df <- data.frame(
  date = c("10/27/2025","10/28/2025","10/29/2025"),
  Northampton_AQI = c(16, 12, 9),
  Easthampton_AQI = c(19, 13, 9),
  Hatfield_AQI = c(17, 12, 9)
)
dfPivoting Data
SDS 192: Introduction to Data Science
Professor Lindsay Poirier
For Today
- Pivoting longer
- Pivoting wider
- Separating
- Uniting
Tidy Data
- Every observation has its own row.
- Every variable has its own columns.
- Every value has its own cell.
Is this tidy?
What variables are displayed on this plot?
Could I make this plot?
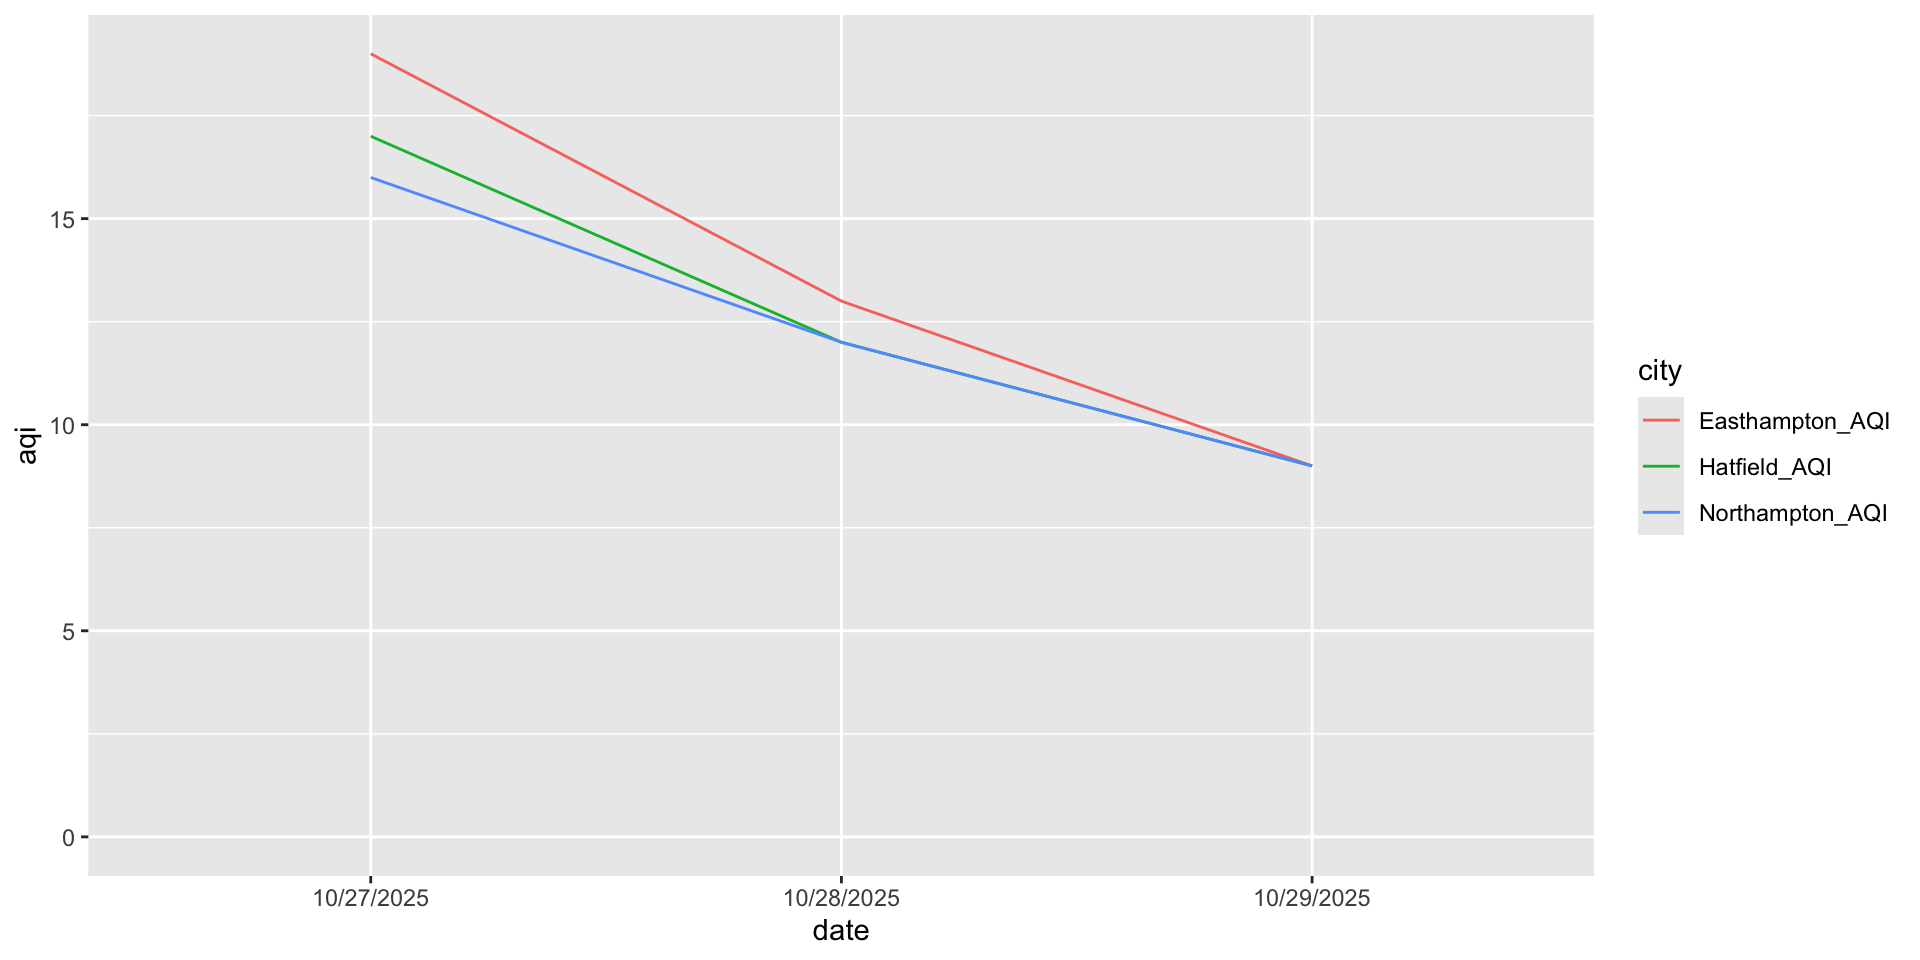
What will it look like when tidy?
Pivoting Longer
- We use
pivot_longer()to pivot a datasets from wider to longer format: pivot_longer()takes the following arguments:
cols =: Identify a series of columns to pivot - The names of those columns will become repeated rows in the pivoted data frame, and the values in those columns will be stored in a new column.names_to =: Identify a name for the column where the column names will be storevalues_to =: Identify a name for the column were the values associated with those names will be stored- Various arguments to support transformations to names
Example
Pivoting Wider
Note: I use this far less often than
pivot_longer()
- We use
pivot_wider()to pivot a datasets from longer to wider format: pivot_wider()takes the following arguments:
names_from =: Identify the column to get the new column names fromvalues_from =: Identify the column to get the cell values from- Various arguments to support transformations to names
Example
Separating Columns
- We use
separate()to split a column into multiple columns: separate()takes the following arguments:
col: Identify the existing column to separateinto = c(): Identify the names of the new columnssep =: Identify the characters or numeric position that indicate where to separate columns
Example
Uniting Columns
- We use
unit()to join multiple columns into one column: unitetakes the following arguments:
...: Identify the existing columns to unitecol: Name of the new columnsep =: Identify the characters or numeric position that indicate where to separate columns
Example
Let’s practice!
Steps
- Brainstorm the ggplot code (i.e. what goes on the x and y axis).
- Sketch out what the data frame should look like (i.e. what columns and rows).
- List the cleaning functions that you will need to to create the data frame.
- Write pseudo-code to create the data frame.