library(tidyverse)
pit <- read_csv("https://raw.githubusercontent.com/sds-192-intro-fall22/sds-192-public-website-quarto/main/website/data/pit_2015_2020.csv") |>
  pivot_longer(-State, names_to = "Measure", values_to = "Count") |>
  separate(Measure, into = c("Shel_Unshel", "Demographic"), sep = " - ") |>
  separate(Demographic, into = c("Demographic", "Year"), sep = ", ") |>
  filter(Demographic %in% c("Black or African American",
  "Asian",
  "American Indian or Alaska Native",
  "Native Hawaiian or Other Pacific Islander",
  "White",
  "Multiple Races")) |>
filter(State != "Total")Functions
Question
Write a function that produces a bar plot of the total unsheltered unhoused count by race for a given state and year. Call the function for Massachusetts 2020. Bonus if you can figure out how to get the variables in the plot title.
# Code Here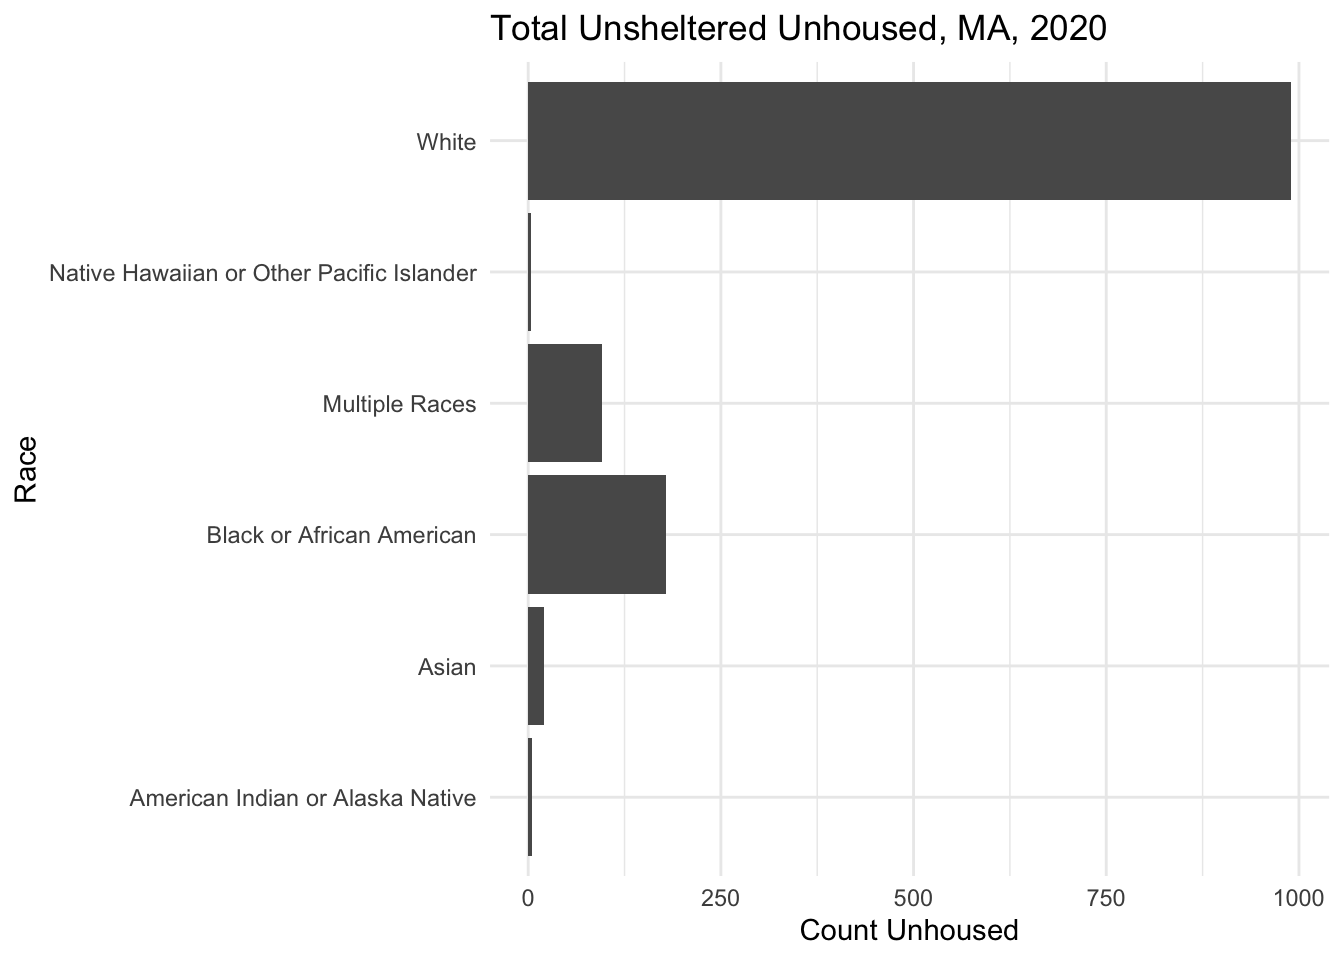
Question
Write a function that accepts a race and a year and returns the name of the state with the highest unsheltered unhoused population for that race in that year. Call the function to determine the state with the greated unhoused count of individuals listed as “American Indian or Alaska Native” in 2020. Hint: You will need the pull() function to pull the state name out of the data frame.
# Code Here[1] "CA"Question
Write a function that takes a state name and two years. The function should return a statement indicating which year had a greater total unhoused population for that state. Call the function for RI in 2019 and 2020. Hint: You will need to calculate the total unhoused in year 1 and year 2. You will also need if-else statements and the paste() function.
# Code Here[1] "The unhoused population in RI was greater in 2020 than 2019"