class: center, middle, inverse, title-slide # Day Thirty-Two: Polygon Mapping ## SDS 192: Introduction to Data Science ### <p>Lindsay Poirier<br/> <span style="font-size: 70%;"> <a href="http://www.smith.edu/sds">Statistical & Data Sciences</a>, Smith College<br/> </span></p> ### <p>Spring 2022<br/> <img src="data:image/png;base64,iVBORw0KGgoAAAANSUhEUgAAAPAAAADwCAYAAAA+VemSAAAABGdBTUEAALGPC/xhBQAAACBjSFJNAAB6JgAAgIQAAPoAAACA6AAAdTAAAOpgAAA6mAAAF3CculE8AAAABmJLR0QA/wD/AP+gvaeTAAAACXBIWXMAAC4jAAAuIwF4pT92AAAAB3RJTUUH5AkKCykoXgqp0QAAe6NJREFUeNrtnXd8HNW5/r9nZrap927Lli1b7p1mwHSwgVBtCC2BFAgBk9yb3JRfbupNvzcJNqElgdB7B5veDAbce5NlyVbvXVumnN8fs5IlayWvbNmSzD6fD9jenXN25rznmdPe530hgggiiCCCCCKIIIIIIogggggiiCCCCIY5xFDfQASDjElLQAiBZWUBJwU/XYOiVCClZOezQ32HEQwiIgQ+UZBzDWQEoEVLRGEx8B1gYvDb3QgeQIrnSGyppzoZ9j0x1HccwSAgQuATAQVLANwgFwDfA86y/90DfmAViL8B7wNedkVG45GOCIFHMiYuBomCwnTgu8BVQOJhSjUDLwHLsJxbEKbJ7qeH+kkiOEJECDwSMXEJGBpoejaCrwPfBHIJ354SKAUeRvAQlixFCMmu54b6ySIYICIEHmkouBogDsRlwB3AHEA9wtosYBNwD4gX8VvNzEmA5/851E8ZQZiIEHikwF7nOkGeDtwJXABE9VvGsuw/FeVwtXuBd4G/gfgECETWxyMDEQIPdxQsBiEFUikAeTtwLZDSbxlLomkKMyePRVEUNm7bh24Y4RC5DngGIe5HyO1IJDsj0+rhjAiBhysmXAWmF7SYdIS8HrgVyKc/m0mJAMaMSudbV5/LTZcvQFEET7y2igeefZeikkokgOjX7BLYB/wDIR/Fa1biUmH380PdIhGEQITAwxGTlgBEI+VC4C7gZMDR5/USsCwSE2NZfNGp3HH9RUzJH4USJKqUkp1F5dz71Fs8s2I1dQ3NNon7J7IBrENyN/AG0MruyGg83BAh8HDChKtAoqGKeSCWApcAMf2WsSzcbidnnzKN7910MWfOnYTbFZrrft3g0/W7uPvRFbyzejNerz+caXU78CZwN6b6OULq7HlmqFsqgiAiBB4OKFgMUgoUZRxSfgu4Ecjst4wlURTB9IIx3HHDRVx1/skkxEWH9XPNrR28/N4a7nniTTZuL8Y0LVAO2xWqgSeAB4E9QOTYaRggQuChRN71kNQArbHJCJYEN6mmcJh1LlIyKiuVr19xFrdcdQ65WSmIQ6fDVgCzcT1IiZo0BxRXz2qAsqp6Hn7xQx564X32l1WHM62WwG7gfpBP4mqoxZsOe54a6pb80iJC4KHCpMUgpAdLnAcsBc4AXP2WMS3i4qK54vyTuOP6i5g1eSxqrymwxGotRN/3D/T9TwAWjtHX4si7FSWugENNblmSTbtKuPept3jhrS9oamq1p9X99wwd+ATJMoR8G0lHZJNraBAh8PFGwVUgTBXpmIntiHEFEN9vGcvC6XBwxrxJLL1xEeedNp0ot7PXZdJfi176DHrR/VjNO+zRGkAIlNgJOMbdimP0dQh3eq+yPn+A9z/fxt2PreSjNdvx+wPhrI9bgVeA5ShyPVKYkWOn44sIgY8XChYDUoAyCuQtwM3A6H7LSIlAUDA+h9u/egHXLppPSmJs78vMDsyqdwgULsOs+xRMf2/LSkBxoqacgjN/KWrGRQit95q5obmN5978nL8/+Sbb9xzAsmQ46+Ny4BEE/8SiBBFZHx8vRAh8rDF2EUTHg6EngLgCe9SdQX/uj8F1bkZaEjd85QxuXXI+40an917nSgOzcSP63nswyl9BBpoPb1EJwhGLlnUJjvw7URPnguI45OclxeU1/OO593j05Y+oqKoPZ31sAduB5SCex2M10qhBSUQocSwRIfCxxKSrAFxIsSB4LHQO4Om3jGkRE+Nh0YLZLL1xISdPz0fTenPdai9GL34Io+RRrPYDA7ekBBGVjSP3Rhx530CJGcehlRimyfrtxSx/bCWvvr+W1tYOUA87rfYBHwHLEPIDwMvOyPr4WCFC4GOByVeBaijozqnA7cBiIKnfMpaFQ9M4eeYE7rxhIYsWzCImyt3rMhloxCh7Ab3oXszGzSCtI7eiBISCkjAV57jb0HKWIFzJvS5r9/p565PNLHtsBZ9t2E1A18NZHzcBLwD3INQtSMuK+FcPPiIEHkxMXAIBBdxWFtL6GohvAmMJw/1x/Jgsbr3mPG649AzSUxJ6X2f6MGo/RC9cjlH9ge1mOVjWk4DqRks7E0f+UrS0c0DtPVGobWjhqTc+5b6n32Z3UTkSGc6x0wHgIaR4GMUqQ0Zki4OJCIEHCxOvBohFiEuxj4XmAFqf1wfXuanJ8Vx78el859oLKMjLCrHONbGatxEoug+j9Dmkv+HYWU2CcCai5VyBY/x3URNmgOg5fZdSUri/ivuffocnX19FdW1jOOtjE1u2eDeW9QoOVwu7V4FRekxN8mVAhMBHi0lXgSWdKMopSHEXcCHQv0uUZRHlcXP+6TO468ZFzJ89EaejN9eltwy95FH0ff/CaisGIY/PM0mBEj0ax9hb0MZ+HSVqFId2FV03+WJLIXc/toKVH22gvd0XzvrYi+RdBHejiFVIApEge0eHCIGPFAWLQSJQmIjkNuCrQFq/ZSyJqirMnpLH0hsX8pVz5hEX03uqKvUWjIrX0Pcux2xYD5Zx/C0lAUVFTZiFY/x30XIuRzgSel3W2u7j9Q/Xs/zxlazdUohhmAOQLXIfFjsix05HjiON5PDlxbiroHEnJE9KQ4hvAX8GLqY/0YGUCAljRqXxHzdfyu//4zrmz5mE23mI6MAKYNauwr/1J+h77rZHXY5ik+poIAAk0luBUf02VtMWhCsVJSobxMHZgsupMW3CaBYtmEVyYhzFFbU0NbYF6+jzxqOAecCFCFxIuY+vO9toOw1qdg7Bw45cREbggaBgMQiisbgQwVLgNMKU+V114Sl897oLmT4xt0vm1/1Cq2UX+r4H0fc/ifTVDD/LSBDuFByjluAYdxtK/FQOvUkpJdsKS7nv6bd5duVq6utbbCeQw8sWPwexHMkKoI3dkWl1uBhu3WR4YuI1gKKBMQfBncBXgNh+y1gWbpeTs06eyl03LeKsk6aElPlJXzX6gSfRix7Eat1tb24Na6sIlNjxOMZ+E0fuDQhPVq8r/AGdVet2cfdjK3hv9Ra8vrBki23ACmAZgjUg9cj58eExrLvKkKNgMdhtNBb4FnATkNVvmaDMb+qEXO684SKuuvAUEkPI/KTRjlm1kkDhPZh1n4EVGDnWkIDiQE0+Cef4O1CzLkFovVcQza0dvPTuGpY/vpLNO0vClS1WAY+DfBCUvSAj6+N+MFK6zPHFhMXgBAySsJ0wvost8+t7GAkeC2VnpvC1y8/im1efw5js1BAyPx2zcZ1N3IrXkHrryLWCBOGIRs1chDP/TtSkk0HpKbKQEkqr6njohQ94+MUPOFBeE65scRdwL8inwVkHftj1wlA/8bDDSO06xw6TrgHwIOU5IO8CziQMmV9sXBSXnTuPO29YyJzJeahqCJlf2170ff9E3/8EsqP8xGl9CcKTgWP0dTjGfQsldiKHPpxpWWzaWcLfn3yTF99eQ3NzWziyxQDwCbAMKd+BiGzxUJwoXejoUbAEFEXBtGYiuB3kVUBCv2UsC4dD4/S5k1l6w0VcMH8GUZ7eXJf+OozSZwkU3Y/VvG0ErHOPABJbthhXgCPvVhyjv4pw9z5V8/oCvPv5VpY9tpJVa7bjD4TlltkCvAzcQ0DdgGaZ7IlsdMGJ140GjolXg6ELHK4ckDcDt2BnOegbQffHgnE53Hrt+Vx/yemkJMb1vsz0Yla/g154D0btx6FlficaOmWLqafZssX0C0LKFuubWnn2zc+498m32F5YipSHdcsEO5vEv0E8hBbYj6nJL/tG14nenfrGrFugrRFURzzIy7FlfrMIQ+aXnprI9Zeewa3XnEd+bmZI90ezaZMt8yt7GRlo+vK1tAThiEEb/VVcU36O8OT0vkRKikqr+cdz7/HYKx9RWd0QrmxxC5J7gBeQognVgJ0vDvUTDwm+bN3Khp3lwAVyPnbY1vMJQ+YXHe1h4ZkzWXrjIk6ZOQFHL5mfxGo/gFHyMHrxw1jtpcfP/XG4QYJwJeGc/P9wjrsNy18H0kKJ7p3CyTBN1m4tYtljK3n9w/W0hS9b/ADJ34CPAd+XMeztl4vAB4+FpmDnz13CYbMcWGiayrzp+dx14yIuPmt23zK/8pfQ9/49KPMzv2yt260xQERl4Zr2exy514FQCez6M0bpMzjyvo02ajHC2Vtd2d7hY+WqTdz96Aq+2LwHXQ8rm0Qj8DzIv+N0bEU3rS+Tf/WXo4tNWgIODXQjEylvxD7T7a1g747gOjdvdAbfWnweN12+gMzUhN7XmX6M2o/QC5dh1LwPxiDK/EYiJCix43DN+F+07MvAMtD3P4p/68+Q3qqgbPEsHPl3oqWdHVK2WF3fbGeTeOYdCosrws0mUQL8CykfwbTKURX5ZdixPvG7WsESQMaAuATkUmwf3P5lfpYkJTmeaxadxneuvYDJ43NCrHMtrJbtBPbeh1H6LNJf/2Vozf4hQUmYhnvWX1HTzgXTS2DvvQR2/BYZaDzYPhKEKxEt5yoc424PyhZ7jrRSSnYVV/DA0+/w5BufUFvXFK5scQO2N9erQAvyWdh14hrmxH2yCUtASgeqODl4nruQMGR+Ho+L806bwV03LuT0OZNwOUPJ/MrR9z9my/xai76869wejQJq6mm4Zv4FNelkpN5CYPf/ou/5K1JvC93TJCgxY23Z4pivBWWLPRHQDT7btIdlj63gzVWb6OjwhTOt7gDeRnI3ktVAgD0n5vr4xCNwwWIQQmBZ+QhxG3AdkN5vmaDMb8akMdx10yIuO3ce8TG9M3dKoxWz4nUChcsxG9aBpZ+ILXgEEGgZF+Ca+ReUuMlIfx3+7b9E3/cvsHz9F5WAoqEmzsIx/g607MsQjt5Rdlvbvbz2wXqWPbaS9dv2YhhhuWXWAk8huQ9F7j4Ro4GcON1vwjWQ/CE0nJGK4KsgbgN6RzLvjqDMb3ROKrdcdQ43X3E2ORlJobMc1H9uh22tehOpt59ILXd0kKBmnId77j9QoscgO8rwb/kxeukzII0B1YMWhZZxvn1+nDK/VzYJgIqaRh55+SP++dy7FB+oRgrCWR/vBR4A8TjW7mqU8SeMW+aJ0Q0nXQWSKIS4IBgV4zRsb+bQCMr8EhJiuPKCU7jj+ouYMXE0SsgsB3vQix5AP/CUvQlzYrTY4EGCs+AHuGb8Gat1N/7NP8CoeMP+4gjrE+5UHKOuwTH+NpS4yYTKJrGt8AD3PvUWz735OQ0NLeFmk/gcO+ztCqD9RAiyN7K748SrQVoqijYH5B3AZUBcv2UsC5fTyVknT+HOGxdyzilT8bhCZDnw1aAfeAp93wNYLbtOTPfHQYKIGoWWeTFW4wbMhrUcMXk70emWGZuPI+9bOHKvR7h753rzB3Q+WruDux9byfurt+ALL5tEG/A6sByUNSCNkUzkkdklJ10NiimwtDFIvgF8Dcjpt0xQ5jdlwmhuv+5Cllx0KknxvSVw0uiwZX57/45Z++nIkvkNJTo5O5ht1SVbPAVn/h2omYtCyhabWtp5/u0vuPept9i8ozjcbBKVwKNI+U+cShGGlCMxLczI6pqTLwEzDZSWROBqpPguMI0wZH5ZGcl87bIFfHPxuYzNSQud5aBhHfree+0sB3rLSGudExdBt0w16xJbf5x0UohsEnCgspZ/Pf8+/37pQ0orasOVLe4A/g48S6u7nsQO2DZy1scjp4va7o9ukGcB3wMW2P/uB6ZFbGwUl5w9l6U3LmTe1HF9yPz2oRc/hF7yKLKjbCS1yvFDcFp71NPjo7wH4cnCMeZ6HGO/hRI7nl6yRdNi484Slj++kpffW0NLS7t9xty/Tf3YssW/IXkPhHekhPUZ/l11wtVgWgoOZRqIO4CrgMR+ywRlfqfOmshdN13MhafPIDqUzC9Qj1H6HIG99wVlfkMUQG64Q4KSNAfHqMWYNe9jVL09pPeCUGzZ4rjbcIy+FuFK7XVZhy/Au59t4W+PvMGn63cRCE+22Ay8BGI5ptiMIs3hTuTh210nLgGvG6I7cpDi68A3sGV+h3V/nDA2m9uuPZ/rLj2dtKQQmTtNL0b1e7ZaqOYjMH3DuSWGGAI1/VzcM/4PJWE6RumzeNd83c4MMZSQgOpCTZkfzLZ4PkLtfXZf19jKMytXc+9Tb7GzsCzcbBKlwMPAQyBKh3NYn+HXbQskcA3Yu8mXBXeX53A4mZ8lSUtN4LpL7Wx+E8f2JfPbbK9zy174csr8BgKhomVfgWvGn1CixyJ9Vfg3/Qf6gaeG+s4OQoJwxqNlX2Znk0ic3SPsLdhumXsPVPHgs+/x+KsfU1UTtmxxE3AP8CK60kxOO3z0+lA/cQ8Mr+47aQkI4cSy5mOnJ7kAO4Zw3zAtoqLdXHTGLJbesJDTZk8MIfMDq+MARsm/bZlfW8lwe/LhB8WFY8xNuKb+BuFOx2rbi3/zf2FUvGIvNYYbJCjRo9DGfA3H2FtQosfQS7Zo2Nkklj/+Jm98uJ62Nm942STgPWAZko9B+IfTtHp4dOMu90c5CcFtwLVAar9lLImmKsyZPp6lNyzk0rPnEBsdKstBE0b5K+h778Fs2PjllvmFg2D+YMeEpTgn/gDhSMBq2oRv039g1nww1Hd32HtHqCgJ03GOvx0t5wqEs3e2xbYOH298tIFlj61k7eZCdCMs2WID8CzIe9HZjiqs4eBfPbRdOf9qqLcgXWSAcgOSbwO9txa7I7jOHTsqnW8uPpevXX4WWWkh9rQsP2btJwQK78aofg+MjqF+2uGPYPB25+Sf48z7JqgezNqP8G/6ge37PVLaTwKqB9fUn+Oc+MNeCdo6UVXXxOOvruLBZ99hb0lluLLFYuCfCB7B46zAr8P2oRuRh84kkxYDxCC5GHu6PI8wshwkJcWxZOFp3P7VC5iSP6p3lgNpYbXsQC+6H730GaSvbuR0vCGGiBqFa/ofcIxaAigY5S/j3/IjrNa9I64NtYyLcM26GyV2AtJbhtRbUWInhMy2uHNfOfc//Q5Pv/GpLVsML5vEemAZUrwGtA7VtPr4m2XC1SDRbJkfd3K4vEJgy/zcLs49bTpLb1zImXMn4XKGyHLgrUDf/zj6vn9ite2NuD8OBBKck36Ma/rvwfKjF/8b//ZfIL3VI64NtYyLcM1ejhIzHqttH/6NS7Fad+EYewuOMTeFjM8V0A0+3bCbZY+v4O1Vm+jo8IezPu4A3kSyDMVcjSV0dh9fJ5DjZ5pJi0FFYDAe+DZwA5DRb5mg++PMyWO54/qLuPL8k4mPDSXza7NlfnvvwaxfE5H5HQkkaFkX4yz4EUb12+iFy5GB5hHXjr3JeydG5YqDssWkuXa2xayvIBy93eZb2ry88t5a7nnyTdZvLQo3m0QN8CRSPIBi7kYqx+3Y6dibp+BKaD4P4j5IQXANcDswicOtcyWMyk7l5ivP4pYrz2ZUZmrvWY2l2zK/vfdgVq7oWzgeQXgQCkKLQxrtIPWhvpsBo0/ydkenbDHzItstM2V+r2wSAGXV9fz7pQ/51/Pvs7+0JlzZ4h7gfpBPMubyGg68DjuePqbPfGy7ux1ELgo4D9v9cT5hyPzi42O44vyTuPOGhcwoyEUNKfMrPJjNz1sZIe6XHGGRtzskCHcajtFfxTHuVpS43tJxy5Js3XOAe558kxfe+pzGxtZwZYufAXcj5FtA+7GMXX1suv3EJSCFiiJngbwTuJywZH4OTp83me/dtIhzT5mGxx1C5uevRT/wNHrRA1gtO47LOlcI+yekHFJP4MGD5IR64Q2YvD3aQaDETsAx7lYco69DuHsHb/H5dT5cs52/PbqCj77YFq5ssRVbtrgMqa5FWOaxkC0OvhknLgZIR3AH8HUGIvP76oUsvugUkhN6Z+6UZgdm1dt2OJu6T49blgNLCho6nOiWQqIngFszj7guQXA5FXwhmLZQ6vghGKtZiZ+K1bIT6a8dUHFVCd6/7Kquz2cQAlTR00QWYA6yD8gRk/eQdkFxoqacEnTLvChkNomG5jaee/Mz/v7kW2zfcyBc2WI58G8ky4HqwY5dPbgUsI+G4pHcj+0P2e86t1Pmd9NlC/hWfzK/xg3oe/9uy/xCbKwIEdQTii6vShRx9COmENDsdfCdl+exoyaeZZeu46y8WkzZ9/WdjxaqoRu8TrZXx9PoddIW0JiX00B+SusxIXHnkk2IrqZGiRmHa/rvUDMWEihcjn/bf4ftVWVaghW7s9hcmYgSDOLn1kyumlbKmMT2Hs8gBOxvjOL5raPxGmrX7GVaRjMXF9gRXwcDg0Le7gg6sahZl9j648R5IWSLkuKyGv7x3Hs8+spHVFTVhytbfCbopNQ8mLpj7eirOOQ24VzsBNh9P1FQ5nfpOXO584aFzJ06Di2kzK8YveRhjJJHglkOeteqCKhrd7K7Lg7dVBiX3Ep6jI+6dhdRTpM419FtxphSUNPqoaIxCq+uBefSva+zpKCuzYWiSJI9AcQhkSoVBbZWJfCN50+mwevEqVrcfel6ClJbMQaZwIqADl2luCGailYPyR4/kyfko035NU2uU0k2NdBbBjb8C1hVnMY/1+ahKRLdUIl2GMzNqicvod1+qYmuS2n0uvjHmvHUddgqML9PY/HM/Vw4oRJNMY96KTLo5A3euDRaMfY/hVn7MY7cG3HkfQMl5mAIcSEEeaPS+c1d13LZufNY/vhKXnt/Ha39Z5MQwFeQPAcMag4Y9eir6IaUKQCXAItCfm9ZOFSV+fMm8Yf/uJ7vf/0S8nLSUA6ZhshAA8b+x/Fv/iFG6fN9HmeYUrBydxY/WjmTZasn8uyWXN4tzKTB6+K/356OlIL5Y+qxui2Tu6axnf8Wfc+COkevJp+DMUntnJVXQ1qMv1fnEwIaO5zc8vzJrCpJ4/z8Klxq75FNEZIYp4EqJCWNMSwsqGR6RrM9gxukuZAQsL0qnl++N43ffjCFJzeO4rkt2ZSKs/l0r4NfLX+CudErSW/5N9L09SjXn/+CImBMYjvn51dx7fT96JagsCmNr156JvkzLkKqUfbZexAxLoO5OQ1cMaWUs/Jq+Hh/KuOSW7m4oBztMCNwl036uJfu5JXtRfg3Lu0iryDkez7sursq0Vsx61dj1ryPQKJE5yG0g0eYiiLIyUjmojNmMm1CLjWNLVRUNWCaZl+N6MB2/lhN3Y7BMTaDPQIHny10wwnG52Vz65LzuOErZ5KeHErm58Oo+SCY5eDDgzK/EO2hCHi7MIOlr85BSsHlk8vIiuugsC6Oez/Lp7Hdhc+wb8WwRFcZwxI0eZ3EOA1iXAZNXgdeQyXereNxmF2DkpT2tQ5V8t1TC5GAU7WwQvQ9BVCEoLbNA1KgCoFDPTiF71wnjk7o4Mdn7eaBL3Q+KUlDCIlhCeranZhSkBC8B+sIhydFwNaqeL778jy2V8Vxal4zp8w7Fd1TwAdfbGfb2+8Qq7Vgla1GZjV3lbGkoMmr4dVVFGGTL8Zp9FqCTExtpSCtFU1V+Kx8NHKfG8fYr6MWTMY9pgbf2psxKlYgBcQ4Dc7Kq0FR4ECTB7dmIg+zYuuyT4cDv6niVC0S3DqObu1+KHnb1t2FUbESl2aX9RlKV+wBl2p2cSmcunt2WAALq2kbvk3/iVr+Es7876GlnwPdZIvRHhdXnn8SZ8wp4KkVn3LfU2+zu7jCzrYYJjeOBseCwL0hJekpCTz6hzs4ZUZ+iO9NrOatBPbei1H2PNLf2O9rVGBPEZ/elEu738F9V6zh0snluFRJW0Dl9x9M5q8fT8KwFJq8Gr//cApNXieZcV4avQ4+KEpndnYjZ4+r5pnNo9nfFM2CsTX89OwdZMZ5EcCmygQeXp+H31BRhMTjMLl57j6mpjf3MLgQUNwYzSMbxlLT7qJNV/nDhwW4NKuL9FdMLmNCaiuWBMMiuIaWFNbG8rO3p/FuYQZeQ+W03Dq+f/puJqa2DHhdLID2gMpfPylgW1UcPzinlKU3XED6rO+DM4lNGz7guh/eR1WjQAbXvUJAWbOHpzbn8m5hBmXNUWiqZGJqC1dMKePSSeVEB4kM9t4CFqhRmShZl4Es7JqGC3caatJJGOUr7KkowReXZa+fD/c4QsDuulge2zCWj/alUdfuItET4LQxtXxtdjFT05tRu5G3trqEF5/6P1avqcJiDtMymsmM9bJiVxbtukZylJ9fnreV5OgAcJi6M5r7bm+B7Vdf9R6+hvVo2ZcHZYuzerhlpibFsfSGhZw8fTyXf/fPVNU2hpMu9ahxnAgMbpeD0Zm9lSG2zO+RbjK/MI6FBARMhdp2FwmeAHOyG3FrEtOCWKfJ1dNKeWpzLqYlaNc1PtiXxvaqBASQm9RGrNPgpW2jeGV7DmkxPlKi/TyxcSz5Ka3cNX8PQkBNu5v39mbQoau0+R0owPn5VUzLaO4xLClAWXMUT2wcQ12HC8Xr5B9rxndNv6OdBrMyG5mY1tpVTgC6qbB89UQACtKaiXUZPLc5lyavkweuWEO8Rx8QiRUB26vjeacwnQWTJN//9s2kTLkJlGjM+tVMbP4ZF+a18cj6sbQHNFQBe+uj+f7rs/mgKJ3s+A7yU1rxGyqf70/hw6J0dtbE8aMFO4hyHP2a9XD3vqUynrtem8P68mTGJ7cyMbWF6jY3D68Zx+riJO79Vhzz5/wJosdTsn8f3//tg6z4tBqXNgpVlTyzJZcYp0GL14nLYZKf0kLAVFAEbK7oo+6141hdksryy9YxJ7ux/5mPsJVtevG/MWs+wDH2ZrSxN6NEje5x2aiMZNwux3E7qjs+BA4FaWFUvEJg5+8wGzeCFb7Mr5MYM7Ma+bQkld9+MJlrZ+xnbFI7sU6d0Qnt3Hv5OnIT2kmN9vOvq77ga8+eitdQeeCKtcQ4Da58/AwUIbn3irWkRfv4yiML2FCWhFdXcTtMTh9Ty1vf+ABVSO75bAIPfjGOUOOIJWFaRiP3XraW778+hwRPgF+et5UYlz1yKUIyPrkNyzq0nGBUQhv/cfouLphQhZTwo5Uzebswk501cZyWW89ADqyEgK3VCbT4VM4/ZxEp024GKTDKX8K/5cfQuodrpsczLaOJ8Smt+AzBvZ/n8/7eDK6bVcJ/nLGLjFgvlhRsrUzg/701g/s/z2dmZiNXTS07uPMuwPJWYpS/CmLqQZv4ajAb1gy403afOWysSOI7p+zhjlMLSYzy49U1Htswht+9P5lla09l9lW5KC3F/OGe+3ltVRGXT63g2yfvJc6l88qOHP6+egKmJbjtlELuOG0PSZ4Abf7D1P3BVO7+ZCL3XbE2vBeVAKt9P/4dv8GofB3npJ+iZV3WK7fT8cLQEdgKYBx4BrNunT2MDdDwDkXyrZOKKG/xsGJ3Fq/tzCbKYZIe62NqehM3zi5hQkorQkB6jB+HapEa42daRjM+QyHBHSAl2s/c7Eb7354A9V4XAVPB7TDxaCZRcV40BeLdep83KIF4t8HMrCainAZxbp2TRjUQ79a71pCHriUl4FAtvnNKITfO3o8l7Q3MU0fX8caubA40RzNf1A/4DKyxwwkIUmIMMBrQS57Dv+PXXYKEaRnNTM+0ZxD7GqJZsSuLiWkt/NeCnYxPbusi6YK8Wn6wYCe3PHcyr+3KZuHECtzBJYH9ABaY7SAtZKAeWb0C3+57MKreHDiBBRTWxfJBUTpT0pv46oz9aKpFs9eJEBaL5iXxelkmH28oomTPZ/iLHuSVD1uYme3lfy7cQm5CBxLIT2mjstXDI2vziHfrZMX6MS3Y1mfdkgsnVPLqzhw+2Z/K/qZoJqeFuXQR2NFd6tZhHHgGLWMhqO4wCg4+ho7Adtc+4mmGKSEl2scfF25mT90+NpQncqApmuLGaFbuzmJVSRr3X7GGs/NqsQgu1YJnxAKJplr28ib4b4dq2Wu1bk4KnWfKhzOqDNYju91b/04aAkXYswiCZRUJLs0epv3Gkb3N7Q0whdod/ybw0f0Emot6+IdbwTbQFKho9dDQ4eLU3HKy4zowrYP3bwFzshtIj/Wxrz6Gdl3D7Qgc8kIRSKMN//rb8dYdwAy0HpEthYCSpmjadY3dtXFc+fgZwXNjC7AQWixNHc14NIvKz35KQ+1+Gr0nc+W0MnLiOjCCM5soh8n83Fqe2Dimy270UXd3uzV7nXhUi4YO18BvX3T1lCOy12BgCAl85LA3sTR++/4UTEvwy/O3cVZeLQFT4NMVXt2Rw52vzuXlbaM4Pbc2tGHkYf59BDel0LdXEiGdSgZvkSSBcUltuDSLHaUGHbVb7OOaQ47MdFOhI6DgUCyEkPgMFUv2vo+AoWCYCg7V6vuIS1pY/howjoy8nVCF3Thjk9qZl1OPlKAmzUVJmGlPTTv2E9XyDhliK80iHiHAp9v33f28PWAqvdaxveoG6HxeYe+Lx7l0suI6RqSb7IgkMNhv2N21cWysSOTaGfuZN6oRTUji3Sb5Ka24NJNmnwPDUrrONw898w317+7HDgJ7atv9MzW4O941qgehConHYeDVVaQUXfVaEuo7nLhUixingSJACXYVIWTXdcohvx3WuXC3jRJLwoysRialtfBWYRaflx5gwdjarg4tBDR6Hfxr7Ti2VsVzx6l7GJPYzprSZLZWx3PKqIYenf/twkyqWt0sKqgg1qnbMacObRNhH58pCmD1bJNOTzC7zWTwUEHa7phKz9nNuOQ2EjwBEtwBfnbODnImnI1jxn/acZ/b9lD7+X+yeXMx0U6T8SmtZMX6+Kg4jW3V8czKakIANe1OVu7OwjIP7gz3rnt71zq/s/1b/Q62V8fbx2ZD3amPAMfCkeN0bPXRQUhIiI/mG1edczBulTQwyl/Gat5+RBsflhS8VZjB+tJkylqjSPAE8BkKa8qS+OsnBRTWxnHD7BLm5jSwrjyJV3fkIIGpGc24NYsXt48iYKrMzGog1mXw7NZc/KbK/DG1JEf5KayPpaghlooWNx8Xp7G5KoGpGc0IJKVN9jlgnNvouh8JfLgvnY0VSRSkthDlNNhVE8eTm8fw+w+nIIBpmU1sq47nk/1prC1LYkJKK2kxPjwOk501cazen8LnpclMSGklOcpHglsP7XYoQTgTUNxptvQPex4Z6zRQVckbO7NZW5ZMlNPA4zCpbXfx4b40/vDhFB5dn4dDlVw+pYxop8kbu7LZWRNPgsePSzOpbnPz3NbR/HVVAVEOk5+cvZ28pA7bcaNbm3y0L43t1QlMz2zCklDaHIUQdpt0dxstb/Gwtz6W13bmEO/WGZPYTlWrh7oOF0meAKqQxLt1ylqieGNnBg1mFjlzvosSO5Hysn28/fJf+b8XivnLqgJSY/ycPa6aFr+DFTuz2ViZiG4JdtfGsnz1BFbszsayBGeNq2b+mDosycG6d2VT3+EiNdoPQGWrh4/2pXH3pxP5yycFpMXY+yEDJbEaPwUt+/Iul8vWdi8PvfABTS3toY6R3gU+He6OHMcFAolDSJyaya6aOG545lTcqkWHrmJZCldOK2XJ9APUtrv4/uuz2VcXixCSb794Ev+7aAMqsKk8iR+8MZsHrlyDAmwuS+K+z/P5zQVb+PW703h3bzqqIgnoKn5D5dfvTkVTLUxL4Sdnbec/z9yNEZwaRztNrpxayiclqdz60knEunS8uopX18iK8yKEpKbNzc3PnUJRfSy6ofB/H09ia1UCvz5/C994/mQK62LRDZW/fVLA+0XpPHv9J7bn1yE7YErCVFxT/wclblLQC+mtrpfg4mkHqGt3sXz1BL778lzi3TqWhFa/A7fD9l3+3um7mJzWQlacl/KWKB5ZP5abnzuFOLeOaQmafU4yY7387JxtnDK6Hgvw6iq/enca7wXbxK9rBAyFn709HU2xsKTgZ+ds5675e5ACVu9P4a5X5+A1NKSEdp+Dj/elsbYsGUtCXlIbL964isxYHy7N4q7T91BnjuW5zRm88v0XiIp6Az3go7W1GZeWyam5dUxIaUURcOtJe2nxOXh84xh+8MZshJB4NJMJKS3sqYvr8tWW2PsKd83fTU3wxfTKDnuzU7cU2vwaLs3sqvtIHWiGEiOXwAKmZDQT7wlw+ZQy3tqTSUlDDHFundNya7m4oILkqADNPgdfn7OPVr/9hvQ4TMYlt3HLSUWUNVeQEu0nJcrPLfOKKJ9YydT0JqI0k0smlVOQ1tw1le3uAm1JwZycnlNOS8IlBRVEOUze3ZtBdZubBHeAmZlNnJlXw9jENjp0jZtmF9McPFfu7MiJngA3zi6myefs+jw12k+Uw+y1caSmn4Vr+p9Qk+ba+Zu6JfuSwee787Q9nDK6jrf3ZFLcEI1EMCaxjfPGVzEvp4Eop+3tleDR+cV5Wzl7XDUfFKVT1uzBoVpMSGll4cRKpmc0oQiJlODULC6dVM6kPtpESpiddbBNxiW18e2T96JbSg+fnM7NwaSoQJeTiATGTjyTBxf9gjc3tvPRx29Ttfc9PJqP8SntnJZby6zMJuKCL6PEqAA/P3cbl04qZ2NFIoYlmJbRzI7qOH713rTgqcFBu4xO6ODur6zn4j3lrN6fSm27iyiHPR0/tO6RhsE9arYF/D8C/tDjc0syZlQanz75G7LSkuzPTC++NV9HP/DsEd+Fz7BXAB6HiRV0o9NUiVuzutZXXWu2YJlODyG1m1LHtA6u66xu/+7PNd20CGlwNeiy5zftjSKnJg/uimLvAB8qsbOsnvfYeZ9G97NjoaGNWoxr2m/tIOv+OgI7f0+g6L6QWRLUoIukN7ij7dYsVEViWT3fCQJ7TWpY9gagIiRux8Ed+h51Kv37AprdnrNzHd/n/le35+vhHtlRQvvaO+goexNVsW3ZaZfuMxHTEuytjw3ucwiKG2O4//N8qlrdPHPdp8w95AXbuR4PmIKAofRbd9iQ4Bi9BPdJ/wbVXhpW1DQw/7r/pqS0JtRGxo+BPw5muJ0ROwIDeILaXCntDYkoh/3v7prTXkQI4lAF0KHXmBYDcqToKhe8F49mOwUcqn81+lDv9fU5EoQWg2P8rTgLfoJwJWO1FeHf+lOMshdBGn3eB8iDbURoLW7n54KD7deXDHMgbWJJwhrRQqmKZPUKohwH6zn0ZoSA1oDGj1bO5LMDKahBn/JYl8HS03YzLaOp129L2fniPvicoeoeaRjRBB7sk6BjeW9HWolwp+Kc/DMced9EqFGYDWvwb/4hZu2qsH5lIPdxvNuvP0lgv/ciwa1aXDm1lLk59bg1i+QoP9Mzmpie2YRTtfotP5z6yVG34VDfQAR9Q4nLxzXtd2jZVwACo+IV/Ft+gtW8c8SHxDkaPa8E3A6TW+YWH7I30dOh5suACIGHKYQrBdese9AyLkCaXvTihwjs+B+kt+pLTd7uMIZhiqbjjQiBhyMkoLgQrmSkv4bA7r+g770XqR+hx1M3IcJQ45hE0vgSI0Lg4QgB0luJb80tCC0Ks3EDWIGBE1ACQkV40ux/+mo4sq25wUGEvIOPCIGHLSyspi32X49w1BWeDJzjbkMbfR0IYe9cH3huSEbiCHmPDSIEHmr0J/w+GqIJcI67FeeUX3R95J51Dz6jHaNixXElcYS8xw5Do0KOIAgFJToX4Uo9+qq6Q4JwZ9gjbzd0hr05ntu0EfIeW0QIPBSQgOLGMfZmPAvexj33HwhHwlDf1aAjQt5jjwiBjzckCGcirsk/xTXz/1BiJyBcyX0moT4iCJC+Kvzbfob0VR/86SMMe3MkiJD3+CCyBj6ekCBixuCa8ksco78KihOz5kP8W/4LGagf9J8zDjyPz+hATT4ZALP+C4zKlcecwBHyHj9ECHwcoaacgmv671FTzwIrgL7/cQLbfo7VVnxsSCUkRsUbGOVvdPvskD8HGRHyHl9ECHw8IBxoOVfgmvoblNgJSL0ZvfAeAnv+72AM7GP228H/UFBi8lAzLsCsfh/pLT9yx5A+ECHv8UeEwMcYQovBMe42nAU/QrhSkB378W//Ffr+pw5mnjjWkKCNvgrX9D+ieHKQgQbMhrXoe++1I0kOwrZ0hLxDgy81gUXwf12Z/IKfB5V4IUPC9llPCEgJ2pibcE39DahuW0m05ceYNR9yNBE5BwQJWtYi3LPuQbhtjyzhTkfLugQlbhLWxxditRYd1b0MNnmPuV2OQTMPFb6UBO4MIOfTFZp8DqpaPVS2eGj2O5DSzg2U5AmQE99BcpSfaGc3/egh0E2FgNl7M18ATtXAIU2k3oxZ8Sr+bb/AatnVK1LkseSxHeHxpC7y9miHmHFoOVcS2PHnI76JwSTvcbOLZh42wdpIwZeKwIqwIzkUN0XxaUkqn5SksKUykcpWD15dRbfsBaOmWDhUi+SoAJPTmjkrr5pzx1czNqkdVciuDiOBJzbl8saubDt8KQc/9zhMlp62m3nuR+mo+wTZUY4MNPUiSrPPQatfO2YkFhg4D2wlOq0azRWLy6nidjq7MkKKrv8NHINF3uNul/m7mXu4VCojBF8KAtuhcwQ7a2J5dstoXtuZzb6GGAK62q3zHpzS+lFAQlOHi6LaWFbuymJschvXTt/P9bNKyIn3IrFjE39UlM5bO7LtyOwHf5F4d4Bb5u4DoxGraXufuY3/sWY8930+ftBHBDuNqkRRJA7NR2zSH4iJiSM1KZastCTG5mQwJa2OsQ3Pk6aBU6VXuJ3+MBjkHUq7dMbqHuk44QmsCDsu8xMbx/DQujyK6mORUthJ1PojTWfUfQGGFBTWxvG7D6byXlE6Pz17BwvyavDpKuWtHlClXV8npETTTDu9SlddodHsc1DTHNX/vRw1JFSX0X0BqWga0W6T7Jh8zhqXwKKCCk4eVU+M0ziYB6kPDAZ5h9wuJwB54QQncGe+3N9+MIW3d2cSMNVg9sMjsJ6QmBJWl6TxnZei+fX5WzhpVD1VrZ5QF6OpkhinHmbdHNk9Dej+e04BLCStXoVd3gR21Sbw9OZcLpxQwbdPLmJudgOKIkN28sEi74iwywjACUtgIeDj4lR+8uZMNlckHnkH6VWxpLQpmp++NZOrpx2gxecg1FxMFRKnNsxDRnTl9oEmr4NnNo/hk5I0vnf6Lm6aXUK00+ixThysaXPELoOHE5LAioBVJal877U57KmNC7+D9Jrv9nHUIySVLW7u/zzfnm6GuEYRsscGyrBHkMzlzVH88p3p7G+M5r/O2kmSJ4AlB2/kPSHsIg/5cwhxwhFYEbCjJo6fvjnj8J1EAlIgBHicBm7NRFMtVCExpSBgqLQHNHRD6T3NFQR3R0PDTgo2gA4aIsHYYe99QNvHYZ47C0l7QOWBL/IxpeDn524nIfdcnLOOnrwjzi59NWNUDlr2ZcjWPUOWF7gTJxSBhbA3hf700SQ2licdppMIEqP8zMupZ25OA1PTm0mP9RHv1nFrJl5dpa7dxd76GNaUJfPxvjQONHqQdMtC1g80IcO5jDiXn7TYFjQlOK0TCggV0xLUdbgw++iM8R69Kz1pX7CjNAr7v2CweZ+uYppK/+tuAbopeGjtWJJSx/KzRf9z1NPmY2KX0mQ+Lk7jQFO0vV4Po73DtUtoKKhpp+Oa8kvUtLMx6z/H2P8okfSigwQBvLIjm9d3ZvfdSaQg2mlw8aRybpxdzJzsBuJcRsgUoAI72fX1M0sobEzmsb2X8vgn0NTSelgS65Zi76r2A0vCrWd6uWnJSQgtGoTArP8Cq+p1KlujuPbJ+VS3eno9ixCSO0/bzU2zizEspZ97sEergKngMxTqO1yUNkWztSqezw6ksK8+Ft1UQreVAL+h8fcPY5h+biuLzzjyc95jZpdZ+9lTF8sj68fy5KYxNHudh52Wh2OX3vcGwhGLY+zXcU78ASJqNNJoxah6086/PITRAk8YAgsBVa1u/r0+D19AC30UIQUZsV5+uGAH18/aT6zLOJhBoC+7S3C4PMw+81vM+NpS5r5TyE/+8hiVNY39klg3FQzr8IZNmXIzzim/PPiBv5rAunbEzvf6PBsWQKJHZ3S8D8Ps9mE/P9fdPdFvCMqao3hlRw7/XDuOkoaYPknc1NzK7+59goktRYxn5fCyi2IxLb2Z/7lgCzMym/jlu9OoavH0S+Jw7dL9d5TYfJyTf4pj1BJQo7BaCwns/C36gafQsi8bcJsMJk4YQb8i4KPiNLZUJvbRSSAxys8vzt/Kt07aR7TTsLPSH272I0FJmIWa/x+4ojO4/nSFny8sJ9al9ztzMqUI6crXvd5QYW9wpSMST8KyDpddQIGYPLSCH+KY9muUzIuxLNHV8Q/9zwzmfDIsUBXJ2KR27pq/m39e9QUnja4LvQYPNuzm3ZXc+1o5fkMMeKw5ZnbhYJ4rp2px3cwS/vvcbcS6A0dnl+6VCwda1sW4T3kCx5ivg3BgVLyO74vr0UseBSPAwFtkcHFCEFhg+8++vzcdXyB0ZAsh4KbZxVwz/QACGf5BvgCrfT9G5evoRQ8QWHsLi3Pf5NqZB/od8SxJeB3lSCAtlJixuOa/iGv6H3BO/m/c8/6FNvrqsKvozGBw6uh6/nrJBqZnNfbT8RVe3pHLuvKk8BKPH2y6Y2eX7s0RrOea6fu5dsb+QbGLcCXjnPRj3Cc9jJo0L5hM7rf41t6MWb+W4yZGOQxODAILaPQ62VCRFLpRpWBMUhs3zi7BdZi8OaEgvWX41t+Ob+NdmC178Dgsvj6nmJz4jj5GLmlvGhn9hMkJhr0xDjzZs6SvBqthTb+7m1JadrqV2Bld1wl3Oq6pv0G4Mwa0p2JKmJnZxM/P2UparBG6bDC38WMbxuI1lLD77bG2S882AY82CHYBUKNwTf8Drik/R7hSMRvX4Vt7C/4dv0P66oYFcTtxQhAY7IzrtW0uQvZACaeOrmNsYtuRO7CbXrD8dmpRCZPSWrhwQmWflxtS0B5Q+7e1hEDRAwS2/wqrbS9G5Rv41nwdo3Ilgv47mdCiQ38mBr6tYUm48IzZ3HTZ6Yh+1vXv7U1nV23cgHZxj7ldumGw7CIUJyJ6DNL0oZf8G9/n12OUvwZSH1bkhROEwEJAXbsLf19TIwETU1vxOPp5y0sBwkG4FnJpFhdOqCTaFcItT9ibJS0+R//VCZDeKvzbf0PH+2fi++w6O2YVKsKdhhAqITu+EMFsDa09PjZqV4HeNOBOpmZcRMy8ZXzz+uuYPD47tD5PSKpaPbxbmBH2SDkodhkgBsMuUm/Cv+l7+FZfhX/DXVgte4YdcTtxQhAYwG8oWDK0uFYokihHP2emwoGWfSnuufehZZwf1u9JCdMzmvqcrhmmQrPfeXi7CwAT6a1EGi0gQBt1NZ7Tnrc1vCEWhUKomNUfYu76I1brnuBU/Gn8G78fPNYIH50eVkSNY0JqK1fOaOhzF1dagveL0mnyOsIehY/KLkeAwbKL1bQdo/LtLpsMV5wwx0geh2m7yIU40JeWoK7d1XtgkSCc8TjGfwfnhP9EuFLA0jGq3+8zcXZXUQnJUQGmZTSzuzq+12/qlgj644aJ4HmnEjsO1/TfIVoToZ9ptDRaCez4Pebeh0DRINCM1AfW2Q51jzQ23cW5KV/wQOx8alrdvesSsKs2jv1N0SR6msIaNY/ILkeBAdmlv6Rvw5i03XFCjMBSQrwngEPty0kAvihNodHrPDhySOyd3Fl345r8C4QrBbNxA/qBpw5L3mBxPA6T8cmhA8NZph1VYmAPAlrO1RCVx2F3ogSAZY/c7aUDHilC+TYHKlZSkNLMvJyGPl07GzpcbKxIDGs3+ojscpQIyy5eDSUqB0feLahJcwbnh4cIJwSBATJjfCRH+QntwS75ojSZl7fn2KOuEKhpZ+E++VEcY74GQsUofQ7fFzdi1nwcfuMJGJvYhlO1wBIH/5MCoUjbbXEgo4sAq2UnWB0DKjPQ0aIvYYIEYt0mJ42q71OTaxgKu2viws7NG7ZdBv4YfaJPu1iAMAjEnoRj3qO45/0L5+SfhtwQHCk4IabQUkJiVIAp6c3sqYkL2RO8AY0/fDiJaLfk6oXnEDXzF+AehQw0ou9dTmDP3Uh/w4B6kZQwOrGD3KQ2HKpFTlwHWXFesuO8ZMZ5mZPdMLBzTQFG9XtY1e+DesYxaatwVEUTU1uIdhq0B0J3j6KGGNoDGjFOo39nk7DtMplop85lk8txa1bXGfWRIrRd2slO0hg95SuceuYSlNQJSKMVs/4LpOk/Jm19PHBiEBiIdpicO66K13dmh1ajCFsq959vzGUtM7kl1mRyxg4cRb/BKH0RYQbs+cgAOo8pYVZWAy/csIpop4HHYeLRTJyaRHDQC2pA0NvtHeaUMwe9ncIhr5SQn9xKnFun3e/ovaEloLw5Cq+uEuMy+m2sgdjlP96Yzer9qdw4u5hJaS12wLrOACIcpV00naiEXGKm/Rh19PWgRGO17iaw47foZc+FtWQarjghCAy2cc8ZX83k9OaDQvFDIaCxDe5/5mNe+WALp45tYX7aOqZnxDA6oYMop01Al2ahiEPCmHb7e3dEO0zyktoPSkSDLotHhWOwgdKTvHvxb1iKUdXbt1kCyVF+MmO9VDZHhayr3uukQ9cQ+Hu2R6iNqrDsImnqcPKvNeN4fVcWp+bWccaYWqZnNDE6of0o7aKgpp6Jc+qvUVNOB2liVLxOYMevMBvWDX5DH2ecMAS2JIxK6OBbJ+3lh2/MwtsjMFo3BDtARU0jL1TDK+osYt06qdF+soNT4Kw4LxmxPtJifKTHeEmP8RPvDtgdyWHanUgejE083OMr9SRvEYGdf8Cs/bTP3MROzSI12t/n9wFDpa379FqCcMSBFo301YA0u8oN1C5VLVG8tGU0r+3IIdZ1dHZBjbHjchf8BBGVg9Sb0IvuJ7D7r/Z9jpCd5v5wwhC4E1dNLWVjeSIPrxtHvwNhMCCzIaGxw0ljh8tepwWhqBYuzcKt2Z0jM9bLmMR2xia1MSurkRmZjWTE+vA4rAFFcwQODh2hNqAEWA1rkc49gDmQWkOiO3ml3or01+Es+BFazhXohX/vnZlBgkORxLn6ihtlh2/1GZ37nwIt8yIc+d9FiZ2Isf8JAkX3I71VPZ4tfLsEA9ZZ4ijs4sXjduOY8isc426zFUQtOwns+DV62Utg+k8I8sIJRmApIdZl8JOzd9AacPDC1lG2IP5wxuoW6bATlhR4dRVvQKURQUVzFOtLkwHwuAyy4rycMrqOK6aUcfqYWmIOiR/VNxSU2Dy0nKuwWndhVr2HNNoO/rYAo2Il3n1bkb6ZIJxH3B49yOurBsXRlalQic1HTZyHb+3NGBUrejy7IiSufuJGmdL2JxYStMyFuOc93BU43jnlF4DEv/1XQ2eXUTVcOUfn/NMvwKG6MCpeI7D9l5gNG45o134444QiMNixjTNifPxx4SbSYnw8un4sLV7nkYdt7Rb4rdPwXl2lqC6WotpYXtuRzcKJFdxxWiEzMxvpdnVvSNAyL8I15x6UqFyk6cWoeBX/pu/3yOMLJtJXg5QmXR4eA8Sha97Arj/jmvLzno/mTkNNOgmjvCeBhbCDBvSHzmmqFiLrgzb6qwSKHugxClsSMmKPo112GVyy/3GWXiCZKv+N5T0xpsyH4oQ5B7a9qpLRshZCdB6p0X5+ce42ll+2jlPG1OJUgmeCg7VeDcYvbvHZ0Rxvfu5knts6GsPqWyEqHNE4xt+KEj0WhILQonGM/iqO3JvoNa88is7Wa7d5w1KMitfskf7QZjPae31mSggYfXcNVUjc/YzQQg0tqrAkx88uXpUn397LDb/fwLNrnZhyqJW7xwYnBoElKAlTcc99AM9pL+Cc8nMsxY1bM7lqahmPXfMZf754IwvGVxPv0RHyoMPFUSMYW2pvXRw/XDGLRzeMDd1ZJOBIRE2c3buKQXQkCH1UtBLpq8Q48FSPa622IozyF3u9LCxL4OtTcidQBLgd9vrcbFhjbwh1hzP0c4JN4uNmF0Vhb0MSP1wxp2+7jHCM7Cm0BBQHWvYluKb8EiVhOlh+ZEcpSLNrhzgz1sc35u3jiqllbKpIYFVxGhvKk9hdF0t9hwtfQD0YJylESo+wICT17S7+572pJEUFuHxKWe9ATnojZuMGNE9Oz8cIMQoeCfo85xWABYHC+5B6q71jLBQ7/lbbvp7PGVTsNPv6XnurioVHM4Pr9RXoJY/gLPjhwSq0aBx538CseS/ksw0ru4xwjFwCSxCuJJz5d+LIvxPhTEb6qgjs+Qt60QNgHdxF7dxcSvQEOHd8DWfn1dDi16hpc7OjJp699bEcaIqitCmaylY3jV6nvVGiq/gMDcvs1on6WxsKSW27mz98OJmC1BYmpbX02NiSejt60YMocZNs4T0KRsWr6PsfPeq5UJ/klSC0GNSsc1CT5mLWfopR+TZdRAhBBr+pUNPu6pMocS6DqM6ImBKk2dv1U02cDY5E0Nv7rOfI7SLw6SqWgb1gV5TDyDb7t8tIxsgksAQlYRquKb9Ay7oUFCdm4zoC236OUfW2fQ4ZqlgwNhRAnNsg3t3GhNQ2BBAwBR26ii9I3NoOFxXNUZS1eChvjmJvfSzbquOpbPEQMNR+QrJKtlcl8PD6PP7ngs09A9MJMCrfxGxYh5pyKgBm1bs9d6GPAP15WAktBtfc+9Cyr0Bo0UhfNb6Nd2KUPhf69rGjaDR0uPps+6w4Lx7NPDiQhVpHN24AvTGs5xqQXdqdVDvOpip6MWX1FnuKS9m8dSMV9cbBFC0DtcsIxsgjsHCiZV98cMps+tD3P05gx/8gW3cfmgLIRghPna7D/uAXipDEugxiXQYCyE3sQOQ0IrA7V3tApbrVw6qSVJ7dMprP9qeim30fhby6I5sbZxUzLaP5kLe9ifRVY5S9HHwejhl5kaCmn9NFXjgYesesXdXrrBbsAW1fQyytfq1PMmTFee01sAQU0Pc/ipo4GzVtAUiJ2bSRwK7/QwZH3z6VRgOxi9NAqC7Gz1yEc8rPIXoiUm+leed9lK5dxcd7nDy7Nfco7DIyMbIIrDhxTvg+zoL/QjiTkL5KArv/D33fPwh4W2kJOEPG/HU7TGKcYUgEgwbtsms3A0c7TMYltzE+pY2FEyu4//N87v0s33b47+WMIaloieKDonSmZTT3/qHB2EmRoGVciDqzH99maU9lD90kE454hBaPpCpkvTtr4voUMiAgN6G9S3QAIL3V+NbdCs6gw0WgpUubrJsKLcEE3UdsFwuEOwXHhO/jGH87OBKw2ksI7Pwd2oEnyIvrYNw8WFhQeXR2GYEYOQSWIJxJOMZ8DeFMwqz/gsD2n2NUvYciTHbXJfDDlTNp8Tl62M2UgoUTK/jJWTtwHkXgtC6XSQnpMX5+uGAn7brG/Z/nh3yTW6ZgTVky7QGVKIc5uPsm0kJLPxvH7B9CVD8ZE8TBXeLuZ7XCnYFz6i/wr/t2j6MlAbQFVNaVJdm7wSGmmR6nwZT05p75dQW2HllvOViRsGV9u2vjjs4unculqb9Gy7rEzlpRtwr/1p9h1q4CZNeIPeR2GQKMHAILkIEGArv/FxGdi1HyGFbr3q63rBCSPTVx1LYdEknCEqRG+fEaqp2VbhAsZkl7RL55zj5W7MoKHRhdwO7aWFr9DqKd5uD6SwvVXvtH5fef7qSPXWIALfUM/I4E0Nu6tSEcaI5mU0Vin1EkkzwBJqU3h36eUGKjo7KLQMtahGv671Dip4PZgb7/CQI7f4fVVtL7+Guo7TIEGDkEBrAC6MUPYbO553FCnEu3O8KhO8UKlLV4aPNrJHQm3B6MW5GQm9jOzKxGSupjQnbeRq+r76no0UAIUFzgKzl8uhMJ0l8bdtXv702noq/sBhImpzeTGesNux2Pxi7CmYBz0k9Q4qcjvZUEdv0Rvfhfdtyvfna2h8wuQ4Dh6chx2N7R+yzQqVl9JPuyYxoX1g0sHGo4t+jWTLJivX1eY1iip2pn0KBgtRWhb1h6+FxFAozyF7Hainre2yERLIWAmjYXr+7IsZOfhapKkSwYW0Ocywh75Doau0ijA6PyDYzyl/Gt/TqBwnsOu2M/tHY5/hheBJaA6kGJy7edDQZQzKFYxLlDhxJt8TtYW5Y06NMlgZ2m5Ei/P5qG0ksewah8I6ybtN0p78SofN3eAQ8RwVIAr+/KZm1ZUp/5i9JifCzIqwl7D+6o7WL5Cez+P3xf3IBR9Q7hqrOGzi7HH8OHwBJEVA6uab8j6qwPcRb8eEBByjU1KIELZRdL8O7eDOraBy94mgB8hkp5i6fPa9yaSaxTD7/SsNvKRPrr7e3Z8ApgVK7E99n1tL87D9+6W23xRLAt1OC68MEvxttn3KGr4PQxtUxMHZgTxFHbxQoEvbnC+9EhtcsQYOgJLAEEauoZeE5+FGf+UoQnC6HFEDbbJGj9xRhWJJsqEvi4OG3QHlgIKG/x9L3hA2THdxDrMo7NTudAX0TBneJDI1gqAuo7nPzxo8lsq47vc+0b49FZMn2/vfET7m+Ga5f9WShCDbfW/h9zqO1ynDGkBJZSgubGMe5W3Kc8hpp2NtJsJ1C4DP+uP/Rwhzzsgwhpb5b0gY6Ag/s+z6e0OWpACbpCQWCvo57dMpr9jdF9dvqp6c3EuvQjm7ofq97V7dlVxc6c8Jv3p/DitlH9FlowtobTx9QN2PnhsHbxazyw6XSqYq9D1dxH/WjH3C7DDENIYIkSMwb3rL/gmvG/KFG5WK2F+Dcsxb/lJ8iOioE9iJB2GNG+IOwQpveszqcjoB4xiTsnBS9tz+HBL8Zj9pFg2+00mJ9bi1M7kl4iUJLmIByxHDWTe5+ioAr7bxsrEvjea7N5eN24vnPmSkFKtI9bTy60d4uPhMD92UWBzwstln+SR4cVN8ztMvwwdFtxijOYDSEVsDAq3yCwvTPQ2AAVJ4TRUbBlcg+tG4fbYbJ0/h6SowJ2CNMwbCmCjgnNPo2nN+fyvx9Poq7d3cdbXjAptYX5Y+oOW7cI4fXnzF6EJ+MXCMfDIGtDLiUU7Pvpr8MLoSI8GWC0gW67Drb6NYrqY3htVzbPbs6lpCG6X/WeIiTXzyph/hGMvuHaxTR0Hnx1B1pNBkvnNw0Lu4wUDB2BhYZwpyMDDeh77yNQuOyIA41JbCMerqMgoCOgsuzTieysiee2kwuZm9NAnNteo8kQo5UIxmeqb3fwRWkKT27K5Z3CTDoCffsKa6rFtTP3kxnrPWynr2x1U9vmtiNgSIkaPw23+z+pro5C10Nnw5MIyls8bK6Mw5QhRhopkaoHkXYRVvxiag+s5cD2VyirC7C1KpFNlQnUtHqCOYv6iwsrOHNcNbefWohLtQZM4AHZxQ/LPslnZ03ssLDLSMGQHoZZLTvwb/tvjPLXwQoclY9wOG96AISd4PmNndl8tj+Fk0fXMz+3loK0FrLiOmyneWGHZ6nrcHGgMYrtNfF8cSCFHTXxtPqCsZL76vhSMH9MDVdNLUWI/kcRRcAj6/O497P8g+oYLRqhPYVpmjS2tIccfaWEB74Yz6MbxvZZtxQqODUs60UCuonPNwlDN7raoN9nCD7HpPRmfnHeVrLjjrzDD8gu1vCwy0jC0BHYChDYczdG6YuDEmhMEQQ3S8KMISUkDR1OVu7M4q3dmUQFA7Nrit3ZTCkIGAodutbtaOXwnX5UQjs/WrCDjFhfWJ2+PaDR2ObudvZqAI3Be+y7UdoCGm3+/nIvSaCp2/OK8Hc8pGB8Sgt/WLiJeTkNRzVa2XYZQGyvYWKXkYKhI7A0kXrjoFUnBDj6e9N3c7w/WAgQEgto84cihKSXC2Cf9QuSo/387NxtnD6mdgCdJNRvhPk2O+x9DfCtGDzSm5tTz68v2MIZYwfyHKGhKCpOV3TfQ96wtcvIwJBOoQc9QpHs+/PseHsaWNkS1WfWhiPe8ZWC9FgvPz9vG0umHRhAHEkFoXqO/HcHs92kIDHaz5VTSrnjtD3kp7QNTmcXKqh9xPwatnYZOTgxHEKxX/D9HYWclVfNRRMr+dlb09nfEHPk4UwPqVcgmZbVyM/O3saFE6pQhAy7k2iZF6FlnQpyM8c95mlwtBVAfJSf03Lr+ObcIs7Mq8WtmYM2UllmAN1bByKFXvQZpnYZSTjBCBzMThYCWXFerpxSRrTT4FfvTmNzRQJ2uIgjMGvw3CUl2scVU0v5zil7mZDSOqCsel2RNL5YA9YmO67TMW8k+w9VtYj16IxJbGd+bi2LCiqYldXYJVIY7ITbRj8uzMPNLiMNJwyBzWDE/lBQVIvMOC9CwAX5VeQmtPPgmvG8siOH6ha3HcUjRBYAgh91fSjto4iM+A7OHlfNtTP2c/KohgGPWJ3kJSqPOPcq0uI70LTBcSXshBASTZE4FDsVSbw7QEp0gFHx7eQltTE1vZn8lFaSouwE3JY1CMSV9Gq/g3bpXflws8tIxAlBYEEwFKrXCYeOwjKYciOoYbUkTExt5XcXbua6mSW8vSeTzw6kUFhnx4EKmAqmVLCkHcBcUyUezSQtxsfktGZOGV3P/DG15Ce3doWVCbuTyGBmhm6Jxm4Z9yRX3vYRQgz+CGw7OUgUIXEoEpdm4nFYaIq0R1oGKZuiFAhPOigupLe0S2QxYuwygnFCENh2GJAsmlROXkprD+8kKcHjMJme2dRlUEvazgVzsxuZnd1Ii89Bg9dJebOHhg4XHbqKYSm4NJM4l05mMCNevFsnKhjFoXskxfAg0EZfjWv6H1GixyJ9Vfg3fo+YlreJTTj27dP5FwkYR0vYQ55LTT8b19TfILRofGtv6cpBNDLsMrJxQhAY7COkJdNLQx51SmyjStn7M4A4t068WycvMRhFsds10DNS4pGNVgLH6Gtwzbob4QrGplI9PeseaZCA6sKRex2uKb9AROUiveWg9AwIP7ztMvJxwhAYbCMeSULOHiQ6BmzSMhfhmvmXg+TFjgypJs21vdCOZgP6CI6PjxoShDMR58Tv48hfinDEY7Xuwb/tZ5gNa3uvg4epXU4EnFAEHo7QMi7CNetvCHfmMahdRXjSQFHBMoM5io4+p3C/kKDEjMU59dc4Ri2xg+rXfox/y48x6z87tr8dQS9ECHwM0SM/r9GOUN22YwMgfTWYDWuOLqj7qCtxTfstQo1Gmu34t/6/PjMuDBbUlFNwTf8DauoCO8jg/scIbPsFVlvxCZm+c7gjQuBjhJ4ZE4oIbPs5ImY8jtwbQAj8W3/aK7F22JCgxI7DNe33KDHjALsa17TfYzVu7BFud9AgVLTsK3BN+y1K7ASk3oxeuIzA7r8gA00R8g4RIgQ+Buid7mRpkKwq+r5/AByxdNIuDFrO1V3k7YQSPRY14wKbwIMJCWrKabhn3Y3wZCHbS/Bv/yX6gWfA9EXIO4SIEHiQ0W+KT0ykt9K+sHunD2Z8CFuVJcBq2WlPy7ulTZH+Gszq947Ng0kDqbdgtZfYm1U1H3IkgRciGFxECDyI6DfRWCd6dXgFJTYPLecqrNZdmFXvIc22/n9IgFn9Pkb5SwezDhrtGNXv2kc5gz59tlO0eD+5FGm0B5OiRbaFhwMiBB4khEXeUOVGXYVr+h9QosYgTS9G+Uv4133nsCSWZhv+dd/BKH0ONWkeZsNazOr3D0/+I4U0D07NI6PusEGEwIOAIyKvBOHJwDX1NyjReYCd2V7LvgKj9DmM8lcPSxRptmGUv4pR9uqgBEXovK8+64kQd9hh6ONCj3Ac6cgL2HHBDk39qUXb2e3DnaEKbCseLbkkCEcCatqZCHfGcW7FCI4UEQIfBY6KvGBvDB2S3V4a7XZ2++M52gWdM1yzl+M5/XWck34CiuPo643gmCMyhT5CHDV5BbagYdt/H3TGMNrQ9z+GWfPBcXWLVJPn4Zr+J9S0s+xg+nrTANK2RDCUiBD4CHDU5O0Go/RFzNpPjq87ZCeEGsy/+3uUuClIvSXonPFXkMfpHiI4KkQIPEAMJnltdDsbhuMz8gazQDrybsY1+b8R7gyktxz/9l+hlzwWcc4YQYgQeAAYfPIGcZzXu8KVjLPghzjG347QYrGatuDf+mOMyrcAK0LeEYQIgcPEMSPvcYYSMxbntN/iyLkaFA2j6i0CW36M2bgpQtwRiAiBw8BQkrcztvugZBJQnDgn/RjH6K+C5cMofgT/9l9htZdFyDtCESHwYdBDEtheRGDjUsxDyHs0qToOV7bZ5yBgKCRFBVAG4L4YkvjSQvqqsdqL8RU9TOWmB4hRaolyhl1tv+hMtiaEHR7nyxol43giQuB+0BU9Mno8dVVFtG/8LzwNb9KhO0nw6KhCYlqCBq/9b4cysB57uLKqAv9YM451Zck8eOUa4gaQ3rPZ50BKiHd3y7EsDQK7/oRR/A8OVLVw41NzuOv0PVw5teyoyaYI2FyZwGs7szEswYSUVq6YWopbtcL3STkk26JlRQJxHA4RAvcBLeMi3LPvIeAcw8PPvMPTL72I0dzA2KTZNHmdLL9sPWkxfipa3Nz56lz+eNEmCtJae8V4UjpjOQVHpc7vFAEVbf2XFcD45DYsKezcQId8J8TBEVxAV/xjTYF/rR1He0Dj5+duAw6Gp5FGG9JsI0pzcmpuPRmx3pDZ/5Sga2bnd53lO9Ohdv5u97A3phQ0+xxsq0pgU0USiwoqcGvhsVAIqGp18+K2UTT5HMzJbuDU0XV2rOqh7gzDGBECh0DnyCtixvHBqnU8+O8H+fbMLxiT7OOxDWMpaYjBtASWhJo2N2VNURxojiLKaaAqktRoP4qQ6KZCdZubA01RBEyFCSmtZMV5AQ5b1rAUKltdzMxs5ORRdbi0gyOZAPymwu7aOGra3GTHd1Db7mJqejNJUQHaA4KyJg/tAQcHmqIASHAHiA2SodHroM2v8e2T9pIS7e8RflUIO+Ha9uo42vwOxia10exzkpfURqxLp9nroLQ5iqpWN8lRAQrSWvAE4y/PzGxkdlYjT28ezYvbRw2ozS0J/1wzjpW7s5iS0UxpUzSzsxrBbUSG4X4QIfAh6L7mpaOI4jUPEGXVcOqYRnIT20mN9vPPtXk4VIs2v8b9X+RT3BjNT9+cgUuzyEtq4y+XbCAlOsCaskT+7+MCfLqKJQVOzeJ3F25mcnoLzd7+yx5ocvP91+dwoCmKqenNLPvK+q4ptG4p3PtZPi9tH0WCJwBAZYuHhxZ/Tlp0gI8rpvFmcQE+bxu76mIRwHdPLeSaGQewLHhy0xge3zgG3VT4+XnbuGxyOaZlk7e61c3/vD+FtWXJJHkCaKpFQ4eL+65Yw4SUVu75bAKflqTi0kyafQ6+MrmcO07dgxpMidK5Bh4oBPZzxbl1fnHuVuLdOvFu40sVIvZIMIQE7pyjMWx2QA/dbQ5sWsqC2A/5OGkqd706h+z4DkbFd/DVGfu7iPONuUVsKE/kl+dvZUJKKw7FIs5lE21UfAen5dZRVB+DYSmsLknhk5JUpqS3EO0y+ixrWZAZ6+Nvl6zn9V3ZvLs3o6sj2yOkykf70jktt45rpu+nstXN+0XpxLsMROo5nD//91zcsZPGbcv48dl7AOyRNjibvWb6fk7LreUX70ynza8dDNcq4fGNYyisi+Xvl61lTGI7n5em8IcPJwN2zOZ5OfW0+B10BFSkjOa1HdncMKuElGj/UYXItaQg3q2zriyJJzeN4YyxNXxcnMZlk8soSG0dnkHau7JDDF0HHjoCK0600ddgtRdhNm4EyxxSIoc6KrIqV9Dij+fqaaUkR/nZ1xDDe3vT+eNHk7n/8rUkRwfIiPXi1kzGJHQwMbWta52rW4JnNo/mtZ3ZzMpqJMZpoKmStoDd5Kqgz7KWtOMp5yV3kBXnRRWyB8liXAZXTTvA81tH8+M3Z2JJSIv24k+9Ate8X+OKGktS/H6kO0B+SlvXiGgFN6pSogO4NItop9H1/ALwGipbKhM5b3w1p+Y2opt2ypPR8R2MS2pjT10sy1dPIM5tkJfURpNXp6bdhWGJrsx/R2JCVcBnB5J5ZvNoFk6s5IlNY3h1RzapMX4uKSgfuk7RFySgqKgps9BGX9MrFvbxxNARWCho2VegJM7BKHkEvfhhrLaSIYn00Nc5r6bAZwdSeHl7DvdfsZa52Q1EOUx+9/4U2gIaydEBlODUscnnwKcLatrd+A2FeLfOh0UZLJ5Wym2nFLKnLpYvSpO7NogsSciyPl1lTGIbitKNDOLgEY0F+AIqhXWxXDN9P6ePraW6PZ6fvT2HT9uvZVbUWOgoRGn8lDbdGcxmIKho8ZAR6yPepfdMxRus1xT2CJsZ18HmygTKm10keAI0eh1sq45HUSRbKhPQDZU/LlxLarSf+z/Pp6ghpmvnuPPZRLe/Kxzes1sI2FUTh0/XWDp/N3/+aBKritP4/UX2cmNYjb4SlOhcHGNvRht7M0rU6CG9neNDYAE+v86Bynqy0pJ6fKVEjcY56adoWZcS2HsvRtnzSH/jcRuND+ek4VQtdtXEc8crc0mJ9rO7No7z8itJi7Ezvce7dfJTWvntB1PIjPWyvzGaU0bX8V8LdjJ3VD2v7Mhmd10s26vj2V6dgCJgakYT5+dX91n2Z+dsZ0NpIm/symZXbRw7q+P55bvTyEtq4+a5RRiWYENZMh8UpfH5gQRazDTM6InMnjoBGr/Av/k/maYW82rVFO58ZS6tAY1Wn4Nfnr+FqenNPLRuHMUN0WyrTMCrq2yvimdRQQWnj6njxtkl/GjlTL7xwslkx3VQ1hyFU7WYmNrC1IwmLODX705DtxS+OJBMq9/B8tX5/PDMneyoieeNndlsr4mnsDaWX7wzlXFJbXxtTjExzr53ky0J0zObcGgmP39nOi0+Bw7V4s8fT8KwBOeMqxn6tbAE4UxAy74cx/jvoibO6goR3B2lVfX4/Ppx67+DmxIvZQrA6cB5PT4Xgnavn4/W7SCgG4wbnUFMlLvb9wrCnYGWfj5K4mwI1GN1lIFlHNOGCMfDSiKYldXIjMwmVEVy2eQyrp9V0pWLx6VazMpuRFMkMU6DiydVcMXUMhI8OjMzG4l1GQhg4cRKzh1fTbTTZGxSG2MT23H2UTbObVDRGkVxYwwZsT6mZzbhVC3i3brd0RWJW9M5f2YUWt5t5E66iDuuX8ispG34NtyJUb+B3MR2xiW3oZsKk9Ob+fqcYqakN2NJhe3V8eiWwvTMJjJifSiKZEJKK9lxXlKj/cwfU0uUw8SpSs4ZX83tpxYyPqWNtGg/0zKb8eoa45LbuHbmfsYktRHtMJmd3UhDh4t9jTFkxvqY1uOem3GqfR80S+h6TodicemkchZOrEBRoCC1hZx479BtRAdTyKjpZ+Oa/kec+XegROfCIcnoahta+NcL7/Ozvz3N/oq6vmp7F/iUuh2DdnuDS4+CxQA/BP4U8nvLwqFpnDJrIt+7aREXnjGTaI+rd5sFGjDKXkAvug+zcbOtTR1kIofrHtl9V7VznXeog4EQ9jqOzu/lwbPZzqlwV9BJYXsoWbL/skq3z7vahYOJyZyJ03DO+F9E2vkgdcz9j+Hd+t/IjsqutlK7TcO7Z+vTlN7NaXb7vnO6fug9hfqusx7DOvw9Hw5q57l2Z9sfcl/HFRIQCkr8VJzjb0PLWYxwpfS6rN3r561PNrP88RWsXr+bgK73l+v5v4A/s2vwgu8fCwJfCTwGRPV5nWkRGxvFpefM5c4bFjJ36jg0tfdDW+370Isfxih5BKu9dNDudqQLE4QrDc9pz6GmnmlrePf8jcCevyADzcNmR39EQ4KIysaReyOOvG8E42/3bFjDtFi3rYjlj6/ktffX0draYb8x+0YHcCPw4mASeHCn0KlTQFAB5ANT6Ks7KYJAQGfr7v2sXLWJhqY28nLSSIiLRnQ7RBTORLTUM1FTzwAZQLaXgOk/unQkI5y8duyqWByjr7UdOrb/kkDhcjDaI+Q9WgTbVht1Fe6Zf8aRewPClUr3hpVSUlxWw/8+9Br/729PsXr9LgK60d+oG6yZFxEsR+AfvlNogImLAdIRfBf4OtC/S44lURTBlAmj+c5XL2DJRaeSnBDbuwXMDsyqdwgULsOs+/SIiDziydsFYY8KqgerZSdI44hqUQQjN73pYEICihM15RSc+UtRMy7qFWwQoLG5jefe+px7nniT7XsOYFmyp/N2aFQADyNZDlSze3BzVx2bd/bEJSCFiiJngbwTuByI67eMZeFyOjh93mS+d9Mizj1lGh537/M16a9FP/A0etEDWC07Di42D4MjJa8SYk03EOXRoMoBD7kRcciakQGQ0bQEdR0u4lw6HseXNHxO0LlbiZ2AY9ytOEZfh3Cn97rM59f5cM12/vboCj76Yhs+f+BwIy5AK/A6sAyhrEVKk13PDvojHNtJl70mjsLelf4eMB/o+9Q7uEMUHx/DFeefxJ03LGRGQS5qr8aSWK2F6PseRN//pB2Spp8nOVLy+gyVhg5nkLQCRUhiXAbxA1AFtfhDqIIGAYqADl2lyesgymna55PB3exwypY2e7jxmdO4a/7uQVEjjThIEO40HLlfxZF3K0pcAYd2IsuSbN2zn3uefIsX3vqcxsZWeh7Qh4QOfAbcjeAtoJ2dxy5j5LFfNRVcCc3nQdwHKQiuAW4HJvX721IiJIzKTuXmK8/ilivPZlRmam8fW0vHbPicQOE9mJUrkHpbr1qPZuRdU5rEj1bOpLbdTaLH1uOmRvv59sl7OW98ld2A/ahzNAX+/HFBSFXQ4cqCQDgTQEqk3kyPbwTsqI7j7k8nsqcujpz4DvyGwqKJFXxjXjGG1b+iSBFQ3+Hkfz+exFcml3Hq6PqeggbooXTqvmPeY0cd27HkUAVVX7/b2a4iWEmvsuLgtL7LxMdg5oIWhZZ5Ec7xd6CmzA/pSVVWXc+/X/qQfz3/PvtLa5CdjdJ/zXuA+0E+yZjLazjwOux4epAfoCcGdxMrFOp2QtsbkDalA411WLwNBIA8ICZkmWDvaW5pZ9W6nXy0bidOh8bYnDTcrm6NLVSUqFy0zIWosQVIf7U9GgePnY5mzSuB5Cg/EkFpUzR/XrSRr0wup8Xv4N/r8pifW0dKdIBmr4PC+lg2VybQ7OvU9tq9zqsrvLx9FHXtLmZkNdLsc6AI2aUsavH1UVaCmno67jn3o2V/BbP2Q9BbIUigdl3lF+/MAOA/zthFcnSAV7aNYmpGM6eMrkcC7brGxooEdtXYK5eSxhiinCZuzaLJ56DV72B2diNjEttxdDujFcJ2qdxcmciWqgR0UyExKhAkvYsGrxPdVNhVG0dhfSxxLqNrCi5E/78rgLLmKNaUJlHWEkWsy7BnD0FUt7lZU5pEdZubmnY31a1u0mJ8RySOCGlQRUNNPgnX1F/jLPiRPeoe4ozR3NbBsys/4wd/eoynXvuExqa2cBQaNcA/keKHKNYboLTz+f9A7bZBuPH+cfxcKe1phGTC1YVIfoIqXgbuBC6mLyIrAgvYsK2I23/1D55/63Puuulizpw7CbfrYOBxocWgjb4WNfVM9P2Poxf/EyUmH9esu49qwyraaZER6yXaZTAuuZ2U6ABZcT4+KU7jk5JUxia196nOcWqSj4rTWbE7E7+h9lAFXTvjAN6A2kfZvbhyFuGa8WeU2IlY7cUILfbg+CvsqX15s4dLJ5czK6uRk0bV09jhJCPWi6BvRdG9l69lZlZTv2qkunYXf/xwMmtKk3E7DAKGyuLpB7hhVgnLV0/gpe05pET5UYStHpqS1szvL9pEgkenqr/fzWzijd2ZLPt0IoapYErbeeP/nb2d6ZnNbKmK52dvTac9oBHrMihv8XBWXjXTMpoGofMJlNixOMZ+A8eYmxCenF5XBHSDTzbs4u5HV/Dup5vp6PDbx0L9b1J1AG8iWYZirkYKnZ0vDML9ho/j7wu953kAgwmLP0WwGbgYwZ3ASUDodACKgs9vsOKD9Xy2aQ9LLjqV715/EVPyR6F0P3byZOGc+AO07MsRWhTCk4PVWoh/010YlSsHfKuda184GCImyqGTFuOjqtXTrzonNdrP6WNquCC/kvaAxo/Pso8OUqL9mFYoZU8Ur+/K5eYrFpAw9+fgzkZ2HCCw9WdYbYVdSwMpIcGtc8PsYh7dkMen+1NJi/ExJ7uB8/OrMPpRFAkhkbJvNZIAnt6cy2cHkvn+6bvJie9gXVkS/1w7jplZjXxzXhFbqxJQhORX528lYCh8//XZbK1O4MyxtX3+riIkZS0e/vzRJObmNHDZ5DL8hsqy1RO49/N8ln1lPduq4qlrc/OTc7aREevjrT2ZZMd5j26RJ0G4ktByrsY5/naU+Gm9PKiklOwsKufep9/mmRWfUlffHPSu6XeTygDWAcuR4jWglZ0vHj03jgBDJ2bY8xzkX92Gr+MZPDEfosjrgVuxz5B7m00AqkJjcxsPPvMO76zewjcXn8vXLj+LrLTEbtcpKLET7L9LC6PiFYyaj45cKiN6/tWwFFr9DmLdOnvrY/pU5wDEu0wSPToOVfZQBSFhd123somtNLnd1DEWpeC/wZ2N1bID/6b/xKh6i54rYwiYtljitxdupsnrZEdNHA+tzcOpWlw+uaxPRdHYxHak7FuN5DMUtlQmUNnq4d7P85HSDlqgCEl9h4t5OQ0keAKclNPArKxmqtucJHoCNHkdwbJ9KJmS29hYnsj+xhj8hsq6MtsfvjXgIN6t06GrnDyqng8zm1i+eiJmsP0um1KGaQk0ZYAL4WDcay39bBz5S9FSF4Dq7nVZVV0Tj7+6igeefYeikkq7lQ9/nrsP+AeKfBSnuxI9ANsHf3c5XAytoL/wefvPgsXVCPFXLPkmgtuAa4HUkGWEsFvxQDU//9vTvPL+Ou68YSFfOXsOsdGeQ65VcIy9BeFKQd/7d8yGjXbGgTCJfKhqx5KwriyJ0mYPc7IbWFua3K86R2LLAtsCWg9VUE68l/VlSXbZi9aSluDggU2nU7w92s712/AZvo3/iVn3We97DUbMWL56IldPO8Atc/cxN6ee1SWpFNXH4NL6VhRZwMzMpj7VSA7VIi3Gx4zMJn5+7lYSguTaWpVASpQducPen5Jdp3edLyVXP0omhCQ52k9KtI9vnlTEgrxqpBRUtnoobohGAMWNMcS4dP60aCOxLoMXt47ipa2jWDLtAKkx/vB2/SX2vkjidJzjb0fLuQrhTOx1WVuHjzc+2sCyx1aydnMhunFYRwyABuBZkH8HtiORbHr8KDr/4ODYb2KFg7odULcd0qbWoijvIeUXQDwwmr6m1cJeH5dX1PHmJ5vYVlhGRnIC2elJPY6dhOpBTZiJmnERijMe2VGCDDQdlsSKgN11sfz9s3y2VCZS2uzhzcJMntmcy1njavjqjP0oAt4qzGRzZSKv7szhlR051La7CZi2ACLKYdHid/D81tGsLUvm+W2jeXVnDtPSm8iO6+DNwgw2V8Tz6t5pvLo9m5omP4H2aqa0/xJnW+gEZyK4Bn5+ay6flKTyRWkKz27JpcHr5NaT9zIq3ktGrI/XdmXz2s5sPi1J5fGNY9ldG8f83Dri3QHu/yKfl7bn8Pn+VCpaPWypTMDjMBmb2EF6jJd3CjP5uDiN7dXxvLUni1XFaYxJbGNLVSIvbhtFTZubUfHtvLYrm7d2Z9HgdTIlvZkZmU28ujOn1++emlvPlPQW2gIOntkymh018XxxIIVXdmTT5HNyVl412yoTuf+zCZQ0RbO5MoHV+1OZO6qeCydUhjcCS1CiR+HIvxPX9N+jpZ+DUHu+0A3D5LNNe/jZ357m/x56laKSSqzD7y57gbeAH2LxACiV7H6OwfSmOhoMP+e7AglcA7bjx2Ug7wDm0N/LJnjWkZaawHWXnsGtS85n4tjMHm6Z9nUmZtNm9L33YpS90C+RFQF762N4YdsoAqaCZQncDpPJac2clVdDjMtASthUmcjH+9KIdhrkJrazuTIBVUhunruPBI+O31D4pCSVDeVJxLsDnDKqmomZCi5PHJur01mtf4fY5HGMyYhm7Xv3IOs/4ZZ5B0iIMkKOOgL7/Pe1ndnEu3UK62JRFclZedVMSmvpumZ/UxQf7kunps3NuORWTh9TS3qMnza/xuObxlDV6kZTJJa0ZzQXTajk5FH1SAkHmqJ4d28Gde0usuO9zM2pZ1R8B68H5Y0OxWJBXg07quOpbPXgUC0um1zGlLQWiht7/25ajB+k/eL57EAy68uTcGkWk9OamZ3VSFJUgA0VieyptT3wShpjGJfcynnjq0nwBPoffSUIZzxa9mVBmd9sED0nllJK9h6o4sFn3+PxVz+mqqbh4DlZ37CATcA9wIvoSjM57fDR68eNCuFg+BG4ExOXgNcN0R05SPE14JtAbr/3LO3IFRPysrntmvO57tLTSUuK732d6cWofg997z32+riPXECdSqFuS9deaqS+1Dlmt2sOqoIESsaFaOO+i5IwBwLViJgJIARm0b3ou36P9Nf3KNsXOvdYQqmNQt1Xd0XRQNRIdCurKAfPaTu9CDvPhTsjavb3u93VWYd+H1L1dUiUzp62xpb5pcwPuj+ej1B762fqGlt5ZuVq7n3qLXYWliE7Xdj6hgRKgYeBh0CUgpSDKUAYTAxfAnfC9q1WgGkI7gCuAhL7LWNZOBwap86ayF03XcyFp8/oQ7ZYj1H6HIGi+7Gath4T2eLBHwMldhyeM98KqluCH+st+Lf8yE4qFhEkHB5dMr/JOPK+bYs6XL23Szp8Ad79bAt/e+QNPl2/i0BAD2ed2wy8BGI5ptiMIk12D90GVTgYOd2lYAmAG+RZwF3AWfa/+0FQtnjJ2XNZemNfskWJ1bYPvfgh9JJHkR3HKM2IBc7JP8Q1vadUWnaU0f7uqUhvJL3JYSHto0LHmOtx5H3Ljhx6SKOZpsXGnSUsf3wlL7+3hpaWdvvoqP+29QOrgLuRvAfCO9yJ24nhsYkVDuq2Q2aBQUDdiypXIOR+EKOBNA4jW9zWTbY4NieNxB6yRYFwJqGlLUBNOR2swZEt9oIENXU+Wvr5PT83WtCL/wV6S4TAfUGCcMSgjboS94w/48i9KYTMD/ZX1PK3R97gJ395klVrt+MPGIfzXZbADuA3CPErmozNxGsGO0YGeWEkERigZic0bIfUyT4UcyMotrO47ZYZWu0U3KxobfXy6cbdfPDFdhRFIW9Uek+1k1BQonJQMy5EjZ+CDNQiOyoGdOzUJ4KLY6utCCU6FyV+StdXRuUbmGXPgQwMdesOP0hAcaCmzMc17bc4J/6nPeoe4v7Y1NLOE69/wg/+9BjPrVxNc0tHkLj9Gq4CuA8p/wun8g6W7KDkBajePtRPPSCM7Hf+xKtBWiqKNie4W30ZYcoWF5w8laU3LuScU6bicYWQLfpq0A88hb7vAayWXWHLFntWAsKVgiP3eqTRir7/CYQjEcfYGxFqDNJsQy95/LBqqi8dumR++TjyvoUj93qEO7PXZf6AzodrdrDs8ZW8v3pLuDK/NmyZ33JQ1oA0joXM73jhxOg2k64CSRRCXIAUdwGnEYZsMSEhhisvOIU7rr+QGRNzUULKFvegFz2AfuAppLcq/BYLhmVxTfsdjtzrsbzleD88D6u1sOcW82H725cMEoQ7Fcfoa3GMuxUlbjKhZH7bCg9w71Nv8dybn9PQ0BKuzO9zYDmIFUD7SCZuJ0bWFLov1O2EpOk6SR/vwjt6BYJKEGOAFPpyy1QEPn+ATduLefOTTbR2+MjLSScuxtNzfexKQUs7GzX5VKTRiuw4AOZhwoZKUGLzcc++G8eoxSBNjNJnMMpfsqfKnVq8E+P1OTjolPllLbLXuXnfCI66PRupoqaRvz/5Fj/638d579MteDtH3f7XuXuBP4L4b6w9axCJOrueH+onHhSceF2oYDEIIbCsfIS4FbgeSO+3jCVRVYUZk8Zw102LuOzcecTH9D5TlEYrZsXrBAqXYzasAysEkSWoibNwzforauoCMDsI7L2XwM7fIQONQ906ww+dMr/EWTjG34GWfRnC0fvsvrXdy2sfrGfZYytZv20vRmcYzP5RCzyF5D4UuRsphu157pHixCNwJyZeA0I4kObJCO4CFgLR/ZaxLDweF+edNoO7blzI6XMKcDl7e3JKbzn6/sfQ9/0Lq7XoYDYJCWraAlwz/4KaOBupNxHY9Sf0PcuRRtuJ3NpHBglKTJ6d5WDM11CieodPC+gGn23aw7LHVvDmqk10dPjCWed2AG8juRvJaiDAnhOLuJ048btUwRJAxoC4BORSYB79iTiCbkbJSXEsWXga373uQiaPzwnhlmlhtWwnsPc+jNJnkYFGtKxLgzrefKSvGv+2n6OX/BusyA5zD0gQrkS0nKtwjLsdNWFGSJnfrn0V3P/M2zz1xqfU1jWF4/5oAhuAZQheBVqQz8KuE7ebn7hP1h2TloBDA93IRMobgW8BvYP9dkfQLTNvdAbfWnweN12+gMzUhN7XmT6M2g+xmjbhyL0R4cnGai/Gv+VHGGUv2sdQEdiQgOpGSzsLR/6daGlnwyGCA4Dq+maeeG0VDzzzDoXFFcEkgId1fywB/oWUj2Ba5aiKZPeJsc7tD18OAneiYDEIKbCUSQh5O7ZqIqXfMpaFpqnMm57P0hsXcfGC2cRGh3IAsw97rfb9+NffilH51petdftGp8wvYSrO8d+xsxw4k3pd1t7hY+WqTdz96Aq+2LwH/fDxlgEageeAe3Cq29Eti50jf3c5XHw5u5jtlukCOR/bLfN8wNNvGdMiOtrDwjNnsvTGRZwycwIOrfcmvvTXEtj7d4zih4PZJL7kUZcliKgcHGNusrMcRI+ld5YDk7Vbi1j22Epe/3A9bYfPcgDgAz5A8jfgY8A32DGXRwK+nAQGmHULtDWC6ogHeTlwBzCLw8kWpSQ9NZHrLz2DW685j/zcvmSLm9D3/h2j7KWw9McnHCQIZxxa1ldwjL8DNWlOSJlfUWk1/3juPR575SMqq8OW+W0B7kHKF5BKE6rBUIW0GWp82bpVb0y8GnRd4HTlgLwZuAVbttg3guvjgnE53Hrt+Vx3yemkJvZ2AJOmF7P6XfTC5Ri1Hw++f/VwRGeWg9TTbJlf+gUhsxzUN7Xy7MrPuPept9heWIqUh5X5gS3z+zeIh9AC+zE1yc4Tf53bH0707hQ+CpaAoiiY1kwEt4O8Ckjot0xQtnj63MksveEiLpg/g6hQskV/HUbps7ZssXn7sZUtDhU6ZX5xBUGZ31cR7rRel3l9Ad77fCt3P7aSVWu24w9P5tcCvAzcQ0DdgGaZ7PnyrHP7w4nWjY4ek64B8CDlOcFjpwWAq98ypkVsXBSXnTuPO29YyJzJeaghZYtF6Pv+hb7/MWRH+YnT+hKEJwNH7vU48r6NEts7LqFpWWzaWcLfn3iTF99ZQ3NzWzjujwHgE2AZkncQdJxojhhHixOlCw0uJiwGpwBDJgGLge9iZ1vse6gIro+zM1P42uVn8c2rz2FMdmrv9bGlYzaus7NJVLyGDAZsH5GQIBzRqJmLcObfiZp0cq8sB1JCaVUdD73wAQ+/+AEHymvCWedKYBdwL/A0lqsOxQu7jm/M5ZGAkdp1jg/s3E4CGIt9dnwTkNVvmWC2xakTcrnjhou4+sJTSIzrvQaURjtm1UqbyHWf2c4eI8UanTK/5JPs9CRZlyC03rH5m1s7ePGdNdzzxEo27yzBNMNyf6wCHgf5ICh7h3M4m+GAkdJlhhYTFwNSAzEnGIT+K0Bsv2UsC7fLyYKTp3LXTQs5+6QpPdPCBCF91egHnkQvehCrdfeRyRaPKwRK7HgcY79p58/19H6f+QM6q9bt5O7HVvLe6i14ff5wZX4rsL2o1oDUv+wbVOFgWHeVYYeCxSCIRnIhsBRbtujo8/qgbDExMZarLjyF7153IdMn5vbIJtF5odWyy862eOAppLd6+FlGgnCn4Bh1jS3zi5/KoTcppWRbYSn3Pf02z65cTX19Szh5hQzgcxDLkawA2kZKOJvhgBNDTni8ULcDEqfpfPP5nWyYtAIhqoAxQDL9yRZ9ATZu28ebn26m3esnLyeN2JiobgUEwpWKlnYOatLJSKMF2VEaWu10vCEBzYOWuQjXjD/hHPet4Kjb88Yqaxu596m3+a//fZx3Vm2mwxc4XFQMCRQBf0LKn3FJ4ReUxAfYERl1B4Kh7h4jFwWLQSJQmIjkNuCr2PG5+kZQtjh7Sh533riQy86ZR1xMbwcwqbdgVLyGvnc5ZsN6sIzjbykJKCpqwiwc47+LlnM5wpHQ67LWdh+vf7ie5Y+vZO2WQgzDDGe6XAc8g+A+LHYgiKxzjxARAh8tJl0FlnSiKKcEo4FcSBiyxSiPm/NPn8FdNy5i/uyJOB29BVLSW4Ze8qgtW2wrPn5umVKgRI/GMfYWtLFfD8r8enYVXTf4Yste7n5sBSs/2kB7uy8c90cv8A6wDEWsQhL4MvktHwtECDxYmHg1QCxCXIq9Pp7D4WSLUpKSHM81i+bznWsvYPK47JBumVbzNgJF92GUPof0NxzT2NXCmYiWc4Wd5SBhRq8AclJKdhdXcv8zb/P0G59SXdsYrsxvE3A3Ur6CIlooLYO2z46pSb4MiBB4MDFxCQQUcFtZSOtrIL6JfQR1WNni+DGZfGvxedx42ZlkpCT0vi4oW9QLl2NUfwDmUabe7HEPBGV+Z9rZ/NLOCSnzq2lo5snXP+WBp99h976ycGV+B4CHkOJhFKvsRIyKMZSIEPhYYPJVoOoKunsKyO8AS7A3uvpGULZ4ysyJ3HnDQhYtmEVMVG/Zogw0YpS9gF50L2bj5qNzy+x0f0yYinPcbWg5SxCu3rfZ7vXz1qpNLHt8Jas37BqIzO8F4O8o2hak+aWS+R0vRAh8LDHpakC4gDORLAXOJQzZYkyMh0ULZrP0xoWcND0/pGzRai9GL34Io+RRrPYDRxbyNiobx5gbcYz9RjDdS2+Z3/rtxSx/bCWvvr+W1vBlfh8BdwMfAL7IiHvsECHwscbYRRAdD4aeAOIKbNniDMKQLWakJXHDV+xsi+NGp4dYHxuYjRvtJG3lryADzYe3qAThiEXLuhRH/h2oiXNBcRzy85Li8hr+8dx7PPryR1RU1Ycr89sG3APK83isRhpVKHl6qC1wQiNC4OOFgsWAFKCMAnkLcDN2/uO+ISUCQcH4HG7/6gVcu2g+KYm9HcCk2YFZ9Q6BwmWYdZ+Gli12yvxSTsGZfxdqxoUhZX4NzW089+bn/P3JN9m+5wBWZxrC/lEOPILknyiUICPHQscLEQIfbxRcBcJSQZ2JFN8FrsROZt43LAunw8EZ8yax9MZFnHfadKLcIdwy/bXopc+gF92P1byjW15PgRI7Ace4W3GMvg7h7h1l1+cP8P7n27n7sRV8tGY7/vCyHLQCrwDLUeR6pDDZGSHu8USEwEOFSYtBSA+WOA/72OkMwpAtxsVFc/n5J3Hn9Rcxa/JY1JDZJArRi23ZIlLiGP1VW+YXN5FQWQ427Srh3qfe4oW3vqCpqTXcLAefIFmGkG8j6fgyBJAbjogQeCiRdz0kNUBrbDKCJSBvx5Yt9nvshJSMykrl61ecxS1XnUNuVkqfskWkRE2a21vmB5RV1fPwix/y0Avvs7+seiAyvweAJ4lqqqUtBfY8NdQt+aVFhMDDAQfdMsch+RZwI5DZb5mgbHF6wRjuuOEirjr/ZBLiosP6uebWDl5+bw33PPEmG7cXhyvzqwaewCZvIUTWucMBEQIPJ0y4CiQaqpgHYilwCRDTbxnLwu12cvYp0/jeTYs4c+5k3K7QAim/bvDp+l3c/egK3vl0c7gyv3bgTeBuLO1zhNTZHdlZHi6IEHg4YtISgGikXIgd9vZkwpQtLr7oVO64/iKm5I/qki1KKdlZVM69T73FMytWU9fQHM502QDWIlkGvAG0fhnDtg53RAg8XDHhKttdUotJR8jrgVuB3sGmuiPoljlmVDrfuvpcbrp8AYoiePy1VTz47LsUlVSG6/64D/gHlnwUaVSiaEQ2qYYnIgQe7uiZTeI24Fogtd8ylkTTFGZOzkMIwabt+9CNsNwf64FnkeLvaHIHFjJyLDS8ESHwSIE9rXYi5enAncAFQFS/ZSzL/vPwxPUC7wJ/Q/IpAn9kg2pkIELgkYaCqwHiQFyG7ZY5hyOPrGIBm0DegxAv4jebmZ0Ez/9zqJ8ygjARIfBIxMQlYGig6dkIvg58EzubRLj2lNhZDh5G8BCWLEVEZH4jERECj2QULMGWBxnTge8AVwNJhynVBLwI3ANsBmGxKyLzG6mIEPhEQMESkNKNYAG2W+Y5wKFiYj/wEYhlCN5H4o0Qd+QjQuATBdO/Bu3NoDkTEHIxcDswMfjtbuABJM8SazZQ5YCyZ4b6jiMYBEQIfKJh0hIQQmBZWcBJwU/XoCgVtkdHZNSNIIIIIogggggiiCCCCCKIIIIIIoggggiOI/4/XAsfnjqA45IAAAAldEVYdGRhdGU6Y3JlYXRlADIwMjAtMDktMTBUMTE6NDE6NDAtMDQ6MDCXimqTAAAAJXRFWHRkYXRlOm1vZGlmeQAyMDIwLTA5LTEwVDExOjQxOjQwLTA0OjAw5tfSLwAAAABJRU5ErkJggg==" width="64"/></p> --- # For today 1. Review: Projections and Coordinate Reference Systems 2. Mapping Geographic Boundaries 3. Importing and Mapping Shapefiles 4. Chloropleth Maps --- # Coordinate Reference System (CRS) * Points are in different locations depending on how we flatten Earth's surface into 2D map * CRS is a system for locating features on a certain map projection via coordinates * For locations to appear correctly on maps, geographic features and underlying maps need to share same CRS * Use `st_as_sf(coords = c("FILL_LONGITUDE_VARIABLE", "FILL_LATITUDE_VARIABLE"), crs = FILL_CRS_VALUE)` to create a geometry column and *set* a data frame's CRS * Use `st_transform(FILL_CRS_VALUE)` to transform a data frame's CRS * For mapping in leaflet the CRS should always be transformed to EPSG:4326. --- # Mapping Polygons * Not all cartographic data is encoded as a latitude and longitude! * Some cartographic data is encoded as regularly or irregularly shaped polygons * Can demarcate: * Administrative boundaries (e.g. census tracts, zip codes, states), * Feature boundaries (e.g. buildings, bodies of water, etc.) * Buffers (e.g. areas at a specified distance from a point source) > When might buffers be useful geometries? Hint: Consider your final project. --- # Administrative Boundaries: US Census 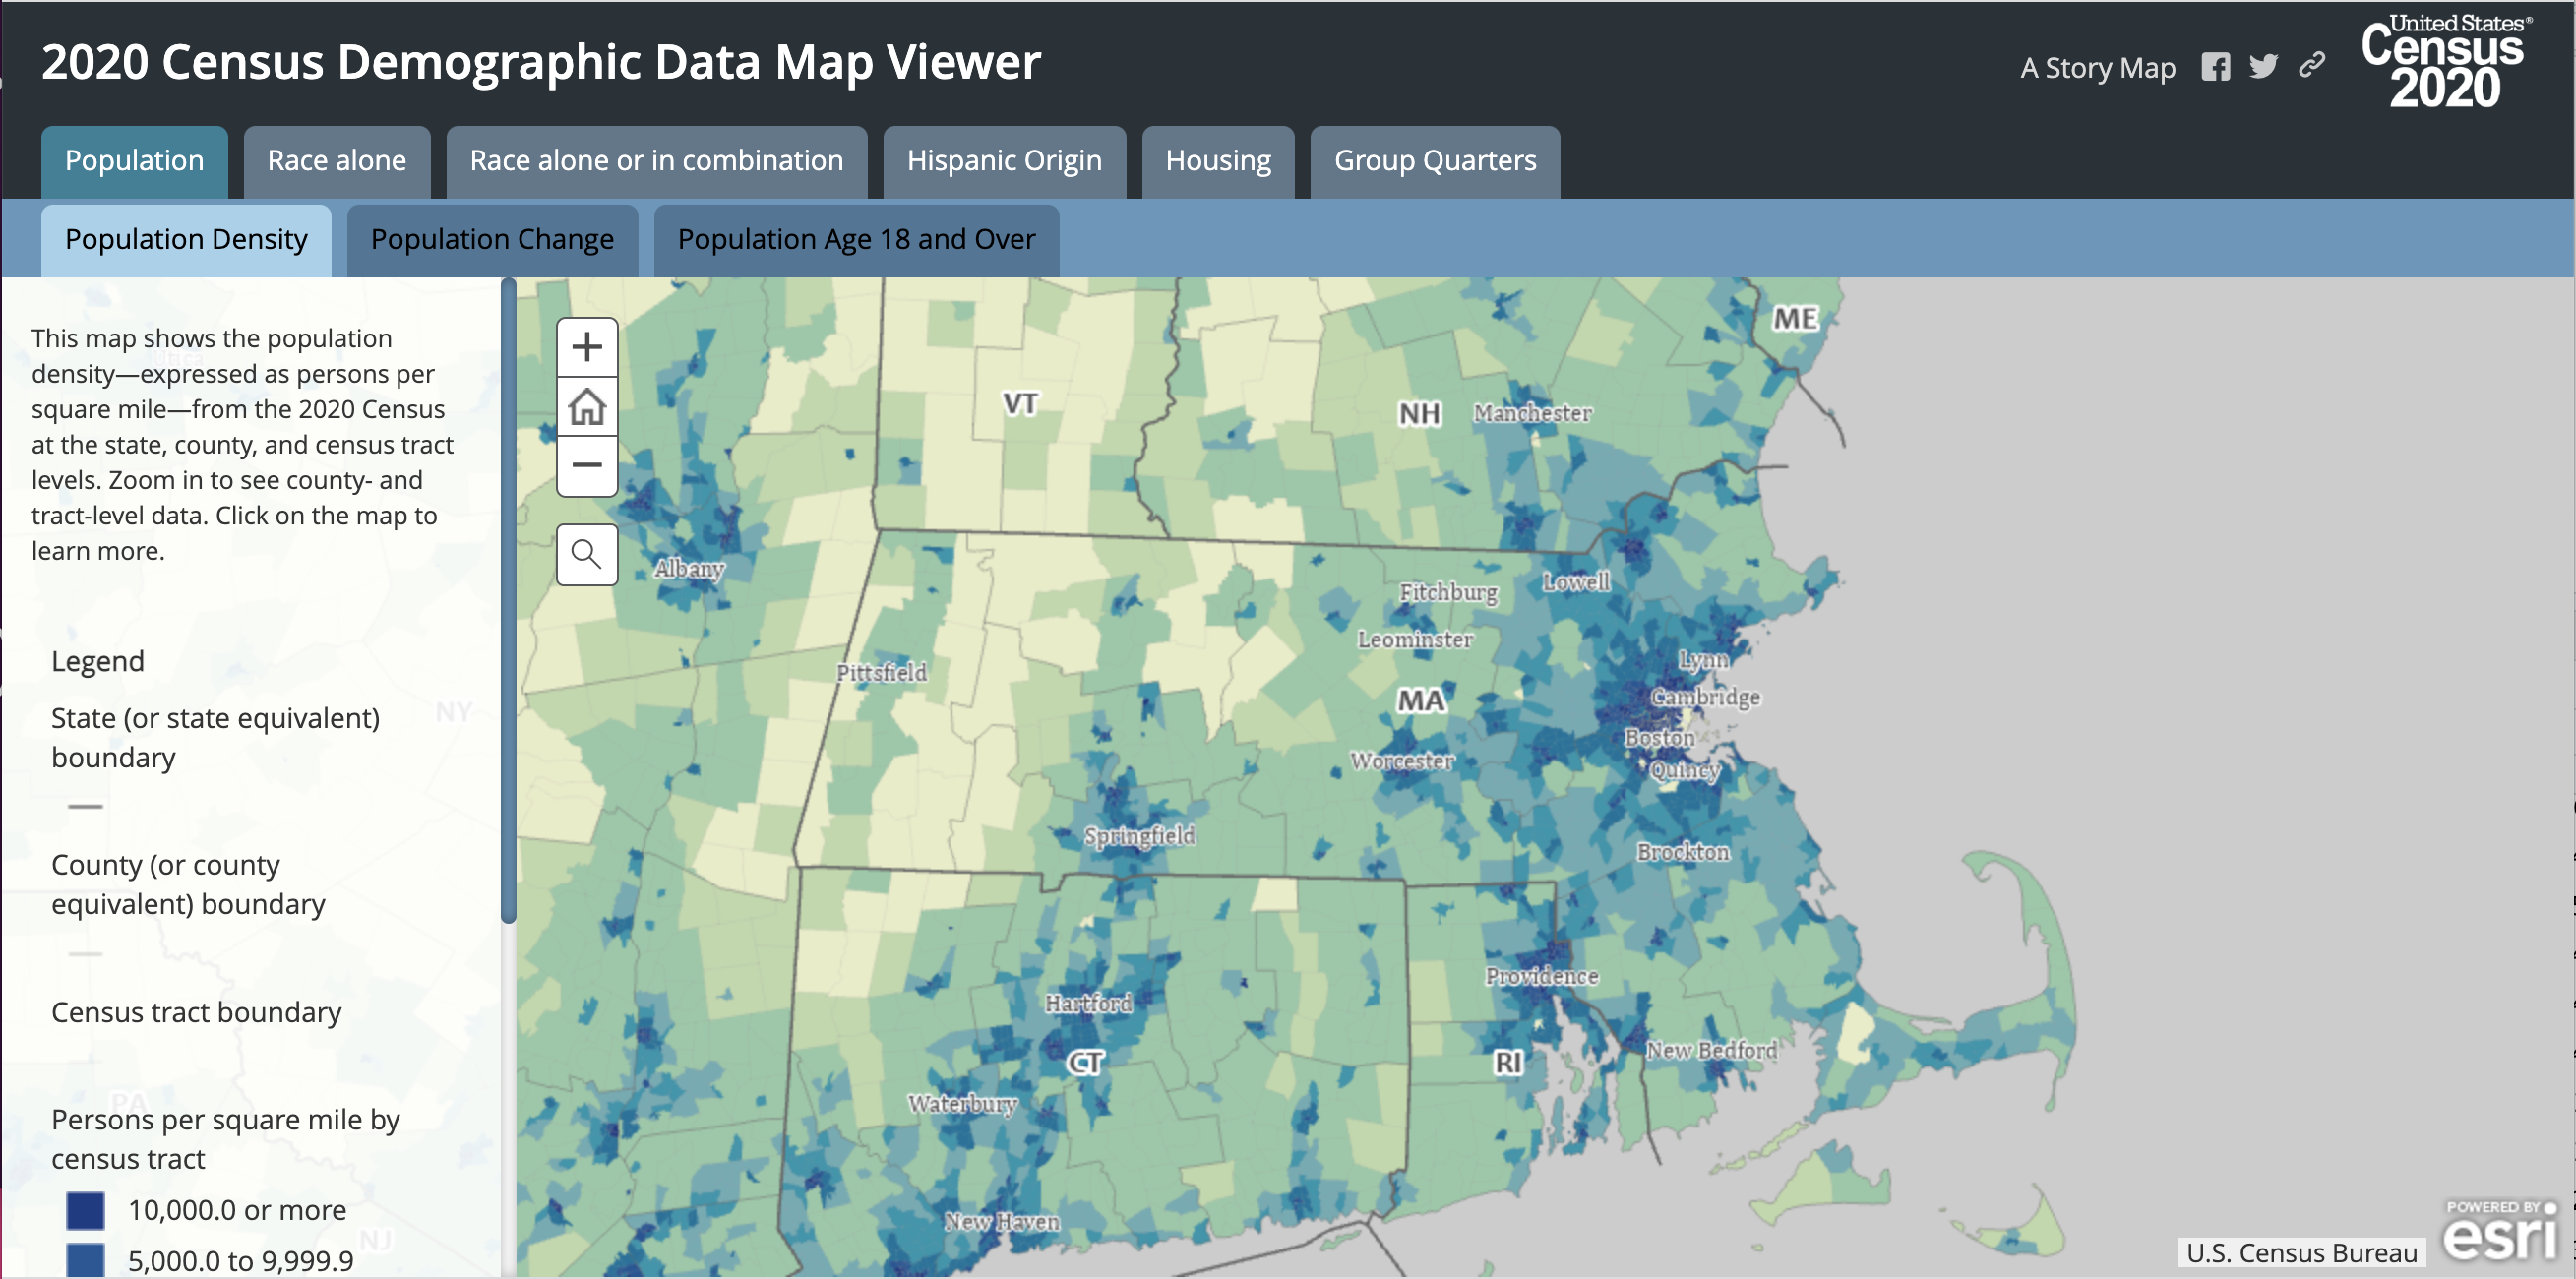 --- # Administrative Boundaries: US Census 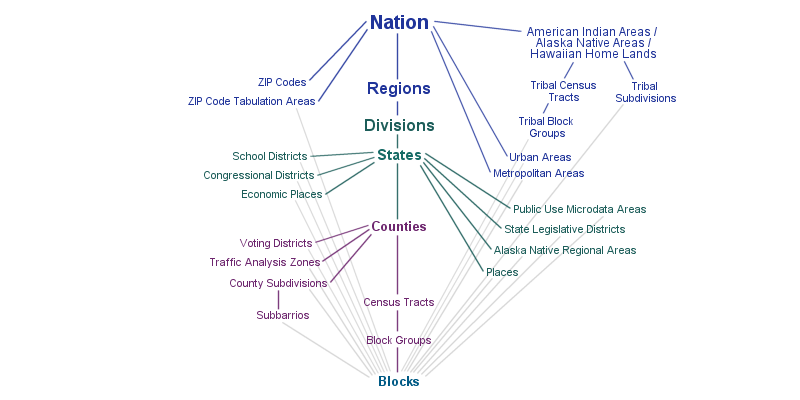 --- # Administrative Boundaries: US Census 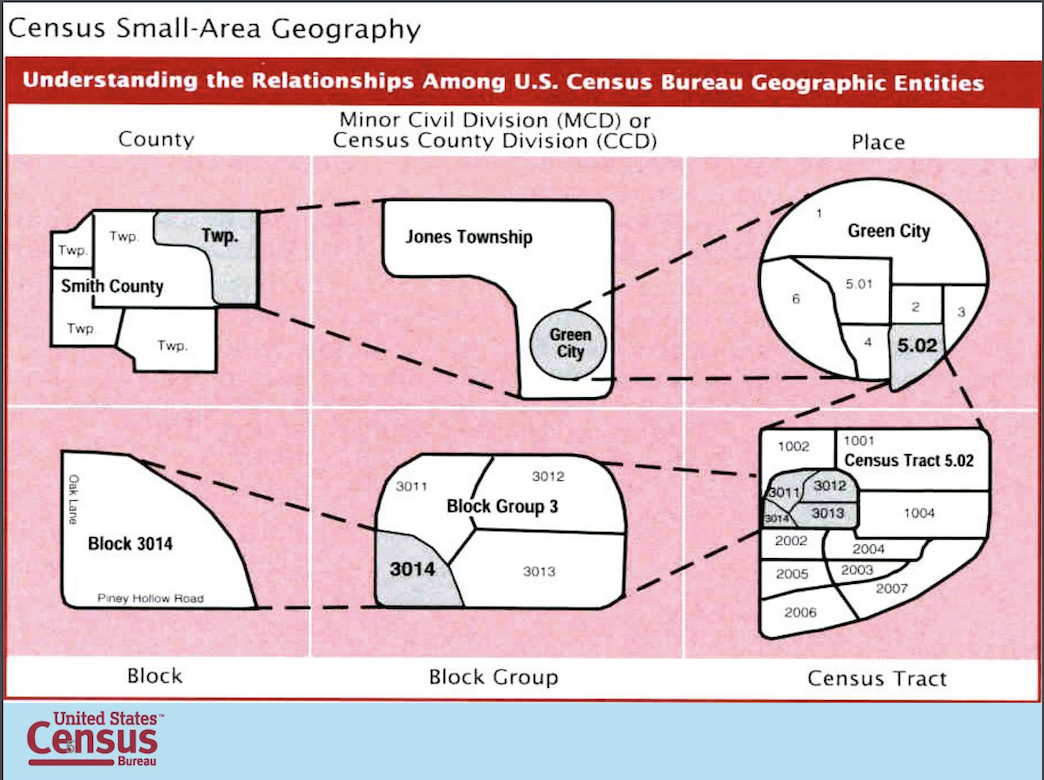 --- # Administrative Boundary Soup 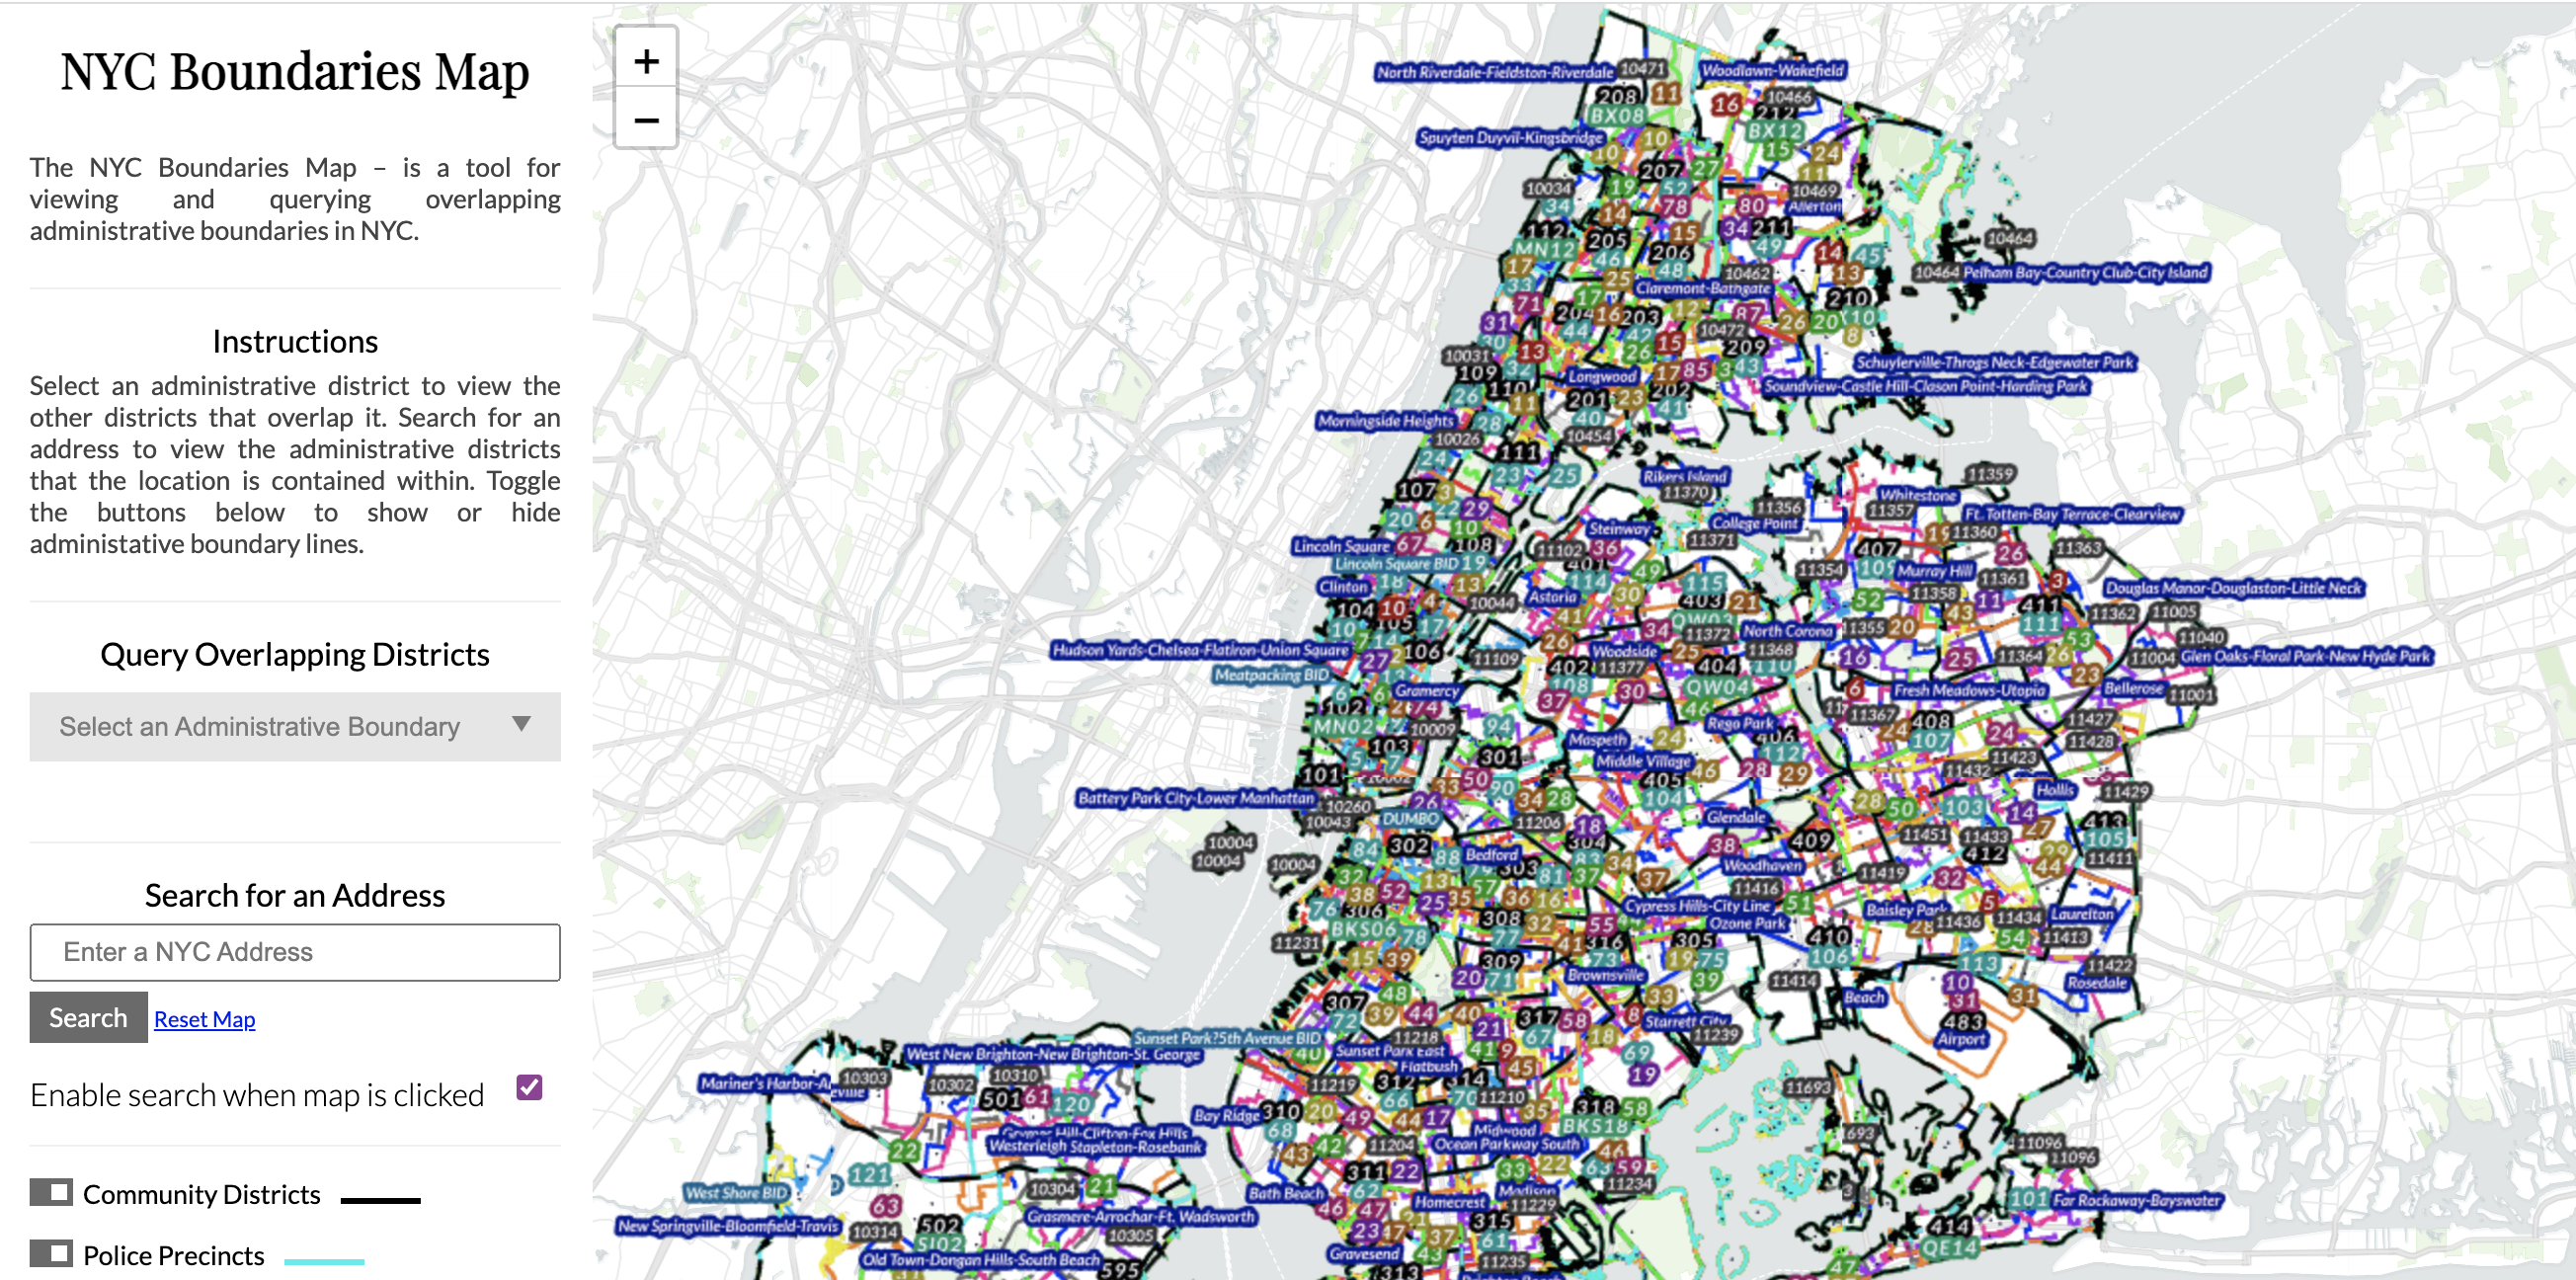 [NYC Boundaries Map](https://boundaries.beta.nyc/) --- # Feature Boundaries 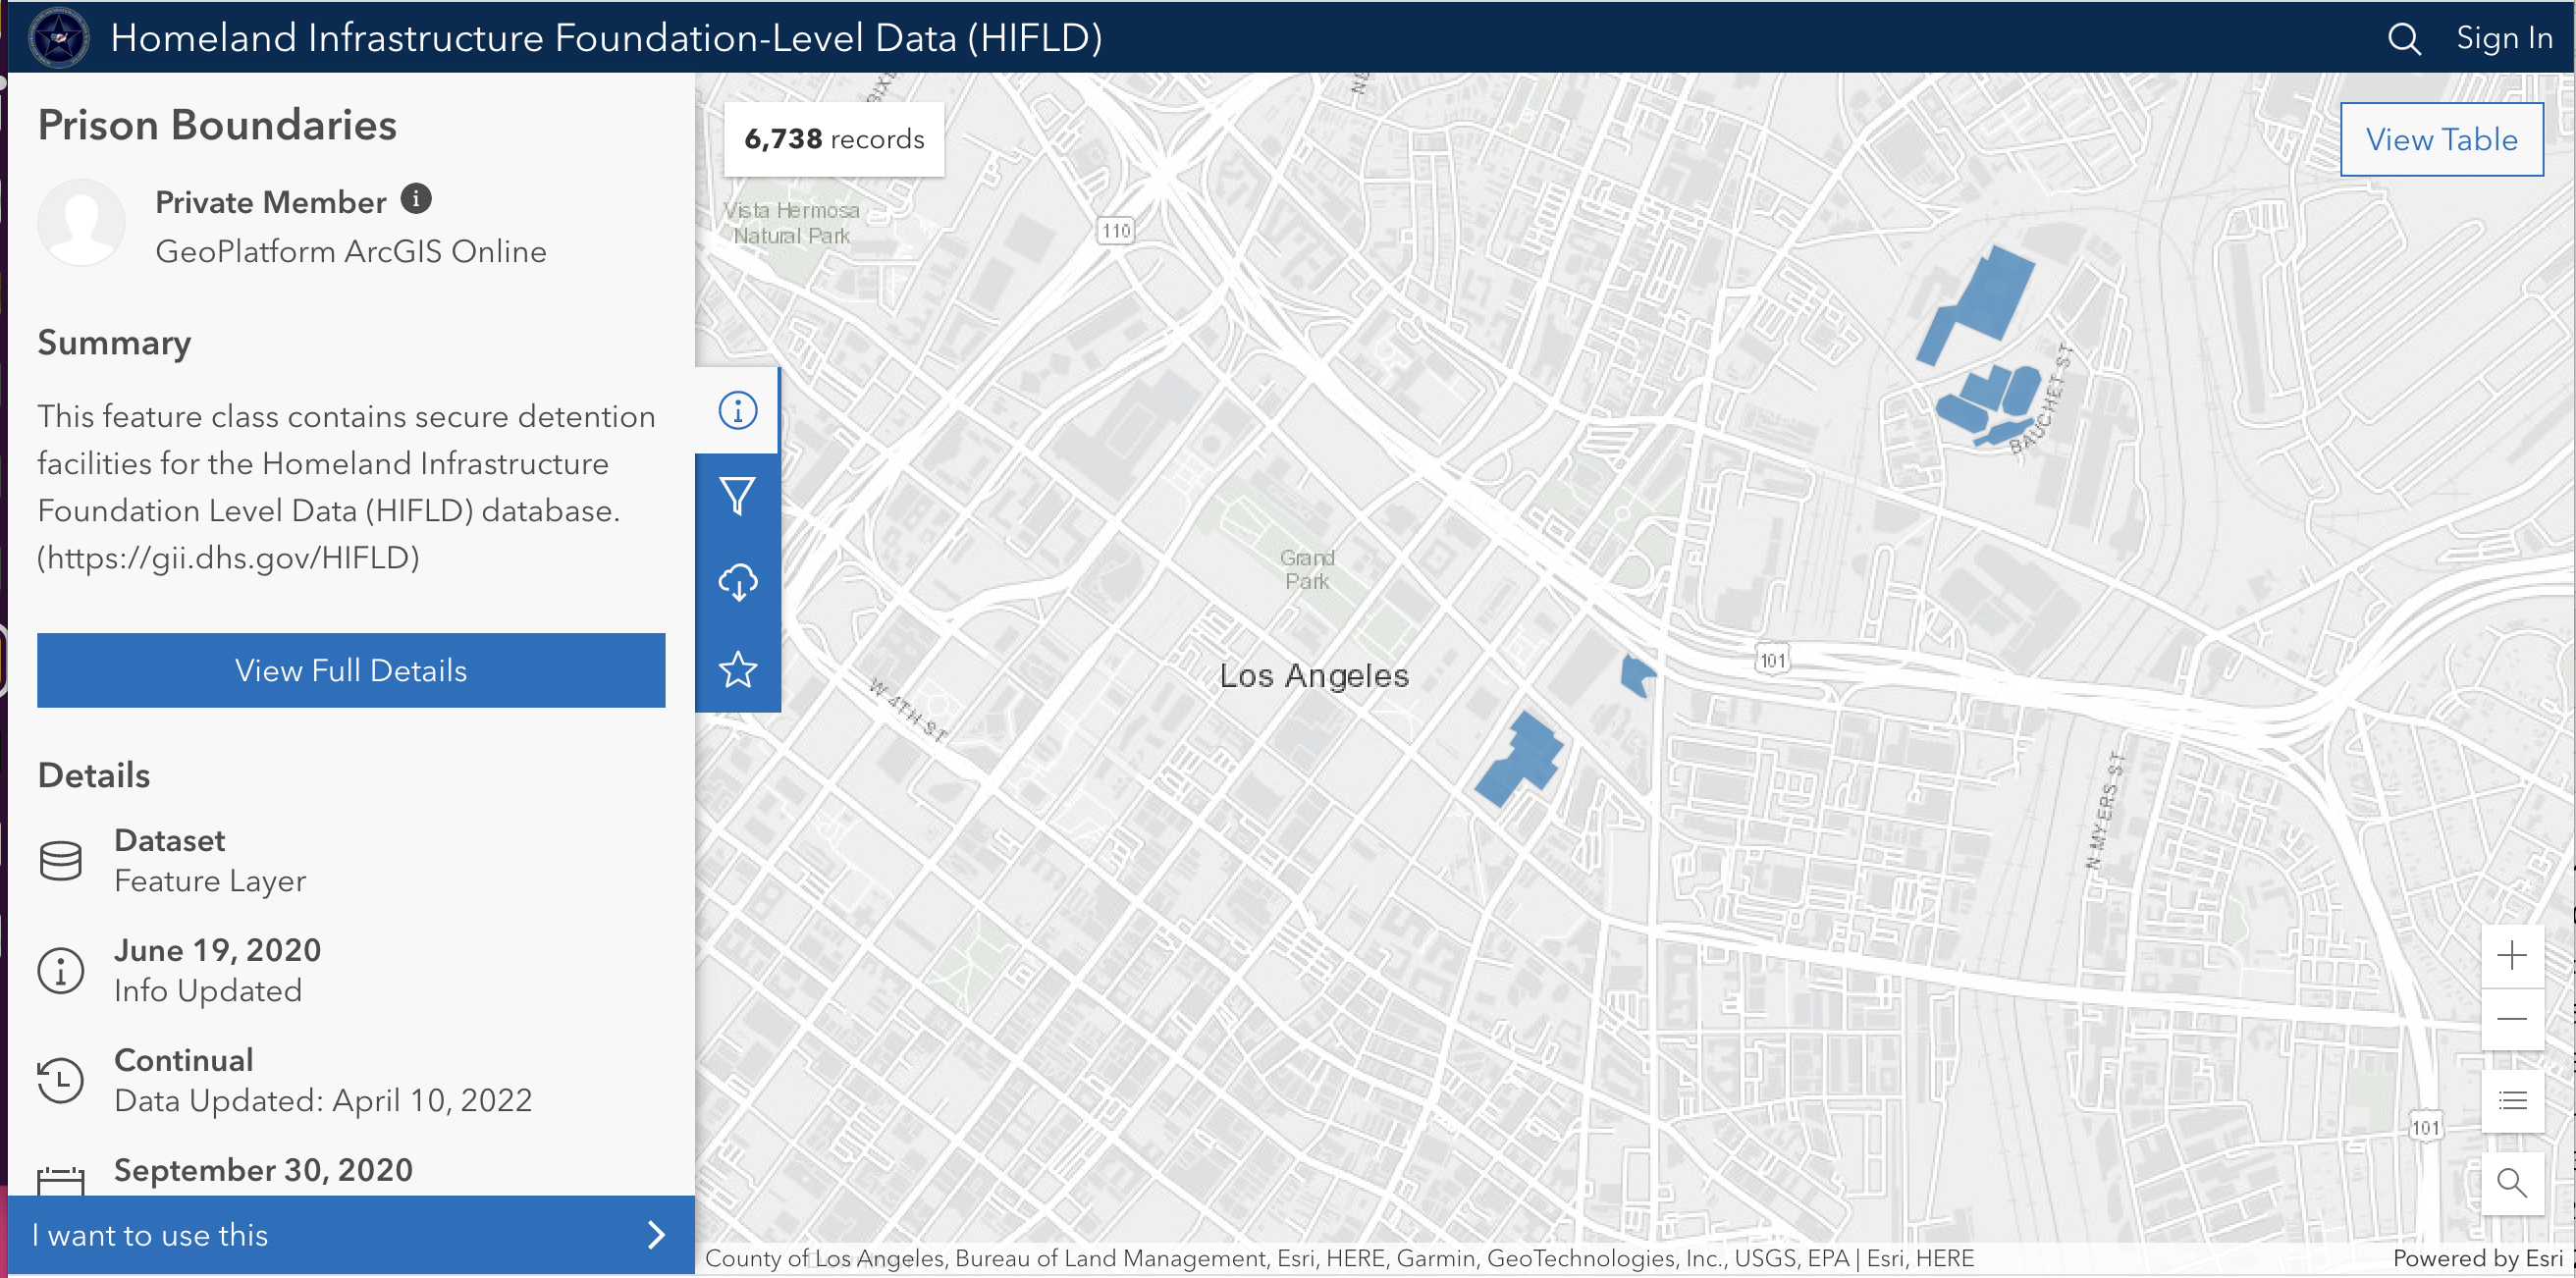 --- # Feature Boundaries 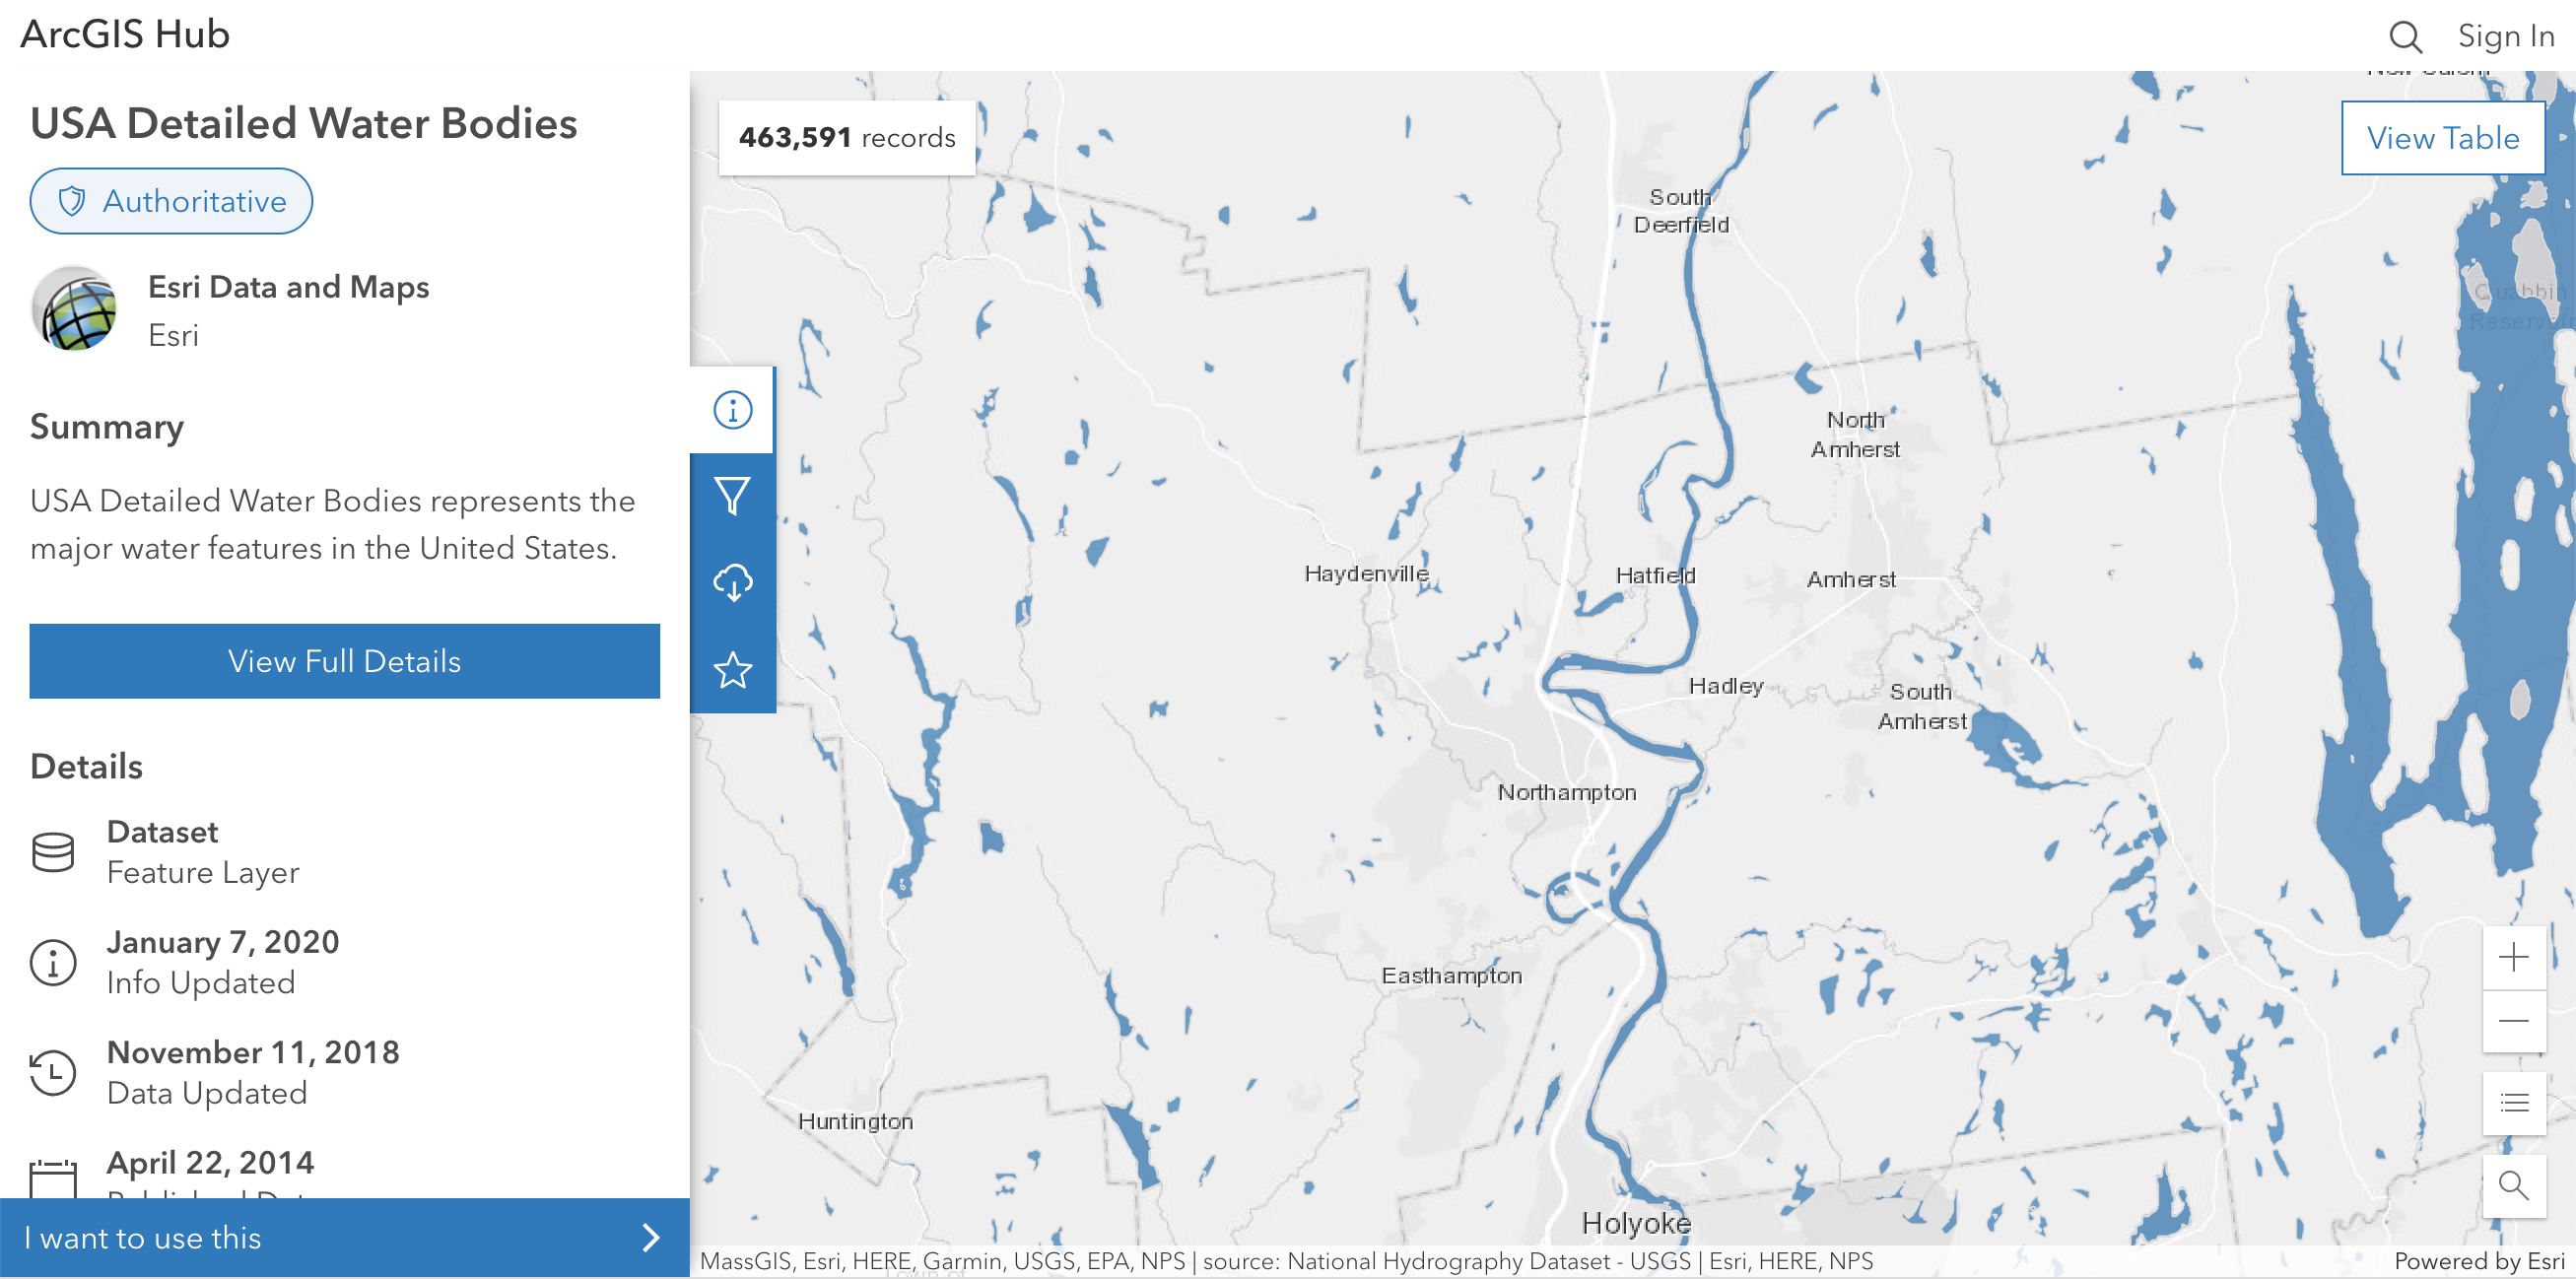 --- # Shapefiles * File for storing geospatial feature data * Actually a series of files (.shp, .shx, and .dbf) that must **all** be present in the directory for the shapefile to import. * Imported file ends in `.shp` and contains feature geometry --- # Importing Shapefiles .pull-left[ 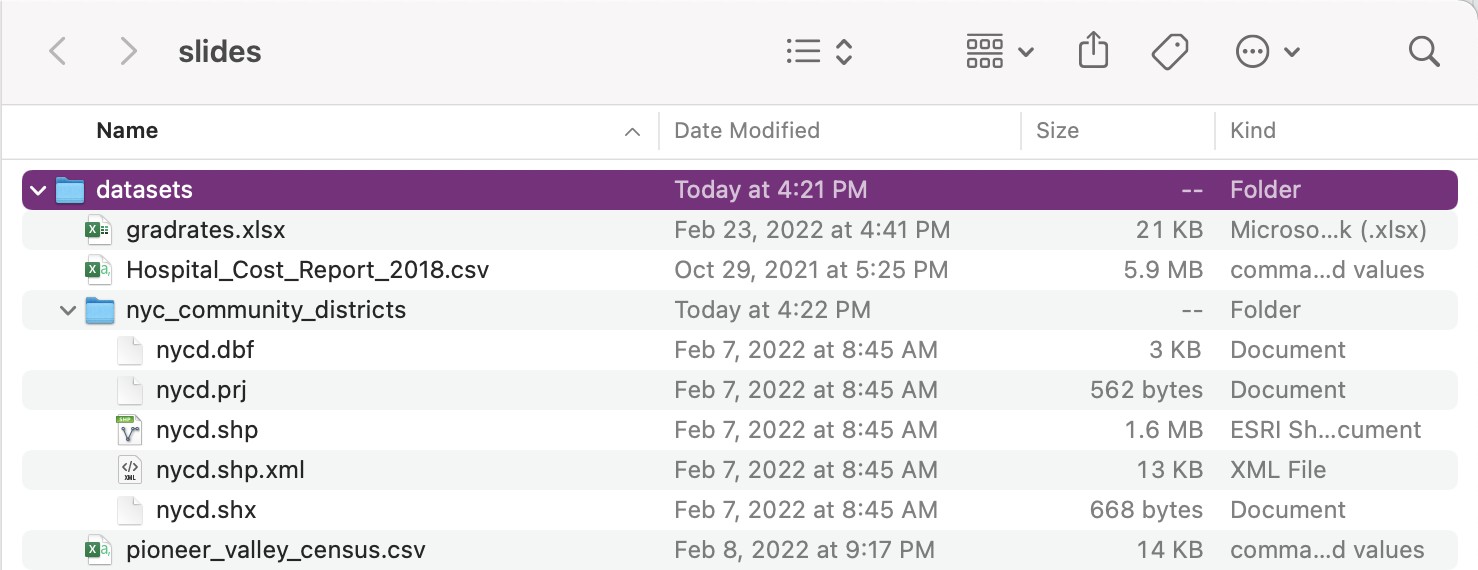 ] .pull-right[ ```r library(sf) ``` ``` ## Linking to GEOS 3.9.1, GDAL 3.3.1, PROJ 8.1.0; sf_use_s2() is TRUE ``` ```r nyc_cd <- st_read("datasets/nyc_community_districts/nycd.shp") ``` ``` ## Reading layer `nycd' from data source ## `/Users/lpoirier_1/Documents/GitHub/R_Projects/SDS-192-public-website/slides/datasets/nyc_community_districts/nycd.shp' ## using driver `ESRI Shapefile' ## Simple feature collection with 71 features and 3 fields ## Geometry type: MULTIPOLYGON ## Dimension: XY ## Bounding box: xmin: 913175.1 ymin: 120128.4 xmax: 1067383 ymax: 272844.3 ## Projected CRS: NAD83 / New York Long Island (ftUS) ``` ] --- # Importing Shapefiles ```r nyc_cd %>% head(4) ``` ``` ## Simple feature collection with 4 features and 3 fields ## Geometry type: MULTIPOLYGON ## Dimension: XY ## Bounding box: xmin: 1000351 ymin: 186749.4 xmax: 1026508 ymax: 255025.8 ## Projected CRS: NAD83 / New York Long Island (ftUS) ## BoroCD Shape_Leng Shape_Area geometry ## 1 206 35875.71 42664312 MULTIPOLYGON (((1019708 246... ## 2 404 37018.37 65739662 MULTIPOLYGON (((1026508 208... ## 3 304 37007.81 56662613 MULTIPOLYGON (((1012966 187... ## 4 205 29443.05 38316975 MULTIPOLYGON (((1014295 253... ``` --- # Mapping Polygons with Leaflet .pull-left[ ```r library(leaflet) nyc_cd <- nyc_cd %>% st_transform(4326) leaflet(width = "100%") %>% setView(lat = 40.7, lng = -74.0, zoom = 10) %>% addProviderTiles("CartoDB.Positron") %>% addPolygons(data = nyc_cd) ``` ] .pull-right[ <div id="htmlwidget-c9ff0509050cba051194" style="width:100%;height:504px;" class="leaflet html-widget"></div> <script type="application/json" data-for="htmlwidget-c9ff0509050cba051194">{"x":{"options":{"crs":{"crsClass":"L.CRS.EPSG3857","code":null,"proj4def":null,"projectedBounds":null,"options":{}}},"setView":[[40.7,-74],10,[]],"calls":[{"method":"addProviderTiles","args":["CartoDB.Positron",null,null,{"errorTileUrl":"","noWrap":false,"detectRetina":false}]},{"method":"addPolygons","args":[[[[{"lng":[-73.8718461029101,-73.8719169151728,-73.8719643215682,-73.8721335784673,-73.8723174854618,-73.8723405632703,-73.8723636524935,-73.8723955806089,-73.872527839146,-73.8726780587469,-73.8727720465853,-73.8729804293913,-73.8731272815869,-73.8731471467484,-73.8731760392855,-73.8733274669736,-73.8733483430233,-73.8735176630578,-73.8735905326388,-73.8736176059599,-73.8737582282926,-73.8737730880609,-73.8738369655606,-73.8738929586438,-73.8742583325403,-73.8750783721069,-73.8761514288291,-73.8769435147923,-73.8772276255229,-73.8775158530005,-73.877890467801,-73.8782622180322,-73.8786303201969,-73.8789939591054,-73.8793523626357,-73.8796518235077,-73.8799463075401,-73.8800914409518,-73.8801734789894,-73.8802673783566,-73.8805595352094,-73.8806788959028,-73.8807208158036,-73.8807657491459,-73.881642909245,-73.8816967494198,-73.8817724951235,-73.8821241001081,-73.8823302550307,-73.882747698579,-73.8831387395403,-73.8835182040595,-73.8841272455011,-73.885109971338,-73.8857468591637,-73.8861097884652,-73.8861197232776,-73.8861843210051,-73.8865980234512,-73.8875425178058,-73.8881375215934,-73.8886904083088,-73.889417248692,-73.8901746864267,-73.8921681562123,-73.8931709893529,-73.8941015052218,-73.8948486279507,-73.8949357995068,-73.8950141578443,-73.8950980727422,-73.8952778489266,-73.8953783618073,-73.8948475875661,-73.8948194262753,-73.8952735691077,-73.8955571806114,-73.896587201409,-73.8975178693376,-73.8985614225852,-73.8996374955661,-73.8996551031458,-73.8997327331982,-73.9003333035012,-73.9015115199571,-73.9010403297361,-73.9009631996938,-73.9009399949242,-73.9011633011518,-73.9013440457415,-73.9026881011636,-73.9026635223805,-73.9024667455367,-73.9020969186615,-73.9014130321413,-73.9009612341735,-73.9008597971891,-73.9006086418721,-73.9005323134581,-73.9004903276375,-73.9000969610738,-73.8995256799479,-73.8993072725916,-73.8991358789811,-73.8983653583245,-73.8981047765657,-73.897586563372,-73.8964405256637,-73.8960552499918,-73.8960071611179,-73.8957558507174,-73.8955807657566,-73.8955344506845,-73.8953978892207,-73.8952629043714,-73.8939489307909,-73.8938102607242,-73.8932152075789,-73.8925639256652,-73.8914180242409,-73.8913802338026,-73.8910628067923,-73.890821698287,-73.8906745175993,-73.8906445360121,-73.890426808212,-73.8901621947616,-73.8898812476067,-73.8897623001672,-73.8895845351166,-73.8894933663028,-73.8892727372128,-73.8892339790122,-73.8889465404615,-73.8880146938843,-73.886778651313,-73.8850526039665,-73.8830938243834,-73.882975370899,-73.8827179466861,-73.8826762473331,-73.8827365885678,-73.8826871439014,-73.8826279138773,-73.8834306953468,-73.8835152021354,-73.8836142989056,-73.8837128967282,-73.8837573289644,-73.8837836605134,-73.883835149305,-73.8838043043127,-73.8837131635657,-73.8821935638197,-73.8818656867116,-73.881491065687,-73.8811936679622,-73.880562139514,-73.8803543879808,-73.8807235341719,-73.8808081789906,-73.8808163119302,-73.8808338762021,-73.8808248274317,-73.8808112834161,-73.8807933004684,-73.8807664263229,-73.8806908860829,-73.8807157751575,-73.8806668466648,-73.8806485810509,-73.8806289285238,-73.8805922515002,-73.8818556767412,-73.8820355312086,-73.882436695103,-73.8825688771652,-73.8827383578705,-73.8826002220831,-73.8805558967974,-73.8789334114153,-73.8774527610744,-73.87729884832,-73.8771605358724,-73.8772445605829,-73.8779813134473,-73.876978028221,-73.8768758605487,-73.8768045292585,-73.8767987212558,-73.8760844866913,-73.8745917543696,-73.8742738632541,-73.8740146905165,-73.873056329373,-73.8719023725062,-73.8718461029101],"lat":[40.8437607778558,40.8434537426466,40.8432382537739,40.842497794549,40.8416902820204,40.8415836261895,40.8414769609834,40.8413363754319,40.8407539830068,40.8401371971068,40.8397512823361,40.8389524851857,40.838335096416,40.8382638989732,40.838165830893,40.8376519493322,40.8375920085582,40.8371144281902,40.8368965251878,40.8368187789932,40.8363981947851,40.8363587514383,40.8363611180845,40.8363634124156,40.8363790022439,40.8364230989704,40.8364985748949,40.8365608443931,40.8365831822738,40.8366299545205,40.8366895689627,40.8367600295246,40.8368412003844,40.8369329018055,40.8370349162458,40.8371260264319,40.8372262776342,40.8372811268627,40.8373105844355,40.8373442991535,40.8374591795866,40.8375051288087,40.837521265023,40.8375429859006,40.8379596836389,40.8379871134609,40.8380310725181,40.8382351240816,40.8383547669226,40.8385923412635,40.8388106720048,40.8390223663263,40.8393559193069,40.8399046391549,40.8402602436551,40.8404709946356,40.8404235214813,40.8401050444709,40.8392790501085,40.8396406584809,40.8398620023848,40.839158026468,40.8394227333803,40.8398736671137,40.8410496397396,40.841637343677,40.842190302897,40.8426282603431,40.842679358976,40.8427252911291,40.8427744807562,40.8428798609365,40.8429387789566,40.8436463632951,40.8436837709689,40.8437338283405,40.8437650891061,40.8438870555599,40.8439972480106,40.8441158739513,40.8442338255314,40.8441948406573,40.8440558179051,40.8429893800162,40.8433679689654,40.8442060775786,40.8443458394087,40.8443849826749,40.8444098469549,40.8444287507698,40.8445814722859,40.8446285737885,40.8449727021133,40.8456418791357,40.8468631933053,40.8477008533084,40.8478837793599,40.8483191998351,40.8484515271086,40.8485185413804,40.849209041181,40.8501037874369,40.8504575174702,40.8507279946471,40.8519132550649,40.8523077928105,40.8531154254887,40.8549077586531,40.8555199355532,40.8555963443679,40.8559788103522,40.8562452669938,40.8563178444408,40.8565318410449,40.8567433647587,40.8587796970276,40.8589865656346,40.8598742056531,40.8605227289159,40.8616629835412,40.8617005882631,40.8615294121173,40.8613993960937,40.8613200721788,40.8613605616078,40.861654500216,40.8619820723099,40.8623020457571,40.8624269845667,40.8626137006337,40.8627022095077,40.8629163992087,40.8629512262654,40.8632095106272,40.8638889485961,40.8645614040817,40.8655027092324,40.8666021850244,40.8664497320037,40.8661329657048,40.8660891414811,40.8660485736041,40.8660041558514,40.8658587386503,40.8654695142063,40.865399532326,40.8652948506201,40.8651499981173,40.8650625061805,40.864988243559,40.8647585975429,40.864497099854,40.8642919844725,40.8624566127224,40.8621237619579,40.8618785164318,40.8616838308439,40.8611972295258,40.8605693625072,40.8588275024044,40.8583857190752,40.8583215854647,40.858183125617,40.8580901230474,40.8579508834032,40.8578861738329,40.8578059491075,40.8576222333998,40.8573874020777,40.8571256774353,40.8570470453411,40.8569680516326,40.856739973288,40.8522260962678,40.8516434322482,40.8503437699291,40.848542763224,40.8478890886555,40.847708461682,40.8463202953062,40.8452146566745,40.8441644089741,40.8441226899081,40.8440851998036,40.8440094946265,40.8428044160759,40.8424397705924,40.8424026366364,40.842376709033,40.8422997872775,40.8420647699207,40.8415206475394,40.8421389483042,40.8425376773162,40.8432429321613,40.8437208520911,40.8437607778558]}]],[[{"lng":[-73.8475082034414,-73.8480129526487,-73.8485944796045,-73.849564537853,-73.8499544028441,-73.8507921646086,-73.8508760633661,-73.851303526722,-73.851870674825,-73.8524444347591,-73.8534013654509,-73.8541541809969,-73.8550508341339,-73.8556742771729,-73.8562856771093,-73.8566154109635,-73.8580176767162,-73.8586201644993,-73.8587246582933,-73.8593087683014,-73.8598592561211,-73.8604098922744,-73.8608717262406,-73.8616234186756,-73.8618182828136,-73.8627137642276,-73.8644708631116,-73.8649174897845,-73.8652477262981,-73.8658127061575,-73.8668280126407,-73.8679258648825,-73.8681058228117,-73.8682776151747,-73.8683180682867,-73.868358533074,-73.8684520354003,-73.8686094929539,-73.869048387312,-73.8693205085695,-73.8708649277179,-73.8710036316108,-73.8711223138123,-73.8712894048577,-73.8713430983512,-73.8714980070648,-73.8719205840257,-73.8731552720696,-73.8739739307465,-73.8747941417987,-73.8750915415561,-73.8753864726791,-73.8762830236057,-73.876997241884,-73.8778940272635,-73.8783662923012,-73.8786587482635,-73.879693540886,-73.880088774892,-73.8804906821248,-73.8808848465233,-73.8808979364915,-73.881309176877,-73.8817230176511,-73.8820851986599,-73.8829754338343,-73.8835332114184,-73.8840905169682,-73.8841609538133,-73.8846141461265,-73.8850919561427,-73.8855933098002,-73.8856119788771,-73.8856503153903,-73.8856999561787,-73.8862888460147,-73.886794729562,-73.88710945095,-73.8877019927043,-73.8882358782069,-73.8883831716343,-73.8887607883856,-73.8896716347519,-73.8900515142445,-73.8901336687324,-73.890159837874,-73.890177442278,-73.8902542797344,-73.8905035830003,-73.8908867031674,-73.8912701795326,-73.8916898855302,-73.8921786575121,-73.8934431381874,-73.8944468875035,-73.8935881894753,-73.8923209052634,-73.8917504879261,-73.8914312862048,-73.890501292144,-73.8895712836084,-73.8886776620666,-73.8877832688397,-73.8876466372534,-73.8867165625313,-73.8857874052002,-73.8848553853325,-73.8839357946289,-73.882999182888,-73.8825687695602,-73.8820711212716,-73.8811374760109,-73.8802064802561,-73.8798389492007,-73.8792777995974,-73.8784577933542,-73.8783431255438,-73.8774161249239,-73.8769245825537,-73.8764795304389,-73.8762518021305,-73.8755564314717,-73.8754323616297,-73.8746294635104,-73.8739829374628,-73.8737009828374,-73.8733031009611,-73.8727735685624,-73.8723725635367,-73.8718409589812,-73.8713564854483,-73.8709705324967,-73.8703788127843,-73.8694245860326,-73.8684575765922,-73.8675141292392,-73.866556611179,-73.8641847586896,-73.8627263391242,-73.8617507144683,-73.8611170766244,-73.8587632497491,-73.8558349556606,-73.854555522564,-73.8526043258402,-73.8522045056597,-73.8521222109915,-73.8520399162594,-73.8518974626072,-73.850498913962,-73.8506337304074,-73.8507490642678,-73.8508643971003,-73.8513110504637,-73.8544257525366,-73.8543692806646,-73.8540545329872,-73.8538245071134,-73.8537828697177,-73.8536056829382,-73.853254931964,-73.852923535223,-73.8525773383639,-73.8522409742843,-73.8518953747769,-73.8515510733492,-73.8513510276501,-73.8512092908837,-73.8509932732465,-73.8508691753435,-73.8505116087321,-73.8502044455664,-73.8501155663642,-73.8499642602272,-73.8498443127133,-73.8496520730917,-73.8493530507701,-73.8489234490988,-73.8479588598362,-73.8478016462052,-73.8475798071804,-73.8477784421743,-73.8477574010969,-73.8476703373911,-73.8475557978618,-73.8475082034414],"lat":[40.7390078070401,40.7387633444713,40.7385011710633,40.7381060928986,40.7379603043543,40.7376817560216,40.7376538599343,40.7375117275426,40.7373429291861,40.7372023129819,40.7370027582791,40.7368778133413,40.7367202216232,40.7365866581536,40.7364260425055,40.7363308371852,40.7359070835274,40.7357399071036,40.7357086441965,40.7355361283473,40.7353683856855,40.7352012602527,40.7350610856848,40.7348299731497,40.7347700602051,40.734515053656,40.7340072749305,40.7338665100468,40.7337622492319,40.7335838624784,40.7332457802965,40.7328725692482,40.7328262545154,40.7327670716494,40.7327536202895,40.7327401590446,40.7327133755154,40.7326531766484,40.732513917941,40.7324275432278,40.731945599399,40.7319056836445,40.7318715290089,40.7318162618719,40.7317993571146,40.7317505866538,40.7316139287872,40.7312439698152,40.7310032586413,40.73075902678,40.7306713632197,40.7305906728702,40.730313093919,40.7300483531401,40.7297159303876,40.7295158866319,40.7293996769841,40.7290101589161,40.7289062742142,40.7288165420463,40.7287437302178,40.7287413119397,40.7286808265212,40.7286352540297,40.7286103753503,40.728540950784,40.7284974480576,40.7284494117285,40.7284435111192,40.7284030066901,40.7283602924179,40.7282744399751,40.7283421776956,40.7284963822676,40.7287269714786,40.730601703117,40.7319225785439,40.7327442933385,40.7342913227586,40.7354411608881,40.7357583823087,40.7365363637948,40.7383151394919,40.7389736031946,40.7391444634683,40.7391988790892,40.7392349338419,40.7393922541524,40.7399027504751,40.7406872451642,40.7414282487896,40.7421448441982,40.7428727780394,40.7449579546392,40.7465352708128,40.7466204605364,40.7467527474311,40.7468117271341,40.7468447364522,40.7469419392122,40.7470390537029,40.7471342773485,40.7472289262337,40.7472448393756,40.7473414625193,40.7474397539918,40.7475348115672,40.7476302420153,40.7477344024237,40.7477778459097,40.747829926818,40.7479272934953,40.7480249796925,40.7480617245398,40.7481240924725,40.7482148108683,40.7482226600425,40.7483193733449,40.748368988615,40.74841640211,40.7484388501133,40.7485136085516,40.7485273595215,40.7486139279188,40.7486856684713,40.7487173189776,40.7487581246386,40.7488129579851,40.7488515513313,40.7489055766492,40.7489569508011,40.7489992423263,40.7490640780592,40.7491568510175,40.7492638209405,40.7493757074826,40.7494641491502,40.7497195881934,40.7498679379296,40.7499675912558,40.7500242283664,40.7507169718049,40.7515772724589,40.7519619185315,40.752541966549,40.7526606818602,40.752685519396,40.7527103580457,40.7527528596665,40.7501206987575,40.7500813409611,40.7500384918114,40.7499956418746,40.7498433761507,40.7488517268845,40.748738930191,40.7481583169479,40.7478540400851,40.7478029913653,40.7474968285921,40.7468235494634,40.7461819475256,40.7455056473151,40.7448409656761,40.7441797382359,40.7435072271111,40.7431190579557,40.7428440212208,40.7424225429113,40.7421804113246,40.7415188570427,40.7409020337518,40.7407235627984,40.7407017722784,40.7406655498284,40.740614663785,40.7405232498138,40.7403919148126,40.7400970163836,40.7400496769622,40.7397213544384,40.7393448352464,40.7392990885836,40.7391952354507,40.739063915243,40.7390078070401]}]],[[{"lng":[-73.8964662506299,-73.8965263330149,-73.8965815876399,-73.8966353676674,-73.8967496595112,-73.8968693782032,-73.8968990812467,-73.896959138362,-73.8970278151516,-73.8971048866469,-73.8971901003899,-73.8972831772595,-73.8973838123863,-73.8974375614847,-73.8974931200785,-73.8976719417578,-73.8978629987368,-73.8980644469557,-73.898274189501,-73.8984899774004,-73.8987094468792,-73.8988992828747,-73.8996983025444,-73.8997455060752,-73.900245376395,-73.9004700109828,-73.9007523595447,-73.9026226228038,-73.9035258449234,-73.9040463980889,-73.9045689133247,-73.90478936068,-73.9054141661056,-73.9054930354526,-73.9055483682493,-73.9056593420266,-73.9062828712672,-73.9067194118451,-73.9070182028394,-73.9077715879164,-73.9085164231406,-73.9088602555343,-73.9090552702809,-73.9092746294856,-73.9100246099535,-73.9107695442353,-73.911511928854,-73.9122730121486,-73.9130372137234,-73.9133072811088,-73.9137970017106,-73.9145397242182,-73.9146891547908,-73.9147008338055,-73.915289635161,-73.9155003395401,-73.9160459932908,-73.9166103203224,-73.9167983288489,-73.9175522613358,-73.9176811391874,-73.9180460695848,-73.9182934576662,-73.9187832329374,-73.9190610922491,-73.9198096194062,-73.9205501314324,-73.9209610386625,-73.9212136988418,-73.9213058780854,-73.9220713379702,-73.9228070235952,-73.923169667107,-73.9236437983556,-73.9242921326796,-73.9243918330361,-73.9253490361324,-73.9255606405626,-73.9263161253153,-73.926449920673,-73.927070693955,-73.9275068527093,-73.9278112067199,-73.9280433068713,-73.9285065967179,-73.9286426904778,-73.9288283423497,-73.9288289782543,-73.9297019240275,-73.9305114666293,-73.9311451648234,-73.931211998206,-73.9314718454511,-73.9317740462147,-73.9319288999603,-73.9323660567559,-73.9331186279311,-73.9338281715593,-73.9341339729401,-73.9344878475898,-73.9345799944256,-73.9346067511236,-73.9346889265965,-73.9347969968416,-73.9352226443668,-73.9360067922188,-73.9363876262512,-73.9367597902675,-73.9373906476545,-73.9377735456835,-73.9381771855279,-73.9385685484866,-73.9389015280868,-73.9396899520913,-73.9404199145092,-73.9404630853598,-73.9411491721417,-73.9419307881624,-73.9404205787432,-73.9402056390494,-73.9400171205594,-73.9398249573838,-73.9395100827194,-73.938868641261,-73.938365196089,-73.9382713952967,-73.9381159247666,-73.9376549335342,-73.9375289602967,-73.937378979284,-73.9372906345065,-73.9369807406091,-73.9353365296369,-73.9339509297254,-73.9335226266566,-73.9326978492492,-73.9317287178306,-73.931155339243,-73.930236889214,-73.9297999423443,-73.928737731971,-73.9281093220348,-73.9266480844634,-73.9260893009301,-73.9259618393912,-73.9251376222063,-73.9249070671207,-73.924169050099,-73.9238514837559,-73.923062441265,-73.9228621886442,-73.9223369695204,-73.9218918463265,-73.9214347597289,-73.9207006591888,-73.9199595293086,-73.9195647335138,-73.9192216260329,-73.9188434257222,-73.9184767086711,-73.9181029964512,-73.9180816760575,-73.9177366290558,-73.9173652032122,-73.9169950680197,-73.9166494811254,-73.9166089237908,-73.9162525203122,-73.9158973862979,-73.9155125050607,-73.9147706384764,-73.9140309747051,-73.9132916243198,-73.9125491390839,-73.9118071006943,-73.9129040412196,-73.9121616973804,-73.9114224265737,-73.9106788273735,-73.9118082010449,-73.911034895788,-73.9095327313856,-73.9087736610297,-73.9080224924566,-73.9075698522655,-73.9072745239221,-73.9068458346055,-73.9065235071222,-73.9061162600322,-73.9057653602042,-73.9054012773038,-73.9050048476836,-73.9046638475369,-73.9042601834566,-73.9048043538206,-73.9049142425983,-73.9057959700921,-73.905042952955,-73.9042879271097,-73.9038660054109,-73.9035405707189,-73.9027882470701,-73.9020727736498,-73.9017609660887,-73.9015539023884,-73.9014395867372,-73.9013984066204,-73.9018877625489,-73.9004246511309,-73.9011615506039,-73.8989768735436,-73.896526442364,-73.8964662506299],"lat":[40.6823364219728,40.6820029184158,40.6815747184331,40.6815564953434,40.6814920260621,40.6808814490309,40.6808156027293,40.6806995818402,40.6805863664477,40.6804763273461,40.6803698249256,40.6802672079914,40.6801688126217,40.6801206915437,40.6800737767268,40.6799688549371,40.6798750111177,40.6797934311789,40.6797250434942,40.6796705087743,40.6796301706819,40.6795609349016,40.6795440916942,40.6795079600669,40.6794227910109,40.6795352440653,40.6796766435087,40.6806645034182,40.6797392425141,40.6792205980192,40.6795155370216,40.6796504568711,40.6799926433812,40.6800371581605,40.6800716022369,40.6801406914279,40.6805067560749,40.6807674219426,40.6809482797905,40.6813778465741,40.6818039438251,40.6819940364655,40.6821055747453,40.6822343235831,40.6826573710899,40.6830927012723,40.6835049900879,40.683934965192,40.6843678096827,40.6845208578216,40.6847998717835,40.6852269184801,40.6853104194227,40.6853169452405,40.6856455369953,40.6857615240279,40.6860720694707,40.6863913526917,40.6864971998719,40.6869302230498,40.6870040948014,40.687213247771,40.6873566678148,40.6876260884438,40.6877843687593,40.688211241412,40.6886409221165,40.6888720518375,40.689019477115,40.6890716435979,40.6894898413008,40.6899239253446,40.6901234059908,40.6903988375817,40.6907733573566,40.690831749277,40.691366941838,40.6914908400026,40.6919284539681,40.6920017688283,40.6923462235934,40.6926038114563,40.6927742086536,40.69290417237,40.6931657263592,40.6932410125515,40.6933500992541,40.6933504740712,40.6938633976118,40.694316523049,40.6946739753662,40.6947127697819,40.6948609024252,40.6950282153467,40.6951146575311,40.6953583772966,40.695791153846,40.6961842773079,40.6963584314036,40.6965602684784,40.6966128244709,40.6966280858393,40.6966749543876,40.6967365923545,40.6969865451318,40.6974053962503,40.6976153015073,40.6978311888305,40.6981857953999,40.6984046930499,40.698640223292,40.6988481360524,40.6990369704857,40.6994557914414,40.6998737747676,40.6998978895406,40.7002811274921,40.7007252341929,40.701076598295,40.7011243056465,40.7011661481724,40.7012087986458,40.7012797812481,40.7014276729813,40.7015448898458,40.7015696423227,40.7016106683499,40.7017323123984,40.7017655535374,40.7018051310971,40.7018284443381,40.7019102776596,40.7023148258386,40.7026745926979,40.7028489818732,40.7031703912226,40.7035459911243,40.7037723348702,40.7041311315899,40.7043045299944,40.7047169507642,40.704963939698,40.7055292245019,40.7056797011623,40.7058097831741,40.70653890478,40.7067443945278,40.7073944496271,40.7076762980633,40.7083689691659,40.7085454975254,40.7090062604165,40.7093960967104,40.7091287657063,40.708694630124,40.7082572885237,40.7080239783973,40.7078151343449,40.7075979984019,40.7073815627365,40.7071599694582,40.7071473301108,40.7069427389294,40.7067224690084,40.7065029645781,40.7062993881245,40.7062754946701,40.7060655429796,40.7058548171301,40.7056264446535,40.7051894377752,40.7047491130351,40.7043126385472,40.7038734198365,40.7034349520267,40.7023618912967,40.7019231641026,40.7014865880167,40.7010459695667,40.6999380026219,40.6995321139707,40.6986751051255,40.6982552266944,40.6978254091374,40.6975717504737,40.6973991897234,40.6971635493117,40.6969761436171,40.6967505571315,40.6965485551254,40.6963503058835,40.6961187462833,40.6959322465276,40.6957003714427,40.6951481695847,40.6950735713309,40.6941271555136,40.6937040067602,40.6932780687472,40.6930357122295,40.6928487817959,40.6924183392061,40.6919992313042,40.691807310892,40.6916798589335,40.6916121057659,40.6915899920378,40.6910777200733,40.6881838988769,40.6878779353556,40.6852976980837,40.6824032992416,40.6823364219728]}]],[[{"lng":[-73.8913802338026,-73.8914180242409,-73.8925639256652,-73.8932152075789,-73.8938102607242,-73.8939489307909,-73.8952629043714,-73.8953978892207,-73.8955344506845,-73.8955807657566,-73.8957558507174,-73.8960071611179,-73.8960552499918,-73.8964405256637,-73.897586563372,-73.8981047765657,-73.8983653583245,-73.8991358789811,-73.8993072725916,-73.8995256799479,-73.9000969610738,-73.9004903276375,-73.9005323134581,-73.9006086418721,-73.9008597971891,-73.9009612341735,-73.9014130321413,-73.9020969186615,-73.9024667455367,-73.9026635223805,-73.9026881011636,-73.9033865124588,-73.9041010735872,-73.9048312203632,-73.9055058276064,-73.9061182471481,-73.9066467555957,-73.9075448891075,-73.9084507328043,-73.9093592484465,-73.910254353069,-73.9108057940986,-73.9110409640953,-73.9112809741578,-73.9114163658133,-73.9119467035972,-73.9125840554476,-73.9132497070102,-73.9133829397145,-73.9135182652173,-73.9137952351787,-73.9141607633373,-73.914774366957,-73.9155882282611,-73.9169715243762,-73.9172871941725,-73.9183870599972,-73.9187717919945,-73.9193488243451,-73.9204329802783,-73.9215071460599,-73.9224698366015,-73.9226280853113,-73.9227346100817,-73.9235400201159,-73.9236095515337,-73.9242740136647,-73.9244534627579,-73.924549099801,-73.9246844846605,-73.9255378459996,-73.9258911698099,-73.9260920720706,-73.9261562785059,-73.9262244385218,-73.926377829331,-73.9264974755206,-73.9268051593282,-73.9271498069637,-73.9273019449863,-73.9272779806354,-73.9272247961193,-73.9271551982429,-73.9270196138204,-73.9269354595453,-73.9268793482887,-73.9268816767143,-73.9268591233208,-73.9268512760248,-73.926830232168,-73.9267740054841,-73.9267577703705,-73.9266993346751,-73.9266268744018,-73.9265660882077,-73.9265169973973,-73.9264585532798,-73.9264141327065,-73.9263042593026,-73.9261943925046,-73.9261102412782,-73.9260331017211,-73.925979329569,-73.925939578958,-73.9258647710027,-73.925771270333,-73.9252195552976,-73.9246537993034,-73.9244527324976,-73.9242240509066,-73.9240886581911,-73.9238477894583,-73.9239478950148,-73.9235176930545,-73.9233181034126,-73.9225617894648,-73.9217403540301,-73.9215426180392,-73.9213420768387,-73.9214899115396,-73.9215154370553,-73.9208007028934,-73.9203723545143,-73.9203002721343,-73.9205665595436,-73.9205501498962,-73.9205265313285,-73.9204414141774,-73.9203502478837,-73.9202939290944,-73.9203062060995,-73.9200200214284,-73.9195662094469,-73.9190236912522,-73.9182912339762,-73.9181118754949,-73.9177604125111,-73.9172066464699,-73.9169130864168,-73.9158052800855,-73.91576213211,-73.9154258348416,-73.9151297932084,-73.9150879462137,-73.9150463133379,-73.9149426305384,-73.9148334512588,-73.91467480712,-73.9145570199357,-73.9144436641967,-73.9143380384375,-73.9142430733899,-73.9141610499808,-73.9140360788766,-73.913337624556,-73.913284370514,-73.9117779598062,-73.9108848844297,-73.9107210432267,-73.9105679933912,-73.9104295272843,-73.9103088085114,-73.9102081809441,-73.9098702213687,-73.9096674783098,-73.9077748429088,-73.9072578618828,-73.9070700394927,-73.9067973494215,-73.9061454856976,-73.9058710064277,-73.9057226248422,-73.9048684721552,-73.9039081666944,-73.9036912208848,-73.903518379154,-73.90311010959,-73.9025447939267,-73.9023388722145,-73.9021172035051,-73.9018800734945,-73.9016278508774,-73.9013609036326,-73.9010796701773,-73.9002836810437,-73.8999617763096,-73.8996426168608,-73.8994367084048,-73.8984103840663,-73.8979809937002,-73.8973727479153,-73.8971437980981,-73.8969389968521,-73.8958838746736,-73.894824633207,-73.8937249076193,-73.8935591434144,-73.8928516915538,-73.8920667930097,-73.8919829788118,-73.891771887992,-73.8913802338026],"lat":[40.8617005882631,40.8616629835412,40.8605227289159,40.8598742056531,40.8589865656346,40.8587796970276,40.8567433647587,40.8565318410449,40.8563178444408,40.8562452669938,40.8559788103522,40.8555963443679,40.8555199355532,40.8549077586531,40.8531154254887,40.8523077928105,40.8519132550649,40.8507279946471,40.8504575174702,40.8501037874369,40.849209041181,40.8485185413804,40.8484515271086,40.8483191998351,40.8478837793599,40.8477008533084,40.8468631933053,40.8456418791357,40.8449727021133,40.8446285737885,40.8445814722859,40.8446552958725,40.8447308221529,40.8448003420935,40.8448434358235,40.844882557804,40.8449163140672,40.8449584961924,40.845007441044,40.8450565236104,40.845104173849,40.8451335258673,40.8451411731634,40.8451464812193,40.845148693223,40.8451573020728,40.845170587654,40.8451844585699,40.8451872325366,40.8451859749536,40.8451832278256,40.8451777551909,40.8451654341516,40.8451471538477,40.8451152461266,40.84510408616,40.8450541402324,40.8450344670993,40.8449924261884,40.8449407948031,40.8448735734316,40.8448126875305,40.8448009103269,40.8447968393723,40.8447589436098,40.8447927396644,40.8450867742174,40.8451661821664,40.8452554723792,40.8453160832941,40.8456981313547,40.8458578093881,40.845952003804,40.8459786004336,40.8460108817896,40.8460807940868,40.8461361515057,40.8462767888972,40.846436407628,40.8465068673762,40.846548036106,40.8465896568059,40.8466508296858,40.8468176577978,40.8469241441708,40.8470395065723,40.8471034020474,40.8471929359749,40.8472240910559,40.8472897601886,40.8473255626625,40.8473359016273,40.8473518705504,40.8473926865004,40.8475098231922,40.8475648403455,40.8476482548015,40.8477316704674,40.8478701014414,40.8479606115267,40.8480209498999,40.8480724152987,40.8481629286313,40.8482711928576,40.8483617046885,40.8484220428326,40.8490822472402,40.8497850435131,40.8500920769201,40.8505688770538,40.8507373501745,40.851182608716,40.8512217846166,40.8518358199715,40.8521297879621,40.8531889120299,40.8542212378405,40.8541168833817,40.8543174356577,40.8544902182887,40.8545100638914,40.8553808143945,40.8551729651367,40.8552463713415,40.8555138983137,40.8556181796815,40.8556866684018,40.85574613631,40.8557853638287,40.8558451145173,40.8559271198111,40.8562707210332,40.8568401836882,40.8573965384138,40.8581550149109,40.8583137296336,40.8587080979583,40.8589289232372,40.8592702122092,40.8604697358561,40.8606446367904,40.8603531270345,40.8600919473337,40.8600565175457,40.8600210533902,40.8599352945638,40.8598444814301,40.8597124061622,40.8597401172978,40.8597801591317,40.8598317683772,40.8598934986602,40.8599634055862,40.8599419533294,40.8597186587504,40.8596186013306,40.859089734571,40.8587761829371,40.8587062322342,40.8586205937367,40.858520856374,40.858409326605,40.8582887888709,40.8576697142193,40.8574849481506,40.8596095196221,40.8593534379199,40.8593618492395,40.8593735889313,40.8591427416386,40.8590455367974,40.8589929885651,40.8586932247089,40.8583675858159,40.8587090879507,40.8590030707098,40.8596523965619,40.8605782548338,40.8609549714692,40.8613269480236,40.86169362462,40.8620544345801,40.8624088641597,40.862756383423,40.8624718375907,40.8623502805284,40.8622104364451,40.862116911563,40.8622969666796,40.8624025398698,40.8624323645427,40.8624450651525,40.8624429292485,40.86225834337,40.8620650742478,40.8619441928009,40.8619259672592,40.8618321929932,40.8618609252411,40.8618639900443,40.8618717167501,40.8617005882631]}]],[[{"lng":[-73.875188501627,-73.8761925755019,-73.8769435202508,-73.8777275301841,-73.8798120630492,-73.8799138038693,-73.881338555091,-73.8830938243834,-73.8850526039665,-73.886778651313,-73.8880146938843,-73.8889465404615,-73.8892339790122,-73.8892727372128,-73.8894933663028,-73.8895845351166,-73.8897623001672,-73.8898812476067,-73.8901621947616,-73.890426808212,-73.8906445360121,-73.8906745175993,-73.890821698287,-73.8910628067923,-73.8913802338026,-73.891771887992,-73.8919829788118,-73.8920667930097,-73.8928516915538,-73.8935591434144,-73.8937249076193,-73.894824633207,-73.8958838746736,-73.8969389968521,-73.8971437980981,-73.8973727479153,-73.8979809937002,-73.8984103840663,-73.8994367084048,-73.8996426168608,-73.8999617763096,-73.9002836810437,-73.9010796701773,-73.9013609036326,-73.9016278508774,-73.9018800734945,-73.9021172035051,-73.9023388722145,-73.9025447939267,-73.90311010959,-73.903518379154,-73.9036912208848,-73.9039081666944,-73.9048684721552,-73.9057226248422,-73.9058710064277,-73.9061454856976,-73.9067973494215,-73.9070700394927,-73.9072578618828,-73.9077748429088,-73.9096674783098,-73.9098702213687,-73.9102081809441,-73.9103088085114,-73.9104295272843,-73.9105679933912,-73.9107210432267,-73.9108848844297,-73.9117779598062,-73.913284370514,-73.913337624556,-73.9140360788766,-73.9141610499808,-73.9142430733899,-73.9143380384375,-73.9144436641967,-73.9145570199357,-73.91467480712,-73.9148334512588,-73.9149426305384,-73.9150463133379,-73.9150879462137,-73.9151297932084,-73.9154258348416,-73.91576213211,-73.9148747020193,-73.9148093432548,-73.9147233085528,-73.914818174053,-73.9147710967512,-73.9147432388462,-73.9147002850958,-73.9146716292915,-73.9146343753192,-73.9146114381532,-73.9146114130447,-73.9146211635516,-73.9142908258902,-73.9142291806776,-73.9134146219366,-73.9127627199546,-73.9122727897698,-73.9127439764683,-73.9127605061229,-73.9127976212894,-73.9127521621649,-73.9127160731499,-73.912730540209,-73.9125260451681,-73.9126763402038,-73.9109129241202,-73.9105566861382,-73.9105128707747,-73.9104747099412,-73.9104428274195,-73.9104177443699,-73.9103998708111,-73.9103758989753,-73.9103586162277,-73.9103482710452,-73.9103450121683,-73.9103488864627,-73.9103598382439,-73.9101746817974,-73.909861764938,-73.9096669484779,-73.9094966437852,-73.9092746410747,-73.908937149299,-73.9086494317758,-73.9089323524159,-73.9089785138663,-73.9090154481035,-73.9090598039457,-73.9090893791723,-73.9090997211075,-73.9090996934467,-73.9091396166038,-73.9091751332363,-73.9091913763908,-73.9092105593452,-73.9092460468985,-73.9092652603834,-73.9092711403346,-73.9093554096112,-73.9094396619834,-73.9095113632802,-73.9095438833791,-73.9095793637417,-73.9095897310371,-73.9096000668815,-73.9096370633219,-73.9096533284654,-73.9096740347101,-73.9097095289616,-73.9097169007266,-73.909747975059,-73.9097864426944,-73.9098455962351,-73.9099076995563,-73.9099616830913,-73.9100164095228,-73.9100755691892,-73.9100948215284,-73.9101096150669,-73.9101036745551,-73.9101687622908,-73.9101791340239,-73.9101835541743,-73.9101894636508,-73.9102737816112,-73.9103551400981,-73.910445395199,-73.9105060658538,-73.9105889776575,-73.9106543931584,-73.9105378778175,-73.9102697115493,-73.9097348729607,-73.9096711788847,-73.908555795888,-73.9074648979431,-73.906699847351,-73.9066288707301,-73.9063631655063,-73.9061466892458,-73.9060791797804,-73.9060180936319,-73.9059112640522,-73.9058661677825,-73.9057142536251,-73.9046772827462,-73.9045920324781,-73.9045919493546,-73.9045918900658,-73.9045208830044,-73.9045207051659,-73.9045205754491,-73.9044690861,-73.904469014531,-73.9044689677043,-73.9044401083144,-73.9044400852579,-73.9044400732502,-73.9044342879858,-73.9044886055592,-73.9044200320979,-73.9040359264304,-73.9037497589396,-73.9031866746583,-73.9023580484644,-73.9021518605061,-73.9019415502505,-73.901727429628,-73.9015098166704,-73.901289033668,-73.9010654080736,-73.8999657564839,-73.8996522027412,-73.8996030036064,-73.8995340437299,-73.8994456161145,-73.8993385117239,-73.8992138769479,-73.8990732725348,-73.8989185429827,-73.8977896227048,-73.8973272118081,-73.894072728484,-73.8923132139066,-73.8921287553187,-73.8914069633233,-73.8912360818402,-73.891235915127,-73.8912357369374,-73.8910483410851,-73.8908453941575,-73.8906284409605,-73.8904006648889,-73.8904005817968,-73.8904004984675,-73.8901826993257,-73.8899753755408,-73.88836487605,-73.8881888660738,-73.8880029809553,-73.8878094658917,-73.8876108716749,-73.8874098703155,-73.8872091898904,-73.8870696278377,-73.8871650526528,-73.8871975479414,-73.8872123874329,-73.8872319407604,-73.887181015669,-73.887146976863,-73.8871320661323,-73.8871230358481,-73.8871070335287,-73.8871000449228,-73.8870870578614,-73.8870430407142,-73.8870483340023,-73.8870514260234,-73.8869288973406,-73.886834866747,-73.8866241303956,-73.8851649583431,-73.884526151592,-73.8843792231517,-73.88437905751,-73.8843788790354,-73.8842169644318,-73.8842168342661,-73.8842167148987,-73.8840435344224,-73.8840434159229,-73.8840432857114,-73.8838639140083,-73.8838637475968,-73.8838635811526,-73.8836834756176,-73.8836833685652,-73.8836832738419,-73.8835081045761,-73.8835078795922,-73.8835076415373,-73.8833425867325,-73.8833423486773,-73.8833421350919,-73.8831908876937,-73.8827483336087,-73.8820862367445,-73.8812442254155,-73.8799579875278,-73.8793628325953,-73.8787604168712,-73.8781494463452,-73.8781312919031,-73.8780356242649,-73.8780162797768,-73.878004801122,-73.8780012488109,-73.8779212389721,-73.8778706811214,-73.8778385700107,-73.8778312590419,-73.8776067654627,-73.8777281766151,-73.8781257522779,-73.8771700595189,-73.8762589013992,-73.8753369943113,-73.8747025549028,-73.87479240732,-73.8749458975559,-73.8740675120518,-73.8730733460093,-73.8719166182427,-73.871871006937,-73.8708356784025,-73.8706826459968,-73.8701531859727,-73.8709441474807,-73.8716071869505,-73.8725525090033,-73.8743675076247,-73.875188501627],"lat":[40.8715757563096,40.8704769567011,40.8699546815721,40.8695553386596,40.8684166479714,40.8683612516643,40.8675900882594,40.8666021850244,40.8655027092324,40.8645614040817,40.8638889485961,40.8632095106272,40.8629512262654,40.8629163992087,40.8627022095077,40.8626137006337,40.8624269845667,40.8623020457571,40.8619820723099,40.861654500216,40.8613605616078,40.8613200721788,40.8613993960937,40.8615294121173,40.8617005882631,40.8618717167501,40.8618639900443,40.8618609252411,40.8618321929932,40.8619259672592,40.8619441928009,40.8620650742478,40.86225834337,40.8624429292485,40.8624450651525,40.8624323645427,40.8624025398698,40.8622969666796,40.862116911563,40.8622104364451,40.8623502805284,40.8624718375907,40.862756383423,40.8624088641597,40.8620544345801,40.86169362462,40.8613269480236,40.8609549714692,40.8605782548338,40.8596523965619,40.8590030707098,40.8587090879507,40.8583675858159,40.8586932247089,40.8589929885651,40.8590455367974,40.8591427416386,40.8593735889313,40.8593618492395,40.8593534379199,40.8596095196221,40.8574849481506,40.8576697142193,40.8582887888709,40.858409326605,40.858520856374,40.8586205937367,40.8587062322342,40.8587761829371,40.859089734571,40.8596186013306,40.8597186587504,40.8599419533294,40.8599634055862,40.8598934986602,40.8598317683772,40.8597801591317,40.8597401172978,40.8597124061622,40.8598444814301,40.8599352945638,40.8600210533902,40.8600565175457,40.8600919473337,40.8603531270345,40.8606446367904,40.8616916999863,40.8617141896458,40.8618531823892,40.861899088983,40.8619463081492,40.8619335899814,40.861953112544,40.861981337605,40.8620204198403,40.8620529939979,40.8620725494614,40.8620966907348,40.8624280182207,40.8624885566597,40.8633674937007,40.8630291741576,40.8636321489967,40.863892568173,40.8638769139099,40.8638988754329,40.8639450568429,40.8639262294341,40.863909790277,40.8637952238378,40.8640211116025,40.8659379459877,40.8664219487232,40.866453462298,40.8664889622657,40.8665278683481,40.8665695445899,40.866613309754,40.8666546446895,40.8666978605708,40.8667423361094,40.8667874319061,40.8668324996435,40.8668768914061,40.867191215116,40.8679433156169,40.8684170395901,40.8688311566409,40.8695541323832,40.8710198403089,40.8713857838033,40.8721573479707,40.8722243538378,40.8722895870549,40.8723413287904,40.8723750756201,40.8723941917606,40.8724144256536,40.8724627949805,40.8724808143928,40.8725134259531,40.8725651466441,40.8726045258465,40.8726337614655,40.8726629959801,40.8727709770792,40.8728823345242,40.8729773835985,40.8730178762489,40.8730628660148,40.8730640000587,40.873087618491,40.8731078813788,40.8731247514355,40.8731472527285,40.8731821299476,40.8732046114176,40.8732181248313,40.8732473847979,40.8733137615274,40.8733834988589,40.8734313206819,40.8734819442078,40.8735359559607,40.8735370875009,40.8735539657266,40.8735607059034,40.8736169640159,40.8736147209173,40.8736270887152,40.8736428340945,40.8737080943758,40.8737778553092,40.8738386281182,40.8738802682534,40.8739337486811,40.8739759430611,40.874060742302,40.8742718145447,40.8746381440676,40.8745887681463,40.873775443923,40.8735473542364,40.8733967627434,40.8733803787288,40.873319047922,40.873260204729,40.8732424201914,40.873226989181,40.8731958174268,40.8731826604275,40.8731383221018,40.8726198789964,40.8725645539741,40.8725645001305,40.8725644463066,40.8724953919421,40.8724952112054,40.8724950228023,40.8724156289577,40.8724155206787,40.8724153949978,40.8723304996567,40.8723304188916,40.8723303282517,40.8722453087808,40.8705785485483,40.8703612760012,40.8699491633589,40.8695956271401,40.8691489914912,40.8686961209535,40.8686118311246,40.8685336307776,40.8684616358937,40.8683959529535,40.8683366796482,40.8682839038865,40.8680173015104,40.8685545787816,40.8687282082563,40.8688996138891,40.8690668420795,40.8692280281048,40.8693813867849,40.8695253556017,40.8696585744867,40.8708566433986,40.8714452336453,40.8755877455144,40.8778234340022,40.8780578022822,40.8789694462465,40.8791607193917,40.8791608998241,40.879161079743,40.8793438553659,40.8795170968304,40.8796795643438,40.8798569611762,40.8798570235833,40.8798570960415,40.8800417137645,40.8802331314222,40.8822675418619,40.8823371139957,40.8823945020752,40.8824385821485,40.8824685728229,40.882484072112,40.8824850739581,40.8824768960662,40.8825765113955,40.8827524355289,40.8828201576411,40.8830549784291,40.8830839422346,40.8831179381563,40.8831509449589,40.8832009399455,40.8836739859517,40.8837299443871,40.8837970273205,40.8840402323784,40.8842355206172,40.8843495758467,40.884355714854,40.8843420260654,40.8842673032099,40.8836316116553,40.8833121478351,40.8832477233281,40.8832476517975,40.883247597844,40.8831977280585,40.8831976917431,40.8831976653223,40.8831650019633,40.8831649842544,40.8831649742397,40.8831513949309,40.8831513853821,40.8831513945959,40.8831576154394,40.8831576153315,40.8831576333284,40.8831831475924,40.8831831835502,40.8831832469685,40.883226374464,40.883226437882,40.8832265189146,40.8832848345123,40.8833973868017,40.8831322219112,40.8827096330056,40.8843906289661,40.8852182399748,40.8860401998614,40.8868738073648,40.8869127973194,40.8871183217562,40.8872273922942,40.8873371754051,40.887447196229,40.8874101571805,40.8872540583453,40.8870945211764,40.8867727601815,40.8845230436198,40.8834541950845,40.8821536849745,40.8819939128098,40.8818320397059,40.8816718323973,40.881553823556,40.8800751283878,40.8799476687928,40.8800389062914,40.8801343853582,40.8802381780163,40.8803281204254,40.8804541142792,40.8804587560067,40.880350827058,40.878509695414,40.87692157251,40.875175183326,40.8727010091991,40.8715757563096]}]],[[{"lng":[-73.8966333386324,-73.8966306864356,-73.8966306858501,-73.896606136735,-73.8965958378131,-73.8965646453232,-73.8965465329252,-73.896492293823,-73.8964350345664,-73.8964113354937,-73.8963578603773,-73.896408958026,-73.8966100226111,-73.8968784456836,-73.8969705424814,-73.8970289508559,-73.8970336369263,-73.8970465142028,-73.8970732920871,-73.8971394732915,-73.8971571716543,-73.8970914908083,-73.896994928605,-73.8967074708932,-73.896431707833,-73.8967579007494,-73.897057634523,-73.8972811252072,-73.89731936279,-73.8975635771188,-73.8976960116153,-73.8977666909259,-73.8978788753162,-73.8982721693128,-73.8992249910406,-73.8993642685063,-73.8996206531463,-73.8997112766292,-73.8997825214195,-73.8997258855994,-73.8989257182505,-73.8973833610236,-73.8971564543338,-73.8968817842862,-73.896682430808,-73.8966154655592,-73.8965206906546,-73.8959567495941,-73.8950827065964,-73.8946794895308,-73.8945343134316,-73.8929164370079,-73.8928864458674,-73.8917661791393,-73.8908054398087,-73.889847018932,-73.8888964224737,-73.8884015720717,-73.8877477344924,-73.8875861260884,-73.8870514260234,-73.8870483340023,-73.8870430407142,-73.8870870578614,-73.8871000449228,-73.8871070335287,-73.8871230358481,-73.8871320661323,-73.887146976863,-73.887181015669,-73.8872319407604,-73.8872123874329,-73.8871975479414,-73.8871650526528,-73.8870696278377,-73.8872091898904,-73.8874098703155,-73.8876108716749,-73.8878094658917,-73.8880029809553,-73.8881888660738,-73.88836487605,-73.8899753755408,-73.8901826993257,-73.8904004984675,-73.8904005817968,-73.8904006648889,-73.8906284409605,-73.8908453941575,-73.8910483410851,-73.8912357369374,-73.891235915127,-73.8912360818402,-73.8914069633233,-73.8921287553187,-73.8923132139066,-73.894072728484,-73.8973272118081,-73.8977896227048,-73.8989185429827,-73.8990732725348,-73.8992138769479,-73.8993385117239,-73.8994456161145,-73.8995340437299,-73.8996030036064,-73.8996522027412,-73.8999657564839,-73.9010654080736,-73.901289033668,-73.9015098166704,-73.901727429628,-73.9019415502505,-73.9021518605061,-73.9023580484644,-73.9031866746583,-73.9037497589396,-73.9040359264304,-73.9044200320979,-73.9044886055592,-73.9044342879858,-73.9044400732502,-73.9044400852579,-73.9044401083144,-73.9044689677043,-73.904469014531,-73.9044690861,-73.9045205754491,-73.9045207051659,-73.9045208830044,-73.9045918900658,-73.9045919493546,-73.9045920324781,-73.9046772827462,-73.9057142536251,-73.9058661677825,-73.9059112640522,-73.9060180936319,-73.9060791797804,-73.9061466892458,-73.9063631655063,-73.9066288707301,-73.906699847351,-73.9074648979431,-73.908555795888,-73.9096711788847,-73.9097348729607,-73.9102697115493,-73.9105378778175,-73.9106543931584,-73.910709837435,-73.9108091320259,-73.9108517108015,-73.9109211800964,-73.9109895384145,-73.9110690965926,-73.9111127952843,-73.9111576199347,-73.9111945984318,-73.9112528804012,-73.9112629469812,-73.9112719252435,-73.9112786433575,-73.9113105894959,-73.9114842829561,-73.9115100668897,-73.9115504309977,-73.9115717328337,-73.9115975127293,-73.9115997468718,-73.9116232923755,-73.9116277654107,-73.9116389750718,-73.9116501760637,-73.911668109663,-73.9116714625678,-73.911688269509,-73.9116927550053,-73.911702841569,-73.9117342370148,-73.9117398302469,-73.9117700920411,-73.9117913916722,-73.9118093399044,-73.9118390427903,-73.9118592105802,-73.9118827471072,-73.9118961952483,-73.911915257546,-73.9119208620329,-73.9119298334881,-73.9119331812602,-73.9119444035402,-73.9119466307367,-73.9119544707725,-73.9119578449278,-73.9119657009461,-73.9119690715052,-73.9120307218896,-73.912084528002,-73.912152908261,-73.9121764464277,-73.9122145452613,-73.9122156629384,-73.9122281439391,-73.9122281334074,-73.9122379138493,-73.9122529437666,-73.9122769919046,-73.9122739725681,-73.9122844936072,-73.912295007618,-73.9123062790969,-73.9123115528349,-73.9123235580487,-73.9123333354827,-73.9123423430992,-73.9123370772946,-73.9123430889777,-73.9123491010973,-73.9123558654387,-73.9123498424775,-73.9123588554421,-73.9123648754102,-73.9123686261151,-73.9123776473639,-73.9123874153289,-73.912394925482,-73.9124046948719,-73.9124227175974,-73.9124309910199,-73.9124400024952,-73.9124520326556,-73.9124572929946,-73.9124775729438,-73.9124880924182,-73.9124903381533,-73.9125023632748,-73.9125068790847,-73.9125196549319,-73.9125256583787,-73.9125294113542,-73.9125512008152,-73.9125557024881,-73.9125917681681,-73.9126188086838,-73.9126428501273,-73.9126751704743,-73.9126962151218,-73.9127063448085,-73.9127228787879,-73.9127285970972,-73.9127431605783,-73.9127536637264,-73.9127686945859,-73.9127874725648,-73.9128002349527,-73.9128062408203,-73.9128212686581,-73.9128483068081,-73.9128565621849,-73.9128693352252,-73.9128790970967,-73.9128843630201,-73.9128948780671,-73.9129046399428,-73.9129211720722,-73.9129362006098,-73.9129437171019,-73.9135004274986,-73.9134892905208,-73.9134995514041,-73.9135089556779,-73.9135087770223,-73.9135341536284,-73.9135479740434,-73.9135687293559,-73.9135820990886,-73.9135876288886,-73.9136014690181,-73.9136222238179,-73.9136314547225,-73.9136448285832,-73.9136526767002,-73.913770655632,-73.9138635875494,-73.9138736803818,-73.9138823183431,-73.9140746732544,-73.9140684200341,-73.9153510599451,-73.9153826800639,-73.9154020517774,-73.9154254876197,-73.9154550495345,-73.9154685586008,-73.915486834987,-73.9155098987458,-73.9155290489645,-73.9155516736433,-73.915575609696,-73.91558474485,-73.91561693873,-73.9156717761469,-73.915707896733,-73.9157200644948,-73.9157422598576,-73.9157851563811,-73.9172602833729,-73.9173333891099,-73.9174010088785,-73.9174736485844,-73.9176890713815,-73.9177566939592,-73.9177892257286,-73.9178392254031,-73.9179192960557,-73.9179918722719,-73.9180845226524,-73.9182497423248,-73.9182597237627,-73.9182797400364,-73.918297275359,-73.9183298383373,-73.9190832635702,-73.91978381299,-73.9197755685445,-73.9198770358193,-73.9199213717929,-73.9199433211953,-73.9199689387989,-73.920028976625,-73.9200689960867,-73.9200564594506,-73.9200539303846,-73.9200714360169,-73.9200802849705,-73.9201114964353,-73.9201540082621,-73.9202563896501,-73.9215771042401,-73.9216063031327,-73.9216328627697,-73.9216451544793,-73.9216920371562,-73.9218221184354,-73.9220672365189,-73.9221344406294,-73.9222297956518,-73.9224079929588,-73.9224079751686,-73.9224346447601,-73.9224882995936,-73.9224899286036,-73.9225352310685,-73.9225852978175,-73.9226787992985,-73.9227378828753,-73.9227979445115,-73.9228730387105,-73.9229506536742,-73.9230408222371,-73.9230931984872,-73.9231234579005,-73.9231635067145,-73.923186039062,-73.9232436350995,-73.9232591722343,-73.9232686916151,-73.9233037539606,-73.9235917255313,-73.9236115025191,-73.923597420866,-73.9236171919142,-73.923624231508,-73.9236369528922,-73.9236791931168,-73.923666479932,-73.9236777389066,-73.9236621938806,-73.9236523348695,-73.9236297395041,-73.9237493550127,-73.923794413682,-73.9238269787748,-73.9239020994249,-73.923942152533,-73.923969678122,-73.923987187551,-73.9240372562042,-73.9240572889594,-73.9240648163391,-73.924179996217,-73.9243126860352,-73.9244904284535,-73.9245179585104,-73.9245354939648,-73.9245380322458,-73.9245806174672,-73.924615654515,-73.9246557202094,-73.9246808194912,-73.9247234218514,-73.9247785346066,-73.9249032747308,-73.923805256055,-73.9218295504334,-73.9213884275242,-73.9210641308731,-73.9205864187729,-73.9203928019909,-73.9197851074929,-73.9191594383817,-73.9188801439161,-73.9185368887621,-73.9181640545842,-73.9180026358522,-73.9178178379003,-73.9178124080557,-73.91786009435,-73.9178996312466,-73.9176348820749,-73.916941610784,-73.9168513803353,-73.9167084917179,-73.9167207100809,-73.9167273215971,-73.9167281398859,-73.9167231418735,-73.9166734321281,-73.9151845587168,-73.9152339741942,-73.9154317295843,-73.9150144958604,-73.9145903924332,-73.9142908008759,-73.9141854352988,-73.9138855399871,-73.9128685787661,-73.9128761283325,-73.9128887597666,-73.9129061978809,-73.9129280627666,-73.9129538780704,-73.9130008154489,-73.9130425669675,-73.9130782762246,-73.9131072107524,-73.9131135010061,-73.9131169990287,-73.9131176168649,-73.913115338978,-73.9131102226412,-73.9131023964972,-73.9130920573239,-73.9130794650871,-73.9129971404434,-73.9129104699953,-73.9128202172689,-73.9127271773519,-73.9126493217288,-73.9123405116745,-73.9123591844843,-73.9123221765587,-73.9122810701675,-73.9122686885144,-73.9122758401166,-73.911819523938,-73.9117749582111,-73.9115789574935,-73.911504753949,-73.9114919070374,-73.9115361890545,-73.9114488247338,-73.9114321302785,-73.9114733209973,-73.9115004578357,-73.9115502902824,-73.9116547240221,-73.9114995907482,-73.9114377620283,-73.9113805213058,-73.911328284461,-73.9112814310221,-73.9112403014074,-73.9112051944518,-73.9112019286101,-73.9112020915845,-73.9112056793843,-73.9112126041006,-73.9112226960605,-73.911235707984,-73.9112010369632,-73.9111583414952,-73.9111079047459,-73.9110500612307,-73.9109851945965,-73.9109137350774,-73.910864461345,-73.9108181472412,-73.910778009319,-73.9107423865345,-73.9107120447705,-73.9106633587891,-73.9103325684898,-73.9101127662511,-73.9085115501761,-73.9024566400494,-73.9006038605853,-73.8999535138472,-73.8981048968874,-73.8972532635489,-73.8966333386324],"lat":[40.9114173753489,40.9112989271071,40.9112988776876,40.9102022486224,40.9096276596512,40.9082858241623,40.9075066550445,40.9063396529452,40.9050929990697,40.9045045208209,40.9032001315844,40.9029611087199,40.9022035130852,40.9010405801358,40.9006111675785,40.900315204249,40.9002786212819,40.9002247030685,40.9000838913376,40.8996194349772,40.8993718266773,40.8985933177028,40.8978787238792,40.8958050299172,40.8936552799275,40.8926454435717,40.8921404575288,40.891710684183,40.8916158607094,40.8910102454727,40.890681823998,40.8905093897077,40.8902761012422,40.8894579429989,40.887530803064,40.8872490897004,40.8867794872161,40.8866387310399,40.886529123508,40.8865148870103,40.8863835018048,40.8860867717957,40.8860448242452,40.8859993472759,40.8859645908544,40.885955255508,40.8859369891962,40.8858283245211,40.8856415115047,40.8855199415863,40.8855940638741,40.8853114345968,40.8852643063068,40.885049846262,40.8848678434673,40.8846857465929,40.8845039191596,40.8844170751705,40.8842876181292,40.884255619663,40.8843495758467,40.8842355206172,40.8840402323784,40.8837970273205,40.8837299443871,40.8836739859517,40.8832009399455,40.8831509449589,40.8831179381563,40.8830839422346,40.8830549784291,40.8828201576411,40.8827524355289,40.8825765113955,40.8824768960662,40.8824850739581,40.882484072112,40.8824685728229,40.8824385821485,40.8823945020752,40.8823371139957,40.8822675418619,40.8802331314222,40.8800417137645,40.8798570960415,40.8798570235833,40.8798569611762,40.8796795643438,40.8795170968304,40.8793438553659,40.879161079743,40.8791608998241,40.8791607193917,40.8789694462465,40.8780578022822,40.8778234340022,40.8755877455144,40.8714452336453,40.8708566433986,40.8696585744867,40.8695253556017,40.8693813867849,40.8692280281048,40.8690668420795,40.8688996138891,40.8687282082563,40.8685545787816,40.8680173015104,40.8682839038865,40.8683366796482,40.8683959529535,40.8684616358937,40.8685336307776,40.8686118311246,40.8686961209535,40.8691489914912,40.8695956271401,40.8699491633589,40.8703612760012,40.8705785485483,40.8722453087808,40.8723303282517,40.8723304188916,40.8723304996567,40.8724153949978,40.8724155206787,40.8724156289577,40.8724950228023,40.8724952112054,40.8724953919421,40.8725644463066,40.8725645001305,40.8725645539741,40.8726198789964,40.8731383221018,40.8731826604275,40.8731958174268,40.873226989181,40.8732424201914,40.873260204729,40.873319047922,40.8733803787288,40.8733967627434,40.8735473542364,40.873775443923,40.8745887681463,40.8746381440676,40.8742718145447,40.874060742302,40.8739759430611,40.8740150269989,40.8740850221116,40.8741097374883,40.8741463960401,40.8741796404157,40.8742214122519,40.874242725001,40.8742657397945,40.8742819410761,40.87431007178,40.8743237041509,40.874316047891,40.8743313694988,40.8743448156469,40.8744179211002,40.874423045964,40.8744281831705,40.8744316127724,40.8744392858029,40.8744452489807,40.874447815204,40.8744563376665,40.8744571920727,40.8744733741374,40.8744759447662,40.8744878615542,40.8744904313174,40.874489579546,40.874496395223,40.8745015248325,40.8745057883776,40.8745160228703,40.8745211442426,40.8745220143366,40.874532671044,40.8745412059888,40.8745505789385,40.8745539937721,40.8745557194015,40.8745608287689,40.8745582787154,40.8745659444332,40.8745659529967,40.8745770212521,40.8745787289304,40.8745744729076,40.8745727772042,40.8745625684232,40.874583038139,40.8745958473945,40.8746137751549,40.8746214562331,40.8746350999659,40.874641908775,40.8746505629472,40.8746585412123,40.8746545589277,40.8746551385941,40.8746540215747,40.874667706562,40.8746682915078,40.8746757107073,40.8746745747573,40.8746694467038,40.8746785863202,40.8746768833404,40.8746837331538,40.8746917168083,40.8746940082284,40.8746865933778,40.8746940179323,40.8747002817259,40.8747025754246,40.8746985820648,40.87470600433,40.8747020127459,40.8747071626092,40.8747071683106,40.8747117407225,40.8747185985448,40.8747151833375,40.8747186116607,40.8747180438393,40.8747237573416,40.8747283388927,40.8747306243426,40.874736902622,40.8747403338956,40.8747340607429,40.8747352137713,40.8747437735435,40.8747494853974,40.8747517800533,40.8747569247389,40.8747643632697,40.8747797908186,40.8747837987426,40.874788955767,40.8747895481354,40.8748001090639,40.8748024002144,40.8748024045389,40.8748024155514,40.8748149727921,40.8748109961071,40.8748167094249,40.8748252803211,40.8748298399712,40.8748298513247,40.8748395676309,40.8748475586712,40.874847001251,40.8748549940972,40.8748458692532,40.8748498744516,40.874857866793,40.8748578792687,40.8748561812052,40.8748493355287,40.8750178501974,40.8750360165633,40.8750340717768,40.8750347276411,40.8750443129933,40.8750471333254,40.8750531029674,40.8750520656332,40.8750587276403,40.875065735741,40.8750646927202,40.8750654113498,40.8750619160274,40.875064726179,40.8750580795542,40.8750960324396,40.8751240097955,40.8751240168257,40.8751294885351,40.8751827016239,40.8752082358149,40.8755945293474,40.875593003956,40.8755992036011,40.875607736463,40.875620920052,40.8756319311675,40.8756365705266,40.8756431960197,40.8756455238628,40.8756538008005,40.8756581137646,40.8756627457504,40.8756776389499,40.8756852797087,40.8756929055994,40.8757094359155,40.8757130860263,40.8757169450649,40.8758090035806,40.8758020592156,40.8757869042733,40.8757622501532,40.8756806840578,40.8756636278607,40.8756769551945,40.8757378049118,40.8757777713369,40.8758044288965,40.8757949931426,40.8758179160084,40.8758445295441,40.8758559463231,40.875848356389,40.875836976332,40.8760648818263,40.876421436609,40.8764975543778,40.876508887421,40.8765450618915,40.8765468304126,40.8765488958108,40.8765926471237,40.8766268836582,40.8766569205095,40.8766629812373,40.8766800977675,40.8766801038958,40.8766801255057,40.8767238657915,40.8769519902771,40.8781365426219,40.8781571020792,40.8781847936899,40.8781985430829,40.8782509837006,40.8783517965694,40.878572414803,40.8786098637857,40.8786454964916,40.8786830902472,40.8786983342941,40.8786984631215,40.8787066447912,40.878744755446,40.8787665758689,40.8787761116834,40.8788668138341,40.8789054454279,40.8789320915677,40.8789511460479,40.8789549993146,40.8789303539074,40.8789055554322,40.8789228073068,40.8789342365734,40.8789361519494,40.8789304889712,40.8789210712965,40.8789153011101,40.8789077227411,40.8789521593327,40.878900860406,40.8788987129931,40.878852758536,40.8788549012864,40.8788153559321,40.8788260744987,40.8788634965134,40.8788656261365,40.8789115833993,40.8789115768776,40.8789639432433,40.8789840360969,40.8789935690825,40.8789802871051,40.8789765357404,40.8789841633156,40.8789993859748,40.8790146008582,40.879022235499,40.8790203483059,40.8790070502859,40.8790052256351,40.8790186150336,40.8790472389572,40.8790586595619,40.8790510693546,40.8790206636449,40.879003587085,40.8790188133257,40.879015039238,40.8789618432268,40.8789295632754,40.8789048931378,40.8788883678532,40.8803249016361,40.8845116013394,40.8854590518583,40.886155561205,40.8871826781173,40.8876485002269,40.8892864443076,40.8908943534716,40.8916057219529,40.8925456829155,40.89356661453,40.8940086163483,40.894416425568,40.8945352796889,40.8946006142797,40.8946690095369,40.8949419053522,40.8966445517024,40.8969307828571,40.8973840552705,40.8974087036203,40.8974345556726,40.897460882676,40.89748694249,40.8975270526165,40.9015842828622,40.9016967972457,40.9018126836884,40.9030812991065,40.9041190021964,40.9040932074626,40.9041403909687,40.9049577649854,40.9075354758935,40.9075620920407,40.9075875751423,40.9076113700141,40.9076329582514,40.9076518695241,40.9076768547826,40.9077066707704,40.9077407059113,40.9077782620861,40.9077912842431,40.9078048970307,40.9078187581718,40.9078325191443,40.9078458339448,40.9078583677879,40.9078698055244,40.9078798595653,40.9079179598965,40.907950036674,40.9079758073147,40.9079950447891,40.9080708119554,40.9090581947693,40.9091367335769,40.9091888449396,40.9091933610948,40.9092301485024,40.9092635165555,40.9111483348636,40.9112521873627,40.9121359593199,40.9121698793769,40.9122337693121,40.9123020622746,40.9127546825887,40.9128238262197,40.9129109035368,40.912968269326,40.9130698126947,40.9134178518967,40.9137665817048,40.9138054512633,40.9138481739078,40.9138944392452,40.9139439111429,40.9139962301711,40.9140510162135,40.9140674897336,40.9140841480481,40.9141005829813,40.9141163918308,40.9141311872345,40.9141446066626,40.9142204847831,40.9142939709988,40.914364577888,40.9144318371259,40.9144953025903,40.9145545533219,40.9145662025195,40.9145834798618,40.914604664217,40.9146300734131,40.9146591611613,40.9147964203062,40.9155327765027,40.9153987341446,40.9150022640264,40.912958933426,40.9126072658993,40.9123834347655,40.9117906000102,40.9116555204412,40.9114173753489]}]],[[{"lng":[-73.7469397001251,-73.746943206382,-73.7470491317052,-73.7470431634196,-73.7469397001251],"lat":[40.6375542352153,40.637529202177,40.6375451343996,40.6375664269618,40.6375542352153]}],[{"lng":[-73.7998195446255,-73.7978588167746,-73.7976123758087,-73.7970129189816,-73.7964149265147,-73.795890798775,-73.7958191481579,-73.7952263042856,-73.7939431779478,-73.7925643312553,-73.7919946470631,-73.7911891908512,-73.7905783251857,-73.7900598003176,-73.7899673676853,-73.7899075998327,-73.7898434719976,-73.7881167984523,-73.7875117799428,-73.7861847037956,-73.7850251380631,-73.7841565762977,-73.7839398185867,-73.7829039833809,-73.7793694751359,-73.7793105067034,-73.7792262575534,-73.7790991216144,-73.7789689472066,-73.7788359205605,-73.7787002319852,-73.7785620757681,-73.7784216493244,-73.7782791535562,-73.7781347923249,-73.7776299353881,-73.7774306750304,-73.7772337035326,-73.7770393092753,-73.7768477768636,-73.7766593867108,-73.776474414498,-73.7762931311092,-73.7761158019386,-73.7759426865885,-73.7757740384892,-73.7752530803675,-73.7746032624106,-73.7745447294383,-73.7744768829416,-73.7721062607331,-73.770286208232,-73.769743641745,-73.7690490402092,-73.7689911301614,-73.7689965406991,-73.768951778703,-73.7683274016358,-73.7681199793464,-73.7677065346624,-73.7673909708656,-73.7672056655397,-73.7668759760595,-73.7666959390493,-73.7662800826662,-73.7656689709815,-73.7647545539745,-73.7641777017885,-73.7640629014157,-73.7635989728986,-73.76277911964,-73.7579393745807,-73.7574546223855,-73.7546575813913,-73.7541108667463,-73.7528415105018,-73.7515738419136,-73.7484077951259,-73.748236168919,-73.7480697628182,-73.7479087752626,-73.7477533982256,-73.7476038169861,-73.7474602099074,-73.7471166625671,-73.7443211473035,-73.7439906316605,-73.7440259471514,-73.7445149239263,-73.7446210730149,-73.7467945086395,-73.7468202546636,-73.746841879311,-73.7468587512377,-73.746870377856,-73.7468764197157,-73.7468767004156,-73.7468712117537,-73.7468601139682,-73.7468437310593,-73.7468166874558,-73.7467855231968,-73.7467503371194,-73.7467254706872,-73.7466981118376,-73.7466686901401,-73.7466370818393,-73.7466160618808,-73.7466009130314,-73.7465920033127,-73.746589549179,-73.7465193841519,-73.74651936401,-73.7465121227545,-73.746497720916,-73.7464762789014,-73.7464479759878,-73.7464304189264,-73.7464160831199,-73.7464053815455,-73.7463986224892,-73.7463960006642,-73.7463975916018,-73.7464033494748,-73.7464059380326,-73.7464061576904,-73.7464040028586,-73.7463995283581,-73.7463928480256,-73.7463841318176,-73.7463736014865,-73.7463615249389,-73.7463508691434,-73.7463417172401,-73.7463343164017,-73.7463288665087,-73.7463255147513,-73.7463243516539,-73.74632540863,-73.7463286571343,-73.7463340094326,-73.7463413209721,-73.7463503942848,-73.7463609843208,-73.7463686244357,-73.7463724514111,-73.7463723664107,-73.7463683716262,-73.7463570365027,-73.7463542236007,-73.7463600143337,-73.7463632374785,-73.7463591289658,-73.7463477012961,-73.7463289892989,-73.7463030500265,-73.7462699625807,-73.7462298278716,-73.7461827683104,-73.7461773987399,-73.7461735352625,-73.7461712790151,-73.7461706890611,-73.7461717808448,-73.7461745257865,-73.7461788520308,-73.7461846463278,-73.7462274124437,-73.7462637918083,-73.7462928618748,-73.7463138854475,-73.7463099050335,-73.746307063574,-73.7463054369777,-73.7463050686987,-73.7463059685757,-73.7463081125694,-73.7463114434039,-73.7463158720977,-73.7463212803401,-73.7463366399571,-73.7463479350888,-73.7463549425576,-73.746357523903,-73.746359088334,-73.7463542590451,-73.7463418995853,-73.746322336371,-73.7462960860805,-73.7462841108028,-73.7462775997289,-73.7462767123012,-73.7462814702566,-73.7462917570947,-73.7463073209289,-73.7463277806545,-73.7463465353728,-73.7463590039717,-73.7463650670882,-73.7463646666717,-73.7463578065403,-73.7463515507916,-73.7463460611203,-73.7463414710065,-73.7463378920581,-73.7463354112966,-73.7463340890415,-73.7463349654594,-73.7463355117049,-73.7463357143267,-73.7463355683355,-73.7463350773262,-73.7463342533896,-73.7463331168149,-73.74633169559,-73.7463300247118,-73.7463281453253,-73.7463199886637,-73.7463154673816,-73.7463146786814,-73.746326395996,-73.7463389707448,-73.7463543736777,-73.746348795562,-73.7463743094946,-73.746431726315,-73.7465080663718,-73.7465432005981,-73.746576548184,-73.7466407000411,-73.7466758862747,-73.7467048941184,-73.7467203748709,-73.7467411640674,-73.7467534323909,-73.7467714817989,-73.7467947694639,-73.7468225950163,-73.7468541216082,-73.7468627942167,-73.7468705398447,-73.7468771551783,-73.7468824665722,-73.7468863346082,-73.7468886577542,-73.7468893750297,-73.7468884676065,-73.7468859348754,-73.7468818452874,-73.7468803255348,-73.7468846512377,-73.7468947374244,-73.7469049971575,-73.7469188472653,-73.7469359048609,-73.7469556983849,-73.7469776806417,-73.7469863653093,-73.7469947700692,-73.7470093002939,-73.747022182048,-73.747028793318,-73.7471879037269,-73.747190891057,-73.7472029394658,-73.7472239091935,-73.7472535569736,-73.7472915388541,-73.747337414187,-73.7473906507404,-73.7473963211011,-73.7474029040966,-73.7474102996091,-73.747414533152,-73.7474327798078,-73.7474502610082,-73.7474665276712,-73.7474811619149,-73.7474937877932,-73.7475040809532,-73.7475117769679,-73.7475166781292,-73.747518658527,-73.7475169513628,-73.7475169978346,-73.7475187967948,-73.7475223037913,-73.7475274321662,-73.7475340551966,-73.7475420092265,-73.7475489643806,-73.7475558432272,-73.7475624663887,-73.747568661155,-73.7475742659869,-73.7475791347288,-73.74758314042,-73.7475861786049,-73.7475881700575,-73.747589062847,-73.7475888336921,-73.7475874885682,-73.7476099448478,-73.7476392052209,-73.7476747478197,-73.7477159387255,-73.7477620432752,-73.7477687069576,-73.7477752429555,-73.7477814624691,-73.7477928895427,-73.747811856344,-73.7478285559511,-73.7478478428813,-73.7478619116874,-73.747870468285,-73.7478763547544,-73.7478869867864,-73.7479020630196,-73.7479211561207,-73.7479437248963,-73.7479691296338,-73.7479966502334,-73.7480148911809,-73.7480322808836,-73.7480482910553,-73.7480624353183,-73.7480738789326,-73.7480828765101,-73.7480891751035,-73.7480891651305,-73.7480939884751,-73.748103520305,-73.7481175139229,-73.7481356071508,-73.7481573317042,-73.7481821253114,-73.7482093462664,-73.748224505874,-73.7482384604497,-73.7482506896511,-73.7482612893203,-73.7482700665636,-73.7482768616513,-73.7482989454319,-73.748322529403,-73.7483484918886,-73.7484005977077,-73.748427570198,-73.7484508203321,-73.7484663308242,-73.7485294905456,-73.748554500353,-73.748751212618,-73.7487682838873,-73.7487655756941,-73.7487689866782,-73.7486905273169,-73.7486925485396,-73.7487810333243,-73.7488045466766,-73.7488695509985,-73.7488504791448,-73.7488971817951,-73.7489280638853,-73.7489586614961,-73.7489651597192,-73.7489777074688,-73.7489902584803,-73.7490024872893,-73.7490140767864,-73.7490374083218,-73.7490591596099,-73.7490788396554,-73.7490960042182,-73.7491102658414,-73.7491213025973,-73.749128865354,-73.7491721951647,-73.7492170233818,-73.7492869335577,-73.7493101825797,-73.7493356768327,-73.7493627341802,-73.7493906306635,-73.749418619872,-73.7494304290493,-73.7494419077666,-73.7494527427241,-73.7494626381924,-73.7494713240845,-73.7494785633274,-73.7494841583328,-73.7494878424929,-73.7494896754714,-73.7495072729692,-73.7495332921571,-73.7495670259359,-73.7496075575463,-73.7496537854822,-73.7497044534263,-73.7497207745277,-73.7497366298382,-73.7497516806455,-73.7497624530595,-73.7497724308755,-73.7497846030697,-73.749794758508,-73.7498026580152,-73.7499173743372,-73.7500684004765,-73.750115482505,-73.7502357487875,-73.7503971733813,-73.7504838151869,-73.7505279484331,-73.7505410461622,-73.7506290520016,-73.7506746049375,-73.7510750902749,-73.7511514461719,-73.7512525162195,-73.7513375785353,-73.7513595267368,-73.7513962772243,-73.7514182360126,-73.7514566807305,-73.7514857592408,-73.7515473361358,-73.7516090128214,-73.7516663139873,-73.7516763805654,-73.7517130246692,-73.7518657022745,-73.751967171878,-73.7520490267428,-73.7522092510301,-73.752526268146,-73.7527788793198,-73.7530341473332,-73.7530811747602,-73.7532709049278,-73.7534036535613,-73.7532111244768,-73.7532332826944,-73.7535419183588,-73.7535256581673,-73.7534223877159,-73.753292106749,-73.7533507681671,-73.7534063211718,-73.7534575837746,-73.7535034652691,-73.7535429894376,-73.753558734195,-73.7535765986108,-73.7535961771532,-73.7536170253786,-73.7536386700202,-73.753660619732,-73.7537198634956,-73.7537784633168,-73.7538353901608,-73.7538896443693,-73.7540619043758,-73.7542780985677,-73.7543914256183,-73.7545036960146,-73.7547559255195,-73.7548797158681,-73.7549276864291,-73.7546120843802,-73.7537928936934,-73.7536600374919,-73.7537670680897,-73.7537377082635,-73.7534018950716,-73.753436116095,-73.7536113410445,-73.7537614636137,-73.7505703281196,-73.7504850303251,-73.7503266117977,-73.7501442858551,-73.7490763129122,-73.7490018091226,-73.7489203284942,-73.7488323264253,-73.7487382947573,-73.7487070149653,-73.7486271361612,-73.7485408225266,-73.7484481674958,-73.7483492713627,-73.7482442411719,-73.748133190603,-73.7480162398473,-73.7477652491534,-73.7477037726398,-73.7476372136735,-73.747565628755,-73.7475610724981,-73.7475608971261,-73.7475492184357,-73.7475290928517,-73.7475007636394,-73.7474645732129,-73.7474209589963,-73.7474068387727,-73.7473988709937,-73.747397247222,-73.7474020064895,-73.7474130343593,-73.7474300656783,-73.7474526909529,-73.747480366195,-73.7474924164986,-73.7475038490069,-73.7475143504607,-73.7475236331129,-73.7475314426121,-73.7475375649732,-73.7475418324396,-73.7475441280805,-73.7475443889946,-73.7475426080335,-73.7475388339976,-73.7475331702987,-73.7475257721266,-73.7475168421963,-73.747506625194,-73.747485438281,-73.7474764826619,-73.7474618281017,-73.7474418328071,-73.7474344399648,-73.7474359998179,-73.7474465061909,-73.747465917741,-73.7474941581208,-73.7474844221609,-73.7474836814846,-73.74749194592,-73.7475091055172,-73.747534932013,-73.7475445368563,-73.7475500033529,-73.7475511903354,-73.7475480671544,-73.7475336922499,-73.7475272049596,-73.7475287788661,-73.7475383718393,-73.747555727165,-73.7475803804158,-73.7476202432832,-73.7476314390395,-73.7476181103501,-73.7476305730106,-73.7476644928835,-73.7476758240128,-73.7476804003228,-73.7477147538997,-73.7477422993089,-73.7477260607187,-73.7477260974419,-73.7477750015817,-73.7477795287408,-73.7477851843689,-73.747812251914,-73.7478212875051,-73.7478269577178,-73.7478281120076,-73.7478292624092,-73.7478281572006,-73.747827054556,-73.7478170347376,-73.7478159320942,-73.7478159385526,-73.7478159482368,-73.7478194975975,-73.7478299563936,-73.7478357040553,-73.7478470717831,-73.7478606716346,-73.7478957798795,-73.7479105339389,-73.7479298819564,-73.747942467055,-73.7479459592512,-73.7479451491761,-73.7479474716309,-73.7479509096296,-73.7479702100006,-73.7479951320462,-73.7480267970751,-73.7480290855586,-73.7480313757249,-73.7480315660139,-73.7480338865221,-73.7480384387038,-73.7480452397762,-73.7480803151142,-73.748092790749,-73.7480996601587,-73.748110064438,-73.7481169267196,-73.7481248858479,-73.7481271476248,-73.748143918011,-73.7481634202261,-73.7481819589211,-73.748211987735,-73.7482674701861,-73.748363469708,-73.7483981553617,-73.7484017373782,-73.7484132261591,-73.7484342180448,-73.7484576989299,-73.7484337636631,-73.7484304741552,-73.7484507265556,-73.7484964125477,-73.7485283727713,-73.7485547839491,-73.7485703750445,-73.7486475250617,-73.7486891364901,-73.748716476956,-73.7487314070713,-73.7487572942326,-73.7487963510959,-73.7489547449872,-73.7490352869346,-73.7491041885201,-73.7491829151816,-73.7492475572515,-73.7492908326172,-73.7493210684411,-73.7493544696593,-73.7494338655436,-73.7495115586185,-73.7496509467005,-73.7497643350072,-73.749868924722,-73.7499145880297,-73.7499367586389,-73.7499623415303,-73.7500653387867,-73.7501348060012,-73.7502690195163,-73.7504070966823,-73.7504843077406,-73.7505908328842,-73.7506960697414,-73.7507521403835,-73.7507721591851,-73.7507839461392,-73.7507924231261,-73.7508295962761,-73.7509636142045,-73.7510955479154,-73.7511504990934,-73.7512269167548,-73.7512908902215,-73.7513042346946,-73.7513472916091,-73.7514068715285,-73.7514934532144,-73.7515164891498,-73.7515322788031,-73.751549411876,-73.7515737562212,-73.7516371729507,-73.7518387235027,-73.7519150936973,-73.7520238550432,-73.7520785388719,-73.7521262186873,-73.7521685044792,-73.7521930035398,-73.752265336406,-73.7523359524697,-73.7523911035077,-73.7524375857295,-73.75249535224,-73.7525857831663,-73.7526402361898,-73.752740186765,-73.752943916069,-73.753053342552,-73.7531912057823,-73.7534019160191,-73.7534839772474,-73.7534999986063,-73.7535068958511,-73.753520501558,-73.7535268983105,-73.7535515731251,-73.753600295491,-73.7536789975171,-73.7537468078235,-73.7537661555233,-73.7537661032922,-73.753752130085,-73.7537574005203,-73.753786940558,-73.7538696914059,-73.7539491653516,-73.7540988170183,-73.7541071681367,-73.7541434201449,-73.7541742552585,-73.7542168444695,-73.7542710578018,-73.7542996112479,-73.7543365784819,-73.754350683643,-73.7543807018513,-73.7544131432106,-73.7544465774878,-73.7545032509407,-73.7545471738545,-73.7545763416686,-73.7545973227583,-73.7546061886553,-73.7546226607265,-73.7546412137972,-73.7546700606754,-73.7547242769989,-73.7547635567585,-73.7547910030492,-73.7548310304517,-73.7549029038447,-73.7549282037131,-73.7549741627584,-73.7549883678877,-73.7549994419332,-73.7550463474472,-73.755074977083,-73.7551063239735,-73.7551262783802,-73.7551421055717,-73.755166245897,-73.7551797262162,-73.7552025320754,-73.7552151800178,-73.7552319510911,-73.7552606355734,-73.7552825618366,-73.7552940794746,-73.7553103290995,-73.7553276077021,-73.7553389562148,-73.7553570534012,-73.7553850898911,-73.7554191403418,-73.7554611033922,-73.7555001374921,-73.755524464149,-73.7555545348726,-73.7555974801771,-73.7556139574111,-73.7556145836109,-73.7556168386635,-73.7556408545354,-73.7556609380233,-73.7556802184708,-73.7556975819166,-73.7557508704521,-73.755771979584,-73.7557830737974,-73.7557955968219,-73.7558191583279,-73.7558476146552,-73.7558590453166,-73.7558749426843,-73.7558959003854,-73.755925470456,-73.7559766009522,-73.7560027549445,-73.7560363447615,-73.7560597089083,-73.7560761288464,-73.7561050656807,-73.7561310958627,-73.756157874089,-73.7561746462377,-73.7562044900603,-73.7562253852841,-73.7562615464047,-73.7562880572202,-73.7563154476996,-73.7563308377861,-73.7563396695295,-73.7563461648814,-73.7563568605385,-73.7563704906134,-73.7563869328948,-73.7563937982453,-73.756399956022,-73.7564276628577,-73.7564484542498,-73.7564890355773,-73.7565536935129,-73.7566070666747,-73.7566445532383,-73.7566658355418,-73.7567041387217,-73.7567400497028,-73.7567922456001,-73.7568608025258,-73.7569501998047,-73.7569751566555,-73.7570007671327,-73.7570134963153,-73.7570378272589,-73.7570701816574,-73.7571188239378,-73.7571319306528,-73.7571411018584,-73.7571482629718,-73.7571589225281,-73.7571671507602,-73.7571727587296,-73.7571799633676,-73.7571927963411,-73.7572177179535,-73.7572520568775,-73.7573015381185,-73.7573459708204,-73.7573881005599,-73.7574242815303,-73.7574541816833,-73.757473277096,-73.7574838884784,-73.7574985822106,-73.7575297757395,-73.7575489943577,-73.7575730563799,-73.7576396789272,-73.7576620656359,-73.7576813462048,-73.7577069149015,-73.757735575542,-73.7577670499684,-73.7578144139575,-73.7578626842789,-73.7579037656372,-73.7579601153014,-73.7579990636154,-73.7580435357901,-73.7580889971835,-73.7581413229889,-73.7581859026266,-73.7582205583179,-73.7582670633135,-73.7583167969557,-73.7583743121067,-73.7584084189022,-73.7584351346835,-73.7584600495784,-73.7584855491345,-73.758516389643,-73.7585468931052,-73.7585679580541,-73.7586231101156,-73.7586843854913,-73.7587421556487,-73.7587808949334,-73.7588504369171,-73.7589729523689,-73.7590095540089,-73.7590418363184,-73.7590722984281,-73.7591010486608,-73.7591298748086,-73.7591592156777,-73.7591872321849,-73.7592237494763,-73.7592580465134,-73.7592898084371,-73.7593110387931,-73.7593230606495,-73.7593328523894,-73.7593490542556,-73.7593765651813,-73.7594068966934,-73.7594288145083,-73.7594520781205,-73.7594834003843,-73.7595321243526,-73.7595599534611,-73.759590478162,-73.7596189529997,-73.7596854707686,-73.7598033724689,-73.7598330649307,-73.7598683441776,-73.7598885173472,-73.7599049945028,-73.7599308570891,-73.7599472289746,-73.7599791832095,-73.7600120155399,-73.7600611930981,-73.7600906163702,-73.7601097130434,-73.7601231462507,-73.7601627856587,-73.7601927673573,-73.7602143962899,-73.7602543528186,-73.7602758974538,-73.7603175638522,-73.7603446395484,-73.7603744986221,-73.7604175948423,-73.7604428864773,-73.7604605472643,-73.7605061533219,-73.7605315984148,-73.7605700679954,-73.7606141373531,-73.7606800980296,-73.7606997266704,-73.7607199949353,-73.7607540534838,-73.7607671627936,-73.7607784108976,-73.7607890290534,-73.7607994939949,-73.7608234266874,-73.7608540408321,-73.7608854475618,-73.7609128371825,-73.760942094701,-73.7609687263903,-73.7609991775948,-73.7610266905418,-73.7610572642026,-73.7610966954456,-73.7611306782389,-73.7611682770681,-73.7612088467028,-73.7612321182093,-73.7612576118087,-73.761287857233,-73.7613131948617,-73.7613471186556,-73.7613901536528,-73.761437396878,-73.7614957850724,-73.7615181974965,-73.7615470835304,-73.7615848407413,-73.7616291920897,-73.7616782936784,-73.7617098196886,-73.7617399872956,-73.7617662441124,-73.7617861817048,-73.7618064045774,-73.7618423864632,-73.7618885122501,-73.7619210247977,-73.761968024412,-73.7619841201352,-73.76202127079,-73.7620246622602,-73.7620443916535,-73.7620643590497,-73.7620829632318,-73.7620969901392,-73.7621156332507,-73.762148768579,-73.7621940781379,-73.7622091014794,-73.7622220637493,-73.7622567824927,-73.7622760190373,-73.7622940112554,-73.7623405595861,-73.7623863707212,-73.7624338357212,-73.7625268036835,-73.7625925474565,-73.7626496260419,-73.7626999304602,-73.7627531752303,-73.7628087226907,-73.7628589049897,-73.7629007190831,-73.7629551509055,-73.7630223437053,-73.7630878967084,-73.7631069787327,-73.7631238207116,-73.7631267386084,-73.7631559831751,-73.763160551738,-73.7631652702642,-73.763170084466,-73.7631718316133,-73.7632077433603,-73.7632181445818,-73.763228297287,-73.7632381457836,-73.7632476257917,-73.7632566820462,-73.7632652603423,-73.7633128002737,-73.7633573032309,-73.7633697100868,-73.7633826654983,-73.7633960970319,-73.7634072845093,-73.7634188557223,-73.7634306823771,-73.7634414675092,-73.7634523592942,-73.7634632816264,-73.7634741604114,-73.7634849228769,-73.7635026316662,-73.763520364162,-73.7635380429598,-73.7635719955999,-73.7635779752854,-73.7635900114928,-73.7636018104818,-73.7636133240625,-73.7636192774738,-73.7636248412175,-73.7636299265296,-73.763632300871,-73.7636340019573,-73.7636349572673,-73.7636351311909,-73.7636345107518,-73.7636189263444,-73.7636178760909,-73.7636187368879,-73.7636203318978,-73.7636226024991,-73.7636254617001,-73.7636288008261,-73.7636324960768,-73.7636364076828,-73.7636801534634,-73.7637340233342,-73.7637941955143,-73.763807531616,-73.7638213577449,-73.7638356276511,-73.763870620694,-73.7639252337308,-73.7639844700796,-73.7640427240857,-73.7640656098469,-73.7640881011776,-73.7641101564682,-73.7641317310296,-73.7641675056327,-73.7642035933457,-73.7642399818538,-73.7642766279428,-73.7643135510575,-73.7643271697934,-73.7643404568497,-73.7643533655433,-73.7643658569003,-73.7643778853325,-73.7644145161047,-73.7644193266117,-73.7644246022247,-73.7644302330657,-73.764436106651,-73.7644421048351,-73.7644481020449,-73.7644577243446,-73.7644674204123,-73.7644770987767,-73.7644866675074,-73.7644960375218,-73.764499351146,-73.7645033086329,-73.7645078387513,-73.7645128665372,-73.7645183038841,-73.7645240569884,-73.7645300263729,-73.7645361088373,-73.7645431141041,-73.7645497120521,-73.7645557994821,-73.7645612787385,-73.7645660682385,-73.7645700910417,-73.7645786977438,-73.7645879752586,-73.7645978669854,-73.7646083066419,-73.7646192325521,-73.7646305737894,-73.764697364773,-73.7647130258508,-73.764728171209,-73.7647427565129,-73.7647567336962,-73.7647900421068,-73.764824083609,-73.7648588320766,-73.7648748470461,-73.7648912443045,-73.76490799289,-73.7649250649239,-73.7649352831757,-73.7649456846579,-73.7649561867252,-73.764966707369,-73.7649771619271,-73.7649874646221,-73.7649950563047,-73.7650022266063,-73.7650089140512,-73.7650150496895,-73.7650205830156,-73.765025462632,-73.76502963955,-73.7650330801634,-73.765035383361,-73.7650368995549,-73.7650376075846,-73.7650374928971,-73.7650365593866,-73.7650348221859,-73.7650323060939,-73.7650290506683,-73.7650251035974,-73.7650189362296,-73.7650121711835,-73.7650048512208,-73.7649970202133,-73.7649887226885,-73.7649800071571,-73.7649709287231,-73.7649615392217,-73.764949721541,-73.7649382928965,-73.7649273163201,-73.7649168460255,-73.7649069388625,-73.7648622800599,-73.7648527553844,-73.7648426945047,-73.7648321411054,-73.7648235424902,-73.7648143214075,-73.7648045518265,-73.764794310796,-73.76478368024,-73.7647734938918,-73.7647638035247,-73.7647547015764,-73.7647462681399,-73.7647430918824,-73.764740521842,-73.7647386362133,-73.7647374824067,-73.7647370963561,-73.7647374876024,-73.7647386461263,-73.7647428973486,-73.764747750603,-73.7647531674681,-73.7647590987901,-73.7647654969507,-73.7647723090664,-73.7647794741292,-73.7647989782821,-73.7648180940381,-73.7648367522837,-73.7649064084826,-73.7649337712963,-73.7649616233955,-73.7649899414326,-73.765018699199,-73.7650478797355,-73.7650774498148,-73.7651008950947,-73.7651240513858,-73.7651468990924,-73.7651694192791,-73.7651915846462,-73.7652133777982,-73.7652347751675,-73.7652557626529,-73.7652942981375,-73.7653324583967,-73.7653702317583,-73.7654704939803,-73.7655373025711,-73.7655915261879,-73.7656476599302,-73.7656816219455,-73.765728580802,-73.7657755646841,-73.7658118161817,-73.7658503754865,-73.7658950458283,-73.7659401031123,-73.7659729360681,-73.7660729458727,-73.7661203126078,-73.7661928358242,-73.7663986309527,-73.7664616109625,-73.7664956050691,-73.7665299787848,-73.7666708693347,-73.7666845750636,-73.7666976285451,-73.766710020056,-73.7667217409605,-73.7667327789028,-73.7667431245932,-73.76675277072,-73.7667617121689,-73.7667699337189,-73.7667774337798,-73.7668454077173,-73.766849972149,-73.7668537781107,-73.7668568074256,-73.7668590452197,-73.7668604814448,-73.7668611064935,-73.7668609175796,-73.7668599200511,-73.7668611368994,-73.7668630609252,-73.766865671705,-73.7668689409331,-73.7668728424832,-73.76687733618,-73.766882379666,-73.7668879239785,-73.7668939184278,-73.7669143172083,-73.7669345583105,-73.7669546014769,-73.7669744090876,-73.7669939419593,-73.7670000611591,-73.7670053608254,-73.7670098133368,-73.7670133976263,-73.7670160941844,-73.7670178892104,-73.7670187743919,-73.7670161662372,-73.7670145545626,-73.767013941914,-73.767014330619,-73.7670157179457,-73.7670151200684,-73.7670153472271,-73.7670163970537,-73.7670182664946,-73.7670209366862,-73.7670243942676,-73.76702861774,-73.7670335724142,-73.7670392326374,-73.7670455542743,-73.7670524987121,-73.7670600185396,-73.7670692231355,-73.7670776168137,-73.7670851915479,-73.7670919234979,-73.7670977993581,-73.7671028080338,-73.7671236249946,-73.767145146777,-73.7671673698598,-73.7672125506337,-73.7672585552604,-73.7673053758046,-73.7673530085153,-73.7674014513824,-73.7674130761345,-73.7674254688693,-73.767438623146,-73.7674525330066,-73.7674671764529,-73.767482561084,-73.7674986802709,-73.7675155218755,-73.7677211537639,-73.7677576800432,-73.7677722654865,-73.7677723140311,-73.7677690626527,-73.7677691164806,-73.7677736470697,-73.7677770298826,-73.7677815336187,-73.7678510335164,-73.767933468777,-73.7681417802164,-73.768154159527,-73.768168783196,-73.7682328635975,-73.7682564832235,-73.7682677377341,-73.7682767506316,-73.7682823976002,-73.7682869263962,-73.7682903815059,-73.7682927896086,-73.768293978947,-73.768300915172,-73.7683054617409,-73.7683111203302,-73.7683257830935,-73.7683460563229,-73.7683663208659,-73.768418084684,-73.7684417210102,-73.7684586081676,-73.7685002399896,-73.7685142264366,-73.7685634075171,-73.768604087208,-73.76861714897,-73.7686235943198,-73.7686217708324,-73.7686206953167,-73.7686203698792,-73.7686207968378,-73.7686354989914,-73.768657931023,-73.7686877045599,-73.768724304131,-73.7687377248324,-73.7687500193133,-73.7687608801198,-73.7687700356511,-73.7687772569512,-73.7687823634346,-73.7687852274022,-73.7687857772346,-73.768783999183,-73.7687811026458,-73.7687779622816,-73.7687766698261,-73.7687772562929,-73.7687797076082,-73.7687839649485,-73.7687899261525,-73.7687974481724,-73.7688063505069,-73.7688163364501,-73.7688236260515,-73.7688280503061,-73.7688295066409,-73.7688279612936,-73.7688234500943,-73.7688160776351,-73.7688088263758,-73.7688048756039,-73.7688043407445,-73.7688072374217,-73.7688134810031,-73.7688228890722,-73.7688351867583,-73.7688384171419,-73.768840794235,-73.7688422532665,-73.7688427544809,-73.7688422842213,-73.7688408553016,-73.768838506657,-73.7688353022838,-73.7687574816108,-73.7687529171153,-73.7687510345104,-73.7687518894018,-73.7687554565368,-73.7687616305503,-73.7687702290768,-73.7686675992549,-73.7686398363376,-73.7686431284678,-73.7686101564793,-73.7685840602198,-73.7685650449087,-73.7685532600749,-73.7685530892061,-73.7685525283269,-73.7685527728421,-73.7685538237634,-73.7685556796925,-73.7685583352748,-73.7685644567074,-73.7685713432294,-73.7685789930167,-73.7685873972223,-73.7685965507318,-73.7686064464519,-73.7686170746512,-73.7686269619474,-73.7686361240184,-73.7686445601803,-73.7686522688716,-73.7686592487424,-73.7686631314703,-73.7686678171728,-73.7686732954551,-73.768679563596,-73.7686866107484,-73.7686944293707,-73.7687030072846,-73.7687123358522,-73.7687224004877,-73.7687331912266,-73.7687446932749,-73.7687517391171,-73.7687594814381,-73.768767902108,-73.768776982366,-73.7687866990386,-73.7687970340151,-73.7688079584246,-73.7688194506352,-73.7688314837659,-73.7688440267366,-73.7688570546492,-73.7688705353353,-73.7688844386278,-73.7691130470866,-73.7691499748244,-73.7691862890294,-73.7692219760304,-73.7692570215096,-73.7692914146577,-73.7693251387343,-73.7693392440053,-73.7693527788617,-73.7693657183833,-73.7693780431746,-73.7693897353512,-73.7694007737456,-73.7694111433373,-73.7694208244772,-73.7694298047924,-73.769438067932,-73.7694390950985,-73.7694408895737,-73.7694433942695,-73.769446523564,-73.7694501764824,-73.7694542287931,-73.7694585477618,-73.7694629886242,-73.7694674058073,-73.7694716513948,-73.7694755838994,-73.769479075989,-73.7694820072018,-73.7694895877037,-73.7694912254507,-73.7694936474523,-73.7694968387199,-73.7695007772014,-73.7695054336039,-73.7695107781765,-73.769514882053,-73.7695184325349,-73.7695213495749,-73.7695235632093,-73.7695250210276,-73.7695256882082,-73.7695255521106,-73.7695246119716,-73.7695228923207,-73.7695264706944,-73.7695309428889,-73.769536305753,-73.7695425521572,-73.7695496754396,-73.7695576669404,-73.769566517122,-73.7695762166849,-73.7695761464365,-73.7695769083152,-73.769578498659,-73.7695809126924,-73.7695841353304,-73.7695881569764,-73.7695929566009,-73.7695985140678,-73.7696048052771,-73.7696118021809,-73.7696295605644,-73.7696467453617,-73.7696633204576,-73.7696792569755,-73.7696945194401,-73.769709082704,-73.7697146401143,-73.7697194499627,-73.7697234848295,-73.7697267179485,-73.7697291302461,-73.769730705935,-73.7697314351686,-73.7697313144761,-73.7697303441253,-73.7697285292081,-73.7697258809866,-73.7697297459426,-73.7697453106777,-73.7697899514217,-73.7697940908081,-73.769797607292,-73.7698004595915,-73.7698026182702,-73.7698040560823,-73.7698047574375,-73.7698047144284,-73.7698039279521,-73.7698024054903,-73.769800165746,-73.769813320957,-73.7698051625517,-73.7698052345856,-73.769802543787,-73.7698053570452,-73.7698191275425,-73.7698219905529,-73.7698155809729,-73.7715638278995,-73.771476093109,-73.7714106878941,-73.771305633154,-73.7712382624075,-73.7711435537743,-73.7710711807374,-73.7710411193119,-73.7710286204483,-73.770973083201,-73.770914999461,-73.7709036408786,-73.770924954283,-73.7709073547107,-73.7709509974847,-73.7709284329042,-73.7708902139605,-73.770867399063,-73.7708327024371,-73.7708112894863,-73.7708393498663,-73.7708904483996,-73.7709114570795,-73.7708857689498,-73.7708383826606,-73.7708206970797,-73.7708600125076,-73.7709246589176,-73.7709687522885,-73.7709853777765,-73.771017925095,-73.7710684101276,-73.7710920485909,-73.7711027737106,-73.7710864602151,-73.7710833712524,-73.7710999588873,-73.7711462312972,-73.7711723904254,-73.771251949954,-73.7712944169888,-73.7713575106856,-73.7714187724035,-73.7714388366401,-73.7714562079496,-73.7715551046515,-73.7716029266012,-73.7716552251946,-73.7717276028514,-73.7717874217137,-73.7716878094125,-73.7716990840581,-73.7718020508899,-73.7718065553057,-73.771973183249,-73.771870213046,-73.7718814934359,-73.7719866984392,-73.7721454697065,-73.7720313143137,-73.7720729688007,-73.7721490467795,-73.7721882402803,-73.7727241829073,-73.7730856275284,-73.7734733756139,-73.7735006729403,-73.7734773057809,-73.7735310283738,-73.7735208785545,-73.7734660342232,-73.7732926658068,-73.7733497479159,-73.7733362347928,-73.7732836324803,-73.7731091404201,-73.7731628632555,-73.773151597999,-73.7730978751548,-73.7729256144366,-73.7729815822395,-73.7729647032208,-73.7729132215353,-73.7727443212582,-73.7727935624734,-73.7727811833139,-73.7727285739533,-73.7725574403958,-73.7726089222988,-73.7725965330096,-73.7725461699329,-73.7723727896455,-73.7724253934094,-73.7724118843109,-73.7723615224445,-73.77220950704,-73.7724031363918,-73.7723626016272,-73.7721689786682,-73.7721543447311,-73.7720046057531,-73.7721546447706,-73.7721848238353,-73.7721701833477,-73.7721536035702,-73.7719966927057,-73.7718210791248,-73.7718188277178,-73.7718244240368,-73.7719990449036,-73.7719877644844,-73.7718556963892,-73.7718131678185,-73.7717389758124,-73.7718603301859,-73.7725553624243,-73.7726614887584,-73.773001506999,-73.7732353724051,-73.7733693629254,-73.7734397297613,-73.7734866840499,-73.7734861654505,-73.773810244094,-73.7738325872655,-73.7734856041889,-73.7734946161459,-73.7735789732032,-73.7736434144031,-73.7736244966693,-73.7736591533506,-73.7736836365793,-73.774075264155,-73.7765422988784,-73.7794689768795,-73.7813619589163,-73.7848788874089,-73.7836307901584,-73.7832841582038,-73.7833669921649,-73.7834897575108,-73.7837772867501,-73.7843476424215,-73.7850119049104,-73.7857029374046,-73.7857077177014,-73.7859397466634,-73.786495055162,-73.786906666845,-73.7874306008714,-73.7877997237829,-73.7883233944035,-73.7892270196835,-73.7892734983958,-73.7893161891414,-73.7893540644566,-73.7893862127706,-73.7894118603439,-73.7894303898913,-73.7894413554386,-73.7894444930579,-73.7894397272202,-73.789427172615,-73.7894966307233,-73.7895151787827,-73.7895418794146,-73.7895761424281,-73.789617210481,-73.7896641758204,-73.7897160003473,-73.7897715385619,-73.7899607917847,-73.7901516103583,-73.7903436422085,-73.7904246552064,-73.7905040977256,-73.7905815760899,-73.7906567063577,-73.790703234859,-73.7907485622124,-73.7907588497605,-73.7907694747373,-73.7907801643333,-73.7907906440798,-73.7908006448964,-73.7908099099997,-73.7908182014964,-73.7908253064918,-73.7908310425557,-73.7908352624072,-73.7908378576955,-73.7908387617828,-73.7908146477735,-73.7907840141711,-73.7907471420723,-73.7907043698241,-73.7906937920087,-73.7906845797456,-73.7906769289901,-73.790671002483,-73.7906663734017,-73.7906644949083,-73.7906654234016,-73.7906685260133,-73.7906736934272,-73.7906960992853,-73.7907238490448,-73.7907563343418,-73.790792842991,-73.7935653410954,-73.7935660842363,-73.7957794868142,-73.7980375183471,-73.7979682950392,-73.798118722262,-73.7982761548127,-73.7981234798391,-73.7980553723507,-73.7958186394161,-73.7936501727697,-73.7936494287495,-73.7911948606937,-73.7908111125051,-73.7910813277266,-73.7912093785741,-73.7913087778823,-73.7913083705343,-73.7912508846191,-73.7912289850974,-73.7917470793118,-73.791882172218,-73.7919746031248,-73.7922231803763,-73.7928695037569,-73.7930847591326,-73.7932253164992,-73.7933055098205,-73.7934336919612,-73.7935903387631,-73.7937398609715,-73.7939107482364,-73.7939458346465,-73.794102992281,-73.7942596433388,-73.7944305456898,-73.7944501324473,-73.7945943402897,-73.7947438743328,-73.7948720305742,-73.7949583546952,-73.7951568395727,-73.7954345382262,-73.7955840854956,-73.7957977084219,-73.7959116202706,-73.7960825169177,-73.7963459863727,-73.7966165683257,-73.7966877730455,-73.7968159559689,-73.7969085306423,-73.7969512359493,-73.7970651648523,-73.7972574286707,-73.7974995510502,-73.797649100452,-73.7978627314211,-73.7980193849944,-73.7982330126522,-73.7983825624036,-73.7984970049823,-73.7985249912263,-73.7985520986981,-73.7986389192264,-73.7987457376064,-73.7987713568496,-73.7989024094984,-73.7990875760913,-73.7992371198386,-73.7997355768646,-73.8001557208123,-73.8004298157185,-73.8004476694881,-73.8017722025143,-73.8029757029201,-73.8046593024144,-73.8056593965263,-73.8058035968175,-73.8060841114885,-73.8062192767137,-73.8064216049657,-73.8067020067576,-73.8074694771084,-73.808645687167,-73.8091841865688,-73.8100244310152,-73.8101171061283,-73.810757494441,-73.8111448304766,-73.8114739755981,-73.812033336833,-73.8127813810424,-73.8132238963757,-73.8136436022475,-73.8139999208905,-73.8144473326928,-73.8149426968579,-73.8153307552018,-73.8156510415763,-73.8159307910774,-73.8159671247629,-73.8161791001817,-73.8167088688832,-73.81728428683,-73.8183031695635,-73.8188184224075,-73.8190848690183,-73.8192357156489,-73.8193946496199,-73.8195615197326,-73.8197361672303,-73.8199184259501,-73.82010812248,-73.8203050763245,-73.8204549548203,-73.8205994026146,-73.8207380926851,-73.8208707110402,-73.8209969574292,-73.8211165460226,-73.8212292060586,-73.8213346824569,-73.821432736396,-73.821523145854,-73.8219362965906,-73.8221514319808,-73.8221406111046,-73.8222009320416,-73.8223293418256,-73.8225109582994,-73.8225973609004,-73.8226057267348,-73.8229606678142,-73.8232184940707,-73.8233792298587,-73.8234656042156,-73.8234212144722,-73.8228612673408,-73.8224676559656,-73.8224310112652,-73.8223873320586,-73.822336880747,-73.8222799604207,-73.8222169130385,-73.8221481173734,-73.821713048647,-73.8216632417559,-73.8216112551013,-73.8216422080524,-73.8216696270373,-73.8216932835147,-73.8216749888022,-73.8216913943942,-73.8216072624319,-73.8215726991349,-73.8215928136412,-73.8215689357557,-73.8215355246485,-73.8216034625033,-73.8217626999444,-73.8217701644304,-73.8217152044911,-73.821746502157,-73.821607002436,-73.8215117933079,-73.8197007412069,-73.8197418328961,-73.819769267185,-73.8197910961527,-73.8197709767998,-73.8197836987367,-73.8197141990923,-73.8196741704967,-73.8196979434637,-73.8196572528702,-73.819011921548,-73.8189361108069,-73.8188578489987,-73.8187774697181,-73.8186953155869,-73.8186210618969,-73.8185475047157,-73.818475430908,-73.8184056114695,-73.8183387932782,-73.817644023338,-73.8176384348895,-73.8176804549628,-73.8176804359499,-73.8176950528247,-73.8176931495326,-73.8176748796964,-73.817672964987,-73.8175049143154,-73.8175142135543,-73.8175635341206,-73.8175672711915,-73.8171796832365,-73.8169852781274,-73.8168833990105,-73.8167796049831,-73.8166742250062,-73.8165675930663,-73.8164600471169,-73.8161395470038,-73.8161335833439,-73.8161737658636,-73.8161754844336,-73.8161608734104,-73.8161608235675,-73.8159818038872,-73.8159965882614,-73.816042258399,-73.8160520303471,-73.8154613461429,-73.8153570977084,-73.8152540383297,-73.8151523558369,-73.8146814879138,-73.8146707545938,-73.8147018000603,-73.814698043002,-73.8146779499052,-73.8146760376376,-73.8145701175825,-73.8145885643114,-73.8146141412009,-73.8146253396985,-73.8140894012619,-73.8138834223295,-73.8137611356149,-73.8137496032602,-73.8135823364557,-73.8132517985096,-73.8130922803795,-73.8126212551767,-73.8126007714405,-73.812307418284,-73.8120016297788,-73.8119905123955,-73.8119325852397,-73.8115724541165,-73.8115379997173,-73.8114988257826,-73.8114383384402,-73.8114230591221,-73.8112949093216,-73.8112443529111,-73.8113011906176,-73.8113170115266,-73.8113325502064,-73.8113583092684,-73.8113822106582,-73.8114036643402,-73.8114221407026,-73.8114371836314,-73.8114484217701,-73.8114555776878,-73.8115144834633,-73.8117211780721,-73.8120090375559,-73.8122192650521,-73.8128291153082,-73.81286081322,-73.8128856288344,-73.8140837996424,-73.8141245512204,-73.8141369726351,-73.8141481982587,-73.8149455657476,-73.8150934515766,-73.8152888564165,-73.8157655353685,-73.8162203961043,-73.8165732258728,-73.8168703124716,-73.8169018883269,-73.8169979381657,-73.8170757974681,-73.8171639426998,-73.8171933980752,-73.8172115050053,-73.8172465199289,-73.817270152976,-73.8173581732293,-73.817468831129,-73.8175952861831,-73.8176935453518,-73.8177139337861,-73.8177523768762,-73.8177557257857,-73.8177726429978,-73.8179183626459,-73.8180166607845,-73.8180799206779,-73.8181692626507,-73.818302597163,-73.8183748365525,-73.8184537895829,-73.8184837458388,-73.8184971488631,-73.8185074720579,-73.8186718437416,-73.8187331088303,-73.8187444407568,-73.8187379911416,-73.8187864961107,-73.8188416790097,-73.8190033563292,-73.8197637179348,-73.8200523698372,-73.8201520597743,-73.8201532275217,-73.8201561699529,-73.8201608161179,-73.8201670539854,-73.8202010245544,-73.82027863985,-73.8213142903301,-73.8213399690981,-73.8214123305336,-73.8214877294638,-73.8215081147694,-73.8215295757148,-73.821551712373,-73.8215741122251,-73.8216460742556,-73.8217223606161,-73.8218021099299,-73.8219194556834,-73.8220334290885,-73.822143557088,-73.8222493825882,-73.822332160758,-73.8227216168943,-73.8227685388113,-73.8228143365179,-73.8229256371116,-73.8230323152441,-73.8231337644647,-73.8232294080529,-73.8233187022975,-73.8234011395873,-73.8234762512969,-73.8240212794523,-73.8240467681479,-73.8240659556743,-73.824078694969,-73.8240848883978,-73.8240844885033,-73.8240762310045,-73.8240774577491,-73.8240955805299,-73.8241196196189,-73.8241494581966,-73.8241849512657,-73.8242129650155,-73.824235740554,-73.8242528866232,-73.8242641086766,-73.8241072859903,-73.8241036885446,-73.8240413045689,-73.8240592913372,-73.8241109742534,-73.8241055791088,-73.8242677604036,-73.8242860891979,-73.8242979356982,-73.8243032248566,-73.8243019231768,-73.8243018325563,-73.8243050092408,-73.8243113648384,-73.8243300462509,-73.8243573769456,-73.8243930847355,-73.8244368140162,-73.8248516898402,-73.8249219145979,-73.8249294096332,-73.8248554196315,-73.8245107910771,-73.8244360539579,-73.8242963850378,-73.8242263337792,-73.8241516285949,-73.8241358874292,-73.8239306090713,-73.8238532110437,-73.8238071795817,-73.8236425072336,-73.8234752748071,-73.8234662547894,-73.8234545299355,-73.8234659988292,-73.8234219994719,-73.8233260000719,-73.8231809999741,-73.8229071770091,-73.8229315891618,-73.8229611349022,-73.8229950106928,-73.8230322952369,-73.823071974535,-73.8231129694609,-73.8231541651091,-73.8231944411156,-73.8233883640573,-73.8234120915168,-73.8234381461775,-73.8234930544188,-73.8235372598477,-73.8235851981415,-73.8236366776097,-73.8237086629046,-73.8237743437587,-73.8238333270885,-73.8238695456938,-73.8239036472567,-73.8239254361219,-73.8239390307236,-73.8239440457655,-73.8239403391019,-73.8239280157677,-73.8239074250038,-73.8239063194281,-73.8239093749004,-73.8239165033197,-73.8239274991418,-73.8239420453053,-73.8239597223744,-73.8239800206326,-73.8240126223632,-73.8240500699112,-73.8240914075425,-73.8241355802372,-73.8241814606169,-73.8244503685961,-73.824587603009,-73.8247231927497,-73.8247438801287,-73.8247532058711,-73.8247639393207,-73.8247758964991,-73.8247888724527,-73.8248272219504,-73.8248684317135,-73.8249114462886,-73.8249551639996,-73.824998465162,-73.8250555551778,-73.8251074946462,-73.8251532153923,-73.8251917771288,-73.8252223867936,-73.825341030858,-73.8254536597011,-73.8255196143557,-73.8255510789481,-73.8255888899322,-73.8256319006799,-73.8256788068836,-73.8257281861091,-73.8257785409294,-73.8258283443339,-73.8258596210226,-73.8258891029798,-73.8259160562406,-73.8259398097915,-73.8259597722759,-73.8259754467158,-73.825986442885,-73.8259924870238,-73.8259934286547,-73.826021617752,-73.8260445006529,-73.8260614450167,-73.826071982603,-73.8260758222121,-73.8261036173387,-73.8261057924015,-73.826111209862,-73.8261197066841,-73.8261310271583,-73.8261448305966,-73.8261710899815,-73.8261971957447,-73.8262223865878,-73.8262459278934,-73.826267133149,-73.826285383967,-73.8263001481182,-73.8262775921068,-73.8262491669738,-73.826215150844,-73.8262144414625,-73.8262093134325,-73.8261998449557,-73.8261809938835,-73.826164039328,-73.8261494233502,-73.826137527036,-73.8261286605601,-73.8261230550986,-73.8261208568021,-73.8261221229847,-73.8261268206305,-73.8261348272543,-73.8261459340955,-73.826159874788,-73.8261706183816,-73.8261778698343,-73.8261814300069,-73.826181201132,-73.8261771894978,-73.8261695052757,-73.8261720453565,-73.826178421186,-73.8261884443194,-73.8262018185141,-73.826218148485,-73.8262369515885,-73.8262576720864,-73.826282330964,-73.8263066442462,-73.8263300008531,-73.8263518137501,-73.826371534702,-73.8263920109692,-73.8264040373646,-73.8264073556986,-73.8264018947448,-73.8263877717669,-73.8263652899999,-73.8263703595005,-73.8263686781897,-73.8263602784903,-73.8263453223384,-73.8263240980612,-73.8262970148178,-73.826241489081,-73.8262203363889,-73.8263924291048,-73.8267194354685,-73.8268962339086,-73.8270132446351,-73.827125099757,-73.8272419261337,-73.827360789807,-73.8274780709591,-73.8275964175788,-73.827706836014,-73.827825075022,-73.8280718116247,-73.8282792561477,-73.828599424047,-73.8293142021882,-73.8299133575328,-73.830031319839,-73.8302937520803,-73.8310777106598,-73.8318573801724,-73.8324776821402,-73.8321184686961,-73.8320321880746,-73.8294871604184,-73.8258439379527,-73.8242605229864,-73.8230521056646,-73.817917595908,-73.8149692248572,-73.8144276302692,-73.8138875902703,-73.8133501116202,-73.8128161638551,-73.812286727852,-73.8117669494147,-73.8111660877966,-73.8112906073772,-73.811403279588,-73.8115024914701,-73.8115869511678,-73.811655742202,-73.8120035042887,-73.812011401654,-73.8120145889871,-73.8120130283954,-73.8120067385057,-73.81197113821,-73.8119302070536,-73.8118849475158,-73.8118364680822,-73.8117859560972,-73.8117346486836,-73.8116838024454,-73.8116204419967,-73.8115572396579,-73.8114955695235,-73.8096014878296,-73.808457543926,-73.807890716094,-73.8076878255338,-73.8073717986702,-73.8064743428578,-73.8061016318443,-73.8041369962541,-73.8043205057094,-73.8037752445163,-73.8029952720731,-73.8021486650281,-73.8020320768996,-73.8018866747649,-73.8018004962112,-73.801220509571,-73.7998195446255],"lat":[40.6652592619759,40.6651259895878,40.665112528433,40.665073247268,40.6650209300159,40.6649634816834,40.6649556274503,40.6648774254888,40.6647023883246,40.6645142759682,40.6644392769414,40.6643332337139,40.6642433008384,40.6641669075752,40.6641532888246,40.6641445380632,40.6641359922341,40.6639058808683,40.6638252434728,40.6636095530448,40.6634210723975,40.662908590548,40.6627828314206,40.6623853557278,40.6608118444399,40.6607856705753,40.6607551071615,40.6606920872454,40.6606327737113,40.6605772514111,40.6605255997728,40.6604778927086,40.6604341985495,40.6603945798054,40.6603590931561,40.6602433290318,40.6602006722528,40.6601522417218,40.6600981083457,40.660038351381,40.6599730583171,40.6599023248673,40.6598262545276,40.6597449586683,40.65965855631,40.6595671739484,40.6593200441285,40.6589699922588,40.6589381796209,40.6589018281002,40.657478486007,40.6562320931192,40.6559482547964,40.6557265855447,40.6557144745297,40.6556786357565,40.6556703691068,40.6556001151361,40.6556101976931,40.6557308884535,40.6558381686998,40.6558568305942,40.6558299853118,40.655802847503,40.6555782154991,40.6552534688908,40.6547468966045,40.6544215005823,40.6543562668311,40.6540909013783,40.6536219366957,40.6508533039385,40.6505813522893,40.6490120966032,40.6486976651584,40.6479793389674,40.6472593012057,40.6454569205046,40.6453440303174,40.6452266935595,40.6451050501743,40.644979245241,40.6448494288012,40.64471575568,40.6443718457897,40.6415831142638,40.6412470695419,40.6411537997528,40.6398622237486,40.6394461872735,40.6378716951649,40.6378884554684,40.6379083100579,40.6379306792711,40.6379549100297,40.6379802949059,40.6380060927762,40.6380315504588,40.6380559247027,40.638078503888,40.6381348432258,40.6381899334336,40.6382435997756,40.6382599711788,40.6382738450953,40.6382850036858,40.6382933941015,40.6383209251002,40.6383506098683,40.6383817272689,40.6384135213608,40.6387907988681,40.6388510187846,40.6389109855258,40.6389701976608,40.6390281600675,40.6390843880727,40.6390977590122,40.6391131991828,40.6391302637956,40.639148461266,40.6391672673743,40.6391861403674,40.6392045365645,40.639215728536,40.639227091659,40.6392383368395,40.6392491779838,40.6392593392776,40.6392685622025,40.6392766121138,40.6392832842098,40.6392896096282,40.6392971791111,40.639305788224,40.6393152044543,40.639325173491,40.6393354260927,40.6393456853596,40.6393556742116,40.639365122872,40.6393737761532,40.639381400349,40.6393877895466,40.6394054541848,40.6394238229908,40.639442421583,40.6394607696449,40.639498334453,40.6395368192791,40.6395751104628,40.6396761983282,40.6397772675598,40.6398780098265,40.6399781177935,40.6400772860596,40.640175212089,40.6402715971343,40.6403661471482,40.6403729294286,40.6403802825587,40.6403880140517,40.6403959215162,40.6404037979542,40.6404114371797,40.6404186392166,40.640425215533,40.6404532621898,40.6404861245303,40.640522969205,40.6405628618759,40.640567939271,40.6405734427726,40.6405792253571,40.6405851325451,40.6405910065285,40.6405966903863,40.6406020322763,40.6406068894922,40.6406111322753,40.6406323890212,40.6406550763404,40.640678745969,40.640702930234,40.6407310227911,40.6407667357707,40.6408013812687,40.6408340442568,40.6408638620657,40.6408898274788,40.6409168980741,40.6409444109791,40.6409716924897,40.6409980745671,40.6410229111959,40.6410455942034,40.6410938966037,40.6411433638858,40.6411935225503,40.6412438924791,40.6412939915306,40.6412973726736,40.6413014535106,40.6413061348172,40.6413113027684,40.6413168317065,40.6413225871967,40.6413241423607,40.6413257828168,40.6413274681693,40.6413291569169,40.6413308074748,40.6413323791986,40.6413338333851,40.6413351342255,40.641336249687,40.6413371523016,40.6413556333802,40.6413748243629,40.641394312679,40.6413999298555,40.6414043419548,40.6414078563476,40.6414519057089,40.6415282063263,40.6415840826145,40.6416391984594,40.6416908587858,40.6418254976917,40.641989359045,40.6420649294102,40.6421420073942,40.6422125314941,40.6422822590425,40.6423085612735,40.6423328534357,40.6423544049455,40.6423725676433,40.6423867952875,40.6423906310598,40.642395483279,40.6424012245798,40.6424077042597,40.6424147522347,40.6424221835033,40.6424298030033,40.6424374107313,40.642444859762,40.6424518957983,40.6424836609144,40.6425152758716,40.6425461195845,40.6425632773981,40.6425789031288,40.6425925648,40.6426038847316,40.6426125499814,40.6426144972478,40.6426170599377,40.6426233274263,40.6426314206941,40.6426442111736,40.6428786916845,40.6429429862387,40.6430066630738,40.6430689834122,40.6431292242124,40.6431866865578,40.6432407037658,40.6432906491231,40.6432965637391,40.6433019017301,40.643306581913,40.643308782157,40.6433113142601,40.6433160343807,40.6433228212614,40.6433315005513,40.6433418492843,40.643353601607,40.6433664556087,40.6433800810768,40.6433941279799,40.6434025494625,40.6434110706783,40.6434194810663,40.6434275728043,40.6434351459437,40.6434420133507,40.6434480053301,40.6434479372948,40.6434487228721,40.6434503415767,40.6434527511982,40.6434558889015,40.6434596728658,40.6434640044176,40.6434687706045,40.6434738471399,40.6434791016445,40.6434843970979,40.6434895954121,40.643529634964,40.643567038118,40.6436011377632,40.6436313257081,40.6436570635284,40.6436572049498,40.6436582038967,40.6436600315132,40.6436750728751,40.6436911145421,40.6437085573912,40.64373505675,40.6437633976237,40.6437929876085,40.6438149134223,40.643835776275,40.6438549848079,40.6438719945535,40.6438863233689,40.6438975651018,40.6439054011038,40.6439079199546,40.6439128130822,40.6439199318371,40.6439290599566,40.6439394782072,40.6439512063994,40.6439639148224,40.6439868730563,40.6440095354075,40.644031315332,40.6440516491242,40.6440700105064,40.6440859242507,40.6440989784779,40.6441088353189,40.6441147088787,40.64412211526,40.6441307076872,40.6441404756854,40.6441512414964,40.6441628092033,40.6441720476816,40.644184060291,40.6441927739142,40.644214570707,40.6442319811701,40.6442522688999,40.6442798462776,40.6443181113375,40.6443226514465,40.6444711028478,40.6445164001251,40.644558314292,40.6446001986831,40.6448165015801,40.644944215896,40.6451188804949,40.6450975027157,40.6451422876541,40.6451692701133,40.6451654525874,40.6451661657439,40.6451694300937,40.6451704598397,40.6451712473699,40.6451704905988,40.6451682091507,40.6451644621866,40.6451577668188,40.6451484844811,40.6451368247054,40.64512305069,40.645107473358,40.645090444339,40.6450723480316,40.645048333751,40.6450259720983,40.6449518481876,40.6449399045835,40.6449310077756,40.6449253958107,40.6449232188452,40.6449245351269,40.6449253183725,40.6449275719226,40.6449312342689,40.6449362054514,40.6449423497867,40.6449494995713,40.6449574596591,40.6449659055121,40.6449746951696,40.6450148490406,40.6450522551055,40.6450858967953,40.6451148598423,40.6451383571276,40.6451557500726,40.645157273066,40.6451605919673,40.6451656358758,40.6451705943607,40.6451764384011,40.6451857643899,40.6451963992227,40.6452080924353,40.6453282181856,40.6454418966431,40.6454453986222,40.645529837853,40.6456244878951,40.6456639825735,40.6456685962416,40.6456977847534,40.6457585845995,40.6457732927346,40.6460379352107,40.6460740347591,40.6461707494487,40.6462315400344,40.6462573903054,40.6462664665647,40.6462900748067,40.6463046488221,40.6463325422493,40.6463745382788,40.6464027475244,40.6464230960423,40.6464702123569,40.6465005907688,40.6465795175205,40.6465977526427,40.6466519368124,40.6467531774833,40.6469346059423,40.6470452156182,40.6472130087495,40.6472277207673,40.6473337620166,40.6471623746074,40.6470722518673,40.6470521146862,40.6471963123193,40.6472142196573,40.6471706590442,40.647343402722,40.6473564101332,40.6473757792417,40.6474010979365,40.6474318275183,40.647467314161,40.6474789663185,40.6474886844971,40.6474962480887,40.6475014853952,40.6475042775269,40.6475045611007,40.6475052740832,40.6475119473783,40.6475244638006,40.6475426035568,40.6477569035242,40.6478864220789,40.6478879333563,40.6479354790543,40.6478121988934,40.6476872079393,40.6475727210385,40.6472004589555,40.6467056046855,40.6468711391909,40.6469307812108,40.6469604235778,40.6468074612093,40.6467815424618,40.6468561822565,40.6466863226581,40.6447285566739,40.6446184524879,40.6444608362552,40.6443501686348,40.6436328700517,40.6435596092734,40.6434907928842,40.6434268054841,40.6433680046839,40.6433434923375,40.6431934577227,40.6430455054853,40.6428997957106,40.6427564860565,40.642615731583,40.6424776845846,40.6423424944252,40.6420948432851,40.6419612310742,40.6418290394412,40.6416983805409,40.6416904134092,40.6416889834983,40.6416298777659,40.6415721057636,40.6415163657409,40.641463331386,40.6414136436845,40.6413841642582,40.6413533764267,40.64132202043,40.6412908501675,40.6412606150721,40.6412320420909,40.6412058182081,40.6411825739272,40.6411804835021,40.6411769074664,40.6411719438061,40.6411657285291,40.6411584319386,40.6411502539664,40.6411414186949,40.6411321682166,40.641122756001,40.6411134399493,40.6411044753275,40.6410961077722,40.6410885665597,40.6410820583242,40.6410767613953,40.6404278514656,40.6403994639725,40.6403724867202,40.6403475791108,40.6402389285237,40.6401301385751,40.6400216369086,40.6399138500325,40.6398072016433,40.639748116685,40.6396885707488,40.6396293558618,40.6395712596463,40.6395150548425,40.6394959640996,40.6394759478726,40.6394555230762,40.6394352171756,40.6393992615655,40.6393620017422,40.6393244347555,40.6392875658734,40.6392523816811,40.6392198236813,40.6390747404679,40.6390141928642,40.6389404032052,40.6389062638241,40.6388320261826,40.6388004463367,40.6387765404185,40.6387344897499,40.6387011311289,40.6386447015042,40.6385528502046,40.6383701665821,40.6383590726792,40.6383462724537,40.6383044780084,40.6382874142052,40.6382703435236,40.6382618042453,40.6382541191898,40.6382498452749,40.6382447183072,40.6382259049217,40.6382207779538,40.638219069003,40.6382165064981,40.6381678276257,40.6380704755733,40.6380329041812,40.6379919307007,40.6379535222942,40.6378613493329,40.637814403986,40.6377384253474,40.637671827922,40.6376376688391,40.6375556678972,40.6375343190489,40.6375146809407,40.6374515154904,40.6373840908654,40.6373124106919,40.6373004571386,40.6372876500277,40.6372372543158,40.6372167601947,40.6371988323172,40.6371792015747,40.6370955697867,40.6370580142907,40.6370204470145,40.6369376147285,40.6369017552278,40.6368727316448,40.6368676120487,40.6368654457732,40.636862852918,40.6368580083674,40.6368446257198,40.6368074448122,40.6367174334314,40.6366536373199,40.6364772913637,40.6362891951181,40.6361018685144,40.6359571416487,40.6359253599241,40.6358332175275,40.6356361375862,40.6355137458597,40.6354566641753,40.6354115595757,40.6353980656848,40.6353802393749,40.6353676329543,40.6353361087588,40.6352756279904,40.6352341414999,40.6352010317566,40.6351269684129,40.6350812341905,40.6350622076527,40.6350408113612,40.6350219748059,40.6349946711076,40.6349684572236,40.6349472568423,40.6349248533121,40.6349218469062,40.6348837864508,40.6348585927858,40.6348317709188,40.6348166942747,40.6348010570673,40.6347780223169,40.634749944025,40.6347361421634,40.6347430025586,40.634721321525,40.6347093537861,40.6346689069613,40.6346279757656,40.6345975987966,40.6345767164499,40.6345594573383,40.634543420381,40.6345165289053,40.634435629729,40.6343576985233,40.634333679686,40.6342933532338,40.6342799740293,40.6342797943189,40.634244603607,40.6342105651852,40.6341687266327,40.6341372804208,40.6341009876733,40.6340627337137,40.6340481697241,40.6340402468914,40.6339701033448,40.6339555121722,40.6339196537855,40.6338867319282,40.6338496784181,40.6338167029854,40.6337984326142,40.6337790641237,40.6337621195559,40.6337168163039,40.6336767797407,40.6336558202131,40.6336237260902,40.633612115197,40.6336178884617,40.63362288938,40.6336036292399,40.6335721360746,40.6335334489909,40.6335142910791,40.6334963217319,40.6334783954787,40.6334556674758,40.6334501218983,40.6334432518108,40.6334362060838,40.6334125279321,40.6333843644273,40.6333721777368,40.6333570708448,40.6333406259042,40.6333308360618,40.6333159263964,40.6332806842004,40.6332453414514,40.6331806522174,40.6331764299124,40.6331598255436,40.6331483123549,40.633133521613,40.6331212463552,40.633110254131,40.6330953893453,40.6330887364052,40.633079766855,40.6330768717214,40.633079455732,40.6330732285653,40.6330648002932,40.6330584024605,40.6330457981158,40.6330332523461,40.6330113044826,40.6329755145995,40.6329483745999,40.6329154176522,40.6328940189968,40.6328824883632,40.6328709594207,40.6328622118239,40.6328578515239,40.6328502464791,40.632846999543,40.6328443326209,40.6328373762268,40.6328319196407,40.6328224591905,40.6328142942649,40.6328023303655,40.6327829183935,40.6327719382491,40.6327430803081,40.632733251156,40.6327288118186,40.632728350187,40.6327334198845,40.6327365465362,40.6327371021341,40.6327417776202,40.6327522890983,40.6327699508419,40.6327789585626,40.6327791677021,40.632773627807,40.6327609734034,40.6327498516011,40.6327246589965,40.6326964195897,40.6326739708504,40.6326503916053,40.63262445366,40.6326094878846,40.6325959421019,40.6325850286713,40.6325867673273,40.6325775734532,40.6325696573041,40.6325606768429,40.632555265945,40.6325565242054,40.6325492818677,40.6325568268614,40.6325550216475,40.6325388416076,40.6325328093333,40.6325324226433,40.6325242695504,40.6325123981702,40.6325083295384,40.6325015012038,40.632490747069,40.632487040245,40.632485091713,40.6324806245981,40.6324784366232,40.6324793318072,40.6324736965597,40.6324664504915,40.6324550885806,40.6324441123489,40.6324327390778,40.6324204538517,40.6324120752608,40.6324093318687,40.6324166679657,40.6324209106141,40.632421884273,40.6324128829898,40.6324025769093,40.6323905280503,40.6323761961397,40.6323640387914,40.6323507471282,40.6323413642958,40.6323325527327,40.6322913836893,40.6322643359446,40.6322623905083,40.6322564037188,40.6322500045858,40.632232708885,40.6322199147748,40.6322073105307,40.6321986762534,40.6321891139192,40.6321913655555,40.6321965186929,40.6321889846164,40.6321805783999,40.6321771647794,40.632170477632,40.6321614350448,40.6321598696127,40.63215346918,40.6321433837156,40.6321311886783,40.6321206590953,40.6321077606309,40.6320864786679,40.6320686709004,40.6320494937351,40.632014267968,40.6319858870076,40.6319491938655,40.6319256258387,40.6319076943225,40.6318777736639,40.6318651382173,40.6318542244517,40.6318384111393,40.6318238110491,40.6318192661207,40.6318143961413,40.6318180918101,40.6318166675389,40.6318086874758,40.6317989671562,40.6317869808879,40.6317805971857,40.63177848231,40.6317762134105,40.6317684899829,40.6317520881468,40.6317295712254,40.6317071523899,40.6316917691535,40.6316771368253,40.6316424350618,40.6316153936223,40.6315763389841,40.631550570038,40.6315441086097,40.6315378810786,40.6315326546277,40.6315297000245,40.6315288206918,40.6315186971928,40.6314969901663,40.6314892963799,40.6314694608957,40.6314451482229,40.6314261277217,40.6314056262465,40.6313928119158,40.6313876549102,40.6313828988392,40.6313742943171,40.6313594538979,40.63134708962,40.6313310561035,40.6313126276107,40.6312863368172,40.6312407406692,40.6311925714716,40.6311693089911,40.63115255733,40.6311397755418,40.6311272480966,40.6311138260564,40.6311021953398,40.6310793320179,40.6310382084487,40.6309863492032,40.6309758964245,40.6309743770758,40.630986195506,40.6309935047042,40.630995699061,40.6309918065262,40.6309837470639,40.6309715715569,40.6309428494485,40.6309270694497,40.6309102370909,40.6308983894726,40.6308777335543,40.6308569492558,40.6308440291103,40.6308257338061,40.6308172369152,40.6307936718364,40.6307799384418,40.6307635757744,40.6307435835198,40.6307239165197,40.6307011582822,40.6306747181646,40.6306633171896,40.6306585840236,40.6306613294494,40.6306705976092,40.6306747243344,40.6306708908956,40.6306711204207,40.6306733962755,40.6306726763518,40.6306657479907,40.6306505839078,40.630638547299,40.6306225132625,40.6306067559492,40.630595385236,40.6305869826623,40.6305767631286,40.6305666059754,40.6305508130547,40.6305362347091,40.6305244470341,40.6305134446279,40.6305113730002,40.6305149365125,40.6305187145455,40.6305255432044,40.630523348212,40.6305115070769,40.6304976218088,40.6304851519631,40.6304875200183,40.6304756847585,40.6304659773611,40.6304490074232,40.6304421041097,40.6304465811461,40.6304420309822,40.6304337423121,40.6304107062354,40.6303828031972,40.6303579079477,40.630345122969,40.6303408233181,40.6303427216344,40.6303414100292,40.6303294433933,40.6303226909431,40.6302914854452,40.6302676577456,40.6302514108848,40.6302516679855,40.6302601593393,40.6302690277091,40.6302775191381,40.6302731603951,40.6302594329565,40.6302500696592,40.6302311480727,40.6301825286689,40.6301628224432,40.6301491532381,40.6301315295626,40.630096084595,40.6300623980626,40.6300336571494,40.6299984678722,40.6299675184253,40.629936063103,40.62989810431,40.6298610554032,40.6298339107893,40.6297979896308,40.629760499761,40.6297105688096,40.629658898502,40.6296538067345,40.6296478566197,40.6296471221521,40.6296766851354,40.6296779456547,40.6296788347354,40.6296793453969,40.6296794334305,40.6296742000705,40.6296720866664,40.6296693649535,40.6296660519052,40.6296621678277,40.6296577332135,40.629652779614,40.6296290613654,40.6296085209071,40.6296024265993,40.6295970328537,40.6295923651529,40.6295891488295,40.6295868543703,40.6295855096562,40.6295842011622,40.6295835730554,40.6295836322152,40.6295843764791,40.6295858028492,40.629585110357,40.629585298277,40.6295863677901,40.6295868554315,40.6295866618343,40.6295840751379,40.629580917683,40.6295771990872,40.6295751110131,40.6295724709665,40.6295693209821,40.6295670290375,40.6295644140526,40.6295615882905,40.6295586726341,40.6295557920336,40.6295200347187,40.6295170731554,40.6295141121705,40.6295113361397,40.6295088441196,40.6295067364489,40.6295050892976,40.6295039655694,40.6295034048492,40.6294942047741,40.62948562809,40.6294681395432,40.6294612818236,40.6294550119641,40.6294493508105,40.6294390363727,40.629423431766,40.6294052253457,40.6293892153652,40.6293828059211,40.6293756349128,40.6293677164953,40.629359065152,40.6293457154248,40.6293328625502,40.6293205070052,40.6293086818719,40.6292973605526,40.6292933201889,40.6292886817344,40.6292834640245,40.6292776822245,40.6292713565122,40.6292489680824,40.6292462210779,40.6292440223444,40.629242415549,40.6292414349725,40.6292410993034,40.629241413478,40.6292423450529,40.6292425614281,40.6292420619139,40.6292408513477,40.6292389375885,40.6292350357512,40.6292314987709,40.6292283854722,40.6292257531638,40.6292236447204,40.6292220974763,40.629221136357,40.6292207820924,40.6292229396404,40.6292257451945,40.6292291568288,40.6292331193938,40.6292375719093,40.6292424462011,40.6292491572879,40.6292553262825,40.6292609162128,40.629265891929,40.6292702214743,40.6292738772286,40.6293036775051,40.6293104770667,40.629317924579,40.6293259966651,40.6293346680974,40.6293561977438,40.6293770515592,40.6293972179301,40.6294042520641,40.6294107528943,40.6294167082952,40.6294221048074,40.6294240289986,40.6294252486006,40.6294257542301,40.629425543039,40.629424616362,40.6294229800549,40.6294199098514,40.6294162986719,40.6294121825771,40.6294075969424,40.6294025847197,40.6293971923771,40.6293914692357,40.6293854673286,40.6293806956094,40.6293757431932,40.6293706871,40.6293656013482,40.6293605665271,40.6293556563807,40.6293509471853,40.6293465077087,40.6293424082431,40.6293363351009,40.6293306433736,40.6293253661518,40.6293205335127,40.6293161765401,40.6293123192899,40.6293089866688,40.6293061952007,40.6293023925871,40.6292979506385,40.6292928909275,40.6292872415426,40.6292810312476,40.6292545716585,40.6292478357641,40.6292415707021,40.6292357971678,40.6292302164364,40.6292252502686,40.6292209363421,40.6292173120057,40.6292144038967,40.6292107999414,40.6292064719335,40.6292014582588,40.6291958059895,40.6291932429942,40.6291903094918,40.6291870920875,40.6291836773235,40.6291801637804,40.6291766518279,40.6291732391149,40.6291680854002,40.6291632490448,40.6291587757056,40.6291546991229,40.6291510540451,40.6291478718595,40.6291451807536,40.6291404628243,40.6291348920435,40.6291284877034,40.6291037550778,40.6290906348501,40.6290781255901,40.6290662386417,40.6290549861806,40.6290443762132,40.6290344158752,40.6290275952466,40.6290202272073,40.6290123189214,40.6290038773865,40.6289949120963,40.6289854298842,40.6289754419266,40.6289649562364,40.6289476730158,40.6289299118932,40.6289116778709,40.6288522823997,40.6288188481457,40.6287813264486,40.6287423542981,40.6287211392633,40.6286903224611,40.6286623871936,40.6286449624428,40.628626937935,40.6286112342431,40.6285978604807,40.6285900020108,40.6285554053571,40.6285312826883,40.6284905634445,40.6283501340626,40.6282905187334,40.6282503759013,40.6282052932249,40.6280008605072,40.6279838953268,40.6279666344723,40.6279490918292,40.6279312848031,40.6279132255988,40.6278949299455,40.6278764139112,40.6278576939037,40.6278387841322,40.6278196993363,40.6276652577916,40.6276571698563,40.6276488570662,40.6276403614345,40.6276317236406,40.6276229877244,40.6276141973915,40.6276053950212,40.6275966233443,40.6275910785831,40.6275856493433,40.6275803912031,40.6275753501757,40.6275705778071,40.6275661189136,40.6275620136162,40.6275583045356,40.6275550250747,40.6275526702609,40.6275496289239,40.6275459063432,40.6275415081387,40.6275364467958,40.627527789558,40.6275188264259,40.627509596378,40.6275001506356,40.6274905350623,40.6274807978785,40.627470989829,40.6274492978811,40.6274275503224,40.6274057734601,40.6273839930985,40.6273622357017,40.6273545567916,40.6273468663186,40.6273392126938,40.6273316516983,40.6273242330501,40.6273170048028,40.6273100156638,40.6273033136438,40.6272969407404,40.627290942432,40.6272853570046,40.6272802235638,40.6272673927183,40.627254244604,40.6272408110355,40.6272271187692,40.6272132002792,40.6271990845254,40.6271399910404,40.627081046237,40.6270222504429,40.6269488828615,40.6268758127866,40.6268030452268,40.6267305833566,40.6266584355476,40.6266321375363,40.626606041945,40.626580167021,40.6265545186156,40.626529099532,40.6265039372601,40.6264790410003,40.62645442346,40.6261906164428,40.6261133439757,40.62601239885,40.6259961722294,40.6259585893464,40.6259406549429,40.6259252916074,40.6259184644183,40.6259116394932,40.6258269545819,40.6257265866857,40.6254630702849,40.6254494295508,40.6254349379365,40.6253829625118,40.6253608019398,40.6253480124878,40.6253352185166,40.6253232713224,40.6253104683126,40.6252839955964,40.6252361679889,40.6252165235557,40.6251558917631,40.6251379647372,40.6251226003023,40.625097005575,40.6250697141896,40.6250449843061,40.6249887131368,40.6249614275036,40.6249409611229,40.6248966280864,40.6248796791651,40.6248012362578,40.6247327184122,40.6246628280231,40.6245853218365,40.6245736763879,40.6245619774949,40.6245502516316,40.6245385277851,40.6244929298084,40.624449197304,40.624408087398,40.6243703118107,40.6243656794742,40.6243594930419,40.6243519072209,40.6243431117134,40.6243333264728,40.6243227962033,40.6243117842399,40.6243005659637,40.6242894219148,40.6242227025685,40.6242137717791,40.6242045785968,40.6241953436248,40.6241862884688,40.6241776304199,40.6241695772396,40.6241623221748,40.6241560393207,40.6241430883466,40.6241291323239,40.6241144948179,40.6240995151937,40.6240845407481,40.6240699186574,40.6240559879287,40.6240416952611,40.6240266704516,40.6240113524703,40.6239961888526,40.6239816226236,40.6239680793547,40.6239559547299,40.6239522063861,40.6239481041969,40.6239437599388,40.6239392919845,40.6239348220769,40.6239304720121,40.6239263603208,40.6239225990384,40.6238199884749,40.6238083543583,40.623796296545,40.6237841711913,40.6237723364487,40.6237611418844,40.6237509181563,40.6235886922432,40.6234790348402,40.6234313884199,40.6233733700765,40.6233133540856,40.6232518124522,40.623189229179,40.623187209269,40.6231711032105,40.6231549917372,40.6231388999805,40.6231228505541,40.6231068657284,40.6230862288893,40.6230657319693,40.6230453935602,40.6230252285542,40.6230052533588,40.6229854843774,40.6229659380081,40.6229261428867,40.62288624763,40.6228462596081,40.6228061856868,40.6227660350774,40.6227489399884,40.6227319646232,40.6227151263838,40.6226984490539,40.6226819537201,40.6226656592979,40.6226495903896,40.6226337650707,40.6226182047555,40.6226029296948,40.6225879579517,40.6225767826728,40.6225658766737,40.6225552690681,40.6225449805916,40.6225350364944,40.6225254603616,40.6225162719035,40.6225074957031,40.6224991482916,40.6224912525579,40.6224838238646,40.6224768819151,40.6224704398835,40.6223002077866,40.6222766546125,40.6222525535465,40.6222279159537,40.6222027495123,40.622177064588,40.6221508700269,40.6221401551747,40.6221290186777,40.6221174824324,40.6221055601376,40.6220932737039,40.6220806406796,40.6220676813058,40.622054419165,40.622040871823,40.6220270628689,40.6220237640983,40.6220206610331,40.6220178587671,40.6220154484321,40.6220135102397,40.6220121102822,40.6220112938614,40.6220110881618,40.6220114999278,40.62201251412,40.6220141002996,40.6220162037642,40.6220187540775,40.6220866097822,40.6220938736201,40.6221010105356,40.6221079678942,40.6221147010888,40.6221211613097,40.6221273049393,40.6221247901753,40.6221218285061,40.6221184884583,40.6221148472903,40.6221109926823,40.62210701235,40.6221030014248,40.6220990535539,40.62209526009,40.6220752423142,40.6220553300308,40.6220355441745,40.6220159117032,40.6219964515342,40.6219771881092,40.6219581453657,40.6219393420481,40.6219298213822,40.6219203171267,40.6219108709892,40.6219015286955,40.6218923290821,40.6218833133419,40.621874522645,40.6218659941424,40.62185776682,40.6218498769754,40.6218402529882,40.6218300433391,40.6218192647088,40.6218079386511,40.6217960875441,40.621783735462,40.6217766825521,40.6217693185502,40.6217616889696,40.6217538409998,40.6217458226838,40.6217376854215,40.6217294792844,40.6217212545245,40.6217130610659,40.6217049525282,40.6216969785227,40.6216628233448,40.6216336998905,40.6216053833513,40.621601102554,40.6215965120877,40.6215916606209,40.6215866045519,40.6215814027967,40.6215761132891,40.6215707976643,40.6215655145592,40.6215603259747,40.6215552914211,40.6215344549976,40.6215156406959,40.6214947539508,40.6214801276063,40.6214592458475,40.6214404747844,40.6214049726708,40.6213773515024,40.6213605272864,40.6215982727276,40.6216823268573,40.6217761075727,40.6218903131415,40.6220424155089,40.6221367633168,40.6222115081451,40.6222679091408,40.6223379638174,40.622403888653,40.6224474836191,40.6225070333453,40.6225714094479,40.6226523060221,40.6227021966959,40.6227555650702,40.6228263431237,40.6229115515827,40.6229497472959,40.62298885348,40.6230041994882,40.6230780792311,40.6231586960858,40.6232031919113,40.6232829979449,40.6233305383729,40.623366901282,40.6233406056121,40.6233237740589,40.6233203123985,40.6233360846393,40.6233285242029,40.6233030233045,40.6232815929735,40.6232556402179,40.6232305341324,40.6232246684094,40.6232440642526,40.6232847780791,40.6232843437313,40.6232976574733,40.6232812644237,40.623284616705,40.6232929729233,40.6233622181966,40.623406511131,40.6234817006502,40.6235850280304,40.6235040813706,40.6234577582481,40.6234389887085,40.6234878803382,40.6234819099907,40.6232721163084,40.6232240788882,40.6232036020507,40.6232533521897,40.6230461052005,40.6229912129031,40.6229391903605,40.6229767243294,40.6229957937951,40.6223083993833,40.621836760093,40.6213440261014,40.6213439091744,40.6213737210489,40.6213985976133,40.6214165154863,40.6213916367068,40.6216082528047,40.621634843872,40.6216527556001,40.6216278811549,40.621845348319,40.6218702250542,40.6218864312239,40.6218615544834,40.6220815894714,40.6221056164927,40.6221243740866,40.6220995016867,40.6223203965996,40.6223444099119,40.622358906552,40.622335740808,40.6225532142679,40.6225780868259,40.6225951449492,40.6225711293339,40.62278945113,40.6228143271634,40.6228305288178,40.6228065124547,40.6230052319845,40.6230953022989,40.6231473260043,40.6230555478412,40.6230734550298,40.623261929019,40.6233267951208,40.623340015193,40.6233596311692,40.6233528522408,40.6232815589851,40.6234964599234,40.623499017983,40.6235015911162,40.6235771044437,40.6235975819621,40.623535819944,40.6235152351454,40.6236057260734,40.6237646064849,40.6244489266691,40.6245709035614,40.6248394629498,40.624994162477,40.6250661943836,40.6250275507182,40.6250592282028,40.625085118327,40.624925596731,40.6249448482535,40.6251131482185,40.625142569371,40.6251613309521,40.6252085910338,40.6252368427773,40.6252591290789,40.6253315021739,40.6257834828402,40.627651724729,40.6273155051215,40.6248427461149,40.6266314707079,40.6281425218704,40.6289543484148,40.6294477106673,40.6301651157201,40.6306341156491,40.6313733204335,40.6317281891817,40.6320949894808,40.6320945241154,40.6320719066688,40.6322297713453,40.632261900729,40.6325765365722,40.6330241902915,40.6334250795629,40.6339472542919,40.6339631571776,40.633984345383,40.6340103089609,40.6340404230322,40.6340739628252,40.6341101211178,40.634148027666,40.6341867701477,40.6342254161204,40.6342630354626,40.6342697792021,40.6342268345031,40.6341864594126,40.6341495463604,40.634116911252,40.6340892754343,40.6340672497521,40.6340513210467,40.6340204537589,40.633995806765,40.6339774255403,40.6339625927879,40.6339434548326,40.6339201065124,40.6338926635301,40.6338730796688,40.6338519239957,40.6338496846093,40.6338487257831,40.6338490721363,40.6338507147758,40.6338536115247,40.6338576880055,40.6338628395495,40.6338689338843,40.6338758145301,40.6338833048178,40.6338912124247,40.6338993343127,40.6339521235888,40.6340029128564,40.6340512360445,40.6340966497111,40.6341032125169,40.6341108776946,40.6341194821974,40.634128842998,40.6341406756728,40.6341529394754,40.6341652662157,40.63417583058,40.6341859149839,40.6342147532706,40.6342407549867,40.6342633500857,40.6342820432051,40.6331019393767,40.6331016234109,40.6321584760959,40.6311962398075,40.6311013074749,40.6310375092612,40.631252179367,40.6313176816303,40.6312244585993,40.6321776965446,40.6331017743508,40.6331020903155,40.6341482196749,40.6343103555108,40.6342326343658,40.634292570112,40.6344013006549,40.6345315590866,40.6346888517636,40.6348570640699,40.6354930207553,40.6355801051739,40.6356399750746,40.63589008828,40.6360097202992,40.636064940587,40.6360822319664,40.6360920971834,40.6360866908474,40.6361735115862,40.6362711834168,40.6363634310634,40.6363862081909,40.6364882327303,40.6365642030472,40.6366022012166,40.6365989595324,40.6365750975797,40.636629366892,40.6367541587269,40.6368133641345,40.6369494940821,40.6371014292607,40.6371014476032,40.6371828480184,40.6373239114381,40.6374053068464,40.6375084120548,40.6376603431482,40.6377091765973,40.6377200402487,40.637736325099,40.6378556804447,40.637931642837,40.6380076137577,40.6380347642779,40.6380402058616,40.6381107522584,40.6382138430422,40.6383060896004,40.6383061038003,40.6383061155962,40.6383061185641,40.6383293540682,40.6384037790722,40.6384200637598,40.6384218411794,40.6384309283659,40.6383712706603,40.6384201097036,40.6387239530665,40.6388921636541,40.6391213814531,40.6391363116193,40.6397602839527,40.640270309687,40.6409052094967,40.6416019831263,40.6415696636522,40.641603699245,40.6416525603746,40.6417257012928,40.6417761846729,40.6421795815075,40.6428149273778,40.6430199824631,40.6433139827165,40.643336537054,40.6434923912559,40.6436968326078,40.643988777716,40.6443035750458,40.6445058073224,40.6445595266027,40.6446909495972,40.6448773174865,40.645087217952,40.6453329947271,40.6454781229252,40.6456300224321,40.6456049105077,40.6456683749205,40.6457856937028,40.6458764311449,40.6459491603232,40.646267664491,40.6465925152186,40.6469535748213,40.6471550343185,40.6473528537995,40.647546844984,40.6477368232336,40.6479226077281,40.6481040216372,40.6482808922892,40.6483651384076,40.6484547192437,40.6485494320048,40.6486490622803,40.6487533845258,40.6488621625744,40.6489751501708,40.6490920915288,40.6492127219099,40.6493367682231,40.6498149799157,40.6501352897398,40.6505863318433,40.6509008229884,40.651406306207,40.6519544232904,40.6524024910937,40.6527861068431,40.6534251983043,40.6541165567159,40.6548506537384,40.6553130155543,40.656025495147,40.6576709767502,40.6591598663989,40.6592301141421,40.6592979894433,40.6593630845114,40.6594250082577,40.6594833886456,40.6595378749258,40.6598701048257,40.6599036822915,40.6599352855983,40.6599821420396,40.6599766192576,40.6600114378434,40.6600211479092,40.6600350867431,40.660069738209,40.6600140335066,40.6600071077537,40.6599586938733,40.6599723830561,40.6600806181441,40.660027970749,40.6600444225478,40.6600636364818,40.6601183665934,40.6601610376039,40.6599821056021,40.6607240868087,40.6607889017741,40.6607778146779,40.6608126307894,40.6608209467054,40.6608460101229,40.6608737261759,40.6608124475496,40.6608041368749,40.6607419190454,40.6610065227671,40.6610370124723,40.6610636700389,40.6610863818368,40.6611050510552,40.6611028440525,40.6610948083136,40.6610810297994,40.661061655903,40.6610368938732,40.6609490324301,40.6609928868627,40.6609929534715,40.6609999098908,40.6609999330574,40.6610277555036,40.6610277265467,40.6610597227771,40.6610483262015,40.6609885162263,40.6609913771061,40.6609367342621,40.6608766109733,40.6608281598643,40.6608000618222,40.6607763743197,40.6607571724308,40.6607425170128,40.6607324545138,40.6607152543344,40.6607845824676,40.6607888198226,40.6608277787887,40.6608263644499,40.6608444502351,40.6608358165486,40.6607746243112,40.6607760890159,40.6607115742052,40.6606635857825,40.6606440659651,40.6606211755823,40.660594956353,40.6605152147618,40.6605791087256,40.6605833318737,40.6606208903848,40.6606194675287,40.6606500715558,40.6606345976391,40.6605706288359,40.6605706700597,40.6605066736532,40.6604198914205,40.6603695356803,40.6603509987519,40.6603473877674,40.6603104019507,40.6602319166585,40.6601940385564,40.6601570498984,40.6601600554948,40.6602031101359,40.6602060603484,40.6602063693609,40.6601921483329,40.6602179803782,40.6602315533773,40.6602262378414,40.6602542107736,40.6603071820085,40.6603744387353,40.6605446395667,40.6606280738625,40.6606298839367,40.6606327837653,40.6606402696738,40.6606507357184,40.660663923532,40.6606795075575,40.6606971030839,40.6607162757437,40.6607365522353,40.6607671422985,40.6608031025393,40.6608815089119,40.6608916517006,40.661009827084,40.6610021795534,40.6610125902673,40.661259193393,40.6612498516923,40.6612524749873,40.6612671470027,40.6614151792102,40.6614552514281,40.6614885868919,40.6615658605533,40.6616346928163,40.6616880860571,40.6617346536703,40.6617493884688,40.6617583015416,40.6617860972186,40.6617932629934,40.6617821643113,40.6617787763439,40.6617849139294,40.661804789683,40.661835200512,40.6618605168077,40.6618919091728,40.6619102978925,40.6619034754443,40.6619027354043,40.6619104935887,40.6619182958845,40.6619411392818,40.661952640695,40.661962310146,40.6619574257206,40.6619707592399,40.6619925092786,40.6620271956875,40.6620488976801,40.6620513995892,40.6621051253082,40.6621327769287,40.6620483462058,40.66205038747,40.6620717624722,40.6620541515832,40.6620113512369,40.6619267841141,40.6616735139504,40.6615865175566,40.66153688252,40.661528083743,40.6615195287148,40.6615114237186,40.661503964186,40.6614788228628,40.6614713202723,40.6610474332093,40.661032913706,40.6609956952824,40.6609621552984,40.6609550787743,40.6609501824102,40.6609475574506,40.6609472528116,40.6609133026505,40.660885359099,40.6608637376759,40.660826735688,40.6607840563775,40.6607358768912,40.6606823972052,40.6606148590322,40.6605165345602,40.6605018031281,40.6604851458954,40.6604416238689,40.6603918394742,40.6603360757338,40.6602746496621,40.6602079104624,40.6601362375418,40.6600600383541,40.6585936599787,40.6585396488557,40.6584841469124,40.6584275795891,40.6583703804913,40.6583129880663,40.6582857894259,40.6581612022494,40.6580960441809,40.6580320058656,40.6579693984568,40.6579085261542,40.6578794260588,40.6578477856948,40.6578141486184,40.6577790926866,40.6577503396416,40.6577625545025,40.6577556701643,40.6576959540202,40.6577041801388,40.6577218236905,40.6577465116385,40.6576850024424,40.6576225778779,40.6575596335026,40.6574965681667,40.6574816048655,40.6574668382669,40.6574526792461,40.6573858781598,40.6573208276366,40.6572581754573,40.6571985455178,40.6558996665954,40.6556667899813,40.6554415323746,40.6551580171516,40.6540232305874,40.6538920722103,40.6534701338616,40.6531730139942,40.6528637416416,40.65264311633,40.6521901032793,40.6518826256612,40.6515442216793,40.6511174790883,40.6504762958912,40.6502582317498,40.6500402422514,40.6497740006296,40.6494640003157,40.6491830000549,40.6491570004279,40.6480934460047,40.6480681164795,40.6480461873345,40.6480282549599,40.6480148070488,40.648006209333,40.6480026956378,40.6480043615221,40.6480111616803,40.6483056280203,40.6483438678202,40.6483812184878,40.6484485568015,40.6484946054715,40.6485384339952,40.6485798671092,40.6486398636551,40.6487039190168,40.6487716498568,40.6488187307825,40.6488667201395,40.6489025238921,40.648940604216,40.6489798818837,40.6490192437324,40.6490575742116,40.6490937869987,40.649112446798,40.6491309800448,40.6491488523346,40.6491655483212,40.6491805865766,40.6491935334731,40.6492040156873,40.6492291825197,40.6492500739272,40.649266156718,40.6492770204261,40.6492823877869,40.6493280689789,40.6494831491803,40.6494901388,40.6494342760847,40.6494256030301,40.6494179322498,40.6494113952256,40.6494061040062,40.6493901027105,40.6493789658552,40.6493729786742,40.6493722945092,40.6493769308829,40.64940123082,40.6494315005916,40.6494671176811,40.6495073495999,40.6495513689513,40.6496653761587,40.6496607816286,40.6495608116854,40.6495308536065,40.6495055072255,40.6494855411738,40.6494715609232,40.6494639904253,40.6494630592556,40.6494687956518,40.649475601099,40.649486068816,40.6494999382052,40.6495168639828,40.649536424775,40.6495581336076,40.6495814500299,40.6496057935685,40.6496305581793,40.6496531639198,40.6496790140424,40.649707394218,40.6497375202025,40.6497685595077,40.6500187495245,40.6500331831252,40.6500471132302,40.6500601206141,40.6500718138204,40.6500818409426,40.6500828672442,40.6500804756161,40.6500747358032,40.6500658151904,40.6500539739214,40.6500395573118,40.6500229857797,40.6499768871022,40.6499327111868,40.6498908902537,40.6498635510563,40.6498364868969,40.649810110473,40.6498022985059,40.6497922775462,40.6497803088739,40.6497667045522,40.6497518192908,40.6497360411976,40.6497197816593,40.6497034646152,40.6496875155035,40.6496723501691,40.6496583640209,40.6496445020488,40.6496290768896,40.6496125121541,40.6495952627484,40.6495778023809,40.6495606105531,40.6495441593913,40.6495269357089,40.6495102979261,40.649494737784,40.6494807151729,40.6494686445399,40.6494588826401,40.6494517179924,40.6494515458776,40.649448407758,40.6494423825059,40.6494336215573,40.6494223451062,40.6493794494994,40.6493347353188,40.6492891625772,40.6492437097182,40.6491993526102,40.6491570435936,40.6491201897203,40.6490831562612,40.6490466571306,40.6490113959411,40.64897805244,40.6489472694053,40.6486469742684,40.6483610275945,40.6483243486166,40.6495788193193,40.6503497089878,40.6508598991299,40.6513256864725,40.6518121627128,40.6523071193095,40.6527954782837,40.6532882664842,40.6537480361906,40.6542403617249,40.6552677027036,40.6560335334255,40.6571969730161,40.6588986567465,40.6596656686856,40.6598940088322,40.6604019915322,40.662056223738,40.6636539306296,40.6649682133149,40.6650328189424,40.6648386056275,40.6638245399743,40.6633884715681,40.6635192590202,40.6635538781358,40.6629560162509,40.6624726687372,40.6625141022415,40.6625699265681,40.6626400787067,40.6627244361327,40.6628228379933,40.662934535878,40.6631774741035,40.6630788107267,40.6629710683587,40.6628555502745,40.6627337587977,40.662607339599,40.6614554959732,40.661422765164,40.6613895750706,40.6613563170601,40.6613233843268,40.6612952368116,40.6612716636874,40.6612532423004,40.6612404238217,40.6612335221973,40.6612327064594,40.6612379965869,40.6612407446942,40.6612363678822,40.6612249613081,40.6608756638831,40.6606423144498,40.6605515147998,40.6604483248614,40.6606729546503,40.6638525847162,40.6648281914004,40.665074269679,40.6651207333671,40.6651601842742,40.6652166107817,40.665249953464,40.6652480253324,40.6652489173924,40.6652504410463,40.6652760575563,40.6652592619759]}]],[[{"lng":[-73.9180460695848,-73.9179989063342,-73.9179154841195,-73.9178920031827,-73.9178493747616,-73.9178353117744,-73.9177842681265,-73.9177654758854,-73.9177010938695,-73.9176643517633,-73.9176563872246,-73.9176477650869,-73.91763742515,-73.9176263055923,-73.917557632914,-73.9174129427007,-73.9172663265664,-73.9171213852814,-73.916976328249,-73.9168301141706,-73.9167620744217,-73.9166863837081,-73.916539986558,-73.916393000754,-73.9163011986149,-73.9163549218404,-73.9164574753002,-73.9164648603233,-73.9173958691575,-73.9183055032112,-73.9192356231401,-73.9201223330722,-73.9209453994001,-73.9218236101579,-73.9226854032338,-73.9228218505646,-73.9237887342265,-73.9247828359688,-73.9250569711535,-73.9251205069533,-73.9266041949648,-73.9270268374548,-73.9271490150459,-73.9275399130746,-73.927722291609,-73.9278423987194,-73.9282261392396,-73.9299300776955,-73.9300709182586,-73.9303176269034,-73.931058761596,-73.9311558184399,-73.9326755251739,-73.9327806834982,-73.9330808422055,-73.9358583708006,-73.9360224075648,-73.9361031306121,-73.9369658361889,-73.9371448242304,-73.9379107701372,-73.9386249249757,-73.9398351826436,-73.9405720421218,-73.9413766379648,-73.9417385886041,-73.9418326671478,-73.9431895075241,-73.9441512012041,-73.9469189146633,-73.9473433076129,-73.9477679288616,-73.9481927600092,-73.948617780266,-73.9486972516062,-73.9496756738763,-73.9520634525867,-73.9529867271405,-73.9541276615553,-73.9543316200652,-73.9552936159939,-73.955958623714,-73.9582921680775,-73.9582693030691,-73.9582457036948,-73.9583957158244,-73.9585856668255,-73.9588406201994,-73.9589832794176,-73.9591320677473,-73.9592759867973,-73.9592995959325,-73.9594225933236,-73.9595677012137,-73.9597137475643,-73.959859394257,-73.9600051980264,-73.9600971456535,-73.9601467801997,-73.9601725613865,-73.9601869192427,-73.960223045397,-73.9602374033646,-73.9602928166811,-73.960738582953,-73.9610926416812,-73.9615855611724,-73.9617499483519,-73.9619407043687,-73.9618983782424,-73.9610510070001,-73.9601968885747,-73.9588587462741,-73.9579593822098,-73.9570199312341,-73.9560745618457,-73.9551837082092,-73.9542905331819,-73.9533700073659,-73.9525480011187,-73.9519516224498,-73.9517725790113,-73.9515373886443,-73.9513727858213,-73.9510111210262,-73.9500909464941,-73.9497937934865,-73.9481322539088,-73.9472480870593,-73.9471276214676,-73.9463155753173,-73.9446176611153,-73.9443878859653,-73.9437235275685,-73.9419307881624,-73.9411491721417,-73.9404630853598,-73.9404199145092,-73.9396899520913,-73.9389015280868,-73.9385685484866,-73.9381771855279,-73.9377735456835,-73.9373906476545,-73.9367597902675,-73.9363876262512,-73.9360067922188,-73.9352226443668,-73.9347969968416,-73.9346889265965,-73.9346067511236,-73.9345799944256,-73.9344878475898,-73.9341339729401,-73.9338281715593,-73.9331186279311,-73.9323660567559,-73.9319288999603,-73.9317740462147,-73.9314718454511,-73.931211998206,-73.9311451648234,-73.9305114666293,-73.9297019240275,-73.9288289782543,-73.9288283423497,-73.9286426904778,-73.9285065967179,-73.9280433068713,-73.9278112067199,-73.9275068527093,-73.927070693955,-73.926449920673,-73.9263161253153,-73.9255606405626,-73.9253490361324,-73.9243918330361,-73.9242921326796,-73.9236437983556,-73.923169667107,-73.9228070235952,-73.9220713379702,-73.9213058780854,-73.9212136988418,-73.9209610386625,-73.9205501314324,-73.9198096194062,-73.9190610922491,-73.9187832329374,-73.9182934576662,-73.9180460695848],"lat":[40.687213247771,40.6869657796104,40.6865659363019,40.6864491591785,40.6862331679145,40.6861636696005,40.6859114121165,40.6858185408124,40.6855003586647,40.6853125866859,40.6852718836681,40.6852278227578,40.6851749763059,40.6851181493407,40.6847671919212,40.6840340515225,40.6833032245533,40.6825684716866,40.681834159418,40.6811009812295,40.6807555999409,40.6803713787895,40.6796374973525,40.678905848881,40.6785771124341,40.6778235366874,40.6767260282328,40.6766470400465,40.6766935840179,40.6767531813271,40.6768132004563,40.676856899742,40.6768878336249,40.676938358473,40.676984280015,40.6769915503554,40.6770460726329,40.6771011446901,40.6771162276846,40.6771197269922,40.6772013782941,40.6772233582208,40.6772297124079,40.6772500493469,40.6772603038453,40.6772670523661,40.6772886878607,40.6773900020347,40.6773983719681,40.6774130382625,40.6774533415934,40.6774586230558,40.6775412435403,40.6775469609287,40.6775632812163,40.6777146016177,40.6777235804611,40.6777280021484,40.6777752500837,40.6777850557325,40.6778251934446,40.6778625695826,40.6779239034292,40.6779701955117,40.6780082308145,40.6780279745302,40.6780331010679,40.6781070809375,40.6781563587821,40.6783205817603,40.6783472717036,40.6783717684003,40.6783940706042,40.6784141778994,40.6784171310243,40.6784566816829,40.6785863307184,40.6787219954922,40.6789579768564,40.6790008660091,40.679203151044,40.679346246648,40.6798311339974,40.6799068951275,40.6799851049055,40.6807977922576,40.6817424827147,40.6830180530165,40.6837499156536,40.6844851487008,40.6852167050472,40.6853348451315,40.6859503064327,40.6866825554247,40.6874156345935,40.6881474512173,40.6888810337183,40.6893452100975,40.6896087768417,40.6897298620638,40.6898034564914,40.6899886278864,40.6900622223053,40.6903462499155,40.6924239053023,40.6940105041868,40.6962074884059,40.6968461689056,40.6979116822372,40.6981883325315,40.6983260788191,40.6984627274387,40.6986773264163,40.6988200032159,40.6989739143496,40.6990900019673,40.6991929024127,40.6992953542764,40.6994045406529,40.6994947771409,40.6995628810171,40.6995847944241,40.6996135788452,40.699633724601,40.6996779853941,40.6997905932375,40.6998233144236,40.7000062728164,40.7001049092465,40.7001228108842,40.7002149527619,40.7004053004199,40.70042452328,40.7005058357302,40.7007252341929,40.7002811274921,40.6998978895406,40.6998737747676,40.6994557914414,40.6990369704857,40.6988481360524,40.698640223292,40.6984046930499,40.6981857953999,40.6978311888305,40.6976153015073,40.6974053962503,40.6969865451318,40.6967365923545,40.6966749543876,40.6966280858393,40.6966128244709,40.6965602684784,40.6963584314036,40.6961842773079,40.695791153846,40.6953583772966,40.6951146575311,40.6950282153467,40.6948609024252,40.6947127697819,40.6946739753662,40.694316523049,40.6938633976118,40.6933504740712,40.6933500992541,40.6932410125515,40.6931657263592,40.69290417237,40.6927742086536,40.6926038114563,40.6923462235934,40.6920017688283,40.6919284539681,40.6914908400026,40.691366941838,40.690831749277,40.6907733573566,40.6903988375817,40.6901234059908,40.6899239253446,40.6894898413008,40.6890716435979,40.689019477115,40.6888720518375,40.6886409221165,40.688211241412,40.6877843687593,40.6876260884438,40.6873566678148,40.687213247771]}]],[[{"lng":[-73.8016826655336,-73.8016677669121,-73.8015556533534,-73.8015305266934,-73.8014539825105,-73.801418975859,-73.8013428673729,-73.8012616037584,-73.8012340123843,-73.8012155284598,-73.8011995636295,-73.8011790910815,-73.8011600086592,-73.8011323614825,-73.801134301319,-73.8011369726162,-73.8011423813821,-73.8011553859723,-73.8011593493157,-73.8011723425091,-73.8011946161513,-73.8013016646212,-73.8014021065074,-73.8015645058313,-73.8015871663702,-73.8016819475972,-73.8020252177967,-73.8023890644017,-73.8026776954252,-73.8030752042896,-73.803230276536,-73.8041022658922,-73.8042828823602,-73.8046451703019,-73.8049297631947,-73.8052268279005,-73.8055181112092,-73.8057684019137,-73.8060620273092,-73.8066060873639,-73.8068607274562,-73.8070906333245,-73.8073362180269,-73.8078746961921,-73.8080734242231,-73.8085765517067,-73.8087435850634,-73.8089241714599,-73.8091446130441,-73.8091842520063,-73.8095478746414,-73.8097232667476,-73.8099560125052,-73.8102442617866,-73.8106329831089,-73.810754331847,-73.8110215873342,-73.8113979127617,-73.8117266323241,-73.811769901511,-73.8120295219687,-73.8120913555942,-73.8122418859606,-73.8124520793489,-73.8129980176373,-73.8131538158261,-73.8133890045906,-73.8136185078703,-73.8136563428962,-73.8136941977681,-73.8140705039223,-73.8141519173061,-73.8143092274701,-73.8144154871931,-73.8146694585273,-73.8149234326723,-73.8150331183611,-73.8151394016928,-73.8153719073105,-73.8154072811482,-73.8154625225467,-73.8155177755766,-73.815937029704,-73.8161385390022,-73.8163782449298,-73.8165897680259,-73.8166996124735,-73.8169667032834,-73.8170973875645,-73.8170276805223,-73.8164004666224,-73.8152427268333,-73.8144393186543,-73.8127805953004,-73.8119043619029,-73.8105887763747,-73.8096898533,-73.8090007105035,-73.808493330562,-73.8065887271708,-73.8044998746597,-73.8027872140162,-73.8018572811557,-73.8010769978964,-73.8002218519338,-73.7993042528534,-73.7989815214528,-73.7981839240753,-73.7977681013414,-73.7973140076359,-73.7963941803778,-73.7956166896186,-73.7947305235293,-73.7938960996078,-73.7930380005235,-73.7920285465067,-73.791014107118,-73.7902154424165,-73.789414121248,-73.7892833506777,-73.7891487964828,-73.7890120958796,-73.7889919307763,-73.7889652459335,-73.7889324378942,-73.7888939941984,-73.7888504861384,-73.7888025602804,-73.7887509288497,-73.7886963591255,-73.7886396620548,-73.7885816801997,-73.7885162535478,-73.7885161549744,-73.7885160889831,-73.7884655771322,-73.7884654550029,-73.7884653920933,-73.7884341342647,-73.7884340590822,-73.7884340315063,-73.7884241075716,-73.7884240885826,-73.7884241033583,-73.7884348118371,-73.7878467841393,-73.7874204069056,-73.7869959870821,-73.7865752862753,-73.7861600592495,-73.7857519848191,-73.7853527219895,-73.7844614449883,-73.7835607566972,-73.7826254745131,-73.7824704324181,-73.7823665003101,-73.7822712657047,-73.781782739708,-73.7805889280166,-73.7804203408727,-73.7799800524784,-73.7797255363961,-73.7795716474232,-73.7788695743189,-73.7780011969972,-73.7773063386292,-73.7771234697216,-73.7761862829399,-73.7757145837483,-73.7752992789752,-73.7744423816123,-73.773571351684,-73.772758592226,-73.7719212200709,-73.7711041071752,-73.7700798474793,-73.7692253578001,-73.7691391403288,-73.7690621074324,-73.7687043494028,-73.7681799066304,-73.7673322808688,-73.7666409517763,-73.765397945285,-73.7644695172354,-73.7636077413815,-73.7627661541315,-73.7624033376401,-73.7619699488974,-73.7611382719,-73.7603062312181,-73.7595009415023,-73.7594414294101,-73.7591950051836,-73.7591282421315,-73.7583272860686,-73.7572567144309,-73.7558887802178,-73.7547007835067,-73.754353618376,-73.754075409734,-73.7540478395502,-73.7540102453054,-73.7537083455682,-73.7536066185572,-73.7535751213263,-73.7531839938608,-73.7524596548407,-73.7523096398835,-73.7518426986276,-73.7513982866851,-73.7513702073877,-73.7512124697011,-73.7507743583769,-73.7504705818291,-73.7501552293658,-73.7498552299581,-73.749556079175,-73.7492501392002,-73.7489509461727,-73.7486428636018,-73.7483288087051,-73.7480407369862,-73.7477301211579,-73.7474186795521,-73.7471243688162,-73.7468190925791,-73.7464936723342,-73.7461815788437,-73.7460220095442,-73.7457314650401,-73.7453309842404,-73.7448792323999,-73.7448461056506,-73.7448795153754,-73.7451048500096,-73.7459533209743,-73.7462434557995,-73.7472861763531,-73.7475517543229,-73.7485699309448,-73.7488460144439,-73.7494454676422,-73.7500899113111,-73.7502561578794,-73.750557614059,-73.7510302062257,-73.7512579347298,-73.7515421552228,-73.7518040921566,-73.7522582861939,-73.7524705986931,-73.7526829098727,-73.7532105785222,-73.7532381712931,-73.7532868997966,-73.7534560422091,-73.7537259608402,-73.7539939508953,-73.7541785694589,-73.7548490967056,-73.7552345780572,-73.7554939240218,-73.7556223647356,-73.7556364696883,-73.7557616922747,-73.75581771087,-73.7560622901594,-73.7561823385891,-73.7563623925967,-73.7564638829438,-73.7564837456172,-73.7564612722833,-73.7564247873451,-73.7564062123614,-73.7564373429195,-73.7566845473024,-73.7567160246846,-73.7569953336142,-73.757316927804,-73.7576312961815,-73.7579189293433,-73.7579564366485,-73.7580419575247,-73.7590282767345,-73.759971165375,-73.7616801228422,-73.761966576912,-73.7625834337871,-73.7628615716047,-73.7634780225603,-73.764403391469,-73.7654426628721,-73.7662096331377,-73.7669902341904,-73.7701748198214,-73.7710884528857,-73.7715329052512,-73.7718800034976,-73.7722939722367,-73.7734358668527,-73.7744510767558,-73.7752069524185,-73.7752740919794,-73.7761539799492,-73.7769771393288,-73.7776921443559,-73.7784156101092,-73.7789686627138,-73.7792131093037,-73.7796624332781,-73.7803166723924,-73.7816168987204,-73.7824122428447,-73.7836648051584,-73.7844108856223,-73.7850689960425,-73.7859075824703,-73.7863041589221,-73.7868787584367,-73.7869186855416,-73.7875280945621,-73.7881416092969,-73.7894808966139,-73.7900299374484,-73.7930598086958,-73.7938312466941,-73.7949477091976,-73.7952869811172,-73.7958739653934,-73.7963786015381,-73.7969869082699,-73.7975311711846,-73.7981196214381,-73.7986684478486,-73.7993087296479,-73.7998270573683,-73.8000083910058,-73.8002640083731,-73.8015284675928,-73.8016057923137,-73.8016826655336],"lat":[40.6663223525709,40.6663729626695,40.6667533644458,40.6668371594929,40.6671756734129,40.6673542161349,40.6677737973427,40.6683901898973,40.6686422375113,40.6688428294487,40.6689388249048,40.669100265712,40.6698004209725,40.6705486676171,40.6712944621285,40.6713585293883,40.6714879425965,40.6717991208439,40.6718938897181,40.6722050322449,40.6724224646056,40.6731215222321,40.6735613198798,40.6740479485806,40.6741158501574,40.6743838489599,40.6751142732162,40.6758884786801,40.6764979669041,40.6773456012399,40.6776810570058,40.6794245501539,40.679817356731,40.6805798897467,40.6811769746726,40.6817981498802,40.6824082109029,40.6829323912503,40.6835543609624,40.6846811457839,40.6851799577744,40.6856303107838,40.6861254469901,40.6870983377938,40.6874528242586,40.6883308903006,40.6886258845928,40.6889448092041,40.6893310307331,40.6894004794721,40.690037546626,40.6903463441441,40.6907561131604,40.6912635868155,40.6919473825768,40.6921587015632,40.6926228874858,40.6933223136246,40.6939192986157,40.6939939048375,40.6944476309482,40.6945596210236,40.6948322361498,40.6951981245524,40.6961120625901,40.6963693587456,40.6967577542373,40.6971367385317,40.6972010516875,40.6972667958838,40.6978871298107,40.6980399706405,40.6983353320566,40.6985189733626,40.6989707122899,40.6994224400754,40.6996395966719,40.6998500093964,40.7003103108916,40.7003803378794,40.700492864456,40.7006053915253,40.701505117148,40.7019375695571,40.7024519644687,40.7029154363234,40.7031560939081,40.7037412846819,40.7040298015877,40.7040334993715,40.7040833531051,40.7042024395625,40.7044021505635,40.7048739630061,40.7051239401774,40.7054960718278,40.7057462554824,40.7059488744024,40.7060867460048,40.7066339100103,40.7072277910612,40.7077158030576,40.7079798752268,40.708201730875,40.7084458015136,40.7086982316472,40.7088009926084,40.7090243932807,40.7091431883418,40.7092701987566,40.7095315794122,40.7097530791751,40.710012461966,40.7103523293739,40.7107110754255,40.7110693716986,40.7114325850963,40.7117170446768,40.7119975320017,40.7120317286485,40.7120568856387,40.7120727091008,40.7121144183749,40.7121539506849,40.712190718555,40.7122241755897,40.712253824594,40.712279224786,40.7122999988747,40.7123158381413,40.7123265072019,40.712331847506,40.712276502572,40.7122764146066,40.7122763272035,40.7122098570008,40.7122096993006,40.7122095427143,40.7121356658029,40.7121354916037,40.7121353010743,40.7120589211358,40.712058799811,40.7120586532517,40.711984687609,40.7118108331664,40.7118476784602,40.7119016092442,40.7119724932767,40.7120600713426,40.7121639526009,40.7122836170325,40.7124939049805,40.7127107883543,40.7129375484909,40.712976581028,40.7130027431969,40.7130251300728,40.7131399931981,40.7134281756625,40.7134687101548,40.7135745712782,40.7136357700218,40.7136741597362,40.7138492976282,40.7140511241328,40.7142093168187,40.7142619940852,40.714485574205,40.7145984549217,40.7146963140527,40.714905043129,40.7151200953687,40.7153972209501,40.715685044453,40.7159750627523,40.7163272024246,40.716626587994,40.7166567985854,40.7166837679547,40.7168090292281,40.7169952203388,40.7172897968106,40.7176466136631,40.7183560323431,40.7188903928791,40.7192821420548,40.7196387608677,40.7198085814108,40.7200036100347,40.7203291771857,40.7206466438225,40.7210273722768,40.7210634437532,40.7207358075491,40.7206470410294,40.7195820898652,40.7181386016612,40.7162986441314,40.7147100533219,40.7142629751936,40.7139046952291,40.7138775399133,40.7138349013797,40.7133246367383,40.7130711226607,40.7129922961522,40.7120551756148,40.7103165636493,40.7099533868739,40.7088229209535,40.7077487195527,40.7076819076429,40.7073065795755,40.7063218369015,40.7056399305325,40.7049445805243,40.7042776917444,40.7036134515685,40.7029280059931,40.7022655651025,40.7015869393525,40.7008872105622,40.7002394336849,40.6995531363303,40.6988590284427,40.6981980346706,40.6975254521686,40.6967998738387,40.6961219259815,40.6957564370627,40.6950909418837,40.6941960574533,40.6932071819817,40.6931390561153,40.6930930777136,40.6927829348501,40.6916625651026,40.691279444851,40.6897371731037,40.6893473366572,40.6878037382071,40.6874474842651,40.6866720220613,40.6859234463587,40.6856131099465,40.685071682496,40.6842228673682,40.6837341259315,40.6830460426678,40.6824033234907,40.6814914114727,40.6811805143678,40.6808696168608,40.6801542881716,40.6801168860067,40.6800511448316,40.6798229563559,40.6794574278661,40.6790945072142,40.6788444857862,40.6779288383874,40.6772884092449,40.6766296731824,40.6762584734758,40.6762151785818,40.6758859094205,40.67575274273,40.6741968599303,40.6733723831302,40.6724292371103,40.6716840025685,40.6714898663732,40.6710940315838,40.6706335640968,40.6703729149189,40.6696663787421,40.6687585221339,40.6685625268752,40.6677412685644,40.6670403158804,40.6664511566071,40.6660125616196,40.6659554033968,40.6659702256372,40.6660804032886,40.6661842055746,40.6663723248568,40.6664038544264,40.6664717483847,40.6665023599371,40.6665702043647,40.6666720415289,40.6667864028128,40.6668781962599,40.6669716151109,40.6673154637619,40.6673893541188,40.6674053395036,40.6674249481372,40.6674468130344,40.6674599271148,40.6674715765186,40.6674555244903,40.6674540983191,40.6674354051205,40.6673907212974,40.6673519029135,40.6673035219654,40.6672665349925,40.667250182699,40.6672201318224,40.6671763718263,40.6670755227508,40.6670289866888,40.6669242770384,40.6668569048781,40.6667851046506,40.6666936091536,40.666651220509,40.6665898095678,40.6665855418631,40.6665294051331,40.6664785904247,40.6663676516217,40.6663276983717,40.6661932040816,40.6661805771446,40.6661622830918,40.6661577008222,40.6661564200896,40.6661642763963,40.6661711588822,40.666183726289,40.6662021767147,40.6662193926456,40.6662390891618,40.6662562369716,40.6662633605444,40.6662733954771,40.6663167738154,40.6663191854131,40.6663223525709]}]],[[{"lng":[-73.9596468542315,-73.9588338138987,-73.9584811140998,-73.9581729710387,-73.9583330495665,-73.958618792567,-73.9590766907229,-73.959536588682,-73.9600301850322,-73.9605227166957,-73.9607478509035,-73.9609797180793,-73.9614406065574,-73.9618998546095,-73.9623598015067,-73.9628214973773,-73.9629757948463,-73.9630793102664,-73.9632183274493,-73.9637110065635,-73.9638060104351,-73.9641759852132,-73.9646854073948,-73.9651770549901,-73.9656279953866,-73.9660950057244,-73.9665522667892,-73.967009770734,-73.9674490837313,-73.9679269635447,-73.9683847931366,-73.9688503681786,-73.9690860867996,-73.9691095043752,-73.9693357331895,-73.9698322562294,-73.9703006816215,-73.9707601311674,-73.9712229222095,-73.9717230555584,-73.9735711742329,-73.9740666825764,-73.9742929486252,-73.9745323148841,-73.9747542408034,-73.9750011189794,-73.9754593243374,-73.9759551729502,-73.9764577739989,-73.9769116822629,-73.9773708499307,-73.9778263936496,-73.9782822010231,-73.9787224679214,-73.9791921451197,-73.9796523340224,-73.9801118156174,-73.9805637066685,-73.9810229005033,-73.981679436394,-73.9817265346255,-73.9817923254865,-73.9818595171329,-73.9819272175715,-73.9819945280543,-73.9820434160202,-73.9820703645754,-73.9820927124339,-73.9822161951483,-73.9832066141372,-73.9843149130714,-73.9847636926324,-73.9849858236627,-73.987615120763,-73.9904532545266,-73.9917579375628,-73.993203471167,-73.9933251984328,-73.993410453874,-73.9934904641407,-73.9936282272451,-73.9936963935409,-73.9939369418221,-73.9938629532914,-73.9938233450535,-73.9937679139921,-73.993699309278,-73.9936227952132,-73.9935278276413,-73.993443419172,-73.9934117567152,-73.9933589415075,-73.9926226638654,-73.9925778427661,-73.9925277439515,-73.9924697458153,-73.9924038371919,-73.9922670890354,-73.9920590849371,-73.9921253723949,-73.992226867797,-73.9923293466088,-73.9923617568011,-73.9923860429603,-73.9920876847127,-73.9920187799107,-73.9914295319022,-73.9909271741497,-73.9907304133948,-73.9903961600365,-73.9901012659766,-73.9896488729282,-73.9892009588643,-73.9892006808992,-73.989175778438,-73.9890851947859,-73.9888686174,-73.9888718744998,-73.9892190228805,-73.9892778590443,-73.9894090541801,-73.989498614927,-73.9895964933882,-73.9896798129025,-73.9897527029379,-73.9898422478065,-73.9899443022715,-73.9900401021205,-73.9901379775248,-73.9902233684564,-73.9903358403322,-73.9904305986971,-73.9905076461551,-73.9906221993968,-73.9907450695054,-73.9908721142822,-73.9909616722243,-73.9910574728295,-73.991157429497,-73.9912428174044,-73.9912553182896,-73.9912948871201,-73.9913219676499,-73.9913594555695,-73.9915510592274,-73.9914198258596,-73.988886144117,-73.9889396567063,-73.9889261035307,-73.9889116802646,-73.9889116606737,-73.9889192614684,-73.9883810502026,-73.988232413847,-73.9882104208316,-73.9881441813541,-73.9881378817448,-73.9881274616869,-73.9880412880673,-73.9881002938246,-73.9880764491451,-73.9880180599722,-73.9879607928421,-73.9879196845924,-73.9878772872501,-73.9864748036859,-73.9862518700354,-73.986113727253,-73.9856158039637,-73.9854658119703,-73.9861727049655,-73.986455862402,-73.9870723456156,-73.9871190139427,-73.9864977810236,-73.9861646288063,-73.9861284224859,-73.9860711352197,-73.9860272747891,-73.9860976378494,-73.9854293212694,-73.9850811377321,-73.9851988332545,-73.9851705023899,-73.9852162186736,-73.9852550979799,-73.9852427393766,-73.9852496293302,-73.9852817791867,-73.9852400328845,-73.9856838852422,-73.9857175290046,-73.9857656602975,-73.9856828719225,-73.9856362709305,-73.9856707225647,-73.9856152376444,-73.9852051188004,-73.9852110356075,-73.9851626399471,-73.985131636312,-73.9850169640648,-73.9849359782035,-73.9846550788302,-73.985743787901,-73.9858922722833,-73.985942854995,-73.9859495615567,-73.9858123735265,-73.9851352097033,-73.9846194285841,-73.9836952162366,-73.9823466414755,-73.9818864594655,-73.9813917446855,-73.9812893737095,-73.9809470835406,-73.980537679464,-73.98043434256,-73.9801322257865,-73.9800468439799,-73.9792882208298,-73.9782894915276,-73.9777947550321,-73.9768520784519,-73.9763995193056,-73.9762852788425,-73.9758305578524,-73.9757816932119,-73.975791401302,-73.9757621948648,-73.97554385822,-73.9752678323445,-73.9750866806789,-73.9749643680818,-73.97483924436,-73.9746655672272,-73.9744872252099,-73.9741436182347,-73.9739409836669,-73.9738998905246,-73.9737747724601,-73.9737206045576,-73.973613224639,-73.9735422772157,-73.973366710678,-73.9732051804574,-73.9731285912099,-73.9730707053794,-73.9730352290207,-73.9729231700197,-73.9728680726215,-73.9728717908152,-73.9725542982963,-73.972172372418,-73.9720509552187,-73.971952924385,-73.9718184948356,-73.9717998015074,-73.9717120072709,-73.9716204956934,-73.9716111339144,-73.9714421096152,-73.9712908330033,-73.971107658523,-73.9709876800351,-73.9708414835481,-73.9707636230071,-73.9706932647336,-73.9697872200334,-73.9686070740611,-73.9685591341792,-73.9684950672613,-73.9680484926094,-73.9668032725715,-73.9667010682416,-73.9665975037666,-73.9661749517758,-73.9660350151679,-73.9655649870462,-73.9654264056685,-73.9643427774881,-73.9638612629117,-73.9610779400213,-73.9596468542315],"lat":[40.8011564232565,40.8008175046001,40.8006704780884,40.8005825409548,40.8003650535111,40.7999770261545,40.7993522339277,40.7987185255206,40.7980381078972,40.7973684689598,40.7970559756554,40.7967386440453,40.796110827184,40.7954792700612,40.7948520605607,40.7942372356913,40.7940161814964,40.7938678763279,40.7936785732783,40.7930090280449,40.7928799013058,40.7923620450278,40.7916640267989,40.7909903410994,40.7903661171291,40.7897343897667,40.7891071528256,40.7884767907422,40.7878607210931,40.7872215711261,40.786595696524,40.7859740529881,40.7856396959121,40.7856032806995,40.7852932795571,40.7846109105864,40.7839754134459,40.7833401370511,40.7827062555875,40.7820214764623,40.7794778616212,40.7788054167216,40.7784979889537,40.7781677850257,40.7778646924296,40.7775277799166,40.7768987227267,40.7762197546262,40.775532537252,40.774909124027,40.7742810072139,40.7736561919219,40.7730318787382,40.7724188982852,40.7717812660014,40.7711553275426,40.7705283686784,40.769905324566,40.7692728335597,40.7683901309362,40.7684027308167,40.7684148757762,40.7684211865087,40.7684215792369,40.7684160487471,40.7684082108152,40.768531121716,40.7688922989298,40.7689604232602,40.7693793797666,40.7698481832134,40.7692264007039,40.7693207012287,40.7704154431329,40.7716122483408,40.7721661445151,40.7727798103924,40.7728314795376,40.7728788953456,40.7729289052621,40.772993650359,40.7730348322204,40.7731795109669,40.7732695290723,40.7733817668827,40.7734839945078,40.7735621521555,40.7736322902124,40.7737144464686,40.7737705496783,40.7738026124239,40.7739268801547,40.774974056037,40.7749560163594,40.7750021104399,40.7750241595518,40.7750181403907,40.7751160338586,40.7754975986949,40.7755090750534,40.7754822110262,40.7754689009586,40.7755018997667,40.7755571799221,40.7759839708214,40.7760733407354,40.7768795605453,40.777566878763,40.7775605502426,40.7775850656791,40.7779964575167,40.778627560009,40.7792523986516,40.7792527867819,40.7792875240158,40.7794075976621,40.7796929229115,40.7797137382531,40.779697895712,40.7797234392711,40.779737706472,40.7797250443898,40.7796981466834,40.7796775686581,40.7796712447142,40.7796807526707,40.7796965927686,40.7797076771957,40.7796997697048,40.7796823617138,40.779661794395,40.779664972553,40.7796681391239,40.7796760644118,40.7796713286867,40.7796460076439,40.7796396842544,40.7796523526258,40.7796697756065,40.7796713675871,40.7796507830191,40.7796302092089,40.7796317960414,40.7795858828349,40.7795748209348,40.7797552802871,40.7798788985328,40.7799561784404,40.7800592925163,40.7800960376492,40.7801223662677,40.7802260943437,40.7809810740459,40.7812331442156,40.7812254825421,40.7813656713272,40.781379281274,40.7814017969449,40.7815859608512,40.7816028783053,40.7816509350017,40.7816341888105,40.7817709870316,40.7818334782158,40.7818920513348,40.7839165737187,40.7842387642455,40.7844389118774,40.7851418625951,40.7853607005755,40.7860684522587,40.7859192190815,40.7851896388202,40.7852103185016,40.7859512028873,40.7861218824484,40.7862390013312,40.7862407060266,40.7862289642368,40.786058225698,40.7854139421847,40.7859219351105,40.7859665521978,40.7860133341582,40.7860305018165,40.7859762055116,40.7859725721508,40.7859631398559,40.7859786209501,40.7860358581368,40.7862221239197,40.7861759946688,40.7861962748587,40.7863097862132,40.7862901501467,40.7862429119939,40.7862196457153,40.7860476692128,40.7860395548837,40.7860209992672,40.78606029702,40.7860142376983,40.786130720651,40.786534741808,40.7865700828548,40.7864265290196,40.7864528478804,40.786487113464,40.7866168653571,40.7865876183929,40.7865860163499,40.7879152813128,40.7898547812753,40.7905165804326,40.7912282460052,40.7913755094331,40.7918678937826,40.792456812625,40.7925942830968,40.7929937658858,40.7931135256665,40.7941776321634,40.7955867604609,40.796284629772,40.7976313483932,40.7982732106926,40.7984352354101,40.7990922809133,40.7991562567803,40.7992096278863,40.7992601735493,40.7995282511399,40.7999328495318,40.800189533633,40.8003696341939,40.8005582432627,40.8008135147342,40.8010574288969,40.8015168953412,40.801809025864,40.8018898635312,40.8020458459486,40.8021678152803,40.8022968598872,40.8023564112503,40.8026301133465,40.8028300582763,40.8029747155087,40.8030555484474,40.803073973742,40.8032498228439,40.8033207341761,40.8033561876453,40.8037986346502,40.8043190769591,40.8045303760101,40.8046197095542,40.804717542702,40.8047856154861,40.8049316912766,40.8050422943994,40.8050961874744,40.8053344268398,40.8055287075333,40.8057901396768,40.8057429029292,40.8056853437599,40.8056573728797,40.8056302684492,40.8053004973846,40.8048709498982,40.8048535841203,40.8048322703844,40.8046837001335,40.804207561121,40.804168476937,40.8041236771614,40.8039455048015,40.8038864986314,40.8036886012456,40.8036303177756,40.8031745614049,40.8029720383534,40.8018003577204,40.8011564232565]}]],[[{"lng":[-73.8627549019687,-73.8627202141363,-73.8622404805114,-73.8621578566161,-73.8621675106328,-73.862014930969,-73.8617687441991,-73.8615384430536,-73.8612366879785,-73.8604333775361,-73.8600169832406,-73.85975083756,-73.859490724012,-73.8594133946409,-73.8592206295408,-73.8591560763267,-73.859078934299,-73.8589205637871,-73.8589919726669,-73.8589842333017,-73.8589229811653,-73.8587920421875,-73.8586719006749,-73.8586451048795,-73.8587652597761,-73.8588872266017,-73.8588398492652,-73.858711700318,-73.8586911026821,-73.8588437150625,-73.8586191528177,-73.8585421861057,-73.8585320867144,-73.8584808798074,-73.8584728970466,-73.8584612577606,-73.8584656240617,-73.8584096899565,-73.8584013738625,-73.85833010331,-73.8583217836605,-73.8582480115053,-73.8582370154957,-73.8581655020133,-73.8581567544819,-73.8580817226887,-73.8580745152959,-73.8580018665468,-73.8579943284836,-73.8579318312431,-73.8579233217447,-73.8578681943669,-73.8578594310592,-73.8578009228025,-73.8577925082393,-73.8577385638559,-73.8577329336658,-73.8576784374159,-73.8576896537065,-73.8576547355013,-73.8577749770522,-73.8578696213026,-73.8578810310114,-73.857964578664,-73.8580547091561,-73.8581503402828,-73.8581528098025,-73.8581642151605,-73.8582546465724,-73.8582678363007,-73.8583521972594,-73.8584153874909,-73.8584863395846,-73.8585008125537,-73.8583431930898,-73.8583294889102,-73.8583953140953,-73.8583507077487,-73.8583381131557,-73.8582525686971,-73.8582413098892,-73.8581390314338,-73.8581280618517,-73.8580509708731,-73.8580391755064,-73.8579512290883,-73.8579424353982,-73.8578624550102,-73.8578497949229,-73.8577706171077,-73.8577593108406,-73.8576389653581,-73.8576006846189,-73.8575883427544,-73.8568388876788,-73.8569707835438,-73.8569635600591,-73.8566748229625,-73.8566829973625,-73.8568029095629,-73.8568542711157,-73.8568614984466,-73.8569147794775,-73.8569207292805,-73.8569749683405,-73.8569812330915,-73.8570289828961,-73.8570361350842,-73.8570833368248,-73.8570895900675,-73.8571382885443,-73.8571452335369,-73.8571946426763,-73.8572008784468,-73.8572490376032,-73.8572566628431,-73.8573064329135,-73.8573135386542,-73.8573599019776,-73.8573679585382,-73.8574166225437,-73.8574251987913,-73.8574725832161,-73.8574797474493,-73.8575281058115,-73.8575355580386,-73.8575591575233,-73.8575479382374,-73.857582854707,-73.8574642287462,-73.8573735970151,-73.8571849615311,-73.8571760689437,-73.8570911149947,-73.8570827583543,-73.8569820720167,-73.8569710568437,-73.8568841550811,-73.8568250757656,-73.8568243674957,-73.8567557112035,-73.8567435031468,-73.856690352891,-73.8566030251476,-73.8565867538866,-73.8567823689739,-73.8567985803451,-73.8567116939948,-73.8567609287029,-73.8567731878093,-73.856825587981,-73.8568366081776,-73.8568878804073,-73.8569004432687,-73.8569899902876,-73.857093112109,-73.8571052940205,-73.8571871669689,-73.8571962917514,-73.8572824076211,-73.8572917459133,-73.8573806782753,-73.8573895145346,-73.8574749996307,-73.8574845369147,-73.8576042410329,-73.857635783638,-73.8576503708522,-73.8577084468894,-73.8577156725686,-73.8577674057337,-73.8577762303999,-73.8578349741772,-73.8578413659768,-73.8578970132351,-73.8579443345331,-73.8579670241406,-73.8579750018693,-73.8580451146315,-73.8580719978761,-73.8581328871493,-73.8581412005723,-73.8581763100433,-73.857819839608,-73.8578078823446,-73.8576883479084,-73.857672576088,-73.857529509768,-73.8574600419265,-73.8573714940672,-73.8573506578043,-73.8571880166611,-73.8571630320101,-73.8570027956736,-73.8569832889211,-73.8568380003565,-73.8567763209547,-73.8566745713554,-73.8566561759732,-73.8566119581344,-73.8566277294147,-73.8567789340733,-73.8567915418135,-73.8568855747746,-73.8569005431057,-73.8569901420736,-73.8570027254228,-73.8570901125114,-73.8571053425835,-73.8571913986338,-73.8572051624175,-73.8572941135809,-73.8573086888954,-73.8573992966731,-73.8574117999749,-73.8575046775756,-73.8575184191901,-73.8576100766833,-73.8576229398933,-73.85771566634,-73.8577302417448,-73.857819481249,-73.8578332359106,-73.8581943306643,-73.8582716431614,-73.8582809200557,-73.8583615894938,-73.8584432328879,-73.858451136766,-73.8585174974233,-73.8585074029871,-73.8585852621824,-73.8571213353452,-73.8562732064007,-73.8553763338786,-73.8553345466012,-73.8553026602968,-73.8550633024279,-73.8549509176938,-73.8547827375971,-73.8543740621409,-73.8538344005143,-73.8536746070519,-73.8534402522138,-73.8532999892406,-73.8531051389512,-73.8529247665995,-73.8526633943345,-73.8525825246995,-73.8524722061685,-73.8523427288433,-73.852336246321,-73.8521911681973,-73.8521650798942,-73.8521279815657,-73.8519826307076,-73.8519004907292,-73.8518659886392,-73.8518618516849,-73.851959190852,-73.8520877795051,-73.8521275848111,-73.8521357137624,-73.8521542855528,-73.8521556683952,-73.8521614469217,-73.8518974626072,-73.8520399162594,-73.8521222109915,-73.8522045056597,-73.8526043258402,-73.854555522564,-73.8558349556606,-73.8587632497491,-73.8611170766244,-73.8617507144683,-73.8627263391242,-73.8641847586896,-73.866556611179,-73.8675141292392,-73.8684575765922,-73.8694245860326,-73.8697391384021,-73.8703788127843,-73.8709705324967,-73.8713564854483,-73.8718409589812,-73.8723725635367,-73.8727735685624,-73.8733031009611,-73.8737009828374,-73.8739829374628,-73.8746294635104,-73.8754323616297,-73.8755564314717,-73.8762518021305,-73.8764795304389,-73.8769245825537,-73.8774161249239,-73.8783431255438,-73.8784577933542,-73.8792777995974,-73.8798389492007,-73.8802064802561,-73.8811374760109,-73.8820711212716,-73.8825687695602,-73.882999182888,-73.8839357946289,-73.8848553853325,-73.8857874052002,-73.8867165625313,-73.8876466372534,-73.8877832688397,-73.8886776620666,-73.8895712836084,-73.890501292144,-73.8914312862048,-73.8917504879261,-73.8923209052634,-73.8935881894753,-73.8944468875035,-73.8948968982871,-73.8952404495164,-73.8954708500579,-73.8955464921217,-73.8956446981448,-73.8956727864848,-73.8957024792063,-73.8957308002896,-73.8961557356709,-73.8963103780021,-73.8967343767552,-73.8972443746733,-73.8974219698374,-73.8973324762698,-73.897264822315,-73.8972874816492,-73.897318413995,-73.8973575745283,-73.8973884526943,-73.8974260640104,-73.8974703131031,-73.8975210877602,-73.8980371566637,-73.8980683174928,-73.8980911934983,-73.8981056575226,-73.8980902978177,-73.8980684312123,-73.8980403733342,-73.8980065291825,-73.8979673872822,-73.897923512633,-73.8981375085596,-73.8981902645821,-73.8982414530998,-73.8982898957431,-73.8983344773505,-73.89837417164,-73.8984080648332,-73.8985607157575,-73.8985946567442,-73.8986240117079,-73.8986486550348,-73.8986684806338,-73.8991209144408,-73.899258571912,-73.8995593819381,-73.8997265043898,-73.8998147477601,-73.8998585165688,-73.8998654486951,-73.8998679400511,-73.8998659865307,-73.8998595914061,-73.8998487650756,-73.8998335252937,-73.8998083602161,-73.8997750875714,-73.8997337782537,-73.8996845202942,-73.8996274187884,-73.8995625954032,-73.8994901883096,-73.8994103518506,-73.8990607288989,-73.8986613786671,-73.8982524029575,-73.8979114523291,-73.8978952811055,-73.8974273674472,-73.8973195757752,-73.8972716766544,-73.8970608179933,-73.8967062276317,-73.8964113840346,-73.8962474473163,-73.8960849253165,-73.895984065028,-73.8958599187409,-73.8955770438276,-73.8954244779486,-73.8952747945424,-73.8952493676186,-73.8951683706391,-73.8950665769515,-73.8950575871895,-73.8949945888893,-73.8949579650197,-73.8949549761795,-73.8948022255794,-73.8946432599384,-73.8946062741715,-73.8945602113229,-73.8944998080285,-73.8944322594536,-73.8943237202154,-73.8934960594546,-73.893075162923,-73.8926678131164,-73.8923944328483,-73.8921210344678,-73.891818572436,-73.891730067629,-73.8914448974731,-73.8916546392846,-73.8918353579635,-73.8910707878575,-73.890513578572,-73.8902903458953,-73.8892561949502,-73.8888165393255,-73.888354711776,-73.8877787738584,-73.8877066182002,-73.887624529175,-73.8871342937633,-73.886719460335,-73.8866762035628,-73.886025541989,-73.885648234261,-73.8850626608288,-73.8843972942821,-73.8842680418434,-73.8838286404288,-73.8834053801751,-73.8829862095267,-73.8825712432872,-73.8821605951121,-73.8817543776954,-73.8813527020737,-73.8809556782727,-73.8805634150475,-73.8802016158719,-73.879611587844,-73.8789736513567,-73.8785491567377,-73.8781864701793,-73.8778141632007,-73.8774333983731,-73.877045371829,-73.8766513529738,-73.8761531411474,-73.8760894970797,-73.8760165651882,-73.8751757334757,-73.874759433569,-73.874263304901,-73.8738052462418,-73.8732794145531,-73.8727256165466,-73.8722357769659,-73.8717353399993,-73.8714335734198,-73.8709270425469,-73.870714474926,-73.8701612831228,-73.8696297045436,-73.8694371976398,-73.8688938272456,-73.8680987350338,-73.8672819381513,-73.8660687595497,-73.8655058871899,-73.8650929408296,-73.864840095843,-73.8647388428493,-73.8645848696249,-73.8640497569827,-73.8635306344501,-73.8634021493181,-73.8633222212668,-73.8627549019687],"lat":[40.7667645254284,40.7666706422915,40.7662830865067,40.7661917584321,40.7660479942144,40.7658909264002,40.7655940045212,40.7653425322173,40.7649606161024,40.7638688823723,40.7632642855178,40.7628778396972,40.7625626159017,40.7624832658427,40.7624827444824,40.7625196306997,40.7625228322716,40.762406401186,40.7622465237092,40.7621714744721,40.7621223460182,40.7622793387477,40.762522270509,40.7625143959091,40.76226519185,40.7621336093978,40.7621053222161,40.7622337619551,40.7622211910035,40.7620587667792,40.7619355975015,40.7620268986902,40.7620217613326,40.7620826998614,40.7620921995025,40.7621060511651,40.7621088022809,40.7621733558773,40.7621830434029,40.7622660656111,40.762275756477,40.7623616936928,40.7623745026043,40.7624578070262,40.7624679957431,40.7625553998327,40.7625637953992,40.7626484207696,40.7626572007307,40.7627300038607,40.7627399155976,40.7628041311836,40.7628143396262,40.7628824935653,40.7628922961825,40.7629551325838,40.7629616921483,40.763027748527,40.7630363052037,40.7630798233503,40.7631388351303,40.7631852837601,40.7631908844928,40.7632318869892,40.7632761204006,40.7633230536619,40.7633242660726,40.7633298629186,40.7633742448036,40.7633807171476,40.7634221189061,40.7634531304235,40.7633693463789,40.7633764330825,40.763562560958,40.763555851276,40.7634770591218,40.763454789502,40.763448502848,40.7634057935906,40.7634001728101,40.7633491099655,40.7633436332673,40.7633051458725,40.7632992570395,40.7632553491317,40.7632509593267,40.7632110271835,40.7632047068898,40.763165177065,40.7631595325573,40.7630994491364,40.7631404011361,40.7631335519922,40.7640001791157,40.7640660675689,40.764074427864,40.7639301883254,40.7639207285854,40.7639808454609,40.7639225439048,40.7639143405931,40.7638538615462,40.7638471080892,40.7637855399447,40.76377842904,40.7637242268053,40.7637161106702,40.7636625297564,40.7636554318984,40.7636001539374,40.763592270232,40.7635361849825,40.7635291068648,40.7634744396575,40.7634657833207,40.7634092878634,40.7634012232512,40.7633485942393,40.7633394499232,40.7632842084879,40.763274472439,40.763220687375,40.7632125548092,40.7631576603969,40.763149201508,40.7631224117855,40.7631155657005,40.7630729006266,40.76301478272,40.7629703785196,40.7628779609662,40.7628736038149,40.7628319820006,40.7628278880202,40.762778558001,40.7627731613803,40.7627305839387,40.7627016390982,40.7627012924442,40.762667654151,40.7626616735372,40.7626356328596,40.7627314174296,40.7627228406169,40.7625082774058,40.762516823292,40.7626156869525,40.7626398261901,40.7626458365176,40.7626715271005,40.7626769309451,40.7627020679321,40.7627082273864,40.7627521310525,40.7628026887013,40.7628086615392,40.762848801777,40.7628532749758,40.7628954970572,40.7629000737088,40.7629436754313,40.7629480077031,40.7629899192708,40.7629945949933,40.7630532817898,40.7630123219649,40.7630191733756,40.7629503952808,40.7629418350821,40.7628805522781,40.7628700979901,40.7628005104989,40.7627929380017,40.7627270184924,40.7626709621704,40.7626440834573,40.7626346320932,40.7625515751763,40.7625197292697,40.7624475987089,40.7624377508773,40.7623962947257,40.7622261338905,40.7622204271011,40.7621633737606,40.7621558457603,40.7620875602117,40.7620544022984,40.7620121377963,40.7620021924469,40.7619245639316,40.761912637771,40.7618361553394,40.7618268444867,40.761757495881,40.7617280559227,40.7616794900641,40.761670708748,40.7616495422568,40.7616290623932,40.7617009740634,40.7617069699136,40.7617516910766,40.7617588092562,40.7618014223738,40.7618074056061,40.761848966852,40.7618562104715,40.7618971370758,40.7619036827937,40.7619459857851,40.7619529184758,40.7619960094695,40.7620019563721,40.762046126614,40.7620526618803,40.7620962530655,40.7621023694236,40.7621464691142,40.7621534005787,40.7621958402194,40.7622023819975,40.7623741079838,40.7622876283529,40.7622772514764,40.7621870156245,40.7620956894799,40.7620994650089,40.7620149107,40.7620080649159,40.7619170090987,40.7611889038728,40.7609024084304,40.7606693850315,40.7606581548903,40.7606495847523,40.7602806988509,40.7601074960894,40.7598482997658,40.759676255254,40.7594269778065,40.7593246483547,40.7591684372405,40.7590596940802,40.7588890062182,40.7587110075729,40.758397738787,40.7582834516903,40.7581202009823,40.7578867326546,40.7578732453588,40.7575667953577,40.7574596732962,40.757388722746,40.7571107363121,40.756866404551,40.7566559922049,40.7563274102381,40.7556896704974,40.7550785717333,40.7547509201017,40.7544551502439,40.7540478926649,40.7534652339494,40.7533819947196,40.7527528596665,40.7527103580457,40.752685519396,40.7526606818602,40.752541966549,40.7519619185315,40.7515772724589,40.7507169718049,40.7500242283664,40.7499675912558,40.7498679379296,40.7497195881934,40.7494641491502,40.7493757074826,40.7492638209405,40.7491568510175,40.7491262710972,40.7490640780592,40.7489992423263,40.7489569508011,40.7489055766492,40.7488515513313,40.7488129579851,40.7487581246386,40.7487173189776,40.7486856684713,40.7486139279188,40.7485273595215,40.7485136085516,40.7484388501133,40.74841640211,40.748368988615,40.7483193733449,40.7482226600425,40.7482148108683,40.7481240924725,40.7480617245398,40.7480249796925,40.7479272934953,40.747829926818,40.7477778459097,40.7477344024237,40.7476302420153,40.7475348115672,40.7474397539918,40.7473414625193,40.7472448393756,40.7472289262337,40.7471342773485,40.7470390537029,40.7469419392122,40.7468447364522,40.7468117271341,40.7467527474311,40.7466204605364,40.7465352708128,40.7472810572633,40.7478504020762,40.7482056553529,40.7483222864038,40.748473705578,40.7485182124273,40.748566072085,40.7486150514112,40.7493346015193,40.7496277093708,40.7505204292329,40.7513005544233,40.7515416182159,40.7517890264151,40.7519381322374,40.7521036484609,40.752268388305,40.7524321127191,40.7525344018712,40.7526353790247,40.7527347880438,40.752832376769,40.7537696722237,40.7538533612141,40.7539385829134,40.7540248637308,40.7540668261564,40.7541070849377,40.754145058949,40.7541802000438,40.7542120009671,40.7542400026781,40.7542937004537,40.7542985273195,40.7543093679749,40.7543259728658,40.7543479597446,40.7543748224688,40.754405942652,40.754604565796,40.7546569872434,40.7547109860182,40.7547663301672,40.7548227824764,40.755306291324,40.75553507451,40.7562390969562,40.7565418668171,40.7569311081173,40.7572823057171,40.7573655635305,40.7574489665315,40.7575323778181,40.7576156605612,40.7576986779708,40.7577812937762,40.7579152845691,40.7580482491626,40.7581799040557,40.758309968538,40.7584381652174,40.7585642208499,40.7586878666643,40.7588088390255,40.7593280164121,40.759921017874,40.7605144868544,40.7610203491476,40.7610445056276,40.7617467386605,40.7619022822687,40.7619711397983,40.7622753976174,40.7627422587513,40.7631500832703,40.7633327472138,40.763473754705,40.7635431100379,40.7636284736151,40.7638279680662,40.763947245818,40.7640855986402,40.7641123010953,40.764197362231,40.7643313277878,40.7643465381524,40.764453154023,40.7646658020983,40.7646683206375,40.7651348860289,40.7656009250014,40.7657093546072,40.7658150860978,40.7659197148497,40.7660112428674,40.7661464712329,40.7659509300008,40.7659734302094,40.7659896840764,40.7660039817046,40.7660219066069,40.7660441321068,40.7660506352475,40.7660746541344,40.7661565361589,40.7662270800494,40.7662753380706,40.7663252110565,40.7663451977956,40.7665207283635,40.7665953489592,40.7666977132982,40.7668232966881,40.7668385980515,40.7668652001879,40.7669829655748,40.767091312866,40.7671032588102,40.7672829582026,40.7674076907791,40.7675989425895,40.7678421703694,40.7678947650038,40.768073553299,40.7682588313479,40.7684494093535,40.7686452351354,40.768846255076,40.76905241372,40.7692636550286,40.7694799211617,40.7697011529032,40.7699041895995,40.770232447966,40.7705564217903,40.7707719955659,40.7709275354495,40.7710704563352,40.7712002552823,40.7713165290767,40.7714189462985,40.7715234553687,40.7715369030874,40.7715510435477,40.7716767111264,40.7717199874537,40.7717533869976,40.7717679784562,40.771767401351,40.7717366426898,40.7716956590197,40.7716225853142,40.7715764672214,40.7714456069189,40.7713906900369,40.7712089858792,40.7710063659756,40.7709244820301,40.7706490218974,40.7701720086523,40.7696500032915,40.7687961821552,40.7683457683383,40.7680153147373,40.7677920552136,40.7677026492889,40.7675666903798,40.7670639471112,40.7665762242062,40.7664555117611,40.7665040708482,40.7667645254284]}]],[[{"lng":[-73.928722045946,-73.9290523546547,-73.9291675220372,-73.9294035290939,-73.9298736482734,-73.9306846549314,-73.9316021867279,-73.9315563885424,-73.9314799142061,-73.9314067937854,-73.9313256978005,-73.9310832309891,-73.9309035493227,-73.9319074382884,-73.9328465735883,-73.9338101207478,-73.9347843737798,-73.9357181332727,-73.9361792781603,-73.9366846950613,-73.9371206387431,-73.9376358398768,-73.9382040380815,-73.9385934899821,-73.9395592537714,-73.9405321468608,-73.9414626098894,-73.9424014792862,-73.9433548889922,-73.9436519320497,-73.9442878880342,-73.9448728440442,-73.9450790938835,-73.9471589632305,-73.9500666492729,-73.9529591999551,-73.9563003512271,-73.9596966586303,-73.959861031131,-73.9606980937955,-73.9615646142233,-73.961880864398,-73.9624553663317,-73.9628129850858,-73.9630772417813,-73.9630696448626,-73.9630542903218,-73.9630312649951,-73.9630006991152,-73.962962766,-73.9629176798521,-73.9628656957107,-73.9628071076408,-73.9623882227418,-73.9622497383514,-73.962131463956,-73.9609559545363,-73.9611088685433,-73.9612579166136,-73.9616162763689,-73.9618065873623,-73.9619965757854,-73.9621102108679,-73.9621944718203,-73.962523265969,-73.9625410816496,-73.9625712308473,-73.9613369555931,-73.9590472528542,-73.957973172018,-73.9552696365476,-73.9532701974491,-73.9516049595336,-73.951604648875,-73.950874696308,-73.9505022756118,-73.9477299632891,-73.9463846338309,-73.945226455804,-73.9449646848674,-73.9421962844687,-73.939426956198,-73.9366570204557,-73.9338877367781,-73.9311193782087,-73.928349671659,-73.9283599500501,-73.9283698750737,-73.92844239741,-73.9285246975042,-73.9285985544817,-73.9286840449078,-73.9286920062813,-73.928722045946],"lat":[40.6644955696853,40.6643510070426,40.664299532152,40.6641998457684,40.6639907725283,40.6636204762702,40.6632304444006,40.6627554039298,40.6620511099541,40.6613305083395,40.6605933070246,40.6582959160363,40.6566103559842,40.6565376525426,40.6564784820519,40.656422992675,40.6563603950873,40.6563032967297,40.6562739725723,40.6562418233009,40.6562159030899,40.6561675762891,40.6561480151249,40.6561223787949,40.6560627532482,40.6560015389652,40.6559442485324,40.6558848110926,40.6558283358869,40.6558097809555,40.6557700543637,40.6557347616017,40.655722046541,40.6555937877736,40.6554229972006,40.6552493004003,40.6550482818312,40.6548392152288,40.6556347894394,40.6553409246806,40.6550041171529,40.6548811920523,40.6582869780274,40.6605093928109,40.6621301945495,40.6622090098859,40.6622871674729,40.6623642251591,40.6624397470141,40.6625133055532,40.6625844849145,40.6626528824221,40.6627181111361,40.6630896130645,40.663198678195,40.6632081631204,40.6632850548343,40.6640623236647,40.6648018234093,40.6666952157605,40.667681226904,40.668662869889,40.6691956971909,40.6696410297926,40.6713797387427,40.6714601187114,40.6716222448873,40.6713567714725,40.6708822675465,40.6706572740763,40.6701249048541,40.670007205105,40.669923718844,40.6699237033007,40.6698870998396,40.6698653518951,40.66971344241,40.6696366798575,40.6695705836165,40.6695558745457,40.6694033043445,40.669248684167,40.669100570778,40.66895044556,40.6687985425918,40.6686471946908,40.6685152024712,40.6684348201971,40.6676722095451,40.666866560048,40.6659705388988,40.6650860232743,40.6649622973766,40.6644955696853]}]],[[{"lng":[-73.8627549019687,-73.8633222212668,-73.8634021493181,-73.8635306344501,-73.8640497569827,-73.8645848696249,-73.8647388428492,-73.864840095843,-73.8650929408295,-73.8655058871897,-73.8660687595498,-73.8672819381513,-73.8680987350337,-73.8688938272456,-73.8694371976398,-73.8696297045435,-73.8701612831228,-73.8707144749259,-73.8709270425468,-73.8714335734198,-73.8717353399993,-73.8722357769659,-73.8727256165466,-73.873279414553,-73.8738052462418,-73.874263304901,-73.8747594335689,-73.8751757334757,-73.8760165651881,-73.8760894970796,-73.8761531411472,-73.8766513529738,-73.877045371829,-73.8774333983731,-73.8778141632006,-73.8781864701792,-73.8785491567378,-73.8789736513566,-73.879611587844,-73.8802016158719,-73.8805634150474,-73.8809556782726,-73.8813527020736,-73.8817543776953,-73.882160595112,-73.882571243287,-73.8829862095266,-73.8834053801751,-73.8838286404287,-73.8842680418433,-73.8843972942821,-73.8850626608287,-73.885648234261,-73.886025541989,-73.8866762035627,-73.886719460335,-73.8871342937633,-73.887624529175,-73.8877066182002,-73.8877298822495,-73.887818145648,-73.8881306268389,-73.8881775922634,-73.8881854192606,-73.8881900815474,-73.8882210938927,-73.8882713106103,-73.8883397556247,-73.888423757307,-73.8885192580243,-73.8886214500178,-73.8886549578871,-73.888744440491,-73.8886884136908,-73.8887089321046,-73.8890400025454,-73.8894022625029,-73.8894128079,-73.889430390386,-73.8894508583694,-73.8894739131481,-73.8894992181914,-73.8895264042493,-73.8895550745804,-73.8903419603084,-73.890708706911,-73.8913588065009,-73.8928899263955,-73.8930694376266,-73.8932423675107,-73.8934067519724,-73.8935608381838,-73.8937030536638,-73.8944227655844,-73.895130599123,-73.8958407490838,-73.8965647755194,-73.8942324749778,-73.8928604007566,-73.8922536570346,-73.8921322903704,-73.8920407755233,-73.8918446928234,-73.8917722965256,-73.8916521596491,-73.8915305842385,-73.8914341510822,-73.891416059024,-73.891401281124,-73.891480166469,-73.8915298715755,-73.891667856477,-73.891765777786,-73.8918088345025,-73.8917925102841,-73.891832449045,-73.8917254778065,-73.8917175133582,-73.8916893512109,-73.8915275908334,-73.8914436187526,-73.8913580140461,-73.8913676627334,-73.8914518571249,-73.8912641458479,-73.8911042266552,-73.8911204433948,-73.8910668141605,-73.8909486063571,-73.8907313211423,-73.8905625059535,-73.8904983464221,-73.8904591577671,-73.8904653739512,-73.8903519308252,-73.8901736950858,-73.8900872941688,-73.8900236909521,-73.88951644381,-73.889471511432,-73.8894710539967,-73.8895551248035,-73.889561496857,-73.8895818466568,-73.8895893573396,-73.8896144877394,-73.8897890075605,-73.8898424655832,-73.8898867162958,-73.8900676015265,-73.8901917152066,-73.8900892166737,-73.889976727388,-73.8898516995968,-73.8897503517801,-73.8896071959493,-73.8895235330305,-73.8894548690374,-73.8877984380514,-73.8876794015554,-73.8858076228665,-73.8858101243798,-73.8858179236733,-73.8858279373366,-73.8858336156138,-73.8857915186703,-73.885790343976,-73.8856818235151,-73.8856829263689,-73.8856694765792,-73.885694980851,-73.8857020708613,-73.8857122164284,-73.8856739890097,-73.8856734925826,-73.8856505496484,-73.8856700766504,-73.8856265073983,-73.8856023610358,-73.8856462738149,-73.8856476757293,-73.8856677313391,-73.8856613097997,-73.885667913156,-73.8856427658466,-73.8856385336236,-73.8856323103537,-73.8856758683631,-73.885677083643,-73.8857880410921,-73.8857868343147,-73.8857947772726,-73.8857871897487,-73.8857847369767,-73.8843155668891,-73.8840826246302,-73.883916279638,-73.8839316828429,-73.8841083630135,-73.8845515053224,-73.8846598266042,-73.8847922251718,-73.8848374239114,-73.8848553608045,-73.8848351959594,-73.8847736190733,-73.8846752373353,-73.8846017535515,-73.8845488263739,-73.884455194209,-73.8844198851325,-73.8842873771221,-73.8842883055274,-73.8843321701883,-73.8843625715656,-73.8844095718806,-73.8847574440451,-73.8848232207529,-73.8849319789734,-73.8849907041199,-73.8850324865644,-73.8850552265844,-73.8851139922264,-73.8852000839678,-73.8852391439166,-73.8852502698659,-73.8852187594233,-73.8850834587663,-73.8850529174103,-73.8851241643548,-73.8850841071635,-73.8851615248084,-73.8851196888178,-73.8851696401095,-73.8851717199686,-73.885425969449,-73.8854128725115,-73.885156229515,-73.885161192192,-73.8851088700627,-73.8850249728927,-73.8851005722684,-73.8850493034367,-73.8851313884868,-73.8851497369199,-73.8851933627272,-73.8851585497607,-73.8850215825569,-73.8850578093422,-73.885008975101,-73.8849784247546,-73.8849346638127,-73.8848811373114,-73.8847822502118,-73.8844503260945,-73.8838520321947,-73.8832527144128,-73.8832403825482,-73.8829049118665,-73.8828785175137,-73.8828111603005,-73.8827444971721,-73.882640305109,-73.8823177709145,-73.8821589972443,-73.8821186300027,-73.8820829336479,-73.8820262945351,-73.8818720051719,-73.8816840768379,-73.8815587218173,-73.8813907598555,-73.8812191473708,-73.8809608791239,-73.8808700388393,-73.8807502584827,-73.8803881741067,-73.8801892943918,-73.8800224049746,-73.8799058778248,-73.8797346684311,-73.8796134393725,-73.8795864683471,-73.8795907103767,-73.8796040812677,-73.8796069243285,-73.8794746864391,-73.8794734130345,-73.8794480502349,-73.8793580603612,-73.8793040917444,-73.8792048385162,-73.8791337082858,-73.8789248868435,-73.8787056251887,-73.8790511569308,-73.8793086829525,-73.8788583748558,-73.8788883123546,-73.8788838475791,-73.8791451042141,-73.8791644572964,-73.8791807880226,-73.8791644060602,-73.8797477785358,-73.8797016367226,-73.8796778842571,-73.8797046907907,-73.8794567955536,-73.8794210653306,-73.8794062256746,-73.8794300686937,-73.8791465474987,-73.8790825117745,-73.8790602451591,-73.8791242759201,-73.8788674717129,-73.8788570569997,-73.8788314678173,-73.8783392329805,-73.8751575489346,-73.8748452733139,-73.8712485624261,-73.8708990768917,-73.8697808119264,-73.8692349176576,-73.8681712705895,-73.8682378476837,-73.8680991232402,-73.8678840753688,-73.8680330493958,-73.8681303200002,-73.8691811350391,-73.8696932571398,-73.8698700743444,-73.8694375165719,-73.8687265728841,-73.868723354284,-73.8687175011424,-73.8687173779744,-73.8687172554684,-73.8687166505421,-73.8687159795051,-73.8687154573373,-73.8687153233773,-73.8687151900795,-73.8687150545767,-73.8687149197376,-73.8687147835746,-73.8687146474128,-73.8687145099297,-73.8687143728861,-73.8687129548725,-73.8687123772111,-73.8687109523075,-73.8687093057912,-73.8687091496026,-73.8687089931934,-73.8687086711011,-73.8687085080725,-73.8687083459287,-73.868707022777,-73.8687068542448,-73.868706686375,-73.8687065163013,-73.8687063468899,-73.8687061759369,-73.8687060045427,-73.8687058329272,-73.8687056615354,-73.8687054886007,-73.8687053154458,-73.8687051403072,-73.8687049660534,-73.8687047909172,-73.8687046157806,-73.8687042626459,-73.8687039073105,-73.8687031887128,-73.8687030069699,-73.8687028211421,-73.8687026386299,-73.8687024615284,-73.8687020894458,-73.8687013536919,-73.8687009694855,-73.8687002198631,-73.8686994623186,-73.8686992691291,-73.868699076821,-73.8686983005499,-73.868697897631,-73.8686977066618,-73.8686975154733,-73.8686973174423,-73.8686971191924,-73.8686967220326,-73.8686963089864,-73.8686946994708,-73.868693869475,-73.8686930445821,-73.868690069023,-73.8686892003157,-73.8686861002091,-73.86868584201,-73.8686815013089,-73.8686796243256,-73.8686786526011,-73.8686777014221,-73.8686767432034,-73.8686764901373,-73.8686762383956,-73.8686757547786,-73.868675463549,-73.8686742865204,-73.8686717989719,-73.8686672240654,-73.8686667584026,-73.8686473214421,-73.8686266134221,-73.8686052618471,-73.8685839156568,-73.8685632236151,-73.8685438138254,-73.8685262778621,-73.8685111467641,-73.8685039837118,-73.8685019272139,-73.8684949974614,-73.8684932306935,-73.8684927492194,-73.8684902914277,-73.8684902617922,-73.8684892543769,-73.8684890601713,-73.8684883247524,-73.868488147071,-73.8684871383182,-73.8684871153036,-73.8684862169534,-73.8684862046835,-73.8684860618424,-73.868485393059,-73.8684851441984,-73.8684850043686,-73.8684847884612,-73.8684847714004,-73.8684846675253,-73.8684845656321,-73.8684844425616,-73.8684843387523,-73.8684840438641,-73.8684838742499,-73.8684836905795,-73.8684836155808,-73.8684835427878,-73.8684834556516,-73.8684833885879,-73.8684833243928,-73.8684832702145,-73.8684832189012,-73.8684831689116,-73.8684831306854,-73.8684831213461,-73.8684829634311,-73.8684828593414,-73.8684828154924,-73.868482668091,-73.8684826392309,-73.8684825890053,-73.8684825676395,-73.8684825497993,-73.8684825367373,-73.8684825254407,-73.8684825044767,-73.8684825444309,-73.8684825771528,-73.868482598984,-73.8684826475539,-73.8684830980082,-73.8684832210058,-73.86848335436,-73.8684838269195,-73.8684839925301,-73.8684845061876,-73.8684846139582,-73.8684849575446,-73.868485076775,-73.8684853247074,-73.8684855647954,-73.868485717428,-73.8684859738202,-73.8684875434332,-73.8684878612931,-73.8684880615076,-73.8684886051395,-73.8684891455523,-73.8684897664174,-73.8684903537534,-73.8684919167947,-73.8684923478841,-73.8684926154976,-73.8684930936349,-73.868493582123,-73.8684938306621,-73.8684945572059,-73.8684945912555,-73.8684950767482,-73.8684956417922,-73.8684964211953,-73.8684964572252,-73.8684978290658,-73.8684978672973,-73.8684984489427,-73.8684990404983,-73.8684996421812,-73.8685002140054,-73.8685002539972,-73.8685008346274,-73.8685008743965,-73.8685011901034,-73.8685018256992,-73.8685021477911,-73.8685027572696,-73.8685027985782,-73.8685034579517,-73.8685041287764,-73.8685051516353,-73.8685054968437,-73.8685057861672,-73.8685058449142,-73.868506106847,-73.8685063703221,-73.8685069027795,-73.8685075752296,-73.8685083456992,-73.868509035983,-73.8685090810295,-73.8685094369788,-73.8685101546069,-73.8685105778835,-73.8685124532695,-73.8685128431666,-73.8685132836112,-73.8685140289268,-73.8685140578465,-73.8685144477155,-73.8685152340572,-73.8685156861614,-73.8685176997762,-73.8685177483384,-73.8685189605854,-73.8685202891007,-73.8685219821599,-73.8685228521615,-73.8685232948789,-73.8685235160119,-73.868523738913,-73.8685239860866,-73.8685242350235,-73.8685250824587,-73.868525533753,-73.868525583629,-73.8685259876889,-73.8685264433869,-73.8685266717834,-73.8685269004005,-73.8685274101508,-73.868528284431,-73.8685283343025,-73.8685285410622,-73.8685287493672,-73.86852921496,-73.8685292663744,-73.8685294737931,-73.8685296840784,-73.8685301540726,-73.8685302048245,-73.8685310984617,-73.8685311498726,-73.8685320514311,-73.8685321026194,-73.8685323153202,-73.8685325306658,-73.8685327700594,-73.8685330101165,-73.8685332508315,-73.8685334930916,-73.8685337338043,-73.8685339767234,-73.868534462556,-73.8685349497064,-73.868535438618,-73.8685356835119,-73.8685359292885,-73.8685364210576,-73.868536914806,-73.8685374098735,-73.868537907362,-73.8685384061686,-73.8685389570354,-73.8685399105022,-73.8685401626539,-73.8685404156873,-73.868540922411,-73.8685414300116,-73.8685416836986,-73.8685419389316,-73.8685424491697,-73.8685429622683,-73.8685432190375,-73.8685434762465,-73.8685437330138,-73.8685439908827,-73.8685445077174,-73.8685447664648,-73.8685450260926,-73.8685452848368,-73.8685455457848,-73.8685458058505,-73.8685460667963,-73.8685463264187,-73.8685465880246,-73.8685468502908,-73.8685471127764,-73.8685473997444,-73.8685476895773,-73.8685479258107,-73.8685481635879,-73.8685486898694,-73.868549220997,-73.8685494856767,-73.8685497514583,-73.8685502827992,-73.8685508147956,-73.8685513503152,-73.8685518858294,-73.8685524228854,-73.868552961258,-73.8685532301123,-73.8685534996265,-73.8685540922461,-73.8685543363932,-73.8685545823033,-73.8685556691513,-73.8685559415233,-73.8685562147755,-73.8685564864817,-73.8685567603932,-73.8685573082115,-73.8685578566868,-73.8685584073629,-73.8685586819267,-73.8685589586956,-73.8685595106855,-73.868560062891,-73.8685603396534,-73.8685606177383,-73.8685608944974,-73.8685611721404,-73.8685617285218,-73.8685622864425,-73.8685628450204,-73.8685631237543,-73.8685634042549,-73.8685639641464,-73.8685645255772,-73.8685648060703,-73.8685650878844,-73.8685655474314,-73.8685656493075,-73.8685659311187,-73.8685662135908,-73.8685667794134,-73.8685673450101,-73.868567912367,-73.86856848016,-73.8685687635029,-73.8685690494929,-73.8685696174976,-73.8685701890244,-73.8685704730242,-73.8685707598881,-73.8685719049059,-73.8685724779592,-73.8685730516697,-73.868573626699,-73.8685742032667,-73.8685747798303,-73.8685753570507,-73.8685759349278,-73.8685765130212,-73.8685770924324,-73.8685773821352,-73.868577673163,-73.8685779628649,-73.8685782534471,-73.8685788335065,-73.8685791254092,-73.868579415768,-73.8685799995666,-73.8685802899198,-73.8685805818181,-73.8685808743743,-73.8685811662694,-73.8685817498347,-73.8685823336146,-73.8685829202578,-73.8685835066765,-73.8685840926486,-73.8685846806012,-73.8685852678871,-73.8685858551687,-73.8685864433301,-73.868587032808,-73.8685875369685,-73.8685877898187,-73.86858804333,-73.8685890545026,-73.8685895608552,-73.8685905744324,-73.8685911645416,-73.8685917568499,-73.8685923491541,-73.8685929414538,-73.8685941282445,-73.8685947211935,-73.8685953147986,-73.8685959086194,-73.8685965022157,-73.8685967984611,-73.8685970960278,-73.8685976904969,-73.868599475203,-73.8686000703158,-73.8686012605297,-73.8686018562911,-73.8686024513867,-73.8686030473607,-73.8686036424477,-73.8686042388527,-73.8686045363923,-73.8686048348136,-73.8686054298876,-73.8686060249561,-73.8686063231516,-73.8686066215652,-73.8686072166273,-73.8686078130053,-73.8686084089413,-73.8686090039892,-73.8686095990329,-73.8686098965519,-73.8686101940722,-73.8686107897693,-73.8686110872843,-73.8686113848,-73.8686116823127,-73.8686119798275,-73.8686122773391,-73.8686125750711,-73.868613169207,-73.8686135643389,-73.8686137628981,-73.8686139607947,-73.8686143572468,-73.8686149522514,-73.8686155457089,-73.8686161393826,-73.8686167328324,-73.8686173258374,-73.8686185107299,-73.8686188075574,-73.8686191028412,-73.868619694945,-73.8686199908867,-73.8686202870476,-73.8686205816637,-73.8686208769408,-73.8686211737566,-73.8686214690327,-73.8686218625831,-73.8686222561322,-73.8686226494588,-73.8686232386737,-73.8686244164278,-73.8686247110276,-73.8686250056297,-73.8686252993457,-73.868625592623,-73.8686258872209,-73.8686261796135,-73.8686267665982,-73.8686270611904,-73.8686273535787,-73.8686276472872,-73.8686279398927,-73.8686285246614,-73.8686288170444,-73.8686291100863,-73.8686295000744,-73.8686296948465,-73.8686298885166,-73.868630277619,-73.8686308617096,-73.8686314435904,-73.8686317344187,-73.8686320248072,-73.8686323165147,-73.8686326066804,-73.8686328975046,-73.8686331878874,-73.8686334780478,-73.8686337675494,-73.8686343465447,-73.8686349255366,-73.8686352150284,-73.8686355038621,-73.8686357924723,-73.8686360961736,-73.8686372335254,-73.8686383826459,-73.8686386692628,-73.8686389715203,-73.8686392570318,-73.8686395284434,-73.8686401007868,-73.8686406724622,-73.8686409720675,-73.8686412421515,-73.8686418272576,-73.8686421105538,-73.8686423804141,-73.8686426648118,-73.8686429478859,-73.8686435153559,-73.868643797545,-73.8686440812773,-73.868644646313,-73.8686449271747,-73.868645210022,-73.8686454924253,-73.868645773948,-73.8686463361067,-73.8686466163016,-73.8686468978179,-73.8686471771313,-73.8686474712021,-73.8686480166057,-73.8686485752207,-73.8686488538654,-73.8686491325111,-73.8686494096107,-73.8686496882521,-73.8686499660119,-73.8686502439911,-73.8686507981832,-73.8686513519297,-73.868651903909,-73.868652178353,-73.8686524547829,-73.8686535785413,-73.8686541003251,-73.8686546474373,-73.8686549317819,-73.8686551930002,-73.8686557372395,-73.8686568219565,-73.8686570910938,-73.8686573617748,-73.8686576309101,-73.8686579015891,-73.8686581700609,-73.8686584391947,-73.8686587076655,-73.8686589761351,-73.8686592446035,-73.8686595130734,-73.8686600471408,-73.8686605796636,-73.8686670756782,-73.8686846116212,-73.8686997420582,-73.8687120074901,-73.868721036027,-73.8687215401526,-73.8694234479541,-73.8704802989896,-73.8709061406768,-73.8714629235818,-73.8723228691895,-73.8720174180928,-73.8709082331228,-73.8702283750835,-73.8702191075742,-73.8709082742764,-73.8720283196516,-73.8723360399841,-73.8725573267373,-73.8723863703688,-73.8721801432673,-73.871185887052,-73.8709107023297,-73.8701948508614,-73.870157511781,-73.8682552027083,-73.86792643466,-73.8663290285311,-73.8661519869218,-73.8657606501558,-73.8651322118665,-73.8647106649719,-73.8610455233363,-73.8591787193464,-73.8590870381648,-73.858925570176,-73.8589640555545,-73.8588418254722,-73.8586335607119,-73.85840105715,-73.8579615794531,-73.8577356389315,-73.8572338759026,-73.8569004401461,-73.8567439825915,-73.8565638462565,-73.8559380688681,-73.8555107354459,-73.8550510627182,-73.8550482539028,-73.8550480307379,-73.8550545177469,-73.8550679859515,-73.8550863591034,-73.855115490055,-73.855180653368,-73.8556587255473,-73.8564239066145,-73.8564422971782,-73.856462729893,-73.8565081867766,-73.8565324020903,-73.8565570587974,-73.8565817666686,-73.8566323197187,-73.8566850341593,-73.8567115074387,-73.8567375829373,-73.8567629111172,-73.8567871552647,-73.8572894270728,-73.8573399931132,-73.857361583989,-73.8573823514903,-73.857402692164,-73.8574227925689,-73.8574377954303,-73.8574460450817,-73.8574632233434,-73.8574769159832,-73.8574889469212,-73.8574949999356,-73.8575012031003,-73.8575121437347,-73.8575367872447,-73.8575494775766,-73.8575560500044,-73.8575625281011,-73.8575690229945,-73.8575723000289,-73.8576325726631,-73.8576759217205,-73.8577161132389,-73.8577536322602,-73.8577763148345,-73.8578006583742,-73.8578834087799,-73.8578306228225,-73.8578246323172,-73.8580085824606,-73.8580129688646,-73.8580189763297,-73.8580223205577,-73.8580251112795,-73.8580280304657,-73.8580309017921,-73.8580335687389,-73.8580358692308,-73.8580385498612,-73.8580427698619,-73.8580426357556,-73.8580388407044,-73.8579870964793,-73.8577199954691,-73.857347309504,-73.8568499051845,-73.8565640028131,-73.8562126761018,-73.8561488851627,-73.8561497357846,-73.8562456574617,-73.8563129611473,-73.8564777188217,-73.8566356595733,-73.8568183370388,-73.8570479026211,-73.8571028793471,-73.8571615843033,-73.8572404200866,-73.8573125445042,-73.8576780026624,-73.8579760422921,-73.8580526188042,-73.8581970423605,-73.8583281385249,-73.8584350717563,-73.8585953895134,-73.8587737655306,-73.8589207597772,-73.8593751042978,-73.8596377997352,-73.859830281486,-73.8599865066951,-73.8601677887754,-73.860336459887,-73.8605545661331,-73.8606974309685,-73.8607746894299,-73.8608553594449,-73.8609288429741,-73.8609888367663,-73.8610076210945,-73.8610003822173,-73.8610334567885,-73.8611027721839,-73.8611899849748,-73.8612119439517,-73.8613138616611,-73.861432508727,-73.861691772079,-73.8618154531637,-73.8620214238525,-73.8620527169919,-73.8621297645646,-73.8622253933612,-73.8622005984658,-73.8622656507162,-73.8624348553379,-73.8626022140311,-73.8626886411053,-73.8627549019687],"lat":[40.7667645254284,40.7665040708482,40.7664555117612,40.7665762242062,40.7670639471112,40.7675666903798,40.7677026492889,40.7677920552136,40.7680153147374,40.7683457683384,40.7687961821552,40.7696500032915,40.7701720086523,40.7706490218974,40.7709244820301,40.7710063659756,40.7712089858792,40.7713906900369,40.7714456069189,40.7715764672214,40.7716225853142,40.7716956590197,40.7717366426898,40.771767401351,40.7717679784562,40.7717533869976,40.7717199874538,40.7716767111264,40.7715510435477,40.7715369030874,40.7715234553687,40.7714189462985,40.7713165290767,40.7712002552823,40.7710704563352,40.7709275354495,40.7707719955659,40.7705564217903,40.770232447966,40.7699041895995,40.7697011529032,40.7694799211617,40.7692636550286,40.7690524137201,40.768846255076,40.7686452351354,40.7684494093535,40.7682588313479,40.768073553299,40.7678947650038,40.7678421703694,40.7675989425895,40.7674076907791,40.7672829582026,40.7671032588103,40.767091312866,40.7669829655748,40.7668652001879,40.7668385980516,40.7669144343696,40.7672020782521,40.7682641924714,40.7684282567009,40.7684794043916,40.768509873313,40.7685922895698,40.7686718716451,40.768744806519,40.7688076442263,40.7688578407815,40.76889404946,40.7689011951585,40.7689181792537,40.7689775966221,40.7690915232464,40.7709162384816,40.7729267175712,40.7729852417294,40.7730042423989,40.773021492612,40.773036740624,40.7730497637638,40.7730603721408,40.7730684109404,40.77323760503,40.7733195299268,40.7734651438649,40.7738076612117,40.7738694852488,40.7739430191484,40.774027592863,40.7741222976583,40.7742260143936,40.7747348382503,40.7752334544951,40.7757348317729,40.7762470243256,40.7781536132297,40.777159074851,40.777204523029,40.7770909363801,40.7769628986734,40.7766855099062,40.7765935211534,40.7765623235497,40.7764767692854,40.7763805231435,40.7763389562343,40.7760448648803,40.7758968423889,40.7756056311981,40.7754845620977,40.7753571879053,40.7752196405644,40.7750887280951,40.7748801998888,40.7750520321341,40.775163632893,40.7752547378436,40.7754781353675,40.7756226947097,40.7760494084328,40.7763429985786,40.7765127692709,40.7768558553747,40.7770232069748,40.7771246997361,40.7772129253049,40.7772838451727,40.7773320498678,40.7774039209643,40.777462635852,40.7775504972535,40.7777032192871,40.7778003207775,40.7778508127779,40.7777841931043,40.7772471264064,40.7759367144457,40.7757380565234,40.7755355514699,40.775278709613,40.7750922386026,40.7750350501164,40.7749587101926,40.7748456871422,40.7742368611699,40.7741003785568,40.7740173490743,40.7739624837535,40.7736468762251,40.7736264355249,40.7737236106506,40.773753297364,40.7737173958503,40.7736203381615,40.7735751800064,40.7735329511273,40.7737112974247,40.7738187917233,40.7740222244754,40.7740360176663,40.7740789987405,40.7740779480581,40.7741092404399,40.7741136550724,40.7741071872505,40.7741185680432,40.7741246454603,40.7741260560839,40.7742666104456,40.7742658671313,40.7743217716242,40.7743257799489,40.7743230506312,40.7743254574896,40.7744330712169,40.7744376397921,40.7743045639391,40.7742999595285,40.7743076912231,40.7743055884074,40.7742702056446,40.7742695127773,40.7741309333886,40.7741313776544,40.7740970747886,40.7740925068702,40.7740992025686,40.7740875662063,40.7740809177599,40.7740800846539,40.7740382692639,40.7740247121646,40.7741843644867,40.7741044801434,40.7741326065916,40.7741846448552,40.7741670828963,40.7743606218296,40.7744801012102,40.7748070631201,40.7749529802431,40.7751022115724,40.775220842116,40.7753322805866,40.7753967659726,40.7754205106945,40.7754280491009,40.7754648038506,40.775456465702,40.7754720556635,40.7754830970367,40.7754829703682,40.7754933737328,40.7755493603748,40.7772541381827,40.777512397707,40.7779050221045,40.7781452173882,40.7782998317229,40.7784053127442,40.7784755290346,40.7785135712636,40.7785592206734,40.7786129017425,40.7786613623025,40.7786713131621,40.7787754351695,40.7790612087805,40.7793525711136,40.7794132647191,40.7795113753826,40.7795335691941,40.7795272490212,40.7796398721741,40.7796599600353,40.7795504594895,40.7795441510686,40.7795223100439,40.7795573184395,40.7796124313351,40.779625245829,40.7797361179981,40.7797286309762,40.7797862140992,40.7797983303711,40.7796148540401,40.7796002377286,40.7795648071174,40.7797443824052,40.7799369123045,40.7799871962388,40.7800384799953,40.7801546008236,40.7802643202571,40.7802654229022,40.7803257232738,40.7803486967373,40.7802363201094,40.7802189366977,40.7802234235696,40.7802858574564,40.7803605487958,40.7803678670606,40.7803958631772,40.7804508361673,40.7804850430253,40.7804984548699,40.7805000621364,40.7805466257367,40.7806016084081,40.7806106167351,40.7805855772364,40.7805730596728,40.7805743262462,40.7806194164029,40.7806349674191,40.7806447198398,40.7806391446684,40.7806548175474,40.7806943189554,40.7806981103576,40.7807791487166,40.7807791626867,40.7808503130653,40.7808569510752,40.7807026889142,40.7807004765119,40.78065668063,40.7807594073783,40.7807673893349,40.7806782288797,40.780673551649,40.7805859099502,40.7817305328608,40.7818536578298,40.7823981786812,40.782414426612,40.7824189392437,40.7825445677957,40.7825231314298,40.7825299236165,40.7825513642733,40.7828365642071,40.7828828180723,40.7828726295066,40.7828376483594,40.7827154225929,40.7827560407917,40.7827458614949,40.7827063594834,40.7825682855527,40.7826506586608,40.7826404710236,40.7825603561656,40.7824369911601,40.7824448855713,40.7824307144944,40.7830259207495,40.7815094491507,40.7816849245779,40.7860381507525,40.7858714255035,40.7853379333259,40.785969915419,40.7872561961563,40.7872796430849,40.7874586618192,40.7873610366954,40.7871820299535,40.7872327778442,40.7859434895708,40.7852961632549,40.7850859065657,40.7836383993112,40.783731698254,40.7837421635882,40.7837541475548,40.7837543538059,40.7837545595551,40.7837555326914,40.7837566133037,40.7837574191765,40.7837576215621,40.7837578234459,40.7837580258299,40.7837582270419,40.7837584289224,40.7837586303004,40.7837588310068,40.7837590323838,40.783761032195,40.7837618143833,40.7837636198571,40.783765706186,40.7837658926314,40.7837660790766,40.7837664608352,40.7837666511259,40.7837668397424,40.7837683461315,40.783768533233,40.7837687196651,40.7837689060947,40.7837690920225,40.7837692772784,40.7837694627013,40.7837696486266,40.7837698328768,40.7837700171253,40.7837702013736,40.7837703856196,40.7837705681913,40.7837707512646,40.7837709345055,40.7837712991411,40.783771662099,40.7837723843201,40.7837725647055,40.7837727488555,40.7837729281511,40.7837731020083,40.7837734633556,40.7837741678832,40.7837745303057,40.7837752263575,40.7837759163693,40.783776089538,40.7837762628753,40.7837769491803,40.7837773006922,40.7837774656547,40.7837776301144,40.783777799592,40.7837779683993,40.7837783055106,40.7837786514827,40.7837799682416,40.7837806279325,40.7837812705417,40.7837834910517,40.7837841109112,40.7837862312665,40.783786400508,40.7837891232951,40.7837902240601,40.7837907784672,40.7837913081878,40.7837918313667,40.7837919682816,40.783792104193,40.7837923604584,40.78379251492,40.783793127057,40.7837943717005,40.7837964961543,40.7837967006747,40.7838035628133,40.7838077551542,40.7838091509255,40.7838077064724,40.7838034669292,40.7837965604996,40.7837871974333,40.7837756621254,40.7837684748167,40.7837661152196,40.7837567483353,40.7837538781159,40.7837530491532,40.7837484330325,40.7837483731922,40.7837462421239,40.7837458137073,40.7837441160028,40.7837436904529,40.7837411208015,40.7837410564454,40.7837384951287,40.7837384584267,40.7837380240377,40.783735841758,40.783734965316,40.7837344568841,40.7837336342553,40.7837335683984,40.7837331565023,40.7837327452785,40.7837322323427,40.7837317871091,40.7837304462339,40.7837296187996,40.7837286546486,40.7837282406076,40.7837278255639,40.7837273078109,40.7837268932764,40.7837264770699,40.7837261223567,40.7837257676467,40.7837254124357,40.7837251269287,40.7837250572274,40.7837237741373,40.7837228013658,40.7837223500022,40.7837205422343,40.7837200898827,40.7837191845178,40.7837187316721,40.783718279333,40.7837178626823,40.7837174448609,40.7837155613483,40.7837132981251,40.7837124648908,40.783712012597,40.7837111897674,40.7837065225198,40.7837056218758,40.7837047222487,40.7837020303189,40.7837012025971,40.7836989042315,40.783698459742,40.7836971273016,40.7836966833277,40.7836957980711,40.7836949788106,40.7836944728903,40.7836936563288,40.7836892215435,40.7836884166113,40.7836879228072,40.7836866284559,40.7836854016136,40.7836840596055,40.7836828437059,40.7836798389103,40.7836790615815,40.7836785892976,40.7836777597546,40.783676934244,40.78367652275,40.7836753488906,40.7836752939811,40.7836745343046,40.7836736691778,40.7836725134715,40.7836724602395,40.7836705185096,40.7836704664528,40.783669676564,40.7836688907069,40.7836681102223,40.7836673829767,40.7836673324297,40.7836666102198,40.7836665608452,40.7836661763995,40.7836654101932,40.7836650291053,40.7836643188227,40.7836642711251,40.7836635176779,40.7836627691019,40.7836616553871,40.78366128689,40.7836609814861,40.7836609200713,40.783660645796,40.7836603716899,40.7836598249918,40.7836591461083,40.783658384579,40.7836577150973,40.7836576717596,40.7836573329267,40.78365665577,40.7836562632382,40.7836545757162,40.7836542335715,40.7836538526186,40.7836532172073,40.7836531931167,40.7836528652115,40.7836522134296,40.783651843379,40.7836502471485,40.7836502093432,40.7836492846456,40.7836482997714,40.7836470879811,40.783646482364,40.7836461781402,40.7836460286247,40.7836458767659,40.7836457101926,40.7836455436212,40.7836449813674,40.7836446865349,40.7836446530867,40.7836443933807,40.783644100731,40.7836439560821,40.7836438114334,40.7836434908686,40.7836429505913,40.7836429193208,40.7836427939126,40.7836426673335,40.7836423862544,40.7836423549858,40.7836422305835,40.7836421056818,40.7836418279583,40.7836417971915,40.7836412762016,40.7836412466082,40.7836407321609,40.78364070374,40.7836405831967,40.7836404626565,40.7836403295794,40.7836401953303,40.7836400627573,40.7836399290133,40.7836397976128,40.7836396650423,40.7836394025815,40.7836391424676,40.7836388833609,40.7836387551482,40.783638626434,40.7836383711837,40.7836381181134,40.7836378667198,40.7836376170043,40.7836373694681,40.7836370983702,40.7836366372551,40.7836365167569,40.7836363962597,40.7836361574439,40.7836359209743,40.7836358043309,40.7836356860141,40.7836354532331,40.7836352228008,40.7836351078362,40.7836349933747,40.7836348794152,40.7836347656245,40.7836345405573,40.7836344282753,40.7836343166644,40.7836342060578,40.7836340954536,40.7836339853509,40.7836338759194,40.783633766989,40.7836336580608,40.7836335496359,40.7836334417138,40.7836333246058,40.7836332075011,40.783633112281,40.7836330163927,40.7836328067485,40.7836325982826,40.7836324953888,40.7836323924963,40.7836321877162,40.7836319857847,40.7836317855325,40.7836315879607,40.7836313908932,40.7836311966752,40.7836311003196,40.783631004635,40.783630795569,40.7836307107446,40.7836306259222,40.7836302555903,40.7836301635944,40.7836300722697,40.7836299826185,40.7836298922995,40.7836297140072,40.7836295378935,40.7836293632899,40.7836292774949,40.7836291910324,40.7836290209536,40.7836288530528,40.7836287699408,40.7836286868303,40.7836286053935,40.7836285227851,40.7836283609199,40.7836282007318,40.7836280427223,40.7836279656434,40.7836278868914,40.7836277332389,40.7836275812636,40.7836275063646,40.7836274321372,40.7836273107027,40.7836272840148,40.7836272112951,40.7836271385762,40.7836269948146,40.7836268539006,40.7836267144964,40.783626577438,40.7836265102484,40.7836264418892,40.7836263091867,40.7836261786661,40.783626113655,40.7836260491498,40.7836257979948,40.7836256756846,40.783625555553,40.7836254370982,40.783625320823,40.7836252067256,40.7836250948067,40.783624985234,40.7836248776718,40.7836247724565,40.783624721189,40.7836246687504,40.7836246179855,40.7836245678917,40.7836244692106,40.7836244201235,40.7836243715372,40.7836242767135,40.7836242309751,40.7836241840658,40.7836241388325,40.7836240935984,40.7836240053078,40.7836239198655,40.7836238354315,40.7836237531751,40.7836236737662,40.7836235958672,40.7836235208154,40.7836234479414,40.7836233760736,40.7836233070552,40.7836232500013,40.7836232223129,40.7836231946252,40.7836230875568,40.7836230365363,40.7836229395222,40.7836228857493,40.7836228343243,40.7836227850771,40.7836227380077,40.783622650405,40.7836226093672,40.7836225710106,40.7836225349996,40.7836225009987,40.783622484919,40.7836224693434,40.7836224398666,40.7836223633322,40.7836223425674,40.7836223072364,40.7836222930059,40.78362228112,40.7836222707429,40.7836222632126,40.7836222578617,40.7836222560231,40.7836222541856,40.7836222531888,40.7836222550399,40.7836222558825,40.7836222578979,40.7836222629321,40.7836222713182,40.7836222802064,40.7836222924441,40.7836223068595,40.7836223154075,40.7836223234529,40.7836223417223,40.783622352448,40.7836223626712,40.7836223745696,40.7836223852954,40.7836223976964,40.7836224100977,40.7836224377467,40.7836224579652,40.7836224674054,40.7836224775151,40.7836224989077,40.7836225330912,40.7836225694507,40.7836226079883,40.7836226482009,40.7836226905908,40.7836227830754,40.7836228070349,40.7836228314952,40.7836228837681,40.7836229099043,40.7836229365435,40.7836229643535,40.7836229921643,40.7836230221547,40.783623050468,40.7836230904527,40.7836231309399,40.7836231725996,40.783623236931,40.7836233727966,40.7836234088153,40.7836234436614,40.7836234808518,40.783623516869,40.783623553893,40.7836235915845,40.7836236691478,40.7836237090196,40.7836237488889,40.7836237897649,40.7836238313097,40.7836239149015,40.7836239574512,40.7836240011743,40.7836240592476,40.7836240891217,40.7836241189945,40.7836241792446,40.7836242715468,40.7836243666945,40.7836244152734,40.7836244633492,40.7836245131016,40.7836245623499,40.7836246131066,40.7836246640302,40.7836247159588,40.783624766714,40.7836248722449,40.7836249794511,40.783625035232,40.7836250893369,40.7836251451168,40.7836252039294,40.7836254310502,40.783625669576,40.783625730212,40.7836257948025,40.7836258571961,40.7836259168095,40.7836260426034,40.7836261717471,40.7836262401039,40.7836263023961,40.7836264384236,40.7836265065943,40.7836265705616,40.7836266389011,40.7836267079092,40.7836268462619,40.7836269169443,40.7836269874608,40.7836271308366,40.7836272041978,40.7836272763886,40.7836273502542,40.7836274236161,40.7836275730195,40.7836276490604,40.7836277257728,40.7836278018127,40.7836278825601,40.7836280344573,40.7836281925678,40.7836282724601,40.7836283518496,40.7836284329127,40.7836285144802,40.7836285960466,40.7836286781159,40.7836288439276,40.7836290120842,40.7836291822491,40.7836292688375,40.7836293542554,40.783629712868,40.7836298836686,40.7836300632093,40.7836301585204,40.7836302460988,40.7836304294894,40.7836308039723,40.7836308992661,40.7836309940589,40.7836310903577,40.7836311861557,40.7836312836264,40.7836313805954,40.7836314785687,40.7836315772121,40.7836316763581,40.783631774834,40.7836319753005,40.7836321767704,40.7836348428025,40.7836442058475,40.7836557411322,40.7836690988433,40.783683871974,40.7836849507422,40.7835913149178,40.7823061123153,40.7822282317644,40.7821264007409,40.7811007616325,40.780955752131,40.7811489619764,40.7812673815643,40.7812473268679,40.7811277348648,40.7809333622233,40.7810850527823,40.7808211215426,40.7807405269745,40.7805259156709,40.7800015988523,40.7798753162314,40.7795468039817,40.7794979456391,40.7785126440758,40.7783942477985,40.7776419990615,40.777590680485,40.7773581201926,40.7769664700143,40.776733185751,40.7749758741902,40.7740726202339,40.7740937051816,40.7740302391693,40.7739385180323,40.7739096083789,40.7738088345996,40.7737213360543,40.7734892058888,40.7733848147567,40.7731836298121,40.7730587728694,40.7729790725725,40.7728996682579,40.7726367415652,40.7724389681712,40.7721953899891,40.7721143507141,40.7720370783252,40.7719246579164,40.7718702301477,40.7718313882775,40.7718132337877,40.7717835813867,40.7711507397379,40.7703004339178,40.77028616889,40.7702730618289,40.7702512516371,40.770242930629,40.7702365380527,40.7702321700844,40.7702288235128,40.7702320509758,40.7702361033485,40.770241714216,40.7702488089299,40.7702572924202,40.7704497281736,40.7704756604658,40.7704848310911,40.7704923175611,40.7704982636018,40.7705027064674,40.7705033892714,40.7705022334986,40.7705037078698,40.7705025368823,40.7704994161827,40.7704967859752,40.770493392873,40.7704859422903,40.7704667634149,40.7704589576595,40.7704560997532,40.7704541781993,40.7704531603001,40.7704529837582,40.7704740127125,40.770498347292,40.770529546012,40.7705680050028,40.7705804875431,40.7705963058926,40.77065971164,40.7704397997069,40.7704373110901,40.7702210226943,40.7702221304197,40.770225133352,40.7702259911846,40.7702260127161,40.7702257248182,40.7702251470416,40.7702243120284,40.7702232740249,40.7702213950075,40.7702158009912,40.7702099704246,40.7702035222029,40.7701736137114,40.7703002478254,40.7701842322154,40.7695424525416,40.7693779437551,40.7691957977579,40.7690787964731,40.7689868469449,40.7688857141991,40.7688784405843,40.7689051574058,40.7689403297536,40.769038846179,40.7691395564514,40.7690925001274,40.7689914017088,40.7688815751449,40.7687636086762,40.7682762653915,40.768114830471,40.7680906563705,40.7679433141032,40.7678241855551,40.7677054409588,40.7674850142725,40.767349995601,40.7672735605669,40.7670753289427,40.7670279682222,40.7670318046986,40.7669579364812,40.7669422272733,40.7669594333953,40.7670003192596,40.7670113343589,40.7669945156697,40.7669321185918,40.7669419506213,40.7670142707441,40.7670593813267,40.7671739162468,40.7672567941806,40.7672719425306,40.7672071668697,40.7670310899356,40.7669406317438,40.766914785036,40.766917042038,40.7669373615674,40.7669131335556,40.7669126121612,40.7669113353639,40.7668946020137,40.7668398937505,40.766803167772,40.7668889175288,40.7668939798399,40.7668759105041,40.7667645254284]}]],[[{"lng":[-73.906473146101,-73.9025117370094,-73.9023993608407,-73.9020632788676,-73.9020342853376,-73.9016968608997,-73.9007737589174,-73.9003262974382,-73.9001075937135,-73.8996163794179,-73.8992474849267,-73.8978318016958,-73.8972553665103,-73.8970241037333,-73.8969399356256,-73.8965120491361,-73.8963790528033,-73.8964008604913,-73.8963525132234,-73.8963036609653,-73.8963502624675,-73.8963688834432,-73.8965025483398,-73.8963785598223,-73.8962678562046,-73.8962865269983,-73.8962180352292,-73.8960437666813,-73.8961138186447,-73.8961332278004,-73.8962425979326,-73.8961401508982,-73.8960051677202,-73.8960274447233,-73.8959800132279,-73.8959296297553,-73.8959767322096,-73.8959997537749,-73.8961263263259,-73.8958291437706,-73.8968317382439,-73.8967770075138,-73.8967585725261,-73.8967226928147,-73.8967344194978,-73.896725136462,-73.8967300542102,-73.8967205217383,-73.8967556481393,-73.896771827075,-73.8967884498549,-73.8968280794559,-73.896806600943,-73.8968593888039,-73.8971553445903,-73.8970770778155,-73.8970670374688,-73.8970351011218,-73.8970438920438,-73.8970307401823,-73.8970608713766,-73.8970715206267,-73.8970834327814,-73.8971191326535,-73.8971109707653,-73.8971927355054,-73.8972969922041,-73.8974219896458,-73.8973312936992,-73.8973218790434,-73.8972874299452,-73.8972999827729,-73.8972874593484,-73.8973157079374,-73.8973420387514,-73.8973720966417,-73.8973620507754,-73.8974542605217,-73.8976139659438,-73.8977222652819,-73.8976401114823,-73.8976313250949,-73.8975962455615,-73.8976138130609,-73.8975987852621,-73.897631422534,-73.8976583777849,-73.8976859245572,-73.8976802682669,-73.8977534240651,-73.8978104387458,-73.8976751806963,-73.898761626615,-73.8988562039788,-73.9011457755211,-73.9017237316452,-73.9017493505536,-73.9017909311379,-73.9018523162193,-73.9018692558847,-73.901886114081,-73.9019194928561,-73.9019509578695,-73.9019834514795,-73.9020525643442,-73.9021170795793,-73.902171328119,-73.90217815316,-73.902183594596,-73.902187819089,-73.9023044303681,-73.9025124804179,-73.9025804939892,-73.9026772358211,-73.9026767708108,-73.9025792967235,-73.9023430388268,-73.9022548092287,-73.9021830370666,-73.9021496741191,-73.9020356579012,-73.9012912761893,-73.9012175409469,-73.9007284702245,-73.9003457266802,-73.9003496078034,-73.899479477527,-73.8986543784404,-73.89718604766,-73.8971138425062,-73.89705399045,-73.8970495925256,-73.8970432306266,-73.897035085108,-73.8970253868894,-73.8970144109085,-73.8970024683272,-73.89698989771,-73.8969770554258,-73.8969368091958,-73.8969343156557,-73.8969301725558,-73.8969245030632,-73.8969174757228,-73.8969092994462,-73.896900217301,-73.8968904992853,-73.8968804343006,-73.8968703215634,-73.8968194082322,-73.8968142358783,-73.8968073547501,-73.8967989511907,-73.8967892527708,-73.8967785221271,-73.896767049849,-73.8967551466102,-73.8967120798327,-73.8967051055797,-73.8966961158285,-73.8966853733364,-73.8966731920909,-73.8966599281328,-73.8966459691492,-73.8965946784282,-73.8965929555898,-73.896589913318,-73.8965856323322,-73.8965802262181,-73.8965738384145,-73.8965666384066,-73.8965588172303,-73.8965505824025,-73.8965421524156,-73.8965337509399,-73.8964843103949,-73.8964803061435,-73.8964747453439,-73.8964677705297,-73.8964595604788,-73.8964503256308,-73.8964403026929,-73.8964297485727,-73.8964189337935,-73.8963637901165,-73.8963617553213,-73.8963583714974,-73.8963537393544,-73.8963479967541,-73.8963413146082,-73.8963338917914,-73.8963259492222,-73.8963177232884,-73.8963094588111,-73.8962554267883,-73.8962475440766,-73.8962374163611,-73.8962253353687,-73.8962116490908,-73.8961967517591,-73.8961810724901,-73.8960029772821,-73.8960029746129,-73.8960018476962,-73.8960007212292,-73.8959995927677,-73.8959984678451,-73.8959973407167,-73.8959950891201,-73.8959939635351,-73.8959928364075,-73.8959905863624,-73.8959883354373,-73.8959872105117,-73.8959849602476,-73.895982710202,-73.8959804586154,-73.8959793336912,-73.895977083425,-73.8959737095955,-73.8959714602123,-73.8959692106069,-73.895966961234,-73.895964713186,-73.8959624629191,-73.895959091071,-73.8959568416994,-73.895953469189,-73.895951221138,-73.8959478470865,-73.8959455990354,-73.8959422278604,-73.8959399798119,-73.8959366084164,-73.8959343590428,-73.8959309885288,-73.8959276160194,-73.8959253684223,-73.8959219972472,-73.8959197498705,-73.8957431744655,-73.8957420473301,-73.8957409195167,-73.8957397923812,-73.895738666112,-73.8957364158353,-73.8957352895812,-73.8957341611062,-73.8957319117116,-73.8957296620967,-73.8957285349607,-73.8957262842434,-73.8957240348486,-73.8957217839099,-73.8957195345157,-73.8957172851206,-73.8957150361807,-73.8957127861239,-73.8957105360681,-73.8957082864685,-73.8957049139479,-73.8957026645511,-73.8957004149522,-73.8956970437537,-73.8956947943731,-73.8956914218521,-73.8956891722528,-73.8956857997317,-73.8956835516743,-73.8956801811532,-73.8956768077503,-73.8956745597077,-73.8956711885101,-73.8956678166666,-73.8956655699464,-73.8956621978825,-73.8954844938979,-73.8954833662952,-73.8954811153277,-73.8954799884034,-73.895478860579,-73.8954766111734,-73.8954754335978,-73.8954732323984,-73.8954709809903,-73.8954698551667,-73.8954676030979,-73.8954653536906,-73.895463104285,-73.8954608533346,-73.8954574794645,-73.8954552291761,-73.8954529784477,-73.8954507290404,-73.8954473562888,-73.8954451055591,-73.8954417323475,-73.8954394842822,-73.8954361117514,-73.8954327378792,-73.8954293653481,-73.8954271157387,-73.8954237432067,-73.8954203713384,-73.8954169988062,-73.8954136276165,-73.895410255086,-73.8954068832148,-73.895404635608,-73.8954012644182,-73.8953978912252,-73.8953945200354,-73.8949705077847,-73.8949693828254,-73.8949682543154,-73.894967127127,-73.8949659994976,-73.8949648723338,-73.8949637451451,-73.8949614950554,-73.8949603665449,-73.8949581162335,-73.8949569899512,-73.8949547391754,-73.8949524888647,-73.8949502387741,-73.8949479893448,-73.8949457390327,-73.8949434882816,-73.8949412388519,-73.8949389878791,-73.89493673845,-73.8949333645507,-73.8949311149247,-73.8949288654934,-73.894925492061,-73.8949232413079,-73.894919869418,-73.8949164968651,-73.8949142487821,-73.8949108768902,-73.8949075036785,-73.8949052540518,-73.8949018828475,-73.8948985109571,-73.8948951384036,-73.8948917671993,-73.8948895204644,-73.8948861490397,-73.8948827773691,-73.8948794052832,-73.8947140757471,-73.8947129472233,-73.894711820905,-73.8947106937316,-73.8947095658695,-73.8947084373462,-73.8947061879054,-73.8947050607061,-73.8947039335331,-73.8947016820809,-73.8946994326406,-73.8946983054666,-73.8946960551453,-73.8946938030321,-73.8946915535895,-73.8946893026067,-73.8946870531658,-73.8946848037244,-73.8946825547536,-73.8946791815009,-73.8946769307378,-73.8946746804425,-73.8946713078516,-73.8946690591005,-73.8946656851869,-73.8946634362145,-73.8946600645345,-73.8946566904281,-73.8946544423371,-73.8946510697734,-73.8946476978734,-73.8946443257804,-73.894640954098,-73.8946387058156,-73.8946353332523,-73.8946319633632,-73.8946285914905,-73.8946252202789,-73.8946218490674,-73.8946196023277,-73.8946162295734,-73.8946128596842,-73.8946094885024,-73.8946061179521,-73.8946027480936,-73.8946005027043,-73.8945971321541,-73.8945937614142,-73.8945903924367,-73.8945881448464,-73.894584777,-73.8945825316119,-73.8945791608725,-73.8945769155157,-73.8945735463174,-73.8945713022821,-73.8945679324247,-73.8945656868488,-73.8945634428147,-73.8945611978994,-73.8945589525423,-73.8945567085086,-73.8945544644752,-73.894552218899,-73.8944420040288,-73.8944442475896,-73.8944453679978,-73.894446487559,-73.89444760797,-73.8944487274988,-73.894449846586,-73.8944509676892,-73.8944520880998,-73.8944532063065,-73.8944532022452,-73.894454322656,-73.8944543185941,-73.8944543145321,-73.8944554340623,-73.8944554300004,-73.8944554259376,-73.894454298285,-73.8944542942231,-73.8944542901619,-73.8944531616248,-73.8944531589177,-73.8944520325872,-73.8944509040518,-73.8944508999889,-73.8944497721154,-73.8944486449014,-73.8944463941278,-73.8944462671622,-73.894445265592,-73.8944441370569,-73.8944430120791,-73.89444076039,-73.894438510278,-73.8944373817425,-73.8944351322915,-73.8944328819579,-73.8944306298273,-73.8944283803759,-73.8944261293816,-73.8944238799281,-73.8944216304763,-73.8944193794809,-73.8944160069077,-73.8944137565729,-73.8944103835275,-73.894408133886,-73.8944047599595,-73.8944025118598,-73.8943991399498,-73.8943957653598,-73.8943935157171,-73.8943901431456,-73.8943867712326,-73.8943834000141,-73.8943800274397,-73.8943777793414,-73.8943744079024,-73.8943710362094,-73.8943676641092,-73.8943642922293,-73.8943609210107,-73.894357549792,-73.8943541792346,-73.8943508080159,-73.8943474367973,-73.8943440669349,-73.8943406963775,-73.8943384509869,-73.8943350795819,-73.8943317077022,-73.8943283385014,-73.8943249692988,-73.8943227232499,-73.8943193554051,-73.8943159846592,-73.8943137386097,-73.8943103701031,-73.8943081238334,-73.8943047562078,-73.8943025106339,-73.8942991407729,-73.8942968967401,-73.8942946518266,-73.8942924071347,-73.8942901622207,-73.894287916866,-73.8942856741927,-73.8942834292791,-73.8942811845867,-73.8942800641801,-73.8942778201492,-73.8942767010686,-73.8942744557148,-73.8942733353093,-73.8942723422792,-73.8942722177708,-73.8942699737407,-73.8942688533372,-73.8942677329321,-73.8942677370013,-73.8942666179195,-73.8942654961601,-73.8942655002274,-73.8942643813682,-73.8942643854367,-73.8942643895059,-73.8942632684402,-73.8942632725095,-73.8942632765797,-73.8942644057823,-73.8942644098516,-73.89426441392,-73.8942655409201,-73.8942655449885,-73.894266672175,-73.8942677993945,-73.8942689279354,-73.8942700564771,-73.8942711828155,-73.8942723099998,-73.8942734378792,-73.894274566202,-73.8942768158749,-73.8942779422112,-73.8942801929866,-73.8942824440162,-73.8942835712018,-73.8942858213149,-73.8942880736684,-73.89429032312,-73.8942925725715,-73.8942948235676,-73.8942981966093,-73.8943004482653,-73.8943026972429,-73.8943060705046,-73.8943083199573,-73.8943116925259,-73.8943139432988,-73.8943173152041,-73.8943195641813,-73.8943229381042,-73.8943263100111,-73.8943296825783,-73.8943319306403,-73.8943353040898,-73.8943386759937,-73.8943420472051,-73.8943454191115,-73.894348790984,-73.8943521628896,-73.8943555334397,-73.8943589053122,-73.8943622758622,-73.8943656483959,-73.8943678953559,-73.894371265212,-73.8943746364234,-73.8943780056176,-73.894381376829,-73.8943847466873,-73.894388116543,-73.8943914870608,-73.8943937333264,-73.8943971023026,-73.894400472379,-73.8944027177641,-73.8944060856054,-73.8944094561256,-73.8944117016982,-73.8944139457301,-73.8944173155867,-73.8944195611597,-73.8944218058522,-73.8944251736954,-73.8944274177267,-73.8944296633013,-73.8944319073339,-73.894541001719,-73.8945398799546,-73.8945376359526,-73.8945365163923,-73.89453539598,-73.8945331504042,-73.8945320321953,-73.8945309104302,-73.8945297900202,-73.8945297940785,-73.8945286745167,-73.8945275541051,-73.8945275581642,-73.894526439075,-73.8945264431342,-73.8945253213707,-73.8945253254291,-73.8945253294883,-73.8945253335476,-73.8945253376068,-73.8945264647825,-73.8945264688409,-73.8945264729019,-73.894527600109,-73.8945276041682,-73.8945287313436,-73.8945298576689,-73.8945309861973,-73.8945321133734,-73.8945332396995,-73.8945343682266,-73.8945354947423,-73.8945366232711,-73.8945388727138,-73.894539999007,-73.894542250683,-73.8945445001243,-73.8945456273008,-73.8945478787551,-73.8945501290769,-73.8945523785188,-73.8945546295015,-73.8945568789414,-73.8945591270302,-73.894561377793,-73.8945647525855,-73.8945670006741,-73.8945692516562,-73.8945726233318,-73.8945748729912,-73.894578245549,-73.8945804949569,-73.8945838661921,-73.8945872402916,-73.8945894883797,-73.8945928609344,-73.8945962334916,-73.894599605357,-73.8946018543245,-73.8946052246471,-73.8946085974245,-73.894611967747,-73.8946153398327,-73.8946175865674,-73.8946209584327,-73.8947840379855,-73.894784042034,-73.8947851669972,-73.8947862955161,-73.8947874231513,-73.8947885503176,-73.8947896775111,-73.8947919269416,-73.89479305546,-73.8947941819647,-73.894796433405,-73.8947986843778,-73.894799810691,-73.8948020614424,-73.8948043117537,-73.8948065618455,-73.8948088121558,-73.8948110615862,-73.8948133110147,-73.8948155619858,-73.8948178114148,-73.8948211852849,-73.8948234355963,-73.8948268081412,-73.894829058232,-73.894832429457,-73.8948346790773,-73.8948380516245,-73.8948402997037,-73.8948436715877,-73.8948470447958,-73.8948504188847,-73.8948526669645,-73.8948560375002,-73.8948594100442,-73.8948627812412,-73.8948661524381,-73.8948695243234,-73.8948717723757,-73.8948751435726,-73.8948785141083,-73.8953092724716,-73.8953104009646,-73.8953115281341,-73.8953126552828,-73.8953137815697,-73.8953149087193,-73.8953160372109,-73.8953171628165,-73.8953194131044,-73.8953205415949,-73.8953216665402,-73.8953239172712,-73.8953261668974,-73.8953272940454,-73.8953295434521,-73.8953317941801,-73.8953340444678,-73.895336293875,-73.895338544823,-73.8953407928864,-73.8953430422914,-73.8953464177021,-73.8953486664265,-73.8953509151508,-73.8953542876952,-73.8953565373026,-73.8953587853663,-73.8953621578895,-73.8953644072755,-73.8953677791391,-73.8953711525463,-73.8953733992666,-73.8953767717895,-73.8953801423107,-73.8953823916963,-73.8953857637603,-73.8953891342814,-73.8953913823437,-73.8953947535261,-73.8955713262016,-73.89557132888,-73.8955724573594,-73.8955735825164,-73.8955747096552,-73.8955747123353,-73.8955758401351,-73.8955769650705,-73.8955780915489,-73.895580342266,-73.8955814680828,-73.8955825952229,-73.8955837201572,-73.8955859710962,-73.8955870982343,-73.8955893462907,-73.8955904725471,-73.8955927228235,-73.8955949708789,-73.8955972209365,-73.895598346734,-73.8956005956716,-73.895602845067,-73.8956050944426,-73.8956073427189,-73.8956095907729,-73.8956118401502,-73.8956140890867,-73.8956163371423,-73.8956185867381,-73.8956219592533,-73.895624205969,-73.8956264555653,-73.8956287029421,-73.895632074796,-73.8956343237155,-73.895636570431,-73.8956388198078,-73.8956421889995,-73.8956444370374,-73.8956466839733,-73.895828878691,-73.8958300058209,-73.8958311307467,-73.8958322592144,-73.8958333856847,-73.8958333883564,-73.895835638403,-73.8958367655325,-73.8958378939982,-73.8958390195848,-73.8958401467149,-73.8958423969822,-73.8958435219092,-73.8958457714978,-73.8958468970859,-73.8958491480114,-73.8958513973939,-73.8958536467645,-73.8958547719114,-73.8958570219557,-73.8958592715438,-73.8958615195917,-73.8958637689755,-73.8958660192246,-73.895868268815,-73.895870517523,-73.895873889365,-73.8958761374117,-73.8958783861203,-73.8958806350467,-73.8958840075514,-73.8958862555845,-73.8958885038521,-73.8958918763548,-73.8958941243879,-73.8958974942336,-73.8958997438234,-73.8959019905341,-73.8959053617021,-73.8959076097352,-73.8960637773843,-73.8960547506216,-73.8960463862991,-73.8960389060176,-73.8960325079566,-73.8960273616236,-73.8960236033629,-73.896021332744,-73.8960206099233,-73.8960214540502,-73.8960178238461,-73.8960142093417,-73.8960107200648,-73.8960074617487,-73.8960045331278,-73.8960020229462,-73.8960000072682,-73.8959985471735,-73.8959976869062,-73.8959974525343,-73.8959868494676,-73.8959760940446,-73.8959654931479,-73.8959553492511,-73.895945951788,-73.8959375688945,-73.8959304397581,-73.8959247677924,-73.8959207148341,-73.8959183965248,-73.8959178790117,-73.8959191770602,-73.8959163006894,-73.8959133159773,-73.8959103093565,-73.8959073678945,-73.8959045767714,-73.895902016814,-73.8958997621548,-73.8958978780854,-73.8958964191656,-73.8958954276434,-73.8958949322317,-73.8958949472769,-73.8958845381499,-73.8958740139161,-73.8958636612248,-73.8958537620529,-73.8958445860247,-73.8958363830681,-73.8958293766075,-73.8958237574776,-73.8958196787265,-73.8958172514469,-73.89581654175,-73.8958175689652,-73.8957935707561,-73.8957821287704,-73.8957706996527,-73.8957595923658,-73.8957491071725,-73.8957395275183,-73.8957311123695,-73.8957240892117,-73.8957186479012,-73.895714935532,-73.8957130524595,-73.8957130495879,-73.8957084636016,-73.8957041433333,-73.8957001838266,-73.8956966721887,-73.895693685674,-73.8956912899842,-73.8956838888882,-73.895674662904,-73.8956651184079,-73.8956555363855,-73.8956461989271,-73.8956373809234,-73.8956293419722,-73.8956223187364,-73.8956165179765,-73.8956121104639,-73.8956092259531,-73.8956079493623,-73.8956083182731,-73.8956103218245,-73.895605533545,-73.8956009456853,-73.8955966666507,-73.8955927975496,-73.8955894298037,-73.8955866429886,-73.8955845029531,-73.8955830602634,-73.8955824394269,-73.8955822772928,-73.8955825762164,-73.8955708104995,-73.8955588883595,-73.8955470942263,-73.8955357094756,-73.8955250057165,-73.8955152383113,-73.8954253684801,-73.8947742905354,-73.8954219797167,-73.8953575056751,-73.8953508303022,-73.8952787246653,-73.8952879617353,-73.894624393384,-73.8946009177459,-73.8952373986715,-73.8952126420444,-73.8952434310706,-73.8952661225134,-73.8953109816393,-73.8953166783332,-73.8953409217013,-73.8953485046738,-73.8953255801008,-73.8953559003853,-73.8953444784229,-73.895284679113,-73.8952764808978,-73.8952657942618,-73.8952529208588,-73.8952382240694,-73.8952315192508,-73.8952227873264,-73.8952122200424,-73.8952000494487,-73.8951865428028,-73.8951862108404,-73.895180952602,-73.8951709274137,-73.8951564390474,-73.8951379265152,-73.8951159507683,-73.8950911776987,-73.8950643579624,-73.8950609539905,-73.895055825154,-73.8950491106284,-73.8950409926186,-73.8950316914145,-73.8950214594134,-73.8950105742711,-73.895004260641,-73.8949934506938,-73.8949784651241,-73.8949597485055,-73.8949378561018,-73.894913437394,-73.894887216812,-73.8948849683982,-73.8948809497007,-73.89487526177,-73.89486804763,-73.8948594886814,-73.8948498001409,-73.8948392256292,-73.894828031045,-73.8948200560961,-73.8948082181827,-73.8947927834442,-73.8947740988851,-73.8947525845744,-73.8947287242006,-73.8947030541983,-73.8947014981501,-73.8946981733793,-73.8946931762352,-73.8946866515312,-73.8946787883488,-73.8946698145581,-73.8946599902137,-73.8946496000191,-73.8946429797258,-73.8946321465195,-73.8946173996284,-73.8945991463844,-73.8945778909718,-73.894554220501,-73.8945287887917,-73.8945228951785,-73.8945147639889,-73.8945045911926,-73.8944926219647,-73.8944791447768,-73.8944644844443,-73.8944590452341,-73.8944499051551,-73.894437302588,-73.8944215662195,-73.8944031064703,-73.8943824047906,-73.8943600011036,-73.8943364797234,-73.8943356369929,-73.8943331255908,-73.8943290128501,-73.8943234090378,-73.8943164643985,-73.8943083651259,-73.8942993283712,-73.8942895964207,-73.8942794301997,-73.8942730855967,-73.8942627145791,-73.8942486220937,-73.8942312225139,-73.894211027456,-73.8941886307359,-73.8941646909079,-73.8941399119007,-73.8941150223186,-73.8940907540174,-73.8940678205844,-73.8940468963558,-73.894028596588,-73.894013459367,-73.8940017780384,-73.8939899417857,-73.8939782281633,-73.89396691185,-73.8939562582079,-73.8939465170594,-73.8939379168297,-73.8939306591893,-73.8939071510805,-73.8938833881688,-73.8938599927784,-73.8938375776086,-73.8938167296871,-73.8937979949969,-73.8937818641769,-73.8937687596732,-73.8937590246751,-73.8937529141281,-73.8937407594954,-73.8937294363085,-73.8937192615912,-73.8937105202124,-73.8937034569106,-73.8936982694417,-73.8936677269819,-73.893639367224,-73.8936140085998,-73.8935923829304,-73.8935751143059,-73.8935627010757,-73.8935540271686,-73.8935457752744,-73.8935381578219,-73.8935313709076,-73.8935255892472,-73.893520961678,-73.8935176073273,-73.893515612546,-73.8934896507279,-73.8934652803588,-73.8934432307169,-73.8934241616321,-73.8934086437408,-73.8933971414096,-73.8933899988393,-73.8933809946988,-73.8933720653866,-73.8933634460653,-73.8933553637334,-73.8933480312474,-73.8933416417156,-73.8933363634124,-73.8933323353471,-73.8933296636024,-73.8933284185409,-73.8933286329521,-73.8933098487454,-73.8932911350585,-73.893272957584,-73.8932557686707,-73.8932399960665,-73.8932260322741,-73.893214224783,-73.8932048674228,-73.8931981930507,-73.8931943677572,-73.8931620256145,-73.8931341497277,-73.8931080016682,-73.893083410282,-73.8930609069206,-73.8923075020365,-73.8922970209444,-73.8928149442209,-73.8927491787641,-73.8921459358378,-73.8916545912373,-73.8917169010549,-73.8918895562188,-73.892141627146,-73.8922419109737,-73.8930098618019,-73.8930006898945,-73.8929894404066,-73.8929790227935,-73.8929697252278,-73.8929618048996,-73.8929554809009,-73.8929509281662,-73.8929237824389,-73.8928981286231,-73.8928746889067,-73.8928541231468,-73.8928370102942,-73.8928238320945,-73.8928149595269,-73.8927960712337,-73.8927787537252,-73.8927634710011,-73.8927506325414,-73.8927270755011,-73.8927049909514,-73.8926848969815,-73.8926672649821,-73.892652508587,-73.8926409739694,-73.8926329317211,-73.8926189481545,-73.8926059083424,-73.8925940928388,-73.8925837558559,-73.8925751197953,-73.8925683704623,-73.8925434699855,-73.8925199037092,-73.8924982278119,-73.8924789538568,-73.8924625367194,-73.8924493638516,-73.8924397461381,-73.892428338347,-73.8924176831658,-73.8924080361711,-73.8923996287568,-73.8923926625838,-73.8923873047433,-73.892355971522,-73.8923269032759,-73.892300891891,-73.892278645976,-73.8921783240054,-73.892161842019,-73.8921114885468,-73.8920848045048,-73.8922462702623,-73.8922350351257,-73.8922264084098,-73.8922206484647,-73.8922179277865,-73.8921977424317,-73.8921778678319,-73.8921588203941,-73.8921410950328,-73.8921251523102,-73.8921114064692,-73.89210021467,-73.8920918677101,-73.8920865824686,-73.8920844962708,-73.8920775931037,-73.8920705839726,-73.892063679936,-73.8920570888881,-73.892051009298,-73.8920456242341,-73.892041095851,-73.8920375605068,-73.8920351246574,-73.8920338616507,-73.892033809518,-73.8920349698288,-73.8920147354005,-73.8919948511951,-73.8919758490286,-73.8919582371257,-73.8919424865274,-73.8919290184922,-73.8919181932298,-73.8919103002665,-73.8919055507023,-73.8919040715649,-73.8919040639767,-73.8919068306299,-73.8919123031394,-73.891920346239,-73.891868794552,-73.8918487937602,-73.8918271316131,-73.8918044376359,-73.8917813713405,-73.8917586030588,-73.891736794462,-73.8917165793315,-73.8916985451401,-73.8916832159796,-73.8916710373299,-73.891662363113,-73.8916574454077,-73.8916564271246,-73.8916593378529,-73.8916660930011,-73.8916588007794,-73.8916523411459,-73.8916469081293,-73.8916426649219,-73.891639738977,-73.8916382181814,-73.8916381482149,-73.8916395311786,-73.8916423255321,-73.8916464473406,-73.8916369736213,-73.8916194579814,-73.8916047514405,-73.8915932607966,-73.8915853038919,-73.8915811008207,-73.8915807678416,-73.8915843141621,-73.8915916416842,-73.8916025477181,-73.8916167305895,-73.8916337979839,-73.8916532777989,-73.8916746312029,-73.8916798893539,-73.8916874147561,-73.8916983210651,-73.8917116359191,-73.8917270606879,-73.8917286120636,-73.8917338981269,-73.8917427776598,-73.8917550134465,-73.8917702786107,-73.8917881653483,-73.8918081958217,-73.8918298349251,-73.8918525045794,-73.8918497245071,-73.8918481315026,-73.8918477722286,-73.8918486572089,-73.8918507605199,-73.8918540205501,-73.8918583418053,-73.891863597705,-73.8918696342912,-73.8918762747375,-73.8918833245292,-73.8918905771609,-73.8918978201856,-73.8919048414375,-73.8919084321567,-73.8919158972964,-73.8919270368795,-73.8919415524999,-73.8919590553161,-73.8919790764671,-73.8920010796329,-73.8920244754003,-73.8920253185006,-73.8920279063255,-73.8920321717801,-73.8920380042741,-73.8920452525888,-73.8920537287979,-73.89206321314,-73.8920734597159,-73.8920842028644,-73.8920909215776,-73.8921016569689,-73.8921161450781,-73.8921340296756,-73.8921548710217,-73.8921781566782,-73.8922033141086,-73.8922095907272,-73.8922174335573,-73.8922266796097,-73.8922371367338,-73.8922465188453,-73.892256444581,-73.8922667735545,-73.8922675963712,-73.892269538286,-73.8922764099764,-73.8922872007676,-73.8923015855565,-73.8923191309631,-73.8923393083863,-73.89236150993,-73.8923869334564,-73.8923859472595,-73.8923859422902,-73.8923869186986,-73.8923888469189,-73.8923933526454,-73.8923989738098,-73.8924055948459,-73.8924130796313,-73.8924185390669,-73.892424355932,-73.8924304139368,-73.8924365919707,-73.8924427665236,-73.8924450471548,-73.8924476314052,-73.8924523947012,-73.8924592226352,-73.8924679512107,-73.892478370781,-73.892490231085,-73.8925032472575,-73.8925171066718,-73.892534845649,-73.8925128172442,-73.8924961922682,-73.892497107066,-73.8925439480314,-73.8925401814555,-73.8924774877329,-73.8924585642639,-73.8924370134927,-73.8924134110009,-73.8923883871692,-73.89236261034,-73.8923367689675,-73.8923115532295,-73.8922876365943,-73.892226234128,-73.8921639309213,-73.892101376906,-73.8920392246303,-73.8919781224518,-73.8918179184095,-73.8916685970292,-73.8915071884852,-73.8912965852538,-73.891195897044,-73.8921833074636,-73.8925225986089,-73.8925027192329,-73.8922536570346,-73.8928604007566,-73.8942324749779,-73.8965647755196,-73.895840749084,-73.8951305991231,-73.8944227655844,-73.893703053664,-73.8935608381839,-73.8934067519725,-73.8932423675106,-73.8930694376266,-73.8928899263955,-73.891358806501,-73.8907087069111,-73.8903419603085,-73.8895550745803,-73.8895264042492,-73.8894992181914,-73.8894739131481,-73.8894508583693,-73.8894303903859,-73.8894128079001,-73.8894022625029,-73.8890400025454,-73.8887089321047,-73.8886884136908,-73.8887444404909,-73.8886549578872,-73.8886214500179,-73.8885192580243,-73.8884237573072,-73.8883397556247,-73.8882713106102,-73.8882210938927,-73.8881900815474,-73.8881854192606,-73.8881775922634,-73.888130626839,-73.887818145648,-73.8877298822495,-73.8877066182002,-73.8877787738584,-73.888354711776,-73.8888165393255,-73.8892561949502,-73.8902903458953,-73.890513578572,-73.8910707878575,-73.8918353579635,-73.8916546392846,-73.8914448974731,-73.891730067629,-73.891818572436,-73.8921210344678,-73.8923944328483,-73.8926678131164,-73.893075162923,-73.8934960594546,-73.8943237202154,-73.8944322594536,-73.8944998080285,-73.8945602113229,-73.8946062741715,-73.8946432599384,-73.8948022255794,-73.8949549761795,-73.8949579650197,-73.8949945888893,-73.8950575871895,-73.8950665769515,-73.8951683706391,-73.8952493676186,-73.8952747945424,-73.8954244779486,-73.8955770438276,-73.8958599187409,-73.895984065028,-73.8960849253165,-73.8962474473163,-73.8964113840346,-73.8967062276317,-73.8970608179933,-73.8972716766544,-73.8973195757752,-73.8974273674472,-73.8978952811055,-73.8979114523291,-73.8982524029575,-73.8986613786671,-73.8990607288989,-73.8994103518506,-73.8994901883096,-73.8995625954032,-73.8996274187884,-73.8996845202942,-73.8997337782537,-73.8997750875714,-73.8998083602161,-73.8998335252937,-73.8998487650756,-73.8998595914061,-73.8998659865307,-73.8998679400511,-73.8998654486951,-73.8998585165688,-73.8998147477601,-73.8997265043898,-73.8995593819381,-73.899258571912,-73.8991209144408,-73.8986684806338,-73.8986486550348,-73.8986240117079,-73.8985946567442,-73.8985607157575,-73.8984080648332,-73.89837417164,-73.8983344773505,-73.8982898957431,-73.8982414530998,-73.8981902645821,-73.8981375085596,-73.897923512633,-73.8985422311188,-73.8986294744263,-73.8987381642835,-73.8992154677058,-73.8995734847149,-73.9003027629588,-73.9012134795135,-73.9021212034403,-73.9024721300924,-73.9029891234458,-73.9039228060483,-73.9049169137475,-73.9058644026395,-73.9061170803334,-73.9066854594976,-73.906908897675,-73.907594259872,-73.9082366112783,-73.9102312473466,-73.9106747489712,-73.9103411180102,-73.9098431864611,-73.9126711659089,-73.9131433924495,-73.9152560093149,-73.9181837583396,-73.9195757355013,-73.9202133376663,-73.920539001505,-73.9207124344269,-73.921014801325,-73.9216120809142,-73.9225504306775,-73.9246336947016,-73.9265160561276,-73.9315191206656,-73.933939394172,-73.9353868532155,-73.9367254201155,-73.9368348054646,-73.9373965378215,-73.9373928572593,-73.9373855812787,-73.9373836877828,-73.937381538012,-73.9373804606774,-73.9372960072456,-73.9373262628454,-73.9374154885158,-73.9374297356962,-73.9378116270893,-73.9379820917095,-73.9386371583589,-73.9394428434305,-73.9400209980992,-73.9402628154808,-73.94039280634,-73.9405203088532,-73.9410861243826,-73.9417770356669,-73.9418744195925,-73.9423834770959,-73.9425402228334,-73.942719280804,-73.9438353681251,-73.9440358037089,-73.9462957550284,-73.9478967108823,-73.9487795492734,-73.948970213573,-73.9490420195343,-73.9490827060623,-73.9491129519947,-73.9508076381835,-73.9507712265949,-73.9507348149569,-73.9506634182629,-73.949150218094,-73.9478318958303,-73.9459642421985,-73.9458055480488,-73.9457052564074,-73.944730489721,-73.9447146080307,-73.9446762807938,-73.9435028203273,-73.9415852327176,-73.9413117494145,-73.9404625695171,-73.9403510378443,-73.9398355934912,-73.9395332166372,-73.9393658722384,-73.9389550245331,-73.9381973075476,-73.938069432176,-73.937887684264,-73.9377781667848,-73.9379620093891,-73.9379582289513,-73.9374710911687,-73.9368146065473,-73.9366853911941,-73.9367073798919,-73.9364038180227,-73.9361691391956,-73.9357402143262,-73.9352401683119,-73.9348953389456,-73.9346949906703,-73.935147154026,-73.9350081387223,-73.934940272005,-73.9349389295669,-73.9349048128265,-73.9345273010944,-73.9344854830391,-73.934857909749,-73.9348701816343,-73.9349539871494,-73.9349294331986,-73.9348371529981,-73.9348428269752,-73.9344801508905,-73.9344352574318,-73.934826227617,-73.9348085889711,-73.9348068134416,-73.9351501780753,-73.9355484466961,-73.935567971159,-73.9356085344977,-73.9355892281931,-73.9360533502869,-73.9374663853708,-73.9378133596951,-73.9378581182278,-73.937654830247,-73.9370470215374,-73.9370301277382,-73.936380228837,-73.936089196991,-73.935854526415,-73.9355093886364,-73.9350823255826,-73.9347435301128,-73.934373228561,-73.9338113285941,-73.9328924547043,-73.9327747786772,-73.9327412296534,-73.9327221045397,-73.9326493117339,-73.931846460775,-73.9317883430521,-73.93104964299,-73.9310737714675,-73.9308830426319,-73.9306285655417,-73.9298805856625,-73.9290357214348,-73.9286051502335,-73.9283956114139,-73.9282773083272,-73.926318334039,-73.9258220124597,-73.9257452164664,-73.9256507624441,-73.9255730426292,-73.9248734454787,-73.9242336300752,-73.9231869439802,-73.922956526902,-73.9226301383084,-73.9220996549944,-73.9209756209968,-73.9199645879303,-73.9190903474066,-73.9184738422549,-73.9181886300531,-73.917738074403,-73.9172451642752,-73.9171711864643,-73.9171820067968,-73.9168327701642,-73.9157517289456,-73.9154171875742,-73.915343512709,-73.9152601400216,-73.9155871020589,-73.9142394796457,-73.9125998597762,-73.9124081100032,-73.9126674836073,-73.9122295242643,-73.9120685357867,-73.9119511090557,-73.9120797509054,-73.911837777361,-73.9116934237208,-73.9112495910534,-73.9109429750036,-73.910904870988,-73.9102221578412,-73.9098586292578,-73.9067799142077,-73.906473146101],"lat":[40.7901811752081,40.7894720845257,40.7895516206859,40.7894944059978,40.7894146869293,40.789320323824,40.7891438182516,40.7890076628257,40.7888504895971,40.7884004962364,40.7881486596258,40.7871821703941,40.786750956944,40.7866581569601,40.7866246689697,40.786068659026,40.7861310815836,40.7861579117736,40.7861793102033,40.7861192015626,40.7860973196128,40.786120230201,40.7860574678441,40.7859089810945,40.7859605719464,40.7859837186365,40.7860160228713,40.7857999874805,40.7857673421654,40.7857914035649,40.785740432992,40.7856071672883,40.7856666502386,40.7856892864258,40.785711675769,40.7856489443138,40.7856270877598,40.7856557520184,40.7855931688089,40.7852215273835,40.7844276637035,40.7843884209637,40.7844032760117,40.7843775493258,40.7843680998444,40.7843614421092,40.7843574786778,40.7843506439794,40.7843223393758,40.7843339410958,40.7843205484267,40.7843489645512,40.7843662706263,40.7844041204828,40.7841949628569,40.7841338313281,40.7841400172814,40.7841161627917,40.7841071162344,40.7840990042975,40.7840732993185,40.7840785501965,40.7840780848955,40.7841005127352,40.7841081296958,40.7841685374298,40.7840948569066,40.7839963147211,40.7839282029087,40.7839348653813,40.7839152982092,40.7839062549849,40.7838962377009,40.7838719598007,40.7838710303746,40.7838934536134,40.7839029755204,40.7839708738884,40.7838449677848,40.7837434648356,40.7836821189856,40.783688305432,40.7836711196673,40.7836616044223,40.78365015495,40.7836249284895,40.7836259059847,40.7836507087883,40.7836597575081,40.7837142604789,40.7836844615451,40.7835842727554,40.782748945882,40.782804304604,40.7827111060906,40.7821292546379,40.7821172376041,40.7821019195106,40.782080999301,40.7820740337806,40.7820658177788,40.7820456213517,40.7820212890945,40.7819904835165,40.7819180789937,40.781847706125,40.7817896965917,40.7817805618635,40.7817697698042,40.7817571387903,40.7815198932185,40.7811082513607,40.7808148981236,40.7805941317424,40.7803525720467,40.7802891208356,40.7801872448046,40.7802741683168,40.7803593666495,40.7807804939543,40.781203101963,40.7818584192704,40.781819112422,40.781979495284,40.7820660545113,40.7821644100274,40.7821698859373,40.7819954203208,40.7828072099636,40.7827230742387,40.7827563539879,40.7827655343607,40.7827740237438,40.7827815814688,40.7827879932791,40.782793077404,40.782796689712,40.7827987277962,40.7827991338784,40.7828215131264,40.7828289764549,40.7828360032633,40.7828423846557,40.7828479309232,40.7828524771841,40.782855888285,40.7828580628191,40.7828589361411,40.7828584822882,40.7828867930694,40.7828950374301,40.7829025253683,40.782909054108,40.7829144468487,40.782918557553,40.7829212749014,40.7829225253072,40.7829464718299,40.7829559205995,40.7829643282805,40.7829714491281,40.7829770750098,40.7829810414889,40.7829832326306,40.7830117517103,40.7830180363387,40.7830240249902,40.7830295587699,40.7830344908517,40.7830386903741,40.7830420459124,40.7830444684352,40.7830458936663,40.7830462837904,40.7830456284566,40.7830731198721,40.7830807781939,40.7830878526371,40.7830941618698,40.7830995441738,40.7831038615901,40.7831070034549,40.7831088892358,40.7831094705966,40.783140132948,40.7831462329441,40.7831519763329,40.7831571921793,40.7831617252486,40.7831654406273,40.7831682277377,40.7831700036297,40.7831707154489,40.78317034201,40.7832003873084,40.783210988532,40.7832204238211,40.7832284213932,40.7832347508789,40.7832392299579,40.7832417296106,40.7833367268055,40.7833384357296,40.7833409960083,40.7833427039183,40.7833452653683,40.7833469721069,40.7833486800163,40.78335123928,40.7833529466881,40.7833546539273,40.7833563608231,40.7833580665454,40.7833597749592,40.783361480682,40.7833631875777,40.7833648932992,40.7833666005403,40.7833683074356,40.7833691574295,40.7833708631529,40.7833725700487,40.7833734227327,40.7833742737425,40.7833759806376,40.783376831638,40.7833776833166,40.7833785349864,40.7833793876712,40.7833802381668,40.7833810908515,40.7833810878076,40.783381938817,40.7833819357727,40.783382788456,40.7833827854124,40.7833836360762,40.7833836340464,40.7833836310019,40.7833836289722,40.783481696872,40.7834834036062,40.7834859655568,40.7834876722909,40.7834902332377,40.7834919401283,40.7834936468632,40.7834962088131,40.7834979152019,40.7834996214229,40.7835013281568,40.7835030345443,40.7835047407653,40.7835064476551,40.7835081533735,40.7835098595944,40.7835107122739,40.7835124186617,40.7835141243793,40.7835149758853,40.7835158275478,40.7835175344385,40.7835183854419,40.7835192371053,40.7835200892813,40.7835209409434,40.7835217919465,40.7835226436084,40.7835234951153,40.7835234920643,40.7835243437251,40.7835243416901,40.7835251923476,40.783525189295,40.783525187261,40.7835251842081,40.7836258131566,40.7836283734296,40.7836309345265,40.7836326412582,40.783635202201,40.7836369084172,40.7836394319568,40.7836411767475,40.7836437371737,40.7836454444089,40.7836480043318,40.7836497112179,40.7836514169313,40.7836531238159,40.7836548285091,40.7836565347241,40.7836582404361,40.7836599468193,40.783660798474,40.7836625046884,40.7836642105544,40.7836650620566,40.7836659132086,40.7836676184036,40.7836684695554,40.7836693217261,40.7836701733802,40.7836710233597,40.7836718750137,40.7836718719543,40.7836727224354,40.7836735740897,40.7836735720498,40.78367356899,40.7836744201403,40.7836744170803,40.7839097751559,40.783911482387,40.7839140433241,40.783916604765,40.7839191662055,40.783920873602,40.7839234350428,40.7839251412483,40.7839277021854,40.7839294090607,40.7839311162904,40.7839336762044,40.7839353824095,40.7839370887823,40.7839387949881,40.7839405018632,40.7839422075651,40.7839439137708,40.7839456201425,40.7839473258455,40.7839490310259,40.7839498836894,40.783951590565,40.7839524410311,40.7839541474027,40.78395499787,40.7839558495093,40.7839567016713,40.7839575533111,40.7839584032743,40.7839592559373,40.7839592528629,40.7839601033296,40.7839609549683,40.7839609518936,40.7839609498445,40.7839609467694,40.7839617974034,40.7839617943276,40.784052182325,40.7840547442647,40.7840573052013,40.7840590130978,40.7840615745355,40.7840641359726,40.7840658428438,40.7840684031094,40.7840701105033,40.7840726709143,40.7840743771152,40.7840760850117,40.7840777907092,40.7840803506168,40.7840820579903,40.784083763687,40.7840854698877,40.7840871762559,40.7840880277424,40.784089733586,40.7840914392827,40.7840922919406,40.7840939971145,40.7840948487685,40.784096553941,40.7840974060973,40.7840982565572,40.7840991081875,40.7840999603444,40.7841008119759,40.7841016619327,40.78410165885,40.784102510482,40.7841025084265,40.784103359555,40.784103356474,40.784103353391,40.7841033503086,40.784103347226,40.7841033451716,40.7841033420874,40.7841033390058,40.7841024817111,40.7841024786286,40.7841016208323,40.7841007657395,40.7841007626568,40.7840999048594,40.7840990475661,40.7840981907958,40.7840964799616,40.7840956243659,40.784094766568,40.7840930560903,40.7840921994664,40.7840904896598,40.7840896318624,40.7840879208817,40.7840862105724,40.7840845000947,40.7840827902867,40.7840810799772,40.7840793695002,40.7840776591893,40.7841347859639,40.7841373499844,40.7841399146514,40.7841416234305,40.7841441864223,40.7841467499158,40.7841493139114,40.784151023362,40.7841535868563,40.7841561503485,40.7841587123103,40.7841612758046,40.784163838269,40.7841664007334,40.7841689637242,40.7841715261887,40.7841740891556,40.7841766500884,40.7841792125528,40.7841817745146,40.7841843371219,40.784186044873,40.784188605807,40.7841911672415,40.7841937302085,40.784196291141,40.7841988530793,40.7842005594416,40.7842008474689,40.784203120876,40.7842056818079,40.7842073890337,40.7842099506121,40.7842116563047,40.7842142172365,40.7842159229296,40.7842176291245,40.7842201907023,40.7842218963953,40.7842236020868,40.7842253089525,40.7842270146453,40.7842287208393,40.784229572464,40.784231278826,40.7842329839918,40.7842338361425,40.7842355408047,40.7842363934593,40.7842372434088,40.7842389492428,40.7842398018958,40.7842406518444,40.7842415034688,40.7842415003793,40.7842423520028,40.7842432034842,40.7842432003942,40.7842440520183,40.7842440489275,40.7842440458369,40.7842440427467,40.7842440396564,40.7842440365666,40.7842440334761,40.7842440303855,40.7842431725816,40.7842431694915,40.7842423143936,40.784241456588,40.7842414534964,40.7842405956926,40.7842397390615,40.7842388822874,40.7842371702728,40.7842363141425,40.7842354578709,40.7842337465255,40.7842328902536,40.7842311794114,40.7842294684255,40.7842286106203,40.7842269008084,40.7842251904931,40.7842234795079,40.7842217696951,40.7842200598818,40.7842174941838,40.7842157843709,40.7842140740555,40.7842115115647,40.7842098012499,40.7842072365825,40.784205526769,40.7842029637756,40.7842006880375,40.7842003997796,40.7841986892971,40.7841961252985,40.784193562305,40.7841909998407,40.7841884363458,40.7841867263903,40.7841841650986,40.7841816004312,40.7841790384694,40.784176476005,40.7841739130109,40.7841713505465,40.7841687875795,40.78416622665,40.7841636641856,40.7841611022238,40.7841585402871,40.7841559783253,40.7841542704331,40.7841517089992,40.784149148069,40.7841465866363,40.7841440246989,40.7841423179793,40.7841397570485,40.7841371944428,40.784135488753,40.7841329278207,40.7841312216292,40.7841286612261,40.7841269533337,40.7841252476441,40.7841226860694,40.7841209803791,40.7841192746887,40.784117567827,40.7841158631672,40.7841141569761,40.7841133048269,40.784111600167,40.7841098933037,40.7841090416822,40.7841073359926,40.784106485543,40.7841056333935,40.7841039282311,40.7841030766086,40.7841022254892,40.7841022275504,40.7841013759291,40.7841005259814,40.7841005290723,40.7840996774492,40.7840996805404,40.7840988294197,40.7840988325096,40.7840988356005,40.7840988386902,40.7840988417815,40.7840988438411,40.7840997011417,40.7840997042316,40.784100562034,40.7841005651237,40.7841014212513,40.784102279054,40.7841031363547,40.7841039931276,40.7841048497565,40.7841057075591,40.7841065638285,40.7841082751706,40.784109131298,40.7841108422818,40.7841125520915,40.7841134098934,40.784115120877,40.7841168311897,40.7841185420287,40.7841202525082,40.7841219628216,40.7841236726309,40.7840656918014,40.7840639818484,40.7840614173268,40.7840597073759,40.7840571438824,40.7840554340737,40.7840528710847,40.7840511618018,40.7840485971356,40.7840460351737,40.7840443263954,40.7840417629019,40.7840392004374,40.784036636945,40.7840340744806,40.7840323645275,40.7840298025656,40.7840272401012,40.7840246776367,40.7840221151723,40.7840204084502,40.7840178464883,40.7840152828512,40.7840127214146,40.7840101589502,40.7840084522281,40.7840058907907,40.7840033298579,40.7840016226332,40.7839990605256,40.7839965002629,40.7839947923675,40.7839922309321,40.7839905240642,40.7839888173411,40.7839862569335,40.7839845507356,40.7839828428406,40.7839802829352,40.7839785772406,40.7839768703724,40.7839751646784,40.7839734589828,40.7839726063252,40.7839709001282,40.7839691942894,40.7839683416317,40.7839666359373,40.7839657848099,40.7839640791142,40.7839632274849,40.7839623765034,40.7839615248727,40.7839606737471,40.7839598210889,40.7839589711344,40.7839581195045,40.7839581225885,40.7839572711035,40.7839572741858,40.7839564225558,40.783956425638,40.7839564287217,40.7839564307762,40.7839564338594,40.7838677521965,40.7838651902346,40.7838634830053,40.7838609203947,40.783858358956,40.7838566522313,40.7838540912947,40.783852385092,40.7838498224813,40.783848115756,40.7838455558456,40.7838438496441,40.783841287534,40.7838395818348,40.7838378756326,40.7838361687601,40.7838344630604,40.7838327561872,40.7838310504866,40.7838293447874,40.7838276385841,40.7838267869489,40.7838250800762,40.7838242301148,40.7838225232419,40.7838216716039,40.7838208206175,40.7838199689806,40.7838191168201,40.7838182663551,40.7838174147185,40.7838165635852,40.7838157109218,40.783815713997,40.7838148640347,40.7838148671103,40.7838148701858,40.7838140185474,40.7838140205981,40.7838140236734,40.7838140267479,40.7835761138405,40.7835735517273,40.7835709902829,40.7835692830504,40.7835667221078,40.7835650142052,40.783562452762,40.7835607455281,40.7835590398183,40.7835564788776,40.783554770973,40.7835530635883,40.7835513578778,40.7835496506452,40.7835479442644,40.7835462385548,40.7835445323422,40.7835428254586,40.7835411197491,40.7835402675788,40.7835385618678,40.7835368566767,40.7835360045068,40.7835351523369,40.7835334476455,40.7835325944711,40.7835317417979,40.7835308918208,40.7835300391487,40.7835291879982,40.7835283363464,40.7835283383862,40.7835274884087,40.7835274914686,40.783526638796,40.7835266418571,40.7835266449168,40.7835257927454,40.7835257958055,40.7834302920782,40.7834285843268,40.783426022881,40.7834243149741,40.7834226082416,40.7834208993175,40.7834191925856,40.7834174853485,40.7834157779453,40.7834140722308,40.7834123649945,40.7834106570892,40.7834089503546,40.7834072434676,40.783405536735,40.7834046840572,40.7834029773238,40.7834012711061,40.7834004189308,40.7833987115401,40.7833978595207,40.7833970068435,40.7833952999547,40.7833944489531,40.7833935962752,40.7833927447697,40.7833918925952,40.7833910404204,40.7833901877421,40.7833893367404,40.7833884850804,40.7833884871153,40.7833876356109,40.7833876376463,40.7833867859855,40.7833867880221,40.7833867900568,40.7833859378818,40.7833859409328,40.7833859429685,40.7833859450032,40.783287882832,40.783286176097,40.78328446936,40.783281907409,40.7832801995007,40.7832784917492,40.7832767848565,40.7832750781214,40.7832725171755,40.783270810439,40.7832691032013,40.783267395806,40.7832656878962,40.78326483689,40.7832631289808,40.7832614232612,40.7832597175402,40.7832588648585,40.7832571569487,40.7832554507256,40.7832545997192,40.7832537470361,40.7832520401422,40.7832511891363,40.7832503364544,40.7832494842743,40.7832486337791,40.7832477815982,40.7832469289154,40.783246077908,40.7832452262404,40.7832452282714,40.7832443755879,40.7832435250927,40.7832435271236,40.7832435301677,40.7832426774852,40.7832426795147,40.7832426825598,40.7832426845904,40.7831572018052,40.7831546582469,40.783151035274,40.7831464288721,40.7831409610814,40.7831347767635,40.783128039763,40.7831209285673,40.7831136315775,40.7831063421167,40.7831065143863,40.7831062055301,40.7831054249072,40.7831041961724,40.7831025565592,40.7831005557516,40.7830982543788,40.7830957221776,40.7830930358798,40.7830902768863,40.7830916480729,40.7830916431729,40.7830902623259,40.7830875449316,40.7830835685248,40.7830784465636,40.783072325192,40.7830653790698,40.7830578063894,40.7830498232204,40.7830416573447,40.7830335417574,40.7830342141582,40.7830345061134,40.7830344091684,40.7830339261306,40.7830330709882,40.7830318685046,40.783030353502,40.7830285698527,40.7830265692084,40.7830244095048,40.7830221532836,40.7830198658816,40.7830210529763,40.783020922568,40.7830194782084,40.7830167592378,40.783012839713,40.7830078263901,40.7830018558175,40.782995090616,40.7829877150495,40.7829799300068,40.782971947529,40.7829639850353,40.7829458710968,40.7829465288193,40.78294575252,40.7829435631848,40.7829400199977,40.7829352187416,40.7829292892086,40.7829223916914,40.7829147126501,40.7829064596717,40.7828978558582,40.7828891337957,40.7828880275271,40.782886417817,40.7828843400782,40.7828818400199,40.7828789726423,40.7828758010261,40.7828703328313,40.7828723529492,40.7828731445115,40.7828726842147,40.7828709856099,40.7828680987032,40.7828641084838,40.782859132422,40.7828533170106,40.7828468334527,40.7828398726211,40.7828326394391,40.7828253468482,40.7828182095384,40.7828174961035,40.7828162332781,40.7828144509011,40.7828121910881,40.7828095072353,40.782806462759,40.7828031295962,40.7827995865052,40.7827967168999,40.782793811363,40.7827909121037,40.7827923769492,40.7827924470797,40.782791120822,40.782788429817,40.7827844382647,40.7827792413927,40.7827199708044,40.7822535924943,40.7817177710163,40.7816576571335,40.78166394584,40.7817226869596,40.7817292382265,40.7822698091908,40.7822531589814,40.7817346547735,40.7817170967076,40.7816920153175,40.7817081101756,40.7816715658941,40.7816756057517,40.7816558547445,40.7816492654844,40.781626273911,40.781595651496,40.7815855663113,40.7815412492548,40.7815530729708,40.7815636865223,40.7815727903174,40.7815801273806,40.7815909328328,40.7816008664813,40.7816097101899,40.7816172697569,40.781623379179,40.781644994973,40.781666239517,40.7816864690752,40.781705070667,40.7817214806404,40.7817352017521,40.7817458182341,40.7817530083932,40.781761208572,40.7817688727072,40.7817757928249,40.7817817811409,40.7817866751561,40.7817903420666,40.7817926823669,40.7818130142095,40.7818322209178,40.7818497326873,40.7818650299965,40.7818776590197,40.7818872450916,40.7818935038217,40.7819021525235,40.7819104223285,40.7819181052907,40.7819250082202,40.781930957541,40.7819358036561,40.7819394247086,40.7819417296461,40.7819618240189,40.7819807861312,40.7819981896728,40.7820136433733,40.7820267997989,40.7820373631632,40.7820450959781,40.7820531234857,40.7820608340575,40.7820680042461,40.7820744262638,40.7820799140047,40.7820843084373,40.7820874822137,40.7820893433597,40.7821090981059,40.7821277465665,40.7821447736393,40.7821597090071,40.782172140129,40.7821817236355,40.7821881948132,40.7821995325474,40.7822100402741,40.7822194647452,40.7822275788204,40.782234186941,40.7822391298438,40.7822569409151,40.7822738541986,40.7822894285774,40.7823032578541,40.7823149813454,40.7823242932891,40.782330950819,40.7823347802988,40.7823426053488,40.7823502209624,40.7823574229561,40.7823640182359,40.7823698299743,40.7823747023517,40.7823785047336,40.7823811351737,40.7823825231465,40.7824008524804,40.7824180884099,40.7824337241294,40.7824472998856,40.7824584164962,40.7824667470877,40.7824720467065,40.7824741595222,40.7824730234095,40.7824686717745,40.7824612325733,40.7824509245488,40.7824380507988,40.782422989864,40.7824244429928,40.7824245233791,40.7824232291378,40.7824205906182,40.7824166696924,40.7824115583042,40.7824053763131,40.7823982686837,40.7824009200656,40.7824006544732,40.7823974788621,40.7823914763978,40.7823828042783,40.7823716896166,40.782358423493,40.782343353332,40.7823268738034,40.7823094164866,40.7823064018013,40.7823018888178,40.7822960038896,40.7822889117816,40.7822808110567,40.782271928517,40.7822641057377,40.7822524661711,40.782237345723,40.7822191807537,40.7821984954845,40.7821758868696,40.7821744117371,40.7821719011388,40.782168419705,40.7821640570587,40.7821589255075,40.7821531571533,40.782146900491,40.7821403165861,40.7821350106263,40.7821263830711,40.7821146920984,40.7821002875585,40.7820836005041,40.7820651302916,40.7820454296374,40.7820456351824,40.7820447309683,40.7820427408084,40.7820397171158,40.7820357395223,40.7820309127821,40.7820253640121,40.7820192393448,40.7820127000794,40.7820059184339,40.7819990730097,40.781999861872,40.7819983955219,40.7819947104497,40.781988898359,40.7819811038842,40.7819715209919,40.7819603881534,40.7819479824104,40.781934612481,40.7819206110766,40.7819002808308,40.7818764330712,40.7818698262456,40.7818603770672,40.7818482897072,40.7824660415738,40.7825343504886,40.7829132149827,40.7829657066848,40.7825408426915,40.7821947815307,40.7821422860273,40.7822580658053,40.7824317265032,40.7824107995637,40.7817980235622,40.7817797192584,40.7817766177032,40.7817721417665,40.7817664152622,40.7817595965972,40.7817518743901,40.781743462253,40.7817384165366,40.7817299919599,40.7817184256857,40.7817040433197,40.7816872497439,40.7816685177189,40.7816483745744,40.7816422346831,40.7816338347736,40.7816233999105,40.7816112096827,40.7816052557874,40.7815966371554,40.7815855559745,40.7815722722023,40.7815570974673,40.781540387759,40.7815225350758,40.7815184127877,40.7815127799254,40.781505757681,40.7814974971392,40.7814881760273,40.7814779948904,40.7814728319313,40.7814648307299,40.7814541801194,40.7814411314608,40.7814259927101,40.7814091211508,40.7813909149612,40.7813878835019,40.781383549446,40.7813780167509,40.7813714181245,40.7813639118426,40.7813556779515,40.7813471834275,40.7813348868921,40.7813191233317,40.7813003221828,40.7813707510488,40.7813581916557,40.7813951792091,40.7813736503221,40.7812547522979,40.7812439935277,40.7812319234787,40.7812189036229,40.7812053238765,40.7812050943529,40.7812024025733,40.7811973184792,40.7811899741718,40.7811805604802,40.7811693220027,40.7811565507513,40.7811425785644,40.7811277684842,40.7811125053238,40.7811134282587,40.7811134301702,40.7811125110007,40.7811106984283,40.7811080470329,40.7811046366534,40.7811005699829,40.7810959694766,40.7810909736648,40.7810857329809,40.781080405232,40.7810751508469,40.7810747794766,40.7810719060851,40.781066607523,40.7810590255039,40.7810493628135,40.7810378778865,40.7810248778943,40.7810107105294,40.7809957547061,40.7809804104263,40.7809669558761,40.7809536667006,40.78094087137,40.7809288861475,40.7808926841164,40.780901419761,40.780907446138,40.7809105881145,40.7809107543811,40.780907940106,40.7809022270752,40.7808937813154,40.7808828482697,40.780869745664,40.7808548542739,40.7808386068586,40.7808214755846,40.7808039583037,40.7807865640852,40.7807697984216,40.7807666150957,40.7807625225033,40.7807576435743,40.7807521248576,40.7807461321198,40.7807398453655,40.7807334534307,40.7807271483107,40.7807211193931,40.780715547769,40.7807085969404,40.780696824524,40.7806830082004,40.7806675301453,40.7806508184995,40.7806333355259,40.780615564823,40.7805979979478,40.7805811208187,40.7805654002746,40.7805512711621,40.7805391243065,40.7805292957019,40.780522057217,40.7805089203533,40.7804964371654,40.7804835551032,40.7804720555873,40.780462196532,40.7804446725114,40.780427574667,40.7804113597616,40.78039646097,40.7803832763076,40.780372157997,40.7803634030591,40.7803572453781,40.7803538494537,40.7803487393235,40.7803433436792,40.7803378205724,40.7803323317885,40.7803270381074,40.7803220945939,40.7803176460556,40.7803138228009,40.7803107368222,40.7803084785153,40.7803071140315,40.7803066833397,40.780307199056,40.7803086460738,40.7802903670559,40.7802727780973,40.7802563503657,40.7802415239221,40.7802286959321,40.7802182100273,40.7802103471005,40.7802053177805,40.7801970025639,40.7801888979995,40.7801812142133,40.7801741504215,40.7801678897663,40.7801625945664,40.7801584021098,40.7801554210935,40.7801537288057,40.780133795168,40.7801149049577,40.7800975226389,40.7800820755997,40.7800689436444,40.7800584496548,40.7800508516516,40.7800422267075,40.780034377403,40.7800274668613,40.7800216386966,40.7800177330085,40.7800147016058,40.7800125873637,40.7800030726554,40.7799936523649,40.7799759689011,40.7799594550567,40.7799446083531,40.7799318760848,40.7799216418432,40.7799142139603,40.7799074284637,40.7799031912418,40.7798988882171,40.7798946496856,40.7798906039905,40.7798844290687,40.7798788074543,40.7798738547224,40.7798696726965,40.779867452147,40.7798658391036,40.7798648658141,40.7798645517362,40.779864903149,40.7798420608318,40.7798311879623,40.7798207491949,40.7798109952518,40.7798021604065,40.7797944568575,40.7797880696311,40.7797831521378,40.7797798224875,40.7797705195885,40.7797417868495,40.7797021126964,40.7796744120368,40.7795755957472,40.7795518342715,40.7795146526437,40.7795280935235,40.7795390119236,40.7795471162329,40.7795521899995,40.779554097712,40.7795527884187,40.7795482970886,40.7795407436772,40.779531644327,40.779527353468,40.7795279158617,40.7795333256412,40.7795435263729,40.7795885736286,40.7794925389073,40.7790978666683,40.778915764469,40.7785632878871,40.7777218134874,40.7774046289891,40.7773646943,40.7772045230289,40.777159074851,40.7781536132297,40.7762470243255,40.7757348317729,40.775233454495,40.7747348382503,40.7742260143936,40.7741222976583,40.774027592863,40.7739430191483,40.7738694852488,40.7738076612117,40.7734651438648,40.7733195299268,40.7732376050299,40.7730684109404,40.7730603721408,40.7730497637638,40.7730367406239,40.773021492612,40.7730042423989,40.7729852417294,40.7729267175712,40.7709162384816,40.7690915232463,40.7689775966221,40.7689181792537,40.7689011951585,40.76889404946,40.7688578407815,40.7688076442263,40.768744806519,40.7686718716451,40.7685922895697,40.7685098733129,40.7684794043916,40.7684282567008,40.7682641924714,40.7672020782521,40.7669144343695,40.7668385980515,40.7668232966881,40.7666977132982,40.7665953489592,40.7665207283635,40.7663451977956,40.7663252110565,40.7662753380706,40.7662270800494,40.7661565361589,40.7660746541344,40.7660506352475,40.7660441321068,40.7660219066069,40.7660039817046,40.7659896840764,40.7659734302094,40.7659509300008,40.7661464712329,40.7660112428674,40.7659197148497,40.7658150860978,40.7657093546072,40.7656009250014,40.7651348860289,40.7646683206375,40.7646658020983,40.764453154023,40.7643465381524,40.7643313277878,40.764197362231,40.7641123010953,40.7640855986402,40.763947245818,40.7638279680662,40.7636284736151,40.7635431100379,40.763473754705,40.7633327472138,40.7631500832703,40.7627422587513,40.7622753976174,40.7619711397983,40.7619022822687,40.7617467386605,40.7610445056276,40.7610203491476,40.7605144868544,40.759921017874,40.7593280164121,40.7588088390255,40.7586878666643,40.7585642208499,40.7584381652174,40.758309968538,40.7581799040557,40.7580482491626,40.7579152845691,40.7577812937762,40.7576986779708,40.7576156605612,40.7575323778181,40.7574489665315,40.7573655635305,40.7572823057171,40.7569311081173,40.7565418668171,40.7562390969562,40.75553507451,40.755306291324,40.7548227824764,40.7547663301672,40.7547109860182,40.7546569872434,40.754604565796,40.754405942652,40.7543748224688,40.7543479597446,40.7543259728658,40.7543093679749,40.7542985273195,40.7542937004537,40.7542400026781,40.7541701124326,40.7541615224451,40.7541536704362,40.754106218947,40.7540635323673,40.7539913147834,40.7539022110865,40.7538010119785,40.753763037953,40.7537083825432,40.7536113241357,40.753505277894,40.7534038487453,40.7533788762879,40.7533079423502,40.753284848735,40.753222284605,40.7531624245448,40.7529765234734,40.7529950763249,40.7526768150166,40.7516386798306,40.7510645887011,40.7509670521758,40.7508456259457,40.7502344982949,40.7499439122082,40.7498108010836,40.7497508278526,40.7504680069492,40.7509726094671,40.7513715516221,40.7515764796352,40.7516433456615,40.7515130743283,40.751152455671,40.750269645274,40.7494119331534,40.7484714113581,40.7483945519164,40.7489164399634,40.7490147471783,40.7491983147121,40.7492460641682,40.7493937359716,40.7494677129278,40.7495204983681,40.7496337966918,40.7496922815123,40.7497510932775,40.7498974782205,40.7499720872667,40.7502587994197,40.7506060198224,40.7508606171018,40.750967100744,40.7510225312797,40.7510793920614,40.7513278799854,40.7516279845761,40.751670283674,40.7518912083212,40.7519592388872,40.7520369517853,40.7525301225546,40.7526266199747,40.7537146046939,40.7544853006744,40.7548904187012,40.7546785623059,40.7546006186048,40.7545564576391,40.7545236203242,40.7552636801144,40.755307969156,40.7553522593585,40.7554363228332,40.7573289458975,40.7589891928021,40.7612926066103,40.7614495671211,40.7614881570567,40.7628565470092,40.7628788404266,40.7629300855996,40.7644990407438,40.7666160876577,40.7669180047697,40.7675304693006,40.7676533754849,40.7679880059393,40.7680587443543,40.7681597018796,40.7679581867197,40.7686997443567,40.7687154003242,40.7685575534322,40.7686190518226,40.768722323496,40.7687849340179,40.7689515585891,40.7689039474785,40.7691330546909,40.7692526090742,40.7694748845173,40.7695161146545,40.7693672298666,40.769679325463,40.7700418628895,40.7704253380226,40.7705419560584,40.7711623948666,40.7711640209328,40.7711640531773,40.7712706411867,40.7711767751034,40.7713065232185,40.7713829129692,40.7713542785531,40.7713729435195,40.7714402360901,40.7714201353098,40.7713957931923,40.7713230682004,40.7714623623334,40.7715769580733,40.7716995868986,40.7717341388899,40.7718336971222,40.7719536868249,40.7719187775339,40.7719312776845,40.7719659736767,40.7721058016265,40.7725314951252,40.773562894648,40.7740875689731,40.7750856853833,40.7758664865388,40.7758932049977,40.7769214560605,40.7771843220771,40.7772116846242,40.7775391032864,40.7779442337282,40.778076335377,40.7780859221373,40.778100454236,40.7779426059905,40.7779223882754,40.7779939503176,40.778034767118,40.7780219742329,40.7778808250306,40.7778706066023,40.7774418968095,40.7772605943982,40.7769737061773,40.7765909027496,40.7762216313997,40.7764674170589,40.776592675101,40.7767905290651,40.7768989753244,40.778241775185,40.7783859062631,40.7784053708384,40.7784308118335,40.7784588513262,40.7786256045095,40.7791011937655,40.7802483931253,40.7804410076197,40.780564785728,40.780851874637,40.7817676915065,40.7826350685365,40.7833676460045,40.7837541576979,40.7839329661142,40.784075951913,40.7841420011984,40.7841934843715,40.7845520631794,40.7851913924874,40.7861075785781,40.786063929411,40.7861163480868,40.7861922171446,40.7864296311664,40.7878562095634,40.7893763296344,40.789274302943,40.7890039750443,40.7891792794636,40.7893386543155,40.789401797221,40.7895218149901,40.7896808844584,40.7895726381073,40.7897439358006,40.7897550432539,40.7900406844603,40.7904652072798,40.7909454937819,40.7903751086532,40.7901811752081]}],[{"lng":[-73.8888514849633,-73.8886002186996,-73.8885856250733,-73.8882134885128,-73.888214152828,-73.888252307444,-73.8883725138001,-73.8883925051978,-73.8882335331365,-73.8879442060369,-73.8876694070563,-73.8875596758065,-73.8874545116094,-73.88744413439,-73.8873438076439,-73.8872856801372,-73.8872316184664,-73.8871867416842,-73.8871326442625,-73.8870765596119,-73.8870335290872,-73.8869905746845,-73.8869375685869,-73.8868262842497,-73.8867799273808,-73.8867307113903,-73.8867212364683,-73.8867012234745,-73.8866822442603,-73.8866510852459,-73.8866044094481,-73.8865364521879,-73.8864857106123,-73.8864619351758,-73.8864476279963,-73.8863934444025,-73.886318371255,-73.8862868005625,-73.8861860564581,-73.8860911272631,-73.8859892188933,-73.8858667545629,-73.885708795864,-73.8855721856571,-73.8854196281805,-73.8853600288644,-73.8853135820616,-73.8852689737819,-73.8852237547495,-73.8851103826709,-73.8850048675163,-73.8848710637576,-73.8847928832058,-73.8847036686671,-73.8846581267036,-73.884575921461,-73.8845045096316,-73.8844628893859,-73.884369382495,-73.8842857665439,-73.8842449870843,-73.88422937028,-73.8842161947253,-73.8841566572552,-73.8840803683776,-73.884032207768,-73.8840098560474,-73.8839800130903,-73.8839509319806,-73.8839171820604,-73.883880383168,-73.8838416029745,-73.8837574159016,-73.8837160236464,-73.8836860650272,-73.883659169528,-73.8836472632472,-73.8836360203243,-73.8836349187715,-73.8836337101802,-73.8836311371671,-73.8836286604531,-73.8836265145038,-73.883625660596,-73.883624936715,-73.8836243435039,-73.883623891814,-73.8836235824943,-73.8836234751105,-73.8836234160023,-73.883623391077,-73.8836233906049,-73.8836234384093,-73.8836235203805,-73.8836308254807,-73.8836411830521,-73.8836612081003,-73.8836857071501,-73.8836917781396,-73.8837213644677,-73.8837292349441,-73.8837313642581,-73.88373228479,-73.8837317928876,-73.8837290864998,-73.8837255258266,-73.8837231954967,-73.883720416197,-73.8837143389532,-73.8837068400431,-73.8836979918817,-73.8836879120701,-73.8836812489722,-73.8836744801572,-73.8836679266944,-73.8836647867828,-73.8836617526162,-73.8836551675666,-73.883648285868,-73.8836329499512,-73.8836256806789,-73.8836181881654,-73.8836004480683,-73.8835774570534,-73.8835487025507,-73.8835213233842,-73.8834905944925,-73.8834377822944,-73.8834103032276,-73.883386374229,-73.8833475098466,-73.8833262262476,-73.8832660048737,-73.8832462436026,-73.8832205255059,-73.8832039430375,-73.8831890372567,-73.8831747335755,-73.8831640628853,-73.8831607945317,-73.8831435822139,-73.88309890771,-73.8829831164623,-73.8829456522901,-73.8828915622347,-73.8828337519772,-73.8828168534381,-73.8828026938237,-73.8827338115199,-73.8826473633497,-73.8825658921806,-73.882515481785,-73.8824564733353,-73.8824118949776,-73.8823775052785,-73.8822824615299,-73.8821854641587,-73.8820963368747,-73.8820730731555,-73.8820244782196,-73.8820040562147,-73.8818964024407,-73.8817971970085,-73.8817083528726,-73.8816605441722,-73.8815938115787,-73.8815390308783,-73.8814862004522,-73.8813813795306,-73.8813650271248,-73.8813087004394,-73.8812896725965,-73.8812727694314,-73.8811967614241,-73.8811036978254,-73.8810641428739,-73.8809770547894,-73.8808768580412,-73.8808401956072,-73.8807589295205,-73.8807225522405,-73.8806622449004,-73.8806128208904,-73.8805007720726,-73.8803803154631,-73.8803118847249,-73.8802354287385,-73.8800988143836,-73.8799870012922,-73.8799150846438,-73.8799144915531,-73.8798539645331,-73.8798049337702,-73.8797574582117,-73.8796747829879,-73.8795627221195,-73.8794600109614,-73.8793489373913,-73.8792044653217,-73.8790765980677,-73.8789935276618,-73.8788725271316,-73.8787466223479,-73.8786466372611,-73.878526859206,-73.8784723387384,-73.8784128119519,-73.8783743781276,-73.8783437027596,-73.8782496060608,-73.8782078718625,-73.8781898904401,-73.8781774587459,-73.8781630235292,-73.8781183147596,-73.8780418488098,-73.8780107168279,-73.8779752321678,-73.8779324351778,-73.8778942239403,-73.8777807252501,-73.8776219539544,-73.8775398020265,-73.8774471559982,-73.877334990618,-73.877265712066,-73.87715743689,-73.8770547451278,-73.8769590242371,-73.8769034141704,-73.8768533497297,-73.8768323927182,-73.8767854325192,-73.8767632583534,-73.876671493771,-73.8765777105675,-73.8765338290845,-73.8764934794008,-73.8764025505538,-73.8763654184664,-73.8763314732659,-73.8763175576235,-73.8762875190691,-73.8762793669934,-73.8762714716073,-73.8762450970565,-73.8762061907145,-73.8761438592494,-73.8761220260555,-73.8760961849141,-73.8760623501444,-73.8760478671672,-73.8760153225427,-73.8759974417483,-73.8759660259803,-73.8759174880815,-73.8758640771574,-73.8758448384829,-73.8758307548566,-73.8758168156148,-73.8758027271105,-73.8757870333305,-73.8757583087014,-73.8757483643047,-73.8757250017996,-73.8756960498014,-73.8756127945004,-73.8755789686585,-73.8755527591729,-73.8755304232711,-73.8755123273792,-73.8754712314494,-73.8754496981089,-73.8754320366553,-73.8753857640649,-73.8753065953437,-73.8752235410315,-73.8751279512566,-73.8750739587247,-73.8749835645341,-73.8749177175302,-73.8748526790569,-73.8748108133885,-73.8747106405434,-73.8746675914925,-73.8746326900661,-73.8745444688067,-73.8744931852396,-73.8744099810372,-73.8742932600669,-73.8742000330936,-73.874175268897,-73.8741531405489,-73.8741321335034,-73.8741119395682,-73.8740706443469,-73.8740175592282,-73.8739274261848,-73.8738851008292,-73.8738685193682,-73.8736197824648,-73.8735108138788,-73.8734378359468,-73.8733713411227,-73.8733590410694,-73.8733444877876,-73.8732952422044,-73.873278401106,-73.8732001761461,-73.8731460894712,-73.8730973477861,-73.8730353749121,-73.8729728485607,-73.8729272419176,-73.8728845744567,-73.8728426936107,-73.8727389679844,-73.8726470660465,-73.8725699039412,-73.8724612160387,-73.8723560250365,-73.8722629891167,-73.8722238667179,-73.8722187897106,-73.8721639987197,-73.8720839064242,-73.8719736724586,-73.8718453860336,-73.8717502050608,-73.8717109479833,-73.871682106399,-73.871607735689,-73.8715342242941,-73.8714377374737,-73.8713615151798,-73.8713436634688,-73.8713252263044,-73.8712678245551,-73.8712309216777,-73.871211541435,-73.8712039443943,-73.8711972404663,-73.8711833651614,-73.8711550062931,-73.871146074844,-73.8711340950593,-73.8711029163764,-73.8710721594182,-73.8710515800514,-73.8710284267798,-73.8710183958015,-73.8710158705442,-73.8710149184942,-73.8710141149966,-73.8710137812168,-73.8710136470027,-73.8710112791872,-73.8710034438594,-73.870984741466,-73.8709833394094,-73.8709726372719,-73.8709474632621,-73.870961397417,-73.8709561378078,-73.8709425834217,-73.8709207647752,-73.8708907309606,-73.8708525495345,-73.8708013219701,-73.8707904502522,-73.8707857397777,-73.8707872827458,-73.8707950489431,-73.8708088863356,-73.8710731674445,-73.8712253879116,-73.8713739875909,-73.8714875214704,-73.8716306537346,-73.87187562145,-73.8721057232918,-73.8722480611034,-73.872265189976,-73.872472986793,-73.8726845432793,-73.8727884706952,-73.8728719590387,-73.8728283978369,-73.8728226286446,-73.8727740600667,-73.8728092001611,-73.8728535000933,-73.8728404791595,-73.8728849698365,-73.872981211824,-73.8730876168893,-73.8732023438031,-73.8732857634665,-73.8733546108221,-73.8734276328681,-73.8735145252486,-73.8736894273373,-73.8738639956842,-73.8740379995199,-73.8742112088209,-73.8743566226382,-73.8745968436572,-73.874838013158,-73.8750798879855,-73.8753222242727,-73.8755647776872,-73.8758073036773,-73.8760495577191,-73.8762912955629,-73.8765322734802,-73.876772248509,-73.8783068005765,-73.8852218678352,-73.8853744221112,-73.8857442214316,-73.885962001819,-73.8861295553837,-73.8863172617217,-73.8865928277027,-73.8869219978638,-73.8871531641876,-73.8872778341865,-73.8877012637253,-73.8883072573235,-73.8885654196711,-73.8890521244328,-73.8894046080708,-73.8895225482992,-73.8896109710906,-73.8897972402007,-73.8898704974421,-73.8898848219704,-73.8901268497077,-73.8903013549902,-73.8905697157506,-73.8907999990983,-73.8909195296391,-73.8911564956423,-73.8914045286984,-73.8916058711545,-73.8917701660342,-73.8919744892707,-73.8921043384419,-73.8921818298494,-73.8928228361094,-73.8926180516649,-73.8917928968658,-73.8914641257184,-73.8913856650629,-73.8913115886879,-73.891268610532,-73.8907313902833,-73.890746678608,-73.8907276326388,-73.8908090315657,-73.8908253533698,-73.89087421679,-73.8908034689184,-73.8907573272039,-73.8907872598436,-73.8907140171138,-73.8906895264545,-73.8906732290771,-73.8906214826654,-73.8906757267916,-73.8906893262691,-73.8908304216948,-73.8907950512707,-73.8906512320207,-73.8906593963295,-73.8906078582426,-73.8901691636863,-73.8901189440267,-73.8900834406639,-73.8900464771062,-73.8900036226347,-73.8897656404153,-73.8896119235331,-73.8893651005021,-73.889212838981,-73.8891492529363,-73.8890633951894,-73.8888616219392,-73.8887110536349,-73.8885622460055,-73.8884600438522,-73.8883524809828,-73.8883109722438,-73.8885138927113,-73.8884606409117,-73.8885620458757,-73.8885087325003,-73.8883928254521,-73.8885128537161,-73.8886128899704,-73.888614059014,-73.8889965422284,-73.8889770898015,-73.8888369162904,-73.8888514849633],"lat":[40.7987063289588,40.7986509854162,40.7987060722971,40.7986653046386,40.798663795715,40.7985771803983,40.7985874557538,40.7985662967674,40.798242884286,40.7983433366838,40.7983810501545,40.7983687324371,40.7983536545766,40.7983519333435,40.7983353290942,40.7983243586845,40.798312265785,40.7982996504603,40.7982811019025,40.798259920727,40.7982414818036,40.7982208091599,40.7981938231771,40.7981342087445,40.79810681476,40.7980748803643,40.7980718902804,40.7980643247813,40.7980553999917,40.7980381967,40.7980103346008,40.7979686372546,40.7979348271491,40.7979169020079,40.7979061182327,40.7978612554141,40.797796075306,40.7977700285322,40.7976931523773,40.7976185699367,40.7975435655545,40.7974539710757,40.7973392977896,40.7972410974449,40.7971354883719,40.7970924932774,40.7970565256805,40.7970191556996,40.7969788219097,40.7968741078222,40.7967753526203,40.79664615908,40.7965763104586,40.7964950320703,40.7964571295255,40.7963924445407,40.7963355702796,40.7963039569595,40.7962385858731,40.796181769927,40.7961510127544,40.7961368507492,40.796122879995,40.7960515186488,40.7959583928208,40.7959003163648,40.7958753947875,40.7958454861496,40.7958198831633,40.7957950219595,40.795771625529,40.795750019441,40.7957085654198,40.7956898392594,40.7956783091039,40.7956707356247,40.7956687424547,40.7956678484153,40.795667865396,40.7956679548069,40.7956683753777,40.7956690662636,40.7956699467867,40.7956704141573,40.7956708992492,40.7956714124498,40.7956719252906,40.7956724563679,40.79567272631,40.7956729963008,40.7956732576148,40.7956735276647,40.7956737972609,40.7956740673941,40.7956913199708,40.7957106730427,40.7957445423725,40.7957885124484,40.7957994053605,40.7958541128894,40.7958731846821,40.7958823367156,40.7958911806238,40.7959081541052,40.7959242255754,40.7959346678433,40.7959388797538,40.7959425511104,40.7959484790533,40.7959540636428,40.7959592411247,40.7959639496331,40.7959663023326,40.7959678446063,40.7959685126158,40.7959685094468,40.7959682912822,40.7959672300652,40.7959655038088,40.7959598599867,40.7959563942596,40.7959521367507,40.7959399893504,40.7959209649321,40.7958924537712,40.7958623037546,40.795824460776,40.7957496930304,40.7957168603062,40.7956927652556,40.7956583092379,40.7956394314056,40.795587276491,40.7955719480321,40.7955548481551,40.7955449974623,40.7955375090625,40.7955318568436,40.7955288558722,40.7955279440706,40.7955250446874,40.7955201368033,40.7955005597605,40.7954923627452,40.7954784853057,40.7954639376443,40.7954579945999,40.7954512989673,40.7954123624136,40.7953638370584,40.7953217541962,40.7952972994424,40.7952700988732,40.7952509439822,40.795239463913,40.7952139819717,40.7951876152651,40.795159861043,40.7951553073649,40.7951495842311,40.7951462312521,40.7951227891024,40.7950981764744,40.7950787063593,40.795070831516,40.7950628383747,40.7950578751088,40.7950553439417,40.7950572985187,40.7950576055152,40.7950560346076,40.7950542508052,40.7950515313826,40.7950358926616,40.7950171287075,40.7950115325983,40.7950037975257,40.7949913113974,40.7949851330353,40.7949685152684,40.7949620302579,40.7949531610384,40.7949472295571,40.7949361624945,40.7949231428036,40.7949177233587,40.7949144562739,40.7949115936349,40.794908020052,40.7949043160522,40.7949042616588,40.7948988490034,40.7948922511704,40.7948836836707,40.7948664965961,40.7948423901276,40.7948185725925,40.7947926213238,40.7947582777922,40.7947282744867,40.7947065296568,40.794673606334,40.7946394442373,40.7946088390497,40.7945740792345,40.7945567145733,40.7945357781626,40.7945208067673,40.7945066374499,40.7944568573403,40.7944325618064,40.7944231959068,40.7944179869757,40.794413145486,40.7944015532226,40.7943843722102,40.7943742989806,40.7943597900945,40.7943397169793,40.7943192448031,40.7942533331939,40.7941604762444,40.7941113664394,40.7940596955175,40.7939972977185,40.7939634917727,40.79390651001,40.7938531444355,40.7938053701594,40.7937754584675,40.7937449592997,40.7937301955297,40.7936932248014,40.7936772537038,40.793617100794,40.7935531914097,40.7935239854831,40.7935007009835,40.793456910602,40.7934365285307,40.7934163215802,40.7934064365676,40.7933816320468,40.7933759049921,40.7933711870491,40.793358479758,40.7933427869377,40.7933212424085,40.7933127822093,40.7932995259746,40.7932775081157,40.793266686497,40.7932394918081,40.7932272085562,40.7932104247476,40.7931880315134,40.7931673159684,40.7931585072103,40.7931501172873,40.7931398364938,40.7931274485734,40.7931116993712,40.7930755225069,40.7930645350341,40.7930435011827,40.7930211102078,40.792967801154,40.7929411819143,40.7929161556767,40.7928907823158,40.7928672589876,40.7928063677674,40.7927771503866,40.7927554386297,40.792706833777,40.7926289898254,40.7925507266519,40.7924651839338,40.7924207754718,40.7923515552186,40.7923034784236,40.7922607239069,40.7922374009807,40.7921897357453,40.7921666540568,40.7921449683235,40.7920870781408,40.7920574505892,40.7920153600434,40.7919530618448,40.7919043783161,40.791892455653,40.7918835622058,40.7918771181925,40.7918730262799,40.7918680373316,40.7918637831472,40.7918586590027,40.7918533812202,40.7918499140662,40.7917728182097,40.7917253607344,40.7916830386319,40.7916462070417,40.7916409796396,40.7916364793325,40.7916259880492,40.7916216289553,40.7915974189541,40.7915783587258,40.791558187299,40.7915296270255,40.7914995900437,40.7914762611335,40.7914521082072,40.7914255868233,40.7913535855846,40.7912941407695,40.7912478067888,40.7911806617287,40.7911198872352,40.7910656827201,40.7910401731709,40.7910368617665,40.7909957211358,40.7909328305738,40.790845017753,40.7907369770191,40.7906585095297,40.7906240759187,40.7905947047772,40.7905079938006,40.7904246339027,40.7903236874941,40.7902454307972,40.7902248885223,40.7902012835638,40.7901199214569,40.7900687327546,40.7900361217372,40.790019084973,40.7899998966741,40.7899453196899,40.7898195237432,40.7897881578825,40.7897460731927,40.7896636425212,40.7895649404125,40.7895036828738,40.7894316889372,40.7893925784799,40.7893752590663,40.78935891373,40.7892721489647,40.7892305455251,40.7892140391068,40.7891944148881,40.7891658598069,40.7891081533766,40.7891038288166,40.7890571349039,40.7889537543245,40.7888652884176,40.7887321814071,40.7885994134662,40.7884672830271,40.7883360870877,40.7882061205436,40.788063241919,40.7880302688341,40.7879964652033,40.7879624927414,40.7879290164667,40.7878966916838,40.7875748407528,40.7874454171815,40.7872709148275,40.7870525659711,40.7867979053405,40.7866235089541,40.7864688171369,40.786428740437,40.7864239182748,40.7863030072831,40.7861539269909,40.7860779763532,40.7859750278048,40.7859544617384,40.7859639746669,40.7859419214596,40.7859031091,40.7859256511131,40.7859431228791,40.785962633216,40.7858944524644,40.7858549527834,40.7858249698961,40.7858123836602,40.7857886888255,40.7857618294568,40.7857500911973,40.7857546522742,40.7857640431733,40.7857782514804,40.7857972584129,40.7858069961376,40.7858326013978,40.7858523970728,40.7858663632041,40.7858744857105,40.7858767564026,40.785873172991,40.7858637390887,40.7858484642072,40.7858273637472,40.7858004589829,40.7853566205085,40.7866304871955,40.786669126296,40.7866772918074,40.7867525194849,40.7867079937548,40.7867328701192,40.7867381754127,40.7867331142543,40.7868261820293,40.7868066737514,40.7868722745733,40.7870063442837,40.7871609498357,40.7873725597555,40.7877912800746,40.7880588246978,40.7881999910089,40.7886523921892,40.7888954979849,40.7890099659352,40.7896362794905,40.7898767268322,40.7901076362129,40.7902075761985,40.7902255542779,40.7901738557051,40.7901939193001,40.7901607004506,40.790222043772,40.7902362742416,40.7903233369396,40.790394269609,40.7928170819515,40.7938409953088,40.7967752457587,40.7970697097071,40.7971359216079,40.7972324711805,40.7972975933644,40.7976608998066,40.7976746555388,40.7976829030025,40.797786294499,40.7977821769492,40.7978297482264,40.7978627409502,40.7978131071417,40.797798670725,40.7976952874491,40.7977076622516,40.7976973150242,40.7977489234486,40.797831626396,40.7978295730397,40.7980074060771,40.7980218373531,40.7978460667698,40.7978419415047,40.7977675071378,40.7979646584326,40.7978874567533,40.7979009049827,40.797903116575,40.7978918409576,40.7978691429793,40.7978476501687,40.7978080913859,40.7978012041041,40.7978101308577,40.7978338780236,40.7978730573985,40.7979382487302,40.7980224993815,40.7980850155215,40.7981393591984,40.7981841853702,40.7982431557863,40.7982908587843,40.7983534038245,40.7984378399946,40.7983752808679,40.7985905410197,40.7985984239576,40.7986194942053,40.7986807544879,40.798750530357,40.7987467222767,40.7987063289588]}]],[[{"lng":[-73.7883334983453,-73.7893122360662,-73.7895101987231,-73.7884570001521,-73.7883334983453],"lat":[40.8346671297594,40.8344648865535,40.8353640425258,40.8353099143154,40.8346671297594]}],[{"lng":[-73.8022229535526,-73.802638111563,-73.8052949591067,-73.8069460864175,-73.8068080137239,-73.8039307330726,-73.8036756002653,-73.8022229535526],"lat":[40.8416348131441,40.8410811527646,40.8411349248503,40.8414624466838,40.8424891399876,40.8425940730525,40.842258492916,40.8416348131441]}],[{"lng":[-73.7806894529126,-73.7807724867361,-73.7810100272568,-73.7810925091386,-73.781136171642,-73.7811739603252,-73.7812052577197,-73.7812295524205,-73.7812464474426,-73.7812556667087,-73.781257059561,-73.7812332263653,-73.781195826902,-73.7811517350907,-73.7811019533516,-73.7810476134695,-73.7809899508628,-73.7809302764952,-73.7808699470695,-73.7806795960922,-73.7806310748522,-73.7806165355589,-73.7806400886633,-73.780646671331,-73.7806894529126],"lat":[40.8549288079359,40.8548435771809,40.8548762501905,40.8549585723049,40.8549914107186,40.8550282099413,40.8550683686822,40.8551112307558,40.8551560958035,40.8552022307367,40.8552488817158,40.8553986681466,40.8554346113947,40.8554658765691,40.8554917528553,40.8555116519543,40.8555251214584,40.8555318551373,40.8555316998999,40.8553444508074,40.8552589706626,40.8551638881587,40.855099489379,40.8550334470845,40.8549288079359]}],[{"lng":[-73.782852131004,-73.7825971159191,-73.7827065741142,-73.7828189878568,-73.7829337361102,-73.7830501849382,-73.7831676910083,-73.7832856051462,-73.7834032759229,-73.7835200532537,-73.7836352919912,-73.783748355489,-73.7838586191203,-73.7837047004291,-73.7835566673902,-73.7835585079552,-73.7835040175149,-73.7833037904222,-73.7830597035215,-73.782852131004],"lat":[40.8554858053077,40.8548225609715,40.854855864458,40.8548829029048,40.8549035269356,40.8549176226111,40.8549251120581,40.8549259539007,40.8549201434879,40.8549077129198,40.8548887308706,40.8548633022082,40.8548315674156,40.8549930900288,40.8550743105525,40.8552843424528,40.8554779305575,40.8558485823202,40.8557084662186,40.8554858053077]}],[{"lng":[-73.7892220296188,-73.7891859759923,-73.7891530081815,-73.7891577905111,-73.7890983184814,-73.7890653689233,-73.7890591869176,-73.7890592662649,-73.7890420676761,-73.7890279951059,-73.7890280744632,-73.7889827087882,-73.7889435664698,-73.7889185983406,-73.7888793951408,-73.7888087665613,-73.7887665199659,-73.7887541531556,-73.7887720716614,-73.7887854976523,-73.7887986210277,-73.7888076195024,-73.7888053997816,-73.7887868143248,-73.7888182058396,-73.7888146251878,-73.7887983109091,-73.7887661651014,-73.7887840285458,-73.7882649805069,-73.788261953108,-73.7881764099842,-73.7881824508761,-73.788043429758,-73.7880283070183,-73.7881658003299,-73.7881718624853,-73.7882558718205,-73.7882543669076,-73.7887789854402,-73.7887638907388,-73.7887504705821,-73.7887316477806,-73.7887209347677,-73.7887048588444,-73.7887104768803,-73.7887187967798,-73.7887514851534,-73.7887624726088,-73.7887746336232,-73.7887925125067,-73.788806266789,-73.7887955603384,-73.7887794059048,-73.7888066725075,-73.7888393340608,-73.7888692625544,-73.7888883077091,-73.7888965495719,-73.7888831222679,-73.788856162376,-73.7888183796671,-73.7887824727151,-73.7887700306417,-73.7887589426025,-73.788731833668,-73.7887251941566,-73.7886884128908,-73.7886531283991,-73.788623338175,-73.7886044489371,-73.7885964318945,-73.7885821237344,-73.7885368773532,-73.7885099251264,-73.7885208608292,-73.7884671015993,-73.7884740222327,-73.7884376714831,-73.7884078081227,-73.7883594322237,-73.7884255157724,-73.7884151118413,-73.7885325000331,-73.7885536572481,-73.7885367952694,-73.7884969618678,-73.7884480874701,-73.7884318753239,-73.7883911431649,-73.7883585543343,-73.7883396144435,-73.7883315963814,-73.788320942807,-73.7883129319888,-73.7883076349547,-73.7882941364667,-73.7882941955018,-73.7883213888005,-73.7883540175145,-73.7883975159523,-73.7884247225351,-73.7884276004137,-73.7884169212399,-73.7884170654634,-73.788427286849,-73.7884416373081,-73.7884580597342,-73.7884826037547,-73.7884826692924,-73.7884773265336,-73.7884313698025,-73.788409768566,-73.7883963289378,-73.7883470068363,-73.7878684947466,-73.7878715115159,-73.7876514907694,-73.7876469359479,-73.7875567694506,-73.7875628281522,-73.7873626907491,-73.7873475314642,-73.7875491913949,-73.7875537496875,-73.7876439087689,-73.7876393517904,-73.788345147841,-73.7883239944992,-73.7882722122409,-73.7881987249002,-73.7881681369218,-73.7877787383167,-73.7876901428156,-73.787658075005,-73.7876275709708,-73.7875634501659,-73.787430572486,-73.7873145006624,-73.7872655583483,-73.7872244857847,-73.7871970601856,-73.7871727188946,-73.7871453985217,-73.7871254596767,-73.7869133906974,-73.786907347027,-73.7871328723602,-73.7871545889612,-73.7872084560679,-73.7872925121059,-73.787323506653,-73.7874193524405,-73.7876241156934,-73.7878120671719,-73.7878777845756,-73.7879282170731,-73.7879679994745,-73.7879940304699,-73.788005081086,-73.7880110443899,-73.7880142495819,-73.7880006494967,-73.7879626428807,-73.7876050231902,-73.7871649642187,-73.787126720309,-73.7871221582337,-73.787076276551,-73.7870610658209,-73.7871099900442,-73.7871039056218,-73.7871366702803,-73.7869380573583,-73.7869167221416,-73.7868847033757,-73.7868495898726,-73.7867823255809,-73.7867595922327,-73.7867657472106,-73.7867764893382,-73.7867765376468,-73.7867689971708,-73.7865939016329,-73.7864173351077,-73.786376220321,-73.786324423421,-73.7862476209336,-73.7858818650649,-73.7856640412241,-73.7854527717418,-73.7854019443248,-73.7852921071903,-73.785218814344,-73.7851006646113,-73.7850354290599,-73.7849559146067,-73.7848988857296,-73.7848072279519,-73.7846830719541,-73.7843347420856,-73.7842745733006,-73.7842779846804,-73.7841318916798,-73.7841233822644,-73.7842643285858,-73.7842668846525,-73.7843141516601,-73.784026370805,-73.783979328986,-73.7838711535815,-73.7838609335567,-73.7839717345159,-73.7839611248831,-73.7838130635293,-73.783577671034,-73.7835624200106,-73.7835426733775,-73.7834795676694,-73.7834752847721,-73.7834100177229,-73.7833815861039,-73.7833764657885,-73.7834133904306,-73.7835341691676,-73.7834449593595,-73.7834960988998,-73.783602105416,-73.7837950127628,-73.7839879199498,-73.7841427509189,-73.7843518870609,-73.7844795319985,-73.7846007769761,-73.7845193630009,-73.7844475052949,-73.784434075491,-73.7845049499061,-73.7844880793576,-73.7844744185389,-73.7844546328855,-73.7844210810376,-73.7843920760886,-73.7843457510766,-73.7843370879414,-73.7843126535271,-73.7842699363078,-73.7842257472773,-73.7841632949915,-73.7841191361484,-73.7840797521446,-73.7840413366318,-73.7840474123545,-73.7840214262709,-73.7840168723634,-73.7838518191188,-73.78384119308,-73.7839542862914,-73.7839588388658,-73.7840107966463,-73.7840031977975,-73.7840307070052,-73.7840352602505,-73.7840658083733,-73.7840171057382,-73.7840087904979,-73.7840036231614,-73.7840128804184,-73.7840142130141,-73.7840419839755,-73.7841261342707,-73.7842011263803,-73.7842394305134,-73.784257858262,-73.784253383755,-73.7842124705257,-73.7842049427147,-73.7842004713439,-73.784153339008,-73.7840970180123,-73.7840737834583,-73.7835782526039,-73.7835349780858,-73.7834997778467,-73.7834536807775,-73.783393955832,-73.7833369305493,-73.7832907462259,-73.78323644139,-73.7832235730049,-73.7831794489828,-73.7831469169356,-73.7831171580348,-73.7830353553791,-73.7824495270921,-73.782218064743,-73.782094563045,-73.7820702066158,-73.7821932862789,-73.7821581415205,-73.7820336745884,-73.7820199553272,-73.7819633800486,-73.7819740249896,-73.7817920623667,-73.7817829373724,-73.7817431778402,-73.7817553556915,-73.7815749238,-73.7815444908843,-73.7817188326843,-73.7817310114097,-73.781769243623,-73.7817616370129,-73.781939024334,-73.7819496759876,-73.7820108213888,-73.7821410869785,-73.7819378271346,-73.7818660849462,-73.7818484791591,-73.7818286909822,-73.7816958156092,-73.7816159406907,-73.7816073854626,-73.7816860428451,-73.781613675352,-73.7815301976367,-73.7815062032531,-73.7815949197541,-73.7815744044064,-73.7815395695513,-73.7814556364994,-73.7814324952229,-73.7815075637581,-73.7814933788413,-73.7814938658749,-73.7817851404006,-73.7820361671336,-73.7820021277274,-73.7820218930651,-73.782061891326,-73.7817892023564,-73.7817970940136,-73.7820704123829,-73.7820765769581,-73.7820964063967,-73.7822038418136,-73.7825140851031,-73.7825587775869,-73.7826190091209,-73.7826191050102,-73.7826746707888,-73.7818945773308,-73.7817621938619,-73.7815544212033,-73.7815261131841,-73.7813814878289,-73.7813915175119,-73.7813365258043,-73.7811225896796,-73.7811082716297,-73.7810879169419,-73.7810757507967,-73.7810758016637,-73.7810941554888,-73.7813019497226,-73.7813182634965,-73.7813183346333,-73.7810657467474,-73.7810189021386,-73.7809924418394,-73.7809782093896,-73.7809843811735,-73.7810109069507,-73.7810903601091,-73.7811412906281,-73.7813062751738,-73.781302280028,-73.7811455793434,-73.7811252006112,-73.7811007856731,-73.7810987812789,-73.7811069777533,-73.7811273330339,-73.7811537830963,-73.7811538186934,-73.7812942097643,-73.7813512415836,-73.781371458819,-73.7817259427401,-73.7818317436821,-73.7826374039789,-73.7825040863354,-73.7815841808155,-73.7814843195056,-73.7815030716316,-73.7814292034792,-73.7815223719534,-73.7818440990062,-73.7818252391238,-73.7820526192897,-73.7820953997107,-73.7822149781743,-73.7821854656223,-73.7821639343558,-73.7811254829111,-73.7811362632227,-73.7810683698102,-73.7810575836193,-73.7806366841116,-73.7806769370407,-73.7804624159847,-73.7804032695859,-73.7810604397285,-73.7811518257857,-73.7811897982452,-73.781106757608,-73.7816878693785,-73.78171847815,-73.7817428890326,-73.7817149462276,-73.7810985345694,-73.7810930188519,-73.7821566739683,-73.7821423278314,-73.7823282774844,-73.78229152991,-73.7825134511686,-73.7823570281052,-73.7825793286569,-73.782519907553,-73.7824959725895,-73.7830944204865,-73.7830955689245,-73.7831464422737,-73.7831107073708,-73.7830745583066,-73.7825750937902,-73.7825784911733,-73.782538397715,-73.7825417786994,-73.7824214884136,-73.7824248715552,-73.7818204764895,-73.7818164610431,-73.7823805745747,-73.7823765539331,-73.7825069011428,-73.7825008810226,-73.783050749408,-73.7830818133074,-73.7830594398958,-73.7830945588723,-73.7830602312658,-73.7819073592775,-73.7818397577268,-73.7818153590045,-73.7818870767267,-73.7830745744669,-73.7831331895294,-73.7831084132483,-73.7831524550574,-73.7832220761393,-73.7830971431072,-73.7829757924433,-73.7833653613535,-73.7833570099665,-73.7833354347671,-73.7833210065621,-73.7832848508252,-73.7832381891781,-73.7832341679832,-73.7831545114778,-73.7831001747465,-73.7830604095184,-73.7830460889106,-73.7830112982939,-73.7832698713884,-73.7830949470612,-73.7834959317382,-73.7834842874882,-73.782985670546,-73.7828930760384,-73.7829065094976,-73.7805736781046,-73.7805465399533,-73.7805762897134,-73.7805273604855,-73.7799270374444,-73.7799786859016,-73.7805330271439,-73.7805601766803,-73.7803690621756,-73.7803962328201,-73.7805846472888,-73.781062613643,-73.7808769019871,-73.7809122002328,-73.7810897779785,-73.7815460252334,-73.7813522918001,-73.7813767409837,-73.781575903027,-73.7820077053668,-73.7818004747547,-73.7818330659936,-73.7820375758626,-73.7824367989546,-73.7822161188231,-73.7822487166873,-73.7824693970624,-73.7828224397139,-73.7825721072394,-73.7826074117645,-73.7827849863566,-73.7830918611238,-73.7828738824319,-73.782901038888,-73.7831325256867,-73.7828066150656,-73.7828415161768,-73.7828686660038,-73.7829422581217,-73.7829830443999,-73.7834748124925,-73.7831919451864,-73.7830453981545,-73.7832450126047,-73.7832103885086,-73.7830087430839,-73.7829109867874,-73.7828948763537,-73.7831392596868,-73.7831170396102,-73.7829174708512,-73.7828992550774,-73.7831238302032,-73.7830165334468,-73.7828877830149,-73.7827331937678,-73.7828158452606,-73.7827791904621,-73.7827066998257,-73.7822994127092,-73.7824445240459,-73.7824078688453,-73.7822668287474,-73.7818004836245,-73.7819697250266,-73.7819330659367,-73.7817719692773,-73.781246566345,-73.781427851886,-73.7813891631934,-73.7812160111929,-73.7806742992502,-73.7808595850378,-73.780829036813,-73.7806437599331,-73.780295525319,-73.7802928657742,-73.7802277387268,-73.7802266241825,-73.780291756783,-73.7802915219649,-73.7828649930492,-73.7827155202259,-73.7823078366579,-73.7822957269889,-73.7824348109359,-73.7824108248819,-73.7805973582243,-73.7805852537408,-73.782368559535,-73.7823400055882,-73.7821597519027,-73.7821516613939,-73.7823305166084,-73.7823111091055,-73.7822171628095,-73.782221151523,-73.7821600555802,-73.7821560453186,-73.7816286101604,-73.7816205502192,-73.7822457473109,-73.7822497921256,-73.7823064331776,-73.7823211854318,-73.7823253683476,-73.782331609939,-73.782372409911,-73.7823705774475,-73.7823325721589,-73.7822934819796,-73.7823116314881,-73.7822770131197,-73.7822669585178,-73.7814541800844,-73.7814400310785,-73.7823235128595,-73.7822677147174,-73.7820753351817,-73.7820810307652,-73.7820649929176,-73.7820615835413,-73.7820375253394,-73.7820341082999,-73.7822634532624,-73.7822402454025,-73.7820159343561,-73.7820125230193,-73.7820365890861,-73.7820354696485,-73.7820515083582,-73.7820537783548,-73.7822359267938,-73.7822154223334,-73.7821662441896,-73.7820723560851,-73.7820209311362,-73.7818833312786,-73.7818660122127,-73.7814069659546,-73.7814183019978,-73.781366764135,-73.7813519733253,-73.7812992811557,-73.7813208230327,-73.7812749882927,-73.7813386857139,-73.7813077534055,-73.7812486350251,-73.7811329010127,-73.7811977223889,-73.7811713719038,-73.7810996706452,-73.7809793566091,-73.7810544845537,-73.7810235442485,-73.7809552932129,-73.7808464399695,-73.7809249903879,-73.7808871744866,-73.7808143539402,-73.7806963280213,-73.7807645283577,-73.7807209883044,-73.7806550828425,-73.7806058110588,-73.7805840273881,-73.7805313141507,-73.7805915762219,-73.7805629270685,-73.7805038114454,-73.7804396356497,-73.7804555257668,-73.7803948047966,-73.7803766260916,-73.7803698059373,-73.7803480515823,-73.7804257718153,-73.7802986397616,-73.7801959995529,-73.7803322792483,-73.7803446604973,-73.780377868103,-73.7803767581232,-73.7812613540187,-73.7812375471225,-73.7818504819778,-73.7818386359831,-73.7818388488652,-73.7818390921631,-73.7818230032176,-73.7818048644,-73.781762344107,-73.7817176560302,-73.7816851699632,-73.7816605121361,-73.7808422380231,-73.7809288650499,-73.7808922061015,-73.7807975292346,-73.7816485529559,-73.781613565438,-73.7813959061904,-73.7813914356879,-73.7816106965153,-73.7815970260399,-73.7813787188564,-73.7813748819495,-73.7815939693726,-73.7815682170103,-73.781543089493,-73.7815134501493,-73.7814808892744,-73.7814483351499,-73.7814266697652,-73.7814180507189,-73.7814202876527,-73.7814420716122,-73.7814660242275,-73.7814769406928,-73.781485705628,-73.7814857706619,-73.7814771845751,-73.7814620370762,-73.7814534280018,-73.781453498466,-73.7814644257484,-73.7814883769658,-73.7815134773707,-73.7815232174989,-73.7815428414099,-73.7815429606054,-73.7815344104607,-73.7815150432261,-73.7814917200694,-73.7812536183457,-73.781249072339,-73.7814887808925,-73.7814655978731,-73.7814536653196,-73.7813626724532,-73.7811843144477,-73.781179478024,-73.7813593201067,-73.7813412514577,-73.7811399435274,-73.7811387572596,-73.7813398884942,-73.7813252257703,-73.7813424000093,-73.7815678098351,-73.7815969841916,-73.7817215486651,-73.7820042098904,-73.7818845572028,-73.7823814255608,-73.7827276073866,-73.7827455904672,-73.7828145265285,-73.7829062919088,-73.7828873348317,-73.7827968044343,-73.7827036458365,-73.7826813143559,-73.7828226013974,-73.7830292186273,-73.7833816805934,-73.7836639360844,-73.7841016459131,-73.7842180749409,-73.7843134711294,-73.7844845614001,-73.7849151225641,-73.7848848705203,-73.7849806032809,-73.7850822664278,-73.7849843560093,-73.7849432573329,-73.7845033396536,-73.7848500922266,-73.7851258217548,-73.7856399784545,-73.7858306796412,-73.7857936743976,-73.7856527957232,-73.7851658442866,-73.7852771294842,-73.7855779685095,-73.7854986418295,-73.7855477281023,-73.7855301151153,-73.7855603115974,-73.78568113678,-73.7857350929869,-73.7859299854499,-73.786078984903,-73.7861463776701,-73.7862727227483,-73.7865259849643,-73.7869001582141,-73.7873035313252,-73.7873298569899,-73.7874075874601,-73.7874137451261,-73.7873362787646,-73.7873885448256,-73.7874710857183,-73.787491621614,-73.787490952802,-73.7874813406311,-73.7874501432673,-73.7874706242269,-73.7876393121901,-73.7873977472516,-73.7873572424446,-73.7873867213582,-73.787491664126,-73.7877166524671,-73.7877134692207,-73.787918891785,-73.7879253690903,-73.7881813214456,-73.7881635562784,-73.7881391077853,-73.7880940024932,-73.7881592116652,-73.7882108349558,-73.7881880045508,-73.7882057896501,-73.7882400094522,-73.7882545328346,-73.7879659654652,-73.787957861961,-73.7877752695698,-73.7877849634727,-73.7875237973354,-73.7875793752362,-73.787786567951,-73.787864040497,-73.7876064058961,-73.7876123778259,-73.7878009807393,-73.7878448749932,-73.7878969868387,-73.7879523907587,-73.7880436914531,-73.7881219015148,-73.788123916089,-73.788196801177,-73.7882390823525,-73.788251975876,-73.7883661747498,-73.7883710120257,-73.7882606446572,-73.7882600684834,-73.7882600054669,-73.7882533774651,-73.7882337021841,-73.7882042790781,-73.7881602030337,-73.7881194130807,-73.7880525055161,-73.7880200355036,-73.7880484708972,-73.7882935884386,-73.7883016763818,-73.7880559907079,-73.7882319926238,-73.7883845661367,-73.7884390903702,-73.7885099380112,-73.7885202708226,-73.7888386489515,-73.7888427325721,-73.7885278086737,-73.788716196135,-73.7887638472453,-73.7887905351073,-73.78876233408,-73.7888430888371,-73.7888908617257,-73.7890582550137,-73.7896166032845,-73.7896575565687,-73.789786204613,-73.7897789783243,-73.7898352223619,-73.7898545655628,-73.7899242492442,-73.7899170567334,-73.7899292872876,-73.789919621512,-73.7899061737935,-73.7898820276732,-73.7899309338809,-73.789957515008,-73.7899440695604,-73.7899500681991,-73.7899659607602,-73.7899997530904,-73.7899520755298,-73.7899315290239,-73.7898618385828,-73.7898895360384,-73.7897346932676,-73.7897457997273,-73.7898991988991,-73.7899064514336,-73.789756268399,-73.7897742122375,-73.7898044950204,-73.7897408470778,-73.7893370872572,-73.7893194914458,-73.7893302133706,-73.7893604725716,-73.7894213262537,-73.7894644334527,-73.789347020263,-73.7893404709632,-73.7893469053209,-73.7894703335672,-73.7894718221409,-73.7895973762959,-73.7899080455866,-73.7899289549435,-73.7900196915212,-73.7901992019094,-73.7904964276808,-73.7906658900102,-73.7908515606674,-73.790988583759,-73.7910188599295,-73.7906978536486,-73.7909606959618,-73.790908485346,-73.7909407344361,-73.7909467367696,-73.7909733331068,-73.7910634908902,-73.7910642712527,-73.7914907651356,-73.7914993735155,-73.7911275924665,-73.7911447882513,-73.7911247657017,-73.7911812878534,-73.7912605744137,-73.7913117056192,-73.7913290103074,-73.7914137911444,-73.7914310833175,-73.7913245194714,-73.7913807040327,-73.7914198266744,-73.7914803472569,-73.7917934362546,-73.7918041859146,-73.7914336300719,-73.7913670985845,-73.7913765853053,-73.7913842828298,-73.791486374168,-73.7914404968817,-73.7916983779534,-73.7916940836624,-73.7917723270085,-73.7919200710007,-73.7919199781009,-73.7917461359944,-73.7917156975866,-73.7917156252611,-73.791429627565,-73.7914173847846,-73.7915173918598,-73.7915410488227,-73.7913057004828,-73.7912670856721,-73.791277200668,-73.791279329539,-73.7913297597005,-73.7916068733174,-73.7916176543145,-73.7913358806323,-73.791362881068,-73.7913102069988,-73.7912308631245,-73.7912447526426,-73.7910600060852,-73.7911119540788,-73.7910972646855,-73.7910443232118,-73.7910178352214,-73.790919717279,-73.7910136233883,-73.7909805783553,-73.7908871020721,-73.79024725581,-73.7897571107061,-73.7898338332935,-73.7898583695219,-73.7901606379887,-73.7901563393647,-73.7902259107128,-73.7902258638802,-73.7906497649306,-73.7906476282183,-73.7909259053448,-73.7909129772108,-73.7909477685763,-73.790988771248,-73.7906756981974,-73.7906605659552,-73.7904410269941,-73.7904453198223,-73.7903670582256,-73.7903627595556,-73.7902345125324,-73.7902409842452,-73.7901714089751,-73.7901671051414,-73.7898663031381,-73.7900175878901,-73.7901681643942,-73.7902008337725,-73.790207295104,-73.7902464258045,-73.7902378700931,-73.7902813729271,-73.790257670317,-73.7903576698173,-73.7904050605431,-73.7901419866557,-73.7901549079707,-73.7902201342953,-73.7902265904322,-73.790054845378,-73.7900527191663,-73.7901244688739,-73.7901158858777,-73.7900241182949,-73.7900388848641,-73.7899187248287,-73.7910173706937,-73.7910238113042,-73.7899295362666,-73.7900317422327,-73.7900709317075,-73.7902476483752,-73.7902500640095,-73.790074059205,-73.7900864002191,-73.7902646047155,-73.7902682450727,-73.7900909438575,-73.7901243917183,-73.7895137151617,-73.789562724642,-73.7896605179442,-73.7896627621722,-73.7897851070265,-73.7897766303241,-73.7897105921199,-73.7897021309969,-73.789683796745,-73.7896657191385,-73.7897684322878,-73.7897793532319,-73.7897952542796,-73.7898085511542,-73.7897950988327,-73.7898108047848,-73.7900578142692,-73.7900179705354,-73.7900497534374,-73.7900896156999,-73.7903451879795,-73.7903028518772,-73.7903370951808,-73.7903794365331,-73.7908245419897,-73.7907846352445,-73.7908176535296,-73.7908575632574,-73.790987179843,-73.790990766491,-73.7908660390276,-73.7908901843567,-73.7908596129088,-73.7908330226529,-73.7903854595429,-73.790410804879,-73.7903875683458,-73.7903548889487,-73.7900944249189,-73.7901161821689,-73.7900733807411,-73.7900516242002,-73.7896649034452,-73.7897257371208,-73.7901477843448,-73.7901731070039,-73.7908921793007,-73.7909163342198,-73.7901958866728,-73.7902164027295,-73.7902483826228,-73.7902327361208,-73.7904552874168,-73.790463705281,-73.790384219464,-73.7903866032003,-73.7902655528271,-73.7902667330034,-73.7902948451225,-73.7903068510807,-73.7902787303728,-73.7902992895896,-73.7902556639458,-73.7900839690412,-73.7901550926101,-73.7902434632529,-73.7901609515002,-73.790195203133,-73.7902740423579,-73.7905321242068,-73.790452003361,-73.7905070423819,-73.7905749341031,-73.7908061058777,-73.7907430949937,-73.7905803755946,-73.7905609252433,-73.7907946335484,-73.7908189678088,-73.7907626752107,-73.7907944671663,-73.7908538071772,-73.79099692237,-73.7909871999905,-73.7911119615058,-73.7910659478956,-73.7910206904042,-73.7910109711846,-73.7911736673112,-73.7911833836593,-73.791102653217,-73.7911669291689,-73.7911877076455,-73.7914629333888,-73.7913962176819,-73.7913289417421,-73.7913204511751,-73.7915173867795,-73.7915234335679,-73.7914267964551,-73.7914959681422,-73.7917699488301,-73.7917275018874,-73.7922718766822,-73.7922621707585,-73.7924835935719,-73.7924945097807,-73.79229143994,-73.7922987241293,-73.7917678060595,-73.7918017523138,-73.7920488276035,-73.7920573145789,-73.79016350155,-73.790170071263,-73.7911379517093,-73.7912055906845,-73.7913345675326,-73.7913418457984,-73.7912125116928,-73.7912265338512,-73.791361879799,-73.7913646086994,-73.7912308400785,-73.7912365597178,-73.7931828407586,-73.7930890196572,-73.7931183718384,-73.7932202604837,-73.7931533961262,-73.7932525807952,-73.7932378678763,-73.7931435368942,-73.7931289407392,-73.7912455678377,-73.7913805269552,-73.7934096030039,-73.7933837673931,-73.7934098763116,-73.7935076283191,-73.7934786291432,-73.7934240066904,-73.7913910646867,-73.7914464002779,-73.7904205378017,-73.7904987936289,-73.7907712759549,-73.7907915075772,-73.7910058674022,-73.7909898272444,-73.7910077775555,-73.7910303311474,-73.7914543630372,-73.7913897249529,-73.7914370271664,-73.7915032725157,-73.7917022389609,-73.7916310769195,-73.7916555443624,-73.7917299552462,-73.7919631831115,-73.7918936538657,-73.7919164994622,-73.7919892816457,-73.7922241306373,-73.7921529705741,-73.792175808378,-73.792251860974,-73.7924866988149,-73.7924171758284,-73.7924367547335,-73.7925095404806,-73.7928308388489,-73.7927645580239,-73.7928151196693,-73.7929008668706,-73.7928389021841,-73.7908075872993,-73.7908620198684,-73.7911143142938,-73.7912657316588,-73.7925240872891,-73.7923861058939,-73.7924093103693,-73.7925559839258,-73.7929792831105,-73.7928471009267,-73.7928761004859,-73.7930399117027,-73.7930138163249,-73.7929994805541,-73.7912736812813,-73.7912904100619,-73.7910572125483,-73.7912841784201,-73.7912902349519,-73.7924581684481,-73.7924883675252,-73.7924622663867,-73.7924406924877,-73.7910700276595,-73.7910828174584,-73.7913847725381,-73.791583609897,-73.7917183529375,-73.791786111757,-73.7918178199532,-73.7918171618838,-73.792514183689,-73.7925061657828,-73.7925371460487,-73.7925675894463,-73.7925300985486,-73.7925173617578,-73.7918261216321,-73.7918214004225,-73.7917936680942,-73.7919181173639,-73.7913381179158,-73.7912928216065,-73.791868434644,-73.7920767566755,-73.7925030668545,-73.7924929783846,-73.7924879115737,-73.792418215414,-73.7923072079674,-73.7921161694851,-73.7920332293373,-73.7920171222853,-73.7925707419965,-73.7925681412599,-73.7920105000906,-73.7919871987402,-73.7919370027975,-73.7920700092792,-73.7920589256043,-73.7920974020608,-73.7920881481997,-73.7920698199593,-73.7920577847071,-73.7920174638365,-73.7920091122996,-73.7919083225176,-73.7919018334026,-73.7930513380813,-73.7930688668018,-73.7930949215237,-73.7930568529535,-73.7930307836123,-73.7930483589582,-73.7918942295888,-73.7918593771358,-73.7918421311268,-73.7918284550688,-73.7919618059141,-73.7919562821119,-73.7918229997617,-73.7917926453528,-73.7919295571427,-73.7919221926292,-73.7917850281768,-73.7917070425736,-73.7918603255296,-73.7918822302672,-73.7918363346284,-73.7918326974459,-73.7917354647656,-73.7918214377102,-73.7918717258124,-73.7922026595025,-73.79222842637,-73.7922146991403,-73.792374840124,-73.7924279413065,-73.7922668728028,-73.7922449012639,-73.7922218918639,-73.7927371986778,-73.7928271323798,-73.7928975388877,-73.7929540078477,-73.79301264383,-73.7929962847809,-73.792884038889,-73.792810745865,-73.7927173038383,-73.7918597871521,-73.7918543264201,-73.7926833857548,-73.7926092302063,-73.792576696214,-73.7926355732807,-73.7921126678363,-73.7918945191309,-73.7924651606529,-73.7925415008948,-73.792551628031,-73.792569704406,-73.7923952172328,-73.7923872563999,-73.7923735381333,-73.7924433640356,-73.7917425408236,-73.7917578139994,-73.7918728196395,-73.792093325041,-73.791843032174,-73.7917397997258,-73.7916039346131,-73.7912937885215,-73.7909420226037,-73.7912330740583,-73.7912445209505,-73.7913161346032,-73.7913063009644,-73.7916366458797,-73.7917560035164,-73.7917852942325,-73.7915989091515,-73.7914369590811,-73.7914092915086,-73.7916186607583,-73.7912932164252,-73.7912785095481,-73.7912117964989,-73.7912216178454,-73.7909322280059,-73.7907906704719,-73.7906806170101,-73.7904419014554,-73.7902359273876,-73.7900613356324,-73.7901253879809,-73.7901364046846,-73.7901601646944,-73.7901463778868,-73.7902012297575,-73.79018745195,-73.7901335115889,-73.790120653197,-73.7900914153764,-73.7900987715655,-73.7900459983775,-73.7899890995976,-73.7899530134158,-73.7898669871437,-73.7897989670505,-73.7897469344117,-73.7896768671681,-73.789607802583,-73.7895345390721,-73.7894994187577,-73.7894389203076,-73.7893879675828,-73.7893412102467,-73.7893071908461,-73.7892828535458,-73.789258045506,-73.7892220296188],"lat":[40.8587425155314,40.8587317283117,40.8587376240369,40.8587138082297,40.8586660480923,40.8586659878566,40.8586361948649,40.8586111775266,40.8585920857393,40.8585765732807,40.8585515564447,40.8585085874184,40.8584823077462,40.8584393760059,40.858432157045,40.8584391750121,40.8584021675785,40.8583437726476,40.8583141329887,40.8580224093624,40.85788507233,40.8578183770111,40.8577268823898,40.8576506064853,40.8576468521152,40.8575887109811,40.8575877280748,40.8574332793712,40.8574206903366,40.8575070008607,40.8574988814611,40.8575126351025,40.8575335114395,40.8575599176872,40.8575146812838,40.857488272249,40.8575021935437,40.8574907557865,40.8574837979425,40.8574009251997,40.8573212192636,40.8572737956984,40.8572181188983,40.857172762168,40.857106786176,40.8570470332136,40.8569914066171,40.8569543716961,40.8569131756158,40.8568898382048,40.8568555268966,40.8567978495311,40.8567504316043,40.8567091858305,40.8566700802565,40.8566412887678,40.8566186743967,40.856604283109,40.8565733867098,40.8565280240177,40.856470271463,40.8564021955432,40.8563629419866,40.85634934057,40.8563155329067,40.8563051785468,40.856304851276,40.8563030388187,40.8563029741864,40.8562823118434,40.8562472426571,40.8562080724732,40.8561628887191,40.856158504288,40.8560986909522,40.8560739818118,40.8559090172621,40.8558732472108,40.8557750111295,40.8557770170726,40.8556264891483,40.8553298528819,40.8551876376071,40.8551546769294,40.8551487361143,40.8551018908548,40.8550538348356,40.8550599268521,40.855037229144,40.8550433365703,40.8550494595914,40.8550308771138,40.8549917063982,40.8549278026595,40.854886571245,40.8548453453119,40.8548226513901,40.8548041044367,40.854787667983,40.8547691801143,40.8547465914232,40.854726032879,40.8546745172184,40.8546188557766,40.8545735189077,40.8545546781589,40.8545282251609,40.8544849783486,40.8544479292254,40.8544273209022,40.8544005205322,40.8543427336927,40.8543076594878,40.8542664186202,40.8541535189498,40.8542732414709,40.8542848401683,40.8543400772606,40.8543319538559,40.8543607681323,40.8543758488933,40.8544195305716,40.8543858854595,40.854343365876,40.8543503300262,40.8543238344355,40.8543168709613,40.8541320123502,40.8541025156497,40.8541129630684,40.8541277890582,40.8540857789036,40.8541733853198,40.8541882912456,40.8541905515937,40.854181220991,40.8541811029365,40.8541982464804,40.8542119427257,40.8542076278716,40.8541932296783,40.8541757907907,40.8541490843056,40.8540991883622,40.8540443786544,40.8540836904621,40.8540639722992,40.8540242708784,40.8539796896362,40.853954403786,40.8539267377792,40.853917164312,40.853887558075,40.8538288158775,40.8537758373808,40.8537539342112,40.8537377973892,40.8537100501656,40.8536857546154,40.8536648684512,40.8536162333371,40.8535687112083,40.8535246363281,40.8534747209356,40.8531147085349,40.8527574122819,40.8527799740252,40.8527741704542,40.8527995874355,40.8527821722268,40.8527602373213,40.8527532703349,40.8527338752442,40.8525790829289,40.8525674520447,40.8525546409831,40.8525545761115,40.8525557072356,40.8525312263328,40.8525161675975,40.852498799145,40.8524837296247,40.8524547353984,40.8523083519206,40.8521445764697,40.8521120419205,40.8520783293114,40.8520228146925,40.8517886729435,40.851795995821,40.8516642258365,40.8516455842245,40.8516206499736,40.8516251504342,40.8516527519344,40.8516835424064,40.8517235806835,40.8517342928891,40.8517526690238,40.8517493468799,40.8517761575724,40.8517919935165,40.8517991729341,40.8518328061573,40.8518086642795,40.8517737171013,40.8517795900761,40.8517675457069,40.8516099318629,40.8515326174405,40.8515589616701,40.851532860725,40.8515076818598,40.851486933923,40.8515188832949,40.8515696774448,40.8515650124407,40.8515379707042,40.8515601838872,40.8515569156658,40.8515790182088,40.8515867339144,40.8515769432487,40.8515634196886,40.8515207805307,40.851400909727,40.8513687799758,40.8513195197827,40.8512539353562,40.8511883506069,40.8511474241763,40.8510983550454,40.8510718029924,40.8510956921952,40.8508927350214,40.8509048174594,40.8508615149039,40.8508535004637,40.8508158268241,40.8507914578981,40.8507728738545,40.8507623791096,40.8507623249032,40.8507700507913,40.8507714954049,40.8507737684217,40.8507655735195,40.8507399887073,40.850696980725,40.850662121468,40.8506306154111,40.8506445887091,40.8506538733703,40.8506642579451,40.8506561348948,40.8507114676586,40.8506928994983,40.8506548577655,40.8506629813183,40.8506468497294,40.8506364022786,40.8506271804952,40.8506353035437,40.8506252332364,40.850584263375,40.8505259320535,40.8505054127577,40.8504752898531,40.8504739134585,40.8504452057775,40.8503874026758,40.8503295823808,40.8502867628729,40.8502531806424,40.8502207138395,40.8501267418182,40.8500942704739,40.8500606442406,40.850001437194,40.8499514850463,40.8499024253895,40.8492663868022,40.8492209679229,40.8491961719756,40.8491837205077,40.8491897900132,40.8491999876585,40.8492143265642,40.8492224680554,40.8492224438743,40.8492223609495,40.8492119955669,40.8491830883062,40.8490719081279,40.8493411540157,40.8491668045962,40.8492473000097,40.8492263887191,40.8491427909954,40.8491161739239,40.8491938617585,40.8491880390028,40.8492157536305,40.8492285251732,40.8493197589455,40.8493093079558,40.8493300991903,40.8493405542836,40.8494306318454,40.8494004351459,40.849305709714,40.8493161648116,40.8492953723672,40.8492872429476,40.8491948423134,40.8492052945014,40.8491799078862,40.8491006626677,40.8489339814074,40.8489448410394,40.8489475052179,40.8489592053636,40.8488483623479,40.8488962046112,40.8488864085314,40.8488378831522,40.8487723863499,40.8488575718797,40.8488425281791,40.8487529478766,40.8487318082124,40.8487263752818,40.8488130908978,40.8488000058133,40.8487192898814,40.8487153062641,40.8485804758258,40.8485098018392,40.8484380492835,40.8483440889264,40.8483395624201,40.8484491832847,40.8485272077288,40.8485471432713,40.8484694124946,40.8484224763747,40.8483983878631,40.8483679444144,40.8482896312976,40.8482773264788,40.8482396199435,40.8482102781259,40.848139672444,40.8483271615401,40.8483516415627,40.8484007080889,40.8483434661372,40.8483771958293,40.8484220377292,40.8484327525387,40.8484988084487,40.8485204200223,40.848520381397,40.8485064469473,40.8484909916135,40.8484802067382,40.8484249589428,40.8484157160757,40.8483940779714,40.8484538776887,40.8484630620649,40.8484630118323,40.8484583479136,40.8484382673038,40.8484182246648,40.8483967372295,40.8483829231765,40.8483476864727,40.8483244954176,40.8483164696778,40.8483241595664,40.8483210215836,40.8483117444882,40.8482947581966,40.8482947968197,40.8482979381552,40.8482871185166,40.8483028413752,40.848290584541,40.8483323545995,40.848234105806,40.848246670899,40.8480726492458,40.8479132737633,40.8480370520398,40.8478821938487,40.8476816429631,40.8474563453573,40.8473134799415,40.847136107937,40.8470655176721,40.8469908379278,40.8469133909624,40.8468614095895,40.8467197156277,40.8466363377809,40.8468294664049,40.8468521553773,40.8468664522056,40.8468458239292,40.8469233347524,40.8470614857935,40.8471002332896,40.8469311341661,40.8468025523569,40.8462463046271,40.8462525588036,40.8467469971412,40.8466388752119,40.8464081213262,40.846412290116,40.8466574742147,40.8467717114391,40.8467984915874,40.8466075781137,40.8465777066086,40.8465486112713,40.8464577901167,40.8464087715512,40.8459815883327,40.8459358930278,40.8457581947647,40.8456615619491,40.8455182855647,40.8455136908632,40.8453099420261,40.8453081297424,40.8455097642919,40.8456018505661,40.8456131591499,40.84562003867,40.8456365644266,40.8456606810231,40.845676336667,40.8457819874981,40.845764978051,40.8456655783036,40.845650115281,40.8456240848009,40.8455977983018,40.8454968231759,40.8453330473897,40.8453283684148,40.8451692354712,40.8450857085671,40.8453555622494,40.8454883575841,40.8454805828803,40.8453338856494,40.8450563687339,40.8451816730595,40.8452898199034,40.8452959833278,40.8450634446582,40.8449916743321,40.8446809480204,40.8444447229817,40.8444028465376,40.8443615897198,40.8443478248024,40.8443395128501,40.8443470148544,40.844347661647,40.8443639978093,40.8443831306009,40.8443720643955,40.8443253250352,40.8441726908498,40.8440693920916,40.8438660944023,40.843732342936,40.8436785459985,40.843794078804,40.8438948842585,40.8439361258401,40.8444695859865,40.8444695343591,40.8445005030096,40.8445251403382,40.8438830813559,40.8438563892544,40.8444530222652,40.8444489518187,40.8439766611937,40.8439664081798,40.8444345726982,40.8443283178767,40.8438622204878,40.8438561053936,40.8443201270777,40.8442158897477,40.8437126825538,40.8437044865401,40.8442077034705,40.8441096006697,40.8435837006888,40.8435755183049,40.8441034749735,40.8440094310999,40.8434464111184,40.8434361684175,40.8439991878351,40.8439194811995,40.8432945819433,40.8432864049577,40.8437545454809,40.8436850548112,40.8431241023624,40.8431179713337,40.8436974967318,40.8437793161221,40.8438947872019,40.843890716883,40.8437919364061,40.8437672832354,40.8436547381098,40.8428678644865,40.8428963320667,40.8434716758789,40.8434793388665,40.8429024464337,40.8429223555082,40.8428697736933,40.8428223194901,40.8427712726345,40.8428064456792,40.8427754998361,40.8427362029937,40.8426053872973,40.8424948288497,40.8425217054985,40.8427645225967,40.8427706368912,40.8425324758104,40.8426058964134,40.8430420344168,40.8430481469174,40.8426120182283,40.8426961457937,40.8432204288159,40.8432280880765,40.842702273492,40.8427971072895,40.843370873779,40.8433769826053,40.8428047773957,40.8429073045377,40.8435011718693,40.8435072971457,40.8429103376209,40.8429730453966,40.8437783053654,40.8437781812978,40.8428832684329,40.8428818466004,40.842952944754,40.8424781018827,40.8424465010931,40.8425193582654,40.8424884238486,40.8424661214351,40.8424500503246,40.8427866004436,40.8427541194415,40.8424284931497,40.8423409256436,40.8423706998426,40.8423552286139,40.8423224512629,40.8422241789572,40.8422409771774,40.8422657146288,40.8422779630478,40.8422594083687,40.8423542395653,40.842329494888,40.8422132095645,40.8422209452587,40.84221111581,40.8421716201721,40.8421376243411,40.8420959055089,40.8420666156722,40.842004786909,40.8419228441114,40.8419304528299,40.841981492171,40.8419876089767,40.8419504946124,40.8421715271261,40.8421421334934,40.8418983304546,40.8417861749048,40.8418324250376,40.8418411299692,40.8418445778055,40.8418367461409,40.8418419167151,40.8418366942245,40.8417781159825,40.8417358661234,40.8417931890252,40.841786227476,40.8417784489051,40.8417706215667,40.8417671749088,40.8417732641796,40.8417278829806,40.8417040173003,40.8416891441101,40.8416933138454,40.8417043339149,40.8417338193934,40.8416873646797,40.8417720402016,40.8418059694208,40.841812826846,40.8417849772272,40.8417944416236,40.8418579485082,40.8418709028589,40.8419962189868,40.842003115446,40.8418778079854,40.8419106260536,40.842042029373,40.842048065539,40.8419201261133,40.8419529353356,40.8420834893569,40.8420929949142,40.8419598459157,40.8419891986258,40.8421232361984,40.8421344670587,40.8419987007775,40.8420323830007,40.8421803128825,40.8421915323058,40.8420418688663,40.8420556858658,40.8420652070461,40.8420807560333,40.8422060665376,40.8422147057062,40.8420893983739,40.8421092725915,40.8421510346229,40.8421648292371,40.8421230635098,40.8421082707012,40.8421090982245,40.8424943942069,40.8425115404673,40.8420462109762,40.8420316902674,40.8420960511805,40.8420935052244,40.842083071044,40.8418395784571,40.8417682420421,40.8416539463943,40.8415347846261,40.8414698697323,40.8413956799173,40.8413369170039,40.84128278594,40.8412162444515,40.8411898835489,40.8411666385568,40.8411241750856,40.8412763240282,40.8415454252676,40.8415530841983,40.8412561460484,40.8410977635288,40.8410072720697,40.841047865835,40.8410366101208,40.8409962400257,40.8409486695933,40.8409871920024,40.8409788710051,40.8409397967481,40.8408351605958,40.8407847820275,40.8407726825704,40.8407643713246,40.8407544106388,40.8407362203448,40.8407147557162,40.8406949612711,40.84067685331,40.8406603990647,40.8406439212901,40.8406208394861,40.8406010402547,40.8405696755126,40.8405514987455,40.8405267339102,40.840505284575,40.8404855070968,40.8404690528438,40.8404512712903,40.8404443703187,40.8404229596941,40.8403866616045,40.8403437476446,40.8402876144613,40.8402062245253,40.8402555004389,40.8402443548052,40.8401973239221,40.8401751597634,40.8401362867731,40.8397301898163,40.8397616492014,40.8397458622558,40.8397117082158,40.8394785634429,40.8395054168936,40.8394942788018,40.8394696998303,40.8392917813566,40.8392383748445,40.8385374057364,40.838477850143,40.8382235666123,40.8380155723072,40.8376502766048,40.8373241061674,40.8374879598489,40.837474393597,40.8374223913663,40.8373200060728,40.8371647356467,40.836920523452,40.8368428019656,40.8364836771536,40.8363381558879,40.8363458523448,40.8369092716807,40.8368116102466,40.836725529358,40.8367549016713,40.8368128267512,40.8370242225386,40.8368419985753,40.8367924444121,40.8367464260806,40.8368819077105,40.8369295721806,40.8368750491436,40.8370577651712,40.8374704891785,40.8374460415695,40.8370644345854,40.8372099800046,40.8372330103735,40.837132104726,40.8374713340618,40.837756718087,40.8379271132254,40.8384803667951,40.8387257139474,40.8387982773384,40.8388659797836,40.8391011043691,40.8392342317759,40.8394292819689,40.8395381333907,40.8395873662531,40.8395883085652,40.839723115607,40.8397148618948,40.8396747245011,40.8397031007226,40.8396776231969,40.8396866388065,40.8397100215976,40.839766356006,40.8399451563011,40.8399896393215,40.8400490260976,40.8400545455657,40.8400724615865,40.8401222034289,40.8405318952367,40.840582316948,40.8405907717767,40.8406519252141,40.8408423416741,40.8408042706383,40.840780754098,40.8407427717964,40.8407551585514,40.8407110805014,40.8406615518444,40.8406639816078,40.840501796296,40.8404907785671,40.8406529763243,40.8406591215729,40.840702464264,40.84070128976,40.8407458631185,40.8407985420459,40.8407849161426,40.8408167533506,40.840842757038,40.8408796126878,40.8409327104988,40.8408922220128,40.8410817258349,40.8411418857565,40.8411980052959,40.8414404634061,40.8414714798359,40.8414802368422,40.8414791013758,40.8414619456777,40.8414620893698,40.8414625256178,40.8414783131045,40.8415043772548,40.8415287453716,40.841504610514,40.8415207055636,40.8415419628608,40.8415662871515,40.8415860857132,40.8416207212313,40.8416590458013,40.8416886896265,40.8417145945332,40.8417318431193,40.8417638932128,40.8417838414588,40.8418507231265,40.8417853731367,40.8418039488218,40.8418670301776,40.8421960847721,40.8423819783706,40.842402498578,40.842391035327,40.8424117659532,40.8423503959612,40.8423634545736,40.8424255768948,40.8426567538168,40.8426596253424,40.8427218551548,40.8427515013552,40.8430002463251,40.8430700643497,40.8432353317701,40.843112654365,40.8432313545617,40.8432081256582,40.8431747021471,40.843165524137,40.8432323800615,40.8432241542407,40.8431795932937,40.8431768313177,40.843141548043,40.8431433795498,40.8430496007927,40.8430422648663,40.8431388328007,40.8431397360649,40.8431750138325,40.8431731867723,40.8433078172436,40.8433132989344,40.8432408730043,40.8432509541467,40.8433809344673,40.8434132474787,40.8434478225887,40.8434171466591,40.8434422174564,40.8434703406619,40.8435135746531,40.8435866562824,40.843599570474,40.8436814980556,40.8437491116523,40.8437936779063,40.8438432308453,40.8438367425103,40.8439457145475,40.8439751985221,40.8439850850581,40.8440114960947,40.8442896248183,40.8442929783521,40.8445019731112,40.8448976109035,40.8449242375681,40.8449284171573,40.8451877778844,40.8454927547125,40.8457415588344,40.8456987816413,40.8456528320625,40.8456974347446,40.8457860125509,40.8462302462746,40.8462516010898,40.8463008206403,40.8463099813459,40.846357311525,40.8463461666545,40.8463460704014,40.8462510049653,40.8462774191292,40.8463575909496,40.8464170189012,40.8464274723316,40.8465556759298,40.846549170068,40.8465377639008,40.8465625431943,40.8465478470329,40.8465759271816,40.8466087324992,40.8467061774723,40.8467012995604,40.8468020527137,40.8467316723293,40.8467679894942,40.8468647979688,40.8468876426859,40.8469278210445,40.8469503696252,40.8469588037629,40.8473060439862,40.847252868927,40.8472363620689,40.8472282532791,40.8472285198791,40.8472582180308,40.8472661538696,40.8472726988569,40.8472957971026,40.8473599891744,40.8474800465622,40.8474604291969,40.8475380172983,40.8475928674716,40.8476018678567,40.8476464250922,40.8476630915501,40.8480579230643,40.8480265056664,40.8480529244079,40.8480862386525,40.8482323023903,40.8484004969992,40.848501039356,40.8485522204472,40.8487250888286,40.8488081270342,40.848815524928,40.84874079645,40.8488116690644,40.8488668730158,40.8489852102194,40.8489999991694,40.8488865637991,40.8491788469899,40.8495314692877,40.8498589736448,40.8499725593619,40.8499225399765,40.8499076826687,40.8498946093209,40.8499094592268,40.8498442332376,40.8498326795902,40.8497820377064,40.8497473661384,40.8497391796438,40.8498283490296,40.8498888275902,40.8498640509837,40.8498917012487,40.8499082079759,40.8499212651616,40.8499064078614,40.8499226743314,40.8499375344149,40.8499522573728,40.8499390501666,40.8499893902006,40.8503163319626,40.8502921302027,40.8502674416482,40.8502856014325,40.8502790731516,40.8502361610853,40.8502213901894,40.8501586512698,40.850142334616,40.850272762714,40.8503250806076,40.8503614023573,40.8503483211092,40.8503681321659,40.850397518037,40.8503826646802,40.8503679464202,40.8503332831735,40.8503478195829,40.850451288624,40.8506117271378,40.850407515282,40.8504322754241,40.850626122555,40.850768547814,40.8509320201068,40.8509035105228,40.8509127959065,40.8509397153125,40.8509844738535,40.850952729384,40.8509610880739,40.8509947644029,40.8511899121946,40.8513007717132,40.8514873368221,40.8514768613213,40.851488703321,40.8514622938808,40.8514372197087,40.8514491645863,40.8514194513656,40.8514194179419,40.8513386433274,40.8513239810696,40.8513490585242,40.8513453750023,40.8513918035146,40.8513945627478,40.8514521319669,40.8514145302111,40.8512594709595,40.8512576728095,40.8514071635898,40.851366793055,40.8512265788572,40.8512201438511,40.851358503724,40.8512897063184,40.8511541357738,40.8511486271558,40.8512832694447,40.8512640152991,40.8512890793499,40.8513083423629,40.8514039779403,40.851408562095,40.8513138509981,40.8513863564677,40.8514884898967,40.8514930879222,40.8513909411603,40.8514322298931,40.851509299306,40.8515166464207,40.851439577001,40.8515003821321,40.851692670565,40.8516074071841,40.8516625791549,40.8515469035489,40.8516388259674,40.8517529045629,40.8518398267893,40.8518334354379,40.8517563771663,40.8517233720031,40.851767006154,40.8517798547381,40.8517993481266,40.8518149058481,40.8518279003075,40.851827951413,40.8518966503176,40.8518993839488,40.8519690261494,40.8519760649297,40.8520345273822,40.8522512852358,40.8522306399868,40.8520402359284,40.8520310177381,40.8522232710926,40.8521634151478,40.8519897209503,40.8519777563453,40.8521532841344,40.8520998759678,40.8519262124944,40.8519778894914,40.8519444438914,40.8518613413858,40.8518966523021,40.8519188235191,40.8519142404308,40.8520888249684,40.8520528898037,40.8520352396326,40.8520057673111,40.8518683298277,40.8518793848393,40.851860805253,40.8518165532695,40.851836059914,40.8518563310627,40.8520160748948,40.8520161125067,40.8519451496967,40.8517835456201,40.8518001282564,40.8517796960942,40.8517299358909,40.8517503647952,40.8517761759172,40.8519340724214,40.8518705309513,40.8517646539592,40.8516106482581,40.8515874297298,40.8515237914069,40.8515507250927,40.8516078992365,40.8516236900845,40.8517740077061,40.85186223511,40.8518032846613,40.8518255732624,40.8522718315855,40.8522806611534,40.8520558525737,40.8521977497844,40.8521660676736,40.8521834828813,40.8522151764154,40.8522580105032,40.8522259775339,40.8522329430854,40.8522648060277,40.8522802898866,40.8518085718713,40.8515844297581,40.8515782952408,40.851828437087,40.8518444045337,40.8519163527338,40.8519311746745,40.8518703721512,40.8518480726759,40.8523046814108,40.8526020383048,40.852109878159,40.8520328360855,40.8520218837304,40.8522640439249,40.8522727910371,40.8521363025276,40.8526280749859,40.8527715719242,40.8530229782125,40.8531887220161,40.8531185269907,40.8531633995922,40.853117691262,40.8530359928268,40.8530286003553,40.8531115490902,40.8530108477136,40.8528362539371,40.8528227279835,40.8530047489597,40.8529580859457,40.8527847185254,40.8527773382266,40.8529544234902,40.8528954482288,40.852720846583,40.8527109881385,40.8528880702981,40.8528315720943,40.8526569681694,40.8526495843216,40.8528229608848,40.8527701739522,40.8525930979695,40.8525857082061,40.8527615527144,40.8526804607679,40.8525083394697,40.8524948193089,40.8526954359823,40.8527076983734,40.8531990600643,40.8533197811035,40.8532644519247,40.8537068642332,40.8534099207049,40.8530620938816,40.8530533361148,40.8534011785408,40.8533029449095,40.8529529294536,40.8529441813285,40.8533712492852,40.853377802404,40.8533293797221,40.8537322078817,40.8538445742532,40.8539184124267,40.853861078984,40.8538787229945,40.853600708755,40.8536717089094,40.8536799115,40.8536303750979,40.8539449566647,40.8539631965326,40.8538954786739,40.8538908882321,40.8539173287806,40.8539935399008,40.85398943667,40.8539800387375,40.8538963082708,40.8538542219227,40.8538493278129,40.8540164349431,40.8540188421887,40.8539223004459,40.8540014872304,40.8539969548983,40.8540048299004,40.8542223547429,40.8544390115384,40.8545840259769,40.8554167523696,40.8556451677071,40.8557886661371,40.8558940634807,40.8559469932098,40.8559953443406,40.8560723554083,40.8560126152917,40.8561405234718,40.8561769486063,40.8562060072138,40.85625611877,40.8562251277185,40.8563655121425,40.8564051579222,40.8564149651615,40.8564413948365,40.8564498169122,40.8564776420094,40.8564755219677,40.8565130862345,40.8565081411262,40.85654014421,40.8565239542295,40.8565469113681,40.8567259611497,40.8566797947431,40.8566864414041,40.8568161654745,40.8568139179516,40.8567523538577,40.8565688893296,40.8566659243807,40.8566611833364,40.8566681433947,40.8567168565852,40.8567245027936,40.8566761075128,40.8567198528192,40.8567690016685,40.8567787332412,40.8567308579452,40.8568518428551,40.856792803532,40.8568241651252,40.8568428753032,40.8568331250586,40.8568664295283,40.8569002425518,40.8569842889639,40.8571460004104,40.8571147242388,40.8571070428457,40.8569061725314,40.8569285420342,40.8571328903861,40.8571231059691,40.8571522984247,40.8573936662167,40.8574357899179,40.8571893964906,40.8569917833512,40.8570030260432,40.8570635965505,40.8574792024937,40.8574642214273,40.8574190113197,40.8570041072594,40.8570137971982,40.8574203935927,40.8575077045023,40.857487846725,40.8574219566026,40.8571669318704,40.8574371218653,40.8577153317841,40.8576247251838,40.8576300758402,40.8576396253623,40.8578455477522,40.857839475268,40.8578290103377,40.8577367419719,40.8573939500042,40.857374179454,40.8574271830768,40.8571579899472,40.8570287020114,40.8571783542773,40.8573753129925,40.8572632386981,40.8575527481889,40.8576865703025,40.8576742173799,40.8577052825311,40.8577225882014,40.8578828125709,40.8577605235232,40.8577754258556,40.8579631775601,40.8581546851231,40.8581422602978,40.8579013420481,40.8577374140003,40.85774976103,40.8577149922319,40.8577013990398,40.8575677879731,40.8577503508179,40.8578027903299,40.8579165340986,40.8581540848113,40.8584595485613,40.8585221023423,40.8585172499559,40.8585416546329,40.8585527670335,40.8586015897105,40.8586099173862,40.8585624873098,40.8585701205891,40.8585387453294,40.8585317981041,40.8584754049121,40.8585227941505,40.8585243395339,40.8585459375095,40.8585788472619,40.858589226702,40.8585979616658,40.8586252302195,40.8586379878776,40.858670152178,40.8586732646033,40.8586780061678,40.8586980636836,40.8587173384862,40.8587401152872,40.8587652164518,40.8587425155314]}],[{"lng":[-73.7678320563717,-73.7682312652446,-73.7685566032705,-73.7690443898713,-73.769385291397,-73.768608176871,-73.7695967431147,-73.7695032156276,-73.7680563608623,-73.7678949267283,-73.7690138918112,-73.7699804265778,-73.7711837801058,-73.7715721883324,-73.7713077293794,-73.7708892022118,-73.7720496366845,-73.7724689293817,-73.7724665195014,-73.7727111749614,-73.7727091206161,-73.772465941265,-73.7724605229543,-73.7726441700332,-73.7726713053291,-73.7727207282958,-73.772718452112,-73.7729173932318,-73.7729208116276,-73.7729635661129,-73.7729679374417,-73.7729453916279,-73.7728768161762,-73.7728768395073,-73.7727060149172,-73.7726483774692,-73.772904294762,-73.772890757313,-73.7726393580299,-73.7726325831005,-73.7725842958313,-73.7726147950971,-73.7724594016302,-73.7724514941548,-73.7717306041191,-73.7717171593655,-73.7722968053138,-73.7722757705761,-73.7722753631336,-73.7722929360788,-73.7723126687318,-73.7723373540152,-73.7723620067985,-73.77234917455,-73.7728075180892,-73.7728112268767,-73.7729628533487,-73.7729581751704,-73.7727959772195,-73.7728000806578,-73.7726943063983,-73.7726944802606,-73.7723327221974,-73.7723111695654,-73.7722877176083,-73.7722291318758,-73.7721972470162,-73.7721403684182,-73.7721272258974,-73.7721454793762,-73.7721822637827,-73.7722002403415,-73.7722060690112,-73.7721864456302,-73.7721726996846,-73.7721469049092,-73.7721397063995,-73.7721693406469,-73.7721681828941,-73.7721538020581,-73.7721658510538,-73.7721655249182,-73.7721961888176,-73.7722080266953,-73.7722075538852,-73.7721882402391,-73.7721815292515,-73.772193645262,-73.7722368970486,-73.7723543271065,-73.7721922305542,-73.7708456236057,-73.7694730542401,-73.7683627729079,-73.7683608591898,-73.7653324399529,-73.7678320563717],"lat":[40.8544422057421,40.8538878888074,40.8532383229595,40.8532909246936,40.8525361339968,40.8507883953781,40.8475945190982,40.8472178342352,40.8455982181375,40.8452894330171,40.8450973427219,40.8459514128695,40.8469445133121,40.8475000585804,40.8480287743218,40.849751771338,40.8516182897575,40.8517091473893,40.8518095688939,40.8518265809337,40.8518476634615,40.8518336845023,40.8520595421737,40.8521389805788,40.8520988887823,40.85211948523,40.8521271687547,40.8521745379254,40.8521617317528,40.8521592539586,40.8521968453856,40.8522104669469,40.852198373764,40.8521915411783,40.852145935077,40.8522244026296,40.8523871921613,40.8523982689983,40.852230362276,40.8522380369325,40.8522140258679,40.8521765043354,40.8521062670822,40.8524358968935,40.8524768313191,40.8530045392819,40.8530863782524,40.8533181315364,40.8534371353639,40.8534797762391,40.8535276533128,40.8536419468,40.8537657611013,40.8538514202341,40.8538506312757,40.8537970865504,40.8538000622465,40.8541374329234,40.8541317587019,40.8539630762566,40.8539575129971,40.8539066390134,40.8539008446752,40.853965589997,40.8540104493269,40.8541225150438,40.8542795384011,40.8544127126006,40.8545888142139,40.8547506970928,40.8549935399675,40.855236346857,40.855364883841,40.8556028554422,40.8559550833618,40.8561644817747,40.8564357991997,40.8569356787656,40.8572736518997,40.8578115261418,40.8579543560855,40.8580495595389,40.8582495491571,40.8584542614441,40.8585923056182,40.8587398346387,40.8588683467835,40.858992136248,40.8591778687733,40.8596731619806,40.859986638597,40.8601010128568,40.8593301366686,40.8583582888519,40.8576553632034,40.8550435951249,40.8544422057421]}],[{"lng":[-73.7845745165458,-73.7844962551005,-73.7844374723637,-73.7844409500086,-73.7843593820364,-73.7843375393238,-73.7843696069391,-73.7844076439542,-73.7844612005787,-73.7845302689546,-73.7845622058828,-73.784603255387,-73.784587788952,-73.7846412447895,-73.7846445909123,-73.7847139765728,-73.784761086061,-73.784814587228,-73.7848765433705,-73.784869376554,-73.7849786030076,-73.7851161220256,-73.7851087348766,-73.7851401704174,-73.7852533419503,-73.7853097001967,-73.7853281136783,-73.7853750808872,-73.7854833101258,-73.785567841132,-73.7855629729891,-73.7856711103235,-73.7857319917326,-73.7858215200494,-73.7858825858318,-73.7860754048853,-73.7862166429507,-73.7863674423584,-73.7866080797074,-73.7866083663771,-73.7865427528639,-73.7865760130465,-73.7866939308742,-73.786792585247,-73.7868633174421,-73.7870089977849,-73.7872608374216,-73.7872750437945,-73.7873663852163,-73.7874825920349,-73.7875892650431,-73.7877337227347,-73.7875984814814,-73.7874804868488,-73.7874784660849,-73.7873713217297,-73.7873428353812,-73.7871569098527,-73.7871662100835,-73.7871118216244,-73.7871409610493,-73.7871220550955,-73.7870716930954,-73.7870180861387,-73.787008480293,-73.7870365636009,-73.7870301496807,-73.7870519342239,-73.7870454440134,-73.7870013048461,-73.7869195745988,-73.7868191320376,-73.7867092900356,-73.7866560716067,-73.7866151227283,-73.7864864746884,-73.7864362036493,-73.7863105856206,-73.7862164026664,-73.7861034603242,-73.7860251070841,-73.7859184031055,-73.7857990768229,-73.7857016646711,-73.7856074738756,-73.7855070755723,-73.7854755802642,-73.7854284537368,-73.7852089146883,-73.7850925721168,-73.785026533055,-73.7848854386844,-73.784838405796,-73.7848068933503,-73.7847378226123,-73.7846843519889,-73.7846278730437,-73.7845745165458],"lat":[40.8605319977584,40.8604722875709,40.8602124795858,40.8601076536337,40.8601003528093,40.8600621913049,40.8598502039805,40.8597335294959,40.8596693001363,40.8596598983884,40.859488413789,40.8594098667138,40.859340743033,40.8593074870184,40.859243164339,40.8591360785074,40.8591242537933,40.8590767026512,40.8590583270918,40.8590316456333,40.8589476871904,40.8589047834341,40.8588450650704,40.8587926124781,40.8587512957318,40.8587907130671,40.8589194055221,40.8589516564444,40.8589625802468,40.8590234920257,40.8590735167732,40.8591130296515,40.8592096362034,40.8591812125095,40.8592206382994,40.8592746028834,40.8592677174449,40.8592143886903,40.8590361420357,40.8589467968277,40.8588573292112,40.8587608972674,40.858686064557,40.8587470020534,40.8587078214664,40.8587831401016,40.8588308482638,40.8588546365193,40.858827496191,40.858827861741,40.8588040815218,40.8587709915781,40.8588660448925,40.8589968271015,40.8591589800949,40.8592468363081,40.8593230251669,40.8595657037077,40.8596014596913,40.8596993992176,40.8597314561973,40.8597552470325,40.8598028055328,40.8598837133197,40.8599432596258,40.8599933452508,40.8600362194651,40.8600934406873,40.8601601404758,40.8602243884116,40.8602671235515,40.8602740857401,40.8602762650881,40.8602356631635,40.8602832393697,40.8602782354894,40.8602972027857,40.8603255617927,40.8603372999249,40.8603275598429,40.8602964411122,40.8602986260295,40.860322230274,40.8603625525809,40.860376673058,40.8603693387245,40.8604050184899,40.8604216093429,40.8603806966483,40.8604519576497,40.8604947206757,40.8604563358526,40.8604443355468,40.8604847804754,40.8604941823846,40.8605322027834,40.8605297148485,40.8605319977584]}],[{"lng":[-73.7732184546988,-73.7732621995875,-73.7733967851429,-73.7733363459062,-73.7732184546988],"lat":[40.8607944638569,40.8606306116497,40.86073948468,40.860853860361,40.8607944638569]}],[{"lng":[-73.7819018153177,-73.7818329046886,-73.7817977390625,-73.7817602138886,-73.7816686385751,-73.781659998409,-73.781716932169,-73.7817195526908,-73.7817733612875,-73.7817983666979,-73.7817944555886,-73.7818671375583,-73.7819160540749,-73.7819713350504,-73.7820177472321,-73.7820678796389,-73.7821065933884,-73.7821064873704,-73.7821552598106,-73.7821746049979,-73.7822008037985,-73.7821063444281,-73.7819893982384,-73.7819018153177],"lat":[40.8764193662272,40.8764087687933,40.8764286836365,40.8764038736948,40.8764236818104,40.8763827519483,40.876223007187,40.876188758343,40.8762174048833,40.87623743366,40.8762830986128,40.8762908475984,40.8762823765974,40.8762444219607,40.8762349943186,40.8762379429248,40.8762827365062,40.8763150875448,40.8763503847837,40.8764019996749,40.8764342026822,40.8765233698447,40.8764699605432,40.8764193662272]}],[{"lng":[-73.7835283143958,-73.7835001052264,-73.7834607445719,-73.7834173078215,-73.7834589736921,-73.7835070623987,-73.7835291227515,-73.7835838935742,-73.7835602079534,-73.7836655067003,-73.7837499209008,-73.7838403243884,-73.7838946102702,-73.783938063828,-73.7839574965726,-73.7838897920714,-73.7838984560303,-73.7840049394705,-73.7839063502643,-73.7838600170837,-73.7837989827466,-73.7837485782934,-73.7837484221692,-73.783702266977,-73.7836387401242,-73.7835558181648,-73.7834861101629,-73.783447066528,-73.7835283143958],"lat":[40.8772408671584,40.8771977778815,40.8772308089542,40.8771761046808,40.8771050073074,40.8770703381494,40.8769925826172,40.8769148890947,40.876822150596,40.8766303398549,40.8765390084702,40.8765197667584,40.8765910434891,40.8766407824011,40.8767004079417,40.8767317304677,40.876749953946,40.8768643657192,40.8770048766487,40.8771703133061,40.8771619231708,40.8772379700125,40.8772859718011,40.8773967864621,40.8774843950608,40.8775007918633,40.8774774881336,40.8774128606742,40.8772408671584]}],[{"lng":[-73.7852513473661,-73.7852100240063,-73.7851771772515,-73.7851358616876,-73.785096372504,-73.7850498696053,-73.7850103119555,-73.7850121828989,-73.7850363904857,-73.7850760889656,-73.7851415950433,-73.7851604890525,-73.7852276039487,-73.7852759191005,-73.7853499785479,-73.7854378807476,-73.7854638081792,-73.7855050721976,-73.7855722807533,-73.7856617968755,-73.7856754910737,-73.7854267081664,-73.7853630020595,-73.7852960424976,-73.7852547266773,-73.7852513473661],"lat":[40.8799088030628,40.8798969541518,40.8799282863347,40.8799138205339,40.8798679649686,40.8798587220603,40.8798337951606,40.8797880159341,40.8797632078067,40.8797449691259,40.87973985801,40.8797595144888,40.8797897245353,40.8797715018206,40.8797860284755,40.8797835762234,40.8797600787215,40.8797902405498,40.8797916736264,40.8798232337279,40.8798520367723,40.8800412441033,40.8800228125264,40.8799442044345,40.879929738676,40.8799088030628]}],[{"lng":[-73.7848358780956,-73.7846915885461,-73.7845122605728,-73.7844347616777,-73.7844718979463,-73.7843968686715,-73.7842652131064,-73.7841145056354,-73.7839854964609,-73.7838224182345,-73.7837664260995,-73.7838106213151,-73.7836945661896,-73.7836667663307,-73.7837015577875,-73.7838412493374,-73.7839528685016,-73.7839689530702,-73.7840664008734,-73.784147814971,-73.7840960101389,-73.7841630484018,-73.7841218517315,-73.7843285043326,-73.7845167411609,-73.7846331056336,-73.7846928539147,-73.7847555422743,-73.7848085394545,-73.7847988879917,-73.7849180655896,-73.7850911337011,-73.7852665214536,-73.7853477067365,-73.785189017492,-73.7849577347024,-73.7848358780956],"lat":[40.8805582744717,40.8805246495356,40.8806592090909,40.8806269376365,40.8805099440716,40.880414501918,40.880357075088,40.8803663240009,40.8804723858658,40.8804244292621,40.8802670756787,40.8801909173924,40.880151108212,40.8800238695864,40.8799319259382,40.8799048619644,40.8798752151735,40.8797671202015,40.8797134147519,40.8797755132244,40.8798734136291,40.8799294962451,40.8800375449411,40.8801999446864,40.8802336521412,40.8801781590513,40.8801339134421,40.8801626213646,40.8802880842218,40.8803485407045,40.8803821187125,40.8802647846527,40.8803890046162,40.8805225775189,40.8806945257664,40.880745811768,40.8805582744717]}],[{"lng":[-73.8197062207993,-73.8195798802582,-73.8194850560712,-73.8194470446169,-73.8193766517293,-73.8192638550414,-73.8192594614578,-73.8193228079943,-73.8194086791859,-73.8194581273736,-73.8195848511527,-73.8196887404384,-73.8197386462506,-73.8197795991469,-73.8197888219001,-73.8197348382722,-73.8196040966057,-73.8194943264822,-73.8194327853892,-73.8193019318854,-73.8192026694702,-73.8191214804555,-73.8191170976628,-73.8191578450162,-73.8192707626138,-73.8193475107463,-73.8194649607783,-73.8194921653581,-73.819569108644,-73.8196324088344,-73.8196672785267,-73.8197363060031,-73.8198582044236,-73.819966568983,-73.8200568782426,-73.8201021762241,-73.8201249413828,-73.8201521831128,-73.8201705264916,-73.820202448795,-73.8202433537734,-73.8202435112473,-73.8202121063766,-73.820135535419,-73.8201266376503,-73.8201268415707,-73.8201994914825,-73.8202628352733,-73.8202629371549,-73.8202043574191,-73.8201465506315,-73.8201276850546,-73.8200510034735,-73.8200240950467,-73.8200784210019,-73.8201689780259,-73.8202686647429,-73.8203374471862,-73.8203090610513,-73.8202566474496,-73.8202162245982,-73.8202130547455,-73.8202809641484,-73.8204098298042,-73.8206199397437,-73.8207182260944,-73.8208167477716,-73.8208948329476,-73.8209965809566,-73.8210568744567,-73.8210432955499,-73.8210130009026,-73.8209759202981,-73.820945639615,-73.8209595614352,-73.820969980602,-73.820974440213,-73.8209769581023,-73.8210448447496,-73.8211127658279,-73.8211536115873,-73.8211639820306,-73.8211236131053,-73.8210358368736,-73.8209480684618,-73.8208907257989,-73.8208583484955,-73.8206991886792,-73.82065127163,-73.8205712412618,-73.8204428188033,-73.8204025485318,-73.8204343494818,-73.8204822005454,-73.8205139359647,-73.8205615736435,-73.8205932936008,-73.8206410787338,-73.8206969055752,-73.8207731605911,-73.8206802646877,-73.8205680689273,-73.8204640131483,-73.820351901436,-73.8202638450277,-73.8201596260193,-73.8200393736932,-73.8199753431325,-73.8199594592641,-73.8199597066553,-73.819975936823,-73.8199440044945,-73.8198478254212,-73.8197598046825,-73.8197601349025,-73.8198085454582,-73.819916531585,-73.8202170542573,-73.8202095437923,-73.820223408475,-73.8202734026321,-73.8203638978662,-73.8205355924314,-73.8206983240576,-73.8208879531168,-73.8211812115105,-73.8212261728902,-73.821284676073,-73.8213541586184,-73.8216491621716,-73.8216327521403,-73.8215832847989,-73.821430208013,-73.8212498006554,-73.8210467514092,-73.8208120701851,-73.8205954538455,-73.8204780529581,-73.8203921729572,-73.8203047240086,-73.8202406138558,-73.8199051939651,-73.8195541714198,-73.8191842773224,-73.8191972438127,-73.8192019147789,-73.8191976723586,-73.8192069319652,-73.8192296957606,-73.8192930158397,-73.8194826893964,-73.8196135737195,-73.8197489255141,-73.8199052704476,-73.8199480323409,-73.8196956727771,-73.8194866343365,-73.8194335795179,-73.8193070687197,-73.8191761949189,-73.8191221625668,-73.8190635702433,-73.8189462911474,-73.8189464404146,-73.8189736717767,-73.8190459909192,-73.8191364206801,-73.8192268769039,-73.8192901979361,-73.8194120908304,-73.8195384612301,-73.8196151723927,-73.8198272899069,-73.8199536780348,-73.8200709463918,-73.8201295018359,-73.8201563429475,-73.8201787209922,-73.8202281790404,-73.8202415252709,-73.8202052404279,-73.8201508651007,-73.8201641742262,-73.8202406546106,-73.8202766994452,-73.8203397219314,-73.8203530320151,-73.8204294845461,-73.8205286463208,-73.8206188620353,-73.8207274986197,-73.8207587938792,-73.8207634832762,-73.8207320716834,-73.8207005968105,-73.8206737190482,-73.8207460842656,-73.8208092100839,-73.8208496664219,-73.8209126710757,-73.8210615377549,-73.8211562680762,-73.8212825101373,-73.8213997539197,-73.8215255067361,-73.8220981283218,-73.8219017632021,-73.8215615796236,-73.8212740721242,-73.8209630412622,-73.8204899982808,-73.8204678422809,-73.8204769706569,-73.8205583070847,-73.8206847978157,-73.8207841879133,-73.8208701473333,-73.8209154947365,-73.8209833822193,-73.821060325111,-73.8211507972168,-73.8212591961336,-73.8213720336084,-73.8214983383185,-73.8215614084057,-73.8216359790352,-73.821945677017,-73.8218875743182,-73.8217612970964,-73.8215628334963,-73.821481516464,-73.8214587010839,-73.8214584159008,-73.8213768960689,-73.8212008061869,-73.8210880325413,-73.8210204682559,-73.8210342768944,-73.8211068052356,-73.8211296303024,-73.8211840046307,-73.8211842073285,-73.8212295267199,-73.821310924384,-73.8214419444385,-73.8215819344758,-73.8217627664947,-73.8218669708162,-73.8219578361546,-73.8219718442932,-73.8219976214233,-73.8219725414266,-73.8219366725247,-73.821896226232,-73.8218873736461,-73.821887557189,-73.8218967951837,-73.8219376633759,-73.8219705250827,-73.8219652846496,-73.8219564130586,-73.8218935210309,-73.8218350215292,-73.8217856047398,-73.8217316003012,-73.8216775414955,-73.82160540264,-73.8214837882122,-73.821411339389,-73.8213480611455,-73.8212891673429,-73.8212393355369,-73.8211805985341,-73.8210767731067,-73.8210136600409,-73.820986709738,-73.8209417890567,-73.8208877120281,-73.8208743291289,-73.8208609921824,-73.8208566715097,-73.8208659297078,-73.8209022295233,-73.8209114124983,-73.8208708766578,-73.8208077095486,-73.820694942123,-73.8206183544149,-73.8205960657219,-73.8205951209726,-73.8205889937872,-73.8205348546445,-73.8204793477214,-73.8202492104295,-73.8201289368279,-73.8199972280692,-73.8192726034273,-73.8189266931716,-73.8186093142649,-73.817734241695,-73.8172811510872,-73.8171045881923,-73.8171321678563,-73.8173408549066,-73.8177883831226,-73.8181661066203,-73.8186395362808,-73.8188293636467,-73.8183302629129,-73.8181557351667,-73.8177497738369,-73.8172257874502,-73.8165908700741,-73.8162851992739,-73.8161233793286,-73.8158377418283,-73.8156167055334,-73.8153787003307,-73.8155321787834,-73.8154902177778,-73.8152539564126,-73.8148934134285,-73.8145001234624,-73.8143803908254,-73.8157876406608,-73.8164145586361,-73.8169976026643,-73.8168449590812,-73.8166212949545,-73.8157366604115,-73.8151732021925,-73.8150889149056,-73.8151590814641,-73.8152245562199,-73.815018054792,-73.8148810257774,-73.8149298412996,-73.8152439525425,-73.8151031538415,-73.8155082906395,-73.8164139210273,-73.8166488977503,-73.8166734511436,-73.8166998719005,-73.8167274466677,-73.8167554309333,-73.8167830691291,-73.8168096150305,-73.8168343519053,-73.8168566118653,-73.8168757938993,-73.8168913801002,-73.8169029496486,-73.8169101901739,-73.8169000986419,-73.8168930053109,-73.8169071127295,-73.8169292010807,-73.8169587679479,-73.8169951408176,-73.8170374923764,-73.8170848593286,-73.8171361643071,-73.8171902403767,-73.8172458575765,-73.8173017508934,-73.8173566490347,-73.8174228633364,-73.8174946717865,-73.8175714449345,-73.8176525098066,-73.8177371558054,-73.8178246409387,-73.8179141983246,-73.8180050429142,-73.8180789506711,-73.8181522799543,-73.8182239488584,-73.8182928999771,-73.8183581160044,-73.8184186347457,-73.8184735633134,-73.8185220913019,-73.8185635027432,-73.818597186671,-73.8186226461335,-73.8186395055248,-73.8186475161255,-73.8186465597711,-73.8186209447384,-73.8185994984742,-73.8185822400276,-73.8185411093534,-73.8185064968899,-73.8184785179755,-73.8184572658376,-73.8184428112822,-73.8184929640527,-73.8185700330994,-73.818655959713,-73.8187914776309,-73.8189494825675,-73.8190849168927,-73.819197740072,-73.8193710177829,-73.8195449763124,-73.8197192080192,-73.8198933046222,-73.8200668581566,-73.82023946193,-73.8203066356453,-73.8202828485718,-73.8202669679571,-73.8204115515322,-73.8205480130711,-73.8211014236926,-73.821350001623,-73.8215664744306,-73.8217670333523,-73.8219673963981,-73.8219911380911,-73.8218304938352,-73.8217422153374,-73.821613676663,-73.8215973878264,-73.8216852746283,-73.8218135516806,-73.8220141293875,-73.8222388060022,-73.8223512657316,-73.822407243871,-73.8222946538731,-73.822141998094,-73.8220137870752,-73.8219254745029,-73.8219171902999,-73.8219731193582,-73.8221736320141,-73.8223502732815,-73.8224626857813,-73.8226392122034,-73.8227754156684,-73.8227190959282,-73.8225343506467,-73.8224138835691,-73.8223143428656,-73.822293465801,-73.8221491092094,-73.822012580825,-73.8219401161444,-73.8218195509981,-73.8216590187428,-73.8215869467944,-73.8216112750702,-73.8216894717082,-73.8216924637047,-73.8216205401917,-73.8215405117246,-73.8214446022487,-73.8213968605195,-73.8213970568015,-73.8213972857994,-73.8214456488136,-73.8213815513288,-73.8212371325298,-73.8211089048712,-73.8209885368425,-73.8209402707989,-73.8209319865486,-73.8209878810678,-73.8210117522057,-73.8209713609405,-73.8209710986057,-73.8210109325885,-73.8210027950278,-73.8209385653091,-73.8208504007906,-73.8207463886159,-73.8206743676083,-73.82052210579,-73.8203615915905,-73.8202090330985,-73.8200805926542,-73.8199922794837,-73.8199760536281,-73.820064135302,-73.8202164306561,-73.8203524329082,-73.8204644195865,-73.8204720313919,-73.8204316052324,-73.8203671786964,-73.8203268193787,-73.8203426504073,-73.8203183681717,-73.8203119137807,-73.8202615721456,-73.8202279185338,-73.8201723331693,-73.8201069613836,-73.8200839171549,-73.8200060349526,-73.8199153170096,-73.8198375878216,-73.8197677452616,-73.819641048894,-73.8195137193205,-73.8194647167815,-73.8194352851437,-73.8194047988668,-73.8193770926057,-73.8193471316074,-73.8189535430748,-73.8189134807487,-73.8188719643612,-73.8188501222153,-73.8188512599791,-73.8188818473955,-73.8189148782768,-73.8189542559541,-73.8191559672191,-73.8193354978936,-73.8195233299826,-73.81971890258,-73.8199216181894,-73.8201835157532,-73.8204506245922,-73.820722721788,-73.8209995802638,-73.8212809689737,-73.8215666530952,-73.8218563942255,-73.8221499505797,-73.8224470771928,-73.8226058537854,-73.8235912425256,-73.8236530946869,-73.8241806766833,-73.8247082676358,-73.8255543837113,-73.8261532357178,-73.8268940432236,-73.8270544139317,-73.8271455629839,-73.8272176947334,-73.8299990383079,-73.8299055380277,-73.8299162390975,-73.8298439885255,-73.8295762357272,-73.8294352707923,-73.8290831870588,-73.8286019716532,-73.8280141596088,-73.8272302606017,-73.8272175114404,-73.8273783576626,-73.8270757933538,-73.8269355604507,-73.8267594811613,-73.8271313332546,-73.827184237589,-73.8269849071501,-73.826878543486,-73.8271115838104,-73.8271898266553,-73.8272466141637,-73.8272573571223,-73.8272815422716,-73.8272945699846,-73.8272856124752,-73.8272548043598,-73.8272024925577,-73.826979355415,-73.8267260158735,-73.8265546067396,-73.8264582938819,-73.8262506803238,-73.825977351434,-73.8258868041304,-73.8257268144441,-73.8255102231047,-73.8254753845592,-73.8255826701322,-73.8254923666768,-73.8249569766314,-73.8244376041839,-73.8239595539916,-73.8230129698969,-73.8220382684854,-73.8211035563378,-73.8204840561741,-73.8201404361447,-73.8191500914545,-73.8182022683034,-73.8172632266091,-73.8163011915219,-73.8151419191866,-73.8152408668624,-73.8152855060849,-73.815343943124,-73.8153563141705,-73.8153575196122,-73.8153183276322,-73.8153173218819,-73.8153234400271,-73.8154509009702,-73.8155173550394,-73.8155300366682,-73.8156337811069,-73.8157014631626,-73.8157624698265,-73.815800208213,-73.8158073300462,-73.8158666602996,-73.8159028142068,-73.815897116493,-73.8158973251068,-73.8158613631583,-73.8157757623118,-73.815694597525,-73.8156314516196,-73.8156044284405,-73.8156045139199,-73.815645166816,-73.8156947683968,-73.8157534032544,-73.8158029843457,-73.8158796857479,-73.8159573475399,-73.8159744992788,-73.8160558923283,-73.8160967060921,-73.8161286299348,-73.8161470557412,-73.8161702681198,-73.8161662285992,-73.8161487223567,-73.8161300604869,-73.8161179735988,-73.8161053747716,-73.8160724677434,-73.8160268511505,-73.8158443288775,-73.8157758661957,-73.8157190383456,-73.8156848863035,-73.8156877032089,-73.8154586761547,-73.8153364437623,-73.8150396314556,-73.8149346545325,-73.8148616003854,-73.8146272778874,-73.8146236381928,-73.8146674141453,-73.8146459469755,-73.814511067696,-73.8145337002393,-73.8145754088475,-73.8146084736806,-73.8148473509641,-73.8149648954781,-73.8151584633276,-73.8153287782356,-73.8154341339023,-73.8155040927003,-73.8154745677966,-73.8155550808555,-73.8155831397372,-73.8156828841434,-73.8156910465961,-73.8157035318945,-73.8156617115367,-73.8156155918577,-73.8156109402784,-73.8155728508249,-73.815514421317,-73.8151637093423,-73.8151179580038,-73.815072223805,-73.8150392207611,-73.8149986361344,-73.8149656982984,-73.8149226573931,-73.8148468378498,-73.8147021413664,-73.8145897658328,-73.8145657911825,-73.814513013641,-73.8144789059203,-73.8144342346963,-73.8144095316957,-73.814357262886,-73.8143327271204,-73.8142787652346,-73.8142426258526,-73.8142011119943,-73.8141615739446,-73.8141239494042,-73.814097764937,-73.8140471037892,-73.8140201039395,-73.8139672085706,-73.8139277174269,-73.8138903665084,-73.8138653271872,-73.8138121855261,-73.8137869919372,-73.8137335496932,-73.8137080557839,-73.8136574083938,-73.8136565472686,-73.8137054212704,-73.813686347382,-73.813611946397,-73.8135637286167,-73.8135830595808,-73.8136274532093,-73.8136447278294,-73.8136958838012,-73.8137209141691,-73.8137731809535,-73.8138000200813,-73.8138511680663,-73.8138789424858,-73.8139064166057,-73.8139548371744,-73.8140064441796,-73.8140339021105,-73.8140842173095,-73.8141126142839,-73.814122486803,-73.814283259677,-73.8143174907764,-73.814423632916,-73.8144309479949,-73.8145818230496,-73.8148431585233,-73.8149085820319,-73.8146569579343,-73.8144690767417,-73.8144235257983,-73.8146550797038,-73.8146044903403,-73.8146817077029,-73.8147529920287,-73.814805342878,-73.8148629624093,-73.8150859385591,-73.815026276043,-73.8142057312911,-73.813990421324,-73.81390002992,-73.813188650725,-73.8131446020024,-73.8138188057648,-73.8140058901369,-73.8140181269572,-73.8139796439502,-73.8134832683883,-73.8134640968365,-73.8139741915033,-73.8140225597418,-73.8140319821938,-73.8139542446311,-73.8136858909351,-73.8136722010049,-73.8139427912892,-73.813902069407,-73.8138566779882,-73.8137289264877,-73.813711148915,-73.8138425886934,-73.8138054459059,-73.813632582327,-73.8136192153525,-73.8136145615574,-73.813609943948,-73.8136062734688,-73.8135984047366,-73.81351835901,-73.8135169818934,-73.8134852598152,-73.813455136879,-73.8134513738106,-73.8134252544073,-73.8134056557892,-73.813401746625,-73.8133590558502,-73.8133531160534,-73.8133309296415,-73.8133192505085,-73.8132893269288,-73.8132129524425,-73.8132188808007,-73.8132835929606,-73.8133078704928,-73.8133121339401,-73.8133380033891,-73.8133435464092,-73.8133608499427,-73.8133659166321,-73.813439644591,-73.8134621533595,-73.8134714600875,-73.8134876816341,-73.8134988042609,-73.813503540281,-73.81352545669,-73.8135288836731,-73.8135513216049,-73.8135551904574,-73.8135771878049,-73.8135815018606,-73.8135833436442,-73.8135905758611,-73.8135923578021,-73.8136030793585,-73.813605296795,-73.8136087496827,-73.8136185826705,-73.8134616641354,-73.8132599772469,-73.8132385841432,-73.8132330638924,-73.813205322668,-73.8131849686936,-73.8131813263456,-73.8131583633644,-73.8131289406328,-73.8131041484968,-73.813100212144,-73.8130700301097,-73.813065715302,-73.8130559203804,-73.8130321484997,-73.8129722205696,-73.8129652515322,-73.8129610902181,-73.8129326707939,-73.8129279178725,-73.8128995185849,-73.8128947510088,-73.8128663452223,-73.8128616248976,-73.8128347148282,-73.8128291043547,-73.8128003477318,-73.8128550632997,-73.8128493995852,-73.8127245767677,-73.8127311850998,-73.8127863772645,-73.8128130245817,-73.8129127269704,-73.8129169557656,-73.8129434074835,-73.8129486182663,-73.8129805049014,-73.812985560734,-73.8130173533951,-73.813021302914,-73.8130425098637,-73.8130896817521,-73.8131151569259,-73.8131199180935,-73.8131402385515,-73.8131518944978,-73.8131663297347,-73.8131693423064,-73.8131900879081,-73.8132008316033,-73.8132133770398,-73.8132173322465,-73.813218832719,-73.8132432635106,-73.8132073362537,-73.8131860321899,-73.813160725449,-73.8131319970072,-73.8131005063921,-73.8130669765418,-73.8130321772085,-73.8129969072877,-73.8129364742229,-73.8128770359743,-73.8128615095885,-73.812994993924,-73.8131491426959,-73.8131559704426,-73.8129934380875,-73.8128553695764,-73.8128312182496,-73.8127509619538,-73.812693573955,-73.8126365379925,-73.8126084648789,-73.8125892469618,-73.8125852677471,-73.8125157943753,-73.8124888632218,-73.8124698203481,-73.8124666572753,-73.812446578716,-73.8123658932568,-73.8123400385257,-73.8124144532813,-73.8124095770757,-73.812277909005,-73.8122817026538,-73.8123296013301,-73.812392256646,-73.8124016231017,-73.8124046054104,-73.8124274491957,-73.8124437463115,-73.8124515242828,-73.8124551804163,-73.8124653783111,-73.8124794586284,-73.8124976903203,-73.8125012415216,-73.8125193042311,-73.8125224745487,-73.8125449024088,-73.8125481027328,-73.8125679545067,-73.8125709100481,-73.8125890919343,-73.8125930732497,-73.812615865814,-73.8126206686793,-73.8126475317541,-73.8126521176322,-73.8126774039104,-73.8126816651072,-73.8127030530214,-73.8127073748351,-73.8127300363471,-73.8127336955554,-73.8127591373199,-73.8127626091815,-73.8127877924403,-73.8127916089606,-73.8128148070046,-73.8128187370874,-73.8128414355154,-73.8126067542148,-73.8126137878729,-73.8128489654355,-73.8128577433796,-73.8127867706024,-73.8127181552948,-73.8126522859257,-73.8126418703826,-73.8126343178552,-73.812629831571,-73.8126285322483,-73.8125445781561,-73.8124400843135,-73.8125486646436,-73.8125384434407,-73.8124554405323,-73.8121886034577,-73.8121748149628,-73.8119550455182,-73.8119612733902,-73.8120338371347,-73.8120217236312,-73.8120350162966,-73.8120266504,-73.8119156826697,-73.8118845884479,-73.8123023649692,-73.8124362506068,-73.8124235865464,-73.8123025520204,-73.8118776605891,-73.8118414922167,-73.8116997182366,-73.812233869483,-73.8122410762878,-73.8123181679274,-73.8123193698125,-73.8123295612444,-73.8123427710665,-73.8124322321851,-73.8124339819535,-73.8124478650901,-73.8125155335495,-73.8125175368001,-73.8125270477547,-73.8126011278366,-73.812603205657,-73.8126213520924,-73.8126482067927,-73.8126614134905,-73.8127730610859,-73.8127839530399,-73.8127836079504,-73.8127836078717,-73.812713811827,-73.8127124230172,-73.8127159662068,-73.8127238416698,-73.8127238765243,-73.8127269832805,-73.8127281625235,-73.8127761871604,-73.8127769894226,-73.8127779007893,-73.8127784125106,-73.8127788168698,-73.8127809680088,-73.8128212193793,-73.8127999523388,-73.8127612352982,-73.8127686268217,-73.8127760709977,-73.8128055118806,-73.8128055465145,-73.8129912030509,-73.8129832521807,-73.8129718121892,-73.8127595582514,-73.8127613503798,-73.8127618323915,-73.8127440865004,-73.8127149339389,-73.8127124043984,-73.8127033728049,-73.8127026798965,-73.8126978656711,-73.8126488933667,-73.8128973137083,-73.8129107442697,-73.8129022578512,-73.8129117569329,-73.8129622078909,-73.8129721379384,-73.8131131815287,-73.8130928806674,-73.8130451020571,-73.8130361971366,-73.8130704182701,-73.8130647312541,-73.8131179502371,-73.8130933831711,-73.8126574446262,-73.81268023985,-73.8126798460958,-73.8126409580988,-73.8125490912071,-73.8126339711425,-73.8126402547584,-73.8126490403652,-73.8126600771203,-73.812673049908,-73.8126875883367,-73.8127032773139,-73.8127196688978,-73.8128536716306,-73.8129874745305,-73.81312081807,-73.813253443612,-73.8133517176972,-73.8134495813784,-73.8135466887783,-73.8135476194774,-73.813590956465,-73.813632964982,-73.8136558066226,-73.81367848753,-73.8137004384586,-73.8137211084837,-73.8137399788294,-73.8137565758887,-73.8137704831102,-73.8137813514526,-73.8137889081448,-73.8138395778087,-73.8138918509207,-73.8139437772937,-73.813993037978,-73.8140386313179,-73.8140796302314,-73.8141152010613,-73.8141446205272,-73.8141672904315,-73.8141827498229,-73.8141159138815,-73.8138620492568,-73.8138669488305,-73.8137494073526,-73.8137397620452,-73.8136997928781,-73.8136916217812,-73.8138959146429,-73.8138938118501,-73.8139510805004,-73.8139610494715,-73.8140379566188,-73.8141865321259,-73.8141833459243,-73.8141709755544,-73.8141497483516,-73.8141202259988,-73.8140831896637,-73.8140396193277,-73.8139906678556,-73.813937630491,-73.8138819105857,-73.8138330077081,-73.8138152811744,-73.8137298702264,-73.8136615023602,-73.8135997578634,-73.8135668404702,-73.8135498805841,-73.8135465137914,-73.8135052138373,-73.8134659709455,-73.813439498365,-73.8134271652066,-73.8134199487959,-73.8133991233128,-73.8133778195054,-73.8133647955676,-73.8133602709468,-73.8133643218681,-73.8133768800506,-73.8133977338596,-73.813426531874,-73.8134627888089,-73.8134706917192,-73.8134795659818,-73.8134891572699,-73.8134991907076,-73.8135093787479,-73.8135588409846,-73.8136086929264,-73.8136578421933,-73.8137052118032,-73.8137611804303,-73.813816610881,-73.8138707772932,-73.813922970358,-73.8139725066088,-73.8140238704326,-73.8140752545558,-73.8141257140199,-73.8141743208718,-73.8142201812293,-73.8142913037507,-73.8143665233124,-73.8144449484793,-73.8145256498288,-73.8146076709653,-73.8146900398539,-73.8147717803383,-73.8148519237091,-73.814929520183,-73.8149995503978,-73.8151072615887,-73.8152000111292,-73.8152061150469,-73.8152154086516,-73.8152276487061,-73.8152425148562,-73.8152596180147,-73.8153502700967,-73.8154380215341,-73.8155226281984,-73.8155372332858,-73.8155500222679,-73.8155606685274,-73.8155689001696,-73.8155745069658,-73.815577345723,-73.8155773439405,-73.8155755007832,-73.8155772347555,-73.8155824946493,-73.8155911251229,-73.8156028712879,-73.8156173862378,-73.8156342412926,-73.8156529386594,-73.8156729261346,-73.8156936134119,-73.8157143895173,-73.816164178151,-73.8162257100844,-73.8162853775263,-73.8162925777523,-73.8162994264437,-73.8163057192387,-73.8163112683633,-73.8163159082344,-73.8163195004005,-73.8163219376735,-73.8163231473266,-73.8163230932645,-73.8163217771009,-73.8163192381096,-73.8163155520532,-73.8162990229885,-73.8162843363742,-73.8162709582224,-73.8162604434476,-73.8162530648017,-73.8162490136846,-73.81624839518,-73.8162512253293,-73.816253425353,-73.8162621479775,-73.8162771603,-73.8162980614844,-73.8163242934637,-73.8163551558415,-73.8163898245921,-73.81641253249,-73.8164358375462,-73.8164593384328,-73.8164826304492,-73.8164962733558,-73.8165086766274,-73.8165195055772,-73.816528467999,-73.8165353220522,-73.8165398827878,-73.8165403343665,-73.8165413278481,-73.8165428357055,-73.8165448161591,-73.8165472143346,-73.8165499637838,-73.816552988325,-73.8165562041547,-73.8165592794263,-73.8165623693186,-73.8165654001879,-73.8165682997971,-73.8165709990377,-73.8165734335766,-73.8165755453897,-73.8165772841444,-73.816578922803,-73.8165816957347,-73.8165855723879,-73.8165904553037,-73.8165962393766,-73.8166028001038,-73.816609996265,-73.8166311886927,-73.8166556135526,-73.8166826036387,-73.81671142167,-73.8167412804313,-73.8167713642772,-73.8168008514139,-73.8168289363479,-73.8168471978876,-73.8168682698779,-73.8168915669467,-73.8169164419108,-73.8169422037544,-73.8169681368251,-73.8169935207139,-73.8170176502674,-73.8170398551769,-73.8170595185985,-73.8170760942889,-73.8170891217797,-73.8170982391694,-73.8170950774138,-73.8170883528664,-73.8170782285912,-73.8170748905506,-73.8170726400087,-73.8170715385916,-73.8170716164595,-73.8170728714803,-73.8170752692885,-73.8170787442258,-73.8170832011393,-73.8170885179865,-73.817094549178,-73.8171011295632,-73.8171080789531,-73.8171152070546,-73.8171502115056,-73.8171863661518,-73.8172230127439,-73.817318417593,-73.8174111925374,-73.8175007297444,-73.8178327782065,-73.818237227462,-73.8182406589385,-73.8182412446042,-73.8182389684846,-73.8182338926705,-73.8182261556239,-73.8182159684011,-73.81820566336,-73.8181969617752,-73.8181901007568,-73.8181852672606,-73.8181825929942,-73.8181821508281,-73.8181839528096,-73.8181879498357,-73.81819403299,-73.8181998513498,-73.8182012721772,-73.8181982605537,-73.8181908905061,-73.8181688784387,-73.8181467063517,-73.818124900995,-73.8181039804059,-73.8180844416024,-73.8180667487753,-73.8180513222605,-73.8180169560161,-73.8179752922442,-73.8179273261021,-73.8178629648026,-73.8178056429797,-73.8177477623424,-73.8176899451924,-73.8176328131487,-73.8175964382085,-73.817560773828,-73.8175133163231,-73.8174690798156,-73.8174286845478,-73.8173926969016,-73.8173623276441,-73.8173370357932,-73.817317158646,-73.8172802949458,-73.8172367353426,-73.8171870417961,-73.8171687840582,-73.8171497695999,-73.8171305527103,-73.81711169358,-73.8166906816595,-73.8166787769689,-73.8166560019096,-73.8166267732509,-73.8166073293189,-73.8166123479289,-73.8166123614215,-73.8166124449865,-73.8165766843614,-73.8165588516266,-73.8165150336826,-73.8164883009426,-73.8164445195421,-73.816437307343,-73.8164227791619,-73.8163911616508,-73.8163668695046,-73.8163580944543,-73.8163523318216,-73.8163548994837,-73.8163623571412,-73.8163503053,-73.8163090098576,-73.8162726047105,-73.816231304312,-73.8162021785277,-73.8161511234762,-73.8161048455927,-73.8160268382358,-73.8159683757196,-73.8159387775397,-73.8159099453582,-73.8158758983187,-73.8158670454382,-73.81572300132,-73.8151711366487,-73.8151693681791,-73.8157020784641,-73.8156179809096,-73.8155069834491,-73.8154424353357,-73.8154150389641,-73.8154059927484,-73.8154079001159,-73.8154336165864,-73.815468470902,-73.8154696807442,-73.8155051742527,-73.8155235497514,-73.815547439729,-73.8155640603642,-73.8155641952185,-73.8155587940179,-73.8155754062468,-73.8155920683093,-73.8155849216333,-73.8155686985858,-73.8155250681465,-73.8154721739664,-73.8154264944484,-73.8153753573668,-73.815329696999,-73.8153023861439,-73.8152915382386,-73.8152898587315,-73.815280836544,-73.8152626339768,-73.8152321123266,-73.8147974828058,-73.8148029338856,-73.814762631631,-73.8147334581754,-73.8152202617932,-73.8152171393888,-73.8152208963107,-73.8152337864045,-73.8152467125467,-73.8152340488725,-73.8152213556616,-73.8152050368038,-73.8151831980254,-73.8151485803036,-73.8151285472972,-73.8151085263405,-73.8150999866279,-73.8150903351601,-73.8150739887726,-73.8150667815675,-73.8150663842937,-73.8150539910944,-73.8149789055192,-73.8149802577071,-73.8149157299578,-73.8149116325971,-73.8149047708611,-73.8149006993824,-73.8149089431792,-73.8149075878783,-73.8149707522553,-73.814973479379,-73.8150491262821,-73.8150056976559,-73.8149733621314,-73.8148064669615,-73.8143659650249,-73.8143618858795,-73.8147969788075,-73.8147889293363,-73.8147793515544,-73.814767019701,-73.8147587878242,-73.8147450638567,-73.8147326967354,-73.8147203367439,-73.814709358142,-73.8146983896073,-73.8146956741557,-73.8146998384361,-73.8147053767567,-73.8147191417947,-73.8147301844657,-73.8147302657414,-73.814727617052,-73.8147231968448,-73.8144750552295,-73.8144709519398,-73.8143844488858,-73.8143871700994,-73.8143157879995,-73.8143090013369,-73.8143845099534,-73.8143872282593,-73.8144709751941,-73.8144696206151,-73.8147199908371,-73.814696501575,-73.8147827774028,-73.8153884348915,-73.8153996642433,-73.8154258702916,-73.8154524280019,-73.8154778607282,-73.8154791850998,-73.8154882391219,-73.8155239012534,-73.8155505602015,-73.8156032216945,-73.8156738410572,-73.8157448110248,-73.8158071304548,-73.8158557949209,-73.8158953035643,-73.815974622831,-73.8160712447756,-73.816141410551,-73.8162023707931,-73.8162770371852,-73.816311289325,-73.8163406748573,-73.8163414725142,-73.8163088092681,-73.816287212934,-73.8162873039007,-73.81630907304,-73.8163222502615,-73.8163525367423,-73.8164090687099,-73.8164525792931,-73.8164787847787,-73.8164789029115,-73.8164486963231,-73.816440331229,-73.8164276553981,-73.8164236541232,-73.816415252095,-73.8163981838119,-73.8163898006928,-73.8163640764483,-73.816342598245,-73.816299398821,-73.8162344751259,-73.8161954944487,-73.8161609048521,-73.8161696614168,-73.816200140537,-73.8162046689658,-73.8161832652041,-73.8161402371855,-73.8160928011742,-73.8160606823468,-73.8159803691234,-73.8159241026841,-73.8158894855888,-73.8158505060959,-73.8157854008651,-73.8157116310458,-73.8156595654215,-73.8156248030444,-73.8155683816207,-73.8155250092251,-73.8155033860899,-73.8155034683068,-73.8155425777755,-73.8156120011819,-73.8156770514443,-73.8157204791911,-73.8157942671827,-73.815907090596,-73.815993908747,-73.8160524959286,-73.8160633957422,-73.8160765805811,-73.816076735398,-73.8160725620593,-73.8160451953109,-73.8160380101668,-73.816007730707,-73.8159817358456,-73.8159253513383,-73.8158776139851,-73.8157908693572,-73.8157214737434,-73.8156780462313,-73.8156433473114,-73.8155999760879,-73.815573970601,-73.8155783626436,-73.8156088051427,-73.8156955497225,-73.8157562805806,-73.8158517370141,-73.8159602407221,-73.8160253803278,-73.8160399882679,-73.816081883136,-73.8160907677206,-73.8161083345374,-73.8161042242727,-73.8160913869234,-73.8160437774296,-73.8160274400796,-73.816000541868,-73.8160006876349,-73.8160225096873,-73.8160230989378,-73.8160617003037,-73.8160705477507,-73.816092452309,-73.8160840140111,-73.8160408429049,-73.8160105821284,-73.8160103949569,-73.8159715667784,-73.8159195203279,-73.8158327490351,-73.8157720190827,-73.8157112448259,-73.8156808845105,-73.8156635813926,-73.8156636179007,-73.8157027066653,-73.8157721467864,-73.8158893052214,-73.8159934709227,-73.816007033034,-73.8160282952324,-73.8160284045402,-73.8160373254812,-73.8160374712174,-73.816020349623,-73.8160118301665,-73.8160119668146,-73.8159921514914,-73.8158948330424,-73.8158880117102,-73.815986842867,-73.8159392098233,-73.8158947343834,-73.8158712174199,-73.8158473907212,-73.8158304047392,-73.8158109436731,-73.8157841289219,-73.8157596920095,-73.8157328297484,-73.815708460203,-73.8156987722173,-73.815711012309,-73.8157403130773,-73.8157794243231,-73.8158039439408,-73.8158059526157,-73.8158163205059,-73.8158140512653,-73.8158069268924,-73.8157851755373,-73.8157609901928,-73.8157586844308,-73.8157393159134,-73.8157004506566,-73.8156615055311,-73.8156396258708,-73.8156445557613,-73.8156568720886,-73.8156106989206,-73.815588964017,-73.8155262657415,-73.8155244505928,-73.8155141574199,-73.8155014834025,-73.8154869578572,-73.8154541550417,-73.8154194756017,-73.8153847503635,-73.8153677860341,-73.8153617809695,-73.8153501288317,-73.815344736913,-73.8153485148566,-73.815335850277,-73.8153177466556,-73.8152868698753,-73.8152357807792,-73.8151956401506,-73.8151518135254,-73.8151338912924,-73.8151188664175,-73.8150988766933,-73.8150714384771,-73.8150421911749,-73.8150312525412,-73.8150331170411,-73.8150477812449,-73.8150569635502,-73.8150846899563,-73.815088098715,-73.8151100708893,-73.8151174361385,-73.8151101712988,-73.8151011044328,-73.8150847377675,-73.8150701972006,-73.8150483259506,-73.8150227643652,-73.8150063166291,-73.8149898688952,-73.814984511838,-73.8149752588367,-73.8149729760761,-73.8149684567078,-73.8149572833039,-73.8149519676385,-73.8149466146564,-73.8149121065449,-73.8148793738859,-73.8148534691479,-73.8144922101245,-73.8144703368803,-73.8148431343242,-73.8147638769196,-73.8147141889604,-73.814683158638,-73.8146521167262,-73.8146119624998,-73.8145791217014,-73.8145444348586,-73.814520085777,-73.81410298739,-73.8141102792525,-73.8139142538886,-73.8138978336049,-73.8140920523134,-73.8140993510555,-73.8145101652145,-73.8145006325293,-73.8144714671745,-73.8144453576978,-73.8144099091828,-73.8143838372897,-73.8143581843146,-73.8143380501204,-73.8143124359146,-73.8142941626632,-73.8142869104826,-73.8142869880651,-73.8143035052965,-73.8143209286822,-73.8143164480169,-73.8143092068151,-73.8138658529302,-73.8138567197728,-73.8142995929505,-73.8142727119395,-73.8142289401408,-73.8141559330912,-73.8141048006587,-73.8140463568647,-73.8139984413421,-73.8139659353652,-73.8139385175097,-73.8139038412146,-73.8138838073233,-73.8138679378801,-73.8138517939896,-73.8138208738557,-73.8138209499012,-73.8138308107145,-73.8138677501533,-73.8137029600182,-73.813668312847,-73.8137287650805,-73.8137360131045,-73.8138870950396,-73.8138897124657,-73.8138574204293,-73.8138282919232,-73.8137633077989,-73.8137113628734,-73.8136972627912,-73.8135849447628,-73.8135666995527,-73.8136888187084,-73.8136854929935,-73.8136693194785,-73.8136564617829,-73.8136337970831,-73.8136111049434,-73.8135753674372,-73.8135461419287,-73.8135135811422,-73.8135005227725,-73.8134614348019,-73.8134126382602,-73.8133768730721,-73.8133671922626,-73.8133704936298,-73.8133900852403,-73.8134323970129,-73.8134584728562,-73.8134943425402,-73.8135042040958,-73.8134977892983,-73.8134816159596,-73.813452508981,-73.8133876638912,-73.8133422382898,-73.8132902732814,-73.81324478515,-73.8131992751329,-73.8131439886681,-73.8130984034398,-73.8130462988403,-73.8129942089801,-73.8129839301872,-73.812951923809,-73.8129259173973,-73.8129032191877,-73.8129306165897,-73.8129651710785,-73.8129945006207,-73.8130400918921,-73.8130824246847,-73.8131247229838,-73.8131605294834,-73.8131801140892,-73.8131704043748,-73.8131574154038,-73.8131281354097,-73.8130988614717,-73.8130760378923,-73.8130532689485,-73.8130500584292,-73.8130631454475,-73.813118480342,-73.8131478310238,-73.8131316371516,-73.8130861488048,-73.8130373736047,-73.8129787581481,-73.8129397051508,-73.8128812007982,-73.812866082337,-73.8128390283324,-73.8128001500006,-73.8128100389849,-73.8128166495417,-73.8128214135037,-73.8128395008979,-73.812859133722,-73.8128754802889,-73.8128723317002,-73.81283989702,-73.8127977174069,-73.8127546999452,-73.8124174328869,-73.8120796739831,-73.8117415799814,-73.8114033077851,-73.8110650143803,-73.8107268567628,-73.8103889918656,-73.8100515764855,-73.8100336442129,-73.8100156832947,-73.8099981954792,-73.8099816692984,-73.8099665664201,-73.809953308751,-73.8099422666506,-73.8099337485845,-73.8099279925079,-73.8099251592181,-73.8099253278625,-73.8099325433493,-73.8099447664056,-73.8099619500682,-73.8099624358324,-73.809968122924,-73.8099788751916,-73.8099944352269,-73.8100144305278,-73.8100383824158,-73.8100657174957,-73.8100957813825,-73.8101475196664,-73.8101942896023,-73.8102352369114,-73.810269613664,-73.8102967919413,-73.8110544605963,-73.8110488018747,-73.810253570973,-73.8102530402304,-73.8100372492007,-73.8100379206187,-73.8102781872553,-73.8102768273065,-73.8118244055815,-73.8118262315602,-73.8110733071719,-73.8110732679615,-73.8111791164733,-73.8112852338383,-73.8113912069858,-73.8114966234066,-73.8115913931115,-73.8116866942923,-73.811781769628,-73.8118758635928,-73.8119682284601,-73.8120581302453,-73.812144854539,-73.8122351380816,-73.8123282215825,-73.812423356994,-73.8125197797804,-73.8126167150614,-73.8126397526309,-73.8126612868316,-73.8126806763198,-73.8126973436275,-73.8127107923613,-73.8127206219858,-73.8127265397527,-73.8127283694192,-73.8127260564967,-73.8127196698731,-73.8127142181199,-73.8127008776583,-73.8126799843073,-73.8126520640051,-73.8127979333841,-73.8129404977351,-73.8130795869687,-73.8132229790977,-73.8132773160344,-73.8133273326761,-73.8133724554688,-73.8134174681474,-73.8134547046715,-73.8134739710259,-73.8135070682508,-73.8135478091757,-73.8135953259904,-73.8136486065598,-73.8137065159831,-73.8137678207673,-73.8137981805222,-73.8138257449556,-73.8138497484506,-73.8138695242988,-73.8138845232188,-73.8138943286125,-73.8138986681358,-73.8138974212627,-73.8138906226319,-73.8138784610843,-73.8138612744173,-73.8138395400014,-73.8138138615211,-73.8137789642947,-73.8137481693651,-73.8137223181829,-73.813702337665,-73.8136883958316,-73.8136808639474,-73.8136799425784,-73.8136856562516,-73.8136978528027,-73.8137073710427,-73.8137220768661,-73.8132835686148,-73.8132848536817,-73.8129229322513,-73.8129177613123,-73.8132744481454,-73.8132783556246,-73.8137278785022,-73.8137529320312,-73.8137841182382,-73.8138208676619,-73.8138625092606,-73.8138997342262,-73.8139341693493,-73.8139649015671,-73.8139911160033,-73.8140121175749,-73.8140273494223,-73.8140364076743,-73.8140390521563,-73.8140352127576,-73.8140230126381,-73.8140047246136,-73.8139805003555,-73.8139505407615,-73.8134288592628,-73.813421021972,-73.8139416195339,-73.8139102545155,-73.8138789643991,-73.8138511992681,-73.8138277314119,-73.8138092135883,-73.8137961608678,-73.8137889363065,-73.8137877408491,-73.8137926077398,-73.8138034015987,-73.8138290576461,-73.8138415853741,-73.813829275571,-73.8137952351766,-73.813736290188,-73.8136679712903,-73.8136442164446,-73.8135685798207,-73.8134909326114,-73.8134257476033,-73.8133352260609,-73.8130309657201,-73.8130340268444,-73.8129659052157,-73.8129563524864,-73.8121258876149,-73.8121135055644,-73.8128817989562,-73.8128911019115,-73.8129470915405,-73.8129378151285,-73.8130000069775,-73.8130123891882,-73.8132773551531,-73.8132419865788,-73.813208858732,-73.8131785656139,-73.8131486714175,-73.8131236849481,-73.8131041679755,-73.8130905592961,-73.8130831648673,-73.8130821509301,-73.8131129888851,-73.8131491302248,-73.8131901331362,-73.8132354963787,-73.8133594651704,-73.8134870982855,-73.8136181331788,-73.8138271853461,-73.8140374584335,-73.8140408448481,-73.8140357980516,-73.81402237526,-73.8140007286102,-73.813971103435,-73.8139338354817,-73.8138893471068,-73.8138381424887,-73.8137808019139,-73.8132741739903,-73.8131933924457,-73.8130768789268,-73.813042823725,-73.8130035472027,-73.812959717414,-73.8129120798627,-73.8128614448219,-73.8128327712025,-73.8128102869812,-73.8127945278077,-73.8127858691231,-73.8127845172148,-73.8127905043014,-73.8128036877634,-73.8128173443128,-73.8128236566099,-73.8128225586798,-73.8128140619764,-73.8128076985411,-73.8127991150637,-73.8127885598976,-73.8127763384447,-73.81276280432,-73.8127483491194,-73.8127333910894,-73.8127183630255,-73.8126756502515,-73.8126392148461,-73.8126098854335,-73.812588329026,-73.8125479139513,-73.8125003074121,-73.8124460443369,-73.8123857344439,-73.8123200553901,-73.8122497451572,-73.8121755937595,-73.812098434368,-73.8120191339488,-73.8119583961351,-73.8118967959948,-73.8118347927711,-73.8117728487121,-73.8117418282739,-73.8117141696216,-73.8116904818479,-73.8116712866018,-73.8116570066004,-73.8115875271899,-73.8116435561962,-73.8116110045945,-73.8115584476889,-73.8114545011042,-73.8113923576518,-73.8113333076675,-73.8112648967289,-73.8112213626614,-73.8111933302495,-73.8111870694364,-73.8111900957045,-73.81121173987,-73.8112116327237,-73.8112115255787,-73.8112037968404,-73.8111990300533,-73.8111679578843,-73.811165618315,-73.811140032556,-73.8111214561669,-73.8111029139569,-73.8110594541496,-73.811031475256,-73.8110220608272,-73.8109752916904,-73.810917179315,-73.8108472867865,-73.8108749629438,-73.8107848528644,-73.8107619255919,-73.8106860176446,-73.8106424254141,-73.8105273450312,-73.8104682542687,-73.8104091439626,-73.8103686761895,-73.8103312351884,-73.8103187056486,-73.8102968738705,-73.8102502588457,-73.8102067852445,-73.8101601978205,-73.810060786379,-73.8099084122116,-73.8098057667835,-73.8096802803618,-73.8096548114175,-73.8095722864966,-73.8094414449777,-73.8093511936931,-73.8093044631584,-73.809248390892,-73.8092201827142,-73.8091981684224,-73.8091670077784,-73.8090923463355,-73.8089867544216,-73.8088874446278,-73.8087849392144,-73.8087071904249,-73.8085921340646,-73.8085330967543,-73.8084692265089,-73.8084337057101,-73.8083840505431,-73.8082753447704,-73.8081634785856,-73.8080795965591,-73.8079977808527,-73.8079843115868,-73.8079524936244,-73.8079630929977,-73.8078932372404,-73.8078342131929,-73.8077595716811,-73.8077252416483,-73.8077095757198,-73.8076660476525,-73.8076474856112,-73.807638266558,-73.8075731156243,-73.807520395043,-73.8074645951476,-73.8074150086962,-73.8073467725187,-73.8073096909888,-73.8072756765167,-73.8072287509376,-73.807160845786,-73.8071018772567,-73.8070211300518,-73.8069777115221,-73.806977793687,-73.8069965461088,-73.8069719145262,-73.8069192700426,-73.8068667277531,-73.806817273037,-73.8068081100321,-73.8068081786769,-73.8068082607938,-73.8067898298338,-73.806755870361,-73.8067342839933,-73.8066940271137,-73.806664162534,-73.8066505545862,-73.8065977325197,-73.8065636155498,-73.8065730253078,-73.8066330592573,-73.8066383521798,-73.8067160719037,-73.8067534553839,-73.8067753629629,-73.8067786621553,-73.8067540243223,-73.8067075535402,-73.8066547729154,-73.8065926709169,-73.8065398628888,-73.8065397101215,-73.8065212539744,-73.8065181940753,-73.8065297547852,-73.8065880080752,-73.8066999140311,-73.8067310469394,-73.806735342719,-73.8067685314543,-73.8067904943618,-73.8067690180941,-73.8067505806003,-73.8067071497296,-73.8066480936659,-73.8066002188435,-73.8065393085972,-73.8064833936376,-73.8064648061047,-73.8064648678868,-73.806508429719,-73.8065799422166,-73.8066047566365,-73.8066638763996,-73.8066919772899,-73.8067045847851,-73.80668314902,-73.8066616600063,-73.806599757719,-73.8065626290151,-73.8065097749169,-73.8064258275136,-73.8063418940225,-73.8062641747481,-73.806236306937,-73.8063016326953,-73.8063793853489,-73.8064602741805,-73.8065101867103,-73.8065050797659,-73.8064917147143,-73.806445390686,-73.8063835502065,-73.8062998237945,-73.806225183705,-73.8061287548796,-73.8060479275223,-73.8059671442928,-73.8059516912445,-73.8060107945038,-73.806082326132,-73.8061476308591,-73.8062005477241,-73.806222420821,-73.8062226476388,-73.8062113647403,-73.8061182882493,-73.806073806414,-73.806046766092,-73.8058623716859,-73.8058246558085,-73.8058174821957,-73.8058513922027,-73.805907484134,-73.8059582248968,-73.8059914283401,-73.8059915984894,-73.8057280298973,-73.8057100839702,-73.8054738643781,-73.8052355907071,-73.8050720219921,-73.8046193120521,-73.80451800417,-73.8044105711301,-73.8042972573555,-73.8041783206438,-73.8040540315811,-73.8039246729261,-73.8037905389667,-73.803651934851,-73.8035091758928,-73.8034832064931,-73.8033684017512,-73.8032484670737,-73.8031341850176,-73.8030136293461,-73.8028833922421,-73.802760080837,-73.8026740763416,-73.802623235675,-73.8025940094008,-73.8025896612499,-73.8025867881536,-73.8025743402983,-73.8025613548567,-73.8025216340177,-73.8024681188674,-73.8024134171439,-73.8023342207742,-73.8023002425323,-73.8022676565956,-73.8022483224924,-73.8022027900624,-73.8020789287186,-73.8020456072146,-73.8020400944291,-73.801973349582,-73.8019326756342,-73.8018849361756,-73.8018129625523,-73.8017106198057,-73.8016114536859,-73.8014985136908,-73.8013920458055,-73.8012881698646,-73.8011860143385,-73.8011161460993,-73.8010513143208,-73.8010252513584,-73.8009268453128,-73.8008136824253,-73.8007085972132,-73.8006160524236,-73.8005902735804,-73.8005840214995,-73.8005684515212,-73.8005679605196,-73.8005746516598,-73.8005160029977,-73.8004170302871,-73.8003254013056,-73.8002238603039,-73.8001227405154,-73.8000140431831,-73.7999014186753,-73.799805728772,-73.7996912444983,-73.7995719363102,-73.799455107581,-73.7993498978655,-73.7985000773509,-73.7984179385739,-73.798332848887,-73.798245520913,-73.7982054396376,-73.7981666758162,-73.7981302361626,-73.7980970670298,-73.7980680298318,-73.7979860293138,-73.7979489597052,-73.7978689666603,-73.7977554611174,-73.7976536852015,-73.7975903277733,-73.7974058787621,-73.7973296095186,-73.7973811257354,-73.7974408099615,-73.7977146523678,-73.7981194529348,-73.7986422064661,-73.79902816314,-73.7999467818626,-73.8001114686428,-73.8004882479157,-73.8009159323764,-73.8011064751458,-73.8013199185646,-73.8014580051732,-73.8017456121596,-73.8015199255211,-73.801426344477,-73.8013738591895,-73.8013390614121,-73.8013915444651,-73.8013880688277,-73.8014038096885,-73.801551198696,-73.8017593218082,-73.8019565913249,-73.802013108274,-73.8020682496527,-73.8021210992062,-73.802168428493,-73.8022121794471,-73.8022516945694,-73.8022863800206,-73.8023540595906,-73.8024277929201,-73.8025068642782,-73.8025905061224,-73.802677906549,-73.8027682171737,-73.8028605613658,-73.8029540427573,-73.8030477539426,-73.8031407852856,-73.8032322337489,-73.8033212116582,-73.8034068553182,-73.8034338575561,-73.8034632079808,-73.8034704956739,-73.8035124352523,-73.8035268592631,-73.8035492184108,-73.8035555484148,-73.8035786567395,-73.8036139015812,-73.8036278344226,-73.8036452509816,-73.8036539209511,-73.8036503478132,-73.8036401312316,-73.8035502187794,-73.803519979065,-73.8036206332804,-73.8037375716227,-73.8037791201988,-73.8036142926104,-73.8036849282066,-73.8037041566978,-73.8037717135113,-73.8037917388227,-73.8038570501525,-73.8038800682625,-73.8039469302265,-73.8039812059659,-73.8039936054988,-73.8041738900948,-73.8042365320176,-73.8042523834905,-73.8043443365333,-73.8043581034669,-73.8043212786793,-73.8041900498615,-73.8041536530105,-73.8041423746033,-73.8042289959179,-73.8041586682089,-73.8039504012368,-73.8039433872392,-73.8038963670915,-73.8038718966309,-73.8038485009328,-73.8037987113862,-73.803778024134,-73.8037256192977,-73.8037061279856,-73.8036018909318,-73.8035592119364,-73.8036145580595,-73.8035137064307,-73.8034592136554,-73.8033882074123,-73.8033003046774,-73.8032529445498,-73.8032354331692,-73.8033443955357,-73.8033496817058,-73.8034610138013,-73.8034517716016,-73.8033679511692,-73.8033639921698,-73.8032320137872,-73.8032244936663,-73.8032936529357,-73.8033564154196,-73.803358651603,-73.8034551929976,-73.8034503981994,-73.8035193755952,-73.8035256557728,-73.8035592196192,-73.8035838963598,-73.8036336240181,-73.8036399068595,-73.8036969274879,-73.8037019767617,-73.8039670445713,-73.8040439378232,-73.8040543627898,-73.8040714340426,-73.8040907340826,-73.8041842844068,-73.8041737995519,-73.8041908025352,-73.8041770111733,-73.8041919164269,-73.8042112142561,-73.804249138364,-73.8043747213264,-73.8044346589742,-73.8044540717867,-73.8045223146546,-73.8045308160983,-73.8044336759107,-73.8042593736155,-73.8042372967655,-73.8042027198095,-73.8041701518706,-73.8041244131024,-73.8040935021118,-73.8040360200035,-73.803959553454,-73.8039265406066,-73.803870719655,-73.8038426168865,-73.8038389579505,-73.8038036632947,-73.8037965276561,-73.803759324239,-73.803755754556,-73.8037174343429,-73.803709960882,-73.8036743990874,-73.8036701640539,-73.8036327506495,-73.803626755189,-73.803590770803,-73.8035847810641,-73.8035482997435,-73.8035411373468,-73.8035037436554,-73.8034989193517,-73.8034634349493,-73.8034602669293,-73.8034304211,-73.8033548591686,-73.8033574513145,-73.8032925569204,-73.803221762993,-73.8031987053882,-73.8035166733737,-73.8035659553828,-73.8038884250615,-73.8041803313036,-73.8043146690454,-73.8043601711592,-73.804353219718,-73.8043917200653,-73.8044300333359,-73.8043862823674,-73.8043653584376,-73.8043297789274,-73.8043512890419,-73.8043615441542,-73.8044050168217,-73.8044728208037,-73.8046028352337,-73.8046175237479,-73.8046489746849,-73.8046869621925,-73.8047181233282,-73.8047593468929,-73.804807304784,-73.8048611970973,-73.8048852890929,-73.8049161283257,-73.8049531970842,-73.8049958730743,-73.8050154416853,-73.8050324876378,-73.8050466086083,-73.8050574713085,-73.8050648193519,-73.8050859781681,-73.8051146551114,-73.8051501797805,-73.8051917216834,-73.805238309653,-73.8052888545505,-73.8058461181963,-73.8059602641602,-73.8061991950041,-73.8062845174831,-73.8064159359505,-73.8065454653918,-73.8065724726016,-73.8065666421889,-73.806583587257,-73.8065466824767,-73.8065433078088,-73.8063096884121,-73.806234658564,-73.8061506996551,-73.8061176137362,-73.8060883751409,-73.8060233194087,-73.8059940724493,-73.8059788424725,-73.8059410358115,-73.8059290494145,-73.8058889626791,-73.8058737283313,-73.8058341031224,-73.8058199772661,-73.8057992148724,-73.8057850637182,-73.8057357554475,-73.8057194078323,-73.805679469813,-73.8056660585571,-73.8056135268847,-73.8055865371615,-73.8055639454624,-73.8055451996341,-73.8055122758909,-73.8054531096465,-73.8054341214583,-73.8054100539614,-73.8053787878483,-73.8052821809177,-73.8050810346669,-73.8050673958007,-73.8050449671834,-73.8049813853499,-73.8049509122035,-73.8049378884095,-73.8048892723055,-73.8048746512255,-73.8048370203069,-73.8048292272019,-73.8046418502051,-73.8045544051887,-73.8045590258357,-73.8045420926871,-73.8046594281504,-73.8046835844033,-73.8045892457258,-73.8046414204578,-73.8046530975323,-73.8046879044161,-73.804701435686,-73.804739207941,-73.8047541321242,-73.8047962657386,-73.80481419769,-73.8049888031168,-73.8050370393538,-73.8050501852306,-73.8050985180556,-73.8051115026288,-73.8051613084482,-73.8051738486057,-73.8052186625882,-73.805242504565,-73.8052787882508,-73.8052953599511,-73.8053557493389,-73.8053805874624,-73.8053984443055,-73.8054362345985,-73.8055451478983,-73.8055638451162,-73.8056233354343,-73.8056443523487,-73.8056960781261,-73.8057155526625,-73.8057484564445,-73.805882465862,-73.8058947030696,-73.8059181977783,-73.806059278521,-73.8061014179791,-73.806218279618,-73.8063293256617,-73.8063965459748,-73.8064191686211,-73.8064282594364,-73.8064518701059,-73.8064628307186,-73.8064825463445,-73.8064907116267,-73.8065130234107,-73.8065188961154,-73.8065416457691,-73.8065501492494,-73.8065728184074,-73.806581670588,-73.8066121612277,-73.8067073779876,-73.8067196798707,-73.8065868955687,-73.8065846468532,-73.8065792363175,-73.8066060318951,-73.8069293317755,-73.8068860922785,-73.8068519601206,-73.8067966558484,-73.806791744307,-73.8067866890503,-73.8067606877993,-73.8067561666252,-73.8067320831588,-73.8067267244558,-73.8066992873994,-73.8066951100633,-73.8066680491436,-73.8065999981988,-73.8065925726006,-73.8065683949886,-73.8065357249395,-73.8065543556007,-73.80671792149,-73.8068992956903,-73.8069419953575,-73.8069430867008,-73.8069566202681,-73.8070460015351,-73.8069468699786,-73.8067977728852,-73.8067914423533,-73.8067659381314,-73.8066287342316,-73.8065867197421,-73.8065784429848,-73.8064017781146,-73.8064123057871,-73.8065636833562,-73.8066177380261,-73.806631563239,-73.8064125454315,-73.8056844290842,-73.8056344247976,-73.8056392815772,-73.8056362249918,-73.8055249710418,-73.805456122011,-73.8055221625494,-73.805534799617,-73.8055741493278,-73.805566431089,-73.8055243508112,-73.8054490724643,-73.8054255978558,-73.8054414524943,-73.8054462743429,-73.8054182315121,-73.8054214544145,-73.805408230578,-73.8054356586946,-73.8054570410134,-73.8054717508156,-73.8054793569598,-73.8054796365168,-73.8054725813035,-73.8054583981209,-73.8054438173039,-73.8054322117576,-73.805423930683,-73.8054192232497,-73.8054182310981,-73.8054209840788,-73.8054365117822,-73.8054473049184,-73.8054530941775,-73.8054537351093,-73.8054492117265,-73.805439636904,-73.8053220937892,-73.8053547250606,-73.8052701998137,-73.805042092896,-73.8050322658418,-73.8050268852107,-73.8050260815338,-73.805029874304,-73.8050381715032,-73.8050507718353,-73.8050617023352,-73.8050647087732,-73.8050597475692,-73.805046890686,-73.8050263245844,-73.8049983475184,-73.8049633652094,-73.8049218849616,-73.8048745083054,-73.8048219222733,-73.8047648894377,-73.8045752201116,-73.8045449925506,-73.804516655291,-73.8044908648448,-73.8044682187192,-73.8044492415726,-73.8044343730605,-73.8044169979326,-73.8043895892182,-73.8040921379196,-73.8040562246306,-73.8039118606248,-73.8037165780169,-73.8034392088561,-73.8033727645837,-73.8032412011167,-73.8031738356602,-73.8029300186893,-73.8025748716634,-73.80235340279,-73.8023036389753,-73.8022519256302,-73.8021996374699,-73.8021481644893,-73.8021513259833,-73.802152036606,-73.8021502784364,-73.8021460958089,-73.8021395941951,-73.8021309375449,-73.8021203441515,-73.8014783291996,-73.8013555274692,-73.8011570762491,-73.8010117290985,-73.8009951799441,-73.8011360841607,-73.8012403253055,-73.8014667000733,-73.8001094991664,-73.7985376596496,-73.7957575226431,-73.7937634697612,-73.7936756888664,-73.793614647195,-73.7922890733743,-73.7917237698573,-73.7916624065082,-73.7916025320149,-73.7915453262128,-73.7914919163525,-73.7914433548881,-73.7914005987389,-73.7913644904329,-73.7913420778982,-73.7913239189442,-73.7913104991461,-73.7913021773549,-73.7912991761016,-73.7913015756459,-73.7913086602536,-73.7913202557613,-73.7913360904372,-73.7913557932053,-73.7913789023411,-73.7914086337195,-73.791441167895,-73.7914851190949,-73.7915249656567,-73.7915601173053,-73.7915900533116,-73.7915865671031,-73.7915797143225,-73.7915696803923,-73.7915567368112,-73.7915412338092,-73.7915235908701,-73.7915042853815,-73.7914838397176,-73.7914628071037,-73.7914417566478,-73.7913022512197,-73.7911592660142,-73.7910132738249,-73.7908647573856,-73.790822223811,-73.7907870090634,-73.7907592443139,-73.7907390329753,-73.7907264503172,-73.7907215431861,-73.7907243298314,-73.7907347998378,-73.7904283944293,-73.7902526372845,-73.790124632941,-73.7900820425006,-73.7900625632805,-73.7901519260014,-73.7902841087417,-73.7905682380779,-73.7906595825781,-73.7910371751558,-73.7916001293646,-73.7916944800097,-73.7917684066367,-73.79184262943,-73.7919166447657,-73.7919899504279,-73.7920620490164,-73.7921560711532,-73.7922452921917,-73.7923589285199,-73.7924756874155,-73.7925951894609,-73.7927170463226,-73.7928491168353,-73.7929829261473,-73.7931179799723,-73.7932537794255,-73.7933898228673,-73.7935138964352,-73.7935859339412,-73.7936554050298,-73.7937347481011,-73.7940063145168,-73.7940138362599,-73.7945164862626,-73.794800165513,-73.7949212239716,-73.7950490247505,-73.7951833567942,-73.7953231687431,-73.7954689891944,-73.7956205800885,-73.79577769394,-73.7958418739472,-73.7960103756911,-73.7961882392365,-73.796209034732,-73.796502685265,-73.796369459998,-73.7965153563044,-73.7970294554423,-73.7971534991025,-73.7979157898774,-73.7988482204416,-73.8005393787116,-73.8013140511098,-73.8014504092572,-73.8014486409563,-73.8015193536847,-73.8015939316603,-73.801671905973,-73.8017527863559,-73.8018360642679,-73.8019212160917,-73.8020392663167,-73.8022164992958,-73.8024105055527,-73.8025957175565,-73.8027823626552,-73.8029139120601,-73.8030898021445,-73.8032594319771,-73.8033926989181,-73.8035029351608,-73.8035938661507,-73.8036188388721,-73.8036521606129,-73.8036647254091,-73.8036752308859,-73.8036901623908,-73.8037091070561,-73.8037315410494,-73.8037568440577,-73.80378431644,-73.8038131985714,-73.8038426918481,-73.8038719807678,-73.8039002554788,-73.803926734172,-73.8039706343793,-73.8040067010932,-73.8040344845344,-73.8040536382147,-73.8041399442761,-73.8043246055619,-73.8045155689722,-73.804678083685,-73.8048446413428,-73.8050151165244,-73.8050323653641,-73.8050219099684,-73.8050613523255,-73.8051189226571,-73.8050794838971,-73.8050637840642,-73.8050363991894,-73.8052104548957,-73.805361204298,-73.8055144822513,-73.8056702060441,-73.805848897605,-73.8060304781497,-73.8062148227121,-73.8066135976601,-73.8071398788419,-73.8072417566976,-73.8073501973924,-73.8074690741483,-73.8075947036926,-73.8077342127756,-73.8078808805182,-73.8079929341801,-73.8081086644716,-73.8082279921662,-73.8083968970767,-73.8085721637902,-73.8087535677874,-73.8089408766821,-73.8091338505182,-73.8093322420777,-73.8095357971972,-73.8097260988672,-73.809920290818,-73.8099831494506,-73.810064638092,-73.8101647712541,-73.8102681226227,-73.8103469369869,-73.8104248856632,-73.810501592464,-73.8105983220946,-73.8106693128785,-73.8107847786834,-73.8107896710634,-73.810799270144,-73.8108133191131,-73.8108314421037,-73.8108531542503,-73.8108778746606,-73.8109049419569,-73.810933631971,-73.8109631771191,-73.8109902152428,-73.8110187387698,-73.8110480618788,-73.811077479524,-73.8111120357959,-73.8111431120652,-73.8111698743303,-73.8111916043632,-73.8112121283037,-73.8112470376834,-73.8113331862571,-73.8114240109497,-73.8114799048396,-73.8115477260319,-73.8115660735979,-73.8116662539629,-73.8116968791518,-73.8117314975659,-73.8117734731758,-73.8117992080486,-73.8118156073982,-73.81183200305,-73.8118506574744,-73.8118762471533,-73.8118948321903,-73.8119156910602,-73.8119412707778,-73.8119971453955,-73.8120716660256,-73.8121625143996,-73.812258018815,-73.8123442043051,-73.8124117531515,-73.8124815979386,-73.8125514527377,-73.8126073275883,-73.8126888664714,-73.8127657266251,-73.8128331909565,-73.8129029762603,-73.8129704520207,-73.8130425968467,-73.8131338179631,-73.8133383835793,-73.813470052449,-73.8134944155579,-73.8135624560236,-73.8135980634565,-73.8135753028649,-73.8135978981883,-73.8140031906606,-73.8140792568506,-73.8141571236673,-73.8141867391691,-73.8142679716994,-73.814349510771,-73.8144306731243,-73.8144601791936,-73.8143716501328,-73.8143693843687,-73.8144369480874,-73.814469632255,-73.8144696569291,-73.8144999411601,-73.8145022325221,-73.8145254679208,-73.8146186626928,-73.8146186084513,-73.8144974546385,-73.8144772719101,-73.8146947569428,-73.8147056096676,-73.8148570008712,-73.8148900798111,-73.8150177700185,-73.8153323750697,-73.8155141636742,-73.8156632632579,-73.8157616923775,-73.8158791909357,-73.8162005689644,-73.8164801554668,-73.8166783531997,-73.8167485070685,-73.8168607833241,-73.8172475521691,-73.8173548154798,-73.81737201627,-73.8173598845662,-73.8173769224247,-73.8173894209152,-73.8174480681647,-73.8175948872848,-73.8176010180959,-73.8177719528478,-73.8178977931026,-73.8179208412757,-73.8179312503736,-73.8179391272829,-73.8179418581481,-73.8179313811298,-73.8179354630367,-73.8179760888702,-73.8179706890866,-73.8179588932762,-73.8179561601403,-73.8179640125377,-73.8179580711047,-73.818042291612,-73.8180796149764,-73.8180796827217,-73.8180844060124,-73.818117030247,-73.8181496360111,-73.8182008571661,-73.8184543216381,-73.818541138576,-73.8187439158346,-73.8189304302125,-73.8191659091188,-73.8193804214272,-73.819466723382,-73.8195623104062,-73.8196811734559,-73.8198163845496,-73.8199027087929,-73.8200122771646,-73.8200695543679,-73.8200959602511,-73.8201075934031,-73.8203920728012,-73.8204130295436,-73.8204781014593,-73.8205552151732,-73.8204902432634,-73.8204459503246,-73.8204042016295,-73.8204624983142,-73.8204393325657,-73.8204206836663,-73.8202909114852,-73.8202582789071,-73.8202443612206,-73.8210651207096,-73.8210813694438,-73.8203235551589,-73.820420879506,-73.8211296980492,-73.8211366407233,-73.8204417962415,-73.8204626463512,-73.8204811567733,-73.8205347659847,-73.8205625483143,-73.8205275519961,-73.8205870914386,-73.8208416352271,-73.8209628282704,-73.8210583806943,-73.8211306443835,-73.8211796069534,-73.8212379137605,-73.8212542943108,-73.8212525979312,-73.8212450276836,-73.8212287311814,-73.8212171051965,-73.8212171384863,-73.8212241525571,-73.8212451227777,-73.8212660962076,-73.8213010368473,-73.8213313076449,-73.8213662134897,-73.821412534399,-73.8213942636171,-73.8214572351253,-73.8214039410241,-73.8214225991526,-73.8215171857091,-73.8216203008346,-73.8216892526155,-73.8217020588685,-73.8216603319514,-73.821695305499,-73.821755990675,-73.8219723444763,-73.8221099447493,-73.8220914994209,-73.8221264634249,-73.8221775712616,-73.8222829082575,-73.8221341396916,-73.8221714521874,-73.8222711436295,-73.8222524806892,-73.8223086356013,-73.8226391838045,-73.8227255809138,-73.8228518510199,-73.822907388358,-73.8229866642977,-73.8230775600897,-73.8231848103856,-73.8232477614146,-73.8233293758287,-73.8233946802049,-73.823450684028,-73.8234551334144,-73.8234600827023,-73.8234648467501,-73.8234649265763,-73.8234626576892,-73.8234743355035,-73.8234976247344,-73.8235231790612,-73.8235579887495,-73.8235668090611,-73.8236208973293,-73.8237211278865,-73.8238166922684,-73.8238726775373,-73.8240638743251,-73.8242177822103,-73.824357729008,-73.8245355042384,-73.8245654301733,-73.8245911668123,-73.8245843825744,-73.8245961581165,-73.8246381762936,-73.824710511251,-73.8247687552466,-73.824794337885,-73.8248175438109,-73.8248313837324,-73.8248732194992,-73.8249407604494,-73.8250200157252,-73.825057821629,-73.8248090536,-73.8248300413557,-73.8248787652218,-73.8249276238048,-73.8249158809187,-73.825076591718,-73.8251552777404,-73.8252435046784,-73.8249304792372,-73.8249211512136,-73.8248793893808,-73.8249167005344,-73.8249631450302,-73.824946817564,-73.8252666431809,-73.8254048364167,-73.8254907531857,-73.8252080388629,-73.8252313743331,-73.8255130381735,-73.8255937891564,-73.8256507029823,-73.8254085736301,-73.8253969109008,-73.8253250216336,-73.8253576685955,-73.825672290848,-73.8257251505202,-73.8257664503313,-73.8255970927756,-73.8256250897205,-73.825590292848,-73.8255739747615,-73.8254997934938,-73.8255371046155,-73.8256229491065,-73.8256066217491,-73.8256390924955,-73.8256530844499,-73.8257156920331,-73.8256923553028,-73.8258125571891,-73.8259271498466,-73.825767241528,-73.825797559051,-73.8259564109994,-73.8259928665451,-73.8260266553418,-73.8260570269905,-73.8260833069838,-73.8261234363861,-73.8261381779516,-73.826154555008,-73.8261721973775,-73.8261907062823,-73.826209663358,-73.8263078475757,-73.8264930841807,-73.8266798477691,-73.8268684729788,-73.8270591548214,-73.8272514489397,-73.8274449072177,-73.8276390788253,-73.8278335112694,-73.8280277514489,-73.8282213467109,-73.8284138459059,-73.8286048004399,-73.8287937653198,-73.8289803001913,-73.8291639703647,-73.8293443478292,-73.8295210122499,-73.8296935519478,-73.8298615648598,-73.8300246594754,-73.8301824557492,-73.8303345859872,-73.8304806957032,-73.8306454515349,-73.8308042977649,-73.8309570225969,-73.8311034224013,-73.8312433019869,-73.8313764748608,-73.8315027634773,-73.831621999474,-73.831734023897,-73.8318386874116,-73.8321468621191,-73.8321748684242,-73.8321946190627,-73.8322060458426,-73.8322091093285,-73.832203798978,-73.8321901331772,-73.8321681591765,-73.8321379529273,-73.8320996188185,-73.8320532893157,-73.8319991245032,-73.8319373115301,-73.8318680639637,-73.8317916210514,-73.8317082468937,-73.8316182295314,-73.8316493312733,-73.8313954873575,-73.831606510589,-73.8316157445545,-73.8316880450481,-73.8319531968697,-73.8322186614701,-73.832484119813,-73.8327492528695,-73.8330137420016,-73.8332772693444,-73.833539518188,-73.8338001733578,-73.834058921593,-73.8343154519229,-73.8345694560401,-73.8348206286711,-73.8350686679428,-73.8353132757449,-73.8358925664454,-73.8364306125712,-73.8366708032072,-73.8369122565336,-73.8370358527652,-73.8371554916892,-73.8372708093106,-73.8373548725084,-73.8374361212601,-73.8380022303414,-73.8380272750527,-73.8380469597466,-73.8380607652819,-73.8380679531457,-73.8380697068464,-73.8380659873075,-73.838056877388,-73.8380425800367,-73.8380352210119,-73.8380372511195,-73.8380486640743,-73.8380694242907,-73.8380994669936,-73.83813869842,-73.8381869961111,-73.8382442092939,-73.8383101593517,-73.8383846403814,-73.8384825756871,-73.8385237426488,-73.838534006938,-73.8385441841749,-73.8386183582208,-73.8386802353457,-73.8387379561234,-73.8388163326525,-73.838894770433,-73.8389729883199,-73.839084585859,-73.8391878232651,-73.8392950052822,-73.8393857498941,-73.839447576897,-73.8395715038143,-73.8396663598261,-73.8397571137025,-73.8398602941833,-73.8399676087635,-73.8400005030146,-73.8400871170107,-73.8401780528961,-73.8402595289626,-73.8402976298541,-73.8403014698999,-73.8402887119285,-73.8402633904454,-73.8402878962949,-73.8403289937369,-73.8403950488649,-73.8404155048249,-73.8404319954095,-73.8404003131454,-73.8403902796154,-73.840340354138,-73.8402945487182,-73.8402860384377,-73.8403065455088,-73.8403095225284,-73.8403270155432,-73.8402686768039,-73.8401712668612,-73.8401440022323,-73.8400234699202,-73.8399363162736,-73.8398875449557,-73.8398739709088,-73.8398546301952,-73.8397453567506,-73.8396623668359,-73.8396290166981,-73.8396483600337,-73.8396577544876,-73.8396492279761,-73.8395909711373,-73.8395680652887,-73.839530915473,-73.8396174255155,-73.839604460621,-73.8395376666943,-73.8395938555069,-73.8396303401205,-73.8396621586961,-73.8396891063866,-73.8397128064344,-73.8397302857791,-73.8397414097111,-73.8397460924943,-73.8397442980271,-73.8397435594376,-73.8397441704763,-73.8397533671252,-73.8397709573482,-73.8397965738246,-73.8398296816188,-73.8398695893502,-73.8399154636311,-73.8399663464696,-73.8400330873002,-73.8400927231985,-73.8401451317145,-73.8401902052316,-73.8400712993488,-73.8400892587674,-73.8400988758263,-73.8401000505856,-73.8400927708164,-73.8400771121282,-73.840053237185,-73.8400213940161,-73.8399819134397,-73.8399352056269,-73.8398817558404,-73.8398221193936,-73.8392102210089,-73.8389273329529,-73.8387913381084,-73.8386834770087,-73.8388078987612,-73.8390639892386,-73.839054664375,-73.838996929699,-73.8389982098281,-73.8389997777356,-73.8389531459822,-73.8389319712713,-73.8389604985147,-73.8390116806759,-73.8389170176072,-73.8388823164674,-73.8389108283803,-73.8389946271518,-73.8390705947301,-73.8390622301787,-73.8390351924259,-73.8390129001397,-73.8390608661319,-73.8390535878405,-73.8390533845019,-73.8390490448119,-73.8391226306319,-73.8392125505941,-73.8392524342565,-73.8394542738298,-73.8394991378315,-73.8395277771424,-73.8395235808097,-73.8394618941404,-73.8394986496589,-73.8394493487325,-73.8395801256455,-73.8396327892728,-73.8396187426244,-73.8396118663857,-73.8396819965657,-73.8397401387723,-73.8397788690754,-73.8398220474946,-73.8398689179921,-73.839913987687,-73.8399578257571,-73.8399993483081,-73.8400414400055,-73.840078145654,-73.8401083499911,-73.840131135285,-73.8401385908755,-73.8401411901509,-73.8401388886934,-73.8402724778753,-73.8406702715678,-73.8408807423958,-73.8411078091212,-73.8411442239193,-73.8413208854279,-73.8414644848759,-73.8416773211162,-73.8419027099417,-73.8419416083445,-73.8420081997138,-73.842075751037,-73.8422204799933,-73.8422272841093,-73.8422338947382,-73.8422757275785,-73.8422842837592,-73.8422923732289,-73.8423075375749,-73.842314357501,-73.8423307747728,-73.8422301364811,-73.8419189273439,-73.8418864377444,-73.8408458452517,-73.8407504723695,-73.8402439631114,-73.8394341192846,-73.839180951993,-73.8389980914315,-73.8388816469985,-73.8388523238473,-73.8388271728037,-73.8388143833264,-73.8388347355651,-73.8388798954376,-73.8389292667672,-73.8389413081545,-73.8389368446315,-73.8389530462066,-73.8389651567291,-73.8389979777704,-73.839043192067,-73.8390594007588,-73.839046635205,-73.8390918718608,-73.8391130079405,-73.8392086990319,-73.8392339230566,-73.8391864206514,-73.8392631031926,-73.839220694564,-73.8392458503589,-73.8392872277845,-73.8392867188956,-73.8392129581747,-73.8392022387011,-73.8391598429395,-73.8391925523571,-73.8393618040317,-73.839589537657,-73.8397201451554,-73.8403028253719,-73.8402737688759,-73.8402237573545,-73.8401624843119,-73.8401669851166,-73.8401454073211,-73.8401087387093,-73.8400306359839,-73.8400444128228,-73.8400280886903,-73.8400097050477,-73.840098896365,-73.8400687997388,-73.8401074296279,-73.8401353153337,-73.8399559513437,-73.8400026434862,-73.8399334106232,-73.8399202641651,-73.8398513200737,-73.8398557810058,-73.8398417964703,-73.8398283357183,-73.8398469784709,-73.8398490706556,-73.8399158140485,-73.83995029818,-73.8399118754095,-73.8398871418964,-73.8398419203313,-73.8398344108467,-73.8398590937155,-73.8398383799964,-73.8398423555631,-73.8397545811197,-73.8397790955617,-73.8397594290159,-73.8397257314497,-73.8396995054642,-73.8396930249307,-73.8396825363717,-73.8396824715858,-73.8396693637226,-73.8396590285273,-73.8396721387774,-73.8396747369206,-73.8398255656932,-73.8398217229278,-73.8397154910854,-73.8397115908042,-73.8398217564905,-73.8398179294371,-73.8397248281831,-73.8397248545696,-73.8398140319761,-73.8398102282455,-73.8397590724813,-73.8397577901948,-73.8398102666072,-73.8397999282558,-73.8396517348158,-73.83969574806,-73.8396800156725,-73.8396085040031,-73.8396009854543,-73.8396167256136,-73.839625994769,-73.8396557334673,-73.8397960508764,-73.8397896015033,-73.8396610859348,-73.8396584974055,-73.8397922694089,-73.8397792782458,-73.8396861590708,-73.839682260142,-73.8397766962261,-73.839775423535,-73.83979488496,-73.8400027641618,-73.8421823657989,-73.8432267235367,-73.8442277329463,-73.8454272320661,-73.8484861534022,-73.8495589063688,-73.8501653592554,-73.8516845974783,-73.8518586876834,-73.852070059308,-73.8522072094839,-73.852331486691,-73.8524793893949,-73.8526648047364,-73.8528699785798,-73.852920440308,-73.8530351029675,-73.8530946020703,-73.8532680414721,-73.8533352494205,-73.8523115320841,-73.8517988662536,-73.8512089676086,-73.8508886338491,-73.8505227808275,-73.8499919434262,-73.8493915835714,-73.8485453056037,-73.8480634539416,-73.8480185603993,-73.847810234636,-73.8474901056339,-73.8462348007163,-73.845541873879,-73.8449103425533,-73.8442915296691,-73.8437757073376,-73.8432765586038,-73.8428366829414,-73.8423930900538,-73.8418797747322,-73.8414610203742,-73.8414166785508,-73.8412712784026,-73.841240530037,-73.8393679425065,-73.8388081325931,-73.8384942473412,-73.8383905629125,-73.8382477523711,-73.8379841620163,-73.8378427094752,-73.8378036833903,-73.8377540955476,-73.8375362574935,-73.8372258397222,-73.8371518944569,-73.8369114823119,-73.8367117969066,-73.8366380691055,-73.836470550498,-73.8363372576998,-73.8362918071927,-73.8361427900208,-73.8359908775545,-73.835855970139,-73.8357757691666,-73.8357047757733,-73.8355190467477,-73.8353621718488,-73.8349446256621,-73.8347353750812,-73.8345832171623,-73.8339302371213,-73.8337795278909,-73.833518472216,-73.8333827254562,-73.8330423462301,-73.832893121063,-73.8328926220929,-73.8328906609381,-73.8328350225652,-73.8327621992899,-73.8326890334202,-73.8323846854234,-73.8321371233042,-73.8319339376551,-73.8312833848724,-73.8311144922167,-73.8307226672039,-73.8305547123578,-73.8295940915706,-73.8287285688355,-73.8284267967819,-73.8283434749758,-73.8283340964284,-73.8281229894433,-73.828157720886,-73.8282565182698,-73.8285591024814,-73.8289208550473,-73.8294560625628,-73.8303040470699,-73.8305614598895,-73.8307142369563,-73.8308958061731,-73.8310035513046,-73.8316964882701,-73.8318469619019,-73.8326212279966,-73.832647485215,-73.832685248026,-73.8335876489385,-73.8337244292411,-73.8339497934444,-73.8341538152812,-73.8342673880512,-73.8344689223801,-73.8344630602064,-73.8344425309164,-73.8344622011831,-73.8344648917652,-73.834491419495,-73.8343785969423,-73.83425022242,-73.8340610756023,-73.834046665239,-73.8334905591873,-73.8334823130115,-73.8332172165616,-73.8331592126714,-73.8325963975417,-73.8322469220485,-73.8320336386387,-73.8318649853506,-73.8318208923045,-73.8313782619935,-73.8312072611756,-73.8308440323072,-73.8302597400713,-73.830071706276,-73.8297629609239,-73.8289598027908,-73.8283716047521,-73.8262182111356,-73.82586082507,-73.8257851762639,-73.8257158614129,-73.8249966413487,-73.824086809709,-73.823642108131,-73.8234347093132,-73.8228216133271,-73.8225846839014,-73.8219900667134,-73.82162663654,-73.8208354407277,-73.8206557938698,-73.820274329496,-73.8198327530423,-73.819791377942,-73.819685743294,-73.8195788913956,-73.8193449746142,-73.8193731239106,-73.8194094334248,-73.8194594158051,-73.8195906249725,-73.8196586540429,-73.8197494948985,-73.8197769243895,-73.8197725954394,-73.8196914883311,-73.8195653335871,-73.81955647313,-73.8196017911082,-73.8196922223854,-73.8197285501709,-73.8197062207993],"lat":[40.8821420355082,40.8821212808493,40.8821314114457,40.8821397606293,40.8821552239129,40.8821344912757,40.8820899450981,40.8820352261169,40.8819976737357,40.8819852500399,40.8819534099604,40.8819295902437,40.8818371627549,40.8817173131852,40.881645379202,40.8815767725229,40.8815148982233,40.8814805464064,40.8814324042501,40.8814116422214,40.8813943560487,40.881370246264,40.8813222742488,40.8812777987986,40.8812539931001,40.8812506867433,40.8812200360964,40.8811755388404,40.8811002854224,40.8810626964095,40.8810535528875,40.8810354496452,40.8810287876173,40.8810186795125,40.8810085419844,40.8809503685833,40.8808784556719,40.8808202546101,40.8807140733535,40.8805942090375,40.8804914899266,40.8804332461496,40.8803612495017,40.8802994606635,40.880251480469,40.8801761065407,40.880018619898,40.8799638998775,40.8799262132465,40.8798884345421,40.8798702623853,40.8798643324925,40.8798436562209,40.8797785188811,40.8797203600582,40.8796177173474,40.8794774018219,40.8793989398313,40.8783728179983,40.8782872397002,40.8782126581709,40.8781329967369,40.8780585839404,40.8779765584109,40.8778972280087,40.8778562674158,40.8777279411969,40.8776458367722,40.8775766153299,40.877566583074,40.8775151785348,40.8774508925245,40.8773917350813,40.8773223087981,40.8771810026485,40.8770833756946,40.877034110919,40.8770062989727,40.8769395950872,40.8768600432062,40.8767778803634,40.8766982387465,40.8766031015197,40.8765130305437,40.8764203898758,40.8763432133391,40.8762842102297,40.8761889992882,40.8761036526003,40.8760243481086,40.8760363293031,40.876091084863,40.8762007701225,40.8763104793334,40.876444527503,40.8766334181018,40.8767735583585,40.8769076309278,40.8770356255022,40.8772383102338,40.8772548701486,40.8771998792283,40.8771022625756,40.8770168163964,40.8769374987093,40.8769007912084,40.8768579676436,40.8767969590969,40.8767360251329,40.8766446633311,40.8765776889965,40.8765167304951,40.8764739442829,40.8763824434809,40.8762606272908,40.8761632490526,40.8760891543194,40.8757175039796,40.8755968535819,40.8754769615209,40.8753502733659,40.8752681869193,40.8752033586147,40.8751145323568,40.8750942712462,40.875142690722,40.8752078558158,40.8752730435382,40.8753205624844,40.8751450770311,40.8750782935681,40.8750096951489,40.8748655616139,40.8748138906004,40.8747895926432,40.8747789507812,40.87476490934,40.8747818570075,40.8748262632379,40.8748900604354,40.8746445681211,40.8742222570761,40.8742596475247,40.8744788102496,40.8743892814406,40.8743310451728,40.8742316804202,40.8741460422178,40.8740741300639,40.874026264024,40.8739888733763,40.8739925045559,40.8740132721355,40.8740327659749,40.873825146791,40.873677430623,40.8737217490685,40.8737900819958,40.8738378498589,40.8738307918303,40.8737827419412,40.8737518156211,40.873724223059,40.8736694045422,40.8736146301864,40.8735770561045,40.8735189542729,40.8734505735289,40.8734027074876,40.8733926199197,40.8733962429502,40.8734032159197,40.8734103996552,40.8734071698935,40.873438188437,40.8734828184168,40.8735719399875,40.8736325843811,40.8737125217068,40.8737844909842,40.8738495304129,40.8739282465336,40.8740139199853,40.8741065437138,40.8741305836315,40.8741923511971,40.8742780246239,40.8743809265567,40.8744324725364,40.8744531705639,40.8744824634302,40.8744499609696,40.8743848728088,40.8743163020558,40.8742717132958,40.8741962972055,40.8741415913919,40.874165672702,40.874227404946,40.8742960247002,40.8743270912607,40.8743477941932,40.874399381489,40.8744406763425,40.8744922187227,40.874774245106,40.8737270073053,40.874156294929,40.8741800978084,40.87402886703,40.8736182723589,40.8735484424099,40.8735107686046,40.8734766341206,40.8734357178889,40.8734016107943,40.8733263704203,40.8732476394419,40.873179222798,40.8731005412724,40.8730253071811,40.8729980660033,40.8729982407204,40.8730258452851,40.8730704826966,40.8731234751391,40.8726822336533,40.8726255917027,40.8725877092224,40.8725394372957,40.8725667206577,40.8726591904556,40.8727653995038,40.8728680568229,40.8728917672363,40.8728676093388,40.8728161128329,40.8727167766223,40.8726004018771,40.872504505644,40.8724257890439,40.8723504150064,40.8722819632358,40.8722238451973,40.8721760832805,40.8721488906749,40.8720395347704,40.8718923723048,40.8716698153057,40.8714951055809,40.8713128945592,40.8712347218955,40.8711455879546,40.8710804288825,40.8710153197369,40.8709467975159,40.8708680108848,40.8707755693328,40.8706619027906,40.8705734714483,40.8705152129658,40.8704054805318,40.8703402947359,40.8702545656636,40.8701962386213,40.8701584670675,40.8701309464268,40.8701189045789,40.8701272209044,40.870161383962,40.8702435190159,40.8703119643452,40.8703358566298,40.8703425475583,40.8703150410455,40.870267032827,40.8701881634042,40.8701572438202,40.8700989794188,40.8700235843315,40.8699516285862,40.8698659901865,40.8697940986643,40.8697358692846,40.8697049707044,40.8696980207642,40.8696738629723,40.8696223521744,40.8695195344922,40.8695039151688,40.8694026376885,40.869362895394,40.8693287346624,40.869272314754,40.8691130434261,40.8689909804737,40.8691854292133,40.8690424100958,40.8685221816429,40.8679259035013,40.8673219849901,40.8677633442414,40.8680406775116,40.8683447520242,40.8682841467267,40.8684382174912,40.868831407546,40.869484735938,40.8698790058607,40.8692970142679,40.869009351052,40.8690092737918,40.8693919909323,40.8696716847837,40.8701586964823,40.8703888529314,40.8699331668282,40.8696093299175,40.8692380322741,40.8690136078319,40.8681908306235,40.8681162886069,40.8681690200683,40.8679449202575,40.8657580614387,40.865151497606,40.8644590311431,40.8643067933021,40.864178253844,40.8649382042966,40.8656012077668,40.8652435735122,40.8648299747341,40.8644440249751,40.8641746594005,40.8639196581483,40.8636761023,40.8632380618776,40.8630574653678,40.8624826087081,40.8611806277039,40.8612249050664,40.8612350990822,40.8612421027868,40.8612457270821,40.8612458741127,40.8612425399091,40.8612358144938,40.8612258794514,40.8612130030255,40.8611975328759,40.8611798866921,40.8611605409157,40.8611400178761,40.8611081695941,40.861075858427,40.8610347571213,40.8609957339579,40.8609596765251,40.8609274049538,40.8608996532637,40.8608770526687,40.8608601172202,40.8608492321151,40.8608446449353,40.8608464600162,40.8608546360736,40.8609024046818,40.8609452624398,40.860982833664,40.861014789011,40.8610408483647,40.8610607832924,40.861074419047,40.8610816360989,40.8610814278681,40.8610744180864,40.8610607101766,40.8610405063861,40.8610141048027,40.8609818949563,40.8609443520715,40.860902030056,40.8608555533274,40.8608056076005,40.8607529297701,40.8606982970383,40.8606425154476,40.8605864079887,40.8604805445552,40.8603741483542,40.8602673139879,40.8601824609793,40.8600959473055,40.8600080613181,40.8599190959414,40.8598293476961,40.8596409899537,40.8595109187575,40.8594425311957,40.8593913522563,40.8593676181441,40.8593472727744,40.8593440242782,40.8593301576833,40.8593226740585,40.8593215909403,40.8593269108669,40.8593386213718,40.8593566950137,40.8593261512252,40.8592225695596,40.8591616354448,40.8590948612279,40.8590646194551,40.859114205621,40.8591572275405,40.859206288756,40.8592065987554,40.859279999118,40.8594018528211,40.8594746958694,40.8594867404811,40.8595535416713,40.8596448801226,40.8597790151909,40.8598096681401,40.859803886079,40.8597859598321,40.8597313163391,40.8597984018664,40.8599017731082,40.8599868103599,40.859931794267,40.8599560211075,40.8600534629379,40.8601388217242,40.8601574040684,40.8601028573039,40.8600664857544,40.8600545751101,40.8601217837507,40.8601826065903,40.8602675945435,40.8603161359052,40.8603411570759,40.8603464052629,40.8603279102076,40.8603825168751,40.8604798596738,40.8605649460132,40.8605951515792,40.8605463134367,40.8604488976177,40.8602361413712,40.8600896611072,40.8599860053333,40.8599127900684,40.8597786429799,40.8596323877372,40.8595592982031,40.8594740260737,40.8593888284448,40.85935827446,40.8593641424459,40.8593152157978,40.8593272112461,40.8593758630774,40.8594733048492,40.8595708450406,40.8596439730865,40.8597474555276,40.8598449085703,40.8599485154786,40.8599911390931,40.8600093125568,40.8599787204244,40.8598750144391,40.8598079031707,40.8597467575474,40.8597708713564,40.8598193604513,40.8598496138276,40.8598738403615,40.859940815402,40.8600018611671,40.8600508253024,40.8601911268287,40.860313118868,40.86046540253,40.8605810673578,40.86067232952,40.8607636291263,40.8608428357611,40.8609219794277,40.8610311075692,40.86110390103,40.8611391268643,40.8611819438414,40.8612115028033,40.8612193200368,40.8612457404807,40.8613000219368,40.8613470343226,40.8613767536343,40.8614289234893,40.8614709104734,40.8615475087951,40.8616506196653,40.8617367595871,40.8617955851321,40.8618275305144,40.8621524272365,40.8621984430304,40.8622455455974,40.8623039922328,40.8623760709791,40.8624110772859,40.8624339793278,40.8624745616912,40.8622988179254,40.862158378145,40.8620240547851,40.8618962541785,40.8617753733896,40.8616355161428,40.8615014606367,40.8613733187336,40.8612511973607,40.8611351984206,40.8610254187067,40.8609219498226,40.8608248781052,40.8607342845534,40.8606772407796,40.8603390746449,40.8603178483175,40.8601451470708,40.859972442754,40.8597370843229,40.8595471439454,40.8593121731403,40.8592611156032,40.8592323949348,40.8592065770424,40.8582111360458,40.8562563631214,40.8561808182253,40.8561343810312,40.8559730686949,40.8558881400116,40.8556760141988,40.8557178475947,40.8547224869677,40.8533507569479,40.8532505132979,40.8528179596694,40.8529458315274,40.8530050968406,40.8530068192239,40.8518710810244,40.8517112057939,40.8516842794588,40.8516699100256,40.8509463710299,40.8506462456696,40.8503421895008,40.8502477436293,40.8500378392255,40.8497332948133,40.8494288848257,40.8491259836566,40.8488259348462,40.848093411579,40.8475391849537,40.8472874415574,40.8471051994446,40.8467524951107,40.8461502294325,40.8461764414555,40.8462074368627,40.845561537337,40.8455583886229,40.8458630487035,40.845836846077,40.846105444802,40.8463778745736,40.8466412420541,40.8471617388565,40.8476903687039,40.8481989807793,40.8485010256302,40.8480205985507,40.8481701799873,40.8483110319788,40.8484265673581,40.8485721724036,40.8490806127351,40.8490039649213,40.8489632175473,40.8488533201379,40.8487798316465,40.8487726747792,40.848704120081,40.8486523839212,40.8485775706927,40.8485128973766,40.8484259090212,40.8482992769046,40.8481831223942,40.8481593652634,40.848181680065,40.848157073112,40.8481524288281,40.84808851854,40.8480131214818,40.8478989795456,40.8478236051903,40.8477755823539,40.8477309061056,40.847713645631,40.8477066928299,40.8476895188118,40.8476586831621,40.8476416178164,40.8476519755044,40.8476589210659,40.8476761310715,40.8476762535213,40.847656733602,40.8476524220968,40.8475874556508,40.8475121460329,40.8473888561198,40.8472518403909,40.8470154748644,40.8468441621691,40.8466488452828,40.8465279828846,40.846487326504,40.8464545444375,40.8464236573529,40.8464004582675,40.846326933104,40.8463056248063,40.8462934434989,40.8463408049056,40.8463418403487,40.8466030287716,40.8466908895933,40.8468719546974,40.8469350091809,40.8469841139971,40.847142794761,40.8471676899999,40.8472040064818,40.847219613529,40.8471060780268,40.847090899394,40.8471248164931,40.8471271372415,40.8469635716256,40.8468898374621,40.8467713676471,40.8466656638,40.8465907260857,40.8465126098581,40.8464968359893,40.8464089391435,40.8464236276061,40.8463078251248,40.8463108261237,40.8462913404238,40.8462880980173,40.8462932760145,40.8462937982898,40.8463014456766,40.8463225518942,40.8464992927555,40.8465242726389,40.8465434716162,40.8465472722555,40.8465394988957,40.8465201737792,40.8464834886923,40.8465212341264,40.8466033156667,40.8466692278063,40.8466830160229,40.8467133689247,40.846732983728,40.8467586743732,40.8467728806978,40.8468029406772,40.8468170507607,40.8468480839737,40.8468688674331,40.846892741082,40.8469154799091,40.8469371168183,40.8469521760658,40.8469813112502,40.8469968378976,40.8470272573685,40.8470499687169,40.8470714478484,40.8470858485113,40.8471164085685,40.8471308984232,40.8471616313461,40.847176292578,40.8472052771765,40.8472157051536,40.8472649150024,40.8472743255091,40.8472025957164,40.8471514112785,40.8471407107707,40.8471895833906,40.8471902431993,40.8471605188045,40.8471461873514,40.8471162621796,40.8471008949811,40.8470716102546,40.8470557083029,40.8470399782421,40.8470122545804,40.8469827070101,40.846966985604,40.8469381775445,40.8469219192112,40.8469162661107,40.8468242138588,40.8468046152269,40.8467438418379,40.8467396542839,40.8466532687728,40.8465050893012,40.8464687648791,40.8462055453014,40.846234151702,40.8461878250725,40.8459684974252,40.8459086730715,40.8458672153634,40.8458175308588,40.8457779455843,40.845743562822,40.845595002916,40.8454999950584,40.8460101808884,40.8458269191938,40.8458658086554,40.8462295364752,40.8461685621387,40.8458024882244,40.8456686916361,40.8456314568879,40.8456491130056,40.8459651709471,40.8459495061096,40.8456355547081,40.8456179666302,40.8455892978679,40.8455215675536,40.8456590622548,40.8456465324691,40.8455115891113,40.8454761083549,40.845417562889,40.8454850681723,40.8454621084494,40.8453993904392,40.8453514829683,40.8452807690314,40.8453061437316,40.845315742706,40.845325259987,40.8453328562933,40.8453490263926,40.8455177901454,40.8455205859042,40.8455849859396,40.8456461416025,40.8456537811424,40.8457101850886,40.8457525047819,40.845760946691,40.8458454993311,40.8458542436841,40.8458869027612,40.8459040954384,40.8459510227316,40.8459229398419,40.8459136426486,40.8459374381477,40.8458993632322,40.8458921883808,40.845848662293,40.8458393364932,40.8458102233661,40.8458016987316,40.8456501583979,40.8456016984583,40.8455816573729,40.8455467324102,40.8455227874324,40.845512591373,40.8454654512211,40.8454580795086,40.8454098176165,40.8454014980967,40.8453541823325,40.8453449056292,40.8453454641151,40.845330976604,40.8453273839169,40.8453059375701,40.8453014684311,40.8452945293047,40.8452750423886,40.8452108495306,40.8452339904582,40.8452936489669,40.8453087046214,40.8453768592089,40.8454268673287,40.8454358174281,40.8454922329617,40.8455645216417,40.8456254300405,40.845634822594,40.8457068262417,40.8457171218048,40.845740487584,40.8457972014792,40.8459319773567,40.8459476493138,40.8459570086627,40.8460170673213,40.8460271107149,40.8460871261761,40.8460971996987,40.8461572298828,40.8461672064843,40.846224073219,40.8462359311763,40.8462950050495,40.8463100525461,40.8463187994983,40.8462866199471,40.8462763934554,40.8462888896987,40.8462326784056,40.8460223635781,40.846013094971,40.8459551305251,40.8459437121666,40.845873834683,40.8458627564801,40.8457930857252,40.8457844319767,40.8457335206416,40.8456202689756,40.8455591104005,40.8455476802486,40.8454967548932,40.8454675453669,40.8454313686639,40.8454238178777,40.8453718287539,40.8453449041118,40.8453134672802,40.8453035542559,40.8453000401901,40.84523590785,40.8452400304051,40.8452186820928,40.8452000230573,40.8451844816589,40.845172414685,40.8451640991598,40.8451597259844,40.8451593955548,40.8451484225571,40.8451346684485,40.8451749877225,40.8452112972411,40.8451995823124,40.8452121003763,40.8452247711841,40.8451862854614,40.845252970234,40.8454650891569,40.8456032471414,40.8457490124263,40.8458207580407,40.84586987198,40.8458800395793,40.8460617095975,40.8461351225585,40.8461870313944,40.8461956545726,40.8462515223213,40.8464760266304,40.8465445206224,40.8465593807488,40.8465705438173,40.8465434582793,40.8465312236468,40.8465415118325,40.8463594291289,40.8463322069804,40.8463235422993,40.8462571530234,40.8462131269252,40.8461921178299,40.8461822400293,40.8461546937276,40.8461166561836,40.8460674056371,40.8460578092721,40.8460090167926,40.8460003222592,40.8459388145986,40.845930037859,40.84587559468,40.8458674894805,40.8458176245264,40.8458067097733,40.8457441992212,40.8457328812313,40.845669588414,40.8456587843688,40.8455992053343,40.8455891650048,40.8455387689926,40.8455285865327,40.8454696920823,40.8454601821594,40.8453940588665,40.8453850359657,40.8453195836822,40.8453096677669,40.8452493771862,40.8452391615863,40.8451801701749,40.8451295602829,40.8451095078659,40.8451630279378,40.8451295445891,40.8451077641522,40.8450819928905,40.8450523767104,40.8450397288494,40.845025958055,40.8450114348825,40.8449965501325,40.8449795980083,40.8452370738176,40.8452606901033,40.8452837301513,40.8452643279637,40.8459521025033,40.8459460416519,40.846475825338,40.84648442528,40.846501697995,40.8465294279249,40.8465326054015,40.8465509813737,40.8465273891914,40.8465949670613,40.8466894075637,40.8467377120756,40.8467553669325,40.8467127921977,40.8466165566338,40.8467141275735,40.8466817008137,40.8453967835226,40.8453789003436,40.8451873060132,40.8451843173308,40.8451590275739,40.8451261833748,40.8448682819852,40.8448632081838,40.8448232677451,40.844628200082,40.8446224125364,40.8445949265871,40.8443813979244,40.8443754458222,40.8443231331002,40.8442456928533,40.8442076495008,40.8442265179079,40.8442283481961,40.8442294718895,40.8442294998659,40.8444618637945,40.8444665362965,40.8444671096206,40.8444684125093,40.8444684125659,40.844468939112,40.8444691237952,40.8442846834596,40.8442823511525,40.8442795811148,40.8442773317631,40.8442751361798,40.8442554319811,40.844259615547,40.8443548768903,40.8444733044381,40.8444785857355,40.8444800519266,40.8444858642087,40.8444858642649,40.8445225070556,40.8445498270434,40.8445474514327,40.8445033404421,40.844496606709,40.8444948030906,40.8444919126389,40.8444871987614,40.8444867828804,40.8444853124324,40.8444875087195,40.8445028981996,40.8446594676673,40.8447132314598,40.8446837360211,40.8446814440978,40.8446580476934,40.8446725392526,40.8446501853737,40.8446839544537,40.8447310482344,40.844717550293,40.8447432844631,40.8447506903746,40.8447728891421,40.8447876030671,40.8448482762972,40.8447514492065,40.8446901161613,40.8446900320949,40.8446816622603,40.8449522751461,40.8449708663179,40.8449591768177,40.8449484576056,40.8449390147302,40.8449311177987,40.8449249922795,40.8449208130645,40.844918699476,40.8449199046465,40.844925589344,40.8449357425423,40.8449503445479,40.8449533699902,40.844960824861,40.8449726828128,40.8450418692036,40.845048229107,40.8450585166113,40.845059122044,40.8450569805158,40.8450521457748,40.8450447391633,40.8450349465727,40.8450230137772,40.845009240266,40.8449939717264,40.8449775913673,40.8449663131635,40.8449606556508,40.8449492419853,40.8449323356833,40.8449102805144,40.8448835249443,40.8448526130146,40.8448181732812,40.844780906032,40.844741569048,40.8447641245086,40.8448183815554,40.8448423321554,40.8448670676485,40.8448413061525,40.8448484568634,40.8448291045311,40.8447889025593,40.844773144542,40.8447601978641,40.8447770554629,40.8447608577814,40.8447254154432,40.8446821990835,40.8446399467554,40.8445997764497,40.8445627510649,40.844529850284,40.8445019446526,40.844479772545,40.8444639206275,40.8444548083361,40.8444613013861,40.8444633829074,40.8444561828736,40.8444435351233,40.8444077112082,40.8443909010885,40.8443540818902,40.8443467688842,40.8442999305934,40.8442631884319,40.8442111634272,40.8441505869062,40.8440928550086,40.8440405444525,40.8439930562657,40.8439438724875,40.843893821912,40.8438437479384,40.8437944943577,40.8437468911351,40.8437017404239,40.8436598030493,40.8436549201361,40.8436511195513,40.8436485102156,40.8436471669098,40.8436471281313,40.8436519206803,40.843651115677,40.8436447307612,40.8436329058421,40.8436317643803,40.8436257745611,40.8436150148214,40.8435996260599,40.8435798097925,40.8435825746619,40.8435800366212,40.8435722423453,40.8435593351716,40.8435415524638,40.8435099850076,40.8434844757542,40.8434653270153,40.8434527657235,40.8434469407431,40.8434479211062,40.8434556951944,40.8434701708768,40.8434911766014,40.8435044526419,40.8437009514143,40.8440483523273,40.8440637504288,40.844078199572,40.8440913215834,40.8441027730238,40.8441122541774,40.8441522161286,40.844195752298,40.8442427415686,40.8442505102617,40.8442599465616,40.8442708094757,40.8442828215772,40.84429567609,40.8443090447237,40.8443225860574,40.8443383310504,40.8443540831946,40.8443693772707,40.8443837615878,40.8443968113233,40.8444081410693,40.8444174162157,40.8444243628323,40.844428775759,40.8444305246655,40.8444295578997,40.8444263232244,40.8444188185778,40.8444051570128,40.8444040798347,40.8444020777265,40.8443992104303,40.8443955635049,40.8443912457728,40.8443863860731,40.8443811294168,40.8443756326601,40.8443700598235,40.8443645771976,40.8443593483812,40.8443545293994,40.8443460923877,40.8443358771542,40.8443231529133,40.8443089627469,40.8442936747482,40.8442776854883,40.8442614097286,40.844245269662,40.8442147172225,40.8441848447431,40.8441564498191,40.8441302905942,40.8441070655179,40.8440873946977,40.8440718033422,40.8440672062079,40.8440649067477,40.8440649445599,40.8440673189933,40.8440722154403,40.8440787419759,40.8440867224899,40.8440959416383,40.8441061506538,40.8441170740589,40.8441195835759,40.8441220014406,40.844124260659,40.8441262986331,40.8441280588946,40.8441294926705,40.8441305602339,40.8441312320047,40.8441314849498,40.8441313754147,40.8441309060098,40.8441300879229,40.8441289406521,40.844127491541,40.8441257751276,40.8441238323204,40.8441178155819,40.8441120436367,40.8441066044946,40.8441016546502,40.8440973006491,40.8440936362119,40.8440907402156,40.8441069779185,40.8441203430048,40.8441304703837,40.8441370834081,40.8441400014315,40.8441391447428,40.8441345367439,40.8441263033107,40.8441122935848,40.8441007818185,40.8440920878038,40.8440864530566,40.8440840341077,40.8440848981544,40.844089021194,40.8440962886902,40.8441064987551,40.8441193677575,40.8441345382019,40.8441515886594,40.8441700454746,40.8441876604911,40.8442046891655,40.844220718561,40.8442255160256,40.8442306658421,40.8442360269947,40.8442414526805,40.8442467943297,40.8442519056734,40.8442566467491,40.8442608877334,40.8442645124964,40.8442674217822,40.8442695359267,40.8442707970389,40.8442711705859,40.8442794562811,40.8442840878925,40.8442849810946,40.8443067408856,40.844334288986,40.8443674449103,40.8443707468254,40.8443550417127,40.84434212791,40.8443289613184,40.844315901103,40.8443033035266,40.8442915122321,40.8442808488678,40.8442740951441,40.8442661460279,40.8442572181256,40.844247554715,40.8442374191151,40.844227087512,40.8442168414324,40.8442069600724,40.8441977126899,40.844176693246,40.8441552415315,40.8441338848075,40.844113148,40.8441110651307,40.8441115758755,40.8441146681006,40.8441202683427,40.8441282435551,40.8441384042679,40.8441505090891,40.8441884970652,40.8442220099778,40.8442502473485,40.8442630661936,40.8442694242425,40.8442712405373,40.8442684955501,40.8442612187936,40.8442541156799,40.8442451728443,40.8442266167566,40.8442039307699,40.8441774329672,40.8441474948773,40.8441153845712,40.8440808294613,40.8440442903929,40.8439978562725,40.8439548962097,40.8439159644176,40.8439113983174,40.8439092574148,40.8439096041193,40.8439124283239,40.8439749658253,40.843971021484,40.8439634756881,40.8439448985603,40.8439170735757,40.8438670515204,40.843862157161,40.8438318446654,40.8438107682354,40.8438002589059,40.8437631295553,40.8437241747226,40.8436740738521,40.8436351505711,40.8435943613231,40.8435572513402,40.8435183008651,40.84349591641,40.8434812180607,40.8434348974064,40.8433848780681,40.8433311228754,40.8432643502327,40.843193878225,40.8431289586954,40.8430733231307,40.8430065342063,40.8429768132079,40.8429507462142,40.8429154471116,40.8428919331202,40.8428690291259,40.8428282098223,40.8427886097637,40.842536565987,40.8425771616239,40.8425549233252,40.8425197216896,40.8424583592655,40.8424206083181,40.8424108271934,40.8423913277834,40.8423537902676,40.8423259987367,40.8422912967432,40.8422607780313,40.8422595426342,40.8422233143741,40.8421955485102,40.84215945312,40.8421052809785,40.84205664042,40.8420246680278,40.8419732739213,40.841903813763,40.8418412646036,40.8417522956216,40.8416479959002,40.8415853723834,40.8415602846037,40.8415240696658,40.8414920321422,40.8414419588593,40.841394690153,40.8413404875644,40.8412946117271,40.8412598394231,40.8412337733766,40.841384170143,40.8413980753519,40.8414132982118,40.8413757283109,40.8412026764997,40.8411680442718,40.8411333071377,40.8411041432502,40.8410624717364,40.8410096414965,40.840967928943,40.8409137028961,40.8408705857376,40.8408163315324,40.8407815557679,40.8407426106796,40.840724329829,40.8407036696935,40.8406591708675,40.840618857037,40.8405906868893,40.8405380858966,40.8405511412462,40.8405584394245,40.8405666737399,40.8405593711557,40.8405593601446,40.8405426767551,40.8405395626445,40.8405333069627,40.8405219436276,40.8405282015092,40.8405176195513,40.8402937348659,40.8400768852004,40.8398043668865,40.839865363765,40.8398518076819,40.8397879574069,40.8397732789181,40.8397628401876,40.8397555243736,40.8397544693208,40.8397544472789,40.8397596390901,40.8397627454037,40.8397627277676,40.8397585414765,40.8397481137635,40.8397314435954,40.839713733132,40.8396991638939,40.8396762510984,40.8396470666848,40.8396126662106,40.8395888866001,40.8396258097624,40.8396205921569,40.8396350443331,40.8396433877278,40.839649527012,40.8396224163793,40.8396131570699,40.8396225422926,40.8396122536812,40.8396059979944,40.839571879092,40.8394510589777,40.8390764879577,40.8388523153941,40.8388146166474,40.8387805796538,40.8387702081795,40.8387732038283,40.8387733595667,40.8387834258345,40.8387865014961,40.8387828909328,40.8387317219631,40.8386905421522,40.8386730268158,40.838672491773,40.8386517871032,40.8386142557457,40.8385594764572,40.8384707375761,40.8383991305163,40.8383073158855,40.8382390519896,40.8381474669795,40.8380727082088,40.8380317012404,40.8380001903654,40.8379672145202,40.8379342725466,40.8379046587927,40.8378946923229,40.83787178706,40.8378191690994,40.8377698264274,40.8377039838885,40.8376611593709,40.8376051103189,40.8374930950357,40.8373711891299,40.8372492981999,40.8371504591288,40.837048312567,40.8369428846268,40.8368341358845,40.8367583348483,40.8366956766661,40.8366461606388,40.8366263326789,40.8365867470322,40.8365571142317,40.8365143380933,40.8364451675303,40.8363430135121,40.8362177654781,40.8361188641332,40.8360301964569,40.8359968002114,40.8359538857045,40.8359241825161,40.8359043556109,40.8359207221207,40.8359337810557,40.8359402857404,40.8359632902182,40.835976376291,40.835976306926,40.8359532134671,40.8359235656645,40.835897275152,40.8358875029027,40.835890901078,40.835871205799,40.8358515578246,40.8358319732894,40.8358057587649,40.8357780778773,40.8357729274737,40.8357103591047,40.8356543571755,40.8355950553197,40.8355532661435,40.8355422934052,40.8355125978387,40.8355026731065,40.8355025831298,40.8355123901899,40.8355122516757,40.8355121408174,40.835531836098,40.8355317806383,40.835531711303,40.8355250818311,40.8355053236751,40.8354757244131,40.8354758630643,40.8354726659002,40.8354596408945,40.8354334610168,40.8354039170063,40.8353928698032,40.8353611824002,40.835285430884,40.8352063978404,40.8351240372077,40.8350614273357,40.8350251150767,40.8350064172677,40.8349756334914,40.8349229264076,40.8348735486026,40.8348727090734,40.8348176089283,40.8347550336325,40.8346760086748,40.8345903462652,40.8345178042419,40.8344815208084,40.8344814886802,40.8344748701665,40.8344747871073,40.8344845311711,40.8344877283759,40.8345073959608,40.8345073474442,40.834490849307,40.834477672577,40.8344579691937,40.8344416096532,40.8344220308863,40.834395844553,40.8343779064162,40.834349781181,40.8343102508222,40.8342213218958,40.8341686148053,40.8340862334001,40.8340302187903,40.8339808052108,40.8339195801628,40.8339397956371,40.8339251915407,40.8339015904747,40.8336768664156,40.8336064017224,40.8335691424606,40.8335347850575,40.8335014035132,40.8334809902567,40.8334735349817,40.8334883201707,40.8334975423534,40.8334882383165,40.8334622808612,40.8334474766987,40.833438259087,40.8334105262718,40.8333660944366,40.8333555722608,40.8333012598528,40.8332401071805,40.8331696828273,40.8330955291377,40.8330195172281,40.8329713360678,40.8329175690233,40.8328563578697,40.8328247956969,40.8327969654247,40.832778444279,40.8327358451114,40.8326709169414,40.8325912041073,40.8324403160344,40.8324216830864,40.832388877756,40.8323402166267,40.8322998910566,40.8322525871623,40.8322219576365,40.832208003901,40.8322001686022,40.8321821799424,40.8321565283894,40.8321217765507,40.8320787003675,40.8320272600036,40.8319577440987,40.8318757005332,40.8318241986078,40.8317838319566,40.8317531871867,40.8317327119459,40.8317094170541,40.8317086301422,40.8317058074217,40.831696032716,40.8316821170179,40.8316696123057,40.8316599085229,40.8316474150432,40.8316375593168,40.8316363472154,40.8316308238176,40.8316141587441,40.8315946903175,40.8315654911974,40.8315293317973,40.8314945652725,40.8314639556653,40.831444459061,40.831437483601,40.8314305086413,40.8314269324487,40.8314207568959,40.8314026775236,40.8313788719308,40.8313053794973,40.8312428331211,40.8311941831647,40.831102405353,40.8310300864914,40.8310081997295,40.8311711402244,40.8311414582521,40.8309861205137,40.8308167999935,40.8307893508801,40.8307628963329,40.8307406109377,40.8307058026788,40.8306723959466,40.8306445455326,40.8306228757943,40.8308245004488,40.8308342400078,40.8309242570356,40.8309075541583,40.8308091963903,40.8308161567317,40.8306140470511,40.830605562691,40.8305666027104,40.8305275325497,40.830495338637,40.8304969747688,40.8305108311324,40.8305135779496,40.8305135367104,40.8305051694309,40.8304815322919,40.830453736604,40.8304356975395,40.8304145280632,40.8303870775072,40.8303592712075,40.8305670167929,40.8305614429227,40.8303501037027,40.8303244687196,40.8302743673953,40.8302103219597,40.830175496331,40.8301378784881,40.830121651866,40.8301085641935,40.8300987921551,40.8300681616621,40.8300347760629,40.8300031302213,40.8299884682277,40.8299675814625,40.8299404044374,40.8299033606089,40.8298573687827,40.8299330331286,40.8298912848539,40.8298649778188,40.829890004939,40.8298210324666,40.8297774522023,40.8296933989933,40.8296414679901,40.8296166562307,40.8295819839035,40.8295523346018,40.8296076442197,40.8295895478884,40.8295345791202,40.8295275873093,40.8294954435661,40.8294410679879,40.8294039716126,40.8293767584586,40.8293618769601,40.829344534659,40.8293568354282,40.8293741088615,40.8293938103402,40.8293962027202,40.8293912027105,40.8293640098932,40.8293467213554,40.8293195759082,40.8293097617669,40.8292900392507,40.8292579784799,40.8292209346762,40.8291888061855,40.8291566612415,40.8290973188923,40.8290230944736,40.8289834903867,40.8289562291131,40.828938861576,40.8289289052662,40.8289263448814,40.8289435648927,40.8289657171257,40.8289829265508,40.8289829098823,40.8289828579738,40.8289778748241,40.828953131666,40.8289176341288,40.8288988778526,40.8288791595443,40.8288594687658,40.8288422435057,40.8288373704206,40.8288275458369,40.8288028712296,40.8287855604447,40.8287781281201,40.8287805514953,40.8287805040551,40.8288002317631,40.828800194855,40.8287853654134,40.8287582094744,40.8287434760944,40.8287163465001,40.8286916139244,40.8286742451506,40.8286692251197,40.8286938364123,40.8287011848559,40.8286862657055,40.8286720696114,40.8286466666957,40.8285922504552,40.8285453241489,40.8285082751221,40.82850210003,40.8284786642376,40.8284366947056,40.8284070739278,40.8283700090611,40.828337837634,40.8283007094129,40.8282482362514,40.8282683375775,40.8282829161626,40.8282919652411,40.8282954806136,40.8282934606486,40.8282859062835,40.8282728210242,40.8282542109433,40.8282554839016,40.8282544704024,40.8282511987586,40.8282457603654,40.8282383071472,40.8282290473138,40.8282182395438,40.8282061857578,40.8281932226847,40.8281797124542,40.8281660324813,40.8281044593261,40.8280433439441,40.8279829210836,40.8279572804582,40.8279320036633,40.8279076958111,40.827884938817,40.827864277469,40.8278462063867,40.8278311581796,40.8278194930915,40.8278448195465,40.8278752139826,40.8279101212333,40.8279489037029,40.827990853012,40.827984794836,40.8278408051546,40.8278338639129,40.8278000299648,40.8277968158974,40.8277815684232,40.8277810109068,40.827817700717,40.8278288136351,40.8278483534852,40.8278415765479,40.8279844023148,40.8279786180308,40.8279778589431,40.8279821280067,40.8279914086037,40.8279991535486,40.8280004569791,40.8279953085375,40.8279837491363,40.8279658706335,40.8279418151023,40.8279117737019,40.8278849476476,40.8278643710374,40.8278502092309,40.8278425760362,40.8278415327959,40.8278364065619,40.8278283479684,40.8278175970213,40.8278044739116,40.8277893694793,40.8277727335728,40.8277550616515,40.8277368800296,40.8277187302009,40.8277011527119,40.8276629351028,40.8276258534524,40.8275908411805,40.8275587796148,40.8274880048142,40.8274134455472,40.8273351907743,40.8272483500848,40.827219873662,40.8271871469385,40.8271505452046,40.8271043966291,40.827054409337,40.8270211739928,40.8269794449655,40.8269418198126,40.8269090999652,40.8268819823684,40.8268610446362,40.8268467327493,40.8268358761213,40.8268213401981,40.8268035287241,40.8267829364234,40.8267601352591,40.8267357585458,40.8267104833594,40.8266850117305,40.826660051145,40.826636294894,40.8266144028165,40.826594982973,40.8265785747564,40.8265618571331,40.8265410010452,40.8265165763741,40.8264896157199,40.8264605455375,40.8264301399696,40.8263992087195,40.8263685754882,40.8263390560393,40.8263047868735,40.8262715925151,40.8263250915874,40.8263340557263,40.826376287416,40.8263503891207,40.8263051616744,40.8263141300597,40.8262612192206,40.8262253770693,40.8261924279223,40.8261629734232,40.8261375514035,40.8261268035612,40.8261116090391,40.8260923707277,40.8260695987403,40.8260438968867,40.8260159466627,40.82598648918,40.8259563055146,40.8259261959966,40.8258749382034,40.8258247360055,40.8257760057167,40.8257291514436,40.825934987273,40.8259250167683,40.8257170317285,40.8256791237606,40.8256650015078,40.825647125359,40.8256259925429,40.8256021908721,40.8255763823933,40.8255492849723,40.8255216523257,40.8254942530568,40.8254678492764,40.8254255989659,40.82539021439,40.8253477084548,40.8252980860016,40.8252649465927,40.8252506733619,40.8252472508124,40.8252363505296,40.8252244243756,40.8252007153921,40.8251709467076,40.8252590836511,40.8252756107211,40.8252944574964,40.8252731248406,40.8255691776095,40.8255526346593,40.8252659236331,40.8252730189851,40.8252518673732,40.8252353290459,40.825218907808,40.8252354499938,40.8251613217076,40.8251503846279,40.8251359560499,40.8251182946868,40.8250950688957,40.8250687087818,40.825039807005,40.8250090133692,40.8249770202121,40.8249445468398,40.8249067569898,40.8248717841741,40.8248400559133,40.8248119600649,40.8247484331887,40.8246892416128,40.8246345070919,40.8245580101152,40.8244834694939,40.8244233437379,40.8243632852116,40.824303974535,40.8242460838507,40.8241902692075,40.8241371631262,40.8240873674307,40.824041446429,40.8239999205184,40.8239666658196,40.8241379807951,40.8241584311799,40.8241905986623,40.8242191258606,40.8242435275517,40.824263388683,40.8242783714327,40.824307238532,40.8243391136744,40.8243732375002,40.824408797078,40.8244449452711,40.8244808209191,40.8245155693529,40.8245696878689,40.8246245826878,40.8246796802186,40.8247344047507,40.8247447676965,40.8247541614597,40.8247623142416,40.82476899015,40.8247739960243,40.8247771870245,40.8247784708224,40.8247778102724,40.8247485535767,40.8247147504346,40.8246771696158,40.8246366658029,40.8245834273397,40.8245337377011,40.8244881552059,40.8244471920237,40.82441130842,40.8243809075851,40.8243563311041,40.824337855119,40.8243256872264,40.8243352746314,40.8243408462411,40.824342360518,40.8243398061728,40.8243553093243,40.8243741290069,40.8243958507799,40.824419996293,40.8244460338207,40.8244926003676,40.8246016622687,40.8246114917025,40.8245120902351,40.8245507774776,40.8245506758531,40.8245553000984,40.8245740701788,40.8245858006886,40.8246093583342,40.8246258701925,40.824654199027,40.8246920001945,40.8247297657495,40.8247675308017,40.8247821145626,40.8247911138833,40.8247910630059,40.8247898717607,40.8247768544131,40.8247532211183,40.8247177854365,40.8247035525487,40.824708227042,40.8247412570052,40.8247978281083,40.8248403512495,40.8248724909649,40.8251139484466,40.8251138006251,40.8249015707142,40.8249237848494,40.8249365409654,40.824976477584,40.8249952641803,40.825021130469,40.8250470273859,40.8251012536472,40.8251366376759,40.8251649263107,40.8251672100369,40.8251576966428,40.8251505385271,40.8251432945696,40.8251855290552,40.8252231255329,40.8252629727771,40.8252755356217,40.8253761613659,40.825493962245,40.8255433805666,40.8255857888623,40.8256352636188,40.8257201885821,40.8258122052155,40.8258428379491,40.8258733981641,40.825854341283,40.8258116906773,40.825799718983,40.8258231935727,40.825853686951,40.8258535889433,40.8258603386524,40.8258392616871,40.8258179367423,40.825801233283,40.8258034071593,40.8257985472471,40.8257903673626,40.8258275749186,40.8258255769738,40.8257817427324,40.825772272983,40.8257674548031,40.8257909327599,40.825842802938,40.8258876239724,40.8258969920591,40.8258686372225,40.8258332172087,40.825797703205,40.8257622099128,40.8257172707769,40.8256723419904,40.8256297419449,40.8255588693735,40.8255021647755,40.825455623742,40.8254547663976,40.8254310642325,40.8254167674442,40.8253883708975,40.8253600459835,40.825322312813,40.8252443807072,40.8251829233017,40.8250860619043,40.8249962859119,40.8249419827179,40.8249183392532,40.8248900555479,40.8248168547949,40.8247412669251,40.8246845829845,40.8246373090928,40.8246307726419,40.8246277948601,40.8246277062808,40.8246064054318,40.8245757374144,40.8245519777406,40.8245498830099,40.8245358516153,40.8245028695437,40.8244486177369,40.8243825348178,40.8243069625607,40.8242596775867,40.824245426909,40.8242311610759,40.8242263521528,40.8242262552348,40.8242145191593,40.8241979919127,40.8241736458632,40.8241724069054,40.8241560729369,40.824134881495,40.8241270448585,40.8240664947715,40.8239933616892,40.8238989121926,40.8238280706587,40.8238043949906,40.8238113767456,40.823816490059,40.8238229960616,40.8238181818992,40.8237992674992,40.8237780251485,40.8237568546249,40.8237404524844,40.8237363073292,40.8237264315483,40.8236792710643,40.8236179240834,40.8235093129397,40.8234195842372,40.823336868686,40.8233192752928,40.8232942316487,40.8233129732942,40.8233269940584,40.8233410257047,40.8233079346507,40.8232820804315,40.8232562475445,40.8232209775114,40.8231526117204,40.8231362891012,40.8230935730247,40.8229967206601,40.8228927626323,40.8228359742371,40.8228594517125,40.8228970548731,40.8229110811483,40.8229109452443,40.8228825953495,40.8228590912443,40.8228356086801,40.8228168352749,40.8227838799892,40.8227414299895,40.8226635401284,40.8226093529148,40.8224196711434,40.8223290192886,40.822273910805,40.8218981288477,40.821767789793,40.8216715038036,40.8215469718063,40.8214847708487,40.8214280437734,40.8208266279261,40.8208235584901,40.820177338695,40.8201571440119,40.8199066505566,40.8196572828818,40.8194879763808,40.8190271147164,40.8189276879602,40.8188320441333,40.818740400814,40.8186529664789,40.8185699400293,40.818491510338,40.8184178558206,40.8183491440291,40.8182855312712,40.8182769854666,40.818251071676,40.8182441139936,40.8182381281,40.81823305963,40.8182310003159,40.8182314464758,40.8182385750915,40.8182674487506,40.8183379343509,40.8183892559925,40.8184230914111,40.8184516064342,40.8184813732856,40.8185259883059,40.8185409075283,40.8185165274038,40.8184942658315,40.8184847162945,40.8184971418508,40.8185095262992,40.8185386971862,40.8185567369686,40.818545541213,40.8184664314127,40.8184128676903,40.8183879597686,40.8183587160459,40.8183366219872,40.8183052033327,40.818266887697,40.8182420028487,40.8182193346689,40.8181819048886,40.8181285029855,40.8181052615602,40.8181003365608,40.8181014558851,40.8181056951122,40.8180895176473,40.818043275796,40.8179636850993,40.8179334364703,40.8179094240462,40.8178496488985,40.8177651510577,40.8176980513612,40.8176657558313,40.8176123912462,40.8175604451612,40.8175191620379,40.817480990993,40.8174407168444,40.8174017017625,40.817367806718,40.8173302625867,40.817295197867,40.8172573748518,40.8172147782155,40.8169012745332,40.8168738928711,40.8168523306884,40.816836768567,40.8168329990796,40.8168243872603,40.8168111567621,40.8167936511872,40.816772325163,40.8166533611849,40.8166208935774,40.8165915093983,40.8165634288648,40.8165333459424,40.8165075320701,40.8158515361339,40.8157998215259,40.8157635048956,40.8157187296873,40.8155132927434,40.8156987850033,40.8154640159352,40.8155411349387,40.8144495656895,40.8140245255607,40.8138670088642,40.8137614025066,40.81353949953,40.813260900539,40.8129409472032,40.8128650174157,40.812554047116,40.8124244215362,40.8124442463237,40.8123937343924,40.8123739096168,40.8123672641137,40.8123633086586,40.8125698095942,40.8128613969873,40.8128093161225,40.8128039649271,40.8127931345439,40.8127770049356,40.8127569942019,40.8127327338602,40.8127045885026,40.8126729811057,40.8126237038646,40.8125797258441,40.8125414739331,40.8125093194375,40.8124835744758,40.8124644889497,40.8124522481191,40.8124469708034,40.8124487082284,40.8124574435293,40.8124730919142,40.8124955014872,40.8125244547225,40.812539387697,40.8125553923043,40.8125593658539,40.8125594373365,40.8125480070659,40.8125302900374,40.8125277949852,40.8125186844801,40.8125211066214,40.8125370629784,40.8125570078367,40.8125795935697,40.8126061405194,40.8126351448017,40.8128574019012,40.8129218712516,40.8129647408178,40.8127936080226,40.8128099060431,40.8130445149281,40.8131086960771,40.8131275339896,40.8131937211463,40.8132133405634,40.8132773275962,40.813299878414,40.81336538363,40.8133989638084,40.8134111121835,40.8135877388186,40.8136465279933,40.8136504403116,40.8135967646141,40.813608538674,40.8136318892921,40.8137079440965,40.8137306728651,40.813718304107,40.8136633052117,40.8135975220486,40.8133977317214,40.8133910023811,40.813345895743,40.8133224212386,40.8132999773279,40.8132522133482,40.8132323694951,40.8131820961997,40.8131633972243,40.8130564525687,40.8130427121723,40.8129721911916,40.8129352432894,40.813051422078,40.8131299665213,40.8131606848942,40.81319677355,40.8132963663707,40.8133200828242,40.813305156158,40.8133292437576,40.8133521311691,40.8133320723837,40.8133410272087,40.8133158096737,40.8133585805213,40.8133758586136,40.8133920217653,40.8133842152334,40.8134026909906,40.813414227125,40.8134850088732,40.8134916552365,40.8135271720872,40.8135532851906,40.8136059067071,40.8136125547438,40.813672893625,40.8136782368844,40.8139665532554,40.8139408945177,40.8139545068795,40.813966010005,40.8139515247597,40.8140304573973,40.8140381594711,40.8140527956805,40.8140607682201,40.8140744766316,40.8140922243217,40.81412710072,40.8142425907479,40.8142931964872,40.8142921914293,40.8142473012592,40.8142546199244,40.8143188860987,40.8141605587425,40.8141408777959,40.8141100523011,40.8140810165259,40.814040240001,40.8140126825778,40.8139630486228,40.8139880855583,40.8139513032765,40.813891952437,40.8138620716292,40.8138581816747,40.813820655517,40.8138130684015,40.8137735112604,40.8137697157716,40.8137289714772,40.8137210242726,40.8136832133298,40.8136787114255,40.8136389314118,40.8136325567623,40.8135942954363,40.8135879273277,40.8135491376057,40.8135415219491,40.8135017640394,40.8134966330735,40.8134589039478,40.8134529073545,40.8134221198429,40.8134064212266,40.8134011244898,40.813388069644,40.8133741099422,40.8135052405722,40.8139519636486,40.8139992970107,40.8143090077609,40.8145899628115,40.814592160481,40.8145696679122,40.8145563792686,40.8145378562017,40.8145830626131,40.8146042320536,40.8145882639326,40.8146031425859,40.8146187768259,40.8146971281821,40.8147702248521,40.8148898321537,40.8150442281981,40.8150590132019,40.8151251050464,40.8151891842418,40.815230505094,40.8152722303681,40.8153095712531,40.815341904921,40.815382739966,40.8154208656662,40.8154556419756,40.815486485076,40.8154978518456,40.8155113617537,40.8155266959368,40.8155434924742,40.8155613549302,40.8156000538539,40.8156358497425,40.8156679057556,40.815695472483,40.8157179054648,40.8157346802581,40.8160141581474,40.8160424492395,40.8162870707728,40.8162684868912,40.8165136903577,40.8166148528417,40.8166063553924,40.8166004373467,40.8165945881656,40.8165270494408,40.8165278973175,40.8161468071589,40.8160696799882,40.8159858577035,40.8159522093261,40.8159311470157,40.8158868540877,40.8158669412942,40.8158565713442,40.8158308296815,40.8158226698106,40.8157953756932,40.815785003544,40.8157580231207,40.8157484060226,40.8157342691493,40.8157246349167,40.8156910617937,40.8156799318761,40.815652738953,40.8156436076895,40.815607839866,40.8155894639607,40.8155740817633,40.8155613184299,40.8155389021864,40.8154986168471,40.8154990009379,40.8155052753378,40.8154826202827,40.8154111733447,40.8151979640126,40.8151831885492,40.8151588921924,40.8150900133716,40.8150570019809,40.8150428912757,40.8149902266519,40.8149743867253,40.814933621029,40.8149251781545,40.8147237415351,40.8146298422371,40.8146261397291,40.814608369639,40.814544989122,40.8145719404021,40.814621511144,40.8146808472396,40.8146941284599,40.8147337120697,40.8147491010407,40.8147920590849,40.8148090308379,40.814856948283,40.8148773417896,40.8150672556058,40.8151197208599,40.815134020058,40.8151865908221,40.8152007130016,40.8152548847505,40.8152685242028,40.8153172667223,40.8153406442128,40.8153772647763,40.8153902851508,40.8154377375067,40.8154572543647,40.8154706474583,40.8154595336427,40.8155342734689,40.8155471437688,40.8155880933305,40.8156025588462,40.8156381644737,40.8156515684525,40.8156742179657,40.8157664600224,40.8157748833344,40.8157910553581,40.8158901253594,40.8159197169539,40.8160268418303,40.8161379588176,40.8162452828964,40.8162814025412,40.8162937476294,40.8163258061145,40.8163406888215,40.8163674605476,40.8163785486464,40.8164088439178,40.8164168179019,40.8164548781742,40.8164691035705,40.8165070281737,40.8165218376414,40.8165779454316,40.8165529425346,40.816575170747,40.8166168008024,40.8166167970303,40.816618074712,40.8166644945437,40.8165683790768,40.8164878109985,40.8164268796694,40.8163327883424,40.8163244328538,40.8163158311978,40.8162715959199,40.8162639019694,40.8162229284239,40.8162138112851,40.8161671314091,40.8161600253744,40.8161139833855,40.8159982047677,40.8159855704899,40.8159444352562,40.8158919863863,40.8158890901495,40.8161601173919,40.8164840311364,40.8165646142208,40.8165642905474,40.8165602669805,40.8165336938753,40.8162140785768,40.8160219197875,40.8160085742045,40.8159756145133,40.8156838402077,40.8156992312724,40.8157303151882,40.8157020306495,40.8156644493896,40.8156876022544,40.8156685582435,40.8155949914608,40.8153801236381,40.8150334249116,40.814840551022,40.8147881420237,40.8147607373439,40.814735532754,40.8146865740627,40.8146235475352,40.8145914039101,40.8145402448562,40.8144985372486,40.8144740590785,40.81441614019,40.8144006137408,40.8143410760255,40.8143005801677,40.8142385860016,40.8141314609623,40.8137978718246,40.8137727335653,40.8137444091473,40.8137137287737,40.8136815917004,40.8136489398786,40.8136167303457,40.8135859071741,40.813573790725,40.8135599421941,40.8135447782741,40.8135287552368,40.8135123552036,40.8134960716395,40.8134741629448,40.8134506698564,40.8134261785838,40.8134013002431,40.8133766556082,40.8133528596205,40.8132268615705,40.8131302303405,40.8128447709236,40.8126290472348,40.8126078750539,40.8125858002922,40.8125633584899,40.8125410940912,40.8125195472358,40.8124992406554,40.8124496558412,40.8123994322958,40.8123492983373,40.8122999809827,40.8122521954059,40.812206634566,40.812163959159,40.8121247880367,40.8120896892332,40.8120591717274,40.8120336780628,40.8121229413498,40.8121152311171,40.8121041246491,40.8120898792586,40.8120728249806,40.8120533569254,40.8120319261249,40.8120220089944,40.8120118366179,40.8121227170506,40.8120720268032,40.8121104978812,40.8118903765523,40.8115913378643,40.8115397861965,40.8112402847783,40.8108686021019,40.8105418613528,40.810283833341,40.810037058959,40.810024850878,40.8100189493632,40.8100195112967,40.8100265217405,40.8100380942453,40.8100499010858,40.8100616445301,40.8100730284448,40.8100837657624,40.8100935857209,40.8101022406908,40.8106062790887,40.8107108448949,40.8105877656151,40.8107133996473,40.8107070763315,40.8105761778899,40.8104793397404,40.8101417179631,40.8097109540783,40.8095870755297,40.8083433211442,40.8074511678729,40.8074237879761,40.8073920627061,40.8068490055795,40.8068781140536,40.8068829123862,40.8068941924772,40.806911732051,40.8069351854877,40.8069640906339,40.8069978779083,40.8070358815256,40.8070543157568,40.8070752789894,40.807098210666,40.8071224975925,40.8071474903347,40.8071725205841,40.8071953897026,40.8072171692046,40.8072373486961,40.8072554552784,40.8072710646301,40.8072853203337,40.8072954429687,40.8073190795225,40.8073465980933,40.8073775910328,40.8074115992244,40.8074274216148,40.8074425956845,40.8074567108494,40.8074693851775,40.807480275723,40.807489087806,40.8074955829865,40.8074995855156,40.8075009870915,40.8074997497899,40.8074506998063,40.8074078238025,40.8073712635504,40.807341139938,40.8072509773587,40.8071590109762,40.8070655834351,40.8069710428221,40.8068757413699,40.8067800341439,40.8066842777203,40.8065888288566,40.8063266499108,40.8060191970246,40.8057715598858,40.8055227277362,40.8054089418345,40.8050799885924,40.8048171036888,40.8045580112917,40.8044857925821,40.804263031702,40.8041434235867,40.8041219178608,40.8041269678207,40.8041273773242,40.8041231435926,40.8041142953532,40.8041008926437,40.8040510583248,40.8039963643149,40.8040404661378,40.8040795759917,40.8041135667842,40.8041423280579,40.804167128081,40.8041857857219,40.80419823206,40.8042044211188,40.8042043300363,40.8042612003149,40.8043721457288,40.8043866514668,40.8044435154771,40.8046379521653,40.8048268612968,40.8050032186842,40.8053572350723,40.8054851867337,40.805609295079,40.8057293551148,40.805844511252,40.8059552816148,40.8060614853423,40.8061629490292,40.8061687212022,40.805921031867,40.8059968776751,40.8059685904618,40.8061044354875,40.8062772027666,40.8062922737885,40.806345377719,40.8063939866826,40.8067122300219,40.8071771927658,40.8083972111247,40.8087788783898,40.808872707534,40.8089123372251,40.8089515356728,40.808986353888,40.8090165729481,40.8090420028478,40.8090624836941,40.8090778867113,40.8091118611804,40.8091427926307,40.8091549518941,40.8091472490841,40.8091201233998,40.8090750624953,40.8089851228489,40.8089105071559,40.8088421360212,40.8088078595418,40.8087571704779,40.8087163000579,40.8086534153162,40.8086062295024,40.8085852689899,40.8085659209942,40.8085487204978,40.808534143103,40.8085225918817,40.8085143862309,40.8085097530403,40.8085088204199,40.8085116141569,40.8085180570034,40.8085279708117,40.8085794891058,40.8086344052663,40.8086920344774,40.8087516580889,40.8088236458408,40.8089702722828,40.8091121622118,40.8092257987875,40.8093360042858,40.809442695707,40.8094176984862,40.8094077234533,40.8093649724374,40.8093969343631,40.8094386891333,40.8094297005033,40.8094556023107,40.8095578710005,40.8096419044449,40.8097232546052,40.8098018775786,40.8098873321457,40.8099691958211,40.8100474122607,40.8103122126175,40.8106616764538,40.8108152404901,40.8109661878989,40.8111193078891,40.81126928329,40.8114237040177,40.8115742469754,40.8116821206359,40.8117877298143,40.8118910021972,40.8120283550428,40.8121610272716,40.8122888489003,40.8124116561599,40.8125292917049,40.8126416048153,40.8127484515895,40.8128411909253,40.8129291522618,40.812946958901,40.812968335664,40.8129879738392,40.8129994808748,40.8129920887225,40.8129805570245,40.8129649414339,40.8129388246036,40.8127643665376,40.812770951355,40.8127931924938,40.8128145301523,40.8128343934565,40.8128522509774,40.8128676249486,40.8128801040495,40.8128893544095,40.8128951285409,40.8128972719603,40.8128883742969,40.8128827594048,40.8128805622888,40.8128818357763,40.8128958720467,40.8129140065973,40.8129357527484,40.8129605268949,40.8129790714999,40.8129932908748,40.8130146750392,40.813030756249,40.813039699335,40.8130509559756,40.8130540019141,40.8130577057379,40.8130569246693,40.8130560425622,40.813043718613,40.813006586017,40.8129747482139,40.8129446806377,40.8129394000403,40.8129536040153,40.8129731070951,40.8130120866376,40.8130298307173,40.8130458544624,40.8130601381716,40.8130673664884,40.813076373891,40.8130853653769,40.8130925560747,40.8131121424491,40.8131281886618,40.8131442109382,40.8131478847457,40.8131586311684,40.8131959163186,40.8132367443258,40.8132704887755,40.8133007001188,40.8133310542431,40.8133684493168,40.8133925184545,40.8133593660002,40.8133299724045,40.8133263420857,40.8133644141753,40.8133853496017,40.8135514672659,40.8135335632743,40.8135208922586,40.8135175035543,40.8135121288593,40.8135124203941,40.8135183757157,40.8129631022567,40.8129594191175,40.812936401406,40.8129382810731,40.8129153202794,40.8129064691428,40.8129082876045,40.8129224535083,40.8129455037803,40.8129474240682,40.8129668972387,40.812964931467,40.8135185418412,40.8135193186139,40.813519355824,40.8135408426881,40.813540895802,40.8135411007414,40.8135221323178,40.8135047209933,40.8135120397435,40.8135718498211,40.8137670553639,40.8138474759768,40.8138532323814,40.8138004399708,40.8137084982738,40.8136884287824,40.8136078326478,40.8135779082896,40.8135743438044,40.8133757200373,40.8133757470258,40.8135707362507,40.8135585832261,40.8135481935175,40.8135483876616,40.8135537845511,40.8135469026047,40.8135446801007,40.8134005219836,40.8133955560866,40.8133557288553,40.8133527255106,40.8132979642329,40.8132990241464,40.8133567708153,40.8133567521913,40.8133975745169,40.8134015694831,40.8135410900311,40.8135329678563,40.8135170953093,40.8134923116245,40.8134693061903,40.813467586756,40.8134729492281,40.8134871917177,40.8134599005902,40.8134505531773,40.8134260883509,40.8133838952792,40.8133293867348,40.8132730751332,40.8132395753338,40.8132184813111,40.8132062764647,40.8131799331559,40.8131375818902,40.8130921735026,40.813044739123,40.8129730847231,40.8128640696654,40.8128440145098,40.8129716116266,40.8130187663386,40.8130176550769,40.8128364491956,40.8128452313994,40.8127743563026,40.8127567440771,40.8127071415866,40.812710652676,40.8124484524933,40.8124537126645,40.812430677574,40.8122035919649,40.8122266305742,40.8124396521949,40.8126380725052,40.8124497568669,40.8124674711615,40.8126575778362,40.8127018673558,40.8127496928607,40.8127426943752,40.8128082378218,40.8128258857005,40.8130194471107,40.8129980893294,40.8129858851077,40.8129771827763,40.8129649024274,40.8129525870685,40.8129314338298,40.8129049062044,40.8129013376407,40.8128854185827,40.8128800822751,40.8128712135753,40.8128588211443,40.8128499808456,40.8128500133603,40.8128482761436,40.8128518709423,40.8128589981261,40.812874984831,40.8128729524781,40.8128413933204,40.8128184779669,40.8127086398482,40.8127015873064,40.8128473212355,40.8128311216825,40.8127683274551,40.8127533578075,40.8126736313549,40.8126648342725,40.8127685360242,40.8127502341697,40.8127008801465,40.8126282712121,40.8126230146218,40.8126797408117,40.8126614997876,40.8123663390302,40.8123540052765,40.8125400351874,40.8125488575915,40.8126582150786,40.8125760073161,40.8125053294507,40.8124901733994,40.8124790553275,40.8124579339138,40.8124474525252,40.8124210628595,40.8124052267668,40.812380568735,40.8123558854955,40.812324106032,40.8123098650246,40.8122940267629,40.8122550885511,40.8122249938394,40.8122019774767,40.8121913737791,40.8121949495702,40.8122233126174,40.8122764736169,40.8122764871149,40.8122765698735,40.8122607912178,40.8122363784849,40.8122220773254,40.8121692615262,40.8121199286983,40.8120634946292,40.8119869546763,40.8119363517581,40.811895675677,40.8118177738361,40.8117699950674,40.81173996415,40.8116993589087,40.8117012171804,40.8117189590821,40.8117543990484,40.8118075278016,40.811846536865,40.8118572615194,40.8118432196167,40.8118299178868,40.8114392816,40.8114322315438,40.811510197086,40.8115368248172,40.8115722123593,40.8118233133875,40.8117956281417,40.8117613402401,40.8113367907272,40.8113403166978,40.8112729838282,40.8112606491835,40.8113191379726,40.8113261939565,40.8117523478985,40.8116986420627,40.8116593304234,40.8112239161375,40.8112097892963,40.8116491334094,40.8116121853569,40.8115922904135,40.811162261086,40.8111675532923,40.8110382160453,40.8110276439238,40.8115847437304,40.8115662654087,40.8115518285534,40.8112404367688,40.8112263174021,40.8111678459978,40.8111713626193,40.8110278591263,40.8110155242807,40.8111537336799,40.8111607904275,40.8112174874036,40.8112121975226,40.8113273588151,40.8113414852495,40.8115337045204,40.8114865013967,40.8112159102333,40.8112053356398,40.8114744484351,40.811462884125,40.8114473319383,40.8114281372671,40.8114057263972,40.8113054095454,40.8112962765294,40.8112889258953,40.8112835237924,40.8112801923267,40.8112790068006,40.8112841217064,40.8113192703292,40.8113493955589,40.811385233907,40.8114141142902,40.8114359694065,40.8114507483253,40.8114584166063,40.8114589563796,40.8114523663871,40.8114386619862,40.8114178751131,40.811390054209,40.8113552641069,40.8113135858805,40.811265116655,40.8112099693812,40.8111482725716,40.811080170001,40.8110058203716,40.8109253969426,40.8108390871268,40.8107470920531,40.8106496260982,40.810528938705,40.8104037613082,40.8102742608384,40.8101406099904,40.8100029869926,40.8098615753694,40.8097165636963,40.8095681453481,40.8094165182413,40.80926188457,40.8082659233093,40.8081597794439,40.8080525687077,40.8079446614799,40.8078364305442,40.8077282498008,40.8076204929745,40.8075135323241,40.807407737356,40.8073034735479,40.8072011010864,40.8071009736225,40.8070034370504,40.8069088283123,40.8068174742349,40.8067296904001,40.8066457800554,40.8061599985245,40.8051707080598,40.8050324175297,40.8049382559933,40.8049528784565,40.8049425283654,40.804939168418,40.8049428026522,40.8049534267004,40.8049710277946,40.8049955847816,40.8050270681486,40.8050654400585,40.8051106543956,40.8051626568206,40.805221384836,40.8052867678614,40.8053587273178,40.8054371767226,40.8056614484821,40.8058164219051,40.8058743158037,40.8059290937245,40.8059810399039,40.8060380852536,40.8061000562212,40.8061500401486,40.8062026426806,40.8069613283096,40.8069849401814,40.8070113208845,40.8070397746934,40.8070671070544,40.8070949478782,40.8071226769145,40.8071496764024,40.8071753448339,40.8073029062464,40.8074305808342,40.8075579699106,40.8076846756782,40.8078103024713,40.8079344579912,40.8080567545315,40.8081768101888,40.8082942500553,40.8084087073902,40.8084912199821,40.8085951332,40.8086504532387,40.8087053104503,40.8088627700959,40.8089667117372,40.8090769422768,40.8092092301818,40.8093163419756,40.8095147199491,40.8096124365519,40.8097416124363,40.8099526183905,40.8101101006032,40.8102360714232,40.8103747171239,40.8105447943157,40.8106991286075,40.8108534805873,40.8110109858327,40.8111117388657,40.8112660681413,40.8113448724323,40.8114430367828,40.8115716300107,40.8116975206709,40.81183597548,40.8120310618903,40.8121758637284,40.8123112460024,40.812402604631,40.8124792996581,40.8125411282369,40.8126343013684,40.8126638080246,40.8127550060602,40.8128556498011,40.8129500511192,40.8130350524424,40.8130497045963,40.8131357886404,40.8132804750239,40.8134131183095,40.8134502463801,40.8136200231777,40.81368913852,40.8137580040519,40.8137771713074,40.8137899234,40.8138619655196,40.8139216450807,40.8140097175493,40.814081763339,40.8141167600929,40.8142174560654,40.8143275235468,40.8144912486081,40.81518345495,40.8153818438254,40.8156052710738,40.8158191827248,40.8159882326769,40.8160313374992,40.816076525791,40.8161235066449,40.8161766055025,40.8162310788486,40.8162865069168,40.8163424625822,40.8163985146537,40.8164060715028,40.8164513605438,40.8164961097912,40.8165393847485,40.8165802817048,40.8166179466076,40.8166515928979,40.8166805179367,40.8167041176784,40.8168221409532,40.8169423397514,40.8170644673477,40.8171882730564,40.8175489087042,40.8176104723109,40.8176731050248,40.8177361561244,40.8177989705394,40.8178608956568,40.8179212881013,40.8179795204194,40.8180349875991,40.8180871133557,40.8181353561195,40.8181792146624,40.8188883571268,40.8190012101071,40.8195285886899,40.8195913810168,40.8197419356444,40.8198024323417,40.8199840013983,40.8201645927034,40.8204051183965,40.820699606823,40.8211324030374,40.8213289340311,40.8215240950677,40.8219501710322,40.8220397225826,40.8221404898561,40.8222152608711,40.8222349762659,40.8222528489576,40.8223213405709,40.8223370300329,40.8223804336632,40.822401620602,40.8225050420869,40.8225891131399,40.8226887481459,40.8227698097295,40.8228758034271,40.8228835644896,40.8229228465581,40.823016322346,40.8230381591519,40.8230786319201,40.8231626178869,40.8232187173854,40.8232653550835,40.8234274536935,40.8236859704763,40.8238051008793,40.8238634265191,40.8239642273544,40.8241104930367,40.8241380354028,40.8241614520519,40.8241803329648,40.8241836013874,40.8241921961871,40.824205904858,40.8242266695428,40.8242526710245,40.8242831192806,40.8243170891774,40.8243450009413,40.8243734129749,40.8244018398261,40.8247619780237,40.8254760946314,40.8258194209672,40.8261533267488,40.8263491677074,40.8267647352185,40.826964271825,40.8273756732199,40.8278113306656,40.8278851256926,40.827978219593,40.8281232744532,40.8283418879439,40.8283717137366,40.8284036174035,40.8286053318715,40.8286466049828,40.8286998075322,40.8287994687215,40.8289229809969,40.8290739624537,40.8298306912489,40.830629758639,40.8307131765345,40.831748524329,40.8317798636101,40.8322040233211,40.8329833802886,40.8331561187525,40.8333824553581,40.8336011542336,40.8336906678483,40.8338102233676,40.8339581193035,40.834109208661,40.8342823629375,40.8344271980852,40.8345877171315,40.8347198898131,40.8348741204419,40.8350063157579,40.835141687594,40.8352928110848,40.8354438945845,40.8355823498828,40.8357240332211,40.8359179554766,40.8365693466569,40.8367410407608,40.8371074159251,40.8372048854776,40.8373924726175,40.8375925458493,40.8378315863306,40.8380422446326,40.8382477116205,40.838277569568,40.8384598456551,40.8387136280578,40.8388017847159,40.8387984858257,40.8395654059862,40.839524313945,40.8392062733977,40.8391368391273,40.8390660652862,40.8390041534653,40.8389439973403,40.8388521182089,40.8388575921478,40.8389443535297,40.838947871008,40.8388380904559,40.8388274554114,40.8387520405934,40.8386284294053,40.8386141774201,40.8382865171442,40.8382519754739,40.8379024965773,40.8378206632593,40.8378217494323,40.8379049577982,40.8379049383802,40.8376871787613,40.8376889755464,40.8377881114949,40.8377827964741,40.8375838970902,40.8372232771488,40.8369911338249,40.8368852765531,40.836766008228,40.8366782868412,40.8364196971759,40.8361162414639,40.8361319708445,40.8362963056924,40.8362962783705,40.8361339222842,40.8361358768608,40.8361049996907,40.8361049851119,40.8361318706336,40.8361308566494,40.8360671137589,40.8360671319843,40.836077092895,40.8360544000702,40.8360165548862,40.8360313440876,40.8360173983144,40.8360026145801,40.8359587953394,40.8359646412493,40.8359536882233,40.8359438543126,40.8358900773018,40.8358999640414,40.8358880134337,40.8358741448051,40.8358113983537,40.8358291159918,40.8360631817476,40.8360631598801,40.8357080506846,40.8356707186986,40.8356677526273,40.8356997123697,40.8358022359378,40.8357884894034,40.8357446676904,40.8357574336883,40.8357434897363,40.8357257515555,40.8356759448331,40.8356897569619,40.8356758100161,40.8356590141047,40.835643079786,40.8356192074919,40.8356616669108,40.8353741424097,40.8352304476122,40.8350927078166,40.8349364829275,40.8345244953327,40.8344088709594,40.8343554874818,40.8342010523503,40.8347777470676,40.8356253025498,40.8363474952993,40.837010527112,40.8377842871409,40.8387800833759,40.8398513043708,40.8401215059892,40.8407354577473,40.8410469607221,40.8420726882375,40.8424701551548,40.842586993994,40.8426476329337,40.8427151219017,40.8427530068867,40.8427894898016,40.8428516281634,40.8429185710571,40.8430072249536,40.8430679986521,40.8431141511437,40.8432905480027,40.8435616107094,40.8444902173025,40.8449802319183,40.845427460749,40.844682548627,40.8441186282067,40.8435418059451,40.8429055404799,40.842269861547,40.8415280888383,40.8409560956207,40.8408847769986,40.8406509118619,40.8406014543219,40.8408829734818,40.8407670341695,40.8406992201194,40.8406768141352,40.8413020528784,40.842151349938,40.8426071071379,40.8427328434843,40.8428859100594,40.8435067888786,40.844384276379,40.8445926998885,40.8453928184807,40.8460573696679,40.8463833341949,40.8471493727829,40.8486406080874,40.8497088799812,40.8510417585734,40.8517962820193,40.8522468310337,40.8524757490562,40.8526408613189,40.8530195775613,40.8533159222454,40.8539362903303,40.8542471796318,40.8544323368314,40.8551302438827,40.8552611656522,40.8554879389928,40.8556058608904,40.8558730803709,40.8559902301674,40.8559906251353,40.8559921708826,40.8560358452586,40.8560795397618,40.8561323835244,40.8563522109563,40.8565436911331,40.8566935170366,40.8573499624236,40.8575243296239,40.8579945871445,40.8581903960537,40.8593597642993,40.8604133281048,40.8607890375821,40.8608920266758,40.8609038698644,40.8611821133886,40.8612271091474,40.8613845716451,40.8617613254983,40.8622117418838,40.8630367900041,40.8643439533508,40.8647407429326,40.8648106024352,40.8651255536883,40.8653235771756,40.8666481952854,40.8669358338153,40.8684260369843,40.8684823183037,40.8685506930474,40.8704765616004,40.8707684549124,40.8713294335771,40.8720367426448,40.8724304768407,40.8734091394891,40.8742929038762,40.8748791439921,40.875411132268,40.8754714980099,40.8760664072996,40.8765812624481,40.8770231113922,40.8775334518224,40.8775791132627,40.8786128478041,40.8786278015641,40.8789664522598,40.8790318042002,40.8796601253787,40.8800163223535,40.8802258949943,40.8803794149563,40.8804198135102,40.8807976077879,40.880930553889,40.8812152776197,40.881619729846,40.8817471016816,40.8819295991919,40.8823853055582,40.8827009750743,40.8837176435616,40.8838761888749,40.8839036166287,40.883930135035,40.8842067212603,40.8845091937673,40.8846426685227,40.8847049139799,40.884869952143,40.8849337282989,40.8850934469743,40.8851910718095,40.8853992724078,40.8854504751546,40.8855507003278,40.8856692545738,40.8856040216303,40.8848592758615,40.8841495338816,40.8835628208178,40.8834537127159,40.8833818206694,40.8832619860428,40.8831525549056,40.8830361742374,40.8828307495686,40.8827040270491,40.8826354979275,40.8825805530889,40.8824912780185,40.8824295941551,40.882364569646,40.8823098922932,40.8822311483099,40.8821420355082]},{"lng":[-73.8188357467381,-73.8187919449959,-73.818716624615,-73.8186477487054,-73.8185632555056,-73.8183930924158,-73.8182346833081,-73.8181321249584,-73.8181166690972,-73.8180311751456,-73.8179964051348,-73.818029630232,-73.8179237069072,-73.8179329780278,-73.8180113542336,-73.8181619714754,-73.8183186903982,-73.8184348042732,-73.8185728423115,-73.8186074508073,-73.8186639487429,-73.8186894001654,-73.8187367812091,-73.8187933308779,-73.8188155977266,-73.8188190807707,-73.8188600682899,-73.818850743698,-73.81887599359,-73.8188510357522,-73.8188699890384,-73.8188587594598,-73.8188357467381],"lat":[40.8652459008096,40.8651957976618,40.8651956793502,40.8651336248343,40.8652028885557,40.8652976205068,40.8654722311137,40.8654735192576,40.8655689704722,40.8656639643111,40.8657544467928,40.8659029920503,40.8659425527805,40.8659949841209,40.8660260806489,40.866035848841,40.8661099550676,40.8661125196808,40.8661317976088,40.8661008786313,40.8660985855872,40.8659723495114,40.8658604444879,40.8658390894841,40.8657295268301,40.8656032578957,40.8655342277468,40.8655008571999,40.8654484807931,40.8653936430513,40.8653484038081,40.8652758974854,40.8652459008096]}]],[[{"lng":[-73.7751378266796,-73.7751674217127,-73.7751908085067,-73.7752123382729,-73.7752320656786,-73.7752508850565,-73.7752652143695,-73.7752795482925,-73.7752929795513,-73.7753019160418,-73.7753054544282,-73.7753054060717,-73.7753044389242,-73.7753052886273,-73.7753052241461,-73.7753051711828,-73.77530333427,-73.7752952099559,-73.7752915679307,-73.7752771194794,-73.7752770457767,-73.7752734023249,-73.7752527300499,-73.7752311396364,-73.7752248196541,-73.7751978380109,-73.7751869940298,-73.7751752559245,-73.7751626289671,-73.7751572084514,-73.7751526643728,-73.7751386273333,-73.774931889674,-73.774929289754,-73.7749284592463,-73.774929428154,-73.7749285884248,-73.7749286230222,-73.7749268524924,-73.7749205839735,-73.7749179068178,-73.7749179483429,-73.7749278474396,-73.7749287867995,-73.7749350968337,-73.7749432115575,-73.7749594075993,-73.7749720152424,-73.7749854888788,-73.7750043844666,-73.7750133716439,-73.7750232661086,-73.7750394413777,-73.7750547316535,-73.7750610223432,-73.7750709615798,-73.7750817815331,-73.7751000777738,-73.7751043612942,-73.7751071170383,-73.7751080771104,-73.7751153236846,-73.7751225539018,-73.7751378266796],"lat":[40.8611846758508,40.8611762683864,40.8611806895073,40.8611855028639,40.8611923569967,40.8612026176263,40.8612128690046,40.8612217574176,40.8612320082159,40.8612442938805,40.861259977971,40.8612742904286,40.8612947371537,40.8613090513602,40.861328136368,40.8613438122916,40.8613560781473,40.8613690124068,40.8613840001892,40.8614091903908,40.8614310019954,40.8614466709255,40.8614534463599,40.8614663548859,40.8614772478615,40.8614915090183,40.8615126171461,40.8615323605582,40.8615493756218,40.861559588525,40.8615759381873,40.8615942811407,40.8615523028641,40.8615257466328,40.8615059792312,40.8614848518646,40.8614678093848,40.8614575864884,40.8614500856807,40.8614453020434,40.8614405259145,40.8614282565625,40.8614214596705,40.8614091932426,40.8614017087,40.8613914998895,40.8613806261923,40.861369064343,40.8613670458264,40.861354131421,40.8613514235036,40.8613459895669,40.8613412496968,40.8613331008352,40.8613310683056,40.861312003219,40.8612983924086,40.861283784495,40.8612582220322,40.8612398252639,40.8612214233203,40.8612023534836,40.8611880545212,40.8611846758508]}],[{"lng":[-73.7746015635093,-73.7745818738489,-73.7745783378966,-73.7745703272304,-73.7745730783146,-73.7745740357912,-73.7745741074101,-73.7745885546017,-73.7745975950086,-73.774610249902,-73.7746247132312,-73.7746247963846,-73.7746338367722,-73.7746554235571,-73.774668310426,-73.7746895833706,-73.7747147252436,-73.7747398742583,-73.7747565753941,-73.7747736506934,-73.7747906456468,-73.7748071078835,-73.7748225992124,-73.7748367072857,-73.7748490565748,-73.774859318366,-73.7748672195099,-73.7748725496928,-73.7748670959213,-73.7748661403912,-73.7748768599432,-73.7748768022625,-73.774875871895,-73.774868598364,-73.7748613677863,-73.7748568162458,-73.7748370177684,-73.7748091371018,-73.774785745786,-73.7747704345425,-73.7747488507719,-73.7747254931765,-73.7747084242581,-73.7746796809878,-73.774662623614,-73.7746446734507,-73.7746258194959,-73.7746015635093],"lat":[40.8620690474598,40.8620498932058,40.8620335289538,40.8620130651991,40.8619960309065,40.8619783112882,40.8619571826756,40.8619326732098,40.8619142882308,40.8618890934396,40.8618598137646,40.8618352767379,40.8618168905831,40.8618046649885,40.8617971520949,40.8617917811164,40.8617904665674,40.8617871084058,40.8617843236464,40.8617836377323,40.8617850689212,40.8617885791177,40.8617940748875,40.8618014099447,40.8618103890448,40.8618207731825,40.8618322859529,40.8618446209093,40.8618643765507,40.8618814143542,40.8618971119656,40.8619141515209,40.86192369135,40.861950941464,40.8619652410783,40.8619836348369,40.861997909925,40.8620121685656,40.8620271177837,40.8620414009489,40.8620522641007,40.8620569899069,40.8620603650155,40.8620643984751,40.8620643651633,40.862062967133,40.8620629303068,40.8620690474598]}],[{"lng":[-73.8203671786964,-73.8204316052324,-73.8204720313919,-73.8204644195865,-73.8203524329082,-73.8202164306561,-73.820064135302,-73.8199760536281,-73.8199922794837,-73.8200805926542,-73.8202090330985,-73.8203615915905,-73.82052210579,-73.8206743676083,-73.8207463886159,-73.8208504007906,-73.8209385653091,-73.8210027950278,-73.8210109325885,-73.8209710986057,-73.8209713609405,-73.8210117522057,-73.8209878810678,-73.8209319865486,-73.8209402707989,-73.8209885368425,-73.8211089048712,-73.8212371325298,-73.8213815513288,-73.8214456488136,-73.8213972857994,-73.8213970568015,-73.8213968605195,-73.8214446022487,-73.8215405117246,-73.8216205401917,-73.8216924637047,-73.8216894717082,-73.8216112750702,-73.8215869467944,-73.8216590187428,-73.8218195509981,-73.8219401161444,-73.822012580825,-73.8221491092094,-73.822293465801,-73.8223143428656,-73.8224138835691,-73.8225343506467,-73.8227190959282,-73.8227754156684,-73.8226392122034,-73.8224626857813,-73.8223502732815,-73.8221736320141,-73.8219731193582,-73.8219171902999,-73.8219254745029,-73.8220137870752,-73.822141998094,-73.8222946538731,-73.822407243871,-73.8223512657316,-73.8222388060022,-73.8220141293875,-73.8218135516806,-73.8216852746283,-73.8215973878264,-73.821613676663,-73.8217422153374,-73.8218304938352,-73.8219911380911,-73.8219673963981,-73.8217670333523,-73.8215664744306,-73.821350001623,-73.8211014236926,-73.8205480130711,-73.8204115515322,-73.8202669679571,-73.8202828485718,-73.8203066356453,-73.82023946193,-73.8200668581566,-73.8198933046222,-73.8197192080192,-73.8195449763124,-73.8193710177829,-73.819197740072,-73.8190849168927,-73.8189494825675,-73.8187914776309,-73.818655959713,-73.8185700330994,-73.8184929640527,-73.8184428112822,-73.8184572658376,-73.8184785179755,-73.8185064968899,-73.8185411093534,-73.8185822400276,-73.8185994984742,-73.8186209447384,-73.8186465597711,-73.8186475161255,-73.8186395055248,-73.8186226461335,-73.818597186671,-73.8185635027432,-73.8185220913019,-73.8184735633134,-73.8184186347457,-73.8183581160044,-73.8182928999771,-73.8182239488584,-73.8181522799543,-73.8180789506711,-73.8180050429142,-73.8179141983246,-73.8178246409387,-73.8177371558054,-73.8176525098066,-73.8175714449345,-73.8174946717865,-73.8174228633364,-73.8173566490347,-73.8173017508934,-73.8172458575765,-73.8171902403767,-73.8171361643071,-73.8170848593286,-73.8170374923764,-73.8169951408176,-73.8169587679479,-73.8169292010807,-73.8169071127295,-73.8168930053109,-73.8169000986419,-73.8169101901739,-73.8169029496486,-73.8168913801002,-73.8168757938993,-73.8168566118653,-73.8168343519053,-73.8168096150305,-73.8167830691291,-73.8167554309333,-73.8167274466677,-73.8166998719005,-73.8166734511436,-73.8166488977503,-73.8164139210273,-73.8163290827876,-73.815876382575,-73.8154929370792,-73.8152632141528,-73.8147962975735,-73.814852060241,-73.8138180258673,-73.8127314649504,-73.8123060270842,-73.8164087090802,-73.8165771147144,-73.8168498133837,-73.8169625442986,-73.8169698373241,-73.8169857776309,-73.8170102376815,-73.8170430217888,-73.8170838676825,-73.8171116607959,-73.8171332649234,-73.8171484062352,-73.8171568928222,-73.817158617127,-73.8171306932316,-73.8171263313162,-73.8171309946555,-73.8171397621267,-73.8171582563326,-73.8171719135278,-73.8171945972528,-73.8172082835312,-73.8171903962615,-73.8171318989228,-73.8171084861675,-73.8170823418616,-73.8170237324759,-73.8169695309101,-73.8169289122749,-73.8169154231731,-73.8169380409761,-73.8169742213086,-73.8170148870242,-73.817069078867,-73.8170872495111,-73.8170873908365,-73.8170878688155,-73.8171055524649,-73.8171236853719,-73.8171238643446,-73.8171240904221,-73.817088144567,-73.8170576472243,-73.817011798577,-73.8169668381161,-73.8169173186943,-73.8168587387075,-73.8167820523949,-73.8167008280947,-73.8166061127024,-73.8165069437184,-73.8164123324573,-73.816326632894,-73.8162859590691,-73.816239841506,-73.8162271896867,-73.8161775944023,-73.8161579371529,-73.8161101320142,-73.8160470692778,-73.8159613683239,-73.8159021993007,-73.8158456481149,-73.8157953756309,-73.8157137849451,-73.8156984546636,-73.8156997731384,-73.8157843266855,-73.8158613075976,-73.815884209736,-73.8160356813382,-73.8160396317423,-73.8160102881625,-73.8159544918557,-73.8159652855003,-73.8160553634239,-73.8161947241598,-73.8162717760661,-73.8162861909423,-73.8162490170486,-73.8159407672751,-73.8158096383237,-73.8157326602227,-73.8156716689797,-73.8156527905891,-73.8155203459238,-73.8154404039996,-73.8153669755972,-73.8152827517089,-73.815209651323,-73.8152085562397,-73.8151310282062,-73.8151419191866,-73.8163011915219,-73.8172632266091,-73.8182022683034,-73.8191500914545,-73.8201404361447,-73.8204840561741,-73.8211035563378,-73.8220382684854,-73.8230129698969,-73.8239595539916,-73.8244376041839,-73.8249569766314,-73.8254923666768,-73.8255826701322,-73.8254753845592,-73.8255102231047,-73.8257268144441,-73.8258868041304,-73.825977351434,-73.8262506803238,-73.8264582938819,-73.8265546067396,-73.8267260158735,-73.826979355415,-73.8272024925577,-73.8272548043598,-73.8272856124752,-73.8272945699846,-73.8272815422716,-73.8272573571223,-73.8272466141637,-73.8271898266553,-73.8271115838104,-73.826878543486,-73.8269849071501,-73.827184237589,-73.8271313332546,-73.8267594811613,-73.8269355604507,-73.8270757933538,-73.8273783576626,-73.8272175114404,-73.8272302606017,-73.8280141596088,-73.8286019716532,-73.8290831870588,-73.8294352707923,-73.8295762357272,-73.8298439885255,-73.8299162390975,-73.8299055380277,-73.8299990383079,-73.8272176947334,-73.8271455629839,-73.8270544139317,-73.8268940432236,-73.8261532357178,-73.8255543837113,-73.8247082676358,-73.8241806766833,-73.8236530946869,-73.8235912425256,-73.8226058537854,-73.8224470771928,-73.8221499505797,-73.8218563942255,-73.8215666530952,-73.8212809689737,-73.8209995802638,-73.820722721788,-73.8204506245922,-73.8201835157532,-73.8199216181894,-73.81971890258,-73.8195233299826,-73.8193354978936,-73.8191559672191,-73.8189542559541,-73.8189148782768,-73.8188818473955,-73.8188512599791,-73.8188501222153,-73.8188719643612,-73.8189134807487,-73.8189535430748,-73.8193471316074,-73.8193770926057,-73.8194047988668,-73.8194352851437,-73.8194647167815,-73.8195137193205,-73.819641048894,-73.8197677452616,-73.8198375878216,-73.8199153170096,-73.8200060349526,-73.8200839171549,-73.8201069613836,-73.8201723331693,-73.8202279185338,-73.8202615721456,-73.8203119137807,-73.8203183681717,-73.8203426504073,-73.8203268193787,-73.8203671786964],"lat":[40.86067232952,40.8605810673578,40.86046540253,40.860313118868,40.8601911268287,40.8600508253024,40.8600018611671,40.859940815402,40.8598738403615,40.8598496138276,40.8598193604513,40.8597708713564,40.8597467575474,40.8598079031707,40.8598750144391,40.8599787204244,40.8600093125568,40.8599911390931,40.8599485154786,40.8598449085703,40.8597474555276,40.8596439730865,40.8595708450406,40.8594733048492,40.8593758630774,40.8593272112461,40.8593152157978,40.8593641424459,40.85935827446,40.8593888284448,40.8594740260737,40.8595592982031,40.8596323877372,40.8597786429799,40.8599127900684,40.8599860053333,40.8600896611072,40.8602361413712,40.8604488976177,40.8605463134367,40.8605951515792,40.8605649460132,40.8604798596738,40.8603825168751,40.8603279102076,40.8603464052629,40.8603411570759,40.8603161359052,40.8602675945435,40.8601826065903,40.8601217837507,40.8600545751101,40.8600664857544,40.8601028573039,40.8601574040684,40.8601388217242,40.8600534629379,40.8599560211075,40.859931794267,40.8599868103599,40.8599017731082,40.8597984018664,40.8597313163391,40.8597859598321,40.859803886079,40.8598096681401,40.8597790151909,40.8596448801226,40.8595535416713,40.8594867404811,40.8594746958694,40.8594018528211,40.859279999118,40.8592065987554,40.859206288756,40.8591572275405,40.859114205621,40.8590646194551,40.8590948612279,40.8591616354448,40.8592225695596,40.8593261512252,40.8593566950137,40.8593386213718,40.8593269108669,40.8593215909403,40.8593226740585,40.8593301576833,40.8593440242782,40.8593472727744,40.8593676181441,40.8593913522563,40.8594425311957,40.8595109187575,40.8596409899537,40.8598293476961,40.8599190959414,40.8600080613181,40.8600959473055,40.8601824609793,40.8602673139879,40.8603741483542,40.8604805445552,40.8605864079887,40.8606425154476,40.8606982970383,40.8607529297701,40.8608056076005,40.8608555533274,40.860902030056,40.8609443520715,40.8609818949563,40.8610141048027,40.8610405063861,40.8610607101766,40.8610744180864,40.8610814278681,40.8610816360989,40.861074419047,40.8610607832924,40.8610408483647,40.861014789011,40.860982833664,40.8609452624398,40.8609024046818,40.8608546360736,40.8608464600162,40.8608446449353,40.8608492321151,40.8608601172202,40.8608770526687,40.8608996532637,40.8609274049538,40.8609596765251,40.8609957339579,40.8610347571213,40.861075858427,40.8611081695941,40.8611400178761,40.8611605409157,40.8611798866921,40.8611975328759,40.8612130030255,40.8612258794514,40.8612358144938,40.8612425399091,40.8612458741127,40.8612457270821,40.8612421027868,40.8612350990822,40.8612249050664,40.8611806277039,40.8611527305223,40.8610038646114,40.8609552867371,40.861117747125,40.8611289567468,40.8609009903099,40.8605482791733,40.8588775419478,40.8541620264733,40.8540822551148,40.8538224267019,40.8532846825006,40.8527850131781,40.8527112782989,40.8526383331134,40.8525667611239,40.8524971348465,40.8524300112315,40.8523893942209,40.8523466624337,40.8523023575142,40.8522570410456,40.8522112874319,40.8521500981766,40.8520952734712,40.8520404629044,40.8520184400577,40.8519719833728,40.8519274649749,40.8518829613815,40.8518281657774,40.8517698936113,40.8517115565728,40.8516985698707,40.8516840692761,40.8516668455182,40.8516873157069,40.8516906777865,40.8516735255671,40.8516530052895,40.8516222269324,40.8516017352718,40.8515846897345,40.8515401796732,40.8514887879615,40.8514877045055,40.8514477032408,40.8514168962223,40.8513518012922,40.8512695734448,40.8512146991595,40.8511785968358,40.8510843849699,40.8510260698137,40.8509848777161,40.8509573759987,40.8509504018371,40.8509536981657,40.8509398438512,40.8509054250287,40.8508538825588,40.8508434672182,40.8508673851572,40.8508995741062,40.8509084057416,40.8508946217709,40.8508716293008,40.8508157130727,40.8507779260436,40.8507675109317,40.8507843739506,40.8507954228493,40.8508187044495,40.8508162043475,40.8507971178269,40.8507723367984,40.8507190779966,40.8506927401809,40.850684905462,40.8506026691164,40.8505283245014,40.8504653706749,40.8504388385415,40.8503895256971,40.850386080334,40.8503779398436,40.85031203978,40.850194576449,40.8501251776302,40.8497744294363,40.8496276855442,40.8495384494819,40.8494559092091,40.8493498371258,40.8492278739309,40.8491943960846,40.8491921465082,40.8492392091718,40.8492307629787,40.8492299515817,40.8491725040558,40.8490806127351,40.8485721724036,40.8484265673581,40.8483110319788,40.8481701799873,40.8480205985507,40.8485010256302,40.8481989807793,40.8476903687039,40.8471617388565,40.8466412420541,40.8463778745736,40.846105444802,40.845836846077,40.8458630487035,40.8455583886229,40.845561537337,40.8462074368627,40.8461764414555,40.8461502294325,40.8467524951107,40.8471051994446,40.8472874415574,40.8475391849537,40.848093411579,40.8488259348462,40.8491259836566,40.8494288848257,40.8497332948133,40.8500378392255,40.8502477436293,40.8503421895008,40.8506462456696,40.8509463710299,40.8516699100256,40.8516842794588,40.8517112057939,40.8518710810244,40.8530068192239,40.8530050968406,40.8529458315274,40.8528179596694,40.8532505132979,40.8533507569479,40.8547224869677,40.8557178475947,40.8556760141988,40.8558881400116,40.8559730686949,40.8561343810312,40.8561808182253,40.8562563631214,40.8582111360458,40.8592065770424,40.8592323949348,40.8592611156032,40.8593121731403,40.8595471439454,40.8597370843229,40.859972442754,40.8601451470708,40.8603178483175,40.8603390746449,40.8606772407796,40.8607342845534,40.8608248781052,40.8609219498226,40.8610254187067,40.8611351984206,40.8612511973607,40.8613733187336,40.8615014606367,40.8616355161428,40.8617753733896,40.8618962541785,40.8620240547851,40.862158378145,40.8622988179254,40.8624745616912,40.8624339793278,40.8624110772859,40.8623760709791,40.8623039922328,40.8622455455974,40.8621984430304,40.8621524272365,40.8618275305144,40.8617955851321,40.8617367595871,40.8616506196653,40.8615475087951,40.8614709104734,40.8614289234893,40.8613767536343,40.8613470343226,40.8613000219368,40.8612457404807,40.8612193200368,40.8612115028033,40.8611819438414,40.8611391268643,40.86110390103,40.8610311075692,40.8609219794277,40.8608428357611,40.8607636291263,40.86067232952]}],[{"lng":[-73.7831258952828,-73.7831088609243,-73.7830880239059,-73.7830717154283,-73.7830581418707,-73.7830355109755,-73.7830165411918,-73.7830102575906,-73.7830094011577,-73.7829967246609,-73.7829740825711,-73.7829631851179,-73.7829558947179,-73.7829377562434,-73.7829278353194,-73.7829161867459,-73.7829189744151,-73.7829244568125,-73.7829118672329,-73.7829001470589,-73.7828911822455,-73.7828930636722,-73.7829021856518,-73.7829004366952,-73.782905054142,-73.7828996766157,-73.7828988305571,-73.782899797861,-73.7829061936613,-73.7829053662226,-73.7828963497963,-73.7828818862492,-73.7828819266694,-73.7828819783118,-73.7828974421715,-73.7828983982876,-73.7828957507203,-73.7828903208138,-73.7829091372512,-73.782943021284,-73.7829691084348,-73.7829756669508,-73.7829991749967,-73.783029163588,-73.7830539987515,-73.7830527887598,-73.7830489731726,-73.7830158462157,-73.7830372110121,-73.7830432358342,-73.7830804240189,-73.7830869986449,-73.7830883952701,-73.7831061033422,-73.7831450428814,-73.7831576133541,-73.7831797146049,-73.7831965836379,-73.783195192648,-73.7831885989094,-73.7831898347776,-73.783198894029,-73.7832053621406,-73.7832091601167,-73.7832182097036,-73.7832337945159,-73.7832350562121,-73.7832284861614,-73.7832193204026,-73.7832192332803,-73.7832204668199,-73.7832256265365,-73.7832255845897,-73.7832268204757,-73.7832098087036,-73.7831915287775,-73.7831745376776,-73.7831731649346,-73.7831717806055,-73.783159098423,-73.783159423968,-73.7831337918232,-73.7831206877043,-73.7831428317427,-73.7831605626672,-73.783185859161,-73.7832171384209,-73.7832301489424,-73.7832444170654,-73.78325862991,-73.7832585686134,-73.7832311428397,-73.7832115301558,-73.7832362903425,-73.7832493576422,-73.7832624131362,-73.7832715047434,-73.7832805769958,-73.7832805350593,-73.7832687251413,-73.7832530924722,-73.7832413599762,-73.7832230773977,-73.7832086889733,-73.7831890568956,-73.7831671444581,-73.7831258952828],"lat":[40.8628561672994,40.8628394748925,40.8628394357218,40.8628400929133,40.8628352525978,40.8628297080678,40.8628131651242,40.8627952710025,40.8627801383269,40.8627780516009,40.8627759449567,40.8627841778431,40.8627972328116,40.8628033885188,40.8627896144932,40.8627503888763,40.8627290720543,40.8627146398256,40.8626857285397,40.8626685120344,40.8626396082363,40.862618290882,40.8625990495343,40.8625797889044,40.8625529740503,40.8625350816266,40.8625165093745,40.8624979410369,40.8624814469716,40.8624573732796,40.8624442876315,40.8624346319971,40.862422251242,40.8624064330913,40.8623872041795,40.862371386558,40.8623500601781,40.8623171942281,40.8623177280157,40.8623227410812,40.8623198202957,40.8623079535338,40.862296119823,40.8622961762197,40.8622774145422,40.8622487047533,40.8622190010056,40.8621947276988,40.8621738838808,40.86216800508,40.8621705556905,40.8621537391325,40.862123946848,40.8621066709286,40.8620686789057,40.8620905196322,40.8621103587707,40.8621351378934,40.862161862665,40.8621846175697,40.8622054077279,40.8622262120839,40.8622420622533,40.8622767164523,40.8623004904791,40.862319328136,40.8623321993339,40.8623480245037,40.8623598863813,40.8623866136018,40.8624083929814,40.8624252315929,40.8624381003414,40.8624588899957,40.8624776664096,40.8624855510695,40.8624983879681,40.8625191727206,40.8625439168712,40.8625726861545,40.8625843715366,40.8625982906414,40.8626180636131,40.8626250345127,40.8626252170998,40.8626251153739,40.8626291335667,40.8626380674175,40.8626608615154,40.8627004844242,40.8627192921817,40.8627330992158,40.8627498901114,40.8627538967202,40.8627450120294,40.8627400872374,40.8627509925103,40.8627678379649,40.8627807067125,40.8628034518218,40.8627994630368,40.862798450597,40.8628073261587,40.8628211576808,40.8628438875819,40.8628612170923,40.8628561672994]}],[{"lng":[-73.784012491389,-73.783952321433,-73.783895340275,-73.7838708144073,-73.7838611886511,-73.7838512202789,-73.7838361239698,-73.7838132254464,-73.783795680359,-73.7837787415074,-73.7837563327808,-73.7837174674923,-73.7836988587245,-73.783687633285,-73.7836625672639,-73.783634880841,-73.7836082805867,-73.7835912769802,-73.7835648188609,-73.7835516610279,-73.7835410529966,-73.7835384378993,-73.7835398092882,-73.7835425231161,-73.7835439107406,-73.7835639493299,-73.783586592922,-73.7836172020301,-73.7836464781436,-73.7836864419092,-73.7837077989767,-73.7837185262937,-73.7837425675275,-73.7837731785961,-73.7838011734367,-73.7837985878665,-73.783777332747,-73.7837640541046,-73.7837507750274,-73.7837202166093,-73.7836962773421,-73.783676336177,-73.7836724235964,-73.7836804838153,-73.783687224624,-73.7836952841707,-73.7837113019703,-73.7837219987663,-73.7837274177446,-73.7837275065253,-73.7837368887363,-73.7837569170728,-73.7837582949926,-73.7837677034899,-73.7837930764634,-73.7838264109627,-73.7838597152168,-73.7838876912407,-73.7838957415019,-73.783894508841,-73.783914534695,-73.7839398320315,-73.7839717754583,-73.7839891241565,-73.7840131651343,-73.7840331476036,-73.7840757656106,-73.7841036969555,-73.784130305168,-73.7841609042523,-73.7841848303381,-73.7842087695524,-73.7842327448609,-73.7842594023036,-73.7843073332376,-73.7843286100172,-73.7843592178853,-73.784404461453,-73.7844417388422,-73.7844710187814,-73.784497661156,-73.7845269959102,-73.7845523718974,-73.784589680706,-73.7846322817113,-73.7846602426389,-73.7846916585071,-73.7846947667645,-73.7846800522657,-73.7846719734112,-73.784651967343,-73.7846413363095,-73.7846306682255,-73.7846027077061,-73.7845773613974,-73.7845466748544,-73.7845439293976,-73.7845398085793,-73.7845396972058,-73.7845465001319,-73.7845608751644,-73.7845674494815,-73.7845673217425,-73.7845525505725,-73.7845297956564,-73.7845163821167,-73.784495012141,-73.7844722864358,-73.7844482486984,-73.7844162263221,-73.7843935591263,-73.7843581180463,-73.7843295477526,-73.7843030179931,-73.7842937482678,-73.7842724711161,-73.7842537845359,-73.7842244086146,-73.7841910647684,-73.7841670236383,-73.7841682767855,-73.7842068207534,-73.784254702922,-73.7842759656718,-73.7842878476008,-73.7842865050007,-73.7842698189831,-73.7842566494319,-73.7842374796012,-73.7842145889189,-73.7841847875146,-73.7841643404756,-73.7841427690034,-73.7841098076781,-73.7840858928125,-73.7840444168663,-73.784012491389],"lat":[40.8631319940744,40.8631302648224,40.8631301581139,40.8631394112414,40.8631515215817,40.8631560052715,40.8631627948643,40.8631627519626,40.8631538245916,40.8631459599507,40.8631355577955,40.8631326546389,40.8631348890298,40.8631362376582,40.8631479154702,40.8631462452782,40.8631381100367,40.8631267584113,40.8631163129413,40.8631096817994,40.8630955063249,40.8630803346724,40.8630682051881,40.8630530435328,40.8630358577149,40.8630166845397,40.8630157158405,40.8630228512861,40.8630299837215,40.8630270246314,40.8630118990948,40.8629896744183,40.862968487543,40.8629746112761,40.8629665745245,40.8629423037225,40.862926086644,40.862913929032,40.8629017709151,40.8628794688528,40.862869313594,40.8628581546538,40.8628328696856,40.8628116516863,40.8627863878638,40.8627651698621,40.8627540778314,40.8627409534799,40.86271265366,40.8626853538485,40.8626671718398,40.8626510326306,40.8626368796377,40.8626106084644,40.8625894235706,40.8625773533014,40.8625743816744,40.8625714012307,40.862553216714,40.8625228815798,40.8625077528406,40.8625098225593,40.8625159487355,40.8625048596603,40.8624836710516,40.8624816861111,40.8624817658743,40.8624929408701,40.8625010786939,40.8625112474946,40.8625254466524,40.8625356029832,40.862534636648,40.862527608959,40.86253174259,40.8625418939186,40.8625490286633,40.8625602352702,40.8625643489381,40.8625704699998,40.8625684974193,40.8625574301471,40.8625352339199,40.8625292372154,40.8625343719329,40.8625364464654,40.8625427899082,40.8625678548908,40.862588048701,40.8626153336019,40.8626243954751,40.8626228622248,40.8626213228735,40.8626192478321,40.8626323454174,40.8626494760393,40.8626747485454,40.862713162383,40.8627475385155,40.8627737648055,40.8627880224399,40.862814322347,40.8628537548124,40.8628911375909,40.8629264831137,40.8629557792118,40.8629749505679,40.8630011964207,40.8630213727844,40.8630395125501,40.8630475589037,40.8630735179608,40.8630737275733,40.8630413233169,40.8630251292417,40.8630149785771,40.8630280868669,40.8630512878917,40.8630663916069,40.863087579748,40.8631118480484,40.8631361860977,40.863155485734,40.8631696810634,40.8631853305461,40.8632050887806,40.8632140174143,40.863216140275,40.8632161044294,40.8632132313115,40.8632071113883,40.8631994000598,40.8631912649673,40.8631742229425,40.8631592195115,40.8631401403623,40.8631319940744]}],[{"lng":[-73.7696354462226,-73.7699407693014,-73.7697769281753,-73.769447747668,-73.7696354462226],"lat":[40.8655425615823,40.8655234099992,40.8656865584024,40.865761350906,40.8655425615823]}],[{"lng":[-73.8185632555056,-73.8186477487054,-73.818716624615,-73.8187919449959,-73.8188357467381,-73.8188587594598,-73.8188699890384,-73.8188510357522,-73.81887599359,-73.818850743698,-73.8188600682899,-73.8188190807707,-73.8188155977266,-73.8187933308779,-73.8187367812091,-73.8186894001654,-73.8186639487429,-73.8186074508073,-73.8185728423115,-73.8184348042732,-73.8183186903982,-73.8181619714754,-73.8180113542336,-73.8179329780278,-73.8179237069072,-73.818029630232,-73.8179964051348,-73.8180311751456,-73.8181166690972,-73.8181321249584,-73.8182346833081,-73.8183930924158,-73.8185632555056],"lat":[40.8652028885557,40.8651336248343,40.8651956793502,40.8651957976618,40.8652459008096,40.8652758974854,40.8653484038081,40.8653936430513,40.8654484807931,40.8655008571999,40.8655342277468,40.8656032578957,40.8657295268301,40.8658390894841,40.8658604444879,40.8659723495114,40.8660985855872,40.8661008786313,40.8661317976088,40.8661125196808,40.8661099550676,40.866035848841,40.8660260806489,40.8659949841209,40.8659425527805,40.8659029920503,40.8657544467928,40.8656639643111,40.8655689704722,40.8654735192576,40.8654722311137,40.8652976205068,40.8652028885557]}],[{"lng":[-73.7669204662503,-73.7672284592154,-73.7671238058439,-73.7666809894407,-73.7669204662503],"lat":[40.8670495558513,40.8669286678911,40.867238188474,40.86732068414,40.8670495558513]}],[{"lng":[-73.7717176241043,-73.7722356472154,-73.7726348815417,-73.77157057964,-73.7711580678453,-73.7708486453095,-73.7717176241043],"lat":[40.8716211890253,40.8715639930681,40.871880208767,40.8718579498094,40.871804980973,40.8716277634744,40.8716211890253]}],[{"lng":[-73.7748304259469,-73.7749394101601,-73.7750498056392,-73.7750986232066,-73.7750888996918,-73.7750590679846,-73.7751183627788,-73.7751368996219,-73.7747807296371,-73.7746737974314,-73.7746437140013,-73.7747046261216,-73.7745143082242,-73.7745443691994,-73.7747546648108,-73.7748304259469],"lat":[40.8740287364363,40.8739186855422,40.8739377185108,40.8740287834937,40.8741656806505,40.8743082256902,40.8743883438338,40.8745544469437,40.8747672681638,40.8747905574113,40.8747093120375,40.8745797734902,40.8744981849944,40.874286311038,40.8741577257522,40.8740287364363]}],[{"lng":[-73.7819412286893,-73.7819955689649,-73.7819565999782,-73.7819869548308,-73.7820352780007,-73.7820862039681,-73.7821378749646,-73.7821398337383,-73.7820330853969,-73.7820665002638,-73.7821269906337,-73.7821599039993,-73.7822380792241,-73.7823163283618,-73.7824125081098,-73.7825268220777,-73.7825988088072,-73.7826578536091,-73.782623930097,-73.7826398694971,-73.782611385286,-73.7825261377404,-73.7824406498313,-73.7823652774674,-73.7822547504327,-73.7821369592633,-73.782096389027,-73.7820376967246,-73.7820261391335,-73.7819281370283,-73.7819814506338,-73.7819412286893],"lat":[40.8752159512247,40.8751589634861,40.8751155016868,40.8750333491942,40.8749763507382,40.8750426710183,40.8750290867875,40.8747459653505,40.87472743523,40.8746293027541,40.8745312225599,40.8745860909243,40.8745999405259,40.8745909537822,40.8746185382809,40.874621036766,40.8746873971805,40.8747926566941,40.8748582015944,40.8748784518374,40.874949873976,40.8751026739514,40.8752123266317,40.8751753319209,40.875160773056,40.8751615146739,40.8752105078037,40.8753047460394,40.8753833483803,40.8754046058686,40.8752274450981,40.8752159512247]}],[{"lng":[-73.7812945815069,-73.7814224288124,-73.7814389771328,-73.7814627394397,-73.7814732128251,-73.7815135709195,-73.781494442486,-73.7813994979628,-73.7813641559281,-73.7813801788729,-73.7814344596056,-73.7813955193731,-73.7813761030745,-73.7813375033859,-73.7812058137924,-73.7812090288385,-73.7812068417753,-73.7812314000691,-73.7812398408576,-73.7813051492695,-73.7812945815069],"lat":[40.8759449029054,40.875766339404,40.8758043370306,40.8758589011151,40.8759678482141,40.876046023437,40.8760994237681,40.8761526805096,40.8761957728929,40.8762636258465,40.8764031473164,40.8765390569828,40.8765523331015,40.8765787244457,40.8765900788502,40.8764359415093,40.8762776845787,40.8762201840734,40.8761236041937,40.8760250769166,40.8759449029054]}],[{"lng":[-73.8072864712257,-73.8069311323246,-73.8065773016606,-73.8063588494412,-73.8061408738587,-73.805924988776,-73.8057127720977,-73.8055057674358,-73.805201136032,-73.8032868213697,-73.8022038829629,-73.7993752043825,-73.7974482563964,-73.794492544383,-73.7941655582766,-73.7938552720907,-73.7930065264918,-73.7932287088216,-73.7935874186363,-73.7937923742423,-73.7949170558652,-73.7955457984265,-73.7950259623285,-73.7962509753579,-73.7971270117467,-73.7972039970304,-73.7974381545729,-73.7985533078772,-73.7989124546362,-73.7998138958034,-73.7998771379357,-73.8002727437516,-73.800354445589,-73.8003496779097,-73.8004766343745,-73.8005122388969,-73.8004754664885,-73.8005811368065,-73.8005724562113,-73.8006592085239,-73.8006554373432,-73.8006909704475,-73.800735001016,-73.800764438214,-73.800805155649,-73.8008681538326,-73.8009591317371,-73.8011078060407,-73.8011822700543,-73.8013560949612,-73.8014502576208,-73.8015351282492,-73.8017851740437,-73.8019645452857,-73.801912906495,-73.8019931231586,-73.8020918507462,-73.8020826375312,-73.8020545070842,-73.8021392605325,-73.8021960854513,-73.8022127286928,-73.8020788872404,-73.8021167957798,-73.8023308119321,-73.8025305596233,-73.8025668361242,-73.8026729876708,-73.8027590760359,-73.8027028360472,-73.8026843020232,-73.8026893913456,-73.8026047762351,-73.8026849489028,-73.8026428220398,-73.8026949472263,-73.8027608675273,-73.8027754777213,-73.8029784759347,-73.8031475585269,-73.8032501987906,-73.8033504398922,-73.8034411117772,-73.8035166856532,-73.8036171745203,-73.8036948592132,-73.8037649036221,-73.8038550294816,-73.8039252766126,-73.8040358885665,-73.8040612495136,-73.8040717526784,-73.8042413879728,-73.8042976148555,-73.8043722844172,-73.8044264672291,-73.804479366939,-73.8045412816963,-73.8045160459014,-73.8045514147277,-73.8046325055678,-73.8046897291289,-73.8047757114042,-73.8048482018141,-73.8049248477131,-73.8049922831058,-73.805170547675,-73.8052886184337,-73.8053878610035,-73.8054096138633,-73.8055051154449,-73.8056532379127,-73.8057111201859,-73.8059442865908,-73.8058877971247,-73.8058811414503,-73.8059525705198,-73.8059910180723,-73.8059571430529,-73.805871103326,-73.8057933375929,-73.8057056389254,-73.8056569294,-73.8056501944511,-73.8056596726139,-73.8056918674619,-73.80577265785,-73.8059865308911,-73.8060468367243,-73.8061721454968,-73.8063037715512,-73.8064037210311,-73.8064348991785,-73.8066042869457,-73.8067107638263,-73.8067042516656,-73.8067858832074,-73.806842142984,-73.8069425234505,-73.8070491532468,-73.8071119674992,-73.8071052199322,-73.8072434308213,-73.8073940431529,-73.8074629964111,-73.8076385945859,-73.8078579680425,-73.8078638739082,-73.8078259755532,-73.807863488383,-73.8079642953943,-73.8080395273652,-73.8081963223922,-73.8082965942431,-73.8083277467561,-73.8083906986881,-73.8085287710773,-73.8086730676319,-73.8086977647588,-73.8087671044093,-73.8089240358265,-73.8090998425718,-73.8092442345299,-73.8091804845686,-73.8090309563674,-73.808848969542,-73.808817719864,-73.8087486284481,-73.8085543609529,-73.8085796352041,-73.8085294022404,-73.8084102034906,-73.8084606821861,-73.8084797065124,-73.8084171250531,-73.8085303215425,-73.8086310599263,-73.8087254925601,-73.8085978992402,-73.808417715724,-73.8083004857598,-73.8081899847763,-73.8081390541736,-73.8081153896957,-73.80800846629,-73.8078639407575,-73.8077977164232,-73.8077756957317,-73.8076958218296,-73.8075956868824,-73.8075406363618,-73.8075396728931,-73.8075368377559,-73.807568374339,-73.8076532073027,-73.8077412122981,-73.8078041696716,-73.8078734322084,-73.8078861042802,-73.8079538842319,-73.8080190249203,-73.8079869375226,-73.8079964558793,-73.8080924153667,-73.8081180682031,-73.8080939309533,-73.8081537636944,-73.8082254429363,-73.8082664041248,-73.8083455321604,-73.8083738765247,-73.8084899752206,-73.8084085098664,-73.8084022624256,-73.8084326890087,-73.8085255793084,-73.8085934655299,-73.8086187329308,-73.8087494782117,-73.8087094249837,-73.8086113929117,-73.8085081841478,-73.8084277381563,-73.8083776252167,-73.8082894541374,-73.808209517861,-73.808093212704,-73.8080253095233,-73.8080151166521,-73.8079798829098,-73.8079420323054,-73.8078716236652,-73.8078538765329,-73.8077910879829,-73.8077485139458,-73.8076178667462,-73.8075024111839,-73.80741951896,-73.8073618401238,-73.8072915305308,-73.8072546425487,-73.807155899555,-73.807090705327,-73.8070481593777,-73.8070306723736,-73.8069253872038,-73.8068425670653,-73.8067949052105,-73.8067295839271,-73.8067321672959,-73.8067021642797,-73.8067400159924,-73.806750230442,-73.8067454528107,-73.8067783153622,-73.806753422436,-73.8067812921388,-73.8068273998491,-73.8068493062778,-73.8069423564928,-73.8069499770167,-73.8068545490562,-73.8067993153805,-73.8066836841929,-73.8065958435657,-73.8065457325562,-73.8065508426005,-73.8066036431878,-73.8066463773828,-73.8067307490511,-73.8067419409634,-73.8066842355304,-73.806611272173,-73.8065536283932,-73.8065539278135,-73.8064661051063,-73.8063849407163,-73.8063784758118,-73.806308333988,-73.8062607609831,-73.8061427244538,-73.8060563575943,-73.8059317955979,-73.8058568595074,-73.8057558732835,-73.8056735582931,-73.8056258634913,-73.8055504225674,-73.8054977238473,-73.8054853252004,-73.8054102188736,-73.8053573297108,-73.8052868925525,-73.8051940317198,-73.8051253599984,-73.8050409283412,-73.8050120101511,-73.8049429394312,-73.8048726616994,-73.8048024018342,-73.8047737712149,-73.8047198376026,-73.8047036442503,-73.8047577986095,-73.8047012405593,-73.8047393611145,-73.8047356983665,-73.8046460450292,-73.8044851910468,-73.8044546980114,-73.8044304475563,-73.8043355999991,-73.8042802121237,-73.8041589402159,-73.8041047129301,-73.8039955577663,-73.8038528078145,-73.8035991538933,-73.8033724425674,-73.8032401091024,-73.803152526309,-73.8031110227604,-73.8030038810895,-73.8029138708857,-73.8030555244455,-73.8029992653225,-73.8030562018376,-73.8030987400333,-73.8030187624008,-73.8030144890873,-73.803085305175,-73.8030950381953,-73.8030813174626,-73.803044079409,-73.8030069581871,-73.8028375907859,-73.80271535305,-73.802481099602,-73.8023048807285,-73.8022485516512,-73.8020529594041,-73.8019778963436,-73.8017726000069,-73.801725553191,-73.8017153840457,-73.8017523456108,-73.801480820561,-73.8013686244769,-73.801340098687,-73.8008531358764,-73.8007407874141,-73.8007006511376,-73.8005373463078,-73.8003194078996,-73.8000947273553,-73.7999638536766,-73.7999447763956,-73.7997764499821,-73.7997105758753,-73.7996171080765,-73.7995700754848,-73.7995694903761,-73.7994313885824,-73.7993542457367,-73.7993216937252,-73.7991800946584,-73.7990961830057,-73.7990722151717,-73.7989803432348,-73.7989021759509,-73.7986829429237,-73.79854108933,-73.7984123313401,-73.7983928019449,-73.7982963932455,-73.7982447662971,-73.7980685220546,-73.7978037721931,-73.7977404198527,-73.7976740071024,-73.7975432468307,-73.7974419348007,-73.7972707791217,-73.7971983072533,-73.7970865100279,-73.7970349889896,-73.7969706461591,-73.7969337497421,-73.7947904468145,-73.7939736383772,-73.7935721088359,-73.7935960533051,-73.7931670377871,-73.7942216999093,-73.7944029458609,-73.7938470272195,-73.7929988022,-73.7930387958811,-73.7928938952063,-73.7926048506948,-73.7923853100076,-73.7921907040825,-73.7919678215398,-73.7918945748058,-73.7917309548464,-73.7915049567696,-73.7909523900138,-73.7906312452509,-73.7906306750359,-73.790805954191,-73.7907616325509,-73.790440931811,-73.789558729443,-73.7894824554537,-73.7894071839181,-73.7893334077823,-73.7892616101982,-73.7891405072464,-73.7890590419732,-73.7891223537942,-73.7890728832659,-73.78911096048,-73.7893183578045,-73.7891202063692,-73.7892955659684,-73.7894779783655,-73.7897591481785,-73.7900633286077,-73.789523093688,-73.7882731347091,-73.7877541548974,-73.7874116965232,-73.7871264073479,-73.786940878067,-73.7867394646181,-73.7861098520813,-73.7858897216716,-73.7852313910201,-73.7848675599614,-73.7845849112644,-73.7844280994943,-73.7843816810757,-73.7842123058882,-73.7841970551985,-73.7841427218489,-73.7841773836882,-73.7844924540867,-73.7848054540206,-73.7847096402645,-73.7846746539644,-73.7848394454981,-73.7849418822533,-73.7849500756427,-73.7852486623769,-73.7854245913465,-73.7853988757831,-73.7855880723639,-73.7856907556887,-73.7859574222525,-73.7861494623108,-73.7862443857077,-73.7861015526193,-73.7863108074994,-73.7865345143752,-73.786593382665,-73.7866224927706,-73.7869057577694,-73.7870089192417,-73.7870425258862,-73.7871101295568,-73.7871368555428,-73.7867650811048,-73.7862487445261,-73.78602387303,-73.7858036804399,-73.7854898623279,-73.7852774937808,-73.7850813965877,-73.7850022922887,-73.7850622333494,-73.7851048140196,-73.7851050180722,-73.7851948465636,-73.7852411741622,-73.7854720056533,-73.785481257393,-73.7855297170343,-73.7854612490718,-73.7855367632569,-73.785542443543,-73.785214888055,-73.7850552739475,-73.784875293956,-73.7847618609721,-73.7842464617834,-73.7840103706005,-73.7837805168962,-73.7834018864173,-73.7832329753796,-73.7833563063733,-73.7835450276292,-73.7836532899615,-73.783745383473,-73.7838437652668,-73.7839461515596,-73.7839154893066,-73.7837214144294,-73.7837449840737,-73.7833520553102,-73.7831450860451,-73.7830685342603,-73.7830557962405,-73.783142188995,-73.7832426407426,-73.7832433113887,-73.7831866423008,-73.7832812880465,-73.7833757966625,-73.7835055553639,-73.7835256373509,-73.783608180677,-73.7836827125658,-73.783792603563,-73.7838790793923,-73.7839422776424,-73.7840129056006,-73.7840987530388,-73.7841546068584,-73.7842688350842,-73.7842964906167,-73.7843985917781,-73.7845524494721,-73.784561680102,-73.7847351358767,-73.7848845939131,-73.7850461290449,-73.7852551748187,-73.7856024530545,-73.7856131971946,-73.7856244216368,-73.7856357932095,-73.7856469743744,-73.7856576332448,-73.7856674534368,-73.7856761434608,-73.7856834453733,-73.7856891424336,-73.7855607293644,-73.7855223748242,-73.785672150052,-73.7860107692419,-73.7865193540714,-73.7874044959486,-73.7876775055994,-73.7880354832577,-73.7883272333658,-73.7892791902781,-73.7894864026915,-73.7897409866335,-73.7900142645293,-73.7904861710853,-73.7907689301798,-73.7913076348604,-73.7916101173377,-73.7918293399445,-73.7919152507282,-73.7919927722335,-73.7920618114394,-73.7921222855128,-73.7921741219081,-73.7922172584536,-73.7922516434259,-73.7922772356116,-73.7922940043569,-73.7923019296033,-73.7923010019118,-73.7922912224739,-73.7922726031093,-73.7922451662519,-73.7922089449225,-73.7921639826881,-73.7921103336099,-73.792048062178,-73.7919772432332,-73.7918979618772,-73.7918103133699,-73.7917144030147,-73.7916103460322,-73.7914982674207,-73.7918801459775,-73.791890708109,-73.7921625334871,-73.792369898861,-73.792436432938,-73.7930392837637,-73.7931380252795,-73.7932982711146,-73.7935904743795,-73.7936964275786,-73.7937700920561,-73.7938505244937,-73.7938461935845,-73.7937145700042,-73.7938088901346,-73.7939925708458,-73.7941155219756,-73.7941726383858,-73.7941217117788,-73.7942561026918,-73.794397469262,-73.7945456231803,-73.794709514094,-73.7948698386675,-73.7948208254581,-73.7947650750132,-73.7947026317924,-73.7946335455845,-73.7945578714683,-73.7944756697683,-73.7944332478194,-73.7943942479925,-73.7943593155327,-73.794329028389,-73.7943038876521,-73.7942825661197,-73.7942684848494,-73.7942619289942,-73.7942630313056,-73.7942717694463,-73.7942879664436,-73.7942939635339,-73.7943044820343,-73.7943500593428,-73.7944721328225,-73.7945179245012,-73.7945666719895,-73.7946170905673,-73.7946678514748,-73.7947176169308,-73.7947650753878,-73.7948089760966,-73.7948902354297,-73.7955888017295,-73.7968546169358,-73.7970010881026,-73.7971407089785,-73.7972732433886,-73.797398467151,-73.7975161684563,-73.7976261482254,-73.7977282204462,-73.797822212488,-73.7979079653934,-73.7979853341466,-73.7982495022723,-73.7985327412687,-73.7987225560009,-73.7990477683483,-73.7990241939245,-73.7989925339197,-73.7989529244149,-73.7989055356488,-73.7988505712862,-73.7987882675424,-73.7987188921677,-73.7986427432961,-73.7985601481648,-73.7984321621051,-73.7983074626317,-73.7981863287323,-73.7980690314156,-73.797955833104,-73.7978052299075,-73.7981936599685,-73.7993204316006,-73.7994067209257,-73.799486814843,-73.7995604510197,-73.7996273882793,-73.7996874073907,-73.7997403117863,-73.7997859282058,-73.7998241072629,-73.7998547239347,-73.7998776779704,-73.7998833704317,-73.7998965110999,-73.7999161899401,-73.7999426171173,-73.7999737605426,-73.8000106590503,-73.8000531133091,-73.800099127049,-73.8001255447778,-73.8001566949586,-73.8001922202446,-73.8002388864362,-73.8002902679449,-73.800345555,-73.8004038762823,-73.8004643126562,-73.8005889026011,-73.8007094600664,-73.8008254316399,-73.8009362849564,-73.8010415111415,-73.8011406271476,-73.8012331779706,-73.8013187387393,-73.8013969166652,-73.8014673528467,-73.8015297239162,-73.8015837435252,-73.8016291636593,-73.8016657757773,-73.8016934117693,-73.8017119447285,-73.8017212895355,-73.8017214032488,-73.8017122853034,-73.8017217336566,-73.8017383535099,-73.8017620890323,-73.8017928604755,-73.8018305644413,-73.8019706475119,-73.8021184955549,-73.802274026914,-73.8024371556822,-73.8026077917489,-73.8027858408498,-73.8029712046187,-73.8031637806417,-73.8033634625141,-73.8035701398985,-73.8037836985861,-73.8041755793241,-73.8045424727646,-73.8045381811374,-73.8045252671772,-73.804503905247,-73.8044743837895,-73.804437101433,-73.8043925616093,-73.8043413657561,-73.804284205196,-73.8042218518013,-73.8041551475707,-73.8040849932587,-73.8040123362121,-73.8039506693221,-73.8038894256506,-73.8038297578341,-73.8037727888521,-73.8037195908928,-73.8036711651748,-73.8036284231036,-73.8035921691194,-73.8035630855557,-73.8035417197979,-73.8035284739797,-73.8035235974138,-73.8035271818984,-73.8035391599884,-73.8036860341654,-73.803778063095,-73.8038373749065,-73.8038636768573,-73.8038905626781,-73.8039589162871,-73.8040524630202,-73.804137847564,-73.8041735417152,-73.8042014225377,-73.8041785611179,-73.804174850118,-73.8041716787409,-73.8042058572653,-73.804220342829,-73.8043057641598,-73.804397449092,-73.8044981748032,-73.8045662404521,-73.8046429381609,-73.804679688048,-73.8046898389874,-73.8046837176005,-73.8046348742635,-73.8046281963014,-73.8046052776888,-73.8046475642777,-73.8047323428191,-73.8047864302104,-73.8048471818275,-73.8049141182051,-73.8049867110611,-73.8050643874663,-73.8051465343657,-73.8052325034175,-73.8053216161107,-73.8054131691201,-73.8055064398582,-73.805600692179,-73.805695182188,-73.8057891641149,-73.8058818961997,-73.8059487602447,-73.8060108510648,-73.8060672353117,-73.8061170654234,-73.8061595923642,-73.8061941768845,-73.8062202991287,-73.8062375664492,-73.8062457193077,-73.8058204128197,-73.8061305703892,-73.8065562995654,-73.80673711195,-73.8069156738035,-73.8071130435447,-73.8074143248992,-73.8076877135098,-73.8079896967062,-73.8080277656594,-73.808178704471,-73.808303486022,-73.8086673158975,-73.8090025368878,-73.8092447052915,-73.809406281023,-73.8099206907889,-73.8101179018374,-73.8103534741799,-73.8104555657104,-73.8106696297195,-73.8108227009248,-73.8108502279226,-73.8111045714928,-73.8112276766861,-73.8113478651819,-73.8114648217051,-73.8115288380944,-73.8115956524241,-73.8116647025986,-73.811735407711,-73.8118071729308,-73.8120087148275,-73.812025085047,-73.8120415992932,-73.8120578217034,-73.8120733241171,-73.8120876973768,-73.8121005621263,-73.8121115788237,-73.8121204567027,-73.8121269614467,-73.8121372396881,-73.8121487040833,-73.8121611076225,-73.8121741830611,-73.8121876486777,-73.8122012143441,-73.8122100620583,-73.8122192373377,-73.812228527648,-73.8122377177904,-73.8122465948863,-73.8122549533085,-73.8122624998108,-73.8122691834239,-73.8122748535536,-73.8122793824413,-73.8122826680427,-73.8122846363267,-73.8122852429439,-73.81228462393,-73.8122829227726,-73.8122810266711,-73.812282833009,-73.8122882880485,-73.8122972294996,-73.812309391348,-73.8123244117684,-73.8123418438898,-73.8123962856109,-73.8124462152814,-73.8125537326357,-73.8126656384659,-73.8127816457352,-73.8129014568839,-73.8129355792522,-73.8129726868601,-73.813011864048,-73.8130521440866,-73.8130925330319,-73.8131320342526,-73.8131696730234,-73.8131815387918,-73.8131944943081,-73.8132081815751,-73.8132222223756,-73.8132362287234,-73.8132498135843,-73.8132626015708,-73.8132742393152,-73.8132844052337,-73.8132928184132,-73.8132992463732,-73.813360988323,-73.8134276623139,-73.8134991633227,-73.81357537872,-73.8136091891463,-73.8136375844619,-73.8136600364602,-73.8136761274882,-73.8136855582154,-73.8136881532031,-73.8136975075405,-73.8137108593729,-73.8137278052265,-73.8137478330195,-73.8137703375363,-73.8137946387166,-73.8138200022062,-73.8138456615488,-73.8139687718433,-73.8140168157655,-73.8140408968062,-73.8140279180928,-73.8139844799931,-73.8139519087283,-73.813958574208,-73.8140087775453,-73.8140588126282,-73.8141721955232,-73.8142288047771,-73.8142089390406,-73.8141717099469,-73.8141257218665,-73.8143799774744,-73.8144846516426,-73.8145957928,-73.8146656643391,-73.8147530485284,-73.8148229056258,-73.8148862061646,-73.8149320887514,-73.8149583890473,-73.814988574052,-73.8150189720343,-73.8151031538415,-73.8152439525425,-73.8149298412996,-73.8148810257774,-73.815018054792,-73.8152245562199,-73.8151590814641,-73.8150889149056,-73.8151732021925,-73.8157366604115,-73.8166212949545,-73.8168449590812,-73.8169976026643,-73.8164145586361,-73.8157876406608,-73.8143803908254,-73.8145001234624,-73.8148934134285,-73.8152539564126,-73.8154902177778,-73.8155321787834,-73.8153787003307,-73.8156167055334,-73.8158377418283,-73.8161233793286,-73.8162851992739,-73.8165908700741,-73.8172257874502,-73.8177497738369,-73.8181557351667,-73.8183302629129,-73.8188293636467,-73.8186395362808,-73.8181661066203,-73.8177883831226,-73.8173408549066,-73.8171321678563,-73.8171045881923,-73.8172811510872,-73.817734241695,-73.8186093142649,-73.8189266931716,-73.8192726034273,-73.8199972280692,-73.8201289368279,-73.8202492104295,-73.8204793477214,-73.8205348546445,-73.8205889937872,-73.8205951209726,-73.8205960657219,-73.8206183544149,-73.820694942123,-73.8208077095486,-73.8208708766578,-73.8209114124983,-73.8209022295233,-73.8208659297078,-73.8208566715097,-73.8208609921824,-73.8208743291289,-73.8208877120281,-73.8209417890567,-73.820986709738,-73.8210136600409,-73.8210767731067,-73.8211805985341,-73.8212393355369,-73.8212891673429,-73.8213480611455,-73.821411339389,-73.8214837882122,-73.82160540264,-73.8216775414955,-73.8217316003012,-73.8217856047398,-73.8218350215292,-73.8218935210309,-73.8219564130586,-73.8219652846496,-73.8219705250827,-73.8219376633759,-73.8218967951837,-73.821887557189,-73.8218873736461,-73.821896226232,-73.8219366725247,-73.8219725414266,-73.8219976214233,-73.8219718442932,-73.8219578361546,-73.8218669708162,-73.8217627664947,-73.8215819344758,-73.8214419444385,-73.821310924384,-73.8212295267199,-73.8211842073285,-73.8211840046307,-73.8211296303024,-73.8211068052356,-73.8210342768944,-73.8210204682559,-73.8210880325413,-73.8212008061869,-73.8213768960689,-73.8214584159008,-73.8214587010839,-73.821481516464,-73.8215628334963,-73.8217612970964,-73.8218875743182,-73.821945677017,-73.8216359790352,-73.8215614084057,-73.8214983383185,-73.8213720336084,-73.8212591961336,-73.8211507972168,-73.821060325111,-73.8209833822193,-73.8209154947365,-73.8208701473333,-73.8207841879133,-73.8206847978157,-73.8205583070847,-73.8204769706569,-73.8204678422809,-73.8204899982808,-73.8209630412622,-73.8212740721242,-73.8215615796236,-73.8219017632021,-73.8220981283218,-73.8215255067361,-73.8213997539197,-73.8212825101373,-73.8211562680762,-73.8210615377549,-73.8209126710757,-73.8208496664219,-73.8208092100839,-73.8207460842656,-73.8206737190482,-73.8207005968105,-73.8207320716834,-73.8207634832762,-73.8207587938792,-73.8207274986197,-73.8206188620353,-73.8205286463208,-73.8204294845461,-73.8203530320151,-73.8203397219314,-73.8202766994452,-73.8202406546106,-73.8201641742262,-73.8201508651007,-73.8202052404279,-73.8202415252709,-73.8202281790404,-73.8201787209922,-73.8201563429475,-73.8201295018359,-73.8200709463918,-73.8199536780348,-73.8198272899069,-73.8196151723927,-73.8195384612301,-73.8194120908304,-73.8192901979361,-73.8192268769039,-73.8191364206801,-73.8190459909192,-73.8189736717767,-73.8189464404146,-73.8189462911474,-73.8190635702433,-73.8191221625668,-73.8191761949189,-73.8193070687197,-73.8194335795179,-73.8194866343365,-73.8196956727771,-73.8199480323409,-73.8199052704476,-73.8197489255141,-73.8196135737195,-73.8194826893964,-73.8192930158397,-73.8192296957606,-73.8192069319652,-73.8191976723586,-73.8192019147789,-73.8191972438127,-73.8191842773224,-73.8195541714198,-73.8199051939651,-73.8202406138558,-73.8203047240086,-73.8203921729572,-73.8204780529581,-73.8205954538455,-73.8208120701851,-73.8210467514092,-73.8212498006554,-73.821430208013,-73.8215832847989,-73.8216327521403,-73.8216491621716,-73.8213541586184,-73.821284676073,-73.8212261728902,-73.8211812115105,-73.8208879531168,-73.8206983240576,-73.8205355924314,-73.8203638978662,-73.8202734026321,-73.820223408475,-73.8202095437923,-73.8202170542573,-73.819916531585,-73.8198085454582,-73.8197601349025,-73.8197598046825,-73.8198478254212,-73.8199440044945,-73.819975936823,-73.8199597066553,-73.8199594592641,-73.8199753431325,-73.8200393736932,-73.8201596260193,-73.8202638450277,-73.820351901436,-73.8204640131483,-73.8205680689273,-73.8206802646877,-73.8207731605911,-73.8206969055752,-73.8206410787338,-73.8205932936008,-73.8205615736435,-73.8205139359647,-73.8204822005454,-73.8204343494818,-73.8204025485318,-73.8204428188033,-73.8205712412618,-73.82065127163,-73.8206991886792,-73.8208583484955,-73.8208907257989,-73.8209480684618,-73.8210358368736,-73.8211236131053,-73.8211639820306,-73.8211536115873,-73.8211127658279,-73.8210448447496,-73.8209769581023,-73.820974440213,-73.820969980602,-73.8209595614352,-73.820945639615,-73.8209759202981,-73.8210130009026,-73.8210432955499,-73.8210568744567,-73.8209965809566,-73.8208948329476,-73.8208167477716,-73.8207182260944,-73.8206199397437,-73.8204098298042,-73.8202809641484,-73.8202130547455,-73.8202162245982,-73.8202566474496,-73.8203090610513,-73.8203374471862,-73.8202686647429,-73.8201689780259,-73.8200784210019,-73.8200240950467,-73.8200510034735,-73.8201276850546,-73.8201465506315,-73.8202043574191,-73.8202629371549,-73.8202628352733,-73.8201994914825,-73.8201268415707,-73.8201266376503,-73.820135535419,-73.8202121063766,-73.8202435112473,-73.8202433537734,-73.820202448795,-73.8201705264916,-73.8201521831128,-73.8201249413828,-73.8201021762241,-73.8200568782426,-73.819966568983,-73.8198582044236,-73.8197363060031,-73.8196672785267,-73.8196324088344,-73.819569108644,-73.8194921653581,-73.8194649607783,-73.8193475107463,-73.8192707626138,-73.8191578450162,-73.8191170976628,-73.8191214804555,-73.8192026694702,-73.8193019318854,-73.8194327853892,-73.8194943264822,-73.8196040966057,-73.8197348382722,-73.8197888219001,-73.8197795991469,-73.8197386462506,-73.8196887404384,-73.8195848511527,-73.8194581273736,-73.8194086791859,-73.8193228079943,-73.8192594614578,-73.8192638550414,-73.8193766517293,-73.8194470446169,-73.8194850560712,-73.8195798802582,-73.8197062207993,-73.8197285501709,-73.8196922223854,-73.8196017911082,-73.81955647313,-73.8195653335871,-73.8196914883311,-73.8197725954394,-73.8197769243895,-73.8197494948985,-73.8196586540429,-73.8195906249725,-73.8194594158051,-73.8194094334248,-73.8193731239106,-73.8193449746142,-73.8195788913956,-73.819685743294,-73.819791377942,-73.8198327530423,-73.8194079982163,-73.8184170336926,-73.8174263890859,-73.8167077859142,-73.8154787310655,-73.8153646422707,-73.8152834545868,-73.8151831684637,-73.8148566585916,-73.814427621261,-73.8139974836601,-73.8135673473951,-73.8120965924556,-73.8119804368335,-73.8114064522649,-73.8108361190483,-73.8102705322771,-73.8097107918628,-73.8091506811379,-73.808684593605,-73.8083423239039,-73.8079939816159,-73.8076413950187,-73.8072864712257],"lat":[40.8859318138162,40.8859266089178,40.8859375249967,40.8859456596549,40.8859654100595,40.8859967177809,40.8860393678749,40.8860929491813,40.885999956351,40.8854155526692,40.8851211147967,40.8843519698216,40.8838453848377,40.8830682510741,40.8829932163499,40.8836433113335,40.883358737383,40.8828225954071,40.8825175238821,40.8819703267638,40.8805437914875,40.8806910153738,40.8797477972117,40.8770119997786,40.8761904009039,40.8757857929839,40.8751353329532,40.8744014282745,40.8746458931429,40.8741598497163,40.8734846672926,40.8728209518242,40.8727301920951,40.872629219453,40.8725427767602,40.8724445583098,40.8723157298598,40.8721098398584,40.8719889987315,40.8718432172952,40.8717925820773,40.8717181890932,40.8717154078561,40.8715955371755,40.8714940612464,40.871507042628,40.8714084364268,40.8713972633294,40.8714241946963,40.8712857110944,40.8712852769324,40.8712425369779,40.8710678493384,40.870910908421,40.8708607861225,40.8708001693072,40.8708467982303,40.8707788802279,40.8707395189597,40.8707360913754,40.8706253999683,40.8705052786344,40.8704572287992,40.8703750955057,40.8703976976724,40.8702157135356,40.8701586436389,40.870154470944,40.8697007411063,40.8696148730392,40.8695147744942,40.8693861253069,40.8693430946289,40.8692967721757,40.8692145018112,40.8691002279839,40.8690967670722,40.8689323953927,40.8687433297618,40.8688087967934,40.8689118981671,40.8689768747604,40.8688817265772,40.8687979892633,40.8687791000266,40.8688306953703,40.868918492354,40.8690082293424,40.8690274101987,40.8689818526767,40.8688961238115,40.8687398462534,40.8686877174549,40.8687489779335,40.8687912835654,40.8688003620305,40.8687119745764,40.8687315465142,40.8688548819997,40.8689197437785,40.8689588146872,40.8689605896373,40.8689493237843,40.8690062244044,40.8691036882203,40.8691452977221,40.8691475047543,40.8691267378346,40.8690247128597,40.8689649276455,40.8689345923775,40.8689405601841,40.8688949122371,40.8689298028289,40.8689933799031,40.8690548242917,40.8690859518194,40.8691312129108,40.8691721540941,40.8691654253787,40.8691825021821,40.8692733084727,40.8693199319394,40.869408415776,40.8694895525427,40.8695535199055,40.8696101945212,40.8697261232533,40.8698373910619,40.8699186093296,40.8699855407907,40.870152488142,40.8702240162523,40.8702576566543,40.8703388420956,40.8704198372218,40.8704104443721,40.8704915450937,40.8705107738697,40.8705395427349,40.8705253516501,40.8706873546094,40.8706494649766,40.8706640113863,40.8706974816717,40.8707549565685,40.8708696837931,40.8709983514649,40.8710792960551,40.8711317745265,40.8710032844925,40.8710367655489,40.871084676407,40.8711420250691,40.8712230833393,40.8711612416519,40.871171000389,40.8711998312447,40.8713428244384,40.8712428730619,40.8712431330188,40.8712291285634,40.871224601975,40.8711272880478,40.8711718325458,40.8711524709442,40.8711047678667,40.8711189494755,40.8710042649374,40.8709471254936,40.8709518075213,40.870927784024,40.8708373305643,40.8707706510402,40.8707038355544,40.8706325459581,40.870527880877,40.8704327359865,40.870400401506,40.8704478097691,40.8704579296545,40.8704912709508,40.8704821606331,40.8704421495699,40.8704123164237,40.8704636509207,40.8704570933369,40.8704364275101,40.8704504774494,40.8704232329133,40.8703775521735,40.8702824576709,40.8701776202431,40.8701252566549,40.8700944247167,40.8700516854224,40.8699874610336,40.8699137170449,40.8698732357095,40.8698735510686,40.8697941048432,40.8697352149401,40.8696994920352,40.869704595441,40.8696733084024,40.8696377079324,40.8695687139587,40.8695423500227,40.8694923926262,40.8694594350468,40.8694261268966,40.8694358491968,40.8693880626417,40.8693266945249,40.8692751704881,40.8692791364851,40.869246846256,40.8691916131903,40.8691289301623,40.8690869313549,40.8691248893944,40.869216207823,40.8692503830638,40.8692140851776,40.8693149591146,40.8693864893892,40.8694518679836,40.8694898756265,40.8695413218169,40.8695698542204,40.8696345969348,40.8696706944043,40.8697297516498,40.8697353659906,40.8696971733067,40.8697255465966,40.8697101055837,40.8697214039208,40.8696965284424,40.8696983169586,40.8696827083527,40.8697133388446,40.8696827341067,40.8696350116491,40.8696044854662,40.8695452225548,40.8695317413932,40.8695164131312,40.869529646303,40.8695048714246,40.8694609828415,40.8693962405318,40.8693371696651,40.869253296829,40.8691771095018,40.8691027325416,40.8690170072877,40.8689844675313,40.8689408787913,40.8688895713515,40.868859088328,40.8688646463763,40.8688626479997,40.8689081985869,40.868894710007,40.868858411324,40.8688279229449,40.8688032322419,40.8687861494705,40.8687700130784,40.8687338940324,40.8687185489001,40.8687698897992,40.8687335784941,40.8686306526802,40.8686114451198,40.8685977149498,40.8685255261839,40.8684701323102,40.8684243081967,40.8684336395198,40.868433996124,40.8683719320678,40.8683073604655,40.8683489066678,40.8683108637458,40.8683069715894,40.8683468709995,40.8683372526195,40.8682838626444,40.8682093995513,40.8682645865115,40.8683102119284,40.8682967126342,40.8682663791597,40.86827739376,40.8682515431236,40.8683001014605,40.8682333028323,40.8681031800389,40.8679035159984,40.8677925278084,40.8676214011119,40.8674293356069,40.8670334691598,40.866829338779,40.8666550658964,40.8666471164369,40.8666831575356,40.866772401515,40.8668478265093,40.8668503807668,40.8668412353776,40.8669202411956,40.8670015526018,40.8671259158306,40.8671664848001,40.8670903890714,40.8670959540696,40.8671246301256,40.8671023013247,40.8670230184322,40.8670418365688,40.8669782467924,40.866835535768,40.8667568154849,40.8666068108955,40.8665497025692,40.8665316963469,40.8663851625477,40.8663173799938,40.8662101824726,40.8660743533727,40.8659313357373,40.8657490070761,40.8657129795306,40.8656591632747,40.8656255861818,40.8656229124319,40.8657502415837,40.8656720356335,40.8658276473192,40.8658768499148,40.8660183513186,40.8663015004845,40.8664148307465,40.8667824796393,40.866881395064,40.867065403552,40.8677512427452,40.8678997111932,40.8681409384841,40.8683716373267,40.8684794736043,40.8687693291406,40.8688752893456,40.8690168401153,40.8691722897363,40.8693703916795,40.8694410202355,40.8695754431825,40.8697388859398,40.8697803083591,40.8698288811459,40.8699846862034,40.8701305612192,40.8702960189627,40.870447834909,40.8705788107853,40.8707973629893,40.8711525414876,40.8713812156303,40.871522241354,40.8716147502618,40.8716681600785,40.8717654835896,40.8718787131906,40.872256132274,40.8723451774509,40.87239814512,40.8724300464064,40.8724606015923,40.8724811173063,40.8725117087009,40.8725396041441,40.8725367189173,40.8725142551185,40.8726233809984,40.8732004845366,40.8745665945684,40.8761210583034,40.876720732726,40.8770556390665,40.8773823704664,40.8776418435016,40.8785944597896,40.8791468626747,40.8794153565641,40.8795771099961,40.8796575973729,40.879595256484,40.8795901408808,40.8796951044619,40.8799279297627,40.8800515274381,40.8800463540276,40.8800739454643,40.8803783299342,40.8805594020109,40.880721733862,40.8808407804646,40.8810022114383,40.8812612849155,40.881254219786,40.8812424968458,40.8812261928673,40.8812054146237,40.8812619235889,40.8812141234785,40.8810474609838,40.8808091155122,40.8806805274228,40.8805786700919,40.8800802109935,40.879880328184,40.8797710641444,40.8797512653527,40.8795946615149,40.8789981270606,40.8788735731543,40.8789732300554,40.8789942571295,40.8789829029108,40.8790042172665,40.8790317071959,40.8790578836591,40.8788876841383,40.8786196152287,40.8785284004045,40.8785707590914,40.8785275803775,40.8784205316705,40.8782817746779,40.8781447501169,40.8779600005066,40.8777213539285,40.8769143150028,40.8768652644715,40.8763579948478,40.8760609091517,40.876061216506,40.8759303672974,40.875823167396,40.8757000484157,40.8754853020244,40.8753376783379,40.8753789430233,40.875410194398,40.8751386445342,40.8747845274948,40.8744779194407,40.8743537534427,40.8743642311994,40.8743066002668,40.8741816029699,40.8740737401798,40.8739875085039,40.8737886093185,40.8735549754205,40.8731812395339,40.8727604663927,40.8725264847766,40.8723828467722,40.8725942573467,40.8728514016382,40.8731595394729,40.8735556450889,40.8735899627232,40.8735190168666,40.8734250176474,40.8733607683533,40.873297630726,40.8731822437743,40.873177154033,40.8729203566024,40.8727723773797,40.8725440209895,40.8723628191468,40.8723057786215,40.8720240269002,40.8716347448803,40.8720083896811,40.8723404195083,40.872476014261,40.873361226292,40.8737678946372,40.8737939791134,40.8737171624261,40.8735381530717,40.8732560526904,40.8731348966738,40.8731422469029,40.8729962087271,40.8730122782758,40.8728963214357,40.8728269152523,40.8726645385809,40.8724995416601,40.8723541132757,40.8722965436342,40.8721535759228,40.871680678239,40.8714390527097,40.8712551614488,40.8710494269716,40.8709302097454,40.8706989069643,40.8705918698119,40.8705027665919,40.8703598513978,40.8703123548671,40.8703154731726,40.8703037660318,40.8702532992828,40.8701223766712,40.8701195314964,40.8700290735694,40.8699768425871,40.8698370818813,40.8697775696426,40.8697479776462,40.8696843672427,40.8696759478321,40.8696299146419,40.8695140435405,40.869302893206,40.8689578110177,40.8683416522237,40.8683388227954,40.8683374353394,40.8683375310392,40.8683391070541,40.8683421166039,40.868346470357,40.8683520390825,40.8683586574857,40.8683661291147,40.8687247518001,40.8689391104561,40.8692109995947,40.8693188433348,40.8692768993692,40.8692570901871,40.8692718877826,40.869215364986,40.8692587865121,40.8689531797354,40.8689321141158,40.8688182164413,40.868747237035,40.8683907120176,40.86829830538,40.867655991106,40.8672777115748,40.8668615358497,40.8666788572212,40.8664940285855,40.8663072718931,40.8661188114081,40.8659288734386,40.8657376860647,40.8655454788652,40.8653524826414,40.8651589291401,40.8649650507753,40.8647710803489,40.8645772507716,40.8643837947827,40.8641909446711,40.8639989319962,40.8638079873098,40.8636183398795,40.8634302174132,40.863243845786,40.8630594487689,40.8628772477603,40.86269746152,40.862520305907,40.8623459936198,40.8612556322097,40.8610712218611,40.8610436685525,40.8609654175541,40.8609055633176,40.8607933287782,40.8606951860883,40.8606311433836,40.860517304506,40.8603744859755,40.8602781780152,40.8601460900101,40.8600245718673,40.8599671556057,40.8599101426985,40.859878306611,40.8596962600436,40.8594926535577,40.8593176567995,40.8591706397768,40.8590274436636,40.8588882591613,40.8584823154283,40.8580755517606,40.8578937576849,40.8577130861509,40.857533681062,40.8573556853117,40.8571792406696,40.8570044876691,40.8569863214618,40.8569641711275,40.8569384031413,40.8569094438321,40.8568777723279,40.8568401996047,40.8568007094064,40.8567601014666,40.8567191981536,40.8566788278158,40.8566398080067,40.856607534287,40.8565759345281,40.8565270238039,40.8564687308314,40.8564520292561,40.8564411734335,40.8564364494641,40.8564379818461,40.8564457301942,40.8564594903041,40.8564788995338,40.856562024219,40.8565132367667,40.8562643587148,40.8561401699742,40.8560115130052,40.8558786054737,40.8557416722357,40.8556009449563,40.8554566617181,40.8553090666182,40.855158409355,40.8550049448055,40.8548489325946,40.8547959856122,40.8550053331045,40.8549144011726,40.8540515605504,40.8539572676521,40.8538643501083,40.8537732071979,40.8536842305723,40.8535978025729,40.8535142945877,40.853434065456,40.8533574599261,40.8532848071746,40.8532343335521,40.8531793210527,40.8531198927586,40.8530561816311,40.8529883302137,40.8519495980945,40.8505925614067,40.8499127758791,40.8498324206331,40.8497484484675,40.8496611344423,40.8495707645631,40.8494776348441,40.8493820503382,40.8492843241381,40.8491847763501,40.8490837330458,40.848981525194,40.8489108398022,40.848840728886,40.8487739952977,40.8487086197514,40.8486482490509,40.8485897783551,40.8485335235084,40.8482984139,40.8482637373541,40.848231405221,40.8482017883996,40.8481709810139,40.8481448562731,40.8481238258997,40.8481082213292,40.8480982884873,40.8481403038605,40.8481886291547,40.8482430425389,40.848303294235,40.8483691076642,40.8484401807162,40.848516187136,40.8485967780212,40.8486815834235,40.8487702140464,40.8488622630327,40.8489573078311,40.8490549121365,40.8491546278923,40.8492559973473,40.8493585551567,40.8494618305183,40.8495653493338,40.8496686363851,40.8497628146352,40.8498564188436,40.8499491343967,40.8500406496666,40.8501306570585,40.8503826760626,40.8506321245146,40.8508788644982,40.8511227595933,40.8513636749509,40.8516014773683,40.8518360353625,40.8520672192431,40.8522949011837,40.8525189552931,40.8527392576849,40.8533401201892,40.8547393780177,40.8547960016125,40.8548518648754,40.8549062134531,40.8549583134443,40.8550074613099,40.855052993374,40.8550942947856,40.8551308078223,40.8551620394216,40.8551875678396,40.8552070483461,40.8552202178807,40.8552193464372,40.8552248915582,40.8552367488819,40.8552546952473,40.8552783928946,40.8553073958213,40.8553411581762,40.855379044532,40.8554203418443,40.8554642728707,40.8555100107995,40.8555566948099,40.8556034462734,40.8556493852901,40.8561333703575,40.8563014596935,40.8564884565042,40.8566631443152,40.8569002668312,40.8571746292792,40.8575050516894,40.8578417603757,40.8581412751491,40.8584845381594,40.8586782218215,40.8587556910034,40.8588218686689,40.8589590489326,40.8589779829079,40.8590896320368,40.8592202599128,40.859438253348,40.8596813969656,40.8599682015712,40.8603801003661,40.8605860934545,40.8608109057229,40.8610034201532,40.8610297415354,40.8612171814953,40.8613418309678,40.8614796401182,40.8615384733615,40.861593429976,40.8616440762175,40.8616900123606,40.8617308758536,40.8617663441801,40.8617961374046,40.8618200203826,40.861837804616,40.8618493497414,40.8618545646381,40.8618534081471,40.861845889396,40.8618320677272,40.8618055728773,40.8617730649992,40.8617350327549,40.8616920478479,40.8616447564297,40.8615938693859,40.8615401516499,40.8614844107043,40.8614274844425,40.860034611968,40.8598810006453,40.8598179261001,40.8598988751247,40.8600063883289,40.8601210815984,40.8601144376614,40.8599862355848,40.8597365695814,40.8595936798799,40.859486716178,40.859704103296,40.8600442218489,40.8603251917453,40.8604186434966,40.8605479522213,40.8611015472038,40.8613487290418,40.8617000857559,40.861918128703,40.8620218364585,40.8620689917645,40.8623319939721,40.8624644687308,40.8625053244625,40.8625509118437,40.862601111293,40.8626265258745,40.8626473805073,40.8626634997447,40.8626747479784,40.8626810305787,40.8626717999036,40.8626701117281,40.8626704582393,40.8626728302916,40.8626771652792,40.862683348788,40.8626912176157,40.8627005640792,40.8627111414956,40.8627226706932,40.8627293964923,40.862734907534,40.8627390850781,40.862741839116,40.8627431103095,40.8627428712698,40.8627407198917,40.8627396127912,40.8627395756132,40.8627406092188,40.8627426896657,40.862745768763,40.8627497141465,40.8627544726527,40.8627599370639,40.862765984257,40.8627724779776,40.8627792719105,40.8627862129756,40.8627923971568,40.8627984632064,40.8628146958883,40.8628309344694,40.862846695837,40.8628615110756,40.8628749394178,40.8628865813572,40.8628960905345,40.8629230191711,40.8629545878819,40.8630224588358,40.8630861100185,40.8631453781589,40.8632001112283,40.8632166244647,40.8632288771913,40.8632365670617,40.8632395043222,40.8632376164932,40.8632309501586,40.8632196698157,40.8632139242454,40.8632097503469,40.8632072634566,40.8632065322942,40.8632075770637,40.8632103688952,40.8632148306427,40.8632208390157,40.8632282279861,40.8632367933761,40.8632462984998,40.8633415808881,40.8634349280751,40.8635261929942,40.8636152318585,40.8636436902275,40.8636753766088,40.8637097015849,40.8637460266554,40.8637836761137,40.8638219496165,40.8638400935532,40.8638567335004,40.8638713666185,40.8638835507118,40.8638929175907,40.8638991841988,40.8639021611662,40.8639017585323,40.8638522213954,40.8638438479597,40.8638603950325,40.8639052017046,40.8639948456642,40.8640645651422,40.8641027042172,40.8640860336494,40.8640113073839,40.8639315006319,40.8638633985356,40.8637937657641,40.8637639714105,40.8637275563138,40.8632543983459,40.8631862157914,40.8630881658962,40.8630731207966,40.8630696568589,40.8630496348548,40.8630296244026,40.8630295470668,40.8630577015233,40.8630904722802,40.8631225253649,40.8630574653678,40.8632380618776,40.8636761023,40.8639196581483,40.8641746594005,40.8644440249751,40.8648299747341,40.8652435735122,40.8656012077668,40.8649382042966,40.864178253844,40.8643067933021,40.8644590311431,40.865151497606,40.8657580614387,40.8679449202575,40.8681690200683,40.8681162886069,40.8681908306235,40.8690136078319,40.8692380322741,40.8696093299175,40.8699331668282,40.8703888529314,40.8701586964823,40.8696716847837,40.8693919909323,40.8690092737918,40.869009351052,40.8692970142679,40.8698790058607,40.869484735938,40.868831407546,40.8684382174912,40.8682841467267,40.8683447520242,40.8680406775116,40.8677633442414,40.8673219849901,40.8679259035013,40.8685221816429,40.8690424100958,40.8691854292133,40.8689909804737,40.8691130434261,40.869272314754,40.8693287346624,40.869362895394,40.8694026376885,40.8695039151688,40.8695195344922,40.8696223521744,40.8696738629723,40.8696980207642,40.8697049707044,40.8697358692846,40.8697940986643,40.8698659901865,40.8699516285862,40.8700235843315,40.8700989794188,40.8701572438202,40.8701881634042,40.870267032827,40.8703150410455,40.8703425475583,40.8703358566298,40.8703119643452,40.8702435190159,40.870161383962,40.8701272209044,40.8701189045789,40.8701309464268,40.8701584670675,40.8701962386213,40.8702545656636,40.8703402947359,40.8704054805318,40.8705152129658,40.8705734714483,40.8706619027906,40.8707755693328,40.8708680108848,40.8709467975159,40.8710153197369,40.8710804288825,40.8711455879546,40.8712347218955,40.8713128945592,40.8714951055809,40.8716698153057,40.8718923723048,40.8720395347704,40.8721488906749,40.8721760832805,40.8722238451973,40.8722819632358,40.8723504150064,40.8724257890439,40.872504505644,40.8726004018771,40.8727167766223,40.8728161128329,40.8728676093388,40.8728917672363,40.8728680568229,40.8727653995038,40.8726591904556,40.8725667206577,40.8725394372957,40.8725877092224,40.8726255917027,40.8726822336533,40.8731234751391,40.8730704826966,40.8730258452851,40.8729982407204,40.8729980660033,40.8730253071811,40.8731005412724,40.873179222798,40.8732476394419,40.8733263704203,40.8734016107943,40.8734357178889,40.8734766341206,40.8735107686046,40.8735484424099,40.8736182723589,40.87402886703,40.8741800978084,40.874156294929,40.8737270073053,40.874774245106,40.8744922187227,40.8744406763425,40.874399381489,40.8743477941932,40.8743270912607,40.8742960247002,40.874227404946,40.874165672702,40.8741415913919,40.8741962972055,40.8742717132958,40.8743163020558,40.8743848728088,40.8744499609696,40.8744824634302,40.8744531705639,40.8744324725364,40.8743809265567,40.8742780246239,40.8741923511971,40.8741305836315,40.8741065437138,40.8740139199853,40.8739282465336,40.8738495304129,40.8737844909842,40.8737125217068,40.8736325843811,40.8735719399875,40.8734828184168,40.873438188437,40.8734071698935,40.8734103996552,40.8734032159197,40.8733962429502,40.8733926199197,40.8734027074876,40.8734505735289,40.8735189542729,40.8735770561045,40.8736146301864,40.8736694045422,40.873724223059,40.8737518156211,40.8737827419412,40.8738307918303,40.8738378498589,40.8737900819958,40.8737217490685,40.873677430623,40.873825146791,40.8740327659749,40.8740132721355,40.8739925045559,40.8739888733763,40.874026264024,40.8740741300639,40.8741460422178,40.8742316804202,40.8743310451728,40.8743892814406,40.8744788102496,40.8742596475247,40.8742222570761,40.8746445681211,40.8748900604354,40.8748262632379,40.8747818570075,40.87476490934,40.8747789507812,40.8747895926432,40.8748138906004,40.8748655616139,40.8750096951489,40.8750782935681,40.8751450770311,40.8753205624844,40.8752730435382,40.8752078558158,40.875142690722,40.8750942712462,40.8751145323568,40.8752033586147,40.8752681869193,40.8753502733659,40.8754769615209,40.8755968535819,40.8757175039796,40.8760891543194,40.8761632490526,40.8762606272908,40.8763824434809,40.8764739442829,40.8765167304951,40.8765776889965,40.8766446633311,40.8767360251329,40.8767969590969,40.8768579676436,40.8769007912084,40.8769374987093,40.8770168163964,40.8771022625756,40.8771998792283,40.8772548701486,40.8772383102338,40.8770356255022,40.8769076309278,40.8767735583585,40.8766334181018,40.876444527503,40.8763104793334,40.8762007701225,40.876091084863,40.8760363293031,40.8760243481086,40.8761036526003,40.8761889992882,40.8762842102297,40.8763432133391,40.8764203898758,40.8765130305437,40.8766031015197,40.8766982387465,40.8767778803634,40.8768600432062,40.8769395950872,40.8770062989727,40.877034110919,40.8770833756946,40.8771810026485,40.8773223087981,40.8773917350813,40.8774508925245,40.8775151785348,40.877566583074,40.8775766153299,40.8776458367722,40.8777279411969,40.8778562674158,40.8778972280087,40.8779765584109,40.8780585839404,40.8781329967369,40.8782126581709,40.8782872397002,40.8783728179983,40.8793989398313,40.8794774018219,40.8796177173474,40.8797203600582,40.8797785188811,40.8798436562209,40.8798643324925,40.8798702623853,40.8798884345421,40.8799262132465,40.8799638998775,40.880018619898,40.8801761065407,40.880251480469,40.8802994606635,40.8803612495017,40.8804332461496,40.8804914899266,40.8805942090375,40.8807140733535,40.8808202546101,40.8808784556719,40.8809503685833,40.8810085419844,40.8810186795125,40.8810287876173,40.8810354496452,40.8810535528875,40.8810626964095,40.8811002854224,40.8811755388404,40.8812200360964,40.8812506867433,40.8812539931001,40.8812777987986,40.8813222742488,40.881370246264,40.8813943560487,40.8814116422214,40.8814324042501,40.8814805464064,40.8815148982233,40.8815767725229,40.881645379202,40.8817173131852,40.8818371627549,40.8819295902437,40.8819534099604,40.8819852500399,40.8819976737357,40.8820352261169,40.8820899450981,40.8821344912757,40.8821552239129,40.8821397606293,40.8821314114457,40.8821212808493,40.8821420355082,40.8822311483099,40.8823098922932,40.882364569646,40.8824295941551,40.8824912780185,40.8825805530889,40.8826354979275,40.8827040270491,40.8828307495686,40.8830361742374,40.8831525549056,40.8832619860428,40.8833818206694,40.8834537127159,40.8835628208178,40.8841495338816,40.8848592758615,40.8856040216303,40.8856692545738,40.8857795888202,40.8860369947318,40.8862943058646,40.8864809505426,40.886687446138,40.8867012210169,40.8867110242098,40.8867196609628,40.8867482325351,40.8867719646752,40.886782132484,40.8867787092492,40.8867150106628,40.886704339445,40.8866355878137,40.8865511521453,40.8864512425234,40.8863360754263,40.8862144769812,40.8861132918981,40.8860443136392,40.8859908313415,40.885953252398,40.8859318138162]}]],[[{"lng":[-73.8705373858619,-73.8705349472268,-73.8705332008308,-73.8705289732455,-73.8705262166591,-73.8705162978047,-73.8705147333307,-73.8705105705784,-73.8704995802517,-73.8704978339237,-73.8704918698942,-73.8704550899089,-73.8704212750105,-73.8704054090955,-73.8703974597621,-73.8703974292502,-73.8704053172813,-73.8704211215406,-73.8704448372036,-73.8705793765648,-73.8708840924882,-73.870978451588,-73.871032688736,-73.8710826251279,-73.871075981354,-73.871075946214,-73.8710758042858,-73.8710496749069,-73.8710494493611,-73.8710490592804,-73.8710027274176,-73.8710022767302,-73.8710017310579,-73.8709446220235,-73.8709441363487,-73.8709436611869,-73.8708901115479,-73.8708898383245,-73.8708896254351,-73.8708775412073,-73.8708488737839,-73.869548681047,-73.8688962278839,-73.8687254040077,-73.8686027851912,-73.8684993643155,-73.868393769371,-73.8682890763312,-73.8681883055873,-73.8684153962974,-73.8687675298734,-73.8688785903134,-73.8690762464051,-73.8692739124451,-73.8693912567731,-73.8698884222067,-73.8699037951237,-73.8699042156866,-73.8698893954676,-73.8698596035482,-73.8698157618704,-73.8693767539613,-73.8691666873424,-73.8687226323057,-73.8686369587995,-73.8682346608126,-73.8683745379487,-73.8692094456987,-73.8695236295179,-73.8695625908049,-73.8688924327461,-73.8694120846032,-73.8709625407474,-73.8717903848607,-73.8718461029101,-73.8719023725062,-73.873056329373,-73.8740146905165,-73.8742738632541,-73.8745917543696,-73.8760844866913,-73.8767987212558,-73.8768045292585,-73.8768758605487,-73.876978028221,-73.8779813134473,-73.8772445605829,-73.8771605358724,-73.87729884832,-73.8774527610744,-73.8789334114153,-73.8805558967974,-73.8826002220831,-73.8827383578705,-73.8825688771652,-73.882436695103,-73.8820355312086,-73.8818556767412,-73.8805922515002,-73.8806289285238,-73.8806485810509,-73.8806668466648,-73.8807157751575,-73.8806908860829,-73.8807664263229,-73.8807933004684,-73.8808112834161,-73.8808248274317,-73.8808338762021,-73.8808163119302,-73.8808081789906,-73.8807235341719,-73.8803543879808,-73.880562139514,-73.8811936679622,-73.881491065687,-73.8818656867116,-73.8821935638197,-73.8837131635657,-73.8838043043127,-73.883835149305,-73.8837836605134,-73.8837573289644,-73.8837128967282,-73.8836142989056,-73.8835152021354,-73.8834306953468,-73.8826279138773,-73.8826871439014,-73.8827365885678,-73.8826762473331,-73.8827179466861,-73.882975370899,-73.8830938243834,-73.881338555091,-73.8799138038693,-73.8798120630492,-73.8777275301841,-73.8769435202508,-73.8761925755019,-73.875188501627,-73.8738643255213,-73.87325775324,-73.8729365034524,-73.8728288453104,-73.8727260480977,-73.8721053948861,-73.8720324185373,-73.8719739703499,-73.8714516766864,-73.8705619252466,-73.8705373858619],"lat":[40.8696740314123,40.8695817025373,40.8695155802357,40.8693555333497,40.8692511767946,40.8688756652312,40.8688164328463,40.8686588353671,40.8682427761091,40.8681766549638,40.8679508309931,40.8666328687624,40.8653610804321,40.8650126777974,40.8646641192375,40.8643155084168,40.8639669493373,40.8636185453352,40.8632704000244,40.8614045539279,40.858895181263,40.8581994146533,40.8578077973948,40.8573770401352,40.8573416611482,40.8573414634313,40.85734126459,40.8573051530233,40.8573048376597,40.857304603361,40.8572771127395,40.8572768426904,40.8572767427389,40.857266080502,40.8572659893286,40.8572660519534,40.8572727819314,40.8572728178106,40.8572729164112,40.8572782242686,40.857290817248,40.8577260296799,40.8577727729451,40.8579534337859,40.8580831005448,40.8580948420303,40.8580955587413,40.8580850653844,40.8580638343109,40.857780358143,40.8573407804222,40.857202138337,40.8569455606196,40.8566889825649,40.8565518951769,40.8559710676522,40.8558730216152,40.8557732926938,40.8556738616951,40.8555767281417,40.8554837748537,40.8542657231123,40.8536860460276,40.852423852418,40.8520663552566,40.8509137372163,40.8506733360092,40.8492383728725,40.8486869770853,40.8480187132393,40.8481123221258,40.8472454909397,40.8443336600023,40.8438028143358,40.8437607778558,40.8437208520911,40.8432429321613,40.8425376773162,40.8421389483042,40.8415206475394,40.8420647699207,40.8422997872775,40.842376709033,40.8424026366364,40.8424397705924,40.8428044160759,40.8440094946265,40.8440851998036,40.8441226899081,40.8441644089741,40.8452146566745,40.8463202953062,40.847708461682,40.8478890886555,40.848542763224,40.8503437699291,40.8516434322482,40.8522260962678,40.856739973288,40.8569680516326,40.8570470453411,40.8571256774353,40.8573874020777,40.8576222333998,40.8578059491075,40.8578861738329,40.8579508834032,40.8580901230474,40.858183125617,40.8583215854647,40.8583857190752,40.8588275024044,40.8605693625072,40.8611972295258,40.8616838308439,40.8618785164318,40.8621237619579,40.8624566127224,40.8642919844725,40.864497099854,40.8647585975429,40.864988243559,40.8650625061805,40.8651499981173,40.8652948506201,40.865399532326,40.8654695142063,40.8658587386503,40.8660041558514,40.8660485736041,40.8660891414811,40.8661329657048,40.8664497320037,40.8666021850244,40.8675900882594,40.8683612516643,40.8684166479714,40.8695553386596,40.8699546815721,40.8704769567011,40.8715757563096,40.8715478120277,40.8715319988152,40.8715254458446,40.8715233384195,40.8715213252099,40.8715091683756,40.8715081411355,40.8715082470116,40.8715091853078,40.8715107784538,40.8696740314123]}]],[[{"lng":[-73.9939369418221,-73.9936963935409,-73.9936282272451,-73.9934904641407,-73.993410453874,-73.9933251984328,-73.993203471167,-73.9917579375628,-73.9904532545266,-73.987615120763,-73.9849858236627,-73.9847636926324,-73.9843149130714,-73.9832066141372,-73.9822161951483,-73.9820927124339,-73.9820703645754,-73.9820434160202,-73.9819945280543,-73.9819272175715,-73.9818595171329,-73.9817923254865,-73.9817265346255,-73.981679436394,-73.9816314948657,-73.9815872266128,-73.9815472180972,-73.9815120000456,-73.9814820383939,-73.9814577300632,-73.9814425438969,-73.9814328351072,-73.9814287062246,-73.9814302008462,-73.9814373030395,-73.9814499379241,-73.981467972046,-73.9814912149279,-73.9815281846638,-73.9815712096455,-73.9816196288633,-73.9816726983235,-73.9817296028408,-73.981789468181,-73.9818437441389,-73.9818986635917,-73.9819535150924,-73.9820075877987,-73.9820601816504,-73.9821106153311,-73.9823654503953,-73.982877134552,-73.983131667412,-73.9833665790018,-73.9838218570337,-73.9842823014675,-73.984733937796,-73.9851915222547,-73.9856467779071,-73.9861040615106,-73.9865613853334,-73.9870151455532,-73.9874752469956,-73.9879264069384,-73.9883904457516,-73.9888425380256,-73.9892972754388,-73.989790854016,-73.9902762141258,-73.9907263633971,-73.9911773809228,-73.9916327131064,-73.9920790001106,-73.9925285599189,-73.9929793784412,-73.9934641773624,-73.9939482565986,-73.9943794679031,-73.9948436383084,-73.9952982146095,-73.9957485550705,-73.9961965546697,-73.996647044391,-73.9970990285431,-73.9950143313275,-73.9942625862863,-73.9914185849462,-73.9918710243355,-73.9920664716518,-73.992321823447,-73.9928034094901,-73.9932897332994,-73.9937335385751,-73.9939707175459,-73.9941607833721,-73.9945926491055,-73.9950179854245,-73.9954472576705,-73.9958740945895,-73.9963423696591,-73.9968399386042,-73.9996842297327,-74.0025238141675,-74.0031073388422,-74.0051255345225,-74.0053622202936,-74.0054421484491,-74.006970777244,-74.0077911613479,-74.0082040187844,-74.0086990229636,-74.0087908052275,-74.0088933979832,-74.0090243918132,-74.0091660821697,-74.0090915684619,-74.0092401357502,-74.0092407416011,-74.0096201534891,-74.0095684341177,-74.009584643457,-74.0121194002866,-74.0121372693618,-74.0121481318359,-74.0120900828903,-74.0120690348667,-74.012020850064,-74.0119776334287,-74.0095120176737,-74.0094886836423,-74.0094380087086,-74.0093942693211,-74.0090420750423,-74.0089003296284,-74.0088028352389,-74.0087278005887,-74.0087298635942,-74.0089397584428,-74.0095744061291,-74.0096122792441,-74.0095583292975,-74.0099166081346,-74.009934366777,-74.0099379618493,-74.0099434181672,-74.0099504876915,-74.0099585260134,-74.0099675995942,-74.0099735068339,-74.0099813573934,-74.0099891727314,-74.0099982260171,-74.0099868578482,-74.0098694847473,-74.0098721108548,-74.0101679053539,-74.0101646519737,-74.0100537565622,-74.0100384838461,-74.0100236125255,-74.0100140432371,-74.0100081403346,-74.0099993017061,-74.0099925052406,-74.0099832013266,-74.0099774363877,-74.0099739502192,-74.0099909538,-74.0104692001187,-74.0104883559496,-74.0104918741747,-74.010496934412,-74.0105033278119,-74.0105117165533,-74.0105208343633,-74.0105268166528,-74.0105296845585,-74.0105504475589,-74.0105318816876,-74.0104170066026,-74.0104193720939,-74.0107641978069,-74.0107615604614,-74.0106062154019,-74.0105857920093,-74.0105680109191,-74.0105637084973,-74.0105505692883,-74.0105397820533,-74.0105337353474,-74.010531065377,-74.0105452039216,-74.0111035980488,-74.0111162416329,-74.0111246622997,-74.0111301002903,-74.0111388700692,-74.0111454579553,-74.0111562731594,-74.0111611341844,-74.0111718311983,-74.0111532870984,-74.0110428174823,-74.0110445915083,-74.0113876997418,-74.0113856784533,-74.0112303805723,-74.0112108529406,-74.0112059244744,-74.0111881687194,-74.0111810296499,-74.0111667508279,-74.0111541917691,-74.0111670997612,-74.0117395855281,-74.0117952764573,-74.0117827350079,-74.0116690085347,-74.011670675838,-74.0118364287242,-74.0117745878639,-74.0117702576505,-74.0117663544953,-74.0117827582809,-74.0117189753091,-74.0117112349654,-74.011678855056,-74.0116345125173,-74.0105552490224,-74.0105513347573,-74.0101282138865,-74.0101282116208,-74.0099466846228,-74.0099480791384,-74.0094638985597,-74.0094523667658,-74.0094416512616,-74.0094356221182,-74.0094244364691,-74.0094190072741,-74.009407456683,-74.009401558017,-74.0093906773477,-74.0093852364561,-74.0093804226021,-74.0093763759856,-74.0093636273423,-74.0115338276476,-74.011567829226,-74.0115912343402,-74.0115884687917,-74.011533072467,-74.0115118301826,-74.0114837308755,-74.0114449125047,-74.0092431465868,-74.0091373625993,-74.0095604796237,-74.0095610347623,-74.0095676530036,-74.0095682662656,-74.0095503986724,-74.0095515541536,-74.0099638499687,-74.0099583844546,-74.0099066997004,-74.0099015891296,-74.0113567533773,-74.0113947762349,-74.0114067393552,-74.0113469315847,-74.0113317444169,-74.0113035299375,-74.0112661125396,-74.0090584790134,-74.0089460650232,-74.0089791840597,-74.0089791823762,-74.0090710092756,-74.0090739077035,-74.0094151163657,-74.0094160767253,-74.0095233674152,-74.0095188236012,-74.0111668756154,-74.0111947275115,-74.0112156181342,-74.0112156213041,-74.0111491428189,-74.0111328994299,-74.0111089118299,-74.0110779705922,-74.0099481793803,-74.0095600497867,-74.0095424804558,-74.0095180868652,-74.0094700192251,-74.0094755960083,-74.0092534091792,-74.0091045321573,-74.0106773753261,-74.0105646347644,-74.0090009825945,-74.0087061865058,-74.0087313782998,-74.0086672907182,-74.0086208983944,-74.0085325692502,-74.0087600499351,-74.0091408212,-74.0091266112324,-74.0087456771504,-74.0086511593681,-74.0086431823763,-74.0089691252792,-74.008957422948,-74.0090389596997,-74.0090490979625,-74.0091075797516,-74.0091059682001,-74.0090577400966,-74.0089973491165,-74.0090076280833,-74.0089288765048,-74.0089147242261,-74.0086722376839,-74.008590531017,-74.0085809576047,-74.00866456562,-74.0093408924528,-74.0093279520623,-74.008478955728,-74.0084263644723,-74.0088177981943,-74.0088027370308,-74.0088394166214,-74.0088517356531,-74.0098656696152,-74.0098462792262,-74.0098892261996,-74.009906315196,-74.0099905581975,-74.0099201063179,-74.0099705879702,-74.0099191627549,-74.0097891311643,-74.0098877486832,-74.009838546744,-74.0098305691398,-74.0088299450539,-74.00883632715,-74.0087921009085,-74.0086879221957,-74.0083535283884,-74.0080115224053,-74.0079024561303,-74.0077387246899,-74.0076194961185,-74.0077440483021,-74.0075961898915,-74.0074715799092,-74.0072939465031,-74.0072849994432,-74.0074136203691,-74.0072718117477,-74.0071446836097,-74.0069591741668,-74.0068063576368,-74.0067029184064,-74.0065776765852,-74.0062054892597,-74.0061042218159,-74.0059669102922,-74.0059238384743,-74.0058093816825,-74.0054188584101,-74.0052118770577,-74.0048039256018,-74.0049677707866,-74.0052789479789,-74.0050310513664,-74.0069642874931,-74.0069937526847,-74.0070103830496,-74.0070035890402,-74.0065295998784,-74.0065068764018,-74.0064758837196,-74.0064435290131,-74.0063151593525,-74.0045048309391,-74.0042062912539,-74.0039074203277,-74.0038065783501,-74.0040798895684,-74.0042469712806,-74.0042024743225,-74.0041486381469,-74.0042448758826,-74.0042596785672,-74.0043188942508,-74.0042686965067,-74.0042105934565,-74.00422266067,-74.004131716228,-74.0041116200779,-74.0036689145354,-74.0035725104008,-74.0039285493356,-74.003825595952,-74.003588009112,-74.0033848822989,-74.003133389914,-74.0027869155261,-74.0023352813006,-74.0045452098343,-74.0045581436139,-74.0045564156092,-74.0044495152728,-74.0044270965925,-74.0043997620352,-74.0022008207327,-74.0017882402231,-74.0015330906698,-74.0037573503769,-74.0036121479418,-74.001386036986,-74.0009730802202,-74.0031497698899,-74.0029480951572,-74.0030616123407,-74.0031345833622,-74.0031619457704,-74.0032227558536,-74.0031558705818,-74.003146529668,-74.0031360601927,-74.0031247515453,-74.0031129163109,-74.0031008816301,-74.0030889801569,-74.0010636422051,-74.0007310525373,-73.9999271236773,-73.9996385355537,-73.9996226345819,-73.9995176709682,-73.9994464221732,-73.9994333072462,-73.9991509808791,-74.0022743664237,-74.0022880237148,-74.0020571383156,-74.0020245433033,-73.9991999724674,-73.9991083256455,-73.9988847317499,-73.9985763853054,-73.9985997870763,-73.9986348787634,-73.9986653047344,-73.9986863747722,-73.998695730373,-73.9986887069456,-73.9986676471138,-73.9986337155607,-73.9985892410515,-73.9984827646868,-73.9984383037147,-73.9984020251825,-73.9983582973387,-73.9982911984643,-73.9982709030835,-73.9982816070953,-74.001542178712,-74.0015733538527,-74.0015618057548,-74.001394371595,-74.0013643461298,-74.00131469636,-74.0012939101499,-73.9981567843898,-73.9981481864737,-73.9980667590535,-73.997721348257,-73.9973780844797,-74.000628373953,-74.000650167862,-74.0006495053042,-74.0004548933672,-74.0004176539319,-74.0003858648908,-73.9971558894921,-73.996815984635,-73.9964571540504,-73.999728191901,-73.9997359024785,-73.9995551893079,-73.9995155216161,-73.9994725373402,-73.9970717603931,-73.9970262882107,-73.9971503547715,-73.9970107141383,-73.9968931131237,-73.9965712643958,-73.999026828329,-73.9987620691432,-73.9963132702209,-73.9958800435168,-73.996016931962,-73.9959007742503,-73.9957673328362,-73.995424744363,-73.995756482129,-73.9957085906995,-73.9957977402045,-73.9958168757904,-73.9959128360384,-73.9959280367067,-73.9960017574905,-73.9958999010094,-73.9958926089489,-73.9958543725281,-73.9957911774878,-73.9958280588624,-73.9957299331441,-73.9957512341283,-73.9956298224031,-73.9956230690437,-73.9953056636536,-73.9951239555689,-73.9949901448208,-73.994957333537,-73.9949350165901,-73.9949238579442,-73.9949258212064,-73.9950091543872,-73.994978307712,-73.9949768849473,-73.9970732816931,-73.9968729144914,-73.9947740793082,-73.9944450129338,-73.9954551499559,-73.9962297200194,-73.9961208799467,-73.9943419199162,-73.9942497922865,-73.9941632845631,-73.9938310820309,-73.9938875450246,-73.993891252437,-73.9939625855146,-73.9940126248051,-73.9941220580824,-73.9941366525886,-73.9943013423911,-73.9942815351345,-73.994376552751,-73.9943186346871,-73.9942940298238,-73.9950232758607,-73.9950710879696,-73.9950893918929,-73.9950139637168,-73.9950502846992,-73.9962406518988,-73.996195837471,-73.9961084688084,-73.99610778143,-73.9960631680818,-73.9961269777373,-73.9961285048278,-73.9961263614022,-73.9960988073697,-73.9961183510278,-73.9961794599738,-73.9960952452262,-73.9960512527533,-73.9955722651611,-73.9939369418221],"lat":[40.7731795109669,40.7730348322204,40.772993650359,40.7729289052621,40.7728788953456,40.7728314795376,40.7727798103924,40.7721661445151,40.7716122483408,40.7704154431329,40.7693207012287,40.7692264007039,40.7698481832134,40.7693793797666,40.7689604232602,40.7688922989298,40.768531121716,40.7684082108152,40.7684160487471,40.7684215792369,40.7684211865087,40.7684148757762,40.7684027308167,40.7683901309362,40.7683679283408,40.7683416844789,40.7683117470297,40.7682785120951,40.7682424205412,40.7682039505063,40.7681639696596,40.7681230149501,40.7680815189263,40.768039919853,40.7679986570501,40.7679581663392,40.7679188753653,40.767881199101,40.7678422397838,40.7678070569482,40.7677761911146,40.7677501163631,40.7677292333884,40.7677138630184,40.7677072053479,40.76770527993,40.7677081117074,40.7677156630808,40.7677278370948,40.7677444760438,40.7673921532134,40.7667155951407,40.7663669830552,40.7660452418662,40.7654184746975,40.7647918145993,40.7641691048775,40.7635436746478,40.762914874483,40.7622899526043,40.7616601223625,40.7610373674779,40.760404786886,40.7597902771578,40.7591641861778,40.7585334990581,40.7579066376497,40.7572331319189,40.7565675650496,40.7559504055648,40.7553298485813,40.7547068050096,40.7540911158654,40.7534739128927,40.7528534028991,40.7521900552677,40.7515222216601,40.7509303898028,40.7502933089629,40.7496716826001,40.749052196221,40.7484393277447,40.7478227290828,40.7472051020423,40.7463223271801,40.7460039813579,40.7448026824962,40.7441855709463,40.7439162027063,40.7435680934219,40.7429100202034,40.7422342815498,40.7416222018193,40.7412984387316,40.7410288222935,40.7404419809084,40.73986001125,40.7392683845799,40.7386859456654,40.7380452320566,40.7373608893982,40.7385524738161,40.7397526436422,40.739997520559,40.7408502130684,40.740949503518,40.7409821402617,40.7416271271582,40.7419708442441,40.7421475187909,40.7423617239634,40.7423751437236,40.7423841671893,40.7423997433102,40.7424165914635,40.7428861490724,40.74289951841,40.7429131608634,40.7429512483898,40.7432577847264,40.7432635204831,40.7435166121826,40.7435319270593,40.7435593015476,40.7438976376489,40.7439224935484,40.7439397702089,40.743935560421,40.7436760937603,40.7436956816821,40.7439712554731,40.7439687168382,40.7439338712551,40.743917927096,40.7444393476242,40.74485823291,40.7448815378297,40.7449092173325,40.7449929086628,40.7449979031506,40.7452888252987,40.7453272550071,40.7453170781019,40.7452967014105,40.7452657697364,40.7452256903209,40.7451801196466,40.7451286811085,40.7450951941158,40.7450506823885,40.7450063842595,40.7449550593021,40.7449441642152,40.7449339177072,40.7449165021258,40.7449423297096,40.7449639246298,40.7449542349299,40.7449634580782,40.745046345318,40.7450996766156,40.7451325767656,40.7451818397911,40.7452197190643,40.7452715730887,40.745303703609,40.7453231351093,40.7453366861714,40.745386766029,40.7453757150947,40.7453551670138,40.7453256154308,40.7452882709089,40.7452392752584,40.7451860213588,40.7451510807061,40.7451343325126,40.7450130572075,40.7450029823718,40.7449935827034,40.7449768241711,40.7450050320208,40.7450237261835,40.7450110164743,40.7450204465616,40.7451379328264,40.7451663622532,40.7452531820779,40.7453244554194,40.745364407457,40.7453820503895,40.7453921350116,40.745447670244,40.7454361246255,40.7453777622025,40.7453432283256,40.7452875486319,40.7452457207186,40.7451770471562,40.745146176461,40.7450782582834,40.7450686430703,40.7450609634236,40.7450462124021,40.7450731126826,40.7450880081415,40.7450758306627,40.7451708041852,40.7451947706308,40.7452811260917,40.7453158494414,40.7453852979819,40.745446378084,40.74546035254,40.7455199181902,40.745154666985,40.7451349561284,40.7451273311914,40.7451139773398,40.7451259636788,40.7455248464214,40.7455527840376,40.7455779800435,40.7456015722554,40.7459398449978,40.7459612591517,40.745979461816,40.7459783948062,40.7458711044229,40.7459028839997,40.745857238929,40.7458423354631,40.7458195144457,40.745800170912,40.7457501436595,40.7458174733884,40.7458800352528,40.7459152427185,40.7459805483631,40.7460122472772,40.7460796956091,40.7461141366291,40.7461776559118,40.7462094268606,40.7462375368081,40.7462611638593,40.7463356019773,40.7465677547123,40.746579452169,40.746601505476,40.7466280744022,40.746966826948,40.7469846036005,40.7469905887653,40.7469862850285,40.7467627907537,40.747359762803,40.7474027996046,40.7473877335953,40.7473878774532,40.7473710834066,40.7473707061128,40.7473393417679,40.7473778030126,40.7474116720829,40.7474068496085,40.7474384843489,40.7475924183468,40.7476109021087,40.7476305500681,40.7479762059952,40.748000575342,40.7480145719089,40.7480137191812,40.7477856453329,40.7484118931688,40.748412709627,40.7484002193805,40.7484097672064,40.7483950617009,40.7484295869173,40.748436935038,40.7484479568083,40.748473540436,40.7486450467662,40.7486568141139,40.7486779922436,40.7486968211758,40.7490257472649,40.749041633831,40.7490498759196,40.7490516431173,40.7489319880057,40.749935041289,40.7500009490234,40.7501070047815,40.7500811641566,40.7500751577196,40.749985205722,40.7503710697304,40.7510226744769,40.7513214621013,40.7506481837826,40.7514268050034,40.7514658949698,40.7516281972208,40.7516525779225,40.7518836093044,40.7519480142071,40.7520975940991,40.752116895735,40.7519643953271,40.7519395126157,40.751956502032,40.7520767914788,40.752090225131,40.7521251556499,40.7521183494431,40.7521397121119,40.7521421249495,40.7522143512432,40.7521891059472,40.7521768422368,40.7521440018702,40.7521636284759,40.7520622500008,40.7520281054344,40.7520438824116,40.7520728678769,40.7523556095456,40.7523735030462,40.7520185719199,40.7521578502393,40.7523243458542,40.7523448540372,40.7523588165347,40.752342281773,40.7527634131393,40.7527854419594,40.7528036810282,40.7527804111984,40.7528161871491,40.7529121255144,40.7529335641532,40.7530035914592,40.7529483700877,40.7528140776533,40.7527949679831,40.7528034642446,40.7523800160072,40.7523715211096,40.7523521383795,40.7524939986284,40.7523507393423,40.7532564521095,40.7535426115119,40.7539721578186,40.7542818417741,40.7543368019317,40.7545305507342,40.7544770199213,40.7547231844509,40.7547355682032,40.7547893026695,40.7549855945353,40.7549324811735,40.7551807948494,40.7553917756404,40.755532367491,40.755706871434,40.7562208434685,40.7563605196206,40.7565581424329,40.7566202356342,40.756789341981,40.7573231403492,40.7572319985399,40.7578098431647,40.757884164448,40.7580285549283,40.7583570164732,40.7591600575616,40.7591761476427,40.7592037203867,40.7592318703411,40.7598747512412,40.7598920323172,40.7598936012681,40.7598904604646,40.7598428220447,40.7590849965527,40.7595017076884,40.7593756921835,40.759510731466,40.7596260447428,40.7596992141714,40.7597610718818,40.7598359141708,40.7598865731666,40.7598753076786,40.7599106857635,40.7599592795159,40.75992456661,40.7599131030437,40.759861642396,40.7598930073072,40.7597059695766,40.7598465589732,40.7600030197205,40.7601331366669,40.7604517069513,40.7607288707064,40.7610783450963,40.7609289697034,40.7615437270017,40.7624928019449,40.7625078760754,40.7625242650251,40.7626645672,40.7626757073564,40.7626713590988,40.7617284322265,40.7622945201417,40.7626445981276,40.7635822416406,40.7637770439098,40.7628500950019,40.7634202717257,40.7643328886872,40.7646168359314,40.7646657826534,40.7646495982067,40.7646126104546,40.7646380376703,40.76473050988,40.7647362813837,40.7647407964326,40.764743930225,40.764745596139,40.7647457481267,40.7647443819868,40.7638882082629,40.7637552863614,40.7634065284794,40.7635690709908,40.7635590812105,40.7637062791803,40.7638061945785,40.763823910197,40.7642052595827,40.7655251810996,40.7655615437953,40.7658773904186,40.7658932665704,40.7647019149825,40.7646624998576,40.7645693770485,40.7649986072708,40.765073340286,40.7650857947378,40.7651044807472,40.7651373942678,40.7651747656796,40.7652085704499,40.765237035343,40.7652601687412,40.7652761788068,40.7652975369844,40.7653162138339,40.7653509090876,40.7654180487638,40.7655210727588,40.7655522334133,40.7655677749348,40.7669447025327,40.7669771922107,40.7669964993683,40.7672300477331,40.7672493639711,40.76725112005,40.7672414582416,40.7658940353741,40.765905607075,40.7658718811357,40.7663491205558,40.766823385877,40.7682031110587,40.7682203737867,40.7682452361056,40.7685041956801,40.7685124799644,40.7685041959319,40.7671286961728,40.7676006218592,40.7680988157957,40.7694735066337,40.7695061773316,40.7697508077401,40.7697675658379,40.7697642154718,40.7687326435769,40.7687955156239,40.7688473877134,40.7690287906537,40.768979629322,40.7694245682739,40.7704632729821,40.7708250567093,40.7697988363364,40.7704005795149,40.7704548488862,40.770613123501,40.7705545959539,40.771031615168,40.7711606684658,40.771225812533,40.7712825627641,40.7712565164156,40.7712978556238,40.7712751028377,40.7713074653306,40.7714502985821,40.7714470870246,40.7714991807485,40.7714755188204,40.7714216672224,40.7713788187937,40.7713542822772,40.7713252926281,40.7713369575129,40.7711960049096,40.7714507382671,40.7714407098065,40.7714491906977,40.7714681460754,40.7714856059375,40.7715160424055,40.7716073399442,40.7716452494733,40.7716587749234,40.772542868902,40.7728174812286,40.7719295475302,40.7723771265884,40.7728026750291,40.7731289750453,40.773275391093,40.7725247819435,40.7725264851382,40.7724871910213,40.7729317878507,40.7729557441639,40.7729551948768,40.772944653909,40.7728828461294,40.7729240585235,40.7729018701743,40.772970028664,40.7729938015668,40.7730395511014,40.7731214402703,40.7731562439918,40.7734811965762,40.7734141386659,40.7733884750392,40.7733580349244,40.7732971531899,40.7737897913977,40.7738523561841,40.7738163160151,40.7738173776011,40.7738868866101,40.7739133546209,40.7739139849032,40.7739167136542,40.7739518052991,40.7739603239614,40.7739869543515,40.7740861864377,40.7740688958032,40.7738707313943,40.7731795109669]}]],[[{"lng":[-73.9582921680775,-73.955958623714,-73.9552936159939,-73.9543316200652,-73.9541276615553,-73.9529867271405,-73.9520634525867,-73.9496756738763,-73.9486972516062,-73.948617780266,-73.9481927600092,-73.9477679288616,-73.9473433076129,-73.9469189146633,-73.9441512012041,-73.9431895075241,-73.9418326671478,-73.9417385886041,-73.9413766379648,-73.9405720421218,-73.9398351826436,-73.9386249249757,-73.9379107701372,-73.9371448242304,-73.9369658361889,-73.9361031306121,-73.9360224075648,-73.9358583708006,-73.9330808422055,-73.9327806834982,-73.9326755251739,-73.9311558184399,-73.931058761596,-73.9303176269034,-73.9300709182586,-73.9299300776955,-73.9282261392396,-73.9278423987194,-73.927722291609,-73.9275399130746,-73.9271490150459,-73.9270268374548,-73.9266041949648,-73.9251205069533,-73.9250569711535,-73.9247828359688,-73.9237887342265,-73.9228218505646,-73.9226854032338,-73.9218236101579,-73.9218323249591,-73.9219009052173,-73.9219749528721,-73.9220484332064,-73.9221315337918,-73.9222144438704,-73.9222995036711,-73.922384017885,-73.9224535544231,-73.9224669682933,-73.9225443223555,-73.9226135432244,-73.9226321076668,-73.9226553004528,-73.9227271424125,-73.9227525722044,-73.9228110659905,-73.9230343938023,-73.9231197845566,-73.9232322460333,-73.9233103976441,-73.9242446727456,-73.9243909938475,-73.925462701954,-73.9259220154963,-73.9263797054922,-73.9273935002171,-73.927711889418,-73.9282287237976,-73.928722045946,-73.9286920062813,-73.9286840449078,-73.9285985544817,-73.9285246975042,-73.92844239741,-73.9283698750737,-73.9283599500501,-73.928349671659,-73.9311193782087,-73.9338877367781,-73.9366570204557,-73.939426956198,-73.9421962844687,-73.9449646848674,-73.945226455804,-73.9463846338309,-73.9477299632891,-73.9505022756118,-73.950874696308,-73.951604648875,-73.9516049595336,-73.9532701974491,-73.9552696365476,-73.957973172018,-73.9590472528542,-73.9613369555931,-73.9625712308473,-73.9627450864405,-73.9629930792292,-73.9632395478874,-73.9634843452673,-73.9637273252179,-73.9639683427011,-73.9642072537957,-73.9644439158614,-73.9646781875988,-73.9650133153311,-73.9653520574662,-73.9656941903139,-73.9660394879417,-73.9663877221241,-73.9667386630812,-73.9670920790557,-73.9674477366532,-73.9675970682695,-73.9677475223481,-73.9678989080235,-73.9680510332478,-73.9682037051064,-73.9683567298466,-73.9685099133405,-73.9686630612583,-73.9687744411689,-73.9689420641728,-73.9688810410428,-73.9688287645491,-73.9688040865352,-73.9687718168702,-73.9687466164817,-73.968728537666,-73.9687176178786,-73.9687138798545,-73.9687173313841,-73.9687414350502,-73.9687820209156,-73.968838901863,-73.9689115461731,-73.9689991853133,-73.9690595480464,-73.9691281508859,-73.9692046860833,-73.9692888102982,-73.9693801461669,-73.9694782839282,-73.9695827833093,-73.9696931754916,-73.9698094747164,-73.9699425635073,-73.9700894257936,-73.9702454870791,-73.9704048696478,-73.9705611137667,-73.9707080104976,-73.9708404133681,-73.9709547358534,-73.9710491910434,-73.9714229284868,-73.9718859677281,-73.9724449244621,-73.9727161502031,-73.9730525161378,-73.9735088335376,-73.9743104817796,-73.9746911837325,-73.9751431678887,-73.9745039588365,-73.9741044872183,-73.9739775765495,-73.974391442015,-73.9742267139578,-73.9739560163829,-73.9708260260517,-73.967678283782,-73.9674779632189,-73.9675069776285,-73.9675319676566,-73.9665724714336,-73.9655104335493,-73.9644217717163,-73.9643588344663,-73.9641038822544,-73.963292055495,-73.9613465588579,-73.9582921680775],"lat":[40.6798311339974,40.679346246648,40.679203151044,40.6790008660091,40.6789579768564,40.6787219954922,40.6785863307184,40.6784566816829,40.6784171310243,40.6784141778994,40.6783940706042,40.6783717684003,40.6783472717036,40.6783205817603,40.6781563587821,40.6781070809375,40.6780331010679,40.6780279745302,40.6780082308145,40.6779701955117,40.6779239034292,40.6778625695826,40.6778251934446,40.6777850557325,40.6777752500837,40.6777280021484,40.6777235804611,40.6777146016177,40.6775632812163,40.6775469609287,40.6775412435403,40.6774586230558,40.6774533415934,40.6774130382625,40.6773983719681,40.6773900020347,40.6772886878607,40.6772670523661,40.6772603038453,40.6772500493469,40.6772297124079,40.6772233582208,40.6772013782941,40.6771197269922,40.6771162276846,40.6771011446901,40.6770460726329,40.6769915503554,40.676984280015,40.676938358473,40.6768490422612,40.6761316215471,40.6753485477724,40.6745743971981,40.6736838895097,40.6727916335527,40.6719002621009,40.6710087634733,40.6702611488539,40.6701169302558,40.6692758106947,40.6685641072422,40.6683732110646,40.668127115014,40.6673650564269,40.6670973329621,40.6670717607138,40.6669741259334,40.666936793632,40.66688762807,40.6668534604254,40.6664450003867,40.6663814232779,40.6659167519916,40.6657150352015,40.6655148926442,40.6650747161542,40.6649343279918,40.6647098651863,40.6644955696853,40.6649622973766,40.6650860232743,40.6659705388988,40.666866560048,40.6676722095451,40.6684348201971,40.6685152024712,40.6686471946908,40.6687985425918,40.66895044556,40.669100570778,40.669248684167,40.6694033043445,40.6695558745457,40.6695705836165,40.6696366798575,40.66971344241,40.6698653518951,40.6698870998396,40.6699237033007,40.669923718844,40.670007205105,40.6701249048541,40.6706572740763,40.6708822675465,40.6713567714725,40.6716222448873,40.6717889828106,40.6718341763298,40.6718839698781,40.6719383337282,40.6719972354242,40.6720606396264,40.6721285086583,40.6722008020009,40.6722774764937,40.6723878435016,40.6724916178564,40.6725887310254,40.6726791188748,40.6727627213398,40.6728394835842,40.6729093549135,40.6729722891836,40.672998311997,40.6730202693967,40.6730381335276,40.6730518817272,40.6730614965438,40.6730669657887,40.6730682825236,40.673065445078,40.6729423672122,40.6728874912704,40.6729803530394,40.6731421769533,40.6732106748991,40.6733283421157,40.6734470058822,40.6735664201242,40.673686336847,40.67380650774,40.6739266835992,40.6740891068388,40.6742503536401,40.6744089769976,40.6745635626416,40.6747127763116,40.6748080325343,40.6748999985297,40.674988261699,40.675072426054,40.6751521142118,40.6752269684347,40.6752966528895,40.675360854936,40.6754206342893,40.6754689008809,40.675502122886,40.6755173738668,40.675512939303,40.6754885756179,40.6754456760798,40.6753869692849,40.6753161182099,40.6752371128027,40.6757546336564,40.6763946529768,40.6771620086036,40.6775228106869,40.6779986773799,40.6786391209694,40.6797348230713,40.6802666168047,40.6808719053068,40.6807332033245,40.6806496724439,40.6809832759687,40.6810461702467,40.681504639034,40.6822697328902,40.6816159417546,40.6809554553115,40.6815862903941,40.6816870214012,40.6817687836176,40.681564814365,40.6813440199768,40.6811190793324,40.6811058760987,40.681052391877,40.680881585896,40.680463524301,40.6798311339974]}]],[[{"lng":[-73.9625712308473,-73.9625410816496,-73.962523265969,-73.9621944718203,-73.9621102108679,-73.9619965757854,-73.9618065873623,-73.9616162763689,-73.9612579166136,-73.9611088685433,-73.9609559545363,-73.962131463956,-73.9622497383514,-73.9623882227418,-73.9628071076408,-73.9628656957107,-73.9629176798521,-73.962962766,-73.9630006991152,-73.9630312649951,-73.9630542903218,-73.9630696448626,-73.9630772417813,-73.9628129850858,-73.9624553663317,-73.961880864398,-73.9641466633954,-73.9662132202526,-73.9714562030853,-73.9717057070882,-73.9722222860573,-73.972328462881,-73.9723690104418,-73.9724290563281,-73.9726828851762,-73.9730510359984,-73.9732662806725,-73.9735549395919,-73.9737918996636,-73.9740445824795,-73.9740727874031,-73.9740728117791,-73.9740728354952,-73.9741195339228,-73.9741845515246,-73.9741845752545,-73.9742673549582,-73.9743670129249,-73.9744823403471,-73.9751573810001,-73.9775117140598,-73.9795787009564,-73.9796198663508,-73.9796200437267,-73.9796202571621,-73.9796801993435,-73.9796803298229,-73.979680495715,-73.9797565750851,-73.9797568353644,-73.9797570839648,-73.9798419793285,-73.9798422756669,-73.9798426188445,-73.9799265629445,-73.9799267048356,-73.9799268238399,-73.9800008903387,-73.9800011389069,-73.9800013861361,-73.9800602537324,-73.9801196428517,-73.9801199153776,-73.9801201271727,-73.9801718613518,-73.9801720148655,-73.9801720977647,-73.9802099218457,-73.9802100522445,-73.9802101227924,-73.9802289430904,-73.980229025947,-73.9802290135527,-73.9802271619049,-73.9802271618675,-73.9802271035243,-73.9802065458748,-73.9802064507635,-73.9802062856975,-73.9801716110372,-73.9801344146106,-73.9800911597291,-73.9800427586837,-73.9799902323078,-73.9799346884464,-73.9798772987375,-73.9798192734448,-73.9797618363971,-73.9797061990158,-73.9796535347633,-73.9793505994626,-73.9788547591815,-73.9783494522871,-73.9778427509164,-73.9773425303496,-73.9768451680885,-73.9763338616919,-73.9758313228491,-73.9753371462465,-73.9748332761671,-73.9743309359185,-73.9738252853462,-73.9733228431905,-73.972819906653,-73.9723172091348,-73.9718159465479,-73.9713252639015,-73.9708544070116,-73.9705026252364,-73.970407345277,-73.9708789450566,-73.9709110838728,-73.9709834176223,-73.9710512914015,-73.9711145821566,-73.9711731751398,-73.9712269643708,-73.9712758520266,-73.9713197494639,-73.9713585770846,-73.971381345661,-73.9713814371047,-73.9713815054419,-73.9714391947519,-73.9714696602279,-73.9714782916489,-73.9714648996102,-73.9714297341057,-73.9714123329649,-73.9713859555711,-73.9713507283514,-73.9713068201652,-73.9712544419753,-73.9711938443834,-73.9711253178971,-73.9710491910434,-73.9709547358534,-73.9708404133681,-73.9707080104976,-73.9705611137667,-73.9704048696478,-73.9702454870791,-73.9700894257936,-73.9699425635073,-73.9698094747164,-73.9696931754916,-73.9695827833093,-73.9694782839282,-73.9693801461669,-73.9692888102982,-73.9692046860833,-73.9691281508859,-73.9690595480464,-73.9689991853133,-73.9689115461731,-73.968838901863,-73.9687820209156,-73.9687414350502,-73.9687173313841,-73.9687138798545,-73.9687176178786,-73.968728537666,-73.9687466164817,-73.9687718168702,-73.9688040865352,-73.9688287645491,-73.9688810410428,-73.9689420641728,-73.9687744411689,-73.9686630612583,-73.9685099133405,-73.9683567298466,-73.9682037051064,-73.9680510332478,-73.9678989080235,-73.9677475223481,-73.9675970682695,-73.9674477366532,-73.9670920790557,-73.9667386630812,-73.9663877221241,-73.9660394879417,-73.9656941903139,-73.9653520574662,-73.9650133153311,-73.9646781875988,-73.9644439158614,-73.9642072537957,-73.9639683427011,-73.9637273252179,-73.9634843452673,-73.9632395478874,-73.9629930792292,-73.9627450864405,-73.9625712308473],"lat":[40.6716222448873,40.6714601187114,40.6713797387427,40.6696410297926,40.6691956971909,40.668662869889,40.667681226904,40.6666952157605,40.6648018234093,40.6640623236647,40.6632850548343,40.6632081631204,40.663198678195,40.6630896130645,40.6627181111361,40.6626528824221,40.6625844849145,40.6625133055532,40.6624397470141,40.6623642251591,40.6622871674729,40.6622090098859,40.6621301945495,40.6605093928109,40.6582869780274,40.6548811920523,40.6539949723505,40.6531894045468,40.6511403124624,40.6511099064229,40.6510469517658,40.6513979285803,40.6515399489964,40.6517502587451,40.6526392779873,40.6539125067717,40.6546492613319,40.6556439390754,40.6563923239465,40.6573472525429,40.6575209783584,40.6575210859169,40.6575211934753,40.6576937524214,40.6578635053414,40.6578635778864,40.6580287871908,40.6581879035122,40.6583394497787,40.658722794115,40.6598627564165,40.660853242154,40.6608072145897,40.6608070082266,40.6608068638552,40.6607667380894,40.6607666568613,40.6607665944027,40.6607386016499,40.6607385023516,40.6607384667118,40.6607274504009,40.6607274147694,40.6607274411314,40.6607346866567,40.6607346965656,40.6607347322698,40.6607574922972,40.66075756421,40.6607576992805,40.660790758261,40.6608227913596,40.6608229358159,40.6608231246566,40.6608676188163,40.6608677538704,40.6608678802009,40.6609231336114,40.6609233224379,40.6609235563192,40.6609850557508,40.6609853264904,40.6609855784504,40.6610478483065,40.6610479746226,40.6610481277332,40.6611054605032,40.661105712449,40.6611059550012,40.6611546584779,40.6611885728972,40.6612180268403,40.6612423990874,40.6612611755975,40.6612739603501,40.6612804837651,40.6612806082055,40.6612743310468,40.6612617846824,40.6612432337311,40.6615948211,40.6622018328287,40.6627990154146,40.6634017694639,40.6640118972666,40.6646063820106,40.6652136035386,40.6658150797262,40.6664190955295,40.6670220980278,40.6676212350908,40.6682230881444,40.668824923261,40.6694271775256,40.6700290975678,40.6706294753052,40.6712482248942,40.6718643647745,40.672445493491,40.6726472194284,40.6727131748473,40.6727714935476,40.6728500965096,40.6729309725521,40.6730139750677,40.6730989535934,40.6731857540558,40.6732742191573,40.6733641885281,40.6734554990708,40.6735092803237,40.6735094900912,40.6735097068892,40.6737045069705,40.6739028980975,40.6741032381801,40.6743034195093,40.6745013617793,40.6746005795177,40.6746986425955,40.6747950808498,40.6748894319058,40.6749812435676,40.6750700754908,40.675155501764,40.6752371128027,40.6753161182099,40.6753869692849,40.6754456760798,40.6754885756179,40.675512939303,40.6755173738668,40.675502122886,40.6754689008809,40.6754206342893,40.675360854936,40.6752966528895,40.6752269684347,40.6751521142118,40.675072426054,40.674988261699,40.6748999985297,40.6748080325343,40.6747127763116,40.6745635626416,40.6744089769976,40.6742503536401,40.6740891068388,40.6739266835992,40.67380650774,40.673686336847,40.6735664201242,40.6734470058822,40.6733283421157,40.6732106748991,40.6731421769533,40.6729803530394,40.6728874912704,40.6729423672122,40.673065445078,40.6730682825236,40.6730669657887,40.6730614965438,40.6730518817272,40.6730381335276,40.6730202693967,40.672998311997,40.6729722891836,40.6729093549135,40.6728394835842,40.6727627213398,40.6726791188748,40.6725887310254,40.6724916178564,40.6723878435016,40.6722774764937,40.6722008020009,40.6721285086583,40.6720606396264,40.6719972354242,40.6719383337282,40.6718839698781,40.6718341763298,40.6717889828106,40.6716222448873]}]],[[{"lng":[-73.9040463980889,-73.9034905003708,-73.9035765725715,-73.9035464012338,-73.9034678007585,-73.9033899477951,-73.9033645784494,-73.9033159957102,-73.9033541752533,-73.9034593367302,-73.9034637968846,-73.9034655362001,-73.9034663061998,-73.9034687813497,-73.9034715727059,-73.9034735546669,-73.9034742227648,-73.9034622888674,-73.9034427236995,-73.9032213189808,-73.902967689961,-73.9026600835474,-73.9022882256012,-73.9019821814221,-73.9016676789062,-73.9012657039877,-73.9008513567251,-73.9004165405497,-73.9000252300403,-73.899652332798,-73.8992176089417,-73.8993165289739,-73.8995655897609,-73.8995540452846,-73.8995612019019,-73.8995872163133,-73.8996320551593,-73.8996954800287,-73.8997770418753,-73.8998250823794,-73.8998535044498,-73.8998898683659,-73.8999175377391,-73.8999442811324,-73.8999926378766,-73.9001171585725,-73.9002631093379,-73.900429882757,-73.9006166251606,-73.9008222483241,-73.9010454603378,-73.9012847816899,-73.9015385661799,-73.9062337671228,-73.9075520957351,-73.9080471149841,-73.9085579052277,-73.90933499313,-73.9101441423353,-73.9106731684801,-73.9108433063198,-73.910934871825,-73.9109775782781,-73.9110577934274,-73.9118947707755,-73.9121886028902,-73.9123645889657,-73.9131435625853,-73.9137794374175,-73.9140287814533,-73.914412476905,-73.9155662961218,-73.9157280376987,-73.9170736350247,-73.9174181928351,-73.9181849310437,-73.9186016816377,-73.9189360736859,-73.9192045104331,-73.9194572779273,-73.9195947982405,-73.919731288154,-73.9201132617165,-73.9207783419004,-73.9210508174915,-73.9216557165979,-73.9220990255853,-73.9228786020059,-73.9231821624421,-73.9240255324197,-73.9240967925411,-73.9241641129001,-73.9242273360784,-73.9242863141597,-73.9243409093055,-73.9243909938475,-73.9242446727456,-73.9233103976441,-73.9232322460333,-73.9231197845566,-73.9230343938023,-73.9228110659905,-73.9227525722044,-73.9227271424125,-73.9226553004528,-73.9226321076668,-73.9226135432244,-73.9225443223555,-73.9224669682933,-73.9224535544231,-73.922384017885,-73.9222995036711,-73.9222144438704,-73.9221315337918,-73.9220484332064,-73.9219749528721,-73.9219009052173,-73.9218323249591,-73.9218236101579,-73.9209453994001,-73.9201223330722,-73.9192356231401,-73.9183055032112,-73.9173958691575,-73.9164648603233,-73.9164574753002,-73.9163549218404,-73.9163011986149,-73.916393000754,-73.916539986558,-73.9166863837081,-73.9167620744217,-73.9168301141706,-73.916976328249,-73.9171213852814,-73.9172663265664,-73.9174129427007,-73.917557632914,-73.9176263055923,-73.91763742515,-73.9176477650869,-73.9176563872246,-73.9176643517633,-73.9177010938695,-73.9177654758854,-73.9177842681265,-73.9178353117744,-73.9178493747616,-73.9178920031827,-73.9179154841195,-73.9179989063342,-73.9180460695848,-73.9176811391874,-73.9175522613358,-73.9167983288489,-73.9166103203224,-73.9160459932908,-73.9155003395401,-73.915289635161,-73.9147008338055,-73.9146891547908,-73.9145397242182,-73.9137970017106,-73.9133072811088,-73.9130372137234,-73.9122730121486,-73.911511928854,-73.9107695442353,-73.9100246099535,-73.9092746294856,-73.9090552702809,-73.9088602555343,-73.9085164231406,-73.9077715879164,-73.9070182028394,-73.9067194118451,-73.9062828712672,-73.9056593420266,-73.9055483682493,-73.9054930354526,-73.9054141661056,-73.90478936068,-73.9045689133247,-73.9040463980889],"lat":[40.6792205980192,40.6788980485348,40.6788833043726,40.6787425374827,40.6783758875856,40.6780382329525,40.6779817489148,40.6778692233986,40.677111534876,40.6760350028628,40.6759278906414,40.6758860089664,40.6758526638646,40.6757441809375,40.6756224600559,40.6755357608614,40.6755066832772,40.6754579194757,40.6753779190606,40.674472913689,40.6734393952624,40.6721971791508,40.6709360069667,40.6696700711987,40.6684135291928,40.6668806501649,40.6653458945236,40.6638065279357,40.6622816314516,40.6607354163782,40.6591114041932,40.6590673908684,40.6589565756107,40.6587177706758,40.6584778011579,40.6582379457657,40.6579994798497,40.6577637018589,40.6575318475627,40.6574219175225,40.6573568607414,40.6572745209475,40.6572040535054,40.6571359524246,40.6570127948912,40.6567546437481,40.6565016437778,40.6562553167027,40.6560171284051,40.6557884673294,40.65557059861,40.6553646491783,40.6551715977333,40.652048896178,40.6511859257308,40.6516122768854,40.6520959377946,40.6528085921442,40.6535211591742,40.6540068324645,40.6541025004812,40.6541732804104,40.6542277852862,40.6543159005311,40.655073286226,40.6553396593528,40.6555135652494,40.6562208640478,40.6567836797114,40.657003709085,40.6573624192911,40.6583925717183,40.6585501282768,40.6597453539634,40.6600511921013,40.6607262089156,40.661118048607,40.6614160111762,40.6616552001489,40.6618807852925,40.6619956797906,40.6621233507708,40.6624591040656,40.6630752390815,40.6633138560385,40.6638435751677,40.6642513320836,40.6649520989224,40.6652260197061,40.6659816997474,40.6660424472593,40.66610574682,40.6661714504239,40.6662394044448,40.6663094499895,40.6663814232779,40.6664450003867,40.6668534604254,40.66688762807,40.666936793632,40.6669741259334,40.6670717607138,40.6670973329621,40.6673650564269,40.668127115014,40.6683732110646,40.6685641072422,40.6692758106947,40.6701169302558,40.6702611488539,40.6710087634733,40.6719002621009,40.6727916335527,40.6736838895097,40.6745743971981,40.6753485477724,40.6761316215471,40.6768490422612,40.676938358473,40.6768878336249,40.676856899742,40.6768132004563,40.6767531813271,40.6766935840179,40.6766470400465,40.6767260282328,40.6778235366874,40.6785771124341,40.678905848881,40.6796374973525,40.6803713787895,40.6807555999409,40.6811009812295,40.681834159418,40.6825684716866,40.6833032245533,40.6840340515225,40.6847671919212,40.6851181493407,40.6851749763059,40.6852278227578,40.6852718836681,40.6853125866859,40.6855003586647,40.6858185408124,40.6859114121165,40.6861636696005,40.6862331679145,40.6864491591785,40.6865659363019,40.6869657796104,40.687213247771,40.6870040948014,40.6869302230498,40.6864971998719,40.6863913526917,40.6860720694707,40.6857615240279,40.6856455369953,40.6853169452405,40.6853104194227,40.6852269184801,40.6847998717835,40.6845208578216,40.6843678096827,40.683934965192,40.6835049900879,40.6830927012723,40.6826573710899,40.6822343235831,40.6821055747453,40.6819940364655,40.6818039438251,40.6813778465741,40.6809482797905,40.6807674219426,40.6805067560749,40.6801406914279,40.6800716022369,40.6800371581605,40.6799926433812,40.6796504568711,40.6795155370216,40.6792205980192]}]],[[{"lng":[-73.9075520957351,-73.9084908428466,-73.9091489002397,-73.9092216277097,-73.9100695676753,-73.9108196941893,-73.91136110205,-73.9114921263236,-73.9122336906649,-73.9127882761001,-73.9129369754959,-73.9137267068675,-73.9145894931745,-73.9152525951674,-73.9159308624383,-73.9177670150513,-73.9185942316251,-73.9197373704819,-73.9202580235395,-73.9215494808753,-73.9233265458737,-73.9237527784941,-73.9238584223179,-73.9241931459387,-73.9246469500312,-73.9251134440834,-73.9255918603648,-73.9260813465546,-73.9267551566779,-73.9276401540758,-73.9287811084919,-73.9295845672209,-73.9310277683218,-73.9315481248931,-73.932235548344,-73.9333791512903,-73.9343051029594,-73.9352099304649,-73.9361041162562,-73.9364119713421,-73.9370366905544,-73.9375927357049,-73.9380145373732,-73.9385171651273,-73.9388318881106,-73.9390277231562,-73.9395451882993,-73.9396696980432,-73.9397372201333,-73.9400170267874,-73.9404774223896,-73.9405807579267,-73.9407095754807,-73.9410288926998,-73.9416715693295,-73.942623913925,-73.9435730877707,-73.9445364292418,-73.9455109552195,-73.9456175464572,-73.945867735272,-73.9468051587991,-73.9477733032834,-73.9480146601131,-73.9482649965689,-73.9492329569703,-73.9501709009553,-73.9511598853806,-73.9521366111647,-73.9530788527286,-73.9536000471938,-73.9537485377843,-73.9539417253589,-73.9540435859013,-73.9541264117089,-73.9541771797979,-73.9542806129959,-73.9545248417564,-73.9546656395126,-73.9547302470444,-73.9556519624085,-73.9557365123291,-73.9557623285312,-73.9557908301855,-73.9558251843973,-73.9559067073484,-73.9560105568092,-73.9560378310877,-73.9561082560446,-73.9561640963249,-73.9563003512271,-73.9529591999551,-73.9500666492729,-73.9471589632305,-73.9450790938835,-73.9448728440442,-73.9442878880342,-73.9436519320497,-73.9433548889922,-73.9424014792862,-73.9414626098894,-73.9405321468608,-73.9395592537714,-73.9385934899821,-73.9382040380815,-73.9376358398768,-73.9371206387431,-73.9366846950613,-73.9361792781603,-73.9357181332727,-73.9347843737798,-73.9338101207478,-73.9328465735883,-73.9319074382884,-73.9309035493227,-73.9310832309891,-73.9313256978005,-73.9314067937854,-73.9314799142061,-73.9315563885424,-73.9316021867279,-73.9306846549314,-73.9298736482734,-73.9294035290939,-73.9291675220372,-73.9290523546547,-73.928722045946,-73.9282287237976,-73.927711889418,-73.9273935002171,-73.9263797054922,-73.9259220154963,-73.925462701954,-73.9243909938475,-73.9243409093055,-73.9242863141597,-73.9242273360784,-73.9241641129001,-73.9240967925411,-73.9240255324197,-73.9231821624421,-73.9228786020059,-73.9220990255853,-73.9216557165979,-73.9210508174915,-73.9207783419004,-73.9201132617165,-73.919731288154,-73.9195947982405,-73.9194572779273,-73.9192045104331,-73.9189360736859,-73.9186016816377,-73.9181849310437,-73.9174181928351,-73.9170736350247,-73.9157280376987,-73.9155662961218,-73.914412476905,-73.9140287814533,-73.9137794374175,-73.9131435625853,-73.9123645889657,-73.9121886028902,-73.9118947707755,-73.9110577934274,-73.9109775782781,-73.910934871825,-73.9108433063198,-73.9106731684801,-73.9101441423353,-73.90933499313,-73.9085579052277,-73.9080471149841,-73.9075520957351],"lat":[40.6511859257308,40.6505864186227,40.6501760427395,40.6501310385613,40.6495572103232,40.6490778277107,40.6487290613685,40.6486387495646,40.6481547584833,40.6478078679181,40.6477058443952,40.6471962866268,40.6466387171483,40.6462178282136,40.645774695238,40.644327494557,40.6436754767375,40.642778147843,40.6423662985682,40.6413446923951,40.6399002155921,40.639582363369,40.6395086650372,40.6392751549271,40.6389791287543,40.6386947792532,40.6384225741831,40.6381629464124,40.6378121710962,40.6373514434135,40.6367574447959,40.636341774394,40.6355951033264,40.635325877722,40.6349633387563,40.6343675942147,40.6338855739312,40.6334140627752,40.6329589540274,40.632810290765,40.632509250074,40.6322678569992,40.6320904666279,40.6319232137334,40.6318283466246,40.6317691192041,40.6316284442441,40.6315983109317,40.6315816487626,40.6315126060848,40.6314124732462,40.6313929601883,40.6313686382038,40.6313095874154,40.6312087906018,40.631101784416,40.6309941556314,40.6308947957303,40.6307914829014,40.6317774303119,40.6341175481595,40.6340588398669,40.6339981566971,40.6362669523824,40.6386071897069,40.638547673901,40.6384850857478,40.6384178994072,40.6384258411824,40.6384279736585,40.6384223474501,40.6385863380881,40.6384947249419,40.6388775491903,40.6391612992827,40.6396323001962,40.6405893852227,40.6428875874788,40.644196744303,40.6447725783615,40.6466304101446,40.647868996887,40.648643289987,40.6495229898266,40.6505298080789,40.6513688344374,40.6523142734144,40.652701220771,40.6532447502487,40.6537765193077,40.6550482818312,40.6552493004003,40.6554229972006,40.6555937877736,40.655722046541,40.6557347616017,40.6557700543637,40.6558097809555,40.6558283358869,40.6558848110926,40.6559442485324,40.6560015389652,40.6560627532482,40.6561223787949,40.6561480151249,40.6561675762891,40.6562159030899,40.6562418233009,40.6562739725723,40.6563032967297,40.6563603950873,40.656422992675,40.6564784820519,40.6565376525426,40.6566103559842,40.6582959160363,40.6605933070246,40.6613305083395,40.6620511099541,40.6627554039298,40.6632304444006,40.6636204762702,40.6639907725283,40.6641998457684,40.664299532152,40.6643510070426,40.6644955696853,40.6647098651863,40.6649343279918,40.6650747161542,40.6655148926442,40.6657150352015,40.6659167519916,40.6663814232779,40.6663094499895,40.6662394044448,40.6661714504239,40.66610574682,40.6660424472593,40.6659816997474,40.6652260197061,40.6649520989224,40.6642513320836,40.6638435751677,40.6633138560385,40.6630752390815,40.6624591040656,40.6621233507708,40.6619956797906,40.6618807852925,40.6616552001489,40.6614160111762,40.661118048607,40.6607262089156,40.6600511921013,40.6597453539634,40.6585501282768,40.6583925717183,40.6573624192911,40.657003709085,40.6567836797114,40.6562208640478,40.6555135652494,40.6553396593528,40.655073286226,40.6543159005311,40.6542277852862,40.6541732804104,40.6541025004812,40.6540068324645,40.6535211591742,40.6528085921442,40.6520959377946,40.6516122768854,40.6511859257308]}]],[[{"lng":[-73.972994339389,-73.9729594808647,-73.9725898234115,-73.972397355419,-73.9721774273492,-73.9723515208722,-73.9724526158844,-73.9725653370985,-73.9729111684125,-73.9729671326161,-73.9730210800516,-73.9731228463365,-73.9732398353256,-73.9740839048974,-73.9749269555482,-73.9750394042932,-73.9755881930256,-73.9765093450658,-73.9775067424922,-73.9785016917869,-73.9789057139549,-73.9794258684296,-73.9803578547385,-73.981283846727,-73.9822111583866,-73.9831403468563,-73.9837215268118,-73.984063802494,-73.9850613649743,-73.9852002737078,-73.9864672684189,-73.9867631492432,-73.9874913607019,-73.9887312972833,-73.990049946831,-73.99036425111,-73.9906631198364,-73.9914734213569,-73.9915393444445,-73.9916141237686,-73.9925574782609,-73.9928606773962,-73.9929159153588,-73.9929783595407,-73.9933085496695,-73.9942155460831,-73.9949748484748,-73.9953314079744,-73.995345668855,-73.9954829431665,-73.9954900735167,-73.9955524716798,-73.9955631668591,-73.9951335133543,-73.9951549040411,-73.9950568493018,-73.9950994949081,-73.9955221225181,-73.9955277563283,-73.9977770813554,-73.9979563973929,-73.9979605510624,-73.9979789350664,-73.9955502945396,-73.9955502936809,-73.9951558419544,-73.9948767769537,-73.9949022605075,-73.9953473766122,-74.000114495384,-74.0001032257227,-74.000108860195,-74.0001652065632,-74.0002384564419,-74.0003173430327,-74.0003736889093,-74.0004327749314,-74.000425294387,-74.0004694808749,-74.0004891200193,-74.0003820711572,-73.9978831125104,-73.9979338241239,-73.9980186702297,-73.9986729337556,-73.9992369039696,-73.9994644681107,-73.9983783488211,-73.9984206169527,-73.9988361801457,-73.9988658617369,-73.9984438707949,-73.9985105961198,-73.9985534416792,-73.9985851536428,-73.9986248512674,-73.9986819791189,-73.9987431883265,-73.9987799135824,-73.9987941943793,-73.9987780058959,-73.9987329830786,-73.9986880961937,-73.998653412126,-73.9985942438703,-73.9985330340609,-73.9984901869193,-73.9984432593687,-73.9983963311173,-73.998355523042,-73.9977597270136,-73.9971116857154,-73.9971056233943,-73.9971073038004,-73.997116708592,-73.997133735026,-73.9971581970789,-73.9971898274793,-73.9972282806273,-73.9980643826768,-73.9981286946127,-73.9974051864242,-73.9972826970379,-73.997548510584,-73.9985640480066,-73.9991676186208,-73.9992642520107,-73.9993628309341,-73.9994627124436,-73.9995632450973,-73.9996637732068,-73.9997636411134,-73.9998621974638,-73.9999266913903,-73.9999873500127,-74.0000431494055,-74.0000931476637,-74.0001365008017,-74.0001724770002,-74.0002004689598,-74.0002200041532,-74.0002307528021,-74.0002325334459,-74.000058121709,-73.9996722321959,-73.9993061293423,-73.9990313144166,-73.9993002958716,-73.9993477536014,-73.9993886947503,-73.9994228766908,-73.9994500968473,-73.9994701938964,-73.9994830487237,-73.9991972767638,-73.9989746432054,-73.9983883108362,-73.998534109787,-74.0001789486995,-74.0008813363674,-74.0010959678416,-74.0016783014122,-74.0019663579194,-74.0019434924068,-74.0020377295676,-74.0022764846723,-74.002406589084,-74.0025444448795,-74.0026899407225,-74.0028429590989,-74.0030033764119,-74.0031710630821,-74.0033458836514,-74.0035276968928,-74.0037163559242,-74.0039117083271,-74.0041135962697,-74.0041305607206,-74.0043572469525,-74.0051183817076,-74.0055730371091,-74.007745857171,-74.0084840914257,-74.0092172390491,-74.0096156325537,-74.0097747960799,-74.0099354510272,-74.0101723998282,-74.0104123888951,-74.0106553381652,-74.0109474159977,-74.011242784576,-74.0115413451252,-74.0117063282543,-74.0118728222616,-74.0120634313686,-74.012369816027,-74.0129988703337,-74.0130216004984,-74.013941377296,-74.0147283701198,-74.0152576991997,-74.0157889982228,-74.0160864858223,-74.0163852849855,-74.0166852552227,-74.0169862554925,-74.0172881442686,-74.0175907796065,-74.0179922793689,-74.0182928630149,-74.0183234721685,-74.0191356390289,-74.0191340840976,-74.0193282664782,-74.0194276088975,-74.0193934357128,-74.0192315039128,-74.0191808901352,-74.0191768511388,-74.0187138228914,-74.0186913577419,-74.0186602176847,-74.0182314505144,-74.018214586302,-74.0181764666061,-74.018119049733,-74.0180470260697,-74.0175086859712,-74.0174671144685,-74.017283667568,-74.0167128387583,-74.0164055306887,-74.0154985500964,-74.0162363672972,-74.0170191015474,-74.0152237943311,-74.0134825591615,-74.0117120155573,-74.0110864810412,-74.0105040358741,-74.0099237199307,-74.0093416449816,-74.0087603999488,-74.0081768755106,-74.0075980688957,-74.0070153162091,-74.0064339499209,-74.0058531993418,-74.005226659917,-74.0045990697737,-74.0040190690737,-74.0034355710265,-74.0028570164015,-74.0022758628599,-74.0016938015666,-74.0012022236823,-74.0005298749299,-73.9999466498922,-73.9993209028495,-73.9986969523364,-73.9981161432841,-73.9975357378005,-73.9974878569875,-73.9971817527544,-73.9968777841972,-73.9965527313994,-73.9962125404841,-73.995858841457,-73.9954933816905,-73.9951180672689,-73.9947348567926,-73.9939819708341,-73.9925497361658,-73.9900935605129,-73.9878509553418,-73.9856935782417,-73.9834887256461,-73.9827363580095,-73.9812863830633,-73.9790579579084,-73.9768267894513,-73.9749726459846,-73.9748929575664,-73.974265609942,-73.9742562563154,-73.9742285162174,-73.9741824018726,-73.9741225370718,-73.9740567930897,-73.9739931946138,-73.9739470935797,-73.9737060382879,-73.9734837349883,-73.9732177484846,-73.9730265604729,-73.972994339389],"lat":[40.6088141418023,40.6086295077702,40.6066715333735,40.6056518901444,40.6041947115372,40.6033481188611,40.6026170545397,40.6017943730231,40.5993158037006,40.5989099600676,40.5985187857771,40.5977905214336,40.5969788180569,40.596882943568,40.5967935381629,40.5967800269532,40.5967192064316,40.5966161089621,40.5965064534207,40.5963948531317,40.5963527300793,40.5962975233277,40.5961915417464,40.5960879017296,40.595987010813,40.595884931775,40.5958210782172,40.5957827199541,40.5956709188194,40.5963981261166,40.5951788221258,40.5948940656273,40.5941939819159,40.5930018990679,40.591734112288,40.5914319316764,40.5911671666083,40.5904493057884,40.5903909030813,40.5903564459446,40.589921674724,40.5897826984193,40.5897573787788,40.589730033453,40.5895838985805,40.5888685304828,40.5885053720159,40.5883300667816,40.5883450171745,40.5882852227254,40.5882974549916,40.5882648392966,40.5882770721988,40.5884809155436,40.5885148937395,40.5885610983382,40.5885925050438,40.5883906229882,40.5884035100657,40.5873532375516,40.5872695063657,40.5872774235411,40.5873124639678,40.5884206939209,40.5884335812816,40.5886268728902,40.5887717466752,40.588802987503,40.58933138044,40.5869516409026,40.5865907989454,40.5865607290968,40.5865048849626,40.5864705188675,40.5864533350233,40.58647481463,40.5865445949216,40.5866924315609,40.5869430487606,40.587042855124,40.5871330573495,40.5883434379228,40.5883992829033,40.5884254000413,40.5891955499397,40.5889353282691,40.5892332693807,40.5897704450886,40.5898140545597,40.5896254895423,40.5896669752881,40.5898603991775,40.5899601329343,40.5900176831463,40.5900473849778,40.5900845670795,40.5901296741744,40.5901903360454,40.5902323318472,40.5902805499443,40.5903143558445,40.5903349879296,40.5903256557092,40.5902914364446,40.5902276635323,40.5902089981609,40.5902167741483,40.5902401054945,40.5902821002549,40.5903349831475,40.5909524696138,40.5912779774438,40.5913342792045,40.5913907557918,40.5914467901091,40.5915017698906,40.5915550943918,40.5916061809533,40.5916544713677,40.5912094647315,40.591288664258,40.5916450849804,40.5917148148681,40.591917578673,40.5914923253096,40.5911491353131,40.5911277784835,40.5911124357323,40.5911032071272,40.5911001528585,40.5911032928466,40.5911126066121,40.5911280334092,40.5911473840901,40.5911729456765,40.5912042866876,40.591240878085,40.5912821022022,40.5913272631709,40.591375598667,40.5914262927777,40.591478489775,40.5915313085593,40.5917148474845,40.5919637586688,40.5921787264061,40.5923128034476,40.5925591221624,40.5926223090534,40.5926880915661,40.5927560798885,40.5928258711364,40.5928970517406,40.5929691998976,40.5931781439191,40.5933063698711,40.5935313916063,40.5935923479004,40.5928506404697,40.5925997289996,40.592518708999,40.5934410039356,40.5938847444513,40.5939024273836,40.5940596060347,40.5943345805146,40.5945438565055,40.5947502289132,40.5949535309587,40.5951535983423,40.5953502693774,40.5955433851207,40.5957327895006,40.5959183294438,40.5960998549989,40.5962772194577,40.5964502794739,40.5964633561943,40.5966380926658,40.5972247915537,40.5975686123182,40.5989357224187,40.5993914586422,40.5998440451524,40.600039964139,40.6001314904761,40.6002214904369,40.6003499961619,40.6004751817125,40.6005970053171,40.6007361813907,40.6008712631935,40.6010022055438,40.6010715720604,40.601138808863,40.6012195223009,40.6013492571162,40.6015592075466,40.6015658671037,40.6018353443733,40.6020659113426,40.6021786875421,40.6022859498374,40.6023345091173,40.6023781409862,40.6024168249286,40.6024505427559,40.6024792786142,40.6025030189923,40.6024919523539,40.6024473552304,40.6024176511305,40.602612754505,40.6026485535541,40.6028108081714,40.602871578348,40.6029117612817,40.6031021742476,40.6031495946108,40.6031544223004,40.6035820759073,40.6036079239394,40.6036410675919,40.6041084725031,40.6041819577837,40.6042526088174,40.6043152228267,40.6043657351264,40.6048504972353,40.6049651043263,40.6051378246966,40.6056826353559,40.605975924814,40.6068415242769,40.6072332661004,40.6076544169712,40.6093563841185,40.6110373979196,40.6127350291876,40.6133390442023,40.6138966114925,40.6144566426455,40.6150150960399,40.6155758234432,40.6161331807064,40.6166944608693,40.6172539464371,40.6178147169019,40.6183704772606,40.6189731540266,40.6195768539982,40.6201361890691,40.6206954038477,40.6212536433395,40.621814274427,40.6223724273197,40.622842712352,40.6234899390831,40.6240506226048,40.6246552468466,40.6252565916406,40.6258157066096,40.6263767110243,40.6264250051576,40.6267101558363,40.6265307825624,40.626339908347,40.6261631253919,40.6260014341036,40.6258557065811,40.6257266289914,40.625614741106,40.6251413990506,40.6242742687793,40.6227889533431,40.6214350324407,40.6201315149502,40.6188000242624,40.618345979472,40.617470905421,40.6161258365951,40.6147764019036,40.6136681101717,40.6131863689167,40.6138455646908,40.6138935328248,40.6139414611534,40.6139832177728,40.6140131730554,40.6140284945025,40.6140298942426,40.6137959280038,40.6125723708565,40.6113710612012,40.6099813857914,40.6089824766405,40.6088141418023]}]],[[{"lng":[-74.0505080640328,-74.0504713719441,-74.0503032127172,-74.0501258737545,-74.0499835256257,-74.0493164036208,-74.0492362984208,-74.0500262015868,-74.0507440997721,-74.050747689433,-74.0507322395424,-74.0507357103709,-74.0508032689558,-74.0508733304563,-74.0509060170505,-74.0509129258488,-74.0508820037162,-74.050852502094,-74.0508338628733,-74.0507650735713,-74.0507083160663,-74.0506876961959,-74.0506825519483,-74.050682576825,-74.0506791674861,-74.0506964038199,-74.0507342649788,-74.0507841675243,-74.0508392303146,-74.0508839591318,-74.0509338641698,-74.0509700033223,-74.0509912930413,-74.0510130265969,-74.0510388419626,-74.0510560689641,-74.0510750042746,-74.0510733020021,-74.0510715980381,-74.0510491317553,-74.0509166482114,-74.0508506650391,-74.050758897382,-74.0506671482292,-74.0506151397822,-74.0505386530106,-74.0505080640328],"lat":[40.5664220346634,40.5664173874353,40.5664174612006,40.5664058803351,40.5663959249283,40.5658877477805,40.5653627368707,40.5653181811238,40.5658871259351,40.5659540767539,40.5659921190177,40.5660327750984,40.5660522004612,40.5660812402099,40.5660943416281,40.5661336842543,40.5661782900042,40.5661895562056,40.5661966735784,40.5661993263429,40.5661941060585,40.5662177227733,40.5662373975521,40.566270186452,40.5663108457364,40.5663606755322,40.566394758646,40.5664314604417,40.5664694708516,40.5664878116295,40.5665284477935,40.5665585971581,40.5665767594865,40.5665953009011,40.5666188968788,40.5666569234872,40.5666792110922,40.5667028199646,40.5667224939004,40.5667381184913,40.566695575668,40.5666433877378,40.5665851368753,40.5665502030478,40.5665082567752,40.5664406737967,40.5664220346634]}],[{"lng":[-74.0531403682107,-74.0540604493991,-74.054897782108,-74.054693169734,-74.0548513462535,-74.0548456005217,-74.0536862915042,-74.0529319063982,-74.0531403682107],"lat":[40.5777027150432,40.5771164457415,40.5777824409199,40.5796916322292,40.5797075925751,40.5799457914276,40.5805487596145,40.5799024746659,40.5777027150432]}],[{"lng":[-74.0555212612237,-74.0554319800416,-74.0553793243408,-74.0552871969713,-74.0551725101646,-74.055182181695,-74.0551795585468,-74.0551685568999,-74.0551525106076,-74.0551202304094,-74.0550597416175,-74.0538106987138,-74.0537176946205,-74.0536072974086,-74.0536725642038,-74.0540203995901,-74.0538509949876,-74.0537815283146,-74.0537547431988,-74.0536960798506,-74.0536712685174,-74.0535913355606,-74.0535675357033,-74.0535396454605,-74.0532048611941,-74.0531579919433,-74.0531186180772,-74.0530869175891,-74.0530630337763,-74.0530470745933,-74.0530391121636,-74.0530333074381,-74.0530361267984,-74.0530475416789,-74.0530674365022,-74.05309560985,-74.0533185734229,-74.0533878948207,-74.053427085934,-74.0534219996675,-74.0531903352764,-74.0528001784733,-74.0524031963273,-74.0522541191052,-74.0522298309426,-74.0522282695419,-74.0522453179922,-74.0522677927034,-74.0522909929142,-74.0523249485185,-74.0523724584625,-74.0524282733076,-74.0524917895084,-74.0526066050153,-74.0527173663353,-74.0527941648545,-74.0528715384339,-74.0529103829463,-74.0530228833831,-74.0530972472875,-74.0543411861936,-74.0543115048126,-74.0543364457311,-74.0544742233395,-74.0568113991338,-74.057193699047,-74.0597269064316,-74.0597473475941,-74.0596412066208,-74.0596625576619,-74.0597666068769,-74.0598450591735,-74.0605535370299,-74.0613377810323,-74.0621527443259,-74.0638870919133,-74.0650333235623,-74.0650330963393,-74.0645418613377,-74.0645875231509,-74.0647061559093,-74.0647783303304,-74.0659379710003,-74.0672227681694,-74.0693350335563,-74.0695143523075,-74.0698079102669,-74.0702115428941,-74.0709631018205,-74.0714483766154,-74.0714918058715,-74.070595337333,-74.0706578160373,-74.0714667093301,-74.0717763843113,-74.0733538959079,-74.0738332107328,-74.0748926415476,-74.0749941307351,-74.0750828819262,-74.0753841695345,-74.0757981960669,-74.0752345361796,-74.0753462264826,-74.0760159704387,-74.0761100804478,-74.0762049932403,-74.0762467639061,-74.0762603708992,-74.0762894240906,-74.0763384548357,-74.0763666041997,-74.0763992839858,-74.0764083478006,-74.07639844893,-74.0763047043055,-74.0762901524249,-74.0762974108436,-74.0763146736372,-74.0764274802261,-74.0764646711526,-74.076492830773,-74.0765164306115,-74.076539113168,-74.0765545262062,-74.0765835626775,-74.0766218356954,-74.0767227386614,-74.0768822647208,-74.0769155296231,-74.0767374768266,-74.076748373651,-74.0768978744567,-74.076938815287,-74.0773747252249,-74.0783016922284,-74.078774128947,-74.0792632125691,-74.0786793393897,-74.0787518531636,-74.0793364053826,-74.0801786750796,-74.0805028914757,-74.0809068328306,-74.0813377078457,-74.0817372535144,-74.0823068274826,-74.0825918520404,-74.0830062080614,-74.08359916127,-74.0846907599149,-74.0859529738592,-74.0865485876068,-74.0869126371913,-74.0861924436644,-74.0862163222426,-74.0872507831611,-74.0873467227257,-74.0875636244047,-74.0879298186953,-74.0883569984764,-74.0885230098563,-74.0892029510326,-74.089140459541,-74.0892490614104,-74.0899825993291,-74.0905496010633,-74.0909990546711,-74.0912380776219,-74.094049684098,-74.0939964366199,-74.0940707110943,-74.0951106336129,-74.0952414529292,-74.0954237186223,-74.0956830428006,-74.0956633199685,-74.0956719806137,-74.0957119199914,-74.0957614107352,-74.0958232182742,-74.0958868775111,-74.0961184720136,-74.0962920220187,-74.0966136227229,-74.0968703678043,-74.0969819949764,-74.0970248329552,-74.0970884436629,-74.0971549591162,-74.0972342082292,-74.0973073289338,-74.0974196957031,-74.0975982484042,-74.0978880797072,-74.0979639297641,-74.09797864218,-74.097993486968,-74.0980443164458,-74.0981203427894,-74.09819767262,-74.0982726569842,-74.0982903082378,-74.0982215482987,-74.0980868632023,-74.0979990225766,-74.0978323030348,-74.0977966531796,-74.0978212708991,-74.0978481605417,-74.097931727151,-74.0986220479275,-74.0986587046811,-74.0987061708381,-74.098764154809,-74.0988326287909,-74.0989258121879,-74.0990954789976,-74.0993277036147,-74.0992959381379,-74.0993803143274,-74.0998692475434,-74.1000954923222,-74.100212259153,-74.1007996399401,-74.1012435413987,-74.1016020305263,-74.1018463767478,-74.101840329649,-74.1013747759571,-74.1013459379665,-74.1013542327051,-74.1014051691083,-74.1014744070096,-74.1026507642614,-74.1030983917743,-74.1038579545435,-74.1046594355729,-74.1050890794746,-74.1048624956166,-74.1048444770231,-74.1049146375917,-74.1050947056397,-74.1060364393664,-74.1064282206517,-74.1064335898292,-74.1064087668843,-74.1064007672846,-74.1064125639783,-74.1064815087813,-74.1065636103537,-74.1066768189853,-74.1070473851548,-74.1073483128373,-74.1076862346398,-74.1085392252843,-74.1087579352307,-74.1089361327878,-74.1090075387378,-74.1092262778655,-74.1098480743019,-74.1102845738754,-74.1109767821218,-74.1112032620188,-74.1116674263359,-74.1127884695798,-74.1129161990336,-74.1130104610455,-74.1133834061628,-74.1134079119562,-74.1134384239258,-74.1135950656281,-74.1137484150788,-74.1138735453275,-74.1147378116536,-74.1149717566118,-74.1152305895161,-74.1152678421862,-74.1153109032001,-74.1153585189978,-74.1154093034278,-74.1154617780993,-74.115514415418,-74.1155656830549,-74.1156140885528,-74.1156528043083,-74.115698152341,-74.115749710695,-74.1158069996233,-74.1158694860522,-74.1159365885406,-74.1160076826915,-74.1160800474892,-74.1161554988765,-74.1162330925448,-74.1163118573723,-74.1163908075783,-74.1164689550621,-74.1165453217698,-74.1167636189857,-74.1169770666739,-74.117079649248,-74.1171874298839,-74.117299889457,-74.1174164863107,-74.117536658865,-74.1176598283213,-74.1177854014493,-74.117912773444,-74.118041330838,-74.1181708779647,-74.1182950050444,-74.118413494035,-74.1185261368023,-74.1186327354855,-74.1187331028451,-74.1188270625911,-74.1189144496929,-74.1189928785093,-74.1190770699964,-74.1191669180862,-74.1192623095882,-74.1193444208015,-74.1194300952744,-74.1194869084314,-74.1195505610797,-74.1196206288041,-74.1196966444211,-74.1197781010942,-74.1198644557132,-74.1199551325148,-74.1200495269217,-74.1201470095731,-74.1202469305204,-74.1203486235601,-74.1204073778078,-74.1204675482712,-74.1205284404594,-74.1205959505124,-74.1206625259271,-74.1207954278591,-74.1209298147348,-74.1210650408826,-74.1212004565978,-74.1213354112649,-74.1214692564836,-74.1216013491856,-74.1217310547238,-74.121857749923,-74.121980826074,-74.1220996918588,-74.1222137761916,-74.1224996009537,-74.1242444971278,-74.1257509454355,-74.1263818513108,-74.1276243414018,-74.1307118427267,-74.1335644349814,-74.1352754862327,-74.1361884899335,-74.1369079907635,-74.1372850425187,-74.1374379727972,-74.1379337688175,-74.1380402897971,-74.1381463548002,-74.1382514070966,-74.1383548952711,-74.1384562761173,-74.1385550174882,-74.1386506010897,-74.1387425252003,-74.1388303073045,-74.1388833730034,-74.138928919264,-74.1389666636111,-74.1389963719493,-74.1390178600161,-74.1390309945242,-74.13903569399,-74.1390319292386,-74.1390197235863,-74.1389991526961,-74.1389966666598,-74.1390022872488,-74.1390160000653,-74.1390377699172,-74.1390675409092,-74.1391052365849,-74.1391507601238,-74.1392039945887,-74.1402701526959,-74.1406109270312,-74.1406238382893,-74.1406278066378,-74.1406228178536,-74.1406088897137,-74.1405860719319,-74.1405544459818,-74.1405141248066,-74.1405021832715,-74.1404815886567,-74.1404524818392,-74.1404150619378,-74.1403695849519,-74.1403163620103,-74.140255757243,-74.1402053605615,-74.1401522533198,-74.1400972809172,-74.1400413184454,-74.1399852567577,-74.1394815427789,-74.1392756315129,-74.1390678845277,-74.1388585879603,-74.1386480300806,-74.1384365008948,-74.1382242917461,-74.1380116949138,-74.1357676137532,-74.1352964320491,-74.1348260325008,-74.1344635867357,-74.1341001749099,-74.1339531324463,-74.1338100515441,-74.1336711693828,-74.1335367161845,-74.1334069148327,-74.1332738365539,-74.1331468311923,-74.1330261157129,-74.133012076688,-74.1329712040365,-74.1329426645362,-74.1311954575527,-74.1311646637856,-74.1308662528681,-74.1288160460006,-74.1287873750151,-74.1286137155024,-74.1284466730707,-74.1282864556917,-74.1281332628455,-74.1279872852722,-74.1278870267627,-74.1277943422538,-74.1277093796158,-74.1276322744064,-74.1275631496541,-74.1275021156617,-74.1274610552823,-74.1274290323374,-74.1274061294096,-74.1273924055795,-74.1273878962725,-74.1273926131672,-74.1274065441646,-74.1274432181896,-74.1274879728643,-74.1275407450563,-74.127601460311,-74.1276700329568,-74.1277000134189,-74.1277314342736,-74.1275576058033,-74.1275666076284,-74.1276299410406,-74.1276389685455,-74.1278189344656,-74.1279480805328,-74.1280850507657,-74.128229721227,-74.1283819610043,-74.1285416323289,-74.1287085907003,-74.1288601030668,-74.1290186463994,-74.129184067473,-74.1293562064094,-74.129448145884,-74.1295459161038,-74.1296492957185,-74.1297580506741,-74.1298719347429,-74.1299906900807,-74.1301140478106,-74.1302605297997,-74.1304116641799,-74.130567116047,-74.130726540926,-74.1308895855342,-74.1311069007707,-74.1313271958808,-74.1315502618896,-74.1317758871917,-74.1320038577519,-74.1325781604283,-74.1327457180815,-74.132915370908,-74.1330866436588,-74.1332590565453,-74.1334321265843,-74.1334699331887,-74.1336426228829,-74.1338217709399,-74.1340003735723,-74.1341782033031,-74.13435503364,-74.1345306393643,-74.1347563447711,-74.1349804552258,-74.1352027784352,-74.1354231236407,-74.1356413017825,-74.1358571256614,-74.1369599246983,-74.1371118563389,-74.1374574353012,-74.1382019389324,-74.138607417331,-74.1386526590918,-74.1384119372381,-74.1376973159297,-74.1373898816613,-74.1360734337128,-74.1352807604433,-74.1345586822585,-74.1331682599924,-74.1317782811874,-74.1310866524171,-74.1304245963892,-74.1297560235694,-74.1289614164244,-74.128116971999,-74.1273005782192,-74.1272522789842,-74.1257267505036,-74.124020471276,-74.1238003156366,-74.1226989576037,-74.1207628817176,-74.1194585929116,-74.1196085410251,-74.1195748044552,-74.1183416929299,-74.1167626888337,-74.1167163144766,-74.1165629005628,-74.1149690458863,-74.1144180206408,-74.1142159849182,-74.113684352106,-74.1125256900003,-74.1120559474584,-74.1116526818833,-74.1099579851235,-74.109846583999,-74.1095362958096,-74.108910797,-74.1064492029203,-74.105726964432,-74.1027890436984,-74.1018921804773,-74.1017373268587,-74.1015227350791,-74.1012385736843,-74.1008081517748,-74.1007127169145,-74.1002705391573,-74.0999637517971,-74.099643467734,-74.0993511497426,-74.0990498808949,-74.0988854901243,-74.0988205963189,-74.0985353612661,-74.0982572108537,-74.0979713491121,-74.0976300813006,-74.0989520165496,-74.1000228097541,-74.1007865099782,-74.1015496156722,-74.1020893826292,-74.1030703666264,-74.1038698555966,-74.1046693161401,-74.1054729455723,-74.1066043939317,-74.1066215258488,-74.1062441446606,-74.1061612134433,-74.1060714918527,-74.1059752618094,-74.1058728256901,-74.1057645053775,-74.105650641249,-74.105531591107,-74.1054077290547,-74.1052727266234,-74.1051336365711,-74.1049908778003,-74.1048448802657,-74.1046960836793,-74.1045449361854,-74.1043918930113,-74.1042374150949,-74.1040819676967,-74.1039260189981,-74.1039162653103,-74.1030623502508,-74.1048925340597,-74.1052429037728,-74.1047097914178,-74.1042693696863,-74.1035224424516,-74.1027719714833,-74.1020293093996,-74.1012715078008,-74.100540513185,-74.0997875664952,-74.0990495449778,-74.0983201493462,-74.0975663500422,-74.0968216684653,-74.0960885193106,-74.0953463096093,-74.094605968253,-74.0938729485011,-74.0927705822398,-74.0927507430531,-74.0920445158073,-74.0910709118548,-74.0902776030581,-74.089706213169,-74.0894625259192,-74.0894603771765,-74.0894176459207,-74.0891785702706,-74.0888140769824,-74.088766266508,-74.0887195034333,-74.0885344761313,-74.0883388800727,-74.0881335529947,-74.0879193916578,-74.0877817102823,-74.087697375959,-74.0858020348512,-74.0854585227023,-74.0848880868417,-74.0842588883333,-74.0837683881891,-74.0833421756386,-74.0829075260775,-74.0824393056807,-74.0817159143092,-74.0807895390109,-74.0803630521683,-74.079947275494,-74.0795429885944,-74.0791509238097,-74.0778714792686,-74.0778023740842,-74.077726921944,-74.0767304009693,-74.0752516172839,-74.0747511641769,-74.0746968511872,-74.0741241000606,-74.0736450889696,-74.0735337984666,-74.0729264086931,-74.0727527782497,-74.0725659217358,-74.0723667002151,-74.0721560935358,-74.0719351994526,-74.0717574744879,-74.0715929326755,-74.0714436987433,-74.0713115058186,-74.0711977234038,-74.0702116931775,-74.0699757532453,-74.0697632175143,-74.0695335598975,-74.0692873830133,-74.0690253902049,-74.0687483925866,-74.0666737077574,-74.0666255950235,-74.0665617301802,-74.0657763656931,-74.0653380118304,-74.0644478548609,-74.0641789596957,-74.0633605055731,-74.0631641537116,-74.0631008501731,-74.0630452578556,-74.063044997929,-74.0630447619832,-74.0629141293707,-74.0629139874503,-74.0629138457672,-74.0627937886333,-74.0627936469587,-74.0627935288087,-74.0626884036215,-74.0626882494532,-74.0626881084882,-74.0626009358209,-74.0618181575796,-74.0615077639733,-74.0605601754054,-74.0617388295381,-74.0620555868396,-74.0624820031818,-74.0628960002703,-74.0632995364789,-74.0635794712449,-74.0636262262527,-74.0637593335814,-74.0628407291809,-74.0620634236495,-74.0619200267061,-74.0612897002948,-74.0610841405996,-74.0619561793393,-74.062067039671,-74.0620926651399,-74.0621249908936,-74.0626077283667,-74.0635056566019,-74.0640480244343,-74.0641494698955,-74.0643006056805,-74.0646841079542,-74.0651709125078,-74.0604642972133,-74.0578935087154,-74.0567718170307,-74.0567493483024,-74.0566599991888,-74.0564956593677,-74.0564069328712,-74.0560104141092,-74.0555212612237],"lat":[40.6064828925687,40.6064824910407,40.6064942235224,40.6065388900787,40.6064907673493,40.6064745668341,40.606402335425,40.6063655468005,40.6063290458977,40.6063053617165,40.6062654204526,40.6059127188527,40.6056045815722,40.6052388099204,40.6051883438246,40.6049347204137,40.6045302744549,40.6043614229124,40.6042769314214,40.604148103838,40.6040047859051,40.6037616885517,40.6036964668285,40.603633557567,40.6020597931997,40.601975984476,40.6018899644888,40.6018021221635,40.6017128546629,40.6016225655922,40.6015316631736,40.6014664706998,40.60140116361,40.6013364030086,40.6012728444661,40.6012111313827,40.6010105882417,40.6008686176556,40.6006987925616,40.6005160710412,40.6002811561914,40.6000607130959,40.5998694989236,40.5998511674101,40.5998238835937,40.5997761023036,40.5997480141526,40.5997349403435,40.5997204405266,40.5997149053204,40.5997187829206,40.5997281540149,40.5997368430716,40.5998145753707,40.5998544724489,40.5998734646549,40.5998672554671,40.5998454653314,40.5997786835973,40.5997310676282,40.5988191753366,40.5987775057602,40.5987604455301,40.5987555400511,40.5967269235442,40.5963950793146,40.5939082167124,40.5938486110647,40.5937093883927,40.5937031757104,40.5938352580128,40.5937805324438,40.5933797554232,40.5927154190646,40.5920250410446,40.590207466209,40.5889909983679,40.5889093141956,40.5884339923943,40.5884031574157,40.5884725468392,40.5884883112283,40.5876060982982,40.5867344497601,40.5847765206549,40.5845855173721,40.584304042217,40.583981357209,40.5831819904026,40.5824340679641,40.5821687826521,40.5816905434251,40.5816256250374,40.5820272438981,40.5818765346615,40.580678939139,40.5802772282298,40.5793174361778,40.5792365574164,40.5791601587556,40.5788038528111,40.5783092511528,40.5779988032532,40.5778879690688,40.5782449127924,40.5781738621852,40.5781266133983,40.5781044158286,40.5780850087185,40.5780655925234,40.5780364627521,40.5780212027085,40.5779948555551,40.5779754514483,40.5779697740889,40.5779200966997,40.5779076368044,40.577898625093,40.5778986136271,40.5779501196462,40.5779670999859,40.5779608461254,40.5779400473639,40.5779116279543,40.5778825204823,40.5778492483568,40.5778185359467,40.5777305454108,40.577636789409,40.5775795000122,40.5773725093251,40.577366959163,40.5775163082902,40.5775343450888,40.5772821589056,40.5764647186576,40.5760108222456,40.5756712922057,40.575081825726,40.5750421261398,40.5756272040169,40.575180418259,40.5749804592133,40.5746898047516,40.5743199893063,40.5739385785235,40.5734225036062,40.5731495159021,40.5727855700491,40.5723714758727,40.5714779144424,40.5702982271043,40.5696323191351,40.5689858426831,40.5685646205922,40.5685326981471,40.5690816781929,40.5690218919986,40.5688504481773,40.5685932869362,40.5682667075909,40.568070329934,40.5671740367102,40.5671334741721,40.5670155705342,40.5673800120357,40.5670835972113,40.5667371296002,40.5665066132282,40.5629816481137,40.5628060596506,40.5627316194612,40.5631732734346,40.5631483870408,40.5631546355681,40.5629193977932,40.5628193176725,40.5627755982454,40.5627508694013,40.5627321195933,40.5627222734153,40.5627249168487,40.5625875744896,40.5624208307733,40.56208714604,40.5617179721501,40.5614762166698,40.561336438997,40.5612545680281,40.561188308012,40.5611195867187,40.56101581109,40.5608836477063,40.5606129255359,40.5601694267306,40.5600365500867,40.5599930136152,40.559967105358,40.5599131654458,40.559892952543,40.5598364773072,40.5595488092975,40.5593326146595,40.5592835820384,40.5592027433582,40.5591857066741,40.5591204543609,40.5590872427753,40.5590534662172,40.5590336690911,40.559041463394,40.5593879818598,40.5594075609212,40.5594236014976,40.5594235516509,40.5593873089778,40.5593500568923,40.5592587906303,40.5590974137302,40.5590049724136,40.5589641933612,40.5590935010381,40.5589534456225,40.558871151631,40.5583218211153,40.5576608313156,40.5568034587189,40.5562169892826,40.5559446392413,40.5556923721067,40.5556256772573,40.5555832999435,40.5555385261645,40.5555336109971,40.5561344047847,40.5559046414506,40.5551181601014,40.5541204673107,40.5532354680107,40.5530800185093,40.5530258150583,40.5530162671125,40.553129028392,40.5536405673812,40.5538533736213,40.5539696706259,40.5540238981148,40.554061346965,40.5541082755844,40.5541568278698,40.5541869275486,40.5541878611327,40.554195451044,40.5541481525338,40.553976670975,40.5532580256727,40.5530464128464,40.5528871558056,40.5528249044379,40.5526061793686,40.5519452845806,40.5514963574176,40.5505123776852,40.5501904287459,40.5495151789242,40.5478842627243,40.5478176517204,40.5477800659327,40.5480733751507,40.5480697091834,40.5480651435049,40.548041704494,40.5480187580534,40.5480914774486,40.5479966111792,40.54789475161,40.5475994973531,40.5475710006699,40.5475477496438,40.5475304211385,40.5475195196059,40.5475153624014,40.5475180705458,40.547527565202,40.5475435699703,40.5475975045646,40.5476483426737,40.5476956112412,40.5477388704249,40.5477777176897,40.5478117915537,40.547840774952,40.5478649468367,40.5478828016376,40.5478941158932,40.547898748,40.547896639985,40.547887818231,40.5478723931466,40.5477520317731,40.5476267117366,40.5475668244565,40.5475125089045,40.547464026685,40.5474216113066,40.5473854670569,40.5473557680196,40.5473326572355,40.5473162460141,40.5473066133972,40.5472100216936,40.5471093737562,40.5470048464037,40.5468966232694,40.5467848944784,40.5466698563135,40.5465517108705,40.5464306657025,40.546305714034,40.5461829640001,40.5460625702009,40.5459446842679,40.5458501751459,40.5457575250083,40.5456918032889,40.5456298365897,40.5455720380667,40.5455187930841,40.5454704566452,40.5454273510252,40.5453897636235,40.545357945047,40.5453321074397,40.5453124230686,40.5452990231752,40.5452865414492,40.5452789400787,40.5452763067991,40.5452792308395,40.5452882574662,40.5453081255108,40.5453209226774,40.5453265874811,40.5453250927048,40.5453164455302,40.5453006875036,40.5452778943354,40.545248175537,40.5452116738943,40.5451685647817,40.5451190553189,40.5450633833761,40.5448581072105,40.5431103809108,40.5413054249478,40.5405207554593,40.5387179535597,40.5345350754362,40.5315111753082,40.5302857284368,40.5296207966873,40.5292819188827,40.5297404679849,40.5296758640466,40.5296681604375,40.5296700196492,40.5296777587688,40.5296913371738,40.529710683592,40.5297356964748,40.5297662445304,40.5298021674132,40.5298432765647,40.5298893562035,40.5299606760228,40.5300349608169,40.5301117499173,40.5301905671236,40.5302709236567,40.5303523211898,40.5304342549382,40.5305162167904,40.5305976984586,40.5306781946312,40.5308002101061,40.5309221649419,40.5310437457708,40.5311646401843,40.531284537536,40.53140312974,40.5315201120622,40.531635183904,40.5333000171959,40.5341306001902,40.5342445137056,40.5343588122774,40.5344730875703,40.5345869313297,40.534699936841,40.534811700382,40.5349218226655,40.5350020835476,40.5350813168788,40.5351589805483,40.5352345431831,40.5353074877836,40.5353773152612,40.5354435478532,40.53546240211,40.5354762646581,40.5354849148231,40.5354882149053,40.5354861123713,40.535363543072,40.5353228803694,40.5352880752985,40.535259175797,40.535236221669,40.5352192445294,40.5352082677613,40.5352033064831,40.5352322483374,40.535262799037,40.5352997067848,40.5353981449349,40.5354944886022,40.5355664606021,40.5356429396112,40.5357237988606,40.5358089043206,40.5358981149225,40.5360081524927,40.5361222914878,40.5362403369511,40.5362560650429,40.5362946885775,40.536322033082,40.5378724087738,40.5379001358684,40.5381644150861,40.5399857428992,40.5399630804139,40.5401038550403,40.5402492157188,40.5403989815102,40.5405529659905,40.5407109774831,40.5408541681175,40.5410002985792,40.5411491358085,40.5413004424272,40.5414539771167,40.5416094950037,40.5417445566482,40.5418810339517,40.5420185751953,40.5421568259161,40.5422954298203,40.5424340297022,40.5425722683638,40.5427368780823,40.5429003204873,40.5430623648054,40.5432227822358,40.543381346273,40.5433741215352,40.5434230848037,40.5434803547261,40.5434993339345,40.5436088936174,40.5436281905961,40.5435643996446,40.5437642710654,40.5439610880129,40.5441546722988,40.5443448486603,40.5445314449184,40.5447142921338,40.5448886058213,40.5450592419686,40.5452260356062,40.5453888254781,40.5454839964805,40.5455757233917,40.5456637985214,40.545748022447,40.545828204465,40.5459041630234,40.5459757261324,40.5460537679618,40.5461264646265,40.5461936550282,40.5462551902705,40.5463109339884,40.5463872962171,40.5464585170965,40.5465245290628,40.5465852694934,40.5466406807661,40.5467540260768,40.5467876170829,40.5468143984293,40.5468342950929,40.5468472513368,40.5468532308665,40.5468551637852,40.5468549629364,40.5468457419316,40.5468316505634,40.5468127067794,40.5467889347073,40.5467603646244,40.5467213480946,40.5466773056303,40.5466282750217,40.5465742983391,40.5465154218966,40.5464516962123,40.5469804431863,40.5470234823076,40.5473096046666,40.5480317959159,40.5484414795959,40.5484858167766,40.5486918314848,40.5493835464295,40.5495923695195,40.5504333007767,40.5508632389527,40.5512550782035,40.5523561791593,40.5534899710139,40.5539737593305,40.5544370425603,40.5550326257449,40.5557698719063,40.5565344367978,40.5572951724478,40.5572654909115,40.5563280570063,40.5552308277777,40.5550846581718,40.5543585024633,40.5530819500847,40.5522219060446,40.5517865892298,40.5516307519132,40.5504596952959,40.5489913911023,40.5490230404453,40.549127741725,40.550215477254,40.5505305226699,40.5506455113435,40.550948085111,40.5498584511809,40.550148394863,40.550376512558,40.5525130226466,40.5524646516058,40.5528108407792,40.5534236290893,40.5552880458486,40.5561875166401,40.5586914631006,40.5597200764875,40.5599055783561,40.5601514945116,40.5604680011701,40.5609420476326,40.5610493425846,40.5615464656662,40.5618845559932,40.562249060569,40.5625714143414,40.5629033648193,40.5630870199658,40.5631595190582,40.5634779466084,40.5637901625775,40.5641118321154,40.5644821710468,40.5651239930237,40.5656434882968,40.5660148190989,40.5663858570257,40.5666484041572,40.5671228251282,40.5675006495187,40.567877127458,40.5682553426664,40.5687782687683,40.5689150672086,40.5693419105715,40.5694360911413,40.5695265800072,40.5696130928106,40.5696953576866,40.5697731161182,40.5698461237492,40.5699141511519,40.5699769845483,40.5700366292767,40.5700905366114,40.5701385441942,40.5701805074356,40.57021629995,40.570245813937,40.5702689605055,40.5702856699422,40.570295891921,40.570299595655,40.5708942937548,40.571924855219,40.5729151645648,40.573094039891,40.5740059394047,40.5738112682864,40.5734282841132,40.573046622403,40.5726616791725,40.5722784655153,40.5718819128259,40.5715038446983,40.5711107821095,40.5707315307686,40.5703424444386,40.5699477987303,40.5695603057981,40.569181388867,40.5687896237727,40.5684089429083,40.5679434106031,40.5680960483853,40.5688923387405,40.5699291958546,40.5707810161172,40.5713629872354,40.5716093452059,40.5716802983745,40.5717207835254,40.5719472890497,40.5723249465657,40.5723744850151,40.5724122347462,40.5725585065765,40.5726972199249,40.5728277202268,40.5729494451845,40.5730191736173,40.5730618845432,40.5741347150593,40.5743291781514,40.5746781759357,40.5750445770901,40.5753317975795,40.5755796615393,40.5758353027021,40.5761079397351,40.5765203918729,40.5770485655325,40.5772823169445,40.5775274330632,40.5777834800652,40.5780499732385,40.579189758485,40.5792502129355,40.5793173431667,40.5802039500301,40.5815195671638,40.582066980334,40.5821263867667,40.582723652505,40.5831951509086,40.5833109123411,40.5838877063468,40.5840615278771,40.5842279009276,40.5843859602722,40.584534930743,40.5846741280705,40.5847904069636,40.5849189520807,40.5850583827193,40.5852070513839,40.5853631101048,40.5865666142673,40.5868494771359,40.5871461449712,40.5874358677838,40.5877177928864,40.5879911110863,40.588255067406,40.5902947235609,40.590342019704,40.5903962231406,40.5910628098845,40.5914348591443,40.5921394185354,40.5923414485486,40.5929065569067,40.5933138094327,40.5932926098742,40.5933057973005,40.5933058606016,40.5933059513644,40.5933545794811,40.5933546328331,40.5933547047808,40.5934184640786,40.5934185454077,40.5934186366082,40.5934952202106,40.5934953372301,40.5934954723356,40.5935819063333,40.5941894178399,40.5943675906145,40.5949115147772,40.5964112311185,40.5968490112399,40.5973476524014,40.5978622277705,40.5983636065895,40.5986967716816,40.5987524157589,40.5989348595219,40.5992375997249,40.5994947946257,40.5995422411895,40.5997489746976,40.5998163931775,40.6012364554469,40.6015601477326,40.6016907451458,40.601855487904,40.601945577091,40.6021500548305,40.6024493024955,40.6027192027059,40.6030952955355,40.6035880441716,40.6042135088463,40.6064058245662,40.6074527233981,40.6078995395851,40.6077987573359,40.6075559308757,40.6072476482562,40.6071887375237,40.6067805666346,40.6064828925687]}]],[[{"lng":[-73.8678979862884,-73.8679553251872,-73.8679962677433,-73.8680426074236,-73.8680942581114,-73.8681511222353,-73.8682027030534,-73.8683086756137,-73.8684768566971,-73.8686500222093,-73.8688280912266,-73.8690109812061,-73.8691598803034,-73.8693127051372,-73.8694693710232,-73.8696297911571,-73.8697938766479,-73.8699615365774,-73.8702485562774,-73.8705411987981,-73.8708392961776,-73.8711426773445,-73.8714435298809,-73.8717491024744,-73.8720592092481,-73.8723736614543,-73.8726922679372,-73.8730148349032,-73.8731948906925,-73.8733732478293,-73.873549843678,-73.873724615943,-73.8739296431274,-73.8741305471525,-73.8743271367095,-73.8745192248422,-73.8747066283928,-73.8748891689179,-73.8750570396693,-73.8752197967313,-73.8753772774422,-73.8755293241256,-73.8756757851077,-73.8758165140247,-73.8759299292354,-73.876039459094,-73.8761450371111,-73.8762465989224,-73.8763440831593,-73.8764374306502,-73.876546875531,-73.8766495902652,-73.8767454811955,-73.8768344608922,-73.8769164481618,-73.8769913683885,-73.8770591532808,-73.877119741058,-73.8795724553702,-73.8800421305908,-73.8801439537609,-73.8801587112667,-73.8801779396049,-73.8802022690034,-73.8802501798871,-73.8803540727151,-73.8803974787197,-73.8804183333439,-73.8804159341632,-73.8803900369338,-73.880340936251,-73.8802693992656,-73.8801766806027,-73.8791894189227,-73.8781889161654,-73.8781545932278,-73.8780512821261,-73.8780012488109,-73.878004801122,-73.8780162797768,-73.8780356242649,-73.8781312919031,-73.8781494463452,-73.8787604168712,-73.8793628325953,-73.8799579875278,-73.8812442254155,-73.8820862367445,-73.8827483336087,-73.8831908876937,-73.8833421350919,-73.8833423486773,-73.8833425867325,-73.8835076415373,-73.8835078795922,-73.8835081045761,-73.8836832738419,-73.8836833685652,-73.8836834756176,-73.8838635811526,-73.8838637475968,-73.8838639140083,-73.8840432857114,-73.8840434159229,-73.8840435344224,-73.8842167148987,-73.8842168342661,-73.8842169644318,-73.8843788790354,-73.88437905751,-73.8843792231517,-73.884526151592,-73.8851649583431,-73.8866241303956,-73.886834866747,-73.8869288973406,-73.8870514260234,-73.8875861260884,-73.8877477344924,-73.8884015720717,-73.8888964224737,-73.889847018932,-73.8908054398087,-73.8917661791393,-73.8928864458674,-73.8929164370079,-73.8945343134316,-73.8946794895308,-73.8950827065964,-73.8959567495941,-73.8965206906546,-73.8966154655592,-73.896682430808,-73.8968817842862,-73.8971564543338,-73.8973833610236,-73.8989257182505,-73.8997258855994,-73.8997825214195,-73.8997112766292,-73.8996206531463,-73.8993642685063,-73.8992249910406,-73.8982721693128,-73.8978788753162,-73.8977666909259,-73.8976960116153,-73.8975635771188,-73.89731936279,-73.8972811252072,-73.897057634523,-73.8967579007494,-73.896431707833,-73.8967074708932,-73.896994928605,-73.8970914908083,-73.8971571716543,-73.8971394732915,-73.8970732920871,-73.8970465142028,-73.8970336369263,-73.8970289508559,-73.8969705424814,-73.8968784456836,-73.8966100226111,-73.896408958026,-73.8963578603773,-73.8964113354937,-73.8964350345664,-73.896492293823,-73.8965465329252,-73.8965646453232,-73.8965958378131,-73.896606136735,-73.8966306858501,-73.8966306864356,-73.8966333386324,-73.8924690662955,-73.886107039908,-73.8860557544588,-73.8859985505397,-73.8856152304181,-73.88480028067,-73.8846959725276,-73.8840540727674,-73.8830325744197,-73.8814809442779,-73.8783616012599,-73.8781677762139,-73.8781119783927,-73.8780718941028,-73.8780367219856,-73.8778655044271,-73.8773681711788,-73.876467149982,-73.875632921197,-73.874830452885,-73.8741605488436,-73.87294860419,-73.8709525195244,-73.8678979862884],"lat":[40.9029401764028,40.902812085638,40.9027168010062,40.9026229502025,40.9025307089621,40.9024402503484,40.9023553827737,40.9022491643954,40.902072434259,40.9018984975693,40.9017274346719,40.9015593257222,40.9014314305281,40.9013062297911,40.9011837928705,40.9010641874455,40.9009474799236,40.9008337349579,40.9006529914398,40.9004775162956,40.900307410286,40.9001427709335,40.8999947124401,40.8998523285878,40.8997157059739,40.8995849277594,40.8994600734117,40.8993412188655,40.8992738044374,40.8992038388346,40.8991313468961,40.8990563539274,40.8989573673885,40.8988536278528,40.8987452341152,40.8986322891719,40.8985149008079,40.8983931808146,40.8982724558971,40.89814776472,40.8980192319232,40.8978869856172,40.8977511583684,40.8976118859462,40.8974933010188,40.8973726316343,40.8972499510673,40.8971253339417,40.8969988558056,40.8968705934597,40.8967027578709,40.8965324907558,40.8963599474535,40.8961852853786,40.8960086642264,40.8958302447916,40.8956501898439,40.8954686636436,40.8952714848418,40.8952222845866,40.8950615902807,40.8949134673607,40.8947204234618,40.8945542272723,40.8942270051642,40.8935174312458,40.8933138145226,40.8931062907469,40.892897043861,40.8926883287953,40.8924824176093,40.8922814994133,40.8920876014835,40.8903070319999,40.8880491810487,40.8879434463563,40.8876252311799,40.887447196229,40.8873371754051,40.8872273922942,40.8871183217562,40.8869127973194,40.8868738073648,40.8860401998614,40.8852182399748,40.8843906289661,40.8827096330056,40.8831322219112,40.8833973868017,40.8832848345123,40.8832265189146,40.883226437882,40.883226374464,40.8831832469685,40.8831831835502,40.8831831475924,40.8831576333284,40.8831576153315,40.8831576154394,40.8831513945959,40.8831513853821,40.8831513949309,40.8831649742397,40.8831649842544,40.8831650019633,40.8831976653223,40.8831976917431,40.8831977280585,40.883247597844,40.8832476517975,40.8832477233281,40.8833121478351,40.8836316116553,40.8842673032099,40.8843420260654,40.884355714854,40.8843495758467,40.884255619663,40.8842876181292,40.8844170751705,40.8845039191596,40.8846857465929,40.8848678434673,40.885049846262,40.8852643063068,40.8853114345968,40.8855940638741,40.8855199415863,40.8856415115047,40.8858283245211,40.8859369891962,40.885955255508,40.8859645908544,40.8859993472759,40.8860448242452,40.8860867717957,40.8863835018048,40.8865148870103,40.886529123508,40.8866387310399,40.8867794872161,40.8872490897004,40.887530803064,40.8894579429989,40.8902761012422,40.8905093897077,40.890681823998,40.8910102454727,40.8916158607094,40.891710684183,40.8921404575288,40.8926454435717,40.8936552799275,40.8958050299172,40.8978787238792,40.8985933177028,40.8993718266773,40.8996194349772,40.9000838913376,40.9002247030685,40.9002786212819,40.900315204249,40.9006111675785,40.9010405801358,40.9022035130852,40.9029611087199,40.9032001315844,40.9045045208209,40.9050929990697,40.9063396529452,40.9075066550445,40.9082858241623,40.9096276596512,40.9102022486224,40.9112988776876,40.9112989271071,40.9114173753489,40.9101676642102,40.9083292712536,40.9083144531044,40.9082971244703,40.9081810248174,40.9079307360831,40.9078987002954,40.907702697388,40.9073336316598,40.9068918567017,40.9060036360062,40.9059555079838,40.9059437605864,40.9059324442065,40.9059286073262,40.905869210358,40.9057116573731,40.9054441177172,40.9052082128174,40.9049437833683,40.9047812832401,40.9044410231716,40.9038502527149,40.9029401764028]}]],[[{"lng":[-73.8572233098447,-73.8590215495895,-73.8599126509161,-73.8600132282501,-73.8604959572286,-73.8605407788258,-73.8605783620238,-73.8606132315635,-73.8608685382499,-73.8609891735391,-73.8609450096383,-73.8608992000733,-73.8608527740765,-73.8608067747311,-73.8607622355334,-73.8607201571733,-73.8604546317086,-73.8603040271179,-73.8602574891922,-73.8602513031117,-73.8602448637658,-73.8602122190236,-73.8601587036747,-73.8597924275074,-73.8597553367327,-73.8594869191347,-73.859410229427,-73.859409890647,-73.8594447402716,-73.8593424080217,-73.8592495587374,-73.8591261328236,-73.8590452922978,-73.8590071538149,-73.8589800291315,-73.858688599342,-73.8585482227649,-73.8583738561172,-73.8580507644599,-73.8579397894111,-73.8578339260733,-73.8577488337395,-73.8575274515629,-73.8573194151551,-73.8573022453536,-73.8571875776634,-73.8570260178516,-73.856958703578,-73.8571116306092,-73.8571471445684,-73.857176020626,-73.8571975333018,-73.8572111421181,-73.8572165051783,-73.8572134877547,-73.8572112957968,-73.8572096947068,-73.8572087304163,-73.8572084305878,-73.8572088038234,-73.8572098394151,-73.8572115076545,-73.8572137606839,-73.8572165338691,-73.8572197476546,-73.8572233098447],"lat":[40.6502786700389,40.6526601758646,40.6538402372784,40.6539734258613,40.654558824478,40.654623996108,40.654675329646,40.6547194707377,40.6550778057373,40.6552097671052,40.655220680013,40.6552264429499,40.6552269264364,40.6552221196096,40.6552121304677,40.655197183443,40.6550671073662,40.6549250027221,40.6548840505041,40.6548786061898,40.6548722545688,40.6548400521315,40.6547936633059,40.6544761573771,40.6541041761898,40.6539323489336,40.6538647374224,40.6538578618105,40.6536375476018,40.6535610669102,40.6532542954285,40.6531729947319,40.653107976084,40.6530040583722,40.6526754578347,40.6524875560957,40.652360790181,40.65218529245,40.6518018686935,40.6516757415765,40.6515581525573,40.6514898816955,40.6513792431127,40.6512370990079,40.6510641045785,40.6508756946087,40.6506937193045,40.6505873739752,40.6505259809426,40.6504961349802,40.6504623900148,40.650425593865,40.6503866710065,40.6503465993456,40.6503063856496,40.650303860942,40.650301090696,40.6502981543831,40.650295136239,40.6502921228468,40.6502892006533,40.6502864534891,40.6502839601636,40.6502817922042,40.6502800118041,40.6502786700389]}],[{"lng":[-73.8303272533706,-73.8303778971818,-73.8304132505903,-73.8304120390573,-73.830400115163,-73.8303580810034,-73.8303305833368,-73.8302660185149,-73.8301902035727,-73.8301257067886,-73.8300032131889,-73.8299259406877,-73.8298891985601,-73.8299455643583,-73.8300430662559,-73.8303272533706],"lat":[40.6551328058033,40.655128335118,40.6551578223363,40.6552158557617,40.6552571439989,40.6553220828877,40.655369872375,40.6554286467848,40.6554788188834,40.6555106108453,40.6555521287071,40.6555422030022,40.6555228225841,40.655424494353,40.6553494225413,40.6551328058033]}],[{"lng":[-73.8011553859722,-73.8011423813821,-73.8011369726162,-73.801134301319,-73.8011323614824,-73.8011600086592,-73.8011790910815,-73.8011995636295,-73.8012155284598,-73.8012340123842,-73.8012616037583,-73.8013428673729,-73.801418975859,-73.8014539825104,-73.8015305266934,-73.8015556533534,-73.801667766912,-73.8016826655336,-73.8017029793769,-73.8018364641517,-73.8020320768996,-73.8021486650281,-73.802995272073,-73.8037752445164,-73.8043205057094,-73.8041369962541,-73.8061016318443,-73.8064743428576,-73.8073717986702,-73.8076878255337,-73.807890716094,-73.808457543926,-73.8096014878295,-73.8114955695234,-73.811557239658,-73.8116204419967,-73.8116838024453,-73.8117346486836,-73.8117859560971,-73.8118364680822,-73.8118849475157,-73.8119302070536,-73.81197113821,-73.8120067385057,-73.8120130283955,-73.8120145889871,-73.8120114016539,-73.8120035042888,-73.8116557422019,-73.8115869511678,-73.81150249147,-73.8114032795879,-73.8112906073771,-73.8111660877966,-73.8117669494147,-73.8122867278519,-73.8128161638551,-73.8133501116201,-73.8138875902702,-73.8144276302692,-73.8149692248572,-73.817917595908,-73.8230521056645,-73.8242605229863,-73.8258439379527,-73.8294871604183,-73.8320321880745,-73.8321184686962,-73.8324776821402,-73.8318573801723,-73.8310777106597,-73.8302937520802,-73.830031319839,-73.8299133575328,-73.8293142021881,-73.8285994240469,-73.8282792561476,-73.8280718116246,-73.8278250750219,-73.827706836014,-73.8275964175787,-73.827478070959,-73.827360789807,-73.8272419261337,-73.8271250997571,-73.827013244635,-73.8268962339085,-73.8272431490016,-73.8289555302084,-73.829271963309,-73.8295969736259,-73.8297565352645,-73.8300103981827,-73.8298694883252,-73.8300117228862,-73.8303814083701,-73.8305312551552,-73.8306991637812,-73.8308197291445,-73.8309365135348,-73.8309944186789,-73.831103562768,-73.8313315140327,-73.8312988663128,-73.831287744717,-73.8313960977567,-73.8315603934254,-73.8315606872412,-73.831592163422,-73.8316131479368,-73.8315832205966,-73.8311820184312,-73.8312016021555,-73.8311318184897,-73.830425167031,-73.8304204789363,-73.8301571958236,-73.8301349868151,-73.8301478542749,-73.8301688540962,-73.8302090599967,-73.8301832066552,-73.8301301265928,-73.8301122668115,-73.8300815506942,-73.8299008001946,-73.8293448924298,-73.8291730685906,-73.8290406635642,-73.8290242898552,-73.8290141755797,-73.8290395009157,-73.829070298979,-73.8291083631228,-73.8291527996165,-73.8291881885571,-73.8292136426253,-73.8293489022466,-73.8293897294641,-73.8294560217537,-73.8294334142134,-73.8296667765213,-73.8298505445562,-73.8300226740885,-73.830023560827,-73.8300651924216,-73.8300860160231,-73.8301503268674,-73.8302001706487,-73.830308055358,-73.8303697749091,-73.8304432807192,-73.8305341162677,-73.8305541099798,-73.830582370173,-73.8305715784614,-73.8305565858942,-73.8305562020811,-73.8305514511539,-73.8305306915187,-73.8305354014107,-73.8305375909055,-73.8305502806031,-73.8305577778013,-73.830569306876,-73.8305583178113,-73.8305560975602,-73.8305688675813,-73.8306024597477,-73.8309784538409,-73.8313573446368,-73.8313435328766,-73.8314475217394,-73.8314691331061,-73.8317081441153,-73.8319529731,-73.8319968847036,-73.8320544513054,-73.8321233098165,-73.8320005287074,-73.832052014315,-73.8321605022974,-73.8321977562753,-73.8322169851857,-73.8321659471106,-73.8320464777308,-73.8319047430317,-73.8318583575191,-73.8316022021337,-73.8315496635671,-73.8314933010301,-73.8314121146682,-73.8313810634856,-73.8313576493811,-73.8313084475245,-73.8311610080975,-73.8311034100904,-73.8309285600347,-73.8308886896376,-73.8308332160637,-73.8307500547715,-73.8306032491923,-73.8304719168043,-73.8304693198169,-73.8304050753494,-73.8303813278389,-73.8303800488346,-73.8303495941264,-73.8302838946952,-73.8302455038411,-73.8302121316101,-73.8300785630865,-73.830087249523,-73.8300878041388,-73.8300718843366,-73.8300551408046,-73.8300330145656,-73.8299852603229,-73.8299273906643,-73.8298889077211,-73.8298448654121,-73.8297995641651,-73.8297117707927,-73.8296582856937,-73.8296089716734,-73.8296056279346,-73.8295528696972,-73.8295541371534,-73.829532333938,-73.8294789300125,-73.8293760341059,-73.8293077520442,-73.8292581972262,-73.829241631575,-73.8292365379905,-73.8292464637477,-73.829258470225,-73.8292606922069,-73.8292595935166,-73.8292672032149,-73.829282046746,-73.8293028747796,-73.8293097469534,-73.8292852571423,-73.8292662361284,-73.829238450417,-73.829205437432,-73.8291580155682,-73.8291348260746,-73.8291153688096,-73.8290999080115,-73.8290859160264,-73.8290592101385,-73.8290302127876,-73.8290043505544,-73.8289828548771,-73.828967787403,-73.8289608408767,-73.8289650827701,-73.828980799956,-73.8290132530184,-73.8290774848865,-73.8291322556383,-73.8291791973457,-73.8292082830465,-73.829257953569,-73.8293238942211,-73.8293876196137,-73.829417622329,-73.8294558972416,-73.8295137509692,-73.8295276562391,-73.8295324144858,-73.8295396402182,-73.8295541464757,-73.8296549949645,-73.8296890823881,-73.8297282031721,-73.8297531466852,-73.8297763896963,-73.829791927876,-73.8298001961994,-73.829822432478,-73.8298640541821,-73.8299171026136,-73.8299303958594,-73.8299313954848,-73.829935716332,-73.829954619396,-73.8299774969859,-73.8300093301949,-73.8300530205078,-73.830094403057,-73.8301180788116,-73.8301302874052,-73.8301306219772,-73.8301234547345,-73.8301136277782,-73.8300758453689,-73.8300506135045,-73.8300229029023,-73.8299889488317,-73.8299550068527,-73.8299167073472,-73.8298827923807,-73.8298530054975,-73.8298131848936,-73.829771694163,-73.8297320793274,-73.8297070683891,-73.8296682515982,-73.8296266773849,-73.8296065278313,-73.8295998690315,-73.8296134315801,-73.8296710398506,-73.8296925320881,-73.8297231849838,-73.8297548637584,-73.8298139921881,-73.8298239376121,-73.8298734791491,-73.8299153679765,-73.8299281928743,-73.8299425594842,-73.8299597282835,-73.8299619242574,-73.829965808183,-73.8299717621831,-73.82999639204,-73.830009970711,-73.8300142688902,-73.8300129082758,-73.830023447344,-73.8300501303299,-73.8300815175368,-73.8301011528758,-73.8301166593848,-73.8301313834006,-73.8301495010476,-73.8301624328173,-73.8301724849563,-73.8301773206411,-73.8301759252158,-73.830166419441,-73.8301537671067,-73.8301406846884,-73.8301336572392,-73.8301243738043,-73.8301155025875,-73.8301093735125,-73.8300978635156,-73.8300733850235,-73.8300689875143,-73.8300341461414,-73.8300278002772,-73.8300216692621,-73.8300121418499,-73.8299472921571,-73.829897165483,-73.8298815258655,-73.8298258946859,-73.8297855130339,-73.8297638699683,-73.8297248146432,-73.8297137337066,-73.8296952008339,-73.8297065289459,-73.8297924026003,-73.8298707219273,-73.8299452754599,-73.8300012075771,-73.8300572136032,-73.8301334698056,-73.8301580575766,-73.8301991065492,-73.8302440680071,-73.8302442703937,-73.8301697604382,-73.830102767811,-73.8300060027402,-73.8299141586122,-73.8298904789936,-73.8298271228172,-73.8297714070234,-73.8297007946754,-73.8296301319762,-73.8295146301451,-73.8294586694703,-73.8293729058294,-73.8292239390286,-73.8291049999112,-73.829064234363,-73.829094348252,-73.8291729074473,-73.82924393205,-73.8293471523731,-73.8294271194847,-73.8294982617395,-73.8294946556542,-73.8294613126142,-73.8294615159303,-73.8295026511984,-73.8295846847763,-73.8296815704028,-73.8297784923666,-73.829891865403,-73.8299015239209,-73.8300096724431,-73.8300917256968,-73.8301850780881,-73.8302411836491,-73.8303272854543,-73.8303908715652,-73.8305053205737,-73.8310667080647,-73.8311054723839,-73.8311423012404,-73.8312098630255,-73.831271125642,-73.8313254491098,-73.8313722659439,-73.8314110870829,-73.8314415069975,-73.8314632079265,-73.8314759631946,-73.8314699336738,-73.8315163883261,-73.8315472294415,-73.831559302535,-73.8315530917718,-73.831614185982,-73.8316872832863,-73.8317531295931,-73.8318523847929,-73.8319167052065,-73.8320072528844,-73.8320641148232,-73.8321285726655,-73.8321818606789,-73.8322411799696,-73.8324846557933,-73.8327535238129,-73.8327673589517,-73.8329030952459,-73.8327819436147,-73.8320849710086,-73.8319439457826,-73.832600363706,-73.8320149170802,-73.8311037371605,-73.8311266442182,-73.8312696749141,-73.8319457671701,-73.8328442835857,-73.8333843947254,-73.8330606995693,-73.832804397168,-73.8325688862534,-73.8323819280704,-73.8321710696902,-73.831974282252,-73.8318330050205,-73.8317056513666,-73.8315668141263,-73.8311871917955,-73.8310888527372,-73.8317960415922,-73.8327190986577,-73.8336384528618,-73.8345606990977,-73.8354713658254,-73.835972234305,-73.8363858007114,-73.8368107681604,-73.8372019248578,-73.8376239181884,-73.8380499820657,-73.8384530672249,-73.8388069039889,-73.8386227280471,-73.838627242939,-73.838734815859,-73.8388370570906,-73.8388507078595,-73.8388946374825,-73.838929251738,-73.8389025881868,-73.8388810542054,-73.8388563211552,-73.8388923948893,-73.8384754191343,-73.8380755563974,-73.8380931086526,-73.8381408144728,-73.8382216766254,-73.8384389733077,-73.838723543631,-73.8396959651554,-73.8396239579199,-73.8399794997561,-73.839725403531,-73.839635114992,-73.8392926818833,-73.8389646298412,-73.8384973955962,-73.8383980383054,-73.8380605840761,-73.8376358235636,-73.8372391352009,-73.8368133457516,-73.8372940791441,-73.8373877877964,-73.836589550425,-73.8363307472129,-73.8364073545599,-73.8376159580897,-73.8381096064441,-73.8386089610291,-73.8390347340008,-73.839312898798,-73.8397046917057,-73.8398022285466,-73.8398979773776,-73.8399911355591,-73.8400809221711,-73.8401665845587,-73.8402474046438,-73.840322704943,-73.8403918542486,-73.8412600544651,-73.8457948406022,-73.8495069901807,-73.8520762847404,-73.8521486157404,-73.8522131572783,-73.8522696911297,-73.8523180261374,-73.8523579988589,-73.8523894741193,-73.8524123454688,-73.8524265355429,-73.8524319963247,-73.8524287093083,-73.8524166855609,-73.8523992616149,-73.8523745309815,-73.8523425750199,-73.8523034988707,-73.8522574311094,-73.8522045233227,-73.8521449496121,-73.8520789060195,-73.8520384660271,-73.8520020581973,-73.8519870498002,-73.8519649517128,-73.8519358943809,-73.8519000493405,-73.8518576282036,-73.8518088814108,-73.8517540967519,-73.851748465221,-73.8517461604044,-73.8517258739812,-73.851697757682,-73.8516730393373,-73.851658390011,-73.8516303084915,-73.8516111941109,-73.8515887121938,-73.8515864377017,-73.8515908913235,-73.8515717997111,-73.8515549863926,-73.8515449128941,-73.8515404206103,-73.8515336867929,-73.8515213251905,-73.8515089638776,-73.8515033532725,-73.8514988656687,-73.8514563036159,-73.8514372318764,-73.8513979282923,-73.8513855669577,-73.8513765735141,-73.8513877343658,-73.8513720216508,-73.8513372511478,-73.8513271986014,-73.8513250249307,-73.8513239446076,-73.8513082877649,-73.8512948518187,-73.8512429702339,-73.8511895581057,-73.8511358605975,-73.851083129526,-73.851032594178,-73.8509854326553,-73.8509427444099,-73.850905524614,-73.8508976017595,-73.850898688717,-73.8509154173802,-73.8509321191295,-73.8509342375028,-73.850927408209,-73.8509115872663,-73.8509036968295,-73.8508879900208,-73.8508823818691,-73.8508790136439,-73.8508621464434,-73.8508307297314,-73.850827317579,-73.8508093154364,-73.8508058631627,-73.8508047027566,-73.8507956292303,-73.8507921397711,-73.8507909668698,-73.8507707816691,-73.8507696594625,-73.8507696556401,-73.8507718539128,-73.8507864083101,-73.8507818599591,-73.8507089708108,-73.8507033666768,-73.850682066897,-73.8506607735166,-73.8506103016636,-73.850596808884,-73.8505809929476,-73.8505853849706,-73.8505853734943,-73.8505999240647,-73.8505886734791,-73.8505762946302,-73.8505750499885,-73.8505872608012,-73.8505938665977,-73.8506060908352,-73.850607086531,-73.8506024787783,-73.8505866563354,-73.8505765359857,-73.8505552079327,-73.8505383729429,-73.8505271491249,-73.8505203896003,-73.8504979903988,-73.8504700272946,-73.8504275107985,-73.8503961526706,-73.8503770834964,-73.8503770490145,-73.8503982732645,-73.8504218051368,-73.8504363098151,-73.8504361891814,-73.8504450863127,-73.8504226101272,-73.8503979092982,-73.8503698265418,-73.8503384037804,-73.8503148248562,-73.8502688342385,-73.8502419023433,-73.8502183121708,-73.8501969246121,-73.8501755472211,-73.8501721729457,-73.8501552962456,-73.8501103731421,-73.8500609679669,-73.8500531136257,-73.8500463815095,-73.8500373928249,-73.8500205333353,-73.8499700059189,-73.8499149744726,-73.8498543445889,-73.8497881217674,-73.8497286297767,-73.8496893831687,-73.8496859879013,-73.8496836744421,-73.8496107867044,-73.8495715205987,-73.849545709434,-73.8495199072339,-73.8494896237204,-73.8494683262287,-73.8494526399356,-73.8494257215643,-73.8493740426053,-73.8493021780029,-73.8492572684081,-73.8492235113803,-73.8492144839441,-73.8492054573344,-73.8492165835728,-73.8492389718614,-73.8492512811913,-73.8492826107579,-73.8492959831814,-73.8493149601344,-73.8493150198728,-73.8493340565691,-73.8493418380898,-73.8493473943191,-73.8493540686591,-73.8493607475185,-73.8493976640632,-73.8494265354144,-73.8494607418717,-73.8494993834858,-73.8495433848653,-73.8495898530683,-73.8496374540811,-73.8499225331628,-73.8499716568271,-73.8500216521742,-73.8500710658326,-73.8501184613399,-73.85024113552,-73.8502900896044,-73.8503426227238,-73.8503960262267,-73.8504491946124,-73.8505010272473,-73.850550451151,-73.8505964432065,-73.8506380513428,-73.8506507064278,-73.8506650641061,-73.8506806922315,-73.8506971204193,-73.850713854204,-73.8507303899229,-73.8507462298741,-73.8507608972973,-73.8507739507234,-73.8507849972619,-73.8508968231504,-73.8510057044508,-73.8511112043475,-73.8512128995933,-73.8513103822068,-73.8514032611105,-73.8514911636992,-73.8517659617138,-73.8517860655937,-73.8518083734584,-73.8518323416379,-73.851857385998,-73.8518828961775,-73.8519083205576,-73.8519329651355,-73.8519562259433,-73.8519775329258,-73.8520213133259,-73.8520630899217,-73.8521016034167,-73.8521356928783,-73.8521643307332,-73.8521866537415,-73.8521970427276,-73.8522276747309,-73.852264451124,-73.8523065884473,-73.8523531890402,-73.8524032601637,-73.852455735148,-73.8525094961157,-73.8525633977956,-73.8526162919181,-73.8526670516778,-73.8528487636856,-73.8530321270977,-73.8532167710734,-73.853402322182,-73.8535884051559,-73.8536101603515,-73.853680489395,-73.8537495605632,-73.8538210536444,-73.8538926809409,-73.8539636799562,-73.8540332948804,-73.8541007846379,-73.8541924891632,-73.8542881458401,-73.8543873486234,-73.854489676413,-73.8545946948411,-73.8547019581168,-73.854788287095,-73.8549108527671,-73.854936004745,-73.8549593954376,-73.8549804001243,-73.8549984578101,-73.8550130862076,-73.855023531767,-73.8550428034632,-73.85507048271,-73.855105968296,-73.8551484894434,-73.8551971225484,-73.8552508112443,-73.8553083893459,-73.8553686061817,-73.8554301537611,-73.8554916951866,-73.8555518936946,-73.8555815862181,-73.8556139177396,-73.8556481446741,-73.8556834798457,-73.8557191105908,-73.8557542174482,-73.8557879930053,-73.8558342102684,-73.8558782271422,-73.8559193294256,-73.8559568502062,-73.8559901806816,-73.8560527795483,-73.8561100599069,-73.8561614859039,-73.8562065764491,-73.8562449097161,-73.8562761270878,-73.8562999365133,-73.8563161152393,-73.8563245118951,-73.8563250479093,-73.8563177182454,-73.8563155754016,-73.8563105368259,-73.8563145811664,-73.8563276393953,-73.8563494885868,-73.8563797557232,-73.8564179240622,-73.8564633419576,-73.8565152339852,-73.8565177643771,-73.8565291786058,-73.8565493691023,-73.8565781455663,-73.8566152367607,-73.8566602930642,-73.85671288977,-73.8567725310861,-73.85683865481,-73.8569106376273,-73.8569567132228,-73.857004896427,-73.8570538834579,-73.8571023487832,-73.8571489809871,-73.8571925182574,-73.8572317825299,-73.857265711365,-73.8572656368121,-73.8572669122461,-73.8572695102135,-73.8572733747954,-73.8572784228099,-73.8572845456027,-73.8572928643504,-73.8573022208871,-73.8573123416295,-73.8573229306489,-73.857333678324,-73.857333821715,-73.85739480831,-73.8574556192318,-73.857515262577,-73.857572765488,-73.857627190022,-73.8576776484503,-73.8577233177397,-73.8578960147709,-73.8581470689611,-73.8582813238382,-73.8583979157458,-73.8585202665814,-73.8585606941667,-73.8585719869021,-73.8586885326703,-73.8587641975346,-73.8587633804155,-73.858758079917,-73.8588572908893,-73.8589249980263,-73.8590032771037,-73.8591549844603,-73.8592655290226,-73.8592777247158,-73.8592944217652,-73.8592775234689,-73.8592977192605,-73.8593083014002,-73.8593273590094,-73.8593581958246,-73.8594178012395,-73.8594848224981,-73.8595081855009,-73.8595731025021,-73.859608185786,-73.8596122371346,-73.8596701793772,-73.8597149870548,-73.8597583811017,-73.8599590652877,-73.8607295220206,-73.8608403069991,-73.8610622300147,-73.8612548660546,-73.8613519324433,-73.8613638195039,-73.8613687513908,-73.861358502096,-73.8613529424475,-73.8613632240649,-73.8613886383943,-73.8614013099616,-73.861401251066,-73.8613922592211,-73.8613603836126,-73.8613045307785,-73.8612370016934,-73.8611742031605,-73.8610877335765,-73.8610156157425,-73.8609888824967,-73.8609597077648,-73.8609308792144,-73.8609086986063,-73.8608648885113,-73.8608311189217,-73.8607879936244,-73.860723044558,-73.8606741458594,-73.8606478405359,-73.860637222368,-73.8606240457877,-73.8606166932969,-73.8606142924694,-73.8606074278591,-73.8606230206867,-73.860615570409,-73.8606030661496,-73.8605812355495,-73.8604949922559,-73.8604576850531,-73.8604428867467,-73.8604400321146,-73.86044847474,-73.8604814321669,-73.8605097108919,-73.8605143464823,-73.8605150388841,-73.8604771130627,-73.8604474248759,-73.860350888227,-73.8603057625893,-73.8602807794779,-73.8602444847006,-73.8602264327206,-73.8602083950094,-73.8601928097566,-73.8601594829451,-73.8601502557075,-73.8601427223578,-73.8601186009138,-73.8601102783192,-73.8600998986866,-73.8600798101341,-73.8600677781952,-73.8600416887145,-73.8600329829865,-73.8600687031598,-73.8600623451106,-73.8600556957444,-73.8600487031046,-73.8600075860233,-73.8599614249595,-73.859930913349,-73.8598814517549,-73.8598457280558,-73.8598336352148,-73.8598459195313,-73.8598858170924,-73.8599341705408,-73.8599624329555,-73.8600001001494,-73.8600081921851,-73.8600233871927,-73.8600544693938,-73.8600692430244,-73.8600749979822,-73.860070689259,-73.8600519436706,-73.8600427563908,-73.8600273065142,-73.8599910170616,-73.8599612824394,-73.8599439747917,-73.8599388282361,-73.859915202642,-73.8598823795487,-73.8598102760968,-73.8598000897788,-73.8597909424718,-73.8598067137594,-73.8599233637409,-73.8599371302826,-73.8599389727953,-73.8599221833128,-73.8598778154744,-73.8598011565704,-73.8597322018688,-73.8597057182864,-73.8596662217731,-73.8596527582745,-73.8596194595523,-73.859592448186,-73.8595720481326,-73.8595585040612,-73.8595519784199,-73.8595551525131,-73.8595651832258,-73.8595820086352,-73.8596055248588,-73.8596355866937,-73.8596791956427,-73.8597275040775,-73.8597799309069,-73.8598358454971,-73.8598945752586,-73.8599652036247,-73.8600352653629,-73.8601039861342,-73.8601358343232,-73.8601681408823,-73.8601999628406,-73.8602303713707,-73.8602584789008,-73.8602873567847,-73.8603105184225,-73.8602702573438,-73.8602334317889,-73.8602005299183,-73.8601976119449,-73.8601955340443,-73.8601943551591,-73.8601941087292,-73.8601948017452,-73.8601964145492,-73.8601989013927,-73.8602021917336,-73.8602061922386,-73.8602107894292,-73.8602158529014,-73.8602212390249,-73.8602267950167,-73.8602323632754,-73.8602952605345,-73.8603544076974,-73.8604087789184,-73.8604195559543,-73.860429523244,-73.860438390331,-73.8604458988195,-73.8604518299056,-73.8604560107522,-73.8604583195259,-73.8604586889478,-73.8604571082532,-73.8604536235055,-73.8604253659693,-73.8604049001925,-73.8603926003612,-73.8604437800774,-73.86045469175,-73.8604656684248,-73.8604764395867,-73.8604867397861,-73.8604963151795,-73.8605049297862,-73.8605123713037,-73.8605184563402,-73.860523034933,-73.8605178542075,-73.8605130816167,-73.8605088466753,-73.8605052643074,-73.8605024317281,-73.860500425806,-73.8604993009753,-73.8604990877612,-73.860499791949,-73.8605013944291,-73.8605120860003,-73.8605246685867,-73.8605388278256,-73.8605542099625,-73.8605704306908,-73.8605767705207,-73.8605821667271,-73.8605864660507,-73.8605895463841,-73.8605963075421,-73.8606036701431,-73.8606114193702,-73.8606193291259,-73.8606271686287,-73.8606347091474,-73.8606417306737,-73.8606480283423,-73.8606534184075,-73.8607199797675,-73.8608232499638,-73.8609244581051,-73.8609407764581,-73.8609558855766,-73.8609693483565,-73.860980775322,-73.8609898358922,-73.8609962679457,-73.8609998854024,-73.8610005836086,-73.8609983423632,-73.860993520295,-73.86098115494,-73.8609615078936,-73.8609349948081,-73.8609021766015,-73.8608910415401,-73.8608828485938,-73.8608778236548,-73.8608773230655,-73.8608737230406,-73.8608671283417,-73.8608577308782,-73.8608458041223,-73.8608316951513,-73.8607724560542,-73.8607162632191,-73.8606640511126,-73.860616688006,-73.8605749615366,-73.8605395656104,-73.8605110888612,-73.8604900048624,-73.8604766642505,-73.8604712888929,-73.860473968198,-73.8604846576261,-73.8605309321605,-73.8605734561431,-73.8606120731121,-73.8606494405175,-73.8606851614936,-73.8607182106939,-73.8607476394658,-73.86077260308,-73.8607923849785,-73.8608064173429,-73.8608140218288,-73.8608172469568,-73.8608160673804,-73.8608166820033,-73.8608210539622,-73.8608290860784,-73.8608405998195,-73.8608553392679,-73.8608729768085,-73.8609480379989,-73.861024875725,-73.8611683597832,-73.8612122437539,-73.8612494339702,-73.8612794319479,-73.8613018356104,-73.861316344677,-73.8613227646881,-73.8613146395542,-73.861309415312,-73.8613028182352,-73.8613001609361,-73.8612988615203,-73.8612896876275,-73.8612728030805,-73.8612485093795,-73.8611331913723,-73.8610198154337,-73.861001934567,-73.8609814450079,-73.8609589209716,-73.8609349936876,-73.8609037508361,-73.8608157203013,-73.8607275364789,-73.8606630860387,-73.860599528113,-73.8605374769887,-73.8605094923605,-73.860474832402,-73.8604340598832,-73.8603878368279,-73.8602078942498,-73.8601783281768,-73.8601461763785,-73.8601122166708,-73.8600772706072,-73.8600421836044,-73.8598940162848,-73.8598352490529,-73.8598249231718,-73.8598143686693,-73.8598038847979,-73.8597937688072,-73.8597843075162,-73.8597757691809,-73.859768395889,-73.8597748765529,-73.8597777544119,-73.859777271966,-73.8597769474741,-73.8597767893437,-73.8597768016729,-73.8597769841418,-73.8597773320223,-73.8597778363008,-73.8597784839102,-73.8597792580703,-73.8597801387212,-73.8597811030446,-73.8597832769264,-73.8597859515817,-73.8597890470933,-73.8597924709688,-73.8597961209037,-73.85979988784,-73.8598036592231,-73.8598073223658,-73.8598107678149,-73.8598138926217,-73.8598166034187,-73.8598188192082,-73.8598204737836,-73.859821517707,-73.8598388800349,-73.8599568546386,-73.8599720412316,-73.8599868371996,-73.860000806047,-73.8600135356789,-73.8600246505587,-73.8600338227871,-73.8600407817753,-73.8600453222274,-73.860047310197,-73.8600436441338,-73.8600404032224,-73.8600376794429,-73.8600355500989,-73.8600340756232,-73.8600332978628,-73.8600332388909,-73.8600339003815,-73.8600352635603,-73.8600372897393,-73.8600399214133,-73.860043083893,-73.8600466874238,-73.8600506297346,-73.860183216439,-73.860195954035,-73.86020644856,-73.8602144200494,-73.8602196558461,-73.8602220162748,-73.8602181625557,-73.860215452976,-73.8602139358177,-73.8602136381153,-73.8602419895309,-73.8602722330012,-73.8603037398306,-73.8603358550621,-73.8603679110911,-73.8603838781945,-73.860397997526,-73.8604100479077,-73.860449717654,-73.8604873410738,-73.8605252694798,-73.860562675294,-73.8605648080438,-73.860566940374,-73.8605690100163,-73.8605709565334,-73.8605727230831,-73.8605742580789,-73.8605755166961,-73.8605764621806,-73.8605770669226,-73.8605773132624,-73.8605771940063,-73.8605767126371,-73.8605758832117,-73.8605747299507,-73.8605289866598,-73.8604852982044,-73.8604444412232,-73.8604071420188,-73.8604053763126,-73.8603868461704,-73.8603594184527,-73.8603236089518,-73.8603102951679,-73.8603163571442,-73.8603416470487,-73.8603503067247,-73.8603737314803,-73.8603945536261,-73.8604157441815,-73.8604367815342,-73.8604571478434,-73.8604763417867,-73.8605326395304,-73.8605879220579,-73.8606093039251,-73.8606197420973,-73.8606101364379,-73.8606237233749,-73.8606580646268,-73.8606628794075,-73.8606642937998,-73.8606622751865,-73.8606603959841,-73.8606591603024,-73.8606586054516,-73.8606587481851,-73.8606595841932,-73.8606610882328,-73.8606632148906,-73.8606658999538,-73.8606690623484,-73.8606726065884,-73.8606764256579,-73.8606804042427,-73.8606844222127,-73.8607026813273,-73.8607205473053,-73.8607375954282,-73.8607534204203,-73.860842649273,-73.8608442617154,-73.8608467822549,-73.860850146214,-73.8608542672731,-73.8608590396853,-73.8608643409899,-73.8608700351547,-73.8608759760671,-73.8608820112825,-73.8608879859368,-73.8612752011856,-73.8614937584788,-73.8616137116361,-73.8616291765528,-73.8616382338067,-73.861640803145,-73.8616368617909,-73.8616264446453,-73.8616170283211,-73.8616165642583,-73.8616250535642,-73.8616424770979,-73.8616687955133,-73.8616693576065,-73.861672136535,-73.8616770552069,-73.8616839771684,-73.861692710391,-73.8617030125971,-73.8617145979824,-73.8617271451438,-73.8626976213909,-73.8626977829953,-73.863170832744,-73.8617475902521,-73.861188754815,-73.8603049456405,-73.8593869184694,-73.8585143639364,-73.8576153725157,-73.8579364091196,-73.8580250429808,-73.8581177926926,-73.8584295085729,-73.8575356334514,-73.8565907511985,-73.8561171020898,-73.8556846115502,-73.8561174022972,-73.8561880966006,-73.8564631194296,-73.8566799570508,-73.8567050909425,-73.8568467616234,-73.8572269369616,-73.857246757818,-73.8572674460262,-73.8572848668308,-73.8573094773904,-73.8576332310837,-73.8585547003992,-73.8594741645808,-73.8603851992073,-73.8607751279138,-73.8610719249902,-73.8611439603649,-73.8613186364856,-73.8613977586667,-73.8617123871755,-73.8620284308972,-73.8622594308921,-73.8623458053513,-73.8614061863468,-73.8607086187616,-73.8604665875376,-73.859524861962,-73.8585896258018,-73.8581983603456,-73.8577926836297,-73.8572107855002,-73.8568313704324,-73.8565341030587,-73.8543933070023,-73.8539801470207,-73.8533505728647,-73.8526772603694,-73.8522341708392,-73.8516820550598,-73.8509908928286,-73.8501480425854,-73.8493014492528,-73.8484443463383,-73.8478681763193,-73.8475784512997,-73.8467146424159,-73.8458323737204,-73.8452904232548,-73.8452020026905,-73.8451334988005,-73.8450583785572,-73.8449619067906,-73.8445106372462,-73.8440891489368,-73.8432309037522,-73.842370291089,-73.8415139193139,-73.8413409190611,-73.8411960566321,-73.8406300412629,-73.839786002263,-73.8389406932338,-73.8380776900331,-73.8371765168474,-73.83595082775,-73.8351167189827,-73.8346311562003,-73.8342599310853,-73.8334219064044,-73.8325774764411,-73.831722983125,-73.8308855629651,-73.8300393407009,-73.8291824226465,-73.8283562087996,-73.827530213257,-73.8267019729211,-73.825873224027,-73.8250112887268,-73.8239803433813,-73.8229321626814,-73.8218934662346,-73.8208526408424,-73.8199392236372,-73.819060751979,-73.8181871097409,-73.8169264130452,-73.8160748749284,-73.8152282660355,-73.8143843798042,-73.8135401422147,-73.8130986312828,-73.8127176213562,-73.8118631505923,-73.8109881057541,-73.8107258752102,-73.8106329831089,-73.8102442617865,-73.8099560125051,-73.8097232667476,-73.8095478746413,-73.8091842520063,-73.8091446130441,-73.8089241714598,-73.8087435850634,-73.8085765517067,-73.8080734242231,-73.8078746961921,-73.8073362180268,-73.8070906333245,-73.8068607274562,-73.8066060873638,-73.8060620273092,-73.8057684019138,-73.8055181112093,-73.8052268279005,-73.8049297631947,-73.8046451703018,-73.8042828823601,-73.8041022658922,-73.803230276536,-73.8030752042895,-73.8026776954252,-73.8023890644016,-73.8020252177967,-73.8016819475972,-73.8015871663702,-73.8015645058312,-73.8014021065073,-73.8013016646211,-73.8011946161512,-73.801172342509,-73.8011593493158,-73.8011553859722],"lat":[40.6717991208439,40.6714879425965,40.6713585293883,40.6712944621285,40.6705486676171,40.6698004209725,40.669100265712,40.6689388249048,40.6688428294487,40.6686422375113,40.6683901898973,40.6677737973427,40.6673542161349,40.6671756734129,40.6668371594929,40.6667533644458,40.6663729626694,40.666322352571,40.6662640702942,40.6658810937387,40.6652480253325,40.665249953464,40.6652166107817,40.6651601842742,40.6651207333671,40.665074269679,40.6648281914004,40.6638525847163,40.6606729546503,40.6604483248614,40.6605515147998,40.6606423144498,40.6608756638832,40.6612249613082,40.6612363678822,40.6612407446942,40.6612379965869,40.6612327064594,40.6612335221973,40.6612404238217,40.6612532423004,40.6612716636874,40.6612952368116,40.6613233843268,40.6613563170601,40.6613895750707,40.661422765164,40.6614554959733,40.662607339599,40.6627337587977,40.6628555502745,40.6629710683587,40.6630788107268,40.6631774741035,40.662934535878,40.6628228379933,40.6627244361327,40.6626400787067,40.6625699265681,40.6625141022415,40.6624726687372,40.6629560162509,40.6635538781358,40.6635192590203,40.6633884715681,40.6638245399743,40.6648386056275,40.6650328189424,40.6649682133149,40.6636539306297,40.6620562237381,40.6604019915322,40.6598940088322,40.6596656686856,40.6588986567465,40.6571969730161,40.6560335334255,40.6552677027036,40.6542403617249,40.6537480361906,40.6532882664842,40.6527954782837,40.6523071193095,40.6518121627128,40.6513256864725,40.65085989913,40.6503497089878,40.6502871718497,40.6500818827522,40.6500467760495,40.6498276580859,40.6499965462376,40.6503283751602,40.6504296301428,40.6509173537454,40.6511479204325,40.6513295201244,40.6514043120837,40.6515137852804,40.6516261292559,40.651769864547,40.6522566954113,40.6527475574427,40.6532337721073,40.6534788379267,40.6535188680935,40.6536032776479,40.6536036503265,40.6536469965029,40.6537489532362,40.6538137863337,40.6541708301037,40.6541897610851,40.6542480974436,40.6548308452706,40.6548282714875,40.6550013567347,40.6550286350992,40.6550347871516,40.6550090626685,40.6550299714484,40.6550642732669,40.6550396663723,40.6550972821853,40.6551438410547,40.6552968790233,40.6557100220864,40.6558648655424,40.656022380948,40.6560492615126,40.6561078844525,40.6561230996729,40.6561231454452,40.6561156138038,40.6560963631156,40.6560722703018,40.6560371249461,40.6559241872042,40.6558987217946,40.6558339728564,40.6558187617576,40.6555990400164,40.6556448430647,40.6556368198189,40.6556444088284,40.6556589578701,40.6556631277594,40.6556646028445,40.6556557081368,40.6556199934782,40.6555717944395,40.6555194724445,40.6554202647843,40.6553947694364,40.6553237545379,40.6551565164178,40.6551547371259,40.6553058507552,40.655359436782,40.6553576489907,40.6553198772563,40.654912223743,40.6549122424386,40.6551398033839,40.6551424559254,40.6549271897774,40.6548929222431,40.6548613123495,40.6548068897776,40.654494997288,40.654180699086,40.6541683788927,40.6541026376867,40.6541158575325,40.6539311742969,40.6540313343473,40.654001526995,40.6540464180677,40.6542731616761,40.6544408189651,40.6544664266678,40.6545095091754,40.6544540770961,40.6544603862931,40.6545304548293,40.6544810763196,40.6546305199392,40.6546118397256,40.6548419990622,40.6549170348584,40.6549798205398,40.6551937389538,40.6553517959102,40.6554709758398,40.6555993251415,40.6559192332347,40.6559468193461,40.6560305622329,40.6560359514772,40.6560434510677,40.6560712465067,40.6561398943018,40.656215670938,40.6562170351476,40.6562519721452,40.6562652784232,40.656265994564,40.656283061172,40.6563067226316,40.6563245690736,40.6563371925055,40.6564690644688,40.6564866917442,40.6565063627481,40.6565320303869,40.6565542055136,40.6565671683361,40.6565826167573,40.6565715537362,40.6565564031857,40.6565228412312,40.656491972762,40.6564606999503,40.6564469484221,40.6564316182289,40.6564444851562,40.656437956807,40.6564237708685,40.6564268604497,40.6564492781825,40.6565063357185,40.6565536280378,40.6566065112344,40.6566378864989,40.6566645275191,40.6566850133927,40.6567062950988,40.6567258116076,40.6567416732448,40.6567696088513,40.6568134228178,40.6568726373389,40.6569324575352,40.6569655628386,40.6569840850302,40.6570071883392,40.6570358349344,40.6570744451495,40.6570937510243,40.6571176654505,40.6571308010009,40.6571409248953,40.657152925478,40.6571652411202,40.6571743889297,40.6571856078463,40.6572052479201,40.6572260156399,40.6572629859236,40.6572952221631,40.6574252118278,40.6575812853062,40.6577027547627,40.6577997785443,40.6578220473962,40.6578541939517,40.6578806631342,40.6578852355415,40.657883235188,40.657898701208,40.6579145244243,40.6579289891663,40.6579383582088,40.6579566156098,40.6579780613107,40.6580882041683,40.6581092137897,40.6581210342123,40.6581361553921,40.6581609504911,40.658184777932,40.6582030375289,40.6582183121643,40.6582295028155,40.6582494402541,40.6582600959532,40.6582719949639,40.6582875511718,40.6583023427271,40.6583127008189,40.6583237127703,40.6583388719749,40.6583591028597,40.6583792993705,40.6584026432187,40.6584258046825,40.65845006243,40.658460194777,40.6584826440638,40.6584900483982,40.6584917366807,40.6584918265541,40.6584879495302,40.6584796218596,40.658468606804,40.6584679110611,40.6584776659649,40.6584883684368,40.6584985983926,40.6585025138646,40.6585225805726,40.6585570786034,40.6586001863156,40.6586568064128,40.6587096602713,40.6587952840859,40.6588361506219,40.6588939040078,40.6589485408648,40.6590168752438,40.6590309794313,40.6591012330403,40.6591554145322,40.6591809814075,40.6592420861804,40.6592965554408,40.659303518989,40.6593244662816,40.659349384544,40.6594533423253,40.6595014373441,40.6595233378131,40.6595545867149,40.65957888,40.6596323949893,40.6597111441825,40.6597548086335,40.6597881537685,40.6598069031759,40.6598086849573,40.6598041109262,40.6597889021289,40.6597760631921,40.6597584510512,40.6597365402197,40.6597209680359,40.6597092026331,40.6596938005854,40.6596676060428,40.6596431572513,40.6596090375775,40.659564913034,40.6594765029715,40.6594239843672,40.6592597914228,40.6592298864369,40.6591965606708,40.6591631638789,40.6591056949107,40.6590486857659,40.6590308989307,40.6589612692377,40.6588800702918,40.6588245754729,40.6587440262995,40.6587014032347,40.6586559286915,40.6586019763555,40.6585680176267,40.6585709737691,40.6585881270138,40.6585938902441,40.6585712494507,40.6585314925072,40.6585174299599,40.6585089690642,40.6584295019878,40.6583499693482,40.6583157735283,40.6582588652103,40.658176348523,40.6581445977936,40.6581364118489,40.6581164348567,40.6580254571928,40.6579259354434,40.6578462978578,40.6577978388326,40.6578034376019,40.6577947884082,40.657706512384,40.6575444290589,40.6574421126501,40.6573342186634,40.6572434406344,40.6571810561469,40.6571030581588,40.6570137395409,40.6569059079554,40.6568576147155,40.6567695103255,40.6566899771696,40.6566474319834,40.6566560738819,40.6566903032254,40.6567103304848,40.6567288207958,40.6567303957745,40.6567362362119,40.6567363574487,40.6566938879689,40.6566314808369,40.6565066273081,40.6564357091324,40.6563423673162,40.656138454681,40.6561187616685,40.6560970206367,40.6560526563348,40.6560032716246,40.655949382416,40.6558915516745,40.6558303835405,40.6557665170172,40.6557006192954,40.6556333787828,40.6555534516711,40.6554644909179,40.6554157430919,40.6553553436444,40.6552429723722,40.6551944356876,40.6550912597042,40.6549621095052,40.654885038267,40.6548826066209,40.6549005207143,40.654889396264,40.6548754452751,40.6548947524574,40.6550865424842,40.6558737270624,40.6567429858043,40.6567877152372,40.6574837716231,40.6575484603835,40.6561310285113,40.6561714272535,40.6578265916274,40.6580775321342,40.6582317184506,40.6583187864411,40.6583598315585,40.6582743468592,40.6581381286936,40.658051859208,40.656687879278,40.6558227352559,40.6550277524378,40.6542376666548,40.6533465524046,40.6526432389254,40.6521383105746,40.6516831345773,40.6511677144158,40.650751711171,40.6500539328134,40.6499406829504,40.6498085002564,40.6496762240526,40.6495443036767,40.6494129637872,40.6493487634152,40.6510076724735,40.6526977151355,40.6543520510954,40.6560381180953,40.6577129385523,40.659361619701,40.6609418349776,40.6610355339965,40.6610816427851,40.6610991231117,40.6611215238808,40.661183986842,40.6611811833069,40.6612700338525,40.6612727533597,40.6612082559568,40.6612130526605,40.6614035247558,40.6614793355895,40.661587959823,40.6617933321926,40.6620695075934,40.6622171264993,40.6623438479148,40.6624071609841,40.6622383041051,40.6619961291953,40.6619042738623,40.6609506588748,40.6604788885263,40.6592413516654,40.6575730435247,40.6559010243485,40.6558154731085,40.6542363721126,40.6525322105559,40.6508969227628,40.6492494150021,40.6491370624168,40.6491181499693,40.6458924652605,40.6453211492796,40.645317414001,40.6453335440902,40.6453472064473,40.6453479083128,40.6452707045829,40.6452235489629,40.6451563970785,40.6451449110519,40.6451266781611,40.6451018512485,40.6450706384322,40.6450333013617,40.6449901530242,40.6449415551204,40.6448879150327,40.6448847936376,40.6441015092574,40.6441337661806,40.6461761480911,40.6462766341581,40.6463801523422,40.6464863526909,40.6465948761834,40.6467053559431,40.6468174184786,40.6469306849455,40.6470447724274,40.6471592952307,40.6472738661877,40.6473880979664,40.647485529272,40.6475820392087,40.6476773101516,40.6477710285526,40.6478628859715,40.6479525800918,40.6480398157156,40.648124305735,40.6482467673914,40.6483699608275,40.6484407296409,40.6485104118322,40.6485785959941,40.6486448795626,40.6487088711938,40.6487701930744,40.6488284831526,40.6488387254555,40.6488669098271,40.6489121545698,40.6489479932084,40.6489693146834,40.649000900378,40.6490213627753,40.6490435466994,40.6490674335577,40.6490819516588,40.6490964784422,40.6491084123246,40.6491041203226,40.6490955660465,40.6490981222612,40.6491006760847,40.6491117627432,40.6491237058065,40.6491254075207,40.6491262547815,40.6491022839493,40.6491056765614,40.6491286880941,40.6491406294687,40.6491500143536,40.649174799374,40.6491799035988,40.6491824211751,40.6491644715731,40.6491337184026,40.6491149261706,40.6490952603634,40.649085846485,40.6490751635101,40.6490706209163,40.6490723246022,40.6490802348509,40.6490941672557,40.6491137970189,40.6491386665233,40.6491681960004,40.649200643373,40.6492160200462,40.6492578958827,40.6493117285265,40.6493672517274,40.6494125142715,40.6494663059301,40.6494842323082,40.649487628689,40.6494876214178,40.6494893253387,40.6495098037632,40.6495165953344,40.649537944762,40.6495644009664,40.6496036881206,40.6496207701668,40.6496668828458,40.6497223982694,40.6497454583861,40.6497454321969,40.6497454307408,40.649747139694,40.649766788111,40.6497779112864,40.6498060927254,40.6498034361198,40.649801719887,40.6497982761616,40.6497922692547,40.6497947657198,40.6498101232884,40.6498622059478,40.6499040658012,40.6499091903155,40.6499220224675,40.6499373819425,40.6499570119271,40.6500116760312,40.6500680670769,40.6501227413789,40.6501731531798,40.6502286744207,40.6502833358301,40.650337980995,40.650349925193,40.6503584392564,40.6503643966392,40.650368652354,40.6503823110456,40.6503686144544,40.6503361204622,40.6502916490183,40.6502728168967,40.6502744998756,40.6502898755958,40.6503113713115,40.6503352030262,40.6503685342596,40.6504223467665,40.6504556707061,40.6504769948255,40.6504897759471,40.6505102397081,40.6505195936527,40.6505315219886,40.6505365871549,40.6505433844038,40.6505612914619,40.6505971384916,40.6506278599964,40.6506321264045,40.6506560214542,40.650685003812,40.6507114177932,40.6507131165115,40.6507148155195,40.6507224920169,40.6507386993546,40.6507659665636,40.6508009144148,40.650832439863,40.6508571239852,40.6508809621335,40.6508783483325,40.6508920101986,40.6509236122608,40.6509200997301,40.6509260276382,40.6509336809203,40.6509370644099,40.6509387325687,40.6509344338921,40.6509275798734,40.6509292524203,40.6509693311082,40.6510093828231,40.651031532551,40.651081029489,40.6511057882475,40.6511296917735,40.6511689979876,40.6511878186714,40.6511989390962,40.6512314377935,40.6512690391576,40.6512818360581,40.6512818761756,40.6512947143632,40.6513246196781,40.6513476892612,40.651371613866,40.6513938311936,40.6514348789504,40.651461802297,40.6514848165241,40.6515033161395,40.6515172941434,40.6515254137098,40.6515274417414,40.6516579636038,40.6516508543448,40.6516502042707,40.651656032279,40.6516681689488,40.6515769180134,40.6515919056847,40.6515994108775,40.6516010966531,40.6515969281146,40.6515869915545,40.6515714926684,40.6515507522968,40.6515251997835,40.6515168577625,40.6515103071555,40.6515057451265,40.6515033089862,40.6515030720589,40.6515050414757,40.65150915796,40.6515152976116,40.6515232756355,40.6515328519043,40.6515001258222,40.6514620735217,40.6514188476646,40.6513706216685,40.6513175890106,40.651259962451,40.6511979731799,40.6508276238599,40.6508156393822,40.6508061840293,40.6507994882395,40.6507957151976,40.6507949568568,40.6507972420742,40.6508025214005,40.6508106654547,40.6508214746496,40.6508155566236,40.6508039603626,40.6507870354197,40.6507652919737,40.6507393854497,40.6507100967621,40.650690569927,40.6506567138434,40.6506266145328,40.6506009132042,40.6505801573753,40.6505647892091,40.650555136094,40.6505514036711,40.6505536714521,40.6505618911265,40.6505758875903,40.6506069749611,40.6506318085902,40.6506503382532,40.6506625264749,40.6506683486051,40.6506661255527,40.6506561022515,40.6506418831129,40.6506380781907,40.6506399042081,40.6506473417268,40.6506603115716,40.6506786756741,40.6507271770918,40.6507710273786,40.6508100403944,40.650844050533,40.6508729134245,40.6508965065484,40.6509170011119,40.6509520744237,40.6509587397292,40.6509684362496,40.6509809050098,40.6509958129939,40.6510127620388,40.6510590858807,40.6511037372903,40.6511457463873,40.6511842006838,40.651218264905,40.6512471991328,40.6512703748782,40.6512872887333,40.6512975733064,40.6513010052025,40.6512975098764,40.6512871632512,40.6512721516633,40.6512607324348,40.6512531681932,40.6512496329065,40.6512502078817,40.6512548798951,40.6512635414964,40.6512744784252,40.6512898013645,40.6513092616905,40.6513325436477,40.6513592694716,40.651398891474,40.6514429340992,40.6514909853403,40.6515425956903,40.6515972823463,40.6516545337262,40.651713814254,40.6517745693701,40.6518362307188,40.6518982214651,40.6519599616909,40.6519706729602,40.6520234780524,40.6520763327221,40.6521283345714,40.6521785957614,40.6522262581694,40.6522705080405,40.652310589882,40.6523458193619,40.6524156840763,40.6524850326098,40.6525532112482,40.6526195773029,40.6526835051701,40.6527443922279,40.6528016645174,40.652854782153,40.6529032444127,40.6529465944579,40.652959281837,40.6529660446877,40.6529667000152,40.6529612300869,40.6529497829129,40.6529326682404,40.6529103491723,40.6528834296355,40.652876406759,40.6528694511551,40.6528627125368,40.652856335947,40.6528504586357,40.6528452071066,40.6528400241541,40.6528359963875,40.6528332415782,40.6528318402762,40.6528318334553,40.6528318456952,40.652833768093,40.6528297547719,40.6528198711944,40.652804278574,40.652783231246,40.6527570725182,40.6527262290717,40.6528030033963,40.6529190400941,40.6529948721519,40.6531329983536,40.6533111894038,40.6535382411213,40.653725197941,40.6538855779148,40.6540325547237,40.654049771786,40.6541616268325,40.654228513878,40.6542554338195,40.6542865562312,40.6544024688711,40.6546385086072,40.6547042819361,40.6547943290983,40.6548358748957,40.6548545553954,40.6548870127229,40.6549405703951,40.6549641309321,40.6549812367453,40.6550178193895,40.655049482144,40.6550738944129,40.6551039492783,40.6551471708468,40.6551878951609,40.6552300042986,40.6552759472571,40.6554902970434,40.6560468126677,40.6561715747792,40.6562519616497,40.6563634693527,40.6563946211912,40.6564147541654,40.6564351813117,40.6564593779758,40.6564809464115,40.6565108495457,40.6565428563089,40.6565677393173,40.6565780876393,40.6565872169825,40.6565942052071,40.6565889764917,40.6565836805569,40.6565728166244,40.6565595098214,40.6565421047948,40.6565369660577,40.6565457416124,40.656561297115,40.6565682969361,40.6565610526284,40.6565606274643,40.6565699355882,40.6565886318622,40.6565845921682,40.6565129762798,40.656471847102,40.656465298536,40.656464657207,40.6564756059603,40.6565181417986,40.6566278703127,40.6566405421746,40.6566564742112,40.6566687992814,40.6566844492454,40.6566863813281,40.6566969851733,40.6567173754367,40.6567309998704,40.656739987205,40.6567471860197,40.6567533953831,40.6567670097429,40.6568064887049,40.6568365349144,40.6568793462147,40.656897489854,40.6569175233727,40.656953161474,40.6569847045572,40.6570103749491,40.6570177108355,40.6570122636808,40.6569953726426,40.6569613555664,40.6568453854026,40.6568095833547,40.6567929927964,40.6567822636355,40.6567798610496,40.6567942668991,40.6568205239111,40.6569394982502,40.6569637270066,40.6569722551554,40.6569725497063,40.6569700282925,40.6569662946867,40.6569658336883,40.6569651267862,40.6569676621938,40.6569770632205,40.6569966210397,40.6570142093616,40.6570380370053,40.6570526187404,40.6570501119641,40.6570497447068,40.6570487136343,40.6570414497333,40.6570426759215,40.6570486110801,40.6570580479027,40.6570774861926,40.6570872739136,40.6571043002835,40.657136973897,40.6571714659582,40.6572092411189,40.6572228220697,40.6572144492154,40.6572736031928,40.6573224114938,40.6573801581545,40.6574320141092,40.6574565996863,40.6576704489722,40.657705380481,40.6577201771504,40.6577351975651,40.657752189196,40.6577856089869,40.6578234853286,40.6578369847945,40.6578862055193,40.6579011388169,40.6579435367629,40.6579884534017,40.6580353500543,40.6580836642942,40.6581328166929,40.6581994107543,40.6582656093878,40.658331003795,40.6583951901428,40.6584577720565,40.6584922764515,40.6585229364228,40.6585493831647,40.6585712985514,40.6585884189642,40.6585896980387,40.6585966168385,40.6586090988952,40.658604968763,40.6586050274393,40.6586092732112,40.6586175821523,40.6586297117391,40.658706508804,40.6587844209917,40.6588054147441,40.6588297935951,40.6588572343805,40.6588608586362,40.6588648044216,40.6588689598106,40.6588732069316,40.6588774253107,40.6588814952894,40.6588853014187,40.658888735734,40.6588917008173,40.6588941125612,40.6588959025541,40.6588970200209,40.6588974332636,40.6588971305601,40.6588785592313,40.6588538545091,40.6588234448731,40.6588205223524,40.6588162464985,40.6588107419141,40.6588041690082,40.6587967193217,40.6587886099458,40.6587800771954,40.6587713697229,40.6587627412724,40.6587544432847,40.6587119183496,40.6586668789991,40.6586201487465,40.6585754697395,40.65857644032,40.6585760984525,40.6585744525622,40.658571543211,40.6585674420987,40.6585622502951,40.6585560957496,40.6585491301378,40.6585415251239,40.6585399579984,40.6585377644096,40.6585350038851,40.6585317513379,40.6585280950328,40.6585241341918,40.6585199763006,40.6585157341926,40.6585115229866,40.6585074569625,40.6584976719463,40.6584892921135,40.6584825268255,40.6584775451058,40.6584744714176,40.6584783424487,40.6584829692787,40.6584882204994,40.6584939469687,40.6584970796393,40.6584992903197,40.6585005145092,40.6585007164899,40.6584998903688,40.6584980602493,40.6584952795286,40.658491629339,40.6584872161812,40.6584162952874,40.6583862346123,40.658352349877,40.658356723093,40.6583631391143,40.6583714123269,40.6583813033884,40.6583925261527,40.6584047559471,40.6584176389661,40.6584308025057,40.658443865747,40.6584837328294,40.6585226454638,40.658559780393,40.6585943519686,40.6586256287725,40.6586384626645,40.6586525228216,40.6586674215874,40.6586813413498,40.6586949937788,40.6587079815781,40.6587199267925,40.6587304818065,40.6587393394606,40.6587544517911,40.6587752439893,40.6588013702897,40.6588323962225,40.6588678058384,40.658907010288,40.6589493576143,40.6589941435941,40.6590406234486,40.6590880242286,40.6591355576686,40.6591824332955,40.6592284741972,40.6592765669478,40.6593265346052,40.6593215267237,40.6593117868084,40.6592975944371,40.6592793569925,40.6592575979674,40.659232941939,40.6592060966403,40.659168702174,40.6591309417318,40.6590931121621,40.6590738310313,40.659054833769,40.6590365426269,40.6590193641614,40.6590036801973,40.6589898393407,40.658950657192,40.6589135258628,40.6588088220647,40.6587666561164,40.6587209100741,40.6586721971191,40.6586211701995,40.6585685132784,40.6585149321659,40.658488983111,40.6584626048565,40.6584304179133,40.6583979041521,40.6583528596513,40.6583083492395,40.6582651676844,40.6582240860245,40.6581592419191,40.6580924412665,40.6580793883282,40.658068789899,40.6580609429969,40.6580560675287,40.6580566402248,40.6580615439609,40.6580644390392,40.6580689456126,40.6580782499222,40.658092262042,40.6581335987029,40.6581718896318,40.6582065130912,40.6582369068921,40.6582947097634,40.6583091649145,40.658319953726,40.6583268151947,40.6583295833278,40.6583281911585,40.6583095927164,40.6582972727903,40.6582989748794,40.6582993334247,40.6582983382604,40.6582960176024,40.6582924372483,40.6582876987122,40.6582819363458,40.6582638869658,40.6582453037852,40.6582445837391,40.658243814072,40.658243014727,40.6582422064162,40.658241410084,40.6582406463648,40.6582399350474,40.6582392945632,40.6582387415079,40.658238290212,40.6582379523694,40.6582403105228,40.6582423483478,40.6582440049552,40.6582452308462,40.6582459893917,40.6582462579268,40.6582460284276,40.6582453077516,40.6582441174322,40.6582424930357,40.6582404830983,40.6582381476761,40.6582355565504,40.658232787143,40.6582114455934,40.6581301043564,40.658129362871,40.6581266532068,40.6581220553018,40.6581157047985,40.6581077890434,40.6580985415589,40.658088235155,40.6580771738804,40.6580656840534,40.6580639913089,40.6580618539144,40.6580593325312,40.6580564987188,40.6580534329033,40.6580502220958,40.658046957422,40.6580437315365,40.6580406359931,40.6580377586462,40.6580351811577,40.6580329766792,40.6580312077758,40.6580299246508,40.6580002501047,40.6579905513257,40.6579794028265,40.6579671020195,40.6579539770575,40.6579403780793,40.6579340324891,40.6579273525438,40.6579204572751,40.6579134695516,40.6579018890924,40.6578935339131,40.6578885776993,40.6578871234799,40.6578892014848,40.6578786988043,40.6578667594453,40.6578535704378,40.657842199173,40.657845897838,40.6578453353583,40.6578405240073,40.6578406614165,40.6578405202804,40.6578401047205,40.6578394268718,40.6578385065289,40.6578373705675,40.6578360521599,40.657834589806,40.6578330262095,40.6578314070301,40.6578297795511,40.6578281912981,40.6578266886507,40.6578253154894,40.6578158799797,40.6578018939937,40.657783606157,40.6577613415682,40.6576058205421,40.6575553211397,40.6575072271649,40.6574624430167,40.657418070542,40.6573843544522,40.6572479056981,40.6572260671677,40.6572098728323,40.6572129144315,40.6572134383571,40.6572114317125,40.6572069438919,40.6572000853642,40.6571807692061,40.6571598213694,40.6571554567006,40.6571616993932,40.6572054116413,40.6572054560829,40.6571742620335,40.657157439737,40.657140256182,40.6571231076685,40.6571204014022,40.6571174882521,40.6571144561787,40.6571113967334,40.657108402294,40.6571055632754,40.6571029653999,40.6571006871084,40.6570987971923,40.6570973527162,40.6570963972952,40.6570959597774,40.6570960533733,40.6570951809377,40.6570921812584,40.6570871256451,40.6570801342824,40.6569312960132,40.6569268661395,40.6569226891772,40.6569188723076,40.656915513472,40.6569126988584,40.6569105006903,40.6569089753726,40.6569081620454,40.6569080815785,40.6569087360369,40.6570009063593,40.6569999340575,40.6569965102529,40.6570478591025,40.6571000878008,40.6571527336577,40.6572053302867,40.6572574117366,40.6574006466021,40.65754406043,40.6576873288935,40.6578301279927,40.6579721347868,40.6579823418592,40.6579923362984,40.6580018408381,40.6580105918025,40.6580183464217,40.6580248895662,40.6580300397154,40.6580336539932,40.6576183763335,40.6576183090124,40.6582765129481,40.658938356511,40.6592546258883,40.659634655304,40.6597727153821,40.6598989424686,40.6601189331547,40.661374437124,40.6617210500925,40.6620365707923,40.6634533609319,40.6635978625139,40.6637471595992,40.6638084021346,40.6638674928748,40.6655093801063,40.6658465551295,40.6670417638916,40.6679241591767,40.6680264396038,40.6686029353322,40.6700962126365,40.670174051682,40.6702552942948,40.6703219899049,40.6704162333649,40.6716561940381,40.6715129273103,40.6713805315348,40.6712517109906,40.672805622741,40.6740198143972,40.6743301474493,40.6750212688162,40.6753365904825,40.6766105959752,40.6778861145353,40.6788167861564,40.6791647856444,40.6792209927655,40.6792637358096,40.67927856245,40.6793454684152,40.6794027293995,40.6794308490687,40.6794557161414,40.679485864345,40.6795093383044,40.6795277252978,40.6796601136843,40.6796830349626,40.6798670165449,40.6800794150818,40.680207890968,40.6803679773977,40.6805683676605,40.6808081069773,40.6810466724078,40.6812907036365,40.6814868321229,40.6815798682804,40.6818584931911,40.6821064507279,40.6822304448261,40.6822506686509,40.6822665335029,40.6822844518408,40.682307455319,40.6824150883418,40.6825292985645,40.6827751975605,40.6830184222149,40.6832616814559,40.6833105030821,40.683351366844,40.6835139105714,40.6837541585341,40.6839938029679,40.6842389097021,40.6844953924184,40.6848435468849,40.6850849330504,40.6852232175474,40.6853289375,40.6855677822712,40.6858063459228,40.6860507053982,40.6862865479114,40.6865293590858,40.6867708057622,40.6870028099533,40.6872394827356,40.6874732094474,40.6877086497737,40.6879523184279,40.6882452682572,40.6885430011056,40.6888382260043,40.6891343834089,40.6893936929379,40.6896424419733,40.6898920748069,40.6902501473664,40.690492270968,40.6907334771279,40.6909719537659,40.6912113678357,40.6913181019626,40.6914078038223,40.6916300801645,40.6918550447344,40.6919224223034,40.6919473825768,40.6912635868155,40.6907561131604,40.6903463441441,40.690037546626,40.6894004794721,40.6893310307331,40.6889448092041,40.6886258845928,40.6883308903006,40.6874528242587,40.6870983377938,40.6861254469901,40.6856303107838,40.6851799577744,40.6846811457839,40.6835543609625,40.6829323912504,40.6824082109029,40.6817981498803,40.6811769746726,40.6805798897467,40.679817356731,40.6794245501539,40.6776810570058,40.6773456012399,40.6764979669041,40.6758884786801,40.6751142732162,40.6743838489599,40.6741158501575,40.6740479485806,40.6735613198798,40.6731215222321,40.6724224646056,40.6722050322449,40.6718938897181,40.6717991208439]}]],[[{"lng":[-73.9344523939737,-73.9346351059628,-73.9346739306833,-73.9347456942292,-73.9347988641014,-73.9348574034224,-73.9349627411069,-73.9350633634262,-73.9353078807002,-73.9357262433215,-73.936603647337,-73.9370064164481,-73.9372953333144,-73.9379724625285,-73.938081821838,-73.9381880763366,-73.9382911469799,-73.938390956886,-73.9384874320206,-73.9385805006181,-73.9387736026166,-73.9389485978898,-73.9392285623012,-73.9392517598325,-73.9392813082096,-73.9393171103521,-73.9393590486393,-73.939406985297,-73.9394607628966,-73.9395202047197,-73.9395851155046,-73.9396552820282,-73.9397304738065,-73.9397859804583,-73.9398372408485,-73.9398841279558,-73.9399265257122,-73.9399643288933,-73.9399974438304,-73.940069476676,-73.9401413121009,-73.9403464331369,-73.9410754698064,-73.9413679958142,-73.9429796619917,-73.9457193369865,-73.9458239515278,-73.9459255816204,-73.9482259724,-73.9489054328625,-73.9491944889159,-73.9494157055686,-73.949551752833,-73.9495743178091,-73.9496411981455,-73.9497080785182,-73.9497761628448,-73.9498559048211,-73.9499624395775,-73.9502121856002,-73.9498891562042,-73.9497982650522,-73.9497847133827,-73.9497425788605,-73.9497389152804,-73.949712435793,-73.9496931383177,-73.9496834900747,-73.9496895057145,-73.9496911764021,-73.9496863474476,-73.9496562891399,-73.9496454181682,-73.9496213764317,-73.9496014970849,-73.9495833406586,-73.9495460072937,-73.9495099176218,-73.9494570191995,-73.9493885290614,-73.9493284608129,-73.9492903465706,-73.9492869861103,-73.949284462591,-73.9492828508901,-73.94928219883,-73.9492825257585,-73.9492838219754,-73.9492860490197,-73.949289140811,-73.9492930056105,-73.9492975287425,-73.9493025759975,-73.9493771335595,-73.9494399469653,-73.9494423001312,-73.9494973993623,-73.9495421050448,-73.9491805889786,-73.9491523412929,-73.9490045976789,-73.9489289116868,-73.9488396198111,-73.9487576366754,-73.9486577502686,-73.9485605452053,-73.9484964028906,-73.9484286079155,-73.9483341792378,-73.9482744989375,-73.9482335262209,-73.948074842555,-73.9479670101405,-73.9478600345227,-73.9477619608773,-73.9477093480996,-73.9476060040179,-73.9475560981857,-73.9474889692931,-73.9473832215426,-73.9472743043913,-73.9472104755568,-73.9471678822236,-73.9471336797226,-73.9471205331108,-73.9471071517441,-73.9469601238285,-73.9469350286281,-73.946869186453,-73.946787682126,-73.946755100748,-73.946709847566,-73.946616425962,-73.9465480827828,-73.9464585806661,-73.9463691999154,-73.9463134956635,-73.946248919182,-73.946197888994,-73.9461262557861,-73.9461241642177,-73.9461193357755,-73.9460974583389,-73.9460941517218,-73.9461136551073,-73.9461169981883,-73.946093164131,-73.9461053777251,-73.9460842580583,-73.9460912407748,-73.9460788055709,-73.9461092998044,-73.9461227215278,-73.9461283683532,-73.9461469239887,-73.9461601872281,-73.9461608690716,-73.9461913872833,-73.9462057455364,-73.9462227116677,-73.9462106518648,-73.9461770484538,-73.9461717498388,-73.9462068240667,-73.9462306238542,-73.9462766495797,-73.946307748146,-73.9464387825548,-73.9464662099247,-73.9464795051287,-73.9464454448152,-73.9464838768725,-73.9465173020058,-73.9465038958519,-73.9464559791282,-73.9464258195366,-73.9463483945936,-73.9463507804994,-73.9464028826528,-73.9464364381749,-73.9464735305792,-73.9465168320512,-73.9466405821043,-73.9467176787914,-73.9467895684932,-73.9468244534264,-73.9468093526662,-73.9467822054396,-73.9467493384277,-73.9466985870492,-73.9466857685379,-73.9466560643462,-73.9466405820579,-73.9466228573435,-73.9466202774859,-73.9466194999889,-73.9466442257228,-73.9466504076318,-73.946678537654,-73.9466355001267,-73.9466506431052,-73.9466649962484,-73.94670601763,-73.9467205117605,-73.9467331340639,-73.9467565642777,-73.9468116467334,-73.9468387203646,-73.9468552500436,-73.9468547984757,-73.9468824441746,-73.9468950579329,-73.9469006321069,-73.9469665223715,-73.9469592294382,-73.9469510884998,-73.9469522211832,-73.9469957865811,-73.9469581447419,-73.9469670652455,-73.9469851657691,-73.9470278249472,-73.9470253617107,-73.9470052735774,-73.9469744714631,-73.9469534291508,-73.9469640449571,-73.9469864504123,-73.9470178169951,-73.9470289720359,-73.9470192100041,-73.9470498025919,-73.9470439927835,-73.9470040657687,-73.9470045960835,-73.9470111027367,-73.94700167437,-73.9469980830222,-73.9469644175959,-73.9469262640486,-73.9468689961492,-73.9468136739163,-73.9468021962802,-73.9465159021613,-73.9465022945865,-73.9464874344917,-73.9464716344196,-73.946456883783,-73.9464418920296,-73.946426914691,-73.9464121608617,-73.9463979316411,-73.9463844711137,-73.9463720101779,-73.9463387537898,-73.9463207741203,-73.9463288803668,-73.9463517419433,-73.9463521863776,-73.9463379635605,-73.946327297948,-73.9463158982778,-73.9462971730483,-73.9462750149671,-73.9462437464238,-73.9461977691754,-73.9461730448016,-73.9461959781453,-73.9462007832208,-73.946186012492,-73.9461721061942,-73.9461581922763,-73.9461469983796,-73.9461454250123,-73.9461339228464,-73.94611976648,-73.9460967019523,-73.9460819050107,-73.9460874587952,-73.9460974239555,-73.9460981322402,-73.9461415938349,-73.9461365365532,-73.9461174410519,-73.9460478028608,-73.9459647343912,-73.9459302578309,-73.9458957745417,-73.9458409279916,-73.9457672616562,-73.9457249399454,-73.9457280636197,-73.9456826191261,-73.9456528362645,-73.945612080799,-73.9455556397503,-73.9455274302487,-73.9455195790856,-73.9454812644814,-73.945449037344,-73.9454223954055,-73.9453957540048,-73.9453785025399,-73.9453894688811,-73.9453220733816,-73.9453126619556,-73.9452797525913,-73.9452531109531,-73.9452436952284,-73.945272680328,-73.9452664099904,-73.9451958685358,-73.9451535565936,-73.9450657830015,-73.9450438270494,-73.9450062023457,-73.9449779839563,-73.9449325267845,-73.9448773127254,-73.9447770228039,-73.9447657741482,-73.9447144548597,-73.9446938070381,-73.9446876545562,-73.9446926993411,-73.9446897831003,-73.9446832405572,-73.9446672117815,-73.9446323412433,-73.9445884563509,-73.9445774787063,-73.9445038194598,-73.9444865815126,-73.9445031635779,-73.944505155126,-73.9444876191584,-73.9444619785477,-73.9444536813326,-73.9444223265937,-73.9443972527988,-73.9444066712573,-73.9443674978486,-73.9443251848248,-73.944317333427,-73.9442906820886,-73.944245224993,-73.9442107380319,-73.9442216965107,-73.9441966078135,-73.9441339103154,-73.9440712308196,-73.9440132395073,-73.943991281309,-73.9439599164944,-73.9438815357491,-73.9437961059554,-73.9436007298518,-73.9434797854567,-73.943059029443,-73.9430264437118,-73.9427983850535,-73.9426099668357,-73.9424736592578,-73.9420551425848,-73.9418699642667,-73.9418277442505,-73.9417310566149,-73.9415815880045,-73.9415373674243,-73.9415021318989,-73.9414976213216,-73.941409806424,-73.9413131113132,-73.9412659205112,-73.9412336635977,-73.9410327700312,-73.9409992899919,-73.941009143133,-73.9409570447241,-73.9408553985549,-73.9407685484289,-73.9407462171037,-73.940694193801,-73.9406197513461,-73.9404883126927,-73.9404051777662,-73.9403505646138,-73.9402934749712,-73.9401471761871,-73.9400852345242,-73.9400182701591,-73.9399488067714,-73.9397814621112,-73.9396848241026,-73.9396104107323,-73.9394021151439,-73.9393648888822,-73.9392830385064,-73.9392223197617,-73.939110941644,-73.9390412264177,-73.9389147144351,-73.9386568056552,-73.938653061647,-73.9385017472503,-73.9384372879187,-73.9384164339628,-73.9383095743429,-73.9378533658648,-73.9377355637796,-73.9375573431851,-73.9375294417256,-73.9375306630546,-73.9375521865699,-73.9375871631842,-73.937580542065,-73.9373543613443,-73.9371357751147,-73.9370939040756,-73.9370422314218,-73.9369685174811,-73.936810969729,-73.9368027996368,-73.9368185154751,-73.9368104544925,-73.9364756166485,-73.9359681300685,-73.9355946079782,-73.9348508917312,-73.9347554071761,-73.9346187007624,-73.9344344685111,-73.9343556851352,-73.9342316407923,-73.9341923030187,-73.9340817388134,-73.934016644267,-73.9340164852447,-73.9339500171158,-73.9338628312348,-73.9337891643636,-73.9336305556861,-73.9335715800758,-73.9335739612203,-73.9334928542417,-73.933436350697,-73.9334362891443,-73.933401827008,-73.9333231755757,-73.9332568887992,-73.9331315018567,-73.9330750030786,-73.9328334942832,-73.9326633272146,-73.9327564862725,-73.9327626078313,-73.9329017189177,-73.9328395820506,-73.9326456957457,-73.9326603505637,-73.9325979485281,-73.9325483038695,-73.9325188840444,-73.9324253821539,-73.9323866223573,-73.9323643143118,-73.9323507813682,-73.9323543156297,-73.9323674680955,-73.9323734128857,-73.9322739712806,-73.9322812400666,-73.9322676982625,-73.9323228438442,-73.9323159101132,-73.9324464374824,-73.9324921429863,-73.9324937728018,-73.9325307779682,-73.932536906623,-73.9325689181631,-73.9325797050119,-73.9326143189161,-73.9326221151462,-73.9326252507503,-73.9326284435028,-73.9326508351281,-73.9325454652185,-73.9325505066164,-73.9325680426409,-73.9325235456004,-73.93250125163,-73.9325061996572,-73.9324953288405,-73.9323522987469,-73.9323059727891,-73.9322983181865,-73.93225031755,-73.9322542774916,-73.9322775105328,-73.9322873204428,-73.9323138544823,-73.9323603509377,-73.9324567080095,-73.9325372935495,-73.9325689548279,-73.9325679516988,-73.9325046980315,-73.9323901680462,-73.9322932768987,-73.9321890382608,-73.9324688306991,-73.9323537080728,-73.9322658163697,-73.93235934466,-73.9321333660305,-73.932109971067,-73.9320771261943,-73.9320590828635,-73.9320534384771,-73.9320500216975,-73.9320671221183,-73.9320956610291,-73.9321797602456,-73.9321985511514,-73.9322060053187,-73.9321232852716,-73.932047404814,-73.9320315692668,-73.9319137713681,-73.9317844012483,-73.9316014958732,-73.9314682113936,-73.9313765589895,-73.9312210755908,-73.931062541996,-73.9308451143446,-73.9306838181817,-73.9299768674315,-73.9298621506257,-73.929319188194,-73.9291796825597,-73.9290134580979,-73.9285900263284,-73.9283297696849,-73.9281462360357,-73.9280363857674,-73.9279659464347,-73.9275308212749,-73.9268994050239,-73.9266082443429,-73.9265309627843,-73.9264818571844,-73.9264159145477,-73.9264055692112,-73.9263508026825,-73.9262968099259,-73.9263100173927,-73.9263025357111,-73.9262974358818,-73.9262945620142,-73.9262954879739,-73.9263001889477,-73.926308538976,-73.9263203143272,-73.9263351994931,-73.9263527956427,-73.926372631308,-73.926394175017,-73.9264211392751,-73.9264410506886,-73.9264533937799,-73.9264578490102,-73.9264401358563,-73.9264143304097,-73.9263810865184,-73.9263412464951,-73.9262958197752,-73.9262459573401,-73.9261929225557,-73.9261380591628,-73.926082757232,-73.9259756560598,-73.9258683405345,-73.9257615947666,-73.9256561987039,-73.9255529224338,-73.9254525205573,-73.9253557266757,-73.9252632480314,-73.9251757603404,-73.9251688213816,-73.9251575024618,-73.9251380476082,-73.9251127542747,-73.9250821570134,-73.9250732377952,-73.9250268108051,-73.9249623961505,-73.9248956789098,-73.9248271973703,-73.9247420252124,-73.9246560717955,-73.9245703699118,-73.9244859493309,-73.9244038244252,-73.9240050501001,-73.923861477643,-73.9238197355543,-73.923776812069,-73.923733746777,-73.9236915827027,-73.9236513410439,-73.9236139964395,-73.9235482336755,-73.9232947673398,-73.9231865833825,-73.923151775517,-73.9231229144576,-73.9230988966351,-73.9230729776833,-73.9229989883947,-73.9229976135937,-73.9229691498885,-73.9229237520377,-73.9229051169181,-73.9228599285484,-73.92283147429,-73.9228105145321,-73.9228031115373,-73.9227944711255,-73.9228073501517,-73.9228124655996,-73.9227941068454,-73.9227755254017,-73.9227515948516,-73.9227150627939,-73.922671103412,-73.9226437737043,-73.922622223329,-73.9226195590284,-73.922609017739,-73.9225959688097,-73.9225851562651,-73.9225802407225,-73.9225838472557,-73.9225771952866,-73.9225817987269,-73.9225914872041,-73.9225685510051,-73.9225378620706,-73.9224923463621,-73.9224768908113,-73.9224234002415,-73.9224170839378,-73.9223976816932,-73.9223875464169,-73.9223766931572,-73.9223763219681,-73.922375212032,-73.9223811545329,-73.9223941447462,-73.9224141724158,-73.9224412217628,-73.9224395667849,-73.9224446821819,-73.9224565168357,-73.9224749525038,-73.9224998050012,-73.9225508217083,-73.9225932860646,-73.9226270503784,-73.9226519972274,-73.9226680398672,-73.922675122532,-73.9226732206282,-73.9226623408192,-73.9226425210016,-73.9226138301729,-73.9225763681903,-73.9225302654235,-73.9224756822998,-73.922412808746,-73.9223418635268,-73.9222630934835,-73.9221767726749,-73.9220832014235,-73.9219827052703,-73.9218756338426,-73.9217623596368,-73.9216432767233,-73.9215187993751,-73.9213893606269,-73.9212554107687,-73.9211174157797,-73.9210886829408,-73.9210596906005,-73.9210309647829,-73.9209734396525,-73.9209140686841,-73.9208535453861,-73.9207925767264,-73.9207318748748,-73.9207298413247,-73.9207272521547,-73.9207241782984,-73.9207207039679,-73.9207169243471,-73.9207129429834,-73.9207088689513,-73.9207048138642,-73.9206893127476,-73.9206835897847,-73.9206592131712,-73.920637876355,-73.9206038943965,-73.9205697228697,-73.9205560210661,-73.9205255308396,-73.9204901960058,-73.9204578420348,-73.9204255346232,-73.9203872314431,-73.9203569084712,-73.9203284953404,-73.9203019234,-73.9202923057271,-73.9202763405224,-73.9202576798151,-73.9202238301978,-73.9201942708146,-73.9201684671804,-73.9201507881323,-73.9201340570572,-73.9201253607022,-73.9201036874971,-73.9200850047188,-73.9200634350377,-73.9200499671979,-73.9200187755385,-73.919990415263,-73.919981386561,-73.9199717090996,-73.9199579782898,-73.919955604878,-73.9199668568458,-73.9199601469089,-73.9199615269548,-73.9199657961229,-73.9199520088966,-73.9199492463788,-73.9199446246653,-73.9199289092784,-73.9199269916987,-73.9199120983483,-73.919905363251,-73.9198735215599,-73.9198288523102,-73.9197930167242,-73.9197927764907,-73.9198322991474,-73.9198718807938,-73.919899578821,-73.9199252575708,-73.9199419807086,-73.9199577479478,-73.9199536640454,-73.9199485938863,-73.9199544749424,-73.9199593435105,-73.9199622400329,-73.9199670789504,-73.9199738476337,-73.9199816353505,-73.9199746456702,-73.9199854396698,-73.919998787496,-73.9201298717641,-73.9201448168173,-73.9201704420499,-73.9201554947969,-73.9201959154611,-73.920213821777,-73.9202413947935,-73.920222508849,-73.9202915163733,-73.9203516480986,-73.9204058454069,-73.9204413156245,-73.920473775627,-73.9204998534944,-73.9205444449928,-73.9205768727461,-73.920606390378,-73.9206269916569,-73.9207696671416,-73.9207876146162,-73.9208025563036,-73.9208075130692,-73.9206608442927,-73.9206698030134,-73.9206857269421,-73.9206966591882,-73.9207110741238,-73.9207001059899,-73.9207160457197,-73.920724984446,-73.9207429085349,-73.9207578511748,-73.9207548342963,-73.9207667777056,-73.9207807050061,-73.9207816924167,-73.9207926569451,-73.9207886511,-73.9208035946764,-73.920799579598,-73.9208095443194,-73.9208165048275,-73.9208164958184,-73.9208294541542,-73.9208424024009,-73.9208394026656,-73.9208433742822,-73.920852355845,-73.9208687955981,-73.9208827322138,-73.9208867110269,-73.9208916739299,-73.9209056154885,-73.9209195635895,-73.9209225407913,-73.9209145351775,-73.9209155100289,-73.9209234915729,-73.9209274622966,-73.9209384181304,-73.9209473691218,-73.9209723077096,-73.9209872399264,-73.9209872192416,-73.9210001580885,-73.9210161056586,-73.9210320229093,-73.9210549369237,-73.9210813353079,-73.9211142016049,-73.9211400938498,-73.9211560033055,-73.9211669569689,-73.9211749268854,-73.9211749134236,-73.9211818650898,-73.9211698884575,-73.9211698776963,-73.9211728486808,-73.9211688534267,-73.9211698417931,-73.9211578766525,-73.9211598601538,-73.921143895438,-73.9211458849822,-73.9211339103894,-73.9211319044241,-73.921126906187,-73.9211109446203,-73.9211039408442,-73.9211129036417,-73.9211069140851,-73.9211049103776,-73.9210799642235,-73.9210619957655,-73.9210570010965,-73.9210360220979,-73.9210240353177,-73.9210110576887,-73.9209901085767,-73.9209781210944,-73.9209691304401,-73.9209551536472,-73.9209302080564,-73.9209292005764,-73.9209182304665,-73.9209132218316,-73.9209032551543,-73.9208942845129,-73.9208755919967,-73.9208060964406,-73.920761627382,-73.9207209780556,-73.9206521784322,-73.9206083874152,-73.9205677100342,-73.9204832770825,-73.9203863158277,-73.9202956159237,-73.9202612447753,-73.9202174638263,-73.9201267665571,-73.9200517124044,-73.9199766486526,-73.9199516140029,-73.9198796450636,-73.9198170880567,-73.9197420473926,-73.9196982810764,-73.9196638817296,-73.9196263365378,-73.9195950773441,-73.9195606636796,-73.9195168658849,-73.9194042833356,-73.9192572909282,-73.9191790912232,-73.9191321642716,-73.9190977731763,-73.9190008227635,-73.918944549657,-73.9188752589724,-73.9188488092111,-73.9188837788074,-73.9189416629275,-73.9189980756303,-73.9190356498488,-73.9190638540166,-73.9190889244292,-73.9190858242829,-73.9191046383589,-73.9191140975085,-73.9191485607419,-73.9191767696481,-73.9191893066728,-73.9191956364688,-73.9191957346041,-73.919211480104,-73.9192522590831,-73.9192586234016,-73.9192462105032,-73.9192743831804,-73.9192400106065,-73.9192212391896,-73.919183710112,-73.9191524739693,-73.919099362582,-73.9190525010765,-73.9189993718673,-73.918928512305,-73.9189158131918,-73.918897129935,-73.9188824798226,-73.9188714911105,-73.918864157249,-73.9188601206762,-73.9188483962036,-73.9188385043048,-73.9188293485031,-73.9188212902824,-73.918811397262,-73.9187996761804,-73.9187875919043,-73.9187758746761,-73.9187659925241,-73.9187583127834,-73.9187477018359,-73.9187374494981,-73.9187253689674,-73.9187198811279,-73.9187132918374,-73.9187132972757,-73.9187135598064,-73.9187136757615,-73.9187048926786,-73.9186975744079,-73.9186994140037,-73.9187089454237,-73.9187170111132,-73.9187225109606,-73.9187228821898,-73.9187203217887,-73.9187133628724,-73.9187075009716,-73.9186957749442,-73.9186715993101,-73.9186598697412,-73.9186528993969,-73.9186488600856,-73.9186411650426,-73.9186320045074,-73.9186174577788,-73.9186034886986,-73.9185868115471,-73.9185703476012,-73.9185652119137,-73.9185657132393,-73.9185662578638,-73.918550825426,-73.9185312632154,-73.9185266692982,-73.9185164289358,-73.918507990951,-73.9185038805398,-73.918499956622,-73.9184811580041,-73.9184403784965,-73.9184089214903,-73.9183914313134,-73.9183972280834,-73.9184169875845,-73.9184472591926,-73.918494997155,-73.9185322631801,-73.91859397285,-73.9186125966822,-73.91862886554,-73.9186276589475,-73.9186124721955,-73.9185972986632,-73.9185728304931,-73.9185611637771,-73.9185273531111,-73.9184958727611,-73.9184690462814,-73.9184539052142,-73.9184387762835,-73.9184119825546,-73.9184014816919,-73.9184247555451,-73.9184247360163,-73.918417720767,-73.9184107122455,-73.9183874047286,-73.9183734080716,-73.9183524161042,-73.9183279207093,-73.9182952725402,-73.9182463125657,-73.9181985232556,-73.9181786973527,-73.9181623589765,-73.918147176506,-73.9181226907861,-73.9181040362078,-73.9180589342757,-73.9180516579744,-73.9180371567266,-73.9179410836636,-73.9179290291799,-73.9177546809532,-73.9177699032563,-73.9175772988473,-73.9174992100054,-73.9176906605858,-73.9177093110948,-73.9178903209832,-73.9178850663064,-73.9178714491751,-73.9177301627013,-73.9176868311414,-73.9176208626149,-73.9175680835195,-73.9175058717097,-73.9174041319876,-73.9173005073949,-73.9172458830367,-73.9171592091786,-73.9170895003867,-73.9170555460038,-73.9169670054334,-73.9168973268623,-73.9167899449282,-73.916693855044,-73.9166090544487,-73.9164866173023,-73.9164357393214,-73.9163434866757,-73.9162121632286,-73.916098527203,-73.9160167512421,-73.9158903312502,-73.9157660498781,-73.9156846308447,-73.9155775103736,-73.915401837362,-73.9152240214606,-73.9150698014154,-73.9149819860697,-73.9146328327852,-73.9142216790583,-73.9141978490461,-73.9139970622633,-73.9139027384917,-73.9135851370558,-73.913497431898,-73.9133451051018,-73.9132937338413,-73.9132489069351,-73.9131941925364,-73.9131425642534,-73.913095589203,-73.9130399794851,-73.91298019757,-73.9128898671973,-73.9127315413304,-73.9126107330855,-73.9125027925933,-73.9122891862131,-73.9120781847149,-73.9116381573252,-73.9115779140944,-73.9115151612332,-73.9114259618443,-73.9113587827129,-73.9113050346001,-73.911274316958,-73.911224414078,-73.911190844095,-73.9111841125018,-73.9111745070815,-73.9111802852213,-73.9111668550319,-73.9111534281913,-73.9111035404607,-73.9110997170905,-73.9111045435437,-73.9110843923963,-73.9110556063183,-73.9110364351832,-73.9110393459936,-73.9110124714732,-73.9109923425105,-73.9109808474126,-73.9109674252256,-73.9109616926925,-73.9109444054977,-73.9109146688595,-73.910832116359,-73.9107630311513,-73.9106966318179,-73.9106688625046,-73.9106487727774,-73.9106440262089,-73.9106000469293,-73.9105646933813,-73.9105408206228,-73.910537972124,-73.9105533301621,-73.910544749547,-73.9105180237903,-73.9104951419257,-73.9104846815837,-73.9104792010068,-73.9104728424446,-73.9104607595298,-73.9104532583538,-73.9104475430646,-73.910442654861,-73.9104264404851,-73.9104290375281,-73.9104442043008,-73.9104495563106,-73.9104510707769,-73.9104461518659,-73.9104336357045,-73.9104477053661,-73.9104646861784,-73.9104729204696,-73.9104936731184,-73.9105116504589,-73.9105209406515,-73.9105435776205,-73.9105594216908,-73.910550649178,-73.9105580894439,-73.9105782849544,-73.9105895707351,-73.9106015951629,-73.9106184554237,-73.9106500006567,-73.9106517779721,-73.9106611016346,-73.9106819282989,-73.9106940639599,-73.9107032613541,-73.9107162572217,-73.910723558799,-73.9107141200385,-73.9106998335503,-73.910677936501,-73.910679070694,-73.9106907232939,-73.9106918236907,-73.9107159481226,-73.9107189879324,-73.9107268069749,-73.9107376520868,-73.9107456109542,-73.9107255729735,-73.9107499177199,-73.9107528703789,-73.9107568063354,-73.9107521234364,-73.9107609030462,-73.9107640087742,-73.9107489270498,-73.9107557348127,-73.9107722269282,-73.9107588776987,-73.9107630768279,-73.9107681122628,-73.9107645322483,-73.9107483141362,-73.9107696662573,-73.9107727265008,-73.9107796756165,-73.9107807730844,-73.9108041995759,-73.9108016053432,-73.9108017662899,-73.9108095372899,-73.9108048771484,-73.910812803668,-73.9108158335099,-73.9108091403541,-73.9108266257386,-73.91083344969,-73.9108335617768,-73.9108500345866,-73.9108501910031,-73.9108415844009,-73.9108406897731,-73.9108542633135,-73.9108602040685,-73.9108767745142,-73.9108623829233,-73.910873077424,-73.910882891482,-73.910884008707,-73.9108533419753,-73.9108764398726,-73.9108967454211,-73.9109094229351,-73.9109239562781,-73.9109153802726,-73.9109164799314,-73.9109251965825,-73.9109185565617,-73.9109408974881,-73.9109469167145,-73.9109249122423,-73.9109558266559,-73.9109866222138,-73.9110086359316,-73.9110393651462,-73.9110577159244,-73.9111324541512,-73.9111890357751,-73.9112561168321,-73.9113040204297,-73.9113462137163,-73.9113817739029,-73.911439622141,-73.9114637661276,-73.9114744889911,-73.9114718867,-73.9114634760692,-73.911424157791,-73.9114165348974,-73.9114002186208,-73.9113935452734,-73.9113580346658,-73.9113553083027,-73.9111224450976,-73.9111169087127,-73.911096730675,-73.9110612575129,-73.9110305795026,-73.9110548931391,-73.9110752967634,-73.9110792521463,-73.9110755316097,-73.9110929071396,-73.9110920271011,-73.9111187176876,-73.9111336600876,-73.9111203524456,-73.9111393222259,-73.9111289088176,-73.9111425919621,-73.9111486989594,-73.9111652354321,-73.9111998585109,-73.9112509470194,-73.91128256772,-73.9113037428697,-73.9113281775882,-73.9113348313459,-73.9113374209974,-73.9113297074864,-73.9113340264439,-73.911325479081,-73.911331498918,-73.9113255355442,-73.9113350016029,-73.9113504607765,-73.9113470512368,-73.9113590915022,-73.9113642705532,-73.911390049729,-73.9114098549045,-73.9114193268045,-73.9114416590703,-73.9114820814421,-73.9114924213864,-73.9114924482575,-73.9115053875513,-73.9115148587101,-73.911524323373,-73.9115354748478,-73.911540659413,-73.9115801924497,-73.9116016621044,-73.9116248556219,-73.9116531981748,-73.9116678135412,-73.9117116303806,-73.9117283316877,-73.911731920643,-73.9117300618978,-73.9117338348192,-73.9117256975957,-73.9117257108521,-73.9117251038061,-73.9117364014255,-73.9117351623112,-73.9117552250195,-73.9117527627056,-73.9117690776385,-73.9117803828235,-73.9117966804086,-73.91180859604,-73.9117942026244,-73.9117967655827,-73.9118055603456,-73.9118237604906,-73.9118457109202,-73.9118710108949,-73.9118896022712,-73.9118922526095,-73.9119115986588,-73.9118477464682,-73.911992967857,-73.9120975526719,-73.9122296295346,-73.9124521529893,-73.9126175467602,-73.9127317391952,-73.912552193527,-73.9125477513028,-73.9128285969364,-73.9131201510073,-73.9135199770815,-73.9138448505673,-73.9139186313324,-73.9139352695202,-73.9140386683301,-73.9141682169297,-73.914252578196,-73.9143120071251,-73.9143892269675,-73.9149238792787,-73.9149286371918,-73.9145403762602,-73.9144739760624,-73.9144111339268,-73.9150440759955,-73.9150740494131,-73.9150858385433,-73.9151683337169,-73.9152551192883,-73.9154318971828,-73.9154286973113,-73.9154340839883,-73.9154587239743,-73.9154534272654,-73.9156323634767,-73.9156387430054,-73.9156644439217,-73.9157115910557,-73.9157587290516,-73.915816585666,-73.9158605206304,-73.9158991164586,-73.915922708197,-73.9159356143907,-73.9159313804988,-73.9159260581022,-73.915898242309,-73.9158714806572,-73.915854349065,-73.9158326451179,-73.915790097378,-73.9157418999245,-73.9157259602557,-73.9156672828416,-73.915615690799,-73.9155837769082,-73.9155387298528,-73.9154934082792,-73.9154398263046,-73.9154055421182,-73.9153844408084,-73.9153745421641,-73.915359819686,-73.915345791037,-73.9153328144197,-73.9153212211744,-73.9153113073186,-73.9153057121835,-73.9152982825845,-73.9152892391494,-73.9152788504299,-73.9152674249267,-73.915240671774,-73.9152158469832,-73.9151957480016,-73.915188031063,-73.9151850595429,-73.9151819299481,-73.9151811948699,-73.9151788001804,-73.9151769384685,-73.9151765655714,-73.9151753977913,-73.9151755642971,-73.9152007107961,-73.9152181857278,-73.9152544391968,-73.915296763934,-73.9153081024622,-73.915344558139,-73.9153619001513,-73.9153740428823,-73.9154165736364,-73.915427025482,-73.9154686342927,-73.9154768244425,-73.915485164641,-73.9154730685431,-73.9154598747822,-73.9154506153671,-73.9154549655414,-73.9154229570089,-73.9154108333567,-73.9153450668942,-73.9154109612745,-73.9153867305114,-73.9154497053343,-73.9154996593965,-73.9155201532824,-73.9155657804495,-73.9155759526675,-73.9155629969495,-73.9155799152005,-73.9155889237252,-73.9155996450579,-73.9155940154285,-73.9156036101675,-73.9156182725241,-73.9156719977999,-73.9156820490604,-73.9156932336194,-73.9157190745788,-73.9157801479673,-73.915818689298,-73.9158388384917,-73.9158576884208,-73.9158645057258,-73.9158696233993,-73.9159336316873,-73.9159518546962,-73.9159526003021,-73.9161051792777,-73.916169354391,-73.916204849469,-73.9162252214126,-73.9162763501275,-73.9163917500321,-73.9164001918305,-73.9164260548227,-73.9164919667945,-73.9165251204384,-73.9165343852264,-73.916568927461,-73.9165963902928,-73.916601917786,-73.9166172045856,-73.9166382302499,-73.9166469633485,-73.9166617397902,-73.9167248371416,-73.9167320678522,-73.9167468904528,-73.9167543144542,-73.9167615341138,-73.9167811300425,-73.9167858494834,-73.9167953482249,-73.9168510078067,-73.9168788936747,-73.9169203986594,-73.9169581550374,-73.9169843735389,-73.9170096707588,-73.9170154616345,-73.9170512980185,-73.917069094196,-73.9170913596197,-73.9171527875946,-73.9172305691993,-73.9172703439263,-73.9172946774168,-73.9173427791736,-73.9173784192024,-73.9174081070895,-73.9174099446934,-73.9174601982095,-73.9174806139373,-73.9175040118264,-73.9175156044248,-73.9175329272892,-73.9175474961808,-73.9175641334226,-73.9175717660054,-73.9175925656434,-73.9176140530771,-73.9176563633175,-73.9176882562444,-73.9177291765482,-73.91778534144,-73.9178082344227,-73.9178270238015,-73.9178222194557,-73.91783553765,-73.9178246813906,-73.9178213642032,-73.9178410378002,-73.9178611574681,-73.9178653636892,-73.9178770705497,-73.9178821133228,-73.9179047245443,-73.9179021167353,-73.9179219058387,-73.9179223464631,-73.9178838738761,-73.9179282856633,-73.9179506177165,-73.9180522105659,-73.9182626496834,-73.9184343925179,-73.9183607452798,-73.9183764802734,-73.9183873872012,-73.9183990354325,-73.9183931121764,-73.9184107171477,-73.918428283844,-73.9184310024095,-73.9184350811156,-73.9184513377764,-73.9184675509689,-73.9184919029045,-73.9185000296487,-73.918528450777,-73.9185595395527,-73.9185879382569,-73.9186109492842,-73.918604223591,-73.91860966059,-73.9186205143219,-73.9186421524151,-73.9186665028499,-73.9186786605747,-73.9186948899459,-73.9186935455488,-73.9187030255635,-73.9186868141633,-73.9187383939309,-73.9187207993234,-73.9188014004671,-73.918777966001,-73.9188857796498,-73.9189033820166,-73.9190035057638,-73.9191361113191,-73.9192321799137,-73.9193377208542,-73.9194013115771,-73.9194385354145,-73.9194809629505,-73.9195021366093,-73.9195234232406,-73.9195456419021,-73.9195462733529,-73.9198077160953,-73.9200835336932,-73.9202757085523,-73.9202665242277,-73.920344957478,-73.9203980513715,-73.9204129916345,-73.9204346715059,-73.9204446658872,-73.9204613430747,-73.9203255179472,-73.9202695892376,-73.9202422842815,-73.9202083343909,-73.9201983463336,-73.9200964799356,-73.9200691729343,-73.9199566565892,-73.9199353497549,-73.9199087158952,-73.9198467968921,-73.919772234095,-73.9197742461086,-73.9198414912715,-73.9199153917475,-73.9199620037515,-73.9200731723363,-73.9204786827316,-73.9204308949874,-73.9204405543496,-73.920433507429,-73.9205090668941,-73.9205081803775,-73.9206197676956,-73.9206531620978,-73.9206707068003,-73.9206979225747,-73.9206934889054,-73.9207479327707,-73.9208154712133,-73.9208248103988,-73.9209663898829,-73.921071666769,-73.9212024520102,-73.9212709129631,-73.9213218707345,-73.9213403221303,-73.9213456057134,-73.9213640618382,-73.9213939762687,-73.9214309172988,-73.9214590637499,-73.9215162352229,-73.9215162438841,-73.9215426504243,-73.9215567174098,-73.9215901484823,-73.9216333546269,-73.9216606844962,-73.9216879995089,-73.9217065432762,-73.9217180392708,-73.9217013602332,-73.921710175143,-73.9217365409028,-73.9217383262247,-73.9217225201101,-73.9217040673148,-73.921686484502,-73.9216970573757,-73.9216812384696,-73.921664557898,-73.9216707277948,-73.9216689701736,-73.9216478841654,-73.9216487848248,-73.9216900992031,-73.9217305218131,-73.9217199644337,-73.921754251406,-73.9217401725026,-73.9217586285425,-73.9217692081425,-73.921803484984,-73.9218034983237,-73.9218166934147,-73.9218157942612,-73.921833378049,-73.9218360285277,-73.9218395729169,-73.9218264000163,-73.9218009271,-73.921784213729,-73.9217842341367,-73.9217895154286,-73.9217912811125,-73.9217833791678,-73.9217781399936,-73.9217553152321,-73.9217447590962,-73.9217280785568,-73.9217386270276,-73.9217421651519,-73.92178084463,-73.9218010581484,-73.9218142212325,-73.9218458912521,-73.9218274385752,-73.9217931831409,-73.921806387584,-73.9218362834467,-73.9218415890083,-73.9218565440059,-73.9218556898008,-73.9218636361759,-73.9218715946483,-73.9218663378371,-73.9218487832654,-73.921810131376,-73.9218286005297,-73.9218180732654,-73.921795231341,-73.9217539205986,-73.9217134856952,-73.9217003121197,-73.921683623464,-73.9216713330465,-73.9216563779765,-73.9216414419963,-73.9216229910233,-73.9215764035827,-73.9215632347676,-73.9215368812828,-73.9215166780508,-73.9214964754598,-73.9214824181689,-73.9214569384195,-73.9214367468757,-73.9214147843838,-73.9214068883123,-73.9213954545154,-73.9213849188486,-73.9213620792983,-73.9213409867892,-73.9213225389184,-73.9213067267439,-73.9212961943727,-73.9213137878253,-73.9213454201629,-73.9213700173977,-73.9213884715815,-73.9213700387011,-73.9213331315342,-73.9213094017866,-73.9212777512901,-73.921255801368,-73.9212391392653,-73.9212391637707,-73.9212497192712,-73.9212550224095,-73.9212638415485,-73.9212568347568,-73.9212392823221,-73.9212102776103,-73.9211883273274,-73.9211725300235,-73.9211329828573,-73.9211040004343,-73.9211093004329,-73.9211207323223,-73.9211031742926,-73.9210891142833,-73.9210856169333,-73.921071552431,-73.9211023676908,-73.9211138364303,-73.9211217794422,-73.921091896552,-73.9210822401778,-73.9210681923046,-73.9210655835521,-73.9210585763393,-73.9210735549948,-73.9210788512476,-73.9210586444682,-73.9210788726283,-73.9210876764655,-73.921063950884,-73.9209971288288,-73.9209874801556,-73.9209416573558,-73.9209295008289,-73.9209145985773,-73.9209386901695,-73.9211439658906,-73.9212232365865,-73.9213047520937,-73.9213637802687,-73.9214016978275,-73.9214596350665,-73.9215196726863,-73.9215555046349,-73.9215839706,-73.9215924259899,-73.9215861444796,-73.921579852046,-73.9215584962263,-73.9215585715575,-73.9215916070457,-73.9216179420979,-73.9216463840934,-73.9216632398164,-73.921703268055,-73.9217443405415,-73.9218012150449,-73.9218370216017,-73.9218633459786,-73.9218865189657,-73.9219002180637,-73.9219181423116,-73.9219413289672,-73.9219697849263,-73.9220449221585,-73.9220746494814,-73.9221574720228,-73.9221686514731,-73.9221463715993,-73.9221097526092,-73.9221671472886,-73.9222197224955,-73.9222468258278,-73.9222929912717,-73.9223328252373,-73.9223769574235,-73.9223714262498,-73.9223446518775,-73.9223746864714,-73.9223758086544,-73.9223445937413,-73.9223421789856,-73.9223363626243,-73.9223297127633,-73.9223288808107,-73.9223278533008,-73.9221957219213,-73.9221787422939,-73.9221811759476,-73.9221829564415,-73.9221840412878,-73.9221844030083,-73.9221840322178,-73.922182937403,-73.9221811462436,-73.9221787036248,-73.9221756733967,-73.9221721288896,-73.922168159748,-73.9221638672952,-73.9221593579167,-73.922154744381,-73.9221501429705,-73.9220633513252,-73.9220770456546,-73.9219520146898,-73.9218732215312,-73.9218876011372,-73.9218175009566,-73.921835493306,-73.9217650845441,-73.921770197447,-73.921698419047,-73.9215189405909,-73.9215907870523,-73.9215969651288,-73.9216718169157,-73.9216897037403,-73.9217596562976,-73.9218232504461,-73.922029567318,-73.9220417170053,-73.922129095313,-73.922127017599,-73.9221256357995,-73.9221249855579,-73.9221250837518,-73.9221259252049,-73.9221274921577,-73.9221297421469,-73.922132619479,-73.9221360483901,-73.9221399440835,-73.9221442056686,-73.9221487254294,-73.922153388387,-73.9221580751638,-73.9221850575136,-73.922218950847,-73.9222355710661,-73.9222593171054,-73.9222721991391,-73.9222811377407,-73.9222883228323,-73.922288370576,-73.9222961101451,-73.9222787306448,-73.9224003587528,-73.9226692969529,-73.9228198567377,-73.9229011413959,-73.9231329851651,-73.9234158418362,-73.9236059522068,-73.9240093922051,-73.9244406513995,-73.9246702118401,-73.9249739691404,-73.9250219122972,-73.925033268598,-73.9250729486687,-73.9251098027102,-73.9251466652887,-73.9251551810145,-73.9251721772904,-73.9252175403106,-73.9252770793833,-73.9252969415281,-73.9253479660684,-73.9254245160487,-73.9254897303231,-73.9255322454736,-73.9255435930326,-73.9256399903463,-73.9256626741845,-73.9257363868127,-73.9257554427499,-73.9258536330909,-73.9258797041968,-73.9258946157337,-73.9260287750863,-73.926238172494,-73.9262560777891,-73.9264945575954,-73.9267143909259,-73.9269230351983,-73.9271167964547,-73.9272546636921,-73.9274036912767,-73.9275229333255,-73.9276533485824,-73.9279737783045,-73.9281379897654,-73.9282169326215,-73.9283915103659,-73.9284220094767,-73.92845501929,-73.9284899482772,-73.9292854401953,-73.9293252284206,-73.9293807879704,-73.9294284591942,-73.9296177884118,-73.9296763121654,-73.9297185047759,-73.9297655896516,-73.9298142904901,-73.929869492199,-73.9299230671316,-73.9299896381694,-73.9300464807203,-73.9300984461563,-73.9301520363543,-73.9302235221325,-73.9302738909538,-73.9303193952958,-73.9303990207569,-73.9304526659845,-73.9304997882218,-73.9305453004993,-73.9305696689228,-73.9305794278086,-73.9306281815354,-73.9306752990735,-73.930698058286,-73.9307273630006,-73.9307728292194,-73.9307858076327,-73.9308020456186,-73.9308101941584,-73.9308946520142,-73.9309748803967,-73.9312222988686,-73.9313588895499,-73.9315292968668,-73.9318346149095,-73.9321620165716,-73.9327955579716,-73.9329597324678,-73.9330991815074,-73.9331680637908,-73.9332666973026,-73.9333568436148,-73.933418072186,-73.9334665418099,-73.9335311701697,-73.9336383069462,-73.9337751779351,-73.933909528764,-73.9340149800834,-73.934102580685,-73.9341982323781,-73.934284477939,-73.9343124535887,-73.9343613270564,-73.9344523939737],"lat":[40.8359809601499,40.8360501920772,40.8360649032392,40.8360920946286,40.8361101162622,40.8359850255776,40.8357599347499,40.83567765881,40.8354777249337,40.8351563465998,40.834513016174,40.834193110683,40.8339759182039,40.8334428170631,40.8333574897971,40.8332699288509,40.8331801993726,40.8330883682452,40.8329945036773,40.8328986755061,40.8326632126625,40.8324173363284,40.831907802484,40.8318230954371,40.8317395369171,40.8316574013863,40.8315769586316,40.831498472879,40.8314222020974,40.8313483966379,40.8312772989227,40.8312091424794,40.8311441511741,40.8310803925658,40.8310146147957,40.8309469808753,40.830877657591,40.8308068175587,40.8307346363336,40.8304899742724,40.8303719888808,40.8304578428499,40.8307668513735,40.8308908380831,40.8315679803621,40.832721413266,40.8327654612874,40.8328064897023,40.8338493081219,40.8340652988768,40.8342106585955,40.8343585898328,40.8344107166949,40.8344193619186,40.8344343300863,40.8344492900065,40.8344559645116,40.8344592868663,40.8344370306769,40.8343031199584,40.8352847212616,40.8354898412104,40.8355204338844,40.8356280878249,40.8357056544778,40.8357749902843,40.8358625809435,40.8359218833707,40.8360411393738,40.8360742774975,40.836109863325,40.8361909399708,40.8362202547503,40.836232103601,40.8363050988022,40.8364839378369,40.8366043715018,40.8366654896875,40.8367056194738,40.836715621438,40.8367192509365,40.836729292485,40.8367327757908,40.8367366454232,40.8367407865633,40.836745076336,40.8367493874559,40.8367535920044,40.8367575652248,40.8367611892245,40.8367643564728,40.8367669729917,40.8367689611441,40.83678033442,40.8367916993169,40.8367921570185,40.8368149814895,40.8368796319257,40.8378640101217,40.8379335525577,40.8384255885336,40.8386434262861,40.8388756358441,40.8390202374826,40.8393013452182,40.8395648851617,40.8396675931725,40.8398608541507,40.8399973353835,40.8400635406622,40.84011759627,40.8404662589754,40.8406541081988,40.8408960125876,40.8411257563313,40.8412636068662,40.8414095476823,40.8415286673707,40.8416974638817,40.8419408258019,40.8420517829701,40.8421011266968,40.8421590990434,40.8422586241128,40.8422855969407,40.8423067875789,40.8425395701268,40.8426191980068,40.8427048228943,40.8428151274789,40.8428884615156,40.8429441246516,40.843020098338,40.8431199811594,40.8432543837634,40.8434547799548,40.843559770439,40.8436712045786,40.843754098968,40.8438885687693,40.8438924965572,40.8440047374941,40.8440550520473,40.844097355249,40.8441962775262,40.8442249656692,40.8442911486529,40.8443497226354,40.8444681819652,40.844498801346,40.8445976703284,40.8448585749908,40.8448795547159,40.8449118071587,40.8449397574234,40.8450298449195,40.8451258270579,40.8451979727793,40.8452317931129,40.8452591663413,40.8453336251319,40.8453659152132,40.8453928915807,40.845461745739,40.8455769807446,40.8456906599184,40.8457409343261,40.8458859229234,40.8458812609095,40.8459197780731,40.845921488093,40.8459646873136,40.8459951844038,40.8460281997677,40.8460581650962,40.8460633386284,40.8461564486068,40.8462403312893,40.8463612916224,40.8464399199942,40.8465286181635,40.8465931398507,40.8466848945391,40.8468247587498,40.8469967493454,40.8471342620698,40.8472884466375,40.8473533891968,40.8474059593372,40.8474973938724,40.8477283950443,40.8478833204836,40.8479392921505,40.8481455194915,40.8482140178312,40.848278425912,40.8483993338854,40.8486676042168,40.8488374590931,40.8489124250597,40.8490050104117,40.8490456941009,40.8490943772971,40.8492317834168,40.8492674972145,40.8493026676951,40.8493519342913,40.849382821351,40.8494276801997,40.849539471265,40.8495928415692,40.8496394530808,40.8496741487555,40.8498151745353,40.8498489584905,40.8498591644656,40.8498900978619,40.8499559242922,40.8499852594493,40.8499956659208,40.8499945330706,40.8500418318125,40.8500621145911,40.8500818672712,40.8500898950813,40.8500977352221,40.8501116557755,40.8501188303829,40.8501269959827,40.8501447599336,40.8501950927356,40.8502233492284,40.8502547459878,40.8503293287003,40.8503440679935,40.8503562926568,40.8503865201127,40.8503980308427,40.8504655258182,40.8505280556684,40.8505895968588,40.8506490391781,40.8506613719885,40.8509683390805,40.8509756656088,40.8509814205397,40.8509854828334,40.8509876209119,40.8509882815855,40.8509874535933,40.8509851407828,40.8509813836728,40.8509762467119,40.850969818018,40.8509478263247,40.850923256677,40.8509043768703,40.8508930733055,40.8508699646573,40.8508528959462,40.8508460330769,40.8508386961086,40.8508331353309,40.850840977173,40.8508845429949,40.8509056662035,40.8509579544857,40.8509741720725,40.8510314881054,40.8510314696569,40.8510521198151,40.851047286469,40.8510312906284,40.851007465882,40.8509839318436,40.8509687541416,40.8509663412482,40.8509807148811,40.8510080629992,40.8510326024698,40.8510335756094,40.8510936994676,40.8511547260646,40.8511725825172,40.8511885509714,40.8511718748365,40.8511897217072,40.8511873391037,40.8511694766442,40.8511694656572,40.8511968323184,40.8512277731899,40.8512265766246,40.8512110978387,40.8512396531049,40.851320567777,40.851320563339,40.8513622126592,40.851371858148,40.8514276592095,40.8514264664057,40.8514157510614,40.851426458196,40.8514526364118,40.8514692889846,40.8514847630188,40.8514942774866,40.8514918868513,40.8515192592296,40.8515460437308,40.8515710290538,40.8515924459341,40.8515864846071,40.851638831106,40.851670957841,40.8517019012563,40.851731648003,40.8517304422577,40.8517538227642,40.8517962897328,40.8518010529019,40.8518153941233,40.8518240937692,40.8518357343676,40.8518625058569,40.8518771540471,40.8519100099595,40.8519212260068,40.8519094970436,40.851927342346,40.8519428155667,40.8519570794526,40.8519237581213,40.8518993981424,40.8518898985121,40.851888798325,40.8518993908867,40.8518975677551,40.8519047047313,40.8518928026739,40.8518547205951,40.8518249617797,40.8518225764386,40.8518558933936,40.8518820743217,40.8519201493655,40.8519296557293,40.8519760733924,40.8520153418159,40.8520272295895,40.8520153196308,40.8519998436644,40.8520414905522,40.8521188413205,40.8521723777101,40.8521979529642,40.8522310207162,40.8522818824446,40.852601430147,40.852626177871,40.8528512338899,40.8530679147468,40.8531712778092,40.8536541074557,40.8538677394428,40.8539899601301,40.8541083885494,40.8543471438085,40.8544356435961,40.8545001267486,40.8545083843677,40.8546846304862,40.8547955397552,40.8549440787885,40.8550098879769,40.8553050386426,40.8553586189386,40.8554150396348,40.8555203343945,40.8556218307785,40.8558079714676,40.8558474469204,40.8558530660602,40.8560110007425,40.8562046288227,40.856372905782,40.8565158035758,40.8566417706576,40.8568335170572,40.8568560512977,40.8569500456452,40.8570666142561,40.857234836996,40.857289321036,40.8573964763968,40.8576652979722,40.8577405057384,40.8578608227914,40.8578936942311,40.8580409112258,40.8582020163639,40.8584069374233,40.8587340304193,40.858768813622,40.8590113350078,40.8590733621212,40.8591662459671,40.8593805236081,40.859830271233,40.8599335122394,40.8600813563253,40.8600966412821,40.8601118788476,40.860123674583,40.8601495403266,40.8602032066512,40.8605151212902,40.8607836372022,40.8609252429913,40.8610575329789,40.8611432190252,40.8612580237499,40.8612790816266,40.8613158186805,40.86136346606,40.8619265916733,40.8625440923962,40.8629650518521,40.8639655769349,40.8640963392407,40.864269871045,40.8645037317338,40.8647329070684,40.8648138978227,40.8648791075311,40.8649778101482,40.8650355482916,40.8651958176667,40.8653467462099,40.8654100461119,40.8654286342686,40.8657090194233,40.8657667509443,40.8658412955388,40.8659456148249,40.8659865819954,40.8660480758076,40.8661356468399,40.8662380950142,40.866241784581,40.8664262137896,40.8665574187251,40.8669820482055,40.867237066437,40.867264360168,40.8672522975572,40.8672930438997,40.8674152769114,40.8673584776424,40.8673296613538,40.8673113496704,40.8674138335016,40.8674105033659,40.8675682479211,40.8676938932448,40.8678633010079,40.8679791202954,40.8680071956979,40.868037214476,40.8680634885758,40.8684771519779,40.8685325381576,40.8685623189724,40.868578111887,40.8686041428961,40.8686597654689,40.8686775191597,40.8686748094245,40.8686132719139,40.8686030783756,40.8685498472381,40.8685319098233,40.8684743473795,40.8684613849858,40.8684561679742,40.8684572743171,40.8684650334819,40.868640259233,40.8686420055912,40.8686480838561,40.868722078359,40.8687143527316,40.8687061253913,40.8687019503915,40.8686470281624,40.8686292390398,40.8686473709179,40.8686395088701,40.8686833988555,40.8687111569726,40.8688751423904,40.8689237203438,40.8689496097985,40.8689622731782,40.8689680023623,40.868979403214,40.8690443914739,40.8691295586652,40.8691873031101,40.8691995019423,40.8693669763891,40.869476099387,40.8697552552966,40.8697347716401,40.8695073632194,40.869415975441,40.8694772491017,40.86954268416,40.8695828168867,40.8696007507444,40.8696417467827,40.8696994277864,40.8697596511453,40.8698223664003,40.8698448707435,40.8700964451045,40.8703789431052,40.8705829039667,40.8707572025348,40.8711294937228,40.8713344229238,40.87158387547,40.8717977162066,40.8721086273607,40.872335322856,40.8726668065288,40.8728871703079,40.8731568769005,40.8743389623304,40.8744184415252,40.875294438561,40.8755555489664,40.8757386600902,40.876096010295,40.8763534690848,40.876522528944,40.8765824425059,40.8766176853765,40.876710534813,40.8772166344347,40.8775076312118,40.87758369128,40.8776182030179,40.8776100477008,40.8776214765374,40.8775923204627,40.8775650278757,40.8775506338821,40.8775374308973,40.8775235895297,40.8775060895173,40.8774884680905,40.8774711973945,40.877454740177,40.8774395373892,40.8774259963709,40.8774144799369,40.8774052966554,40.8773986925807,40.8773669656259,40.8773323669498,40.8772957922817,40.8772581885062,40.8772184044071,40.8771812576164,40.8771476893259,40.8771185500571,40.8770945781122,40.8770763808683,40.8770644193883,40.8770589967396,40.8770602503155,40.8770548675552,40.8770564469608,40.8770649769924,40.8770803953243,40.8771025893011,40.8771313967601,40.8771666072165,40.8772079634007,40.8772551631383,40.8772833622691,40.8773107323133,40.8773423726156,40.8773715375105,40.8773976106156,40.8773934774013,40.8773719622974,40.8773936372497,40.877410837546,40.8774234244108,40.8774323908053,40.8774342275695,40.8774289126333,40.8774165098596,40.8773971682764,40.8773174426567,40.8772700640755,40.8772618117109,40.8772585751075,40.8772604326544,40.8772673393627,40.8772791279546,40.8772955129148,40.8773013797371,40.8772644349572,40.8772167453458,40.877201401217,40.8771886779114,40.8771667680331,40.8771421666355,40.8771005790338,40.8770962119724,40.8770594793718,40.877034386157,40.8770263778511,40.8770125221739,40.8770059690955,40.8770049576484,40.8770133728904,40.8770047976539,40.8769904164038,40.8769790825587,40.8769760056179,40.8769715972223,40.8769537621515,40.876931817514,40.8769198661462,40.8769163528043,40.8769320637138,40.8769170265969,40.8769144949612,40.8769212336896,40.8769137800527,40.8769061772551,40.8768963422384,40.8768956774015,40.8768780897677,40.8768658324316,40.8768569187412,40.8768713104603,40.8768489288533,40.8768320445797,40.8768014652248,40.8767858914179,40.8767802231412,40.8767632317003,40.8767589349818,40.8767479378711,40.8765568556489,40.8763658248065,40.8761749952763,40.875984516831,40.8757945389668,40.8757431215487,40.8756918355591,40.8756411933424,40.8755917008109,40.8755438523901,40.8754348887644,40.8753238316046,40.8752110672823,40.8750969881063,40.8749819909582,40.8748664759106,40.8747508448364,40.8746355000096,40.8745208427066,40.8744072718099,40.8742951824202,40.8741849644826,40.8740770014294,40.873971668847,40.8738693331689,40.8737703504013,40.8736750648845,40.8735838080958,40.8734968974959,40.8734146354248,40.8733373080507,40.873265184374,40.8731985152924,40.8731375327275,40.873082448819,40.8730334551863,40.8730363931522,40.8730363733233,40.8730333960596,40.8730180498903,40.8730075058083,40.8730018869784,40.8730012590336,40.8730056293089,40.8730083143718,40.8730107080339,40.8730127447178,40.8730143686258,40.8730155352691,40.8730162126858,40.8730163823172,40.8730160395162,40.873011840458,40.8730043956631,40.8730056485616,40.8729987902473,40.8729910856156,40.8729952054424,40.8729987739631,40.8730169898392,40.8730321958372,40.8730444713919,40.873054529805,40.8730726662116,40.8730797857813,40.8730898803593,40.8731059058398,40.8730984166226,40.8731059782961,40.8731212258949,40.8731498055146,40.8731659007723,40.8731683959346,40.8731821269408,40.8731928344783,40.873208748321,40.8732217607303,40.8732347460574,40.8732537875096,40.8732833292058,40.8733235772303,40.8733539934522,40.8733808489737,40.8733982782056,40.8734097135067,40.8734504651365,40.8734714911908,40.8734873876354,40.8735130212587,40.8735326011033,40.8735410117399,40.8735553760776,40.8735780385408,40.8735902442389,40.873594792493,40.8735956758922,40.8736108191332,40.8736080814841,40.8736107319979,40.8736065121579,40.8736463110556,40.8736524504206,40.8736488362998,40.873648932924,40.8736542737823,40.8736693460208,40.8736791632408,40.8737009241341,40.8737219231193,40.8737302051708,40.8737444858466,40.8737557592927,40.8737730409511,40.8737978411985,40.8738196444988,40.8738293811032,40.8738444333085,40.8738456051708,40.8739233912036,40.8739054265169,40.8739197803451,40.8739377421856,40.8739611593436,40.8739439559092,40.8739628184367,40.8739785165083,40.8740162960233,40.8740510437418,40.8740842699144,40.8741069096158,40.8741370592891,40.8741600503281,40.8741451823987,40.8741805831901,40.8742069630454,40.8742348111288,40.8741773858655,40.8741789110844,40.8741940588667,40.8742152601,40.8742787429689,40.8742969117812,40.8743234151158,40.8743484014494,40.8743873937397,40.8743919336095,40.8744063250527,40.8744305548209,40.8744517555819,40.8744661470045,40.8744896115246,40.8745108168859,40.8745312585311,40.8745395887767,40.8745471695053,40.8745630601448,40.8745766945263,40.8745910734341,40.8746009227384,40.8746137946044,40.8746213595919,40.8746289410148,40.8746433310577,40.8746524144305,40.8746645283816,40.8746637786791,40.8746762799488,40.8746883920199,40.8747042968473,40.8747209506734,40.874739123049,40.8747512443371,40.8747618447056,40.8747800107502,40.8747981752427,40.8747996931078,40.8748133204558,40.8748277084521,40.8748428516068,40.8748413557892,40.8748640767411,40.8748814835157,40.8748951247069,40.8749027006161,40.8749345076661,40.8749602591966,40.8749780618044,40.8750136625935,40.875048492861,40.8750772747616,40.8750946885301,40.8751060493373,40.8751174046912,40.8751378408507,40.8751438929738,40.8751529696849,40.87516811862,40.8751756797112,40.8751832529178,40.8751885398035,40.8751961148627,40.8752036672727,40.8752067043121,40.8752097212554,40.8752218311102,40.8752346959552,40.8752384672065,40.8752528429074,40.8752672301934,40.8752763115283,40.8752853967606,40.8752929435237,40.8753088340025,40.8753194202021,40.8753436288027,40.8753678442235,40.8753769207709,40.8753852354942,40.8754003648103,40.8754185219736,40.8754291107283,40.8754374232059,40.8754464992335,40.8754533083851,40.8754646603152,40.8754661663826,40.87545783117,40.8754639500233,40.8754774924702,40.8754579959689,40.8754342171775,40.8754009179667,40.8753866373584,40.8753866093674,40.8753437987434,40.8753104811385,40.8752747912985,40.8752343908834,40.8752129843848,40.875174919778,40.8751392410755,40.8751106882332,40.8751130455062,40.8751129955633,40.8750939511804,40.8750463965961,40.8750131147231,40.8749964651518,40.8749940637038,40.8749679157474,40.8749631418246,40.8749559860418,40.8749036551076,40.8748441742439,40.8748227437655,40.8748155851425,40.8747918101611,40.8747513654788,40.8747109487898,40.8746789963927,40.8746179763849,40.8745568992121,40.8745114371774,40.8744378493496,40.8744164989716,40.8743808920188,40.8743500329707,40.8743262804207,40.874293042179,40.8742336700197,40.8741980681022,40.8741577106799,40.8741410943297,40.8740817199708,40.8740009668459,40.8739178493691,40.8738347482353,40.8737468735733,40.8736613605749,40.8736518804021,40.8736138549749,40.8736114660283,40.8735971892567,40.873552040249,40.8734854996524,40.8734260891654,40.8733737995076,40.8733165102158,40.8733244137316,40.8733269020534,40.8733268917565,40.8733277179604,40.8733343862435,40.8733407774165,40.8733441050542,40.8733460440427,40.873345203842,40.8733457541819,40.8733482493431,40.8733487971045,40.8733471204087,40.8733443329585,40.8733379308188,40.8733281943468,40.8733204024256,40.8733167809016,40.8733120460727,40.8733070381333,40.8733045308686,40.8733000823038,40.873292939148,40.8732897959989,40.8732833951306,40.8732783859006,40.8732714365071,40.8732650487079,40.8732583814526,40.8732533817546,40.8732492112002,40.8732464290205,40.873246424119,40.8732480881821,40.8732519724816,40.8732539013915,40.8732613998223,40.8732700132883,40.8732786293227,40.8732819597799,40.8732844559447,40.8732863559497,40.8732860167478,40.8732778730905,40.8732626921149,40.8732512716428,40.8732446786331,40.8732375098781,40.8732221731611,40.8732130886615,40.8732132309956,40.873213547587,40.8732065048323,40.8731982123975,40.8731917156039,40.8731956113037,40.8731973511958,40.8731973289591,40.873208814186,40.8732318116309,40.8732698532834,40.8732866788948,40.8733114746724,40.8733247666165,40.8733566475419,40.8733708106609,40.8734053130723,40.8734398031601,40.8734725146829,40.8734954973251,40.8734963644158,40.8735096218126,40.8735281696945,40.8735476040677,40.8735714628151,40.8735679147051,40.8735537540312,40.8735510827025,40.8735625716988,40.87358558267,40.8736015006742,40.8736218366703,40.8736368660505,40.8736412713342,40.8736545270639,40.8736713152546,40.8736942917676,40.8737146096121,40.8737366845985,40.8737534537738,40.8737693584062,40.873791456314,40.8738215142154,40.8738365311799,40.8738471306805,40.8738498679841,40.8738625454665,40.8738972582906,40.8739831478103,40.8739788932051,40.8742485345662,40.8742543038425,40.8745486785472,40.8745200785402,40.8742252221832,40.8742324940793,40.8739624782543,40.8739602501476,40.8739049952887,40.8740231597222,40.8740359947418,40.874078833507,40.8741173929048,40.8741688114545,40.8742030473512,40.874238711782,40.8742458198168,40.8742800663,40.8743014593244,40.8743457502328,40.8743671298139,40.8743642202119,40.8743927337827,40.8744255431514,40.8744683677399,40.8744868635092,40.8745096987334,40.8745238498897,40.8745035833653,40.8745001588918,40.8745148499584,40.8745196373244,40.8745276775628,40.8745276181051,40.8745194089048,40.8745030163073,40.8744866218682,40.8744491021407,40.8744246421399,40.8743266210968,40.8741996036456,40.8741893553126,40.8741262854577,40.8740957001749,40.8740253797859,40.8739883205172,40.8739442154148,40.8739355864263,40.8739205024874,40.8738853808933,40.8738608527235,40.8738457490155,40.873833821548,40.8738353552193,40.8738258952373,40.873795081751,40.8737573161231,40.8737194123703,40.8736289043189,40.8735246341791,40.8733023648453,40.8732715874743,40.8732366296253,40.8731817666524,40.8731277571354,40.8730919848904,40.8730635217613,40.873027751932,40.8729847074077,40.8729883510421,40.872984695839,40.8729744879261,40.8729562506,40.8729431101575,40.8728847349208,40.8728679641107,40.8728511987912,40.8728263828483,40.8728008393959,40.8727716567113,40.8727483246968,40.8727220536473,40.8726899521357,40.8726600447944,40.8726439954662,40.8726170101466,40.8726082445753,40.8725739469484,40.8725177377356,40.8724520631146,40.8723632735469,40.8723180825276,40.8722962489632,40.8722620528649,40.8721849286295,40.8721165358204,40.872058327575,40.8720335978173,40.8720183383369,40.8719863279473,40.8719062988014,40.8718255524487,40.8717615375259,40.8717297250338,40.8716956848108,40.8716424058376,40.8715768318925,40.871501871014,40.8714903712969,40.8714854380621,40.8714659533122,40.8714636710251,40.8714362282272,40.8714066530675,40.8713937069338,40.8713808163843,40.8713662831332,40.8713567821817,40.8713322020721,40.8713205126754,40.8713153335756,40.8712986744288,40.8712862475407,40.8712616125126,40.8712443629158,40.8712320483785,40.8711770927294,40.8711683480675,40.8711430166964,40.8711241407117,40.8710654934261,40.8710553817793,40.8710423384609,40.8710364080222,40.8710197361536,40.8709958633831,40.8709719721078,40.8709488361421,40.8709225428194,40.8709042432883,40.8708727903315,40.8708472605499,40.8708290695444,40.8708086525357,40.8707934179073,40.8707693591104,40.8707496895931,40.8707096105862,40.8706687893969,40.8706475579564,40.8705995017302,40.8705885664423,40.8705747268998,40.8705579262572,40.8705368065638,40.8705047186094,40.8704594276769,40.8704485156405,40.8704252319858,40.8704091294106,40.8703558916938,40.8703216264272,40.8702822142246,40.8702646466189,40.8702333609693,40.8702063752237,40.8701743023004,40.8701524213032,40.8700992575824,40.8700547465755,40.8700306761666,40.8700197588401,40.8699978569745,40.8699621376616,40.86993953295,40.869935135828,40.8699074832628,40.8698921819647,40.8698754103244,40.8698550425457,40.8698317040401,40.8698251045252,40.8698148854369,40.8697974247883,40.8697719223339,40.8697369694086,40.869732533844,40.8697150704664,40.8696851937949,40.8696603952304,40.8696486077466,40.8696428524125,40.8696239631286,40.8695962932675,40.8695795667665,40.8695685967741,40.8695481693717,40.8695379970709,40.8695241071403,40.8694891750761,40.8694519956564,40.8694365913542,40.8694111773553,40.8694054602706,40.8694194005851,40.8694217046019,40.8694086517895,40.8694417626559,40.8694587623879,40.8694874713105,40.8695102726675,40.8695242899073,40.8695229733526,40.8694947447472,40.8694766016084,40.8694547576384,40.8694131635453,40.8693773822302,40.869364097975,40.869354585028,40.8693516043297,40.8693442813003,40.8693361236358,40.8693134965608,40.869214114197,40.8691790755204,40.8691789979928,40.8691671909452,40.869155402996,40.8691117185161,40.8690782428826,40.8690614758765,40.8690432262404,40.8690316229164,40.8690192190053,40.86900617043,40.8689726922542,40.8689522098604,40.8689337669567,40.868920043664,40.8688950132028,40.8688802152404,40.8688768552322,40.868864452347,40.868861225958,40.868847673374,40.868824947571,40.8688024395358,40.8687853490966,40.8687742739647,40.8687586364689,40.8687403958655,40.8687182373993,40.8687052112504,40.8686758955076,40.8686576593617,40.8686465952899,40.868623792458,40.8686062153127,40.8685834091945,40.8685632401288,40.8685130894059,40.8684915930923,40.8684766253026,40.8684082551757,40.8683750352578,40.8683548464132,40.8683033850666,40.8682812392571,40.8682649661278,40.8682643169823,40.8682454287192,40.8682037670693,40.8681861971224,40.86817448074,40.8681543048662,40.8681354243198,40.868100284558,40.8680744889102,40.8680606237671,40.8680401639344,40.868030179937,40.8680301737123,40.8680201875091,40.8680035371016,40.8679911726627,40.8679773850747,40.8679659830569,40.8679350577684,40.8679131878876,40.8678956019256,40.8678956143845,40.8678823045758,40.8678680211171,40.8678314000352,40.8678104796165,40.867789089279,40.8677762558634,40.8677594897189,40.8677477528478,40.8677259174102,40.8677002056725,40.8676725204725,40.8675058345256,40.8673731911212,40.8672154621941,40.8669405587706,40.8667395598418,40.8666052127114,40.8665286242922,40.8665149430044,40.8661571113571,40.8657812423226,40.8652674711696,40.8648483385921,40.8647455844036,40.864739284545,40.8647105005771,40.8646664014103,40.8646457251095,40.8646250226958,40.8646241797464,40.8645803789192,40.8645695666337,40.8644123516234,40.864311285995,40.864173626873,40.8644367216078,40.8644465049087,40.8644481434173,40.8644392536738,40.8644336260168,40.8644183035537,40.8644077291607,40.8643874009978,40.8643841682682,40.8643337365839,40.8643094726769,40.8643485140767,40.8643501533155,40.8643428676768,40.864342090787,40.8643348122537,40.8643259020843,40.8643080375825,40.8642804014023,40.864242184212,40.8642039645844,40.8641730558767,40.8641461925409,40.8641290905331,40.8641225769717,40.8641143089535,40.8641030076246,40.8640964701971,40.8640956252963,40.86408664892,40.8640753568306,40.8640706510481,40.8640668185245,40.8640661939499,40.864078356575,40.8640815822304,40.8640803014559,40.8640797008296,40.8640772897231,40.8640731291084,40.8640673252212,40.8640600262559,40.8640514185819,40.8640429392834,40.8640353151468,40.8640287725766,40.8640235058589,40.8640196713926,40.8639960681748,40.8639759521886,40.8639452242333,40.8638977435162,40.8638794605397,40.863860203635,40.8638431150668,40.8637874519083,40.8637441870244,40.8637355194392,40.8637083856987,40.863680433751,40.8636521862261,40.8636410813958,40.8636180437802,40.8635986440193,40.863590473696,40.8635642056844,40.8635472325672,40.8635287306711,40.8634479063176,40.863429170989,40.8633624976231,40.8633461072968,40.8633007178207,40.8632803306087,40.8632570739249,40.8632329845173,40.8632084572924,40.8631941806309,40.863195486465,40.8631645422749,40.8630949190699,40.8630843842007,40.8630065104948,40.862938127791,40.8629100749655,40.8629310718745,40.8629161042567,40.862909251121,40.862895998348,40.8629011386855,40.862892159247,40.8628891567996,40.8628797533731,40.8628789082212,40.8629024278781,40.8628939057829,40.8628798188935,40.8628528645355,40.8627891573601,40.8627512515447,40.8627314341833,40.8627149402002,40.8627089749816,40.8627044959614,40.8626484876943,40.862631455322,40.8626307569586,40.8624881448087,40.8624412603439,40.8624212860406,40.8624054177958,40.8623655914322,40.8622757022763,40.8622691265757,40.8622489805492,40.8621976386999,40.862180503963,40.86217571565,40.8621578639007,40.8621463796049,40.8621419552931,40.8621297200632,40.8621128904668,40.8621059005062,40.8620936347474,40.8620412576156,40.8620347304357,40.8620213486599,40.8620146453838,40.8620081280779,40.8619904378624,40.8619861759588,40.8619776012673,40.8619636088136,40.861953580029,40.8619317270406,40.8619332555635,40.8619250408344,40.8619127869555,40.8619099815896,40.8618926229765,40.8618782689821,40.8618603082395,40.861810761149,40.8617365437312,40.8616946996722,40.8616794182307,40.8616173280705,40.8615709779882,40.8615327376193,40.8614863727063,40.8614294698831,40.8613986345894,40.8613633248697,40.8613499247695,40.8613357360443,40.8613231312905,40.861306835299,40.8612921169717,40.8612763647144,40.8612611255655,40.8612211917724,40.861192821694,40.8611449992203,40.8610935042629,40.8610635528519,40.8610427828053,40.8610244365989,40.8609969359274,40.8609804221354,40.8609489017911,40.8609314463155,40.8609006558049,40.8608844678497,40.8608838360767,40.8608736738556,40.8608498720005,40.860839613202,40.8608254261721,40.8608139992255,40.8608022212707,40.8607498976819,40.860731985232,40.8606210984389,40.8604048243112,40.8602215333953,40.8601958090441,40.8601701380299,40.8601352968953,40.8600961970058,40.8600804694219,40.8600486774215,40.8600568926171,40.8600456121851,40.8600179156063,40.8599912458413,40.8599922832119,40.8599707606168,40.8599502447626,40.8599184592107,40.8599071983025,40.8598938731094,40.8598631108042,40.859835407099,40.8598118080843,40.8597820642849,40.8597677166058,40.8597390082306,40.8597482466603,40.8597349215738,40.859728770346,40.8597164582054,40.8597051639241,40.8596483075315,40.8596422249336,40.8595580957327,40.859546750814,40.8594391634973,40.8594180416418,40.8593134659011,40.85917299234,40.8590766175033,40.8589638331018,40.8588992490814,40.858855421344,40.8588139373585,40.8587911337905,40.8587836337146,40.8587916154439,40.8587985779833,40.8589108124499,40.8590245658312,40.8591014028212,40.8591103309918,40.8591432567476,40.8591615018279,40.8591465513039,40.8591209465917,40.8591244925797,40.8591032611252,40.8590434921099,40.859018671592,40.8590110614035,40.8589958646785,40.8589872586345,40.858945216186,40.8589386149475,40.8588864435765,40.8588808636701,40.8588671935468,40.8588438820696,40.8588018582986,40.8587947722912,40.8588271917271,40.8588585985421,40.8588783602685,40.8589263439596,40.8591040920989,40.8591550007931,40.8591610128276,40.859172355155,40.8592051037551,40.8592124507138,40.8592592450833,40.8592632659965,40.8592899779153,40.8593240353371,40.8593513980484,40.8593981524968,40.8595229988217,40.8595376239784,40.8597593633276,40.8599363005511,40.8600985688388,40.8601880428167,40.8602141105169,40.8602167893972,40.8602127856764,40.8602114654421,40.8601908017355,40.8601748066524,40.8601628138991,40.860130812816,40.8601234734623,40.8600988006779,40.86009947665,40.8600728000269,40.8599640409767,40.8598906508614,40.8598399452158,40.8597652081007,40.8597118259141,40.8596937956305,40.8596724424008,40.8596724602885,40.8596471031735,40.8596337378341,40.8596310601862,40.8596357219835,40.8596116954394,40.8596090190728,40.8595923215973,40.8595809797729,40.8595723064046,40.8595709498909,40.8595509334866,40.8595476206198,40.8595556620253,40.8595676672836,40.8595690233562,40.8595796940834,40.8595790401933,40.8595590197975,40.8595590430338,40.859547697532,40.8595423658337,40.8595603935719,40.8595550653481,40.8595403802146,40.859521697242,40.8595083430817,40.8594949717051,40.8594969689795,40.8594796164343,40.8594756121886,40.8594669330016,40.8594602553621,40.8594368927054,40.8594108536667,40.8594115117421,40.8593948154479,40.8593914811851,40.8593781388515,40.8593761658585,40.8593835177483,40.8593948738556,40.8593828817189,40.8593715232041,40.8593528146151,40.8593287992249,40.8593234793441,40.8593001245031,40.8592907871714,40.8592707601947,40.8592407341879,40.859200028582,40.8591813396473,40.8591626423828,40.8591412563114,40.8591285904998,40.8591152381301,40.8591038754625,40.8590938342541,40.8590964724544,40.8590837846856,40.8590744347753,40.8590670788624,40.8590757490929,40.8590684007617,40.8590557000184,40.8590550019536,40.8590383068487,40.8590282844412,40.8590115840442,40.8590055649264,40.8589968738034,40.8589801709775,40.858964812603,40.858952109435,40.8589394252268,40.8589400838451,40.8589320720708,40.8589193770062,40.8589126903443,40.858907337627,40.8588993128659,40.8588799538982,40.8588752916645,40.8588853276061,40.8588966903869,40.8588967029622,40.8588786714329,40.8588666338519,40.8588639431609,40.8588692617083,40.8588465535271,40.8588145120428,40.8587938192521,40.8587844883761,40.858763131608,40.8587371046804,40.858715082987,40.8586937117908,40.8586890177532,40.8586663112333,40.8586456158418,40.85863890715,40.858616194634,40.8585975128812,40.858588183286,40.8585721515337,40.8585668017792,40.8585561197791,40.8585534445282,40.8585127539342,40.858472717183,40.8584453568508,40.8584413290928,40.8584326514839,40.8584172880317,40.8583972685568,40.8583745717309,40.8583452163224,40.8583298661028,40.8583171734476,40.8583118483198,40.858299841248,40.8582938191413,40.8583037772235,40.8582897589699,40.8582844149141,40.858255014123,40.8582189671403,40.8581206744615,40.8575512240577,40.8575223303538,40.8574206514332,40.8573999648614,40.8573895975539,40.8573672528818,40.8573489063801,40.8573217505963,40.8572897919277,40.8572634156027,40.8572322337398,40.8572114438419,40.8571527025229,40.8570888306292,40.8570651542334,40.8570547796524,40.8570436065724,40.8570356238064,40.8570212610615,40.8570132947157,40.8569989433622,40.8569925719215,40.8569917904993,40.8569846112326,40.8569750272847,40.856954253125,40.8569342836194,40.856911118313,40.8568541600868,40.8567794912411,40.8567662474765,40.8567384468189,40.8567263402886,40.8567202706607,40.8566634824712,40.8566417541365,40.8566139642052,40.8566272949848,40.8566079765501,40.8565835696249,40.8562803416538,40.8562531225375,40.8562150534732,40.8559783494555,40.8556823358149,40.8556854610127,40.8556929874393,40.8557015931599,40.8557026712826,40.8557040017314,40.8558749905505,40.8558969651964,40.855899953109,40.8559031947138,40.8559066087336,40.8559101085401,40.8559136066799,40.8559170153764,40.8559202490439,40.8559232254587,40.8559258709535,40.8559281180658,40.8559299104007,40.8559312041355,40.8559319663397,40.8559321773216,40.8559318311289,40.8560539117845,40.856059135366,40.8562369904473,40.8563496620561,40.8563551337233,40.8564542243657,40.8564621413125,40.8565658685902,40.8565678943987,40.856672301855,40.8566011706232,40.8564966611342,40.8564991103357,40.8563940160026,40.8564006434736,40.8563046818085,40.8563291258636,40.8560400550478,40.856045054281,40.8559226292745,40.8559194089111,40.8559159771004,40.8559124189684,40.8559088295121,40.8559052955052,40.855901909576,40.8558987579704,40.8558959202243,40.8558934693268,40.8558914672042,40.8558899648829,40.8558890013233,40.8558885999009,40.8558887720943,40.8558474155497,40.8557954657965,40.855771186451,40.8557256156674,40.8557008918708,40.855686931639,40.85567571342,40.8556756394069,40.8556638352292,40.8556549888438,40.8555100559744,40.8551797749608,40.8549886765113,40.8548855053088,40.8545894703178,40.8542258063622,40.8539771980347,40.853436953918,40.8528404727044,40.8525066395779,40.8520709093696,40.8520217104241,40.8519937849446,40.8519422207045,40.851892817511,40.8518369559468,40.851815475919,40.8518025923293,40.8517381371085,40.8516479112024,40.8516070867049,40.8515383483389,40.8514223342444,40.8513267343892,40.8512730303642,40.8512429513113,40.85109901651,40.8510689370451,40.8509550715729,40.8509263172095,40.8507781470425,40.8507527429455,40.8507160211588,40.8505141272094,40.8502071754799,40.8501809282889,40.8498392626862,40.8495328924865,40.8492505321107,40.8489681607699,40.8487634400509,40.8485573121181,40.848379413767,40.8481874030753,40.8477271362688,40.8474916337005,40.847380136944,40.8471322292998,40.8470826810153,40.8470314732832,40.8469819578816,40.8458542212013,40.8457950120815,40.8457130880242,40.8456441614596,40.8453719768564,40.8452895999682,40.8452317777612,40.8451554985848,40.8450773836422,40.8449838830711,40.8448940737051,40.8447691969373,40.8446609297276,40.8445551176073,40.844449305943,40.8442844415958,40.844163491488,40.8440441406138,40.843828808693,40.8436811598807,40.843555650223,40.8434285460887,40.8433719473012,40.8433374999177,40.8432058408848,40.8430852580147,40.8430231193936,40.8429397055029,40.8428102512157,40.8427930332116,40.8427659647572,40.8427179729305,40.8425383401419,40.842400432568,40.8419311978196,40.8416883401195,40.84138537504,40.8408369730494,40.8402550680509,40.8391237495382,40.8387857813553,40.8385434752912,40.8384216813445,40.8382502714485,40.8380878701799,40.8379718800389,40.8378913250208,40.8377663055668,40.8375794217014,40.8373712849736,40.8371328548001,40.8369343628763,40.8367661687363,40.8365727930764,40.8363838431464,40.8363185036597,40.8362007755935,40.8359809601499]}]],[[{"lng":[-73.9730148717612,-73.9714114162373,-73.9699048927902,-73.9698002889176,-73.969688011648,-73.9681868780361,-73.9686422611989,-73.9691324742657,-73.9696250012669,-73.970081008278,-73.9705341753114,-73.9709937066437,-73.9714504804381,-73.9719067600844,-73.9723627592047,-73.9728196744526,-73.9732755973791,-73.9737341050976,-73.9741893717431,-73.9746479807628,-73.9751026616537,-73.9755580087778,-73.9760482492897,-73.9765348538745,-73.9769857072833,-73.9784850338427,-73.9786072413417,-73.9787064217339,-73.9802208997001,-73.9806734524911,-73.9811232286508,-73.98157269673,-73.9820246450754,-73.9824721204708,-73.9829569102128,-73.9814328194381,-73.981340686616,-73.9812591988635,-73.9797234650314,-73.9802097127826,-73.9806584262387,-73.9811085987999,-73.981559970852,-73.9820087537404,-73.982455207304,-73.9829118010137,-73.9832796584488,-73.9833596221309,-73.9838113565054,-73.9842577192636,-73.9847423100253,-73.9852322461129,-73.9864719497867,-73.9866496967712,-73.986960482836,-73.9870359272105,-73.9873015486895,-73.9872282000595,-73.9868534526938,-73.9872886374606,-73.9871753728691,-73.9876064539275,-73.9865350000197,-73.9869611550926,-73.9873871843564,-73.987816450892,-73.9882860036744,-73.9887793168407,-73.9888393515615,-73.9899029597006,-73.9907539681664,-73.9911989933494,-73.9917149877339,-73.993616883955,-73.9968399386042,-73.9963423696591,-73.9958740945895,-73.9954472576705,-73.9950179854245,-73.9945926491055,-73.9941607833721,-73.9939707175459,-73.9937335385751,-73.9932897332994,-73.9928034094901,-73.992321823447,-73.9920664716518,-73.9918710243355,-73.9914185849462,-73.9942625862863,-73.9950143313275,-73.9970990285431,-73.996647044391,-73.9961965546697,-73.9957485550705,-73.9952982146095,-73.9948436383084,-73.9943794679031,-73.9939482565986,-73.9934641773624,-73.9929793784412,-73.9925285599189,-73.9920790001106,-73.9916327131064,-73.9911773809228,-73.9907263633971,-73.9902762141258,-73.989790854016,-73.9892972754388,-73.9888425380256,-73.9883904457516,-73.9879264069384,-73.9874752469956,-73.9870151455532,-73.9865613853334,-73.9861040615106,-73.9856467779071,-73.9851915222547,-73.984733937796,-73.9842823014675,-73.9838218570337,-73.9833665790018,-73.983131667412,-73.982877134552,-73.9823654503953,-73.9821106153311,-73.9820601816504,-73.9820075877987,-73.9819535150924,-73.9818986635917,-73.9818437441389,-73.981789468181,-73.9817296028408,-73.9816726983235,-73.9816196288633,-73.9815712096455,-73.9815281846638,-73.9814912149279,-73.9790765877813,-73.9783611297531,-73.9762338879695,-73.9741922902141,-73.9736358469904,-73.9730148717612],"lat":[40.7642788794452,40.7635874736972,40.7629580422263,40.7629135121279,40.7628659629433,40.7622268213259,40.7615999606762,40.7609291906075,40.7602514400397,40.7596249069017,40.7590006498643,40.7583733305535,40.7577492320373,40.7571246738538,40.7564977256586,40.7558705520048,40.7552435380833,40.7546187736035,40.753993511311,40.7533671226279,40.7527413795409,40.7521161830587,40.7514413933756,40.7507755069916,40.7501569592558,40.7507882418086,40.7508424848914,40.7508846466341,40.7515219796268,40.7509051014574,40.750282458774,40.7496680890156,40.749049540406,40.7484315019191,40.7477643531884,40.7471197779358,40.7470786636824,40.7470457052569,40.7464028758359,40.7457333623706,40.7451158253887,40.7444982793065,40.7438818838497,40.7432646208938,40.7426469600848,40.7420259399277,40.7415217628685,40.7414121661736,40.7407898806718,40.7401685929103,40.7395103601641,40.738840230795,40.7393628214297,40.7391009115229,40.7392355272563,40.7392663785494,40.7389030260365,40.7388709785074,40.7387147516696,40.7381307864771,40.7380841334007,40.7374978246478,40.7370500104712,40.736464342419,40.7358789328976,40.7352922810599,40.7346590025307,40.7339653997385,40.7339904794289,40.7344347896343,40.7348391545737,40.7350123685835,40.7352153006666,40.736004491616,40.7373608893982,40.7380452320566,40.7386859456654,40.7392683845799,40.73986001125,40.7404419809084,40.7410288222935,40.7412984387316,40.7416222018193,40.7422342815498,40.7429100202034,40.7435680934219,40.7439162027063,40.7441855709463,40.7448026824962,40.7460039813579,40.7463223271801,40.7472051020423,40.7478227290828,40.7484393277447,40.749052196221,40.7496716826001,40.7502933089629,40.7509303898028,40.7515222216601,40.7521900552677,40.7528534028991,40.7534739128927,40.7540911158654,40.7547068050096,40.7553298485813,40.7559504055648,40.7565675650496,40.7572331319189,40.7579066376497,40.7585334990581,40.7591641861778,40.7597902771578,40.760404786886,40.7610373674779,40.7616601223625,40.7622899526043,40.762914874483,40.7635436746478,40.7641691048775,40.7647918145993,40.7654184746975,40.7660452418662,40.7663669830552,40.7667155951407,40.7673921532134,40.7677444760438,40.7677278370948,40.7677156630808,40.7677081117074,40.76770527993,40.7677072053479,40.7677138630184,40.7677292333884,40.7677501163631,40.7677761911146,40.7678070569482,40.7678422397838,40.767881199101,40.766876086135,40.7665737113197,40.7656746314446,40.7648065283319,40.7645699137759,40.7642788794452]}]],[[{"lng":[-73.935567971159,-73.9356563528377,-73.9355216306533,-73.9355662175141,-73.9358519529475,-73.9358098764252,-73.9356983388849,-73.9356085344977,-73.935567971159],"lat":[40.7719187775339,40.7717563964351,40.7717162935583,40.7716291158891,40.7717160019927,40.7717993686218,40.771766903124,40.7719312776845,40.7719187775339]}],[{"lng":[-73.9418003272943,-73.9425680614214,-73.942855286207,-73.9432192352011,-73.9438142732276,-73.9442234308923,-73.9448402665221,-73.9462378795983,-73.9465716508005,-73.9466214140868,-73.9468246022838,-73.9470887692952,-73.947882683892,-73.9479297966422,-73.9483245959115,-73.9487778940647,-73.9491473854193,-73.949431755632,-73.9497122670002,-73.9500826263769,-73.9503335881448,-73.9512600590877,-73.9514862628306,-73.9517119041102,-73.95177822026,-73.9520923302263,-73.952176634237,-73.9522114634206,-73.9525407933688,-73.9531215654617,-73.9532200996317,-73.9532688861099,-73.9533069603585,-73.9533455646288,-73.9534058305199,-73.9540952773631,-73.9550732692816,-73.9551950311748,-73.9557941523772,-73.9569240430461,-73.9572100353129,-73.9579145255927,-73.9586075575642,-73.9586849544351,-73.9590324860946,-73.9590275744249,-73.959558759308,-73.9599018708187,-73.9603917057254,-73.9608128692842,-73.9608301144032,-73.9608443596393,-73.960855224895,-73.9608776206171,-73.960905862976,-73.9609392003413,-73.9609599478155,-73.9609834163596,-73.9610089580296,-73.9610358676456,-73.9610634022606,-73.9610908016722,-73.961117309411,-73.9611421936251,-73.9611647672859,-73.9613284548105,-73.9615385553056,-73.9613865617142,-73.9614090988969,-73.96142702683,-73.9614398278911,-73.9614471324804,-73.9614442702823,-73.9614379778049,-73.9614283919083,-73.9614157210855,-73.961400240928,-73.9613804474666,-73.961363401328,-73.9613495196993,-73.9611106020796,-73.9606855795818,-73.9600113232981,-73.9598906175869,-73.9595715660582,-73.9595007999513,-73.9590161662748,-73.9589267112095,-73.9584583680568,-73.9576807286007,-73.9568947695998,-73.9564634877301,-73.9559856341006,-73.9556551316413,-73.9555928627347,-73.9555672470045,-73.9555346437704,-73.9555042552447,-73.9554645538082,-73.9554458901496,-73.9553419381823,-73.9549940606845,-73.9539079511914,-73.9538429487645,-73.9537814567638,-73.9537476058547,-73.9536624181071,-73.9536127225653,-73.9533232161792,-73.9533914073396,-73.9531245150495,-73.9529778821611,-73.9524845791203,-73.9520863226651,-73.9518766729838,-73.9516250497398,-73.9509719159441,-73.9509373492809,-73.950730687827,-73.9503754807445,-73.9499719175026,-73.9492037602278,-73.9490862879156,-73.9488131531641,-73.947701090128,-73.9465527389312,-73.9459145890561,-73.9458511233309,-73.9458445142382,-73.9457536133356,-73.9457035726866,-73.9455965853588,-73.9454811428929,-73.9456272109345,-73.9455630204875,-73.9454049185002,-73.9453820817897,-73.9452451034135,-73.9451570422152,-73.9450906579417,-73.9447235322071,-73.9447247849746,-73.9446729328337,-73.9445616151757,-73.9442700706356,-73.9440042395634,-73.9432041411423,-73.9428171096028,-73.9425783030101,-73.9421267464683,-73.9413699074241,-73.9408870721163,-73.9405695742063,-73.9402746092122,-73.940179598041,-73.9400766575165,-73.9400115725835,-73.9401845122451,-73.940282079242,-73.9402776672236,-73.9402002177965,-73.9402287038908,-73.9402798582933,-73.9403553347751,-73.940826053003,-73.9411177871803,-73.94121934173,-73.941259753826,-73.9418003272943],"lat":[40.7690469266247,40.7685059057316,40.7683034944094,40.7678926438532,40.7672209120499,40.7666649778899,40.7658236283908,40.7642850145498,40.7639175582609,40.763862772081,40.7636176332345,40.7632989210868,40.762365697592,40.7623103162598,40.7618462300015,40.7613145708652,40.7608812159892,40.7605486173615,40.7603289173848,40.7600474704633,40.7598567555536,40.7588101163718,40.758666455352,40.7584624942014,40.758402549877,40.7579931403449,40.75783133644,40.757583639833,40.7570953145373,40.7565238048271,40.7564268418177,40.7563810441033,40.7563443271275,40.7563113756674,40.7562585318773,40.7556549289454,40.7547986825548,40.754774523476,40.7541615474087,40.7529611603938,40.7527153568317,40.7521098545256,40.751613323987,40.7515737774218,40.7513864227712,40.751297369851,40.750814597762,40.7505585153536,40.7502561861173,40.7499006169389,40.7498876783699,40.7498727772904,40.7498563113,40.7498275707736,40.7498019819458,40.7497802258211,40.7497664130919,40.7497554037121,40.7497475016397,40.7497429250427,40.7497418002764,40.7497441583943,40.7497499342913,40.7497589685008,40.7497710115974,40.7496009576245,40.7497231198408,40.7498805028359,40.74989974574,40.7499216126241,40.7499454721447,40.749970635426,40.7499885332942,40.7500059163785,40.7500224065932,40.7500376452722,40.7500513009708,40.7500635162894,40.7500779297977,40.7500941887413,40.750600469901,40.751201936968,40.7518315173349,40.7520974776227,40.7528047159002,40.7529563816932,40.7535950599574,40.7535624923614,40.7539492365049,40.7548219611657,40.7557039958265,40.7561879825457,40.7567242253051,40.7570951057258,40.7572228001736,40.757257666686,40.7572960344684,40.7573334560726,40.7573773682119,40.7573992514428,40.7575211355683,40.7579290196575,40.7592008748508,40.7592389453878,40.7593230822284,40.759363937926,40.7594797341135,40.7595021490142,40.7597459646874,40.7597967623577,40.7600527584296,40.7599621073743,40.7604601105153,40.7608621549074,40.7612455827981,40.7616788636058,40.7624945075076,40.7625704952379,40.7627582254338,40.7631738450779,40.7636460303171,40.7642696438328,40.764264027275,40.7646107544687,40.7660223973252,40.7673682050641,40.7682139390187,40.7682477502356,40.7683212282514,40.7683016714271,40.7683279343115,40.7684708650051,40.7686247794379,40.7686929531789,40.7688017760271,40.7687321730386,40.7687632030479,40.7687732683104,40.7691183177517,40.7692137208155,40.7697340583815,40.7697862715349,40.7698199680534,40.7698863959274,40.7701405352547,40.7702939821508,40.7709923997487,40.7714108607023,40.7717018567185,40.7720347005095,40.7723091508277,40.7723725162786,40.7726147589642,40.7729474373956,40.7729593155944,40.772926186358,40.7728423605526,40.7725649068042,40.7723014069913,40.7717131417395,40.7711283056628,40.7708522616644,40.7706707110098,40.7704965743711,40.7699121567656,40.7694144085747,40.7693343431224,40.7693088793927,40.7690469266247]}],[{"lng":[-73.9380464060344,-73.9379013362394,-73.9377944872642,-73.9377994417956,-73.9376463182148,-73.9376536596381,-73.9375989462262,-73.9377926903634,-73.938237735094,-73.9383962259174,-73.9386120082195,-73.9392374617823,-73.939318219876,-73.9395301579325,-73.9395837897248,-73.9394323810077,-73.9394932975206,-73.9393751537968,-73.9393052849678,-73.9392178962528,-73.9387280292659,-73.9388395184504,-73.9388286341011,-73.9387442308928,-73.9383009795165,-73.9380821326871,-73.9379675772165,-73.9380494892176,-73.9380672308993,-73.9380464060344],"lat":[40.7808295442756,40.7807499961726,40.7807812587555,40.7810313397967,40.7810012158929,40.7807900075528,40.7804678408615,40.7803579042124,40.7802590794654,40.7802624333912,40.780338955869,40.7797333940584,40.7797180018269,40.7795276202605,40.7795764740072,40.7798122002746,40.7798736913155,40.7799787718493,40.7799512245521,40.7800135202215,40.7805107437046,40.7805992497999,40.7807634512302,40.7810438760423,40.781362084365,40.7814184377772,40.7812893340603,40.7810558060425,40.7809447026981,40.7808295442756]}],[{"lng":[-73.943832566099,-73.9437600534063,-73.9436320172783,-73.9435697971989,-73.9435442071252,-73.9436482353901,-73.9438806810246,-73.9438707598871,-73.9437146885057,-73.9436004747541,-73.9434387673599,-73.9424642534703,-73.9424516407923,-73.9424388123453,-73.9424260871596,-73.9424137816975,-73.9424022019831,-73.9423916359918,-73.9423823464885,-73.9423745644931,-73.9423684835349,-73.9423642548404,-73.9421202220567,-73.9421158521175,-73.9421132094469,-73.9421123584726,-73.9421133199406,-73.9421160704098,-73.9421205428228,-73.9421266281418,-73.942134178006,-73.9421430083496,-73.9427297339572,-73.942718846166,-73.9427171925761,-73.9427248067431,-73.9427415340418,-73.9427670348071,-73.9428007913825,-73.9428421182346,-73.9428901762189,-73.9429439895218,-73.9430024654733,-73.9426553074297,-73.9424574105696,-73.9422950619864,-73.9422805004479,-73.94231968904,-73.9423633371575,-73.9424554569813,-73.9424285395392,-73.9424249119559,-73.9423899917322,-73.9423594348603,-73.9423623347101,-73.9423354182118,-73.9422411139339,-73.9422854938064,-73.9422405053421,-73.9422557960449,-73.9421198245403,-73.9421853701392,-73.9423097071322,-73.942293683332,-73.9424340389556,-73.9424296453569,-73.9423378939154,-73.9423846714195,-73.9423288292182,-73.9422762272684,-73.9422277831706,-73.9421843419916,-73.9421466615231,-73.9421153990621,-73.9420910999458,-73.9420741880388,-73.9420026672227,-73.9420816045738,-73.9424010094905,-73.9425876964068,-73.942930437814,-73.9433389475049,-73.943664318148,-73.9439608437088,-73.9443639344074,-73.9448788959671,-73.9456151401251,-73.9464041891907,-73.9469076413377,-73.9474897545637,-73.9480863340655,-73.9486641647792,-73.9490853676865,-73.949373321315,-73.949579120714,-73.950069793031,-73.9506634515425,-73.9512249766656,-73.951764809004,-73.9523096318113,-73.9533655996358,-73.9544182607861,-73.9557362164032,-73.9558722233907,-73.9563091763419,-73.9563331896777,-73.9569784172763,-73.9573173758794,-73.9575986944528,-73.957637727421,-73.9580049661682,-73.9582566084192,-73.9583612533256,-73.9583852867399,-73.958426201896,-73.9584550180999,-73.9584911954165,-73.9585432967906,-73.958777908227,-73.9588635886981,-73.958934485137,-73.9590368100845,-73.9597218041865,-73.9619657361163,-73.963080735288,-73.9635561893216,-73.9643135356523,-73.9665833842226,-73.9681868780361,-73.969688011648,-73.9698002889176,-73.9699048927902,-73.9714114162373,-73.9730148717612,-73.9725535229576,-73.9720985244436,-73.9716477426822,-73.9711852091349,-73.9707277741458,-73.9702816550227,-73.9698245528782,-73.9695160517743,-73.9693648454656,-73.9689045471034,-73.9684415586728,-73.9679932771091,-73.9675339844437,-73.9670394751384,-73.966536169471,-73.9660744904101,-73.9656096862152,-73.9651474537478,-73.9646873584175,-73.9642282017404,-73.963761238512,-73.9637260260806,-73.9632299191105,-73.9631345980356,-73.9627671549355,-73.9623036147985,-73.9618383683974,-73.9613687269495,-73.9609101613834,-73.9604143058784,-73.9599209422009,-73.9594690599152,-73.9590117668133,-73.9585681001153,-73.9581035344421,-73.9576359938983,-73.9571624332454,-73.9567186299825,-73.9562613091965,-73.9557773591232,-73.9541647699251,-73.953713450606,-73.9534164669039,-73.9526613672815,-73.9525514546904,-73.9524643016674,-73.9522294753702,-73.9512967085309,-73.9509281278826,-73.9503380413039,-73.9493317062711,-73.9487762622345,-73.9478434603698,-73.9470895191672,-73.946444972832,-73.9459218599374,-73.9447226452693,-73.9446466599195,-73.9440543944633,-73.9439546016314,-73.9438932460593,-73.943832566099],"lat":[40.782859089475,40.7828289317175,40.7829623236854,40.7829230780709,40.7828805238227,40.7826561613333,40.7815320433644,40.7812730265716,40.7806298155289,40.7801590994662,40.7797632419659,40.7800325000442,40.7800343016842,40.7800345736886,40.7800333092929,40.7800305399415,40.7800263345051,40.7800207975688,40.7800140668302,40.7800063096758,40.779997719018,40.7799885084971,40.7794725563725,40.7794643817475,40.7794557896798,40.7794469896443,40.7794381961863,40.7794296236904,40.7794214811542,40.7794139670926,40.7794072646985,40.7794015373762,40.7792572476555,40.7792084524819,40.7791589763413,40.7791098238455,40.7790619930324,40.7790164551013,40.7789741344228,40.7789358905933,40.778902500145,40.778874641062,40.7788528790149,40.7781249655742,40.777407473348,40.7773319624832,40.7773474382287,40.7774525192671,40.7774470109242,40.7777478643337,40.7777528275672,40.7777423200661,40.7777472787893,40.7777538991917,40.7777649591649,40.7777688163741,40.7774701741157,40.7774602428268,40.777334146821,40.7773164602774,40.7772555664118,40.7771638087623,40.7772197198808,40.7772429362478,40.7773004614862,40.7772889489517,40.7772489011777,40.777171097102,40.7771552162206,40.7771338794108,40.7771074588783,40.7770764155101,40.7770412908347,40.7770026975747,40.7769613089589,40.7769178469771,40.7761853173828,40.7759570163171,40.7757269275262,40.7752189565281,40.7746762680359,40.7742111925907,40.7738407641769,40.773530420092,40.7731085387924,40.7725695620073,40.7719430265877,40.7712690456193,40.7707339117236,40.7701151540191,40.7694747932189,40.7688576238969,40.7682782707957,40.7678821910544,40.7676289301796,40.7670250878808,40.7663807113494,40.7657711989735,40.7651637118432,40.764554288606,40.7633681709117,40.7621841049511,40.7610243928476,40.7609047121156,40.7605083675543,40.7604865855639,40.759896754446,40.7595922122566,40.7593423182578,40.7593067398983,40.7589719996293,40.7587492611931,40.7586602419549,40.7586397974006,40.7586038730069,40.7585809021978,40.7585459038305,40.7584956229358,40.7582709208488,40.7583060704377,40.7583351554485,40.7583837826046,40.7586630636816,40.7596194607855,40.7600831637403,40.7602808185822,40.7605992313504,40.7615509355766,40.7622268213259,40.7628659629433,40.7629135121279,40.7629580422263,40.7635874736972,40.7642788794452,40.7648977317234,40.7655172512275,40.7661424684726,40.7667702901723,40.7673937229188,40.7680250324297,40.7686460088209,40.7690652004245,40.769270656823,40.7699008317911,40.7705163268729,40.7711472309525,40.771776183984,40.7724612188163,40.77314036859,40.7737729891002,40.7744072014455,40.7750442320898,40.7756770817154,40.7763103091826,40.7769509699349,40.7770057178997,40.7776770473619,40.7778080512782,40.7783130408885,40.7789470412049,40.7795841921961,40.7802297490476,40.7808570355244,40.7815242678047,40.7822129435021,40.7828333216645,40.7834612846351,40.7840834440397,40.7847130047313,40.7853434578213,40.7859796382595,40.7866007938244,40.7872228762799,40.7879139244711,40.7872275635765,40.7870375855268,40.7869125711392,40.786595020127,40.7865485806622,40.7865104314209,40.7864115502316,40.7860200748652,40.7858653801727,40.7856171500132,40.7851931260554,40.7849582359268,40.7845637555659,40.7842449057949,40.7839731785782,40.7837527983547,40.7832475726415,40.7832178738028,40.7829643580463,40.7829155196513,40.7828877273326,40.782859089475]}]],[[{"lng":[-73.949233270825,-73.9494228781563,-73.9496868299651,-73.9501582122699,-73.9506288547574,-73.9511110237241,-73.9516026543104,-73.9520712707866,-73.9525222263876,-73.9529774055357,-73.9530982760681,-73.9531604499487,-73.9534368386116,-73.9538891708097,-73.9538948958825,-73.954399191913,-73.9548172381665,-73.9551041694841,-73.9552823348086,-73.9557773591232,-73.9562613091965,-73.9567186299825,-73.9571624332454,-73.9576359938983,-73.9581035344421,-73.9585681001153,-73.9590117668133,-73.9594690599152,-73.9599209422009,-73.9604143058784,-73.9609101613834,-73.9613687269495,-73.9618383683974,-73.9623036147985,-73.9627671549355,-73.9631345980356,-73.9632299191105,-73.9637260260806,-73.963761238512,-73.9642282017404,-73.9646873584175,-73.9651474537478,-73.9656096862152,-73.9660744904101,-73.966536169471,-73.9670394751384,-73.9675339844437,-73.9679932771091,-73.9684415586728,-73.9689045471034,-73.9693648454656,-73.9695160517743,-73.9698245528782,-73.9702816550227,-73.9707277741458,-73.9711852091349,-73.9716477426822,-73.9720985244436,-73.9725535229576,-73.9730148717612,-73.9736358469904,-73.9741922902141,-73.9762338879695,-73.9783611297531,-73.9790765877813,-73.9814912149279,-73.981467972046,-73.9814499379241,-73.9814373030395,-73.9814302008462,-73.9814287062246,-73.9814328351072,-73.9814425438969,-73.9814577300632,-73.9814820383939,-73.9815120000456,-73.9815472180972,-73.9815872266128,-73.9816314948657,-73.981679436394,-73.9810229005033,-73.9805637066685,-73.9801118156174,-73.9796523340224,-73.9791921451197,-73.9787224679214,-73.9782822010231,-73.9778263936496,-73.9773708499307,-73.9769116822629,-73.9764577739989,-73.9759551729502,-73.9754593243374,-73.9750011189794,-73.9747542408034,-73.9745323148841,-73.9742929486252,-73.9740666825764,-73.9735711742329,-73.9717230555584,-73.9712229222095,-73.9707601311674,-73.9703006816215,-73.9698322562294,-73.9693357331895,-73.9691095043752,-73.9690860867996,-73.9688503681786,-73.9683847931366,-73.9679269635447,-73.9674490837313,-73.967009770734,-73.9665522667892,-73.9660950057244,-73.9656279953866,-73.9651770549901,-73.9646854073948,-73.9641759852132,-73.9638060104351,-73.9637110065635,-73.9632183274493,-73.9630793102664,-73.9629757948463,-73.9628214973773,-73.9623598015067,-73.9618998546095,-73.9614406065574,-73.9609797180793,-73.9607478509035,-73.9605227166957,-73.9600301850322,-73.959536588682,-73.9590766907229,-73.958618792567,-73.9583330495665,-73.9581729710387,-73.9578649929525,-73.9553665162024,-73.9553036398665,-73.9552576358306,-73.9552229647798,-73.9527672697835,-73.9525318675435,-73.9524609278529,-73.9523741906278,-73.9509422828337,-73.9497477308443,-73.949233270825],"lat":[40.7968719999055,40.7966063841608,40.7962169853809,40.7955877315044,40.7949595913764,40.7942850353219,40.7936078056141,40.7929811719834,40.7923476222252,40.7917196931681,40.7915527529126,40.7914668813839,40.7910851413718,40.7904704985544,40.7904626909915,40.7897749086677,40.7892047443701,40.7888220717528,40.7885844554883,40.7879139244711,40.7872228762799,40.7866007938244,40.7859796382595,40.7853434578213,40.7847130047313,40.7840834440397,40.7834612846351,40.7828333216645,40.7822129435021,40.7815242678047,40.7808570355244,40.7802297490476,40.7795841921961,40.7789470412049,40.7783130408885,40.7778080512782,40.7776770473619,40.7770057178997,40.7769509699349,40.7763103091826,40.7756770817154,40.7750442320898,40.7744072014455,40.7737729891002,40.77314036859,40.7724612188163,40.771776183984,40.7711472309525,40.7705163268729,40.7699008317911,40.769270656823,40.7690652004245,40.7686460088209,40.7680250324297,40.7673937229188,40.7667702901723,40.7661424684726,40.7655172512275,40.7648977317234,40.7642788794452,40.7645699137759,40.7648065283319,40.7656746314446,40.7665737113197,40.766876086135,40.767881199101,40.7679188753653,40.7679581663392,40.7679986570501,40.768039919853,40.7680815189263,40.7681230149501,40.7681639696596,40.7682039505063,40.7682424205412,40.7682785120951,40.7683117470297,40.7683416844789,40.7683679283408,40.7683901309362,40.7692728335597,40.769905324566,40.7705283686784,40.7711553275426,40.7717812660014,40.7724188982852,40.7730318787382,40.7736561919219,40.7742810072139,40.774909124027,40.775532537252,40.7762197546262,40.7768987227267,40.7775277799166,40.7778646924296,40.7781677850257,40.7784979889537,40.7788054167216,40.7794778616212,40.7820214764623,40.7827062555875,40.7833401370511,40.7839754134459,40.7846109105864,40.7852932795571,40.7856032806995,40.7856396959121,40.7859740529881,40.786595696524,40.7872215711261,40.7878607210931,40.7884767907422,40.7891071528256,40.7897343897667,40.7903661171291,40.7909903410994,40.7916640267989,40.7923620450278,40.7928799013058,40.7930090280449,40.7936785732783,40.7938678763279,40.7940161814964,40.7942372356913,40.7948520605607,40.7954792700612,40.796110827184,40.7967386440453,40.7970559756554,40.7973684689598,40.7980381078972,40.7987185255206,40.7993522339277,40.7999770261545,40.8003650535111,40.8005825409548,40.8005152724391,40.7994664264164,40.7994405006974,40.7994211988942,40.7994066466177,40.7983720915692,40.7982697426927,40.7982424940104,40.7982097712479,40.7976031176705,40.7970970016013,40.7968719999055]}]],[[{"lng":[-73.9401413121009,-73.9396256993014,-73.93966773022,-73.9397061205912,-73.9397399122403,-73.9397682615681,-73.9397904612159,-73.9398059571174,-73.9398074739128,-73.9398059136575,-73.9398012960173,-73.939793679653,-73.9397575536381,-73.9397274631895,-73.9397036051036,-73.9396861354115,-73.9396751683588,-73.9396707756499,-73.9396729859966,-73.9396817849236,-73.9396971148626,-73.9397188755294,-73.9398949532679,-73.9402010365408,-73.9415361978508,-73.9424433497653,-73.9438427568083,-73.9429236691258,-73.9432358197176,-73.9435059452953,-73.9440498636813,-73.9446036460381,-73.9451600489582,-73.9460782874042,-73.9464028991384,-73.9467183203377,-73.9470362320686,-73.9473495397973,-73.947666413187,-73.9480073293346,-73.9483560158538,-73.9486768180755,-73.9488393948718,-73.949018597281,-73.9492141043905,-73.9494255284926,-73.9496367491157,-73.9496368844227,-73.9496370210479,-73.9498621898559,-73.9503501927523,-73.9509286573892,-73.9509820339399,-73.9515053733073,-73.9521012521537,-73.9525912577644,-73.9530786999544,-73.9532765494936,-73.9535757781037,-73.9549665717247,-73.9554297485646,-73.9558841761641,-73.9563449367975,-73.9568054387732,-73.9572658155452,-73.9577217601593,-73.9581896226123,-73.9582272503924,-73.9582564604776,-73.9582770255324,-73.9582887854434,-73.9582916487569,-73.9582855932167,-73.9582548258013,-73.9582427245238,-73.9582347744944,-73.9582030080716,-73.9582487832981,-73.9586883936751,-73.9591474113735,-73.9596468542315,-73.9610779400213,-73.9638612629117,-73.9643427774881,-73.9654264056685,-73.9655649870462,-73.9660350151679,-73.9661749517758,-73.9665975037666,-73.9667010682416,-73.9668032725715,-73.9680484926094,-73.9684950672613,-73.9685591341792,-73.9686070740611,-73.9697872200334,-73.9706932647336,-73.9707636230071,-73.9708414835481,-73.9709876800351,-73.971107658523,-73.970465121444,-73.9702140079922,-73.969882906147,-73.9697728894336,-73.9695593479735,-73.9691117356584,-73.9690910324439,-73.9689167848403,-73.9688521864532,-73.9686626476494,-73.9685574777122,-73.9685442063378,-73.9684634861166,-73.9684247350704,-73.9682395273212,-73.9681533751206,-73.9681167501867,-73.9681318659272,-73.9679606531177,-73.9678831249756,-73.9678809917402,-73.9677948483447,-73.9677216009522,-73.967704390523,-73.967667789409,-73.9676203882461,-73.9676204142262,-73.9675439727051,-73.9674018531237,-73.9671304875859,-73.9670411118029,-73.9670023214405,-73.9669226550844,-73.9668817501495,-73.9667493078798,-73.9666330076011,-73.9665296232187,-73.9663917772088,-73.9662776271681,-73.9661580922395,-73.9661063953949,-73.9658824094512,-73.9657919497465,-73.9656584016126,-73.9654897501296,-73.9654893242488,-73.965347065517,-73.9651078426746,-73.9650951190635,-73.9643248339137,-73.964140828883,-73.9634039510231,-73.9631270240379,-73.963085296941,-73.9627191339208,-73.9620310579599,-73.9618791703533,-73.9613183318057,-73.9609488984397,-73.9604472849203,-73.9599989222935,-73.9598146267456,-73.9593906879793,-73.9593256626521,-73.9592830064729,-73.9591306158063,-73.9592076770925,-73.9592625540374,-73.9593026359868,-73.9594262434965,-73.9591468571519,-73.9590329415577,-73.95923467194,-73.9591771279426,-73.9590896024009,-73.95881892234,-73.9589417294171,-73.958854039854,-73.958745236605,-73.9589636009464,-73.9590001828989,-73.9591130402411,-73.9592297621347,-73.959909994444,-73.9596033246028,-73.958926147183,-73.9590495333171,-73.9589172176045,-73.9588674543331,-73.9588384986324,-73.9586512601192,-73.9586458514766,-73.9585273152426,-73.9582001935401,-73.9581680536359,-73.9581306330556,-73.9580746794387,-73.9579390490912,-73.9582283818304,-73.958206395391,-73.958143127692,-73.9591645863233,-73.9591819603764,-73.9594384674442,-73.9594645418917,-73.9594826976696,-73.9594974741095,-73.9595036116449,-73.9595089793919,-73.9595310141184,-73.959538002253,-73.9595428443909,-73.9595447255249,-73.9595452218032,-73.9595335110508,-73.9595557549386,-73.9591403826995,-73.959016129419,-73.9589958280338,-73.9574370851175,-73.9572589697715,-73.9569486642047,-73.9563178451031,-73.9562005452838,-73.9562037377957,-73.9562239436024,-73.955039129784,-73.954697366195,-73.9545418806213,-73.9544646997723,-73.954464580347,-73.9544412004407,-73.9543606801021,-73.9542722090605,-73.9542165362576,-73.954169506442,-73.9541364913583,-73.9540611180425,-73.9540327171764,-73.9540210667868,-73.9539861491178,-73.9539540640746,-73.9535912862679,-73.9529761936262,-73.9521859729655,-73.9519140405714,-73.9518089234596,-73.9516565636901,-73.9515529347538,-73.9513174203759,-73.9511918301221,-73.951147921668,-73.9510522457128,-73.9510410955593,-73.9510083856706,-73.9509530708301,-73.950865127052,-73.9508073499324,-73.9507269874008,-73.9506817724416,-73.9505687424802,-73.9505134612838,-73.9504833022592,-73.950448097408,-73.9504179493977,-73.9503400935556,-73.9502848174077,-73.9502121856002,-73.9499624395775,-73.9498559048211,-73.9497761628448,-73.9497080785182,-73.9496411981455,-73.9495743178091,-73.949551752833,-73.9494157055686,-73.9491944889159,-73.9489054328625,-73.9482259724,-73.9459255816204,-73.9458239515278,-73.9457193369865,-73.9429796619917,-73.9413679958142,-73.9410754698064,-73.9403464331369,-73.9401413121009],"lat":[40.8303719888808,40.830155837388,40.8301408088839,40.8301209399942,40.8300967266229,40.8300687730826,40.8300377771075,40.8300045123177,40.8299837956854,40.8299630809152,40.8299426303878,40.8299227040787,40.8298670822961,40.829809425007,40.8297501093298,40.8296895232286,40.8296280629762,40.8295661306538,40.8295041312445,40.8294424702619,40.8293815510044,40.8293217719184,40.829073508872,40.8286533023111,40.8268202536772,40.8255725938732,40.8236478015425,40.8232605872505,40.8229213350338,40.8226277527772,40.8220515921051,40.8214619811882,40.8208790434763,40.8212632155597,40.8205720426877,40.8198942680339,40.8192083715056,40.818534997721,40.8178555099919,40.8171165088996,40.8163743056192,40.8156922860175,40.8153568260673,40.8150257543226,40.8146997709849,40.8143795835932,40.8140866660151,40.8140864784467,40.8140862972449,40.8137999804368,40.8131593892901,40.8125750715315,40.8125216292872,40.8120076851397,40.8114428535016,40.8107653330668,40.8100940849071,40.809879604283,40.8094766976597,40.8100645547038,40.8094291534067,40.8088022490491,40.8081733540405,40.8075457092798,40.806916171387,40.8062909886274,40.8056088036908,40.8055374971112,40.8054639479951,40.8053887288287,40.8053124249316,40.8052356303971,40.805158942967,40.8047138784415,40.8045224810712,40.8043967319451,40.8038942709989,40.8031064864712,40.802469794366,40.8018437601372,40.8011564232565,40.8018003577204,40.8029720383534,40.8031745614049,40.8036303177756,40.8036886012456,40.8038864986314,40.8039455048015,40.8041236771614,40.804168476937,40.804207561121,40.8046837001335,40.8048322703844,40.8048535841203,40.8048709498982,40.8053004973846,40.8056302684492,40.8056573728797,40.8056853437599,40.8057429029292,40.8057901396768,40.8066243176124,40.8069357061534,40.8073647884813,40.8075252821412,40.807795500999,40.808406370069,40.8084301645759,40.8086307805598,40.8087519861146,40.8089632926782,40.8090728938211,40.8091451098902,40.80931871402,40.809394060333,40.809662684397,40.8097658814087,40.8098068362405,40.809844489225,40.8101000095667,40.8102015646796,40.8102441473245,40.8103669968715,40.8104341611109,40.8104881998844,40.8105504459429,40.8105848503944,40.8106307010374,40.8107731997242,40.8110221553972,40.8113874200739,40.8115200996269,40.8115479480297,40.8116904465337,40.8117739764283,40.8119819850119,40.8121539702855,40.8122850155248,40.8124733731619,40.8126388120003,40.8128157027913,40.8128632069363,40.8132006263486,40.8133283817001,40.8134987314925,40.8137470723679,40.8137476942588,40.8139396518968,40.8142754760298,40.8143195721566,40.8155127370107,40.8157716574539,40.8166841974377,40.8169550953364,40.8170061134332,40.8173684907574,40.8180863309792,40.8182585640901,40.8188945235574,40.8193112888728,40.819877156791,40.8203829448023,40.8202978747014,40.8208551783559,40.8209462762535,40.8209949744137,40.8211689537748,40.8212079093495,40.8212356553586,40.8211898975231,40.821252381738,40.821571328551,40.8215137462285,40.8212778252705,40.8212494299851,40.821206247056,40.8215185248468,40.8215693640096,40.8216747502473,40.8218055119737,40.8223737941422,40.8224097283744,40.8224549646456,40.8222869101324,40.822571119822,40.8229946867834,40.8227117554414,40.8225413353683,40.8224860513715,40.8224502392281,40.8224050420779,40.8219184365734,40.8219043696318,40.8218437566522,40.8222831369181,40.8224581009913,40.8225310909584,40.8226113584649,40.8227743535473,40.8228878671009,40.8229221319123,40.8230207222715,40.8234517954834,40.8234591229456,40.823562392293,40.8235711356718,40.8235786526657,40.8235868162859,40.8235911857978,40.8235957889028,40.8236191821806,40.8236293340874,40.8236391684525,40.8236449418293,40.8236473375997,40.8236850183973,40.8236937977688,40.8243175902052,40.8245041884993,40.8244964274251,40.8268485479497,40.8271173098731,40.827000553935,40.8279442153886,40.8279012265975,40.8278969860999,40.8278700873914,40.8274134319119,40.8279183855142,40.8278614763655,40.8279741696988,40.82797433215,40.8280066352987,40.8281178830152,40.8282365431425,40.8283074708555,40.8283608692402,40.8283934095627,40.8284621324515,40.8284904234907,40.8285029803045,40.8285435162517,40.8285853581641,40.8290977206488,40.8300902032711,40.8312771179192,40.8316197174183,40.831824320518,40.8319769945715,40.8321341999871,40.832479572948,40.8326391512799,40.8327835929616,40.8329224381364,40.8330224885963,40.8331406499581,40.8332835798298,40.8334341206276,40.8335141493259,40.8335922635999,40.8336513313083,40.8337885185296,40.8338857037694,40.8339447790291,40.8340419716803,40.8340857983956,40.83416772531,40.8342572855851,40.8343031199584,40.8344370306769,40.8344592868663,40.8344559645116,40.8344492900065,40.8344343300863,40.8344193619186,40.8344107166949,40.8343585898328,40.8342106585955,40.8340652988768,40.8338493081219,40.8328064897023,40.8327654612874,40.832721413266,40.8315679803621,40.8308908380831,40.8307668513735,40.8304578428499,40.8303719888808]}]],[[{"lng":[-73.9344523939737,-73.9344669791022,-73.9344537723424,-73.9344487756432,-73.9344663722597,-73.9345027734122,-73.9345256263579,-73.9345466975778,-73.9345705455849,-73.9345642918786,-73.9345561913577,-73.9345455079479,-73.9345505539768,-73.9345631232394,-73.9346088164462,-73.9346334112486,-73.9346522438861,-73.9346510058626,-73.9346416390713,-73.9346736361382,-73.9346751091449,-73.9347075726068,-73.9347339324972,-73.9347527825099,-73.9347565729576,-73.9347804623171,-73.9347742431493,-73.9347730086192,-73.9347868403004,-73.934820729846,-73.9348481357196,-73.9348698506781,-73.9348946004199,-73.9349153357865,-73.9349362082846,-73.9349422585534,-73.9349585956692,-73.9349794120863,-73.9349883314069,-73.9349508717846,-73.9349577598409,-73.9349652301556,-73.9349662416419,-73.9349731606118,-73.9349721907353,-73.9349938973666,-73.9350306032399,-73.9350361242771,-73.935031241186,-73.9350421249086,-73.935076445029,-73.9350695809819,-73.9350834136337,-73.9350968747191,-73.9350969046914,-73.9351038425559,-73.9351124510008,-73.9351174304804,-73.9351204170423,-73.9351322584874,-73.9351263604187,-73.9351293550089,-73.9351244355286,-73.9351382681903,-73.9351372912785,-73.9351304030063,-73.9351215497367,-73.9351235294981,-73.9351156589231,-73.9351324360264,-73.9351393584774,-73.9351275237941,-73.9351246598458,-73.9351217185335,-73.9351158094604,-73.935111878823,-73.9351197936552,-73.9351178302057,-73.9351237677008,-73.9351208554731,-73.9351317051837,-73.935144551144,-73.9351672529464,-73.9351648084094,-73.9351565917338,-73.9351287813163,-73.9351139834151,-73.9350778924617,-73.9350956518488,-73.9350878372859,-73.9350682497411,-73.9350227546552,-73.9349850562145,-73.93493515655,-73.9348935333238,-73.9348308720848,-73.9347988190573,-73.9348008067693,-73.9347899627879,-73.934792938279,-73.9347811108582,-73.9347702822969,-73.9347594429443,-73.9347634328832,-73.9347437259128,-73.9347393083095,-73.9347491949278,-73.9347373734992,-73.9347226012782,-73.9347255769993,-73.9347147602576,-73.9347010025242,-73.9346941270737,-73.9347128856067,-73.9347050490228,-73.9346932166962,-73.9346759710182,-73.9346622898783,-73.9346830270246,-73.9347076940248,-73.9347008078072,-73.9346810792481,-73.934677148802,-73.9346702522203,-73.9346544761815,-73.9346495924325,-73.9346619319835,-73.9346629522556,-73.9346649597136,-73.9346561102258,-73.9346551553651,-73.9346364185213,-73.934616403439,-73.9346117126479,-73.9346026032382,-73.9346088357669,-73.9346105250687,-73.9346080499331,-73.9346006584532,-73.9345987364063,-73.9346019211835,-73.934611595532,-73.9346091744548,-73.9346101771651,-73.93461219001,-73.9346043348989,-73.9346073136309,-73.9346004318559,-73.9346083455533,-73.9345975056548,-73.9346004848812,-73.9345936004084,-73.934586741478,-73.9345956291445,-73.9345867621054,-73.9345917047489,-73.9345976397154,-73.9345887726725,-73.9345868424075,-73.9345651301025,-73.9345581017987,-73.9345458626602,-73.9345423063814,-73.9345325888057,-73.9345217563805,-73.9345389813406,-73.9345318309277,-73.9345207652812,-73.9345159067242,-73.9344239633905,-73.9344829105876,-73.9344642654949,-73.9344284440052,-73.9343671795538,-73.9343564345215,-73.9343257428912,-73.9342953073278,-73.9342937167056,-73.9342728544085,-73.9342464289509,-73.934218348033,-73.9341659453066,-73.9341465766699,-73.9341460438214,-73.9341337362534,-73.9341212616502,-73.9341175261266,-73.9341023336635,-73.9340998673827,-73.9340984379996,-73.9340911251737,-73.9340794472348,-73.9340743435485,-73.9340773409516,-73.934070055227,-73.9340444747647,-73.9340459977903,-73.9340356044318,-73.9340266233459,-73.9340038961569,-73.9340006920745,-73.9339829570548,-73.9339866464062,-73.9339724153109,-73.9338300916368,-73.9338307684021,-73.9338300069596,-73.933827774217,-73.9338261413771,-73.9338001947305,-73.9339200430821,-73.9340091796638,-73.9340746397773,-73.9341281676116,-73.9342351954951,-73.9344540007277,-73.9346379027272,-73.9348734383498,-73.9357554821078,-73.9359937141727,-73.9360507657812,-73.936135543971,-73.9362095781427,-73.9366885488281,-73.9370816369499,-73.9371439842421,-73.937617149518,-73.9381355240751,-73.9382064268832,-73.9383092504302,-73.9383874852984,-73.9386375332666,-73.9387439450372,-73.939017533146,-73.9394939753992,-73.9399487597705,-73.940403449022,-73.940860631756,-73.9413174236948,-73.9417714017003,-73.94226311155,-73.9427536722819,-73.9428555022079,-73.943157703856,-73.9437747678022,-73.9443019458712,-73.9447820817178,-73.9452396521392,-73.9456926125162,-73.9461313104867,-73.9456183646418,-73.9447092611273,-73.9445991529627,-73.9447597648013,-73.9450512798452,-73.945508639182,-73.9459678974937,-73.9464613385203,-73.9469736680703,-73.9472801829742,-73.9473277151459,-73.9473759984473,-73.9474199623519,-73.9477105597932,-73.9477571646885,-73.9478166305282,-73.9478467911888,-73.9480513020299,-73.9481010902656,-73.9481538432484,-73.9482064153801,-73.9483112545438,-73.9487870281116,-73.9490651785891,-73.949233270825,-73.9497477308443,-73.9509422828337,-73.9523741906278,-73.9524609278529,-73.9525318675435,-73.9527672697835,-73.9552229647798,-73.9552576358306,-73.9553036398665,-73.9553665162024,-73.9578649929525,-73.9581729710387,-73.9584811140998,-73.9588338138987,-73.9596468542315,-73.9591474113735,-73.9586883936751,-73.9582487832981,-73.9582030080716,-73.9582347744944,-73.9582427245238,-73.9582548258013,-73.9582855932167,-73.9582916487569,-73.9582887854434,-73.9582770255324,-73.9582564604776,-73.9582272503924,-73.9581896226123,-73.9577217601593,-73.9572658155452,-73.9568054387732,-73.9563449367975,-73.9558841761641,-73.9554297485646,-73.9549665717247,-73.9535757781037,-73.9532765494936,-73.9530786999544,-73.9525912577644,-73.9521012521537,-73.9515053733073,-73.9509820339399,-73.9509286573892,-73.9503501927523,-73.9498621898559,-73.9496370210479,-73.9496368844227,-73.9496367491157,-73.9494255284926,-73.9492141043905,-73.949018597281,-73.9488393948718,-73.9486768180755,-73.9483560158538,-73.9480073293346,-73.947666413187,-73.9473495397973,-73.9470362320686,-73.9467183203377,-73.9464028991384,-73.9460782874042,-73.9451600489582,-73.9446036460381,-73.9440498636813,-73.9435059452953,-73.9432358197176,-73.9429236691258,-73.9438427568083,-73.9424433497653,-73.9415361978508,-73.9402010365408,-73.9398949532679,-73.9397188755294,-73.9396971148626,-73.9396817849236,-73.9396729859966,-73.9396707756499,-73.9396751683588,-73.9396861354115,-73.9397036051036,-73.9397274631895,-73.9397575536381,-73.939793679653,-73.9398012960173,-73.9398059136575,-73.9398074739128,-73.9398059571174,-73.9397904612159,-73.9397682615681,-73.9397399122403,-73.9397061205912,-73.93966773022,-73.9396256993014,-73.9401413121009,-73.940069476676,-73.9399974438304,-73.9399643288933,-73.9399265257122,-73.9398841279558,-73.9398372408485,-73.9397859804583,-73.9397304738065,-73.9396552820282,-73.9395851155046,-73.9395202047197,-73.9394607628966,-73.939406985297,-73.9393590486393,-73.9393171103521,-73.9392813082096,-73.9392517598325,-73.9392285623012,-73.9389485978898,-73.9387736026166,-73.9385805006181,-73.9384874320206,-73.938390956886,-73.9382911469799,-73.9381880763366,-73.938081821838,-73.9379724625285,-73.9372953333144,-73.9370064164481,-73.936603647337,-73.9357262433215,-73.9353078807002,-73.9350633634262,-73.9349627411069,-73.9348574034224,-73.9347988641014,-73.9347456942292,-73.9346739306833,-73.9346351059628,-73.9344523939737],"lat":[40.8359809601499,40.8359577569972,40.8359352630948,40.8359114345038,40.8358819009942,40.8358695321068,40.8358644650877,40.8358638397868,40.8358562284681,40.8358352581315,40.835815845054,40.8357971272419,40.8357694925149,40.8357485321879,40.8357321310449,40.8357285593052,40.8357171332879,40.8357009316848,40.8356799193823,40.8356561512936,40.835626677302,40.8355980370351,40.8355875676387,40.8355599407126,40.8355323052652,40.8354837143951,40.8354274826505,40.8354074680382,40.835377932348,40.8353674683613,40.8353514322074,40.8353327151311,40.8352540431224,40.8352308219388,40.8350802176516,40.8350268754173,40.8348827790447,40.8347891214536,40.8347486578937,40.8347066733677,40.8346827603634,40.8346568479537,40.8346291231457,40.8346216350416,40.8346081447976,40.8345976661831,40.8343923653413,40.8342983203434,40.8342488628495,40.8342113992345,40.8339240432871,40.8338873180048,40.8338655969297,40.8337153567923,40.8336846319099,40.8336576569179,40.8334257390735,40.833377034784,40.8333538035701,40.833344822905,40.8333260803563,40.83329460948,40.8332811181852,40.8332601442583,40.8332414131886,40.8332286672735,40.8332016927766,40.8331896995089,40.8331762053808,40.8331627256204,40.8331514910004,40.8331424888092,40.8330510690293,40.8330285903476,40.8330218421729,40.8330031007293,40.8329836281742,40.8329671390245,40.8329454129968,40.8329041962711,40.8329026976737,40.8328847220365,40.8328749922759,40.8328528832643,40.8326824062373,40.8323635344769,40.8323657768372,40.8319416236114,40.8319423812671,40.8318591983501,40.8317040676258,40.8313199995499,40.831027353358,40.8306024452159,40.8302865638378,40.8298084370518,40.8297923091497,40.829772833255,40.8297683240768,40.8297563407522,40.8297405931673,40.8297203616943,40.8297001210002,40.8296574039486,40.8296371681202,40.8296090614466,40.8295970813634,40.8295745894253,40.8295506004956,40.8295273692709,40.8294951440797,40.8294404308,40.8294164557186,40.8294007259447,40.8293407746905,40.8293287736013,40.8293134022105,40.829180759946,40.8291657878361,40.8291583097922,40.8291320741339,40.8291335582814,40.8291163285479,40.8291125704264,40.8290975769611,40.829048119407,40.8290387602945,40.8290140338141,40.8289735668265,40.8289428363862,40.8289128585811,40.8289068601491,40.8286936557933,40.8286898352595,40.8286824012378,40.8286611886821,40.8286554361922,40.8286533630182,40.8286471822131,40.828600724009,40.8285925492987,40.8285677551862,40.8285216749682,40.8285029362902,40.8284572291491,40.8284280027947,40.8284010255637,40.8283822824144,40.828363557539,40.8283448203536,40.8283283339851,40.8283013511601,40.8282593849925,40.8282511498574,40.8282384027765,40.8282271675599,40.8282084316785,40.8281956939791,40.8281567195714,40.8281627044494,40.8281174027778,40.8280481614642,40.8280268703131,40.8279685583618,40.8279078000914,40.8279034726707,40.8278494020435,40.827765689651,40.8277289307585,40.8270428939722,40.8270370927788,40.8268422051935,40.8264678505915,40.8258275981585,40.8258209371444,40.8252325902945,40.8246492312228,40.8244963869173,40.8244389527514,40.8241668830372,40.8237990457902,40.823078580871,40.8230290320505,40.8230206191804,40.8228006559768,40.8226472532443,40.8225243326885,40.8222012169168,40.8221399123411,40.8221042273439,40.8219960379902,40.8218055757963,40.8217170991103,40.8216945617701,40.8215593209342,40.8211767035744,40.8211338770228,40.8209525472825,40.8208168097529,40.8203978401842,40.8203381971747,40.8199999202018,40.8199680347252,40.8197295747657,40.8197197434297,40.8195966579799,40.8194910950851,40.8194154949189,40.8193564297504,40.818349758874,40.8181159933882,40.8179438380677,40.8178265139486,40.8177339630165,40.8175548812153,40.8171885285585,40.8169080484752,40.8165278475177,40.8153255842971,40.8149886935705,40.8149080151166,40.8147881271423,40.8146738499206,40.8140416302207,40.8135061410526,40.8134210414446,40.8127403643289,40.8120656192324,40.811967604798,40.8118254640113,40.8117184435789,40.8113763885697,40.8112308205668,40.8108565568745,40.8102088095336,40.8095814180327,40.8089580956456,40.8083342675993,40.8077133463811,40.8070890003497,40.8064157377451,40.8057440127946,40.8057865544534,40.8059128052393,40.8061705933247,40.8063908245811,40.805761256464,40.8051360144618,40.8045149486583,40.8038773575842,40.8036589775521,40.8032719273995,40.8032250478403,40.8030030414928,40.8025985987175,40.8019702312397,40.8013423951725,40.8006653058823,40.7999617029103,40.7995417892866,40.7994766714787,40.799410524218,40.7993502952957,40.7989521806135,40.7988883320409,40.798806862972,40.7987655427009,40.7984853598543,40.7984171483815,40.7983448765784,40.7982728510984,40.7981292175668,40.7974828390052,40.7971004941062,40.7968719999055,40.7970970016013,40.7976031176705,40.7982097712479,40.7982424940104,40.7982697426927,40.7983720915692,40.7994066466177,40.7994211988942,40.7994405006974,40.7994664264164,40.8005152724391,40.8005825409548,40.8006704780884,40.8008175046001,40.8011564232565,40.8018437601372,40.802469794366,40.8031064864712,40.8038942709989,40.8043967319451,40.8045224810712,40.8047138784415,40.805158942967,40.8052356303971,40.8053124249316,40.8053887288287,40.8054639479951,40.8055374971112,40.8056088036908,40.8062909886274,40.806916171387,40.8075457092798,40.8081733540405,40.8088022490491,40.8094291534067,40.8100645547038,40.8094766976597,40.809879604283,40.8100940849071,40.8107653330668,40.8114428535016,40.8120076851397,40.8125216292872,40.8125750715315,40.8131593892901,40.8137999804368,40.8140862972449,40.8140864784467,40.8140866660151,40.8143795835932,40.8146997709849,40.8150257543226,40.8153568260673,40.8156922860175,40.8163743056192,40.8171165088996,40.8178555099919,40.818534997721,40.8192083715056,40.8198942680339,40.8205720426877,40.8212632155597,40.8208790434763,40.8214619811882,40.8220515921051,40.8226277527772,40.8229213350338,40.8232605872505,40.8236478015425,40.8255725938732,40.8268202536772,40.8286533023111,40.829073508872,40.8293217719184,40.8293815510044,40.8294424702619,40.8295041312445,40.8295661306538,40.8296280629762,40.8296895232286,40.8297501093298,40.829809425007,40.8298670822961,40.8299227040787,40.8299426303878,40.8299630809152,40.8299837956854,40.8300045123177,40.8300377771075,40.8300687730826,40.8300967266229,40.8301209399942,40.8301408088839,40.830155837388,40.8303719888808,40.8304899742724,40.8307346363336,40.8308068175587,40.830877657591,40.8309469808753,40.8310146147957,40.8310803925658,40.8311441511741,40.8312091424794,40.8312772989227,40.8313483966379,40.8314222020974,40.831498472879,40.8315769586316,40.8316574013863,40.8317395369171,40.8318230954371,40.831907802484,40.8324173363284,40.8326632126625,40.8328986755061,40.8329945036773,40.8330883682452,40.8331801993726,40.8332699288509,40.8333574897971,40.8334428170631,40.8339759182039,40.834193110683,40.834513016174,40.8351563465998,40.8354777249337,40.83567765881,40.8357599347499,40.8359850255776,40.8361101162622,40.8360920946286,40.8360649032392,40.8360501920772,40.8359809601499]}]],[[{"lng":[-73.8684051894918,-73.8686845430455,-73.8685947803896,-73.8680588528607,-73.8679768804403,-73.8679094844676,-73.8677683216845,-73.8676234034652,-73.8675274988967,-73.8674569407755,-73.8672805740703,-73.8670180292609,-73.8668705856634,-73.8665984828325,-73.8665979084489,-73.8665040782449,-73.8663149694295,-73.866302638535,-73.8662900301626,-73.8660199322073,-73.8649940445724,-73.8645649429913,-73.8641009667913,-73.8639900878039,-73.863786744035,-73.8633494352703,-73.8633096418202,-73.8632829703043,-73.8628674241378,-73.8623458053523,-73.8622594308922,-73.8620284308973,-73.8617123871756,-73.8613977586668,-73.8613186364857,-73.861143960365,-73.8610719249902,-73.8607751279137,-73.8603851992073,-73.8594741645808,-73.8585547003992,-73.8576332310836,-73.8573094773904,-73.8572848668308,-73.8572674460264,-73.857246757818,-73.8572269369615,-73.8568467616235,-73.8567050909425,-73.8566799570509,-73.8564631194297,-73.8561880966006,-73.8561174022973,-73.8556846115504,-73.8561171020898,-73.8565907511986,-73.8575356334515,-73.858429508573,-73.8581177926926,-73.8580250429809,-73.8579364091196,-73.8576153725158,-73.8585143639364,-73.8593869184695,-73.8603049456405,-73.861188754815,-73.8617475902521,-73.8631708327441,-73.8626977829953,-73.8630020220129,-73.8630099421013,-73.8630153216374,-73.8630180308236,-73.8630180042936,-73.863015242689,-73.8630098126441,-73.863001845178,-73.8630129753606,-73.8630026713913,-73.862994891143,-73.8629897550625,-73.8629945183242,-73.8630032158504,-73.8630156273031,-73.86303143826,-73.8630502481797,-73.8630715805491,-73.8630777580685,-73.8630848545675,-73.8630926834548,-73.8631010388821,-73.8631097011566,-73.8631184425171,-73.8631234318754,-73.8631277753476,-73.8631313611032,-73.8631340968203,-73.8631359120629,-73.8631367600946,-73.8631366190814,-73.8631354926541,-73.8631334098149,-73.8631304241904,-73.8631266126511,-73.8631220733322,-73.8631208631444,-73.863120965205,-73.863122376788,-73.8631250601965,-73.8631289437694,-73.863133923795,-73.8631398672809,-73.8631466155051,-73.8631539882555,-73.8631581097421,-73.8632186820399,-73.8632160622111,-73.8632143949638,-73.8632137298295,-73.8632140865682,-73.8632154545815,-73.8632177932273,-73.8632210330276,-73.8632250777323,-73.8632298071785,-73.8632350808609,-73.8632407421057,-73.8632466227252,-73.8632605695935,-73.863270517155,-73.8632762306861,-73.8632498848914,-73.8632176741554,-73.8631800080592,-73.8631373655485,-73.8630902888434,-73.8630393765439,-73.8630017171527,-73.863031173415,-73.8630382008606,-73.8630441941585,-73.863048995318,-73.8630524777747,-73.8630545497269,-73.863055156556,-73.8630542822654,-73.8630519499031,-73.8630482209535,-73.8630431937166,-73.8630370007169,-73.8630298052097,-73.8630130787,-73.8629999260079,-73.862990578352,-73.8629939813938,-73.8629992094927,-73.8630061181126,-73.8630145162579,-73.863024171754,-73.8630348176659,-73.8630461596779,-73.8630578842299,-73.8630696671866,-73.8631237892544,-73.8631305962589,-73.8631384969758,-73.8631472572018,-73.8631566172549,-73.8631662996722,-73.8631760174347,-73.8631848795857,-73.8631920617609,-73.8631973868762,-73.8632007236354,-73.8632019897679,-73.8632011540567,-73.8631982371082,-73.8631933108438,-73.8631864967268,-73.8631226425887,-73.8630513221345,-73.8629727346688,-73.8628870997973,-73.862794656813,-73.8626956640271,-73.8626411734317,-73.8617335554759,-73.8615829711944,-73.861432942853,-73.8612837693698,-73.8611357479592,-73.8609891735391,-73.86086853825,-73.8606132315635,-73.8605783620238,-73.862415662489,-73.8630437576723,-73.8657814362307,-73.865781613718,-73.8665377371266,-73.8669524199474,-73.8670922526893,-73.8672402628091,-73.8673016789663,-73.8675581768578,-73.8679313096204,-73.8683003031427,-73.8684816771708,-73.8688236145514,-73.8688921986943,-73.8691753364724,-73.8693844004147,-73.8696177059267,-73.8699327052746,-73.8701856522754,-73.8711645285202,-73.8713166100128,-73.8721847326651,-73.8728165793136,-73.8734002412763,-73.8734655825853,-73.8735203686159,-73.8762333965815,-73.8762945252789,-73.8792151390953,-73.879216582309,-73.8792686378595,-73.8793321168056,-73.8796386550232,-73.879719790343,-73.8792412462232,-73.8791083739292,-73.8767619395631,-73.8767224338222,-73.876721924919,-73.8765602494519,-73.8739542531331,-73.873901277361,-73.8745808100912,-73.8749535774166,-73.8753064636552,-73.8754586187918,-73.8759630900538,-73.8761608741758,-73.8761776706062,-73.8761993303292,-73.8762191253342,-73.876548599704,-73.8768334902356,-73.877096271282,-73.8773424827109,-73.8775289455008,-73.8779734133435,-73.8780368114511,-73.8786849317358,-73.8786470531725,-73.8791915645211,-73.8802966914578,-73.8817902790232,-73.8849483577282,-73.887675444841,-73.8881581183427,-73.888628250132,-73.889085352959,-73.8895289317097,-73.8899585373793,-73.8900058919058,-73.8900378251875,-73.8913654358725,-73.8924573741515,-73.8935467713984,-73.8944111404313,-73.8952054035487,-73.8954642725973,-73.8955888446442,-73.8959444275682,-73.896677454942,-73.8967821330709,-73.8974134466262,-73.8976101330835,-73.8978033326603,-73.8980025574774,-73.8981364616514,-73.8985970379314,-73.898872111499,-73.8990033229351,-73.8990244634611,-73.8990418038891,-73.8988860174521,-73.8988069843351,-73.8988183473785,-73.8988357145382,-73.8992176089417,-73.899652332798,-73.9000252300403,-73.9004165405497,-73.9008513567251,-73.9012657039877,-73.9016676789062,-73.9019821814221,-73.9022882256012,-73.9026600835474,-73.902967689961,-73.9032213189808,-73.9034427236995,-73.9034622888674,-73.9034742227648,-73.9034735546669,-73.9034715727059,-73.9034687813497,-73.9034663061998,-73.9034655362001,-73.9034637968846,-73.9034593367302,-73.9033541752533,-73.9033159957102,-73.9033645784494,-73.9033899477951,-73.9034678007585,-73.9035464012338,-73.9035765725715,-73.9034905003708,-73.9040463980889,-73.9035258449234,-73.9026226228038,-73.9007523595447,-73.9004700109828,-73.900245376395,-73.8997455060752,-73.8996983025444,-73.8988992828747,-73.8987094468792,-73.8984899774004,-73.898274189501,-73.8980644469557,-73.8978629987368,-73.8976719417578,-73.8974931200785,-73.8974375614847,-73.8973838123863,-73.8972831772595,-73.8971901003899,-73.8971048866469,-73.8970278151516,-73.896959138362,-73.8968990812467,-73.8968693782032,-73.8967496595112,-73.8966353676674,-73.8965815876399,-73.8965263330149,-73.8964662506299,-73.8964301047751,-73.8964190907378,-73.8963679902941,-73.8963589890351,-73.8962863475366,-73.8962016955736,-73.8959972738213,-73.8957794543699,-73.8956147649848,-73.8955485950465,-73.8953050494877,-73.8950492683729,-73.8949106745415,-73.8941746326718,-73.8941425555181,-73.8940409878327,-73.893985686658,-73.8934403131568,-73.8927414244319,-73.8925830316834,-73.8916601065927,-73.8906308685609,-73.890154186729,-73.8896278757877,-73.8890889528668,-73.8882981117232,-73.888092663383,-73.8880834184255,-73.887283929256,-73.884522508914,-73.8837769864928,-73.8822666544277,-73.8811746909754,-73.8795613942397,-73.879506412209,-73.8793931510817,-73.8740205324067,-73.8710755255059,-73.8700429289989,-73.8689176275678,-73.8684051894918],"lat":[40.6947311862439,40.6940346919049,40.6938843746911,40.6911839582394,40.6907955842833,40.6904762612661,40.689803288876,40.6891453418447,40.6887161827396,40.6884004416592,40.6877492851037,40.6868303490357,40.686330590624,40.6852695590692,40.6852647166839,40.6844740517614,40.6832489428232,40.683186694603,40.6831150072076,40.681919587028,40.682128969899,40.6822461495736,40.6823728502927,40.6819285755629,40.6811137470236,40.679351640889,40.6791679691603,40.6790793706735,40.6791221206402,40.6791647851417,40.6788167861564,40.6778861145353,40.6766105959752,40.6753365904825,40.6750212688162,40.6743301474492,40.6740198143971,40.672805622741,40.6712517109905,40.6713805315348,40.6715129273103,40.6716561940381,40.6704162333648,40.6703219899049,40.6702552942948,40.670174051682,40.6700962126364,40.6686029353322,40.6680264396037,40.6679241591767,40.6670417638915,40.6658465551295,40.6655093801063,40.6638674928747,40.6638084021346,40.6637471595992,40.6635978625139,40.6634533609319,40.6620365707923,40.6617210500925,40.6613744371239,40.6601189331547,40.6598989424686,40.6597727153821,40.659634655304,40.6592546258883,40.6589383565109,40.6582765129481,40.6576183090124,40.6574881166273,40.657476093037,40.6574632804216,40.6574499879275,40.6574365362798,40.6574232500435,40.657410449792,40.6573984443731,40.6573490240437,40.6573340362566,40.6573181900077,40.6573017306177,40.6572825565294,40.6572642008487,40.657247128581,40.6572317722185,40.657218520784,40.657207709976,40.6572124229881,40.6572163136927,40.6572192797899,40.6572212432908,40.6572221525682,40.657221983714,40.6572192141448,40.6572158724994,40.657212044815,40.6572078296421,40.6572033355084,40.6571986781235,40.6571939774003,40.6571893543677,40.6571849280539,40.6571808124227,40.6571771134383,40.6571739263378,40.6571678659808,40.6571617364378,40.6571557013992,40.6571499220318,40.6571445526744,40.6571397367165,40.657135602769,40.6571322612295,40.6571298013342,40.6570877841037,40.6570418793427,40.65703782732,40.6570334928752,40.6570290047788,40.657024496366,40.6570201015757,40.6570159509711,40.6570121678609,40.6570088646362,40.6570061394312,40.657004073208,40.6570027273512,40.6570021418443,40.6569830737892,40.656962603945,40.6569412153282,40.6569004089046,40.6568621207965,40.6568268378514,40.6567950087041,40.6567670380727,40.6567432816125,40.6566537573703,40.6565081811807,40.6565037502665,40.6564985116793,40.6564926035149,40.6564861815201,40.6564794149869,40.6564724822897,40.656465566183,40.6564588489841,40.6564525077666,40.656446709693,40.6564416076074,40.6564373360072,40.6564176096086,40.6563963713411,40.6563739945704,40.6563653899706,40.656357333738,40.6563500485944,40.6563437359443,40.6563385703065,40.6563346944896,40.6563322156439,40.6563312022994,40.6563316824709,40.6563899390294,40.6563952428283,40.6563995787833,40.6564028183623,40.6564048655336,40.6564056596121,40.6564051770587,40.6563975353458,40.656388931338,40.6563795771769,40.6563697035002,40.6563595537546,40.6563493781935,40.6563394277067,40.6563299476344,40.6563211717183,40.6562122741798,40.6561060983797,40.6560029409736,40.6559030901821,40.6558068249862,40.6557144143476,40.6556675370077,40.6552952217741,40.6552882942718,40.655276256008,40.6552591309677,40.6552369532711,40.6552097671052,40.6550778057373,40.6547194707377,40.654675329646,40.6535648293056,40.6532094155741,40.6517060219567,40.6517059233221,40.6513027581793,40.6510793881619,40.6510100211849,40.6509254890873,40.6508927806821,40.6507561620547,40.6505611782635,40.6503651351014,40.6502673752048,40.6500856936291,40.6500492524762,40.6498963066432,40.6497848796895,40.6496539930983,40.64947579544,40.6493231823679,40.6486871358636,40.6485883154056,40.6479450700283,40.6474157972005,40.6468810876709,40.6468166334718,40.6468762094049,40.6505542748243,40.6506371403334,40.6545891318927,40.654591083773,40.6545691307326,40.6546220168498,40.6544990918043,40.6543759297764,40.653737186432,40.6537062355396,40.6505609544952,40.6503754030904,40.6503232219679,40.6500966543428,40.6464444346184,40.6463683678613,40.6456101054833,40.6451415836971,40.6446556691015,40.6444269313803,40.6436444842541,40.6433205280068,40.6432896590227,40.6432571730929,40.6432221341946,40.6426389282807,40.6421185898394,40.6416029545283,40.6410826809833,40.6407168001053,40.6398071177214,40.6398722842505,40.6405385525687,40.6410658560679,40.6416523796818,40.6426378289533,40.6439490289227,40.6468021729202,40.6491940977459,40.6495575484092,40.6499307837856,40.6503134324823,40.6507050708338,40.6511053045391,40.6511486971311,40.6511781774775,40.652364719447,40.6537109390806,40.6552027140843,40.6548329486657,40.6544879295266,40.6543775766565,40.6543244722693,40.6541728884023,40.6538549566563,40.6538095558218,40.6535383207189,40.6534538161212,40.6536248534122,40.6538012239551,40.6540430147487,40.6558281670742,40.6567123638255,40.657240805857,40.6573127030726,40.6573716575709,40.6573948832092,40.6574066618045,40.6574538129022,40.6575259418736,40.6591114041932,40.6607354163782,40.6622816314516,40.6638065279357,40.6653458945236,40.6668806501649,40.6684135291928,40.6696700711987,40.6709360069667,40.6721971791508,40.6734393952624,40.674472913689,40.6753779190606,40.6754579194757,40.6755066832772,40.6755357608614,40.6756224600559,40.6757441809375,40.6758526638646,40.6758860089664,40.6759278906414,40.6760350028628,40.677111534876,40.6778692233986,40.6779817489148,40.6780382329525,40.6783758875856,40.6787425374827,40.6788833043726,40.6788980485348,40.6792205980192,40.6797392425141,40.6806645034182,40.6796766435087,40.6795352440653,40.6794227910109,40.6795079600669,40.6795440916942,40.6795609349016,40.6796301706819,40.6796705087743,40.6797250434942,40.6797934311789,40.6798750111177,40.6799688549371,40.6800737767268,40.6801206915437,40.6801688126217,40.6802672079914,40.6803698249256,40.6804763273461,40.6805863664477,40.6806995818402,40.6808156027293,40.6808814490309,40.6814920260621,40.6815564953434,40.6815747184331,40.6820029184158,40.6823364219728,40.6824463593363,40.6824798757412,40.6825997571336,40.6826208667338,40.6827583825879,40.682891482754,40.6831968787779,40.6834971833575,40.6837074215681,40.6837918923162,40.6840805200677,40.6843625985359,40.6845084863337,40.6852832481706,40.6852471462724,40.6851328346005,40.6850705947104,40.6844567900322,40.6836701856633,40.6834919108878,40.6840441779094,40.6847001780487,40.6850039898045,40.6842364542529,40.6846405530012,40.6851541932134,40.6852876279233,40.6852936321711,40.6856224754499,40.6866847490949,40.687863411185,40.6890385511502,40.6898725878353,40.691104780826,40.6911467688432,40.6912096316943,40.6941912952175,40.694746747868,40.6949414841501,40.6951465615148,40.6947311862439]}]],[[{"lng":[-73.9968399386042,-73.993616883955,-73.9917149877339,-73.9911989933494,-73.9907539681664,-73.9899029597006,-73.9898685213956,-73.9900345573586,-73.9901022574384,-73.9901135029676,-73.9902119097244,-73.9903901000267,-73.9905055860359,-73.9907253040987,-73.990757284933,-73.9909305352938,-73.9910699383004,-73.9911225669304,-73.9912294360479,-73.9912979062873,-73.9912343955904,-73.991352889619,-73.9913889833731,-73.9915520757907,-73.9915676292787,-73.9916385340918,-73.9917939621946,-73.9920610854351,-73.9922151661297,-73.9923276795879,-73.992579873967,-73.9926032219844,-73.9926325495429,-73.9930919022704,-73.9932601619493,-73.9933391724292,-73.9933618150688,-73.9935273136781,-73.9937959386914,-73.9938379218417,-73.9940415520236,-73.9940726322125,-73.9941680598259,-73.9942347091631,-73.9943986625863,-73.9948077902131,-73.9954287587875,-73.9958091234924,-73.9960587274438,-73.9969837521549,-73.9977628592577,-73.9985892556803,-73.9993124170014,-73.9999562086466,-74.0005319552123,-74.0012727334021,-74.0014005568262,-74.0018840630948,-74.0026000190985,-74.0032595504915,-74.003511864393,-74.0039292829342,-74.0046351624464,-74.0052271617457,-74.0053098612998,-74.0059128987708,-74.006298417107,-74.0076290415272,-74.0079120604296,-74.0080783528947,-74.0083021626477,-74.0085709097978,-74.0086438056641,-74.0093176044508,-74.0097315228011,-74.010053385917,-74.0108123826073,-74.0109227725817,-74.0110245795111,-74.0111435335985,-74.0112946411488,-74.0114712324908,-74.0115819399768,-74.0117574747775,-74.015170840198,-74.0151432552331,-74.0151235654947,-74.0143067159663,-74.0134167752072,-74.0123445476603,-74.011542018976,-74.0113832360476,-74.0143906993239,-74.0143446147417,-74.0142192854302,-74.0140774139114,-74.0140869355992,-74.014037969248,-74.0140155229543,-74.0111619569648,-74.0110897139191,-74.0110717022351,-74.0109935087915,-74.0109411822675,-74.0114608355918,-74.0140022021461,-74.0139995724097,-74.0109038988329,-74.0108984071244,-74.0108711957776,-74.0108445982394,-74.0108192559447,-74.0107957800571,-74.01077473673,-74.0107566334533,-74.0107433001391,-74.0107342444294,-74.0107297240402,-74.0107298676192,-74.0107346710848,-74.0107439977416,-74.0107575821696,-74.0107750377783,-74.0108021659265,-74.0108329687799,-74.0108665468693,-74.0108328456321,-74.0120179201047,-74.0120012422239,-74.0108135947911,-74.0107879833172,-74.0107092291038,-74.0106429201788,-74.0106772465934,-74.0106698675122,-74.0106875260377,-74.0107040434535,-74.0107170297584,-74.0107261323198,-74.0107311039634,-74.0107318096853,-74.0107282303187,-74.0107204630542,-74.0107087188013,-74.0106937789917,-74.0106757602816,-74.0106551258418,-74.0106542103389,-74.0106191007743,-74.0105681057344,-74.0105158157676,-74.0104765981442,-74.0110870663595,-74.0110679193433,-74.0110887458719,-74.0111066571464,-74.0111212396193,-74.0111321565993,-74.0111391560256,-74.0111155367853,-74.0110917377806,-74.011068088912,-74.0110542671545,-74.0110512619664,-74.010454328646,-74.0104286788463,-74.0103930313456,-74.010498589883,-74.0105547399681,-74.010746761353,-74.0113879840656,-74.0114845673462,-74.0115804550232,-74.0115881872491,-74.0115871581663,-74.0116335189519,-74.0116279231177,-74.0115551815629,-74.0115274502041,-74.0115149173653,-74.0114607395534,-74.0121574191309,-74.0121537262405,-74.0126574248999,-74.0126592820849,-74.0125737299691,-74.0125737287473,-74.0114748691886,-74.0113743882049,-74.0107184060963,-74.0096314557175,-74.0094968552036,-74.0094915462128,-74.009516273582,-74.0095184419593,-74.0095013790586,-74.0094629386021,-74.0094114026613,-74.0095813182218,-74.0095769279162,-74.0121623290922,-74.0121174587214,-74.00951947145,-74.0094478407252,-74.0092779275607,-74.0091660821697,-74.0090243918132,-74.0088933979832,-74.0087908052275,-74.0086990229636,-74.0082040187844,-74.0077911613479,-74.006970777244,-74.0054421484491,-74.0053622202936,-74.0051255345225,-74.0031073388422,-74.0025238141675,-73.9996842297327,-73.9968399386042],"lat":[40.7373608893982,40.736004491616,40.7352153006666,40.7350123685835,40.7348391545737,40.7344347896343,40.7335271145549,40.732754151374,40.7324453723405,40.7324005043438,40.7319963344049,40.7312885238275,40.7305649567378,40.7298786874765,40.7297408314207,40.7291422958175,40.7287253700306,40.7285679662687,40.7280726173606,40.7277552485622,40.7277268052624,40.7275573980602,40.7274977011422,40.7270943367239,40.7270346471162,40.7268332557749,40.7263917953616,40.7256446143343,40.7252325956682,40.7249060973921,40.7242015549233,40.7241364496834,40.7240568651524,40.722820084364,40.722354426278,40.7221411401718,40.7220800178355,40.7216332613659,40.7209375374658,40.7208321486218,40.7203209798232,40.720243490903,40.7200118462521,40.7198515145635,40.7194571089279,40.7184574263504,40.7172792430479,40.716644659708,40.716231640211,40.7165405431721,40.7168139281215,40.7170995115372,40.7175502417774,40.7180170950872,40.7184302390141,40.718961426446,40.7190526207015,40.7193975702879,40.7199034258279,40.7203770957584,40.7205563523918,40.7208544345578,40.7213536332407,40.7217441025603,40.7218241918131,40.7222529491649,40.7225495031654,40.7234977035754,40.7236997672675,40.7238268627638,40.723977808516,40.7241693552824,40.7242213174553,40.724701551389,40.7249903710288,40.7252444513723,40.7257898025558,40.7257941513483,40.7257938617085,40.7258144754712,40.725954942917,40.7260619796901,40.7261710343295,40.7261899048353,40.7265793906577,40.726710526782,40.7267939430672,40.7267081211967,40.7266210312135,40.7265194304825,40.7264473464245,40.7282292723672,40.7284630475202,40.7286221837815,40.7295234277555,40.7306404091879,40.7306631730403,40.7306942188439,40.7306828396561,40.7304506763491,40.7312525684535,40.7314524921763,40.7323204179406,40.7330077632694,40.7330284136384,40.7330680017955,40.7333322775177,40.7332976171396,40.733351207376,40.7333526110263,40.733357202535,40.733364871172,40.7333754319978,40.733388630324,40.7334041478552,40.7334226468679,40.7334425875549,40.7334634024343,40.7334844991451,40.7335052773059,40.7335251455996,40.7335435386025,40.7335599328751,40.7335781204809,40.7335925291098,40.7336027380169,40.734007094011,40.7340637444564,40.7343384011662,40.7342834436476,40.7345482938444,40.7353628721402,40.7360486977049,40.7360562799568,40.7361019319292,40.7361138677228,40.7361291844309,40.7361463565088,40.7361649176664,40.7361843638938,40.7362041671477,40.7362237896898,40.736242698688,40.7362603806857,40.7362759491663,40.736289501447,40.7363006891653,40.7363477447433,40.7363453907218,40.7369722201425,40.7375960649536,40.7380639405951,40.7380927500813,40.7383040961741,40.7383175246911,40.738333198299,40.7383507551168,40.7383697897827,40.7383898628131,40.738392085617,40.7383921814886,40.738390149099,40.7383879479573,40.7383964257507,40.7383645057256,40.7387033646588,40.7391742965618,40.7391734327704,40.739186239049,40.7391759366796,40.7392160560887,40.7392604620915,40.739264536112,40.7392715953977,40.7394788698322,40.7395064860661,40.7395624736036,40.7395567262273,40.7398737709473,40.7399728636988,40.7405842147525,40.7406059981313,40.7406742566207,40.7406966522318,40.7407476384975,40.7407417318449,40.7407352576227,40.7406870602711,40.7407239476413,40.7406855939256,40.7406453673743,40.7407270117855,40.7407427094398,40.7407735836735,40.7408057229169,40.7408292237458,40.7409023372403,40.7411540933129,40.7411749602848,40.7412106566544,40.7414918896827,40.7417585162116,40.741490301696,40.7418915912202,40.7418786108562,40.7424165914635,40.7423997433102,40.7423841671893,40.7423751437236,40.7423617239634,40.7421475187909,40.7419708442441,40.7416271271582,40.7409821402617,40.740949503518,40.7408502130684,40.739997520559,40.7397526436422,40.7385524738161,40.7373608893982]}]],[[{"lng":[-73.9887793168407,-73.9875719527018,-73.9871804967054,-73.984945506,-73.9835605212129,-73.9834664420825,-73.9832146714656,-73.9829644066345,-73.9825562923175,-73.9824687621402,-73.9819091150614,-73.9816665703113,-73.9803400750025,-73.9799210997628,-73.9791080389467,-73.9780269795085,-73.9775384383504,-73.9769043637167,-73.9761963235918,-73.9758124489941,-73.9756678261324,-73.9732979683815,-73.9720501541323,-73.9719768505994,-73.9719124415182,-73.9718567123771,-73.9717960198696,-73.9716269727173,-73.9716697270118,-73.971695874516,-73.9717189436151,-73.9717384337936,-73.9717675541024,-73.9717741096531,-73.9717914296149,-73.9718165058775,-73.971859358309,-73.9718743769522,-73.9718849095148,-73.9719112073207,-73.9719337450108,-73.9719397545632,-73.9719615477859,-73.9720051184119,-73.9720366696688,-73.9720659586741,-73.9720719696035,-73.9720809815193,-73.9720840005729,-73.9720975129091,-73.9721560900173,-73.9721658599662,-73.972216923762,-73.9722334467696,-73.9722649986824,-73.9723250773159,-73.9723611574465,-73.9723994574828,-73.9725101118038,-73.972889713967,-73.972996376171,-73.9731121076904,-73.9732368828268,-73.9733706738902,-73.9735134512052,-73.9736887753742,-73.9738717527949,-73.9740623607051,-73.9742605754032,-73.9744663722499,-73.9746797256724,-73.974900609167,-73.9751289953027,-73.9751497793712,-73.9751636080619,-73.9751885098631,-73.9752138702366,-73.9752254962796,-73.9752466638863,-73.9752467042073,-73.9758031128397,-73.9757953279243,-73.9759684451969,-73.9760498145551,-73.9761236883879,-73.9761653123832,-73.976311278672,-73.9764287251453,-73.9765054011539,-73.9765500881422,-73.9767122153967,-73.9768188354005,-73.9769907657463,-73.9770565940175,-73.9772221356257,-73.9775266843264,-73.9777211949307,-73.9778209163825,-73.9778994961945,-73.9779967479038,-73.9780797490662,-73.9781819069428,-73.9782555774921,-73.9783714816526,-73.97861560124,-73.9787761334208,-73.9791889437701,-73.9792072643461,-73.9792901523712,-73.9800364229283,-73.9802834433218,-73.9803365249047,-73.9803309012443,-73.9805104602636,-73.9812864755256,-73.9812457956995,-73.983060194774,-73.9836423447263,-73.9844964707676,-73.9865503533998,-73.9881649172669,-73.9881734096788,-73.9883906402327,-73.9884465343738,-73.9884796726877,-73.9884972717388,-73.9886365807185,-73.9886453349368,-73.9886675058094,-73.9886961027133,-73.9887177111125,-73.9887368170752,-73.988797177858,-73.9888984598088,-73.9893576569668,-73.9894606701943,-73.9895744960872,-73.9897451515574,-73.9901582537338,-73.990514203767,-73.9907891301856,-73.9910678346301,-73.9913510923706,-73.9917026029252,-73.9917677958013,-73.9919054436645,-73.9920392696835,-73.9920913163597,-73.9921486897015,-73.9923611613991,-73.9928484674865,-73.9937401286223,-73.9940082016405,-73.9941406320035,-73.9943782354394,-73.9945789996372,-73.9951757736984,-73.9958038565357,-73.9960189839576,-73.9966640099659,-73.9972828719558,-73.99808351187,-73.9982860232059,-73.9985275858531,-73.9985611462062,-73.9987219795506,-73.9987539657086,-73.9988084627664,-73.9988215842098,-73.9988813086388,-73.9989834096324,-73.9990527673855,-73.9991343491895,-73.999194511749,-73.9992873111686,-73.9993619558227,-73.9993995507368,-73.9994428144047,-73.9995627336694,-73.9998119392456,-73.9999293642363,-74.0000076558933,-74.0001235912308,-74.000191031389,-74.0002656668273,-74.0005500495307,-74.0013443991373,-74.0014714023208,-74.0014193471629,-74.0012825853251,-74.0012347662873,-74.0011364675746,-74.0010032544294,-74.0009063363727,-74.0007528938798,-74.0006636699085,-74.0005098609723,-74.0006202506202,-74.0007140956851,-74.0007880129429,-74.0008396236891,-74.0008678146431,-74.0008727630724,-74.0008906642112,-74.0008911124527,-74.0008516037919,-74.0002562874538,-74.0004590571478,-74.0004546306596,-74.0005273494269,-74.0007895518617,-74.0005783921612,-74.0001382090783,-73.9999309777797,-73.9994483818033,-73.9993124170014,-73.9985892556803,-73.9977628592577,-73.9969837521549,-73.9960587274438,-73.9958091234924,-73.9954287587875,-73.9948077902131,-73.9943986625863,-73.9942347091631,-73.9941680598259,-73.9940726322125,-73.9940415520236,-73.9938379218417,-73.9937959386914,-73.9935273136781,-73.9933618150688,-73.9933391724292,-73.9932601619493,-73.9930919022704,-73.9926325495429,-73.9926032219844,-73.992579873967,-73.9923276795879,-73.9922151661297,-73.9920610854351,-73.9917939621946,-73.9916385340918,-73.9915676292787,-73.9915520757907,-73.9913889833731,-73.991352889619,-73.9912343955904,-73.9912979062873,-73.9912294360479,-73.9911225669304,-73.9910699383004,-73.9909305352938,-73.990757284933,-73.9907253040987,-73.9905055860359,-73.9903901000267,-73.9902119097244,-73.9901135029676,-73.9901022574384,-73.9900345573586,-73.9898685213956,-73.9899029597006,-73.9888393515615,-73.9887793168407],"lat":[40.7339653997385,40.7334569906786,40.7332921477617,40.732349672818,40.7317702249338,40.731731080616,40.7316241682911,40.7315208425476,40.7313501340519,40.7313148847332,40.7310951283115,40.7309985475813,40.7304424608738,40.7302622052087,40.7299105584781,40.7294330591074,40.7292262479172,40.728957824278,40.7286619765265,40.7285197676225,40.7284625320068,40.72742800886,40.7268809467975,40.7268303562017,40.7267910087674,40.7267586854661,40.7267136796566,40.7266284529969,40.7263923271544,40.7262418298049,40.7261219932596,40.7259996675555,40.7258333029521,40.7258212813371,40.7258142211491,40.72581496625,40.7255829695329,40.7255031160798,40.7254244050658,40.7252903707,40.7251762903512,40.7251580386101,40.7250399788108,40.7248414902108,40.7246840700201,40.7245591583287,40.7245363508581,40.7244975679304,40.7244679055457,40.7244234152347,40.7241701782781,40.7241319637758,40.7239300546468,40.7238467799263,40.7237144573337,40.7234634993273,40.7233120604765,40.7231488163666,40.7226968860068,40.7210882972193,40.7206228901928,40.7201587392745,40.7196959467712,40.7192346146881,40.7187748447066,40.7182498827723,40.7177264352491,40.7172045667377,40.7166843416427,40.716165824164,40.7156490782896,40.7151341677872,40.7146211561967,40.7145794238635,40.7145519056912,40.7145031607239,40.7144484987985,40.714423439942,40.7143778063055,40.714377724561,40.7131781245892,40.7131700231916,40.7127895733909,40.7126041937779,40.7124603253984,40.7124201979109,40.7121186473102,40.7119090325037,40.7117987894525,40.7117345387283,40.7115357651784,40.7114195675238,40.7112566602306,40.7111976264668,40.7110687312283,40.7108430727332,40.7107100746607,40.710645444907,40.7105998662024,40.7105610173916,40.7105322505773,40.7105068655177,40.7104979090553,40.7104897074916,40.7104737819109,40.7104633150473,40.7104349233883,40.7104336663931,40.710428144567,40.7103784012667,40.7103618156111,40.7103592007147,40.7102869383136,40.7102747519457,40.7102183478817,40.7098262146013,40.7096479117481,40.7095918792448,40.7095096639395,40.7093119441395,40.7091567815065,40.7091475183013,40.7091269491627,40.709133820547,40.7091558468059,40.7091763052932,40.7099120615163,40.7099169338986,40.7099200348308,40.7099284498446,40.7099470900163,40.7099707418451,40.7099666074723,40.709954735765,40.7099009867079,40.7098892870513,40.7098740816066,40.7098487616557,40.7097903726638,40.7097338841188,40.7096895065887,40.7096572298426,40.7096203327034,40.7095652624535,40.7095550555237,40.7095253965823,40.7095169196653,40.7095082229038,40.7094986091041,40.7094643688115,40.7093818776388,40.7092461204354,40.7092374799191,40.7092332674,40.709192639199,40.7091309729101,40.7090342933078,40.7089460139075,40.7089162238475,40.7088269045177,40.7087316198429,40.7085096153672,40.7084299314676,40.7083315279083,40.7083152832336,40.7082374528962,40.7082236510272,40.7082001349927,40.7081754816775,40.7081366339198,40.7080926533162,40.7080325458664,40.707982396946,40.7079473763515,40.7080166031688,40.7080722865883,40.7081003383602,40.7081365567566,40.7082364831476,40.7084426144807,40.7085368170874,40.7085996194838,40.7086845192807,40.7087339123622,40.7087929499197,40.7090179172995,40.709646292959,40.7097465543233,40.7098147957719,40.7099940534729,40.7100553330356,40.7101759642254,40.7103540297637,40.7104778313564,40.710673832197,40.7107878023748,40.7109842704534,40.7110819840558,40.711192133519,40.7113121083329,40.7114386568541,40.7115681588622,40.7116969678131,40.7129829725656,40.7130150995419,40.7130567180603,40.713683831927,40.7141114129813,40.7143650475989,40.7151700588628,40.7152909684015,40.7155709024217,40.7161997305624,40.7165439142706,40.7173297970984,40.7175502417774,40.7170995115372,40.7168139281215,40.7165405431721,40.716231640211,40.716644659708,40.7172792430479,40.7184574263504,40.7194571089279,40.7198515145635,40.7200118462521,40.720243490903,40.7203209798232,40.7208321486218,40.7209375374658,40.7216332613659,40.7220800178355,40.7221411401718,40.722354426278,40.722820084364,40.7240568651524,40.7241364496834,40.7242015549233,40.7249060973921,40.7252325956682,40.7256446143343,40.7263917953616,40.7268332557749,40.7270346471162,40.7270943367239,40.7274977011422,40.7275573980602,40.7277268052624,40.7277552485622,40.7280726173606,40.7285679662687,40.7287253700306,40.7291422958175,40.7297408314207,40.7298786874765,40.7305649567378,40.7312885238275,40.7319963344049,40.7324005043438,40.7324453723405,40.732754151374,40.7335271145549,40.7344347896343,40.7339904794289,40.7339653997385]}]],[[{"lng":[-73.8202625598923,-73.8197062687684,-73.8195442616116,-73.8192154306295,-73.819161362818,-73.8191072958394,-73.8190501695227,-73.8189930568016,-73.8189210252737,-73.8186127527825,-73.8182856634571,-73.8182167099208,-73.8180990519696,-73.8174001053499,-73.8173552907551,-73.8170973875645,-73.8169667032834,-73.8166996124735,-73.8165897680259,-73.8163782449298,-73.8161385390022,-73.815937029704,-73.8155177755766,-73.8154625225467,-73.8154072811482,-73.8153719073105,-73.8151394016928,-73.8150331183611,-73.8149234326723,-73.8146694585273,-73.8144154871931,-73.8143092274701,-73.8141519173061,-73.8140705039223,-73.8136941977681,-73.8136563428962,-73.8136185078703,-73.8133890045906,-73.8131538158261,-73.8129980176373,-73.8124520793489,-73.8122418859606,-73.8120913555942,-73.8120295219687,-73.811769901511,-73.8117266323241,-73.8113979127617,-73.8110215873342,-73.810754331847,-73.8106329831089,-73.8107258752103,-73.8109881057541,-73.8118631505925,-73.8127176213562,-73.8130986312828,-73.8135401422149,-73.8143843798043,-73.8152282660355,-73.8160748749285,-73.8169264130452,-73.8181871097409,-73.819060751979,-73.8199392236373,-73.8208526408424,-73.8218934662347,-73.8229321626815,-73.8239803433813,-73.8250112887268,-73.8258732240272,-73.8267019729213,-73.8275302132571,-73.8283562087996,-73.8291824226466,-73.8300393407009,-73.8308855629651,-73.8317229831251,-73.8325774764411,-73.8334219064043,-73.8342599310853,-73.8346311562002,-73.8351167189827,-73.8359508277501,-73.8371765168474,-73.8380776900331,-73.8389406932338,-73.8397860022631,-73.8406300412629,-73.8411960566323,-73.8413409190611,-73.841513919314,-73.8423702910891,-73.8432309037523,-73.8440891489368,-73.8445106372463,-73.8449619067907,-73.8450583785572,-73.8451334988005,-73.8452020026906,-73.8452904232549,-73.8458323737205,-73.8467146424159,-73.8475784512998,-73.8478681763194,-73.8484443463383,-73.8493014492528,-73.8501480425854,-73.8509908928288,-73.8516820550599,-73.8522341708392,-73.8526772603694,-73.8533505728648,-73.8539801470208,-73.8543933070023,-73.8565341030587,-73.8568313704324,-73.8572107855002,-73.8577926836297,-73.8581983603457,-73.8585896258019,-73.859524861962,-73.8604665875376,-73.8607086187618,-73.8614061863469,-73.8623458053523,-73.8628674241378,-73.8632829703043,-73.8633096418202,-73.8633494352703,-73.863786744035,-73.8639900878039,-73.8641009667913,-73.8645649429913,-73.8649940445724,-73.8660199322073,-73.8662900301626,-73.866302638535,-73.8663149694295,-73.8665040782449,-73.8665979084489,-73.8665984828325,-73.8668705856634,-73.8670180292609,-73.8672805740703,-73.8674569407755,-73.8675274988967,-73.8676234034652,-73.8677683216845,-73.8679094844676,-73.8679768804403,-73.8680588528607,-73.8685947803896,-73.8686845430455,-73.8684051894918,-73.8668143382809,-73.8645570888365,-73.8636865642969,-73.8623683420772,-73.8601636430352,-73.8592849835958,-73.8583307891721,-73.8574444773962,-73.8565718515049,-73.8556742185687,-73.8547879606038,-73.852835443863,-73.8527451168608,-73.8527121632538,-73.8527011098125,-73.8527076981109,-73.8527320843455,-73.8527739700244,-73.8528326227881,-73.8533848640604,-73.8538625040373,-73.8543747078542,-73.8544996463028,-73.8544142783975,-73.8541011646925,-73.8510378068372,-73.8507084225627,-73.849138372429,-73.8482091285539,-73.8478966979251,-73.8470040531641,-73.8450247287711,-73.8442735217034,-73.8435939812998,-73.8429378956652,-73.8427567833131,-73.8427566424662,-73.8427564879882,-73.8425654377089,-73.8425652600801,-73.8425650701426,-73.8423654433828,-73.8423652895894,-73.8423651228293,-73.8421584479979,-73.8415637809442,-73.8394781524145,-73.83856418283,-73.83696237745,-73.8373309565426,-73.8378459516089,-73.8380686049643,-73.8380994175054,-73.8381220533075,-73.8381363534196,-73.8381422174135,-73.8381396038401,-73.8381285312553,-73.8381090773705,-73.838081378743,-73.837843159085,-73.8371470292285,-73.8382842883624,-73.8382490770014,-73.8381154639458,-73.8375010765286,-73.8374668178907,-73.8374571648824,-73.8374520301377,-73.8374402849152,-73.8374296234805,-73.8374093620758,-73.8374029131513,-73.8373827978206,-73.8373661358879,-73.8369679679288,-73.8369509368217,-73.8369448968254,-73.8369232207586,-73.8366260416097,-73.8365856505032,-73.8365763662954,-73.836573390022,-73.8365310312022,-73.836391679472,-73.8363696429638,-73.8363117940522,-73.8348123068994,-73.8344103057214,-73.834047919776,-73.8343772846659,-73.8348761972718,-73.8353995615279,-73.8357035139729,-73.835900721417,-73.8349471756521,-73.8341630764937,-73.8336425620393,-73.8335689574767,-73.8334783794503,-73.8333952937598,-73.8332165272826,-73.8315008443802,-73.8311564582916,-73.8308991069618,-73.8307132655342,-73.8305930643839,-73.8299041641565,-73.8289485211392,-73.8272072076456,-73.8263823750347,-73.8260600322682,-73.8260033749814,-73.8258552754084,-73.8255971632927,-73.8254606073229,-73.8248322241324,-73.8246934397495,-73.8245608126472,-73.8242894051795,-73.8242644916465,-73.8239440598338,-73.8238388906146,-73.8236575144419,-73.8234685822679,-73.8232722406517,-73.8230686423718,-73.8228579448663,-73.8226403115577,-73.821747155236,-73.8210335440499,-73.8207781897381,-73.8206415970137,-73.8204870313979,-73.8203905504066,-73.8203231300878,-73.8202625598923],"lat":[40.7095380732723,40.7086918535547,40.7084383738074,40.7078521164746,40.707760332058,40.7076685389046,40.707570220915,40.7074719035871,40.7073499060442,40.7068533995611,40.7063028504821,40.7061812339367,40.7059737147274,40.7046360531532,40.7045501397848,40.7040298015877,40.7037412846819,40.7031560939081,40.7029154363234,40.7024519644687,40.7019375695571,40.701505117148,40.7006053915253,40.700492864456,40.7003803378794,40.7003103108916,40.6998500093964,40.6996395966719,40.6994224400754,40.6989707122899,40.6985189733626,40.6983353320566,40.6980399706405,40.6978871298107,40.6972667958838,40.6972010516875,40.6971367385317,40.6967577542373,40.6963693587456,40.6961120625901,40.6951981245524,40.6948322361498,40.6945596210236,40.6944476309482,40.6939939048375,40.6939192986157,40.6933223136246,40.6926228874858,40.6921587015632,40.6919473825768,40.6919224223034,40.6918550447344,40.6916300801645,40.6914078038223,40.6913181019626,40.6912113678357,40.6909719537659,40.6907334771279,40.690492270968,40.6902501473664,40.6898920748069,40.6896424419732,40.6893936929379,40.6891343834089,40.6888382260043,40.6885430011056,40.6882452682572,40.6879523184278,40.6877086497737,40.6874732094474,40.6872394827356,40.6870028099533,40.6867708057622,40.6865293590858,40.6862865479113,40.6860507053982,40.6858063459228,40.6855677822712,40.6853289374999,40.6852232175474,40.6850849330504,40.6848435468849,40.6844953924184,40.6842389097021,40.6839938029679,40.6837541585341,40.6835139105714,40.6833513668439,40.683310503082,40.6832616814559,40.6830184222149,40.6827751975605,40.6825292985645,40.6824150883418,40.682307455319,40.6822844518408,40.6822665335029,40.6822506686508,40.682230444826,40.6821064507279,40.6818584931911,40.6815798682803,40.6814868321229,40.6812907036365,40.6810466724078,40.6808081069773,40.6805683676605,40.6803679773977,40.6802078909679,40.6800794150817,40.6798670165449,40.6796830349626,40.6796601136843,40.6795277252978,40.6795093383044,40.679485864345,40.6794557161414,40.6794308490686,40.6794027293995,40.6793454684152,40.6792785624499,40.6792637358096,40.6792209927654,40.6791647851417,40.6791221206402,40.6790793706735,40.6791679691603,40.679351640889,40.6811137470236,40.6819285755629,40.6823728502927,40.6822461495736,40.682128969899,40.681919587028,40.6831150072076,40.683186694603,40.6832489428232,40.6844740517614,40.6852647166839,40.6852695590692,40.686330590624,40.6868303490357,40.6877492851037,40.6884004416592,40.6887161827396,40.6891453418447,40.689803288876,40.6904762612661,40.6907955842833,40.6911839582394,40.6938843746911,40.6940346919049,40.6947311862439,40.6950653508091,40.6955204565116,40.6956914183774,40.695950143246,40.6963846579409,40.6965537112189,40.6967437106509,40.6969129847168,40.697064691022,40.697179357049,40.6972966237558,40.6975489621307,40.697560750099,40.6976690012452,40.6978182549633,40.6979685615504,40.6981181201147,40.6982650980146,40.6984077665833,40.6992542988145,40.6998648552405,40.700420652783,40.7005518549602,40.7005436911184,40.7005137488268,40.7002332854879,40.7002031251044,40.6982827412019,40.6985184085461,40.6986003293224,40.6988252110124,40.6993593770162,40.6997805061122,40.7001723519251,40.7005544292202,40.700657615421,40.7006576953068,40.7006577681377,40.7007505661518,40.7007506548659,40.700750735857,40.7008324281366,40.7008324904137,40.7008325439617,40.700902563635,40.7011005987176,40.7026901943316,40.7032969693934,40.7042124523322,40.7048549764566,40.7056295408818,40.7059574045712,40.7060307493963,40.7061057997818,40.7061820288086,40.7062589012806,40.7063358775998,40.7064124171869,40.7064879826599,40.7065620434741,40.7069519253094,40.7079570462625,40.7084093586259,40.7084640364838,40.7086650885321,40.7095493352663,40.7095923462805,40.709602451971,40.7096071091837,40.7096159923195,40.709620460462,40.7096208660767,40.7096201427989,40.7096118388699,40.709604945203,40.7094357214998,40.709428224989,40.7094245879593,40.7094076351508,40.7091343750677,40.7090945108954,40.7090853554134,40.7090832229207,40.7090415917049,40.7089120393388,40.7088915572839,40.7088372559869,40.7096433509599,40.7098464286569,40.7100293917755,40.7103027602552,40.7107231935459,40.7111922371615,40.7114646345007,40.7116413707688,40.7121627281736,40.7125916402772,40.7128670594696,40.7129169758843,40.7129629515836,40.7130079305458,40.713070986944,40.7139877114039,40.7140976747921,40.7141656017704,40.7142082424194,40.7142370635617,40.7144186894738,40.7146487412239,40.715073713355,40.7153106753392,40.7153993486023,40.715413630791,40.7154533969516,40.7155143369393,40.7155496455943,40.7146399929159,40.714443144363,40.7142550301751,40.7138700661059,40.713816425045,40.7132332993445,40.7129408783816,40.7127324472787,40.7125279397826,40.7123275144605,40.71213132661,40.711939528439,40.7117522686562,40.7110403038144,40.7104270358934,40.7101568997868,40.709971226871,40.7097944308467,40.7096802769619,40.7096109608246,40.7095380732723]}]],[[{"lng":[-74.0438776163994,-74.0435059607857,-74.0427353389298,-74.0427843338001,-74.0427042842677,-74.0425537203731,-74.0426392937116,-74.0426938081921,-74.043467523103,-74.0435163724582,-74.0436407862745,-74.0439745855618,-74.0443852177725,-74.0447839910639,-74.0462753900363,-74.0468028489857,-74.0474765152837,-74.047729627631,-74.0475857192479,-74.0474312612351,-74.0468920550059,-74.0472002936622,-74.0471105069861,-74.0471158204236,-74.0471832141206,-74.0471949251373,-74.0472132456783,-74.0472256842528,-74.0472319282725,-74.0472318208172,-74.0472253645786,-74.0472127217936,-74.0471942101681,-74.0471702948939,-74.0471409105325,-74.0471081405363,-74.0470726965651,-74.0470353483505,-74.0469969069794,-74.0461716706545,-74.0461470720867,-74.0460955106326,-74.0460444245365,-74.0459941839553,-74.0459259276921,-74.0458602742741,-74.0446061648289,-74.0438776163994],"lat":[40.6901876758739,40.6896873596361,40.6900501909177,40.6901209766912,40.6901552046443,40.6899627592896,40.6899281759108,40.6899972596098,40.6896369906061,40.6891910332398,40.6887665600728,40.688582407056,40.6885161779001,40.6885956601157,40.6893274253942,40.6899532562661,40.689611369998,40.6899153189686,40.6899825068262,40.6898038904709,40.6900590983227,40.6904248151212,40.6904704128501,40.6906558061182,40.6907473550491,40.6907632638482,40.6907904873262,40.6908195724355,40.6908497882698,40.6908803755068,40.6909105654899,40.6909395995445,40.6909667480433,40.6909913287425,40.6910105163445,40.6910262084724,40.6910380643421,40.6910458264812,40.6910493263199,40.6910979814864,40.6911226460332,40.6911200633818,40.6911141523256,40.6911049556948,40.6910826035467,40.6910561165834,40.6905734844483,40.6901876758739]}],[{"lng":[-74.0167475609607,-74.0154035914165,-74.0153546638998,-74.0154091666595,-74.0153891976824,-74.0151748220262,-74.0151893420934,-74.0152547432226,-74.0153091598503,-74.0152595103565,-74.0151263756415,-74.0151653814954,-74.0151287829433,-74.0150478986297,-74.0149431503348,-74.0149841798006,-74.0150397387253,-74.015156121595,-74.014221230849,-74.013478097856,-74.0134718371085,-74.0134642424601,-74.0134555172519,-74.0134458950948,-74.0134356336145,-74.0134250075543,-74.0134143014184,-74.0134038018552,-74.0125025867518,-74.0125228982705,-74.0124088889432,-74.0124009890298,-74.0123916159385,-74.0123726014913,-74.0123501259174,-74.0123248007178,-74.0122973149255,-74.0121181561438,-74.0121172676508,-74.0121035918566,-74.0120436917983,-74.0118492003855,-74.0118488930743,-74.0118118564724,-74.0117988123054,-74.0117837450172,-74.0117509703223,-74.0117503308665,-74.0117503425204,-74.0117574905125,-74.011834467264,-74.0118383347108,-74.0118390082567,-74.0118646870669,-74.0119030972256,-74.0119111886801,-74.0119689325871,-74.0121363077087,-74.0121373251626,-74.0121429331618,-74.0121488598439,-74.0122011411637,-74.0123243068946,-74.0123595184464,-74.0123900102967,-74.0124085861358,-74.0124292705936,-74.0124614016514,-74.0125398248163,-74.0125589901549,-74.0128282602698,-74.013223380517,-74.013241954393,-74.0132478456347,-74.013285157929,-74.0133031402166,-74.0133112315667,-74.0133180447417,-74.0133236765739,-74.0133260654666,-74.0133281831765,-74.0133306424727,-74.0133326414961,-74.0133350530328,-74.0133353949411,-74.0133351582511,-74.01333432977,-74.0133329328366,-74.013325465205,-74.01331621036,-74.0132748195948,-74.0132662046015,-74.0132647611729,-74.0132552869935,-74.0131865653706,-74.0129122875168,-74.0129280039382,-74.0128598710889,-74.0128968843035,-74.0128951835567,-74.0128751983543,-74.0128654726673,-74.0128159518588,-74.0127543683678,-74.0126507176099,-74.012625116948,-74.0126085685939,-74.01258434696,-74.0125843493594,-74.0125450515152,-74.0125548821136,-74.0125322859477,-74.0125195075271,-74.0120341761658,-74.0120174665936,-74.0125975315257,-74.0125278320997,-74.0121835507106,-74.0121868207526,-74.0118257535497,-74.0118284795756,-74.0121950009008,-74.0121955295861,-74.0122101741068,-74.0120841439639,-74.0120823242436,-74.0120532549877,-74.0119987596657,-74.0119878628144,-74.0119715131882,-74.0119860327698,-74.0119932916737,-74.0119805676125,-74.0120495985062,-74.0120568542849,-74.0120986343193,-74.0121077136943,-74.0121276971237,-74.0121422160092,-74.012231311469,-74.0123068830449,-74.0127032092405,-74.0127545120307,-74.0131692640275,-74.0132648670562,-74.0133301997795,-74.0134185895131,-74.0134724391663,-74.0148809797502,-74.0160473053953,-74.016097892284,-74.0165192757865,-74.0169814686412,-74.0170498660922,-74.0167158267198,-74.0166466408476,-74.0151516167432,-74.015148311897,-74.0151471464411,-74.0151439102199,-74.0166197123322,-74.0166735152999,-74.0172729123865,-74.017530324341,-74.0176225750659,-74.0173613207693,-74.0167811395715,-74.0167734646322,-74.0171209910106,-74.0201565665238,-74.0205436729308,-74.0202068671052,-74.0201627894175,-74.0194595738943,-74.0193984239193,-74.020952550103,-74.021008778993,-74.0202889999226,-74.0202781984649,-74.0206126723581,-74.0210622632964,-74.021839095257,-74.0222407889852,-74.0221823698076,-74.0221886915917,-74.0221185438341,-74.022136931921,-74.0222076545161,-74.0222547765965,-74.0221840541003,-74.0221984190984,-74.0222708648953,-74.0222794849969,-74.0222973095268,-74.0223271913025,-74.0223381152258,-74.0223082337383,-74.0223355290356,-74.0223973258052,-74.0225935958104,-74.0221325018687,-74.0230557474959,-74.0231946283466,-74.0223682355767,-74.0227589902996,-74.0230170445637,-74.0231350971031,-74.0232567831563,-74.0233977685457,-74.0234147937386,-74.0235416037012,-74.0237826733675,-74.0239473535509,-74.0242153726968,-74.0244317302371,-74.0246480924123,-74.0248418563728,-74.0249930605751,-74.025216469359,-74.0254683676858,-74.0256718375821,-74.0258850182353,-74.0260465318478,-74.0261257819296,-74.0262323829033,-74.0263340424241,-74.0264406662461,-74.026518229121,-74.0265764094311,-74.0266087555928,-74.0266281908387,-74.0266217834019,-74.026608909598,-74.0265702154533,-74.0264960014405,-74.026425772432,-74.0263762161382,-74.0263127037026,-74.0262202538429,-74.0261748809759,-74.0260658498755,-74.0257838705966,-74.0255797186632,-74.02538699247,-74.0251879424652,-74.0251542677043,-74.0249845267697,-74.0249599648895,-74.0247490351457,-74.0245639021156,-74.0244568522129,-74.0243392280889,-74.0243230857736,-74.0241951143645,-74.0241199762105,-74.0239719227775,-74.023969248803,-74.023811441694,-74.0236743648252,-74.0235364445218,-74.0233903409694,-74.0231339475036,-74.0226846593961,-74.0225653790493,-74.0224397395196,-74.0222511405758,-74.0218994219376,-74.0214963976845,-74.0214763606046,-74.0212129206163,-74.0209799620246,-74.0207196970176,-74.0207161915116,-74.020463884629,-74.0202052743428,-74.0198562397694,-74.0197970661688,-74.0197942453812,-74.0197676419043,-74.0197330819635,-74.0196927182827,-74.0196473380963,-74.0195978264823,-74.0195451490996,-74.0195262578606,-74.0194356527756,-74.0193436678775,-74.0192511249204,-74.0191588506442,-74.0190123842788,-74.0188658064592,-74.0188507475579,-74.0187971061621,-74.0181916221425,-74.0179603944227,-74.0173589862861,-74.0167475609607],"lat":[40.6933433682176,40.6930664973092,40.6932248534172,40.6932386731731,40.6932981346656,40.6932566803355,40.693198603543,40.693206891184,40.6930470428916,40.6930368142319,40.693177431516,40.6931972880948,40.6932437958344,40.6931997464005,40.6931410219309,40.6931065176805,40.6931382997609,40.6930155153942,40.6928229058415,40.6921384700918,40.6921318530237,40.6921261016862,40.6921213700671,40.6921177848518,40.6921154420315,40.6921144043335,40.6921146995412,40.6921163197508,40.692303580463,40.6923390324147,40.6924935274802,40.6925053579968,40.6925165481091,40.6925337719919,40.6925483824289,40.6925599819074,40.6925682548351,40.6926063657175,40.6926065546145,40.6926094649994,40.6926018166216,40.6925181977505,40.6925178732815,40.6924793350644,40.692444594737,40.6924047664728,40.692318113593,40.6923164119148,40.6923163487558,40.6922637395616,40.6921590560232,40.692153797275,40.6921528776478,40.692117962626,40.6920905835079,40.6920888440713,40.6920764745573,40.6920406438556,40.6920404180889,40.6920392196763,40.6920379493605,40.6920449050961,40.6920911875024,40.6921077702802,40.6921230850378,40.6921342405295,40.6921542388924,40.6922126249185,40.6921969738632,40.6921931538237,40.6921394359442,40.6920591906568,40.6920554161389,40.6920542176399,40.6920473690061,40.6920426486868,40.6920394962255,40.6920359024768,40.6920318225324,40.6920295792313,40.692027201437,40.692023725796,40.6920199701024,40.6920120995526,40.6920082090239,40.6920044629708,40.6920009245528,40.6919976369891,40.6919852024616,40.6919724974161,40.6919353467952,40.6919271804921,40.6919258027455,40.6919168169964,40.6919579289153,40.6916907308338,40.6916761044282,40.691602990363,40.6915768955003,40.691575283407,40.6915563302518,40.6915471012485,40.6915001267235,40.691476467636,40.6913994591805,40.6914087371478,40.6913641041272,40.6913706497296,40.6913833623806,40.6913915932729,40.6914230017505,40.6914289866178,40.6913968314542,40.6915030766857,40.6914582075514,40.6913343355445,40.691146337338,40.6911362159407,40.6910780242707,40.6910648162162,40.6910113577644,40.6910288475688,40.6910205736679,40.6907916968013,40.6907806223006,40.6907598819245,40.6907391439031,40.6907502116022,40.6907723360765,40.6907709555095,40.6906976681143,40.6906506537971,40.6906064072718,40.6906105485467,40.6905538544896,40.6905469365822,40.6905289595975,40.6905289574933,40.6904542878072,40.6904613307751,40.6892801829376,40.688790539817,40.6887205562379,40.6881547707006,40.6881224300967,40.688093166048,40.6880521978153,40.6880120579662,40.6872545709912,40.6873380068003,40.6873145922882,40.6871195511475,40.6869073844815,40.6868759874165,40.6864455937096,40.6864163472334,40.6865248020418,40.6864871672498,40.6864738915166,40.686437034043,40.686319804841,40.6863051685535,40.6856906976812,40.6853629879325,40.6854097837207,40.685746272027,40.6863490379192,40.6863987749472,40.686843337134,40.6854497872951,40.685272067926,40.6848338325745,40.6848330174109,40.6851549579224,40.6850874040472,40.6843844316472,40.6844535390844,40.684784447916,40.6848091351745,40.6852403901981,40.6850410247005,40.6846965405469,40.6845184075993,40.6844481899764,40.6844451266885,40.6843519508015,40.6843440719616,40.6844372477266,40.6844188635282,40.6843261247038,40.6843182466297,40.6844087975366,40.6844061707108,40.6844293550852,40.6844179738336,40.6844302216649,40.6844437904943,40.6844763936042,40.6844489893264,40.68435969595,40.6837676718827,40.6829169454452,40.6830004980622,40.683779916794,40.6842844483323,40.6841670442691,40.6841241561502,40.6840854143208,40.6840409698217,40.6840356031305,40.6840029835926,40.6839689158691,40.6839492159867,40.6839442434644,40.6839540305945,40.6839785666131,40.6840129411425,40.6840521120331,40.6840939808714,40.6841529225783,40.6842364562051,40.6843765268401,40.684514151155,40.6845935114398,40.6847002610538,40.6848016977242,40.68495162452,40.6851089331485,40.6852416635407,40.6853768580099,40.6855268047497,40.6856546341114,40.6857627980695,40.6859053846814,40.6860553525164,40.6861753398296,40.6862313188001,40.6862951162681,40.686384567591,40.6864290722291,40.6865305662279,40.6867947064173,40.6869974566,40.6871669042823,40.6873562274818,40.6873874944769,40.687545099961,40.6875682036495,40.6877870294122,40.6879646584538,40.688060559422,40.6881658095555,40.688180257022,40.68829476559,40.6883682435102,40.6885130254044,40.688515550098,40.6886645163053,40.6887923092574,40.688915770961,40.6890492476134,40.6892954542647,40.6897174708539,40.6898257584261,40.6899398194394,40.6901222185782,40.6904434723606,40.6908270503348,40.6908466226212,40.6911039656509,40.6913243908622,40.6915809849955,40.6915842321406,40.6918179911041,40.6920339238542,40.6929062333015,40.6930415627445,40.6930459455788,40.6930805572903,40.6931141074869,40.6931436657949,40.6931686557175,40.6931885898582,40.6932030794264,40.6932067903494,40.6932211771182,40.693228988633,40.6932301551088,40.693224666125,40.6932198290028,40.6932177137343,40.6932176503636,40.6932176591375,40.6932548004308,40.6932689832641,40.6933058702595,40.6933433682176]}],[{"lng":[-74.0403713480116,-74.0402998307913,-74.0402213162827,-74.0401217686172,-74.040062869259,-74.0400039635295,-74.0399352369473,-74.0398763281201,-74.0398244276532,-74.0397739487065,-74.0397038392806,-74.0396533436312,-74.0396210756969,-74.0395467484794,-74.0394878362359,-74.0394303306438,-74.0393672215053,-74.0393181348399,-74.039250820562,-74.039166684644,-74.0390965753385,-74.0390320779959,-74.0389717871358,-74.0389142920967,-74.0388539769994,-74.0388062726642,-74.0387627688549,-74.0387431075228,-74.0387416712619,-74.0387135933486,-74.0386827215315,-74.0386238167206,-74.0385312542336,-74.0384933607574,-74.0384807229866,-74.0384666680838,-74.0384526169438,-74.0384525837081,-74.0384441333066,-74.0384469222078,-74.0384398936978,-74.0384062192017,-74.0383879728089,-74.0383641141923,-74.038362694246,-74.0383879138229,-74.0384173590704,-74.0384496071002,-74.0384748494118,-74.0385071044475,-74.0385435696128,-74.0385884333871,-74.0386248658599,-74.0386921534173,-74.0388029062662,-74.0388772083666,-74.0389627293633,-74.0390482490852,-74.0391548059866,-74.0392164998595,-74.0392613798839,-74.0393216911619,-74.0393764021459,-74.039422688826,-74.0394759921562,-74.0395110546549,-74.0395671389096,-74.0396330286387,-74.0396708702862,-74.0397269284693,-74.0399327213296,-74.0402555508328,-74.0401000994505,-74.0400136805696,-74.039974796096,-74.0399315872412,-74.0398797486622,-74.0398279174942,-74.0397933763783,-74.0397933940411,-74.0398150202987,-74.0398539185806,-74.039914422906,-74.0399662859447,-74.0400138266,-74.0400570316896,-74.0400959182989,-74.0401564129788,-74.0401953154804,-74.0401996537943,-74.0401996656897,-74.0402515321239,-74.0402990710751,-74.0403336419898,-74.0403682109316,-74.0404114175359,-74.0404330343545,-74.0404452362883,-74.0404662947079,-74.0404747344223,-74.0404817587988,-74.0404873855592,-74.0405014203071,-74.0405308833366,-74.0405715619176,-74.0405968133284,-74.0406066462156,-74.0406263033208,-74.0406277301934,-74.040631960743,-74.0406516146495,-74.0406698664149,-74.0406951388009,-74.0407147999637,-74.0407344618005,-74.0407429056793,-74.0407471363103,-74.0407331372184,-74.0407037012129,-74.0406546278607,-74.0405985391033,-74.0405368332498,-74.0404849441414,-74.0404386598317,-74.0403713480116],"lat":[40.7001226430609,40.7001066612296,40.7001130910828,40.700116327273,40.7000982071006,40.700069415749,40.7000299567913,40.6999968972833,40.6999584994095,40.6999531816239,40.6999457356221,40.6999126737672,40.6998806709227,40.6998540196115,40.699813489697,40.699780428976,40.6997559080023,40.6997335148266,40.6997111290202,40.6996940841406,40.6996866382713,40.6996855925107,40.6996845462949,40.6996685588533,40.6996258952931,40.6995693550195,40.6995032098104,40.6994477265405,40.6993890361902,40.6993271545301,40.6992823466737,40.6992524869615,40.6992109006934,40.6991468872962,40.6991138115862,40.6990551254481,40.699001775218,40.6989441515408,40.6988790616386,40.6988523826575,40.6988203717141,40.6987787663307,40.6987446253315,40.6987040831398,40.6986731374703,40.6986421834211,40.6986443073914,40.6986453637717,40.6986538921918,40.6986666873581,40.6986858824907,40.6986815993651,40.6986431707922,40.6986228737041,40.6986036285771,40.6985897309034,40.6985800979796,40.698568330695,40.6985672273452,40.6985714756061,40.6985938690905,40.6986311977049,40.6986823996306,40.6987133299286,40.6987538611356,40.6987719892939,40.6987741043246,40.6987602102276,40.6987356529355,40.6986929496575,40.6985444222911,40.6988048233073,40.6989232434725,40.6988936821999,40.6988871204335,40.6988739830332,40.698877289232,40.6988937466318,40.6989266381538,40.6989562299992,40.6989989657656,40.6990285436516,40.6990679775371,40.6991041268364,40.699136989892,40.6991435501415,40.6991534007748,40.6991763950843,40.699212548801,40.6992421386337,40.6992618663064,40.6993045919258,40.6993341666382,40.6993505934773,40.6993637337567,40.6993735820978,40.6993998776279,40.6994247322101,40.6994695423739,40.6995132909958,40.6995367651268,40.6995677092874,40.699590113132,40.6996210483974,40.6996509130562,40.6996733129345,40.6997021218103,40.6997480002565,40.6997885498947,40.6998280307243,40.6998685739258,40.6999091169492,40.6999656645496,40.7000168787209,40.7000702273531,40.7001203778372,40.700160926312,40.7001972121424,40.7002100280044,40.7002111124971,40.7002047304085,40.7001834100228,40.7001642197786,40.7001407596175,40.7001226430609]}],[{"lng":[-74.0111435335985,-74.0110245795111,-74.0109227725817,-74.0108123826073,-74.010053385917,-74.0097315228011,-74.0093176044508,-74.0086438056641,-74.0085709097978,-74.0083021626477,-74.0080783528947,-74.0079120604296,-74.0076290415272,-74.006298417107,-74.0059128987708,-74.0053098612998,-74.0052271617457,-74.0046351624464,-74.0039292829342,-74.003511864393,-74.0032595504915,-74.0026000190985,-74.0018840630948,-74.0014005568262,-74.0012727334021,-74.0005319552123,-73.9999562086466,-73.9993124170014,-73.9994483818033,-73.9999309777797,-74.0001382090783,-74.0005783921612,-74.0007895518617,-74.0005273494269,-74.0004546306596,-74.0004590571478,-74.0002562874538,-74.0008516037919,-74.0008911124527,-74.0008906642112,-74.0008727630724,-74.0008678146431,-74.0008396236891,-74.0007880129429,-74.0007140956851,-74.0006202506202,-74.0005098609723,-74.0006636699085,-74.0007528938798,-74.0009063363727,-74.0010032544294,-74.0011364675746,-74.0012347662873,-74.0012825853251,-74.0014193471629,-74.0014714023208,-74.0013443991373,-74.0005500495307,-74.0002656668273,-74.000191031389,-74.0001235912308,-74.0000076558933,-73.9999293642363,-73.9998119392456,-73.9995627336694,-73.9994428144047,-73.9993995507368,-73.9993619558227,-73.9992873111686,-73.999194511749,-73.9992594547077,-73.9993263267543,-73.9993822517736,-73.9994212913861,-73.9994603307519,-73.9995232494107,-73.9995121136475,-73.9994906247462,-73.9995383965945,-73.999551213255,-73.9995714951379,-73.9996094803925,-73.9998829708522,-73.9999485594979,-73.9999450565511,-73.9999485595232,-73.9999567126231,-73.999972226488,-73.9999964501603,-74.0001386885914,-74.0002338052576,-74.0004002783203,-74.0005524793206,-74.000771752191,-74.0008497336769,-74.0008825909762,-74.0011868526283,-74.001131305772,-74.0012236753882,-74.0012321369197,-74.0012270129996,-74.0011603902258,-74.0011752161098,-74.0011691334154,-74.0011764356769,-74.0011760207968,-74.0009827669173,-74.0014053302406,-74.0014066669195,-74.0014058149584,-74.0005924020935,-74.000845235038,-74.0014543741885,-74.0020551772798,-74.0020614256381,-74.0020628208456,-74.0021227868642,-74.0021581834855,-74.0025696505947,-74.0026851276879,-74.0023628531175,-74.0024157347692,-74.0023838545834,-74.0019707039795,-74.001970148378,-74.0020320137903,-74.002171849419,-74.0021856233157,-74.0023334462116,-74.0023339307576,-74.0024205931867,-74.0024307107586,-74.0024883982926,-74.0024879014864,-74.0023983274895,-74.0023867074068,-74.0033230727079,-74.0035826233776,-74.0036318716933,-74.0036444618386,-74.0038332753226,-74.0036621783769,-74.0035839095211,-74.0035525995076,-74.0036308690132,-74.0026289640783,-74.002866897815,-74.0040566643926,-74.004340507828,-74.0045862295246,-74.0048406282478,-74.0049203782648,-74.0051880506733,-74.005211609004,-74.0052603582918,-74.0053502722476,-74.0056633064066,-74.0058912988893,-74.006020486211,-74.0061410675355,-74.0063421556028,-74.0064325927195,-74.0065959191387,-74.006320807539,-74.0063148451942,-74.0063003077744,-74.0059114573594,-74.0058994174579,-74.0058874726644,-74.0055584330446,-74.0054838408244,-74.0055268261524,-74.0055053127207,-74.0054713086128,-74.0054359976336,-74.0054272882625,-74.0053041259608,-74.005494278051,-74.0055016606746,-74.0056136179763,-74.0056016319641,-74.0056090526452,-74.0055947948584,-74.0055993510048,-74.0055902297777,-74.0055919461143,-74.005585095478,-74.005589095949,-74.0055354613818,-74.0055577199882,-74.0056752224985,-74.005984303395,-74.0060897609384,-74.0062387050853,-74.0063637273041,-74.0064602883175,-74.0064942519111,-74.0065488081265,-74.0065572087851,-74.0067554158403,-74.0067850219105,-74.0069946600246,-74.0072204666368,-74.0075190528379,-74.0075271497926,-74.0076049817952,-74.007645551613,-74.0076979869418,-74.0079559488799,-74.0083614839123,-74.0091103736175,-74.0091420219538,-74.0092907260061,-74.0086996431357,-74.0077554915064,-74.0075913620422,-74.0085361151077,-74.008349275591,-74.0086203616387,-74.0095848301761,-74.011056038415,-74.0111808830354,-74.0111077537304,-74.0112898390553,-74.0112097577877,-74.0111286853961,-74.0110783797455,-74.0110670856896,-74.0111088635154,-74.0110938631078,-74.0110933738937,-74.0110787243713,-74.0110558431283,-74.0110594329577,-74.0110374892875,-74.0110153838857,-74.0110294584325,-74.0110199968731,-74.0110066808234,-74.0109927275579,-74.0110085466105,-74.0110036190302,-74.0109913441062,-74.0109699717893,-74.0109884177341,-74.0109582729442,-74.0109361768365,-74.0109248271703,-74.0109255733494,-74.0109471284869,-74.0109191808652,-74.0109049693404,-74.0108846266534,-74.0109036642329,-74.0107853798049,-74.0107995931101,-74.0108153066737,-74.0108515738467,-74.0109309320508,-74.0110036442997,-74.0110437724954,-74.0110742747597,-74.0111043640435,-74.0111336222292,-74.0111503355684,-74.0113583629135,-74.0113031892116,-74.0112981643225,-74.0113098641095,-74.0113340941042,-74.0113608226743,-74.0113817187564,-74.0113950812339,-74.0114326991225,-74.011469474374,-74.0115029114371,-74.0117292681748,-74.0117000924834,-74.0116827539771,-74.0116653983307,-74.0116314961404,-74.0116101983588,-74.0116141358711,-74.0116314791865,-74.011677980343,-74.0117032101199,-74.0117260583568,-74.0117512926493,-74.0117773082774,-74.0118261923343,-74.0118340760152,-74.0118482702612,-74.0118537854959,-74.0119915978112,-74.0120866821469,-74.0120850937795,-74.0120693217167,-74.0120385679701,-74.0119767064249,-74.0119048809849,-74.0118567255699,-74.0119309631658,-74.0119619611692,-74.0120402793021,-74.0120884209169,-74.0121275950614,-74.0121577915852,-74.01217247961,-74.0122369454994,-74.012254902849,-74.0123185597424,-74.0123622244026,-74.0123916003228,-74.0125939232751,-74.0125906468422,-74.0125547187094,-74.0125289995523,-74.0125159356419,-74.0125151128012,-74.0125420278017,-74.0126138208737,-74.0126480885809,-74.0126807272845,-74.0127349915856,-74.0127961913925,-74.0128345493341,-74.0128663775656,-74.0128818840338,-74.0129047424937,-74.0129088179396,-74.0130020533556,-74.0131074784737,-74.0131115538951,-74.0131115319146,-74.0130939583163,-74.0130784348595,-74.0130249570557,-74.0130118926586,-74.0130208570277,-74.0130437009244,-74.013113038263,-74.0131407896509,-74.0131538489773,-74.013166916268,-74.0131775356333,-74.0131857168463,-74.0132008419732,-74.013207367872,-74.013222880169,-74.0132734948309,-74.0134856083274,-74.013480684937,-74.0134831153611,-74.0135034966087,-74.013532850181,-74.013586693151,-74.0136102983072,-74.0136747931479,-74.013662749699,-74.013642651867,-74.0136118226915,-74.0135704900994,-74.0135613093191,-74.0135331020564,-74.0135304779647,-74.0135613123654,-74.0135603414428,-74.0135295088917,-74.0135314747603,-74.0135629711161,-74.0135597054893,-74.0135236175674,-74.013522959189,-74.0135807001883,-74.0135854179851,-74.0135528322951,-74.0135771282257,-74.0135103959265,-74.0135582695949,-74.0139515275651,-74.0140919838548,-74.0141049030009,-74.0140914494948,-74.0141282119082,-74.014137263886,-74.0141486063779,-74.0141746727945,-74.0142206319549,-74.014309813113,-74.0143098158616,-74.0141778793178,-74.0141649576329,-74.0141523878731,-74.0142892074113,-74.0143015702324,-74.0142965168929,-74.0143153026476,-74.0143179646809,-74.0143678358322,-74.0144481315072,-74.0145599997369,-74.0145751333203,-74.0145842544043,-74.0145823440944,-74.0146329433346,-74.0146711999201,-74.014667172137,-74.0146538612469,-74.0146086300375,-74.0146082544851,-74.01455219326,-74.0144934254997,-74.0144924689342,-74.0144849212638,-74.0144785793136,-74.0144094739467,-74.0143968998894,-74.0143948069374,-74.0143238436303,-74.0146432323491,-74.0147242483441,-74.0147714243914,-74.0148123651405,-74.0148592665941,-74.0149303261123,-74.0149988305358,-74.015068182693,-74.0150983227013,-74.0150357973508,-74.0150227106005,-74.0150085051726,-74.0149931457591,-74.014967570717,-74.0149749555559,-74.0149488118272,-74.0149425550582,-74.0149232228936,-74.0149175465081,-74.0149237946395,-74.0149368794706,-74.0149419915596,-74.0148859896548,-74.0148200428468,-74.014726817822,-74.0147026503388,-74.0146736562849,-74.0148107256014,-74.0148283422528,-74.0150211366168,-74.015142318121,-74.0156777818474,-74.0157935171115,-74.0159103423342,-74.0161160906048,-74.01613890636,-74.0162444906066,-74.0163920537019,-74.0165151526078,-74.0165325870375,-74.0168185959992,-74.0168965704124,-74.0170039678951,-74.0171370588938,-74.0171450806266,-74.0172518213395,-74.0172457159113,-74.017253284,-74.0172934622105,-74.0173183776341,-74.0173983933228,-74.0174400354604,-74.0174938116276,-74.0175403829795,-74.017575485615,-74.0175964796705,-74.0176168121712,-74.0176260190494,-74.0176479750686,-74.0176604507462,-74.0176688130727,-74.0177712802033,-74.017767301143,-74.0178783934064,-74.0178846288097,-74.0178908849536,-74.017776393884,-74.017771283998,-74.0176713202027,-74.0176831056811,-74.0176726458143,-74.0176768962942,-74.0176742874819,-74.0176657844225,-74.0176579248343,-74.0176430653269,-74.017653788982,-74.0176546198974,-74.017643902936,-74.0176339989055,-74.0176265796304,-74.0175703564002,-74.0177945452029,-74.0178558568293,-74.0177505498687,-74.0177913930344,-74.0178175869795,-74.0178378282597,-74.0178082174696,-74.0179122932622,-74.0179426936393,-74.0179547398264,-74.0178444110672,-74.0184474268677,-74.018667846767,-74.0186556057802,-74.0175164637147,-74.017480904833,-74.0175317040947,-74.0175479625262,-74.0175581267376,-74.0175703146188,-74.0175736990254,-74.017566930139,-74.0175980853969,-74.0176343306109,-74.0176757094025,-74.0176867022586,-74.017718379389,-74.0177332539423,-74.017749416039,-74.0177655688175,-74.0177668704934,-74.0177836734917,-74.0177978958546,-74.0178063090113,-74.0178289331509,-74.0178399261186,-74.0179019884637,-74.0179103910473,-74.017941428159,-74.0179440193729,-74.017969224205,-74.0179789273837,-74.0179892694116,-74.017998321529,-74.0180080233745,-74.0180241870724,-74.0180429299157,-74.0180539241076,-74.0180650937425,-74.0181130290589,-74.0188628904543,-74.01888747948,-74.0189257238241,-74.0193415570455,-74.0193425462447,-74.0192224228399,-74.0191227596341,-74.0191025548842,-74.0190915508471,-74.0190661714014,-74.019033380197,-74.0189535946337,-74.0189457916734,-74.0189374055716,-74.0189266044381,-74.0189092157067,-74.0188846202889,-74.0188594300692,-74.0188294377503,-74.0187964493679,-74.0187610576787,-74.0187262698743,-74.0186896687048,-74.0186554807563,-74.0186305837271,-74.0185807840372,-74.0185471847534,-74.0185711739944,-74.0186071760113,-74.018634170231,-74.0186443710117,-74.0186479626221,-74.0186869537992,-74.0187211524911,-74.0187505462297,-74.0187619403742,-74.0187499332399,-74.0187739308764,-74.0187943275789,-74.0188201191435,-74.0188387043294,-74.0188482972443,-74.0188488981451,-74.0188111003502,-74.0187985148563,-74.0187757159848,-74.0187421241638,-74.018722929817,-74.0186947319077,-74.018678533722,-74.0186479447412,-74.0186281448806,-74.0186125449897,-74.0186047441127,-74.0186029418132,-74.0185915305335,-74.0185795285099,-74.0185717260917,-74.0185693319175,-74.0185645235698,-74.0185489275958,-74.0185351326967,-74.0185303375208,-74.0184064908863,-74.0182172638975,-74.0182169938448,-74.0181902925965,-74.0186555704965,-74.0186468907908,-74.0188006306843,-74.0188319588391,-74.0188339595149,-74.0188534776038,-74.0188550091197,-74.0187468983046,-74.0186314246896,-74.0184688213453,-74.0183413660979,-74.0182640918068,-74.0181448036177,-74.0181105778918,-74.0180460968757,-74.0179785323149,-74.0179222425703,-74.0178733342264,-74.017770142545,-74.017752927059,-74.017731838367,-74.0177202156355,-74.0177214894612,-74.0178003788839,-74.0166242442529,-74.0165446381253,-74.0165922758278,-74.0166181765532,-74.016618400783,-74.016591495205,-74.0165554889346,-74.0165411217173,-74.0164772420414,-74.0163916948582,-74.0163200662758,-74.0165411468663,-74.0169106869547,-74.0175444333466,-74.0175681104147,-74.0175788932214,-74.0176481071909,-74.0176550944719,-74.0176704166405,-74.0176727084408,-74.0176756542503,-74.0176791761199,-74.0176831808571,-74.0176875624925,-74.0176922050834,-74.0176969857822,-74.0177017780866,-74.0177061082747,-74.0177102420671,-74.0177140859701,-74.0177175530466,-74.0177205648821,-74.0177230533581,-74.017724962193,-74.0177068725834,-74.0176183331001,-74.0175372179073,-74.0174087136049,-74.0173828138784,-74.0173822318786,-74.0173257095844,-74.0172642150952,-74.0171212229362,-74.0169827429463,-74.0168629737727,-74.0167101860582,-74.0166941909594,-74.0166594696961,-74.0166299633819,-74.0159469520427,-74.0159438298421,-74.0156688366686,-74.0156706206075,-74.0155508775451,-74.0150006068241,-74.0149961973162,-74.0149898133956,-74.0149833323072,-74.01497036258,-74.0149451554934,-74.0147027002181,-74.0132132271919,-74.0130680549232,-74.0130723776922,-74.0130306812644,-74.0130117279954,-74.0129552430876,-74.012957495678,-74.0129089276402,-74.0134550563318,-74.0134137651287,-74.0139945221956,-74.0139999996444,-74.0142646199906,-74.0142669667171,-74.015573640966,-74.0155736434712,-74.0157137847,-74.0157130096578,-74.0163784829148,-74.0163057334284,-74.0144972031296,-74.0135191913237,-74.0129998067908,-74.0128973027087,-74.0156947197329,-74.0156224578195,-74.0131606667329,-74.01311663312,-74.0132538007587,-74.0132619393908,-74.013635236405,-74.01361558335,-74.0135612803112,-74.0135610909336,-74.0132556511851,-74.0132579965484,-74.0131123731524,-74.0131037691494,-74.0125387580726,-74.0124917103153,-74.0123707171539,-74.0122308084015,-74.0120946382959,-74.0119643204912,-74.0118133958526,-74.0116541510403,-74.0116532656994,-74.0119583307484,-74.0123158841747,-74.0141159544427,-74.0147782154846,-74.0151632411842,-74.0152042653114,-74.01518864982,-74.015170840198,-74.0117574747775,-74.0115819399768,-74.0114712324908,-74.0112946411488,-74.0111435335985],"lat":[40.7258144754712,40.7257938617085,40.7257941513483,40.7257898025558,40.7252444513723,40.7249903710288,40.724701551389,40.7242213174553,40.7241693552824,40.723977808516,40.7238268627638,40.7236997672675,40.7234977035754,40.7225495031654,40.7222529491649,40.7218241918131,40.7217441025603,40.7213536332407,40.7208544345578,40.7205563523918,40.7203770957584,40.7199034258279,40.7193975702879,40.7190526207015,40.718961426446,40.7184302390141,40.7180170950872,40.7175502417774,40.7173297970984,40.7165439142706,40.7161997305624,40.7155709024217,40.7152909684015,40.7151700588628,40.7143650475989,40.7141114129813,40.713683831927,40.7130567180603,40.7130150995419,40.7129829725656,40.7116969678131,40.7115681588622,40.7114386568541,40.7113121083329,40.711192133519,40.7110819840558,40.7109842704534,40.7107878023748,40.710673832197,40.7104778313564,40.7103540297637,40.7101759642254,40.7100553330356,40.7099940534729,40.7098147957719,40.7097465543233,40.709646292959,40.7090179172995,40.7087929499197,40.7087339123622,40.7086845192807,40.7085996194838,40.7085368170874,40.7084426144807,40.7082364831476,40.7081365567566,40.7081003383602,40.7080722865883,40.7080166031688,40.7079473763515,40.7079140213105,40.707879676494,40.7078415493216,40.7078189370554,40.7077963264511,40.7077626286582,40.7077487066091,40.707721845225,40.7076934700257,40.7076943527765,40.7077171986885,40.7077599731763,40.7076240860353,40.707591496371,40.7075826269833,40.7075586915538,40.7075311988559,40.7075063988221,40.7074916478985,40.7074050544075,40.7073471424869,40.7072602795707,40.707184275923,40.7070801482008,40.7070431186366,40.7070252538031,40.7068598257718,40.7067990506846,40.7067452616478,40.7067403364284,40.7067348699065,40.7066637208343,40.7066487452692,40.7066394976678,40.7066350582928,40.706627574359,40.706416712993,40.7061801352079,40.7061793880207,40.7061786128832,40.705410078911,40.7052545188463,40.7048733034321,40.7054113493667,40.7054170051382,40.705416077348,40.7053790026725,40.7053571191186,40.7055235795236,40.7054492481187,40.7051589666926,40.7051293117851,40.7051012702508,40.7047378679847,40.7047311592024,40.7046929537301,40.7046065964637,40.704607018874,40.704748135307,40.7047426069016,40.7046803346038,40.7046778580044,40.7047267723513,40.7047337605891,40.7047949251409,40.7047956636745,40.7056285952201,40.7054611288312,40.7054298067518,40.7054216841363,40.7053032430264,40.7051497597392,40.705192649148,40.7051664408342,40.7051235514465,40.7042229527815,40.7040752255116,40.705147363439,40.7049627293066,40.7047994506793,40.7046397795265,40.7045910049734,40.7044205356906,40.7044055322354,40.7043744884102,40.7043100799616,40.7041042444783,40.703959853442,40.7038749001019,40.7039809734355,40.7038498226075,40.7037911899517,40.7036859019493,40.7034667610289,40.703461324597,40.7034482349883,40.7030981114305,40.703087270192,40.7030765152238,40.7027812568899,40.7027143221341,40.7026852876171,40.7026668465856,40.7026898290835,40.7026595554114,40.7026654361941,40.7025598656331,40.702431381453,40.7024308677971,40.7025302420324,40.7025380597699,40.7025528185537,40.7025680203295,40.7025801678393,40.7025858142839,40.7025988359212,40.7026040502024,40.7026127305969,40.7026455211069,40.7026643946521,40.7025840721976,40.7028600185437,40.7029511204912,40.7030797893016,40.7031877922526,40.7032712080341,40.7033005481718,40.7033676150859,40.7033631483333,40.7035414894768,40.7035681274027,40.7034411885666,40.7033019778059,40.7031218197346,40.7031149809136,40.7029931411559,40.7029281742764,40.7028492785468,40.7026925299446,40.7024445390164,40.7019838705111,40.7019728494027,40.7019300713194,40.7011398675423,40.7015480021744,40.7013280810482,40.7009196957451,40.7006693483883,40.7005521637133,40.7018373855633,40.7014541814121,40.7014513922537,40.7012757644737,40.7012499822443,40.7010445832738,40.7010648974505,40.7009571203151,40.7009149408949,40.7009014201038,40.7008664103711,40.7008512565756,40.7008519490364,40.7008115312728,40.7008026214951,40.7007571312482,40.7007411242965,40.7007311709937,40.7007123949458,40.700711387706,40.7006905930471,40.7006835572344,40.7006680667978,40.700673352282,40.7006455360896,40.7006342445026,40.7005745916001,40.7005758419471,40.7005667930364,40.7005558319939,40.7005377430358,40.7004864630919,40.700491783764,40.7004614274096,40.7004513815124,40.7002325144708,40.700207213007,40.7002004441012,40.7002385110849,40.7004151523344,40.7005811099441,40.7006828452197,40.7007483373936,40.7008106494294,40.7008678744055,40.700898400101,40.7008519586364,40.7006478440364,40.7005988845293,40.7005798011911,40.7005683536823,40.7005658109993,40.7005702571179,40.7005906076738,40.7006745411163,40.7007489282581,40.7008150589742,40.7007701180597,40.7007215386359,40.7006933450621,40.7006375605903,40.7005553917474,40.7004930064215,40.7004726184626,40.7004582182481,40.7004618152075,40.7004810023868,40.7004786044219,40.7005307875863,40.700570974375,40.7006663427821,40.7006861344762,40.700729925806,40.7007389214502,40.7007048309639,40.7006813087392,40.7006645148039,40.7005997333441,40.7005289568123,40.7003784242992,40.700226930002,40.7001071034084,40.7000512101569,40.7000375455955,40.7000480916456,40.7000865841921,40.7001430865068,40.7002113786482,40.7002331155977,40.7003212778443,40.7003647343415,40.7004882870901,40.700575829962,40.7006205280941,40.7005708334725,40.7005118505081,40.7003597306578,40.700252320357,40.7001846484802,40.7001504921108,40.7001349741483,40.7001082658111,40.700115088283,40.7001467553815,40.700218772701,40.7003000998847,40.7003528747345,40.7004075133718,40.7004416598862,40.7004969121628,40.7005236116935,40.7005160284655,40.7005074521807,40.7004720530446,40.7003602906032,40.7002236932399,40.7001032425843,40.6998828302061,40.6998182566313,40.699793419368,40.6997747847359,40.6997741653827,40.6998033379255,40.6998449404854,40.6999312443376,40.7000175479651,40.7001032303439,40.7002398279762,40.7002752165189,40.7003335860855,40.7004968702278,40.7004782229084,40.7003577710684,40.7002633881163,40.7001764595283,40.7001081614233,40.7000795908476,40.7000842980872,40.7001258214509,40.7001366565327,40.7001617828094,40.700245174148,40.7002322028714,40.7002951221583,40.7002971242458,40.7003111003465,40.7003100975851,40.7003665334373,40.7003735241241,40.7003820161837,40.7003800132065,40.7004389344275,40.7004419375783,40.700460415407,40.700456914493,40.7005019127563,40.7005033576671,40.7006436814761,40.7006503711521,40.7009398708306,40.70099098246,40.7005516178246,40.7005108283869,40.7005083362244,40.7003932820546,40.7003949552103,40.7003205717238,40.7002608912939,40.7001114913658,40.7001212960687,40.7001341015157,40.7005414735537,40.7005390520308,40.7005778662861,40.7006441447651,40.7006322117728,40.7006291865237,40.7006110379742,40.7006124973079,40.7005461226676,40.7004473724,40.7003097867797,40.7003169163312,40.7003084689551,40.7002838755286,40.7001974299099,40.7002104011971,40.7002393804048,40.7002426411752,40.7003097087484,40.7003236571139,40.7003829807516,40.7004451692506,40.7004546690029,40.700461153592,40.7004620821558,40.7005513314123,40.7005634813906,40.7005704790973,40.7006613046297,40.7008173043251,40.7007142938943,40.7006636519069,40.7006108499362,40.700555444143,40.7004792698635,40.7004061205765,40.700318257555,40.7003342655235,40.7004208310106,40.7004195360587,40.7004377099261,40.7004368473199,40.7004654148796,40.7004701777235,40.7004944136013,40.7005061032914,40.7005151914715,40.7005255757127,40.7005303387072,40.7005229793813,40.7005238433258,40.7005801144357,40.7006606197803,40.7007740158497,40.7007991160257,40.7008346090284,40.7009038314796,40.7008947428697,40.7009925040134,40.7008428923543,40.7012560210275,40.7013469058075,40.7014609484439,40.7016308016254,40.7016460171027,40.7017527214368,40.7018977010082,40.7020172986715,40.7020365396831,40.7023385750805,40.702421879457,40.7025545356276,40.7027113402677,40.7027053499762,40.7028355572638,40.7028384577392,40.7028462221601,40.7028874392095,40.7029188717716,40.7030191408049,40.7030775145419,40.7031548429576,40.7032361604299,40.7033075030561,40.7033613868065,40.7034232484654,40.7034227607245,40.7034945998795,40.7035499790976,40.7035913134677,40.7035838159297,40.7035451812609,40.7035385080372,40.7035817831893,40.7036252077717,40.703632558342,40.7035980508801,40.7036064273838,40.7037111312253,40.703711791046,40.7037705036386,40.7038343675716,40.7038992337186,40.7039326617864,40.7039889729588,40.7039983808126,40.7040096825698,40.704022245902,40.7040247517832,40.7040235013242,40.7041838809866,40.7042348975988,40.7040788471131,40.7040548828935,40.7039509125836,40.7039379224966,40.7039626661385,40.7040319644796,40.704054497151,40.7039731765763,40.7039757861112,40.704242039938,40.7041623049779,40.7044352780547,40.7044410017616,40.7045806241499,40.7046672608579,40.7046708723883,40.704663659375,40.7046657214244,40.704662623998,40.7046677836524,40.7046713858492,40.7046842721363,40.7046787078711,40.7046806793498,40.7046737911229,40.7046796984516,40.7046713328709,40.7046752679378,40.7046723154604,40.7046649301604,40.7046708375882,40.7046669021877,40.7046619854725,40.7046649299456,40.7046609955427,40.7046516481115,40.7046590330762,40.7046555835495,40.7046482084331,40.7046472181013,40.7046408245879,40.704646731822,40.7046496854182,40.7046383655994,40.7046457498439,40.7046280371103,40.7046295049346,40.7046358259916,40.7045536023338,40.7047196071708,40.7047291428043,40.7047737625703,40.7060705387066,40.7060936725271,40.7065730887261,40.7069758143375,40.7070004376415,40.7070044731845,40.7070137706215,40.7070131908761,40.7069967694655,40.7070177709414,40.7070342068967,40.7070442577859,40.7070643424513,40.7070858055368,40.7071004156837,40.7071154866401,40.7071278198476,40.7071378665251,40.7071433556864,40.707142443754,40.7071415391251,40.7071397157719,40.7071237481028,40.7071077702643,40.7070799223887,40.7070954409752,40.7071031988088,40.7071054758605,40.70708173803,40.7070840092376,40.7070817261499,40.7070798933099,40.7070757853643,40.7070497624896,40.7070442827876,40.7070324111698,40.707015972883,40.7069949696516,40.7069830904102,40.7069703123503,40.7069662117742,40.7069821883763,40.7069972586465,40.7070077633788,40.7070068575004,40.7070109676699,40.7070187330024,40.7070178195785,40.707010978465,40.7069972851459,40.7069890641773,40.7069749179782,40.7069593949184,40.706949814809,40.7069383979239,40.7069205952058,40.7069064401093,40.7069082706792,40.7069183220141,40.7069507324104,40.7072578721585,40.7077422059691,40.7077513097683,40.70782162611,40.7079239488833,40.707946813547,40.7079806216374,40.7079991667892,40.7080022191402,40.7080220122841,40.7080475344474,40.7084805802537,40.7089411000542,40.7095895710088,40.710106476441,40.7104089966268,40.710888650189,40.7110296282144,40.7113445014871,40.7117563192081,40.7120392427008,40.7123151439539,40.7128345747892,40.712848327556,40.7128493123467,40.7128447309337,40.7127841446105,40.7123451241586,40.7121573189953,40.712456037931,40.7125481710769,40.7126497635691,40.7127561500297,40.7128615632173,40.7129290955044,40.7129555648194,40.713029493074,40.7130999979507,40.7134079824783,40.7134410527424,40.7134963280103,40.7136112226643,40.7135237029755,40.713442743428,40.7132061859517,40.7131610626671,40.7130692079651,40.7130659962026,40.7130631096676,40.7130606247408,40.7130586071758,40.7130571103596,40.7130561738995,40.7130558225751,40.7130560656828,40.7130568137398,40.7130580474563,40.7130597389294,40.7130618499033,40.7130643326342,40.7130671309706,40.7130701816227,40.7131692824661,40.713654323433,40.7140975422478,40.7148067999054,40.7149414343151,40.7149444612793,40.7152549132549,40.71559268237,40.7163717930772,40.7171306436682,40.7177869542878,40.718624176058,40.7186488433544,40.7186660212247,40.7186653684503,40.7185755489063,40.7185892550442,40.7185544887632,40.7185377482337,40.7185219331838,40.718449236055,40.7184730013167,40.7185073473277,40.718523791433,40.7185358508643,40.7185435350772,40.7185161548842,40.7183157198958,40.7189221938255,40.7189386191727,40.7191314558191,40.7192189691163,40.7194894533972,40.7195001638031,40.7197348517065,40.7198017074262,40.7200194820142,40.7200856494666,40.7200671836615,40.7200951465836,40.7200868071437,40.7202432944648,40.7202540155095,40.7202706752682,40.7203034357419,40.7203766088309,40.7207270200381,40.7205137212632,40.7203951865582,40.7203330907501,40.7208680459758,40.7212064248753,40.7215434536738,40.7212539631946,40.7214737345308,40.7214899200012,40.7214718119331,40.7215165611344,40.7215861825595,40.7215806138451,40.7215718937641,40.7215438565393,40.7215277730294,40.7215099202957,40.7215545954712,40.7215031765764,40.7217797578275,40.722387580579,40.7230562570727,40.7237070524812,40.7243298642398,40.7250780063059,40.7258673740708,40.7258717618514,40.7259775992184,40.7260338432854,40.726215863303,40.7262817064734,40.7263197119368,40.7263619493796,40.7264511830076,40.7265793906577,40.7261899048353,40.7261710343295,40.7260619796901,40.725954942917,40.7258144754712]}]],[[{"lng":[-73.8283434749758,-73.8284267967819,-73.8287285688355,-73.8295940915706,-73.8305547123578,-73.8307226672039,-73.8311144922167,-73.8312833848724,-73.8319339376551,-73.8321371233042,-73.8323846854234,-73.8326890334202,-73.8327621992899,-73.8328350225652,-73.8328906609381,-73.8328926220929,-73.832893121063,-73.8330423462301,-73.8333827254562,-73.833518472216,-73.8337795278909,-73.8339302371213,-73.8345832171623,-73.8347353750812,-73.8349446256621,-73.8353621718488,-73.8355190467477,-73.8357047757733,-73.8357757691666,-73.835855970139,-73.8359908775545,-73.8361427900208,-73.8362918071927,-73.8363372576998,-73.836470550498,-73.8366380691055,-73.8367117969066,-73.8369114823119,-73.8371518944569,-73.8372258397222,-73.8375362574935,-73.8377540955476,-73.8378036833903,-73.8378427094752,-73.8379841620163,-73.8382477523711,-73.8383905629125,-73.8384942473412,-73.8388081325931,-73.8393679425065,-73.841240530037,-73.8412712784026,-73.8414166785508,-73.8414610203742,-73.8418797747322,-73.8423930900538,-73.8428366829414,-73.8432765586038,-73.8437757073376,-73.8442915296691,-73.8449103425533,-73.845541873879,-73.8462348007163,-73.8474901056339,-73.847810234636,-73.8480185603993,-73.8480634539416,-73.8485453056037,-73.8493915835714,-73.8499919434262,-73.8505227808275,-73.8508886338491,-73.8512089676086,-73.8517988662536,-73.8523115320841,-73.8533352494205,-73.853497466347,-73.8542074576561,-73.8551967533145,-73.8555357982924,-73.856184021551,-73.8571924801879,-73.8575394249403,-73.8583566909684,-73.8591959368475,-73.859724523661,-73.8601849194853,-73.8604562735985,-73.8616283336918,-73.8617616650535,-73.8634723231289,-73.8635801404726,-73.8636393815755,-73.8643692214372,-73.8644801171779,-73.8654645019086,-73.866361307901,-73.8672481888945,-73.8674020711092,-73.8678225811518,-73.8683084692482,-73.868740735508,-73.8692076681603,-73.8695586208914,-73.8700652511302,-73.8701817822227,-73.8702763856525,-73.8703478696004,-73.8712060585942,-73.8727271842559,-73.8727720465853,-73.8726780587469,-73.872527839146,-73.8723955806089,-73.8723636524935,-73.8723405632703,-73.8723174854618,-73.8721335784673,-73.8719643215682,-73.8719169151728,-73.8718461029101,-73.8717903848607,-73.8709625407474,-73.8694120846032,-73.8688924327461,-73.8695625908049,-73.8695236295179,-73.8692094456987,-73.8683745379487,-73.8682346608126,-73.8686369587995,-73.8687226323057,-73.8691666873424,-73.8693767539613,-73.8698157618704,-73.8698596035482,-73.8698893954676,-73.8699042156866,-73.8699037951237,-73.8698884222067,-73.8693912567731,-73.8692739124451,-73.8690762464051,-73.8688785903134,-73.8687675298734,-73.8684153962974,-73.8681883055873,-73.8682890763312,-73.868393769371,-73.8684993643155,-73.8686027851912,-73.8687254040077,-73.8688962278839,-73.869548681047,-73.8708488737839,-73.8708775412073,-73.8708896254351,-73.8708898383245,-73.8708901115479,-73.8709436611869,-73.8709441363487,-73.8709446220235,-73.8710017310579,-73.8710022767302,-73.8710027274176,-73.8710490592804,-73.8710494493611,-73.8710496749069,-73.8710758042858,-73.871075946214,-73.871075981354,-73.8710826251279,-73.871032688736,-73.870978451588,-73.8708840924882,-73.8705793765648,-73.8704448372036,-73.8704211215406,-73.8704053172813,-73.8703974292502,-73.8703974597621,-73.8704054090955,-73.8704212750105,-73.8704550899089,-73.8704918698942,-73.8704978339237,-73.8704995802517,-73.8705105705784,-73.8705147333307,-73.8705162978047,-73.8705262166591,-73.8705289732455,-73.8705332008308,-73.8705349472268,-73.8705373858619,-73.8699057097023,-73.8698507154024,-73.8696211371525,-73.8692775128076,-73.8691176689694,-73.8690397861754,-73.8686229317931,-73.8685450134633,-73.8683847295567,-73.8682292102352,-73.867848622814,-73.8677752593662,-73.8675284080566,-73.8672206463434,-73.8665381887574,-73.8662052329964,-73.8652648332035,-73.864326164937,-73.8633862119727,-73.862447452331,-73.8617955491394,-73.8617944766638,-73.8614338378629,-73.8604220182369,-73.8594836130853,-73.8585412426463,-73.857607877091,-73.8574501352669,-73.8566624526441,-73.856501878474,-73.8560303732627,-73.8555490916087,-73.8545435102471,-73.8536363872702,-73.8535762849665,-73.8526575185201,-73.8517098726112,-73.8510846336729,-73.8507898324263,-73.8498764519222,-73.8489375486445,-73.8485967600268,-73.8479261406924,-73.8472514483993,-73.8469927362359,-73.8464076634316,-73.8460895713345,-73.8457814738794,-73.8451725669668,-73.8448773743104,-73.8444213367985,-73.8442314689986,-73.8435858138452,-73.8431571542739,-73.842804435339,-73.842406293729,-73.841851864839,-73.8415882668867,-73.8412236259795,-73.8406436476823,-73.8397423340175,-73.8395447573561,-73.8392208540751,-73.838752234548,-73.8378438016918,-73.8369702106376,-73.8367882426342,-73.8361860131034,-73.8357843665769,-73.8315962003194,-73.8315196428682,-73.8308932966159,-73.8301201610068,-73.8297261483776,-73.8295089269199,-73.8292408964243,-73.8291192906947,-73.8284196344166,-73.8283434749758],"lat":[40.8608920266758,40.8607890375821,40.8604133281048,40.8593597642993,40.8581903960537,40.8579945871445,40.8575243296239,40.8573499624236,40.8566935170366,40.8565436911331,40.8563522109563,40.8561323835244,40.8560795397618,40.8560358452586,40.8559921708826,40.8559906251353,40.8559902301674,40.8558730803709,40.8556058608904,40.8554879389928,40.8552611656522,40.8551302438827,40.8544323368314,40.8542471796318,40.8539362903303,40.8533159222454,40.8530195775613,40.8526408613189,40.8524757490562,40.8522468310337,40.8517962820193,40.8510417585734,40.8497088799812,40.8486406080874,40.8471493727829,40.8463833341949,40.8460573696679,40.8453928184807,40.8445926998885,40.844384276379,40.8435067888786,40.8428859100594,40.8427328434843,40.8426071071379,40.842151349938,40.8413020528784,40.8406768141352,40.8406992201194,40.8407670341695,40.8408829734818,40.8406014543219,40.8406509118619,40.8408847769986,40.8409560956207,40.8415280888383,40.842269861547,40.8429055404799,40.8435418059451,40.8441186282067,40.844682548627,40.845427460749,40.8449802319183,40.8444902173025,40.8435616107094,40.8432905480027,40.8431141511437,40.8430679986521,40.8430072249536,40.8429185710571,40.8428516281634,40.8427894898016,40.8427530068867,40.8427151219017,40.8426476329337,40.842586993994,40.8424701551548,40.8424516676459,40.842370739177,40.8422579925553,40.8422194899931,40.8421459172477,40.8420276484458,40.8419893968736,40.8418992866161,40.8418040334786,40.841744019969,40.8416890901825,40.8416616659383,40.8415278596844,40.8415127206042,40.8413059327065,40.8412779566327,40.8412652747639,40.8411090181287,40.8410877973869,40.8408568919647,40.840592685023,40.8403438043703,40.8402902760565,40.8401664990161,40.8399952139561,40.8398245766416,40.8396000467111,40.8395956534619,40.8396138826638,40.8396180754978,40.8396214788075,40.8396255665228,40.8396746224424,40.8397489448,40.8397512823361,40.8401371971068,40.8407539830068,40.8413363754319,40.8414769609834,40.8415836261895,40.8416902820204,40.842497794549,40.8432382537739,40.8434537426466,40.8437607778558,40.8438028143358,40.8443336600023,40.8472454909397,40.8481123221258,40.8480187132393,40.8486869770853,40.8492383728725,40.8506733360092,40.8509137372163,40.8520663552566,40.852423852418,40.8536860460276,40.8542657231123,40.8554837748537,40.8555767281417,40.8556738616951,40.8557732926938,40.8558730216152,40.8559710676522,40.8565518951769,40.8566889825649,40.8569455606196,40.857202138337,40.8573407804222,40.857780358143,40.8580638343109,40.8580850653844,40.8580955587413,40.8580948420303,40.8580831005448,40.8579534337859,40.8577727729451,40.8577260296799,40.857290817248,40.8572782242686,40.8572729164112,40.8572728178106,40.8572727819314,40.8572660519534,40.8572659893286,40.857266080502,40.8572767427389,40.8572768426904,40.8572771127395,40.857304603361,40.8573048376597,40.8573051530233,40.85734126459,40.8573414634313,40.8573416611482,40.8573770401352,40.8578077973948,40.8581994146533,40.858895181263,40.8614045539279,40.8632704000244,40.8636185453352,40.8639669493373,40.8643155084168,40.8646641192375,40.8650126777974,40.8653610804321,40.8666328687624,40.8679508309931,40.8681766549638,40.8682427761091,40.8686588353671,40.8688164328463,40.8688756652312,40.8692511767946,40.8693555333497,40.8695155802357,40.8695817025373,40.8696740314123,40.8696756649764,40.8696758071737,40.8696763988606,40.8696772852873,40.8696782502923,40.8696787212891,40.8696812363957,40.8696817065155,40.869682673857,40.8696836112369,40.8696877431894,40.86968853965,40.8696912175001,40.8696942623212,40.8696981557872,40.8696932953425,40.869674425282,40.8696563237169,40.8696407710719,40.8696214305266,40.8696098791953,40.8696098603209,40.8696034680244,40.8695850047635,40.869567116579,40.869550945745,40.8695343812969,40.8695325205235,40.8703611857399,40.8705663647562,40.8712335201549,40.8718131675638,40.8726043527937,40.873300599209,40.8732760205502,40.8729921874044,40.8726974590117,40.8724927914307,40.8723962924543,40.8721018813922,40.8717855901893,40.8716707851355,40.8713422330779,40.8709870524543,40.8708528887558,40.8705543006853,40.8703897719082,40.8702276962491,40.8699146982046,40.869760506992,40.86952229868,40.8694203509684,40.8690876373726,40.8688632665463,40.8686807525724,40.86847474402,40.8681919253787,40.8680518806315,40.8678581508499,40.8675541750672,40.86708793062,40.8669867383835,40.8668208402431,40.8665727774641,40.8660991880232,40.8656431364009,40.8655459061294,40.8652240993816,40.8650160114971,40.8626447044244,40.8625976691933,40.862212849092,40.8620492818338,40.861952745138,40.8618412139492,40.8616318676345,40.8615099769718,40.8609319398436,40.8608920266758]}]],[[{"lng":[-73.7938552720907,-73.7941655582765,-73.7944925443829,-73.7974482563964,-73.7993752043825,-73.8022038829628,-73.8032868213697,-73.8052011360319,-73.8055057674358,-73.8057127720978,-73.8059249887761,-73.8061408738586,-73.8063588494412,-73.8065773016606,-73.8069311323245,-73.8072864712256,-73.8076413950186,-73.8079939816159,-73.8083423239038,-73.8086845936049,-73.8091506811379,-73.8097107918628,-73.8102705322771,-73.8108361190483,-73.8114064522649,-73.8119804368333,-73.8120965924556,-73.813567347395,-73.81399748366,-73.814427621261,-73.8148566585915,-73.8151831684636,-73.8152834545869,-73.8153646422706,-73.8154787310654,-73.8167077859141,-73.8174263890859,-73.8184170336926,-73.8194079982162,-73.8198327530422,-73.8202743294959,-73.8206557938698,-73.8208354407275,-73.8216266365399,-73.8219900667133,-73.8225846839013,-73.8228216133271,-73.8234347093131,-73.823642108131,-73.8240868097089,-73.8249966413486,-73.8257158614128,-73.8257851762638,-73.8258608250698,-73.8262182111356,-73.8283716047521,-73.8289598027908,-73.8297629609238,-73.8300717062759,-73.8302597400712,-73.830844032307,-73.8312072611756,-73.8313782619935,-73.8318208923044,-73.8318649853505,-73.8320336386386,-73.8322469220484,-73.8325963975418,-73.8331592126715,-73.8332172165615,-73.8334823130115,-73.8334905591873,-73.834046665239,-73.8340610756022,-73.8342502224199,-73.8343785969423,-73.834491419495,-73.8344648917651,-73.8344622011831,-73.8344425309163,-73.8344630602063,-73.8344689223801,-73.8342673880511,-73.8341538152811,-73.8339497934443,-73.8337244292412,-73.8335876489384,-73.832685248026,-73.8326474852148,-73.8326212279966,-73.8318469619019,-73.8316964882701,-73.8310035513045,-73.8308958061731,-73.8307142369562,-73.8305614598893,-73.8303040470699,-73.8294560625628,-73.8289208550472,-73.8285591024813,-73.8282565182697,-73.828157720886,-73.8281229894433,-73.8283340964283,-73.8283434749757,-73.8284196344165,-73.8291192906946,-73.8292408964243,-73.8295089269198,-73.8297261483775,-73.8301201610067,-73.8308932966158,-73.8315196428681,-73.8315962003193,-73.8357843665769,-73.8361860131034,-73.8367882426341,-73.8369702106376,-73.8378438016918,-73.8387522345479,-73.8392208540751,-73.8395447573561,-73.8397423340175,-73.8406436476823,-73.8412236259796,-73.8415882668866,-73.841851864839,-73.8424062937289,-73.842804435339,-73.8431571542738,-73.8435858138451,-73.8442314689985,-73.8444213367985,-73.8448773743104,-73.8451725669669,-73.8457814738793,-73.8460895713345,-73.8464076634316,-73.8469927362359,-73.8472514483993,-73.8479261406924,-73.8485967600268,-73.8489375486446,-73.8498764519221,-73.8507898324262,-73.8510846336728,-73.8517098726112,-73.8526575185201,-73.8535762849664,-73.8536363872701,-73.8545435102471,-73.8555490916087,-73.8560303732627,-73.8565018784739,-73.8566624526441,-73.8574501352669,-73.8576078770908,-73.8585412426464,-73.8594836130851,-73.8604220182369,-73.8614338378629,-73.8617944766638,-73.8617955491394,-73.8624474523309,-73.8633862119727,-73.864326164937,-73.8652648332034,-73.8662052329964,-73.8665381887574,-73.8672206463433,-73.8675284080565,-73.8677752593663,-73.8678486228139,-73.8682292102352,-73.8683847295566,-73.8685450134632,-73.8686229317931,-73.8690397861753,-73.8691176689694,-73.8692775128076,-73.8696211371524,-73.8698507154024,-73.8699057097023,-73.8705373858619,-73.8705619252466,-73.8714516766863,-73.8719739703499,-73.8720324185372,-73.8721053948861,-73.8727260480976,-73.8728288453104,-73.8729365034523,-73.8732577532399,-73.8738643255213,-73.875188501627,-73.8743675076245,-73.8725525090033,-73.8716071869503,-73.8709441474806,-73.8701531859726,-73.8706826459966,-73.8708356784023,-73.871871006937,-73.8719166182427,-73.8730733460092,-73.8740675120517,-73.8749458975558,-73.8747924073199,-73.8747025549028,-73.8753369943113,-73.8762589013991,-73.8771700595187,-73.8781257522779,-73.877728176615,-73.8776067654627,-73.8778312590419,-73.8778385700107,-73.8778706811214,-73.877921238972,-73.8780012488109,-73.878051282126,-73.8781545932278,-73.8781889161654,-73.8791894189226,-73.8801766806026,-73.8802693992655,-73.8803409362508,-73.8803900369338,-73.8804159341632,-73.8804183333439,-73.8803974787196,-73.880354072715,-73.8802501798871,-73.8802022690033,-73.8801779396049,-73.8801587112665,-73.8801439537609,-73.8800421305907,-73.8795724553701,-73.8771197410579,-73.8770591532808,-73.8769913683886,-73.8769164481618,-73.8768344608922,-73.8767454811955,-73.8766495902651,-73.8765468755308,-73.8764374306502,-73.8763440831592,-73.8762465989223,-73.876145037111,-73.876039459094,-73.8759299292354,-73.8758165140245,-73.8756757851076,-73.8755293241256,-73.8753772774422,-73.8752197967313,-73.8750570396693,-73.8748891689179,-73.8747066283927,-73.8745192248421,-73.8743271367094,-73.8741305471524,-73.8739296431273,-73.8737246159429,-73.8735498436779,-73.8733732478293,-73.8731948906924,-73.8730148349031,-73.8726922679371,-73.8723736614543,-73.8720592092481,-73.8717491024744,-73.871443529881,-73.8711426773445,-73.8708392961775,-73.8705411987981,-73.8702485562774,-73.8699615365774,-73.8697938766479,-73.869629791157,-73.8694693710232,-73.8693127051371,-73.8691598803034,-73.8690109812061,-73.8688280912267,-73.8686500222092,-73.868476856697,-73.8683086756136,-73.8682027030534,-73.8681511222352,-73.8680942581115,-73.8680426074236,-73.8679962677432,-73.867955325187,-73.8678979862884,-73.8665212451291,-73.8656579432583,-73.8647725828352,-73.8630508566479,-73.8627985057923,-73.8626620860068,-73.8624577262726,-73.8622443959521,-73.86202342452,-73.8617962600684,-73.8615643838505,-73.8613410083432,-73.8610932999277,-73.8608813850757,-73.8607838003149,-73.8606862277895,-73.8605035462826,-73.86027030901,-73.8601931726778,-73.8601070691112,-73.85946778767,-73.8593969864738,-73.859324184964,-73.8590769227481,-73.8592357623462,-73.8594198409143,-73.8593831534815,-73.8593769645891,-73.8592809961688,-73.859205520239,-73.8590270408598,-73.8588640131634,-73.8592890319391,-73.8593857688913,-73.8594638989188,-73.8594985109914,-73.859532014426,-73.859578830145,-73.8592643247563,-73.8591789950162,-73.8591049877186,-73.8590360482632,-73.8589614807183,-73.8587282476721,-73.8584007535218,-73.8581600000485,-73.8581646029956,-73.8579693226212,-73.8577474745885,-73.8575596765764,-73.8571109054622,-73.8571717623632,-73.8569915741298,-73.8570414411814,-73.8571015144452,-73.8571862132476,-73.8573593530021,-73.8574345761825,-73.8571776607595,-73.8570502266738,-73.8568003828243,-73.8567314667085,-73.8566543688902,-73.8563608136679,-73.8560102332302,-73.8560116083934,-73.8563554520587,-73.8564238694302,-73.8565025169435,-73.8569239818007,-73.8568101363853,-73.8565573254491,-73.8559562264415,-73.8558804426122,-73.8558046379595,-73.8555269767283,-73.8551379214933,-73.8542377668688,-73.8537410356452,-73.8538336099959,-73.8542290536686,-73.854710782734,-73.8547558188669,-73.8547937280357,-73.8549110967363,-73.85458940522,-73.8539164602896,-73.8537750782683,-73.8536006165404,-73.8533535186496,-73.8529561848767,-73.8527699151414,-73.852584747504,-73.8526603582585,-73.8524565331729,-73.8522745168273,-73.8517831695014,-73.8514924250258,-73.851447539028,-73.8510711618394,-73.8516438065431,-73.8520728793833,-73.8523474489439,-73.8530497084913,-73.8534752239983,-73.8525776725087,-73.8522805971137,-73.8514250778235,-73.8509205929659,-73.8504014886026,-73.850173175521,-73.8493364139069,-73.8486391326434,-73.8470803291424,-73.8462327036082,-73.8453806105087,-73.8448188698501,-73.8448770721415,-73.844929219197,-73.8448926497548,-73.8444131946661,-73.8433955986826,-73.8423754377947,-73.8413868930467,-73.8411315278941,-73.8410627295322,-73.8410204734272,-73.8408654618152,-73.8408408750865,-73.8408119003378,-73.8407785894581,-73.8407410020537,-73.840699205479,-73.8406532745756,-73.8400447470177,-73.8392460467563,-73.8392182946635,-73.8391972049588,-73.8391828552173,-73.8391752982126,-73.8391745617249,-73.8391806484881,-73.839193536038,-73.8392131769298,-73.8392394988701,-73.8392724049848,-73.8396643321183,-73.83964812813,-73.8389662594575,-73.8383919918973,-73.838042772197,-73.8373795618846,-73.836305418251,-73.8352579057,-73.8335684976889,-73.8326780861135,-73.8318450099647,-73.8309577397887,-73.8300796531272,-73.8289056422736,-73.8286634108476,-73.8279693354161,-73.8272242978431,-73.8252082280862,-73.8239157102835,-73.8236684812067,-73.8225237766688,-73.8224180593248,-73.8224190239942,-73.8224167408367,-73.8224060555625,-73.8224059322864,-73.822416374771,-73.8224266256654,-73.8224370673189,-73.8224673768218,-73.8224913664282,-73.822506384473,-73.8225529011104,-73.8225951241745,-73.8226055152407,-73.8226587263005,-73.8227144441239,-73.8227469282072,-73.8227497237261,-73.8228238391386,-73.8228432579017,-73.8229248353265,-73.8229530768104,-73.8230388860436,-73.8230605918842,-73.8230894059049,-73.8231346117765,-73.8231690844194,-73.8231714249178,-73.8231733717007,-73.8231963678716,-73.8232596774653,-73.8233001785961,-73.8233337280592,-73.8233554269897,-73.8233703003777,-73.8233731814146,-73.823374431024,-73.8233743068037,-73.8233818029973,-73.8233720090933,-73.8233706888178,-73.8233557978707,-73.823337994666,-73.823310704503,-73.8232974557727,-73.8232947153793,-73.8232946538122,-73.8233062618837,-73.8233069378397,-73.8233273319153,-73.8233326238687,-73.8233341336464,-73.8233701037516,-73.8234170320996,-73.8234361167169,-73.823451985957,-73.8234642832399,-73.8234727322461,-73.8234771431253,-73.8234774167623,-73.8234735470044,-73.8233700399608,-73.8228533507268,-73.8206122361334,-73.8195746411005,-73.8194872444408,-73.8194065172857,-73.8182773810029,-73.8176062684771,-73.8166140094754,-73.8160169942589,-73.8157426143845,-73.8153304756216,-73.8152419714368,-73.8151685479307,-73.8136510836387,-73.8124290405474,-73.8122814098687,-73.812281112953,-73.8112683483296,-73.8098982238487,-73.8094327324855,-73.8087210608029,-73.8075594419275,-73.8063796862917,-73.8048387076826,-73.8045261501558,-73.8042376172505,-73.8029094648742,-73.8019244994992,-73.799302062783,-73.7977278308141,-73.7973275925205,-73.7962818154783,-73.7948690105643,-73.794055173961,-73.7938552720907],"lat":[40.8836433113335,40.8829932163499,40.8830682510741,40.8838453848377,40.8843519698216,40.8851211147967,40.8854155526692,40.885999956351,40.8860929491813,40.8860393678749,40.8859967177809,40.8859654100595,40.885945659655,40.8859375249967,40.8859266089178,40.8859318138162,40.885953252398,40.8859908313415,40.8860443136392,40.8861132918981,40.8862144769812,40.8863360754263,40.8864512425234,40.8865511521454,40.8866355878137,40.886704339445,40.8867150106628,40.8867787092493,40.886782132484,40.8867719646752,40.8867482325352,40.8867196609628,40.8867110242098,40.8867012210169,40.8866874461381,40.8864809505426,40.8862943058646,40.8860369947318,40.8857795888202,40.8856692545739,40.8855507003278,40.8854504751546,40.8853992724078,40.8851910718095,40.8850934469744,40.8849337282989,40.884869952143,40.8847049139799,40.8846426685227,40.8845091937673,40.8842067212603,40.883930135035,40.8839036166287,40.883876188875,40.8837176435616,40.8827009750744,40.8823853055582,40.8819295991919,40.8817471016816,40.8816197298461,40.8812152776198,40.880930553889,40.8807976077879,40.8804198135102,40.8803794149563,40.8802258949943,40.8800163223536,40.8796601253787,40.8790318042002,40.8789664522598,40.8786278015641,40.8786128478041,40.8775791132627,40.8775334518225,40.8770231113922,40.8765812624481,40.8760664072997,40.8754714980099,40.875411132268,40.8748791439922,40.8742929038763,40.8734091394891,40.8724304768408,40.8720367426448,40.8713294335771,40.8707684549124,40.8704765616004,40.8685506930474,40.8684823183037,40.8684260369844,40.8669358338153,40.8666481952854,40.8653235771757,40.8651255536883,40.8648106024352,40.8647407429326,40.8643439533508,40.8630367900042,40.8622117418838,40.8617613254983,40.8613845716451,40.8612271091474,40.8611821133886,40.8609038698644,40.8608920266759,40.8609319398436,40.8615099769719,40.8616318676345,40.8618412139493,40.861952745138,40.8620492818338,40.862212849092,40.8625976691933,40.8626447044245,40.8650160114971,40.8652240993816,40.8655459061295,40.8656431364009,40.8660991880232,40.8665727774642,40.8668208402431,40.8669867383835,40.86708793062,40.8675541750672,40.8678581508499,40.8680518806315,40.8681919253787,40.86847474402,40.8686807525724,40.8688632665463,40.8690876373726,40.8694203509685,40.8695222986801,40.8697605069921,40.8699146982047,40.8702276962491,40.8703897719082,40.8705543006854,40.8708528887558,40.8709870524543,40.8713422330779,40.8716707851355,40.8717855901893,40.8721018813922,40.8723962924543,40.8724927914307,40.8726974590117,40.8729921874044,40.8732760205502,40.873300599209,40.8726043527938,40.8718131675638,40.8712335201549,40.8705663647563,40.8703611857399,40.8695325205235,40.8695343812969,40.869550945745,40.8695671165791,40.8695850047635,40.8696034680244,40.8696098603209,40.8696098791953,40.8696214305266,40.869640771072,40.869656323717,40.869674425282,40.8696932953426,40.8696981557872,40.8696942623212,40.8696912175001,40.86968853965,40.8696877431894,40.8696836112369,40.869682673857,40.8696817065155,40.8696812363957,40.8696787212891,40.8696782502923,40.8696772852874,40.8696763988606,40.8696758071737,40.8696756649764,40.8696740314123,40.8715107784538,40.8715091853078,40.8715082470116,40.8715081411355,40.8715091683756,40.8715213252099,40.8715233384195,40.8715254458447,40.8715319988152,40.8715478120278,40.8715757563096,40.8727010091991,40.875175183326,40.87692157251,40.878509695414,40.880350827058,40.8804587560067,40.8804541142793,40.8803281204254,40.8802381780163,40.8801343853582,40.8800389062915,40.8799476687928,40.8800751283879,40.881553823556,40.8816718323973,40.8818320397059,40.8819939128099,40.8821536849745,40.8834541950846,40.8845230436198,40.8867727601815,40.8870945211764,40.8872540583453,40.8874101571805,40.887447196229,40.8876252311799,40.8879434463563,40.8880491810487,40.8903070319999,40.8920876014835,40.8922814994133,40.8924824176093,40.8926883287953,40.892897043861,40.8931062907469,40.8933138145226,40.8935174312458,40.8942270051642,40.8945542272723,40.8947204234618,40.8949134673608,40.8950615902807,40.8952222845866,40.8952714848418,40.8954686636436,40.8956501898439,40.8958302447916,40.8960086642264,40.8961852853786,40.8963599474536,40.8965324907559,40.8967027578708,40.8968705934597,40.8969988558056,40.8971253339417,40.8972499510674,40.8973726316343,40.8974933010188,40.8976118859462,40.8977511583684,40.8978869856172,40.8980192319232,40.89814776472,40.8982724558972,40.8983931808146,40.8985149008079,40.8986322891719,40.8987452341152,40.8988536278528,40.8989573673885,40.8990563539274,40.8991313468961,40.8992038388346,40.8992738044375,40.8993412188655,40.8994600734117,40.8995849277594,40.8997157059739,40.8998523285879,40.8999947124401,40.9001427709335,40.900307410286,40.9004775162956,40.9006529914399,40.9008337349579,40.9009474799236,40.9010641874455,40.9011837928705,40.9013062297911,40.9014314305281,40.9015593257222,40.9017274346719,40.9018984975693,40.902072434259,40.9022491643954,40.9023553827737,40.9024402503484,40.9025307089621,40.9026229502025,40.9027168010062,40.902812085638,40.9029401764028,40.9025159296287,40.9022432075405,40.9020124418739,40.9015080840389,40.9015355222228,40.9014591873937,40.9013583965145,40.901267706536,40.9011877766896,40.9011191222883,40.9010621228347,40.9011115703015,40.9010320752821,40.9009640758508,40.9009330448608,40.9009020133003,40.900846092615,40.9007746959148,40.9007502577133,40.9007219820543,40.9005172092678,40.9006061094728,40.9006975273986,40.9010079930999,40.9010986126319,40.90139312451,40.9015403907192,40.901565217661,40.9015555013765,40.9015478636586,40.9014449097527,40.9017116950496,40.9018691120143,40.9019049408937,40.9019338776329,40.9021016045005,40.9022431111243,40.9024408427722,40.9026694798958,40.9026560789517,40.902644455435,40.9025834959438,40.9025178652185,40.9022889705694,40.9022132557991,40.9023057102028,40.902595860559,40.9028509076869,40.90278754692,40.9029177959587,40.9036495326968,40.9040820654355,40.9045842095667,40.9046405674271,40.9047084578832,40.9046920172057,40.9047309614909,40.9048415437005,40.9052865416615,40.9052915357558,40.9051422481779,40.9051010693704,40.9050550002806,40.9051021540583,40.9053059836261,40.9054820834407,40.9055281179251,40.9055447407948,40.9055638487958,40.9059741701111,40.906155828326,40.9062620328462,40.9062185037384,40.9062414303687,40.9062643641266,40.9063802514584,40.9068668891419,40.9070328682545,40.9077879167348,40.9079743498197,40.9080185890469,40.9080063099422,40.9080839927338,40.9081583316855,40.9083548698343,40.9089394992976,40.9094656034419,40.9095315552404,40.90960674145,40.9100431402495,40.9103530441801,40.9104060080653,40.9103106170642,40.91001519366,40.9098605095732,40.9098540996441,40.9101606306521,40.9102716404998,40.910449671202,40.9103715197194,40.909699085114,40.909197082764,40.9088628420952,40.9080359269022,40.9075302935267,40.9072001912095,40.907081266626,40.9067801749592,40.9066164944888,40.9072181705057,40.9075078656515,40.9071253147679,40.9068065221673,40.906156733033,40.9058986722635,40.9056558080872,40.9055299496747,40.9050726937815,40.9046630037689,40.9041908667972,40.9041713300481,40.9041711245578,40.9041664047764,40.904172741534,40.9035037283972,40.9032141163291,40.9028141354767,40.901862433763,40.901783334753,40.9017050957055,40.9016278566925,40.901551756033,40.901476929933,40.9014035123527,40.9005749571893,40.8995011540483,40.8994184166921,40.899334554814,40.8992498769862,40.8991646947818,40.8990793216291,40.8989940715522,40.8989092583337,40.8988251940402,40.8987421879819,40.8986605455737,40.8978855151058,40.8973305353407,40.8955932069691,40.8940670080491,40.8941423313869,40.8939247416097,40.8935991658837,40.8933916440558,40.8928064263453,40.8926018263349,40.8923542795198,40.8920301594027,40.8917882328256,40.8914394503379,40.8913674848872,40.8911452751048,40.8909102335518,40.8903443498499,40.8899746254419,40.8899037402954,40.8894288239167,40.8895144328945,40.889514763728,40.8895208627287,40.8895662901443,40.8896124342212,40.8896578946439,40.8896793876482,40.8897012843394,40.8897412876111,40.8897630597236,40.8897766871596,40.8898064046482,40.8898249699062,40.8898295376322,40.8898445664313,40.8898528422,40.8898540322457,40.8898541347067,40.8898481322431,40.8898444512551,40.889828986609,40.8898236321844,40.8897964393262,40.8897862359655,40.8897726912007,40.8897663971304,40.889771870139,40.889772241604,40.8897729071382,40.8897762025209,40.8897986027624,40.8898195156351,40.8898466027878,40.8898732983882,40.8899025625503,40.8899208279255,40.8899217624358,40.8899279702975,40.8899755049085,40.8900432596742,40.8901094634141,40.8901500087316,40.8902175041395,40.8902900813942,40.8903651678473,40.890388748317,40.8903923107577,40.8904321419404,40.890434461655,40.8904650434588,40.8904729804014,40.8904742875453,40.8905054542124,40.8905298544761,40.8905450899162,40.8905623190402,40.890581154715,40.8906011737082,40.8906219261985,40.8906429458822,40.8906637604517,40.8909672958784,40.8912068290963,40.8906132883958,40.8903150964607,40.8902899803603,40.8902604342747,40.8898471305285,40.8896770237937,40.8894334275054,40.889323833842,40.8891973369043,40.8890825057322,40.8890601485909,40.8890377622584,40.888678450576,40.8883792117794,40.8883435603364,40.8883434873161,40.8880989064755,40.8877405420071,40.8876384069332,40.887480598377,40.887108891601,40.8868293791823,40.8864739640991,40.8864092483435,40.8863416823861,40.8860306803368,40.8857129680244,40.8850690548588,40.8846481295645,40.8845410611669,40.884290883524,40.8839153173342,40.8836999667811,40.8836433113335]}]],[[{"lng":[-74.032310843001,-74.0320095332724,-74.0260978906359,-74.0257237706746,-74.0246637088286,-74.0246145327845,-74.0245735491043,-74.0235493908876,-74.0235178724573,-74.0234820367263,-74.0234682183412,-74.0234008536295,-74.0233168302438,-74.0232178021328,-74.0231059320848,-74.0229700932488,-74.0226109861283,-74.0219243974276,-74.0217543256647,-74.0216494666172,-74.0215981079466,-74.0215603682944,-74.0215164548883,-74.0214664593663,-74.0214104860531,-74.0213486517288,-74.021281085446,-74.0212079281793,-74.0211293325644,-74.0210873117535,-74.021052986947,-74.0209074004978,-74.0207733057556,-74.0205426995401,-74.0202929162027,-74.0200572173502,-74.0197129379459,-74.0195531816618,-74.0193110334044,-74.0187832339203,-74.016067907324,-74.0132448956053,-74.011069092807,-74.0105038368618,-74.0102948249559,-74.0100893858062,-74.0098877214696,-74.0096900302874,-74.0094965066905,-74.0093073410079,-74.0091227192795,-74.0066191489383,-74.0060056409891,-74.0037731632313,-74.0016269681283,-73.9993952679115,-73.9983141752881,-73.9971817527544,-73.9974878569875,-73.9975357378005,-73.9981161432841,-73.9986969523364,-73.9993209028495,-73.9999466498922,-74.0005298749299,-74.0012022236823,-74.0016938015666,-74.0022758628599,-74.0028570164015,-74.0034355710265,-74.0040190690737,-74.0045990697737,-74.005226659917,-74.0058531993418,-74.0064339499209,-74.0070153162091,-74.0075980688957,-74.0081768755106,-74.0087603999488,-74.0093416449816,-74.0099237199307,-74.0105040358741,-74.0110864810412,-74.0117120155573,-74.0134825591615,-74.0152237943311,-74.0170191015474,-74.0162363672972,-74.0154985500964,-74.0164055306887,-74.0167128387583,-74.017283667568,-74.0174671144685,-74.0175086859712,-74.0180470260697,-74.018119049733,-74.0181764666061,-74.018214586302,-74.0182314505144,-74.0186602176847,-74.0186913577419,-74.0187138228914,-74.0191768511388,-74.0191808901352,-74.0192315039128,-74.0193934357128,-74.0194276088975,-74.019747728448,-74.0201043756255,-74.0202469222392,-74.0203938499672,-74.0205447299712,-74.0206991218734,-74.0208565750431,-74.0210166299113,-74.0211788193131,-74.0213426698512,-74.0215077032786,-74.025146682482,-74.0293088286275,-74.0300514654768,-74.0308851121658,-74.0310161227128,-74.0314347165998,-74.0317963379444,-74.0318603999744,-74.0321315955129,-74.0327068147989,-74.0335922408201,-74.0337835067925,-74.0342728053947,-74.0343553603929,-74.0344300462957,-74.0344966293679,-74.0345392968579,-74.0345901403734,-74.0346489446757,-74.0347154608169,-74.0347894071938,-74.0348704707392,-74.0349583082476,-74.0350525478283,-74.0351527904791,-74.0352586117765,-74.0353037125144,-74.0353517024384,-74.0354021721903,-74.0354771543369,-74.0355494097886,-74.0356180767648,-74.035682336281,-74.0357414219166,-74.0357946289556,-74.0360397777792,-74.0360805816691,-74.0361133550141,-74.0362101028571,-74.03629809448,-74.0363772387649,-74.0364474537446,-74.0365086666884,-74.0365629009538,-74.0366254102351,-74.0366960674766,-74.0367747290519,-74.0368612350558,-74.0369554096287,-74.0370570613142,-74.0371659834482,-74.0372819545788,-74.0374047389161,-74.0375340868122,-74.0388202256032,-74.0390250218435,-74.0392919574696,-74.0395091473236,-74.0398606911968,-74.0402342727845,-74.0403813233868,-74.0404761202149,-74.0407276051782,-74.0408614076925,-74.0410175065469,-74.041127772883,-74.0413752289159,-74.0414338599224,-74.0414854001621,-74.0415296679683,-74.0415665073013,-74.0415957882992,-74.0416174077357,-74.0416221976546,-74.0416233689153,-74.0416178557304,-74.0416033381146,-74.041579840425,-74.0415996813114,-74.0416711974167,-74.0417493234625,-74.0416949017986,-74.0417083251721,-74.0417101581247,-74.0417579401213,-74.0417987681907,-74.0418325674458,-74.041859275884,-74.0418788445011,-74.0418912373814,-74.0418964317639,-74.0418966070505,-74.0418943598296,-74.0418876636111,-74.0418765259563,-74.0417566930148,-74.041683215349,-74.0416420772686,-74.0415662473388,-74.0414291871028,-74.0414165035367,-74.0413007668797,-74.0412729956255,-74.0410906211761,-74.0411031727376,-74.0411068494917,-74.041101632208,-74.0410875480839,-74.0410646706034,-74.0410331191542,-74.040993058405,-74.0409446974472,-74.0408882887033,-74.0408241266104,-74.0407525460831,-74.0406588539327,-74.0402891153532,-74.0401548100985,-74.0399179062505,-74.039293886904,-74.0384323056844,-74.0381605859819,-74.0378337608468,-74.0374542493744,-74.0371680252796,-74.0368066204885,-74.0387629792076,-74.0386880469073,-74.0367248437488,-74.036606414452,-74.0364794917536,-74.0363441848625,-74.0362006102107,-74.0360856095201,-74.0359659274961,-74.0358416240743,-74.0357127615073,-74.0359803944726,-74.0363505536881,-74.0367398662957,-74.0367572887095,-74.0367703428426,-74.0367786854673,-74.0367820972313,-74.0367804884261,-74.0367739013457,-74.0367625091755,-74.0367466114392,-74.0367266261241,-74.0367030786911,-74.0344519318136,-74.0345382973941,-74.0340732929426,-74.0328750723012,-74.032641289603,-74.0322971135638,-74.0322352443678,-74.0324696878725,-74.0325417379564,-74.032310843001],"lat":[40.6440392144804,40.6438578080477,40.6402700203256,40.640630519108,40.6399833864462,40.6399533646609,40.6399239349924,40.6393203336925,40.6394447739147,40.6395332128084,40.6395673354794,40.6396857318486,40.6397977817249,40.6399015146036,40.6399953259269,40.6399346044787,40.6397085283277,40.6392848596933,40.6391813932466,40.6391176950941,40.6390864953723,40.6389828433429,40.6388806121901,40.6387800151832,40.6386812621815,40.6385845594067,40.6384901083802,40.6383981061366,40.6383087446018,40.6382635879785,40.6382266915978,40.6380803058091,40.6379594688674,40.6377745918535,40.6375973527029,40.637437238496,40.6372314829131,40.6372013433337,40.6370978064117,40.6369602855955,40.6361384510949,40.6353974741061,40.6347410636714,40.6345790963294,40.6344948005997,40.634405553255,40.6343114420795,40.6342125596412,40.6341090032007,40.6340008746154,40.6338882802393,40.6323754580869,40.6320168033571,40.6307116464701,40.6293467864133,40.6280287270261,40.6273882283809,40.6267101558363,40.6264250051576,40.6263767110243,40.6258157066096,40.6252565916406,40.6246552468466,40.6240506226048,40.6234899390831,40.622842712352,40.6223724273197,40.621814274427,40.6212536433395,40.6206954038477,40.6201361890691,40.6195768539982,40.6189731540266,40.6183704772606,40.6178147169019,40.6172539464371,40.6166944608693,40.6161331807064,40.6155758234432,40.6150150960399,40.6144566426455,40.6138966114925,40.6133390442023,40.6127350291876,40.6110373979196,40.6093563841185,40.6076544169712,40.6072332661004,40.6068415242769,40.605975924814,40.6056826353559,40.6051378246966,40.6049651043263,40.6048504972353,40.6043657351264,40.6043152228267,40.6042526088174,40.6041819577837,40.6041084725031,40.6036410675919,40.6036079239394,40.6035820759073,40.6031544223004,40.6031495946108,40.6031021742476,40.6029117612817,40.602871578348,40.6030848092639,40.603259552474,40.6033243178239,40.6033831211798,40.6034357909078,40.6034821732763,40.6035221329049,40.6035555531597,40.6035823364936,40.6036024047313,40.6036156992975,40.60408312423,40.6045990640619,40.604759173812,40.6051845642557,40.6052514141152,40.6055294663082,40.605780274596,40.6058111847287,40.6059018357617,40.6063310660381,40.6070826074389,40.6072543503886,40.607717478733,40.6078229744082,40.607931823169,40.6080436844216,40.6081405553546,40.6082351064089,40.6083269372528,40.6084156590702,40.6085008962076,40.6085822877641,40.6086594891201,40.6087321733968,40.6088000328398,40.608862780123,40.6088882352687,40.6089104106755,40.6089291171841,40.6089450487606,40.6089671168761,40.6089950583281,40.6090285398638,40.6090671621539,40.6091104645554,40.6092956390019,40.6093468863875,40.6093947289095,40.6096010411228,40.6098096179503,40.6100202435996,40.6102327001566,40.6104467678108,40.6105875865767,40.6107263988675,40.6108629224212,40.6109968796283,40.6111279980958,40.6112560112018,40.6113806586373,40.6115016869359,40.6116188499891,40.6117319095473,40.6118406357038,40.612957940882,40.6131589759483,40.6134558235079,40.6137892029902,40.6143355465455,40.6150282566493,40.6153417823284,40.6156252631615,40.6170504163953,40.6176307657876,40.6183078055248,40.618786056113,40.6199935529653,40.6200832821062,40.6201755041769,40.62026989417,40.6203661194366,40.6204638408585,40.6205627140432,40.620668758078,40.6207748611502,40.6209422590323,40.621109343823,40.6212758344175,40.6214663151838,40.6220918059191,40.6224569956695,40.6228024562284,40.6232449341951,40.6233053206118,40.6234283208546,40.6235527668442,40.6236784304404,40.6238050812695,40.6239324871463,40.6240604145004,40.624188628804,40.6242174302818,40.6243182189414,40.6244188929392,40.6245193382939,40.6250550601989,40.6253835421746,40.6260093584274,40.6267435941552,40.6280706656596,40.6281499605455,40.6290060532216,40.6291410646544,40.6297257009313,40.6298190015033,40.6299127490165,40.6300064541015,40.6300996276081,40.630191783159,40.630282439689,40.6303711239559,40.6304573730111,40.6305407366167,40.6306207795958,40.6306970841042,40.6308887529338,40.6317163045763,40.6320169015631,40.6325344437072,40.6338863542965,40.6356851891421,40.6362439805844,40.6369160833307,40.6376965153073,40.6382850965695,40.6389842215455,40.6395882589806,40.6397382560296,40.6391411902067,40.6393630185794,40.6395821044715,40.6397982592301,40.6400112967246,40.6401715914976,40.6403298853458,40.6404860989534,40.6406401540465,40.6409459495711,40.6411543836094,40.6414763654588,40.6414958750387,40.6415172730086,40.6415399967658,40.6415634488493,40.6415870126479,40.6416100686124,40.6416320105453,40.6416522615392,40.6416702891449,40.6416856193715,40.6438267866824,40.6438763815101,40.6443139329639,40.6435833153871,40.6437873129417,40.643581313015,40.6436433701554,40.6437861263341,40.643825484352,40.6440392144804]}]],[[{"lng":[-73.9097168486006,-73.9097303218179,-73.909748234711,-73.9099505152206,-73.9099683724985,-73.9100230764213,-73.9100323390824,-73.9100376297162,-73.9100029708461,-73.909983872491,-73.9097683869871,-73.9097851795935,-73.9097717067779,-73.9097168486006],"lat":[40.5652874254607,40.565263518328,40.5652695117089,40.5648999443351,40.5648706997616,40.5647802095385,40.5647888042025,40.5647937111051,40.5648448175586,40.5648798823218,40.5652755073489,40.5652806451071,40.5653054053081,40.5652874254607]}],[{"lng":[-73.9119255184388,-73.9119249780236,-73.9119129970696,-73.9118955622332,-73.9118923943234,-73.9118751880938,-73.9118580902939,-73.9114511965002,-73.9113379662561,-73.9111700100362,-73.9110738230738,-73.91079817683,-73.9107982674948,-73.9105608869093,-73.9103319353975,-73.9103067522018,-73.9103190147384,-73.9101749642071,-73.9101740613076,-73.9103921070443,-73.9103724216721,-73.9105513242827,-73.9106016875131,-73.9106472927737,-73.9106880765446,-73.910697665914,-73.9102645150204,-73.90958244807,-73.909478379881,-73.909381011384,-73.9092904720366,-73.9092068804637,-73.9084593012586,-73.9083539581391,-73.9091819173441,-73.9095063011081,-73.9095035521169,-73.9094791811542,-73.9092829979288,-73.9090849517405,-73.9087973049183,-73.9117395760218,-73.9162568481325,-73.9170143918727,-73.9178065311057,-73.9186664376506,-73.9194812234374,-73.9264190946264,-73.9285424483302,-73.9288400241461,-73.9290987825575,-73.9295011378781,-73.929653742719,-73.9298294383554,-73.9304248548829,-73.9311865092941,-73.9322220409448,-73.9317759997137,-73.9313670120434,-73.928785000305,-73.9282838813482,-73.9281018253143,-73.9279240530811,-73.9277507710773,-73.9275821805212,-73.9274184771864,-73.9272598511749,-73.9270731982572,-73.9268913825356,-73.9261572320952,-73.9258652370387,-73.9256842660726,-73.9255872177415,-73.9254500300139,-73.9252989680378,-73.9251005278679,-73.9246627109143,-73.9242146123668,-73.9232948420831,-73.9227870295444,-73.9220824879531,-73.9210782281548,-73.9203681028045,-73.920201488048,-73.9202059671435,-73.9201969854857,-73.920240673625,-73.920259631071,-73.9201173594527,-73.9200984008251,-73.9201443328769,-73.9201690188257,-73.9201757395464,-73.9203312014267,-73.9201787725894,-73.9196239733509,-73.9190976194402,-73.9176608190009,-73.917225769588,-73.9168009798367,-73.91649706703,-73.9161048943738,-73.9156798655151,-73.915524404278,-73.915191311702,-73.9148338659629,-73.9145533689538,-73.913867496264,-73.9132438842566,-73.9131318012794,-73.9122020070342,-73.9121594295398,-73.9118831959703,-73.9119025883587,-73.9119211284959,-73.911926920704,-73.9119421181112,-73.9119552267277,-73.9119546436619,-73.9119815277005,-73.9121450951884,-73.912161819591,-73.9119702481841,-73.9117361534007,-73.9117351104733,-73.9119255184388],"lat":[40.5658138623767,40.5657367218824,40.5654796093025,40.5651114502878,40.5651015945948,40.5650480554683,40.5649954380033,40.5651030371663,40.565068125911,40.5650585144619,40.5650530092225,40.5651109963341,40.5650430970932,40.5650073501188,40.5650168707514,40.5650049363722,40.5649656474842,40.5649227235295,40.5649234019891,40.5645112691349,40.5644010327536,40.5641210305939,40.5640245197434,40.5639266427128,40.5638275358726,40.5634150375821,40.5623964513697,40.5613848048471,40.5612456215229,40.5611036463112,40.5609590664902,40.5608120732341,40.5608085329923,40.5607544805896,40.5607571956874,40.5607619785479,40.5607179770173,40.5604436355842,40.5569972416293,40.5561133452459,40.5548295083884,40.5537082477529,40.5519710661188,40.5516238123081,40.5512792955979,40.5510038380795,40.5506248153475,40.548155780823,40.5520049120728,40.5524975322778,40.5530934450985,40.5538409491934,40.5541249241834,40.5544572271851,40.5555833186755,40.5570158313271,40.5576763419598,40.5578999999187,40.5581764796731,40.5599260000763,40.560149121598,40.5602426545397,40.5603408639174,40.5604436357011,40.5605508505628,40.5606623840153,40.560778106556,40.5609103340846,40.5610464257207,40.5615526097227,40.5616517408228,40.5617005759089,40.5617252284096,40.5617600754396,40.5618071555221,40.5618292784331,40.5619224583034,40.5620013188244,40.5620905804516,40.5620671964763,40.5620744473305,40.5620798528844,40.5622188324676,40.5625319610129,40.562532817689,40.5625507493656,40.5625439461716,40.5626122930581,40.5626395263476,40.5625711806096,40.5625618176502,40.5625225428773,40.5625225475482,40.5622260548866,40.5622558861274,40.5623658432259,40.5624701612084,40.5628261496865,40.5629865531698,40.5631854967995,40.5633372024824,40.5635585818893,40.5638166471417,40.5639038435663,40.5640906667103,40.5642420555416,40.5643534324333,40.5646080961419,40.5646561583481,40.5646382444486,40.5650545698495,40.5649714827409,40.5649904057408,40.5650444796229,40.5650961752655,40.5651123285709,40.5654796316312,40.5657316205047,40.5658113226729,40.5658096349759,40.5657790089394,40.5658362520712,40.565869417533,40.5658726534857,40.56581371622,40.5658138623767]}],[{"lng":[-73.8905023530036,-73.8902853709935,-73.890164958552,-73.8900867519944,-73.8900607421668,-73.8900201856575,-73.8899339515348,-73.8896291503377,-73.8895949238329,-73.8894412417433,-73.8894082306153,-73.8891110313813,-73.8889112469059,-73.8887900084631,-73.8886612893331,-73.8884018070009,-73.888399354335,-73.8883943149822,-73.8883907733278,-73.8883830456706,-73.8883680303089,-73.8883595070434,-73.8883473569274,-73.8883446776343,-73.888343773765,-73.8883431199295,-73.888340978466,-73.888188674625,-73.8880566091741,-73.8879664227046,-73.8878622257412,-73.887473784751,-73.8868763825338,-73.8868610567602,-73.8865468400235,-73.8858879004769,-73.8854913682334,-73.8854058149184,-73.8853686026088,-73.8858303730299,-73.8866055656849,-73.8869064451001,-73.8878212259585,-73.8881241945653,-73.8890262404147,-73.889125659432,-73.8895703529338,-73.890570511465,-73.8909195104634,-73.891048940677,-73.8912701145646,-73.8914974334037,-73.8943470682738,-73.8945535639848,-73.8945658095034,-73.895265425395,-73.8954479581841,-73.8953795134035,-73.8953135264294,-73.895265977316,-73.8952436289779,-73.8951870485933,-73.895148792278,-73.895116856669,-73.8950463220106,-73.8948540376939,-73.8947957203479,-73.8945970958608,-73.8943825749535,-73.8943641990722,-73.8941302815936,-73.893963288209,-73.8936594640261,-73.8934546778162,-73.8932625507133,-73.893141192271,-73.8928058167791,-73.8926101337963,-73.8925692981124,-73.8924941323068,-73.89235367291,-73.8922838107672,-73.892144688497,-73.8919476841919,-73.8918459414204,-73.8917327234491,-73.8914645256912,-73.891208364166,-73.8910600526065,-73.8907572912292,-73.8905023530036],"lat":[40.5681832359058,40.5681723756464,40.5682285252773,40.568169502443,40.5681452622973,40.5680909838695,40.568072954144,40.5679825995205,40.5679418902334,40.5679368972911,40.5679262134683,40.5679162366916,40.5679256345658,40.5679313340535,40.5679681039404,40.5680790674466,40.5680908264912,40.5681034367543,40.5681245331852,40.5681412206882,40.5681449259279,40.5681436747411,40.5681356211677,40.5681205078807,40.5680957159468,40.568077740037,40.5680660225985,40.5680335180839,40.568016918935,40.5680187683238,40.5680380449872,40.5681302387245,40.5683498398471,40.5683832977038,40.5684709781101,40.5675683645135,40.5670251824339,40.5669072318635,40.5668570118532,40.566722113205,40.5665087635952,40.5664265363888,40.5661741689034,40.5660903826884,40.5658404168571,40.5658130120109,40.5656904269484,40.5654095554544,40.5653133321118,40.5652776506503,40.5652166696303,40.565153036464,40.5643488998972,40.5642906252657,40.5643299855738,40.5663164316821,40.566858506537,40.5668950154642,40.5669199792661,40.5669138413556,40.566910957055,40.5669136013296,40.5669583995599,40.5670308640542,40.5671909146972,40.5673270295054,40.5673683107278,40.5674821167302,40.5676418074104,40.5676499673055,40.5678201496535,40.567928148645,40.5681037138815,40.56823501906,40.5683333123386,40.5683953984464,40.5685149106194,40.5685872477887,40.5685588057726,40.5685308109202,40.5685261141927,40.5685118378231,40.5685056098667,40.5684891798645,40.5684729902008,40.5684549737768,40.5684151240162,40.5683448297941,40.5683041297756,40.5682210478606,40.5681832359058]}],[{"lng":[-73.7666913977135,-73.7666477018893,-73.7665986674209,-73.7665602979091,-73.7665232418954,-73.7664914318716,-73.7664464576801,-73.7664094440771,-73.7663657306391,-73.7663101310163,-73.7662651847383,-73.7662374781758,-73.7662044835291,-73.7661953290391,-73.7661742245558,-73.7661279329225,-73.7661121090666,-73.7660750815448,-73.7660526530638,-73.7660076778543,-73.7659759528507,-73.7659243122233,-73.7658938299061,-73.765844850688,-73.7658197721987,-73.7657747736255,-73.765719156196,-73.765672818082,-73.7656106179882,-73.7655497419896,-73.7655401979789,-73.7655326188811,-73.7655192439421,-73.7655034074654,-73.7654623457203,-73.7654200037884,-73.7654092152309,-73.7653989138705,-73.7653711122996,-73.7653663229943,-73.7653617624717,-73.7653405135711,-73.7653007978494,-73.7652862732978,-73.7652558983956,-73.7652096838289,-73.7652003132122,-73.765164008292,-73.7651489819561,-73.7651244912456,-73.7651136919524,-73.7650837827247,-73.7650603169688,-73.7650410483942,-73.7650255433501,-73.7650205004747,-73.7650172452292,-73.765015802201,-73.7650161460726,-73.7650182993051,-73.7650222420731,-73.7650279821982,-73.7650355466587,-73.7650381399819,-73.7650418547915,-73.765046739584,-73.7650528760445,-73.7650659481678,-73.7650987474004,-73.7651121765244,-73.7651171900261,-73.7651210801833,-73.7651238968659,-73.7651256864326,-73.7651373334552,-73.7651459281289,-73.7651515583102,-73.7651522387342,-73.7651542947895,-73.7651570765323,-73.7651556119947,-73.7651520685323,-73.7651457337866,-73.7651292425045,-73.7651237245843,-73.7651121841273,-73.7651083781552,-73.7651084347684,-73.7651113058518,-73.7651175619946,-73.7651187061249,-73.7651173731579,-73.7651129101092,-73.7651112450397,-73.7651094871159,-73.7651052819416,-73.7651002941461,-73.7650945113865,-73.7650442537034,-73.764995416925,-73.7649901655348,-73.7649856141369,-73.764981866706,-73.7649790064601,-73.7649777241999,-73.7649773764182,-73.7649779522445,-73.7649794611303,-73.7649850532324,-73.7649889944852,-73.7649935240493,-73.7650064757232,-73.7650393215519,-73.7650533511493,-73.7650867769187,-73.7650920546499,-73.7650963161965,-73.7650995138344,-73.7651016127529,-73.7651038576635,-73.7651035556139,-73.7650936512162,-73.7650919126018,-73.7650894825733,-73.7650868738951,-73.765083303937,-73.7650787143525,-73.7650760288008,-73.7650730701541,-73.7650596167917,-73.7650436710001,-73.7649867680617,-73.7648851174193,-73.7648108217639,-73.764737825289,-73.7646658821167,-73.7645948390174,-73.7645526582224,-73.7645047305972,-73.7644550119138,-73.764353727133,-73.7641892443344,-73.7641399905812,-73.7640954648178,-73.7639982263801,-73.7638417149627,-73.7637222993265,-73.7636707130079,-73.7636633777051,-73.7636559011754,-73.7636402708839,-73.7636235607262,-73.7635748550324,-73.7635588366432,-73.7635438981197,-73.7635366099538,-73.7635285855172,-73.7634931119177,-73.7634847202602,-73.7634772180944,-73.7634254550879,-73.7633741106811,-73.7633233744208,-73.7632734247828,-73.7632367879683,-73.7632225585992,-73.7631985527308,-73.7631892622387,-73.7631581383879,-73.7631138926215,-73.763026155521,-73.7629480917049,-73.7628969845188,-73.7627584898812,-73.7627139744242,-73.7626677312548,-73.7626197487923,-73.7625699784138,-73.7625187378768,-73.7624610850704,-73.7623961501984,-73.7623044835185,-73.7622994409043,-73.7617241378888,-73.7610151274559,-73.7602363575698,-73.7607673039872,-73.76087049521,-73.7610310763763,-73.7610671269154,-73.7611734484292,-73.761782429606,-73.7615505190589,-73.7615442281979,-73.7614683859222,-73.7614205228462,-73.7614045713529,-73.761261309996,-73.7611066075837,-73.7608468611397,-73.760668143153,-73.760569138445,-73.7603213354934,-73.7599844697484,-73.7594911983339,-73.7597357109902,-73.7597209903911,-73.7597057873169,-73.7596824361514,-73.7596591369825,-73.7596365808956,-73.7596154369353,-73.7595963322614,-73.7595798335462,-73.7595664301666,-73.7595565196879,-73.7595090291909,-73.7595011327068,-73.7594903676904,-73.7594770529798,-73.7594615829308,-73.7594444157369,-73.7593629284582,-73.7592801215763,-73.7591967293208,-73.7591134911122,-73.7591044220478,-73.7590702252238,-73.7590451147308,-73.759008128299,-73.7589872166545,-73.7589569701422,-73.7589203023739,-73.7588892467426,-73.7588511420089,-73.7588313612004,-73.7588003973069,-73.7587807106553,-73.7587456244265,-73.7587131086047,-73.7586833311999,-73.7586488378751,-73.7586119326827,-73.758582660223,-73.7585466548193,-73.7585090305671,-73.7584802284604,-73.7584467751967,-73.758417026303,-73.7583833893642,-73.7583492965338,-73.758321477724,-73.7582992606989,-73.7582955003337,-73.7582912547755,-73.7582577507584,-73.7582269006986,-73.7581949143401,-73.7581588990949,-73.7581210525278,-73.7580882548818,-73.7580543726852,-73.7580288046063,-73.758001900818,-73.7579740245019,-73.7579443471631,-73.7579102259766,-73.7578855949994,-73.7578490881041,-73.7578182051052,-73.7577894051914,-73.7577540874121,-73.7577243390536,-73.7576878695922,-73.7576599890832,-73.7576207438533,-73.7575877699895,-73.7575575344091,-73.7575277924032,-73.7574948356595,-73.757475345603,-73.7574384823873,-73.7574062363816,-73.7573830080019,-73.7573738042192,-73.7573697504805,-73.7573590559356,-73.7573383590768,-73.7573166656676,-73.7572997607122,-73.7572970359315,-73.7572957334404,-73.7572750037202,-73.7572437358534,-73.7572132104499,-73.7571818402145,-73.7571488683707,-73.7571185169416,-73.7570863402528,-73.7570510386322,-73.7570156646704,-73.7569814148009,-73.7569543997968,-73.7569350479991,-73.756894675878,-73.7568732373591,-73.7568405593607,-73.7568151155203,-73.7567834420213,-73.7567518741128,-73.7567259437505,-73.7566887908651,-73.7566587303668,-73.756630566574,-73.7566070879791,-73.7565891619184,-73.756578949253,-73.7565605340319,-73.7565349349472,-73.756506179424,-73.7564824532646,-73.756442672371,-73.7564142113711,-73.7563872009586,-73.7563612625333,-73.7563383711574,-73.7563043092811,-73.7562758393677,-73.7562514657054,-73.7562195967062,-73.7562013112423,-73.7561929480639,-73.756155102311,-73.7561262228225,-73.7560929451583,-73.7560742404356,-73.7560504209596,-73.756034944986,-73.7560151393083,-73.7559977524841,-73.7559884095663,-73.7559819898068,-73.7559813832174,-73.7559786925961,-73.7559682129282,-73.7559632628383,-73.7559297420021,-73.7558960638692,-73.7558709128561,-73.7558399967387,-73.7558179839118,-73.7557930946159,-73.7557745440193,-73.7557557543616,-73.7557368120963,-73.755718096898,-73.7557028589204,-73.7556838651025,-73.7556719830031,-73.7556621033869,-73.7556486346495,-73.7556289047755,-73.7556068472615,-73.7555975529572,-73.7555949635375,-73.7555978966168,-73.7556018295172,-73.7556137466023,-73.7556225904002,-73.7558089283855,-73.7558725146728,-73.7558763762554,-73.755875612163,-73.7558741291214,-73.7556992596434,-73.755697464001,-73.7556997446915,-73.755701731513,-73.7557163433209,-73.7557572725982,-73.7557116739463,-73.7555636908416,-73.7555021896631,-73.7554509484917,-73.7553991550046,-73.7553482567732,-73.755299676348,-73.7552734733896,-73.75524482136,-73.7552145695948,-73.7551836148515,-73.7551528747266,-73.7551232604544,-73.7550956498949,-73.7550708615107,-73.7550519351809,-73.7550327012424,-73.7550135854277,-73.7549950108548,-73.7549773886616,-73.754961108906,-73.7549458357652,-73.7548942103441,-73.7548479687316,-73.7548076524533,-73.7547737336485,-73.7547466095408,-73.7547344981683,-73.7547321957257,-73.7534583619682,-73.7500877107679,-73.7491200068025,-73.7482158588267,-73.7479930731725,-73.7476141892919,-73.7472156788501,-73.7469209647418,-73.7468553902455,-73.7457615017868,-73.7456211251228,-73.7453675171237,-73.7445665806748,-73.7438698184871,-73.7433707107956,-73.7431089457377,-73.7433249333374,-73.7433973152214,-73.7431465521456,-73.7412136685223,-73.7402913897614,-73.7392073980312,-73.7384039445363,-73.7383943842241,-73.7382259779417,-73.7382621923208,-73.7383645985682,-73.7383696113806,-73.7383660305963,-73.7383650460103,-73.7383615469628,-73.7383551712838,-73.7383561770227,-73.7386528027747,-73.7386274447949,-73.7385771682641,-73.7385738210247,-73.7385588463223,-73.7385035556856,-73.7384890040081,-73.7385085497771,-73.7385242380761,-73.7385429505286,-73.738560378395,-73.7385661122164,-73.7385880917945,-73.7386138969057,-73.7386248616551,-73.7386440737476,-73.7386553784339,-73.7386595499101,-73.7386842310519,-73.738690785487,-73.7387154873914,-73.738719680769,-73.7387382318955,-73.7385746161792,-73.7385880505228,-73.7385846673763,-73.7386264125461,-73.7386278141483,-73.73863304587,-73.7387600455039,-73.7387626305711,-73.7387662111787,-73.7387706803131,-73.7387759044052,-73.7387817273228,-73.7387879750365,-73.7387944608211,-73.7388009908363,-73.7388073699198,-73.7388134074202,-73.738818922895,-73.7388237515033,-73.7388277489326,-73.7388307957117,-73.7388328007814,-73.7388826858174,-73.7389394379819,-73.7390023579786,-73.7390706705059,-73.7391435338104,-73.7392200500596,-73.739299276405,-73.7393802366018,-73.7394619330383,-73.7395433590301,-73.7396289716528,-73.7397109987354,-73.7397886075914,-73.7398610103888,-73.7399274721486,-73.7399873182058,-73.7400399410583,-73.7400848065331,-73.7401054361675,-73.7401179793492,-73.7401221145523,-73.7401177357879,-73.740104955319,-73.7400841007809,-73.7400627513083,-73.7400342775386,-73.7399992661043,-73.7399584383248,-73.7399126353454,-73.7398628008077,-73.739809961409,-73.7398054369596,-73.73980187245,-73.7397993679075,-73.739797993614,-73.7397977881349,-73.739798757236,-73.739904078141,-73.7400370304209,-73.7400695477712,-73.7400971426267,-73.7401181821894,-73.7401537610051,-73.7402507506906,-73.7403090535136,-73.7403915383498,-73.7403929448337,-73.7403475207994,-73.7403490082914,-73.7403327952407,-73.7402839300583,-73.7402820405415,-73.7403601274953,-73.7403823249003,-73.7404096033572,-73.7404411814553,-73.7404761546151,-73.7405135210003,-73.7405522102172,-73.7405595562073,-73.7405671573938,-73.7405748242826,-73.7405823657417,-73.7405895937659,-73.7405963281638,-73.7406024010499,-73.7406076610296,-73.740611976974,-73.7406183407659,-73.7406210251857,-73.7406199604062,-73.7406151741204,-73.7406067908214,-73.740609214101,-73.7406133485253,-73.7406190703894,-73.7406262084907,-73.7406345492511,-73.7406438431082,-73.740685301377,-73.7407257793269,-73.740764118855,-73.7407992230416,-73.7408030758657,-73.7408076996294,-73.7408129972653,-73.7408188575598,-73.7408251574871,-73.7408579579208,-73.7408916351949,-73.7409252451211,-73.7409578453994,-73.7409885220371,-73.7409930685405,-73.7409973317634,-73.7410011967164,-73.7410045591522,-73.7410073283778,-73.7410094297005,-73.7410108064426,-73.7410114214702,-73.7410112581946,-73.7410103210199,-73.7410086352239,-73.741006246277,-73.7410032186147,-73.7410017981389,-73.7409998522408,-73.7409974344513,-73.740994611283,-73.7409914604,-73.7409880684822,-73.74098452884,-73.7409809388477,-73.7409773972647,-73.7409740015188,-73.7409708450258,-73.7409683621983,-73.7409657470704,-73.7409630671784,-73.7409603917312,-73.7409577898232,-73.7409553286493,-73.74095307177,-73.7409510774698,-73.7409493972522,-73.7409480745091,-73.7409471434008,-73.7409466279734,-73.740956196002,-73.7409693807286,-73.7409858217838,-73.7410050697972,-73.7410433797584,-73.7410831534284,-73.7411235170081,-73.7411635837387,-73.7411855306349,-73.7412076864951,-73.7412296241686,-73.7412509207111,-73.7412518896054,-73.7412535158919,-73.7412557560826,-73.7412585502726,-73.7412618237431,-73.7412654889587,-73.7412694479084,-73.7412735947267,-73.7412778185244,-73.7412820063536,-73.7412860462282,-73.7412898301188,-73.741293256841,-73.7412962347615,-73.7413031074448,-73.7413110980514,-73.7413199874781,-73.7413295319763,-73.7413394698348,-73.7413495285566,-73.7413577654794,-73.7413649505534,-73.7413709084442,-73.7413754937637,-73.7413785946179,-73.7413801353374,-73.7413800783241,-73.7413784249688,-73.7413984711753,-73.7414219257656,-73.7414217559189,-73.7414220701026,-73.7414228588891,-73.7414240986099,-73.741425752065,-73.7414277696403,-73.7414300907951,-73.7414326458796,-73.7414353582247,-73.7414381464422,-73.7414409268673,-73.7414436160691,-73.7414461333538,-73.7414660740348,-73.7414882777692,-73.7415121863709,-73.7415371987952,-73.7415626862489,-73.741565381164,-73.7415681865853,-73.7415710213159,-73.7415738033102,-73.7415764520494,-73.7415788908711,-73.7415810491888,-73.7415828645345,-73.7415842843668,-73.7415852675917,-73.7415857857519,-73.7415858238504,-73.7415853807844,-73.741597367067,-73.7416138813321,-73.741634506348,-73.7416587210272,-73.7416859135921,-73.7417153970309,-73.7417464264551,-73.7417782179177,-73.7417962923106,-73.7418109665087,-73.7418218077845,-73.7418284964411,-73.7418308352394,-73.7418287552142,-73.7418245143533,-73.7418168674444,-73.7418060003625,-73.7417918706979,-73.7417750222456,-73.7417558811879,-73.741734931698,-73.7417127036924,-73.7417037086443,-73.7416941850988,-73.7416843795402,-73.7416745457516,-73.7416649382468,-73.741655805683,-73.7416473844251,-73.7416398924282,-73.7416335235966,-73.7415957404517,-73.7415550609638,-73.7415123916912,-73.741153473001,-73.7409431357655,-73.7409414631759,-73.7409387973318,-73.7409352110898,-73.7409308024607,-73.7409256919307,-73.740920019169,-73.7409139392105,-73.7408748714649,-73.740833157289,-73.7407899463293,-73.7407464294828,-73.7407038060767,-73.7406611119079,-73.7406167457699,-73.7405714160901,-73.7405258466823,-73.740520598182,-73.7405157412708,-73.7405114232607,-73.7405077751186,-73.740504907494,-73.7405029073628,-73.7405018353897,-73.7405017240878,-73.7405025768327,-73.7405043677603,-73.7405070425509,-73.740510520077,-73.740514694864,-73.7405456370422,-73.7405709758138,-73.7405904358176,-73.740603805582,-73.7406109398226,-73.7406152597219,-73.7406107934655,-73.7405976600892,-73.7405762095955,-73.740547013624,-73.7405308245967,-73.7405114202689,-73.7405017613249,-73.7404938294606,-73.7404793008963,-73.7404591762314,-73.7404437182442,-73.7404145265139,-73.740301437487,-73.7402902294696,-73.7402223263084,-73.7401867050776,-73.73992792985,-73.7399149276756,-73.7398122932899,-73.739579049975,-73.7395315359668,-73.7396098805516,-73.7394637030306,-73.739482209896,-73.7394878180858,-73.7394966087367,-73.7395787016432,-73.739586315604,-73.7396975766965,-73.7397054367772,-73.7397511124264,-73.7397601084977,-73.7398110577149,-73.7398337462708,-73.7398465094775,-73.7398504168597,-73.739883060073,-73.7397948669749,-73.7397915823695,-73.7397336932096,-73.7397095010199,-73.7396551872421,-73.7396485337227,-73.7396962138201,-73.7397472402286,-73.7397539004343,-73.7397760233305,-73.7397798429376,-73.7398056637179,-73.7398110275669,-73.7398335157583,-73.7398378424684,-73.7398642497534,-73.7398682886114,-73.7398842055665,-73.7398966257443,-73.7399099469019,-73.7397963402894,-73.7396986631097,-73.7396933389029,-73.7396873668863,-73.7396357105085,-73.7395850473889,-73.7395740169378,-73.7395467196584,-73.7395174599581,-73.7395088586728,-73.739496522098,-73.7394552865932,-73.7394403349946,-73.7394309585005,-73.7394064975082,-73.7393981082489,-73.7393663946224,-73.7392417205815,-73.7392166950833,-73.7392084173552,-73.7391443475868,-73.7391385634967,-73.739081848153,-73.7390731939712,-73.7390157192885,-73.738928507263,-73.7389470451158,-73.7389726645639,-73.739046067227,-73.7390548498901,-73.7391094693468,-73.7391183037991,-73.7391675142764,-73.7391752880372,-73.7392231749774,-73.7392355386212,-73.739288082365,-73.7392961042102,-73.7393428322753,-73.7393979636385,-73.739447490424,-73.7394449744967,-73.739455832885,-73.7394395712474,-73.739332787064,-73.7391068300239,-73.7391230771092,-73.738946906941,-73.7388930801942,-73.7388552026586,-73.7383836040119,-73.7384106531874,-73.7384123110008,-73.7380516362654,-73.7380323102608,-73.7379898178098,-73.7380612247594,-73.7381702454363,-73.738261225563,-73.7382939615529,-73.7383669401855,-73.7384019028317,-73.7384283324355,-73.738448422413,-73.7384609175789,-73.7384600986037,-73.7384715971063,-73.7384874397197,-73.7385073171875,-73.7385204199478,-73.7385214043477,-73.7385341655638,-73.7385668195085,-73.7386568578937,-73.7386772728309,-73.7387488964859,-73.7387715307992,-73.7387781550138,-73.7387841880634,-73.73877005027,-73.7387775351491,-73.7388166251648,-73.7388111276207,-73.7387933849302,-73.7387913253896,-73.7387864497873,-73.7388343255079,-73.7388934919143,-73.7390019677829,-73.7390721241753,-73.7391072931772,-73.7391676497133,-73.7391954400391,-73.7392558939158,-73.7392769220234,-73.7392872963178,-73.7392851279439,-73.7392778049533,-73.7392810987523,-73.7392943062812,-73.7393040614292,-73.7393194110554,-73.7393266291088,-73.7393338592542,-73.7393485604136,-73.7393647240569,-73.7393965917047,-73.7394274948999,-73.7394588745489,-73.7394946578488,-73.7395276572986,-73.7395646533139,-73.7395650257312,-73.7395522688196,-73.7395524947196,-73.7395876329776,-73.7395874090206,-73.7395751975891,-73.7395749312188,-73.7395886488495,-73.7396196522245,-73.7396410602331,-73.7396745366049,-73.739695394656,-73.7396812312462,-73.7399580159236,-73.7399527501691,-73.7399867874933,-73.7400174641402,-73.7400474263918,-73.7400609815585,-73.7400729504349,-73.7400890894508,-73.7401080313917,-73.7401358036458,-73.7401413912174,-73.74013382011,-73.7401428669949,-73.74018445146,-73.7402112286486,-73.7402741209832,-73.7403296252842,-73.7403640876095,-73.7403919369295,-73.7404190326721,-73.7405061595839,-73.7406283206412,-73.7406515880709,-73.7406816322753,-73.7406975897843,-73.7407077349857,-73.7407393540938,-73.7407679033801,-73.7407927582371,-73.7408315167314,-73.7408386224034,-73.74083755554,-73.7408405427884,-73.7408533186527,-73.7408664322078,-73.7409017059618,-73.7409174097076,-73.7409156959837,-73.7409053346813,-73.7408887491255,-73.7408952027494,-73.7409401621547,-73.7409671798522,-73.7410299055339,-73.7410899703498,-73.7411263340129,-73.7411523383162,-73.7411810418561,-73.7412611561602,-73.7412949827084,-73.7413182062533,-73.7413728777919,-73.7414657806754,-73.7415005811382,-73.7415611899847,-73.7415916774987,-73.7416209169234,-73.7416408809994,-73.7416549849405,-73.7416577455779,-73.7416619727451,-73.7416763840125,-73.7416976630028,-73.7417173010716,-73.7417321898157,-73.7417401459872,-73.7417376616593,-73.7417497722409,-73.7417758878265,-73.7418015199148,-73.7418488883716,-73.7419149057843,-73.7419683684427,-73.7420222993206,-73.7420847378623,-73.742146604135,-73.7422260309707,-73.7422598820867,-73.7423222936312,-73.7424292633438,-73.7423874258488,-73.7426183753406,-73.7427604397498,-73.742774591011,-73.7427956338553,-73.7428096683661,-73.7428399399711,-73.7428748814147,-73.7429142453084,-73.7429744598867,-73.7430096921162,-73.7430410432954,-73.7430671734546,-73.7430994470636,-73.7431320293356,-73.7431661814968,-73.7431906932675,-73.7432206092645,-73.7432864969817,-73.7433196601969,-73.7433495160322,-73.743374408598,-73.7434020111233,-73.7434284540106,-73.7434529260186,-73.7434686761583,-73.7434702101365,-73.7434536853233,-73.7434557162718,-73.7434664263827,-73.7434844228224,-73.743502729374,-73.7435157298737,-73.7435345191668,-73.7435914535387,-73.7439938230992,-73.7441528113984,-73.7445247361909,-73.7446249979318,-73.7447255144534,-73.7450753615092,-73.7451531438331,-73.7452518587278,-73.7453976826242,-73.7457728613277,-73.7458874270436,-73.745980818178,-73.7460697802647,-73.7463441143408,-73.746430952744,-73.74658189443,-73.74662917813,-73.7466551146475,-73.7467602247804,-73.7468430289712,-73.7468796171076,-73.7469244048254,-73.7469887765248,-73.7470549169793,-73.7471202305351,-73.7471289151914,-73.7471531455304,-73.7471920982158,-73.7472252253302,-73.7472958360232,-73.7473690085107,-73.7474520466475,-73.7475836949817,-73.7476488596553,-73.7477082486333,-73.7478133146639,-73.7479374339949,-73.7480052388263,-73.7481792909626,-73.7482356509745,-73.7484115035692,-73.7486427305113,-73.7491252475753,-73.7493782467932,-73.7494324308571,-73.7495333267301,-73.7495922240713,-73.7497212168937,-73.7498653957973,-73.7499500876097,-73.7500495158626,-73.7502436192121,-73.7504993610352,-73.7506576904048,-73.7509408586591,-73.7510498732506,-73.7511480968751,-73.7512284827897,-73.7513212284759,-73.7514266873623,-73.7515681879929,-73.7516005680158,-73.7516936949566,-73.751752703735,-73.7518207622913,-73.751903131566,-73.7519461234433,-73.7519909556692,-73.7521369040945,-73.7522451183051,-73.7523289009096,-73.7524904950323,-73.7525509695599,-73.7525879142063,-73.7526296141386,-73.7526638778546,-73.7526976313684,-73.7527546476937,-73.752780986616,-73.752845799607,-73.7529076354062,-73.7529669924522,-73.753027794334,-73.7530506404061,-73.7530878451759,-73.7531841652795,-73.7532158643339,-73.7532979266633,-73.7533495446751,-73.7533726256097,-73.7534093039575,-73.7534478017782,-73.7534761216802,-73.7535096482518,-73.7535728695853,-73.7536416988834,-73.7536685947132,-73.7537020707026,-73.7537349479359,-73.7537715525036,-73.7538236317265,-73.7538680481762,-73.7539055518399,-73.7539865893047,-73.7541866590037,-73.7542599069499,-73.7543100035587,-73.7543300032088,-73.7544007991898,-73.7544633674703,-73.7545004779169,-73.7545170678507,-73.7545407182493,-73.7545700192771,-73.7546061805103,-73.7546653161473,-73.7547003070945,-73.754733625594,-73.7547625541292,-73.7547964695811,-73.7548915446743,-73.7549219234696,-73.7549510610879,-73.7549872525134,-73.7550156960268,-73.7551455854891,-73.7552157883921,-73.7552709556114,-73.7553212007629,-73.7553629738859,-73.7554604309609,-73.755489500361,-73.7555324690533,-73.7556957125513,-73.7557526725645,-73.7557859743641,-73.7558248968662,-73.7558548084831,-73.7559179084112,-73.7559546362307,-73.7560203659541,-73.7560502459825,-73.7560772338772,-73.756104797244,-73.756131800095,-73.7561627833196,-73.7561947863888,-73.756231544015,-73.7562599980219,-73.7562917989764,-73.7563250288547,-73.7563578301109,-73.7563887888308,-73.7564219951325,-73.7564523134088,-73.7564821055078,-73.7565122844903,-73.7565446269331,-73.7565782747532,-73.7566122470615,-73.7566401205727,-73.7566705429374,-73.7566986632362,-73.7567552578205,-73.7568249426793,-73.7569180670109,-73.7569473416197,-73.7570024510165,-73.7570341941707,-73.7570629735927,-73.7571132833222,-73.7571455457802,-73.7571765504006,-73.7572010810555,-73.7572211627072,-73.7572407067868,-73.7573025728899,-73.7573363936922,-73.7573966376476,-73.7574518605696,-73.7574835055543,-73.7575146637452,-73.7575576526476,-73.7576233155973,-73.7576758748623,-73.7577333429522,-73.7577894312456,-73.757852857213,-73.7578918986187,-73.7579563751517,-73.7579880115994,-73.7580128027423,-73.7580409764196,-73.7581118140114,-73.7581377746055,-73.758166435227,-73.7582978144265,-73.7585620020177,-73.7587153707653,-73.7587894526425,-73.7588598162934,-73.758927855118,-73.7590452190125,-73.7590624957915,-73.7591446261356,-73.7592283619631,-73.7592871448224,-73.7593801075517,-73.7594748651791,-73.7596005418234,-73.7596717559462,-73.7596957062161,-73.7597673492067,-73.7597929480672,-73.759896586545,-73.759948092556,-73.7600703156496,-73.7601656007759,-73.7602359571861,-73.7603092441357,-73.7603820592078,-73.7604182481032,-73.7605495401333,-73.7606527996974,-73.7607857300814,-73.760843822574,-73.7609554874374,-73.7610830583577,-73.7612089514511,-73.7612787298498,-73.7613431167833,-73.7614122929294,-73.7615703049741,-73.7617209878914,-73.7622997805491,-73.7623641622963,-73.7624396704495,-73.7627614686995,-73.7629527557214,-73.7630382243593,-73.7630843059676,-73.763476521516,-73.7635405786842,-73.7637622344744,-73.7640987935915,-73.764282068166,-73.7646392316699,-73.7649902320435,-73.7651713998932,-73.7654199496351,-73.7655172350702,-73.7656728520302,-73.7660473654207,-73.7662277217002,-73.7663250125615,-73.766425974719,-73.7666506848434,-73.7667497184508,-73.7670483246079,-73.7671948161463,-73.7673542988743,-73.7674534552508,-73.7674668729755,-73.7676217203533,-73.7677627986511,-73.767969730065,-73.7680714748103,-73.7681334550013,-73.7682199338214,-73.7682863640962,-73.7684439384153,-73.7685869548803,-73.7687270852515,-73.7688338763409,-73.768858473005,-73.7691002392612,-73.7693599793007,-73.7696446912666,-73.7698264315575,-73.7698621754479,-73.7699007081697,-73.7700635097177,-73.7701024390404,-73.7701380031976,-73.7704956266261,-73.7706275158935,-73.7706542191612,-73.7706817780951,-73.7707644429887,-73.7707967349992,-73.7708261107154,-73.7708321600447,-73.7708615482898,-73.7709040440118,-73.770936949671,-73.7709737424731,-73.7710797588535,-73.7713208373601,-73.7714197694658,-73.7715338568424,-73.7716369311775,-73.7716874519498,-73.7717899790754,-73.7720906007931,-73.7722411142496,-73.7722808174547,-73.772422179357,-73.7724707070397,-73.7725245319042,-73.7727407212681,-73.7727899352468,-73.7728339578406,-73.7728623290645,-73.7728931511805,-73.7730345212223,-73.7730687134217,-73.7730996386625,-73.7731567894857,-73.7734850390846,-73.7735399291297,-73.7736085328067,-73.7736431373905,-73.7736811306431,-73.7737060326093,-73.7737413597798,-73.7737617470266,-73.7737984301096,-73.7738388101865,-73.7738817424924,-73.7739680190848,-73.774004596367,-73.7740430347892,-73.7740776316473,-73.7740963939505,-73.7741155049582,-73.7741554752311,-73.7742007143777,-73.7742952613308,-73.7743486862128,-73.7743824652318,-73.7744143500631,-73.7744248191391,-73.7746758736449,-73.774786035275,-73.7752111763412,-73.775292997832,-73.7754764851908,-73.7755990554106,-73.7757967608383,-73.7758602960536,-73.7759175977054,-73.7759259477778,-73.7759304282186,-73.7759299368923,-73.7759203982951,-73.77590847859,-73.7758487632679,-73.7758246648792,-73.775823731068,-73.7758242405556,-73.7758265854894,-73.7758298087243,-73.7758368859527,-73.7759241781331,-73.7760871070941,-73.7763506460392,-73.7764548908938,-73.7764684492854,-73.7764811199317,-73.7765162533722,-73.7765395142324,-73.776578092444,-73.7766254384115,-73.7766624348081,-73.7766988290516,-73.776752374737,-73.7768626714429,-73.776911142187,-73.777013156498,-73.7771092607016,-73.7772008021456,-73.7772884402808,-73.777353199261,-73.7774555913147,-73.7775002672504,-73.7776135207686,-73.7777588232144,-73.7778350904398,-73.7779158791074,-73.7781014446016,-73.7781494669255,-73.7782495663136,-73.7782735086315,-73.778386800104,-73.7785445021911,-73.7786550405375,-73.7787030555576,-73.7788453933175,-73.7789746580202,-73.7791283407998,-73.7791849535611,-73.7792490976238,-73.7792811613131,-73.7793605954026,-73.7793939859842,-73.779423257967,-73.7795158643185,-73.779803757318,-73.7798595971842,-73.7799294545596,-73.7800882602327,-73.7801490325092,-73.780222860699,-73.7803102103622,-73.7803723678392,-73.780430361019,-73.7804844957085,-73.780552843795,-73.7805745281378,-73.7806436790899,-73.7806760403791,-73.7807538436898,-73.7808460279726,-73.7808693602992,-73.7809744729335,-73.7810298398042,-73.7810878441754,-73.7811486577806,-73.7812120801139,-73.7813575552339,-73.7814224355464,-73.7814852544962,-73.7816108106415,-73.7816837036495,-73.7817862234493,-73.7819089013723,-73.7820622614738,-73.7821135175353,-73.7821445463118,-73.7821835138885,-73.7822239170207,-73.782280547659,-73.7823401597319,-73.7824060179701,-73.782435146331,-73.7824633144626,-73.7825273784381,-73.7825569715206,-73.7827088491648,-73.7827734160816,-73.7828896186919,-73.782976023243,-73.7831056626425,-73.7833072213585,-73.7835006341401,-73.7837005396172,-73.7838100709539,-73.783936364383,-73.7840617124232,-73.7843854309992,-73.7845331104849,-73.7846525807335,-73.7847462481341,-73.7848477643946,-73.7849135108061,-73.784977187227,-73.7850591964947,-73.7851338231642,-73.7851713614314,-73.7852423673775,-73.7853758781869,-73.7855107314078,-73.7856309549134,-73.7857754579471,-73.7860206318108,-73.7861075182459,-73.786305552171,-73.7863918267206,-73.7864590557343,-73.7865341968225,-73.7866094161771,-73.7867059439455,-73.7868420628936,-73.7869250441059,-73.7870888125184,-73.7872068784151,-73.787379868144,-73.7875018580917,-73.7876837071575,-73.7881827053927,-73.7884229506115,-73.7884468737857,-73.7884747250358,-73.7884974260264,-73.7885370655059,-73.7885747750771,-73.7885889478971,-73.7886029845987,-73.7887840687313,-73.7888753880713,-73.7889828399614,-73.7890132588202,-73.789033888718,-73.7890759082711,-73.7891046960101,-73.7891269092375,-73.7891773570223,-73.7892302471116,-73.7892622845117,-73.7892958256229,-73.7893257053347,-73.7893439307521,-73.789362568615,-73.7894147079357,-73.7894506559179,-73.7894798745313,-73.7895379175189,-73.789574374153,-73.789597540443,-73.7896353589655,-73.7896837943696,-73.7897171820514,-73.7897582480165,-73.7898370482927,-73.7898946942647,-73.7898973453772,-73.7899629857301,-73.7900968573425,-73.7901522964178,-73.7903045519528,-73.7904000181013,-73.7905036026947,-73.7905760397098,-73.7906377095661,-73.7908504407698,-73.7908897973144,-73.7909227572484,-73.7910062424917,-73.7910444711486,-73.7910683611977,-73.7910981537638,-73.791125078394,-73.7911566803919,-73.7912973635828,-73.7913129180354,-73.7913416079647,-73.7913636989535,-73.7914000875515,-73.7914367698291,-73.79149786042,-73.7915620434272,-73.7916899036627,-73.7917473801005,-73.7919010532294,-73.7920076246444,-73.792035648733,-73.7921324254116,-73.7922231385969,-73.7923499485337,-73.7923844341414,-73.7924361215058,-73.7924847681318,-73.7925652381903,-73.7926626301392,-73.7927987495687,-73.7928648371179,-73.7929913885341,-73.7930756194957,-73.7931398158928,-73.7932002357979,-73.7932635837203,-73.7933297029792,-73.7933904964615,-73.7934516292134,-73.7935482656398,-73.793570727759,-73.7935935705154,-73.7936577315187,-73.7938439968573,-73.793872977428,-73.7939325270546,-73.7939651190306,-73.793991479355,-73.7940230372449,-73.7940523988242,-73.7940909861896,-73.7941151928484,-73.794138868673,-73.7941961492664,-73.7942292413025,-73.794287964405,-73.7944372928238,-73.7944949080757,-73.7945452753695,-73.7946074805166,-73.7946349620627,-73.7947904419421,-73.7948223804684,-73.7948447307448,-73.7948987541468,-73.7949288977165,-73.7949614463643,-73.7949916076328,-73.79505176112,-73.7950855165588,-73.7951152309989,-73.7951447968193,-73.7951733882475,-73.7953414089138,-73.7953728468819,-73.7954074287576,-73.795461110873,-73.7955013913427,-73.795548781146,-73.7955628148623,-73.7956593036498,-73.7957028017023,-73.7958285165154,-73.7958573004336,-73.7959194716695,-73.7959653530456,-73.7959881443897,-73.7960314370951,-73.7960556458447,-73.7960898079884,-73.7962065767829,-73.7962747899976,-73.7963024188204,-73.7963791097559,-73.7964669488896,-73.7964860089067,-73.7965521461359,-73.7966197337288,-73.7966536584246,-73.7967152789521,-73.7967459289054,-73.7967683564383,-73.7968256422762,-73.7968584115798,-73.7988154278793,-73.7989335956124,-73.7990820019513,-73.7992838155623,-73.7994917499321,-73.799636422621,-73.7996884641193,-73.7997408464199,-73.8000758959528,-73.8001457731877,-73.8001786234689,-73.8002199783446,-73.8002427421712,-73.8002604834812,-73.8002832014546,-73.8003589338419,-73.8004151898698,-73.8004901074986,-73.8006127394599,-73.8010307495096,-73.8010864980952,-73.8011438173505,-73.8012192305872,-73.8013378598142,-73.8014298135063,-73.8015584265056,-73.8016831456915,-73.8017620375705,-73.8018290732302,-73.8018892078897,-73.8019436671182,-73.8020170223033,-73.8022078128539,-73.802395208754,-73.8025125330306,-73.8026254505703,-73.8028306065251,-73.803003800609,-73.8031945745431,-73.8032577124328,-73.8033420660217,-73.8034500614328,-73.8034659098168,-73.8034951700862,-73.803522420111,-73.8035604372237,-73.8036110593587,-73.8036656026521,-73.80372119406,-73.8040618147755,-73.804219960799,-73.8043391501074,-73.8044483389779,-73.8046143179246,-73.8047686092367,-73.8048589283969,-73.8049447918958,-73.8050679254237,-73.8053499679569,-73.8054111404047,-73.8055911843674,-73.805842873413,-73.8059533578926,-73.8061163776582,-73.8061330857886,-73.8061897844841,-73.8062405242,-73.8063423784615,-73.8065000606491,-73.8066264314693,-73.8067135572971,-73.8067919334671,-73.8068624556928,-73.8069011318664,-73.8069418477372,-73.8069821201509,-73.8071253610337,-73.8071574045431,-73.8073975350409,-73.8076235015205,-73.8076563296824,-73.8077685992577,-73.8079918289513,-73.8080744350623,-73.8084070543619,-73.8084563040846,-73.8085988348496,-73.8086410181414,-73.8087208996346,-73.8087484757663,-73.8088307340771,-73.8088866328773,-73.808937059005,-73.8089824305324,-73.8090342132292,-73.809085210797,-73.8091350984664,-73.8091835555701,-73.8092311400266,-73.8093367953087,-73.8093850292278,-73.8094260992189,-73.8095242320035,-73.8096214309178,-73.8113248181527,-73.8121675037541,-73.8126959584454,-73.8132037635681,-73.8134180922384,-73.8135244872756,-73.8136458227654,-73.8139880142518,-73.814172599328,-73.8142538945914,-73.8147648592321,-73.8150806139137,-73.8153380974139,-73.8156344990164,-73.8157674640157,-73.8158590610476,-73.8158884067921,-73.8161552532741,-73.8165273466956,-73.8165543899187,-73.8168458293745,-73.8170259565131,-73.8173079593227,-73.8176010349307,-73.8182086104205,-73.8183818984172,-73.8188697177708,-73.8189563226585,-73.8191796746251,-73.8192881203056,-73.8194032518933,-73.8196443060656,-73.8203660882111,-73.8204826006866,-73.8205019869832,-73.8213416508988,-73.8219491633867,-73.8221413670357,-73.8222275124401,-73.8222899149419,-73.8224218594525,-73.8226489797346,-73.8232023358939,-73.8232113022061,-73.8237248749445,-73.8239755669983,-73.8241917004781,-73.8243611823079,-73.8245996868573,-73.8247370190074,-73.8249590583429,-73.825169768084,-73.8256246940647,-73.8262248546286,-73.826702994793,-73.8268713901215,-73.8271737888498,-73.8275561640453,-73.8279881906269,-73.8283754442816,-73.8286859709955,-73.8287828989676,-73.8291106634537,-73.8292744991743,-73.829566375492,-73.8296197413151,-73.8296794193301,-73.8297337397023,-73.8299028492068,-73.8300269998087,-73.8301726281433,-73.8303228220148,-73.8304817879112,-73.8306608340285,-73.8309007727715,-73.8310650223513,-73.8312479629121,-73.8314609333145,-73.8316260137541,-73.8318035587194,-73.8320353896951,-73.8321972446242,-73.8322688248143,-73.83269598986,-73.832927886451,-73.83304274012,-73.8333885590582,-73.8336543297874,-73.8338692317218,-73.8340874013797,-73.8345027419369,-73.8345585968093,-73.8346778103372,-73.8351513108083,-73.8355666504531,-73.8358494901401,-73.8359869560413,-73.8360537805542,-73.8362462605398,-73.8363228487878,-73.8364104564329,-73.8370385268039,-73.8371082947657,-73.8376569816259,-73.8377849130498,-73.8380093591484,-73.8382587796084,-73.838430490748,-73.8386147788838,-73.8388827526752,-73.8396176277056,-73.8404382143134,-73.8413829783017,-73.8420693890224,-73.8428890667108,-73.8437835907519,-73.8445146032435,-73.8452690026788,-73.8461575520935,-73.8462251592388,-73.8469948732578,-73.8477692494442,-73.8487785018451,-73.8488682478324,-73.848972805261,-73.8490205802636,-73.849071393455,-73.8491372324166,-73.8492518652192,-73.8493536535546,-73.8494048377902,-73.8494932823789,-73.8495788121833,-73.8496952947906,-73.8497869345559,-73.8499533063608,-73.8502482143468,-73.8503876633552,-73.8505346292565,-73.8507129196377,-73.8508548297974,-73.851102174303,-73.8511958562786,-73.8512814136079,-73.851538384838,-73.8516807185696,-73.851769220989,-73.8518407838807,-73.8522020239955,-73.852741626957,-73.8531210285016,-73.8533220785222,-73.8535752547943,-73.853811604805,-73.8538460536592,-73.8539655657709,-73.8540958517921,-73.8542330612708,-73.8544210818527,-73.8547170129156,-73.8548782791352,-73.8549337132964,-73.8549907600988,-73.8550557024824,-73.8552407924824,-73.8555103843256,-73.8557459904333,-73.8558507224794,-73.8559676296702,-73.8561220243743,-73.8562449554623,-73.8564986702892,-73.8567072094262,-73.8569010507821,-73.8569802438667,-73.857203306723,-73.8573299488912,-73.8573928819669,-73.8576797555545,-73.8577508747852,-73.8577792908101,-73.8579171148118,-73.8582711741329,-73.8585268428976,-73.8590931899924,-73.8592271825486,-73.8594265760655,-73.8595035986372,-73.8595781385289,-73.8596885630464,-73.8597721614938,-73.859858291967,-73.8600415300239,-73.8602227671123,-73.8611623268848,-73.8620296557441,-73.8621459219614,-73.8622638852911,-73.8623900679746,-73.8625528602915,-73.862659276752,-73.8628329077533,-73.8628689221141,-73.8630876752875,-73.8631693027943,-73.8643096948521,-73.8653428508825,-73.8644663293313,-73.8645417611105,-73.8652255543476,-73.8663383636396,-73.8666835996215,-73.8645724530018,-73.8644930291127,-73.8636113295238,-73.863347400685,-73.8639426787596,-73.863966420578,-73.8639920973905,-73.8628036192697,-73.8628830195682,-73.8606003068899,-73.8598447069816,-73.8590886206757,-73.8583384434615,-73.8575846505752,-73.8568386972949,-73.8560729980588,-73.8553224461964,-73.8545602042591,-73.8538168195638,-73.8530554958512,-73.8521897684036,-73.8513471682044,-73.8504438514919,-73.8493066719294,-73.848610535383,-73.8481963055694,-73.8472584177387,-73.8462064241177,-73.845205663448,-73.8450567062853,-73.8441571217811,-73.8432082793878,-73.8423397955226,-73.8422501040417,-73.8412996912381,-73.8403332529745,-73.8393538589904,-73.839297372671,-73.8392635074896,-73.8392228477812,-73.8391754977889,-73.8391215789155,-73.8390612294114,-73.8390451016021,-73.8390249136953,-73.8389915656087,-73.8389516141697,-73.8389056328709,-73.8388542817674,-73.8388176228653,-73.8387791566487,-73.838678890979,-73.8387065246959,-73.8386806185434,-73.8386100993355,-73.8385389160848,-73.8385530645124,-73.8384821624093,-73.8384688321752,-73.8383021878468,-73.8382892920665,-73.8381910924731,-73.838192191301,-73.8374901884451,-73.8364970217597,-73.8364949295982,-73.8358408009742,-73.8312278529533,-73.8312292409178,-73.8311587238917,-73.8303593489067,-73.8299592711194,-73.8296454626666,-73.8292334489553,-73.8292234822476,-73.8292169926744,-73.8285247126134,-73.8285047385715,-73.8284669830419,-73.8284487596066,-73.828360206096,-73.8282763680679,-73.8282624181623,-73.8282444250125,-73.8282222177512,-73.8281953619332,-73.8281790456803,-73.8281722606212,-73.8281343961027,-73.8280889160727,-73.8280365364045,-73.8279780815809,-73.8279144717167,-73.8278467080748,-73.8266883898116,-73.8252488270677,-73.8249565289294,-73.824764278751,-73.8247762097872,-73.8247709930178,-73.8248133390712,-73.8248011662345,-73.824757080911,-73.824754474264,-73.8247435228989,-73.8232615725833,-73.8232074342624,-73.8231555877069,-73.8231070458407,-73.8230692648603,-73.8230200267494,-73.8229800138885,-73.8229368863152,-73.8228937850445,-73.8228631130527,-73.822786689047,-73.8227107489774,-73.8226430351847,-73.822567334678,-73.8224621233094,-73.8219942197646,-73.8214597199177,-73.8211617779836,-73.8203976503682,-73.8200329907414,-73.8196865863467,-73.8193468654137,-73.8192974302651,-73.8192343077767,-73.819188294669,-73.8191291636316,-73.8188372236462,-73.8187683998721,-73.8186974637358,-73.8186248236584,-73.8185504807194,-73.818474640706,-73.8183750322358,-73.8182786497709,-73.8181858720216,-73.8180970635371,-73.8180125732726,-73.8180018490604,-73.8179129262765,-73.8174158614744,-73.8174659356762,-73.8175896298833,-73.8176380045065,-73.8176233043948,-73.8176076196293,-73.8175326558044,-73.8175020858069,-73.8175122091399,-73.8175102165584,-73.8174204510318,-73.8173679813753,-73.8172188618417,-73.8172070656516,-73.8171659084728,-73.8171296961493,-73.8170817895315,-73.8170029878008,-73.8169155826916,-73.8168295109653,-73.8167888816139,-73.8167419758236,-73.8166919117708,-73.8166264962132,-73.8165927177596,-73.8165790238481,-73.8165385947025,-73.8165043381431,-73.8164729403146,-73.8164436434684,-73.8164191611934,-73.8163966008142,-73.8163602721315,-73.8163180949921,-73.8162965440299,-73.8162760181166,-73.8162594080286,-73.8162442386483,-73.8161570622004,-73.8160561876223,-73.8160022608795,-73.8159662667934,-73.8159410310229,-73.8158930711572,-73.8158452300022,-73.8158245545225,-73.8152695546929,-73.8152483237509,-73.8152132029782,-73.8151896591905,-73.8151660850608,-73.8151326830001,-73.8150834910298,-73.8150441897244,-73.8150034353037,-73.8149690845178,-73.8149239291514,-73.8148817258155,-73.8148440346032,-73.8148439398328,-73.8147478467246,-73.8147006746172,-73.8145941810194,-73.8145502492725,-73.8145187951351,-73.8144810726057,-73.8144475463125,-73.8144171703352,-73.8143826220818,-73.8143512145648,-73.8143261088947,-73.8142969662041,-73.8142606969067,-73.8142198680356,-73.8141821591738,-73.814143401544,-73.8140931002458,-73.8140580316417,-73.8140218278381,-73.8139050466203,-73.813815761945,-73.8137648345344,-73.8137014404197,-73.8136322141083,-73.8132567156643,-73.8135885661264,-73.8135540503611,-73.8132347443274,-73.8131299166972,-73.81305738293,-73.8129855091913,-73.8129022555729,-73.8128145263996,-73.812743211537,-73.8126240479293,-73.8125870576233,-73.8125462283178,-73.81249376357,-73.8124432708426,-73.8123889387478,-73.8123384959686,-73.812285022248,-73.8122433822537,-73.8121986762638,-73.8121436008147,-73.8120411019058,-73.8120099856872,-73.8119428948392,-73.8118339786603,-73.8117034483635,-73.8115734824099,-73.8115130318271,-73.811512540257,-73.811534730991,-73.8115671565894,-73.8115043696877,-73.811531746912,-73.8115165521837,-73.8115285843874,-73.8115605130938,-73.8115742035826,-73.8115619165812,-73.8115268934752,-73.8114942358587,-73.8114802571172,-73.8114732723097,-73.8114791622641,-73.8114662890849,-73.8114355727511,-73.8114296825845,-73.8113986824522,-73.811361371914,-73.8113346362317,-73.8111701953094,-73.8110076658511,-73.8109453471328,-73.8109341676148,-73.81089019539,-73.8108799583513,-73.8109089030711,-73.8108211633678,-73.8108247654627,-73.810817918745,-73.8108302359726,-73.8108380702301,-73.8108604007184,-73.8108838661633,-73.8108923594219,-73.8109501895273,-73.810957477226,-73.8109542267109,-73.8110976969202,-73.8111001194159,-73.8111074220722,-73.8111163673838,-73.8112592980945,-73.8113859315203,-73.8113870702491,-73.8113796839661,-73.8113924992214,-73.8114017970392,-73.8114075122716,-73.8113765804719,-73.8113792293374,-73.8110728702105,-73.8110606009221,-73.8110474038037,-73.8110282125315,-73.8110962413686,-73.8110999785652,-73.8111653984806,-73.811172868368,-73.8112192932798,-73.8112267315564,-73.8113738393581,-73.8113733128964,-73.8112937793125,-73.8112820253955,-73.811216827485,-73.8112055726808,-73.8111116956165,-73.8110895808892,-73.8110174352588,-73.811004389328,-73.8109224362891,-73.8109101676165,-73.8107572930819,-73.8107497491333,-73.8107891995388,-73.8108252396764,-73.81083602322,-73.8108598323715,-73.8113734725556,-73.8113582931579,-73.811239589383,-73.8112428839083,-73.8111754936314,-73.8111776446745,-73.8109789214421,-73.8109756520525,-73.8109532105481,-73.8109636902661,-73.810939658946,-73.8109150217089,-73.8109087864633,-73.810895853667,-73.8108930338688,-73.8108763285783,-73.8108740898203,-73.8108581422785,-73.8108551338251,-73.8108383617101,-73.8108356597853,-73.810816376923,-73.8108198408849,-73.8108053790442,-73.8107946476628,-73.8107922582464,-73.8101949249412,-73.8101761082247,-73.8101578941834,-73.8101390994171,-73.8101219805962,-73.8100678962784,-73.810014907832,-73.8099640966475,-73.8099414286419,-73.8098992991335,-73.8100392058451,-73.8099979237101,-73.8099835757124,-73.8099034030014,-73.8097783184952,-73.8097313839371,-73.8097638049883,-73.8098026628822,-73.8098074971652,-73.8097874359227,-73.8097859880762,-73.8097431944498,-73.8097098243639,-73.8096309557386,-73.8094866574489,-73.8094858102198,-73.8095145350583,-73.8097012886361,-73.8096167937437,-73.8096119637886,-73.8095917049308,-73.8095898385533,-73.8095721006429,-73.8095581604757,-73.8095538021073,-73.8095374918283,-73.8095233376035,-73.8095171653244,-73.8095116207863,-73.8095067153687,-73.8095024721709,-73.8094884480668,-73.8094760391201,-73.8094663948579,-73.8094462888367,-73.8094405771248,-73.8094348784064,-73.8094220756306,-73.8094074210146,-73.8093761543141,-73.8093619281383,-73.8093537655731,-73.8093456591739,-73.8093415865927,-73.8093374765284,-73.8093333320529,-73.8093291377375,-73.8093179701062,-73.8093061602151,-73.8092538289376,-73.8092408596565,-73.8092288034227,-73.8091972679537,-73.8091740764194,-73.8091536556731,-73.8091444221856,-73.8091357345838,-73.8091019425454,-73.8090714359296,-73.8090436597833,-73.8090184143208,-73.8089578698147,-73.8089361547233,-73.8086203099057,-73.8085176824943,-73.8084403865846,-73.8083211112164,-73.8083043238702,-73.8082752105754,-73.8082641747994,-73.8082083398358,-73.8080442864003,-73.8080010094564,-73.8079628467709,-73.8079377517549,-73.8079118946978,-73.8078847693022,-73.8078548153492,-73.8078075543128,-73.8077016007437,-73.8076726584841,-73.8076392750054,-73.8075126476875,-73.8074620891305,-73.8074476664377,-73.8074326337307,-73.8073713829503,-73.8073551585958,-73.8073392344806,-73.8073105486676,-73.8072407707133,-73.8072239206979,-73.8072094453461,-73.8071904947152,-73.8071445318128,-73.8071181939623,-73.8070439215281,-73.806935265059,-73.8069276464443,-73.806919805812,-73.8068952243259,-73.8068854411235,-73.8068745674638,-73.8068691055078,-73.8068635462754,-73.8068566755333,-73.8068494128863,-73.8068332882184,-73.8068175348623,-73.8067978804537,-73.8067951303792,-73.806782892937,-73.8067782254105,-73.8067674014694,-73.8067576888595,-73.8067296310454,-73.8067030747429,-73.8066791187746,-73.8066558684716,-73.8066457174899,-73.8066363829002,-73.8066116663649,-73.80653538284,-73.8064807915795,-73.8064583813962,-73.8064068640558,-73.8063847506684,-73.8062985938723,-73.8062313542192,-73.8062069425962,-73.8061677979958,-73.8061477452574,-73.8060992120514,-73.8060778488096,-73.8060616359398,-73.8060451469741,-73.8060280745985,-73.8060056788432,-73.8059907250284,-73.8059775708135,-73.8059669094546,-73.8059664847337,-73.8059577052284,-73.8059467693256,-73.8059384130959,-73.8059327059409,-73.8059297171214,-73.8059295278248,-73.8059315506507,-73.8059308668098,-73.805920459081,-73.8059225448708,-73.8059221663672,-73.8059180687328,-73.8059115670643,-73.8059055108292,-73.8058985417752,-73.805885365269,-73.8058798126856,-73.8058708561291,-73.8058589305565,-73.8058447658739,-73.8058235929902,-73.8057962565507,-73.8057916393013,-73.8057886198244,-73.805787164011,-73.8057872479926,-73.8057919964335,-73.8057944217929,-73.8057957869246,-73.8057975470499,-73.8058010784831,-73.8058020445565,-73.8058006675253,-73.8057959201392,-73.8057924686732,-73.8057874034244,-73.8057866993956,-73.8057857228517,-73.8057844629664,-73.8057829320769,-73.8057811156266,-73.8057790283904,-73.805774082933,-73.8057680280221,-73.8057658317025,-73.8057611205177,-73.8057582490905,-73.8057494764338,-73.8057462699809,-73.8057411784421,-73.8057319238076,-73.8057277039301,-73.8057239902314,-73.8057207123187,-73.8057179076314,-73.8057155739989,-73.8057118049866,-73.8057085772221,-73.8057037371199,-73.8057010641304,-73.8057005600859,-73.8057074836612,-73.8057072285902,-73.8057089537327,-73.8057176172876,-73.8057172583089,-73.8057125726178,-73.8057126872344,-73.8057244849798,-73.8057325340218,-73.805735769157,-73.8057524326577,-73.805796627857,-73.8058091059092,-73.805819383108,-73.8058278727264,-73.8058298721608,-73.8058295575768,-73.8058254830985,-73.8058258987926,-73.8058297920273,-73.8058296759713,-73.8058294472539,-73.8058290062943,-73.8058283530706,-73.805827498184,-73.8058251525943,-73.8058220153474,-73.8058180508081,-73.8058134261236,-73.8058083061022,-73.8058030209249,-73.8057893724461,-73.805774473459,-73.8057582806731,-73.8057405542968,-73.8057136358894,-73.8056865089,-73.805659377144,-73.8056324863024,-73.8055281962189,-73.8054088970474,-73.8053539429433,-73.8053356177451,-73.8052793589079,-73.8052548137537,-73.8052337200615,-73.805226303595,-73.805170273113,-73.8050996235615,-73.8050354593906,-73.8048838352251,-73.8048057500453,-73.8047640005419,-73.8047198345267,-73.8047099440855,-73.8046985518073,-73.8046504640141,-73.8046323226646,-73.8045569465275,-73.804486692137,-73.8043618478531,-73.8043598772317,-73.8043582605543,-73.8043544708549,-73.8043491339722,-73.8043395424288,-73.8043349630686,-73.8043287434159,-73.8043197954531,-73.8043112128626,-73.8043033350806,-73.8042964725334,-73.8042826319766,-73.8042754408589,-73.8042704176469,-73.8042601839782,-73.8042522990738,-73.8042302179291,-73.8042232077471,-73.8042183860353,-73.8042035855463,-73.8041900343423,-73.8041721853263,-73.8041674172753,-73.8041644553091,-73.8041633132051,-73.8041631404541,-73.8041628266146,-73.8041638930988,-73.8041641010062,-73.8041644050227,-73.8041656910304,-73.8041759660216,-73.8041781344897,-73.8041826989722,-73.8041875828177,-73.804214580921,-73.8042795701326,-73.8043084328775,-73.804384213697,-73.8043997140324,-73.8044200993903,-73.8045001695339,-73.8045379209857,-73.8046248357911,-73.8046427733935,-73.8048157370953,-73.8049176489052,-73.8049622709197,-73.8050855195805,-73.8051145098672,-73.8051456189249,-73.8052717469567,-73.8053289395636,-73.8053506291013,-73.805384624982,-73.8055111407731,-73.8055632480704,-73.8056217394383,-73.8057471099598,-73.8057986894484,-73.8060005116205,-73.8060695215005,-73.8062101515529,-73.8062578030197,-73.8063070618051,-73.8063457467224,-73.8065032406336,-73.8066925594288,-73.8068854113191,-73.8070123817497,-73.8070393480081,-73.8070641006151,-73.8070873148306,-73.8071091778122,-73.8071106788903,-73.8071121679707,-73.8071136459387,-73.807115099629,-73.8071180212119,-73.8071209793608,-73.8071248033486,-73.8071367067789,-73.8071398203772,-73.807142731447,-73.8071454169848,-73.8071480889948,-73.8071494372201,-73.807150783622,-73.8071521549827,-73.8071535361947,-73.8072010271591,-73.807249149261,-73.8072955829944,-73.8073083788579,-73.8073138652304,-73.8073188559165,-73.8073424062987,-73.8073742767043,-73.8074259544479,-73.8074711916921,-73.8075572303775,-73.8076132403634,-73.8076563667241,-73.8077299740505,-73.8077389278919,-73.8077494426448,-73.8077926642891,-73.8078100225382,-73.807818704742,-73.8078261114324,-73.8078324056671,-73.8078376351767,-73.807872573458,-73.8079206176391,-73.8079317441324,-73.8079550762015,-73.8079698341611,-73.8080228385053,-73.8080233209092,-73.8080468868397,-73.8080298569269,-73.8080032432997,-73.8080017115997,-73.8079806519221,-73.8079500072572,-73.8079360095193,-73.807930518742,-73.8079131605389,-73.8078992259711,-73.8078935856535,-73.8078888447485,-73.8078578695703,-73.8078523654731,-73.8078293982909,-73.8078178254229,-73.8078154016989,-73.8078135430893,-73.8078114283107,-73.8078123432358,-73.8078117766477,-73.8078097264279,-73.8078019702853,-73.8078008377103,-73.8078008364147,-73.8078009000118,-73.8078013175028,-73.807802065519,-73.807803158096,-73.8078045682064,-73.8078084406312,-73.8078137442954,-73.8078259480735,-73.807860982239,-73.8078695303084,-73.8078729592569,-73.8078758819428,-73.8078802606058,-73.8078843403118,-73.8079005997489,-73.8079067677401,-73.8079101839036,-73.8079138844162,-73.8079165032094,-73.8079195590629,-73.807923075636,-73.807927124301,-73.8079558547774,-73.8079609549831,-73.807965158055,-73.8079692635874,-73.80797095039,-73.8079724243866,-73.8079736847035,-73.807974732409,-73.8079755668743,-73.8079761891423,-73.8079772167454,-73.8079776888493,-73.8079775709935,-73.807976875983,-73.8079756502689,-73.8079748443761,-73.8079739069839,-73.8079728640739,-73.8079716804627,-73.8079703913589,-73.8079689953969,-73.8079518380457,-73.8079434099204,-73.80793410536,-73.8079279595898,-73.8079078718621,-73.8079029086525,-73.8078985583725,-73.8078967490705,-73.8078950812499,-73.8078935309296,-73.8078921097546,-73.8078908184093,-73.8078896562396,-73.8078877096955,-73.8078862798637,-73.807885344917,-73.8078848952586,-73.8078867136453,-73.8078945980635,-73.8078968800484,-73.8078991925387,-73.8078991894356,-73.8078983733737,-73.8078969444498,-73.8078948917658,-73.8078936234557,-73.8078921897236,-73.8078505328061,-73.807793194557,-73.8077811482982,-73.807769735337,-73.8077586688829,-73.807745389028,-73.8077433924723,-73.8077419489601,-73.8077396192272,-73.8077381603167,-73.807736946683,-73.8077354266016,-73.8077335651411,-73.807731362488,-73.8077271593775,-73.8077218826639,-73.8077002280937,-73.8076957091585,-73.8076919223534,-73.8076233989075,-73.807617069061,-73.8076094758698,-73.8075760811617,-73.8075693266216,-73.8075635997752,-73.8075524122248,-73.8075422604232,-73.8075333816046,-73.8075260013777,-73.8075207697932,-73.8075118723957,-73.8075084494049,-73.8075043788189,-73.8074714995829,-73.8074431545673,-73.8074409350218,-73.8074392216072,-73.8074372573181,-73.8074372269084,-73.8074391152413,-73.8074492911166,-73.8074539012208,-73.80745487381,-73.8074548417072,-73.8074538319263,-73.807452021434,-73.8074518182131,-73.8074467372451,-73.80743943495,-73.8074299835035,-73.807418560294,-73.8074044327884,-73.8073697400663,-73.8073618002792,-73.8073551262956,-73.8073377315496,-73.8073231033996,-73.8073111085183,-73.8073017121054,-73.8072748256239,-73.8072350228185,-73.8072075022499,-73.8072008117164,-73.8071915799664,-73.8071526100705,-73.8071386534145,-73.8071360094415,-73.8071337534931,-73.807130300019,-73.8071251204731,-73.807123624807,-73.807121694728,-73.8071186667323,-73.8071168523098,-73.8071148013988,-73.8071125395203,-73.8071100296756,-73.8071072851061,-73.807104280916,-73.8070903758527,-73.8070851030105,-73.8070549471339,-73.8070394235704,-73.8069884135475,-73.8069661988633,-73.8069331300076,-73.8069296389983,-73.8069263358728,-73.8069201389114,-73.8069046800572,-73.8068988944607,-73.8068925570574,-73.8068891372887,-73.8068854937296,-73.8068676245046,-73.8068465712728,-73.8067738800473,-73.8067386987996,-73.8066664881076,-73.8066537510151,-73.8066110043121,-73.8065507210964,-73.8064869686682,-73.8064184116768,-73.8064094377694,-73.8063864892023,-73.8063750569061,-73.806340581036,-73.8062655672259,-73.8062371798229,-73.8061825899357,-73.8061359053204,-73.8060932797368,-73.8060707485363,-73.8060600346756,-73.8060503394423,-73.8060414980739,-73.8060334728027,-73.8059985508769,-73.8059373439847,-73.8059138139574,-73.8058658810606,-73.8058464787959,-73.8058365222658,-73.8058263210968,-73.8057872076558,-73.8057782673558,-73.8057694539029,-73.8057100234558,-73.8056496334049,-73.8055497007919,-73.8054762836834,-73.8054677536999,-73.8054590623744,-73.8054261393057,-73.8054186734747,-73.805411263936,-73.8054098235536,-73.8054083249751,-73.8054067541915,-73.8054051241401,-73.8054016385437,-73.8053977974455,-73.8053904898673,-73.805373600516,-73.8053695561165,-73.8053660093875,-73.8053626310233,-73.8053610705089,-73.8053595824727,-73.8053581783465,-73.8053568321417,-73.8053555584185,-73.8053543433257,-73.8053532710783,-73.8053522809923,-73.8053505733875,-73.8053491979305,-73.8053481180436,-73.8053469403968,-73.8053454530823,-73.805343897395,-73.8053427577652,-73.8053413568612,-73.8053396727592,-73.805337680215,-73.8053116685343,-73.805280246086,-73.8052182297303,-73.8051781968835,-73.8051716208852,-73.8051532833495,-73.8051450197632,-73.8051096501325,-73.8050581169697,-73.8050152839805,-73.8049656481798,-73.8049061943788,-73.8048529847726,-73.8048366440257,-73.8048029493544,-73.8047884602155,-73.8047320298805,-73.80470909685,-73.8046720500015,-73.8046404689901,-73.8046390783568,-73.8046379488596,-73.804637055003,-73.8046363974447,-73.8046359887683,-73.8046358166099,-73.8046361698617,-73.8046371246011,-73.8046387318362,-73.804647727226,-73.8046492393239,-73.8046499239592,-73.804651670683,-73.8046508646082,-73.8046493902595,-73.8046447447299,-73.8046440840434,-73.8046422699629,-73.8046402292846,-73.8046286347278,-73.804615019518,-73.8045662681747,-73.8045479793407,-73.8045174924761,-73.8045088825894,-73.8045017005284,-73.8044922971972,-73.8044832994395,-73.8044613670889,-73.8044384837417,-73.8044280122767,-73.8043701215671,-73.8043181642543,-73.8043085496715,-73.8042860016215,-73.8042607906553,-73.8042366284674,-73.8042150584782,-73.8041764670525,-73.8041305412957,-73.8041145995467,-73.8041029811837,-73.8040922448784,-73.8040648136579,-73.8040421517149,-73.804037359591,-73.8040350912004,-73.8040272236804,-73.8040146236064,-73.8040119133164,-73.8040095680511,-73.8040088328599,-73.8040101581872,-73.804011029603,-73.8040128584826,-73.8040262523603,-73.8040285923953,-73.8040295097963,-73.8040297259894,-73.8040297893551,-73.8040260826685,-73.8040270202503,-73.8040292918989,-73.8040378938237,-73.8040390333897,-73.8040404794084,-73.8040422325956,-73.8040442922591,-73.8040493568505,-73.8040557666853,-73.804069739706,-73.80410356479,-73.8041107408925,-73.8041163335099,-73.8041188892231,-73.8041210309394,-73.804122771481,-73.8041241233457,-73.8041246456697,-73.8041250852489,-73.8041256686378,-73.8041258636516,-73.8041256801527,-73.8040594464771,-73.8040526559568,-73.8040305590591,-73.8040050565269,-73.8039497457627,-73.8039274447978,-73.8039054527673,-73.8038976576568,-73.8038881252933,-73.8038457614602,-73.8038374819496,-73.8038305837226,-73.8037856886147,-73.8037827885688,-73.8037792143373,-73.8037660594503,-73.8037613521424,-73.803757202167,-73.8037555643536,-73.8037541986329,-73.8037525980292,-73.8037513067392,-73.8037503456633,-73.8037496908454,-73.80374931853,-73.8037501874515,-73.8037544643681,-73.803768275084,-73.8037694632817,-73.803771159512,-73.8037761261888,-73.80379981216,-73.8038039236563,-73.8038067687813,-73.8038079904051,-73.8038087764684,-73.8038091120762,-73.8038091265698,-73.803809022312,-73.80380873854,-73.8038081147173,-73.8038072989343,-73.8038062726808,-73.8038050334719,-73.8038031795577,-73.8037992719999,-73.8037932984863,-73.8037881636288,-73.8037811633883,-73.8037706664657,-73.8037420406955,-73.8037093167072,-73.8036977265247,-73.8036916381217,-73.8036863541989,-73.8036817751246,-73.8036797285224,-73.8036778584029,-73.8036392644939,-73.8036173945544,-73.8032849675575,-73.8030752367355,-73.803058378551,-73.8030519011422,-73.8030401917982,-73.8030315399936,-73.8030213018703,-73.8029817877793,-73.8029750456643,-73.8029548781226,-73.8029477319339,-73.8027636457429,-73.8024384629031,-73.8024922804006,-73.8024928535665,-73.8023773535742,-73.802496439409,-73.8025096508728,-73.8026241357364,-73.8026339447477,-73.802707141008,-73.8027174182248,-73.8027942917372,-73.8028072764099,-73.802883221117,-73.8028967158741,-73.802971829839,-73.8029847575388,-73.8030596018978,-73.8030702500824,-73.8031419734312,-73.8031167250184,-73.8031350344072,-73.8031654946492,-73.8031574006414,-73.8031808219089,-73.8031661682019,-73.8031427534747,-73.8030545898815,-73.8030419110999,-73.8029452783461,-73.8029340017686,-73.8028496327875,-73.8028385380615,-73.8027617005865,-73.8027494141389,-73.8026700892783,-73.8026587768739,-73.8025130428299,-73.8025683760107,-73.8027275047449,-73.8027372309565,-73.8027947332231,-73.8028986136941,-73.8029404434122,-73.8032396774976,-73.8032202745917,-73.80324253171,-73.8032879389302,-73.8032577544878,-73.8032402429578,-73.8028197246812,-73.8028282488544,-73.8027220186608,-73.8027163447746,-73.8026044285099,-73.8026072763416,-73.8027064061843,-73.8027098385907,-73.802577409159,-73.8025887550429,-73.8023366308645,-73.8023451384566,-73.802773703339,-73.8027768156754,-73.803042157154,-73.8030977681141,-73.8030954378941,-73.8031185189868,-73.8031857440442,-73.8032276900642,-73.8034328702208,-73.8034714992942,-73.8034177410977,-73.8034401704145,-73.8035089697621,-73.8034862093512,-73.8034839799894,-73.8034819069426,-73.8031967536496,-73.8033503136884,-73.8033775430383,-73.8036551931336,-73.8037245426739,-73.8037100833306,-73.8036516708072,-73.8035939706668,-73.8035844496438,-73.8035231503071,-73.8035166544639,-73.803454489603,-73.8034462656881,-73.803384680362,-73.8033610256466,-73.8033448974511,-73.803200106232,-73.8032030344505,-73.8033835099471,-73.8033847234932,-73.8032037365532,-73.8032070440724,-73.803390973279,-73.8033906168834,-73.8032080174898,-73.8032149425126,-73.8033130680304,-73.8033138483864,-73.8033513711173,-73.80335292789,-73.8033666530119,-73.8033776892123,-73.8033941019406,-73.8034511252999,-73.8035142189567,-73.8035262195315,-73.8035936244204,-73.8036053845055,-73.8036398118251,-73.8036718113493,-73.803683189993,-73.8037544068126,-73.8037652168307,-73.8038351219794,-73.8038606987119,-73.8038950700674,-73.8039084226472,-73.8036772320261,-73.8036515862444,-73.8033144341284,-73.8033145372922,-73.8033288308293,-73.8034268388653,-73.8034979216473,-73.8035400150352,-73.8035713534222,-73.8035853412165,-73.8035984043636,-73.8036229402663,-73.803646332867,-73.8036672269746,-73.8036846869572,-73.8042790905691,-73.8042810356017,-73.80429363816,-73.8042997353915,-73.8043289484842,-73.8043980426707,-73.8044951992737,-73.8045703785287,-73.8045935361572,-73.8046780050839,-73.8046929794539,-73.8047062309421,-73.8047180211976,-73.8047313730931,-73.8047336704688,-73.8047346019019,-73.8047352339766,-73.8047509769877,-73.8047727031318,-73.8047786380937,-73.8048620246606,-73.8048646264693,-73.8048756521491,-73.8049411714637,-73.8050845877184,-73.8051118547991,-73.8050845720959,-73.8050548122763,-73.8050209804731,-73.8050089049317,-73.8049695753335,-73.8049331456871,-73.8048457887006,-73.8047651550102,-73.8047507602645,-73.8047298146243,-73.8047295994338,-73.8047276131902,-73.8047238899268,-73.8047184934407,-73.8047111222788,-73.8047021456855,-73.8046917334407,-73.8046801857531,-73.8046680129044,-73.8046666771496,-73.8046446977662,-73.8046218826123,-73.8045988652576,-73.8045813826406,-73.8045629843407,-73.8045447587701,-73.8045136349039,-73.8044956172173,-73.8044850959095,-73.8044775652443,-73.8044641439562,-73.804456363208,-73.8044443126962,-73.8044391036016,-73.8044358272786,-73.8044294025663,-73.8044241688907,-73.8044208568388,-73.8044185705422,-73.8044058013584,-73.8043898349654,-73.8043786608781,-73.8043626712017,-73.8043582202066,-73.8043511808183,-73.8043484398127,-73.804339144611,-73.8043240410534,-73.8043128269554,-73.8043079185093,-73.8042995249811,-73.8042945239897,-73.8042900591187,-73.8042792490305,-73.8042729430723,-73.8042623830588,-73.8042467054019,-73.8042403595177,-73.8042336086575,-73.8042319004906,-73.804232071142,-73.8042326047063,-73.8042280644481,-73.80421769771,-73.8042096695066,-73.8042031128831,-73.8041946397759,-73.8041847304748,-73.8041708939004,-73.8041571879698,-73.8041443434791,-73.8041254397978,-73.8041112370033,-73.8040995661049,-73.8040864946157,-73.8040748242987,-73.804065864218,-73.8040572241792,-73.8040474877828,-73.8040355441548,-73.8039803724711,-73.8039558191452,-73.803933389224,-73.8039207554161,-73.8039188096421,-73.8039144548259,-73.8039063758998,-73.8038984136394,-73.8038885977693,-73.8038868501403,-73.803889644632,-73.8038827364594,-73.8038764705576,-73.803867620225,-73.8038612609307,-73.8038565878293,-73.8038524106045,-73.8038486884557,-73.8038496424974,-73.8038518221497,-73.8038559380057,-73.8038574653963,-73.8038574800898,-73.8038533160152,-73.803845703724,-73.8038406287842,-73.8038196698298,-73.803811548787,-73.8038059751034,-73.8038009355491,-73.8037928278715,-73.8037825924671,-73.8037699011112,-73.8037115119719,-73.8037071492459,-73.8036929430565,-73.8036922136416,-73.803687515903,-73.8036833262452,-73.8036848304803,-73.8036859928002,-73.8036813879555,-73.803678969971,-73.8036717091367,-73.803663626871,-73.8036569822586,-73.8036522706829,-73.8036495681198,-73.8036472836056,-73.803646108043,-73.803644569707,-73.8036402368263,-73.8036313822986,-73.803624543705,-73.8036153244924,-73.8036036134328,-73.8035935508251,-73.8035807586773,-73.8035750381026,-73.803574534761,-73.803577822687,-73.8035806711834,-73.8035755308634,-73.8035706363435,-73.8035657807396,-73.8035585485595,-73.8035491366611,-73.803542007747,-73.8035320458803,-73.8035270441308,-73.8035228300447,-73.8035191472182,-73.8035166526327,-73.8035141738963,-73.8035109099911,-73.8034961580369,-73.8034941773744,-73.8034852992407,-73.8034546343587,-73.8034480956327,-73.8034457717393,-73.8034474712559,-73.8034467924196,-73.8034403331465,-73.8034310351829,-73.803424156912,-73.8034140762217,-73.803408423074,-73.803399662623,-73.803395578385,-73.8033940241133,-73.8033968594041,-73.8034038301535,-73.8034148257163,-73.803430453415,-73.8034332099969,-73.8034309246571,-73.8034235253518,-73.8034162397086,-73.8033997274699,-73.8033935514456,-73.8033890618124,-73.8033894019296,-73.8033861010748,-73.8033792722391,-73.8033723521624,-73.8033583074262,-73.803346463504,-73.8033378983732,-73.803326306063,-73.8033139433168,-73.8032981861802,-73.8032848447032,-73.8032637333819,-73.8032437358512,-73.8032035817504,-73.8031923426801,-73.8031661048614,-73.8031321779268,-73.8031240841912,-73.8031138631919,-73.8031016684857,-73.8030862005719,-73.8030700782973,-73.8030566575119,-73.8030434844951,-73.8030272996374,-73.8030172458892,-73.8030114906755,-73.8030061519271,-73.8030019122912,-73.8029943552855,-73.8029794332575,-73.8029572142476,-73.8029215526802,-73.8028920730259,-73.8028644300694,-73.8028347431551,-73.8028005997593,-73.8027053205335,-73.8026711679349,-73.8026566290449,-73.8026299053836,-73.8025709047583,-73.8024237167254,-73.8023584177934,-73.8023353424498,-73.8022786652259,-73.8022009589097,-73.8021928925362,-73.8021825643873,-73.8021606627623,-73.8021505817731,-73.8020943658779,-73.8020758667759,-73.8020276932853,-73.8020081995983,-73.8019868089979,-73.8019634990348,-73.8019382565773,-73.8018888492348,-73.8017657381599,-73.8017459668847,-73.8016880898675,-73.8016709268018,-73.8016564394445,-73.8016258342872,-73.8015461702358,-73.8014952442383,-73.8014721360703,-73.8013636035114,-73.8012541249121,-73.8012457249838,-73.8012349066239,-73.8010228888697,-73.8009486786282,-73.8009515525456,-73.8009108345036,-73.8008907853468,-73.800903273469,-73.8008930699797,-73.8008959696432,-73.800909005672,-73.8009150062396,-73.8008828551433,-73.8008768544129,-73.8008864632642,-73.800883415491,-73.8008705531318,-73.8008591679292,-73.8008229985189,-73.800779844078,-73.8007765470762,-73.8005651750557,-73.8005680203956,-73.8004952637198,-73.8005098546784,-73.800473792278,-73.8004672985563,-73.8004623404319,-73.8004513186147,-73.7999735317719,-73.7991845737638,-73.7991747811967,-73.7991604000904,-73.799167248752,-73.7991914897089,-73.7991969082538,-73.7991884260765,-73.7991385330341,-73.7991287764231,-73.7991226568794,-73.799145662173,-73.7991402419668,-73.7987884785068,-73.7986882098963,-73.7986541239533,-73.7986153163312,-73.7985726259757,-73.7985269757667,-73.7984793525683,-73.7984307858949,-73.7983823256563,-73.7983103379164,-73.798239957451,-73.7981719578763,-73.79810708664,-73.798112292869,-73.7978224823471,-73.797692351605,-73.797691327587,-73.7967910721176,-73.7967695166345,-73.7966082635941,-73.795673528029,-73.7956175698666,-73.7956183311845,-73.7955431570437,-73.7955463762113,-73.7954650486308,-73.7954635354575,-73.7953136029396,-73.7951933365679,-73.7950706855062,-73.7949463231563,-73.7948209323137,-73.7946965786432,-73.7945726155057,-73.7944497074562,-73.7943285133949,-73.7942096830347,-73.7940938534191,-73.7939816455075,-73.7938736608467,-73.7937704783464,-73.7936726511759,-73.7935807037988,-73.7935507760372,-73.7935146064042,-73.7934810987182,-73.7934683867041,-73.7934556766613,-73.7934305472589,-73.7934111560434,-73.7933850952171,-73.7933771789457,-73.7933589884056,-73.7933467509403,-73.7933364278478,-73.793318700187,-73.7933090173635,-73.793288720303,-73.7932575043313,-73.7931880396646,-73.7931646655147,-73.7931429340669,-73.7931225829606,-73.793099378261,-73.7930382805068,-73.7930249515367,-73.7929807564197,-73.7929117056841,-73.7928935997975,-73.7928735976404,-73.7928527225943,-73.7928429975396,-73.7928116886489,-73.7928032076438,-73.7927810968592,-73.7927699088344,-73.7927533213037,-73.7927405671694,-73.7927337029168,-73.792700953607,-73.7926648576839,-73.7926316641495,-73.7926222969637,-73.7926168585718,-73.7926107654925,-73.7925944145181,-73.7925834746533,-73.7925569931663,-73.7925360671186,-73.7925226651951,-73.7925059866605,-73.7924852612345,-73.7924555036574,-73.7924271518793,-73.79237327688,-73.7923539600404,-73.7923312154815,-73.7922853503261,-73.7922827714383,-73.7922657716274,-73.7922592636278,-73.7922405718276,-73.7922106548691,-73.7921933396592,-73.7921944799588,-73.7921914181468,-73.7921585715851,-73.7921386295015,-73.7921277147092,-73.7921047376719,-73.7920897214341,-73.7920797111125,-73.7920573871568,-73.7920509391275,-73.7920444880444,-73.79203842626,-73.7920287313629,-73.7919295519147,-73.7919121295448,-73.7918851237614,-73.7918529428479,-73.7918217197696,-73.7917972572013,-73.7917657054879,-73.7917454240327,-73.7917164527138,-73.7916903680145,-73.7916613854426,-73.7915883001475,-73.7915731719632,-73.7915397141203,-73.7915088581264,-73.7914722359877,-73.7914369098574,-73.7914160390717,-73.7913810225653,-73.7913466386936,-73.7913103431702,-73.7911864029795,-73.7911572061776,-73.7911138651035,-73.7910772577322,-73.7910441947503,-73.7910137128061,-73.7909819561306,-73.7909543765338,-73.790935468952,-73.790915603707,-73.7908995881797,-73.7908835948385,-73.7908685492465,-73.7908438381044,-73.7908207176112,-73.7907882651043,-73.7907586811506,-73.7907352280725,-73.790716966453,-73.7907035318837,-73.7906965034167,-73.7906836880164,-73.7906692427191,-73.7906473796139,-73.790619071618,-73.790587533814,-73.7905621049419,-73.790533774302,-73.7905083331263,-73.7904783747976,-73.7904513119695,-73.7904313508711,-73.7904023906965,-73.7903753719711,-73.7903512679409,-73.7903258777467,-73.7902979275357,-73.7902731941662,-73.7902535354717,-73.7900856055522,-73.7899967100026,-73.7899745412193,-73.7899563722886,-73.7899380759102,-73.7899063146254,-73.7898484642283,-73.7897954822662,-73.7897448728765,-73.7896960621875,-73.7896069544902,-73.7894838818015,-73.7893978251341,-73.7893319475014,-73.7892425201111,-73.7890704438684,-73.789009458113,-73.7889563064054,-73.78888814041,-73.7888504259262,-73.7888110804187,-73.7887485465497,-73.7886516879372,-73.7885725312445,-73.7885138732602,-73.7884615894142,-73.7884166111997,-73.7883637129931,-73.7883209790586,-73.7882753009593,-73.7882449333417,-73.7882060757601,-73.7881659468652,-73.7881387977423,-73.7881071188405,-73.7880772395231,-73.7880391201626,-73.7879775151098,-73.7879414299902,-73.7878951385265,-73.7878557488172,-73.78782163298,-73.7877898051664,-73.7877675696257,-73.7877455020878,-73.7877317168954,-73.7876963929195,-73.7876675503317,-73.7876185479178,-73.7875744781259,-73.7875258350769,-73.7874744175514,-73.7874307935248,-73.7873799470256,-73.7873419561138,-73.7873011909474,-73.7872738515927,-73.7866389736401,-73.7865033564862,-73.7863533281182,-73.7863048594403,-73.7863035495189,-73.7863143879221,-73.7863147341152,-73.786288106149,-73.7862564906196,-73.786222019579,-73.7861688184279,-73.7861663259701,-73.7861685512481,-73.7861788404122,-73.7862012062298,-73.7862438955323,-73.7862680434144,-73.7862878110694,-73.7863401978098,-73.7863887825273,-73.786433052821,-73.7864725417949,-73.786506832982,-73.7864669327872,-73.7865898380064,-73.7866255384318,-73.7867663078374,-73.7869028449409,-73.7870349471747,-73.7871624185536,-73.7871653344155,-73.7871783373919,-73.7871946425311,-73.7872105628667,-73.7872196023105,-73.7872315131196,-73.7872404000163,-73.7872499848116,-73.7872642149558,-73.7872707028803,-73.7872801037317,-73.7872917208995,-73.7873046490466,-73.7873185051615,-73.7873331555073,-73.7873433950961,-73.7873523026375,-73.787369421518,-73.7873806111207,-73.7873949512222,-73.787411557863,-73.787419305299,-73.7874305807554,-73.7874425385077,-73.7874551094421,-73.7874670875912,-73.7874757442994,-73.7874882483236,-73.7875001640694,-73.7875120146221,-73.7875218531503,-73.7875350645556,-73.7875462616966,-73.7875533365676,-73.7875656642408,-73.7875745143792,-73.7875871421951,-73.7875967182246,-73.787608738241,-73.787619759469,-73.7876304315415,-73.7876409470177,-73.7876496402184,-73.7876635101433,-73.787674487666,-73.7876890281427,-73.7878897161628,-73.7879299419281,-73.7880022705269,-73.7880715504991,-73.7883548397444,-73.7885000751371,-73.7886253668246,-73.7887606156777,-73.788867634427,-73.7889851576997,-73.7890885296823,-73.7891327861542,-73.7891882823172,-73.7892185045605,-73.7892363084508,-73.7892492449865,-73.7892640497442,-73.7892707943896,-73.7892835779178,-73.7893041864962,-73.7893596539239,-73.7893949388122,-73.7894626969611,-73.7895163751022,-73.7895346213068,-73.7895411493868,-73.7895472142273,-73.7895598347106,-73.7895775107852,-73.7896023117367,-73.7896263534454,-73.7896548567956,-73.7896761591639,-73.7897009861483,-73.7897507006724,-73.7897654061276,-73.7897729885864,-73.7897809614911,-73.7898007583233,-73.7898060265517,-73.789834827163,-73.7898751129413,-73.7898888938198,-73.7899094388818,-73.7899264353794,-73.7899485203325,-73.7899803860388,-73.7899962291786,-73.7900135066705,-73.790031717236,-73.7900513483697,-73.7901327142548,-73.7901696602697,-73.7902020808062,-73.7902361037268,-73.79027662468,-73.7902948023629,-73.7902994278082,-73.7903216472611,-73.7903337897945,-73.7903331460656,-73.7903316801715,-73.7903286861662,-73.790324031546,-73.7903193947578,-73.7903188560546,-73.7903225617514,-73.7903318742783,-73.7903468528613,-73.790366016532,-73.7903763055393,-73.7903822598154,-73.7903863152123,-73.7903915766893,-73.7903991652915,-73.790404266575,-73.7904104026113,-73.7904280266431,-73.7906703956822,-73.7906700708712,-73.7906855465806,-73.7907050891696,-73.7907248095526,-73.790748366004,-73.790769130237,-73.7908028575046,-73.7908157361601,-73.7908262552015,-73.7908491687664,-73.7908683006209,-73.7908921856888,-73.7909050151035,-73.7909172441526,-73.7909235331473,-73.7909341538619,-73.7909410097242,-73.7909458655937,-73.7909554625929,-73.7909751427851,-73.7909880828085,-73.7910219604496,-73.7910539033581,-73.7910884876079,-73.7911151854087,-73.7911356674641,-73.7911464705988,-73.7911475859171,-73.7911551320733,-73.7911863897345,-73.7911978807079,-73.7912017846163,-73.7911858287903,-73.7911851804753,-73.7911907436826,-73.7912079055316,-73.7912346532275,-73.7912407100585,-73.7912362994862,-73.7912336473191,-73.791234462734,-73.7912427216696,-73.7911979613538,-73.7911864750222,-73.7911689483703,-73.7911487218813,-73.7911291996959,-73.7911168945722,-73.7911020403909,-73.7910884796504,-73.7910731432714,-73.7910499107331,-73.7910363039858,-73.7910243296004,-73.7910113624891,-73.7909842485782,-73.7909692473285,-73.790966707189,-73.7909572578378,-73.7909463476073,-73.7909374325161,-73.7909314225108,-73.7909335690196,-73.7909344978793,-73.7909512824529,-73.7909708474101,-73.7909953727564,-73.7910189277161,-73.7910329684625,-73.7910361749239,-73.7910251567506,-73.7910179542064,-73.7909986060776,-73.790989544224,-73.7909693173788,-73.7909584162255,-73.7909468894716,-73.7909366075871,-73.7909187092029,-73.7909114925756,-73.7909026737873,-73.7908867246645,-73.7908752071509,-73.7908629237989,-73.7908450723663,-73.7908313582243,-73.7908005846623,-73.790776405498,-73.7907540710101,-73.7907277927604,-73.790706785304,-73.790690262347,-73.7906824848061,-73.7906764068957,-73.7906662242759,-73.7906508004343,-73.790595370995,-73.790537973698,-73.7904794061721,-73.7904204823075,-73.7904211709725,-73.7904226974689,-73.7904326101785,-73.7904370931087,-73.7904568408438,-73.7905700419604,-73.7905755240916,-73.7905771347877,-73.7905840345527,-73.7906030136446,-73.7906087854566,-73.7906101249093,-73.7906117467737,-73.7906136229564,-73.790669593295,-73.7906707197992,-73.7907067310185,-73.7907143995217,-73.7908040584739,-73.7908062614169,-73.7905944297404,-73.7905933432614,-73.7906818927781,-73.7906742249609,-73.7906727089734,-73.7906654446477,-73.7906638296013,-73.7906568850775,-73.7906464545827,-73.7906413709643,-73.7906377740856,-73.7906334960354,-73.7906290957677,-73.7906278616241,-73.7906204146483,-73.7906177587278,-73.7906029478242,-73.7906006398132,-73.7905768004642,-73.7905753632351,-73.7905698597283,-73.7905681203157,-73.7905678335643,-73.7905577786379,-73.790552393756,-73.7905506534905,-73.7905385766652,-73.7904253754972,-73.7904067442169,-73.7903193247474,-73.790317123294,-73.7904045494298,-73.7904023510796,-73.7904124362441,-73.7904047210201,-73.790383423134,-73.7903812382011,-73.790380361023,-73.7903789633477,-73.7902957114852,-73.7902128317094,-73.7901526364882,-73.7901608207458,-73.7901496115924,-73.7901577735789,-73.7901656270879,-73.7901696464953,-73.7901714140182,-73.7901809999018,-73.7901827807717,-73.7901922469611,-73.7901994322676,-73.7902038447662,-73.7902056256192,-73.7902152109528,-73.7902169782591,-73.7902205542704,-73.7902245871923,-73.7902273268837,-73.7902358922463,-73.7902374656808,-73.7902461251572,-73.7902483193384,-73.7902559543658,-73.7902576175574,-73.7902660910703,-73.7902676638745,-73.7902761253786,-73.790277686167,-73.7902860465556,-73.7902876193827,-73.7902962872884,-73.7902977561485,-73.790306218388,-73.7903077798403,-73.7903162547623,-73.7904238115948,-73.7904248147227,-73.7902504239903,-73.7902500104928,-73.7901783000132,-73.7901761694431,-73.7902505477276,-73.7902815117736,-73.7902743442816,-73.7901874489295,-73.7901826376013,-73.7901816194572,-73.7901554610442,-73.7901479384387,-73.7901343095825,-73.7901299201232,-73.790138885819,-73.7901311949162,-73.7901199866647,-73.7901134405471,-73.7900656436186,-73.7899470552338,-73.7899064370479,-73.7899006918675,-73.7898665049067,-73.7898580733859,-73.7898614477066,-73.7898685513478,-73.7898958891096,-73.789882432428,-73.7898546191522,-73.789848689118,-73.7898456956044,-73.7897851316378,-73.78978687942,-73.7897897129199,-73.7898230113407,-73.7898106723668,-73.7897798417371,-73.7897768799594,-73.7897751268896,-73.7897550344794,-73.7897390188982,-73.7897220699886,-73.7897062183409,-73.7896931691464,-73.7896832287685,-73.7896766305842,-73.7896735295047,-73.7896873761161,-73.789712057399,-73.7897131719807,-73.7897263182001,-73.7897161994223,-73.7897205263478,-73.7897317337508,-73.7897382529751,-73.7897397518765,-73.7897495934449,-73.7897540268943,-73.7897609444913,-73.7897625399515,-73.7897648496644,-73.7897721865835,-73.7897736974835,-73.7897834381253,-73.7897861123857,-73.7897947695449,-73.7897961927412,-73.7898060323172,-73.7898075338197,-73.7898121644619,-73.7898186767265,-73.7898286167521,-73.7898638656099,-73.789873606484,-73.7899968915851,-73.7899990943909,-73.7896987236082,-73.7896976345842,-73.7898411023289,-73.7898312804325,-73.7898298410845,-73.7898248549577,-73.789817190859,-73.7898081972891,-73.7898027832543,-73.7897966602605,-73.789795118298,-73.7897850116735,-73.789783673211,-73.7897734747287,-73.7897720351663,-73.7897619279267,-73.7897604890378,-73.7897503824781,-73.7897487521083,-73.7897388456272,-73.7897372947137,-73.7897295793705,-73.7897270948089,-73.7897256568068,-73.7897170605382,-73.7897141101677,-73.7896958667114,-73.789705953713,-73.7896982658032,-73.7896859348711,-73.7896750018978,-73.7896743600627,-73.7896738967583,-73.7894603524432,-73.7894247225453,-73.7894137054955,-73.7894024270997,-73.789395143082,-73.7894012876079,-73.789412196829,-73.789424550995,-73.7894248796351,-73.7893838254404,-73.789378105849,-73.7893793632538,-73.7893761707196,-73.7893531151333,-73.7893312441389,-73.789303878552,-73.7892732974538,-73.789243332059,-73.7892099783502,-73.789179593688,-73.7891725602875,-73.7891794570947,-73.7891878799052,-73.7891887719647,-73.7891861188097,-73.7891824428435,-73.7891422717672,-73.7891290465876,-73.7891208484846,-73.7891130666732,-73.789111556091,-73.7891153756189,-73.7891234320429,-73.7891419217049,-73.7891642640376,-73.7891854489019,-73.7892027508169,-73.7892128317459,-73.7892154914681,-73.7892099430009,-73.7891899647149,-73.7891666427371,-73.7891519908476,-73.7891499118313,-73.7891301148115,-73.7891166356462,-73.7891067586143,-73.789111801044,-73.7891242907872,-73.7891381937532,-73.7891208586042,-73.78910870574,-73.7891069625366,-73.7891204101836,-73.789131437422,-73.7891496917163,-73.7891626177448,-73.7891699943219,-73.7891720390863,-73.7891737634738,-73.789176051945,-73.789180286323,-73.7891914011452,-73.7892003477182,-73.7892122341179,-73.7892060925493,-73.7892055857194,-73.7892117672762,-73.7892284112724,-73.7892455441222,-73.7892624984735,-73.7892685809627,-73.7892678668431,-73.7892624390966,-73.7892536247427,-73.789242448287,-73.7892330513694,-73.7892287730828,-73.7892371208607,-73.7892375753388,-73.7892295648954,-73.7892319135429,-73.7892292819758,-73.7892239473968,-73.7892008120086,-73.7891987448845,-73.7892031525298,-73.7892225736615,-73.7892363961816,-73.7892434785241,-73.7892497082822,-73.7892548556676,-73.78925996091,-73.789256389901,-73.7892478733231,-73.7892398755406,-73.7892354817733,-73.7892227264953,-73.7892167419103,-73.789221133766,-73.789220651933,-73.7892201723234,-73.7892122232344,-73.7891979985426,-73.7891863750341,-73.7891708121684,-73.7891588059019,-73.7891597863339,-73.7891561649938,-73.7891494766589,-73.7891427997799,-73.789121077026,-73.7891344157257,-73.7891339679722,-73.7891181658513,-73.7891019586131,-73.7891006666848,-73.7890993875034,-73.7891038727292,-73.7891106751913,-73.7891174789781,-73.7891318136952,-73.7891476540793,-73.7891566416011,-73.7891855414937,-73.7891919992271,-73.7891920747924,-73.7891908024912,-73.789181546432,-73.789165588559,-73.7891392645183,-73.789068291215,-73.7889770366264,-73.7888957602654,-73.7888599973601,-73.7888443043442,-73.7888319992508,-73.7888140832798,-73.7887971601477,-73.7887724106701,-73.7887641558448,-73.7887440656206,-73.788725395427,-73.7887047635189,-73.788675539242,-73.788641326112,-73.7886065203392,-73.7885839443651,-73.788553672118,-73.788536279031,-73.7885237656104,-73.7885112521853,-73.7885033934661,-73.7884923259623,-73.7884676080429,-73.7884287861272,-73.7884162777442,-73.7883667765859,-73.7883404569392,-73.7882884717325,-73.7882618681033,-73.7882207305037,-73.7882101727133,-73.7882037285846,-73.7881912245939,-73.7881752184712,-73.788152404992,-73.7881069308385,-73.788092046576,-73.7880719963165,-73.7880581860509,-73.7880381573555,-73.7880180848383,-73.7880028438394,-73.7879820116462,-73.7879665671928,-73.7879281171125,-73.7879156694131,-73.7878922376782,-73.7878741405196,-73.7878575011757,-73.7878355942092,-73.787823144044,-73.7878055121184,-73.7877821099852,-73.7877505175673,-73.7877420402307,-73.7877234972214,-73.787688750027,-73.7876558291996,-73.7876508593211,-73.7876416287736,-73.7876226435098,-73.7875927894574,-73.7875940545289,-73.7875829233518,-73.7875622124781,-73.7875402762315,-73.7875341081999,-73.7875145728328,-73.7875015625371,-73.7874749475544,-73.7874499362079,-73.7874315790633,-73.7874017448272,-73.7873804101434,-73.7873513612673,-73.7873249254411,-73.7872835079853,-73.7872438594406,-73.7872155073376,-73.7871908785645,-73.7871691922136,-73.7871498336376,-73.7871248229709,-73.7871023122659,-73.7870969554153,-73.78709826804,-73.7870916341217,-73.7870655646415,-73.7870379055408,-73.7870083276577,-73.786976276019,-73.7869689502503,-73.7869763105809,-73.7869836812457,-73.7869925578446,-73.7870014351054,-73.7870244940072,-73.7870231292598,-73.7870000816038,-73.7869489890716,-73.7869325702592,-73.7869214698311,-73.7869087905168,-73.7868933405339,-73.7868726736499,-73.7868579474411,-73.7868453071895,-73.7868197067482,-73.7867957173194,-73.786755568717,-73.7866909007611,-73.7866680027709,-73.7866436747178,-73.7866240946364,-73.7866054013709,-73.7865848097756,-73.7865600366651,-73.7865308681775,-73.7865005057333,-73.7864708424682,-73.7864668747899,-73.7864443347303,-73.7864240087787,-73.7864024409634,-73.7863951501853,-73.7863370006981,-73.7862915727927,-73.7862387337743,-73.7862089397216,-73.7861654642579,-73.7861273913565,-73.7860780055875,-73.7860571543552,-73.7860237486715,-73.7859938159804,-73.7859710976622,-73.785952916435,-73.7859251043757,-73.7858840052671,-73.7858512619777,-73.7858237106097,-73.7857937881344,-73.7860650818484,-73.7860887345345,-73.7861435869864,-73.786105282421,-73.7857800655194,-73.7857780949851,-73.7857532354442,-73.7857381085642,-73.7857236290053,-73.7857045075324,-73.7856889160771,-73.785667785006,-73.7856420527327,-73.7859835911779,-73.7859430373042,-73.7858859624751,-73.7859185896004,-73.7856327637329,-73.7856195462069,-73.7856019073333,-73.7855877434277,-73.7855823694157,-73.7855674227919,-73.7855645516737,-73.7855634439396,-73.7855645941978,-73.7855656827182,-73.7855749330086,-73.7855785274998,-73.7855819807166,-73.7855792154547,-73.7855719756877,-73.7855613555706,-73.7855495634764,-73.7855460940746,-73.7855428191514,-73.7855343231045,-73.7855170322148,-73.7854971608163,-73.7854613810112,-73.7854472113969,-73.7854156187335,-73.7853935808703,-73.7853681979549,-73.7853154869272,-73.7852836875124,-73.7852530155861,-73.7852205056039,-73.7851941978982,-73.78517278166,-73.7851434486737,-73.785083077605,-73.7850542903208,-73.7850259143327,-73.7849977914499,-73.7849630953365,-73.7849423319791,-73.7849161254917,-73.7848895164179,-73.7848794271856,-73.784870586205,-73.7848596458618,-73.7848137197045,-73.7847958299783,-73.7847680111651,-73.7847344434565,-73.7846953711013,-73.7846477296779,-73.7846251666291,-73.7845954585572,-73.7845665117044,-73.7845373715338,-73.7845100311294,-73.784482331704,-73.7844286514026,-73.7843841986464,-73.7843325051658,-73.7842814123419,-73.7842226803892,-73.7841695299335,-73.7841009961771,-73.7840391048712,-73.783988611299,-73.7839415299821,-73.7838926225543,-73.7838511934909,-73.7838288841489,-73.7838034338003,-73.7837618943173,-73.7837361507594,-73.7836449148863,-73.7835952739753,-73.7835567842201,-73.7835207328793,-73.7835056090531,-73.783496099955,-73.7834694517241,-73.7834707910351,-73.7834683209107,-73.7834642786232,-73.78345786484,-73.7834457634087,-73.7834293278847,-73.7834063732484,-73.7833959860442,-73.783373176938,-73.7833712591384,-73.7833643125109,-73.7833576278076,-73.7833419740553,-73.7833245613077,-73.7832898962296,-73.7832485946515,-73.7832283674284,-73.7832098706909,-73.7831727864431,-73.7831510926538,-73.7831366383313,-73.7831321166963,-73.7831333340295,-73.7831398017008,-73.7831363378543,-73.7831280240591,-73.7831343246511,-73.7831474349527,-73.7831644438236,-73.7831847587034,-73.7832043169042,-73.7832266271089,-73.7832554876234,-73.7832755672557,-73.7832931232547,-73.7833257508644,-73.7833504408152,-73.7833734142587,-73.7833911948417,-73.7834554663972,-73.783464517724,-73.7834813827143,-73.7834841772495,-73.7834889069767,-73.7834984466352,-73.7835038373124,-73.7835142760072,-73.7835298312738,-73.7835596861121,-73.7835789038438,-73.7835954136683,-73.7836074928552,-73.7836172851156,-73.7836285544023,-73.7836358804457,-73.7836379238286,-73.7836050067449,-73.7836061735608,-73.78362666255,-73.7836272101498,-73.7836277707412,-73.7836367561347,-73.7836399857607,-73.7836512761346,-73.7836808597858,-73.7837091850993,-73.7837449298421,-73.7837644056854,-73.7837770230479,-73.7838061610844,-73.7838707783725,-73.7838808920015,-73.7838910179407,-73.7838900188497,-73.7838869072532,-73.7839015362119,-73.7839239960653,-73.7839364583798,-73.783947649712,-73.7839567448506,-73.7839498079909,-73.7839304996253,-73.7839324474276,-73.7839173477141,-73.7838997853996,-73.7838741320928,-73.7838537195558,-73.7838278682438,-73.7838091795515,-73.783817659506,-73.7838206219652,-73.7837950718664,-73.7837837951175,-73.783763013599,-73.7837319449242,-73.7837177517298,-73.7837089290262,-73.7836936991152,-73.7836806473876,-73.7836744426421,-73.7836682493245,-73.7836647474121,-73.7836699316424,-73.7836669629241,-73.7836294544504,-73.783600010822,-73.7835707210696,-73.7835581114659,-73.7835540305274,-73.7835161059125,-73.7834908424499,-73.7834718473775,-73.7834436837136,-73.7834011987203,-73.7833842445563,-73.7833796243207,-73.783390776892,-73.783404565302,-73.7834038894106,-73.7833879282281,-73.7833588075524,-73.7833379030228,-73.7833167748501,-73.7833023730231,-73.7832948499736,-73.7832873260464,-73.7832697712842,-73.7832520521986,-73.7832398438957,-73.7832328529062,-73.783251489663,-73.7832529818628,-73.7832415871083,-73.7831973334153,-73.7831920176963,-73.7831765582719,-73.7831555333099,-73.7831108907336,-73.7830700370222,-73.7830364107295,-73.78298147505,-73.782936294463,-73.7829056493192,-73.7828931300396,-73.7828850408962,-73.7828436949065,-73.7828280684702,-73.7828046065296,-73.7827997094917,-73.7827933518074,-73.7827745192135,-73.782746802345,-73.7827395189192,-73.7827382789618,-73.7827129263491,-73.7826813076207,-73.7826512293443,-73.782658215877,-73.7826301268029,-73.7826017357238,-73.7826028332436,-73.7825973507228,-73.7825863267077,-73.7825596690038,-73.7825361714402,-73.7825092276018,-73.7824862661088,-73.782462754185,-73.782378728476,-73.7823312457979,-73.782289479509,-73.7822537477645,-73.7822083011731,-73.7821224360095,-73.7820356078126,-73.7819856188624,-73.7819527253146,-73.7818807560742,-73.7818330655919,-73.7818069998387,-73.7817862029057,-73.7817477411389,-73.78173055396,-73.7816923823054,-73.7816560378077,-73.7816366753603,-73.7816166366388,-73.7815790765107,-73.7815588543154,-73.7815385290055,-73.7815065217414,-73.7814658668752,-73.7814195085451,-73.7813675028103,-73.7813043672219,-73.7812701068719,-73.7810218241902,-73.7809873307123,-73.7804083226788,-73.7802456487958,-73.7794014392239,-73.7792701544495,-73.7788148768506,-73.7786932213697,-73.7785680693995,-73.7782892124283,-73.7779808300086,-73.7776875942565,-73.7773904169832,-73.7772789827485,-73.7771309348388,-73.7770311396954,-73.7769279804783,-73.7768033156276,-73.7766672635363,-73.7765808225963,-73.7764749300841,-73.7763584369479,-73.7762653833009,-73.7761407621011,-73.7759517189499,-73.7758355701068,-73.7754792405511,-73.775458628752,-73.7754380169872,-73.7753952925399,-73.7753516474572,-73.7752644619335,-73.7752225507699,-73.7751464839224,-73.7750522666411,-73.7749233665847,-73.774804178814,-73.7747364041888,-73.7746524564662,-73.7745335984846,-73.7744136021342,-73.7742695710831,-73.774222344114,-73.774202397581,-73.7741722192056,-73.7741289739422,-73.7741294628374,-73.7741336102761,-73.7741657713945,-73.7742226936343,-73.7742705282427,-73.7743300451988,-73.7744255270604,-73.7744590472243,-73.7744908031617,-73.7745119430876,-73.774536482472,-73.7745603378389,-73.7745879556987,-73.774615572462,-73.7746408599633,-73.7746616693476,-73.7746799841397,-73.7747705623471,-73.7747972510297,-73.7748032719371,-73.7748102662827,-73.7748144100892,-73.774813794092,-73.7748068540612,-73.7747976620205,-73.7747533901269,-73.7747078481186,-73.7746963915616,-73.7746808240789,-73.7746621724381,-73.7743970542338,-73.7743766195285,-73.7743499661213,-73.7743274580315,-73.7743090477536,-73.7742943786518,-73.7742808838334,-73.7742628713388,-73.7742470208807,-73.7742332242909,-73.7742173775335,-73.7742162034629,-73.7742224517175,-73.7742301788163,-73.7742466501226,-73.7742553958968,-73.774275482551,-73.7742983432084,-73.7743254148134,-73.7743530758229,-73.7743808559245,-73.7744085040147,-73.7744354815394,-73.7744624597164,-73.7744829412183,-73.7745034345916,-73.7745510986733,-73.7745738638951,-73.7745887960433,-73.7746029459907,-73.7746211805567,-73.7746305995161,-73.7746365753831,-73.7746394828631,-73.7746414676725,-73.7746428084315,-73.7746413131611,-73.7746341578389,-73.7746461190791,-73.7746671127304,-73.7747077747192,-73.774731816024,-73.7747450428037,-73.7747638620594,-73.7747864592519,-73.7748129932109,-73.7748241424827,-73.7748266105824,-73.7748267763498,-73.7748268913157,-73.7748280247368,-73.7748348850182,-73.7748444173143,-73.7748488654648,-73.774888549431,-73.7749387783054,-73.7749733078393,-73.7749945501279,-73.7750448443823,-73.7750548578985,-73.7750648720794,-73.7752385198618,-73.7752604081286,-73.775273855438,-73.7752873148487,-73.7753197220776,-73.7753648170795,-73.7754478651901,-73.7755040744157,-73.7755212729318,-73.7755355553276,-73.7755429767608,-73.7755486543444,-73.7755599152568,-73.7755665331228,-73.7755866554816,-73.7756042828523,-73.7756196532498,-73.7756578534311,-73.7756732624129,-73.7757418841933,-73.7758312167412,-73.7758451335812,-73.7758738665951,-73.7759042150091,-73.7759197459348,-73.7759518582596,-73.7759557535048,-73.7759601473623,-73.7759625339713,-73.7759676184065,-73.7759757557212,-73.7759813765442,-73.7759921865152,-73.7759969268969,-73.7760009693188,-73.7760041734712,-73.7760064560193,-73.7760077215282,-73.7760079876462,-73.7760079934167,-73.7760077496699,-73.7760072470852,-73.7760065079189,-73.7760055083406,-73.77596856303,-73.7759309258108,-73.7757849079212,-73.7757259626911,-73.7757061698236,-73.7756862609702,-73.7756241808282,-73.7755980859069,-73.7755703276481,-73.775537279188,-73.775497508147,-73.7753747121141,-73.7753380915166,-73.7753077039689,-73.7751284973814,-73.7750735213425,-73.7750481477032,-73.7750034302605,-73.7749744561874,-73.7749459848426,-73.7749317720569,-73.7749269655385,-73.7749251969612,-73.7749305572665,-73.7749297739873,-73.7749267509852,-73.7749085545262,-73.7748999578101,-73.7748901347523,-73.7748726840939,-73.7748253320815,-73.7748063126374,-73.7747602813147,-73.774746697421,-73.7747373853523,-73.7747310501998,-73.7747276159847,-73.774727236319,-73.7747299843844,-73.7747366070564,-73.7747373966933,-73.7747344392551,-73.7747275870203,-73.7747173329728,-73.7747019761045,-73.7746890379971,-73.7746774672501,-73.7746353808712,-73.7746213564081,-73.7745900946967,-73.7745455161387,-73.774581662776,-73.7746248915921,-73.7746280384372,-73.7746264711951,-73.774601490718,-73.7745844767564,-73.7746044318293,-73.7746884508707,-73.7747159717678,-73.7747369164851,-73.7747454183045,-73.774761614426,-73.7747766635732,-73.7748136238156,-73.7748276036699,-73.7748326235325,-73.7748341970078,-73.7748393486754,-73.7748487185613,-73.7748809781407,-73.7748923469089,-73.7748978294844,-73.7749033245856,-73.7749099428762,-73.7749128298293,-73.7749119870954,-73.7749072865333,-73.7748935318407,-73.7748793478914,-73.7748757705119,-73.7748780089714,-73.7748854772529,-73.7748982523166,-73.7749081979198,-73.774959228631,-73.7751594209371,-73.7751708454886,-73.7751799020557,-73.7751863599239,-73.7751871126134,-73.7751796890912,-73.775167238019,-73.7751490207891,-73.7751316822032,-73.7751112811993,-73.7750838495279,-73.7750535825599,-73.7750229279642,-73.7749266749063,-73.7748909224301,-73.7748335972117,-73.7747906845147,-73.7747540331857,-73.774723186144,-73.7747034044968,-73.7746942473413,-73.774686620493,-73.7746879896464,-73.7746936385406,-73.7747088967981,-73.7747313243791,-73.7747717855254,-73.7748195950672,-73.7748784844787,-73.7749137389966,-73.7749688835917,-73.7749996977694,-73.7750324888993,-73.7750671424741,-73.7751034085461,-73.7751287159189,-73.7751572923177,-73.7751866276491,-73.7752624903682,-73.7752842172751,-73.7753032105219,-73.7753342615122,-73.7753606262421,-73.7753760831685,-73.7754069631899,-73.7754436715797,-73.775464302981,-73.7754857592531,-73.7755570489848,-73.7755906116768,-73.7756724279463,-73.775701864387,-73.7757776320493,-73.7758547544727,-73.7758814058217,-73.7758950323549,-73.7759050111013,-73.7759111492324,-73.7759224536322,-73.7759330789449,-73.7759499895041,-73.7759888761183,-73.7760034647615,-73.776015579303,-73.7760224377881,-73.7760260132656,-73.7760317130469,-73.7760539176107,-73.7760457410148,-73.7760291118865,-73.7760040156322,-73.7759507985527,-73.7759101547337,-73.775873045942,-73.775845909816,-73.7758341309426,-73.775815341371,-73.7758080456107,-73.7757985266769,-73.7757826511175,-73.7757709527732,-73.7757550251349,-73.7757254638193,-73.7756891989244,-73.7756593617534,-73.7756328573123,-73.775617581733,-73.7756064218183,-73.7755968361678,-73.775588954346,-73.7755829301849,-73.775580610237,-73.775577400486,-73.7755761648485,-73.7755806087654,-73.7755984381216,-73.7756115853643,-73.7756454519545,-73.775688143627,-73.7757259356811,-73.7757748696854,-73.7758674827302,-73.7759005211664,-73.7759384382709,-73.7759763667972,-73.776009330495,-73.7760169963519,-73.7760360741398,-73.7760579355511,-73.7760819764521,-73.7761075111881,-73.7761337708002,-73.7761600683867,-73.7761729009806,-73.7761857439048,-73.776210253479,-73.7762249256439,-73.7762320383498,-73.7762356567533,-73.7762559218365,-73.7762782576726,-73.7763020163646,-73.7763265087415,-73.7763510243501,-73.7763748520634,-73.7763973007084,-73.7764161736535,-73.7764328643378,-73.7764469628807,-73.7764792425499,-73.7765200130459,-73.7765550769751,-73.7765840617402,-73.7766089315068,-73.7766254580248,-73.7766183345058,-73.7766100691768,-73.7766008792761,-73.7765910063424,-73.7765807098661,-73.7765702604701,-73.7765685261341,-73.7765657166576,-73.7765619081382,-73.7765572037342,-73.7765517308695,-73.7765456377832,-73.7765390895136,-73.7765322634285,-73.7765253444203,-73.7765185198988,-73.7765119747142,-73.7765056466178,-73.7764999994705,-73.7764951991214,-73.7764913865499,-73.7764886737259,-73.776487140321,-73.776486831369,-73.776487755943,-73.7764898868892,-73.7764988395903,-73.7765128916559,-73.7765298276125,-73.7765455725766,-73.7765597666235,-73.7766049662665,-73.776635296455,-73.7766545866936,-73.7766704292988,-73.7767055614496,-73.7767285076359,-73.776760028719,-73.776788104551,-73.7768468092238,-73.7768757540789,-73.7769243811837,-73.7769601449935,-73.7769950520968,-73.7770296835684,-73.7773363202505,-73.7773665790593,-73.7774027282068,-73.7774256372645,-73.7774543929934,-73.7774636216476,-73.7774758324206,-73.7774908200474,-73.7775144606171,-73.7775418152792,-73.7775720812795,-73.7776043704285,-73.7776221564483,-73.7776368932982,-73.7776482253428,-73.7776558791139,-73.7776596141803,-73.7776714226793,-73.7776910159334,-73.777705148948,-73.7777214434702,-73.7777598135098,-73.7778030236581,-73.7778506393829,-73.7779072029443,-73.7779666727661,-73.7780288237906,-73.7780398057842,-73.7780527667265,-73.7780673800409,-73.7780832775167,-73.7781000585864,-73.7781173004188,-73.7781345685734,-73.7781514279461,-73.778167453733,-73.7783571476973,-73.7783599726631,-73.7783626180888,-73.7783650051173,-73.7783670625939,-73.7783687291876,-73.7783699552191,-73.7783707041417,-73.7783709536311,-73.7783706962502,-73.7783699396714,-73.7783687064474,-73.7783670333393,-73.7783649702206,-73.7783625785906,-73.778359929741,-73.7781534119905,-73.7781338191578,-73.7781158466103,-73.7780999195865,-73.7780864149263,-73.7780756521549,-73.7780785486613,-73.7780801655535,-73.7780804139131,-73.7780747116826,-73.7780764026766,-73.7780907793121,-73.7781214515369,-73.7781382332651,-73.7781582130951,-73.7781808697831,-73.7782056211708,-73.778218092269,-73.778232035246,-73.778264313816,-73.7783024356024,-73.7783471540577,-73.77836673971,-73.778387748998,-73.778470443297,-73.7785075620664,-73.7787148631821,-73.7788669679823,-73.7789872865962,-73.7791089017109,-73.7791341716549,-73.7791898922575,-73.7792472575935,-73.7793068691868,-73.7793698843602,-73.7794245218081,-73.7794547259279,-73.7795242981462,-73.7795848650449,-73.779684801446,-73.7798346039733,-73.7798687662048,-73.7799029420759,-73.7799342222836,-73.7799675332509,-73.7800023794585,-73.7800740054352,-73.7801090008511,-73.7801721054757,-73.7802566534263,-73.7803490030637,-73.7804206218155,-73.7806940132634,-73.7807226652832,-73.7807398198615,-73.7807327045797,-73.7807552715094,-73.7808108323142,-73.7808707385144,-73.7810107337272,-73.7811035633284,-73.7811662833747,-73.7812121247587,-73.7813164993497,-73.781373089266,-73.7814336708032,-73.7814777422332,-73.7815200374221,-73.7815406375559,-73.7815656000013,-73.7815895719552,-73.7816080155217,-73.7816348873633,-73.7816562208508,-73.7816588472545,-73.7817165759258,-73.7817709603691,-73.7818212474205,-73.7818667406635,-73.7819068100732,-73.7819409007421,-73.781970678528,-73.7819923161412,-73.782002183292,-73.7820080539196,-73.7820096791919,-73.7820113068644,-73.7819913320746,-73.7819360135701,-73.7819055918766,-73.7818940569096,-73.7818778837808,-73.7818572569845,-73.7818322654304,-73.7818086980763,-73.7817826204328,-73.7815901331061,-73.7815169588828,-73.7814955737047,-73.781452291845,-73.7814425498353,-73.7814192749892,-73.7814109233841,-73.7813879004422,-73.7813770762338,-73.781358744408,-73.7813404529393,-73.7813419779861,-73.7813297399813,-73.7811052355601,-73.7809305400691,-73.7806177374446,-73.7805956870741,-73.7805710995562,-73.780544710382,-73.780517308935,-73.7804974998274,-73.7804775376231,-73.7804502641998,-73.780423425436,-73.7803936198751,-73.7803655337064,-73.780236747555,-73.7801833442591,-73.7801674222315,-73.7801521861507,-73.7801472024238,-73.7801441021438,-73.7801503707875,-73.7801598376676,-73.7801711536594,-73.7801706514563,-73.7801684557319,-73.78016314495,-73.7801559413034,-73.7801453745188,-73.780101369887,-73.7800571989178,-73.7800704574468,-73.7800653162024,-73.7797546050558,-73.7797388090499,-73.779726393466,-73.7796936099086,-73.7796758709688,-73.7796746659364,-73.7796707033373,-73.7796438298508,-73.7795796710093,-73.7795467449914,-73.7794434330666,-73.7793717424039,-73.7793174654793,-73.7791549505702,-73.7790664355121,-73.7790436440524,-73.7790241372345,-73.7790133842286,-73.7790039844596,-73.7789826316323,-73.7789814240838,-73.7789828491809,-73.7789868651689,-73.7789933543786,-73.7789955992175,-73.778997480543,-73.7789989475664,-73.7789999606838,-73.7790005083461,-73.7790004994684,-73.7789999343196,-73.7789988300167,-73.7789972200068,-73.7789954518617,-73.7789933799272,-73.7787682530116,-73.7787645216781,-73.7787606800496,-73.7787567977789,-73.7787520538816,-73.7787474862433,-73.7787432209429,-73.7787393757136,-73.7787249640625,-73.7787115417398,-73.7786853537618,-73.778635864188,-73.7786159338297,-73.7786019834655,-73.7785881663149,-73.778581153745,-73.7785575726627,-73.7785490382499,-73.7785367020448,-73.7785327839876,-73.7785281947317,-73.778511792275,-73.7784913626621,-73.7784665661827,-73.7784346674444,-73.7784057432047,-73.7783412281701,-73.7783158865123,-73.7782884472351,-73.7782659814659,-73.7782465406749,-73.7782297316043,-73.7782086178483,-73.7781889408425,-73.7781709394524,-73.7781547647768,-73.7781483232693,-73.7781100087146,-73.7780908391463,-73.7780774758955,-73.7780637666965,-73.7780496400929,-73.7780356746466,-73.7780191579167,-73.7779610831584,-73.7779399558411,-73.7778631025669,-73.7778415644714,-73.7778141444862,-73.7778048908919,-73.777731882595,-73.777677960858,-73.7776240511341,-73.7775206532431,-73.7774733792735,-73.7774217481077,-73.7774017544398,-73.7773860641275,-73.7773723010921,-73.7773694370919,-73.7773692598684,-73.7773518831981,-73.7773147879462,-73.7773095791335,-73.7773027762506,-73.7772951694435,-73.7771985062932,-73.7771861105555,-73.7771499239539,-73.7771302938324,-73.7770644074665,-73.7770366488225,-73.7770194242739,-73.7770096803672,-73.776988133778,-73.776948487075,-73.7769461210137,-73.776934960797,-73.7767847248324,-73.7766202968601,-73.7765703050483,-73.7765223419082,-73.7763539470025,-73.7763535605312,-73.7763498238602,-73.7763177038621,-73.7763000184168,-73.7762764752334,-73.77625982654,-73.7762168976505,-73.776194725683,-73.7761927882602,-73.776180801268,-73.7761805610816,-73.7761791514488,-73.7761739097137,-73.7761173531282,-73.7760881078679,-73.7760444513513,-73.7760194941171,-73.776010275563,-73.7760090075017,-73.7760142074615,-73.776018765608,-73.7760154391343,-73.7760016385097,-73.7759842385834,-73.7759630898688,-73.7759391793611,-73.7759098507734,-73.7758079787677,-73.7757480567016,-73.7756800832039,-73.7756004963302,-73.775564005191,-73.775518829094,-73.7754550132792,-73.775414201013,-73.77538820339,-73.7753614780291,-73.7752933629883,-73.7752703535474,-73.7752479336173,-73.7752271320921,-73.7751114272762,-73.7749720735378,-73.7749703323768,-73.774962827457,-73.7749479605569,-73.7749269236358,-73.7749002070587,-73.7748684335779,-73.7748573876123,-73.7748513303599,-73.7748502038221,-73.774850567165,-73.7748553541094,-73.774874217366,-73.7748855683491,-73.774889149695,-73.7748848802127,-73.7748728567237,-73.7748533518653,-73.7748268079075,-73.7748145402507,-73.7747826966579,-73.7747552020396,-73.7747322207443,-73.7747124274679,-73.774710380376,-73.7747100968006,-73.774710547823,-73.7747117674098,-73.7747161104775,-73.7747324443185,-73.7747421272579,-73.7746165788419,-73.7746198002118,-73.7746039850794,-73.774602113341,-73.7744813396476,-73.7744795424716,-73.7745250442246,-73.7745234216942,-73.7746009641035,-73.7745990882522,-73.7746175548555,-73.7746206296033,-73.7747472472181,-73.7747638109976,-73.7746411337564,-73.7746403362973,-73.7747631317229,-73.7747564130838,-73.774742850219,-73.7747226332927,-73.7746960457577,-73.7746634603805,-73.7746369039563,-73.7746155355151,-73.7745993150756,-73.7745929922277,-73.7745885955269,-73.7745891413379,-73.7745892915135,-73.7745880532147,-73.7745854577044,-73.7745815705105,-73.7745823492838,-73.774580986496,-73.7745775168605,-73.7745720287558,-73.7745646619737,-73.7745556041591,-73.77454508603,-73.7745333755007,-73.7744936815783,-73.7744841416667,-73.7744753467855,-73.7744642715364,-73.7744550908053,-73.7744479822848,-73.7744430835592,-73.7744433360815,-73.7744404207511,-73.7744350246895,-73.7744271660832,-73.7744270542207,-73.7744164398301,-73.7744036670907,-73.774383170801,-73.7743701819589,-73.774358422769,-73.7743125982292,-73.774264382926,-73.77426028244,-73.7742517333228,-73.7742446205755,-73.7742391429198,-73.7742354533944,-73.7742336550798,-73.774233798218,-73.7742358788091,-73.7742398387231,-73.774240773377,-73.7742382063464,-73.7742322025115,-73.7742229136118,-73.774210574411,-73.7741839640219,-73.7741585099613,-73.7741411142352,-73.7741281796942,-73.7741199509688,-73.7741096794315,-73.7741059476383,-73.774108810312,-73.7741182254532,-73.7741340549568,-73.7741521976781,-73.774174539503,-73.7741748866066,-73.7741749494071,-73.7741748800541,-73.7741747284072,-73.7741745061508,-73.7741742123663,-73.7741738473148,-73.7741734116164,-73.7741723160709,-73.7741709121109,-73.7741692254477,-73.7741649638532,-73.7741593427366,-73.7741309482794,-73.7741196706856,-73.7741170975482,-73.7741149036641,-73.7741130859809,-73.774111613702,-73.7741110119897,-73.7741104952388,-73.7741100717373,-73.7741097303399,-73.7741093214268,-73.7741092416664,-73.7741092441625,-73.7741141216439,-73.7741348041224,-73.7741408296947,-73.774141689022,-73.7741409725346,-73.7741432837177,-73.7741478548113,-73.7741524659581,-73.7741645598181,-73.7741690978377,-73.7741776235941,-73.7741842630436,-73.7741844685055,-73.77418439064,-73.7741840179877,-73.774183361402,-73.7741824199523,-73.7741811840228,-73.7741796516043,-73.7741778117704,-73.7741733892158,-73.774167618427,-73.7741399362503,-73.7741338933768,-73.7741290093167,-73.7741242679361,-73.7741223933866,-73.7741208394749,-73.7741196034273,-73.774118687416,-73.7741180661632,-73.7741177643485,-73.7741181516037,-73.7741221367553,-73.7741296941194,-73.7741420534984,-73.7741848215241,-73.7742051864619,-73.774216438465,-73.7742228395082,-73.7742241174657,-73.774224117809,-73.7742238871068,-73.7742233845767,-73.7742226337914,-73.7742216105759,-73.7742203149604,-73.7742187473226,-73.7742147613397,-73.7742102064765,-73.774204492755,-73.7741788709967,-73.7741683752704,-73.7741634428544,-73.7741594217081,-73.7741577364582,-73.7741562635421,-73.7741549909379,-73.7741539210302,-73.7741511855916,-73.7741491015079,-73.7741452223444,-73.7741433073918,-73.7741404090904,-73.7741385878848,-73.7741364808251,-73.7741207006658,-73.7741025824082,-73.7740572556112,-73.7740085544747,-73.773955005461,-73.7739446592211,-73.7739324708674,-73.7738791452571,-73.7738680182633,-73.7738584640533,-73.7738362050705,-73.7738274845809,-73.773814546468,-73.7737933788753,-73.7737724568435,-73.7737443283908,-73.7737253885386,-73.7737122502363,-73.7737101129921,-73.7737014135145,-73.773701499381,-73.7737032456759,-73.7737164894213,-73.7737185847037,-73.7737194943664,-73.7737190124497,-73.7737181027182,-73.773716718878,-73.7737148616424,-73.7737125312387,-73.7737097154169,-73.7736740549994,-73.7736324408321,-73.7735854526163,-73.7735337449119,-73.7734861752828,-73.7734366071366,-73.7733859470436,-73.773335121544,-73.7732994741423,-73.7732644759934,-73.7732309037799,-73.7731995025393,-73.7731709691296,-73.7731459367643,-73.7731266043433,-73.7731110156293,-73.7730994593453,-73.7730685923341,-73.7730657054463,-73.7730624211477,-73.7730546820468,-73.7730455555901,-73.7730352831345,-73.7730240995246,-73.7730125147374,-73.7730010131493,-73.7729900745517,-73.7729637599637,-73.7729089900539,-73.772884735931,-73.7728126360421,-73.7727546987148,-73.7727349407484,-73.7727110926981,-73.7726847399076,-73.7726582898216,-73.7726027468022,-73.7725753381614,-73.7725509940707,-73.7725285984877,-73.7724858575746,-73.7724664120313,-73.772354259212,-73.7722412163707,-73.7721564733628,-73.7721144406273,-73.7720374091887,-73.7720074931362,-73.7719772569679,-73.7719504032425,-73.7719064467118,-73.7717967024464,-73.7717146395753,-73.7716790667001,-73.7716497935027,-73.7716191038552,-73.7715888645479,-73.7715310798177,-73.771457257478,-73.7714139185675,-73.7713070194024,-73.7712040353662,-73.7711982479904,-73.7711865626526,-73.7711735061239,-73.7711593018545,-73.771144195379,-73.7711284962987,-73.7711125298481,-73.7710966632499,-73.7710606579699,-73.7710246126099,-73.770989317324,-73.7709555458236,-73.7709240384159,-73.7708870065648,-73.7708438950676,-73.7707958298513,-73.7707440662131,-73.7706899560367,-73.7706349124871,-73.7706137634609,-73.7705946719453,-73.7705781945336,-73.7705648116065,-73.7705488005553,-73.7705304520297,-73.7705103128427,-73.7704889831711,-73.7704670986693,-73.7704453115262,-73.7703727705842,-73.7702998680936,-73.7702276399188,-73.7701571123436,-73.7700053633165,-73.7698810317214,-73.7698520360133,-73.7698261676794,-73.769814536229,-73.7698027473596,-73.7697781326017,-73.7697565612089,-73.7696987210488,-73.7696670413474,-73.7696127508819,-73.7695961928534,-73.7695624077455,-73.7695477270817,-73.7695316219494,-73.7695142925684,-73.769496069963,-73.7694772510935,-73.7694583652661,-73.7694399101713,-73.7694223815148,-73.7693757367894,-73.7693397084541,-73.7692876349053,-73.7692503863634,-73.7691855550195,-73.7691076923228,-73.76902982862,-73.7689521265002,-73.7688975494072,-73.7687775389514,-73.7687229413012,-73.7686400307123,-73.7685850103498,-73.7685340197086,-73.7684868567326,-73.7684637525859,-73.7684047651013,-73.7683784246502,-73.7683448847491,-73.7682732794675,-73.7682408166579,-73.7681898031738,-73.7681711483723,-73.7681549573632,-73.7681404594938,-73.7681340424152,-73.7681281772844,-73.7681228537632,-73.7681180619348,-73.7681138101507,-73.7681100893987,-73.7680992580518,-73.7680894811585,-73.7680667809275,-73.7680368859177,-73.7680283915836,-73.7680081292507,-73.7680067159131,-73.7680049943448,-73.7680004903718,-73.767979671423,-73.7679754782097,-73.7679721933939,-73.7679503097038,-73.7679398704013,-73.7679366906248,-73.7679351652138,-73.7679350123446,-73.7679352608935,-73.767935922888,-73.7679369873996,-73.7679383588175,-73.7679400618258,-73.7679445341425,-73.7679504365526,-73.767957886713,-73.7679735866159,-73.7680172540108,-73.7680435625351,-73.7681062491693,-73.7681355168275,-73.7681410828387,-73.7681464462807,-73.768156717574,-73.7681667225244,-73.7681943912842,-73.7682047665676,-73.7682101048102,-73.7682156340394,-73.7682399516417,-73.7682654948314,-73.7682916830248,-73.7683180569374,-73.7683969370248,-73.7684315302242,-73.7684641662521,-73.7684852549811,-73.768532806082,-73.7685541300836,-73.7685661520723,-73.7685791509613,-73.7686328786048,-73.7686455934203,-73.7686571889455,-73.7687011962767,-73.7687851600614,-73.7687971144412,-73.7688390328965,-73.7688846983052,-73.768904725491,-73.7688917638077,-73.7689314606459,-73.7689799009703,-73.7690072861183,-73.769016421235,-73.7690229725278,-73.7690308024205,-73.7690398994508,-73.769050274444,-73.7690747424771,-73.7691041118577,-73.7691891784688,-73.769220769943,-73.7692324467041,-73.769251140991,-73.7692560185019,-73.7692609071398,-73.7692658644641,-73.7692709962845,-73.7693026437811,-73.7693092149817,-73.7693153972631,-73.7694155363363,-73.7695869087764,-73.7696131133313,-73.7696740111103,-73.7697007198686,-73.7697177925864,-73.7697357437995,-73.7698000253883,-73.7698282841543,-73.7699323841222,-73.7699761691586,-73.7700155717014,-73.7700517546641,-73.7700731691921,-73.7701176593302,-73.77017682425,-73.7702740886928,-73.7702805383322,-73.7702923541345,-73.770313390883,-73.7703363481647,-73.7703602477494,-73.7703839066796,-73.7704066291054,-73.7704276476877,-73.7704373673667,-73.770446476072,-73.7704683455719,-73.7704900496415,-73.7705120960162,-73.7705552476916,-73.7705745008754,-73.7705963393645,-73.7706179534415,-73.7706448264614,-73.7706645870806,-73.7706956755421,-73.7707250359,-73.7707389480334,-73.7707525239889,-73.7707872052214,-73.7708235249686,-73.7708613191173,-73.7709002697019,-73.7709308647414,-73.770958345169,-73.7709816837218,-73.7710002428972,-73.7710107069038,-73.771020232801,-73.7710367211596,-73.7710501442542,-73.771062452222,-73.7710647110477,-73.7710649791953,-73.7710591233429,-73.7710582818911,-73.7710599715045,-73.7710645532676,-73.7710704277217,-73.7710790878299,-73.7710905684283,-73.7711272010144,-73.7711369003756,-73.7711437557009,-73.77115249541,-73.7711580733787,-73.7711605243634,-73.7711598618174,-73.7711557024036,-73.7711467245463,-73.771135342743,-73.7711058159883,-73.7710939261194,-73.7710867482204,-73.7710843741066,-73.7710871200451,-73.7710955061141,-73.7711062422284,-73.7711141974222,-73.7711191444761,-73.7711349315703,-73.771139054263,-73.7711393089279,-73.7711389131171,-73.7711362158622,-73.771116242608,-73.7711129243112,-73.7711112638116,-73.7711105407235,-73.7711118787778,-73.7711281731824,-73.7711302849931,-73.7711302089683,-73.771125901278,-73.7711195384298,-73.7711110344586,-73.7711003046957,-73.7710528236859,-73.7709351261395,-73.7709123968636,-73.7708673092232,-73.7707373338483,-73.7707424465438,-73.7707528359568,-73.7707790890397,-73.7708264393771,-73.7708473791312,-73.7708419899009,-73.7708391752866,-73.7708047126414,-73.7707808064803,-73.7707438331868,-73.7707122342882,-73.7706886589747,-73.7706518991445,-73.7706175881474,-73.7706016789518,-73.7705831114775,-73.7705459655242,-73.7705035614735,-73.7704453306685,-73.7703974139011,-73.7703444395099,-73.7702754652311,-73.7702646936335,-73.7702328460693,-73.770222117424,-73.7701858827409,-73.7702523641613,-73.7703138937263,-73.7703700294626,-73.7704203681375,-73.7704142933553,-73.7704033885725,-73.770384241361,-73.7703561356167,-73.7703250673407,-73.7702953251842,-73.7702625417431,-73.7702279335524,-73.770183875779,-73.7701706004355,-73.7701643502722,-73.7701612222252,-73.7701627402662,-73.7701637970145,-73.7701654341669,-73.7701690851557,-73.7701742947421,-73.770207126837,-73.7702145953684,-73.7702171841477,-73.7702190307509,-73.770245990085,-73.7702718933096,-73.7702974655561,-73.7703263389662,-73.7703395276677,-73.7703520552946,-73.7703775043774,-73.7704086211374,-73.7704872310977,-73.7704681186036,-73.7704578663427,-73.7704566582725,-73.7704645160881,-73.7704812988314,-73.7705067054186,-73.770540280041,-73.7705601137256,-73.7705710414293,-73.7705727575488,-73.7705652140766,-73.7705486219448,-73.7705234451287,-73.7704903876736,-73.7704439091608,-73.7703928841061,-73.7703377798828,-73.7702791012304,-73.7702173856322,-73.7702052123949,-73.7701935102429,-73.7701826224276,-73.770172868314,-73.7701645340135,-73.770157863991,-73.7701530538945,-73.7701502448164,-73.7701495191543,-73.7701508981946,-73.7701363985747,-73.7701169632823,-73.7700929129469,-73.7700646443358,-73.7700462904006,-73.7700307011422,-73.7700182736651,-73.7700093245348,-73.770004081714,-73.7700026787558,-73.7700051514006,-73.7700114366662,-73.7700213744511,-73.7700347116132,-73.7700534544598,-73.7700645608251,-73.7700678971611,-73.7700634233369,-73.7700511931217,-73.7700313535393,-73.7699802477477,-73.7699364883434,-73.7699003650525,-73.7698721170496,-73.7698519313741,-73.7698399416915,-73.7698362274069,-73.7698408131397,-73.7698536685589,-73.7698747085835,-73.7699037939453,-73.7699417222759,-73.7699721244564,-73.7699948811229,-73.7700099029198,-73.7700171308512,-73.770016536513,-73.7700192048632,-73.7700124964803,-73.769996603896,-73.7699719832565,-73.7699393412306,-73.7698684467777,-73.7698049398178,-73.7697925448899,-73.7697833492917,-73.7697775826455,-73.7697753889509,-73.7697768229888,-73.769781848953,-73.7697903413442,-73.7698020881038,-73.7698221434336,-73.7698347838403,-73.7698397996308,-73.769837107588,-73.7698267523518,-73.7698089056797,-73.7697838635988,-73.7697520414961,-73.7697139672287,-73.7696702723683,-73.7695572036169,-73.7695462775559,-73.7695289067008,-73.7695055801432,-73.7694769546677,-73.7694438362592,-73.7694071574103,-73.7693679508644,-73.769327320538,-73.7692996997087,-73.7692750332574,-73.7692539581123,-73.7692370184699,-73.7692246517427,-73.7692171772643,-73.7692147880433,-73.769217545779,-73.7692253792674,-73.7691968812579,-73.7691745311841,-73.7691589747482,-73.769150661386,-73.7691498312821,-73.7690161421487,-73.7690145502718,-73.7690077725659,-73.7689959692666,-73.7689794194283,-73.7689676857025,-73.7689517238015,-73.7689408198736,-73.768935241167,-73.7689351244157,-73.7689404724877,-73.7689511543139,-73.768968074904,-73.7689880837897,-73.7690007803495,-73.7690369349354,-73.769067345198,-73.7690877634328,-73.769108513693,-73.7691296332793,-73.7691396434007,-73.7691512844112,-73.7691797656083,-73.7692155600952,-73.7692635931377,-73.7693092309743,-73.769417241362,-73.769467226608,-73.7695013422237,-73.7695725764671,-73.7696019995386,-73.7696609094773,-73.7697153102116,-73.769767455525,-73.769818184544,-73.7698283860992,-73.7699543582363,-73.7700832272164,-73.7702147580464,-73.7702279120988,-73.7702419643945,-73.7702565650714,-73.770271350614,-73.7702859529039,-73.7703000083855,-73.7703131671172,-73.7703251014842,-73.7703355143551,-73.7703441685594,-73.7703552824938,-73.7703685468421,-73.77038359244,-73.7704000005493,-73.7704173145114,-73.7704350524574,-73.7704527207183,-73.7704654717885,-73.7704783145403,-73.7704908763245,-73.7705027926446,-73.7705137177332,-73.7705280053082,-73.7705430707806,-73.7705586208209,-73.7705743526655,-73.7705899600105,-73.7706092184396,-73.7706278046754,-73.7706449770005,-73.7706679847179,-73.7707137198034,-73.7707262128041,-73.7707389035453,-73.7707621282576,-73.7707897874985,-73.7708224454607,-73.7708644356954,-73.7709185729139,-73.7709549325996,-73.7709886840332,-73.7710044773681,-73.7710197564061,-73.7710258554322,-73.7710321206811,-73.7710454386448,-73.7710862987222,-73.7711003405786,-73.7711135729814,-73.7711198484272,-73.7711260047928,-73.7711689452322,-73.7711996962333,-73.7712289122568,-73.7712407576605,-73.7712510187967,-73.7712912175345,-73.771361350079,-73.7713897690596,-73.7714934010842,-73.7714937072192,-73.7715855971799,-73.7717273497864,-73.7718187697134,-73.7718465474094,-73.7718466227929,-73.7718616147112,-73.7718746376626,-73.7718864830016,-73.7718914102445,-73.7719008356735,-73.7719074595342,-73.771915720172,-73.7719403210666,-73.7719456365011,-73.7719489116512,-73.7719636565871,-73.77197744828,-73.7719830896072,-73.7719900735787,-73.7720090965038,-73.7720532149167,-73.7721119078782,-73.7721178953008,-73.7721252314717,-73.7721438888505,-73.7721676556579,-73.7721940888671,-73.7721959659049,-73.7722143805513,-73.7722345023452,-73.7722563068642,-73.7722798402918,-73.7723588562621,-73.7725272670121,-73.7726928856985,-73.7728552680339,-73.7730139784155,-73.7730809628462,-73.7731451800079,-73.7732059967312,-73.7732628133769,-73.773315069748,-73.7733622506139,-73.7734038907899,-73.7734056378988,-73.7734052051865,-73.7734033898882,-73.7733955931147,-73.7733822262269,-73.7733613190281,-73.7733244987483,-73.7732362818338,-73.7731987388422,-73.7731621070199,-73.7731307266894,-73.7730494627963,-73.7730196903468,-73.7729567654066,-73.7729327200278,-73.7729113931563,-73.7728959008683,-73.7728849979041,-73.7728785434566,-73.7728784087938,-73.7728786513161,-73.7728792361723,-73.7728801874142,-73.7728815051346,-73.7728831663198,-73.7728875131376,-73.7728932068367,-73.7729000704975,-73.7729078884504,-73.7729163781357,-73.7729341192849,-73.77294255493,-73.7729502808852,-73.7729570214591,-73.7729626868655,-73.7729650810402,-73.7729671797825,-73.7729689586623,-73.7729704298314,-73.7729999267002,-73.7730660145716,-73.773390194967,-73.7734097120092,-73.7734276137358,-73.7734922286161,-73.7735189070819,-73.7735483979781,-73.7735775169173,-73.7736046044434,-73.7736776071414,-73.7737091583369,-73.7737449292238,-73.7737676775313,-73.7737810417912,-73.7737913895167,-73.7737990075748,-73.7738072092963,-73.7738097849536,-73.7738108133512,-73.773808630144,-73.7738088425268,-73.7738110207291,-73.7738153614019,-73.7738241541382,-73.7738472739775,-73.7738549776988,-73.7738859101927,-73.7739108113025,-73.7739170348874,-73.7739207677506,-73.7739239440799,-73.7739278681188,-73.7739326342091,-73.7739382775391,-73.7739422974548,-73.7739443032786,-73.773946309958,-73.7739483166074,-73.7739503249932,-73.7739523458515,-73.7739543558842,-73.7739563775417,-73.7739584015895,-73.773962474421,-73.7739665981219,-73.7739707837436,-73.7739853925256,-73.7740093072807,-73.774017640334,-73.7740527693593,-73.7740809475436,-73.7740928435592,-73.7741180604719,-73.7741312788372,-73.7741318240865,-73.7741325006772,-73.7741333297462,-73.7741343002687,-73.7741354124956,-73.7741366424368,-73.7741380140212,-73.7741394916667,-73.7741428231495,-73.774146520342,-73.7741504518245,-73.7741544656219,-73.7741620523295,-73.7741652598085,-73.7741678993512,-73.7741698891093,-73.7741706310784,-73.7741711939148,-73.7741715932891,-73.7741718023234,-73.774171846797,-73.7741717130818,-73.7741621061536,-73.774148710208,-73.7741315530967,-73.7741041494618,-73.7740920718836,-73.7740568624256,-73.7740487208103,-73.7740432574984,-73.7740393319131,-73.7740369203471,-73.7740348822998,-73.7740325715227,-73.7740142408178,-73.7739930624686,-73.7739849167802,-73.7739773224592,-73.7739579375357,-73.7739345674392,-73.7739013074259,-73.7738578222754,-73.7738373812835,-73.7738168667037,-73.773787622586,-73.7737264630054,-73.7737028302578,-73.7736633960735,-73.7735954581159,-73.7735671661519,-73.7735355781114,-73.7735040805645,-73.7734886203661,-73.7734735653331,-73.7734480434867,-73.7734185874336,-73.7733859797136,-73.7733510865964,-73.7733148350681,-73.7732781882037,-73.7732421195811,-73.7732075874161,-73.7731755091052,-73.7731467368536,-73.7731313094908,-73.7731113261431,-73.7730873833538,-73.7730601958609,-73.7730305752613,-73.7729994057834,-73.7729676178912,-73.7729361605095,-73.7729059726968,-73.7726632282815,-73.7724163451187,-73.7721655972425,-73.7719112629804,-73.7718276217388,-73.7717415670277,-73.7716539380542,-73.7715655893792,-73.7714773825827,-73.7713901778611,-73.7713048256376,-73.7712740381915,-73.7712429610477,-73.771212512495,-73.7711835922482,-73.7711570548636,-73.7711336844883,-73.7711078502824,-73.7710801423635,-73.771051385637,-73.7710224362336,-73.7709941560202,-73.7709673869409,-73.77094292595,-73.7709167839499,-73.770891226052,-73.7708667870581,-73.7708439783572,-73.7708066335683,-73.7707668014505,-73.7707252861052,-73.7706829256141,-73.7706405751209,-73.770389687482,-73.7701981469448,-73.7701060927564,-73.7700690743281,-73.7700278890932,-73.7698588689227,-73.7696506822438,-73.769638491473,-73.7696259961294,-73.7695993851945,-73.7695748126446,-73.769519171471,-73.7694926601112,-73.769469470062,-73.769447594984,-73.7694099738552,-73.7693710945689,-73.7693308513122,-73.7692890181251,-73.7692456321569,-73.7692000070755,-73.7691515868237,-73.7690989290565,-73.7690206896526,-73.7689649625555,-73.7689151321967,-73.7688703711833,-73.7685826847262,-73.7684604444133,-73.768414160334,-73.7683714053908,-73.7683546501778,-73.7683370607492,-73.7683184731142,-73.7682985424985,-73.7682592124146,-73.7681828504966,-73.7681513197119,-73.7681186466552,-73.7680893764376,-73.7680314557676,-73.7678995259225,-73.7678669716792,-73.767837294613,-73.7677876546539,-73.7676654919582,-73.7676317075786,-73.7676013209394,-73.7675607760042,-73.7675453008217,-73.7675186061644,-73.7674275279153,-73.7673763830733,-73.7672634252232,-73.7672137357689,-73.7671592195634,-73.7671025363521,-73.7670437923495,-73.7669830845767,-73.766941573983,-73.7669001998525,-73.7668592577793,-73.7668190315112,-73.7667244910131,-73.7666913977135],"lat":[40.6142546549475,40.614250528622,40.6142574952948,40.6142453039918,40.6142361439421,40.6142421360205,40.614224885274,40.6142036130588,40.6142045337514,40.6141953354384,40.6141700094208,40.6141386617523,40.6141042752257,40.6140709462133,40.6140456693216,40.6140263960341,40.6140061758632,40.6139889404694,40.6139636601905,40.6139464092692,40.6139281757745,40.6139230234654,40.6139280085493,40.6139198330264,40.6138945473034,40.6138843612972,40.6138802103251,40.6138740603499,40.6138587920504,40.6138435270879,40.6138283188937,40.6138162384619,40.6138254551222,40.6138363668487,40.613836283074,40.6138240844563,40.6138090873115,40.6137947686493,40.6137906742758,40.6138020400884,40.6138128617293,40.613828968197,40.6138228315909,40.613809679515,40.6137902463859,40.6137836263883,40.6137711464029,40.6137542026866,40.6137327850024,40.6136875561069,40.6136702620824,40.6136266057618,40.6135891236684,40.6135542522178,40.6135211527106,40.6135066800815,40.6134913551984,40.6134751874932,40.6134581869661,40.6134403424384,40.6134216649265,40.6134021177572,40.6133816554173,40.613376743057,40.6133720504423,40.6133675398106,40.6133631128213,40.6133557911925,40.6133402342546,40.6133319761899,40.61332774576,40.6133233862147,40.6133188443815,40.6133140654055,40.6132617869914,40.6132066746086,40.6131483146396,40.6131326826777,40.6130858957161,40.6129871130944,40.6129566192268,40.6129293621377,40.612899496104,40.6128342651111,40.6128072378575,40.6127387829878,40.6126952986178,40.6126454097806,40.6125785417133,40.6125232714282,40.6125039311417,40.6124829729867,40.6124651067265,40.6124613121306,40.6124572918503,40.6124502317715,40.6124439266565,40.6124383856941,40.6124018566937,40.6123608104617,40.6123555138333,40.6123496421667,40.6123433219919,40.6123367060985,40.612331642577,40.6123262747223,40.612320692978,40.6123150225079,40.6123039657679,40.6122989404012,40.6122944652315,40.6122842705664,40.6122618874141,40.6122511642134,40.6122218307625,40.6122163924828,40.6122108638382,40.6122053132508,40.6121998252518,40.6121866459352,40.6121717772392,40.612118643937,40.6120820889571,40.6120672872795,40.6120599615775,40.6120536236753,40.6120481746112,40.6120457652411,40.6120435617093,40.6120352306105,40.6120268960907,40.6120016362586,40.6119556730472,40.6119236879278,40.6118948471007,40.611869052898,40.6118462420167,40.6118349442105,40.6118248411627,40.6118163281331,40.6118009828992,40.6117733595355,40.6117673604341,40.6117641344149,40.6117608557811,40.6117576885018,40.611756857913,40.6117553920235,40.6117547736676,40.6117536236172,40.6117496290686,40.6117434792075,40.6117227211348,40.6117178886317,40.6117152739261,40.6117148169901,40.6117149355106,40.6117183660715,40.6117187001141,40.6117184590146,40.6117138236624,40.6117075036337,40.6116995468979,40.6116899618647,40.6116813944997,40.6116774269042,40.6116707338989,40.6116677707618,40.6116578269148,40.6116421392387,40.6116086205096,40.6115763920399,40.6115534580457,40.6114885239617,40.6114692958422,40.6114507761387,40.6114329450567,40.6114158140531,40.6114006513107,40.6113871232825,40.6113748404974,40.6113601435825,40.611359206046,40.6118472427577,40.6113597125881,40.6108208649503,40.610184642971,40.6101981228625,40.6100126516049,40.6099710131896,40.6098393441379,40.6091516700545,40.6090313658008,40.6090391864342,40.6091335579802,40.6092153070721,40.6092448025611,40.6093809246084,40.6095575931736,40.6098587915843,40.6100673936647,40.6101829512594,40.6104770050961,40.6108793778468,40.6108157959109,40.6101554576521,40.6101515978711,40.6101490458937,40.6101477386662,40.6101495043606,40.6101542906041,40.6101619554302,40.6101722714894,40.610184932793,40.610199563789,40.6102157305011,40.6102965595015,40.6103098292151,40.6103218705774,40.6103323269459,40.6103408886225,40.610347302026,40.6103609209791,40.6103686383578,40.6103703857339,40.6103661476138,40.6103643636827,40.6103578707655,40.6103516676142,40.6103422610193,40.610338020389,40.6103338957106,40.6103341970906,40.6103382744542,40.6103373484916,40.6103309664967,40.6103192042727,40.6103130486315,40.6103074815299,40.6103033789964,40.610299993031,40.6102973997898,40.610294791589,40.6102926220852,40.6102896386441,40.6102867318697,40.6102848883354,40.6102820985289,40.6102808024862,40.6102827848585,40.6102869456551,40.6102911097495,40.6102950979837,40.6102957746022,40.6102967653235,40.6103045922088,40.6103105340953,40.6103136277577,40.6103133625097,40.6103096268742,40.6103054153466,40.6103033090491,40.6103025707008,40.6103022708074,40.6103024009189,40.6103045903579,40.6103064365432,40.6103048536096,40.6103001384803,40.6102955176137,40.6102929525284,40.6102896727554,40.6102879895411,40.6102860483946,40.6102843679286,40.6102819526632,40.6102774886566,40.6102734718568,40.6102702850268,40.6102704306067,40.6102720374733,40.6102776156534,40.6102805916128,40.610279830584,40.6102762988981,40.6102701128543,40.6102700639765,40.6102880481446,40.6102910550684,40.6102832389644,40.6102819815973,40.6102808398132,40.6102626929575,40.6102595257832,40.610261586925,40.6102649890238,40.610256595991,40.6102450969585,40.6102414684548,40.610241497042,40.6102429198145,40.6102466627248,40.6102470902673,40.6102458004126,40.6102454087868,40.610245123539,40.6102422524801,40.6102369274988,40.6102314313496,40.6102295359615,40.6102254340697,40.6102183798311,40.6102127892246,40.6102056776042,40.610189987995,40.61016610923,40.6101500826605,40.6101394251298,40.6101589035221,40.6101707759113,40.610177346082,40.6101796454054,40.6101712195024,40.6101790704935,40.6101895973557,40.6101914345443,40.6101960054153,40.6101994770773,40.6102033010222,40.6102051866629,40.6102069841715,40.6102078079336,40.6102147280434,40.6102207338575,40.6102326107886,40.6102373674682,40.6102339638112,40.6102218889354,40.6102036280499,40.6101958628329,40.6101971616245,40.6102031118825,40.6102206976863,40.6102412543917,40.6102687197319,40.6102776368755,40.6102913743295,40.6103038186138,40.6103067976506,40.6103020120028,40.6102915398727,40.6102753755043,40.6102586637098,40.6102403625534,40.610222618273,40.6101973708205,40.6101755435013,40.6101544153392,40.6101336663333,40.6101089283469,40.6100854051932,40.6100768023169,40.6100773652269,40.6100814797605,40.6100991611942,40.6101048771754,40.6101085959841,40.6101198409489,40.6101281814509,40.6103652889503,40.6103742578574,40.6103748249378,40.6103802893037,40.6103851850548,40.6103656866573,40.6103558042895,40.6103526207133,40.6103521298861,40.6103535119002,40.6103606771734,40.6103022256842,40.6101184279463,40.6101208015401,40.6101149991597,40.6101157835709,40.61012313285,40.6101368415929,40.6101494480789,40.6101584423157,40.610163557686,40.6101646425539,40.6101616647606,40.6101547125772,40.6101439920885,40.6101298210833,40.6101271650374,40.6101266783721,40.6101283718594,40.6101322080149,40.6101381019275,40.6101459231386,40.6101559629607,40.6101918021048,40.6102316827926,40.6102751379985,40.6103216588367,40.6103707005195,40.6103990823391,40.6104052416785,40.6105198629088,40.6116405538272,40.6117943265438,40.6120110775895,40.6123101579678,40.6119980108849,40.6121788391533,40.611726499417,40.6115740995571,40.6119916547488,40.6117424929569,40.6112035526029,40.6101174529375,40.6088924844812,40.6081623428489,40.6077159965038,40.6075368704248,40.6074721710666,40.6072598660959,40.6055189208322,40.604598232281,40.6040401433012,40.6031211357847,40.6028025717903,40.6025660272114,40.6015994988107,40.5984528538427,40.5983393459828,40.5982263311987,40.5981914292931,40.5981409639973,40.5980187280319,40.5976004783072,40.5973193595632,40.5972808113883,40.5972634442931,40.5972683712726,40.5972632148108,40.5973631983613,40.5973588942403,40.5973241477774,40.5972962594185,40.5972629936936,40.5972320136694,40.5972218192827,40.5971827453488,40.5971368706904,40.5971173795656,40.5970832267165,40.5970631302385,40.5970557144636,40.597011837708,40.5970001866654,40.5969562730935,40.5969488173265,40.596955440414,40.5972446310752,40.5972480777386,40.5972531946157,40.5972659146248,40.5972414428984,40.5972172746649,40.5969944663454,40.5969898893497,40.5969857201294,40.5969820832898,40.596979087525,40.5969768223694,40.5969753555215,40.5969747308209,40.5969749669381,40.5969760568162,40.5969779678821,40.5969806430199,40.5969840022777,40.5969879452577,40.596992354116,40.5969970970853,40.5970464390018,40.5970912624507,40.5971310151103,40.5971652071409,40.5971934172215,40.5972152977412,40.597230579083,40.5972390729466,40.5972406746684,40.5972353645116,40.5972114955819,40.5971811811061,40.5971447288194,40.597102508764,40.5970549495324,40.5970025339162,40.5969457940047,40.5968853057834,40.5968479460785,40.5968085555892,40.5967681440771,40.5967277474753,40.5966884013332,40.59665111427,40.5966120109143,40.5965756402063,40.5965427514612,40.5965140222576,40.5964900444776,40.5964713121136,40.5964582110908,40.5964541175107,40.5964495056619,40.5964445049621,40.596439255741,40.596433905302,40.5964286037892,40.5963733767386,40.5962812340572,40.5962357014411,40.5962086472918,40.5962037646358,40.5962026127408,40.596210227619,40.5961869395404,40.5961821956732,40.5962364324785,40.596274540415,40.5963078234296,40.59631887912,40.5964099798625,40.5964802322842,40.5967749955401,40.5967993985565,40.5968205985755,40.5968379883044,40.596851069599,40.5968594677337,40.5968629421363,40.5968612628131,40.5968604857789,40.5968606304048,40.5968616930854,40.5968636473284,40.5968664444155,40.5968700146166,40.5968742689281,40.596879101292,40.5968961555747,40.5969137678503,40.5969314800073,40.5969488313358,40.596965370511,40.5969730997394,40.5969803950175,40.5969870380644,40.5969928301143,40.596997597864,40.5970011986583,40.5969994472864,40.5969923947747,40.5969802429006,40.596963339338,40.5969590594706,40.5969552489275,40.5969519877036,40.596949344262,40.5969473740967,40.5969534804573,40.5969553295127,40.5969528694223,40.596946169158,40.5969354165708,40.5969343828693,40.5969327958651,40.5969306983634,40.596928146939,40.5969252104101,40.5969219679819,40.5969185071108,40.5969149211448,40.5969113068061,40.5969077615821,40.5969043810962,40.5969012565283,40.5968984721553,40.5969009853296,40.5969032849662,40.5969053078027,40.5969069981918,40.5969083096314,40.5969092060443,40.5969096627705,40.5969096672455,40.5969092193463,40.5969083313944,40.5969070278171,40.5969078099533,40.5969082788356,40.596908422355,40.5969082368051,40.5969077269778,40.5969069060396,40.5969057951913,40.596904423121,40.5969028252628,40.5969010428817,40.5968991220084,40.5968971122499,40.5968797746031,40.5968638755276,40.5968498495789,40.596838080116,40.5968283617439,40.5968230665697,40.5968223109247,40.5968261114096,40.5968284255849,40.5968284002084,40.5968260357695,40.5968213778529,40.5968182426142,40.5968152696625,40.5968125384969,40.5968101221511,40.5968080852402,40.5968064822327,40.5968053559946,40.5968047366422,40.5968046407376,40.5968050708453,40.596806015464,40.5968074493337,40.5968093341116,40.5968116193972,40.5968172184773,40.596821876286,40.5968254651058,40.5968278865308,40.5968290741654,40.5968289954445,40.5968336518678,40.5968392292896,40.5968455916066,40.5968525835619,40.5968600345339,40.5968677626998,40.5968755794723,40.596883294102,40.5969047368742,40.5969240667479,40.5969261934594,40.5969283106056,40.5969303546586,40.5969322642831,40.5969339821782,40.5969354567956,40.5969366438872,40.5969375078325,40.5969380227074,40.5969381730624,40.5969379543858,40.5969373732393,40.5969364470612,40.5969243241242,40.5969147559868,40.5969079831848,40.5969041759814,40.5969034300867,40.5969041023889,40.5969044167524,40.5969043640787,40.5969039458923,40.5969031742966,40.596902071624,40.5969006697889,40.5968990093646,40.5968971384086,40.5968951110718,40.5968929860312,40.5968908247916,40.5968886899055,40.5968661780893,40.5968453983135,40.5968268755727,40.5968110778377,40.596798404233,40.5967891749525,40.5967836231704,40.5967818891504,40.5967679275838,40.5967518147079,40.5967340256783,40.5967150850784,40.5966955514501,40.5966760008225,40.5966590443658,40.596642796445,40.5966276519967,40.5966137208704,40.5966016734934,40.596591814604,40.5965843935821,40.5965795981421,40.5965826637052,40.5965845901045,40.596585327482,40.5965848567531,40.5965831901011,40.5965803706614,40.5965764714057,40.5965715932526,40.5965658624564,40.596548876159,40.5965363665849,40.5965286125145,40.5965402391987,40.5965470521118,40.5965517533885,40.5965561803737,40.596560212079,40.5965637383193,40.5965666627236,40.5965689053687,40.5965704049638,40.5965557310661,40.5965461861358,40.596542033232,40.596543386809,40.5965502095621,40.5965623758291,40.5965703407978,40.5965739772854,40.5965732272254,40.5965718564564,40.5965698123709,40.5965671569667,40.5965639707833,40.5965603504588,40.5965564057992,40.5965522564473,40.5965480282547,40.5965438494639,40.5965398468191,40.5965361417221,40.5965328465497,40.5965300612457,40.5964902644393,40.596448228433,40.5964044100578,40.5963592855138,40.5963133451953,40.5962724508818,40.5962315657048,40.5961917792024,40.5961541516323,40.596119685718,40.5961245794045,40.59612453559,40.596113420952,40.5960739606301,40.5960677640591,40.5960691129606,40.5960701490663,40.5960922694532,40.5960661303974,40.5960377549819,40.5960351366335,40.596047381951,40.5960615873134,40.5960788139732,40.596274562182,40.5963763378487,40.5965352326581,40.5967634375403,40.5968784200921,40.5969776298814,40.5969759347949,40.5970203712617,40.596980082263,40.5969763468467,40.5969217422505,40.5969163774852,40.5968851950549,40.5968790538443,40.596844270047,40.5968211749773,40.5968081819379,40.5968042042413,40.5967709741896,40.5966512479565,40.5966467884113,40.5965681991978,40.5965734083625,40.5965851055696,40.5965671520608,40.59655529542,40.5965426048351,40.5965520258863,40.5965833167987,40.5965887195767,40.5966252422724,40.5966328296178,40.5966646368355,40.5966707576201,40.5967081095628,40.5967138212567,40.5967363351114,40.5967539026021,40.5967727445203,40.596882675628,40.5969467653058,40.5969502599823,40.5969541782144,40.5969822481007,40.5970053313409,40.5970103573716,40.5970227937427,40.5970361259649,40.5970400440916,40.5970425781621,40.597045568738,40.5970466525981,40.5970465802413,40.5970463914213,40.5970463256563,40.5970411385431,40.5970025035919,40.5969947493067,40.5969921832292,40.5969671715136,40.5969648895262,40.5969425107846,40.5969390958061,40.5969140276249,40.5968754894665,40.5968631903196,40.5968737655416,40.5969060805704,40.5969097422793,40.5969325181805,40.5969362019485,40.5969567213117,40.5969599630692,40.5969799315816,40.5969840850615,40.5970017376255,40.5970044319472,40.5970201301232,40.597029543018,40.5970286320473,40.5969775690849,40.5969782825868,40.5968974023075,40.5969131843773,40.5968042043652,40.5967845197931,40.596763166427,40.5967951924628,40.5967831154392,40.5971174085638,40.5968382191848,40.5959235049483,40.5947334535043,40.5946779767966,40.5945560432435,40.5945461162055,40.5945396277767,40.5945276924653,40.5945188772128,40.5944954456226,40.594483896629,40.5944699060534,40.5944525008541,40.5944279374009,40.5943761168406,40.5943590658423,40.5943522629883,40.5943786161244,40.5944009265887,40.5944248822644,40.5944382763397,40.5944454564172,40.5944754753593,40.59448469556,40.5945170742613,40.5945252075305,40.5944489123519,40.5944133375066,40.594412157453,40.5943550082153,40.5943597644535,40.5944164355568,40.5944144574086,40.5944490768166,40.5945295655602,40.5945430493005,40.594557204839,40.5945862322445,40.5945964765347,40.5945965563853,40.5945930022111,40.5945859325305,40.5945577844615,40.5945455304477,40.5945330096761,40.5945074209202,40.5944828020272,40.5944653393076,40.5944530055607,40.5944539455886,40.5944619414342,40.5944739800936,40.5944860182775,40.5945120680229,40.5945231717144,40.5945307092916,40.5945372006263,40.5945424583371,40.5945453397255,40.594550187793,40.5945615785775,40.5945194553518,40.594519437999,40.594426474457,40.5944265251086,40.594518270377,40.5945182525876,40.5945647430572,40.5945689665816,40.5945800418789,40.5945824498767,40.5945863437267,40.5945893942863,40.5945035588826,40.5945007687871,40.594636709614,40.5946328598997,40.5946248612315,40.5946146359736,40.5946012121379,40.594579590822,40.5945306571454,40.5945112661757,40.5945115727389,40.5945175465931,40.5945660319092,40.5945815319684,40.5946119293187,40.5946251644138,40.5946470717361,40.5946612182571,40.5946696985913,40.5946745072992,40.5946788009862,40.5946994751196,40.5947216522721,40.5947200299895,40.5947071932945,40.5946958377691,40.5946720142795,40.5946705458527,40.5946625147099,40.5946502427498,40.5946111660211,40.5945976474688,40.5945743387975,40.5945474201197,40.5945033682814,40.5944910517333,40.5944882492532,40.5945056823109,40.59451789892,40.5945547344952,40.5945971840363,40.5946115791919,40.5946366078412,40.5946517338775,40.5946772977564,40.5946973346561,40.5947062229599,40.5947147377804,40.5947306333429,40.5947687530906,40.5947827158066,40.5947925928812,40.5948081417613,40.5948080269764,40.5948055750604,40.594801181374,40.5947956850931,40.5947864931352,40.594771445416,40.5947473250019,40.5946752261497,40.5946543701324,40.5946424340221,40.5946417440528,40.5946498837433,40.5946641632835,40.5946809492374,40.5947277712909,40.5947425666082,40.594759042058,40.5947719952709,40.5947944977661,40.5948181498347,40.594837865704,40.5948588154524,40.5948792716287,40.5948948367904,40.5949058833243,40.5949045550175,40.5948954741344,40.5948685178065,40.5947292560602,40.5947368068089,40.5947443114451,40.5947908105678,40.5948052206806,40.5948083773633,40.5948193134479,40.5948260110791,40.5948321590436,40.5948319699041,40.5948278167278,40.5948191067595,40.5948041263581,40.5947920318185,40.5947857927963,40.5947890838636,40.5947925426857,40.5947945808627,40.594796871785,40.5947959824007,40.5947951482763,40.5947918815827,40.594784288443,40.5947737475313,40.5947567828012,40.594734584394,40.5947107414391,40.5946362038159,40.5946120024512,40.5945975633334,40.594590516488,40.5946033760723,40.594626721237,40.5946513989531,40.5946645797708,40.5946789219917,40.594679617,40.5946676761655,40.5946617747979,40.5946483789546,40.5945848167201,40.5945628236953,40.5945341897321,40.5944966290322,40.5944141217312,40.5943904091371,40.594374444289,40.5943685133326,40.5943427300678,40.5943252089468,40.5943117469999,40.5943014940618,40.5942956949022,40.5942581903019,40.5942232958372,40.5941773316723,40.5941244280361,40.59410460072,40.5940957208189,40.5940950493671,40.5940940259396,40.5940899581881,40.594085068754,40.5940802547806,40.5940669269377,40.5940546604572,40.594025919778,40.5939074038402,40.5938734437314,40.5938365274044,40.593786667418,40.5937284890523,40.5936910437116,40.5935158617683,40.5934951872593,40.5934639889924,40.5934016267206,40.5932163672704,40.5930579838589,40.5929986329154,40.5929240683522,40.5928890549636,40.59280435609,40.5927269249096,40.5926789289635,40.5926083116121,40.5924771425759,40.5923469034994,40.592229252646,40.5919866139372,40.5918939888227,40.5917830834924,40.591703680492,40.5916119449973,40.5915131497428,40.5913972842885,40.5913742743585,40.5913122513258,40.5912843482146,40.5912637784743,40.5912478734711,40.5912368349263,40.5912314579915,40.5912320342496,40.5912311515381,40.5912273451071,40.5912113413627,40.5912007185304,40.5911943944183,40.5911875766014,40.5911831598854,40.5911778285204,40.591170992524,40.5911667327848,40.59116121623,40.5911516770413,40.591139058316,40.5911206972259,40.5911133825481,40.5911046159127,40.5910548942286,40.5910414205315,40.591013495942,40.590991276518,40.590983540775,40.5909712567873,40.5909641299131,40.590961013804,40.5909591869429,40.5909509579399,40.5909459184662,40.5909458404276,40.5909462246297,40.5909449742893,40.5909372393037,40.5909239809945,40.5909164746394,40.5909160520412,40.5909189380456,40.5909359520136,40.5909428065312,40.5909468239727,40.5909484334733,40.5909501795292,40.590949307561,40.5909418523617,40.5909369773347,40.5909300197453,40.5909248227303,40.5909203677735,40.5909141545464,40.5909096514933,40.5909051041499,40.5909007369043,40.5908948487344,40.5908799780714,40.5908762489851,40.5908749645213,40.5908746047785,40.5908731068929,40.5908655917605,40.5908629268303,40.5908611718561,40.5908615944832,40.5908639380433,40.5908718880508,40.5908691848294,40.5908671308656,40.5908657938743,40.5908676463845,40.5908721466574,40.5908742216392,40.5908739541574,40.5908710002974,40.5908741980498,40.5908863049638,40.5908978137133,40.5909118113389,40.5909269180551,40.590937187656,40.5909441961829,40.5909531517203,40.5909641534941,40.5909714635439,40.5909809500304,40.5909907915187,40.5910012616659,40.5910118091496,40.5910214347812,40.5910293520104,40.5910360240392,40.5910430312698,40.591050187487,40.5910554190286,40.5910587501181,40.5910603221167,40.5910590454662,40.5910608605566,40.5910710214475,40.5910870625041,40.5911119073821,40.5911212451042,40.5911368144508,40.5911493721027,40.5911581317752,40.5911748798808,40.5911843046172,40.5911918354412,40.5911996045426,40.5912032399873,40.5912050110249,40.59121411947,40.5912205309003,40.5912372904786,40.5912511855547,40.5912614641329,40.5912691483119,40.5912784687471,40.5912926925147,40.5913050139519,40.5913217681694,40.5913345657436,40.5913504584558,40.5913569882777,40.5913599523496,40.591362737995,40.5913670139699,40.5913738545737,40.5913783981896,40.5913794975516,40.5913789539283,40.5913899554484,40.5914285676106,40.5914509794128,40.5914664708013,40.5914750472486,40.5914791705213,40.5914919346869,40.5914936205807,40.5915016346677,40.591509806355,40.5914932070093,40.5915045769618,40.5915256319818,40.591552496046,40.5915676025827,40.5915726778985,40.5915866055272,40.5915916452348,40.5916120450005,40.5916180511717,40.5916231691615,40.5916192255655,40.5916200575872,40.5916232813044,40.5916301326885,40.5916319911678,40.5916380015593,40.5916472762025,40.5916607813385,40.5916649365467,40.5916827109522,40.5916920352781,40.5917080477897,40.5917183233068,40.5917266338504,40.5917232932163,40.591699964295,40.5916812218376,40.5916408701559,40.591637683713,40.5916339461123,40.591624209178,40.5916111774311,40.591597477046,40.5915876929952,40.5914843195107,40.5914722578506,40.5914397090337,40.5913938710503,40.5913649791845,40.5912987703787,40.5912337011348,40.5912054711496,40.5911736048457,40.5911556064807,40.5911268162828,40.5910468293308,40.5909939026278,40.5909736506488,40.5909609333352,40.5909387857498,40.5909270826497,40.5908829765193,40.5908729902564,40.5908633710332,40.5908434182369,40.5908387545541,40.5907849357218,40.5907585836891,40.5907294829644,40.5907228263471,40.5907368999683,40.5907988150592,40.5908343477634,40.5908576746301,40.590868597202,40.5908700689556,40.5908637796635,40.5908623563883,40.5908371366746,40.5908037325102,40.5907687127439,40.5907457971533,40.5907398708429,40.5907309900209,40.5906819071668,40.5906720708104,40.5906651591467,40.5906144510288,40.5905930249549,40.5905875358652,40.5905813651227,40.5905621517192,40.5905564586374,40.5905530269117,40.5905530949315,40.5905624063808,40.5905679153964,40.5905712302391,40.5905737069617,40.5905786420582,40.5905862777899,40.5905857911126,40.5905806349362,40.5905716727632,40.5905655505941,40.590550661163,40.5905029716914,40.5904821784513,40.5904766928042,40.590459952836,40.5904561315863,40.5904543475789,40.5904570540962,40.5904563311934,40.5904541850597,40.5904515397261,40.5904473050154,40.5904209289984,40.590415826894,40.590412601364,40.5904090218445,40.5904032493107,40.5904009893001,40.5903953691643,40.5903869097332,40.5903756024249,40.5903681767895,40.590359250506,40.5903563548549,40.5903548866369,40.5903572530707,40.5903629479699,40.5903781302337,40.5903836407002,40.5903873361109,40.5903879630178,40.5903867663833,40.5903841563117,40.5903746258691,40.5903584880023,40.5903172759561,40.5902976951208,40.5902888463495,40.5902844426048,40.5902835447586,40.5902740319491,40.5902713664026,40.5902682183731,40.5902629222973,40.5902454226257,40.5902273997978,40.5901937181982,40.5901846844655,40.5901782942247,40.590178589948,40.590181408328,40.5901904300247,40.590205937252,40.5902204658164,40.5902842782289,40.5903162269039,40.5903196467115,40.590322763593,40.5903246324399,40.5903252151983,40.5903245987577,40.5903083066968,40.5902743141927,40.5902122501826,40.5901812325074,40.5901749552385,40.5901658297416,40.5901261306828,40.5901044469655,40.5900874382948,40.5900731046842,40.5900663321666,40.5900632419455,40.5900671376931,40.5900915935002,40.5900976850164,40.5901012158691,40.5901024195698,40.5901012910393,40.590097841116,40.590093815392,40.5900833781134,40.5900762968667,40.5900534712087,40.5900195960134,40.59000049901,40.5899789701202,40.58992581088,40.5899067311578,40.5898537936301,40.5898439607656,40.5898164522955,40.5897872633822,40.5897636042033,40.5897505578231,40.589705679222,40.5896595873448,40.5896059407627,40.5895931088954,40.5895855867523,40.5895845141701,40.589593284963,40.5895910158862,40.5895802032484,40.58958863903,40.5896437622558,40.5896471020728,40.589644354374,40.5896237210381,40.5896142562999,40.5896110202994,40.5896087735683,40.5896053538265,40.5895966214291,40.5895831363488,40.5895687233012,40.5895625592396,40.5895374681471,40.5895284709128,40.5895049355329,40.5894693695699,40.5894580220399,40.5894207870693,40.5894025314912,40.5893795790191,40.5893571907479,40.5893425702415,40.5892911657003,40.5892713063464,40.5892605844686,40.5892495391987,40.5892539914424,40.5892509984242,40.5892242777952,40.5891855128788,40.589170626216,40.5891602745786,40.5891467143731,40.5891343279088,40.5891122011692,40.5890959248302,40.5890913570539,40.5890916284914,40.5890895749675,40.5890738559549,40.5890658427184,40.5890392051369,40.5890246934882,40.5889986710705,40.5889670548951,40.588924372001,40.5888474513452,40.5887578713443,40.5887024419664,40.5886789104637,40.5886476381658,40.5886093317205,40.5885183195756,40.5884780552179,40.5884525065651,40.5884360215682,40.5884177693449,40.5884071311552,40.5884009647813,40.5883915360154,40.5883818245007,40.5883748438623,40.5883635038188,40.5883394830634,40.5883348815334,40.5883101797984,40.5882801997791,40.588218925898,40.5881947730615,40.5881471078831,40.5881330222365,40.588128149448,40.5881162942688,40.588105726485,40.5880918028819,40.5880755311747,40.5880645905894,40.5880382750151,40.588023040441,40.5879936613259,40.5879665201617,40.5879229377121,40.5877483551036,40.5876459035973,40.5876336196291,40.5876156331357,40.5875977008169,40.5875648047435,40.5875262240014,40.5875081677475,40.5874844460529,40.5874502888673,40.5874731502872,40.5874932398293,40.5875037606075,40.5875166391454,40.5875494053771,40.5875674959873,40.5875767587703,40.5876003189207,40.58762075826,40.5876235552981,40.5876290828052,40.5876308931389,40.5876313234322,40.587631762185,40.5876281473041,40.5876232429071,40.5876173441098,40.5876033124309,40.5875983534745,40.5875937588398,40.5875876505904,40.5875748166765,40.5875689160682,40.5875632276877,40.5875556907709,40.5875462744698,40.587545841227,40.5875347854877,40.5875073932314,40.587498354235,40.5874771897255,40.5874586695941,40.5874352284223,40.5874149906885,40.5874042962278,40.5873563223137,40.587349855257,40.5873423067021,40.5873115722836,40.5873030977906,40.5872956588494,40.5872845505073,40.587272521226,40.5872685690111,40.5872741044988,40.5872850972417,40.5872968811235,40.5873027155919,40.5873058635385,40.5873041273398,40.5873029294692,40.5872940242708,40.587271379782,40.5872612003192,40.58723236675,40.5872174649418,40.5872122724865,40.5871893269836,40.5871611904129,40.5871271924758,40.5871161053491,40.5870994883029,40.5870791388735,40.5870430473107,40.5870247142331,40.5870033576465,40.5869961508922,40.5869818973483,40.5869720195629,40.5869629476535,40.5869543334714,40.5869488792799,40.5869490020798,40.5869471928606,40.5869387110041,40.586910591072,40.5869018805096,40.5868893179435,40.5868380986986,40.5867859451211,40.5867852296607,40.5868004856933,40.5868058037389,40.5868092846952,40.5868118116665,40.5868127491903,40.586809161172,40.5868037790964,40.5867958045459,40.5867774708375,40.586774475702,40.5867742201602,40.5867579669635,40.5867436004759,40.5867340188857,40.5867212009855,40.5867125112498,40.5866612645754,40.5866496055827,40.586637804987,40.5865971432734,40.5865802643362,40.5865656881921,40.5865504787046,40.586532669541,40.5865263321174,40.5865225232095,40.5865213867996,40.5865186133866,40.5864819072934,40.5864786431803,40.5864776764645,40.5864782650793,40.5864758950304,40.5864711989017,40.5864696819279,40.5864696927376,40.5864667991136,40.5864472813612,40.5864406807341,40.5864210977128,40.5864054749519,40.5863942167087,40.5863613339222,40.5863417065496,40.5863263968241,40.5863409368372,40.5863510214721,40.5863558112151,40.586376459164,40.5863788747726,40.5863781965321,40.586375841755,40.5863753492555,40.5863738266453,40.5863651990036,40.5863570583385,40.5863517154447,40.5863376502681,40.5863272230206,40.585894019513,40.5858856438084,40.585869892424,40.5858441475228,40.5858141809784,40.5857907051023,40.5857799126032,40.5857690483018,40.5856848742621,40.5856673527615,40.5856618917998,40.5856530298513,40.585644400265,40.5856388706261,40.5856328584377,40.58559175259,40.5855553333498,40.5855340874962,40.5854815144088,40.5854206059953,40.5854322833543,40.5854330639157,40.5854248792357,40.5854071712861,40.5854006866781,40.5853886522309,40.5853745923526,40.5853637350217,40.5853518267125,40.5853379746793,40.5853218610638,40.5852960128291,40.585224665141,40.5851582530922,40.5851191409271,40.5850880216255,40.5850351580243,40.5849823277174,40.5849074545417,40.5848932129069,40.5848925096165,40.584930090245,40.5849501160573,40.5849789009825,40.5849946390951,40.5850080811859,40.5850180281919,40.5850213745009,40.5850179374502,40.5849541004362,40.5849280532658,40.5849026577445,40.5848684522782,40.5848094533935,40.5847508214042,40.5847207819476,40.5846963491146,40.5846633826636,40.5845901001371,40.5845720051606,40.5845133305741,40.5844575172494,40.5844525084637,40.5844774474057,40.5844877527142,40.5844988770228,40.5844985174738,40.5844887205009,40.5844679620138,40.5844492774077,40.5844349274889,40.5844198992057,40.5844038712516,40.5843922520607,40.5843759663911,40.5843566403015,40.5842846550672,40.5842726323009,40.5841929751112,40.5841143690789,40.5841048929351,40.5840770574484,40.584004409504,40.5839950773973,40.5840116297864,40.5840147180562,40.5840291466957,40.5840287410076,40.58402056555,40.584018788899,40.5840163950889,40.5840134226224,40.5840087876766,40.5840022904208,40.5839921509836,40.5839797780515,40.5839652454693,40.5839486528888,40.5839299980549,40.5838857250989,40.5838672996222,40.5838534949442,40.5838233066352,40.5838174401778,40.5837215247149,40.5836261410754,40.5835663221546,40.5835088381157,40.583489123005,40.5834731490467,40.5834280582561,40.5833310946861,40.5832734543754,40.5832454334571,40.5830588927394,40.5829552722322,40.5828981645049,40.5828045165836,40.5827549385115,40.5827258202438,40.5827164921386,40.5826592355834,40.5825756965884,40.5825686850913,40.582463428205,40.582410179392,40.58233475894,40.5822605438318,40.5821173906327,40.5820765600863,40.581932715121,40.5819006758529,40.5818041484645,40.5817669743542,40.5817379879475,40.5816860824015,40.5814980837822,40.5814645421461,40.5814586760572,40.5812621274562,40.5811711184754,40.5811355755287,40.581115032162,40.5810960731939,40.5810418054005,40.5809375142691,40.5807479877891,40.5807449614234,40.5805713141759,40.5804807635388,40.5804252536169,40.5803783696227,40.5803015005832,40.5802572377077,40.5801381392026,40.5800697327872,40.5799687097926,40.5797870279171,40.5796597949051,40.5795973090506,40.5794445129552,40.5793398789875,40.5792439182393,40.579139550197,40.5790558594243,40.5790384799665,40.5789260059823,40.5788652429208,40.5787803560459,40.5787735825628,40.578769546133,40.5787682493882,40.5787758564582,40.5787683591308,40.5787486724569,40.5787037159496,40.5786501529496,40.5785679107544,40.5784959072129,40.5784731215472,40.5784616656676,40.5784194376228,40.5783665665372,40.5782789351169,40.5782088710694,40.578153612509,40.5781291740905,40.5780257143779,40.5779428336021,40.5779037196932,40.5777859473781,40.5777155148127,40.577649897609,40.5775524977874,40.5773490373614,40.5773229295525,40.5772784591672,40.5770928598457,40.5769228981812,40.5767923895186,40.5767495873209,40.576728784869,40.5766503756697,40.5766110880026,40.5765684107656,40.5762842934972,40.5762527333306,40.5760123758161,40.5759236834755,40.5758487079283,40.5757945764864,40.5757005340107,40.5756362609003,40.5755519602698,40.5753070268271,40.5750335179511,40.5747186084141,40.5744809616699,40.5741971689912,40.5738874520418,40.5736105357737,40.5733247520325,40.5730342656066,40.5730088212309,40.5727191281362,40.572405332878,40.5720531905229,40.5720140485174,40.5719835046154,40.5719556279641,40.571944273558,40.5719099901253,40.5718498218341,40.5718186058427,40.5717954978831,40.5717627255128,40.5717323762623,40.571682657781,40.5716519523275,40.5715883852906,40.5714922072629,40.5714510350657,40.5714076426579,40.5713425859454,40.5713012924077,40.5712131809827,40.5711870615066,40.5711721872626,40.5710662670458,40.5709721381476,40.5709275554248,40.5708915051954,40.5707451035041,40.5706053056492,40.5705063552281,40.5704324357731,40.5703413643759,40.570335991837,40.5703307464202,40.5703125488727,40.5702551255456,40.5701371692595,40.5700635464707,40.5699360647024,40.5699138445135,40.5698968769154,40.5698653771078,40.5698149836704,40.5697514243856,40.5696588470664,40.5695973586782,40.5695551652461,40.5695232530462,40.5695054900142,40.5694276490651,40.5693242070255,40.5692726371382,40.5692134772201,40.5691836141402,40.5691005004877,40.5690075841319,40.5689792446938,40.5688981603699,40.5688702651152,40.5688592381376,40.5687921032458,40.5686181454211,40.5685201497186,40.5683107982568,40.5682620461742,40.5682050078845,40.5681860558162,40.5681677128154,40.5681342947062,40.5681042735841,40.5680718433955,40.5679984389428,40.5679210973245,40.5675042315488,40.5671084414283,40.5670459488113,40.5669740489646,40.5668898928101,40.5668100123009,40.5668002967062,40.5668186682684,40.5668305715456,40.5675977288694,40.5677392722517,40.5673916164731,40.5687875343785,40.5691417855225,40.569242922454,40.5704584729965,40.572381674513,40.572988329032,40.5736900119722,40.5735427757593,40.5738230570186,40.574021231946,40.5749881084912,40.5750267867217,40.5750607221259,40.5759330347646,40.5760597612556,40.5772715872538,40.5776726943298,40.578074048806,40.578468346055,40.5788645343772,40.5792565927193,40.5796615165746,40.5800584215184,40.5804614973145,40.5808536550377,40.581255267855,40.5815455323126,40.5818277256432,40.5821302435814,40.5821661606911,40.5821881421437,40.5821149493557,40.5819492204964,40.5817627447372,40.5815798570505,40.5815865566433,40.5816260064314,40.5816676086032,40.5817056806939,40.5817102353441,40.5817584904656,40.5818075527706,40.5818572628055,40.5818640129915,40.581966993962,40.582068535757,40.5821683779671,40.5822662645401,40.5823619444384,40.5823973400485,40.5824315034934,40.5824751251249,40.582515392867,40.5825517286752,40.5825836109469,40.5826020719111,40.5826182547317,40.5826618343859,40.5826987865088,40.582710041639,40.5827186491214,40.5827273424076,40.5827917137967,40.5828007817042,40.5827402026538,40.5827632821797,40.5827136472618,40.5827182536142,40.5827318837027,40.5827724751199,40.5828225015279,40.5828303382705,40.5828789393622,40.5841243723825,40.5841620727924,40.5841808209705,40.5843888648095,40.5844980772365,40.584583729021,40.5846950522022,40.5846789545374,40.5846684602127,40.5848542198798,40.5849293521006,40.5850632357345,40.5851253466317,40.585427098031,40.5857113637902,40.5857523382925,40.5857947384577,40.5858389515247,40.5858858315778,40.5859106828248,40.5859210173012,40.5859691994377,40.5860133877647,40.5860528867268,40.5860870745815,40.5861154131862,40.586137456469,40.586489799,40.5869008694234,40.5869843267138,40.5870392157723,40.5870638335233,40.5870651502248,40.587151322036,40.58715461537,40.5870691034816,40.587069099506,40.5870451419737,40.5874682407781,40.5874783148159,40.5874879703482,40.5874901200866,40.5874917899847,40.5874939665917,40.5874911129044,40.5874916497275,40.5874820198688,40.587475623883,40.5874528662459,40.5874258061371,40.5874016845819,40.5873600980814,40.5873022842441,40.5870533304064,40.5867699249213,40.5869246902342,40.5873216062137,40.5875110201712,40.5876936868871,40.5878728283577,40.5878949658979,40.5879332928949,40.5879737167787,40.5880388929453,40.5882514349589,40.5882833500887,40.5883124533213,40.5883385932937,40.5883617845536,40.5883819629051,40.5884188361383,40.5884603946014,40.5885064750038,40.5885568962869,40.5886114603353,40.588616141887,40.5886617992653,40.5889170141097,40.5890419428144,40.589217246455,40.5892857989826,40.5892918268233,40.5892695859851,40.5893003279442,40.5893128605387,40.5893301304977,40.5893330450299,40.5893593332524,40.5892552030516,40.5893188940923,40.5893390112214,40.5893657987367,40.5893679742814,40.5893574617675,40.5893401537818,40.5893116936562,40.5893048470851,40.5893114917065,40.589319169846,40.5893545979043,40.5894008878561,40.5894247885108,40.5894344744943,40.5894237205525,40.5894281409049,40.5894321888713,40.5894414716346,40.5894526164685,40.5894734640014,40.5895181616672,40.5895546375004,40.5895650491934,40.5895590464561,40.5895508163037,40.5895515385582,40.5895901854158,40.5896265672249,40.589666013197,40.5896923501892,40.5896979920401,40.5897023909294,40.5897067723983,40.5897119713798,40.5899788516837,40.5899890562929,40.5900153043223,40.5900368960461,40.5900696827189,40.5901188522173,40.5902187224372,40.5902783273879,40.5903342026178,40.5903721859248,40.5904258114873,40.5904712469067,40.5905128528169,40.5905129515067,40.5905881261723,40.5906105898882,40.5906537158137,40.5906664136961,40.5906735499503,40.5906790813608,40.5906798188051,40.5906773752484,40.5906717353468,40.5906620948748,40.5906508779038,40.5906378544645,40.5906268100857,40.5906195570589,40.5906163088337,40.5906162461518,40.5906209556268,40.5906242392584,40.5906360141259,40.5906739893184,40.5907131437941,40.590735474724,40.5907632701736,40.5907936318978,40.591046302491,40.5916976858236,40.5917088961941,40.5910707395151,40.5912466263417,40.5912560811728,40.5912618897441,40.591268606851,40.5912838178996,40.5912961840057,40.5913323704938,40.5913634055171,40.5913811061088,40.5913869371545,40.591383891988,40.5913689983617,40.5913481862076,40.5913261255072,40.5913258231023,40.5913405549768,40.5913587008894,40.5914291346301,40.5914505163004,40.5914733969509,40.5915235572917,40.591593746638,40.5916861165155,40.5917834903168,40.591957641949,40.5920893171174,40.5921486158157,40.5921905582578,40.5922594127843,40.5923148153815,40.5924925711731,40.5927277056568,40.5928285327022,40.5928499545051,40.5928824422123,40.5929013266969,40.5929024835083,40.5928535733302,40.5927421153035,40.5926278806814,40.5925077004684,40.5922550034887,40.5921010886896,40.5919814834781,40.5917446231799,40.591758172594,40.5917682972598,40.5918242612277,40.5918510782374,40.591956619424,40.5919969551095,40.5920584457527,40.592079948515,40.5920878100782,40.5920902691986,40.5921293501883,40.5921290947026,40.592206091903,40.5922858704508,40.5923133522551,40.5925030591446,40.5925018096358,40.5924885171767,40.5924686068404,40.5924780809387,40.5924761254751,40.5924745932105,40.5924544896292,40.5924423184546,40.5924598601752,40.5924610820745,40.5926408890566,40.5927660394114,40.5928712572387,40.5928721665815,40.5928772219482,40.5930223305721,40.5930066649739,40.5930127368297,40.5929874255512,40.5929577293583,40.5929601229667,40.5929364873522,40.5929433353392,40.5929266122475,40.592931427877,40.5928611016076,40.5927030542842,40.5927169968621,40.5927190564346,40.5927304857679,40.5927324583671,40.5927489139861,40.5927527912923,40.5927654375854,40.5927677245202,40.5927820905651,40.5927842408913,40.5928110382307,40.5927921135526,40.592785307122,40.5927790891237,40.5927772288686,40.5927731206964,40.5926844996331,40.592462584045,40.5924716940463,40.5924910503051,40.592498350596,40.5925021699534,40.5925289619312,40.5925136399876,40.592516760166,40.5925413164791,40.5925468478067,40.5924606484459,40.5924414134883,40.5924015211544,40.5923928220601,40.5923412937746,40.5923343885384,40.5922851995409,40.5922759171319,40.5922241823336,40.5922158484789,40.5921332256196,40.592132675124,40.5920920957351,40.5920935794666,40.592087032494,40.5922382546131,40.5922361655423,40.5922320022148,40.5922251695133,40.5922161327678,40.5922190430667,40.5922277984819,40.5922422203327,40.5922508107874,40.5922709538865,40.5930779100416,40.5930816021608,40.5930815938487,40.5930807760518,40.5923990277862,40.5924041860533,40.5926463184047,40.5926492461447,40.5927104095048,40.5927113397621,40.5926929849948,40.5926949580115,40.5924396083395,40.5924921780128,40.5927660351366,40.5928685697512,40.593002894394,40.5935340425957,40.5935757269146,40.5935769842637,40.5935806886181,40.5935808743314,40.59358266364,40.5935827936602,40.5935828315025,40.5935812283512,40.5935778919917,40.5935755936407,40.5935728830344,40.5935697771121,40.5935662677034,40.5935506023791,40.5935315263147,40.5935123827953,40.5934668460608,40.5934563366691,40.5934458184195,40.5934282183021,40.5934137222841,40.593383575899,40.5933723584707,40.5933677785734,40.5933646948083,40.5933637064951,40.5933630689267,40.5933627837833,40.5933628667873,40.5933642700806,40.5933671681792,40.5933874071935,40.5933910324498,40.5933929211005,40.5933953369568,40.5933956941516,40.5933940749056,40.593392492833,40.5933903802623,40.5933801029791,40.5933693365973,40.5933578627439,40.593345609721,40.5933132076906,40.5933015807135,40.5931343592729,40.5930743038279,40.5930338762454,40.592966840222,40.5929591581237,40.5929487357819,40.5929451057643,40.5929267590586,40.5928784329338,40.5928638532347,40.5928492644757,40.5928381731162,40.5928251354581,40.5928099068987,40.5927916032871,40.5927616086479,40.5926966567158,40.592680182833,40.5926633138448,40.5926065752829,40.592581681951,40.5925731658732,40.5925626494723,40.5925136750586,40.5925031928363,40.5924949080991,40.5924839099265,40.592462558512,40.5924559652603,40.5924489620245,40.5924378350739,40.5924084193103,40.5923944084909,40.5923626300721,40.5923094788732,40.5923051429695,40.5922996100279,40.5922786400778,40.5922712302175,40.5922649538723,40.5922626389816,40.5922608285265,40.5922593040178,40.5922584090965,40.5922584907184,40.5922604273482,40.5922638795915,40.5922670441264,40.5922664383691,40.5922673226162,40.5922684747775,40.5922687998698,40.592269365338,40.5922699058503,40.5922692090013,40.592266008431,40.5922633524234,40.592259950774,40.5922486170099,40.5922104593676,40.5921867829515,40.5921787578963,40.5921626589635,40.5921543735502,40.5921151187148,40.5920823432624,40.5920722335618,40.59205854235,40.5920526560412,40.5920418572822,40.5920359144701,40.5920294571516,40.5920206041929,40.5920093090046,40.5919924230729,40.5919796102861,40.591965683448,40.5919515093558,40.5919509509323,40.591935716706,40.5919102220003,40.5918834180499,40.5918555458803,40.5918268949325,40.5918067324158,40.5917609436042,40.5917400506604,40.5916551856644,40.5916040659966,40.5915881356298,40.591550756522,40.5914913912808,40.5914089030037,40.5913558044245,40.5912925923132,40.5912766625867,40.5912612122752,40.5912469817564,40.5912350792987,40.5911878021595,40.5911273487761,40.5911146710369,40.5911008249655,40.5910856749727,40.5910688889745,40.5910079682934,40.5909419005239,40.5909313303671,40.5909233009631,40.5909072503828,40.5908959142759,40.5908697704474,40.5908246185317,40.5907886909808,40.5907673754903,40.5907658350375,40.5907643742033,40.5907630129054,40.5907617406103,40.5907605753866,40.5907594996686,40.5907576726071,40.5907562581385,40.5907559662749,40.5907553456551,40.5907552057723,40.5907580097972,40.5907557169262,40.590755833966,40.5907577457492,40.5907587382645,40.5907602355648,40.5907619592643,40.5907638819514,40.5907659942408,40.5907704898938,40.5907754464982,40.5907867309886,40.5907998103707,40.5908146595183,40.5908753846575,40.5909261922974,40.5909423506054,40.5909933708421,40.5910073819162,40.5910384787294,40.5910518065804,40.5911302714685,40.5911730145299,40.5911901569464,40.5912889641401,40.5915197173371,40.5915992548823,40.5916927559912,40.5917350315424,40.5917500643438,40.5917609070034,40.591788888297,40.5918041891502,40.5918387659811,40.591854417748,40.5918557584366,40.5918570818461,40.5918583955152,40.5918596813687,40.5918621905178,40.5918645710066,40.5918668343343,40.5918688615021,40.591870582091,40.5918718879321,40.5918738547828,40.5918744779407,40.5918737566617,40.5918717010945,40.5918667560115,40.5918598575085,40.5918510496552,40.5918404141192,40.591793032493,40.5917359257222,40.5917119956867,40.5917046700664,40.5916821880893,40.5916734295888,40.5916679640331,40.5916632507468,40.5916432718291,40.5916138758723,40.5915839951553,40.5915085087569,40.5914689595879,40.5914497167305,40.5914325854837,40.5914295065673,40.5914267956733,40.5914180508041,40.5914129139916,40.5913838066936,40.59136051665,40.5913136742832,40.5913130775379,40.5913125877766,40.5913117260851,40.5913110329746,40.5913105840813,40.5913133408587,40.5913113671548,40.5913130536841,40.5913155967441,40.5913188793073,40.5913227849665,40.5913333244758,40.5913404618921,40.5913454428728,40.5913587800705,40.5913728863765,40.5914257455897,40.5914479951595,40.5914688705258,40.591552999493,40.5916220011477,40.5916861595642,40.5917090338161,40.5917402779136,40.5917829878288,40.5917895877015,40.591820241749,40.5918433328432,40.5918448280649,40.5918459989454,40.5918547098328,40.5918594632402,40.5918609442124,40.5918635007875,40.5918657422807,40.5918760725963,40.5918983360937,40.5919091465201,40.5919416126329,40.5919488523444,40.5919583879862,40.5919984891167,40.5920156008239,40.592049563495,40.5920559696691,40.5921177685976,40.5921561148037,40.5921729053209,40.5922204090793,40.5922324898964,40.592246905642,40.5923117590998,40.5923381968632,40.5923463559469,40.5923591566731,40.5924007399817,40.5924210190066,40.592447925894,40.5925095090421,40.59253299124,40.5926159282937,40.5926455191118,40.5927126747464,40.5927341876703,40.5927549741945,40.5927712924528,40.5928377289634,40.5929151777511,40.5929925147249,40.5930486956729,40.5930584219944,40.5930650823182,40.5930688580414,40.5930697774566,40.5930696806312,40.5930694767342,40.5930691635892,40.5930687339703,40.5930675229441,40.5930658261431,40.5930630048286,40.5930522360652,40.5930498286964,40.5930479961168,40.5930467133261,40.5930458531899,40.5930455673016,40.5930453800851,40.5930453018048,40.5930453128344,40.5930487697551,40.5930548297855,40.5930606256181,40.5930639524359,40.593066059107,40.5930685082149,40.5930825236952,40.5931035419522,40.5931382718573,40.5931691179978,40.5932259687283,40.5932698641469,40.593295583288,40.5933331955858,40.5933373167186,40.5933413236941,40.5933547417437,40.5933612364159,40.5933654378374,40.593369935328,40.5933748090722,40.5933801213035,40.5934272498587,40.5934890883048,40.5935057486273,40.5935469416152,40.5935665169876,40.5936244644262,40.5936249966362,40.5936503128762,40.5936690874521,40.5936727891192,40.5937001176808,40.5937233342659,40.5937322256192,40.5937441070482,40.5937472494384,40.5937569726593,40.5937675943665,40.5937732134307,40.5937790228042,40.5938239430074,40.593831939878,40.5938653194468,40.5938843907652,40.593889537578,40.5938950373156,40.5939073798755,40.5939465454794,40.5939585398214,40.5939689914146,40.5939958582376,40.5940037548631,40.5940042050131,40.594010895248,40.5940135172825,40.5940160668269,40.5940185542915,40.5940209781233,40.5940256946958,40.594030304935,40.5940379888202,40.5940561121247,40.5940618993208,40.5940647771819,40.5940676997646,40.5940731467725,40.5940796105203,40.5941111381321,40.5941189739197,40.594122248636,40.5941251539221,40.5941267612231,40.5941281623555,40.594129383661,40.5941304438546,40.5941345991969,40.594135606867,40.5941367760441,40.5941384665777,40.5941394415709,40.5941405162237,40.5941416886918,40.5941429695314,40.5941443481869,40.5941458440937,40.5941498356966,40.5941539508458,40.5941578686644,40.5941614159482,40.5941644123454,40.5941657076781,40.5941668764737,40.5941679018551,40.5941687907998,40.5941695276188,40.5941701285603,40.5941756196538,40.5941777130908,40.5941800300547,40.594181045734,40.5941827688723,40.5941834901671,40.5941844456876,40.5941850285141,40.5941857821223,40.5941867155186,40.5941878297278,40.5941891160393,40.5941905726094,40.5941940179527,40.5941981409796,40.5942029659453,40.5942151131023,40.5942281018668,40.5942551129507,40.5942669227463,40.5942841716099,40.5942935006599,40.5942977949229,40.594301601823,40.5943049662396,40.5943064951727,40.5943079244841,40.5943414259316,40.5943854111076,40.5943962785414,40.5944092362953,40.594424508547,40.5944456037752,40.5944496973719,40.594454521318,40.5944715912024,40.594477793724,40.5944808631817,40.5944835801469,40.5944860165989,40.5944881840975,40.5944912199057,40.5944940306003,40.5945023862593,40.5945044329454,40.5945065329583,40.5945535795301,40.5945569900557,40.5945602019537,40.5945716188031,40.5945746783105,40.594577954814,40.5945861859077,40.594595651083,40.5946061636068,40.5946174527943,40.5946293037891,40.5946584567992,40.5946657813243,40.5946720875246,40.5947137798211,40.5947521585987,40.594755909721,40.5947599686056,40.5947690961813,40.5947796411152,40.5947925849379,40.5948157900996,40.5948311435379,40.5948382772388,40.594844913536,40.5948511348995,40.5948563909559,40.594856976299,40.5948658192131,40.5948745327575,40.5948830093312,40.594891085722,40.5948986179665,40.5949135535505,40.5949178177747,40.5949221916745,40.594935914014,40.5949495322629,40.5949631730187,40.594976863196,40.5950255636994,40.5950918113619,40.5951435360354,40.5951530976206,40.5951628712225,40.5951947559075,40.5952084658932,40.5952119918075,40.5952159323386,40.5952252643085,40.595259916991,40.5952664164727,40.5952718978179,40.5952775026324,40.5952799215627,40.5952821156063,40.5952840754243,40.5952858274245,40.5952873526981,40.595288672312,40.595293034058,40.5952941692661,40.5953006375503,40.5953052502125,40.5953248140966,40.5953349885506,40.5953523399947,40.5953544228887,40.5953568942645,40.5953631057351,40.5953859170628,40.5953930581753,40.5953985853849,40.5954007315562,40.5954025178326,40.5954087108574,40.5954134212514,40.5954222498193,40.5954261711617,40.5954321459327,40.5954331960226,40.5954389683637,40.5954505477337,40.5954647134159,40.5954817616929,40.5954841873146,40.5954903886281,40.5954934852494,40.5955028017772,40.5955261884543,40.5955340555298,40.5955460312998,40.5955527333131,40.5955576234552,40.5955586564511,40.5955581168504,40.5955567577378,40.5955545552136,40.5955514976548,40.59553549089,40.5955073630214,40.5954981738201,40.5954834685233,40.5954766549828,40.5954720455034,40.5954658589886,40.5954368682322,40.5954317384429,40.5954278055315,40.595405939953,40.5953854680749,40.5953533214686,40.5953273971499,40.5953235647102,40.5953183084975,40.5952934166575,40.5952891346912,40.5952858987071,40.5952854367343,40.5952851103619,40.5952849001328,40.5952848161207,40.5952850264989,40.5952857319952,40.595288006567,40.5952946511712,40.5952958872236,40.5952966371102,40.5952969289208,40.5952968900912,40.5952967168582,40.5952964080682,40.5952959826082,40.5952954215719,40.5952947267788,40.5952939596872,40.5952931290736,40.5952912262277,40.5952889989369,40.5952864044192,40.5952812327952,40.5952687496536,40.5952633611085,40.5952612067574,40.5952593406172,40.5952577442227,40.5952564073115,40.5952434143782,40.5952309161998,40.5952086484365,40.5951954966771,40.5951938732231,40.5951909068453,40.5951888841533,40.5951767124515,40.5951571462046,40.5951397209831,40.5951176009092,40.5950878906338,40.5950563360434,40.5950446192475,40.5950174377975,40.595007228891,40.594973812712,40.5949584017243,40.5949302611275,40.5949070731079,40.594905837223,40.5949045111486,40.5949030955113,40.5949015908149,40.5948999778149,40.5948982757562,40.5948944945427,40.5948911008427,40.5948871862296,40.594869299305,40.5948649249962,40.5948610806848,40.5948417135424,40.5948305007538,40.5948256531228,40.5948226286868,40.5948180618784,40.5948165815181,40.5948152550673,40.5948091473284,40.5948032075356,40.594785618793,40.5947781498746,40.5947647971688,40.5947602250458,40.5947555938678,40.5947478155517,40.5947382807064,40.5947080401397,40.5946678381456,40.5946532497693,40.5945864585179,40.5945263949443,40.5945138523801,40.594479954061,40.5944482130039,40.5944213451549,40.5944007124798,40.5943672825237,40.5943334436783,40.5943191704534,40.5943049670852,40.5942881807397,40.5942319681483,40.5941888755586,40.5941754683652,40.5941631540831,40.5940708641614,40.5939239938846,40.5938816374303,40.593815102043,40.5937677249099,40.5937268795867,40.5937199822016,40.5937125118228,40.5936771798768,40.5936685207413,40.5936621285364,40.5936606516286,40.5936434786063,40.5935900259677,40.5935807259849,40.5935710302268,40.5935504687357,40.5935486514744,40.593546952174,40.5935453515698,40.593543860885,40.5935411674355,40.5935388376411,40.5935356011718,40.5935301834681,40.5935284758419,40.5935265579466,40.5935253562572,40.5935240627258,40.5935226515748,40.5935211327098,40.5935203321383,40.5935194945692,40.5935177306386,40.5935158310171,40.5935138051032,40.5933552806597,40.5932581737456,40.5932118948606,40.5931790624596,40.5931270446325,40.5931060692274,40.5930885615391,40.5930838205494,40.5930793736243,40.5930637942682,40.5930596646008,40.5930552226703,40.5930166116824,40.593014661711,40.5930127650354,40.593007231013,40.5930049442356,40.5930022087602,40.5930007474499,40.5929992046822,40.5929968974105,40.5929944814377,40.5929919490932,40.5929893008385,40.592983627313,40.5929773601717,40.592965093247,40.5929367327825,40.5929342947419,40.5929317312515,40.5929260743818,40.5929057906287,40.592901799553,40.5928983553097,40.5928963580964,40.5928945038798,40.5928927758816,40.5928919568538,40.5928911639254,40.5928911815341,40.5928905497198,40.5928907009465,40.5928902309489,40.5928897610903,40.5928895954212,40.5928886522586,40.592887382236,40.5928858055581,40.5928842268674,40.5928826334937,40.5928832773422,40.5928836178231,40.5928844631474,40.5928855693317,40.5928871545172,40.5928892448358,40.5928904830693,40.59289186769,40.5929236436093,40.5929413377438,40.5927619164764,40.5926133837814,40.5925935165278,40.5925866615038,40.5925797888002,40.5925771894901,40.5925757221385,40.5925756543971,40.592578596218,40.5925992195545,40.5926032509641,40.5926155244929,40.5926400638351,40.5931923224386,40.5932863110879,40.5932867157861,40.5938752066461,40.5939481280416,40.5939307135187,40.5939282732088,40.5939159578144,40.5939142281245,40.5939012930969,40.5939021344321,40.5938893553966,40.593887666391,40.5938750274346,40.5938743957313,40.5938618024935,40.5938602923691,40.5938482244631,40.5937610237336,40.5937579430712,40.5938631328448,40.5938644952364,40.593945378131,40.5939478436951,40.5938669844304,40.5938818188915,40.5938827018212,40.5938963501473,40.5938987737269,40.5939117772405,40.5939130481836,40.5939247184538,40.5939279636902,40.5939403712833,40.5939419723713,40.5939668517924,40.5942722669942,40.594250579154,40.5942493996889,40.5942424249469,40.5942298271924,40.5942247540961,40.5941884622592,40.5940890132522,40.5940872398654,40.5942821158917,40.5942858520627,40.5942040548772,40.594260864599,40.5942883004791,40.5943032145896,40.5942736157612,40.5942877515425,40.5942985989536,40.5942859777994,40.5943064330322,40.594322123256,40.5943847474068,40.5944048638614,40.5944959752569,40.5944818254182,40.5945558180521,40.594536398598,40.5945630141778,40.5946013096405,40.5945895179087,40.5946630028417,40.5946395791449,40.5945242443782,40.5945026726548,40.5944467343604,40.5944342091769,40.5945058005138,40.5945185105997,40.5945161896847,40.5945163886829,40.5946781998833,40.5948402987507,40.5948690406591,40.5947306425327,40.5948171119799,40.5948239767712,40.5947531427816,40.5947829636318,40.5947875860868,40.5948173710968,40.5948222183498,40.5948517016301,40.5948567653874,40.5948852603587,40.5948868876414,40.5948710846133,40.5948728464242,40.5949372933911,40.5949344864387,40.5949495800877,40.5949527555691,40.5950096836171,40.5950065124942,40.5950204434817,40.5950264504778,40.5951456484506,40.5951490668528,40.5951652800315,40.5951636957568,40.5951557499772,40.5951546525226,40.5951537689241,40.5951524559308,40.5951478928023,40.595142843132,40.5951418832669,40.5951364896143,40.5951355479258,40.595132792763,40.5951149167405,40.5951085611747,40.5950687765874,40.5950627378461,40.5950236865915,40.5950093979213,40.5949908753673,40.5950048138348,40.5951343033169,40.5951495474173,40.595177427938,40.5951795614369,40.5951881402988,40.5951913245313,40.5951751380982,40.5951668350951,40.5951637096249,40.5951636435705,40.5951645667044,40.5951689124725,40.5951761845323,40.5951859543738,40.5951977901839,40.5958787999856,40.595896345325,40.5959416895819,40.5959533352327,40.595990387078,40.5960362518511,40.5961692899479,40.5962635223917,40.5962869666638,40.5963552071995,40.5963695068432,40.5963866750146,40.5964069741751,40.5964385874198,40.5964688676098,40.5964817917565,40.5964875826538,40.5965296817839,40.5965622194395,40.5965725845271,40.59673011,40.5967336283515,40.5967485359317,40.5968565372316,40.5971010781004,40.5971510479981,40.5971790355557,40.5972055158041,40.5972288808881,40.5972378550633,40.5972697432501,40.5973035738324,40.5974150648248,40.5975294610487,40.5975512754154,40.5976253297888,40.5976356757702,40.5976459116876,40.59765586215,40.5976653566573,40.5976746631942,40.5976831108329,40.5976905397974,40.5976958563167,40.5977002890729,40.5977007089771,40.5977059460663,40.5977083282668,40.5977077894254,40.5977065618612,40.5977081346696,40.5977093388686,40.597713869706,40.5977180112122,40.5977200519161,40.597722151987,40.5977304739679,40.5977318874107,40.5977275307368,40.5977231032796,40.5977234808443,40.5977283562465,40.5977325463013,40.5977359673149,40.5977383294443,40.597745745523,40.5977501644147,40.5977542351266,40.5977672743776,40.5977746771366,40.5977804286729,40.5977821812242,40.5977835652759,40.5977888919627,40.5977940873937,40.5977978405773,40.5977990328321,40.5977975421813,40.5977974533258,40.5977999321116,40.5978014030034,40.5978045695875,40.597809675655,40.5978122449685,40.5978175583966,40.5978231823031,40.5978261470299,40.5978286451349,40.5978296804396,40.5978283183539,40.5978279198609,40.5978286778185,40.5978321223654,40.5978344100181,40.5978379546534,40.5978455887395,40.5978541597773,40.5978660126103,40.5978711474753,40.5978726921396,40.597871957353,40.597873528318,40.5978780688414,40.5978824469035,40.5978876734757,40.5978960235582,40.5979218141265,40.5979330808255,40.597943498584,40.5979538804485,40.5979663116773,40.5980025362062,40.5980194023673,40.5980328383911,40.5980403428816,40.5980471184814,40.5980517076974,40.5980615496638,40.5980618678311,40.598059410983,40.5980544863191,40.5980514311476,40.5980520277945,40.5980562490506,40.5980623990149,40.5980679198196,40.5980770664212,40.5980834649728,40.5980909577587,40.598099047859,40.5981034001845,40.5981030616564,40.5980910310958,40.5980854172205,40.5980825536711,40.5980822157042,40.5980840962865,40.5980867956381,40.5980919879913,40.5981109673821,40.5981123856071,40.5981186463809,40.5981198248783,40.598127393044,40.5981441018217,40.598159118393,40.5981682056756,40.5981790123467,40.5981803263388,40.5981756202583,40.5981688536677,40.5981632704489,40.5981613410022,40.5981619676362,40.598167371588,40.5981754947644,40.5981841096904,40.5981880822875,40.5981867502077,40.5981856954829,40.5981859536396,40.5981886509562,40.5981943155249,40.598209252881,40.598219563596,40.5982320515638,40.5982402915979,40.5982512482106,40.5982606540849,40.5982719000215,40.5982820200581,40.5982923007136,40.5982970880331,40.5982964725724,40.5982923926145,40.5982909287339,40.5982914979985,40.5982945938473,40.5982981852698,40.5983081167089,40.5983159887046,40.5983236599577,40.5983246897259,40.5983308503552,40.5983626359065,40.5983697618187,40.5983762904927,40.5983856531098,40.5983963018045,40.5984011491147,40.5984036595573,40.5984037575239,40.5984030810511,40.5984024949113,40.5984063769979,40.5984110641897,40.5984132848158,40.5984167756219,40.5984219208211,40.5984298721566,40.5984420308784,40.5984477711363,40.5984531476074,40.5984593387389,40.5984632788017,40.5984824362101,40.5984879702034,40.5984964993274,40.5985035535749,40.5985114260063,40.598518989508,40.5985213381599,40.5985219174028,40.5985205247336,40.5985187528588,40.5985180468193,40.5985216225214,40.5985290058881,40.598535049633,40.5985500281652,40.5985665994614,40.5986043260505,40.5986181412289,40.5986500183842,40.5986885522168,40.598697897559,40.5987081181163,40.5987158101177,40.5987227285538,40.5987316764925,40.5987399976395,40.5987501571767,40.5987677242315,40.5987820359717,40.5987923454263,40.5988074327004,40.598816649109,40.5988273952392,40.598844304553,40.5988567552863,40.5988729714773,40.598880414182,40.5988914938718,40.5988988883349,40.5989072397365,40.5989221781567,40.598933187696,40.59893569293,40.5989356557485,40.5989313938066,40.5989294390858,40.5989259495747,40.5989228489546,40.5989122053013,40.5989013558875,40.598900225419,40.5988974430681,40.598888841589,40.5988857978121,40.5988751022578,40.5988705134269,40.5988564363686,40.5988527560017,40.5988510530653,40.598851337404,40.5988535895604,40.5988616630893,40.5988874133565,40.5988897293552,40.598893177437,40.5988963092695,40.5989011375986,40.598915250237,40.598954969994,40.5989771698413,40.5989887382165,40.5990504158316,40.599112345348,40.5991164996269,40.5991229021577,40.5991423022463,40.5991516646199,40.5991812410819,40.5991838994392,40.5992005712572,40.5993117393886,40.5993124045617,40.5993382057902,40.5993373550428,40.5993907611358,40.5993928602,40.5993394435507,40.5993388162156,40.5993116801896,40.5993125203456,40.599211164654,40.5991887295697,40.5991915461616,40.5991623604783,40.5991754938956,40.5991994230632,40.5992043680686,40.5993291074451,40.5993315591238,40.5992760489842,40.5992763856541,40.5991825683778,40.5992122522724,40.5992581446571,40.5992578842922,40.5992581380972,40.5993210384954,40.5993195085901,40.5993693949668,40.5993699308154,40.5993733706235,40.5993733535704,40.5993223455272,40.5993205269961,40.5992584942159,40.5992647013439,40.5992628992,40.5992364395867,40.5992140756913,40.5991962909753,40.5991834699076,40.5991758896531,40.5991737140811,40.5991769902228,40.5991858112782,40.5992003287923,40.59922038319,40.599245754035,40.5993010402406,40.59932182829,40.5993283658035,40.5993205385259,40.5993760075915,40.5993773385264,40.5993869542501,40.5994433257097,40.5994448297986,40.5994622167045,40.5994673042155,40.5994967621491,40.5994985311247,40.5994726762686,40.5994827857728,40.5994548390531,40.5994337569543,40.5994196552252,40.5994126112894,40.5994132072575,40.5994207370939,40.5994351604318,40.5994563999489,40.599484341782,40.5995188361371,40.5995596980923,40.5996067085891,40.5996596156068,40.5997181355126,40.599781954583,40.5997941026755,40.599827864602,40.599859960863,40.5998696151986,40.5998792705416,40.5998910796026,40.5999128681575,40.599932396136,40.5999385933986,40.5999614512669,40.5999641279968,40.599962120522,40.5999782978007,40.5999811833394,40.5999802602665,40.5999788090955,40.5999714582235,40.5999747977429,40.599989634923,40.5999992029299,40.6000008387974,40.5999925262003,40.5999945656579,40.6000013470622,40.600003331686,40.599993739484,40.5999736345618,40.5999635542071,40.5999649563234,40.5999716389286,40.5999678599183,40.5999580194029,40.5999571681148,40.5999640018909,40.6000077892222,40.6000133664679,40.6000221318537,40.6000227063662,40.6000239743161,40.6000272671284,40.6000351519799,40.6000583686293,40.6000673629361,40.6000664308259,40.6000594677414,40.6000630492765,40.6000517054417,40.6000352580986,40.6000337648448,40.6000256391968,40.6000107951275,40.5999772820162,40.5999682512784,40.5999692811976,40.6000074345967,40.600033316778,40.6000353796681,40.6000289434788,40.6000248018632,40.6000271499822,40.6000352147097,40.6000498965534,40.6000643402781,40.6000691539803,40.6000783893365,40.6000931964672,40.6001047802864,40.6001271786343,40.600149664106,40.6001718698041,40.6001839358487,40.6001959936785,40.600219679102,40.6002359377294,40.6002664868222,40.6002790731048,40.6002921608699,40.6003008421061,40.6003080466196,40.6003135133583,40.600318755322,40.600322738612,40.6003289540618,40.6003319700629,40.6003357311697,40.6003479584863,40.6003514372779,40.6003633137481,40.6003798495715,40.6004040147766,40.6004298951447,40.6004459133041,40.6004688456959,40.6004895674999,40.6005144671936,40.6006098403205,40.600637423118,40.6006719217894,40.6006997698662,40.6007271177662,40.6007554403466,40.6007869609185,40.6008157680639,40.6008386587554,40.6008630256476,40.600883942065,40.6009097718285,40.6009316693844,40.6009535922356,40.6009706003128,40.6009908237136,40.6010041633435,40.6010192066809,40.6010423400902,40.6010642340244,40.6010775136926,40.6010935118778,40.6011058299857,40.6011159563595,40.6011261001377,40.6011350242719,40.6011407392764,40.6011459730349,40.6011492318537,40.6011507846868,40.601151592259,40.6011550828619,40.6011637553253,40.6011743860579,40.6011879568848,40.6012022696941,40.6012205172851,40.6012375271675,40.6012513025983,40.6013791152565,40.6014398398085,40.6014662306091,40.6014867467518,40.6015136058316,40.6015479214958,40.6016102747792,40.6016511117308,40.6016843630704,40.6017108670742,40.601782163896,40.6018869041887,40.6019721944871,40.6020196494707,40.6020790977308,40.6021921535019,40.6022447401658,40.6022940358246,40.6023448471624,40.6023714804183,40.6023964028683,40.6024430516456,40.6025134107248,40.6025865129177,40.6026336294036,40.6026672821826,40.6026963684642,40.6027329778023,40.6027608209214,40.6027970890243,40.6028170404637,40.6028453523936,40.6028816854612,40.6029071714483,40.6029372598266,40.6029605992349,40.6029796135727,40.6030187418998,40.6030470856595,40.6030863085387,40.6031133446354,40.6031264841601,40.6031362660834,40.6031381222969,40.6031315197454,40.6031271306428,40.6031174146867,40.6031166554337,40.6031249683418,40.6031363003501,40.6031543470163,40.6031723598839,40.6031891950029,40.6032063690586,40.6032190395605,40.6032316786135,40.6032389741853,40.6032555155772,40.603250206179,40.6031946590385,40.6031587278162,40.6031505941647,40.6031383757783,40.6031225098626,40.6031140947608,40.6031137290527,40.6031048041314,40.603074726411,40.6030671489338,40.603047449752,40.6030320628744,40.6030097754698,40.602975672139,40.6029517499315,40.6029304420821,40.6029042403112,40.6028740815928,40.6028402840002,40.6028032039845,40.6027632326146,40.6027230415177,40.6026461172369,40.602677115852,40.6025954230434,40.6025096588348,40.6024199504769,40.6023264310723,40.6023227050856,40.6023060529344,40.6022830843294,40.6022597472821,40.6022421605113,40.6022159082264,40.6021983199987,40.6021775453092,40.6021482434173,40.6021344040796,40.602113270031,40.6020898288454,40.6020649727843,40.6020402578237,40.6020121957495,40.6019907085874,40.6019743490511,40.6019473174909,40.6019298806033,40.6019060477344,40.6018795235049,40.6018646082679,40.6018402865703,40.6018130484379,40.6017874807032,40.6017643933193,40.6017512051472,40.601728282745,40.6016988289497,40.6016764581842,40.6016607858868,40.6016396253557,40.6016177864578,40.6016021574648,40.6015735765831,40.6015570555919,40.6015307803024,40.6015124896957,40.6014888543846,40.6014670238658,40.601441980823,40.6014182110499,40.6013962192511,40.6013704645845,40.6013530349823,40.6013309519575,40.6010410521853,40.6009953025485,40.6009373915059,40.6008544686558,40.6006428178045,40.6005388578011,40.6004795826302,40.6003801151666,40.6003234713718,40.6002398575764,40.6001855107473,40.6001520208667,40.6001282681377,40.6001132298236,40.6000985749871,40.6000834523584,40.600060669679,40.6000424548237,40.6000198847163,40.6000074681815,40.6000041921276,40.5999942887825,40.5999974926311,40.5999810929738,40.5999718149267,40.5999436948052,40.5999272623767,40.5999116164417,40.5998924944759,40.5998729079246,40.5998540413607,40.5998370197528,40.5998178236597,40.5998013980837,40.599760263189,40.5997466736187,40.5997286234402,40.5997216403123,40.5997156072601,40.5997007131254,40.5996567396831,40.5995896249225,40.5995691453302,40.5995428871054,40.5995181095509,40.5994941328719,40.5994594928768,40.5994370452165,40.5994142426666,40.5993942104134,40.5993755503073,40.5993485204247,40.5993363146678,40.5993237615576,40.5993078076636,40.5992832509096,40.5992709225722,40.5992651180694,40.5992179792524,40.5991982843415,40.5991528489639,40.5991242618813,40.5990960705636,40.5990818445016,40.5990566216593,40.5990380756488,40.5990136976343,40.5989606097415,40.5989042499439,40.5988627566519,40.5988464158162,40.5988263192676,40.5988017842431,40.5987805046762,40.598754667354,40.5987358258881,40.5987149545097,40.5986662988522,40.5981208447462,40.5981036589635,40.5980590039796,40.5980123147165,40.597968144917,40.5979015406648,40.5978566197123,40.5977910823662,40.5977572075249,40.5977181416692,40.5976512025058,40.5975849178627,40.5975483187382,40.5975228395453,40.5974971907238,40.59748030613,40.5974604668219,40.597436895977,40.5974128224227,40.5973972494033,40.5973910819129,40.5973801684426,40.5973386287542,40.5972947540277,40.5972492508473,40.5972002925976,40.5971507191,40.5970817974312,40.5970422616206,40.5970111469834,40.5969704873758,40.5969449985134,40.5969231614139,40.5968910225142,40.5968687318495,40.5968420603462,40.5968236337802,40.5968039746874,40.5967873488219,40.5967357560803,40.5966956419797,40.5966744035473,40.5966265216513,40.5965083384491,40.5964890754553,40.596475894873,40.5964594343439,40.5964340125889,40.5964206977485,40.5963905420436,40.5963430976156,40.596298763664,40.5962367887184,40.5962068059852,40.5961861460623,40.5961609196515,40.59612119194,40.5960724838805,40.5960552649155,40.5960292846473,40.5960052065332,40.5959834493181,40.5959611834065,40.5959111555779,40.5958812981177,40.5958105604294,40.5957612302152,40.595695454924,40.5956320043472,40.5955690563093,40.5955222401058,40.5954729090466,40.5954476393404,40.5953998610397,40.5953722812336,40.5953227077565,40.5952778641855,40.595234116292,40.5951900027668,40.5951376004212,40.5951150277422,40.5950935796223,40.595055555871,40.5950337263986,40.595013137764,40.5949908948573,40.594975521495,40.5949448789097,40.5949234842349,40.5949106861821,40.5948977212873,40.5948819734336,40.5948621614325,40.5948441957886,40.5948328546839,40.594808610503,40.5947827015795,40.5947674596719,40.5947572959525,40.5947523516625,40.5947526955109,40.5947627426854,40.594771302719,40.5948259869111,40.5948259950865,40.5949601362763,40.5949518002998,40.5949902479694,40.5950030121444,40.5950576930089,40.5952080973895,40.595253841335,40.5952644497454,40.5952773010553,40.5952921730691,40.5957357172439,40.5957446442724,40.5960300067138,40.5960855415233,40.5960814332706,40.5960933958843,40.5961083847728,40.5960972784233,40.5960888990854,40.5960333642749,40.5960214325626,40.595964226875,40.5959515055822,40.5958968202901,40.5958146854418,40.5957746431196,40.5957463255578,40.5957126379309,40.5956779772361,40.595668264967,40.5956096168461,40.595588704302,40.5954720630821,40.5954538860934,40.5952661544472,40.5952548393854,40.5952114981355,40.5951977989104,40.5951955389148,40.5951163554375,40.5950739493855,40.5950602441273,40.5949807840561,40.594989119499,40.5948558355794,40.5948616554038,40.594848839218,40.594841310437,40.5948276406946,40.594827659089,40.594786644636,40.5947891689927,40.5947712270994,40.5947650853682,40.5947519659131,40.5947538213939,40.5947600953514,40.5947682022728,40.5948178274536,40.594819577941,40.5948691580156,40.5948691294688,40.5948981687001,40.594910936853,40.5949801866744,40.5949930449825,40.5950614364966,40.5951133439491,40.5951452181636,40.5951580846799,40.595227322266,40.5952400949407,40.5952658950107,40.5952989025394,40.595321299727,40.5953913183145,40.5954041728919,40.5954749520671,40.5954928840944,40.5955552968085,40.595568895381,40.5956381590756,40.5956510081226,40.5957201833382,40.5957329407243,40.5958012884926,40.5958141326807,40.5958849909386,40.5958970004714,40.5959661713287,40.5959789308931,40.5960481989394,40.5960419772493,40.5960539321539,40.5960665732409,40.5960666033116,40.5960713197045,40.5960602114444,40.5960537690057,40.5960514161062,40.5959822388991,40.5953115948049,40.5952744537338,40.5952665957373,40.5950647130535,40.5950066465902,40.5949014638112,40.5948724140186,40.5948715756559,40.5948228747985,40.5948237085622,40.5947734814208,40.5947799173832,40.5948073107434,40.5948086231333,40.5948024264277,40.5947155439945,40.5947171864502,40.5947264327216,40.5947458833454,40.5948207365171,40.5948241280109,40.5947449949227,40.594728124894,40.5947195968483,40.5947313897291,40.5947361623295,40.5947438562886,40.5948342701533,40.594838517917,40.5947472873326,40.5947385242991,40.5947333372204,40.5947372503093,40.5947436685546,40.5947649344202,40.5947779891733,40.594792736702,40.5948088307724,40.5948258935368,40.5948435244051,40.5948425638353,40.594840900033,40.5948426110431,40.5949383009254,40.594948532044,40.59499808151,40.5949972489564,40.5950527219272,40.5950654830616,40.595149228056,40.5951869449245,40.5952458057373,40.5952593827499,40.5952790387114,40.5953414690076,40.5953543323562,40.5954372125399,40.5954599636085,40.5955336330362,40.595545735304,40.5956294600147,40.5956422409207,40.5956816374634,40.5957370598191,40.5958216367659,40.5961215662952,40.5962044437846,40.5961969820469,40.5962089435033,40.5962280399114,40.596217788285,40.5962069468799,40.5961232200315,40.5961112857676,40.596069954112,40.5960064131736,40.5959318565687,40.5958869730019,40.5958362135418,40.595823438593,40.5957396453774,40.5957285516259,40.5956439968179,40.5956320674107,40.595548278546,40.5955363459567,40.5954525597719,40.5954390408283,40.5953569128816,40.5953440561605,40.5952800912677,40.5952595018451,40.5952475707644,40.5951763059943,40.595151844275,40.5950005995878,40.5949997638135,40.5949502081962,40.5949518934268,40.5948656029916,40.5948626325204,40.5948604759002,40.5949974662479,40.594956139403,40.5949467896526,40.5949497855237,40.5949628934359,40.5949776459705,40.5950022325183,40.5950216884352,40.5950449408198,40.5951130163302,40.5951360601118,40.5951604939427,40.5951765434675,40.5951937649754,40.5951987221258,40.5951875840012,40.5951851464922,40.5951858770857,40.5951843909018,40.5951858667194,40.5951923167766,40.5951969703373,40.5952091100812,40.5952335470971,40.5952822131255,40.5952982223885,40.595339913672,40.5953855476131,40.5954262622216,40.5954747563321,40.5955225812777,40.5955456748842,40.5955700788089,40.595590519864,40.5956079075522,40.5956259644041,40.595645882253,40.5956677499671,40.5956921237147,40.5957154378587,40.5957376752885,40.5957591424773,40.5957931050238,40.595809088065,40.5958299343152,40.5958505976542,40.5958777372638,40.5959015142895,40.5959134179123,40.5959286474133,40.5959527780753,40.5959744952633,40.5959917283561,40.5960156410924,40.5960298107174,40.5960518889409,40.5960772987654,40.596101960104,40.5961242516696,40.5961506313769,40.5961780836388,40.5961950301658,40.5962181579251,40.5962395888185,40.5962839068103,40.5963096155393,40.5963351714301,40.5963605683739,40.5963835806238,40.5964053228876,40.5964306320309,40.5964537237488,40.5964780452358,40.5965060603172,40.5965284395203,40.5965775253224,40.5966016864738,40.5966207786855,40.5966447034963,40.5966615623385,40.596688194247,40.59671100839,40.5967329137645,40.5967571636174,40.5967735104419,40.5967806387234,40.5967878969902,40.5968069782243,40.5968295170513,40.5968461893585,40.5968673363271,40.5968909758272,40.5969167577866,40.5969404350752,40.596969767472,40.5969919600349,40.5970179683293,40.59704311476,40.5970676698314,40.5970911459456,40.597101194329,40.5971112345076,40.5971403422797,40.5971632354187,40.5971853399071,40.5972089677184,40.597258249002,40.597280944872,40.5972977144812,40.5973095894447,40.5973214550472,40.5973389572188,40.59735375044,40.5973612149078,40.5973816644024,40.5974038686947,40.5974125113571,40.5974211540428,40.5974371908422,40.5974491718124,40.5974611516119,40.5974820889685,40.59750882712,40.5975249271276,40.5975987330701,40.5976489760046,40.5977185327826,40.5977882765636,40.5978353565264,40.5978827580797,40.5979284921189,40.5980199273827,40.5980916759766,40.5981613540683,40.5982067736736,40.598226339946,40.5982470379058,40.5982639717166,40.5982767819315,40.5982911175242,40.5983051870716,40.5983146499108,40.5983307808594,40.5983323634413,40.5983269512693,40.5983270052862,40.5983348660898,40.5983455595246,40.5983618123386,40.5983739909014,40.598385827634,40.5983976643653,40.5984132919785,40.5984272931713,40.5984430066878,40.5984658901352,40.5984724496814,40.5984908283417,40.5985013704239,40.5985208516789,40.5985386692001,40.5985536864793,40.5985674448285,40.5985912062473,40.5986152815045,40.5986330647602,40.598651852035,40.5986821257432,40.598696343847,40.5987188384387,40.5987339149302,40.5987496095273,40.5987647738088,40.5987795407402,40.5987955588528,40.5988043472761,40.5988247717376,40.5988457492777,40.5988655262976,40.5988723274342,40.5988849497311,40.5989157521672,40.5989298139013,40.5989465844025,40.5989680906955,40.5989722016619,40.5989889002699,40.5990097578042,40.5990325046199,40.5990566491491,40.59908126029,40.5990974617785,40.5991194181438,40.5991339866318,40.5991413198996,40.5991568606517,40.5991790284228,40.5991931263674,40.5991970954685,40.5992029310966,40.5992148480508,40.5992288291074,40.5992474146604,40.5992541614694,40.5992586088085,40.5992656476338,40.599283325391,40.599296451003,40.5993323861851,40.5993693961466,40.5994059324634,40.5994269131695,40.599439859237,40.5994457752097,40.5994419646608,40.5994433008924,40.5994520990069,40.5994704899946,40.5994833821777,40.5995041993594,40.5995191857358,40.5995326579347,40.5995805776758,40.5995954415659,40.5996067384981,40.5996180349464,40.5996279755201,40.5996379160943,40.5996573289412,40.5996665840998,40.5996806430249,40.5996899680067,40.5997112619122,40.5997357535978,40.5997588374512,40.5997834297956,40.5998068320494,40.5998271470243,40.5998489980924,40.5998703644124,40.5998834143613,40.5999178387461,40.5999609527717,40.5999799833498,40.5999989037143,40.6000186331783,40.6000303950686,40.6000409830685,40.6000515632987,40.6000623429286,40.6000732722824,40.6000833669544,40.6000975243803,40.6001079649943,40.6001132044054,40.6001115163324,40.6001155908396,40.6001372485292,40.6001634861503,40.6001908634102,40.6002046395701,40.6002337892553,40.6002468490456,40.6002618760075,40.6002725721564,40.6002817314644,40.6002949852881,40.6003164918147,40.6003380887093,40.6003680337563,40.6004221412999,40.6004603445611,40.6005046431701,40.6005689284959,40.6006672657775,40.6006297257064,40.6006486187517,40.6007117570642,40.6005932618931,40.6005966458366,40.6006414545477,40.60066461563,40.6006850934225,40.6007090210393,40.6007296855599,40.6007612811071,40.6007971945209,40.600918237942,40.6009839328683,40.6009599105217,40.6009198246729,40.6008163836285,40.6008460216011,40.6008679794724,40.6008928703992,40.6009181384152,40.6009882699238,40.6010177476023,40.6010464808862,40.6010782811597,40.6010923491452,40.6011368344618,40.6011617585187,40.6011865296924,40.6012161700719,40.6012411276914,40.6012627661049,40.6012885166904,40.6013170297884,40.6013360429796,40.6013583693775,40.6013822459309,40.6014038933746,40.6014425036478,40.6014581730453,40.60149511683,40.6015180217085,40.6015377675959,40.6015691784475,40.6015819328787,40.6015896477717,40.60159910488,40.6016051261475,40.6016114524097,40.6016180170051,40.6016356887332,40.6016375529427,40.6016366002337,40.6016377266988,40.601643694861,40.6016489606668,40.6016676240123,40.6016792989381,40.6016793350031,40.6016729509885,40.6016727323213,40.6016992748362,40.6017071210938,40.6017019362262,40.6017137605876,40.6017250514319,40.6017370382072,40.601743579672,40.6017525285438,40.6017637037956,40.6017762741994,40.6017873904628,40.601800098583,40.6018311014538,40.6018585473675,40.6018853489276,40.6019164390098,40.601949368442,40.6019810036057,40.6020271259529,40.6020690276031,40.6021044225169,40.6021407872861,40.6021754461664,40.6022027087537,40.6022181200596,40.6022368120484,40.6022765637282,40.6022979565654,40.6023932497515,40.6024536446978,40.6024963648066,40.6025409812399,40.6025634387428,40.6025846913936,40.6026518291057,40.6026834583703,40.6027164671002,40.6027351537777,40.6027600958978,40.6028046487028,40.602852264827,40.6029028664376,40.6029285663408,40.6029779259868,40.6030373472988,40.6030590999854,40.6030764049194,40.6031270484233,40.603166349703,40.6032281511808,40.6032925772154,40.603336016849,40.603385275868,40.6034715843361,40.6035411269899,40.6035896020462,40.6036175010959,40.6036431958984,40.6036705479262,40.6037149281874,40.6037609923505,40.6038147468935,40.603837725865,40.6038576237823,40.6038778155822,40.6038985197643,40.6039156905739,40.6039314671539,40.6039371335113,40.6039303590508,40.6039320953604,40.6039475413919,40.6039609755029,40.6039722385232,40.6040203300584,40.6040272448074,40.6040478363137,40.6040642576344,40.6040702996199,40.6040943895812,40.6041189387986,40.6041424797822,40.6041663098412,40.6041997934129,40.6042160843275,40.6042331628901,40.6042501149999,40.6042724487112,40.6042952797496,40.6043134120328,40.6043279051775,40.6043608934398,40.6043689367213,40.6043903634623,40.6044036371913,40.6044169039086,40.6044224137841,40.6044357024462,40.6044518335114,40.604459715173,40.6044729430081,40.6045117965503,40.6045362548179,40.6045549740185,40.6045870601519,40.6046750192797,40.6046859883657,40.604696958144,40.6047134805444,40.6047293055676,40.6047509906269,40.6047768066083,40.6047994510521,40.6048244251169,40.6048652629705,40.6048803974514,40.6049028915348,40.6049253454986,40.6049396176019,40.6049596216203,40.6049712981071,40.6049806963254,40.6050135354341,40.6050450901588,40.6050499150456,40.6050583674584,40.6050744034084,40.6050868721936,40.605111705373,40.6051539449467,40.6051767280584,40.6051974325167,40.6052193591061,40.6052364351216,40.6052478962025,40.6052593573047,40.6052861954824,40.6053087724773,40.6053244364318,40.6053628451868,40.6053807457386,40.605395180386,40.6054071239467,40.6054339610303,40.6054766821805,40.6054957626145,40.6054980050647,40.6055109908277,40.6055062462443,40.6055170300001,40.6055318168325,40.6055464896518,40.6055577451436,40.6055767088858,40.6055908435967,40.605596687258,40.6055904435629,40.605587278468,40.6055978775476,40.6056078506377,40.605617822553,40.6056349806641,40.6056556952827,40.6056782575884,40.6057026759086,40.6057196223274,40.6057367801679,40.6057527614366,40.6057836107923,40.6058122560251,40.6058355856748,40.6058553042771,40.6058852525618,40.6059241225631,40.6059528219044,40.6060126932646,40.6060520232931,40.60606160188,40.6060818573492,40.6060876962213,40.6061034127956,40.6061089661922,40.6061258343008,40.6061563971791,40.6061751344013,40.6061856081054,40.6061917332018,40.6062154307288,40.6062331948936,40.6062536435365,40.6062540789733,40.6062782103483,40.606298863368,40.6063106612881,40.6063247460785,40.606332104712,40.6063541670297,40.6063687435289,40.6063798683252,40.6063860281578,40.6063872106951,40.6063959479689,40.6064137967985,40.6064839870741,40.6065189274195,40.606550772073,40.6065838797573,40.6066394099396,40.6067409701343,40.6068404391771,40.6069049844676,40.606944058645,40.6070237442174,40.6070747224023,40.6071004548806,40.6071187595474,40.6071590026694,40.6071756305088,40.6072172783957,40.6072533843457,40.6072702593328,40.6072844135248,40.6073272972285,40.6073433686048,40.6073691838019,40.6074049553502,40.6074434837317,40.6074884119375,40.6075436235694,40.6075991110306,40.6076368131918,40.607866524163,40.6079070540288,40.608425974828,40.6085633537548,40.6092262606824,40.6093073618075,40.6095502680002,40.6096025973846,40.609643663429,40.6097061806309,40.6097605626938,40.6098045808687,40.6098397385704,40.6098491130919,40.6098532205897,40.6098482718862,40.6098352029453,40.6098082243946,40.6097729122764,40.6097459626824,40.6096952195112,40.6096558382424,40.6096490383917,40.6096582603254,40.6096781173232,40.6096911285405,40.6097405201889,40.6097417771056,40.609743023632,40.6097419766898,40.6097374069644,40.6097180190495,40.6097035471469,40.6096665576169,40.6096090014369,40.609520785203,40.6094185674732,40.6093581994216,40.6092900269216,40.6091916818316,40.609080924632,40.6089496521835,40.6088932316353,40.6088586567388,40.6088095550174,40.6087465958681,40.6087068289997,40.6086962109182,40.6086514009889,40.6086011286403,40.6085652194881,40.608523300347,40.6084650167804,40.6084479275353,40.6084355712145,40.608431821663,40.6084324456014,40.6084361765362,40.6084421017758,40.6084480276766,40.6084512370355,40.6084509183162,40.6084471724092,40.6084166322238,40.6084108315393,40.6084089884489,40.6084056880831,40.6083995631124,40.6083931956151,40.6083801338114,40.6083660848664,40.6082670303663,40.6081843006212,40.6081687523628,40.6081528459077,40.6081371041164,40.6079357407257,40.607919878452,40.607897600316,40.6078763673209,40.6078559252336,40.6078366251677,40.6078160213455,40.6077823517299,40.6077457867562,40.6077025613209,40.6076366389715,40.607616824116,40.6075826437729,40.6075654501468,40.6075337838957,40.6075193030647,40.6074949016261,40.6074748742998,40.6074569434933,40.6074425622813,40.6074319642817,40.6074252377921,40.6074210845743,40.6074169325241,40.6074153878831,40.6074138425916,40.6074140086355,40.6074153767711,40.6074162706769,40.6074176488826,40.607424105881,40.6074306618567,40.6074382294927,40.6074449440826,40.607452080043,40.6074680041793,40.6074837872236,40.6075454143574,40.6076004590428,40.6076501909792,40.6077157568232,40.6077484122341,40.6077646473122,40.6077865849974,40.6078026144459,40.6078214964224,40.6078368989871,40.6078584082518,40.6078792559549,40.6078941148793,40.6079189982548,40.6079904957192,40.6080159443745,40.6080248331597,40.6080825165979,40.6081598444125,40.6082077654969,40.608233031338,40.608287764522,40.6082999951814,40.6083122253386,40.6085509430003,40.6085775330351,40.6085912932325,40.6086050517767,40.6086341573823,40.6086713107661,40.6087366896154,40.6087822846916,40.6087980415996,40.6088129457808,40.6088232532889,40.6088355923724,40.6088811813915,40.6088983944042,40.6089372462673,40.6089589114264,40.608970332939,40.6089915512412,40.6090020274527,40.6090601289262,40.6091434482637,40.6091551193779,40.6091772743977,40.6091969018586,40.6092060454095,40.6092214706352,40.6092226485893,40.6092230892126,40.609223022497,40.6092222490392,40.6092199049112,40.6092174213517,40.6092107342025,40.6092068254279,40.6092027276598,40.6091985908988,40.6091945528595,40.6091907542482,40.6091889454479,40.6091872256009,40.6091855771379,40.6091840263428,40.6091825570085,40.6091811958935,40.609141401631,40.6091069644397,40.6089823444638,40.6089245056527,40.6089033676901,40.6088788078745,40.608790362784,40.608756632539,40.6087259056928,40.6086936210383,40.6086582879432,40.6085541539102,40.608519592191,40.6084872408003,40.6082607777074,40.6081931391406,40.6081665236516,40.6081260929965,40.6080985250736,40.6080654202707,40.6080405826534,40.6080258413622,40.6080000641467,40.6079379114609,40.607921566246,40.6079071780813,40.6078509052871,40.6078320948175,40.6078157576972,40.6077941916136,40.607746911809,40.6077244961148,40.6076572987677,40.6076314007238,40.6076070953776,40.6075796168242,40.6075505046794,40.6075300623127,40.6075103462859,40.6074806242756,40.6074639296591,40.6074506499926,40.607436553022,40.6074218536481,40.6074033175605,40.6073891098153,40.6073794962322,40.6073510472761,40.6073405010973,40.6072976565928,40.6071221020348,40.6069321171644,40.6068113514632,40.606778731751,40.6067421936597,40.606596151858,40.6065259673208,40.6064772608756,40.6063762345607,40.6063300012563,40.6062720484239,40.6062349998356,40.6061694735633,40.6061249180699,40.6060265710452,40.6059838596258,40.6059562150156,40.6058858062484,40.6058539463488,40.6058294343513,40.6057690180187,40.6057404124939,40.6057192701076,40.6056981277456,40.605662327068,40.6056296074905,40.6055992856636,40.6055672533428,40.6055045679887,40.6053974231215,40.6053266259788,40.6052935982167,40.6052579880099,40.6052190022554,40.6051950326675,40.6050796844298,40.6046293726735,40.6045980120356,40.604564431688,40.6045205790364,40.6045002563185,40.6044488217653,40.6044236088284,40.604405509644,40.604396721964,40.6043920712965,40.6043908016869,40.604393191902,40.604398418967,40.604417996996,40.6044210428585,40.6044205341894,40.6044170092184,40.6044097790206,40.6043986152009,40.6043857170191,40.6043749828686,40.6043557767291,40.6043246483892,40.6043069648173,40.6042775835631,40.6042453524403,40.6042015582439,40.6041613707685,40.6041259425468,40.6041125132324,40.6041008608055,40.6040976152728,40.6040961221082,40.6040963787406,40.6040983947308,40.6041023352926,40.6041105586053,40.6041217374452,40.6041539627101,40.6041615874162,40.6041666497693,40.604169915816,40.6041650865427,40.6041573088679,40.6041338385089,40.6040957821712,40.6040704012004,40.604039149589,40.6039309283259,40.6038761614191,40.6037259958061,40.6036823878344,40.6035847833146,40.6035056066301,40.6034716817535,40.6034457276629,40.6034155619671,40.6033854606521,40.6033090459592,40.6032690736664,40.6032296193976,40.6031547712569,40.6031237949821,40.6030909846274,40.6030608403143,40.6030270411423,40.6029339649109,40.6027528944023,40.602739073692,40.6027339354857,40.6027342285036,40.6027455256652,40.6027596293158,40.6027765506581,40.6027933733311,40.6028038415657,40.6028295418237,40.6028451609553,40.6028756694694,40.6029485817401,40.6029807428678,40.6030056653307,40.60303001236,40.6030422064307,40.6030469839354,40.603048067544,40.6030474250657,40.6030458365398,40.6030434496249,40.603040299588,40.6030364604429,40.6030342859014,40.6030294443934,40.6030210489132,40.6029925462246,40.6029360562036,40.6029088313348,40.6028583063488,40.6028147406705,40.6027840621819,40.6027467498019,40.6026742309655,40.6026447486921,40.6026087119417,40.6025726653168,40.6025445969841,40.6025380749177,40.602524955659,40.6025133174222,40.6025034594095,40.6024956737955,40.6024901875921,40.6024871410232,40.6024868684833,40.6024865959621,40.6024885805005,40.602492615876,40.6024961600771,40.6024985024854,40.6025091234249,40.6025169692179,40.6025218122809,40.6025235121304,40.6025220194588,40.6025173775641,40.6025097210944,40.6025002049594,40.6024885583801,40.6024750673677,40.6024481766434,40.6024075310622,40.6023639023322,40.6023177540765,40.6022636784055,40.6022077782881,40.6022019508665,40.6021970773654,40.6021932858754,40.6021906760481,40.602189316478,40.6021892428985,40.6021943481754,40.6021991674916,40.6022035703104,40.6022074373762,40.602210663945,40.6022131626213,40.6022148657256,40.6022157271273,40.6022157234942,40.6022148549247,40.6022131449451,40.6022105199965,40.6022071100598,40.6022030152802,40.6021983559159,40.602193268806,40.6021879033519,40.6021824171297,40.602176971262,40.6021717256865,40.6021621791649,40.6021502560992,40.6021381597176,40.6021287257445,40.602120215863,40.6020931257313,40.6020715095299,40.6020548597264,40.6020411939595,40.6020108788796,40.6019892746089,40.6019577628689,40.6019249038566,40.6018446093228,40.6018096352392,40.601757264878,40.6017218813313,40.6016916007395,40.6016661829881,40.6014726697611,40.6014506838252,40.6014166863571,40.6013918490551,40.6013570852112,40.6013390600153,40.6013220964025,40.6013064795309,40.6012883441457,40.6012735503007,40.6012625321375,40.6012556129957,40.6012416631145,40.6012257819441,40.6012083527378,40.6011897961065,40.6011521490318,40.6011137956823,40.6010773407749,40.6010581769076,40.6010400373323,40.6010017339175,40.6009665522041,40.6009348459824,40.600897492658,40.600862860972,40.6008310819821,40.6008208829795,40.600812136989,40.6008050643829,40.6007998433687,40.6007966055001,40.6007954323612,40.6007963535114,40.6007993457408,40.6008043336543,40.6008451004354,40.6008444914237,40.6008435211177,40.6008422184412,40.6008406222254,40.6008387800518,40.6008367468336,40.6008345831786,40.6008323535831,40.6008301245088,40.6008279624019,40.6008259317124,40.6008240929728,40.6008225009939,40.6008212032308,40.6008202383683,40.6007549801213,40.6007480793574,40.6007389699081,40.6007278673074,40.6007150342482,40.6007007743667,40.6006791311068,40.6006547027081,40.6005762770234,40.6005326076139,40.6005141866368,40.6004828494938,40.6004398899449,40.6004203453291,40.6004020853031,40.6003855410858,40.600371153998,40.6003657745637,40.6003617397134,40.6003576869653,40.600358985321,40.6003656365628,40.60037015877,40.6003764580257,40.6004074058929,40.6004186169877,40.6004676093149,40.6004987443011,40.6005201382652,40.600539580194,40.6005398807261,40.6005459407975,40.6005550555538,40.6005673092426,40.6005829372832,40.6005983329294,40.6006076129015,40.6006299348582,40.6006499887406,40.6006830862063,40.6007284166494,40.6007369120148,40.6007454062235,40.6007505988987,40.6007524994752,40.6007510713187,40.6007383940652,40.6007274290338,40.6006978328453,40.600650374904,40.6005804617295,40.6005074836227,40.6002168327437,40.600165792378,40.6001154491071,40.6000550020549,40.600004182769,40.599947754527,40.5999169084492,40.5998609731182,40.5998165825567,40.5997709466373,40.5997236300598,40.5996314077965,40.5995919737743,40.5995462699792,40.5994873607295,40.5994079784734,40.59935143784,40.5993194271469,40.5992972562638,40.5992825500439,40.5992625908603,40.5992563726535,40.599256395234,40.5992372905877,40.5992131489283,40.5991843045926,40.599151157044,40.5991141653402,40.5990738417756,40.5990267866877,40.5989772150616,40.598942525587,40.598907313339,40.5988621594686,40.5988169429464,40.5986821322895,40.5985311442433,40.5984700288139,40.5984364095949,40.5984039198478,40.5983729301851,40.5983436412748,40.5983211795595,40.5983003920404,40.5981326985602,40.5980415608577,40.5980168104071,40.5979899727753,40.5979919354542,40.5979995464564,40.5979994131328,40.5979912376149,40.5979850038498,40.5979693712896,40.5979126930234,40.5977788783992,40.597753037447,40.5975984842237,40.5974873336222,40.5973260740733,40.5973133912108,40.597303794157,40.5972975699899,40.5972949048939,40.5972968808771,40.5972974864517,40.5972960872293,40.5972921345335,40.597284508767,40.597273739042,40.5972328164508,40.5972125702059,40.5972008594102,40.5971778673011,40.5971632334282,40.597146756981,40.5970583724239,40.5969890144701,40.5969287014635,40.5969123469222,40.5968976272469,40.5968852078265,40.5968805657023,40.5968784748198,40.5968780925888,40.5968774991027,40.596895243928,40.596918168069,40.597274655881,40.5972893876543,40.5972980040343,40.5973158993706,40.5973297085101,40.5973624681423,40.597372167384,40.5973871496385,40.5974156669729,40.5974328796455,40.5974845429139,40.5975176168925,40.5975400700483,40.5976010395486,40.597638006057,40.5976493993236,40.5976641848445,40.5976757000955,40.5976886665771,40.5977187311035,40.5977304185367,40.5977420917252,40.5977534086386,40.5977640376856,40.5977655887762,40.5977673991255,40.597769419861,40.5977715964309,40.5977740068198,40.5977764530816,40.5977788611241,40.5977811580127,40.5977832741794,40.5977849140382,40.597786332253,40.597965525772,40.5979663434797,40.5979667716691,40.5979668025768,40.5979662925281,40.59796519083,40.5979635278922,40.5979613496162,40.5979552132238,40.5979478882855,40.5979573644318,40.5979715520258,40.5979786632985,40.5979854808494,40.5979944775467,40.5980001463081,40.5980213984203,40.5980333767665,40.598062701015,40.5980685833062,40.5980734639839,40.5980858235392,40.5980971312848,40.5981076284765,40.5981184907547,40.5981262597951,40.5981402113894,40.598147221539,40.5981565432318,40.59816546993,40.5981747701888,40.5981846613742,40.598199569973,40.5982155967538,40.5982325557178,40.5982502828109,40.5982591558163,40.5983119270785,40.5983355563149,40.5983501186613,40.5983623664178,40.5983721094676,40.598379520981,40.5983866030596,40.5984066361466,40.5984149433295,40.5984473756421,40.598458184739,40.598475917017,40.5984840852972,40.5985681612953,40.5986146769899,40.5986611926825,40.5987248406387,40.598761885753,40.5988124043614,40.5988383913745,40.5988669706983,40.5989127630739,40.598928237102,40.5989306324333,40.5991650865629,40.5992462054408,40.5992741572256,40.5993511830732,40.5993757980447,40.5995769592531,40.5995951436871,40.5996375960745,40.5996535964618,40.5996913992329,40.599718252659,40.5997391840722,40.5997541029503,40.5997870943084,40.5998782761448,40.5998828191457,40.599905877546,40.6001671345175,40.6004945855035,40.6005710048204,40.6006416836353,40.6009280048512,40.6009481054813,40.6009850964664,40.6010408886804,40.6010624997603,40.6010837085876,40.6010903641284,40.6010975987434,40.601104920507,40.6011055551897,40.601119792138,40.601124432577,40.6011511439445,40.6011609963748,40.6012115274146,40.6012376613566,40.6012821123771,40.6013116916962,40.6013234495571,40.6013342775433,40.6013536616457,40.6013706252012,40.6013789705743,40.6013943239049,40.6014093244368,40.6014241100889,40.6014398916776,40.60145668312,40.6015126449037,40.6015612900155,40.6016068517456,40.6016484531431,40.6016580738123,40.6016579219191,40.6016507963554,40.6016488210103,40.6016506009676,40.6016577999187,40.6016821575847,40.6016903848733,40.6016967776877,40.6017010029813,40.6017186677901,40.601744487092,40.6017324011085,40.6017044096301,40.6016726490291,40.6016429835801,40.6016161047659,40.6015926391139,40.6015707641263,40.6015477840523,40.6015352593102,40.6015227082246,40.6014991133429,40.6014620652281,40.6014232782895,40.6013836319982,40.601344025309,40.6013053562772,40.6012685016958,40.6012342972151,40.6012217173323,40.6011797507654,40.601136034464,40.6010908297549,40.6010400438725,40.6010337025471,40.6010298060886,40.601025701323,40.6010213531357,40.6010123214131,40.6009858681618,40.6009634259351,40.6009706511074,40.6009967434706,40.6009977275166,40.6009802037598,40.6009877038508,40.6009708900614,40.6009680638228,40.6009529010466,40.6009480855645,40.6009305437062,40.6009293980012,40.6009581651908,40.6009497903433,40.6008457853707,40.6008507967633,40.6008376563496,40.600831744885,40.6007873055887,40.6007437831095,40.600701787632,40.6006619079312,40.600624703118,40.6005973177397,40.6005679435823,40.6005367143761,40.6005198692626,40.600496272424,40.6004724424328,40.6004657697985,40.6004591632641,40.6004527896213,40.6004468097816,40.6004365968381,40.6004264195305,40.600416537092,40.6004072012449,40.6003986497888,40.6003911005434,40.6003847458004,40.6003797474256,40.6003606880958,40.6003552258849,40.6003490800043,40.6003392638513,40.6003283711035,40.6003166125903,40.6003042158983,40.600290272912,40.6002765067902,40.6002643734056,40.6002530483973,40.6002529148241,40.6002423043204,40.6002331798232,40.6002234910496,40.6002153670482,40.6002062194048,40.6001755099674,40.6001470064796,40.6001447454859,40.6001387189898,40.6001316912957,40.6001238587495,40.6001154401835,40.6001066708027,40.6000977956133,40.6000890625778,40.6000807156866,40.6000639301605,40.6000472438499,40.6000310784743,40.6000158425869,40.6000019212498,40.5999824966693,40.599957291565,40.5999334212332,40.5999079574402,40.5998813817926,40.5998406216842,40.5997992140534,40.599757766234,40.5997168861479,40.5996771733891,40.5996450565034,40.5996145159248,40.5996132649924,40.5996121128466,40.5996115632129,40.5996110408924,40.5996105353536,40.5996100583218,40.5996095975679,40.5996091646527,40.5996083528288,40.5996076204781,40.5996069688238,40.5996058889295,40.5996050395646,40.5996029581601,40.599601252321,40.5996005538581,40.5995997562928,40.5995988524155,40.5995978498719,40.5995973085734,40.599596731088,40.5995961363628,40.599595505445,40.599594171775,40.5995934502353,40.5995927124394,40.599565390896,40.5995037903333,40.5994758407982,40.5994594170374,40.5994089238522,40.5993931062191,40.5993792918241,40.5993711147147,40.5993548837441,40.5993476617447,40.599327867608,40.5993036104585,40.5993020628878,40.5993005859604,40.5992991887006,40.5992978463351,40.5992965741075,40.5992953557483,40.5992942004678,40.5992930896488,40.5992910628955,40.5992891154147,40.5992822170899,40.5992803958927,40.5992785494978,40.5992761076476,40.5992747990743,40.5992734356789,40.599271992829,40.5992704780679,40.5992688920157,40.5992672159579,40.5992504580525,40.5992322848915,40.5992123613647,40.5991874776738,40.5991176180657,40.5990799888576,40.5990541390167,40.5990303057488,40.5990191588223,40.5990083975521,40.5990067502818,40.5990052182405,40.5990037850566,40.59900245018,40.5990012047317,40.5990000669731,40.5989980241586,40.5989964566807,40.5989950593138,40.5989907584061,40.5989882789479,40.5989865043297,40.5989844614441,40.5989833316626,40.5989821314332,40.5989808411314,40.5989794704786,40.5989745842922,40.5989688171744,40.5989492313587,40.5989424562119,40.5989363361839,40.598933684965,40.5989312670558,40.5989161434567,40.5989008257834,40.5988679489345,40.598837405487,40.5988080509908,40.5988033661099,40.5987990284116,40.5987838764833,40.5987796040252,40.5987749469972,40.5987612604115,40.5987547682259,40.5987451342628,40.5987264795452,40.5987050865313,40.5986701539815,40.5986284944356,40.5984093259551,40.5983845657121,40.5983230611528,40.5983149108333,40.5983054144991,40.5982669243212,40.598258733563,40.5982517383076,40.5982441288288,40.598240767899,40.598237675591,40.5982348359908,40.598232246921,40.5982298912694,40.5981897663935,40.5981531235774,40.5981204732615,40.5980922702695,40.5980785226842,40.5980697932888,40.5980662417382,40.5980679329881,40.5980666312178,40.5980613073236,40.598052079454,40.5980391523948,40.5980228130246,40.5980034239481,40.5979834122978,40.597961585137,40.5979383467383,40.5979013620689,40.5978985221001,40.5978958234117,40.5978909234642,40.5978867575721,40.5978834451578,40.5978810816743,40.5978797736721,40.5978795939785,40.5978805418657,40.5978857176467,40.5979005988177,40.5979059686311,40.5979166307805,40.597920675154,40.597922222589,40.5979208973403,40.597917399465,40.597912010148,40.597900700893,40.597895982627,40.5978933022206,40.5978925876066,40.5978938375394,40.5978947728905,40.5979074338172,40.5979163785688,40.5979230808129,40.5979239915913,40.5979209705357,40.5979206059491,40.5979220111739,40.5979255519033,40.5979343809342,40.5979588427041,40.5979735917071,40.5979815770396,40.5979911064357,40.598004663105,40.5980208500403,40.5980547586218,40.5980968363644,40.5981243525349,40.598198664117,40.5982692893636,40.5982732595206,40.5982802470394,40.5982863847963,40.5982915655144,40.5982957152988,40.598298728552,40.5983005554951,40.5983011437525,40.5983033879495,40.5983015553037,40.5982956859889,40.5982859086668,40.598272437667,40.5982413795643,40.5982152738032,40.5981948021743,40.5981804993243,40.5981727387926,40.5981717232565,40.5981638857711,40.5981534200499,40.5981406312107,40.5981258920992,40.5981144750637,40.5981053271297,40.5980987209186,40.5980948533049,40.5980938395489,40.5980957098619,40.5980900923544,40.5980910941489,40.598098701011,40.5981128048555,40.5981187605,40.5981184935092,40.5981195426479,40.5981217246807,40.5981235024957,40.5981262516668,40.598134829805,40.5981448727169,40.5981749875617,40.5981906112212,40.59821925586,40.5982279940189,40.5982441359537,40.5982496356668,40.5982538083663,40.5982565919645,40.5982579152545,40.5982577699525,40.5982561383568,40.5982530568145,40.5982486271733,40.5982323518771,40.5982173302197,40.5981956317751,40.5981814997358,40.5981597288867,40.5981346194214,40.5981095000169,40.5980826072469,40.5980608404326,40.5980069270213,40.5979844668442,40.5979530876552,40.59793333602,40.5979166453696,40.5979030975595,40.5978984578491,40.59789191774,40.5978869575395,40.5978766051154,40.5978491038118,40.5978384022191,40.5978247915716,40.5978214222762,40.5978198860332,40.5978202080933,40.5978211048328,40.5978224878517,40.5978243594748,40.5978267273884,40.5978295916095,40.597832952455,40.5978459701097,40.5978614118691,40.5979105167755,40.5979832459386,40.5980038955986,40.5980450542841,40.5980472395371,40.5980493879814,40.5980536658078,40.598067905521,40.5980713017622,40.5980746272969,40.5980996437194,40.5981152478049,40.5981227510727,40.5981297994872,40.5981331851224,40.5981364816047,40.5981397063815,40.5981428420077,40.5981456999867,40.598148450411,40.5981536635862,40.5981585119211,40.5981631013644,40.5981702564291,40.5981864549175,40.5981972786773,40.5982206109065,40.5982333586645,40.5982363507513,40.5982398282654,40.5982483589962,40.5982591585469,40.5982932368053,40.5983027756006,40.5983066769111,40.598310074007,40.5983222798472,40.5983324442907,40.5983403505552,40.5983458516285,40.5983568801229,40.598360182656,40.5983621483689,40.5983619476023,40.5983587293137,40.598359006133,40.5983603632109,40.5983628125384,40.5983772562402,40.5983799926368,40.5983817546037,40.5983853723666,40.5983885496602,40.5983889963888,40.598391864054,40.5983945309999,40.5983970564108,40.5984430970046,40.598467764332,40.5984530095378,40.5984856042229,40.5984950960563,40.5985000180128,40.5985042119415,40.5985076875358,40.5985104285667,40.5985137110602,40.5985140396275,40.5985092759211,40.5985057101693,40.5985043913693,40.5985035286021,40.5985038441373,40.5985046922717,40.5985060801571,40.5985080446949,40.5985257941773,40.5985289051608,40.5985311594539,40.5985615467694,40.5986143728705,40.5986209903948,40.598632684077,40.5986401310263,40.598646855371,40.598655554471,40.5986930911348,40.5987072237528,40.598747036401,40.5987637845456,40.5987837736449,40.5988054674373,40.5988206660288,40.5988554976841,40.5988969863136,40.5989597854721,40.5989633106254,40.5989697636997,40.5989780187239,40.5989842233328,40.598988107858,40.5989894967096,40.5989883893352,40.5989848021283,40.5989821201274,40.598978851724,40.598968259781,40.5989541926018,40.5989365139936,40.5988972923201,40.5988811117025,40.5988656487463,40.5988538321252,40.5988414128369,40.5988322758317,40.5988204518004,40.5988130801013,40.598811217283,40.5988105422483,40.5988124395103,40.5988184999601,40.5988287058459,40.5988429757828,40.5988575991251,40.5988748533372,40.598894090547,40.5989147678632,40.598929791336,40.5989458574866,40.59898153279,40.5990224977664,40.5990746620595,40.5990911826447,40.5991097704341,40.5991704810894,40.5991919838633,40.5992123394099,40.5992304670443,40.5992435626503,40.5992572858428,40.5992718616829,40.5993140789233,40.5993280385551,40.5993411548739,40.5993661615132,40.5993932424076,40.5994224520738,40.5994539682878,40.5994817687655,40.5995123230506,40.5995410456359,40.5996075182415,40.5996398591226,40.5996693454677,40.5996965730287,40.5997918090883,40.5998958094734,40.6000002559782,40.6000643531084,40.6000860294105,40.6001335097871,40.6001540765726,40.6001592279481,40.6001645400294,40.6001759442686,40.600219057798,40.6002288309032,40.6002377339777,40.6002558059772,40.6002756294165,40.6003645980266,40.6003858091471,40.6004048458983,40.6004550426204,40.6005018662269,40.6005460285474,40.6005878632996,40.6007493055454,40.6011523082857,40.6012104189019,40.6012926913032,40.6015355022549,40.6015817158007,40.6016259306884,40.6016561154448,40.6016823250725,40.601724552308,40.6017586924878,40.6018109160963,40.6018691043117,40.6019232950375,40.6019453186211,40.6019372198546,40.6018949880068,40.6018547371841,40.6018687309816,40.6018968224347,40.6019309357944,40.6020031795091,40.6020713955177,40.6021435977633,40.6022821125802,40.6023583419665,40.6024887789217,40.6025550488811,40.6026192680247,40.6026734861485,40.6027488233251,40.6027912471702,40.6028378093233,40.6028881753317,40.6029419834188,40.6029676555915,40.6029918177192,40.6030186900913,40.6030447518098,40.6030643672582,40.6030774444882,40.6030870368777,40.6030925901552,40.6030895475108,40.6030865422867,40.6030859342198,40.6030865235322,40.6030916050622,40.6030932819696,40.6030951133272,40.6030982815781,40.6031020292477,40.6031232656214,40.6031296205465,40.6031325077352,40.6031352398153,40.6031872357815,40.6032444706279,40.6033084136993,40.6033881679418,40.6034284573696,40.6034721753094,40.6035786235713,40.6037190238181,40.6043290684803,40.6043786207127,40.6044296752213,40.6044813160308,40.6045326166448,40.6045826566684,40.6046305383211,40.6046754025447,40.6047148678091,40.6047563002899,40.6047985413537,40.6048404097535,40.6048807346613,40.6049183884102,40.6049523180291,40.6049902630591,40.6050246478547,40.6050551574579,40.6050815124061,40.6051034712922,40.6051047779861,40.6051076486908,40.6051119992016,40.6051177019081,40.6051245895366,40.6051324600567,40.6051410826076,40.6051502042696,40.6051595574826,40.6051688678946,40.6051989272118,40.6052273220786,40.6052535840484,40.6052772798617,40.605289404609,40.6053036004284,40.6053195057121,40.6053367153074,40.6053547908362,40.6053732718628,40.6053916876216,40.6054095690092,40.6054264605339,40.6054419319185,40.6054943082093,40.60554793362,40.605602163424,40.6056563456266,40.6057098288038,40.6057619699345,40.6058292552377,40.6058994844263,40.6059721925587,40.6060468982802,40.60612310701,40.6062003142149,40.6062780087496,40.6063556762408,40.6064328024924,40.6065088768898,40.6065833957807,40.6066740904189,40.6067664172174,40.6068600137819,40.6069545127322,40.6070495431448,40.6071447320084,40.6071868929535,40.6072287921319,40.6072692269211,40.6073070367285,40.6073411363039,40.6074123838324,40.6074875698503,40.6075022998891,40.6075183341151,40.6075352721433,40.6075526910201,40.6075701557844,40.6075872303289,40.6076034882899,40.6076185236944,40.6076615061503,40.6077060966221,40.607751555447,40.6077971285566,40.6078420599851,40.6078856044095,40.607927039513,40.6079656779671,40.6080008788331,40.6080320581943,40.6082037237727,40.6082338001608,40.6082620607915,40.6082877099493,40.6083100254474,40.608328378962,40.608342253724,40.6083512590696,40.6083551414403,40.6083675021363,40.6083830749403,40.608401457738,40.6084221758571,40.6084446943225,40.6084684316712,40.6084927749659,40.608517095622,40.6085407656389,40.6085665796937,40.6085956990998,40.6086272825974,40.6086604177379,40.6086941472444,40.6089686276572,40.6089945011106,40.6090198827175,40.6090441723943,40.6090667958723,40.6090799111291,40.6091036545422,40.6091290055909,40.6091553429507,40.6091820211234,40.6092083862569,40.6092337921707,40.6092590663547,40.6093247854488,40.6093915529849,40.6094711145646,40.6095371399296,40.6095783250385,40.6096155500766,40.6096484527523,40.609661665476,40.6096747464454,40.6097008737563,40.609727394026,40.6097579644211,40.6097842874701,40.6098430207667,40.6098728297173,40.6098962480708,40.60994953965,40.6099695276125,40.6100058737796,40.61003699686,40.6100641886718,40.6100878759208,40.6100921671808,40.6101459271957,40.6101955395373,40.6102409137347,40.6102460590994,40.6102495635538,40.6102513398472,40.6102513437547,40.6102495751791,40.610246078153,40.6102409397423,40.610234287879,40.6102262881755,40.6102144602025,40.6102038932812,40.6101948815023,40.6101876756752,40.6101824763469,40.6101794282213,40.6101786161315,40.6101800626789,40.6101813050339,40.6101808800597,40.6101788000874,40.6101751254701,40.6101699628316,40.6101649422716,40.6101614862413,40.6101596620308,40.6101595051578,40.6101610186769,40.6101688205996,40.6101793658141,40.610192215086,40.6102155209626,40.6102724082369,40.6102851131331,40.6102958008642,40.6103113086544,40.610325926152,40.6103400029402,40.6103554229794,40.6103739638291,40.610384059749,40.610389935585,40.6103911643844,40.6103912760754,40.6103908380735,40.6103898772077,40.6103863382058,40.6103694171837,40.6103645918175,40.6103618979913,40.6103614241494,40.6103615082784,40.6103649897657,40.6103703006878,40.6103790581472,40.6103841607157,40.6103898365992,40.610417525963,40.6104716969478,40.6104925283093,40.6105642277739,40.6105644446632,40.6106294732955,40.6107305468637,40.6107990015256,40.6108241748703,40.6108242442096,40.6108454270821,40.6108702077619,40.6109000728021,40.6109167254659,40.6109565816859,40.6109760708075,40.6109919110331,40.6110302663094,40.6110413988056,40.6110517778939,40.6111286211074,40.6112118654054,40.6112342999198,40.6112540522691,40.6112855723171,40.6113490109366,40.6114389099016,40.611446720271,40.6114542451632,40.6114684025424,40.6114812277997,40.611491645074,40.6114923783851,40.611497664584,40.6115016767503,40.6115044208657,40.6115058909897,40.6115063175627,40.6114685473993,40.6114241827805,40.6113733427201,40.6113161636028,40.611297436594,40.6112737392448,40.6112453052078,40.6112124148386,40.6111753924309,40.6111346030192,40.6110904487791,40.6110630135697,40.6110515124857,40.6110396491578,40.6110145638331,40.6109873146042,40.6109538547621,40.6109018845272,40.6107855246141,40.6107308695916,40.6106719662981,40.610618368631,40.6104631195924,40.610416279021,40.6103305865243,40.6102954911778,40.6102601656504,40.6102293741069,40.6102006435311,40.610173425322,40.6101715251035,40.610169635012,40.6101677899922,40.610165963287,40.6101641922557,40.6101624569166,40.6101591613207,40.6101561198476,40.6101534500885,40.6101512229847,40.6101495281085,40.6101479870397,40.6101482199846,40.6101491273411,40.6101506536152,40.6101527629458,40.6101540373812,40.6101554375502,40.6101569721162,40.6101586230101,40.6101993839074,40.6102967359804,40.6107531480085,40.6107826991548,40.6108098020204,40.6109170832587,40.6109594606527,40.6110021851739,40.611039478988,40.6110695824474,40.6111427050835,40.6111773566863,40.6112217864047,40.6112562224755,40.6112843094683,40.6113163705215,40.611352342874,40.6114078409331,40.6114325832407,40.6114602758811,40.6115499635302,40.6115816813036,40.6116116819147,40.6116386970495,40.6116730243931,40.6117479388171,40.6117792831629,40.6119371976796,40.6120410496114,40.6120802707903,40.6120949024519,40.6121025008008,40.6121091718367,40.6121150353611,40.6121201517537,40.6121227897051,40.6121237390188,40.6121244356997,40.6121248815888,40.6121250743443,40.6121250245415,40.612124730962,40.612124185441,40.6121233884629,40.6121210463684,40.6121177042228,40.6121133442896,40.6120913646664,40.6120431888256,40.6120284721626,40.6119733218252,40.6119256939623,40.6119022141275,40.6118428557159,40.6118161632496,40.6118153628599,40.6118146620733,40.611814051047,40.6118135396437,40.6118131186498,40.611812796562,40.6118125829765,40.6118124689445,40.6118125473608,40.6118130416338,40.6118139402805,40.6118151997799,40.611818601295,40.6118205700375,40.6118226376791,40.6118246953324,40.6118257227408,40.6118267415883,40.6118277333099,40.6118287152759,40.6118296699464,40.6118305969594,40.6118650725751,40.6119024743539,40.6119431444445,40.6120024491399,40.6120244255441,40.6120788555258,40.6120949471474,40.6121099043302,40.6121270670459,40.6121463603623,40.6122128602025,40.6122383554909,40.6123494757717,40.6124480269106,40.6124788740137,40.612507698109,40.612572515344,40.6126438897157,40.6127398654317,40.6128576209622,40.6129076403964,40.6129541305059,40.6130119416599,40.6131197112704,40.6131637692263,40.6132465682482,40.6134028207041,40.6134650407057,40.6135284339488,40.6135844465155,40.6136079648309,40.6136256473834,40.613645693345,40.6136623134987,40.6136750663063,40.6136836129709,40.6136877264379,40.6136872974271,40.6136823373357,40.6136729779358,40.6136594678736,40.6136421660634,40.6136209761698,40.6136021262392,40.6135861789766,40.6135736104366,40.6135647958127,40.613559998237,40.6135593609257,40.6135629029036,40.6135705184364,40.6136682749388,40.6137598150438,40.6138450371385,40.6139238466224,40.6139456448036,40.6139610499548,40.6139699118447,40.6139721440516,40.6139677248071,40.6139566972077,40.6139391687951,40.6139358557142,40.613936609702,40.6139414084791,40.6139501102479,40.6139624578825,40.6139780865263,40.6139880977648,40.6139945757305,40.6139973275647,40.6139962713411,40.6139914385051,40.6139829729375,40.6139711266706,40.6139727671951,40.6139772647998,40.6139845253719,40.6139943969832,40.6140097984814,40.6140210112379,40.6140278088977,40.6140300542345,40.614027701921,40.6140446820724,40.6140633065312,40.6140631762379,40.6140620130865,40.6140592555852,40.6140430326652,40.6140311703792,40.6140299293498,40.6140278249318,40.6140208908252,40.6140122240205,40.6139901480129,40.6139813784606,40.6139759829058,40.6139734170439,40.613972180601,40.6139725433709,40.6139745250759,40.6139781153769,40.6139833141791,40.6139901839315,40.6139988124728,40.6140094498718,40.6140263126721,40.6140393388436,40.6140524131967,40.6140658321102,40.6141617621662,40.6142006168815,40.61421360803,40.6142241657018,40.6142271484735,40.6142286534593,40.6142286784853,40.6142272434622,40.6142211393147,40.6142043617243,40.6141984890465,40.6141947676473,40.6141944747264,40.6141997606812,40.6142181886473,40.6142211406185,40.614222404166,40.6142214030904,40.6142140422662,40.6142138114722,40.6142153085681,40.614219207089,40.614221131702,40.6142244527644,40.6142391903748,40.6142498206648,40.6142765086412,40.6142864133874,40.6142945424067,40.6143004155808,40.6143040250803,40.6143053518329,40.6143045380864,40.6143018521245,40.6142973203464,40.614290961924,40.6142607781354,40.6142546549475]}],[{"lng":[-73.8201734801783,-73.8174981097033,-73.8165268124436,-73.8165551962293,-73.8165752774288,-73.8165868764074,-73.8165898894192,-73.8165842895348,-73.8165701268807,-73.8165475281902,-73.8165166956687,-73.8164779051836,-73.8164315037957,-73.8162336668465,-73.8161412617741,-73.8159841242866,-73.8158269667421,-73.815697634774,-73.8155499467557,-73.8153834930926,-73.8152355516727,-73.8150691571859,-73.8149583754392,-73.8147181262786,-73.8145884428529,-73.8144403234523,-73.8142092675447,-73.8140806243293,-73.814090115668,-73.8141326807543,-73.814164498977,-73.8144144148853,-73.8146826267649,-73.8148672597213,-73.8148668107361,-73.814857222891,-73.8150419346298,-73.8153563487286,-73.8154952663758,-73.8153570301601,-73.8153665393461,-73.815191435543,-73.8149977606887,-73.814875191593,-73.8147956325532,-73.8148512269952,-73.8148721310775,-73.8150363849463,-73.8152395649453,-73.8152855135111,-73.8152759071431,-73.8153219532688,-73.8154694831705,-73.815608068999,-73.8157190614926,-73.8157842022238,-73.8158860167964,-73.8159876362269,-73.816156266325,-73.8160437533197,-73.8160263669113,-73.8159530191791,-73.8158610634639,-73.8158891422888,-73.8158525845638,-73.8158160289696,-73.8157332911965,-73.8156352254609,-73.8155940547347,-73.8155985877934,-73.8154036618983,-73.8152644549375,-73.8150387432528,-73.8148469963902,-73.8146136462951,-73.8145026156671,-73.8144987682779,-73.8152072079899,-73.8150261538041,-73.8149179451195,-73.8147707379247,-73.814752871105,-73.8147625763954,-73.8148278509591,-73.8148653992228,-73.8149997118507,-73.8149632880443,-73.8150612987873,-73.8152060710554,-73.815227716652,-73.8153414691471,-73.8156155774171,-73.8157417406382,-73.815710058652,-73.815699262256,-73.8155212646286,-73.8155168973556,-73.8154606648321,-73.8155281672229,-73.8155838176452,-73.8155253672366,-73.815708158548,-73.8157272639208,-73.815767515787,-73.8158070389098,-73.8158541676901,-73.8159596200255,-73.8160076436125,-73.8160087598857,-73.8159609357312,-73.8159703204825,-73.8159435785884,-73.8159191721878,-73.8159191394359,-73.8158902628443,-73.8158882977846,-73.8159419972973,-73.8159854852757,-73.8160928425469,-73.8164252992309,-73.8173919210665,-73.8173024484803,-73.8172537059339,-73.8175579235687,-73.817720326387,-73.8183112105431,-73.8184267544185,-73.8184906612075,-73.8189934642394,-73.8192814220164,-73.8197359176564,-73.8201569539572,-73.8202231043504,-73.8202831613501,-73.8203368857146,-73.8203840634335,-73.8204245065798,-73.8204580540579,-73.8204845722455,-73.820509133645,-73.8205256209246,-73.8205338573616,-73.8205337546837,-73.8205253140147,-73.820508625861,-73.8204838691406,-73.8204513092645,-73.8204507977208,-73.8204424432616,-73.8204408472568,-73.8204460563461,-73.8204579182662,-73.8204760863018,-73.8205000294204,-73.8205954478592,-73.8206138122379,-73.8206179603423,-73.820658434813,-73.8206726599183,-73.8207120677811,-73.8207977868963,-73.8209309527333,-73.8210215206314,-73.8210888344679,-73.8212003542905,-73.8214708930779,-73.8219605043601,-73.8223089073945,-73.8226131015319,-73.8231657310365,-73.8233979991554,-73.8241350690591,-73.8254779349812,-73.8257295717259,-73.8261186078163,-73.8267810099318,-73.8272522387304,-73.827702185304,-73.8283688983407,-73.8288784131568,-73.8292113972271,-73.8304818247775,-73.8313131857726,-73.8319880604785,-73.8326268830346,-73.833217441063,-73.8337351613081,-73.8342524733578,-73.8347213708108,-73.8348469993175,-73.834455000193,-73.8343960000693,-73.8342009997734,-73.8334899989838,-73.8333609992995,-73.8325081184181,-73.8323936445369,-73.8315410594015,-73.8312607091214,-73.8310800060544,-73.8309569926471,-73.8307600944867,-73.8306285217902,-73.8304967590327,-73.8305046651861,-73.8303892248227,-73.8302656864047,-73.8300517968242,-73.829854229455,-73.8297552219399,-73.8296151518607,-73.8294834182312,-73.8293519572508,-73.8292699442463,-73.8292127677906,-73.8290977742234,-73.8289168177293,-73.8287440863918,-73.8285715645375,-73.8283249018501,-73.8280615967543,-73.827946103696,-73.8278471090353,-73.827846915053,-73.8276327319441,-73.8274268880005,-73.8272209299851,-73.8271301912551,-73.8270970627869,-73.8271708479069,-73.8271031449313,-73.8270781007883,-73.8270513387313,-73.8270235696169,-73.8269955310509,-73.8269679677962,-73.8269416119906,-73.8269171637001,-73.8268952723238,-73.8268765193449,-73.826861402885,-73.826850324473,-73.8268435783794,-73.8268413437993,-73.8267628710567,-73.8266785732675,-73.8265887389712,-73.826493675662,-73.8263937087364,-73.8262891803794,-73.826271385298,-73.8262463954872,-73.8262145722122,-73.8261763755322,-73.8261323576501,-73.8261080108119,-73.8260797191137,-73.8260483082057,-73.8260146947694,-73.8259798597652,-73.8259448198041,-73.8259105974784,-73.8258781915185,-73.8258485476457,-73.8258772397746,-73.825898537817,-73.8259122021743,-73.8259180791333,-73.8259161025944,-73.8259062948145,-73.825888766156,-73.8258637138438,-73.8258314197458,-73.8257922472013,-73.8257618664088,-73.8257240013218,-73.8256788716729,-73.8256267393438,-73.825567906846,-73.8255027155645,-73.8254315437771,-73.8253548044591,-73.8252729428871,-73.8251864340553,-73.8251336039631,-73.8250761076771,-73.8250145832148,-73.82494971329,-73.824882217737,-73.824812845524,-73.824742366442,-73.8246542059728,-73.8245680497674,-73.8244845126566,-73.8244232449058,-73.8243672913632,-73.82431733671,-73.8242739922261,-73.8242377883096,-73.8242091679865,-73.8241884814887,-73.8240341420486,-73.823958710583,-73.8240594485754,-73.8241007139487,-73.8241847190072,-73.8242702601019,-73.8243464084565,-73.8245227127641,-73.8245370242063,-73.8246136348815,-73.824617199115,-73.8246190135313,-73.8246368464132,-73.8246388130141,-73.8246517839903,-73.8246632500265,-73.8246844380112,-73.8246973900064,-73.8247046036449,-73.8247065871479,-73.8247177746559,-73.8247277308939,-73.8247429240798,-73.8247476101533,-73.8247490756407,-73.8247708899249,-73.8247690885738,-73.8247480693571,-73.8247464666553,-73.8247324778651,-73.8247145596044,-73.8247043075619,-73.8247021648593,-73.8246832374592,-73.8246817915681,-73.8246801991926,-73.8246606878445,-73.8246583674264,-73.8246410901693,-73.824638945229,-73.8246221269015,-73.8246202842304,-73.8246030301602,-73.8246017460211,-73.8245838769644,-73.8245820068512,-73.8245650238147,-73.8245631747242,-73.824545805942,-73.8245440402754,-73.8245056312336,-73.8245033964212,-73.8244880556901,-73.8245308425857,-73.8245262485854,-73.8244769096061,-73.8244562947674,-73.8243900431506,-73.8243943163887,-73.8244671334376,-73.8245021227419,-73.8245173365546,-73.8243625589612,-73.8243547208029,-73.8243382407657,-73.824225851978,-73.8241734059545,-73.8241274901203,-73.8240779135502,-73.8240698418146,-73.8241085473059,-73.8242187037736,-73.8241859569915,-73.8241656988867,-73.824113882606,-73.8240711620784,-73.8240135817074,-73.8237932359373,-73.8237661228125,-73.8236175934878,-73.8231735613632,-73.8231669276735,-73.8231733730621,-73.8231737671854,-73.8231840819635,-73.8231801596429,-73.8231174097478,-73.8231178997717,-73.8231329439959,-73.8231338437416,-73.8231476032341,-73.8231529315943,-73.8230319516688,-73.8230040388377,-73.8230401256699,-73.8230400784937,-73.8229275781121,-73.8229361266005,-73.822978576463,-73.8230043648485,-73.8225763895636,-73.8225581324748,-73.822358922475,-73.8222883413144,-73.8221598125493,-73.8221417494074,-73.8221272696694,-73.8221128243731,-73.8219444175979,-73.8219063676653,-73.821802961751,-73.8217194912701,-73.821688592813,-73.821588900132,-73.821469298337,-73.8214692171152,-73.8214763936771,-73.8215900159069,-73.8217315475342,-73.821720742398,-73.8223455555714,-73.8223436228187,-73.8224848917291,-73.8224940410853,-73.8226063190182,-73.822610015198,-73.8231478828971,-73.823153269908,-73.8233090238451,-73.8233192047833,-73.8244364376235,-73.8244070658681,-73.8244521800895,-73.8243038852104,-73.8242976551575,-73.8241386296896,-73.8239890012412,-73.823924147647,-73.8238815004375,-73.8237903313483,-73.8237054426258,-73.8236043123054,-73.8235113029426,-73.8234666688423,-73.8234542357978,-73.8235185703405,-73.8235849835638,-73.8236230301977,-73.8235779976056,-73.8232348581057,-73.8230490629182,-73.8229963974538,-73.8229448474048,-73.8229248115599,-73.8228982402094,-73.8228859757218,-73.8229020152676,-73.8228796737161,-73.8228062773857,-73.8227656347778,-73.8227808979095,-73.822813065482,-73.8229028300363,-73.8228447444166,-73.8228161465416,-73.8227697835931,-73.8227152139278,-73.8226707160534,-73.8225937475773,-73.8225450585255,-73.822532809663,-73.822554726474,-73.82253633148,-73.8224674670248,-73.8224834571986,-73.8226002432249,-73.8226945672187,-73.8227816108923,-73.8229046337765,-73.8226672713203,-73.8223600087623,-73.8222471202005,-73.8222389445715,-73.8221137778033,-73.8217377242458,-73.8216769159647,-73.8215192464308,-73.8212647034285,-73.8211998726974,-73.8212602881281,-73.8211712051778,-73.8211913052347,-73.8210755024073,-73.8208916319941,-73.8208874221989,-73.8209045612608,-73.8208599009043,-73.8202997848072,-73.8200324356358,-73.8200281254085,-73.8199831836803,-73.8199425188838,-73.8199745876944,-73.8199808486382,-73.8199822794736,-73.8198083170342,-73.8196179536215,-73.8199515024194,-73.8204540531979,-73.8205188787713,-73.8204320253512,-73.820434036151,-73.8205028157397,-73.8205759543651,-73.8206893333314,-73.8207604386338,-73.8208227425594,-73.8208784179014,-73.8209522206181,-73.8209814379867,-73.8210438454831,-73.8210840360541,-73.8210286562814,-73.821013912225,-73.8209889300499,-73.8211062794904,-73.8211499519637,-73.8212096026824,-73.8212611978967,-73.8212830585657,-73.821284210529,-73.8212054362442,-73.8210622846741,-73.8207864552559,-73.8206269821821,-73.8205487261035,-73.8204870062156,-73.8205252563745,-73.820558136737,-73.8206342043217,-73.820751279887,-73.8207977738915,-73.8208587850587,-73.8211463708444,-73.8211990301142,-73.8213301025863,-73.8213826812563,-73.8216146008913,-73.8217609852129,-73.8217528051501,-73.8216824113534,-73.8217733991909,-73.8218253133993,-73.8216943459945,-73.82166797839,-73.8217980419999,-73.8218494508058,-73.8218620524135,-73.8220962122128,-73.8223307978119,-73.8225397843014,-73.822735296455,-73.8228923334858,-73.8231948971962,-73.8234483920221,-73.8236954549719,-73.8238249998633,-73.8240041278942,-73.8240192622484,-73.8239480380605,-73.8241032709013,-73.8239953676249,-73.8223496103741,-73.8217647149712,-73.8217020804839,-73.8216392193983,-73.8215706029162,-73.8214160164138,-73.8207589250475,-73.8201734801783],"lat":[40.6151806191388,40.6142141315642,40.6149470096586,40.6148810682363,40.6148133781806,40.614744545093,40.6146751847996,40.614605917841,40.6145373639212,40.6144701363629,40.6144048366205,40.6143420488995,40.6142823349301,40.6142310461986,40.6142449765889,40.6142869582643,40.6143359784349,40.6143428098854,40.6143073781113,40.6143774996556,40.6144335725619,40.614482576347,40.6144612823424,40.614496088552,40.6146296182281,40.6147490386707,40.61470344327,40.6145584092363,40.6144669200998,40.614366290439,40.6142910696408,40.6141014240082,40.6139751578551,40.6140106497528,40.6141725422843,40.6142992262149,40.6143065618144,40.6141733296829,40.6140398151332,40.6139269712749,40.6138284438188,40.6136873855628,40.6135814908631,40.613369848954,40.6131940299813,40.6131307701847,40.6131133204971,40.6129762137494,40.6129835792573,40.6130681188599,40.6132018410488,40.6132511869091,40.613342929511,40.6133290737516,40.6132729416364,40.6130970752989,40.6130198109109,40.6130129348912,40.6129421155098,40.6127596264421,40.612365424464,40.6121682188736,40.6120202569755,40.6118865638109,40.6117457281924,40.6116048932336,40.6114639842352,40.6111956001471,40.6108633572951,40.6106725163296,40.6103848020155,40.6104996381818,40.6107245311143,40.6108190569023,40.6109340738067,40.6110584735055,40.6107354536593,40.6098167335934,40.6093520133115,40.609055392403,40.6088510287802,40.6086327965047,40.6084638800539,40.6082387424955,40.6080205989857,40.607825413339,40.6076405944247,40.6073170302799,40.6070925440703,40.6070495688818,40.6069389908103,40.6066987194458,40.6064652452356,40.6064586277901,40.606457067365,40.6064196423778,40.6064358852173,40.60642813751,40.6061630699451,40.606172902762,40.606407380282,40.606439294196,40.606354262278,40.6063715922188,40.6063664063662,40.6063415563578,40.6062624833535,40.6061948520611,40.6061442589629,40.6061397170653,40.6060743624535,40.606061564613,40.6060615255257,40.606022940603,40.6060253394416,40.6059290343592,40.6059268883734,40.6057335049299,40.6057440932406,40.6052241235739,40.6051581237843,40.6042059210925,40.6039403246919,40.6027857600089,40.6022249997411,40.6013397122124,40.6000840688403,40.5993895594792,40.5982624632439,40.5975296108766,40.5975168432681,40.5968739074053,40.5968018755247,40.5967268060723,40.5966489981189,40.5965687616441,40.5964864163015,40.596402290145,40.5963167183218,40.5962581659621,40.5961979915829,40.5961368402576,40.5960753675303,40.5960142323892,40.5959540902014,40.5958955856883,40.5958393460133,40.5958385739079,40.595808875965,40.5957785272652,40.5957484148598,40.5957194188928,40.5956923868748,40.5956681089122,40.5956026302228,40.5955060752519,40.5953519297354,40.5952714515629,40.595195706171,40.5951705149244,40.5951530065934,40.5951080616107,40.5949411512667,40.5948043391963,40.5947122944406,40.5947253806346,40.5947460164546,40.5947354612374,40.5946801386686,40.5946155131488,40.5946084747445,40.594633056748,40.5950806575843,40.5949521747366,40.595023805634,40.5949212231788,40.5947690025126,40.594814155946,40.5947005508801,40.5948052098815,40.5946621113275,40.5944982903221,40.5944811454442,40.5944086612128,40.5942993846386,40.5942175873874,40.5943560981663,40.5946599196307,40.5950555096457,40.5955429999386,40.5962270003178,40.596464000371,40.5966569999827,40.5969160003652,40.5972360002592,40.5975733114885,40.5978033533824,40.5979510260551,40.5978920461112,40.5977914646544,40.5976470800861,40.5974461583099,40.5974334257242,40.597495928192,40.5976213351738,40.5977340195843,40.5977965350973,40.5978087577316,40.5978711633014,40.5979901416968,40.5980839792985,40.5981339424052,40.5980773196542,40.5979831509758,40.5978263229147,40.5977634552207,40.5977631859695,40.597762928691,40.597681164513,40.5976431782166,40.5976804026488,40.5978118947437,40.5979246012261,40.5979998382635,40.5981249118647,40.5982061087161,40.5983311945707,40.5984313729277,40.598519099662,40.5986132570136,40.5986886855088,40.5986790633816,40.5986726698959,40.5986696748761,40.5986701578761,40.5986741060666,40.5986814145752,40.5986918892727,40.598705251929,40.5987211476035,40.5987391540733,40.5987587930474,40.5987795428719,40.5988008523858,40.5988785239209,40.5989525644663,40.5990227205752,40.5990887520968,40.5991504329984,40.5992075521393,40.5992540617348,40.5992986071926,40.5993405445169,40.5993792674162,40.5994142160696,40.5994334729676,40.5994492901905,40.5994612061354,40.5994688730522,40.5994720671928,40.5994706953407,40.5994647975313,40.5994545458841,40.5994402395789,40.5993881912673,40.5993341192856,40.5992786319782,40.5992223536116,40.5991659173506,40.5991099581345,40.5990551055346,40.59900197667,40.5989511692659,40.5989032549286,40.5988274256747,40.598753579113,40.59868214373,40.5986135340206,40.5985481480826,40.5984863653073,40.5984285441783,40.5983750201912,40.598326103908,40.5982820791545,40.598246143636,40.5982146436001,40.5981879285889,40.5981662950471,40.598149983032,40.5981391735504,40.59813398655,40.5981492467017,40.5981701241343,40.5981964698621,40.5982305579617,40.5982695955786,40.598313105032,40.5983605539206,40.5984113616373,40.5984649064735,40.5985205332262,40.5987579794804,40.5988768966773,40.5988894223304,40.5988973268842,40.598912821907,40.5989259324245,40.5989343375288,40.5989512639906,40.5989122179652,40.5987237900155,40.5987150236107,40.5987105600434,40.5986666967072,40.598661862294,40.5986299595084,40.5986017581672,40.5985533282297,40.5985206859345,40.5985025065854,40.5984975091905,40.5984693129473,40.5984442219945,40.5983989904223,40.5984001553649,40.5983894539726,40.5983918438742,40.5983962773086,40.5984480259439,40.5984519699922,40.598486409141,40.5985305209761,40.5985557619178,40.5985610380064,40.5986070976703,40.5986108322099,40.5986149421271,40.5986653327064,40.5986713243765,40.5987159444568,40.598721482892,40.5987649162205,40.5987696767745,40.5988142359035,40.5988175530379,40.5988637004099,40.5988685306136,40.5989123875315,40.5989171623148,40.5989620204672,40.5989665795994,40.5990657692747,40.5990715419436,40.5991111606835,40.5991194982919,40.5991290272233,40.5991200098234,40.5991158381798,40.5990981130265,40.5990878732852,40.5991074648586,40.5990086626634,40.5989658087331,40.5989504363327,40.5989494680949,40.5989474320493,40.5989335455699,40.5989257315096,40.5989162224715,40.5989092038331,40.5989224812561,40.5989947266152,40.5990744879184,40.5992134253144,40.5992993796671,40.5992853501948,40.5992922598941,40.5994297214814,40.5998512239159,40.6000400708209,40.6000357011257,40.5999780053117,40.6000481138974,40.6000491063751,40.6000628688579,40.6000632119133,40.6000838490282,40.6000794925254,40.6000568848416,40.6000572363534,40.6000421654461,40.6000408757028,40.5999766626497,40.5999305168843,40.6000486009444,40.6000502748515,40.6000680747858,40.6000614281631,40.6000404051602,40.6000437072248,40.5999256193963,40.5998877394415,40.5999415604228,40.5999219221127,40.5998969593224,40.5998650031084,40.5998456445978,40.5998345633988,40.5998235085535,40.5998011559785,40.5998116299336,40.5998616896203,40.5999154088302,40.5999540220076,40.5999773391704,40.5999937227703,40.6000240987552,40.6000503441831,40.6000624297974,40.6000764809963,40.6001252833312,40.6001801000632,40.6002256614078,40.6002355446462,40.6002010401671,40.6002136403655,40.6001860316845,40.6002393292047,40.6002572869374,40.6002699526721,40.6002340888722,40.6003449838522,40.600591124701,40.6007969626885,40.6007851996586,40.6008521012328,40.6008914666527,40.6010019871271,40.6011064839631,40.6012492163682,40.6013431591506,40.60139225096,40.6014782342343,40.6015457711607,40.6016349168996,40.6017579528721,40.6018503423145,40.6019400329957,40.6020320087663,40.6022718957505,40.6022959800764,40.6023449161547,40.6024186674568,40.6025829094679,40.6027980562531,40.6029045822899,40.6029630145758,40.6030030320859,40.6032827830248,40.6039751790459,40.6042026050691,40.604534876444,40.6045810710097,40.6046872685414,40.6048118473668,40.6049410110016,40.6049451785135,40.6049500838798,40.6049869323456,40.6050914097061,40.6051867014867,40.6052389815651,40.6053620659111,40.605432797401,40.6055249828227,40.6055834580221,40.6056851581341,40.6057381027482,40.6057869582263,40.605851276927,40.6061187321218,40.6064692606601,40.606419864154,40.6064230580218,40.6064719561702,40.606720559235,40.6068189088507,40.6069109547069,40.6070028504105,40.6070950401635,40.607144356104,40.6072488143266,40.6072796086807,40.6073827252285,40.6076421535843,40.6077067508682,40.6077812462183,40.6078399697072,40.6085764454725,40.6089236562609,40.6090251697797,40.6092250630896,40.6093357481794,40.6094188599585,40.6095340585779,40.6095603857079,40.6098349587208,40.6104790410643,40.6110058657384,40.6118545573261,40.6119499487245,40.6119871082759,40.6120667870062,40.612133008358,40.6122331408812,40.6122587455675,40.6122876758601,40.6122809922494,40.6122573458201,40.6121099760661,40.6119981364708,40.6119524624709,40.6118965826518,40.6118100390948,40.6117666054449,40.6116930064398,40.6114320680975,40.6113933510174,40.6113624912725,40.6113068569677,40.6112326051185,40.6110969287836,40.6108961349875,40.6107638483698,40.6106334177369,40.6105299952171,40.6104308242089,40.6102243792936,40.6100965022457,40.6099521089638,40.6098573064163,40.6096160596957,40.6094427991465,40.6092310582713,40.6090624110714,40.6088933979355,40.6086847184734,40.6085455449468,40.6084803192278,40.6086157595912,40.608626103067,40.6087151065872,40.6088545024521,40.608963997186,40.6091328903249,40.6092323166074,40.6094016133887,40.6097000968157,40.6098692125685,40.6101580317354,40.6102877032547,40.610228344792,40.61032811416,40.6103370221941,40.610937835616,40.6110930829761,40.6113057648626,40.6114990002824,40.6116317684097,40.6117615321191,40.6118546321536,40.6123260974856,40.6125162775592,40.6142600261963,40.6147644579723,40.6148241913903,40.6148706148947,40.614908690831,40.6150547639347,40.6152326795177,40.6151806191388]}]],[[{"lng":[-73.9322220409448,-73.9311865092941,-73.9304248548829,-73.9298294383552,-73.929653742719,-73.929501137878,-73.9290987825575,-73.928840024146,-73.9285424483301,-73.9264190946264,-73.927740607388,-73.9288720624816,-73.9305463182744,-73.9325673631225,-73.9340816717479,-73.934428914061,-73.9347732805166,-73.9351145970114,-73.9354526909869,-73.9357873915167,-73.9361185293922,-73.9364459372092,-73.9367694494521,-73.9370889025781,-73.9374041350995,-73.9377149876656,-73.9380213031432,-73.938187673069,-73.9383587509563,-73.9385342732395,-73.9387139695089,-73.9388975629274,-73.9390847706579,-73.9392753042979,-73.9394688703237,-73.9396651705429,-73.9398639025531,-73.940064760208,-73.9402674340879,-73.9404716119772,-73.9405577742616,-73.9407354551324,-73.9401297030218,-73.9401280893473,-73.9400847187798,-73.9401421955907,-73.9401906412672,-73.9402300006841,-73.9402602290379,-73.9402812918991,-73.9402931652501,-73.9402958355147,-73.940289299573,-73.9402735647651,-73.9402486488838,-73.9402145801542,-73.9401713972022,-73.9401191490113,-73.9400578948672,-73.9399877042903,-73.9399086569573,-73.9398208426117,-73.9397243609613,-73.9396193215654,-73.9395058437111,-73.9393840562769,-73.9392540975884,-73.9391161152595,-73.9389702660255,-73.938816715566,-73.9386556383159,-73.9368377709958,-73.9366575414854,-73.9364731596412,-73.9362849484168,-73.9360932374764,-73.935898362617,-73.9357006651803,-73.9355004914548,-73.9352981920684,-73.9350941213741,-73.93488863683,-73.9346820983707,-73.9344748677788,-73.9343082755452,-73.9341406541585,-73.9339724824065,-73.9338042406475,-73.9336364094407,-73.9334694681723,-73.9333038936879,-73.9331401589297,-73.9329787315873,-73.9328200727611,-73.932664635646,-73.9325128642372,-73.9323651920627,-73.9322220409448],"lat":[40.5576763419598,40.5570158313271,40.5555833186755,40.5544572271852,40.5541249241835,40.5538409491935,40.5530934450985,40.5524975322778,40.5520049120728,40.548155780823,40.547629297936,40.5470962362139,40.5464259208047,40.5456945539297,40.5451718389553,40.5450772536444,40.5449767367568,40.5448703391151,40.544758114515,40.544640119698,40.5445164143231,40.5443870609358,40.5442521249373,40.5441116745506,40.5439657807865,40.5438145174075,40.5436579608903,40.5435639436714,40.5434749795103,40.5433912054578,40.5433127505685,40.5432397357024,40.5431722733387,40.543110467403,40.5430544131064,40.5430041967997,40.5429598958404,40.542921578473,40.5428893037244,40.5428631213131,40.5418605102404,40.5418339604531,40.5480052923383,40.5495162890124,40.5505459430503,40.5507496094051,40.5509546376585,40.5511607948654,40.551367846796,40.5515755582016,40.5517836930822,40.5519920149544,40.5522002871201,40.5524082729355,40.55261573608,40.5528224408246,40.5530281522999,40.553232636763,40.5534356618632,40.5536369969055,40.5538364131138,40.55403368389,40.5542285850718,40.5544208951878,40.554610395709,40.554796871297,40.5549801100494,40.5551599037397,40.5553360480551,40.555508342828,40.555676592264,40.556781364702,40.5568599287321,40.5569326721707,40.5569994675993,40.5570601980174,40.5571147570482,40.5571630491243,40.5572049896556,40.5572405051776,40.5572695334798,40.5572920237148,40.5573079364878,40.5573172439251,40.5572991547116,40.5572878798398,40.5572834515152,40.5572858823865,40.5572951655103,40.5573112743706,40.5573341629547,40.5573637658846,40.5573999986031,40.5574427576163,40.5574919207881,40.5575473476899,40.5576088800008,40.5576763419598]}],[{"lng":[-73.8636113295238,-73.8644930291127,-73.8645724530018,-73.8666835996215,-73.8663383636396,-73.8652255543476,-73.8645417611104,-73.8644663293313,-73.8653428508824,-73.8643096948521,-73.8631693027943,-73.8630876752873,-73.862868922114,-73.8626737282957,-73.8626760798278,-73.8626839125124,-73.8626935669121,-73.8627042426979,-73.8627141083374,-73.8627735330123,-73.8629592059013,-73.8630048294378,-73.863198836654,-73.8633548259163,-73.8634236098639,-73.863493063602,-73.8635586267797,-73.8637303990016,-73.863876398297,-73.864027918788,-73.8644998105449,-73.864599490949,-73.8647532374843,-73.86482648734,-73.8648457640144,-73.8649546750932,-73.8650892685746,-73.8652553467216,-73.8653782480632,-73.8655375725741,-73.865576083572,-73.8656514519138,-73.8657243816347,-73.8657945321696,-73.8658616070943,-73.8663598437849,-73.8664427551592,-73.8665338659245,-73.8666108929557,-73.8665383219141,-73.8663010507296,-73.8663094123243,-73.8665495589555,-73.8666300571505,-73.8666858040465,-73.8667419788776,-73.866792162326,-73.8668611196514,-73.8668840105985,-73.8669635707924,-73.8670297222431,-73.867091810783,-73.8671429879067,-73.8673262202151,-73.8673813933508,-73.8674257709774,-73.8674742990935,-73.8676523668321,-73.8676877093092,-73.8677087811788,-73.8677506350579,-73.8678531739867,-73.8678815584405,-73.8679236704756,-73.8679724519841,-73.8680745547832,-73.868097824395,-73.8681796931619,-73.8682353121071,-73.8683267709937,-73.8683648423974,-73.8683769037809,-73.8683950442179,-73.8684327244352,-73.868451401221,-73.8684670518855,-73.8684824121516,-73.8684869484588,-73.8684895369912,-73.8683861025469,-73.8682318187936,-73.8682511755017,-73.8684055523222,-73.8685275320511,-73.868549863565,-73.868623218271,-73.8686901563823,-73.8689360528216,-73.8690517579423,-73.8691282463429,-73.8692499643221,-73.8694848895482,-73.8695487239752,-73.8696809502264,-73.8698863945634,-73.8700302879703,-73.8703197307059,-73.8703948097212,-73.8704872406495,-73.8706221481524,-73.8705161185081,-73.8702528539713,-73.8702758846469,-73.8705352486937,-73.870640941506,-73.8706456539157,-73.8706586695132,-73.8706663074306,-73.8707907428892,-73.8709131620648,-73.8709997007495,-73.8711121195577,-73.8711624983262,-73.8712415182737,-73.8712898277122,-73.871362894894,-73.8714454347018,-73.8716022504034,-73.8717026448745,-73.8718730410604,-73.8723261708997,-73.8725083117448,-73.8725776351144,-73.8726397128045,-73.8726467126448,-73.8725874901474,-73.8723787804738,-73.8723986982237,-73.8725687931846,-73.8726088308715,-73.8726625102607,-73.8726667706931,-73.872685834534,-73.8727061484115,-73.8727216588162,-73.8727326631845,-73.8727464978413,-73.8727576187202,-73.8727734264097,-73.8728299825045,-73.8728807659337,-73.8729349313741,-73.8729760045507,-73.8730163007437,-73.8730664610891,-73.8731291017865,-73.8732062803706,-73.8732838499305,-73.8733179928008,-73.8734017852769,-73.8734284915006,-73.8734579941904,-73.873500183962,-73.8735444658861,-73.8735882385913,-73.8736497574944,-73.873727501358,-73.8737735366131,-73.8738206562612,-73.8738909048484,-73.8739526901536,-73.8739320736625,-73.8739467145849,-73.8739681745212,-73.8739945233407,-73.8740390002515,-73.8740898973152,-73.8741155883481,-73.87415824033,-73.8742326006635,-73.8742742014696,-73.8743375801887,-73.8743939610555,-73.8744293747284,-73.8744774075448,-73.8745089757562,-73.8745488906863,-73.874594959928,-73.874606147382,-73.8746204284669,-73.8746232205979,-73.8746046592085,-73.8745989432893,-73.8746190677548,-73.8746380095013,-73.8746887466617,-73.874724852141,-73.8747925621882,-73.8748481345684,-73.874903386451,-73.8749528753117,-73.8749878606346,-73.8750273730929,-73.8750730964324,-73.8751207134788,-73.8751683304187,-73.8751904661137,-73.8752118606167,-73.8752314656925,-73.8752487045967,-73.8752796832832,-73.8752940700634,-73.8753238827349,-73.8752837447079,-73.8752987558433,-73.8753383732131,-73.8753554849568,-73.8753909901523,-73.8754098908836,-73.8754447377146,-73.8754618731102,-73.8754930940936,-73.8755278253067,-73.8755610079745,-73.8755878654712,-73.8756142947204,-73.8756436101384,-73.8756747513537,-73.875703189268,-73.8757337043466,-73.875762559057,-73.8758116871438,-73.8758354497339,-73.8758775351533,-73.8758987918399,-73.8759208219515,-73.8759606213908,-73.8759896264525,-73.8759533805188,-73.8759684141703,-73.8760043473053,-73.876021723435,-73.8760500121257,-73.8760854259758,-73.8761110475568,-73.876150039594,-73.876176641681,-73.876229604878,-73.8762464269039,-73.8762918266537,-73.8763061204558,-73.8763318091073,-73.8763421210658,-73.8763615064249,-73.8763730522169,-73.8763921254408,-73.8764140857242,-73.8764424192696,-73.8764570593083,-73.8764725765806,-73.8764881643388,-73.8765044202692,-73.8765161733708,-73.8765296584527,-73.8765420822694,-73.8765711075602,-73.8765852970514,-73.8766008155932,-73.8766204078742,-73.8766421267241,-73.876649977718,-73.8766332524719,-73.8766500991351,-73.8766654259648,-73.8766789006246,-73.8766951235687,-73.8767144514224,-73.8767336987019,-73.8767771235201,-73.8768009884024,-73.8768270603516,-73.8768530726646,-73.8768668706868,-73.8768950892157,-73.8769087132656,-73.8769479124587,-73.8769633265072,-73.8770081942973,-73.8770238967986,-73.8770383985299,-73.8770531420265,-73.8770684865418,-73.8770851938756,-73.8771011388166,-73.8771163440668,-73.8771314453634,-73.8771470669348,-73.8771635318878,-73.8771783916156,-73.8771921778956,-73.8772225551789,-73.8772488454847,-73.8772355636698,-73.8772531832779,-73.8772661198348,-73.8772755180184,-73.87729857586,-73.8774107679178,-73.8775038056453,-73.8775844299736,-73.877684592334,-73.8777769697276,-73.8778539334365,-73.8779333930285,-73.8779802675992,-73.8780643081606,-73.8781478196826,-73.8782406253741,-73.8783568562458,-73.8784966073044,-73.8786090398963,-73.878720179335,-73.8787917848763,-73.8788923710382,-73.8790539954178,-73.8792251339631,-73.8793827492325,-73.8793881144645,-73.8794076999255,-73.8794279601802,-73.8794489006676,-73.8794707963034,-73.8794954463661,-73.8795226329305,-73.8795499232578,-73.879578777394,-73.8796068754013,-73.8796253672907,-73.879641345249,-73.8796553898528,-73.8796729072942,-73.8796990791223,-73.8797156978585,-73.8797322226706,-73.8797484851916,-73.8797638741584,-73.8797806170285,-73.8797984622318,-73.8798165261773,-73.8798337985224,-73.8798504697368,-73.8798672233611,-73.8798845342442,-73.8799134879176,-73.879925480793,-73.8799497438309,-73.8799743319984,-73.8799988232499,-73.8800265598875,-73.8800564530407,-73.8800853501523,-73.8801144917984,-73.8801388582061,-73.8801608405444,-73.8801862432182,-73.8802143217964,-73.8802410558386,-73.8802664442321,-73.8802816599137,-73.8802852482995,-73.8802887314462,-73.8802913349074,-73.880287319713,-73.88027840928,-73.8802701130248,-73.8802675494022,-73.8802645271851,-73.8802650873212,-73.8802720619761,-73.8802902225468,-73.8803202015873,-73.8803342751083,-73.8803553504257,-73.8803709770919,-73.8803865238183,-73.8803981355584,-73.8804149029379,-73.8804406158269,-73.8804574880567,-73.8804783315629,-73.8805050813086,-73.8805204471406,-73.880535067378,-73.8805518013572,-73.880567898024,-73.8805846655495,-73.8805987405071,-73.8806247182728,-73.8806550328625,-73.8806712254117,-73.880687500168,-73.8807038828735,-73.8807208433217,-73.8807391628092,-73.8807579545786,-73.8807759545183,-73.8807925485915,-73.8808087518941,-73.8808257009109,-73.8808417646691,-73.8808558789195,-73.8808798549296,-73.8809059096621,-73.8809211803021,-73.8809392487336,-73.88095900626,-73.8809780194721,-73.8809968788297,-73.8810128228147,-73.881047698884,-73.8810658172375,-73.8810827662343,-73.881099358105,-73.8811143662928,-73.8811299537612,-73.8811492519276,-73.8811696234928,-73.8811857560227,-73.8812000825893,-73.8812189779924,-73.8812368359078,-73.8812538575203,-73.8812670754167,-73.8812824922131,-73.8813042410815,-73.8813265586235,-73.8813487107849,-73.8813689489703,-73.8813898367189,-73.8814120452841,-73.8814329314113,-73.881451833468,-73.8814729360648,-73.8814958133455,-73.8815191542814,-73.8815320118978,-73.8815547039271,-73.8815754938479,-73.8815965680315,-73.881619259613,-73.8816401884444,-73.8816634567865,-73.8816889926377,-73.8817025356876,-73.8817173773788,-73.8817326092093,-73.8817465881272,-73.8817586184783,-73.8817819212203,-73.8818053790233,-73.881829476463,-73.8818423348379,-73.8818562332559,-73.8818702503476,-73.8818826829409,-73.8818945598807,-73.881906957149,-73.8819210786526,-73.8819349052522,-73.8819483061399,-73.8819612697965,-73.8819745651355,-73.8819875296367,-73.8820005040657,-73.8820360491699,-73.8820588059176,-73.8820819996501,-73.8821070736858,-73.8821216897349,-73.8821362009455,-73.8821491394014,-73.8821604122492,-73.8821830640957,-73.8822061509316,-73.8822294874467,-73.8822556351734,-73.8822820641386,-73.8823092830407,-73.8823345270263,-73.8823526704722,-73.8823707414756,-73.8823851748646,-73.8824158672829,-73.8824162120251,-73.88241602369,-73.8823527124969,-73.882356357125,-73.8823592303983,-73.8823744167974,-73.8823854904356,-73.8823980883645,-73.8824195896144,-73.8824258445805,-73.8824378051493,-73.8824390871065,-73.88245337703,-73.882473283226,-73.8824866815976,-73.8825075025293,-73.8825205700058,-73.8825388835077,-73.8825554023756,-73.8825739413358,-73.8825957505849,-73.882617523669,-73.8826386124801,-73.8826559960189,-73.8826701801523,-73.8826879649602,-73.8827067865281,-73.8827232354037,-73.8827418790111,-73.8827612416815,-73.8827776183866,-73.8828004661791,-73.882826527758,-73.8828490225591,-73.8828762604977,-73.8828964477117,-73.8829164574741,-73.8829396297221,-73.8829583785698,-73.8829787454126,-73.8830090026561,-73.8830277150227,-73.8830503248985,-73.883074475417,-73.8830982621813,-73.8831098264082,-73.8831376495745,-73.8831443819454,-73.8831633133861,-73.8831843371579,-73.8832035325496,-73.8832184047981,-73.8832328032012,-73.8832474156215,-73.8832655270563,-73.8832868896189,-73.8833094351043,-73.8833304664062,-73.8833522544527,-73.8833739347156,-73.8833920132912,-73.8834085789114,-73.8834259028192,-73.8834353998252,-73.8834431569507,-73.8834590395883,-73.8834755738798,-73.8834933725867,-73.883512859152,-73.8835328176367,-73.8835551042597,-73.8835765415392,-73.8835990543216,-73.8836214608744,-73.8836406196835,-73.8836593548208,-73.8836801441924,-73.8837024428477,-73.8837275769731,-73.8837403622964,-73.8837524963408,-73.8837756926996,-73.8838000116076,-73.8838232817823,-73.8838466939579,-73.8838610980943,-73.8838756198105,-73.8838907094268,-73.8839075224937,-73.8839279409055,-73.8839494086169,-73.8839690701959,-73.8839908203671,-73.8840147324752,-73.8840359745521,-73.8840572629733,-73.8841056884477,-73.8841324117759,-73.8841587684461,-73.8841840883877,-73.8842050830723,-73.8842217179733,-73.8842369128128,-73.8842516820894,-73.8842667714668,-73.8842815400791,-73.8842971729714,-73.8843137017091,-73.8843310946315,-73.8843484869369,-73.8843642243774,-73.8843791356449,-73.884393254304,-73.8844074077149,-73.884432064304,-73.8844540744506,-73.8844760727287,-73.884497208574,-73.8845149996423,-73.8845339020197,-73.8845543911888,-73.8845742068728,-73.8845979797353,-73.8846109772309,-73.8846249896923,-73.8846385650166,-73.8846533235087,-73.884670043243,-73.8846861728719,-73.8847019129205,-73.8847169328813,-73.8847314804796,-73.8847440539328,-73.8847553264898,-73.8847749144084,-73.8847911250262,-73.8848041665422,-73.8848168532933,-73.8848360187817,-73.8848580084243,-73.8848843688667,-73.8848567487085,-73.8848294233947,-73.8848263976224,-73.8848273858012,-73.8848380904247,-73.8848594947987,-73.8848824392988,-73.8848970100832,-73.8849071562974,-73.8849203051875,-73.8849443679718,-73.8849511180102,-73.8849770114872,-73.8849938495859,-73.8850127096121,-73.8850292330992,-73.885052271757,-73.8850818267642,-73.8851127779889,-73.8851308835123,-73.8851488156457,-73.8851658160037,-73.8851812879553,-73.8851987482443,-73.8852174405885,-73.885234191288,-73.8852485866231,-73.885273868947,-73.8852964895182,-73.8853141363416,-73.8853301523258,-73.8853466783229,-73.8853632401859,-73.8853837426773,-73.8854083777507,-73.8854327762529,-73.8854530907159,-73.8854753112317,-73.8855030253378,-73.8855166632546,-73.885544272022,-73.8855582775894,-73.8855824162641,-73.8855987165488,-73.8856121055156,-73.8856334022087,-73.8856508311301,-73.8856703865086,-73.8856904900269,-73.8857087077934,-73.885725269898,-73.8857448979587,-73.885760878809,-73.8857769069595,-73.8857941946982,-73.885808948384,-73.8858277852816,-73.8858469176142,-73.8858676248084,-73.88589285466,-73.8859060922695,-73.8859335968961,-73.8859454024234,-73.8859747062489,-73.8859897214488,-73.8860086295033,-73.8860289513432,-73.8860489416346,-73.886071109524,-73.8860849281564,-73.8861110968447,-73.8861485309128,-73.8861686390254,-73.8861858568533,-73.8862028139775,-73.8862211084262,-73.8862390146779,-73.886258910141,-73.8862802386738,-73.8863112404774,-73.8863321055742,-73.8863488510919,-73.8863668606566,-73.8863864258304,-73.8864055634253,-73.8864200715227,-73.8864367477369,-73.8864462444221,-73.8864699178598,-73.8864867816284,-73.8865078600896,-73.8865279565181,-73.8865440262623,-73.8865647027499,-73.8865848475004,-73.8866015938659,-73.8866100866124,-73.8866347787031,-73.8866482329217,-73.8866626455494,-73.8866774017688,-73.8866918027641,-73.8867102525096,-73.8867255881532,-73.8867427356908,-73.8867600242327,-73.8867774205654,-73.8868056866638,-73.8868251081218,-73.886846185617,-73.886865455317,-73.8868821421944,-73.8868951709223,-73.8869077738954,-73.8869215976938,-73.8869350660175,-73.886941273518,-73.8869617068307,-73.8869734857866,-73.8869831680338,-73.8869889206047,-73.886992389675,-73.8869951820822,-73.8869954720765,-73.88695260038,-73.8869503889954,-73.886948337714,-73.8869751080115,-73.8870058914959,-73.8870110333348,-73.8870179748427,-73.8870298901837,-73.8870656347993,-73.8870662133412,-73.8870718299723,-73.8870892452764,-73.887106957488,-73.8871221422342,-73.8871402444857,-73.8871584170819,-73.8871816311594,-73.8871956339974,-73.8872120089976,-73.8872291763723,-73.8872469451602,-73.8872650100889,-73.8872913275863,-73.8873100301024,-73.8873315194377,-73.8873545562877,-73.8873755375107,-73.8873959420781,-73.8874147285442,-73.8874315422127,-73.8874478371795,-73.8874687126093,-73.88750700362,-73.8875304292464,-73.8875517401487,-73.8875717520427,-73.8875931219592,-73.8876117994421,-73.8876286359486,-73.8876464522692,-73.8876609625663,-73.8876688394054,-73.887694250743,-73.887715340571,-73.8877322980817,-73.8877467994364,-73.8877668156752,-73.8877839521201,-73.8878015857729,-73.8878195494186,-73.8878328013095,-73.8878534247632,-73.8878752435507,-73.8878925610638,-73.8879114384691,-73.887924612014,-73.8879417212941,-73.887956019609,-73.8879666430407,-73.8879804093226,-73.8879963271807,-73.8880075300954,-73.8880237288677,-73.8880476087853,-73.8880629579635,-73.8880777536488,-73.8880938236922,-73.8881118307228,-73.8881272377495,-73.8881441672807,-73.8881623105665,-73.8881751281128,-73.8881884555166,-73.888211647912,-73.8882340822326,-73.8882524789828,-73.8882699048499,-73.8882870467544,-73.8883044874913,-73.8883178045346,-73.8883347745588,-73.8883464040058,-73.8883512012762,-73.8883742544533,-73.8883934805102,-73.8884119606611,-73.8884346089272,-73.88845783243,-73.8884743234939,-73.8884859962259,-73.8885001015592,-73.8885149772188,-73.8885450129405,-73.8885604316523,-73.8885751894861,-73.8885881983002,-73.8886016310847,-73.8886153128972,-73.8886414248369,-73.8886634605054,-73.8886823662913,-73.8887056346912,-73.8887209520704,-73.8887338823092,-73.8887475668122,-73.8887635644898,-73.8887786148414,-73.8887944573452,-73.8888118462847,-73.8888287632054,-73.8888431745663,-73.8888687023635,-73.8888852295012,-73.8888989814032,-73.8889137134724,-73.8889297681178,-73.8889482799551,-73.8889653864726,-73.8889816895705,-73.8889987960814,-73.889013421802,-73.8890323617647,-73.8890480627826,-73.8890645955248,-73.8890786000221,-73.8890897309991,-73.8891049044481,-73.8891246028719,-73.8891430729845,-73.8891584235231,-73.8891750585277,-73.8892004497328,-73.8892171555851,-73.8892343340056,-73.8892499294803,-73.8892651940847,-73.8892818246389,-73.8892986791705,-73.8893152723213,-73.8893351879128,-73.8893357193388,-73.8893479348072,-73.8893690002114,-73.8893859216667,-73.8893995335843,-73.8894163621374,-73.8894280985923,-73.8894400605295,-73.8894525648784,-73.8894657189563,-73.8894790396637,-73.8894942887611,-73.8895032919375,-73.8895241314313,-73.8895382113087,-73.8895560022638,-73.8895720265046,-73.8895834926073,-73.8895940851253,-73.8896051399749,-73.8896188399402,-73.8895926256344,-73.8896394754289,-73.8896611473774,-73.8897125166058,-73.8897318305541,-73.8897466592472,-73.8897668465181,-73.8897884365622,-73.8898101675598,-73.8898263876075,-73.8898427264074,-73.889865478567,-73.8898829269558,-73.8899054527058,-73.889925271436,-73.8899436251793,-73.8899607198016,-73.8899782776807,-73.8899949742274,-73.8900149513571,-73.8900308556968,-73.8900474796024,-73.8900652253863,-73.890081670511,-73.8901004563939,-73.8901185943874,-73.8901360577103,-73.8901518210717,-73.8901698816206,-73.8901773299972,-73.8901841301177,-73.8901910691231,-73.8901991642258,-73.8902026414446,-73.8902165355359,-73.8902346475846,-73.8902521813761,-73.8902662296028,-73.8902820358395,-73.8902961529898,-73.8903116045611,-73.8903262178215,-73.8903450480544,-73.8903745457453,-73.8903910013933,-73.8904068778248,-73.8904233318436,-73.8904425142591,-73.8904563463809,-73.8904710289626,-73.8904887144677,-73.8905023585841,-73.8905186377465,-73.8905491641335,-73.8905731470376,-73.8905942578775,-73.8906109979651,-73.890623922959,-73.8906385010502,-73.8906524433935,-73.8906680755493,-73.8906851487941,-73.8907032615922,-73.8907175195228,-73.8907373874058,-73.8907589230427,-73.8907796300435,-73.8907958963037,-73.890810771714,-73.8908220810734,-73.8908394030616,-73.8908549649827,-73.8908764351628,-73.890895160977,-73.8909130138337,-73.8909297671221,-73.8909458232364,-73.8909602596397,-73.8909793874437,-73.8909933173852,-73.8910121648075,-73.8910283640108,-73.8910414440566,-73.8910549491734,-73.8910680882565,-73.891081166934,-73.891095203827,-73.8911128550402,-73.891127766212,-73.8911433968183,-73.8911590875941,-73.8911772826575,-73.8911839104862,-73.8912080377105,-73.8912252541496,-73.8912413125525,-73.8912568743287,-73.8912700469697,-73.8912842374989,-73.8913029974393,-73.891317187949,-73.8913335739666,-73.8913487313569,-73.8913702324131,-73.8913892383485,-73.8914048310546,-73.8914188761831,-73.89143378339,-73.8914519279084,-73.8914656405205,-73.8914818484358,-73.8914949872161,-73.8915086821131,-73.8915194555626,-73.891528464146,-73.8915482632456,-73.8915673155099,-73.8915829777034,-73.8915979927195,-73.891611274634,-73.8916265561547,-73.8916405593407,-73.891654468208,-73.8916682591017,-73.8916861960403,-73.8917023365416,-73.8917141761112,-73.8917278339071,-73.8917436087502,-73.8917559248699,-73.8917676013771,-73.8917822927393,-73.8917923863957,-73.8918033305939,-73.8918173438662,-73.8918248683843,-73.8918516839,-73.8918680976514,-73.8918817012714,-73.8918989829858,-73.8919118009201,-73.8919235482839,-73.8919365147703,-73.8919479345298,-73.8919576292187,-73.8919720052427,-73.8919847962727,-73.8919971957187,-73.8920088620753,-73.8920211869688,-73.8920300739881,-73.8920445263988,-73.8920613433801,-73.8920739176222,-73.8920869968554,-73.8921137369647,-73.8921386439618,-73.8921647132066,-73.8921993963759,-73.8922036773825,-73.8922663713837,-73.8922784885256,-73.8922972985661,-73.8923172563169,-73.8923389548432,-73.8923581722535,-73.8923723831729,-73.8923883154821,-73.8924044341479,-73.8924084923351,-73.8924254928589,-73.8924381085829,-73.8924492860879,-73.8924622591761,-73.8924773962248,-73.8924938408947,-73.8925094594325,-73.892527450993,-73.8925451950121,-73.8925590438621,-73.8925678277281,-73.8925967660423,-73.8926153302368,-73.8926331142013,-73.8926531657461,-73.8926688238802,-73.8926876103423,-73.8927093842571,-73.8927252203909,-73.8927400539467,-73.8927582285079,-73.8927839978274,-73.8928003448394,-73.8928155345823,-73.8928317400362,-73.8928494918879,-73.8928669467291,-73.8928834325399,-73.8929010997339,-73.8929185314161,-73.8929368475022,-73.8929565712635,-73.8929716670592,-73.8929880734527,-73.8930050697284,-73.8930230319097,-73.8930405225727,-73.8930593123053,-73.8930739339635,-73.893089842962,-73.8931056815176,-73.8931259485519,-73.8931518031743,-73.8931680328501,-73.8931848192112,-73.893195304034,-73.893208617608,-73.8932276638708,-73.8932487907422,-73.8932628014221,-73.893278278686,-73.8932950656039,-73.8933127024746,-73.8933274687079,-73.893344027972,-73.8933599024965,-73.8933763219616,-73.8933921620817,-73.8934084728107,-73.8934242426321,-73.8934359490259,-73.8934561458079,-73.8934706505056,-73.8934863536199,-73.8934997967821,-73.8935147869029,-73.8935324277669,-73.8935451768537,-73.8935495519015,-73.8935545879222,-73.8935595172113,-73.8935666552342,-73.8935863145931,-73.893605326364,-73.8936186536995,-73.8936355454666,-73.8936529711883,-73.8936676264106,-73.8936799554251,-73.8936913732919,-73.8937039832919,-73.8937191808248,-73.8937348837495,-73.893747491994,-73.8937616438375,-73.8937800330014,-73.893790294279,-73.8938100857548,-73.8938275574881,-73.8938424217052,-73.8938623446109,-73.893874278906,-73.8938779770227,-73.8938941053767,-73.8939115427708,-73.8939247149953,-73.893940993596,-73.893955253216,-73.893970851267,-73.893985763907,-73.8939977921127,-73.8940138143366,-73.8940258456039,-73.8940413725927,-73.8940541575227,-73.8940704988849,-73.8940831766383,-73.8940999301583,-73.8941148759661,-73.8941270824512,-73.8941434010887,-73.8941543432201,-73.8941671649348,-73.8941843126643,-73.894196672808,-73.8942127656715,-73.8942232836113,-73.8942364721489,-73.8942527089062,-73.8942683052763,-73.8942758664445,-73.8943040279781,-73.8943238969556,-73.8943430567223,-73.8943606231462,-73.8943777294342,-73.8943943294632,-73.8944106466766,-73.894428581734,-73.8944404691671,-73.8944564558038,-73.8944722648734,-73.8944918150637,-73.8945070786952,-73.8945210539847,-73.8945342727724,-73.8945501135455,-73.8945655184921,-73.8945784905098,-73.8945938246094,-73.8946075790644,-73.8946321076485,-73.894647266847,-73.8946646598369,-73.8946797966905,-73.8946951332959,-73.8947109060071,-73.894727835053,-73.8947463352354,-73.8947661476704,-73.8947750431635,-73.8948011434227,-73.8948165296447,-73.894828595949,-73.8948412411335,-73.8948571950491,-73.8948763610932,-73.8948940000281,-73.8949082243786,-73.8949250789311,-73.8949414083753,-73.8949484836621,-73.8949514249942,-73.8949527601394,-73.8949541911714,-73.8949551734091,-73.8949559942491,-73.8949564947503,-73.8949562617203,-73.8948975640329,-73.8948819661663,-73.8948901040065,-73.8948901401568,-73.8949181726639,-73.8949421816391,-73.894955641369,-73.8949663169489,-73.8950173488561,-73.895017937896,-73.8950187996601,-73.8950200025571,-73.8950457120953,-73.8950640624076,-73.8950770760282,-73.8950911347205,-73.8951079724782,-73.8951222108766,-73.8951343949402,-73.8951434505136,-73.8951475330495,-73.8951485267189,-73.8951469283566,-73.8951515915655,-73.8951616465734,-73.8951734041618,-73.8951845869694,-73.8951998276188,-73.8952172056299,-73.8952306441212,-73.8952437064054,-73.8952680546952,-73.8952865163084,-73.8953016634738,-73.895318936584,-73.8953390899614,-73.8953571923589,-73.8953723060128,-73.8953878912956,-73.8954059576507,-73.8954203637431,-73.8954362697205,-73.8954435433923,-73.8954708187832,-73.8954944585395,-73.8955118877109,-73.8955279008104,-73.8955448250694,-73.895565659529,-73.8955839186681,-73.8956023780589,-73.8956169990622,-73.8956323282864,-73.8956543655359,-73.8956735795029,-73.8956908596372,-73.8957069240623,-73.8957210742432,-73.8957387792503,-73.8957539335624,-73.8957665011288,-73.8957874891693,-73.8958042376849,-73.8958264404445,-73.8958337632165,-73.8958391336006,-73.8958518520311,-73.8958669424309,-73.8958796583669,-73.8958951518649,-73.8959058494862,-73.8959189238513,-73.8959350681013,-73.8959455135812,-73.8959612816688,-73.8959883541575,-73.8960040165087,-73.8960210845181,-73.8960417790568,-73.8960648951546,-73.8960871833128,-73.8961088236106,-73.8961295532763,-73.8961757148673,-73.8961937163428,-73.8962131611484,-73.896233752489,-73.896254779314,-73.8962775333992,-73.8963028574274,-73.8963325749897,-73.8963537486009,-73.8963688745841,-73.8963807290363,-73.8963918931438,-73.8964088890203,-73.8964263485628,-73.8964459336594,-73.8964707044747,-73.8964948976914,-73.8965207913381,-73.8965351208919,-73.8965486947657,-73.8965730308227,-73.8965988198401,-73.8966241363034,-73.8966502984294,-73.8966738122563,-73.8966912688659,-73.896706861711,-73.8967201877132,-73.8967319909397,-73.8967460392351,-73.8967623238846,-73.8967799305114,-73.8967928679052,-73.8968082734379,-73.8968250981738,-73.8968426313344,-73.8968467423028,-73.8968625731448,-73.8968878200112,-73.8969013940518,-73.8969146139116,-73.8969431659874,-73.8969582505035,-73.8969723675976,-73.8969952294265,-73.8970085611632,-73.8970195965619,-73.8970219405276,-73.8970272086246,-73.8970357200894,-73.8970481215989,-73.8970618102129,-73.8970734555977,-73.8970835856682,-73.897083963115,-73.8970794853591,-73.8970763764495,-73.8970744919834,-73.8970696143954,-73.8970682502089,-73.8970658664873,-73.8970638000344,-73.897064591606,-73.8970795611668,-73.8970968467929,-73.8971185913381,-73.8971255262877,-73.8971289970519,-73.8971296536063,-73.8971331754792,-73.897136923637,-73.8971390967053,-73.8971421344785,-73.8971462464826,-73.897151740008,-73.8971556027239,-73.8971597251632,-73.8971637679964,-73.8971685651108,-73.8971714654906,-73.8971742583602,-73.8971768633552,-73.8971854425313,-73.8971859619495,-73.8971949117037,-73.8972064104602,-73.8972231209831,-73.897238331912,-73.8972558640443,-73.8972684676474,-73.8972724995262,-73.8972856912195,-73.8972963931953,-73.8973064624851,-73.8973170257423,-73.8973310799625,-73.8973424711099,-73.8973568861931,-73.8973831757135,-73.8973967006846,-73.8974107679729,-73.8974249425597,-73.8974521682449,-73.897478864431,-73.8974949749068,-73.8975108376365,-73.8975303360197,-73.8975496942272,-73.897570278356,-73.8975903559965,-73.8976088058294,-73.8976290262806,-73.8976488936645,-73.8976674504284,-73.8976837528675,-73.8976995462549,-73.8977164616661,-73.8977324691634,-73.8977478752496,-73.8977646743382,-73.8977800086008,-73.8978073153412,-73.8978294010431,-73.8978403770865,-73.8978904923303,-73.8979081999625,-73.8979289554443,-73.8979510936345,-73.8979720400911,-73.8979951479681,-73.8980162729331,-73.898032758131,-73.8980485922053,-73.8980659371215,-73.8980844780186,-73.8981087705836,-73.8981304071463,-73.8981496664705,-73.8981742019625,-73.8981908738412,-73.8982076786758,-73.8982343213399,-73.8982482825628,-73.8982608131258,-73.8982860889416,-73.8983110353072,-73.8983327826384,-73.8983356999338,-73.898351753959,-73.8983762067774,-73.8983985342539,-73.8984209542545,-73.8984437541306,-73.8984653939166,-73.898485191672,-73.8985028356767,-73.8985041596106,-73.8985145041391,-73.8985194637294,-73.8985414548581,-73.8985682083693,-73.8985822185029,-73.8985964293353,-73.8986124239452,-73.8986317952826,-73.8986521365945,-73.8986621310926,-73.8986737784478,-73.898696317933,-73.8987216928349,-73.8987457903566,-73.8987674201223,-73.898790609688,-73.898812724255,-73.8988343662659,-73.8988527229342,-73.8988729226896,-73.8988938071751,-73.898914290617,-73.8989344897011,-73.8989571697072,-73.898980512792,-73.8990017514762,-73.8990196466884,-73.8990374256058,-73.8990551074595,-73.8990719164587,-73.8990853472157,-73.8990952588455,-73.8991171842639,-73.8991319889622,-73.8991144647642,-73.8991000406908,-73.8991026135143,-73.8991063311197,-73.8991110807585,-73.8991167183829,-73.8991230730139,-73.8991299519273,-73.8991371464984,-73.8991444385294,-73.8991516068665,-73.8991584341071,-73.8991647131942,-73.8991702536941,-73.8991748875738,-73.8991969286806,-73.8992134631296,-73.8992999961605,-73.8993872916842,-73.8994744002641,-73.899560374496,-73.8996442793144,-73.8997252021632,-73.8998022629208,-73.8997952094684,-73.8997927491468,-73.899794915274,-73.8997975615876,-73.8998010235963,-73.8998052081389,-73.8998100026115,-73.8998152779973,-73.8998208923378,-73.8998266945543,-73.8998325285119,-73.8998382372222,-73.8998436670661,-73.8998486719295,-73.8998531171341,-73.8998568830614,-73.8998773143845,-73.8998924803396,-73.8999020563856,-73.89999588547,-73.9000899828481,-73.9001835917141,-73.9002759591905,-73.9003663423857,-73.900454014369,-73.9005382700172,-73.9005398464212,-73.9005377817857,-73.900532119198,-73.9005347416163,-73.9005393475988,-73.9005458060813,-73.9005539332867,-73.9005634979546,-73.9005742279221,-73.9005858178673,-73.9005943684698,-73.9006023202462,-73.9006094790761,-73.9006156701964,-73.9006207424679,-73.9006245720645,-73.9006270654971,-73.9006281618952,-73.9006422262519,-73.9006521142797,-73.9006577817328,-73.9007011551582,-73.9007379790246,-73.9008513058857,-73.9009667361983,-73.9011023862968,-73.9012400164108,-73.9013790712455,-73.9015975687609,-73.9018164661936,-73.9020354455625,-73.9021147552507,-73.9023421019478,-73.902568711181,-73.9027942267971,-73.9030182943618,-73.9032405617191,-73.9034606795431,-73.9036783018887,-73.9040586929179,-73.9044365125221,-73.9048116128226,-73.9051838470074,-73.9055530693881,-73.9059191354582,-73.9062540843084,-73.9065857490928,-73.9069139101127,-73.9072383499937,-73.9075588538296,-73.9078752093252,-73.908187206936,-73.908494640009,-73.9087973049183,-73.9090849517405,-73.9092829979287,-73.9094791811541,-73.9095035521168,-73.9095063011081,-73.9091819173441,-73.9083539581389,-73.9084593012585,-73.9092068804636,-73.9092904720365,-73.9093810113839,-73.9094783798809,-73.90958244807,-73.9102645150203,-73.910697665914,-73.9106880765446,-73.9106472927737,-73.910601687513,-73.9105513242827,-73.910372421672,-73.9103921070442,-73.9101740613075,-73.9101479998986,-73.9101179993435,-73.9101009990952,-73.9100809993512,-73.9100789904178,-73.9100959998537,-73.9100989999712,-73.9100376297161,-73.9100323390823,-73.9100230764212,-73.9099723034905,-73.9098771456683,-73.9098755490563,-73.9098765383495,-73.9098110357142,-73.9097625843697,-73.9096907336255,-73.9096682386098,-73.9096535512362,-73.9095315534645,-73.9093913415669,-73.9092770814904,-73.9091835645525,-73.9090493410539,-73.9089211721263,-73.9087254513681,-73.9085158357453,-73.9083832812099,-73.9082119510577,-73.9080904469522,-73.9080730435863,-73.9079952845688,-73.9079717552091,-73.9079482148672,-73.9079331648651,-73.9079191596907,-73.9079065611063,-73.9078956945403,-73.9078868406824,-73.907880228232,-73.9078760279913,-73.9078743484541,-73.907875233002,-73.9078786587854,-73.9078845373133,-73.9079384277087,-73.9079852337301,-73.9080243801874,-73.9080553860238,-73.9080778702269,-73.90809155651,-73.9080962767057,-73.9080919728332,-73.9080648390424,-73.9080292631881,-73.9079857599726,-73.9079349587814,-73.9078775945765,-73.9078144972631,-73.9077465796845,-73.9076748244147,-73.9076002695447,-73.9075239936652,-73.9074471002631,-73.9073666762316,-73.9072798288399,-73.9071869440714,-73.9070884347374,-73.9069847386423,-73.9068763166365,-73.9067636505706,-73.906647241152,-73.9065276057219,-73.9064052759551,-73.9062807954982,-73.9061547175535,-73.9059438287517,-73.9057331496544,-73.9055230144353,-73.9053137564059,-73.9051057074866,-73.9048991976812,-73.9046945545537,-73.9044921027084,-73.9042921632762,-73.9040950534045,-73.9039010857546,-73.9037105680066,-73.903523802371,-73.9033410851092,-73.9031627060648,-73.9029889482024,-73.9029622187842,-73.9029727831142,-73.9028714333007,-73.90270957807,-73.9026546277041,-73.9025922976606,-73.9025231344804,-73.902447744615,-73.9023667891079,-73.9022809777987,-73.9021910630995,-73.9020978333986,-73.9020021061469,-73.9019047206924,-73.9018065309204,-73.901708397768,-73.9016111816762,-73.9015157350454,-73.9014228947631,-73.901235632564,-73.9010504156515,-73.9008676416955,-73.900687703123,-73.9005109862759,-73.9003378705816,-73.9001687277386,-73.9000039209185,-73.899843803987,-73.8996887207439,-73.896132624453,-73.8958166316655,-73.8956663077634,-73.895433323929,-73.8953372502706,-73.895454565432,-73.8956808438876,-73.8956831575407,-73.8956839233353,-73.8956831188288,-73.895680767597,-73.8956769385436,-73.8956717438795,-73.8956653358368,-73.8956579022051,-73.8956496608304,-73.8956408532291,-73.8956317375118,-73.8956225808188,-73.8956136514907,-73.8956052112053,-73.8955975073087,-73.8955907655667,-73.8955851835487,-73.8954860721863,-73.895447958184,-73.895265425395,-73.8945658095033,-73.8945535639847,-73.8943470682738,-73.8914974334036,-73.8912701145644,-73.8910489406769,-73.8909195104632,-73.890570511465,-73.8895703529338,-73.8891256594321,-73.8890262404147,-73.8881241945652,-73.8878212259583,-73.8869064451,-73.8866055656848,-73.8858303730298,-73.8853686026088,-73.8854058149184,-73.8854913682334,-73.8858879004768,-73.8865468400234,-73.8864424199488,-73.8862956965174,-73.8860133221726,-73.8859297674962,-73.8857220272244,-73.8855253744356,-73.8854210473079,-73.8853418301968,-73.8852892970495,-73.8851467629828,-73.8850621899404,-73.8850284088772,-73.8850000254086,-73.8848967822019,-73.8843097310527,-73.8843046669392,-73.8848870712472,-73.8847559483283,-73.8846397935349,-73.8847079107735,-73.8846773897261,-73.8846276452297,-73.8843368477482,-73.8842987608294,-73.8845872263366,-73.8845973421432,-73.8847368979913,-73.8847176876168,-73.8844597533558,-73.8841664662606,-73.8841809023689,-73.8841857256822,-73.884255637072,-73.8842560545,-73.8842262381348,-73.8841423383729,-73.8841561193721,-73.8841480672704,-73.8839890745021,-73.8839961004786,-73.884007526758,-73.8840717193515,-73.8840363832393,-73.8839701016892,-73.88398465406,-73.883974125313,-73.8837910370301,-73.8838069030385,-73.8838193709807,-73.884023400924,-73.883993260792,-73.8837881934638,-73.8837965106266,-73.8837808675611,-73.8837601597834,-73.8837694847298,-73.8835767067272,-73.8836919497781,-73.8834785008156,-73.8836976811031,-73.8839084517025,-73.8839042788441,-73.8836872809632,-73.8834653474965,-73.8833692731619,-73.8831309477431,-73.8831138564798,-73.8831109152025,-73.8830912985409,-73.8830733379197,-73.8830520232543,-73.8830289160619,-73.8830076886766,-73.8829928724059,-73.8829895562916,-73.8829708772637,-73.8829605109284,-73.8829539927881,-73.8829386322967,-73.8829232730061,-73.8829025076279,-73.8828881181202,-73.8828730774773,-73.882856195404,-73.8828383792699,-73.8828214702486,-73.8827999740372,-73.8827855060586,-73.8827640842769,-73.8827461612176,-73.8827312615787,-73.882714894745,-73.8826953376474,-73.882678706603,-73.8826628663012,-73.882647356467,-73.8826297064068,-73.8826121362228,-73.8825940821128,-73.882579393401,-73.8825624207648,-73.8825451641957,-73.8825292072079,-73.88251696222,-73.8825032279551,-73.882488713527,-73.8824798246325,-73.8824715626351,-73.8824508571581,-73.8824309313821,-73.8824097890766,-73.8823900889821,-73.8823728347231,-73.8823576600031,-73.8823432548687,-73.8823296410062,-73.8823125284216,-73.8822981933936,-73.8822863742942,-73.8822686225277,-73.8822549694179,-73.8822422175139,-73.8822224668608,-73.8822094323028,-73.8821968589678,-73.8821812940916,-73.882164554129,-73.8821492544641,-73.8821313939324,-73.8821095387251,-73.8820977215195,-73.8820866043097,-73.8820695586143,-73.8820178499041,-73.8819702188563,-73.8819225891014,-73.8819226001215,-73.8819072788426,-73.881892616846,-73.8818743776716,-73.8818434971748,-73.8818255990701,-73.8818082819819,-73.8817884102399,-73.8817705831497,-73.8817545281002,-73.8817400446436,-73.881733571167,-73.8817255382139,-73.8817063390418,-73.881689197652,-73.881670330497,-73.881654891261,-73.881633934213,-73.8816126471153,-73.8815942921179,-73.8815731962863,-73.8815504019912,-73.8815292375217,-73.8815083580284,-73.8814884562626,-73.8814673627766,-73.8814469424009,-73.8814248438588,-73.8814022366995,-73.8813818984351,-73.8813582760967,-73.8813348787342,-73.8813120151503,-73.8812899899062,-73.8812667373388,-73.8812459284977,-73.8812440990778,-73.8812198791834,-73.881199623999,-73.8811856563286,-73.8811716549246,-73.8811485478543,-73.881133977698,-73.8811178500327,-73.8811025250152,-73.8810843924999,-73.8810605336752,-73.881047513156,-73.8810325436917,-73.8810172452177,-73.8810024997093,-73.8809753235468,-73.8809525859164,-73.8809338020415,-73.8809167052046,-73.8808963389219,-73.8808747431561,-73.8808512493675,-73.8808300924381,-73.8808080248636,-73.880806407641,-73.880787942383,-73.8807627948612,-73.8807390428937,-73.8807191166047,-73.8807032726479,-73.8806856796717,-73.8806688655307,-73.8806537174327,-73.880636017406,-73.8806144240391,-73.8805921472235,-73.8805743327898,-73.8805534731679,-73.8805432606638,-73.8805326701731,-73.8805129538612,-73.8804926122529,-73.8804710279827,-73.8804558326657,-73.8804336685183,-73.8804168862766,-73.8804017686917,-73.8803811842881,-73.8803670004922,-73.880349038085,-73.8803288442766,-73.8803211799181,-73.8803089344671,-73.8802891429506,-73.8802700354299,-73.880253763002,-73.880233676534,-73.8802150317033,-73.8801974043537,-73.8801781832691,-73.8801645097377,-73.8801465488391,-73.8801255513685,-73.8801234024926,-73.8800980962713,-73.8800740206283,-73.8800491891564,-73.8800250074984,-73.8800022565668,-73.8799797291329,-73.8799575300854,-73.8799375873509,-73.8799266417823,-73.8798930346689,-73.8798718977874,-73.8798526866435,-73.879838610246,-73.8798219848695,-73.8798031265408,-73.8797862389313,-73.8797696124805,-73.8797581820166,-73.8797530566217,-73.8797336555665,-73.879715481371,-73.8796975180857,-73.8796813149436,-73.8796646509882,-73.8796454594403,-73.8796263871944,-73.879607090859,-73.8795885627288,-73.8795692998785,-73.8795453985284,-73.8795179303687,-73.8794927062651,-73.8794682966321,-73.879441302633,-73.879414485104,-73.8793889679826,-73.8793634823873,-73.8793357984612,-73.8793151423803,-73.8793019289567,-73.87928170143,-73.879259030653,-73.8792383318162,-73.8792187881528,-73.8791993153899,-73.8791744093102,-73.8791558674187,-73.8791342806749,-73.8791169678952,-73.8790980624541,-73.8790834195094,-73.8790684803536,-73.8790528944075,-73.8790357238126,-73.8790332791487,-73.8790190619414,-73.8790031905854,-73.878986776099,-73.8789661931276,-73.8789468977914,-73.878928604412,-73.8789084909184,-73.8788877180913,-73.8788706904323,-73.8788513603807,-73.8788351013405,-73.8788205884211,-73.8788040660362,-73.8787856422797,-73.8787701594239,-73.8787547597571,-73.8787319323622,-73.8787145494516,-73.8786968741593,-73.878687266263,-73.8786813484624,-73.8786797390724,-73.8786746736169,-73.8785169999532,-73.878303220537,-73.8781912454564,-73.8779725416071,-73.8778870198155,-73.8778080899573,-73.8776378530969,-73.8776057756234,-73.8774528179506,-73.8774001796679,-73.8773129940171,-73.8770689967848,-73.8768548587813,-73.8766212500724,-73.8765603879109,-73.8764337012452,-73.8763407507257,-73.8761145168805,-73.8760840841443,-73.8759845403442,-73.8758586734124,-73.8754300620292,-73.8751873602752,-73.8751059087809,-73.8748475856539,-73.8744304758418,-73.8739228738502,-73.8731651580676,-73.872600776491,-73.8671807548113,-73.8666395622718,-73.8655431746864,-73.8646422160799,-73.8634866193508,-73.8628830195682,-73.8628036192697,-73.8639920973905,-73.863966420578,-73.8639426787595,-73.8633474006849,-73.8636113295238],"lat":[40.5738230570186,40.5735427757593,40.5736900119723,40.572988329032,40.572381674513,40.5704584729966,40.569242922454,40.5691417855225,40.5687875343785,40.5673916164731,40.5677392722517,40.5675977288694,40.5668305715456,40.5665195661027,40.5665130138054,40.5665056560436,40.5665021921775,40.566501997369,40.5665050987465,40.5665718620529,40.5668159825696,40.5668759577309,40.5669722210839,40.5670196300701,40.567031743534,40.5670343117341,40.5670271943907,40.5669790128282,40.5669342852579,40.5668856115059,40.5667240744526,40.5666929977696,40.5666525743526,40.566640845868,40.5666377613749,40.5666314776009,40.5666321847562,40.5666247436854,40.5666081378207,40.5665716104374,40.5665600147002,40.5665339119296,40.566504036502,40.5664705232209,40.5664335153182,40.5661829279414,40.5661406889099,40.5661097939137,40.5660938651888,40.5659572765569,40.5655522142982,40.5655460641249,40.5659535253843,40.5660901116541,40.5660847373441,40.5660834333064,40.566084806289,40.56608647107,40.5660839762761,40.5660687419813,40.5660562292127,40.5660385965158,40.5660213656342,40.5659555954522,40.5659353981054,40.5659168714451,40.5658958461578,40.5658137334928,40.5657961246035,40.565787422579,40.565772837042,40.5657399059368,40.5657287722208,40.5657095761609,40.5656851194403,40.5656337452791,40.565623947214,40.5655937209732,40.5655689662455,40.5655311581122,40.5655189099153,40.5655160154187,40.5655143882133,40.5655149259272,40.5655169203177,40.5655206212171,40.5655276628299,40.5655270103016,40.5655193854632,40.5653418545428,40.5650770407786,40.5650694894597,40.5653353754958,40.5655454634338,40.565544696911,40.5655380087751,40.5655280893125,40.565474132193,40.5654408630604,40.5654196258607,40.5653847604534,40.5652706519785,40.5652411150982,40.5651879275377,40.5651134258735,40.5650602236515,40.5649336571445,40.5648959195044,40.5648554285948,40.5648133094942,40.5646323822351,40.5641831019156,40.5641746535974,40.5646260106916,40.5648099452174,40.5648094097381,40.5648143683689,40.5648152596842,40.5647909418769,40.5647645855108,40.564736415587,40.5646908934176,40.5646762624261,40.5646457788429,40.564626210381,40.5645965928744,40.5645592679901,40.5645028729121,40.5644590126915,40.5643764803295,40.5641895402501,40.5641212848329,40.5640975060073,40.5640841840268,40.5640417955064,40.5639386374732,40.563575116059,40.5635707700138,40.5638614777691,40.5639310333413,40.5640238905079,40.5640319039965,40.5640352490889,40.5640546829544,40.5640838654177,40.5640958147845,40.5641054473323,40.564109744899,40.5641107659134,40.5641094940011,40.5641061971049,40.564100047711,40.5640943477039,40.5640880666671,40.5640804113806,40.5640742081021,40.5640602717444,40.5640375386052,40.5640255869918,40.5639947959158,40.5639849489595,40.5639734549086,40.5639593370657,40.5639448651747,40.5639310894628,40.5639134822478,40.5638920346251,40.5638765149986,40.5638586092443,40.5638312009405,40.5638086443534,40.5637629333158,40.5637588459076,40.5638065911781,40.5638016668983,40.5637891065464,40.5637743084824,40.563767438432,40.5637557319439,40.563732778367,40.5637200237907,40.5637027596691,40.5636876974116,40.5636781138871,40.5636620302465,40.5636502724806,40.5636355369325,40.5636140031942,40.5636035664025,40.5635832946274,40.5635646246282,40.5635183153595,40.5635086463311,40.5635049117782,40.5635372372388,40.5635445076126,40.563536350431,40.5635231091538,40.5635137089719,40.5635098127757,40.5635058905103,40.5635005515542,40.563491953864,40.5634785826181,40.563463713518,40.5634488901336,40.5634416415496,40.5634346380899,40.5634276271539,40.5634213733926,40.5634099144855,40.5634050263395,40.5633960331995,40.5633099305334,40.5633067677848,40.5633914875915,40.5633870919176,40.5633762138602,40.5633705229352,40.5633597599103,40.5633543344399,40.5633443711097,40.5633328064713,40.5633216375256,40.5633132867755,40.5633040478146,40.5632935482945,40.5632832159278,40.5632726643461,40.5632610642573,40.5632496315698,40.5632307295307,40.5632213844373,40.5632042617978,40.5631969868303,40.5631894903823,40.5631766563531,40.5631669057708,40.5630895299828,40.5630859093118,40.5631618672871,40.5631565210674,40.5631503280311,40.5631442750234,40.563139314795,40.563129351459,40.5631212390259,40.5631060706601,40.5631009965479,40.5630836801449,40.5630775587521,40.5630655361574,40.5630605418021,40.5630499906979,40.5630433585557,40.5630326754319,40.5630220178605,40.5630082688434,40.562999735039,40.5629913856214,40.562983167956,40.5629739118191,40.5629665831286,40.5629587183603,40.5629517078573,40.5629355462841,40.5629271173555,40.5629192520833,40.5629104441385,40.5629017768541,40.5628991436746,40.562863868044,40.5628614619799,40.5628942459424,40.5628908195144,40.5628865550353,40.5628794914467,40.5628719255139,40.5628546347772,40.5628451835472,40.5628352215352,40.5628250745003,40.5628200804848,40.5628111922796,40.5628067882804,40.5627935493513,40.5627877534148,40.5627698201514,40.562763645228,40.562757144679,40.5627510493068,40.5627442328571,40.5627371779611,40.5627296022341,40.5627225391926,40.5627152629399,40.5627080497304,40.5627013909394,40.5626955070981,40.5626905395007,40.5626827520165,40.5626760651837,40.5626556361327,40.5626516717732,40.5626719510167,40.5626697312362,40.562663424079,40.5626266130878,40.5625913876695,40.5625611309499,40.5625251219023,40.562487105852,40.5624545947866,40.5624240735615,40.5623991828599,40.5623603924451,40.5623297825616,40.5622934304995,40.5622474150882,40.5621945195311,40.5621544933956,40.5621074834742,40.5620775440721,40.5620340741452,40.5619540706793,40.5618755455576,40.5618359888441,40.5618340940192,40.5618311178097,40.5618274204189,40.5618226652847,40.5618161797276,40.561809180059,40.5618025276547,40.5617974114343,40.5617916764839,40.561784499139,40.5617771641262,40.5617664591254,40.56175494343,40.5617430959764,40.5617307431006,40.5617239210982,40.561716801797,40.5617104190153,40.5617046151377,40.5616980170758,40.5616911424005,40.5616847785824,40.5616792279611,40.5616736246065,40.5616682441504,40.561662757223,40.5616536582925,40.5616494696838,40.5616417843159,40.5616334702079,40.5616249325085,40.5616145223618,40.5616037023369,40.5615943913786,40.5615844371861,40.5615756760092,40.5615681644581,40.5615590907364,40.5615494270791,40.5615418254787,40.5615327413375,40.561523563158,40.5615181975654,40.5615129652167,40.5614992350027,40.5614869495369,40.5614701425301,40.5614527268567,40.5614377309295,40.5614039478899,40.5614026035438,40.5613858745786,40.5613745508969,40.5613674488836,40.5613686186658,40.5613696588683,40.5613797162167,40.5614019121929,40.561425544994,40.5614715703482,40.5614737215632,40.5614740636304,40.5614725817416,40.5614690616267,40.5614671595623,40.5614657787435,40.5614644456892,40.5614629038977,40.561462588115,40.5614621075293,40.5614619457258,40.5614592039392,40.5614568612724,40.5614547344672,40.5614518161931,40.5614490055684,40.5614458373356,40.5614425427702,40.5614397062441,40.5614372477112,40.5614349050363,40.5614320943841,40.5614295364513,40.5614272185746,40.5614234522418,40.561419660752,40.5614175427568,40.5614158322445,40.5614143122862,40.5614123507821,40.5614110555492,40.5614092627449,40.5614044356448,40.5614018248587,40.5613990146712,40.5613974113318,40.5613967423403,40.5613961815006,40.5613938156784,40.5613915042379,40.5613900354399,40.5613881322096,40.5613859542626,40.5613829193295,40.5613792896356,40.5613762867573,40.5613721338797,40.561365482637,40.5613587254288,40.5613515800461,40.5613448288905,40.5613383129441,40.5613323016173,40.5613266946784,40.561321248192,40.5613132282012,40.5613027161878,40.561291240011,40.5612847700345,40.5612730505979,40.5612615987512,40.5612497607023,40.5612380330436,40.5612277615764,40.5612170599536,40.5612057759826,40.5611996119325,40.5611929545025,40.561186161438,40.5611798370028,40.561174715435,40.5611640418011,40.5611527551627,40.561140731376,40.5611342958767,40.5611268998242,40.5611197190005,40.5611134455627,40.5611071177751,40.5611008186664,40.5610947094649,40.5610881673965,40.5610817512063,40.561075515665,40.5610689105571,40.5610626914318,40.561056446683,40.5610410573782,40.5610322737022,40.5610233192548,40.5610129970083,40.5610069432397,40.5610006725779,40.5609952555405,40.5609906563492,40.5609816738505,40.5609725304621,40.5609638011239,40.5609535886728,40.5609448274804,40.5609365435464,40.5609303376338,40.5609263487372,40.5609232057894,40.560920564719,40.5609108970016,40.5609100958915,40.5609095198985,40.5607880992609,40.5607768734654,40.5607679618077,40.5607604308098,40.5607610273319,40.5607617160473,40.5607684018973,40.5607703444434,40.5607909509685,40.5607938162042,40.5608257546558,40.5608729621658,40.5608752903004,40.5608795177741,40.5608813954135,40.5608814942231,40.5608812147552,40.5608807654644,40.5608805895717,40.5608803685725,40.5608797868482,40.5608782103952,40.5608765231171,40.560875226509,40.5608748312626,40.5608743798133,40.5608741287902,40.5608751926024,40.5608755612981,40.560875395138,40.5608744039844,40.5608736078773,40.5608747066749,40.5608763120917,40.5608790257018,40.5608822365773,40.560883102213,40.5608841144075,40.5608869454933,40.5608881985772,40.5608894276491,40.5608869309125,40.5608832996233,40.5608803486268,40.5608776567566,40.5608770603313,40.5608745044888,40.5608710404139,40.560866142933,40.5608628620726,40.5608597256419,40.5608559219878,40.5608500961167,40.5608415540338,40.5608323554265,40.5608241901087,40.5608155134168,40.5608075481108,40.5608006499951,40.5607938322629,40.5607856192714,40.5607810039124,40.5607772343208,40.560769181863,40.5607604190673,40.5607511256445,40.5607420941046,40.5607328841181,40.5607223166484,40.5607120728187,40.5607009198852,40.5606895867449,40.5606790336799,40.5606676886038,40.5606562363755,40.5606456688894,40.5606345460598,40.5606289041981,40.5606240086918,40.560614089938,40.5606024792582,40.5605907780515,40.5605785093924,40.5605720226259,40.560565751755,40.5605595620382,40.5605527444842,40.5605446333873,40.5605367845262,40.5605289783993,40.5605216437975,40.5605132748673,40.5605067043503,40.560500133876,40.5604844868743,40.5604762283104,40.5604673578864,40.5604581893805,40.5604511235318,40.5604449177389,40.5604389438612,40.5604331414383,40.5604269253696,40.5604211229423,40.5604149874965,40.5604085565907,40.5604018471128,40.5603951113296,40.5603892286151,40.560383615125,40.5603785503331,40.5603734580996,40.5603652523359,40.5603579167352,40.560350582291,40.5603435257451,40.5603379963853,40.5603316753886,40.5603234654088,40.560315002281,40.5603051382203,40.560299937246,40.5602946565406,40.5602895094182,40.5602836799605,40.5602766365384,40.5602695206509,40.5602617104613,40.5602544314543,40.5602473320658,40.5602412841224,40.5602366759645,40.5602296985637,40.5602236267891,40.5602128785874,40.5602032828015,40.5601950357602,40.5601924014529,40.5601823680412,40.5601356660237,40.5600894605185,40.560084341624,40.5600730417182,40.5600547171425,40.560042807458,40.5600411643726,40.5600475990565,40.560066385975,40.560089425297,40.5601446788174,40.5601601745554,40.5601605693906,40.560160397446,40.5601576968166,40.560155516371,40.560153810187,40.5601534252933,40.5601509617373,40.560148367888,40.5601453077942,40.5601424900195,40.5601398072511,40.5601368812045,40.5601333244636,40.5601300644854,40.5601281832679,40.5601247693036,40.5601222008793,40.5601210354055,40.5601187677968,40.5601156250163,40.5601124454126,40.560108919099,40.5601042938881,40.5600992809394,40.5600953657564,40.5600911537648,40.5600854579046,40.560082303509,40.5600764180576,40.5600729115405,40.5600674833295,40.5600647822318,40.5600625650741,40.5600580463897,40.5600536588797,40.5600493086652,40.5600450330411,40.5600420257486,40.5600386842592,40.5600338295042,40.5600315343257,40.5600285529895,40.560023479115,40.5600189543943,40.5600134208452,40.5600084037462,40.5600034408133,40.559996235459,40.5599923394672,40.5599844952268,40.5599807976714,40.5599719357883,40.5599669408802,40.559960496177,40.5599527270418,40.5599443598276,40.5599361782151,40.5599313528206,40.5599219190292,40.5599067104195,40.5598985347879,40.5598917821356,40.5598855247757,40.5598788544368,40.5598714430609,40.5598628792035,40.5598540450282,40.5598424042469,40.559834698252,40.5598280811421,40.5598208685389,40.559812628168,40.5598045867314,40.559797560133,40.5597897055659,40.5597855900344,40.5597757924998,40.5597693731719,40.5597610799963,40.5597528774854,40.5597469448766,40.5597378662483,40.5597287514073,40.5597210868645,40.5597168890761,40.5597060993961,40.5597000571394,40.5596938603592,40.5596873757649,40.559681170258,40.5596732730054,40.5596669327171,40.5596599817241,40.5596534270757,40.5596470362077,40.5596361144824,40.5596286232562,40.5596203305201,40.5596115216826,40.5596036677314,40.5595968294273,40.5595901533741,40.5595818084159,40.5595737613092,40.5595702749241,40.5595581541445,40.5595493104414,40.5595408989114,40.5595327453632,40.5595248145605,40.559517731966,40.5595147178859,40.5594321616924,40.5594284524141,40.5594250188801,40.5594004829985,40.5594059074156,40.5594166281891,40.5594311072557,40.559458242067,40.5595396037716,40.559540145127,40.5595421048858,40.559541870043,40.5595418062022,40.5595412716287,40.5595404703644,40.5595397668364,40.5595393845542,40.5595395882869,40.55954039645,40.5595407734966,40.5595412866628,40.5595413844752,40.5595419872772,40.559542392623,40.5595421342656,40.5595418605015,40.5595416279397,40.5595412971389,40.5595407660578,40.5595403955441,40.5595400782968,40.5595396661899,40.5595395055124,40.5595400241751,40.5595404595107,40.5595413887891,40.5595423905933,40.5595431840322,40.5595434700617,40.5595440644646,40.5595442399894,40.5595440314124,40.5595428502152,40.559541384845,40.5595402491513,40.5595389485507,40.5595372926455,40.5595350306481,40.5595317793672,40.5595286178668,40.5595262982908,40.5595218427013,40.5595155789522,40.5595106513796,40.5595047442717,40.5595002820687,40.5594928602679,40.5594855714216,40.5594806460189,40.5594742844312,40.5594660687088,40.5594607305711,40.5594541001192,40.5594438308641,40.5594365155539,40.5594291722274,40.5594212273681,40.5594136445828,40.5594074546187,40.5594020144913,40.5593976651579,40.5593935346238,40.559388333566,40.5593797385714,40.559372213183,40.559364847036,40.5593586596871,40.5593528320811,40.559345104304,40.5593383364816,40.5593302024847,40.5593236767741,40.5593214658548,40.5593105830713,40.559301821681,40.5592935541111,40.5592854718545,40.5592789919054,40.5592739300887,40.5592700146893,40.5592648411555,40.5592591458419,40.5592463343287,40.5592396760718,40.5592337648576,40.5592284465084,40.5592229754467,40.5592179360144,40.5592075069666,40.5591981893755,40.5591897883182,40.5591778153923,40.5591684112005,40.5591609309529,40.559153866406,40.5591473443818,40.5591425044434,40.5591372244988,40.5591319103653,40.5591267127081,40.5591226653968,40.5591151435484,40.5591096122888,40.5591047985533,40.5590998150512,40.5590944183573,40.5590888176401,40.5590829262374,40.5590775116831,40.5590716207779,40.559065988317,40.5590586500449,40.5590525689682,40.5590445701402,40.5590367032272,40.5590312035832,40.5590235002998,40.5590136407496,40.5590044365603,40.5589970948027,40.5589903300828,40.5589799533194,40.5589733769653,40.558966612761,40.5589608379671,40.558955367924,40.5589516735049,40.558948286214,40.5589455552185,40.558940612844,40.5589404327589,40.5589363388729,40.5589281285895,40.558920400148,40.558913721945,40.5589047873617,40.5588974677203,40.5588895456898,40.5588822361669,40.5588746665913,40.5588659542856,40.5588558910298,40.5588518121298,40.5588447000942,40.5588410031844,40.5588354455688,40.5588275098402,40.5588196136202,40.5588110605121,40.558802398618,40.5587923894766,40.5586981409389,40.5586643517941,40.5586941922693,40.5587723978265,40.5587735329579,40.5587743387726,40.5587765556395,40.5587795391255,40.5587828296576,40.5587849339808,40.5587861557006,40.5587863938016,40.5587878159403,40.5587896205558,40.5587931518163,40.5587963484525,40.5587975802615,40.5587972094181,40.5587971441592,40.558797460322,40.5587973405221,40.5587976363805,40.5587981392046,40.5587990914365,40.5587986411678,40.5587978664408,40.5587967571786,40.5587968798104,40.5587989870181,40.5588001382023,40.5588011882482,40.5588035367831,40.5588062553238,40.558809283903,40.5588115491217,40.5588046412495,40.5587971382582,40.558791550654,40.5587861629154,40.5587815381678,40.5587765013966,40.558771795867,40.5587662665966,40.5587569119085,40.5587518481075,40.5587475775082,40.5587435039702,40.5587387227058,40.55873497167,40.5587309788604,40.5587252315235,40.5587206612493,40.5587152464541,40.5587048930509,40.5586963877937,40.5586892664408,40.5586836538837,40.5586791904644,40.5586739365362,40.5586679167243,40.5586606825874,40.558653755562,40.5586463338024,40.5586419528929,40.5586365151792,40.5586301869516,40.5586248569128,40.5586193789072,40.5586132249343,40.5586075808811,40.5585996368277,40.5585922126196,40.5585822375168,40.5585745462512,40.558567152189,40.5585605493288,40.5585546115679,40.5585496012204,40.5585421540786,40.5585361605159,40.5585275596591,40.5585199390171,40.5585142416726,40.5585083839011,40.5585028491135,40.558497178568,40.5584913207934,40.5584840347333,40.5584778701988,40.5584716631214,40.5584650592207,40.5584577729959,40.5584550860649,40.558444852741,40.5584366553917,40.5584287375557,40.558421890266,40.5584163648688,40.5584108310519,40.5584037073433,40.5583981822339,40.5583919396591,40.5583862985247,40.558379403061,40.5583737650587,40.5583694935505,40.5583656975347,40.5583611283439,40.5583562547935,40.5583528367403,40.5583477730515,40.558342248099,40.5583356685671,40.5583254669581,40.5583183433835,40.5583117426395,40.5583071773454,40.5583035185355,40.5582981467894,40.5582918467979,40.5582823696442,40.5582750262835,40.5582678704657,40.5582605893899,40.5582517637439,40.5582439523024,40.5582389213181,40.5582333869441,40.5582259365141,40.558217708164,40.5582102801702,40.5582011537498,40.5581946894019,40.5581883322359,40.5581819253553,40.5581795724489,40.5581786074333,40.5581779651655,40.5581764387077,40.5581719249663,40.5581667229969,40.5581604215251,40.5581515092403,40.5581425511036,40.5581347610367,40.5581235187278,40.5581132107484,40.5581046311404,40.5580972031126,40.5580905783385,40.5580852282493,40.5580782184787,40.5580682113055,40.558061009787,40.5580482251374,40.5579165461191,40.5578715414941,40.5578682529024,40.5579113575691,40.5579511212929,40.5580254211651,40.5580308722269,40.5580370936677,40.5580419394208,40.5580436352296,40.5580465077844,40.5580496188979,40.5580537037986,40.5580597794621,40.5580618995016,40.5580776932253,40.5580889070958,40.5580985798507,40.5581078952692,40.5581142482704,40.5581162185711,40.5581177905477,40.5581192940452,40.5581202471401,40.5581206921558,40.5581212761729,40.558121475124,40.5581195650512,40.5581180780968,40.5581159806022,40.5581143735467,40.5581138416035,40.5581126558983,40.5581108601952,40.5581087045371,40.5581064965443,40.5581024863158,40.5580986560934,40.5580946364852,40.5580910043142,40.5580874823105,40.5580848058856,40.5580823537144,40.5580801189236,40.5580779107152,40.5580755140199,40.5580717956501,40.5580680004237,40.558063837013,40.5580602868064,40.5580576383052,40.5580550783206,40.5580520792742,40.558049454627,40.5580463084829,40.5580429828465,40.5580387960369,40.5580329215325,40.5580289561196,40.5580234249851,40.5580161939258,40.5580115323891,40.5580110099808,40.5580085263878,40.558003631621,40.5579971084843,40.5579916306087,40.5579858027126,40.5579814846075,40.5579775737556,40.5579738512392,40.5579691749762,40.5579648484781,40.5579610005449,40.5579565401208,40.5579532275248,40.5579494007811,40.5579455786387,40.55793790224,40.5579268838674,40.5579147937309,40.557906435098,40.5579006301099,40.5578967623814,40.5578923182923,40.5578893781876,40.5578851154706,40.5578766786206,40.5578679962386,40.5578627945507,40.5578575067013,40.5578512635858,40.5578421368908,40.5578329274587,40.5578249775093,40.5578173888515,40.5578092261163,40.5578016309355,40.5577955545638,40.557790930595,40.5577876779226,40.5577865626165,40.5577845184566,40.5577792931013,40.557772148456,40.5577621701921,40.5577562563577,40.5577544223068,40.5577471069372,40.5577403960497,40.5577358782076,40.5577304909044,40.5577250650456,40.5577172264822,40.557709585472,40.5577038605176,40.5576958610086,40.5576891720871,40.5576807026985,40.5576744019659,40.5576670961497,40.5576616148714,40.5576545245395,40.5576479738277,40.5576415907992,40.5576336453224,40.5576278386013,40.5576206277001,40.5576107924064,40.557604185022,40.5575969045887,40.5575909800317,40.5575829241047,40.5575743747592,40.5575675538981,40.5575647063166,40.5575557901605,40.5575492709245,40.5575434167964,40.5575374174589,40.5575315339614,40.5575249304547,40.5575172918535,40.5575090228143,40.5575035139652,40.5574960089101,40.5574885581367,40.5574824798524,40.5574770004003,40.5574721324197,40.5574676958024,40.5574624150624,40.5574572969266,40.5574523643568,40.5574460659039,40.5574397122225,40.5574281801907,40.5574214945763,40.5574131712258,40.5574054683449,40.5573981246618,40.5573916915664,40.5573854758099,40.5573782975237,40.5573706603998,40.5573674000416,40.5573559243634,40.5573471851854,40.5573400547704,40.5573324397177,40.557323340362,40.5573134255608,40.5573060839584,40.5573006309767,40.5572967833258,40.5572965183218,40.5572950393059,40.5572939254094,40.5572930169433,40.5572918929537,40.5572898220097,40.5572864647909,40.5572830243518,40.5572814754922,40.5571497285371,40.5571053905375,40.5570883335559,40.557088252337,40.5570787957957,40.5570900017224,40.5571052059815,40.5571334648068,40.5572601081249,40.5572608464651,40.5572612173264,40.5572615779451,40.5572655462692,40.5572717943121,40.5572779480157,40.5572867766175,40.5572941772177,40.5573021507395,40.5573099510007,40.5573174790163,40.5573270642817,40.5573405191809,40.5573514140345,40.5573592343997,40.5573688520892,40.557378147999,40.5573850371509,40.5573933184925,40.5574023400864,40.557408196627,40.557413179322,40.557419621609,40.5574220254089,40.5574229757104,40.5574235409536,40.5574236943499,40.5574223692654,40.5574217166008,40.5574214600696,40.5574205675068,40.557419535909,40.5574184338047,40.55741805293,40.5574164840456,40.5574154603395,40.5574142701497,40.5574123666671,40.5574091673294,40.5574045755182,40.5574010523805,40.5573978539275,40.5573952113653,40.5573929470572,40.5573892028516,40.5573859512955,40.5573820132852,40.5573776153038,40.5573740533993,40.5573699269613,40.5573662934238,40.557363171351,40.5573583908327,40.5573543442661,40.5573506539547,40.5573410339929,40.557335302807,40.5573261383929,40.5573178402473,40.557310412778,40.5573010977525,40.5572927869083,40.557282559497,40.5572717315906,40.5572672115486,40.5572628038816,40.5572563540416,40.5572522794899,40.5572478466895,40.5572420744171,40.5572356477826,40.5572294098707,40.5572236652466,40.5572178941628,40.5572052202146,40.5571996711429,40.5571931242244,40.5571853262199,40.5571782850027,40.5571694447301,40.5571549146096,40.5571401726708,40.557129961902,40.557121736263,40.5571141184845,40.5571094640211,40.5571054725393,40.5571003555046,40.5570943839709,40.557086419482,40.5570783995172,40.5570695878254,40.5570648730413,40.5570596449333,40.5570508593016,40.5570408057662,40.5570319397543,40.5570257594998,40.5570214131521,40.5570173133161,40.5570125271065,40.5570073525324,40.5570022841416,40.5569954880218,40.5569859216255,40.5569765541004,40.5569705495604,40.5569644403526,40.5569570169727,40.5569499818909,40.5569482657212,40.5569416785902,40.5569316064098,40.5569263770875,40.5569214999286,40.5569118902372,40.5569066885658,40.5569015421471,40.5568917916388,40.5568825820784,40.5568703177273,40.5568662679506,40.5568571231954,40.5568423977432,40.556832332104,40.556821718119,40.556811137985,40.5567959649997,40.5567807914835,40.5567673872557,40.5567549845755,40.5567443566317,40.5567297185223,40.5567182802,40.5567023752864,40.5566949624135,40.5566636244744,40.5566574335873,40.5566563137261,40.5566588634112,40.5566638591668,40.5566722097887,40.5566749035877,40.5566878650137,40.556699655608,40.5567145794438,40.5567273971977,40.5567412599601,40.556754169374,40.5567683113525,40.5567823904048,40.5567945332424,40.5568072431738,40.5568181427539,40.5568286808756,40.5568396964568,40.5568497452102,40.5568503496205,40.5568575253994,40.556866288292,40.5568792357189,40.5568916487213,40.5569076671992,40.5569197188485,40.5569235761454,40.5569365736901,40.5569487130965,40.5569579166446,40.5569681378751,40.5569808842206,40.5569900889473,40.5569984230418,40.5570083514052,40.5570123176974,40.5570162832996,40.5570204647744,40.5570286757714,40.5570356966593,40.5570396635724,40.5570431899937,40.5570477105959,40.5570509694021,40.5570556248225,40.5570592637187,40.5570617472141,40.5570646467539,40.5570668894256,40.5570695442225,40.5570718095114,40.5570741560992,40.5570766119083,40.5570782741551,40.5570798001648,40.5570810498156,40.5570824320164,40.5570846538069,40.5570877163024,40.5570906350555,40.5571011433731,40.5571032133668,40.5571041403296,40.5571039085401,40.5571031888458,40.5571021371803,40.5571000216097,40.5570985507593,40.5570978528142,40.5570970947243,40.5570946161558,40.557090603925,40.5570865888306,40.5570845697533,40.5570845915091,40.5570842829565,40.5570819115561,40.5570777026912,40.5570743378257,40.557071169879,40.5570652042454,40.5570586425781,40.5570518272813,40.5570508757809,40.5570456391008,40.5570370431695,40.5570293186862,40.5570218457428,40.5570140136117,40.5570069807409,40.5570014240191,40.5569976584633,40.5569974433521,40.5569957594363,40.5569949524713,40.5569907218343,40.5569836314754,40.5569792763433,40.5569743811026,40.5569689017504,40.5569632365702,40.5569566982391,40.5569532102065,40.5569491444804,40.5569416364073,40.5569325537037,40.5569245606555,40.5569169974868,40.5569089486791,40.5569006300341,40.5568930931658,40.5568871838011,40.5568803933412,40.5568731089323,40.556866814436,40.5568600239647,40.5568528031104,40.5568450251278,40.556838514999,40.5568327139287,40.556826686588,40.5568215155721,40.5568166138448,40.5568121762199,40.5568088445498,40.5568003537942,40.5567935585497,40.5567287439562,40.5566634863985,40.5566582819911,40.5566534969472,40.5566492763885,40.5566457483165,40.5566430197314,40.5566411733859,40.5566402652763,40.5566403229438,40.5566413446397,40.5566432993775,40.5566461278739,40.5566497443458,40.5566540391122,40.5566820053585,40.5567120999711,40.5567211302737,40.5567232377786,40.5567183995643,40.5567066682518,40.5566881714323,40.5566631102793,40.5566317573605,40.5566019184018,40.5565716564721,40.5565413814629,40.5565374099018,40.5565338217619,40.5565307135982,40.5565281690498,40.5565262565893,40.55652502768,40.5565245153913,40.5565247335085,40.5565256761623,40.5565273179864,40.5565296147999,40.5565325047969,40.556535910209,40.5565622946514,40.5565906702832,40.5566204298975,40.5566259262105,40.5566249888222,40.556617625272,40.5566038947833,40.5565839077875,40.5565578250359,40.5565258563063,40.5565066686925,40.5564875080459,40.5564687742091,40.5564596040706,40.5564509006003,40.5564429114557,40.5564358639685,40.5564299586748,40.5564253636101,40.5564222095269,40.556424630667,40.5564280381224,40.5564323487096,40.5564374571974,40.5564432388764,40.5564495526027,40.5564562442444,40.5564631504433,40.5565104417452,40.5565583443637,40.5566066439916,40.5566335685432,40.5566503744751,40.5566835591392,40.5567122176037,40.5567392922283,40.5567597437462,40.5567734896414,40.5567846701758,40.5567894922434,40.5567879488392,40.5567858184697,40.5567750657928,40.5567574487717,40.5567329950943,40.5567017431937,40.5566637421873,40.5566190517996,40.5565677422687,40.5564714868533,40.5563695110123,40.5562618546622,40.5561485599427,40.5560296712004,40.5559052349715,40.5558112018276,40.5557106253669,40.555603572217,40.5554901132957,40.5553703237638,40.5552442829754,40.5551120744254,40.5549737856941,40.5548295083884,40.5561133452459,40.5569972416294,40.5604436355842,40.5607179770173,40.5607619785479,40.5607571956874,40.5607544805896,40.5608085329923,40.5608120732341,40.5609590664902,40.5611036463112,40.5612456215229,40.5613848048471,40.5623964513697,40.5634150375821,40.5638275358726,40.5639266427129,40.5640245197434,40.5641210305939,40.5644010327537,40.5645112691349,40.5649234019891,40.5649430003466,40.5649560004712,40.5649560009045,40.5649420003672,40.564917358181,40.5648720009159,40.5648239997863,40.5647937111051,40.5647888042025,40.5647802095385,40.5647446036866,40.5644858357853,40.5644534094092,40.5644209689521,40.5643271554776,40.5642848369282,40.5642577017826,40.5642405109511,40.5642127549601,40.5641228318125,40.5640460955145,40.5639971241531,40.563977896403,40.5639612747779,40.5639473047675,40.5639312915376,40.5639390484314,40.563962725977,40.5639933245409,40.5640265641324,40.5640853374123,40.5641647373781,40.5641615301018,40.5641583234818,40.5641542748851,40.5641484398698,40.5641409691578,40.5641320557223,40.564121929803,40.5641108529584,40.5640991113099,40.564087008151,40.5640748561133,40.5640629690906,40.5640516541311,40.5640051239821,40.5639543306988,40.5638998984878,40.5638424962737,40.5637828294782,40.5637216313506,40.5636596539568,40.5635976589372,40.5635427877151,40.5634907978962,40.563442441628,40.5633984184896,40.56335936537,40.5633258472557,40.5632983490564,40.563277268591,40.5632629108315,40.5632554834928,40.5632550940262,40.5631795237119,40.5631082079468,40.5630414636694,40.5629795875017,40.5629228544298,40.5628715165826,40.5628258021114,40.5627859141762,40.5627520300427,40.5627243002952,40.562702848167,40.562687768993,40.5626885820937,40.5626957989851,40.56270940822,40.5627293882117,40.5627557072686,40.5627883236438,40.5628271856019,40.5628722315009,40.5629233898894,40.5629805796208,40.5630437099809,40.5631126808328,40.5631873827747,40.5632676973138,40.5633534970544,40.5634446458993,40.5634583430064,40.5634844044909,40.5635148642061,40.5631209026751,40.5630587680735,40.5630008257683,40.5629475838098,40.5628995090334,40.5628570229666,40.5628204981339,40.5627902547897,40.5627665581115,40.5627496158742,40.5627395766291,40.5627365284015,40.5627404979182,40.5627514503744,40.5627692897377,40.5627938595909,40.5628242232173,40.5628611701132,40.5629046209524,40.5629544824446,40.5630106475348,40.5630729956344,40.5631413928788,40.563215692415,40.5632957347173,40.5633813479292,40.5653584275669,40.565624318586,40.5658306373084,40.5661504359843,40.5663321003709,40.5666401669763,40.5669920511987,40.5669988203443,40.5670057912384,40.5670127595963,40.5670195212076,40.5670258779206,40.5670316434494,40.5670366488327,40.5670407473858,40.5670438189988,40.5670457736568,40.5670465540776,40.5670461373908,40.5670445358076,40.5670417962629,40.5670379990404,40.5670332554191,40.5670277044131,40.5668717888066,40.566858506537,40.5663164316821,40.5643299855739,40.5642906252657,40.5643488998972,40.565153036464,40.5652166696303,40.5652776506503,40.5653133321118,40.5654095554544,40.5656904269484,40.5658130120109,40.5658404168571,40.5660903826885,40.5661741689034,40.5664265363888,40.5665087635953,40.566722113205,40.5668570118532,40.5669072318636,40.5670251824339,40.5675683645136,40.5684709781101,40.5684459932407,40.568465965911,40.5684802291445,40.5684844512137,40.5685244615918,40.5685797926874,40.5685909094802,40.5685993486547,40.568569111027,40.5685490313856,40.5685270635517,40.5685311271886,40.568521733527,40.5684995848769,40.5686961195387,40.5686635719477,40.5684702056688,40.5682891391875,40.5683371852272,40.5684296740966,40.5684413423982,40.5683729686108,40.568487934478,40.5684368020531,40.5683194570265,40.5683260025263,40.5682685132407,40.5682451548869,40.5678928367589,40.568001951564,40.5680277256674,40.5680263926377,40.5681451025008,40.5681571334024,40.5681664603957,40.5680276867777,40.5680224256663,40.5680089773012,40.5680601606942,40.5680729459565,40.5680729574952,40.5681950141335,40.5682052770241,40.5680895549024,40.5680840245328,40.5680649731336,40.5681239118272,40.5681535541788,40.5681519824607,40.5685031156109,40.5685117989024,40.5681598730711,40.568155920076,40.5681271859599,40.5681338512879,40.5681475254579,40.5682097697543,40.5683953597227,40.568473114105,40.5688362854632,40.5688959110918,40.5689062042593,40.5688434048324,40.5684780199385,40.568331859751,40.5683806260142,40.5683831750127,40.5683838654255,40.5683852140129,40.5683847817658,40.5683840217636,40.5683828184911,40.5683802661684,40.5683773420903,40.5683766816605,40.5683750146413,40.5683742470125,40.5683737639163,40.5683723785402,40.5683700578444,40.568366002896,40.5683631336865,40.5683605063943,40.5683582647187,40.568356247248,40.568355843509,40.568358018564,40.5683591835462,40.5683596299307,40.5683578286175,40.5683559759409,40.5683555722372,40.5683570295446,40.56835946151,40.5683619666536,40.5683645627663,40.5683689298251,40.568374846781,40.5683808619146,40.5683863666718,40.5683947780791,40.5684041169736,40.5684125031124,40.5684186674124,40.5684258403923,40.5684335423016,40.5684379913429,40.5684421160171,40.5684518383624,40.5684610399817,40.5684699334378,40.5684785939923,40.5684860960668,40.5684926093297,40.5684986100677,40.568504133987,40.5685113924417,40.5685179971907,40.5685239374126,40.5685323754529,40.5685397180264,40.5685459099225,40.5685554350178,40.5685610776253,40.5685664137898,40.5685731511192,40.5685772588664,40.5685807279576,40.5685843031458,40.5685890528036,40.5685939033943,40.5685980904468,40.5686802980709,40.5686987784568,40.5687151094141,40.5687314415257,40.5687312971263,40.5687076963665,40.5686850964353,40.5686887162598,40.5686948432295,40.5686992648595,40.5687028487655,40.5687074940216,40.5687120045069,40.5687159959636,40.568719024567,40.5687203507691,40.5687219992004,40.5687269508766,40.5687313007243,40.5687353425472,40.5687385676729,40.5687431035599,40.5687470621304,40.5687496990614,40.5687520905806,40.5687542645662,40.5687555931977,40.5687565269165,40.56875826193,40.5687596993502,40.5687615155758,40.5687639323351,40.5687664941484,40.5687683374197,40.5687708975059,40.5687729533875,40.5687740550637,40.5687747799895,40.5687752154914,40.5687756984129,40.5687757415872,40.5687755815162,40.5687704815694,40.5687688191325,40.5687671017092,40.5687654035108,40.5687640461861,40.5687622739516,40.5687600606022,40.568757412285,40.568752992607,40.5687506745848,40.5687476688432,40.5687449872641,40.5687424236942,40.5687376673452,40.5687342940249,40.5687323839827,40.5687306907947,40.5687287791058,40.5687265597264,40.5687236796472,40.5687212719086,40.5687191327765,40.5687189422923,40.5687167519446,40.5687137093024,40.5687095064521,40.5687055327295,40.5687033544717,40.5687017156838,40.5687005459479,40.5686995387692,40.56869867385,40.5686954911279,40.5686920637679,40.5686890831542,40.5686852965685,40.5686839981472,40.5686826460573,40.568680428062,40.5686776329427,40.5686758812426,40.5686743799433,40.568673924313,40.5686746995943,40.5686756741239,40.5686770761908,40.5686778628821,40.5686783931685,40.5686786959674,40.5686786342053,40.5686785401946,40.5686785733477,40.5686789141248,40.568678752752,40.5686782459746,40.5686771012359,40.5686754073875,40.5686736580969,40.568673013586,40.5686725803785,40.5686731530312,40.5686732139474,40.5686726923172,40.568671621966,40.5686701199338,40.5686678971917,40.568665486463,40.5686634016411,40.5686619549439,40.5686608088038,40.5686603559219,40.5686594655478,40.5686590113858,40.5686582161333,40.5686577963222,40.5686569779698,40.5686567957345,40.5686569130914,40.568657058194,40.5686568750141,40.5686567971085,40.5686566692434,40.5686568390199,40.5686573692035,40.5686582624222,40.5686592265235,40.5686603591895,40.5686607536736,40.5686607867255,40.5686612092485,40.5686622875474,40.5686623975155,40.5686627282273,40.5686633325176,40.5686635226857,40.5686628378086,40.5686624846519,40.5686616031252,40.5686627286327,40.5686645363521,40.5686658388075,40.5686655191825,40.5686650290109,40.568663744857,40.5686623270725,40.5686622158911,40.5686622585732,40.5686626649403,40.5686635276473,40.5686638931022,40.5686641712446,40.5686642863768,40.5686642171869,40.5686640664313,40.5686636893301,40.5686636987246,40.5686636867685,40.5686636274004,40.5686637550941,40.5686636746441,40.5686635442316,40.5686633888701,40.5686642248301,40.5686655458775,40.5686660460004,40.5686658573332,40.5686650986443,40.5686643425215,40.5686640477726,40.5686648324739,40.5686659658065,40.5686667685204,40.5686672479877,40.5686677733886,40.5686678357855,40.5686663128716,40.5686634481851,40.568658164747,40.5686465289411,40.568639939838,40.5686597834547,40.5686938672682,40.568714919825,40.5687616315576,40.5687822173686,40.5688006300631,40.5688518421286,40.5688608944349,40.5689102509828,40.5689261788313,40.5689583608613,40.5690484404373,40.569134625281,40.5692318389113,40.5692571591455,40.5693143685505,40.569353135603,40.5694594414489,40.5694728894103,40.5695197901716,40.5695804484277,40.5697899600541,40.5699103490379,40.5699506854438,40.5700754511973,40.5702818287635,40.5705294840445,40.5709018998861,40.5711764307631,40.5738357944239,40.5740992189345,40.5746421286126,40.5751192138439,40.5757403158872,40.5760597612556,40.5759330347646,40.5750607221259,40.5750267867217,40.5749881084912,40.574021231946,40.5738230570186]}],[{"lng":[-73.8264466151699,-73.8264240388846,-73.826409148944,-73.8264023882524,-73.8264039579007,-73.8264138111846,-73.8264316549954,-73.8264569585418,-73.8264889691382,-73.8267745715186,-73.8268109736292,-73.8268542600488,-73.826903554368,-73.8269578585428,-73.8270160730999,-73.827138818998,-73.8272582568873,-73.8273738576671,-73.8273754342406,-73.8273726567287,-73.8273655957191,-73.8273544306685,-73.8273394453404,-73.8273210205944,-73.8273183991794,-73.8273183780765,-73.82732095789,-73.8273260648978,-73.8273335531577,-73.8273432086781,-73.8273547555332,-73.8273678637479,-73.8273821587272,-73.8273972319621,-73.827412652703,-73.8274279802693,-73.8274427766428,-73.8274566189861,-73.8274721768597,-73.8274889988386,-73.8275066175252,-73.8275245433863,-73.8275422783537,-73.8275593296631,-73.8275752235457,-73.8275895183906,-73.8276018170165,-73.8276117777059,-73.8276191237002,-73.8276324661377,-73.8276384901483,-73.8276371662341,-73.8276285008458,-73.8276125363513,-73.8275893508288,-73.8275650983102,-73.8275837736592,-73.8276590590332,-73.8276856320368,-73.8276910846794,-73.8276890592571,-73.8276595866904,-73.8276057568093,-73.8275645924924,-73.8275385388044,-73.8275063197856,-73.827487546321,-73.8274044686059,-73.8273167163783,-73.8272245326945,-73.827128172889,-73.8270954250752,-73.8270705876396,-73.8270542620837,-73.8270468437804,-73.8270485123964,-73.827059227541,-73.8270787297415,-73.8271065467253,-73.827142004856,-73.8271842454459,-73.8272132846494,-73.8272398299138,-73.8272631859841,-73.8272827411338,-73.8272979831854,-73.8273085129256,-73.8273140545621,-73.8273144629463,-73.8273097273768,-73.8272999718794,-73.827285451959,-73.8271634843302,-73.8270377253784,-73.8269085061516,-73.8267761668089,-73.8266410557258,-73.8265805854527,-73.8265235546353,-73.8264710021977,-73.8264238854856,-73.8262794035911,-73.8261325699972,-73.8259835640645,-73.825832567809,-73.8257733905231,-73.8257127961049,-73.8256521472104,-73.8255928077208,-73.8255361120694,-73.825483335233,-73.8254778068992,-73.8254810161954,-73.8254928832813,-73.8255131129744,-73.8255412020934,-73.8255764519756,-73.8256179858545,-73.8257717806162,-73.825923765129,-73.8260737939732,-73.8261539972392,-73.8262388708766,-73.8263277408655,-73.8263721615108,-73.8264100891568,-73.8264413295603,-73.8264657227315,-73.8264831437534,-73.82649350342,-73.8264967486946,-73.826481081676,-73.8264690122262,-73.8264608629555,-73.8264568516882,-73.8264570856405,-73.8264615585555,-73.8264734770454,-73.8264779479213,-73.8264749345779,-73.8264644617222,-73.8264466151699],"lat":[40.5905274419383,40.5904948305249,40.5904597468813,40.5904232346086,40.5903863798021,40.5903502787441,40.5903160052946,40.5902845789477,40.590256934507,40.5900320080855,40.5899930515317,40.5899584279949,40.5899288384811,40.5899048820744,40.5898870438075,40.5898522499394,40.5898113085554,40.5897644010249,40.5897851920489,40.5898059098625,40.5898260279097,40.5898450348777,40.5898624476918,40.5898778237937,40.5898894227734,40.5899011926368,40.589912797036,40.5899239043515,40.5899341971687,40.5899433813487,40.5899511944346,40.5899574131507,40.5899618597842,40.589964407263,40.5899649827875,40.5899635699108,40.5899602090091,40.5899549961269,40.589948202698,40.5899434737459,40.5899409406642,40.5899406738343,40.5899426806702,40.589946905412,40.5899532306756,40.5899614807143,40.5899714263014,40.5899827910996,40.5899952593385,40.5900747164178,40.5901546901369,40.5902347892405,40.590314621858,40.5903937974217,40.5904719285769,40.5905029272137,40.5905154633333,40.5905340998551,40.5905499134577,40.5905599797773,40.5905685405189,40.5905682405013,40.5905457181564,40.590539580594,40.5905412997168,40.5905780559365,40.5906020520022,40.590671450305,40.5907374204632,40.590799779742,40.5908583554083,40.5908952755087,40.5909356217134,40.5909784169605,40.5910226248772,40.5910671748786,40.5911109880931,40.5911530034899,40.5911922035743,40.5912276390289,40.5912584517036,40.5912684406835,40.5912818697264,40.5912983871094,40.5913175602218,40.5913388868954,40.5913618085577,40.5913857248602,40.5914100094031,40.5914340261412,40.5914571460426,40.5914787635646,40.5915374981126,40.5915913865029,40.5916402868759,40.5916840705026,40.5917226221235,40.5917389747956,40.5917613861133,40.5917894478133,40.5918226486999,40.5918758734356,40.591925216839,40.5919706186343,40.5920120233606,40.592022639587,40.5920263905439,40.5920231918791,40.5920131155247,40.5919963880791,40.5919733857111,40.5919313528604,40.5918891801707,40.5918479165941,40.5918085884684,40.59177217399,40.5917395788835,40.5917116138742,40.5916688109091,40.5916224023878,40.5915724327159,40.5915297136688,40.5914926073555,40.5914614084508,40.5913934154052,40.5913231745608,40.5912510456884,40.5911773982283,40.5911026093976,40.5910270622581,40.5909511437545,40.5909352924386,40.5909177068605,40.5908988570783,40.5908792469409,40.5908594006217,40.5908398486061,40.5907774683789,40.590714522148,40.5906515255814,40.5905889947575,40.5905274419383]}],[{"lng":[-73.831932772558,-73.8311688264468,-73.8335737606269,-73.8336682241384,-73.8338245825864,-73.8339174071754,-73.8339660025802,-73.8340730885172,-73.8342548865104,-73.8344717827975,-73.8345867378274,-73.8347010349452,-73.8348388970334,-73.8349085013809,-73.8349889242451,-73.835095355346,-73.835094333903,-73.8351907839241,-73.8353435459553,-73.8354647651059,-73.8355986592411,-73.8356843282124,-73.835758633,-73.8358352907319,-73.8359470545489,-73.8359939282658,-73.8360443392151,-73.8360821890045,-73.8361404776635,-73.8361855895902,-73.8362324354899,-73.8362988522651,-73.8363419996488,-73.8363914851874,-73.836434748037,-73.836468843554,-73.8365018394166,-73.8365607440234,-73.8366262943397,-73.8366687671486,-73.8366983168281,-73.8367781405654,-73.8367965366244,-73.8368794996991,-73.8369219739223,-73.8369281952527,-73.8369343590982,-73.8369339352202,-73.8369192957425,-73.8369460694565,-73.8369961146231,-73.8370035687303,-73.8370334255378,-73.837082486858,-73.8371076630753,-73.8371948261411,-73.8372807565615,-73.8373860066472,-73.8376239778754,-73.8376250384774,-73.8376765084418,-73.8377596072059,-73.8377882930504,-73.8379162520189,-73.8380141263411,-73.8380675611283,-73.838093065978,-73.838134635535,-73.8381559622236,-73.838152790122,-73.8381470057435,-73.838800851447,-73.8388324144641,-73.838823432179,-73.8387819068649,-73.8387582837066,-73.8386083939724,-73.8383872250273,-73.838395273036,-73.8384159762752,-73.8386152608046,-73.8386858739932,-73.8387970929377,-73.8388467809664,-73.838875451339,-73.838923194169,-73.8390887815876,-73.8393269282162,-73.8395559412879,-73.8396364380357,-73.8396540288728,-73.8396673695604,-73.8396886757134,-73.839771968374,-73.8398963540131,-73.8399568578053,-73.8401774083174,-73.8405762419087,-73.8406261366941,-73.8406237108017,-73.8405868557223,-73.8404907300312,-73.8405045146487,-73.8410132277108,-73.8413649663431,-73.8417983529499,-73.8417576104164,-73.8421530904042,-73.8423793311594,-73.8424148693954,-73.8424367857282,-73.8424370930035,-73.8425648631712,-73.8426447135369,-73.842728949355,-73.8427511780047,-73.8427900062687,-73.8429663145242,-73.8431269638554,-73.8431936661326,-73.8433647041955,-73.8435006569797,-73.8407376339097,-73.8405697216373,-73.8374583348024,-73.8365869890018,-73.8362742528854,-73.8359859742979,-73.8356978802487,-73.8353490065424,-73.8349280277956,-73.8347598570629,-73.8347602661448,-73.8343993050648,-73.8340000196425,-73.831932772558],"lat":[40.5934477969242,40.5914881443093,40.5890351718492,40.5890483777829,40.5890702369472,40.589083212968,40.5891287036585,40.5891420345488,40.5891303899289,40.5891607093191,40.5891221649679,40.5891531557356,40.5892120280403,40.589279557561,40.5893147120665,40.58931399203,40.5893529772162,40.5893817467402,40.5893700307698,40.5893515940492,40.5893766420646,40.5893873064044,40.5893825861093,40.5893513054665,40.5893669272337,40.5893957531159,40.5894066796352,40.5894031555388,40.5894152998017,40.589409147771,40.589445786259,40.5894766979694,40.5894902517631,40.5894954067573,40.5894777122221,40.5894667287597,40.5894968467744,40.5895128388499,40.5895223544359,40.5895476856509,40.5895722678881,40.5895589789368,40.5895299326507,40.589520256508,40.5895455871286,40.5895684371106,40.5896069104855,40.5896362352694,40.589672740803,40.5896800102135,40.589704636198,40.589735180548,40.5897616862062,40.5897961656855,40.589809441242,40.5898579441353,40.5898987525928,40.5899162861355,40.5900268903025,40.5900814585326,40.5901469513887,40.5901860703058,40.5901894774792,40.5902046760674,40.5902560858425,40.5903018721065,40.5903971159437,40.5904967214212,40.5906138311803,40.5906563003178,40.5907337598552,40.5911977653703,40.5911841454304,40.5911249427941,40.5910673210475,40.5909869975142,40.5907537405576,40.5904161700562,40.5903917525474,40.5903872434538,40.5904862289287,40.5905497324972,40.5906271240685,40.590646691694,40.590615994579,40.5906146556066,40.5907051702981,40.5908664148532,40.591042334815,40.5910884303621,40.5910924530032,40.5911078084471,40.5911413923346,40.591206584528,40.59124597071,40.5912518592241,40.5913119233156,40.5915269031144,40.5915345550497,40.5914940098688,40.5914555035096,40.5912281047137,40.5912066517522,40.5915473237824,40.5918457978923,40.5920075961524,40.5920972358706,40.5923096435194,40.592478318069,40.5925708628792,40.5927164839653,40.5928728453879,40.5928601962943,40.5929535383583,40.5930760038358,40.5931979908871,40.593327379146,40.593341467201,40.5933672511261,40.5934632181329,40.5934701438688,40.5950841097559,40.5971737199489,40.5973007027942,40.596862867843,40.5958112711257,40.595599593064,40.5952410032274,40.5948089411707,40.5945972077124,40.5943118973807,40.5941096068619,40.5939442945016,40.5937509090235,40.5936197131525,40.5934477969242]}],[{"lng":[-73.8099705940606,-73.8100013294844,-73.8100693044022,-73.8101441752304,-73.8101443079841,-73.8101069792286,-73.8100492795985,-73.8099881323256,-73.8099746525173,-73.8100529543002,-73.8101005362172,-73.8101311091979,-73.8101889643458,-73.8102231105826,-73.8102402580587,-73.8102438004538,-73.8102404865728,-73.8102269559029,-73.810267782702,-73.8102949385732,-73.8103018397034,-73.8103019870831,-73.8102851056618,-73.8102546285999,-73.8102547907584,-73.8102550339963,-73.8103300132373,-73.8103574053884,-73.8103474029703,-73.8103305658313,-73.81030695227,-73.8102901158607,-73.8103310668464,-73.8103889881454,-73.8104163272101,-73.8104096471615,-73.8104880810819,-73.8105868483028,-73.8106856684497,-73.8107844156081,-73.8108593790579,-73.8109003668611,-73.8109616972454,-73.8110433560139,-73.8111181504355,-73.8111797413363,-73.8112202255586,-73.8113156054143,-73.8113871961231,-73.811417982163,-73.8114896519202,-73.8115237959287,-73.8115341737503,-73.8115086199738,-73.8115755034552,-73.8117281147511,-73.8117892258254,-73.811938748309,-73.8120576696929,-73.8122207328776,-73.812224046748,-73.8122103489912,-73.8122238643905,-73.812244171764,-73.8122678748163,-73.8122881895316,-73.8123967142286,-73.8125324601858,-73.8126104408961,-73.8127292041678,-73.8129736235998,-73.8130536962747,-73.8130706166164,-73.8131989936139,-73.8132938509618,-73.8134670293962,-73.8135788337239,-73.8135953012102,-73.8137352480731,-73.8137798346891,-73.8139139273092,-73.8140089309657,-73.8141038635366,-73.8142100772522,-73.8142937779244,-73.8145120609477,-73.8146071255904,-73.814707498835,-73.8147742443317,-73.8148410149893,-73.8148967064153,-73.8150147156856,-73.8149782940831,-73.8149854217502,-73.8150130073835,-73.8150183991994,-73.8150181388147,-73.8149954122192,-73.8149671753706,-73.8149669385913,-73.8149162234836,-73.8149159511106,-73.814926852392,-73.8149432292706,-73.8149484189157,-73.8149312494922,-73.8148692172275,-73.8148406371023,-73.8148011774958,-73.8147057650676,-73.814548734198,-73.8144422299799,-73.8144308425367,-73.8144081731411,-73.8142869369858,-73.8133966522334,-73.8132086239475,-73.8130799510939,-73.8129011820515,-73.8126662578459,-73.8123919095857,-73.8120614408769,-73.8117029976751,-73.8114232271991,-73.811098511924,-73.8108536518665,-73.8107234648387,-73.8105164156457,-73.8103263268261,-73.810169588196,-73.810035487525,-73.8100806775802,-73.8100865862214,-73.810075984767,-73.8099082936959,-73.8098633385732,-73.8099214611191,-73.8099965835328,-73.8100342593774,-73.8100345324261,-73.8100244640393,-73.8099498291988,-73.809912581666,-73.8099433702624,-73.809994590248,-73.8100391457443,-73.8100359124071,-73.8100429323148,-73.8100261835713,-73.8099787722712,-73.8099382179838,-73.8099281721657,-73.8098910060967,-73.8098605349629,-73.809850645024,-73.8098814545094,-73.8099394362194,-73.8099905520963,-73.8100008866392,-73.8100147118702,-73.8099705940606],"lat":[40.6000675373802,40.6000286828153,40.6000573257895,40.6000548556422,40.6000081688998,40.5999717952002,40.5999198251643,40.5998834120547,40.5998367028039,40.5998238636205,40.5998446917928,40.5998628986558,40.5998604003661,40.5998189570124,40.5997722983647,40.5997230235586,40.5996918936122,40.5996633401523,40.5996660014225,40.5996893896501,40.5996556822047,40.5996038084351,40.5995570936048,40.599505168773,40.5994481073073,40.5993625148569,40.5993211393835,40.5992615289946,40.5991888882644,40.5991266105198,40.5990539473201,40.5989916700724,40.5989502379169,40.5989243962373,40.5988829420946,40.5988388379677,40.598779311237,40.5987483495902,40.5986992315959,40.5986760508239,40.5986398615255,40.5985854610998,40.598557030881,40.598559759036,40.598583225391,40.5985848923351,40.5985859869742,40.5985498315847,40.5985032621373,40.5984462504205,40.5983711504213,40.598329706674,40.5982700680956,40.5982161835272,40.5981411992596,40.598275573709,40.5983249539675,40.5983952302902,40.5984576736234,40.5985539084778,40.598585037699,40.5986161402956,40.5986498807163,40.5986888197842,40.5987303577529,40.5987667031323,40.5988965668044,40.5990264742773,40.5991277567963,40.5992472615708,40.5994551579924,40.5995037120154,40.5995963267413,40.5997844990842,40.5999341693057,40.6001352296224,40.600237936587,40.600361848356,40.6004218817888,40.6005116640854,40.6006613973496,40.6007598040106,40.6008838426576,40.6009822679515,40.6011148317813,40.6012219818331,40.6012990292526,40.6014828821846,40.6016666813346,40.601841936479,40.6019701832264,40.6020562910611,40.6021763691585,40.6023163496653,40.6024744534352,40.6025513561295,40.6026453372286,40.6027563701697,40.602833218726,40.602918655858,40.6030168277126,40.6031150807893,40.6032261673598,40.6033842542543,40.6035337786268,40.6036619079951,40.6037985086017,40.6039992409065,40.6040803433335,40.6041271800476,40.6041611022749,40.6041652018693,40.6042292619877,40.604318935389,40.6044556662216,40.6043640722455,40.6043554390855,40.6042697918807,40.6040601784778,40.603888919775,40.6037859479234,40.6037085139897,40.6036139452695,40.6034468825287,40.6033181922461,40.6032237130143,40.6031509716553,40.6030352894494,40.6028683718439,40.6027997630425,40.6026542969203,40.6025304865655,40.6024236992953,40.6022100878724,40.6020517505721,40.6018957895053,40.6017870948398,40.6016964385096,40.6016109079579,40.6015149401376,40.6014656433503,40.6013851141657,40.6013202099329,40.6012631991294,40.601201033877,40.6010895779422,40.6010299170134,40.6009547100426,40.600861308442,40.6007808249385,40.6006821964081,40.6006251180666,40.6005316821705,40.6004771638922,40.6003656167586,40.6003008250928,40.6002542340363,40.6002283813038,40.6001843047859,40.6001091095641,40.6000675373802]}],[{"lng":[-73.8003180772991,-73.8002416025982,-73.800161461991,-73.8000922561732,-73.8000304270933,-73.8000158987901,-73.7999868927615,-73.7999467332933,-73.7998957324949,-73.7998520568149,-73.7998157069352,-73.7997721645037,-73.7997467678912,-73.7997174956049,-73.7996301444238,-73.7995391591198,-73.7994882229042,-73.7993790018735,-73.799277023314,-73.7992187947082,-73.7991604740487,-73.7990512023445,-73.7989819969837,-73.7989091482292,-73.7988290071778,-73.7987270279924,-73.7986323336235,-73.798519461301,-73.7984758446317,-73.7983957278909,-73.7983265400201,-73.7983412104687,-73.7983704668227,-73.7983596652858,-73.798319607216,-73.7982757300536,-73.7981820476248,-73.7980644884188,-73.7980136040354,-73.7979518258022,-73.7979273649887,-73.7979426912835,-73.7979698634872,-73.7979943189259,-73.7980160832624,-73.7980215877423,-73.7980257662997,-73.7980340131649,-73.7980517640498,-73.798080341464,-73.7981075597061,-73.7981469787728,-73.7982311269372,-73.7982339114549,-73.7982448318519,-73.798285572923,-73.7983371850514,-73.7983779180054,-73.7984091870797,-73.7983971092265,-73.7983972183874,-73.7983919565085,-73.7983920531955,-73.7983921561207,-73.7983814107201,-73.7983490210242,-73.798334202255,-73.7983180493345,-73.7982951121297,-73.7982843962099,-73.7982655576332,-73.7982439223327,-73.7982358560726,-73.7982521627214,-73.7982657542499,-73.7982955365084,-73.798344268587,-73.7983875612852,-73.7984430237766,-73.7984808653318,-73.7985255261675,-73.7985796254701,-73.7986147940675,-73.7986770784641,-73.7987204561345,-73.7987760543556,-73.7988262411912,-73.7988669559235,-73.7989211767465,-73.7989658968257,-73.7990052652703,-73.7990663096039,-73.7991097797623,-73.7991248194793,-73.7991533843592,-73.7991955174803,-73.7992375928549,-73.7992783122107,-73.7993542250587,-73.7994233623166,-73.7995005965651,-73.7995264345793,-73.7995373248973,-73.7995807928576,-73.7996092568875,-73.7996539488469,-73.7997162787724,-73.7997447472184,-73.7997854543903,-73.7998179890649,-73.7998667351019,-73.799930358677,-73.7999709261181,-73.7999884694486,-73.8000127722431,-73.8000438382688,-73.8000532809991,-73.8000587907299,-73.8000697348277,-73.800098276194,-73.8001132794205,-73.8001092807899,-73.8000700224731,-73.8000429537867,-73.8000103713998,-73.7999737981392,-73.7999318473195,-73.7998953291408,-73.7998655345754,-73.7998303215615,-73.7997991628213,-73.799772035791,-73.7997395184036,-73.7997002442668,-73.7996650498738,-73.7996175864075,-73.7995633985349,-73.7995254356845,-73.799503686087,-73.7994819163236,-73.7994696363223,-73.7994506241726,-73.799376115957,-73.7993245956843,-73.7992798416559,-73.7992188355535,-73.7991808506374,-73.7991360592711,-73.7991075481351,-73.7991074673323,-73.7990924729266,-73.7990720693405,-73.7990475819837,-73.7990122678526,-73.798966105199,-73.7989186475901,-73.798849516071,-73.7988034126759,-73.7987789771603,-73.7987410202471,-73.7987071409265,-73.7986583899861,-73.7986028837387,-73.7985487564328,-73.7985000492051,-73.7984540204107,-73.7983904345842,-73.7983363096876,-73.7982767612478,-73.7982117663163,-73.7981440062972,-73.798099292621,-73.798049183915,-73.7979937255416,-73.7979517904541,-73.7979207130431,-73.7978815163872,-73.7978707382413,-73.797840950779,-73.7978261216346,-73.7978126574357,-73.7978114220631,-73.7978155749749,-73.7978333106925,-73.7978442726542,-73.7978497902558,-73.7978688539869,-73.7978757195449,-73.7978785275678,-73.7979043342041,-73.7979383160978,-73.7979844680148,-73.7980373536493,-73.7981322039886,-73.7981742030707,-73.798222978999,-73.7982513804507,-73.7982567268447,-73.79828516577,-73.798296071922,-73.7983232283787,-73.7983598473948,-73.7983964608225,-73.798433053951,-73.7984750537072,-73.7985157197417,-73.7985414894139,-73.7985537292001,-73.7985808780144,-73.7986242246108,-73.7986621243401,-73.7986756411206,-73.7986850716699,-73.7986619654896,-73.7986618845081,-73.7986740254948,-73.7986875451891,-73.7986983711261,-73.7986982839291,-73.7986914361085,-73.7986791932067,-73.7987035637813,-73.7987225486253,-73.7987375079592,-73.7987578165453,-73.7987685918107,-73.7988011277275,-73.7988255730119,-73.7988270125873,-73.7988121528792,-73.7987878290061,-73.7987634771295,-73.7987649214168,-73.7987961484153,-73.7988422484093,-73.7988801986573,-73.7989507002855,-73.79900356333,-73.7990510235051,-73.7990916872664,-73.7991147613276,-73.7991282446604,-73.7991403538123,-73.799160637542,-73.7991756162552,-73.7992081922297,-73.7992610477268,-73.7993099112903,-73.7993289916174,-73.799323616894,-73.7993493678242,-73.7993832684343,-73.799436196538,-73.7994877347172,-73.7995270421877,-73.7995392848392,-73.7995664067883,-73.7995934567644,-73.7996232634553,-73.7996422970892,-73.7996721788109,-73.799708807691,-73.7997494859259,-73.799805046574,-73.7998551896971,-73.7998931740657,-73.7999379460762,-73.799985381192,-73.8000219671042,-73.8000585059631,-73.8000624877492,-73.8000921559294,-73.8001123927741,-73.8001448511763,-73.8001352477446,-73.8001541489632,-73.8002055914621,-73.8002719498479,-73.8003302241844,-73.800370929601,-73.8003953821237,-73.8004131162409,-73.8004564678451,-73.8004863202351,-73.8004267411482,-73.8003942056775,-73.8003589094874,-73.8003303848085,-73.8002869767112,-73.8002355035257,-73.800196263373,-73.8001787269645,-73.8001707133833,-73.8001491364348,-73.8001357362669,-73.8001480034991,-73.8001196352005,-73.8000465016262,-73.7999651778212,-73.7999041941838,-73.7998513345046,-73.7997672953798,-73.7996670147624,-73.7996195300627,-73.7995774805764,-73.7995313662152,-73.7994689678219,-73.7994133723796,-73.799376756734,-73.7993211743351,-73.7992696607751,-73.7992275987453,-73.7991828482367,-73.7991096365942,-73.7990499788331,-73.7990038929301,-73.7989510330814,-73.7989076436106,-73.7988723918437,-73.7988236221815,-73.7987897501936,-73.7987559220092,-73.7987288435651,-73.7987085724319,-73.7986855637387,-73.798651706694,-73.7986015635264,-73.79855006859,-73.7984836336903,-73.7984199450733,-73.798357599301,-73.798323683892,-73.7982911137698,-73.7982409455934,-73.7982002718239,-73.7981623503839,-73.7981258150616,-73.7981000984867,-73.7980675782977,-73.7980187937692,-73.7979496608389,-73.7979008379109,-73.7978655262092,-73.7978491771974,-73.7978111956846,-73.7977975760533,-73.7977703193682,-73.7977580387325,-73.7977321757373,-73.7977075674547,-73.7976938905336,-73.7976680080044,-73.7976407104088,-73.7976418749967,-73.7976593478982,-73.797663260297,-73.7977105209434,-73.7977510793726,-73.7978092782755,-73.7978552818313,-73.7978890791069,-73.7979351099793,-73.7979716146392,-73.7980162502601,-73.7980582316938,-73.798079852214,-73.7981163661322,-73.7981514908248,-73.7981473313438,-73.7980917861249,-73.7980335766633,-73.7980186111887,-73.7980591592515,-73.7981268327633,-73.7981755058527,-73.7981876053945,-73.7982010199235,-73.798215835326,-73.7982170660229,-73.798215619929,-73.7981803052435,-73.7981517615046,-73.7981151043512,-73.7980825110179,-73.7980485328304,-73.7980172987997,-73.7979833569541,-73.797949399241,-73.7979046006727,-73.7978963794328,-73.7978800421482,-73.7978555711508,-73.7978446393925,-73.7978011605381,-73.7977767426572,-73.7977401290026,-73.7977102590563,-73.7976614342219,-73.7975991190537,-73.7975517765906,-73.7975057788058,-73.7974665786536,-73.7974355229687,-73.7973976728563,-73.7973611745525,-73.7973246471868,-73.7973002976378,-73.7972692922905,-73.7972585016599,-73.7972340681225,-73.7971988267305,-73.7971406249961,-73.797093243738,-73.7970485642183,-73.7970188236234,-73.7969768826645,-73.7969471125288,-73.7969010303918,-73.7968522606569,-73.7967940198831,-73.7967764914865,-73.7967318058182,-73.7966992661949,-73.7966544987561,-73.7966151733854,-73.7965840144819,-73.7965434387201,-73.7965204506326,-73.7964879689897,-73.7964568749261,-73.7963675453999,-73.7963476113365,-73.7963332599561,-73.7963327639753,-73.796332402659,-73.7963315207439,-73.7963258190827,-73.7963143733081,-73.7963144425882,-73.7963337381519,-73.7963444524111,-73.7963454654649,-73.7963743328114,-73.7963937087477,-73.7964053488634,-73.796413109226,-73.7964228074372,-73.7964297135572,-73.7964250017125,-73.7964376190698,-73.7964415456951,-73.7964676560527,-73.7964850582491,-73.7965071899393,-73.7965494728297,-73.7965821029153,-73.7966118138811,-73.7966319341009,-73.7966608168682,-73.7966908053574,-73.7966937599445,-73.7966592491597,-73.7966352925658,-73.7966151679298,-73.7965930987771,-73.7965662510091,-73.7965643933092,-73.7965509983408,-73.7965116836066,-73.796482920613,-73.7964503087602,-73.7964157570726,-73.7963783284707,-73.7963389296226,-73.7963351265723,-73.7963409622322,-73.7963583447274,-73.7963689882222,-73.7963555665453,-73.7963253488531,-73.7962940460296,-73.7962699577963,-73.7962535702298,-73.796236266596,-73.796204554399,-73.796184410718,-73.7961623529085,-73.7961489402129,-73.7961384011068,-73.7961125268627,-73.7961145228829,-73.7961318602634,-73.7961415182277,-73.7961444506183,-73.7961521723028,-73.7961656364128,-73.7961742412475,-73.7962020647379,-73.7962308780367,-73.796249121628,-73.7962750949126,-73.7962924224004,-73.7963078029201,-73.7963202577558,-73.796310590012,-73.7963105408479,-73.7963383829273,-73.7963585614497,-73.7963814128491,-73.7964037297118,-73.7964210913949,-73.7964518747404,-73.7964875128082,-73.7964922218726,-73.7965001543482,-73.7965203971443,-73.7965348755768,-73.7965570204574,-73.7965945292835,-73.7966164717066,-73.7966271957047,-73.7966512658675,-73.7966497007729,-73.7966465533153,-73.7966398580826,-73.7966783657723,-73.7966514532748,-73.7966264676514,-73.7965966780089,-73.7965717214027,-73.7965621430051,-73.7965650529678,-73.7965766303202,-73.7966016516302,-73.7966381721735,-73.7966564328849,-73.7966987242453,-73.7967266086362,-73.7967477971232,-73.7967622642931,-73.79678247039,-73.7967930021973,-73.7967919542625,-73.796796250131,-73.7967995888623,-73.7967822340538,-73.7967600736411,-73.7967657864865,-73.7967965206415,-73.7968177046796,-73.79684278615,-73.7968735693254,-73.7968918855338,-73.796893869679,-73.7968996745739,-73.7969275834486,-73.7969439611791,-73.7969295898624,-73.7969316413976,-73.7969335391727,-73.7969355411295,-73.7969783187023,-73.7970171923834,-73.7970565982615,-73.7970634627531,-73.7970644709744,-73.7970654882381,-73.7970829045887,-73.7971319444586,-73.797143197327,-73.797159748603,-73.7971789143851,-73.797196174915,-73.7972375060371,-73.7972596767014,-73.7972559148533,-73.7972463995811,-73.7972435170829,-73.7972667819291,-73.7973190117819,-73.7973458661577,-73.7973875919342,-73.7974526315979,-73.7975050576428,-73.7975312217275,-73.7975272543143,-73.7975641206447,-73.7975971356108,-73.797678805056,-73.7977321327159,-73.7977796176802,-73.7978562944714,-73.7979281469625,-73.7980048052208,-73.7981127410952,-73.7981535357765,-73.7981798000765,-73.7982254246876,-73.7982827089458,-73.7983370381187,-73.7983739502152,-73.7984167337774,-73.7984701457195,-73.7985186979463,-73.7985681540566,-73.7986117767237,-73.7986719439482,-73.7987457315222,-73.7988205084829,-73.7988788158436,-73.7989098875083,-73.7989147848904,-73.7989049775625,-73.7988993465834,-73.7988896873687,-73.7988994491279,-73.7989295795502,-73.7989655064194,-73.7989858670623,-73.7990178752678,-73.799031405894,-73.7990352030064,-73.7990855738474,-73.7991253005398,-73.7991689165631,-73.7992339786189,-73.7992573262966,-73.7992864798443,-73.7993271813043,-73.7993727378358,-73.7994484368495,-73.7994940292417,-73.7995882249084,-73.7996454696167,-73.7997221840161,-73.7997562150075,-73.7998203322159,-73.7998717980813,-73.799916505322,-73.7999660485046,-73.8000020153994,-73.8000331130668,-73.8000506342304,-73.8000759611594,-73.800136112539,-73.8001981467445,-73.8002467352106,-73.8002699514023,-73.8003252554858,-73.8003747284212,-73.8004796798049,-73.8005409413481,-73.800565766913,-73.8005965508542,-73.8005995519493,-73.8006200516823,-73.8006666901031,-73.8006899124739,-73.8006956428462,-73.8006984263309,-73.8007275588744,-73.8007479732496,-73.8007480395605,-73.8007569573225,-73.8007570766803,-73.8007891909575,-73.8008591518957,-73.8009144959021,-73.8009698531806,-73.8009755843501,-73.8009608952028,-73.8009578611436,-73.8010073681303,-73.8010685626969,-73.8010920176737,-73.8010950516532,-73.8011417093328,-73.801200080769,-73.801229134607,-73.8012554712006,-73.8012584735482,-73.801290627393,-73.8013313949752,-73.8013896876332,-73.801453863901,-73.8015413551828,-73.801602616361,-73.8015852225344,-73.8015969964764,-73.8016465694772,-73.8017136478666,-73.8017193263826,-73.8017279602002,-73.8017336910847,-73.8017773091723,-73.8018473873693,-73.8018882739907,-73.8019291801373,-73.8020020815953,-73.8020778071807,-73.8021506230438,-73.8021972147678,-73.8022467753095,-73.8022466765885,-73.8022669454521,-73.8022638661096,-73.8022880860892,-73.8023133135875,-73.8023178607617,-73.8023280875111,-73.8023603731564,-73.8024246470238,-73.802482874017,-73.8025294139368,-73.8025409501311,-73.8025787966771,-73.8026568454328,-73.8026864649595,-73.8027096299704,-73.8027240811416,-73.8027620197412,-73.8027796430885,-73.8028233852736,-73.8029049739326,-73.8030011333053,-73.8030914945034,-73.8031643634246,-73.8031846729565,-73.8031874626799,-73.8032195123824,-73.8032400701458,-73.8032635885403,-73.8033336938031,-73.8033745987384,-73.8033768366878,-73.8033806262441,-73.803468169643,-73.8035906054811,-73.803663421939,-73.8037275521011,-73.8037704050587,-73.8038118323422,-73.8037951829759,-73.8037605549707,-73.80373125377,-73.803712862494,-73.8036945031717,-73.8036325853219,-73.8036142755804,-73.8035741282081,-73.8035304779365,-73.8035048923853,-73.8034611283748,-73.8034284044359,-73.8034321857777,-73.8033957704352,-73.8033774048802,-73.8033955088417,-73.8034062813903,-73.8034425808512,-73.803507979872,-73.8035916294773,-73.8036644099714,-73.8036934175706,-73.8037151582345,-73.8037332304883,-73.8037730920233,-73.803783888533,-73.8037254806843,-73.8037034800771,-73.8036815443027,-73.8036486077278,-73.803670258691,-73.8037392994009,-73.8038811547481,-73.8039429919467,-73.8039355455406,-73.8038407540922,-73.8037823628387,-73.8037530930866,-73.8037275486829,-73.8036035285557,-73.8034687287852,-73.8033885243588,-73.8033556281629,-73.8033334798629,-73.8033369008845,-73.8033367291587,-73.8033074432242,-73.8032527264108,-73.8032343833167,-73.8031941536431,-73.8031430203319,-73.8030700992604,-73.8028186930947,-73.8027239177625,-73.8026473541773,-73.8025635128728,-73.8024797551829,-73.8023595805474,-73.802264903629,-73.8021702098431,-73.8020063849581,-73.8019153993945,-73.8018170226687,-73.8017258805504,-73.8016929006441,-73.8016235141357,-73.8015503777232,-73.8014663878606,-73.8013824717057,-73.8012730685089,-73.8011708657649,-73.8010650627405,-73.8009519742597,-73.8008680573912,-73.8007733466785,-73.8006860688771,-73.8006971628586,-73.8006462683366,-73.8005807950569,-73.8005810106541,-73.8006576757775,-73.8007815588606,-73.8009054754491,-73.8009674862933,-73.8009676683637,-73.8009969810744,-73.800968049061,-73.8008843659815,-73.8007969321484,-73.8006878092909,-73.8006624704207,-73.8006444488431,-73.8006954678661,-73.8007499704111,-73.8007789766845,-73.8008553927246,-73.8009464275843,-73.8010337365798,-73.8010775031085,-73.8010740095013,-73.8010304250185,-73.8009576438615,-73.8009432148344,-73.8009176446931,-73.8009283974455,-73.8008700777402,-73.8008300868531,-73.8008120568385,-73.8007685222913,-73.800695724773,-73.8006372725142,-73.8006043751687,-73.8004914286139,-73.8004697066514,-73.8004260479354,-73.8003386392456,-73.8002839294357,-73.8003020328182,-73.8003749216603,-73.8004075874144,-73.8004548548232,-73.8005276275714,-73.8005675948138,-73.800640268193,-73.8006911534352,-73.8007493573187,-73.8008257397457,-73.8008547965173,-73.8007927926577,-73.8006652930049,-73.800574157707,-73.800515713896,-73.8004827990051,-73.8004425507947,-73.8004569872222,-73.8004823261215,-73.8004894542014,-73.8005111499822,-73.8005283665261,-73.8004127644353,-73.8003180772991],"lat":[40.6070644018449,40.6070587161934,40.6070613530116,40.6070612326627,40.6070305891776,40.6070166834141,40.6069722160234,40.607002682562,40.6070053699109,40.6069941895076,40.6069691418642,40.6069135452472,40.6068801884382,40.6069245538486,40.6069021933924,40.6068770504007,40.6068575289707,40.6068406822617,40.606837728751,40.6068209704289,40.6068347485169,40.606834557522,40.6068344365049,40.6068343090718,40.6068369454624,40.6068339902898,40.6068310482926,40.6068169704999,40.6067863575984,40.6067806655044,40.606774991359,40.6067417045352,40.6067028910367,40.6066612317997,40.606658384882,40.6067138298277,40.6067374451691,40.6067079061158,40.606671728007,40.6066244263692,40.6065794048856,40.6065627537689,40.6065400790098,40.6065194651078,40.6064926493885,40.6064647717705,40.6064275969517,40.6063893961273,40.6063450152542,40.6063058169925,40.6062676499929,40.6062284707582,40.6061862722538,40.6061614888103,40.6061356871644,40.6061068394003,40.6060687146532,40.6060429646296,40.6060099687605,40.6059706991039,40.6059345496162,40.6058818654314,40.6058498475337,40.6058157638408,40.6057837274266,40.6057392580343,40.6057103115861,40.6056741342326,40.6056410427582,40.6055997101747,40.6055552652103,40.6055397344411,40.6055180302381,40.6055035992254,40.6054901960965,40.6055005765606,40.6055182205045,40.6055420516345,40.6055752008047,40.605609351035,40.6056290523967,40.6056642642467,40.6056860159167,40.6057036829617,40.6056996274914,40.605687331517,40.6056719265809,40.6056523736026,40.6056473038773,40.6056473821076,40.6056247282676,40.6056041787876,40.6055691377488,40.6055247514664,40.6054896855319,40.6054484448732,40.6054268290048,40.6054052095801,40.6053970802471,40.6053889373643,40.6053921710853,40.6053622632247,40.6053457567763,40.6053117487096,40.605309732703,40.6053191061581,40.6053212804309,40.6053182317467,40.6053007447386,40.6052966699653,40.6053101813407,40.6053330146382,40.6053620050263,40.60538682389,40.6054168186092,40.6054509565344,40.6054654331019,40.6054354897556,40.6054014249205,40.605373587943,40.6053415958021,40.6053188663212,40.6053053710508,40.6052939626134,40.6053135301591,40.6053083019146,40.6052886051629,40.6052647859071,40.6052585367782,40.6052512457207,40.6052480936618,40.6052563087928,40.6052541863324,40.6052458550043,40.6052323666777,40.6052436451157,40.6052373540468,40.6052434844159,40.6052661691711,40.6052950509703,40.6053229161686,40.6053363099812,40.6053279170561,40.6053360900013,40.6053473731982,40.6053555295295,40.6053688896489,40.6053925677288,40.6054100758254,40.6054369291532,40.605465822721,40.6054916085402,40.605522551312,40.605549343031,40.6055781820729,40.6055873945942,40.605593470875,40.6056026857188,40.605617102578,40.6056211675627,40.6056211082318,40.6056096621625,40.6055909731601,40.6055650574828,40.6055391506124,40.6055235771137,40.605488349736,40.605461400138,40.6054354741497,40.6054178021277,40.6054187162955,40.6054165714475,40.6054061552182,40.6053719738824,40.6053471125056,40.6053171049349,40.6052829521354,40.6052622762912,40.6052539615136,40.6052281139403,40.6051991704758,40.6051599203296,40.6051310078557,40.6050917910812,40.6050515299052,40.6050195208695,40.6049896019667,40.6049596611066,40.6049276484767,40.6049080696196,40.6048740454911,40.6048483051319,40.6048370373987,40.6048403023248,40.6048434750456,40.6048466589788,40.6048652999212,40.604890097641,40.6048963448084,40.6048746739047,40.6048571631289,40.6048468991866,40.6048387005266,40.6048377320575,40.6048409039994,40.6048368438523,40.6048296597926,40.6048152211053,40.604799775894,40.6048060484323,40.6048205756428,40.6048319599987,40.6048505676012,40.6048732503247,40.6049001036536,40.604918716005,40.6049290683828,40.6049342514415,40.6049631710682,40.6049869142542,40.6050023856023,40.605009658694,40.6050055598282,40.6049880275937,40.6049942609088,40.6050159691492,40.6050118946659,40.6049943795281,40.604966495423,40.6049509766195,40.6049282108396,40.6049147412175,40.604884791315,40.6048652217484,40.6048570400562,40.6048550413356,40.6048438028346,40.6048397638504,40.6048295181445,40.6048264914466,40.6048141372769,40.6048368828689,40.6048658238114,40.6048803200693,40.6048565898904,40.6048390888781,40.6048371148984,40.6048113799166,40.6047752630475,40.6047597608702,40.604758773848,40.604751602622,40.6047258735085,40.6047115037963,40.6047084740757,40.6046930026368,40.6046868526878,40.6047044584573,40.6047065767362,40.6046859525265,40.6046632825891,40.6046499187714,40.6046417267643,40.6046418235568,40.6046408782365,40.6046275173906,40.6046100374054,40.6046080536575,40.6046091504764,40.6046257393244,40.6046536335463,40.604702227998,40.6047322161289,40.6047539621166,40.6047931938915,40.6048169819384,40.6048346298073,40.6048492047818,40.6048482740543,40.604830785663,40.6048112038957,40.6047719867218,40.6047761934416,40.6047628182809,40.6047472220477,40.6047512976618,40.6047718925753,40.604794566221,40.6048089497683,40.6048016305783,40.604781938633,40.6047550546753,40.6047157922677,40.6046806377201,40.6046300057679,40.6046062707471,40.6045762696534,40.604561682803,40.6045667047166,40.6045676317145,40.6045706386341,40.6045777214853,40.6045775467333,40.6045960550381,40.6046094093748,40.6046227559361,40.6046433033007,40.6046545676331,40.6046637992647,40.6046709326329,40.6046770392561,40.6046945243854,40.6047047748988,40.6047160076325,40.6047262320367,40.6047302828944,40.6047332893999,40.6047414758783,40.6047476114452,40.6047423619923,40.6047402363889,40.6047236523862,40.6047153414088,40.6046967148239,40.6046873789822,40.60468009044,40.6046810345651,40.6046809443172,40.6046921892004,40.6046910448619,40.6046940344565,40.6047063687811,40.6047218044173,40.6047310119015,40.6047371377441,40.6047298407486,40.6047122186515,40.6047018447817,40.6047007549971,40.6047006692733,40.6047077781639,40.6047200856528,40.6047458450442,40.6047747360701,40.6047870630917,40.6048097623304,40.6048603230263,40.604888188043,40.6049263578521,40.6049975812563,40.6050388707951,40.6050832373036,40.6051472260552,40.6052102317616,40.6052577728844,40.6053083889252,40.6053642460365,40.6053963354844,40.6054201930627,40.6054440291628,40.6054709427407,40.6054854838178,40.6055134346153,40.6055413996908,40.6055507690028,40.6055714643801,40.6055963163545,40.6056325282299,40.6056635058386,40.6056582441769,40.605637484512,40.6056570824496,40.6056922707295,40.6057202762371,40.6057575445524,40.605789583364,40.6058350526412,40.6058650304118,40.6059063468509,40.6059362967408,40.6059630887057,40.6059909258731,40.6060135835131,40.6060362487835,40.6060692398038,40.6060908749599,40.6061114726963,40.606137233821,40.6061629760415,40.6061929145161,40.606217674119,40.6062434513958,40.6062733850993,40.6063104907798,40.6063187108763,40.6063269088363,40.606345447349,40.6063577564082,40.6063504162826,40.606321413126,40.6062955106089,40.6062623908199,40.6062251539273,40.6061941016297,40.6061640855272,40.6061433637301,40.6061288611521,40.6060750983565,40.6060585538792,40.6060719372592,40.6060739408872,40.6060511161513,40.606034506567,40.6060210006944,40.6059971929956,40.6059743968929,40.6059598834917,40.6059618678755,40.6059566175879,40.6059461859358,40.6059172356682,40.6059057959699,40.6059109025133,40.6059263154396,40.6059345089138,40.6059313548107,40.6059054626752,40.6058888955299,40.605875411536,40.60585056814,40.6057994212997,40.6057880033561,40.6057667353534,40.6057468055009,40.6057323056855,40.6057066665816,40.6056854139053,40.605656826827,40.6056341186617,40.60560998103,40.6055631192313,40.6055462734225,40.6055346048766,40.6054840963911,40.6054489565903,40.6054255302794,40.6053969801603,40.6053383919137,40.6053076181153,40.6052673533038,40.6052402581731,40.6051875641168,40.6051538997238,40.605145148303,40.605146688372,40.6051621285198,40.6051892838566,40.6052098292595,40.6051930332609,40.6051293585927,40.6051059237612,40.6050765624691,40.6050538122953,40.6050347315952,40.6050229733479,40.6050024150247,40.6049811691627,40.6049613685939,40.6049319987528,40.6049092395344,40.6048879392078,40.6048724961207,40.6048548492689,40.6048533149172,40.6048393903291,40.6048166928826,40.6047896209265,40.6047661997257,40.604755188522,40.6047579834803,40.6047587421966,40.6047792091328,40.6047952954164,40.604796729953,40.6047952085126,40.6047827201563,40.6047672986454,40.6047533570073,40.6047423508909,40.6047181326624,40.6046939632024,40.604681541321,40.6046661760597,40.6046500670996,40.6046390921996,40.6046361863233,40.6046508517048,40.6046662834375,40.6046729269798,40.6046780872344,40.6046700756099,40.6046613163845,40.6046598784312,40.6046730854118,40.6046913810969,40.6047074956735,40.6047170678938,40.6047185688619,40.6047189804268,40.6047193811559,40.604698901607,40.6046894339197,40.6046638594869,40.6046418896286,40.6046155365394,40.6045957955209,40.6045753103475,40.6045621651437,40.6045534415945,40.6045554478928,40.6045564286564,40.6045425538998,40.6045323306575,40.604511780777,40.6045015132763,40.6044803393334,40.6044810239916,40.6044802475101,40.6044787295797,40.6044684302574,40.6044581581516,40.6044493733638,40.6044347437348,40.6044238005956,40.6044238652217,40.6044238975312,40.6044225071349,40.6044181614869,40.604403548839,40.6043867268172,40.6043787055498,40.6043919090792,40.6044204745267,40.6044303739023,40.6044380685724,40.604456350036,40.6044746236692,40.6044922136484,40.6044988604457,40.6044857129904,40.6044549925435,40.6044455240729,40.6044272436244,40.6044067374976,40.6043942951195,40.6043818917989,40.6043687358278,40.6043540603152,40.6043361810019,40.6043196403128,40.6042932728614,40.6043037067845,40.604306602005,40.6043059393226,40.60426053704,40.6042437686132,40.6042268454049,40.6041880530332,40.6041800819384,40.6041889966129,40.6042021065299,40.6042204531728,40.6042329355978,40.6042315439793,40.6042096075743,40.6041824981806,40.6041509843379,40.6041192025889,40.6040850944128,40.6040666788765,40.6040782055215,40.6040879008107,40.6040946770952,40.6040977293876,40.6041155383024,40.6041429145151,40.6041540811348,40.6041541392818,40.6041209787148,40.6041469758253,40.6041788842967,40.60419086084,40.6041924671497,40.6042103652269,40.6041609671472,40.6041573389106,40.6041418423162,40.6041471029398,40.6041494246013,40.6041658014659,40.6041614256906,40.6041422581318,40.6041408711758,40.6041409563015,40.6041632468496,40.6041877465857,40.6042004336323,40.6042042639267,40.6042021737375,40.604187473549,40.6041882685662,40.6041742148754,40.6041535123448,40.6041416229746,40.6041245839019,40.6041075788121,40.6040980104768,40.6040988128004,40.6041092099458,40.6041211075797,40.604160432993,40.6041714655872,40.6042122596381,40.6042411922351,40.6042679123511,40.6042672865474,40.604253264568,40.6042459143665,40.6042733698128,40.6043008332173,40.6043150269241,40.6043306486873,40.6043293335273,40.6043449748785,40.6043443686083,40.6043296263387,40.6043201158075,40.6043202054361,40.6043069616648,40.6043003867634,40.604287867724,40.6042797807385,40.6042657491307,40.604239149298,40.6042570167347,40.6042242978591,40.6042831122976,40.6043187039136,40.6043476851106,40.6043766568229,40.6043768390665,40.6043636134027,40.6043309225601,40.6042903852516,40.6042615046869,40.6042304328711,40.6042327358805,40.6042661058134,40.6042994447395,40.6043438891113,40.6043506056251,40.6043484187399,40.6043261997525,40.6042684436701,40.6042284482193,40.604212950784,40.6042152936356,40.6042309432908,40.6042421495574,40.6042754884707,40.6043132370814,40.6043532263114,40.6043710879237,40.6043800821377,40.6043356831887,40.6042956934525,40.604291329801,40.6042692110107,40.6043025909208,40.6042693068081,40.6042404262288,40.6042115972273,40.6042272208087,40.6042317654457,40.6042185453377,40.6042075860594,40.604194359662,40.6041610006465,40.6041232475938,40.6041188892728,40.6041101167433,40.6041612320834,40.6041990203566,40.6042323593987,40.6042702080136,40.6042325554791,40.604208184584,40.6041771482119,40.6041706078281,40.6041951789707,40.6042175241158,40.6042353801969,40.6042354654829,40.6042687949706,40.6043154914985,40.6043710344568,40.6043895782487,40.6044088928962,40.6043883860612,40.6043422596629,40.604268990544,40.6042224393994,40.6042492029731,40.6042848342119,40.6043270712967,40.6043449121975,40.6043748120403,40.6044117569092,40.6044651231554,40.6045073658947,40.6044940983422,40.6044496897132,40.6044453208787,40.6044587923178,40.6044745109534,40.6044791101921,40.6044836782304,40.6045170426675,40.6045592647073,40.6045659855841,40.6045149152411,40.6044482968598,40.604401756363,40.6043707189734,40.6043459778593,40.6043040694698,40.6042753346059,40.604277765012,40.604300109701,40.6043024408453,40.6043302145169,40.6043609974165,40.6044229927655,40.6044580721166,40.6045135428609,40.6045745838227,40.6046245216519,40.6046244158781,40.6046576971605,40.6046853883553,40.6046658816663,40.6046963743623,40.6047157327842,40.6046962435676,40.6046490581528,40.6046462192321,40.6046989324609,40.6047350521295,40.6047878152032,40.604829518751,40.6048851513551,40.6049269346243,40.6049492671864,40.604993733658,40.6050326361197,40.6050798588626,40.605149328188,40.6051937635419,40.6052380802299,40.6052880118391,40.6053157346756,40.6053684237244,40.6054378619709,40.6054935006594,40.6055603679336,40.6055882332341,40.6056437418059,40.6056741171652,40.6057128816475,40.6057572480897,40.605773861087,40.6058347220954,40.6058455955256,40.6058704431929,40.6059092517389,40.6060091515314,40.6060841102326,40.6061424068394,40.6061923252331,40.6062199925516,40.6062643775645,40.6063198299567,40.6063669349328,40.6063917948525,40.6064191236139,40.6064439458189,40.6064687987159,40.6064908629297,40.6064851667577,40.6064766324478,40.6064681413791,40.6064652022969,40.6064371604,40.6064120187856,40.6064229530481,40.6064505561561,40.606517124383,40.6065780776746,40.6066751129749,40.6067471453107,40.6067941933747,40.6068384206791,40.6069104218091,40.6069685349587,40.6070266360641,40.6070736837511,40.6070762957515,40.6070289513862,40.6069734498553,40.6069400490289,40.6069093995188,40.6068372220043,40.6067790580963,40.6067653929079,40.6067406227866,40.6067101937552,40.6066491217092,40.6065908750623,40.6065214237077,40.6064907428336,40.6064961429191,40.6064459852269,40.6063931959716,40.606329315717,40.6063210764768,40.6063655873922,40.6064100545929,40.6064351718644,40.6064436572845,40.6064798971546,40.6064605401641,40.6064105656075,40.6063688498786,40.6063465144789,40.6062992976126,40.6063242369934,40.606382552521,40.6063963319801,40.6063712783479,40.6063101742359,40.6062518018762,40.6062350190459,40.6062932145744,40.6063320228349,40.6063429306855,40.6062984765601,40.6062817441414,40.6062788156968,40.6063037054853,40.6063398256365,40.6063260717709,40.6063649933281,40.6063928357044,40.6064179463659,40.6064513282872,40.6065097512682,40.6065459287166,40.606571013302,40.6066072343868,40.6066350457082,40.6066626980578,40.6066680292638,40.6066928560105,40.6067482753594,40.6067926351446,40.6068536376317,40.6068980796137,40.6069508689116,40.6070036259238,40.6070564082207,40.6070886270431,40.6070701179004,40.6070644018449]}],[{"lng":[-73.8295303585581,-73.8295773134622,-73.829608270395,-73.829595295861,-73.8295715845654,-73.829524149886,-73.8295172333449,-73.8295182681063,-73.8295303585581],"lat":[40.6072406733496,40.6072381700666,40.6072563595585,40.6073277342884,40.6073423909514,40.607339324343,40.607320752169,40.6072614072753,40.6072406733496]}],[{"lng":[-73.7966569965902,-73.7964755603714,-73.7963087395916,-73.7962147086063,-73.796088116852,-73.796008633179,-73.7960961637415,-73.7962524598776,-73.796390749872,-73.7964781783413,-73.7965257597975,-73.7964204956574,-73.7963185705158,-73.79627507921,-73.7962607775151,-73.7962612424815,-73.7963016139075,-73.7964800277672,-73.7965494167646,-73.7964950736061,-73.7963823801074,-73.7963059075842,-73.7962221730515,-73.7961128777754,-73.7960581369517,-73.7960541809613,-73.7960828098688,-73.796115335819,-73.7960787176381,-73.7960096658397,-73.7959075970346,-73.7958745877352,-73.7958198799993,-73.7957765005519,-73.7957151069639,-73.7956935874565,-73.795693850259,-73.795661365792,-73.7955997877335,-73.7955636694612,-73.7955385391368,-73.7955169436739,-73.7955207982458,-73.7955245777669,-73.7955174697304,-73.795510387379,-73.7954778531633,-73.795478056835,-73.7954636707201,-73.795492925995,-73.7954530371734,-73.795409557772,-73.7954024570414,-73.7954352966157,-73.7954208936133,-73.7953628668442,-73.7953339329546,-73.7953051108358,-73.7952872092975,-73.7952732743313,-73.7952847554231,-73.7952781403841,-73.7952968741346,-73.7954500465336,-73.7955777321476,-73.7957269895433,-73.7959304337894,-73.7960320850385,-73.7960245030761,-73.795955174456,-73.7958094072424,-73.7957036725008,-73.7956050205915,-73.795630081726,-73.7955858635244,-73.7956108568974,-73.795701417647,-73.79587219718,-73.796003325185,-73.796130893513,-73.7962582762919,-73.7964044721276,-73.7965163231484,-73.7966006336054,-73.7966681053894,-73.796749377758,-73.7968474312853,-73.7969393532677,-73.7970158964828,-73.7970908444373,-73.7971443845828,-73.7972316488242,-73.7973127582703,-73.7973708414784,-73.7974136496495,-73.7974595588229,-73.7974916779934,-73.7975438028334,-73.7975898567219,-73.7976327704795,-73.7976756058864,-73.7977276313991,-73.7977612602286,-73.7977979548153,-73.7978377310862,-73.7978974694127,-73.7979772062541,-73.7980354742081,-73.7980922129446,-73.7981474754566,-73.7981918940998,-73.798240955385,-73.7982792401851,-73.798334403811,-73.798389662749,-73.7984309996476,-73.7984508749328,-73.7984922301738,-73.7985489619029,-73.7986670328824,-73.7987498401588,-73.7988311159999,-73.7989108661195,-73.7989585284545,-73.7990199169041,-73.799075010318,-73.7992635117901,-73.7994766001105,-73.7995715784554,-73.7996742362551,-73.7997921249175,-73.7999101120901,-73.7999821109959,-73.8000403349951,-73.8001552975269,-73.8002120644518,-73.8002534936646,-73.8003408142684,-73.8003760571578,-73.8004403894206,-73.8004878556238,-73.8005261765421,-73.8005844840869,-73.8006320116363,-73.8006626772389,-73.8007531264261,-73.8008451299733,-73.8009248872769,-73.8009985363598,-73.8010706750478,-73.8011229214359,-73.8011889907404,-73.8012228575209,-73.8012904622462,-73.8014133076452,-73.8015023834127,-73.8015822409902,-73.8015915725708,-73.8016085373451,-73.8016668933477,-73.8017068104105,-73.8017221360347,-73.8017098036788,-73.8016866918647,-73.8016559029806,-73.8016328429755,-73.8016450165327,-73.8017063626357,-73.80174935547,-73.801793904046,-73.8018246657527,-73.8018339867597,-73.8018203152941,-73.8018188781384,-73.8018557738423,-73.8019279227096,-73.8020107280255,-73.8021073491913,-73.8021701870996,-73.802228403591,-73.8022621483108,-73.8023096824435,-73.8023939874724,-73.8024445616446,-73.8024920800445,-73.8025810566201,-73.8026930215714,-73.8027605351275,-73.8028204793558,-73.8029263282158,-73.803067399028,-73.8031701355434,-73.8032652325732,-73.8033419977669,-73.8034281809807,-73.8034606529297,-73.8034883743361,-73.803563591737,-73.803614258593,-73.8036358329625,-73.8036988313436,-73.8037741116569,-73.8038247838781,-73.8038831185918,-73.8038732225642,-73.8039167885041,-73.8039676743751,-73.8040149333745,-73.8040002643394,-73.8039491757269,-73.8038653661719,-73.8038432822193,-73.8038539505914,-73.8038683178044,-73.8038063089382,-73.8037042361841,-73.8036494472883,-73.8036092695655,-73.8036054882775,-73.8035108721482,-73.8034380307322,-73.8033688000081,-73.8033176529244,-73.8032519579391,-73.8031935092971,-73.8030841574779,-73.8028911236851,-73.8027819174216,-73.8027344944674,-73.8026434861591,-73.8025379229363,-73.8021197135946,-73.8018214331974,-73.8016865354915,-73.8014827738456,-73.801402636418,-73.8014860385055,-73.8016239788134,-73.8014892290442,-73.8013144538674,-73.8009942123057,-73.8005761359319,-73.8001978608077,-73.7998197901786,-73.7994379780088,-73.7991942545633,-73.7989725977723,-73.7985290091998,-73.7981762641652,-73.7978672638813,-73.7974746947889,-73.7970784834088,-73.7966569965902],"lat":[40.6089609150713,40.6088608681896,40.6087359146869,40.6085806184226,40.6083754010183,40.608217360286,40.6081205592703,40.6081208364398,40.6080656781697,40.6080021190495,40.6078941667296,40.607846887298,40.6078965698533,40.6078549402744,40.6077773496215,40.6076249907767,40.607497634899,40.6073954550912,40.6072875408662,40.6072292707217,40.6072346118341,40.6072815688656,40.6073257435415,40.6074086552184,40.6074805822007,40.6075858416508,40.6077327114155,40.6077937131524,40.6078822937237,40.6078794005891,40.6079761757265,40.6080730734413,40.6081339196323,40.6080562777644,40.6079259711327,40.6078317466468,40.6077458715112,40.6076710190617,40.6076016554013,40.607526796963,40.6074242552192,40.6073549633007,40.6072829448827,40.6072358584018,40.6071832125189,40.6071222565489,40.6070640247202,40.6069975410099,40.6069476522709,40.6068895315606,40.6068589883066,40.6068145878123,40.6067591718328,40.6067176772788,40.6066733297081,40.6066316734005,40.606584528673,40.6065013730039,40.6064126949027,40.6062159879483,40.6060276363941,40.6058143215337,40.6056315235924,40.6054628151553,40.6053079126908,40.6052306132467,40.6052614474335,40.6053004097837,40.6054028927202,40.6054914147116,40.6056158138638,40.6057236630595,40.6058924681309,40.6060171702199,40.6062137742232,40.6063606376626,40.6064605251218,40.6064774493267,40.6063862664935,40.6062701456259,40.606214968164,40.6061918541859,40.6062200997169,40.6062284295846,40.6062273802841,40.6062263558525,40.6062534079748,40.6062804501856,40.6063214890565,40.6063835600612,40.6064257269186,40.6064714583038,40.60652419239,40.6065850652848,40.6066272119219,40.606657678994,40.6066846143543,40.6066882129101,40.6066707640751,40.6066778509178,40.6067106493599,40.6067469690112,40.6067820880866,40.6068172137183,40.606847668676,40.6068688099084,40.6068689500902,40.6068690524935,40.6068679828252,40.606848213075,40.6068646516685,40.6068670753404,40.6068835043051,40.6068964566496,40.6068778542896,40.6068989629646,40.6069188653061,40.6069341302282,40.6069353985308,40.606935605417,40.606934581588,40.6069323865009,40.606927851651,40.6068858626861,40.6068684401006,40.6069047650071,40.6069401542782,40.6069580561903,40.6069886080143,40.6070156657479,40.6070766421359,40.6071048950451,40.6071283940739,40.6071436877926,40.6071579121344,40.6071474926547,40.6071382153456,40.6071664156853,40.6071746575323,40.6071981417849,40.6072215984009,40.6072263386507,40.6072135854626,40.6072160047821,40.6072172261535,40.6072243954347,40.6072245548904,40.6072176806142,40.6072026157467,40.607179366917,40.6071420605711,40.6070977649946,40.6070534143616,40.6070079531993,40.6069497325859,40.6069031397093,40.6068623739425,40.6068179808417,40.6067852882732,40.6067561716834,40.6067398792961,40.6067422437769,40.6067644268552,40.6068017837418,40.6068426342696,40.6068624612878,40.6068940366373,40.6068906362679,40.6068708429486,40.606844041021,40.6068125398932,40.6067716523083,40.6067283882111,40.6066956638801,40.6066641726502,40.6066374177465,40.6066363922356,40.6066307148741,40.6066413412192,40.6066589713556,40.6066555231922,40.6066556049616,40.6066662686087,40.6066757048651,40.6066816296242,40.6066677582645,40.6066586017139,40.6066435245151,40.6065957119362,40.6065807004008,40.6065809422022,40.6065811181879,40.6065719321921,40.6065393412112,40.6064331396061,40.6063408709971,40.6063000147414,40.6062720947027,40.6062499769334,40.6062137852155,40.6061694841226,40.6061205278825,40.606096072491,40.6060739671883,40.6061174082802,40.6061341028763,40.6061341896788,40.6061315001749,40.6061757977579,40.6062449652896,40.6063168463944,40.6064109944338,40.6064913480378,40.606549545984,40.6066242348462,40.6067265575912,40.6068178791274,40.6068842945423,40.6069341512094,40.6069727718923,40.6070225111407,40.6070805659804,40.6071691234874,40.6072604273409,40.6073600530245,40.6074651321797,40.6075977699163,40.607652985907,40.6077110784507,40.6077580147412,40.6078104666561,40.607881772167,40.607958823036,40.6080970991733,40.6081687715075,40.608226806993,40.6082934351248,40.6083546166372,40.6084430301742,40.6085452240285,40.6086720979106,40.6086963055197,40.6087815234857,40.6087974865792,40.6088494541942,40.6089127426061,40.6088901936804,40.6089365100161,40.6089912944881,40.6090046023238,40.6090066813772,40.609011523764,40.6089609150713]}],[{"lng":[-73.8273019254298,-73.8272710204225,-73.8272042605073,-73.827157513283,-73.8271267123468,-73.8271306999411,-73.8270381669954,-73.8269249707744,-73.8269065659595,-73.8269004082756,-73.8268479756474,-73.8268027813449,-73.8267476467248,-73.826714626882,-73.8266845081988,-73.8266372784242,-73.8266073922421,-73.8265452536132,-73.8265029927284,-73.8264442668549,-73.8264371122888,-73.8264298919988,-73.8264270387868,-73.8264241232899,-73.826419710776,-73.826415299801,-73.8264123834235,-73.8264094692446,-73.8264050754862,-73.8263991668369,-73.826394695861,-73.8263902445161,-73.8263843345476,-73.8263798629113,-73.8263768302678,-73.8263738554274,-73.826369463868,-73.8263620974697,-73.826354709457,-73.826350298262,-73.8263473827661,-73.826344468591,-73.8263415522177,-73.826338643857,-73.8263372439191,-73.826337350322,-73.8263359517003,-73.8263315465386,-73.8263271342479,-73.8263242191954,-73.8263198066855,-73.8263124202163,-73.8263050134523,-73.8263005424746,-73.8262975946233,-73.8262961966626,-73.8262963008754,-73.8262949022569,-73.826290497317,-73.8262845880117,-73.8262801864214,-73.8262787971805,-73.8262774079457,-73.82627450315,-73.8262710954927,-73.8262652071428,-73.8262573285106,-73.8262514388408,-73.8262480305246,-73.8262451141589,-73.8262421999886,-73.8262392842815,-73.8262363679146,-73.8262334725025,-73.826232094844,-73.8262321930287,-73.826230775,-73.8262278795892,-73.8262250035943,-73.8262221081885,-73.826219191821,-73.8262162776533,-73.826213361947,-73.8262104080697,-73.8262088715558,-73.8262058589843,-73.8262010037479,-73.8261904957791,-73.8261738765883,-73.8261538777366,-73.8261383079949,-73.8261370946583,-73.8261341796187,-73.8261297880744,-73.8261239178349,-73.8261224795164,-73.826125492752,-73.8261255721865,-73.8261211799841,-73.8261152706895,-73.82611085885,-73.826107944029,-73.8261035308725,-73.8260976222377,-73.826093170902,-73.8260901764249,-73.8260872218877,-73.8260828296912,-73.8260769601129,-73.8260710898758,-73.8260652203027,-73.8260600912844,-73.8260534617302,-73.8260467946578,-73.8260430611596,-73.8260386091653,-73.8260312231506,-73.8260238554576,-73.8260194632625,-73.8260165482254,-73.8260136334083,-73.8260107183732,-73.8260107567751,-73.8260137519131,-73.826015288432,-73.8260153669946,-73.8260139483184,-73.8260110341617,-73.8260096146079,-73.8260096940483,-73.8260082758124,-73.8260053603387,-73.8260009681472,-73.8259950985775,-73.8259922031854,-73.8259923013907,-73.8259909215587,-73.8259880261661,-73.8259851120133,-73.8259821581374,-73.8259791630007,-73.8259762292084,-73.8259733534583,-73.8259704580683,-73.8259675423766,-73.8259645876232,-73.8259615927079,-73.8259585997701,-73.8259541281346,-73.8259482188428,-73.8259453234573,-73.8259439052235,-73.8259380155788,-73.8259306485555,-73.825929210244,-73.8259322248023,-73.8259323042465,-73.8259294182435,-73.8259280290336,-73.8259266420282,-73.8259237560218,-73.8259223761965,-73.825922474407,-73.8259210570565,-73.8259166452276,-73.8259092587886,-73.8259018520459,-73.825897381074,-73.8258944263227,-73.8258915108539,-73.8258885951699,-73.8258856810216,-73.825882771373,-73.8258813743299,-73.8258814792345,-73.8258830360595,-73.8258860356895,-73.8258890292853,-73.8258920329259,-73.8258935984728,-73.8258937082668,-73.8258937964354,-73.8258909010537,-73.8258850314992,-73.8258806384409,-73.8258777236359,-73.8258740704755,-73.8258674424797,-73.8258608151479,-73.8258571597889,-73.8258542441057,-73.8258513299613,-73.8258484136223,-73.8258454994784,-73.8258410869992,-73.8258346857754,-73.8258273006632,-73.8258194207488,-73.8258135525165,-73.8258146138827,-73.8258220400433,-73.8258294266927,-73.8258338976642,-73.8258339771163,-73.8258310817384,-73.825828165401,-73.8258252503796,-73.8258252909847,-73.8258282845778,-73.8258312781751,-73.8258342711114,-73.8258358076331,-73.8258329122589,-73.8258270442507,-73.8258256059461,-73.8258286055766,-73.8258301608642,-73.8258302673151,-73.8258288687375,-73.8258259606298,-73.8258230449541,-73.8258186318159,-73.8258127225457,-73.8258083116121,-73.8258046591164,-73.8257980289353,-73.8257914016089,-73.8257877484565,-73.82578483212,-73.8257819179818,-73.8257790223926,-73.8257761466647,-73.8257732606794,-73.8257718728061,-73.8257749157296,-73.825780874109,-73.8257838877868,-73.8257839672427,-73.8257840447197,-73.8257841205563,-73.8257841241768,-73.8257871378556,-73.8257930868485,-73.8257975571521,-73.8258005522819,-73.8258035458755,-73.8258065597694,-73.8258095922082,-73.8258126061014,-73.8258126467081,-73.8258082335815,-73.8258038420742,-73.8258009654686,-73.8257985788086,-73.8257980888649,-73.8257952135785,-73.8257908207542,-73.8257760708637,-73.8257732130318,-73.8257747777065,-73.8257777822151,-73.8257807758072,-73.825783770715,-73.8257853074572,-73.8257853860361,-73.8257869212377,-73.825789935792,-73.8257944464768,-73.8258004142275,-73.8258048851848,-73.8258078800924,-73.8258094166142,-73.8258079979564,-73.8258050829461,-73.8258021674946,-73.8257992533624,-73.8257963370351,-73.8257934416684,-73.825790565726,-73.825787681065,-73.8257862918718,-73.8257863996995,-73.8257849924026,-73.825780579282,-73.825776187125,-73.8257733118448,-73.8257704361268,-73.8257675601865,-73.8257646648229,-73.8257647045519,-73.8257676987983,-73.8257706923818,-73.8257736868476,-73.8257752227114,-73.825775264889,-73.8257753209325,-73.8257768971813,-73.8257799110723,-73.8257829046558,-73.8257858988989,-73.8257888933614,-73.8257919072481,-73.8257919571797,-73.8257919858252,-73.8257890904639,-73.8257906060195,-73.825796495183,-73.8258008489322,-73.8258038247449,-73.8258052419653,-73.8258111512135,-73.8258127465213,-73.8258156221634,-73.8258186554712,-73.8258216678185,-73.825823204998,-73.8258232938364,-73.825823402313,-73.8258220131265,-73.8258191083775,-73.825816194253,-73.8258132779275,-73.8258133176535,-73.8258163112354,-73.8258163509611,-73.8258134359581,-73.8258105205124,-73.8258076251507,-73.8258091817511,-73.8258151503683,-73.8258196213141,-73.825822614893,-73.8258256084721,-73.8258286223551,-73.8258316556603,-73.8258346789273,-73.8258362449049,-73.8258392891336,-73.8258467032225,-73.8258555685148,-73.8258629752034,-73.8258674461454,-73.8258703999992,-73.8258733163222,-73.825877726577,-73.8258836364769,-73.8258895457217,-73.8258954540827,-73.825899905601,-73.8259014421126,-73.8259015209019,-73.8259001035623,-73.8258971872371,-73.8258942731117,-73.8258913775298,-73.8258885018107,-73.825885606448,-73.8258826914426,-73.825879786041,-73.8258783983854,-73.8258770083175,-73.8258741029143,-73.825874142638,-73.8258771377536,-73.8258816086917,-73.8258890131758,-73.8258964004355,-73.8259008128855,-73.825905205035,-73.8259111149303,-73.8259155858674,-73.8259185410348,-73.8259214560417,-73.8259243708264,-73.8259272858324,-73.8259301999574,-73.8259301615502,-73.8259271666602,-73.8259241737471,-73.8259211592116,-73.8259195836377,-73.8259194854275,-73.8259209027673,-73.8259238190921,-73.8259267347572,-73.8259296886103,-73.8259341595493,-73.8259400694477,-73.8259444615997,-73.825947376388,-73.8259517694198,-73.8259576786593,-73.8259621493777,-73.8259651438313,-73.825968136744,-73.8259711318577,-73.8259726661671,-73.8259727456111,-73.8259742821179,-73.8259772772295,-73.8259788137377,-73.8259788923003,-73.8259759969336,-73.825970126758,-73.8259686893365,-73.8259717016678,-73.825971781115,-73.8259688857505,-73.82596892547,-73.8259719183805,-73.825974913272,-73.8259779070632,-73.8259809006312,-73.8259838566785,-73.8259882481676,-73.8259941183432,-73.8259992495064,-73.826005876793,-73.8260125460014,-73.826016276383,-73.8260192714903,-73.8260222650613,-73.8260252646665,-73.8260268214693,-73.8260269257036,-73.826025528438,-73.8260226196832,-73.8260197046759,-73.8260167898904,-73.8260123955413,-73.8260065275706,-73.8260021338833,-73.8259977229735,-73.8259918137421,-73.8259874207121,-73.8259845449888,-73.825981649626,-73.8259787346211,-73.8259758198362,-73.8259758595609,-73.825978852469,-73.8259833240585,-73.8259892730092,-73.8259922859967,-73.8259923850802,-73.8259954386659,-73.8260014061596,-73.8260058779666,-73.8260088715346,-73.8260118644398,-73.8260148593237,-73.8260178531077,-73.8260208667519,-73.8260209448737,-73.8260180495114,-73.8260151353886,-73.8260122197256,-73.8260078275816,-73.826001917697,-73.825997446771,-73.8259945072166,-73.8259931340681,-73.8259932719933,-73.825993409259,-73.8259949903941,-73.8259979596245,-73.8260008737453,-73.8260037907257,-73.8260081822086,-73.8260140523711,-73.8260199218771,-73.8260258317603,-73.8260303026858,-73.8260332969076,-73.8260348320886,-73.8260349302893,-73.8260365071709,-73.8260395203707,-73.8260425145929,-73.8260455090329,-73.8260470455333,-73.8260471234333,-73.8260457054304,-73.8260427891124,-73.8260398749896,-73.8260369599879,-73.8260340445486,-73.8260296321098,-73.8260237235454,-73.8260193119848,-73.8260163956669,-73.826013481547,-73.8260105652265,-73.8260076511088,-73.8260076899485,-73.8260106937738,-73.8260122606116,-73.8260108714144,-73.8260079666743,-73.8260050503562,-73.8260020965173,-73.8259991014157,-73.8259961475797,-73.8259927415189,-73.8259868523841,-73.8259789740847,-73.825973045227,-73.8259695575238,-73.8259666023688,-73.8259622102309,-73.8259563407337,-73.8259519485985,-73.8259490329421,-73.825950549148,-73.8259565177277,-73.8259565971724,-73.8259507464375,-73.8259463543049,-73.8259434393107,-73.8259434777143,-73.8259464725923,-73.8259494663738,-73.825952480018,-73.8259525594614,-73.8259496837492,-73.8259483039398,-73.8259484036831,-73.8259469848108,-73.8259425717188,-73.825938160825,-73.8259352451716,-73.8259323498199,-73.8259339066259,-73.8259398743228,-73.8259443458974,-73.8259473394572,-73.8259503323555,-73.8259533272326,-73.8259563210099,-73.8259593346511,-73.825959412775,-73.8259565174234,-73.8259536033112,-73.8259506883197,-73.825947773547,-73.8259433604566,-73.8259369606274,-73.8259295742811,-73.8259216951178,-73.8259158249733,-73.8259154102834,-73.8259184241423,-73.8259214177012,-73.8259244315598,-73.8259289428579,-73.8259363689206,-73.825943754825,-73.8259482257378,-73.8259512603382,-73.8259542728754,-73.8259543125975,-73.8259499001702,-73.8259454486786,-73.8259417176528,-73.8259350491398,-73.8259284415275,-73.8259277819665,-73.8259308052084,-73.8259323698504,-73.8259309828621,-73.8259280968953,-73.8259289153487,-73.8259356010842,-73.8259422702563,-73.8259445435642,-73.8259460800628,-73.8259490742775,-73.8259491126828,-73.8259432237814,-73.825935816921,-73.8259298688754,-73.8259224628964,-73.82591433887,-73.8259062126452,-73.8258995853959,-73.8258959316211,-73.8258930159743,-73.8258901018696,-73.8258871458408,-73.8258841522837,-73.8258811982332,-73.8258782828085,-73.8258753665032,-73.8258724523961,-73.8258695367536,-73.82586514529,-73.8258592751554,-73.8258548830361,-73.825851966732,-73.8258475752727,-73.8258417051424,-73.8258358369866,-73.825829966854,-73.8258255740741,-73.8258226787388,-73.8258227575328,-73.8258257711687,-73.825827307677,-73.8258273858097,-73.8258289229726,-73.8258319267926,-73.8258334929799,-73.825832104461,-73.8258291997395,-73.8258255457514,-73.8258189171921,-73.8258123093772,-73.8258086937984,-73.8258057984628,-73.8258028837039,-73.8257999687222,-73.8257985500803,-73.8257986295368,-73.8257972122157,-73.8257942959172,-73.8257943356451,-73.8257973291988,-73.8257988860074,-73.8257975062158,-73.8257946108813,-73.8257902194288,-73.825784358691,-73.8257814937021,-73.8257801045292,-73.8257772185796,-73.8257728661967,-73.825766957009,-73.8257617095672,-73.8257550209824,-73.8257483546829,-73.8257446221217,-73.8257416660973,-73.8257387520003,-73.8257358363679,-73.8257358754355,-73.8257388890753,-73.8257419225816,-73.8257449558628,-73.825747988486,-73.8257510217695,-73.8257540565887,-73.8257585272733,-73.825764436463,-73.825768887941,-73.825771882152,-73.8257748953477,-73.8257749748045,-73.8257720794749,-73.8257691631829,-73.8257647514331,-73.8257603399021,-73.8257603796308,-73.8257633852564,-73.8257649630271,-73.8257650927457,-73.8257681463282,-73.8257741079676,-73.8257793185322,-73.8257859848232,-73.8257926546327,-73.825796384989,-73.8258008371255,-73.8258052877212,-73.8258090218125,-73.8258156878839,-73.8258223563747,-73.8258260882682,-73.8258290818139,-73.825832076901,-73.8258365274974,-73.8258424366782,-73.8258468482062,-73.8258512411904,-73.8258571503704,-73.8258616210483,-73.8258646154737,-73.8258676096786,-73.8258706032256,-73.8258735976497,-73.8258780489028,-73.8258839580844,-73.8258884095553,-73.8258914024418,-73.8258943973065,-73.8258981307339,-73.8259047970195,-73.8259114262205,-73.8259158192088,-73.8259224455528,-73.8259313085543,-73.8259401724324,-73.8259468400397,-73.8259510660597,-73.825956994664,-73.8259648731289,-73.8259707620085,-73.8259741702416,-73.8259771234052,-73.8259801169448,-73.8259831120245,-73.825986105567,-73.8259890991106,-73.825993570001,-73.8259994698017,-73.8260023361132,-73.8260037239873,-73.8260066287041,-73.8260095450035,-73.8260124591036,-73.8260153754016,-73.8260197869324,-73.8260242384044,-73.8260272326039,-73.8260301873036,-73.8260331027234,-73.8260375151363,-73.8260419853672,-73.826045019284,-73.8260479927453,-73.8260509083849,-73.8260538224864,-73.8260552420158,-73.8260551625811,-73.826055083803,-73.8260565024532,-73.8260594174363,-73.8260638102087,-73.8260696595939,-73.8260740126503,-73.8260769073344,-73.8260798227585,-73.8260827377432,-73.826085654044,-73.82608854939,-73.8260914244364,-73.8260943197846,-73.8260942809449,-73.8260912671061,-73.8260911876722,-73.826094083018,-73.826096998664,-73.8260999127682,-73.8261028281962,-73.8261057244223,-73.8261086001307,-73.8261114954781,-73.826114410466,-73.8261173252344,-73.8261202415383,-73.8261231368883,-73.826126012159,-73.8261289075112,-73.8261325628231,-73.8261391900613,-73.8261458570157,-73.8261510660364,-73.8261569745667,-73.8261613682271,-73.8261642823382,-73.8261679376547,-73.8261745648926,-73.826181174035,-73.826184787435,-73.82618768213,-73.8261891016716,-73.8261890222427,-73.8261904402446,-73.826193355895,-73.8261962700085,-73.8261991854383,-73.8262006036619,-73.826200524234,-73.8262019437755,-73.8262048578883,-73.8262077735418,-73.8262106876556,-73.8262143436341,-73.8262209708809,-73.8262276391578,-73.8262313697275,-73.8262343257529,-73.8262372398672,-73.8262401352261,-73.8262415141795,-73.8262414159956,-73.8262428342205,-73.8262457389615,-73.8262471281696,-73.826248517381,-73.8262514221183,-73.8262543362348,-73.8262572907231,-73.8262602851451,-73.8262632793438,-73.8262648158279,-73.8262648939328,-73.8262674164883,-73.826274822456,-73.8262846715579,-73.8262920391328,-73.826295937345,-73.826300348233,-73.8263062580923,-73.8263106705195,-73.8263150626518,-73.8263209718492,-73.8263254427421,-73.8263284362806,-73.8263314311373,-73.826334434275,-73.8263360010837,-73.8263390430507,-73.8263464590505,-73.8263538456002,-73.8263582578072,-73.826361911813,-73.8263685390604,-73.8263751482154,-73.826378761635,-73.8263831553081,-73.8263890642866,-73.8263935151033,-73.8263965099565,-73.8264009607731,-73.8264078560453,-73.8264167190698,-73.8264265679505,-73.8264339747941,-73.8264379515451,-73.8264408866204,-73.8264437623544,-73.8264466579444,-73.8264480759618,-73.8264494926575,-73.8264524486874,-73.8264539851578,-73.8264555216323,-73.8264585158241,-73.8264600509794,-73.8264601303898,-73.8264587130333,-73.8264557967111,-73.826456822492,-73.8264642284519,-73.8264740775504,-73.826481483514,-73.8264854609207,-73.8264884162882,-73.8264913304131,-73.826495741303,-73.8265016504983,-73.8265060635883,-73.826508978372,-73.8265118933771,-73.8265148096995,-73.8265177238244,-73.8265206394877,-73.8265235536143,-73.8265269631964,-73.8265328529801,-73.8265407312515,-73.8265466203761,-73.826550027761,-73.8265544388736,-73.8265588894681,-73.8265618845388,-73.8265648396876,-73.8265692305084,-73.826576598089,-73.8265844787792,-73.8265918637915,-73.8265997429397,-73.8266056708885,-73.826609157018,-73.8266110032133,-73.8266121117228,-73.8266150271748,-73.8266205474575,-73.82665046141,-73.8266582151406,-73.8266741961241,-73.8266742367017,-73.826677230231,-73.8266792681274,-73.826680223757,-73.8266832179409,-73.8266832563199,-73.8266803421883,-73.8266759485086,-73.8266700805481,-73.826665686207,-73.8266627720763,-73.8266591196007,-73.826652490147,-73.826645864215,-73.8266422075625,-73.8266392934328,-73.8266363784255,-73.8266334629793,-73.8266320447349,-73.8266321228134,-73.8266307054504,-73.8266277904428,-73.8266248749969,-73.8266219606508,-73.8266234770414,-73.8266294252751,-73.8266353726279,-73.8266413215172,-73.8266472704064,-73.8266531802586,-73.8266575723969,-73.826661984827,-73.8266663769658,-73.8266692529372,-73.8266721483166,-73.8266750624465,-73.826679475536,-73.8266853847275,-73.8266898353164,-73.8266928303806,-73.8266958239037,-73.82670029544,-73.8267062046309,-73.8267120741265,-73.8267179833189,-73.8267224539769,-73.8267254477189,-73.8267269841769,-73.8267270823169,-73.8267286584725,-73.8267316325869,-73.8267350421709,-73.8267409319521,-73.8267488088953,-73.826754698457,-73.8267551507023,-73.826752137772,-73.8267520583813,-73.8267549537647,-73.8267578694328,-73.8267607835654,-73.8267636990173,-73.8267666140266,-73.8267702693652,-73.826776896618,-73.8267835635668,-73.8267872954373,-73.8267902996514,-73.8267918651054,-73.8267919732782,-73.8267920620368,-73.8267921414247,-73.8267922194927,-73.8267908021201,-73.8267879067357,-73.8267879852448,-73.8267910186789,-73.8267910971877,-73.8267882214314,-73.8267853461149,-73.8267824507318,-73.8267795344057,-73.8267766196155,-73.8267737046057,-73.8267678150477,-73.8267589520341,-73.8267530225627,-73.826750028384,-73.8267470745591,-73.8267441604296,-73.8267397473434,-73.8267331013493,-73.8267249742679,-73.8267183478994,-73.8267132158756,-73.8267073075694,-73.8267020976908,-73.8266954300884,-73.8266887631481,-73.8266835526104,-73.8266776434232,-73.8266725129392,-73.826665882836,-73.8266592569114,-73.8266556024627,-73.8266526867979,-73.8266497726734,-73.8266453595879,-73.8266409074661,-73.826639371005,-73.8266370977372,-73.8266304299154,-73.8266238035518,-73.8266186702123,-73.8266128007269,-73.8266084085914,-73.8266039955095,-73.8265980863222,-73.8265936357365,-73.8265906406743,-73.8265876868481,-73.8265832947148,-73.82657738553,-73.8265761875304,-73.826572914654,-73.8265699211296,-73.8265669260658,-73.8265639722413,-73.8265610581182,-73.8265581417973,-73.8265552261392,-73.8265523120167,-73.826549397017,-73.8265449839321,-73.8265390756273,-73.8265346234995,-73.8265316299755,-73.8265286155007,-73.8265285367529,-73.8265314327818,-73.8265299166063,-73.8265240074194,-73.8265196152877,-73.8265166989695,-73.8265137848467,-73.8265108691898,-73.8265079550703,-73.82650503875,-73.8265021237533,-73.826499208314,-73.8264948168439,-73.8264889083196,-73.8264836984348,-73.8264770301711,-73.8264703632274,-73.8264666298143,-73.8264636362849,-73.8264599052908,-73.8264532361465,-73.8264466095668,-73.8264429551229,-73.8264400394687,-73.8264371244711,-73.8264342090342,-73.8264298175676,-73.8264239077232,-73.8264194361831,-73.8264164821395,-73.8264135667034,-73.8264106525875,-73.8264077362744,-73.8264047822321,-73.8264017886999,-73.8263988335601,-73.8263959179049,-73.8263930037902,-73.8263900887964,-73.8263856750587,-73.8263797674122,-73.8263753549939,-73.8263724386817,-73.8263695245653,-73.8263651324427,-73.8263592629667,-73.8263541324983,-73.8263475024067,-73.8263386394028,-73.826329776397,-73.8263231491639,-73.8263180180362,-73.8263121485653,-73.8263077542459,-73.8263033433692,-73.8262974341874,-73.8262915250025,-73.8262848783548,-73.82627675216,-73.8262700852169,-73.8262663526798,-73.826263418272,-73.8262605416769,-73.8262576463235,-73.8262547313375,-73.8262503198026,-73.8262458683342,-73.8262428741419,-73.8262399194391,-73.8262355273242,-73.8262296190208,-73.826225146598,-73.826222152405,-73.8262191588695,-73.8262161659932,-73.826213171581,-73.8262101773872,-73.8262071838496,-73.8262042278316,-73.8261998363735,-73.8261939662447,-73.8261895747856,-73.8261866584811,-73.8261852411415,-73.8261838231429,-73.8261809074981,-73.8261794892802,-73.8261795673887,-73.8261774123649,-73.8261707831607,-73.8261641559336,-73.8261619987124,-73.8261605813746,-73.8261576650725,-73.8261532722981,-73.8261474021745,-73.8261430107214,-73.8261400966167,-73.8261371816361,-73.8261342653339,-73.8261313499109,-73.826128435809,-73.826125520168,-73.8261211070998,-73.8261151992433,-73.8261092902852,-73.8261019044182,-73.8260945368741,-73.8260886674138,-73.8260827972956,-73.826078405845,-73.8260754908656,-73.8260725747879,-73.8260696591482,-73.8260662531111,-73.8260603640166,-73.8260524857744,-73.8260465975564,-73.8260431864675,-73.8260387753806,-73.8260328664258,-73.8260284540217,-73.8260255390422,-73.8260226236277,-73.8260189711837,-73.8260123433061,-73.8260056763663,-73.8260019422868,-73.8259989875905,-73.8259945954862,-73.825987229262,-73.8259813000079,-73.8259768284614,-73.8259709192874,-73.825966527184,-73.8259636130889,-73.8259592194459,-73.8259533109335,-73.8259488400458,-73.8259458264239,-73.82594279382,-73.8259383207332,-73.8259338701455,-73.8259308757257,-73.8259279212508,-73.8259235291466,-73.8259176199734,-73.8259131484242,-73.8259101952652,-73.825905802281,-73.8258984347416,-73.8258910497569,-73.8258865982907,-73.825882126081,-73.8258761778425,-73.8258717069481,-73.8258687134071,-73.8258657192035,-73.8258627631875,-73.8258583717462,-73.8258524632307,-73.8258479923382,-73.8258435404276,-73.8258390896189,-73.8258346167475,-73.8258287075687,-73.8258235793258,-73.8258169492485,-73.8258102823036,-73.8258065497552,-73.8258035546715,-73.825800561126,-73.8257975675807,-73.825794081876,-73.8257881526187,-73.8257802756935,-73.8257743462132,-73.8257693814033,-73.8257634722267,-73.8257605769009,-73.8257576815755,-73.8257517724007,-73.8257487585475,-73.8257467301079,-73.8257408021654,-73.8257329243617,-73.825725538058,-73.8257205933273,-73.8257175988995,-73.8257146437622,-73.8257112375148,-73.8257053479861,-73.8256974701814,-73.8256915402609,-73.8256865752245,-73.8256791686121,-73.825671783627,-73.8256673819299,-73.8256659929874,-73.8256646044859,-73.825661718547,-73.8256617980095,-73.8256648118676,-73.825669282766,-73.825675230134,-73.8256782649511,-73.8256768851756,-73.8256724930806,-73.8256680806807,-73.8256651657182,-73.8256622503133,-73.8256593362273,-73.825656420606,-73.8256535056399,-73.8256505902358,-73.8256506299697,-73.8256536235178,-73.8256566186032,-73.8256596121526,-73.8256626057032,-73.8256655999099,-73.8256671350958,-73.8256657177839,-73.8256613047281,-73.8256569132973,-73.8256569921024,-73.8256600066156,-73.825662999503,-73.8256659930493,-73.8256689872565,-73.8256719816815,-73.8256720214136,-73.8256691051328,-73.8256654527061,-73.8256588239601,-73.825652197634,-73.8256485423489,-73.8256456282691,-73.8256456671223,-73.8256486608895,-73.8256501973956,-73.8256502768606,-73.8256488573534,-73.8256444449582,-73.8256399943715,-73.8256362624828,-73.8256295948857,-73.8256229676827,-73.8256237442202,-73.8256296931207,-73.8256341640133,-73.8256371575604,-73.8256386940635,-73.825637276756,-73.8256328637051,-73.8256284622381,-73.8256270730815,-73.8256256839265,-73.8256227798892,-73.8256183878054,-73.8256125177162,-73.825611080104,-73.8256140939551,-73.8256141725444,-73.8256112968805,-73.8256084203393,-73.8256055250289,-73.8256011336052,-73.8255952635191,-73.8255893940945,-73.8255835347142,-73.8255806684352,-73.8255822330974,-73.8255852375621,-73.8255867941547,-73.8255898470816,-73.8255958160593,-73.8256002869468,-73.8256033001397,-73.8256033796074,-73.8256004842997,-73.825597569346,-73.8255946633362,-73.8255932741842,-73.825593392726,-73.8255935110479,-73.8255921227814,-73.8255892368575,-73.8255863609793,-73.825583465674,-73.8255835054071,-73.8255865192577,-73.8255865987267,-73.825583712808,-73.8255823236579,-73.8255838905158,-73.8255868949745,-73.8255884292814,-73.8255899664455,-73.8255929796333,-73.8255945558704,-73.8255946556424,-73.8255932361443,-73.8255903220728,-73.8255859284641,-73.8255800605911,-73.8255741902973,-73.8255683195658,-73.8255639274927,-73.825561013426,-73.8255580971596,-73.8255551897894,-73.8255537912607,-73.8255538955342,-73.8255554523469,-73.8255584519187,-73.8255614467751,-73.8255644405352,-73.8255674340727,-73.8255704289285,-73.8255748998067,-73.8255808473678,-73.8255838609898,-73.8255839404588,-73.8255825231574,-73.8255796171595,-73.8255782280118,-73.8255768401846,-73.8255724374134,-73.8255665282733,-73.8255621362047,-73.825559260994,-73.8255563650395,-73.825553450972,-73.8255505360267,-73.8255476197657,-73.8255447043811,-73.8255403129771,-73.825534442914,-73.8255330046507,-73.825535999508,-73.8255389932629,-73.8255420068845,-73.825545039497,-73.8255480548764,-73.8255510484136,-73.8255540412899,-73.8255570348237,-73.8255600290172,-73.8255630234298,-73.8255660270091,-73.8255675925411,-73.8255662047173,-73.8255633188055,-73.8255604431594,-73.8255575478626,-73.8255546322623,-73.8255517182005,-73.82554880326,-73.8255458878784,-73.8255429729379,-73.8255400676029,-73.8255386784573,-73.8255402446542,-73.825543268537,-73.825543347349,-73.8255404520548,-73.8255375364579,-73.8255346215177,-73.825533202906,-73.8255332823752,-73.825534818879,-73.8255378130707,-73.8255408074792,-73.8255438155286,-73.8255453953547,-73.8255455326709,-73.8255456728448,-73.8255472526776,-73.825550260721,-73.8255517972185,-73.8255518766906,-73.8255489814007,-73.8255431113511,-73.8255387199577,-73.8255358246688,-73.8255329481516,-73.8255300528633,-73.8255315705937,-73.8255375172539,-73.8255405317514,-73.8255376364632,-73.8255317670759,-73.8255288717884,-73.825528949722,-73.8255275324298,-73.825524617716,-73.8255246567927,-73.8255276503212,-73.8255306438477,-73.8255336576836,-73.825533737154,-73.8255308418673,-73.8255279269358,-73.8255250115618,-73.8255206192938,-73.8255147492501,-73.8255133118728,-73.8255163241668,-73.8255164036427,-73.8255135177446,-73.825512129924,-73.8255122384341,-73.8255123467155,-73.8255109678468,-73.8255080725635,-73.8255036805173,-73.8254978312275,-73.8254949743666,-73.825495072609,-73.8254951520837,-73.8254937341362,-73.8254908279335,-73.8254894409962,-73.8254910063137,-73.8254940161374,-73.8254955736048,-73.825495677883,-73.8254942793666,-73.825491381399,-73.8254899916048,-73.8254901005553,-73.8254901894112,-73.8254887708052,-73.8254858661457,-73.8254844770118,-73.8254830900801,-73.8254802041868,-73.8254788244406,-73.8254789226856,-73.8254775054003,-73.8254745913538,-73.8254716751093,-73.8254687695739,-73.8254673813182,-73.8254674902738,-73.8254675791313,-73.8254691158483,-73.8254721093696,-73.8254736452054,-73.8254722277027,-73.8254693217291,-73.825467932596,-73.8254665450081,-73.8254636401288,-73.8254607247662,-73.8254578294953,-73.8254549529927,-73.8254520583794,-73.8254491434573,-73.8254462481853,-73.8254463263439,-73.8254493602617,-73.8254494384203,-73.8254465431472,-73.8254436291072,-73.825440733839,-73.8254408111189,-73.8254438316438,-73.8254453882308,-73.8254454933943,-73.825447049319,-73.8254500497522,-73.8254500894893,-73.8254471739116,-73.8254442598734,-73.8254413449542,-73.8254384287177,-73.82543401726,-73.8254296042653,-73.8254266902294,-73.8254237753112,-73.8254238137303,-73.8254268179529,-73.8254283828245,-73.8254299509976,-73.8254329547766,-73.825435947632,-73.8254389621143,-73.8254390400536,-73.825436144128,-73.8254332300934,-73.8254303339473,-73.825427458329,-73.8254245643829,-73.8254216481467,-73.8254187334539,-73.8254158185383,-73.8254129031833,-73.8254114850274,-73.8254115841589,-73.8254117011791,-73.8254103042095,-73.8254073886371,-73.8254059707008,-73.8254060689533,-73.8254076451904,-73.8254106777836,-73.8254107572617,-73.8254078619989,-73.8254064447236,-73.8254065220058,-73.8254036267436,-73.8253977681068,-73.8253949018792,-73.8253964665351,-73.8253994709699,-73.8254010074652,-73.825402543963,-73.8254055381318,-73.8254070746293,-73.8254071527903,-73.8254057355143,-73.8254028206022,-73.8253999043759,-73.8253954929268,-73.8253910424025,-73.8253880480142,-73.8253850996224,-73.8253837011208,-73.8253838054084,-73.8253839052001,-73.8253839913744,-73.8253825719038,-73.8253796578744,-73.8253767429689,-73.8253738282802,-73.8253709120532,-73.8253679971483,-73.8253680377687,-73.8253710400068,-73.8253726068565,-73.8253741730479,-73.8253771960333,-73.8253772741965,-73.8253743789402,-73.8253714649127,-73.8253685493485,-73.8253656331244,-73.8253627400674,-73.8253598635827,-73.8253569871014,-73.825354111938,-73.8253512166855,-73.8253483020006,-73.825345387096,-73.8253454255206,-73.8253484393386,-73.8253514725893,-73.8253544957963,-73.8253560626458,-73.8253546735334,-73.8253517688931,-73.8253488526721,-73.8253459386479,-73.8253415466438,-73.8253356764382,-73.8253327811904,-73.8253313626022,-73.8253284680111,-73.8253285468356,-73.8253315800853,-73.825331658911,-73.8253287636611,-73.8253258481019,-73.8253229340803,-73.8253200191814,-73.8253171232716,-73.825314246797,-73.8253113658261,-73.8253099861029,-73.8253101180681,-73.8253087398866,-73.8253058479888,-73.8253044588777,-73.8253030697743,-73.8253001651381,-73.825297249584,-73.8252943355658,-73.8252899426901,-73.8252840742527,-73.825282636017,-73.8252856395675,-73.8252872051004,-73.8252858173191,-73.8252829126866,-73.8252799964732,-73.8252771012299,-73.8252742262987,-73.8252713310562,-73.8252709581696,-73.8252699115943,-73.8252700011332,-73.8252701096559,-73.8252687218764,-73.8252658159275,-73.8252628997162,-73.8252584896082,-73.8252511025757,-73.8252437358556,-73.8252408406159,-73.8252409201067,-73.8252395006491,-73.8252365966844,-73.8252352082417,-73.8252338191456,-73.8252309212189,-73.8252295236105,-73.8252296279145,-73.8252282294271,-73.825225340227,-73.8252224659637,-73.8252195691886,-73.8252181519293,-73.8252182307623,-73.8252168126257,-73.8252138972971,-73.8252124784986,-73.8252125573317,-73.8252111400751,-73.825208231888,-73.8252068320853,-73.8252069385883,-73.8252055401048,-73.8252026312547,-73.8251997165892,-73.825196821356,-73.8251939448974,-73.8251910570268,-73.8251896594229,-73.8251897637304,-73.8251883652475,-73.82518546398,-73.8251840646182,-73.8251841698055,-73.8251827726421,-73.8251798633556,-73.8251799031058,-73.8251829166961,-73.8251829961906,-73.8251801206161,-73.8251772441599,-73.8251743677069,-73.8251714925733,-73.8251685973448,-73.8251686370923,-73.8251716502452,-73.8251717297387,-73.825168834514,-73.8251659196322,-73.8251630150213,-73.8251616246079,-73.8251602377162,-73.8251573322253,-73.8251544169021,-73.825151501364,-73.8251500841117,-73.8251501723418,-73.8251502813165,-73.8251488922294,-73.8251459970046,-73.8251446087935,-73.8251447271596,-73.8251448444255,-73.8251434575404,-73.8251405513891,-73.8251405911362,-73.8251436049453,-73.8251451805291,-73.8251452788016,-73.8251438615497,-73.8251409663317,-73.825138090543,-73.8251351953226,-73.8251308011561,-73.8251249528519,-73.8251206006346,-73.8251177054144,-73.8251177429643,-73.8251207379987,-73.8251237314916,-73.8251267249839,-73.8251282621392,-73.8251283612904,-73.8251269829118,-73.8251241073487,-73.8251212309056,-73.8251183356896,-73.8251154201567,-73.8251125155546,-73.8251111264659,-73.8251112363303,-73.8251113236751,-73.8251099064298,-73.8251069917775,-73.8251040755901,-73.8251011609382,-73.8250982454074,-73.8250953501917,-73.8250954296932,-73.8250984622728,-73.8250985417741,-73.8250956465591,-73.8250927310308,-73.8250898358162,-73.8250869606972,-73.8250840654858,-73.8250841039147,-73.8250871083343,-73.8250886751887,-73.8250872861103,-73.8250843806292,-73.8250814653229,-73.8250785707679,-73.8250786496099,-73.8250816631964,-73.8250817016265,-73.8250787876382,-73.8250743956831,-73.8250685264222,-73.8250670882033,-73.8250700816898,-73.8250701207828,-73.8250672052566,-73.8250628146231,-73.8250569440408,-73.8250555064848,-73.8250585196272,-73.8250585991311,-73.8250557039217,-73.8250557436715,-73.8250587480922,-73.8250603127474,-73.8250589236731,-73.8250545229905,-73.8250486133218,-73.8250442213697,-73.8250413449372,-73.825038471367,-73.8250355949369,-73.8250326997329,-73.8250297848686,-73.8250268702243,-73.825025451448,-73.8250255403447,-73.8250256488909,-73.8250242598228,-73.8250213543479,-73.8250184390483,-73.8250155344576,-73.8250141467018,-73.8250142552547,-73.8250143441454,-73.8250129247112,-73.8250085131094,-73.8250041017251,-73.8250011877461,-73.8249982809605,-73.8249968932054,-73.8249955050183,-73.8249926004242,-73.8249882062863,-73.8249823580121,-73.8249780049463,-73.8249751097462,-73.8249721944493,-73.8249692789344,-73.8249663640794,-73.824963448783,-73.8249634885361,-73.824966482022,-73.8249680191768,-73.8249695556752,-73.8249725681553,-73.8249726476636,-73.8249682557242,-73.8249623467271,-73.82495793447,-73.8249535425295,-73.8249476936065,-73.8249433398805,-73.8249404446853,-73.8249375307124,-73.824934614541,-73.8249346542979,-73.8249376477812,-73.824939184279,-73.8249362890834,-73.8249304191825,-73.8249260279063,-73.8249231117361,-73.8249231528091,-73.8249261652926,-73.8249277415427,-73.8249278398341,-73.8249249446404,-73.8249190747434,-73.8249146834694,-73.8249117686183,-73.8249088533296,-73.8249059371614,-73.8249030231903,-73.8249001076824,-73.8248957157487,-73.824889845856,-73.8248884083081,-73.8248914221114,-73.8248929977072,-73.8248930959972,-73.8248931755119,-73.8248917582844,-73.824888842117,-73.8248859281478,-73.8248830126434,-73.8248800977955,-73.8248771825082,-73.8248742685418,-73.8248713523769,-73.8248713927923,-73.8248743869331,-73.8248744253713,-73.8248715105274,-73.8248685959007,-73.8248641829956,-73.8248597910687,-73.8248598697052,-73.8248628843823,-73.8248644200031,-73.8248615248149,-73.8248556564652,-73.8248512623464,-73.8248483483807,-73.8248454328753,-73.8248425283051,-73.8248411405663,-73.824839751735,-73.8248368456183,-73.8248354283962,-73.8248340111744,-73.8248310950124,-73.8248281801707,-73.8248252648902,-73.8248223507071,-73.8248194354252,-73.824816520583,-73.8248136059638,-73.8248136450654,-73.8248166586412,-73.8248167368409,-73.8248138416609,-73.8248109277006,-73.8248080128596,-73.8248050967,-73.824802201521,-73.8247993266619,-73.8247964314821,-73.8247935153235,-73.824790600487,-73.8247906411247,-73.824793634602,-73.8247951704439,-73.8247937532242,-73.8247908377271,-73.8247879215713,-73.8247850076118,-73.8247806156955,-73.8247747464771,-73.8247703545615,-73.8247674593889,-73.8247645836517,-73.8247601917371,-73.8247557989435,-73.8247529234302,-73.8247500273741,-73.8247486094992,-73.824748709341,-73.8247473296879,-73.8247444345138,-73.8247415196818,-73.8247386238487,-73.8247372463962,-73.8247358473016,-73.8247329521301,-73.8247300764007,-73.8247256844908,-73.8247212925795,-73.8247213721042,-73.8247244053447,-73.8247244842086,-73.8247215888178,-73.8247186735473,-73.8247157573981,-73.8247128434453,-73.8247099279558,-73.8247070140051,-73.8247040991738,-73.8247041376165,-73.8247071514167,-73.8247072309407,-73.8247043357717,-73.8247014202834,-73.8246985114977,-73.824697113947,-73.8246972182945,-73.8246958198668,-73.8246929126162,-73.8246899977871,-73.824687081641,-73.824684166374,-73.8246812712076,-73.8246783961417,-73.8246740035829,-73.8246695989391,-73.8246682011715,-73.8246683055233,-73.8246698614661,-73.8246743188353,-73.8246787802138,-73.8246803470853,-73.8246789580519,-73.8246760534936,-73.824673138669,-73.8246702240639,-73.8246673079192,-73.8246643930952,-73.824662975886,-73.8246630540957,-73.8246645899378,-73.8246675847293,-73.8246676231717,-73.8246647092291,-73.8246603173281,-73.8246544472612,-73.8246500562418,-73.8246471407599,-73.8246471798637,-73.8246501733364,-73.8246502131009,-73.8246473179401,-73.8246444415656,-73.8246415470649,-73.8246415861688,-73.8246445878864,-73.8246461431684,-73.8246462475219,-73.8246448504174,-73.8246404451192,-73.8246360396074,-73.8246346420653,-73.8246347464185,-73.8246333479963,-73.8246304385564,-73.8246260479817,-73.8246201774793,-73.8246187392927,-73.8246217343037,-73.8246232708036,-73.8246233503333,-73.8246248861766,-73.8246278796463,-73.8246279194132,-73.8246250045936,-73.824620612044,-73.8246147024336,-73.8246102316712,-73.8246072779683,-73.8246043618325,-73.8246014478933,-73.8246014876581,-73.8246044918439,-73.8246060573974,-73.8246076236159,-73.824610626475,-73.8246106662396,-73.8246077514218,-73.8246048361646,-73.8246019213504,-73.8246005028274,-73.8245990847472,-73.824596178885,-73.8245947920565,-73.8245934030332,-73.8245905179303,-73.8245876431027,-73.8245847573451,-73.8245833689793,-73.8245834773499,-73.824583576547,-73.8245836842551,-73.8245822952349,-73.8245794094733,-73.8245765353064,-73.8245736401598,-73.8245707240266,-73.8245678092138,-73.8245644027073,-73.8245585140908,-73.8245506359474,-73.8245447674367,-73.824542894572,-73.8245429935543,-73.8245415756988,-73.824538660888,-73.8245372423717,-73.8245373355587,-73.8245374593392,-73.82453759677,-73.8245377348576,-73.8245363610295,-73.8245334622863,-73.8245305461602,-73.8245276510163,-73.8245277305525,-73.8245322010869,-73.8245381100186,-73.8245425823113,-73.8245456148823,-73.8245485895624,-73.8245515034903,-73.8245559148102,-73.8245603734814,-73.8245619296436,-73.8245620340057,-73.8245606355933,-73.8245577277039,-73.8245548137781,-73.8245518983112,-73.8245482454116,-73.8245416162917,-73.8245350103545,-73.8245343493786,-73.8245373819531,-73.8245374614881,-73.8245345860123,-73.8245346646712,-73.8245376987806,-73.824539274389,-73.8245393727093,-73.8245379546353,-73.8245350393905,-73.8245350791606,-73.8245380929449,-73.8245411261748,-73.8245441500131,-73.8245457153432,-73.8245472809006,-73.824550187017,-73.8245481424681,-73.8245603885232,-73.8245725318647,-73.8245886872786,-73.8245895226165,-73.8246048422389,-73.8246055819769,-73.8246331418061,-73.8246527352,-73.8247072966206,-73.8247219167293,-73.8247226175067,-73.8247390191883,-73.8247571767429,-73.8247620512668,-73.8247701757711,-73.8247783000542,-73.8247854420489,-73.8247928266992,-73.8248007054648,-73.8248065933972,-73.8248100005544,-73.8248144120822,-73.824820320993,-73.8248247329606,-73.8248276477679,-73.8248305623555,-73.82483347716,-73.8248363932867,-73.8248393072156,-73.8248422226813,-73.8248451366093,-73.8248495494603,-73.8248554583703,-73.8248613670604,-73.8248672759735,-73.8248717272604,-73.8248747200419,-73.8248777148046,-73.8248807084648,-73.8248837019096,-73.8248866968916,-73.8248896505766,-73.824892564504,-73.8248954806326,-73.8248983961034,-73.8249012912542,-73.8249013873501,-73.8249041654294,-73.8249070605806,-73.8249099767106,-73.8249128919616,-73.8249172831757,-73.8249231914275,-73.8249291400965,-73.8249350302291,-73.8249393823488,-73.824942277504,-73.8249466693791,-73.824952538537,-73.824957916443,-73.824965283643,-73.8249751309523,-73.8249825372467,-73.8249865138577,-73.8249894690845,-73.8249923843374,-73.8249952991523,-73.8249982130866,-73.82500112856,-73.8250055204394,-73.8250113896006,-73.8250157827983,-73.8250169789495,-73.8250337670428,-73.8250356469556,-73.8250393787092,-73.8250423714885,-73.8250468428694,-73.8250542485044,-73.8250621285947,-73.8250695141345,-73.8250773926893,-73.825083321258,-73.8250868059515,-73.82508979939,-73.8250927943638,-73.8250957480523,-73.8251001399352,-73.8251060488483,-73.825110520229,-73.8251135143229,-73.8251150507917,-73.8251151492814,-73.8251167246196,-73.8251196992777,-73.8251226140963,-73.8251255092606,-73.8251283849892,-73.8251312801528,-73.825134195412,-73.8251371102318,-73.825140024171,-73.8251444363704,-73.8251503459431,-73.8251547581398,-73.8251576720797,-73.8251605873403,-73.8251635021584,-73.8251679143558,-73.8251753003359,-73.82518270685,-73.8251886539703,-73.8251945628884,-73.8251989547736,-73.8252033669718,-73.8252092756674,-73.8252136878658,-73.8252180784317,-73.8252239873493,-73.8252284600448,-73.8252329106706,-73.8252395592168,-73.8252476821901,-73.8252543110839,-73.8252594406253,-73.8252653111152,-73.8252697030035,-73.825272617829,-73.8252755333123,-73.8252784485765,-73.8252818566377,-73.8252877461229,-73.8252956226999,-73.8253015128449,-73.8253049187077,-73.8253093309093,-73.8253152398283,-73.8253196902305,-73.8253226852025,-73.8253256388913,-73.8253285550368,-73.8253314502137,-73.8253343257401,-73.8253372209166,-73.8253401357424,-73.8253430503517,-73.8253459651823,-73.8253503780451,-73.8253562860839,-73.8253607373716,-73.8253637314596,-73.8253667351579,-73.8253683013054,-73.825369865918,-73.8253743272443,-73.8253802368234,-73.8253846490245,-73.8253875629754,-73.8253904688607,-73.8253918566214,-73.8253932457038,-73.8253961502652,-73.825399065759,-73.8254019797097,-73.8254063729261,-73.8254122811853,-73.8254167518995,-73.8254197562522,-73.8254213221775,-73.8254243656103,-73.8254302839121,-73.8254317221186,-73.8254287286911,-73.8254286880733,-73.8254316029057,-73.8254345190558,-73.8254374330076,-73.8254388502468,-73.82544174609,-73.8254476159298,-73.8254505111143,-73.825453406521,-73.8254592763631,-73.825463668265,-73.8254695562181,-73.8254769040086,-73.8254812555109,-73.8254856496094,-73.8254900602793,-73.825492975776,-73.8254958910521,-73.8254958513162,-73.8254928572276,-73.825489863798,-73.825486869492,-73.8254868306351,-73.8254912426218,-73.8254956939111,-73.825498687997,-73.825501641692,-73.8255045565274,-73.8255074711451,-73.8255103873002,-73.825513302136,-73.8255132624009,-73.825510267434,-73.8255087331833,-73.825510150427,-73.8255145626383,-73.8255204700244,-73.8255249407393,-73.8255294518482,-73.825535380861,-73.8255397729864,-73.8255441849779,-73.8255486362659,-73.8255516303521,-73.8255560816366,-73.8255627295344,-73.8255708531817,-73.8255775205066,-73.825579795266,-73.8255798935001,-73.825581469017,-73.8255844436759,-73.8255873576365,-73.8255917705069,-73.8255976794311,-73.8256020916427,-73.8256050069242,-73.8256079021159,-73.8256107772247,-73.8256136717591,-73.8256165879194,-73.8256195018821,-73.8256224180399,-73.8256253320029,-73.8256282475047,-73.8256311614663,-73.825634077628,-73.8256369929093,-73.825636951859,-73.8256339396674,-73.825630906291,-73.825627893438,-73.8256248991313,-73.8256224809602,-73.8256219043879,-73.8256174336743,-73.8256100280329,-73.8256040996741,-73.8256025638912,-73.8256024844238,-73.8256039029919,-73.8256068178368,-73.8256104720903,-73.8256170999098,-73.8256237665817,-73.8256274983233,-73.8256304917485,-73.8256349631222,-73.8256423687661,-73.8256497547642,-73.82565416764,-73.8256570824865,-73.8256614925053,-73.8256659053802,-73.8256702988328,-73.8256761664933,-73.8256805599438,-73.8256834739111,-73.8256863900768,-73.8256893437737,-73.8256908795571,-73.8256909590161,-73.8256939727436,-73.8256970158313,-73.8257218269682,-73.8257189663486,-73.8257159735841,-73.8257159331957,-73.8257188491429,-73.8257217639911,-73.8257261753279,-73.8257320829428,-73.8257365355495,-73.8257410062616,-73.8257469158513,-73.8257483540716,-73.8257453597689,-73.825742365684,-73.8257393526192,-73.8257392731604,-73.8257436652989,-73.8257510519588,-73.8257535705426,-73.8257584178762,-73.8257642877435,-73.8257701953569,-73.8257746667285,-73.8257776608125,-73.8257813940881,-73.8257880598821,-73.8257947287505,-73.8257984598273,-73.8258014034871,-73.8258027932562,-73.8258041817155,-73.8258070863041,-73.8258107414487,-73.8258173675153,-73.8258240357253,-73.8258277674611,-73.8258307811846,-73.8258323906552,-73.8258338134529,-73.8258368287145,-73.8258398214775,-73.825842814898,-73.8258472869243,-73.8258531951989,-73.8258560904099,-73.825857508331,-73.8258619198938,-73.8258663718396,-73.8258693652611,-73.8258723586806,-73.8258753536389,-73.8258798040453,-73.8258842559933,-73.8258879897042,-73.825894655053,-73.8259012841959,-73.8259034395552,-73.8259048577013,-73.8259092683855,-73.825915179515,-73.8259225648572,-73.8259299307783,-73.8259348168158,-73.8259407047878,-73.8259485835856,-73.8259559695879,-73.8259623691185,-73.8259668217234,-73.8259698151402,-73.8259727703753,-73.8259771614208,-73.8259830315138,-73.8259874234404,-73.8259925752982,-73.8260006989571,-73.8260073281038,-73.8260109801761,-73.826015392403,-73.826021794791,-73.8260291794742,-73.8260370582757,-73.8260429482288,-73.8260463543462,-73.8260492683259,-73.8260536624542,-73.826059530793,-73.8260639236015,-73.8260683336309,-73.8260727855736,-73.8260757789906,-73.8260787348863,-73.8260831261567,-73.8260889960357,-73.8260948659132,-73.8261007748507,-73.8261059851879,-73.8261126503154,-73.8261192810065,-73.8261229317662,-73.8261258472882,-73.8261287612731,-73.8261316774545,-73.8261360693886,-73.826141978324,-73.8261464496854,-73.826149442438,-73.8261524371674,-73.8261553910883,-73.8261590462456,-73.8261656732016,-73.8261737975204,-73.8261819225018,-73.8261892884317,-73.8261951585339,-73.8262010262182,-73.8262054196939,-73.8262083336802,-73.8262119888419,-73.8262186157985,-73.826226742319,-73.8262333880325,-73.8262378002648,-73.8262421922033,-73.8262480614294,-73.8262524533673,-73.8262553673577,-73.8262582835444,-73.826262695781,-73.8262686031799,-73.8262730551247,-73.8262775258224,-73.8262834144685,-73.8262877680145,-73.8262921608368,-73.8262966127786,-73.8263003451614,-73.8263070111733,-73.82631364011,-73.8263172930783,-73.8263202079474,-73.8263245992323,-73.8263319651662,-73.8263393527136,-73.826343764073,-73.8263466802636,-73.8263495951372,-73.8263532494231,-73.8263598750684,-73.8263665445938,-73.8263702763185,-73.826374727382,-73.8263806356617,-73.8263865446007,-73.8263924535429,-73.8263969039465,-73.8264006378651,-73.8264073036566,-73.8264139134045,-73.8264160299684,-73.8264174276263,-73.8264218392047,-73.8264262911472,-73.8264297786715,-73.8264357063632,-73.8264435851694,-73.8264494738202,-73.8264536209075,-73.8264602472115,-73.8264669145407,-73.8264706462624,-73.8264736396658,-73.8264781116787,-73.8264840596628,-73.8264885303559,-73.8264929814191,-73.8264974326989,-73.8265004261009,-73.8265033813395,-73.8265062966591,-73.8265092505791,-73.8265122439825,-73.8265152480812,-73.8265168128278,-73.8265198575081,-73.8265272725187,-73.8265346585308,-73.8265391098085,-73.8265421038679,-73.8265451168983,-73.8265481493421,-73.8265511239885,-73.8265555159361,-73.8265614261943,-73.8265658962223,-73.8265688505819,-73.8265717654587,-73.8265776547681,-73.8265850612836,-73.8265895317535,-73.8265925441228,-73.8265955794189,-73.8265985518666,-73.8266029453539,-73.8266088540711,-73.8266133247577,-73.8266162583888,-73.8266191348889,-73.8266220301411,-73.8266249447998,-73.8266278596817,-73.8266307758826,-73.8266351865846,-73.82663963852,-73.8266426319181,-73.8266470838546,-73.826651534254,-73.8266545291885,-73.8266575413321,-73.8266605759645,-73.8266635484138,-73.8266672049081,-73.8266738305531,-73.8266804994098,-73.8266842295818,-73.8266871848203,-73.826691576772,-73.8266989427116,-73.826707069233,-73.8267151922329,-73.8267218211777,-73.8267254743769,-73.8267306253716,-73.8267387499135,-73.8267454172342,-73.8267491480636,-73.8267521423352,-73.8267551350665,-73.8267595876627,-73.8267654957193,-73.8267714046551,-73.8267758559308,-73.8267803279318,-73.8267862362079,-73.8267906275034,-73.8267957806979,-73.8268039030412,-73.8268105718969,-73.8268143033847,-73.8268172573029,-73.8268206660838,-73.8268265562747,-73.8268344328809,-73.8268403027839,-73.826843670558,-73.8268480625174,-73.8268525135711,-73.8268560010746,-73.8268619296378,-73.8268698075621,-73.8268757361262,-73.8268806985008,-73.8268866083161,-73.8268895013835,-73.8268909208969,-73.8268953331403,-73.8268997438454,-73.8269041371271,-73.8269100460641,-73.826914516082,-73.8269175110076,-73.8269205043949,-73.8269234594141,-73.8269278515943,-73.8269337206263,-73.8269381128089,-73.8269410268208,-73.8269439421519,-73.8269468583639,-73.8269497732554,-73.8269527262955,-73.8269557210024,-73.8269587146101,-73.826961707996,-73.8269646638947,-73.8269690551951,-73.8269749251087,-73.8269778203797,-73.8269807156508,-73.8269866245893,-73.8269910952638,-73.8269955456598,-73.827001454598,-73.8270058675039,-73.8270102588101,-73.8270161287247,-73.8270175669884,-73.8270145539796,-73.8270144746112,-73.8270188665769,-73.8270247755166,-73.8270292267912,-73.8270322195163,-73.8270352351625,-73.8270382669105,-73.827041280579,-73.8270442739612,-73.8270472876262,-73.8270503206963,-73.8270532759345,-73.8270561515859,-73.827059046861,-73.8270619617583,-73.8270648770937,-73.8270677919902,-73.8270707066685,-73.8270736215649,-73.8270765377821,-73.8270794518014,-73.8270823673596,-73.8270852813775,-73.8270882372763,-73.8270919696325,-73.8270986356335,-73.8271052645891,-73.8271089162649,-73.8271118122007,-73.827114687419,-73.8271190815891,-73.8271249889915,-73.827130897934,-73.8271368068766,-73.8271427158206,-73.8271486245422,-73.827153036134,-73.8271559516937,-73.8271603646046,-73.8271662735494,-73.8271706842608,-73.8271735982844,-73.8271765145062,-73.8271801697013,-73.8271867960234,-73.8271934249831,-73.8271985539522,-73.8272044635571,-73.8272089342306,-73.8272119276104,-73.8272149225277,-73.8272193729216,-73.8272252818651,-73.8272296832104,-73.8272310724342,-73.8272324616621,-73.8272353663165,-73.8272382803415,-73.8272412355856,-73.827244230284,-73.8272472238834,-73.8272502172624,-73.827253170966,-73.8272560865304,-73.8272584032311,-73.8272969659224,-73.8273058121028,-73.8273404423355,-73.8274785256435,-73.8274784952578,-73.8274804080428,-73.8274862969369,-73.8274941735559,-73.8275000635495,-73.8275049476749,-73.8275108176154,-73.827515209604,-73.8275181243019,-73.8275225171702,-73.8275283855735,-73.8275335187384,-73.8275401444114,-73.8275468130516,-73.8275505434237,-73.8275534783944,-73.8275563549642,-73.827559250269,-73.8275621658482,-73.8275665765755,-73.8275724855266,-73.8275768984511,-73.8275798124911,-73.8275842247563,-73.8275886354814,-73.8275930296744,-73.8275989386265,-73.8276039025288,-73.8276098317527,-73.827617708377,-73.8276235985942,-73.8276284818483,-73.8276343517948,-73.8276394840859,-73.8276461097644,-73.8276527200104,-73.827656331388,-73.8276607255825,-73.8276673735118,-73.8276754971979,-73.8276821261752,-73.8276857785378,-73.8276901901472,-73.827694642079,-73.827697635448,-73.8277006288164,-73.8277036228428,-73.8277065774317,-73.8277094914784,-73.827712407062,-73.8277153224267,-73.8277182373532,-73.8277211535968,-73.8277240676432,-73.8277284589848,-73.8277343289383,-73.827739462113,-73.827746089115,-73.8277542141208,-73.827759401512,-73.8277638741515,-73.8277697831064,-73.8277741751067,-73.8277770900371,-73.8277807452615,-73.8277873722648,-73.8277940005869,-73.8277976522952,-73.8278005678849,-73.8278049612074,-73.8278108695043,-73.8278153401648,-73.8278183335293,-73.8278197101842,-73.8278316744245,-73.8278728518636,-73.8279621858741,-73.8279621758346,-73.8279650711678,-73.8279679874235,-73.8279723981641,-73.8279783071287,-73.8279827191882,-73.8279856341245,-73.8279885488444,-73.8279914637842,-73.8279943800413,-73.8279980343981,-73.8280046600955,-73.8280112899668,-73.8280164203002,-73.8280222693475,-73.8280266223738,-73.8280310152717,-73.8280369242345,-73.82804283298,-73.828048740624,-73.8280531529064,-73.8280568081469,-73.8280634349449,-73.8280701024918,-73.828073834171,-73.8280767878845,-73.8280804431245,-73.8280870701428,-73.8280936884602,-73.8280958160736,-73.828097203835,-73.8281001091899,-73.8281030241366,-73.8281089128392,-73.8281162601137,-73.8281206124881,-73.8281235078304,-73.8281264234354,-73.8281293396995,-73.8281337317244,-73.8281396398115,-73.8281441104696,-73.8281470650652,-73.8281499804512,-73.8281528953962,-73.8281528557524,-73.8281498630483,-73.8281483267232,-73.8281497441095,-73.8281541563974,-73.8281600653653,-73.8281644774347,-73.8281678865027,-73.8281737752097,-73.8281816540542,-73.8281875421021,-73.8281909494095,-73.8281938643599,-73.8281967790878,-73.8281996940399,-73.8282026081103,-73.8282055243804,-73.8282088324507,-73.8282283390207,-73.8282981176921,-73.8283332431995,-73.8283533153426,-73.8283535034912,-73.8283534054902,-73.8283548235516,-73.828357739171,-73.8283611473684,-73.8283670360878,-73.8283749149444,-73.8283808043219,-73.8283856876267,-73.8283915375862,-73.8283958913073,-73.82839878667,-73.8284024406113,-73.8284090676513,-73.8284156968927,-73.8284193490763,-73.8284222653586,-73.828425180321,-73.8284280950632,-73.8284324871083,-73.8284383947695,-73.8284428674075,-73.8284458213492,-73.8284502133919,-73.8284575807338,-73.828465460258,-73.8284728458798,-73.8284807238611,-73.8284881094841,-73.8284930720612,-73.8284975823543,-73.828503512029,-73.8285093807161,-73.8285152500642,-73.8285196421093,-73.8285240544142,-73.8285307030348,-73.8285388267596,-73.828545456003,-73.8285491084122,-73.8285520225014,-73.8285549394467,-73.8285578541957,-73.8285622462445,-73.8285696122699,-73.8285784758536,-73.8285858231668,-73.8285901755832,-73.8285930709595,-73.8285944896919,-73.8285944113076,-73.8285973066814,-73.8286031766942,-73.8286075680872,-73.8286134568175,-73.8286208228495,-73.8286252155634,-73.8286296272123,-73.8286340978676,-73.8286371330492,-73.8286416037026,-73.828646054102,-73.8286495415761,-73.8286554705943,-73.8286633481402,-73.8286692275149,-73.8286711081201,-73.8286724965879,-73.8286754022026,-73.8286783176152,-73.8286812325902,-73.8286841480049,-73.8286870623178,-73.8286914543758,-73.8286973640223,-73.8287003776267,-73.8287004755997,-73.8287005938236,-73.8287006917949,-73.8287022280981,-73.8287052214515,-73.8287082141422,-73.8287111700625,-73.8287140841574,-73.8287169997902,-73.8287213918478,-73.8287273008343,-73.8287332494455,-73.8287391582121,-73.8287435511465,-73.8287464659046,-73.8287493808801,-73.8287522949763,-73.8287552112723,-73.8287596235831,-73.8287655310291,-73.8287699829677,-73.8287729763164,-73.828775912643,-73.8287787873374,-73.8287816827228,-73.8287845968221,-73.8287875131181,-73.82878747349,-73.8287844741252,-73.8287829175735,-73.8287828135916,-73.8287827149688,-73.8287826296963,-73.828781094053,-73.828778079792,-73.8287780011986,-73.8287808972454,-73.8287838122273,-73.8287867263274,-73.8287896426243,-73.8287925380126,-73.8287924587638,-73.8287894458181,-73.8287864518073,-73.828783458454,-73.828781921274,-73.8287818435616,-73.8287832609871,-73.8287876733042,-73.8287935822997,-73.8287980340206,-73.8288010275919,-73.8288039617276,-73.8288068370842,-73.8288097337934,-73.8288141267387,-73.8288200357318,-73.8288245063871,-73.8288274997398,-73.8288304930923,-73.828833487983,-73.8288364813339,-73.8288394350605,-73.8288423498231,-73.8288452587904,-73.828846657507,-73.8288466059497,-73.8288465535336,-73.8288449976417,-73.8288419773576,-73.8288418989896,-73.8288447943827,-73.8288477084877,-73.8288506038815,-73.8288505246362,-73.8288475123506,-73.8288474736048,-73.8288503877133,-73.8288533033577,-73.8288562174654,-73.8288598740699,-73.8288664998206,-73.828873129751,-73.8288767821801,-73.8288796962886,-73.8288833515756,-73.828889977769,-73.8288966063777,-73.8289009999891,-73.8289076270622,-73.8289081818688,-73.828908771859,-73.8289265588112,-73.8290860263269,-73.8291063065326,-73.8291097786095,-73.8291210559476,-73.8291439878254,-73.8291823457371,-73.8291894336934,-73.8292200263091,-73.8292341581231,-73.8292465538702,-73.8293055134835,-73.8293014613507,-73.8292969906647,-73.8292969114506,-73.8292998068951,-73.8293027210449,-73.8293056373947,-73.8293055977879,-73.8293025848333,-73.8293025056182,-73.8293053817006,-73.8293082569028,-73.8293111523504,-73.8293140687004,-73.8293169837329,-73.8293198978846,-73.8293227939929,-73.8293256707344,-73.8293285661839,-73.8293314812177,-73.829334395371,-73.8293358150388,-73.8293372318498,-73.8293401473224,-73.8293445403376,-73.8293504104511,-73.8293518472877,-73.8293488336745,-73.8293487553416,-73.8293516507937,-73.8293545671483,-73.8293574813035,-73.829360396998,-73.8293632924509,-73.8293661683194,-73.8293690637732,-73.8293719788092,-73.8293748742633,-73.8293777503531,-73.8293806364564,-73.8293820243338,-73.8293834130944,-73.8293863049759,-73.8293876792618,-73.8293875402023,-73.829387402683,-73.8293887769761,-73.8293916782075,-73.829394592369,-73.8293975080661,-73.8293974691205,-73.829394467539,-73.8293929125432,-73.8293928086133,-73.8293942065076,-73.8293971155313,-73.8294000310115,-73.829402946052,-73.8294029064484,-73.8293999130765,-73.8293983767842,-73.8293982975736,-73.8293982190224,-73.8293981398134,-73.8293966048396,-73.8293935972403,-73.8293920222242,-73.8293918904948,-73.8293932705641,-73.8293961720389,-73.8293961333129,-73.8293931290486,-73.829391563818,-73.829389998153,-73.8293869787629,-73.8293853992815,-73.8293852624197,-73.8293851227016,-73.8293835438845,-73.8293805226938,-73.829378946574,-73.8293788159422,-73.8293772407028,-73.8293742264209,-73.8293726698822,-73.8293725659529,-73.8293710109525,-73.8293679906529,-73.8293649561283,-73.8293619338135,-73.8293603681387,-73.8293602606542,-73.8293601720836,-73.8293586344697,-73.8293556323967,-73.8293540658416,-73.8293524999513,-73.8293494845292,-73.8293479084048,-73.8293477784305,-73.8293462016461,-73.8293431882382,-73.8293416316953,-73.8293415277617,-73.8293399727587,-73.8293369724783,-73.8293339784333,-73.8293309748178,-73.8293294091389,-73.8293278432438,-73.8293248336135,-73.8293232772886,-73.8293231724727,-73.8293216168093,-73.8293186058546,-73.8293170406148,-73.8293154749382,-73.8293124646451,-73.8293109087576,-73.8293108048216,-73.8293107068995,-73.8293106016403,-73.8293119795112,-73.8293148562714,-73.8293147770561,-73.8293117634233,-73.8293102271195,-73.8293101492202,-73.8293086137997,-73.8293055992825,-73.8293025662854,-73.8292995339457,-73.8292979589126,-73.8292978594493,-73.8292977815502,-73.8292977023323,-73.8292961660286,-73.8292931659627,-73.8292916109516,-73.8292915048182,-73.8292899498063,-73.8292869495158,-73.8292854125498,-73.8292853239805,-73.8292852167012,-73.8292836507992,-73.8292806378217,-73.8292790721346,-73.8292775062336,-73.8292744825771,-73.8292714495722,-73.8292684359322,-73.8292654425366,-73.8292624288947,-73.8292608536365,-73.8292607361261,-73.8292606181732,-73.8292605202481,-73.8292589837187,-73.8292559890026,-73.8292544526912,-73.8292543741312,-73.8292557938083,-73.829258689278,-73.8292571333852,-73.8292511646338,-73.8292481516465,-73.8292480724252,-73.8292450596602,-73.8292391498848,-73.8292340193763,-73.829227391507,-73.8292207253463,-73.8292169920705,-73.8292139973484,-73.8292110039479,-73.8292079903029,-73.8292049579478,-73.8292019436395,-73.8291989508988,-73.8291959574942,-73.829194421183,-73.8291943419579,-73.8291928056434,-73.8291898013505,-73.8291882360951,-73.8291851930666,-73.8291792349766,-73.8291747635776,-73.8291717708332,-73.8291687765483,-73.8291657824816,-73.8291627890784,-73.8291597754271,-73.8291552644113,-73.8291492969665,-73.8291448255663,-73.8291418119137,-73.8291387795493,-73.8291357665584,-73.8291342289195,-73.8291356485926,-73.829138602385,-73.8291415957934,-73.8291445324165,-73.8291429758514,-73.8291370077436,-73.8291339940895,-73.8291324577702,-73.8291294441155,-73.8291264110926,-73.8291233974371,-73.8291204040256,-73.8291174097391,-73.8291144156708,-73.8291114120301,-73.8291098469846,-73.8291082804059,-73.8291052682859,-73.8291037023605,-73.8291021370986,-73.8290991140851,-73.8290960797379,-73.8290926698372,-73.8290924411716,-73.829048459001,-73.8290449821116,-73.8290496056455,-73.8290397267007,-73.8290142126814,-73.8289954501667,-73.8289801914146,-73.8289680157719,-73.8289740527622,-73.8289660668797,-73.8289389148961,-73.828915566839,-73.8288448011006,-73.8288294223722,-73.8287779862699,-73.8286950744417,-73.8286084613784,-73.8285494693337,-73.828494748762,-73.8284358082812,-73.8283925013183,-73.8283913029705,-73.8283293909265,-73.8283081930532,-73.8282924095787,-73.8282479678496,-73.8282411744699,-73.8282064454813,-73.8281533300299,-73.8281433662934,-73.8280993822918,-73.8280900020959,-73.8280683036307,-73.82802509067,-73.8280178539586,-73.827938901072,-73.8278575100962,-73.8278564569545,-73.8278210716311,-73.8277698430138,-73.8277179763238,-73.82767895588,-73.8276694443778,-73.8276592054215,-73.8275873922223,-73.8276178807309,-73.8276408108247,-73.8276516486183,-73.8276529274154,-73.8276552485459,-73.8276193015333,-73.8274715456467,-73.8274402162694,-73.8274326145074,-73.8273983018031,-73.8273635731324,-73.8273445617149,-73.8273408332956,-73.8273344052269,-73.8273340139081,-73.8273086310885,-73.8272752795539,-73.8272452273046,-73.8272030343498,-73.827146411986,-73.8271425962414,-73.8271152865144,-73.8270796938176,-73.8271179987205,-73.8271082023202,-73.8271121216493,-73.8271165147108,-73.8271194288752,-73.8271238226015,-73.8271296906109,-73.8271355614815,-73.8271414316917,-73.8271472999239,-73.8271531701348,-73.827154608476,-73.8271516149453,-73.8271500682509,-73.8271499601135,-73.8271498526351,-73.8271527378092,-73.8271601050066,-73.8271674900697,-73.8271718835775,-73.8271747589438,-73.8271791517942,-73.8271865377361,-73.8271938837761,-73.8271982378276,-73.8272011332515,-73.8272040474228,-73.8272069544229,-73.8272083428344,-73.8272097308126,-73.827212616867,-73.8272154935546,-73.8272183889869,-73.8272213031567,-73.8272242188674,-73.8272271330365,-73.8272300494069,-73.8272329648984,-73.8272358799504,-73.8272402714874,-73.8272461220885,-73.8272504754875,-73.8272533702601,-73.827257025644,-73.8272610084479,-73.8272834724584,-73.8272867965363,-73.8273119088273,-73.8273189106223,-73.8274379955486,-73.8274558897316,-73.8274874544982,-73.8275339946922,-73.8275357847701,-73.827564691917,-73.827587570103,-73.8276023197398,-73.8275977869096,-73.8275973563646,-73.8275995014461,-73.8276009188879,-73.8276008208182,-73.8276022007939,-73.8276050753462,-73.8276049982108,-73.8276019634466,-73.8276011348585,-73.8276049781909,-73.8275965163336,-73.8275883989785,-73.8275850716295,-73.8275725117443,-73.827556460513,-73.8275530957673,-73.8275405662261,-73.8275127469555,-73.8274383149552,-73.8273796830402,-73.8273446091173,-73.8273019254298],"lat":[40.609485389754,40.6094642210526,40.6094814194489,40.6094720058847,40.6094448782835,40.6094157531125,40.6093665144166,40.6093564271252,40.6093573616984,40.6093525418209,40.6093462887201,40.6093553635398,40.6093605252869,40.6093887919841,40.6093942065203,40.6093765646523,40.6093686337992,40.6093451202832,40.6093294369046,40.6093176114767,40.6093097582912,40.6092944643592,40.6092944359263,40.609292153795,40.6092909828026,40.6092898118125,40.6092875303496,40.60928524889,40.609282951961,40.6092828914379,40.6092850980822,40.6092861799643,40.6092861194385,40.6092883260812,40.6092927993913,40.6092938955651,40.609291598638,40.6092903973817,40.6092903225593,40.6092891520688,40.6092868706057,40.6092845884743,40.6092823065071,40.6092796484487,40.6092751289056,40.6092691256535,40.6092646072852,40.6092630618725,40.6092618908769,40.6092596087438,40.6092584377475,40.6092583624222,40.6092594128627,40.6092616195034,40.6092612138158,40.6092566959505,40.6092506910198,40.6092461726509,40.609244627237,40.609244566707,40.6092428324923,40.609237751909,40.6092326691478,40.6092298256382,40.6092275389059,40.6092263531122,40.6092262725161,40.6092250872223,40.6092228006558,40.6092205180161,40.6092182365523,40.6092159544159,40.609213672446,40.6092102650458,40.6092046212459,40.6091989919068,40.6091955988022,40.6091921914018,40.6091876587364,40.6091842496606,40.6091819686954,40.6091796872309,40.609177405764,40.6091773743255,40.6091807376662,40.609184084535,40.6091858739454,40.6091762748766,40.6091610935346,40.609153730865,40.6091479997585,40.6091451005036,40.609142817863,40.6091405220994,40.6091382103613,40.609135942519,40.6091325946482,40.6091280910778,40.6091257953129,40.6091257347742,40.6091245642735,40.6091222828053,40.6091211117998,40.6091210512612,40.609122131959,40.6091243540603,40.6091243237904,40.6091220263487,40.6091197151118,40.6091174038736,40.6091150909608,40.6091127868747,40.6091115939174,40.6091126514918,40.6091148664424,40.6091159466345,40.6091158717944,40.6091146710169,40.6091123740754,40.6091100926045,40.6091078111338,40.6091055289927,40.6091032772893,40.609101055191,40.6090976930255,40.6090931894539,40.6090897968481,40.6090875153784,40.6090841222687,40.6090796193684,40.6090762267632,40.6090739447888,40.6090716478466,40.6090693361029,40.6090659281939,40.6090602986874,40.6090546543787,40.6090512469722,40.6090489649993,40.6090489352302,40.6090511573277,40.6090500006191,40.6090454672776,40.6090420593681,40.6090397778949,40.6090397476215,40.6090419690487,40.6090441906464,40.6090463977753,40.6090463389032,40.6090429298205,40.6090395378846,40.609038351402,40.6090371506196,40.609034883445,40.6090315360838,40.6090270336861,40.6090230618861,40.609017981466,40.6090128987039,40.609008928579,40.6090032842693,40.6089976549304,40.6089942623255,40.6089930924875,40.6089930169687,40.6089940680534,40.6089962741759,40.6089962439006,40.6089939629284,40.6089916802805,40.6089893988076,40.6089867407355,40.6089822211911,40.6089762179369,40.6089717298395,40.6089691333233,40.608966911896,40.6089641260776,40.6089590747596,40.6089528820372,40.6089478169217,40.6089444090102,40.6089420972609,40.6089398003127,40.6089375188385,40.608935229042,40.6089340365788,40.608932842441,40.6089305531432,40.6089282716671,40.6089259901933,40.6089237075434,40.6089214260695,40.6089202550548,40.6089201904057,40.6089201150512,40.6089200344231,40.6089177231747,40.6089132299715,40.6089110524547,40.6089111279795,40.6089089206869,40.6089044177867,40.6089010103763,40.6088987277258,40.60889644625,40.6088941950526,40.6088919741294,40.6088897515309,40.6088875294339,40.6088841677735,40.6088807591903,40.6088784474404,40.6088761802644,40.6088735827445,40.6088690946454,40.6088630902208,40.6088585713435,40.6088559154501,40.6088536328005,40.6088524634593,40.6088524029051,40.6088512312215,40.6088489420938,40.6088477484506,40.6088465559841,40.6088442661848,40.6088419847059,40.6088397032304,40.6088362946455,40.6088317614664,40.6088277896624,40.6088227085722,40.60881767273,40.6088149181979,40.6088115703367,40.608807067269,40.6088025643657,40.6087982688614,40.6087980607955,40.608794712264,40.6087925211181,40.6087903144961,40.6087880929058,40.608785870308,40.608782522949,40.6087780496535,40.6087747022944,40.6087724505944,40.6087712789073,40.6087689826286,40.6087644492812,40.6087606869761,40.6087599154311,40.6087553822531,40.6087530858043,40.6087512223002,40.6087461505413,40.6087410980508,40.6087383144146,40.6087360918173,40.6087338703947,40.6087305080651,40.6087260039908,40.6087226423289,40.6087192937987,40.6087148359789,40.6087115188965,40.6087093122752,40.6087070901818,40.6087037273489,40.608700334908,40.6086980527615,40.6086957712844,40.6086934898092,40.608691207158,40.6086877997465,40.6086832665673,40.6086792947657,40.6086742148463,40.6086680211155,40.6086640664631,40.6086628954452,40.6086605984942,40.6086560651481,40.6086515312986,40.6086469986214,40.6086435912092,40.6086413395078,40.6086391174145,40.6086368964928,40.6086346743997,40.6086313110636,40.6086289632041,40.6086256822272,40.6086200681959,40.6086167196649,40.6086144982403,40.6086122766491,40.6086100552256,40.608606707867,40.6086038312967,40.6086022042953,40.6085987963811,40.6085965599838,40.6085977464733,40.6086022934517,40.6086038492833,40.608604590403,40.6086046509576,40.6086038628045,40.6086024443358,40.608597971544,40.6085946236796,40.6085912603449,40.6085861930525,40.6085800020032,40.6085749192361,40.6085720762173,40.6085697935698,40.6085675120916,40.6085652608928,40.6085630387972,40.6085607875983,40.6085585049494,40.6085562234725,40.6085528160613,40.6085483279644,40.6085450097098,40.6085428030879,40.6085405816622,40.6085383600689,40.6085350122067,40.6085305389118,40.6085266271599,40.6085215770159,40.6085165393311,40.6085149273735,40.6085150170316,40.6085139666199,40.6085117599961,40.608511789098,40.6085140712448,40.608515242255,40.6085153028069,40.6085153616822,40.6085154222311,40.6085143415412,40.6085109792096,40.6085064756381,40.6085030832003,40.6085008017242,40.6084985195813,40.6084951116693,40.6084905778226,40.6084871704134,40.608484888939,40.6084820437428,40.6084769631567,40.608471880389,40.6084690361978,40.6084667849989,40.6084645624014,40.608462355777,40.6084613053604,40.6084613807143,40.6084625517269,40.6084648481704,40.6084649087209,40.6084627020952,40.6084627323706,40.6084650133415,40.6084672953173,40.6084695767907,40.6084718589328,40.608474111809,40.6084763327329,40.6084785541622,40.6084819021935,40.6084875162279,40.6084931455671,40.6084965381722,40.6084988201503,40.6085011022948,40.6085011313952,40.6084989247687,40.6084989853177,40.6085012822625,40.608503563735,40.6085058606807,40.6085059212278,40.6085037146,40.6085014925019,40.6084992710714,40.6084970484715,40.6084936861356,40.6084891825651,40.6084858204,40.6084835983025,40.6084802354673,40.6084757325654,40.6084723251585,40.6084700134124,40.6084677462395,40.6084643993764,40.6084598946331,40.6084564867233,40.6084542360269,40.6084520145964,40.608449791996,40.6084475698965,40.6084453489693,40.6084453787418,40.6084476761864,40.608449987429,40.6084522915215,40.6084534856514,40.60845242691,40.6084502131283,40.6084479915323,40.6084457689288,40.608443170901,40.6084386828013,40.608432678373,40.6084281605051,40.608425504113,40.608423222642,40.6084209405012,40.6084186442259,40.6084163313123,40.6084140343677,40.6084128633613,40.6084128028163,40.6084105070448,40.6084059737031,40.6084025657937,40.6084002843216,40.6083980028499,40.6083957499756,40.6083935283773,40.6083913217499,40.6083891305939,40.6083857832286,40.608380153723,40.60837455516,40.6083712368941,40.6083690302661,40.6083668076629,40.6083645862313,40.6083623646351,40.6083601432046,40.6083567958395,40.6083522922668,40.6083488843583,40.6083466022184,40.6083443207463,40.6083420238041,40.6083419632586,40.6083441698877,40.6083432959603,40.6083373700444,40.6083294888359,40.6083216076265,40.6083157114801,40.6083148979294,40.6083171800698,40.6083194615443,40.6083217584856,40.6083240707324,40.6083263819727,40.6083264425173,40.6083242353844,40.6083220137867,40.6083186516189,40.6083130221119,40.6083074070727,40.6083040602091,40.6083018381085,40.6082996166783,40.6082962538421,40.6082917502691,40.6082883583345,40.6082860756894,40.6082837942202,40.6082815127497,40.6082792306082,40.6082780590982,40.608278000231,40.6082768292246,40.6082745470814,40.6082722651089,40.6082699841382,40.6082677014955,40.6082654502952,40.6082626639713,40.6082576136585,40.6082525320663,40.6082496878795,40.6082474064061,40.6082473761349,40.6082495987357,40.6082495672917,40.6082472812234,40.6082460942413,40.6082460147992,40.6082470801881,40.608249298189,40.6082492667422,40.6082469704684,40.6082446592251,40.6082423622809,40.608240080807,40.6082378427333,40.608234525644,40.6082300220733,40.6082265855636,40.6082242881165,40.6082220059734,40.6082197542699,40.6082175333455,40.6082153112466,40.6082119627106,40.6082074598101,40.6082029264674,40.6081972816551,40.6081916533232,40.6081882602134,40.6081870892015,40.6081859181929,40.6081836367188,40.6081802293106,40.6081757400394,40.608172422447,40.6081702163237,40.6081679942246,40.6081657727946,40.6081635511999,40.608161329771,40.6081579812348,40.6081534783322,40.6081500709246,40.6081477887831,40.6081455068078,40.6081432253352,40.608142054826,40.608141989682,40.6081419148346,40.6081418342145,40.6081395224655,40.6081350137906,40.6081316664285,40.6081294443301,40.6081260969679,40.6081216379708,40.6081194627919,40.6081195376381,40.6081173310111,40.6081128565421,40.608109509177,40.6081072574755,40.6081060864649,40.6081071676594,40.608109382108,40.6081104396737,40.6081081207775,40.6081036095538,40.6080996977993,40.6080946474842,40.6080895653917,40.6080855952666,40.6080810995163,40.6080789153423,40.6080778566049,40.6080745020896,40.6080711399248,40.6080689178266,40.6080666654529,40.6080654796415,40.6080665312308,40.608068722888,40.6080697734725,40.6080696908057,40.6080696083025,40.608068415172,40.6080661260451,40.6080638445698,40.6080615619242,40.6080615316467,40.6080637537443,40.6080637234696,40.6080614413242,40.6080591598475,40.608056878374,40.6080545957255,40.6080522999515,40.6080499881996,40.6080476912516,40.6080454097743,40.6080431128269,40.6080407999014,40.6080384886539,40.6080361769006,40.6080338811231,40.6080304720368,40.6080259684651,40.6080226222778,40.6080192582717,40.6080147553691,40.6080113930393,40.6080086072225,40.6080035564085,40.607998474815,40.6079956306236,40.6079933414941,40.6079921483569,40.6079898289511,40.6079852879499,40.6079818800359,40.6079795978895,40.6079773169155,40.6079739244742,40.6079694204009,40.6079660272915,40.6079637458127,40.6079614939436,40.6079592725184,40.6079547837516,40.6079491389373,40.6079457315256,40.6079434352461,40.6079405596008,40.6079354637066,40.6079303821115,40.60792641148,40.6079218638323,40.6079218032757,40.6079262539468,40.6079284386088,40.607929496167,40.6079317106069,40.6079316808283,40.6079293993515,40.6079271166995,40.6079248660021,40.6079215181416,40.6079170436765,40.6079125710537,40.6079080977598,40.6079036239642,40.607899151176,40.6078969445559,40.6078970034376,40.6078959232553,40.6078937018319,40.6078903544724,40.6078858509016,40.6078824429868,40.6078801608372,40.6078789898206,40.6078778193067,40.6078755676051,40.6078725939924,40.6078669799632,40.6078594736728,40.6078538746129,40.6078509329557,40.60784873399,40.60784767643,40.6078466182049,40.6078444039276,40.6078433225723,40.6078422418846,40.6078400281152,40.607838969883,40.6078379111516,40.6078356968757,40.6078334759523,40.6078312538585,40.6078301724995,40.6078302325499,40.6078314035633,40.6078337005131,40.6078337610653,40.6078315539386,40.6078293323455,40.6078271109195,40.6078248888224,40.6078226673966,40.6078215865396,40.6078216460853,40.6078205658983,40.6078183437996,40.6078161217038,40.6078139079305,40.6078128503636,40.6078140439995,40.607816339774,40.6078175334049,40.6078176230539,40.6078177138761,40.6078166551361,40.6078144471329,40.6078133800695,40.6078134606862,40.6078146464964,40.6078169337415,40.6078169628397,40.6078147419123,40.6078125204847,40.6078102983845,40.6078080757817,40.6078058691527,40.6078064912419,40.6078115899807,40.6078166693934,40.6078195152556,40.6078217967291,40.6078240787018,40.6078263608452,40.6078275318519,40.6078264504869,40.6078242290568,40.6078242593286,40.6078265413027,40.6078277113049,40.6078255046732,40.6078210318759,40.6078199357084,40.6078222178499,40.6078244998215,40.6078278929311,40.6078323953294,40.6078368989013,40.6078402920096,40.6078425734798,40.607844870421,40.6078483080958,40.6078528562358,40.6078562641421,40.6078585456124,40.6078608270821,40.6078631097263,40.6078665171307,40.6078710509715,40.6078744577056,40.6078767100788,40.6078800574456,40.607884560514,40.6078879684208,40.607890249891,40.6078925325316,40.6078948134987,40.6078982214065,40.6079027552479,40.6079061631543,40.6079084446231,40.6079107260915,40.6079130087348,40.6079164161383,40.6079209499786,40.6079243567118,40.6079266465038,40.6079278401235,40.6079267818736,40.6079245823861,40.6079246424194,40.6079269393583,40.6079292208245,40.6079315094427,40.6079327035629,40.6079350224473,40.6079395646062,40.6079429720071,40.6079463639423,40.6079508675133,40.6079542599488,40.6079565420866,40.607958823552,40.6079611061919,40.607964498125,40.607969001696,40.6079723941337,40.6079746762689,40.6079769577363,40.6079792397039,40.6079815289917,40.6079827219365,40.6079816638514,40.6079794493928,40.6079794796614,40.6079817617958,40.6079851691963,40.6079908128313,40.6079964428411,40.6079998354438,40.6080026789546,40.6080077612142,40.6080128423011,40.6080156874871,40.6080179696211,40.6080179998867,40.6080157777808,40.6080135568472,40.6080101935054,40.6080056899323,40.6080023379652,40.608001286856,40.6080013863445,40.6080025871054,40.6080048799397,40.6080060509346,40.6080061097895,40.6080072807864,40.6080095777171,40.6080096377429,40.6080074311011,40.6080052094946,40.6080029880576,40.6080002027293,40.6079951519094,40.6079901148779,40.6079885017182,40.6079885765391,40.6079897475338,40.6079920368139,40.6079932309229,40.6079955497962,40.6080000907762,40.6080023877067,40.6080024470586,40.6080013663484,40.6079991454123,40.6079980645343,40.607998134254,40.6079982245357,40.6079983245143,40.6079972733961,40.6079950621506,40.6079962178443,40.6080007521798,40.6080041595755,40.6080075515051,40.6080109446055,40.6080109736958,40.6080076120267,40.6080042486824,40.6080020277437,40.6079986643972,40.6079941608261,40.6079907682274,40.6079884867654,40.6079862447614,40.6079851948126,40.6079852947875,40.6079842431623,40.6079820324188,40.6079820621772,40.6079843436351,40.6079855146225,40.607985574639,40.6079867451268,40.6079890270879,40.6079913085465,40.6079935906772,40.607995872637,40.6079981547665,40.6080004362236,40.6080027227841,40.608003909237,40.6080039886412,40.6080051750924,40.6080074616489,40.6080086326344,40.6080075519176,40.6080053298047,40.6080053595609,40.6080076569824,40.6080088577251,40.6080089371299,40.6080090124358,40.60800909301,40.6080080270848,40.6080058095648,40.6080058294379,40.6080058409943,40.6080081212783,40.6080093038188,40.6080096076044,40.6080108357289,40.6080042191342,40.6080019672661,40.6079997446454,40.6079982325832,40.6079975231972,40.6079953022526,40.6079930503813,40.6079907689283,40.607988471004,40.6079861597995,40.607983862879,40.6079815814256,40.6079792916548,40.6079780992345,40.6079769051438,40.6079746158687,40.6079723344147,40.6079700524566,40.6079677703303,40.6079643779,40.6079598748293,40.6079564817302,40.6079542002745,40.6079519183155,40.6079496361906,40.6079474004536,40.6079452080906,40.6079430162286,40.6079408250387,40.6079386336809,40.6079386931881,40.6079409906082,40.6079421610891,40.6079444585089,40.6079489911639,40.6079523985535,40.6079546800068,40.6079558509904,40.6079559115001,40.6079548307782,40.607952608662,40.6079503872135,40.6079481805581,40.6079482410667,40.6079505527744,40.6079506127798,40.6079484054521,40.6079461840031,40.6079428211577,40.6079371923201,40.6079315771026,40.6079304809185,40.6079327681429,40.6079339545851,40.6079340344757,40.6079352209169,40.6079374767109,40.6079408245989,40.6079453281703,40.6079487355579,40.607951018184,40.6079532996351,40.607955581088,40.607957863713,40.607960152312,40.6079613458949,40.6079602871054,40.6079580721282,40.6079552874597,40.6079502366315,40.6079440429001,40.6079389777845,40.6079344742131,40.6079299711423,40.6079265787153,40.6079231713286,40.6079186677558,40.6079141939331,40.6079096903603,40.6079051570386,40.607900623885,40.6078972164982,40.6078949338716,40.6078926524201,40.607890370968,40.6078891845279,40.607889095446,40.607890160204,40.6078923818206,40.6078923520712,40.6078900706198,40.6078888996386,40.6078888319899,40.6078887488731,40.6078875564613,40.6078852523994,40.6078851918925,40.6078873914039,40.6078884501876,40.6078895077993,40.6078917068063,40.607891646799,40.6078893427377,40.6078881498146,40.6078869562272,40.6078846664533,40.6078823849973,40.6078801030409,40.6078789325586,40.6078800127739,40.6078833756182,40.6078867306499,40.607887788927,40.607886595337,40.607884291269,40.6078819790539,40.6078796826372,40.6078785111482,40.6078784516395,40.6078795325254,40.6078817539689,40.6078817248856,40.6078794279653,40.6078793674504,40.607879958529,40.607881574102,40.6078837955473,40.6078860171577,40.6078859874037,40.6078837059476,40.6078814244881,40.6078791418569,40.6078768604006,40.6078745782728,40.6078734084569,40.6078733479413,40.6078744298277,40.6078766507695,40.6078799976442,40.607884501719,40.6078879091132,40.607890146022,40.6078900860069,40.6078877890842,40.6078855071212,40.6078832261665,40.6078809435341,40.6078786615741,40.607876380616,40.6078740979843,40.6078718165247,40.607869519602,40.6078694590835,40.607871658585,40.6078727173551,40.6078737756243,40.6078759899188,40.6078782120315,40.6078804258269,40.6078814845943,40.6078802909937,40.6078780023857,40.6078757197515,40.607873438291,40.6078711568298,40.6078688594021,40.6078687993808,40.6078710060255,40.6078709762672,40.6078686948054,40.607866412843,40.6078641307096,40.6078641004485,40.6078663230621,40.6078662922966,40.607864010834,40.6078617287036,40.6078594467393,40.6078582757435,40.6078582162259,40.6078570452317,40.6078547632649,40.6078524823066,40.6078501848754,40.6078478736526,40.6078455690744,40.6078443754628,40.6078442851759,40.6078441955584,40.6078430019496,40.6078406978715,40.6078383856411,40.607836088707,40.6078349177123,40.6078348576855,40.6078347988312,40.6078347311556,40.6078346480085,40.607835706266,40.6078379200528,40.6078367650258,40.6078322311869,40.6078288237868,40.6078265411489,40.6078253701513,40.6078264515249,40.6078286729607,40.6078286438671,40.6078263457609,40.6078262864021,40.6078284930378,40.6078307144731,40.6078329365794,40.6078351586867,40.6078373796188,40.6078396010538,40.6078418236624,40.6078417928905,40.6078394959566,40.6078371847243,40.6078348884602,40.6078326063212,40.6078292138866,40.6078258212835,40.6078235393128,40.6078201467094,40.6078156438064,40.607812243555,40.6078110494319,40.6078098558141,40.607806455559,40.6078030631241,40.6078007809843,40.6077984847168,40.6077961734821,40.607793876546,40.6077915950793,40.6077893124384,40.6077870309682,40.6077847494993,40.6077824673621,40.60778018539,40.6077790143851,40.6077789538484,40.6077788943148,40.6077788194792,40.607777617701,40.6077753064644,40.6077729947238,40.6077706982878,40.6077684163155,40.607766134174,40.6077638527031,40.6077615661343,40.6077603796584,40.6077603002213,40.6077591149188,40.607756827169,40.6077556561638,40.6077555961238,40.6077544246137,40.6077521436453,40.6077498610008,40.6077475723823,40.6077463787547,40.6077474374995,40.6077496512753,40.6077496210028,40.60774732406,40.6077461239521,40.6077471898434,40.6077493964709,40.6077493364273,40.6077470394834,40.6077447575097,40.6077424610658,40.6077424005197,40.6077446071471,40.6077479551806,40.6077524289824,40.607754635606,40.6077557162989,40.6077579378938,40.6077579069496,40.6077556106742,40.6077555501254,40.6077577567503,40.6077577269804,40.6077554312056,40.6077542299173,40.6077541550695,40.6077552352566,40.6077574418794,40.607759633031,40.6077618408281,40.6077640617526,40.6077662838488,40.6077662535707,40.6077639566237,40.607763896575,40.6077661031985,40.6077671845559,40.6077682647422,40.6077704713621,40.6077704124839,40.6077681067127,40.6077669142432,40.6077679729767,40.6077701867485,40.6077724081716,40.6077746297644,40.6077768511896,40.6077790686858,40.6077801333944,40.6077800539406,40.6077811198209,40.6077833208342,40.60778326078,40.6077798533674,40.6077764459548,40.6077763853974,40.6077797334253,40.6077830909886,40.6077841568695,40.6077840769086,40.6077840008754,40.6077850776276,40.6077872990494,40.607787268769,40.6077849826918,40.6077837956946,40.6077837162338,40.6077847816065,40.6077869841237,40.6077880351942,40.6077879591595,40.6077862244181,40.6077811433245,40.6077760617288,40.6077720920995,40.6077675891989,40.6077642406706,40.6077620340543,40.6077598422419,40.6077553696231,40.6077497241372,40.6077474278521,40.6077462573333,40.6077439746805,40.6077416931997,40.6077394117207,40.6077371290666,40.6077348480888,40.6077325666076,40.6077303142359,40.6077280928145,40.6077258718979,40.6077236498062,40.6077214272119,40.6077192057911,40.6077158434603,40.607712451522,40.6077112804993,40.6077089835446,40.6077044799729,40.6077011321158,40.6076989105256,40.6076966891038,40.6076944670129,40.6076922455923,40.6076899937232,40.6076877117386,40.6076854224386,40.6076842294594,40.6076830358133,40.6076807471787,40.6076784645267,40.6076762128238,40.6076739907327,40.6076706279015,40.6076661243309,40.6076627318862,40.6076615618692,40.6076626427181,40.6076648564854,40.6076659152075,40.6076647215583,40.6076624775083,40.6076602851979,40.607658078583,40.6076558564918,40.6076524948336,40.6076491022247,40.6076479312009,40.6076461964583,40.6076411153637,40.6076360337666,40.6076331895709,40.6076308926137,40.6076285808491,40.6076263141737,40.6076229668195,40.6076184627448,40.6076139293935,40.6076093955381,40.6076059881215,40.6076036918348,40.6076013800694,40.6075990676345,40.6075961921485,40.6075910967497,40.6075860442612,40.6075832606296,40.6075787725352,40.6075731728088,40.6075698557387,40.607567649125,40.6075643005973,40.6075597970265,40.6075563896098,40.6075541076253,40.6075512629233,40.6075461818283,40.6075394270575,40.6075326722864,40.6075275890148,40.6075236193835,40.6075190861987,40.6075156787816,40.6075134275825,40.6075100790562,40.6075055754855,40.6075016043463,40.6074965232511,40.6074914707659,40.6074886878043,40.6074853249707,40.6074819621414,40.6074786142839,40.6074730002545,40.6074673719224,40.607463978807,40.6074616973263,40.6074593998628,40.6074570874298,40.6074547761655,40.6074524643977,40.6074501686111,40.6074478859568,40.6074456039693,40.6074429458919,40.607438426843,40.6074324230846,40.6074279343207,40.6074253384828,40.6074231170658,40.6074208944742,40.6074186728874,40.6074164514701,40.6074142448574,40.6074120525475,40.6074087056962,40.6074042021254,40.6074008101858,40.607397963808,40.6073928827128,40.6073878011169,40.6073860678779,40.607386007311,40.6073837115243,40.6073791781722,40.6073757697482,40.607373488769,40.6073712072859,40.607368924628,40.6073666431441,40.6073643461848,40.6073620344162,40.6073597677388,40.6073575451497,40.6073553237315,40.6073519768812,40.6073475030897,40.607344156242,40.6073419336505,40.6073397115605,40.6073374901414,40.6073352685558,40.607333047138,40.6073302618302,40.6073252110185,40.6073201289199,40.6073161587853,40.60731162493,40.6073082181822,40.6073059360281,40.6073036540437,40.6073013718904,40.6072990904065,40.6072968084205,40.6072939630479,40.6072888831248,40.6072838306391,40.6072799205707,40.6072754169989,40.6072720102507,40.6072697275935,40.6072674461099,40.607264052995,40.6072595505969,40.6072561872646,40.607253965177,40.6072517442623,40.607248677345,40.6072427828774,40.6072349016677,40.6072270204622,40.6072211231465,40.6072180579044,40.6072146962472,40.6072101921737,40.6072067847555,40.6072044729874,40.607202176028,40.6071987686096,40.6071942342496,40.607190826831,40.6071885904401,40.6071863993038,40.6071830507795,40.6071796433612,40.6071773315933,40.6071739241747,40.6071694206015,40.6071660281586,40.607163746005,40.6071614943023,40.607159272214,40.6071570507956,40.6071537027731,40.6071491998723,40.6071457924537,40.6071435097972,40.6071412283127,40.6071389313514,40.6071366200843,40.6071343529053,40.6071310060537,40.6071265014777,40.6071225303366,40.6071174502475,40.6071112565171,40.6071050661369,40.6070994206499,40.6070960132306,40.6070937169391,40.6070902792353,40.6070846189393,40.6070789901023,40.6070744865314,40.6070710939195,40.6070682487118,40.6070631681212,40.6070581151321,40.6070549555751,40.6070504668129,40.6070444630543,40.6070399440045,40.6070367238787,40.6070316432837,40.6070254500565,40.6070203849414,40.607016992496,40.6070141466203,40.6070090660263,40.6070039839278,40.6070000137911,40.606994369475,40.6069887401353,40.6069853475242,40.6069830660404,40.6069807845532,40.6069779381732,40.6069728587529,40.606966664353,40.606961599238,40.6069582370795,40.6069560149925,40.6069526533352,40.6069492602211,40.6069464138404,40.6069413339163,40.6069362516491,40.6069334074478,40.6069311259616,40.606927717536,40.606923184179,40.6069197767594,40.6069174952735,40.6069140878527,40.6069095842798,40.6069051104927,40.6069006069198,40.6068972001691,40.6068949180144,40.6068915095882,40.6068870060139,40.6068832825706,40.6068787939752,40.6068727895477,40.6068683019565,40.6068657049499,40.6068634537507,40.6068611717613,40.6068588896065,40.6068566081206,40.6068543261299,40.6068531556033,40.6068519845717,40.6068497019139,40.6068474204275,40.6068451692263,40.6068423839231,40.606837333112,40.6068322806305,40.6068294964992,40.6068272750822,40.6068239282358,40.6068194246625,40.6068160167378,40.6068137340802,40.6068103266576,40.6068057939714,40.6068023860494,40.6068001050635,40.6067978224045,40.6067955409178,40.6067932594305,40.6067898663145,40.606784236306,40.6067774815326,40.6067729636568,40.6067706816662,40.6067672890532,40.6067616590434,40.6067560445134,40.6067515712279,40.606747068327,40.6067436609051,40.6067402677905,40.6067357642162,40.6067323567942,40.6067294812994,40.6067243858956,40.6067193334092,40.6067165492797,40.6067131869542,40.6067098236234,40.6067076027118,40.6067042393811,40.606699735808,40.6066963433635,40.6066940623791,40.6066917797173,40.6066906103619,40.6066916905312,40.6066939114422,40.60669350573,40.6066889866788,40.6066829829201,40.6066773534151,40.6066724760963,40.606669082978,40.6066668014917,40.6066645188313,40.6066622373438,40.606659955854,40.6066576731934,40.606655421493,40.6066526361881,40.6066475853807,40.6066425340696,40.6066386235014,40.6066341199284,40.6066307125057,40.6066284310192,40.6066261488602,40.6066238668676,40.6066204594479,40.6066159267586,40.6066113928965,40.606606859539,40.606603451613,40.6066011701249,40.6065988886364,40.6065966362626,40.6065932889149,40.6065888151292,40.6065849033893,40.606579852582,40.606574770981,40.6065719272797,40.6065696452867,40.6065673637996,40.6065650668315,40.6065627550523,40.6065593464557,40.6065559540082,40.6065525465853,40.6065480435159,40.6065435697307,40.6065390661587,40.6065356587348,40.6065333767422,40.6065310952544,40.6065288130951,40.60652540634,40.6065208724769,40.6065167130349,40.606511069219,40.6065035629315,40.6064979181129,40.606494322893,40.6064892429667,40.6064841601923,40.6064813171598,40.6064790344963,40.6064767530079,40.6064744560365,40.6064721442572,40.6064698775765,40.606467092946,40.6064620421376,40.6064569588625,40.6064541151594,40.6064518331646,40.6064484257393,40.60644389238,40.6064404849546,40.6064395934667,40.606437092505,40.6064320245428,40.6064258341628,40.6064207508874,40.6064179071819,40.6064156251866,40.6064144551579,40.606414379763,40.6064131784337,40.6064097710075,40.6064052674365,40.6064018743163,40.6063990291053,40.606393948509,40.6063888657337,40.6063856456011,40.6063811277218,40.6063751227903,40.6063706049098,40.6063668225616,40.6063622886994,40.6063588812704,40.6063554888234,40.6063509852513,40.6063475921329,40.6063453106403,40.6063419186936,40.6063374151215,40.6063340220043,40.6063313639164,40.606326845531,40.6063208411055,40.606316322722,40.6063136663082,40.6063113841462,40.6063079767189,40.6063034435228,40.6062996589978,40.6062951411181,40.6062891361867,40.6062846183055,40.6062815852969,40.6062770674144,40.6062710624843,40.6062665446051,40.6062638881901,40.6062616353156,40.6062582884744,40.6062537849033,40.606249251038,40.606244718344,40.6062401844772,40.6062356506123,40.6062322431843,40.6062299914825,40.6062266434682,40.6062221405673,40.6062187319665,40.6062164504734,40.6062136045894,40.6062085246592,40.6062034430589,40.606200597676,40.6061983173546,40.60619603519,40.6061926427421,40.6061875742753,40.6061813832258,40.6061763011196,40.6061728936909,40.6061678130936,40.6061610578195,40.6061543030463,40.6061492197706,40.6061463760614,40.6061441248623,40.6061407770172,40.6061351629922,40.6061295334848,40.6061261415394,40.6061227324353,40.6061181997412,40.6061147918097,40.6061124953328,40.6061090571084,40.60610450843,40.6061011010007,40.6060988497982,40.6060966272198,40.6060944056443,40.6060921842363,40.6060888214126,40.6060831925767,40.6060775482578,40.606073014391,40.6060684810254,40.6060650725909,40.6060627910954,40.60605994521,40.6060548657837,40.606048672055,40.6060436069374,40.6060402138189,40.6060379323245,40.6060356496551,40.6060333681606,40.6060310866647,40.6060276792347,40.606023175161,40.606018702386,40.6060141983122,40.6060107908823,40.6060085088836,40.6060051014535,40.6060005680891,40.6059971596536,40.605994908955,40.6059921231581,40.6059870728568,40.6059819907497,40.6059791465375,40.6059768643714,40.6059734576121,40.6059689540401,40.6059656055261,40.6059633543249,40.6059610728308,40.6059587758524,40.605956462888,40.6059541968746,40.6059519759705,40.6059497235976,40.6059474421009,40.6059451446216,40.6059428333298,40.6059405661445,40.6059372193058,40.6059327152321,40.6059293078011,40.6059270566019,40.6059242696331,40.6059192199988,40.6059141377238,40.6059124046353,40.6059123440407,40.6059100475637,40.6059055148662,40.6059009804976,40.6058964471297,40.605893038693,40.6058907576989,40.6058884767051,40.6058850835831,40.6058800157873,40.6058738247371,40.6058687414565,40.6058658977453,40.605863615745,40.6058607703598,40.6058556899291,40.6058494967009,40.6058444315856,40.6058410384625,40.6058398674165,40.6058386973759,40.6058364153773,40.6058335694856,40.6058284895572,40.6058234067802,40.6058205637397,40.605818265582,40.6058148285229,40.6058102791676,40.6058068717345,40.6058045902357,40.6058023082339,40.6058000260655,40.6057977445665,40.6057954933672,40.6057932712932,40.6057899091417,40.6057865458164,40.6057831989789,40.6057786954078,40.6057763984253,40.6057763378273,40.605775167281,40.6057728709681,40.6057694320635,40.6057648850512,40.6057614771147,40.6057591949469,40.6057569129431,40.6057546605713,40.605752439168,40.6057490763457,40.6057456689117,40.6057433576145,40.6057410606314,40.6057387786273,40.6057365274302,40.6057331794211,40.60572756607,40.6057219360599,40.6057185286256,40.6057162168251,40.6057139198416,40.6057116383419,40.6057093561713,40.6057070741668,40.6057047926683,40.6057025104971,40.605700214182,40.60569790171,40.6056956356953,40.6056922871865,40.6056866726621,40.6056810443274,40.6056765402537,40.6056731476349,40.6056708661326,40.6056685846336,40.6056663019594,40.6056640204589,40.6056617389577,40.6056594567883,40.6056571747829,40.6056549235847,40.6056527020166,40.6056504503128,40.6056481676394,40.6056458861389,40.6056447150853,40.6056424180987,40.6056379145263,40.6056345676949,40.6056312043697,40.6056277976038,40.6056254863051,40.6056231876395,40.6056209061394,40.6056186251396,40.6056157787448,40.6056106988144,40.6056056165369,40.6056027734901,40.605599380368,40.6055959872459,40.6055937057421,40.6055914237377,40.605589141565,40.605586860064,40.6055845785613,40.6055822970591,40.6055800143845,40.6055777620116,40.6055744158499,40.6055699122768,40.605566504337,40.6055642221659,40.6055619406635,40.6055596591591,40.605556251219,40.6055517173448,40.6055483099072,40.6055460284024,40.6055437457269,40.6055414945291,40.6055392736321,40.6055359103082,40.6055325176881,40.6055302356817,40.6055279535067,40.6055256720051,40.6055233750154,40.6055210643812,40.6055187673911,40.6055153582775,40.6055108255738,40.6055085285833,40.6055062315913,40.605501697715,40.6054982909449,40.6054948978207,40.6054892689857,40.60548362466,40.605480217221,40.6054779345442,40.6054745271041,40.605468882279,40.605464364391,40.6054609564491,40.6054564225718,40.60545412558,40.6054518292581,40.605447325687,40.6054428519174,40.6054383488479,40.605434941408,40.6054326594001,40.6054303772232,40.6054280957198,40.6054258137112,40.6054235315375,40.6054212500325,40.6054189988313,40.6054156503273,40.6054111474263,40.6054077399863,40.6054054578101,40.605402799708,40.6053982813193,40.6053922775605,40.6053877585003,40.6053851020758,40.6053828205704,40.6053805383928,40.6053782563839,40.6053748489433,40.6053703162384,40.6053680180709,40.6053664715891,40.6053619531997,40.6053559487707,40.6053514606867,40.6053500044523,40.6053483605908,40.6053433097921,40.6053382275122,40.6053353839611,40.6053331017851,40.6053308197769,40.6053285382689,40.6053262560928,40.6053228636386,40.6053183600655,40.6053149972458,40.6053127758515,40.6053105251528,40.6053082424754,40.6053059466538,40.6053036331641,40.6053013366733,40.6052990546632,40.605296803463,40.6052945818997,40.6052923301978,40.6052889227563,40.6052843883732,40.6052809809326,40.6052787297324,40.6052761305705,40.6052716429884,40.6052656385594,40.6052611201707,40.6052595746919,40.6052580270348,40.6052535081426,40.6052475042162,40.6052429858253,40.6052403293958,40.6052380329047,40.6052357205853,40.605233453896,40.6052312318332,40.6052278696851,40.6052233666165,40.6052200032947,40.6052177818994,40.6052155295276,40.6052132480205,40.6052109510236,40.605210892082,40.6052130986578,40.6052130678482,40.6052107856685,40.6052085041621,40.6052062529629,40.6052034666755,40.6051984163784,40.6051933639044,40.6051905802953,40.605188329096,40.6051860475885,40.6051837660802,40.6051814833998,40.6051780914454,40.605174698319,40.6051718530884,40.6051667719835,40.6051616897024,40.6051577202137,40.6051531863341,40.6051492151689,40.6051441340615,40.6051379413355,40.605132311997,40.6051261204426,40.6051210376589,40.6051170686715,40.6051125352951,40.6051091268465,40.6051068458386,40.60510456433,40.6051022765424,40.6051010911624,40.6051010104493,40.6050986986316,40.605093049697,40.605087419688,40.6050840265611,40.6050817450517,40.6050783525939,40.605073004193,40.6050659678125,40.6050580866022,40.6050502063981,40.6050442794563,40.6050411541259,40.6050388721118,40.6050354646672,40.6050309615986,40.605028754523,40.6050288146406,40.6050266073997,40.6050221348063,40.6050210386793,40.6050233206896,40.6050244917528,40.6050230345196,40.6050185464372,40.6050125415055,40.6050080231137,40.6050053671872,40.6050030845069,40.6050008029969,40.6049985131573,40.6049973206149,40.6049950016399,40.6049904909071,40.6049860164711,40.60498151357,40.604976979688,40.6049724756129,40.6049680023519,40.6049623878319,40.6049567588269,40.6049533663697,40.6049510848596,40.6049488324877,40.6049454851607,40.6049410113957,40.6049371001799,40.6049320505533,40.6049269980789,40.604924304957,40.604889974226,40.604860304031,40.6048365932011,40.6048069636486,40.6048054305218,40.6047773339257,40.6047356333027,40.6047239923605,40.6047212127872,40.6047307068129,40.604747913773,40.6047487382487,40.6047587324326,40.6047697957836,40.6047698461035,40.604769928183,40.6047700107642,40.6047700826331,40.6047701587247,40.6047702387521,40.6047714241189,40.6047737119004,40.604774882954,40.6047749425545,40.6047761136084,40.6047783951105,40.6047806766123,40.6047829592869,40.6047852407909,40.6047875222913,40.6047898044642,40.6047920864671,40.6047932565162,40.60479331712,40.6047933777232,40.6047934371537,40.6047923565032,40.604790135603,40.604787913533,40.6047856926339,40.6047834700593,40.6047812479894,40.6047812782892,40.604783560961,40.6047858424634,40.6047881234622,40.6047915314001,40.6047916836632,40.6047960647685,40.6047994727063,40.6048017542083,40.6048040357089,40.6048063326927,40.604806393292,40.6048042010173,40.6048053875534,40.6048099362394,40.6048133436737,40.6048156406574,40.6048179529582,40.6048202591496,40.6048214599959,40.6048215605999,40.6048205095745,40.604818297876,40.6048183276729,40.6048206096741,40.604822891172,40.6048251733385,40.6048274553399,40.6048297518187,40.6048320641165,40.6048343610996,40.6048352984048,40.604839365945,40.6048390674215,40.6048368525003,40.6048346310931,40.604832425004,40.604831373973,40.6048314546546,40.6048315295571,40.6048316090626,40.6048305437195,40.6048283269131,40.6048261048356,40.604823883933,40.604823913725,40.6048262100326,40.6048262706236,40.6048240635268,40.6048218426224,40.6048184792948,40.6048128509597,40.6048072357613,40.6048061407922,40.6048084222869,40.6048118297166,40.6048163635842,40.6048197715164,40.6048220530114,40.6048243345056,40.6048266166686,40.6048277865379,40.6048278471275,40.6048290181691,40.6048313003317,40.604833581826,40.6048358644923,40.6048370355333,40.6048371104297,40.6048360588892,40.604833868274,40.6048339271851,40.6048362241591,40.6048373951988,40.6048374552815,40.6048386263209,40.6048409237947,40.6048409832069,40.6048387766101,40.604837695442,40.6048377631818,40.6048378457278,40.6048390394019,40.6048413435262,40.6048436558131,40.6048459527844,40.6048482342752,40.6048505164371,40.604852798431,40.6048550845246,40.604856270539,40.6048563510318,40.6048575370466,40.6048598236387,40.6048609946743,40.6048610542493,40.6048599745853,40.6048577520015,40.6048577822901,40.6048600642841,40.6048634717086,40.6048680050682,40.6048714129951,40.6048736956569,40.6048759771456,40.6048782581319,40.6048794291671,40.6048794897437,40.6048784079016,40.6048761869907,40.6048734011852,40.6048683508785,40.6048632990617,40.6048616561784,40.6048617155835,40.6048628872864,40.6048651687729,40.6048680129784,40.6048730945778,40.604878175174,40.6048810215552,40.6048833018711,40.6048855840274,40.6048878803254,40.6048879408995,40.6048857342924,40.6048829496593,40.6048778988489,40.6048728618424,40.6048723596996,40.6048746263789,40.6048768477951,40.6048790996635,40.6048813811503,40.6048836631416,40.604885945297,40.6048893377418,40.6048927451645,40.6048950581111,40.6048984655325,40.6049018722842,40.6049041847276,40.6049064805188,40.6049076670242,40.6049099936057,40.6049145429402,40.6049168399066,40.604918010933,40.6049202919166,40.6049225734024,40.6049248251046,40.6049270471916,40.6049292692796,40.6049314901935,40.604933741897,40.604934914098,40.6049338322507,40.6049316113362,40.6049316404476,40.6049339226026,40.6049362040871,40.6049384860765,40.6049407682313,40.6049430199335,40.604945241517,40.6049486036805,40.6049519962918,40.6049531673196,40.6049532278869,40.6049510212756,40.6049465627954,40.6049454969271,40.6049477933859,40.6049489644122,40.6049478830653,40.6049456616469,40.6049445814725,40.6049446491926,40.6049447312142,40.6049436729979,40.6049403179885,40.6049346884801,40.6049290751184,40.6049279789646,40.6049302604461,40.6049314314719,40.604931491535,40.6049326625593,40.6049349435398,40.6049383519625,40.6049428853144,40.6049462932333,40.6049485747174,40.6049508561981,40.6049531388547,40.6049554203353,40.6049577018181,40.6049599839685,40.6049622654522,40.6049645474369,40.6049667993047,40.6049701466629,40.6049746199537,40.6049779678133,40.6049801899035,40.6049819834898,40.6049824108202,40.6049846174352,40.6049856678324,40.6049867348782,40.6049900960353,40.6049946006124,40.6049979932246,40.6050002742043,40.6050025645149,40.6050037574962,40.6050026987737,40.6050004845036,40.6049982635847,40.6049960569701,40.6049950059013,40.6049950807671,40.6049962517906,40.604998532769,40.6049997037878,40.6050008754809,40.6050031717691,40.6050054841981,40.6050077816586,40.6050100631376,40.6050123446199,40.6050123743966,40.605009011563,40.6050045079911,40.6050011611364,40.6050000392839,40.6050060496668,40.6050081714444,40.6050103928692,40.6050126447379,40.605014926219,40.6050172076984,40.6050183798895,40.6050184392735,40.6050173585915,40.6050151519718,40.6050152125308,40.605017479206,40.6050197006292,40.6050219227227,40.6050252689096,40.6050297736542,40.6050320699376,40.6050321454681,40.6050325560478,40.6050333467641,40.6050356580192,40.605035718574,40.605033511954,40.6050312898596,40.6050290760894,40.6050280168534,40.6050269586269,40.6050247448528,40.6050253361698,40.6050304194425,40.6050354993626,40.6050383447282,40.6050406338609,40.6050418274982,40.6050407692689,40.605038555495,40.6050352081341,40.6050328341688,40.6050307343337,40.605027386975,40.6050251648769,40.60502294345,40.6050207373307,40.6050207967095,40.6050242041207,40.6050275972315,40.6050287682449,40.6050276875569,40.6050254654591,40.6050232440314,40.6050210224384,40.6050199417475,40.6050188598862,40.6050166461132,40.6050155878755,40.6050167815126,40.6050201817708,40.6050235737085,40.6050247447189,40.6050248052715,40.6050248801188,40.6050260809012,40.6050283829512,40.6050295694324,40.6050296493811,40.6050297242273,40.6050297893703,40.6050287081768,40.605026486579,40.6050265168534,40.6050288137963,40.6050311255431,40.6050334219844,40.6050346006473,40.6050346826385,40.6050358762694,40.6050381660613,40.6050393365673,40.6050394022138,40.6050394775559,40.6050395564934,40.6050407429724,40.6050430295429,40.6050453116827,40.6050476079572,40.6050499196976,40.6050522166398,40.605053387643,40.6050523074496,40.6050500848438,40.6050501151165,40.6050524120557,40.6050547237968,40.6050570362077,40.6050570955748,40.6050548960911,40.6050538385106,40.6050550314673,40.605057320751,40.6050596027237,40.6050618841914,40.6050641663325,40.6050664626006,40.6050665231382,40.6050643165038,40.6050620950678,40.6050598741374,40.6050599032323,40.6050621925215,40.6050633854699,40.6050634686226,40.6050635506029,40.6050647513687,40.6050670636073,40.6050693760095,40.6050716722773,40.6050739544131,40.6050762430305,40.605077436646,40.605077519128,40.605077586806,40.605078757806,40.6050810542376,40.6050833664721,40.6050856634059,40.6050879448704,40.6050902270083,40.6050913968346,40.6050914573634,40.6050903761571,40.6050881700191,40.6050893553111,40.6050939051206,40.6050962008814,40.6050951206793,40.605092906891,40.6050918476252,40.6050930417407,40.6050953303515,40.6050976129884,40.6050999087457,40.6051011105075,40.6051011860015,40.6051023558233,40.605104637959,40.6051069194224,40.6051092092067,40.605110402142,40.6051093445533,40.605107129589,40.60510604888,40.6051061094043,40.6051061699294,40.6051062292815,40.6051051485706,40.6051029347813,40.6051018755094,40.6051041948851,40.6051098463349,40.6051143658755,40.6051155368674,40.6051144561578,40.6051122381423,40.6051111732307,40.6051112538156,40.6051124390991,40.6051147334775,40.6051159275805,40.6051148688101,40.6051126538425,40.6051104323992,40.6051082257529,40.6051060338993,40.6051038272505,40.6051027458669,40.605101665656,40.6050994442119,40.6050994744726,40.6051017554302,40.6051017856886,40.6050995635742,40.6050967782419,40.6050917280853,40.6050866903817,40.6050850783815,40.6050851520178,40.6050840718054,40.6050818503612,40.6050785029807,40.6050740284916,40.6050729334855,40.6050752304076,40.605075289753,40.6050730836028,40.6050731133579,40.6050753959884,40.6050765812663,40.6050755308081,40.605073323485,40.6050699755996,40.6050655017837,40.6050644066055,40.6050667035282,40.6050667635389,40.6050645568853,40.6050657124053,40.6050702462366,40.6050736536285,40.6050759362573,40.6050782177137,40.605080499172,40.6050816696518,40.6050805894365,40.6050783673186,40.6050772866004,40.6050762052095,40.6050739837637,40.6050706368814,40.6050661630629,40.6050650668779,40.6050673559853,40.6050685495726,40.6050674919647,40.6050652774905,40.6050653072438,40.6050676041608,40.6050688048939,40.6050688868395,40.6050689704544,40.6050701633737,40.605072452642,40.6050736312705,40.6050737138809,40.6050726550943,40.6050704406189,40.6050682191696,40.6050659982205,40.6050649163262,40.6050649768304,40.6050650373357,40.6050639559414,40.6050617487806,40.6050618092842,40.6050641061963,40.6050652843226,40.6050653667576,40.6050643086397,40.6050620936606,40.6050621239112,40.6050644111328,40.6050655969018,40.605065676284,40.6050679891594,40.6050725275784,40.6050748238192,40.6050737430917,40.6050715267385,40.6050704608012,40.6050705406854,40.6050694742447,40.6050672726771,40.6050673331779,40.6050707405597,40.60507413366,40.6050753046347,40.605076475607,40.6050787713451,40.6050788318432,40.6050766251769,40.6050744037243,40.6050721821017,40.6050722118487,40.6050745087569,40.605076819951,40.6050791161888,40.605081398306,40.6050836802576,40.6050859617079,40.6050882438263,40.605088274072,40.605086051948,40.6050838298222,40.6050816083661,40.6050816381133,40.6050839360239,40.6050862472172,40.6050896546001,40.605093061983,40.6050931224772,40.6050909163115,40.6050898344046,40.6050898948981,40.6050910658697,40.6050933622708,40.6050956739646,40.6050979411265,40.6051012890221,40.6051057920923,40.6051080889967,40.605108149489,40.6051070680849,40.605104846626,40.6051014985664,40.6050970259063,40.6050936773409,40.6050914563853,40.6050881089925,40.6050836344913,40.6050836647378,40.6050881985568,40.6050916059377,40.6050938873831,40.6050961694992,40.605098451447,40.6051007328918,40.605103015007,40.605105296454,40.6051075778976,40.6051098593435,40.605112141457,40.6051121717037,40.6051099583922,40.6051088990805,40.6051100919777,40.6051123812314,40.6051157896172,40.6051203229314,40.6051226191652,40.60512267965,40.6051227396342,40.6051227996181,40.6051228589316,40.6051229194172,40.605124090381,40.6051263724951,40.6051275434607,40.605127602773,40.605128774405,40.6051310558462,40.6051333372906,40.60513562705,40.6051368199385,40.6051380129981,40.60514031804,40.6051403775188,40.6051381701719,40.6051359487094,40.6051337277516,40.6051326463388,40.6051327063181,40.6051344399948,40.6051395220765,40.6051446026503,40.6051474478123,40.605149729922,40.6051497589909,40.6051475375295,40.6051453158988,40.6051430944352,40.6051431241717,40.6051454061157,40.6051472195851,40.6051535054423,40.6051549482629,40.6051605930928,40.6051831036341,40.6051848251204,40.6051882221367,40.6051894080375,40.6051894883796,40.6051906742813,40.6051929762615,40.60519528793,40.6051975848154,40.6051998662489,40.6052021631354,40.6052044748006,40.6052067788287,40.6052079728685,40.6052069140374,40.6052046990328,40.605205855201,40.6052103890087,40.6052137968795,40.6052160783132,40.6052172487573,40.6052173087188,40.6052184796684,40.6052207616019,40.6052219325502,40.6052231041661,40.6052254003818,40.6052254603419,40.6052232582428,40.6052221922679,40.6052222720989,40.6052234584972,40.6052257599683,40.605228072133,40.605230376155,40.6052315696861,40.605233887986,40.6052384294267,40.6052407263099,40.6052407939082,40.605240875781,40.6052420693151,40.6052443583839,40.6052455293271,40.6052444480657,40.605242226423,40.6052400049477,40.6052377839759,40.6052378130319,40.6052400944595,40.6052423765595,40.6052446584915,40.6052469399202,40.605249222021,40.6052515039508,40.6052538003245,40.6052561119815,40.605258416503,40.6052596100303,40.6052596924021,40.605258618774,40.6052564120787,40.60525647203,40.6052587694082,40.6052610503328,40.6052633394028,40.6052645329279,40.6052657264544,40.6052680155186,40.6052702969462,40.6052725938226,40.6052726537708,40.6052704470705,40.6052682260948,40.6052675463126,40.60527212338,40.6052878726741,40.605322042534,40.6053226117837,40.6053260184716,40.6053283005661,40.6053294714971,40.605329530265,40.6053307011978,40.6053329837924,40.6053352652139,40.6053375466356,40.6053398287293,40.6053421177912,40.6053433107991,40.605344504818,40.6053468093227,40.6053502468987,40.6053547949659,40.6053570911628,40.605357151603,40.6053572110374,40.605357271475,40.6053584424053,40.605360730964,40.6053619244727,40.6053608661122,40.6053586522653,40.6053586819806,40.6053609710412,40.6053621645488,40.6053639201042,40.6053690094782,40.605374089369,40.6053769368554,40.6053792177717,40.6053804034728,40.6053827300519,40.6053872786171,40.6053906859711,40.605392967893,40.6053952499833,40.6053975461749,40.6053976066086,40.6053953998955,40.6053954291077,40.6053977110287,40.6053999936191,40.6054022443169,40.6054044669776,40.6054078286702,40.6054112217514,40.6054123926778,40.6054124531117,40.6054136235348,40.605415909544,40.6054170952417,40.6054171757074,40.6054183614034,40.6054206485819,40.6054229299986,40.6054252125875,40.6054274935013,40.605429775419,40.6054320568373,40.6054337866643,40.6054636650294,40.6054971471763,40.6055004823839,40.6055026022913,40.6055033748827,40.6055090043932,40.6055123963002,40.6055146777136,40.6055169648884,40.6055181505761,40.6055182310287,40.6055194173868,40.605521717653,40.6055251557138,40.6055297042706,40.6055331116176,40.6055354008334,40.6055365948251,40.605537787647,40.6055400768596,40.6055423582724,40.6055446401856,40.6055469222661,40.6055492184463,40.6055492788639,40.6055470716395,40.6055471013457,40.6055493986979,40.6055505998228,40.6055506785949,40.6055507537812,40.6055508342251,40.6055509089079,40.6055487072711,40.6055442481712,40.6055431833235,40.6055454949389,40.6055478060525,40.605550103402,40.6055512738116,40.605551341361,40.6055514231728,40.6055526166573,40.6055549056986,40.6055571871048,40.6055594691853,40.6055617505923,40.6055640474376,40.605565249056,40.6055653391722,40.6055676650512,40.6055722142687,40.6055756209407,40.6055790135158,40.6055835170908,40.6055869249354,40.6055892365479,40.6055915333906,40.6055927190657,40.6055939196756,40.6055962160169,40.6055973869241,40.605595180192,40.605590706825,40.6055885005952,40.6055874197973,40.6055852022171,40.6055841366905,40.6055842171213,40.6055859650081,40.6055910516576,40.6055961322126,40.6055989773393,40.6056012594143,40.6056035408185,40.6056058222233,40.6056081047991,40.6056104009694,40.605610460874,40.6056071139407,40.6056014839274,40.6055947291521,40.6055890998089,40.6055857374388,40.6055835147648,40.6055812932624,40.6055813234672,40.6055836053718,40.6055858874462,40.6055881836154,40.6055882430149,40.6055860515487,40.6055861109473,40.6055884082897,40.6055906891893,40.6055929710943,40.6055952531655,40.6055975345698,40.605598705473,40.6055987658735,40.6055976844029,40.6055954628997,40.6055966195412,40.6056011521425,40.6056045594798,40.6056068408801,40.6056091229537,40.6056113758295,40.6056139717522,40.6056184598905,40.605624464323,40.6056300931627,40.6056349733336,40.6056383367108,40.6056416836452,40.6056461877227,40.605649595061,40.6056518759599,40.6056541578628,40.6056564404389,40.6056598477759,40.6056643506796,40.605667698789,40.6056699202915,40.6056721424652,40.6056755046674,40.6056800082435,40.6056834008143,40.6056845717163,40.6056846309449,40.6056835506457,40.6056813291422,40.6056824846069,40.6056870183812,40.6056904257197,40.6056927225567,40.6056927829567,40.6056905762172,40.6056883540426,40.6056861318678,40.6056839098628,40.6056816881905,40.6056817183888,40.6056840004587,40.6056866567804,40.6056911751199,40.6056941377999,40.6056971783798,40.6057016671899,40.6057053917282,40.6057098953034,40.6057133026391,40.6057155845403,40.6057189918759,40.6057234949471,40.6057268428914,40.6057290952661,40.605731376162,40.6057336580654,40.6057359394638,40.6057382291715,40.6057394226323,40.6057406149262,40.6057429046271,40.6057451860249,40.6057474757299,40.6057486685199,40.6057498624857,40.6057521593203,40.6057533522781,40.6057532641459,40.6057531705376,40.6057746459656,40.6058209668566,40.6060029032372,40.6060148614518,40.6060537028121,40.6060837288466,40.6061258290282,40.6061676138442,40.6062066557831,40.6062201828294,40.6062545941842,40.606383482013,40.6063834414839,40.6063856482418,40.6063901506429,40.6063935584695,40.6063958405265,40.6063981219167,40.6064003731173,40.6064037217425,40.6064082246461,40.606412757906,40.6064172916671,40.6064206989908,40.6064229808833,40.6064252622712,40.6064275443278,40.6064309516522,40.6064354859177,40.6064388932409,40.6064411746285,40.6064434565172,40.6064468490841,40.6064502414793,40.6064525235374,40.6064548196839,40.6064571319282,40.6064593978856,40.6064627460084,40.6064672489134,40.6064706562361,40.606472937625,40.6064752196806,40.606477501571,40.6064809088934,40.6064854426539,40.6064888499761,40.6064911318652,40.6064945391873,40.6064990729479,40.606503042987,40.6065081250396,40.6065132055858,40.6065168933464,40.606522821402,40.6065307026137,40.6065385833251,40.6065445087002,40.6065476349161,40.6065499163007,40.6065521988602,40.6065544505643,40.6065570464994,40.6065615353179,40.606567540253,40.6065720580816,40.6065747160645,40.6065769979534,40.6065792800092,40.6065815312098,40.6065837527291,40.6065871156107,40.6065916191845,40.6065961227593,40.6066006256629,40.6066039885465,40.6066069600734,40.6066125734867,40.6066200809512,40.6066257252205,40.6066287576203,40.6066310093247,40.6066337935587,40.6066388460982,40.6066438964592,40.6066475243484,40.6066534222197,40.6066613034345,40.6066691841426,40.6066750798369,40.6066788955237,40.6066845096052,40.6066920170713,40.6066976304839,40.6067009786064,40.6067054672548,40.6067114711846,40.6067159598352,40.6067196838844,40.6067241572711,40.6067280674422,40.6067331199806,40.6067393103653,40.6067443788341,40.6067477405404,40.6067505247767,40.6067555773137,40.6067606276737,40.606764162254,40.606769776335,40.6067772831319,40.6067828972119,40.6067862453348,40.6067907339827,40.6067967384151,40.6068012265626,40.6068038241733,40.6068060463601,40.6068088305934,40.6068138831313,40.6068189339936,40.6068220931485,40.6068265817965,40.60683258673,40.6068370743738,40.6068402352019,40.6068452872377,40.6068503381001,40.6068534977563,40.6068579865723,40.606863990837,40.6068696203475,40.6068756262856,40.60688127005,40.6068858043155,40.6068903073865,40.6068936548381,40.6068970177184,40.6069015217966,40.6069048830029,40.6069082321283,40.6069127048455,40.6069171782337,40.6069227923156,40.6069284223264,40.6069329259019,40.6069374294755,40.6069407916855,40.6069433882902,40.6069478769396,40.6069538801959,40.6069583690128,40.6069609671249,40.6069643300038,40.6069693956245,40.6069755888572,40.6069806397188,40.606983986668,40.6069890392051,40.6069940893965,40.6069980017411,40.6070024751276,40.607005822578,40.6070080442612,40.6070113922141,40.6070170062951,40.607023761071,40.6070305170189,40.6070361458592,40.6070395087384,40.607041730252,40.6070450936341,40.607049596706,40.6070529891062,40.6070563976038,40.6070608852462,40.6070642030092,40.6070675516328,40.6070720552062,40.6070754026573,40.6070753422782,40.6070730378285,40.6070718448887,40.6070729033185,40.6070751171999,40.607077339885,40.6070795613994,40.6070829083456,40.6070873822338,40.6070907303516,40.607092951364,40.6070951740505,40.6070985357565,40.60710303933,40.6071064022086,40.6071091859347,40.607114237801,40.6071192739013,40.6071220296155,40.6071242363675,40.6071264578817,40.6071286800637,40.6071309027486,40.607133123759,40.6071364712065,40.6071409303308,40.6071442480905,40.6071464543387,40.6071498017858,40.6071542763423,40.6071576226175,40.607160985996,40.6071643785652,40.6071644087558,40.6071621865733,40.6071633427029,40.6071678313479,40.6071711492735,40.6071744967204,40.6071778595982,40.6071812070449,40.6071856804274,40.607189027874,40.6071912505586,40.6071934715665,40.6071956930773,40.6071984768023,40.6072035293379,40.6072085796934,40.6072119276444,40.6072169801787,40.6072220310387,40.6072259417043,40.6072304155866,40.6072320985419,40.6072451728612,40.6073013363281,40.6073137261495,40.6073267115239,40.6073552136733,40.6073835580371,40.6073833671173,40.6073617609398,40.6073425687551,40.6073256713481,40.6073183764619,40.6073061831415,40.6072999880011,40.6072983559485,40.6073080524284,40.6073432837949,40.6073901133617,40.6074249881522,40.6074452450987,40.6074446896861,40.6074619686499,40.6074794054524,40.6074840747161,40.6075115384901,40.607525957572,40.6075263983849,40.6075640840485,40.6075950001467,40.6076137160518,40.6076107935086,40.6076440609932,40.6076555332989,40.6076554380177,40.6076666883268,40.6076640990102,40.6076662856643,40.6077101754436,40.6077299391362,40.6077301950515,40.607741753004,40.6077650685387,40.6078090476696,40.6078207539215,40.6078229783553,40.6078324714653,40.607915165135,40.6079601656858,40.6079901936872,40.6080417407874,40.6080478256949,40.6080588655049,40.6081000747412,40.6082253172652,40.608233910391,40.6082279609011,40.6082228451349,40.6082415602829,40.6082556685207,40.6082593547637,40.6082582196452,40.6082805887455,40.6083013051492,40.6083486373531,40.608350239671,40.6083307425095,40.6083135797656,40.6083128680586,40.6083096110908,40.6083330843614,40.6083781649867,40.6083922398023,40.6083937827793,40.6083960808533,40.6083983622952,40.608400658527,40.608402970881,40.6084052820664,40.6084075937529,40.6084099054363,40.6084122171223,40.6084144837791,40.6084167059096,40.6084206303034,40.6084268228622,40.6084330155895,40.6084369861851,40.6084381873922,40.6084382616559,40.6084405590582,40.608445092202,40.6084473891005,40.6084474638669,40.6084497910046,40.6084543391031,40.6084577481545,40.6084600290917,40.6084628725813,40.6084679548278,40.6084730347281,40.6084770069988,40.6084815408136,40.6084849475191,40.6084872296285,40.60848951107,40.6084917936818,40.6084940751241,40.6084963565651,40.6084986380052,40.6085009348994,40.6085043730184,40.6085089211139,40.6085123289903,40.6085146182438,40.6085153362292,40.60858720522,40.6085978381075,40.6086781826941,40.6087005803239,40.609081573239,40.6091489827365,40.6091595400677,40.6091808683746,40.6091827973125,40.6092139530539,40.6092469589846,40.6092977582362,40.6093334651673,40.6093339426501,40.6093356218308,40.6093390149175,40.6093446442577,40.6093502880444,40.6093548223483,40.6093593254203,40.6093637992619,40.6093650216532,40.6093692912061,40.6093780706195,40.6093864927064,40.6093899450176,40.6094374875785,40.6094611593454,40.6094642795564,40.6094758953324,40.6094814634745,40.6095106102425,40.6095100149235,40.6095037008353,40.609485389754]}],[{"lng":[-73.8321287690365,-73.8321221408741,-73.8321155133685,-73.8321118577644,-73.832108952714,-73.8321075630252,-73.832106174657,-73.8321032682842,-73.8320988758532,-73.8320929665206,-73.8320877580127,-73.8320810890191,-73.8320744621757,-73.83207230482,-73.8320723816544,-73.8320709639822,-73.832068047403,-73.8320636556353,-73.8320578038212,-73.832053450908,-73.8320505760501,-73.8320521309331,-73.832058098441,-73.8320611127099,-73.8320589573335,-73.8320523276413,-73.8320442034377,-73.8320375544251,-73.8320331031645,-73.8320301088722,-73.8320271147978,-73.8320243338872,-73.8320118801268,-73.831968309281,-73.8319655148284,-73.8319347012325,-73.8319035549855,-73.8318877896614,-73.8318867446466,-73.8318853263238,-73.831885404492,-73.8318884174492,-73.8318943662927,-73.8318973805665,-73.8318974587326,-73.8318960397532,-73.8318916264802,-73.8318842413127,-73.8318768346266,-73.8318723638272,-73.8318694099338,-73.8318664940298,-73.8318635774638,-73.8318591863714,-73.8318532770526,-73.8318488064697,-73.831845869705,-73.83184352779,-73.8318429939835,-73.8318401178239,-73.8318387388107,-73.8318388367426,-73.8318389157918,-73.8318389939618,-73.8318375749832,-73.8318370041334,-73.8318346606209,-73.8318302679903,-73.8318243588944,-73.8318198858979,-73.8318168924812,-73.8318138990685,-73.8318111126718,-73.8318021516471,-73.8317962119606,-73.8317933149419,-73.8317904392279,-73.8317875630703,-73.831787642123,-73.8317906650756,-73.8317922293032,-73.831790841843,-73.831787935934,-73.8317840363572,-73.8317766698604,-73.831766820564,-73.8317594727353,-73.8317556109286,-73.8317527152341,-73.8317497995546,-73.8317482228489,-73.8317448971984,-73.8317375098442,-73.8317296318606,-73.83172562984,-73.8317174473721,-73.8317000682979,-73.8316811545274,-73.8316505901962,-73.8315948869038,-73.8315702037776,-73.8315488870368,-73.8315483259033,-73.8315439332978,-73.8315380628726,-73.8315336711459,-73.8315307546027,-73.8315278389391,-73.8315249245931,-73.8315220087098,-73.831519094363,-73.8315161778223,-73.8315132625991,-73.8315096098948,-73.8315029804647,-73.8314963530148,-73.8314941941604,-73.8314927765243,-73.8314898613012,-73.8314869456417,-73.8314840297595,-73.8314796386978,-73.8314737676179,-73.8314678972018,-73.8314620289786,-73.8314576350607,-73.8314547300572,-73.8314533417466,-73.8314519508009,-73.8314490457929,-73.8314461314532,-73.8314432155725,-73.8314403012351,-73.8314373846966,-73.8314344694773,-73.8314315538216,-73.8314286386026,-73.8314257236038,-73.8314257624828,-73.8314287758875,-73.8314288536451,-73.8314244619295,-73.8314200113444,-73.831417017051,-73.8314140618532,-73.8314111459776,-73.8314082503125,-73.8314068722202,-73.8314054726013,-73.831402556725,-73.8313996423895,-73.8313952298072,-73.8313893198593,-73.8313849094756,-73.8313819929409,-73.8313790777253,-73.8313761620734,-73.8313732468569,-73.8313703318617,-73.831367416647,-73.8313645009957,-73.8313615844625,-73.8313586701277,-73.8313557744655,-73.8313558535471,-73.8313603241185,-73.831364774921,-73.8313663111689,-73.831366390248,-73.8313649717424,-73.8313605593849,-73.8313561670152,-73.8313532906835,-73.8313488983146,-73.8313445050706,-73.831341629617,-73.8313387339591,-73.8313358187477,-73.8313329022189,-73.8313344184758,-73.8313403686196,-73.8313433815843,-73.8313434591278,-73.8313435382099,-73.8313421199246,-73.8313391653941,-73.8313361704434,-73.8313331583578,-73.8313301251823,-73.8313271109006,-73.8313241181441,-73.8313211234132,-73.8313181306593,-73.8313151945784,-73.8313123184708,-73.8313094334705,-73.8313080438537,-73.8313066551188,-73.8313037687979,-73.8313008918127,-73.831297996154,-73.8312950818278,-73.8312921277378,-73.8312891336636,-73.831286178914,-73.8312832632681,-73.8312803489394,-73.8312774324141,-73.831274516549,-73.8312716022211,-73.8312686856951,-73.8312657713707,-73.8312628757162,-73.8312629548022,-73.8312659775456,-73.8312675420201,-73.8312676504387,-73.8312647650002,-73.8312588952684,-73.8312574567771,-73.8312604508514,-73.8312619857801,-73.8312605681627,-73.8312561562529,-73.8312517445618,-73.8312473513237,-73.8312414802755,-73.8312400439831,-73.831243036737,-73.8312430762829,-73.831237926897,-73.8312298005715,-73.8312231731529,-73.8312224730227,-73.831225475772,-73.8312270422298,-73.8312256532851,-73.8312227469777,-73.8312227865244,-73.8312257799343,-73.8312273161866,-73.8312258979124,-73.8312229820516,-73.8312230215952,-73.8312260258846,-73.8312275901435,-73.831227698783,-73.8312262911613,-73.8312218779376,-73.8312174258269,-73.8312129557034,-73.8312070464348,-73.831205608829,-73.831208621571,-73.831211654528,-73.8312146690323,-73.8312176624417,-73.8312206760619,-73.8312237090173,-73.8312266830947,-73.831229597414,-73.8312340106365,-73.8312384627441,-73.8312414552746,-73.8312444489025,-73.8312444891035,-73.8312415739065,-73.8312386573878,-73.8312357417486,-73.8312357826137,-73.8312387760213,-73.8312417696488,-73.831244763056,-73.8312462993059,-73.831247834895,-73.8312508296193,-73.8312538232471,-73.8312568166533,-73.8312568561986,-73.8312539409996,-73.8312539805423,-73.8312569748289,-73.8312585095376,-73.8312585886254,-73.8312571696906,-73.8312542753637,-73.8312543531326,-73.8312573767488,-73.8312589425398,-73.831257552936,-73.831251672343,-73.8312428085621,-73.8312354228099,-73.831230970706,-73.8312279773009,-73.8312249636803,-73.8312204540209,-73.8312145247654,-73.8312091491919,-73.831201782772,-73.8311919329047,-73.8311845269373,-73.8311805474448,-73.8311776129164,-73.8311776920121,-73.8311807047514,-73.831182241002,-73.831185253962,-73.8311912021093,-73.8311942155082,-73.8311927978963,-73.8311898813846,-73.8311899218098,-73.8311929338894,-73.8311930129813,-73.8311901173409,-73.8311916333774,-73.8311975815234,-73.8312005951391,-73.831200692903,-73.8312022686987,-73.8312052823149,-73.8312082757184,-73.8312112893358,-73.8312158003126,-73.8312217677868,-73.8312262385583,-73.8312292332794,-73.8312322268996,-73.831236678779,-73.8312411302168,-73.8312411691019,-73.8312382532505,-73.8312353389366,-73.8312309257234,-73.831225016471,-73.8312206054576,-73.8312176889492,-73.8312147730976,-73.8312148139605,-73.8312178262569,-73.8312194020483,-73.8312194998105,-73.8312225134232,-73.831228462879,-73.8312314756119,-73.8312344892237,-73.8312404367012,-73.8312434500913,-73.8312449863372,-73.8312479806156,-73.8312495161987,-73.8312495952882,-73.8312481767972,-73.831245261168,-73.8312423459761,-73.8312394310085,-73.83123503779,-73.8312291689661,-73.8312277304873,-73.8312307245449,-73.8312337188207,-73.8312367315542,-73.8312397644933,-73.8312427767865,-73.8312428163305,-73.83123990114,-73.8312399415664,-73.8312429349636,-73.8312474057267,-73.8312533536349,-73.8312578259393,-73.8312622764888,-73.831266747251,-73.8312697808493,-73.8312727542544,-73.8312756707612,-73.8312800833071,-73.8312845538486,-73.8312875861278,-73.8312905990725,-73.8312935940068,-73.8312966060741,-73.8312996405489,-73.8313026734846,-73.8313027516897,-73.8312998756047,-73.8312984966523,-73.8312986139632,-73.8313009280967,-73.8313076150107,-73.8313142834727,-73.8313165571851,-73.831316634948,-73.8313152173354,-73.8313123008297,-73.8313108832175,-73.831309465605,-73.8313065504192,-73.831302156768,-73.8312962475324,-73.8312917767766,-73.8312887638328,-73.8312886856267,-73.8312915812622,-73.8312915423777,-73.8312885481066,-73.8312840753711,-73.8312781287871,-73.8312736580295,-73.8312692052846,-73.831264733867,-73.8312617015893,-73.831258726867,-73.8312543351956,-73.8312469688034,-73.8312395808807,-73.8312351287914,-73.8312321367173,-73.8312291426633,-73.8312261492682,-73.8312231556507,-73.8312186829115,-73.8312127354459,-73.8312082649043,-73.8312052699669,-73.8312022765691,-73.8311992831741,-73.831196289556,-73.8311932955012,-73.8311932559526,-73.8311961717994,-73.8311946548876,-73.8311872489483,-73.8311813203705,-73.8311768489472,-73.8311694436634,-73.8311635142071,-73.831161958629,-73.8311589061297,-73.8311529373419,-73.83114698987,-73.8311410412989,-73.8311380276854,-73.8311394466067,-73.8311423617939,-73.8311423215866,-73.8311393079726,-73.8311362756821,-73.8311332427315,-73.8311302095607,-73.831127176612,-73.8311226662946,-73.8311167370524,-73.8311108666932,-73.8311049574452,-73.8311019453654,-73.8311048409952,-73.8311107113561,-73.8311121491734,-73.8311091555518,-73.8311061608281,-73.8311031680854,-73.831098696653,-73.8310912907002,-73.8310824275967,-73.8310750589956,-73.8310706666637,-73.831067712806,-73.8310647178625,-73.8310617640089,-73.8310588497019,-73.8310559338575,-73.8310530173556,-73.8310501030515,-73.8310457107198,-73.8310398014726,-73.8310353306978,-73.8310323955214,-73.8310295185706,-73.8310266229445,-73.8310237077602,-73.8310207927972,-73.8310178776145,-73.8310149619954,-73.8310105696674,-73.8310046604187,-73.8310001889864,-73.8309972357952,-73.8309943192946,-73.8309914041118,-73.8309884884922,-73.8309855739693,-73.8309826583517,-73.8309782451498,-73.8309723359038,-73.8309678853453,-73.8309648917204,-73.8309619378659,-73.830958283893,-73.8309516549732,-73.8309450471455,-73.8309414311924,-73.8309370388666,-73.8309325680926,-73.8309295342499,-73.8309265797362,-73.8309237041154,-73.830920808495,-73.8309178928774,-73.8309149381443,-73.8309119453957,-73.8309090089032,-73.8309061332797,-73.8309032376649,-73.8309003227075,-73.8308974075324,-73.8308930152092,-73.8308856488171,-73.8308782617676,-73.830873849229,-73.8308694569099,-73.8308635863431,-73.8308591949027,-73.8308547817053,-73.8308473950967,-73.8308385313432,-73.8308311462733,-73.8308267330766,-73.8308238172435,-73.8308209029512,-73.8308165106318,-73.8308106409502,-73.8308062464364,-73.8308033321421,-73.8308004163103,-73.8307975020188,-73.8307945868487,-73.8307916912372,-73.8307888151855,-73.8307859195745,-73.8307815270414,-73.8307741593388,-73.8307667736122,-73.8307623610786,-73.8307594445915,-73.8307550342564,-73.8307491243593,-73.8307447118263,-73.8307417975365,-73.8307389019287,-73.8307360250009,-73.830733129398,-73.8307331680785,-73.8307361623663,-73.8307362019291,-73.8307332867613,-73.8307310203122,-73.830730371157,-73.8307259592856,-73.8307193119127,-73.8307169744218,-73.8307111856426,-73.8307045582767,-73.8306883781319,-73.8306871537069,-73.8306848300271,-73.8306784347855,-73.8306774436504,-73.8306700772725,-73.8306656849665,-73.8306627684832,-73.8306598541971,-73.8306569383748,-73.8306525460686,-73.8306466757391,-73.8306422834335,-73.8306393676111,-73.8306349753061,-73.8306291056377,-73.8306247133333,-73.8306217990505,-73.8306188825716,-73.8306159667505,-73.8306130524696,-73.8306101373101,-73.830607222369,-73.8306043072094,-73.8306013907316,-73.8305984751316,-73.8305955608508,-73.8305911483262,-73.8305852384362,-73.8305807876661,-73.8305763162317,-73.8305704205568,-73.8305675645298,-73.8305676952451,-73.8305663150442,-73.83056343344,-73.8305605574123,-73.8305561651137,-73.8305495168753,-73.8305413919341,-73.8305347258886,-73.8305309912664,-73.8305280380817,-73.8305251229267,-73.8305207106252,-73.8305163183281,-73.8305134420801,-73.8305105525011,-73.8305091536184,-73.8305092587669,-73.8305093565896,-73.8305094404163,-73.8305065448265,-73.8305006356028,-73.8304961654878,-73.8304932103263,-73.830490295832,-73.8304873875696,-73.8304859873691,-73.8304860934001,-73.8304846945186,-73.8304817847144,-73.8304773924223,-73.8304700260643,-73.8304640974958,-73.8304625552096,-73.8304624571657,-73.8304624152797,-73.8304219369713,-73.830369069588,-73.8303476385454,-73.8303293345698,-73.8303138662059,-73.830298564077,-73.8302828026763,-73.8302831790609,-73.8302366909081,-73.830227686714,-73.83022569562,-73.830221304665,-73.830215415024,-73.8302080680365,-73.8302052107284,-73.8302038118723,-73.8302008976156,-73.8302009363139,-73.8302039492986,-73.8302040284549,-73.8302011328893,-73.8301967397402,-73.8301908709903,-73.8301864765218,-73.8301835622667,-73.8301791706564,-73.8301733190627,-73.8301689663736,-73.8301660801571,-73.8301646919654,-73.8301633033385,-73.8301604177794,-73.8301604954004,-73.830163509703,-73.830166502457,-73.8301694967465,-73.8301724901597,-73.8301754842303,-73.8301784778642,-73.8301814712754,-73.8301830075583,-73.8301830867202,-73.8301801911588,-73.8301743208766,-73.8301699292707,-73.8301670337103,-73.8301641568438,-73.830161261284,-73.8301583454944,-73.8301554312437,-73.830151038101,-73.830145167823,-73.8301407762184,-73.8301378606512,-73.8301349455225,-73.8301320306155,-73.8301306124128,-73.8301306906964,-73.8301322256648,-73.8301352190744,-73.8301367560207,-73.8301368351845,-73.8301339383091,-73.8301280686931,-73.8301251731386,-73.8301252616496,-73.8301253703869,-73.8301239808863,-73.8301210759835,-73.8301181601997,-73.8301152459533,-73.8301123295107,-73.8301093756812,-73.8301063820541,-73.8301033873263,-73.8300989165618,-73.8300915106627,-73.8300841249941,-73.8300796729244,-73.8300766795127,-73.830073724147,-73.8300693318902,-73.8300634622785,-73.8300590700237,-73.8300561744725,-73.8300547943203,-73.8300549130721,-73.8300564882847,-73.8300595212794,-73.8300640316238,-73.830069999091,-73.8300730133915,-73.8300730918988,-73.8300716741394,-73.8300687585808,-73.83006584214,-73.8300629278978,-73.8300600114604,-73.8300570972184,-73.830055678143,-73.8300542599465,-73.8300513441681,-73.8300469519151,-73.8300410440466,-73.830036573506,-73.8300336181435,-73.830030703025,-73.8300255524139,-73.8300174277501,-73.8300108191415,-73.8300072032856,-73.8300043077404,-73.8300043473275,-73.8300073609671,-73.8300103939623,-73.8300134073827,-73.8300164010089,-73.830019395737,-73.8300209320264,-73.8300195131732,-73.8300166176284,-73.8300166967989,-73.8300197291327,-73.830022761466,-73.8300257957773,-73.830025873627,-73.8300229772051,-73.830020061649,-73.8300171474136,-73.8300127558261,-73.8300068855698,-73.8300054471467,-73.830008440554,-73.8300099768428,-73.8300100753653,-73.8300101928024,-73.8300102906668,-73.8300118269553,-73.830014821898,-73.830016376878,-73.8300149989309,-73.8300121033929,-73.830007708951,-73.8300018393587,-73.8299974471188,-73.829994532884,-73.8299916171147,-73.8299887006833,-73.8299857864501,-73.8299828909127,-73.8299800153887,-73.8299771198507,-73.8299771581167,-73.829980171756,-73.8299832047425,-73.8299862190404,-73.8299877546662,-73.8299878329635,-73.8299864141134,-73.8299834998821,-73.8299800921766,-73.8299742032373,-73.8299663263215,-73.829960435844,-73.8299555494736,-73.8299497001217,-73.8299483004108,-73.829951313386,-73.8299543074494,-73.8299573017305,-73.8299602951353,-73.8299633087687,-73.8299633879426,-73.8299589957082,-73.8299516085323,-73.8299442609452,-73.8299414049981,-73.8299415041886,-73.8299400853433,-73.8299371702384,-73.8299327766856,-73.8299269071065,-73.8299254700073,-73.829928473639,-73.8299300395059,-73.8299301467276,-73.8299287378885,-73.8299258221253,-73.829922171096,-73.8299155416227,-73.8299088747623,-73.8299051401578,-73.8299021863456,-73.8298992721225,-73.8298963623746,-73.8298949648646,-73.8298950696301,-73.8298951666231,-73.8298952713887,-73.8298968472663,-73.8298998608989,-73.8299013971897,-73.8299014823812,-73.8299015802517,-73.8299016854562,-73.8299002868477,-73.829897378417,-73.8298944619999,-73.8298915471189,-73.8298915867096,-73.8298946003422,-73.8298976326712,-73.8299006073738,-73.8299042619139,-73.8299108891786,-73.8299175575747,-73.8299198322015,-73.8299199091812,-73.8299214448093,-73.8299244590989,-73.8299274920832,-73.8299319628237,-73.8299378719784,-73.8299423238066,-73.8299438603124,-73.8299439394874,-73.8299425197656,-73.8299396055461,-73.8299352117826,-73.8299293437532,-73.8299249499922,-73.8299220348926,-73.8299176435501,-73.8299117343977,-73.8299057856551,-73.8298983791443,-73.829890991987,-73.8298865412615,-73.8298835478634,-73.8298805538087,-73.8298775604103,-73.8298745661342,-73.8298715720771,-73.8298686369643,-73.8298687161427,-73.8298717484703,-73.8298733243477,-73.8298734222261,-73.8298764358554,-73.8298823845993,-73.829886855998,-73.8298898587432,-73.8298914246109,-73.8298900364538,-73.8298871409331,-73.8298857523344,-73.8298843628635,-73.8298814571115,-73.829878542237,-73.8298756373704,-73.8298742472343,-73.8298728584212,-73.8298699535526,-73.8298685351571,-73.829868613018,-73.8298671948394,-73.8298642993218,-73.8298614244776,-73.8298585289607,-73.8298585672306,-73.8298615612848,-73.8298630975722,-73.8298631767507,-73.8298617579154,-73.8298588428238,-73.8298559279525,-73.8298530324339,-73.8298501556147,-73.8298472600998,-73.8298443450097,-73.8298414294784,-73.8298385130697,-73.8298355988564,-73.8298326831078,-73.8298297688964,-73.8298312856098,-73.8298372330211,-73.8298417037554,-73.8298446984686,-73.8298476920782,-73.8298506854692,-73.8298522217572,-73.8298523009382,-73.8298508825441,-73.8298479670143,-73.8298450528047,-73.829842136395,-73.8298421759872,-73.8298451693773,-73.8298467056639,-73.8298467841856,-73.8298453666698,-73.8298424509243,-73.8298395345168,-73.8298366203073,-73.8298337052207,-73.8298308097097,-73.8298279337719,-73.8298250373823,-73.8298221225133,-73.8298192074291,-73.8298177885965,-73.8298178771329,-73.8298179858948,-73.8298195502286,-73.829822554502,-73.8298241001386,-73.8298242086842,-73.8298228200989,-73.8298199152373,-73.8298184955293,-73.8298185934104,-73.8298172154879,-73.8298143293341,-73.8298129411824,-73.8298115519392,-73.8298086537591,-73.8298072540663,-73.829807358835,-73.8298078674842,-73.8298012606721,-73.8298060069209,-73.8298375242001,-73.8298224727733,-73.8297788496926,-73.8297799438019,-73.8297863445253,-73.829784923287,-73.8297820077734,-73.8297820473648,-73.8297850514166,-73.8297866166214,-73.8297852265043,-73.8297823223149,-73.8297838392398,-73.8297897044688,-73.8297858344982,-73.8297846504668,-73.8297848188646,-73.8297901980631,-73.8297910866527,-73.8297924424265,-73.8297903973003,-73.829787421739,-73.8297857388195,-73.8297836858646,-73.829793770928,-73.8297986509736,-73.8298126718101,-73.8298098086305,-73.8298098473414,-73.8298128476042,-73.8298144041158,-73.8298145080064,-73.8298160629791,-73.8298189002915,-73.8298194473,-73.8298169267546,-73.8298147702603,-73.8298148579169,-73.8298149660187,-73.8298150747872,-73.8298151820129,-73.8298138032242,-73.8298094110549,-73.8298066748897,-73.829809110605,-73.8298092218977,-73.8298111828988,-73.8298141856153,-73.8298145087595,-73.8298157514698,-73.8298158587008,-73.8298159681231,-73.829817543985,-73.8298205575863,-73.8298235509509,-73.8298265443136,-73.8298265832435,-73.8298236884204,-73.8298208109705,-73.8298179161464,-73.8298179557361,-73.8298209693364,-73.8298210485187,-73.8298181717292,-73.8298182509118,-73.8298212832061,-73.8298243161583,-73.8298273391061,-73.8298289056155,-73.8298304714725,-73.8298334741799,-73.829835010451,-73.8298335929505,-73.8298306825882,-73.8298292851074,-73.8298293905339,-73.8298309461607,-73.8298339664238,-73.8298369987149,-73.8298400209984,-73.8298415868492,-73.829841695394,-73.8298417908165,-73.8298418886906,-73.8298419938977,-73.8298435497408,-73.829848006858,-73.8298524581819,-73.8298539944493,-73.8298555300567,-73.8298585247327,-73.8298615183076,-73.8298645116655,-73.8298645512525,-73.829861636199,-73.8298587207031,-73.8298543083109,-73.8298483999015,-73.8298439883861,-73.8298410720131,-73.8298366611604,-73.829832190482,-73.8298291559967,-73.8298246846585,-73.8298180387941,-73.829809912749,-73.8298032855843,-73.8298025855249,-73.8298055788814,-73.829807115153,-73.8298071936754,-73.8298094702546,-73.8298161356931,-73.8298228053035,-73.8298265361146,-73.8298295296911,-73.8298325230445,-73.8298355177196,-73.8298385112936,-73.8298429617369,-73.8298474137171,-73.8298518850525,-73.8298578315107,-73.8298608470779,-73.829860924279,-73.8298624605429,-73.8298654538984,-73.829866990823,-73.8298648352129,-73.8298582058547,-73.8298515404224,-73.8298478067591,-73.829844792512,-73.8298402829044,-73.8298343638341,-73.8298314977163,-73.8298301091487,-73.8298272230163,-73.8298287792993,-73.8298347466511,-73.8298377608992,-73.8298378474519,-73.8298379559926,-73.8298402623712,-73.8298469375892,-73.8298536065338,-73.8298573375555,-73.8298603315673,-73.8298633257999,-73.8298663385041,-73.8298693714449,-73.8298723837101,-73.8298753783771,-73.8298783919636,-73.8298784698227,-73.8298755743461,-73.8298756139349,-73.8298786072853,-73.8298816012932,-73.8298845955212,-73.8298890661893,-73.8298950146183,-73.8298980281966,-73.8298951320604,-73.8298892619343,-73.8298848697851,-73.829881955615,-73.829881994323,-73.8298849885513,-73.8298850272594,-73.8298821117712,-73.8298791967223,-73.8298762818924,-73.8298763208192,-73.829879314169,-73.8298808504322,-73.8298809296071,-73.8298795114531,-73.8298765957446,-73.8298766346769,-73.8298796431434,-73.8298812247668,-73.8298813615692,-73.8298814990312,-73.829880124703,-73.829877223454,-73.8298772643634,-73.8298802585868,-73.8298847292493,-73.8298921340938,-73.8298995204596,-73.829903972429,-73.8299084430901,-73.8299143519195,-73.8299194839331,-73.8299261110808,-73.8299327791316,-73.8299365094835,-73.8299395237199,-73.8299396022355,-73.8299367065409,-73.8299367448077,-73.8299397396876,-73.829941275946,-73.8299428122053,-73.8299458048855,-73.8299458444724,-73.8299429294244,-73.8299400145975,-73.8299371191267,-73.8299371976414,-73.8299416689581,-73.8299475771243,-73.8299520284263,-73.8299550224282,-73.8299580166467,-73.8299610099847,-73.8299640235582,-73.8299670558249,-73.8299700900682,-73.8299701679194,-73.8299672724454,-73.8299643560828,-73.8299614419152,-73.8299614821623,-73.8299644748406,-73.8299689454945,-73.8299748941225,-73.8299793645559,-73.8299823587747,-73.8299838943669,-73.829982475991,-73.8299795820564,-73.82997965969,-73.8299826725989,-73.829985666594,-73.8299886668239,-73.8299902230885,-73.8299903278433,-73.8299918827884,-73.8299963414132,-73.8300022504543,-73.8300067024091,-73.830009695746,-73.8300127093086,-73.8300157413504,-73.8300187549153,-73.8300217491276,-73.8300261995452,-73.8300306514998,-73.8300351221468,-73.8300410705469,-73.8300455420727,-73.8300485354072,-73.8300515293981,-73.8300545227279,-73.8300545609921,-73.8300516468269,-73.8300531635043,-73.830059072539,-73.8300619680133,-73.8300633855144,-73.8300677972257,-73.8300737062622,-73.8300796152976,-73.8300855243373,-73.8300899956415,-73.8300915714691,-73.8300916693226,-73.8300932062292,-73.8300962097869,-73.8300977747254,-73.8300993398907,-73.8301023441015,-73.8301053374324,-73.8301097893812,-73.8301156968748,-73.8301201099049,-73.8301230256111,-73.8301274364421,-73.830131888392,-73.8301334246355,-73.8301335029151,-73.830132084094,-73.8301291690472,-73.8301262535641,-73.8301233393968,-73.8301189457201,-73.8301130778061,-73.8301119133003,-73.8301186751782,-73.8301470660322,-73.8301727865511,-73.830223231381,-73.8302771763749,-73.8302776334021,-73.8302716703048,-73.8302659580956,-73.8302756702936,-73.830307312525,-73.8303766409549,-73.8304149518778,-73.830515591433,-73.8305440226175,-73.8305887955253,-73.8306174353765,-73.8306645449982,-73.830689965988,-73.8306928522386,-73.8307086100946,-73.8307151548603,-73.8307159804384,-73.830724950189,-73.8307796422073,-73.8307987354106,-73.8308150348631,-73.8308562223087,-73.8308972858827,-73.8309227150495,-73.8309668638445,-73.8309858721275,-73.8310110952337,-73.8310302304009,-73.8310744189974,-73.8310844558497,-73.8310864726452,-73.8310894661219,-73.8310924593804,-73.8310954539557,-73.8310984474321,-73.8311014406882,-73.8311058925663,-73.8311118013044,-73.8311162518617,-73.8311192464362,-73.8311222585866,-73.8311267693422,-73.8311326982935,-73.8311370912879,-73.8311400054491,-73.8311443982257,-73.8311502669817,-73.831155399616,-73.8311620273382,-73.8311686565995,-73.8311730478376,-73.831179674903,-73.8311863028461,-73.8311899559878,-73.8311928723541,-73.8311957865199,-73.8312001979727,-73.8312061069334,-73.8312120174301,-73.8312164677685,-73.8312209383164,-73.8312268868169,-73.8312313573628,-73.8312343506163,-73.8312373438709,-73.8312403446685,-73.8312419008269,-73.8312420054651,-73.8312435603053,-73.8312465608754,-73.8312495543495,-73.8312525476,-73.8312562813661,-73.8312629477504,-73.831269577011,-73.8312747061307,-73.8312805762043,-73.8312849683252,-73.831287884033,-73.8312915384959,-73.8312981649006,-73.8313048328255,-73.8313085652731,-73.83131157851,-73.8313116556102,-73.8313087807624,-73.831308858525,-73.831311871981,-73.8313148652299,-73.831319316221,-73.8313267031295,-73.8313341073867,-73.8313385799053,-73.8313415338356,-73.8313459259586,-73.8313518355716,-73.8313563061113,-73.8313592993585,-73.8313622941411,-73.8313652967262,-73.8313668624281,-73.8313691677716,-73.8313758437003,-73.831382472741,-73.8313861239088,-73.8313905368991,-73.8313949887685,-73.8313950734317,-73.8314133154212,-73.8314539628582,-73.8314698037837,-73.8314728134361,-73.8314763521246,-73.8314792482893,-73.8314821437965,-73.8314880520893,-73.8314925226236,-73.8314955158638,-73.8314985106441,-73.8315015038839,-73.8315044977846,-73.8315089489893,-73.8315148579417,-73.8315192700569,-73.8315221851081,-73.8315265965627,-73.8315325063936,-73.8315369567216,-73.831539951279,-73.8315429438582,-73.8315474159284,-73.8315533622156,-73.8315578340655,-73.8315608273028,-73.8315638214194,-73.8315668339838,-73.8315698676299,-73.8315728415418,-73.8315772336685,-73.8315830835429,-73.8315874370202,-73.8315903325307,-73.8315947246576,-73.8316020906983,-73.8316102178979,-73.8316183402616,-73.831625009052,-73.8316287412655,-73.8316317531649,-73.8316347865895,-73.8316392571189,-73.8316451654105,-73.8316496172721,-73.8316526105063,-73.8316556179429,-73.8316571929574,-73.8316573233272,-73.8316588992204,-73.8316619051146,-73.8316663756392,-73.8316737812027,-73.831681168103,-73.8316856384071,-73.8316901493355,-73.8316960769478,-73.831700470397,-73.8317048811886,-73.8317107901381,-73.8317152426559,-73.8317182352282,-73.8317212284579,-73.8317242219079,-73.8317272257915,-73.8317287908059,-73.8317318344332,-73.8317377913543,-73.8317430023863,-73.8317496680939,-73.8317563377554,-73.8317615450529,-73.8317674919844,-73.8317705262757,-73.831772101058,-73.8317750758424,-73.8317779900203,-73.8317809055174,-73.8317852985272,-73.8317911670679,-73.8317960541924,-73.8318019429348,-73.8318098210916,-73.8318157005056,-73.8318175797956,-73.8318189693737,-73.8318233714924,-73.8318292819795,-73.8318337322961,-73.8318382028148,-73.8318441512832,-73.8318486217997,-73.831851615023,-73.831854608249,-73.8318576216735,-73.8318606557393,-73.8318636678459,-73.8318666623881,-73.8318696558296,-73.8318726490542,-73.8318771009069,-73.8318837494849,-73.8318918722785,-73.8318985008765,-73.8318991996703,-73.8318962062298,-73.8318932116886,-73.8318902184656,-73.8318886829911,-73.8318885852904,-73.8318870096372,-73.8318839962121,-73.8318824600803,-73.8318823723684,-73.8318822631378,-73.8318836527183,-73.8318865588878,-73.8318894739522,-73.8318923688171,-73.831895245679,-73.8318981412026,-73.8319010567077,-73.8319039717703,-73.8319068859582,-73.8319097821423,-73.8319126576904,-73.8319155532168,-73.8319184695996,-73.8319213837873,-73.8319243001734,-73.8319271950416,-73.8319300710271,-73.8319329665551,-73.8319358816234,-73.8319387771522,-73.8319387003124,-73.8319356853462,-73.8319326927795,-73.8319296995519,-73.8319267056675,-73.8319236928997,-73.8319236138611,-73.8319252060495,-73.8319037607493,-73.8319252733532,-73.831950081732,-73.8319972315804,-73.8320277483345,-73.8320350860737,-73.8320508837636,-73.8320674798225,-73.8320681440928,-73.8320710209706,-73.8320754137784,-73.832082799371,-73.8320902056012,-73.8320946761181,-73.8320976693401,-73.832102139855,-73.8321095454235,-73.8321154752369,-73.8321184684566,-73.8321229200933,-73.8321273706339,-73.8321289267329,-73.8321305017076,-73.8321349715623,-73.8321408805161,-73.8321453516906,-73.8321483850823,-73.8321513978386,-73.8321543917182,-73.8321573454221,-73.8321602618174,-73.8321631768952,-73.832167568384,-73.8321734773403,-73.8321779485119,-73.8321809410702,-73.8321839356081,-73.8321869290453,-73.8321884651652,-73.8321885441846,-73.8321900803026,-73.832193073522,-73.8321968072529,-73.8322034716391,-73.8322101410792,-73.8322138726154,-73.8322168860238,-73.8322213945045,-73.8322288209161,-73.8322347625007,-73.8322363361464,-73.8322364673305,-73.8322387819308,-73.8322454618234,-73.8322535883599,-73.8322602343076,-73.8322646846178,-73.8322676791505,-73.8322721296815,-73.8322780392884,-73.8322824401091,-73.8322838297176,-73.8322852193289,-73.8322896208056,-73.8322955297575,-73.8323014393659,-73.8323088240688,-73.8323162309443,-73.8323207007888,-73.8323236560337,-73.8323275562649,-73.8323349223156,-73.8323447716682,-73.8323521785415,-73.8323561549271,-73.8323591483582,-73.8323621415662,-73.8323650952738,-73.832369488083,-73.8323753976952,-73.8323798681969,-73.8323828622862,-73.8323858561539,-73.8323888098586,-73.8323917249404,-73.8323946413411,-73.8323990328354,-73.8324049029407,-73.8324100334124,-73.8324166611473,-73.8324247870241,-73.832431432752,-73.832435884603,-73.8324388778087,-73.8324418710171,-73.832444865761,-73.8324478194689,-73.8324507358702,-73.8324551460183,-73.8324595985268,-73.8324640690257,-73.8324700174778,-73.8324744877533,-73.8324774423372,-73.8324818338358,-73.8324877039461,-73.8324920967625,-73.8324950118482,-73.8324979282499,-73.8325008238046,-73.832499268174,-73.8324918426495,-73.8324829791114,-73.8324756117382,-73.832471219581,-73.8324668087724,-73.8324623569256,-73.8324593637161,-73.832454911869,-73.8324504413688,-73.8324503623656,-73.8324532579186,-73.8324561736648,-73.8324590692152,-73.8324619461203,-73.8324648416755,-73.8324677558828,-73.8324721688914,-73.8324780778439,-73.8324825288157,-73.8324862618767,-73.8324929275792,-73.8325010543392,-73.8325062414305,-73.8325092361753,-73.8325122293815,-73.8325137856736,-73.8325153590765,-73.8325183336325,-73.832521249378,-73.832524144936,-73.8325270218423,-73.8325299173996,-73.8325343089022,-73.8325401790165,-73.8325460475939,-73.8325519580851,-73.8325564285836,-73.8325594217898,-73.8325624149928,-73.8325654190642,-73.8325669844547,-73.8325692890458,-73.8325759649459,-73.8325825935674,-73.8325862467519,-73.8325891509808,-73.8325905406119,-73.8325919302486,-73.8325948351335,-73.8325977506624,-73.8326006462265,-73.8326035218171,-73.8326064173819,-73.8326108102061,-73.8326167185017,-73.8326211911971,-73.8326242030491,-73.832627236407,-73.8326302491405,-73.8326347196365,-73.8326406285889,-73.8326450207539,-73.832649433767,-73.8326568197939,-73.832664185855,-73.8326685780199,-73.8326714944338,-73.8326744088671,-73.8326773243991,-73.8326817152491,-73.8326876264024,-73.8326928365331,-73.8326995009134,-73.8327061696887,-73.8327070900763,-73.8327142988105,-73.8327201585727,-73.8327354332612,-73.8327539957029,-73.8327763372466,-73.8328348065117,-73.8328353728924,-73.8328572597595,-73.8328695372095,-73.8329198772514,-73.8329238578636,-73.8329601276305,-73.8329762017543,-73.8330540810123,-73.8331290819085,-73.8331639122983,-73.8331638439279,-73.8331682369949,-73.8331726886173,-73.8331764216639,-73.8331830867034,-73.8331897153421,-73.8331941090681,-73.8332007359487,-73.833208860523,-73.8332140491473,-73.8332170423338,-73.8332200556958,-73.8332230896773,-73.8332275601581,-73.8332334684583,-73.8332393774181,-73.8332452863768,-73.8332497380014,-73.8332512929241,-73.8332543464193,-73.8332617706099,-73.8332676995256,-73.8332706935882,-73.8332736472975,-73.8332780401468,-73.833283948446,-73.8332884189235,-73.8332913539968,-73.8332942300787,-73.8332986231489,-73.8333045321081,-73.8333089830705,-73.8333119771303,-73.8333149308427,-73.833317845739,-73.8333222574474,-73.8333267092885,-73.8333311804246,-73.8333370685484,-73.8333414225884,-73.83334431819,-73.8333487112626,-73.8333546202213,-73.8333590907004,-73.8333620444074,-73.8333649608474,-73.8333678750881,-73.8333707908678,-73.8333737064249,-73.8333773605237,-73.8333839876272,-73.8333906561793,-73.8333943863592,-73.8333973810782,-73.8334003742578,-73.833403327968,-73.8334062444082,-73.8334091601893,-73.8334120744304,-73.8334150281407,-73.8334180219811,-73.8334210160411,-73.8334254865154,-73.833431434723,-73.833435906076,-73.8334388992557,-73.8334426329503,-73.8334492993004,-73.833455927284,-73.8334600746223,-73.8334659627492,-73.833473840702,-73.8334797303679,-73.8334831380698,-73.8334860917798,-73.8334890849563,-73.8334920983044,-73.8334951309483,-73.8334981048321,-73.833501019077,-73.8335039355202,-73.8335083277187,-73.833514198532,-73.8335185894123,-73.8335230031042,-73.8335274542795,-73.8335304467981,-73.833534899293,-73.8335408073724,-73.8335452585513,-73.8335482523851,-73.8335527035636,-73.8335571545205,-73.8335616256489,-73.833567533291,-73.8335719276896,-73.8335748419343,-73.8335762602554,-73.8335786639494,-73.8335860315739,-73.8335958794005,-73.8336032858289,-73.8336043084692,-73.8336013920223,-73.833601432143,-73.8336044259778,-73.8336088957859,-73.8336148442066,-73.8336193153328,-73.8336237671687,-73.8336296752471,-73.8336355835454,-73.8336429695797,-73.8336503365415,-73.8336547287474,-73.8336591402418,-73.8336635914165,-73.8336680632006,-73.833675467424,-73.8336828549983,-73.8336872664928,-73.8336901816221,-73.8336945939987,-73.833701979373,-73.8337093849163,-73.8337145950174,-73.8337212615837,-73.8337279303493,-73.8337302031693,-73.8337302814268,-73.8337332954236,-73.833740700965,-73.8337466485013,-73.8337496813456,-73.8337526953397,-73.8337556876269,-73.8337586810124,-73.8337631521321,-73.833769100547,-73.8337735710064,-73.8337780212993,-73.8337854082063,-73.8337942708734,-73.8338002004354,-73.8338041798547,-73.8338115845123,-73.8338214340893,-73.8338302974141,-73.8338386653021,-73.8338460714993,-73.8338505419558,-73.8338534978628,-73.8338569062313,-73.8338627965606,-73.8338706731886,-73.8338766014315,-73.8338800880511,-73.8338830905306,-73.8338846560415,-73.8338876979721,-73.8338936556885,-73.8338981261423,-73.8339011206235,-73.8339026566535,-73.8339041929076,-73.8339072046925,-73.8339102379642,-73.833913212497,-73.8339176033851,-73.8339234742035,-73.833927866631,-73.8339307815467,-73.8339341914594,-73.833940080246,-73.83394795819,-73.8339538857729,-73.833957371726,-73.8339603642237,-73.8339648366527,-73.8339707837384,-73.8339767321413,-73.8339826790037,-73.833988260116,-73.8339960329378,-73.8340063735459,-73.8340167141569,-73.834024491374,-73.8340285907942,-73.8340315451609,-73.8340344602994,-73.8340373767538,-73.8340402910136,-73.8340432068121,-73.8340466151864,-73.8340525039762,-73.8340603828014,-73.8340663103761,-73.8340683383197,-73.8340703684583,-73.834076296035,-73.8340841748591,-73.8340900629895,-73.8340949471202,-73.8341008560728,-73.8341063132127,-73.83411371874,-73.8341235674323,-73.8341309729622,-73.834134950608,-73.8341394017691,-73.8341453107198,-73.834149761003,-73.8341527556915,-73.8341557094003,-73.8341593648359,-73.8341659919413,-73.8341741169439,-73.8341807626749,-73.8341866709674,-73.8341911227857,-73.8341941159359,-73.8341970711804,-73.8342007257382,-73.8342061670721,-73.8342073521879,-73.834215479387,-73.8342221251168,-73.8342265762782,-73.834229570085,-73.8342325237907,-73.834236916889,-73.8342428258409,-73.8342472962811,-73.8342502513047,-73.834254642205,-73.8342605511557,-73.8342650237934,-73.8342694740746,-73.8342739258926,-73.8342769190398,-73.8342798727469,-73.8342827885518,-73.8342857028177,-73.8342886192837,-73.8342915348693,-73.8342944500152,-73.8342974030649,-73.834300397529,-73.8343033908944,-73.8343063840392,-73.8343093399433,-73.8343133626767,-73.8343210975891,-73.8343314382017,-73.834341778813,-73.8343495558038,-73.8343541495501,-73.834360077123,-73.8343679557242,-73.8343712367234,-73.8343738841733,-73.8343773685769,-73.8343803235988,-73.8343832387532,-73.8343861530213,-73.834390547442,-73.8343964160792,-73.8344008091806,-73.8344066986368,-73.834415561296,-73.8344229482018,-73.8344288564952,-73.8344347654468,-73.8344391769493,-73.8344425868788,-73.8344484763349,-73.8344563538401,-73.8344637385472,-73.8344701394197,-73.8344745515827,-73.8344789446884,-73.8344848536408,-73.8344908011493,-73.834496709442,-73.8345011032098,-73.834504017484,-73.8345054373883,-73.8345073483308,-73.8345132380075,-73.8345211159544,-73.8345270444064,-73.8345310235778,-73.8345369524689,-73.8345448299755,-73.8345507187735,-73.8345548654869,-73.8345614917214,-73.8345696182649,-73.8345758615397,-73.8345770038541,-73.8345851275403,-73.8345917568568,-73.8345968858676,-73.8346027553939,-73.8346078887994,-73.8346145159187,-73.8346211450171,-73.8346252910702,-73.8346311805318,-73.8346390580421,-73.8346449869306,-73.8346499486188,-73.8346558970004,-73.8346603674293,-73.8346633211399,-73.8346662376203,-73.8346691534399,-73.8346735447971,-73.8346794152032,-73.8346847925965,-73.834692160232,-73.8347020089325,-73.8347093750301,-73.8347147504454,-73.8347206594009,-73.8347256246055,-73.834731552835,-73.8347394294657,-73.8347468163735,-73.834751759229,-73.8347562289959,-73.8347621379522,-73.8347665317282,-73.8347694460157,-73.8347738382535,-73.8347812043556,-73.8347893309023,-73.8347974545918,-73.8348063172573,-73.834815182121,-73.8348218105652,-73.8348269398045,-73.8348328494226,-73.8348373205065,-73.8348402735544,-73.834844667115,-73.8348520340966,-73.8348594188103,-73.8348638318622,-73.8348667461511,-73.8348711585454,-73.8348778071393,-73.8348859308285,-73.8348940567175,-73.8348992453106,-73.8349022384387,-73.834905194347,-73.8349095859319,-73.8349169520347,-73.8349243396054,-73.8349302476854,-73.8349366501004,-73.8349440361325,-73.8349519136429,-73.8349578039919,-73.8349612102052,-73.8349656232578,-73.8349715322179,-73.834975942415,-73.8349803359814,-73.8349862042056,-73.8349913382891,-73.8349979647575,-73.8350045938663,-73.8350082451608,-73.8350126582168,-73.8350200442493,-73.8350274118961,-73.8350332805654,-73.835039150989,-73.8350435432387,-73.8350464588554,-73.8350498681504,-73.8350557569635,-73.8350636342597,-73.8350695239536,-73.8350729301713,-73.8350758854219,-73.8350788785459,-73.8350818329173,-73.8350847487522,-73.8350876645917,-73.8350890823291,-73.835091978019,-73.8350978482284,-73.8351027345997,-73.8351086249558,-73.8351165015961,-73.835122380454,-73.8351242613182,-73.83512565203,-73.835128557027,-73.8351329492837,-73.8351403167158,-73.8351477023185,-73.8351521145013,-73.83515650698,-73.8351623771931,-73.8351667687921,-73.8351696830933,-73.8351740775533,-73.8351799462303,-73.8351858164434,-73.8351916860017,-73.8351975562197,-73.8352034244575,-73.8352092946751,-73.835215203642,-73.8352196747202,-73.8352226299734,-73.8352255442789,-73.8352284599049,-73.8352313750897,-73.8352342915937,-73.8352372065592,-73.8352401217462,-73.8352430360529,-73.8352459518981,-73.8352503441635,-73.8352562143857,-73.8352606066502,-73.835263522498,-73.8352664368046,-73.8352693526528,-73.835270771059,-73.8352706922489,-73.835272112194,-73.8352750265045,-73.8352794203096,-73.8352853290607,-73.835289799479,-73.8352927531974,-73.8352956697049,-73.8352985848955,-73.8353029765037,-73.8353088467283,-73.8353132383372,-73.8353161539683,-73.8353175725988,-73.8353189925455,-73.8353219068597,-73.8353248227103,-73.8353277764281,-73.8353307708667,-73.8353337248058,-73.8353371338949,-73.8353430233859,-73.8353509009165,-73.8353567912884,-73.8353616746,-73.8353675450495,-73.8353726769606,-73.8353793041125,-73.8353859126627,-73.8353895265557,-73.8353924216104,-73.8353953381252,-73.8353982431413,-73.835399632991,-73.8354010219688,-73.8354039269817,-73.8354073376126,-73.8354132266704,-73.8354211039877,-73.835428488724,-73.8354348909411,-73.8354393020374,-73.8354436956347,-73.8354495452913,-73.8354524022672,-73.8354523048667,-73.8354552005845,-73.8354610701618,-73.8354669397412,-73.8354728099815,-73.8354786802211,-73.8354845489223,-73.8354889420819,-73.8354918564031,-73.8354947722625,-73.8354991844631,-73.8355036349651,-73.8355066294027,-73.8355096420036,-73.8355141518194,-73.8355200607978,-73.8355244150014,-73.8355273107251,-73.8355287284892,-73.8355286505698,-73.8355300683354,-73.8355329841956,-73.8355329454586,-73.8355299322014,-73.8355298534055,-73.8355327497901,-73.8355341690936,-73.8355340716983,-73.8355354500656,-73.8355383457917,-73.8355412616553,-73.8355441759816,-73.8355470925047,-73.835550008149,-73.8355529233552,-73.8355558383403,-73.8355602315081,-73.8355661404927,-73.8355706106941,-73.8355735646379,-73.835576481164,-73.8355793954893,-73.8355823111366,-73.835585206866,-73.8355880826796,-73.8355909799455,-73.8355938942736,-73.8355983051647,-73.835604216349,-73.8356086272379,-73.8356115415669,-73.8356144388374,-73.8356173150905,-73.8356202108228,-73.8356231260319,-73.835626021765,-73.8356288980192,-73.8356317939728,-73.8356347096209,-73.8356376248325,-73.835641280345,-73.8356479075203,-73.8356545167588,-73.8356551760743,-73.8356521630351,-73.8356491683767,-73.8356461752554,-73.8356431821366,-73.8356401874748,-73.8356386515223,-73.8356385547938,-73.8356384379312,-73.8356383392244,-73.8356397591939,-73.8356426735285,-73.8356455894033,-73.8356485037385,-73.8356484650012,-73.8356454718807,-73.835643935925,-73.8356438571367,-73.8356452771086,-73.8356481914429,-73.8356511070978,-73.8356555188737,-73.835661427871,-73.8356658409662,-73.835670232608,-73.8356761028704,-73.8356775414431,-73.8356745474391,-73.8356730114853,-73.8356744308,-73.8356773457955,-73.8356773050839,-73.8356743126191,-73.8356727766654,-73.8356726991978,-73.8356746119741,-73.8356805008388,-73.8356883788454,-73.8356942484535,-73.8356976162016,-73.8357004924682,-73.835703368294,-73.8357062640372,-73.8357091799136,-73.8357120756574,-73.835714951927,-73.8357178485465,-73.8357207628883,-73.8357236586332,-73.8357265357835,-73.8357294122718,-73.83573079132,-73.8357306939396,-73.8357321117202,-73.8357350074669,-73.8357363880546,-73.8357377872391,-73.8357406829869,-73.8357420613742,-73.8357419672401,-73.8357419639977,-73.8357404280433,-73.8357377191237,-73.8357358602331,-73.8357358758743,-73.8344626562024,-73.8343738656812,-73.8343040247909,-73.8342263135761,-73.8341410118183,-73.8340484266342,-73.83394889137,-73.8338427644016,-73.8337304278445,-73.8336122861771,-73.8336103121768,-73.8335985732963,-73.8335435853963,-73.8333572612979,-73.8333379717765,-73.8333265974304,-73.8333096930096,-73.8333048816644,-73.8333004109493,-73.8332937424896,-73.8332870764438,-73.8332818658343,-73.8332759173069,-73.8332729037895,-73.8332728248394,-73.833271288689,-73.8332682953487,-73.8332653026665,-73.8332623091046,-73.8332593144435,-73.8332563210996,-73.8332533275343,-73.8332503328739,-73.8332473401905,-73.8332428874522,-73.8332369794996,-73.8332325276389,-73.8332280569215,-73.8332221081735,-73.8332176367961,-73.8332146434499,-73.8332101727313,-73.8332042239807,-73.833199015563,-73.8331923466539,-73.8331856810407,-73.8331809641285,-73.8331805995391,-73.8331735581814,-73.833163708291,-73.8331563030011,-73.8331523235664,-73.8331493293396,-73.8331463353321,-73.8331433419814,-73.8331388712591,-73.8331329218447,-73.8331284511216,-73.8331254577699,-73.8331224628806,-73.8331194695326,-73.8331194313717,-73.8331223271149,-73.8331237062295,-73.8331251053032,-73.83312802101,-73.8331309362779,-73.8331338320254,-73.8331330162441,-73.8331263275896,-73.8331196615298,-73.83311592828,-73.8331129342707,-73.8331099409195,-73.8331069466885,-73.8331032158574,-73.8330965460593,-73.8330876835691,-73.8330788188797,-73.8330706956249,-73.8330640451292,-73.8330595750586,-73.8330565428811,-73.8330535226901,-73.8330519672297,-73.8330518620881,-73.8330532620372,-73.8330561704291,-73.8330590848172,-73.8330620014039,-73.8330649173311,-73.8330678130807,-73.833069191307,-73.8330705910381,-73.8330734967698,-73.8330748851969,-73.8330756946498,-73.8330762740692,-73.8330791800172,-73.8330820966058,-73.8330865076752,-73.8330924169605,-73.8330948773195,-73.8330880965508,-73.8330889176015,-73.8330873776933,-73.8330844624214,-73.8330800506905,-73.8330741407417,-73.8330696899664,-73.8330652172526,-73.8330593092833,-73.8330534396956,-73.8330460723322,-73.8330386858879,-73.8330342344525,-73.8330312404344,-73.8330282865568,-73.8330253699697,-73.8330224555782,-73.8330195396497,-73.8330151263815,-73.8330092184129,-73.8330047665377,-73.8330017731783,-73.8329987782795,-73.8329952936291,-73.8329893650393,-73.8329814879635,-73.8329755578331,-73.832972070327,-73.832969116452,-73.8329662005246,-73.8329617885758,-73.8329558792851,-73.8329514668967,-73.8329485509689,-73.8329441390207,-73.8329396685012,-73.8329366354306,-73.8329336221061,-73.8329306285223,-73.8329276278466,-73.8329260721525,-73.8329259672206,-73.8329244115248,-73.8329214115047,-73.8329184181409,-73.8329154139189,-73.8329138497756,-73.8329137419558,-73.8329136529968,-73.8329121168239,-73.8329091234587,-73.8329053917342,-73.8328987232357,-73.8328920571564,-73.8328883232328,-73.8328853298648,-73.8328823364982,-73.8328793415911,-73.8328778054173,-73.83287772644,-73.8328791463438,-73.8328820607328,-73.8328834806367,-73.83288340166,-73.832881865483,-73.8328788718965,-73.8328758791878,-73.8328729239869,-73.8328700087198,-73.8328670930104,-73.8328641764218,-73.8328597660093,-73.8328553132457,-73.8328523205348,-73.8328493262879,-73.8328463322593,-73.832843338887,-73.8328403446378,-73.8328373506085,-73.8328328791989,-73.8328269326069,-73.8328239183917,-73.8328238307489,-73.832823721595,-73.832825111331,-73.8328280163964,-73.8328309329838,-73.8328353455985,-73.8328412546788,-73.8328457054668,-73.8328486988377,-73.8328516533805,-73.8328545686498,-73.8328574643942,-73.8328573876121,-73.8328543740563,-73.8328471032982,-73.8328450479487,-73.832842437641,-73.8328403211727,-73.8328395219301,-73.8328366060007,-73.8328336916109,-73.8328307763402,-73.8328278606314,-73.8328249447002,-73.8328220294301,-73.8328191137221,-73.8328147212917,-73.8328088119921,-73.8328028631996,-73.8327971480725,-73.8327969150667,-73.8327924443133,-73.8327894496213,-73.8327849788672,-73.8327790322708,-73.832774559976,-73.8327715659422,-73.8327678348672,-73.8327611665773,-73.8327544996059,-73.832750766332,-73.8327477629753,-73.8327461966196,-73.8327438941098,-73.832737214953,-73.8327305501789,-73.8327298474513,-73.8327282740964,-73.8327311698376,-73.8327370403078,-73.8327384788535,-73.8327354646285,-73.8327353871803,-73.8327382822602,-73.8327411979695,-73.8327441132395,-73.832744073747,-73.8327410595203,-73.8327409827302,-73.8327438784752,-73.8327438389796,-73.8327408380689,-73.8327392832368,-73.8327391787274,-73.8327361451935,-73.8327302292261,-73.832725099091,-73.832718470287,-73.8327118033103,-73.8327080709101,-73.8327051148241,-73.832702200435,-73.8326992845069,-73.8326963701164,-73.8326919568404,-73.8326875047247,-73.8326845113427,-73.8326815177437,-73.832679981555,-73.8326784453674,-73.8326779927349,-73.8326507177147,-73.8326186193822,-73.832605696646,-73.8326051641721,-73.8326032091814,-73.8326002157943,-73.8325972208677,-73.8325942274771,-73.8325912340894,-73.8325882391612,-73.8325852271252,-73.8325851481264,-73.832588043864,-73.8325880043662,-73.8325850116369,-73.8325820173656,-73.8325790233165,-73.8325760299272,-73.8325730356568,-73.8325700416088,-73.8325670482189,-73.8325625774416,-73.832555171425,-73.8325477847189,-73.8325433139422,-73.8325402803917,-73.8325372683473,-73.8325352223963,-73.8325264443197,-73.832507308465,-73.8325092712305,-73.832506931419,-73.8325053752479,-73.8325052707184,-73.8325037152062,-73.8325006949582,-73.8324991192561,-73.8324990216006,-73.8324974860558,-73.8324944824573,-73.8324929169575,-73.8324913512403,-73.8324883485132,-73.8324853535769,-73.8324823415266,-73.8324793070865,-73.8324762941563,-73.8324733000978,-73.8324703066961,-73.8324658352494,-73.8324598877344,-73.8324539375798,-73.8324465315484,-73.8324391457072,-73.8324346935718,-73.8324309631245,-73.8324242941357,-73.8324161705902,-73.832409521575,-73.8324050700994,-73.8324035332326,-73.8324034542212,-73.8324004421639,-73.8323944933256,-73.8323900218746,-73.8323870282518,-73.8323840357251,-73.8323810802903,-73.8323781650193,-73.8323737526092,-73.8323678432723,-73.8323633911354,-73.8323603977285,-73.8323574043257,-73.832354409381,-73.832351455485,-73.8323485410927,-73.8323456245035,-73.832341971749,-73.8323353420491,-73.8323272191593,-73.8323200768727,-73.8323126916905,-73.8323048123587,-73.8322988843695,-73.8322953968155,-73.8322924025296,-73.8322894084638,-73.8322864545652,-73.8322820612486,-73.8322761923052,-73.8322717989891,-73.8322688832851,-73.8322659686774,-73.8322615553874,-73.8322571041283,-73.8322526326729,-73.8322467233377,-73.832242330904,-73.8322394156377,-73.8322350225464,-73.832229114751,-73.8322231650281,-73.8322172170626,-73.832212745604,-73.8322082934637,-73.8322023847896,-73.832197923322,-73.8321963577971,-73.8321940552325,-73.8321873766878,-73.8321807109895,-73.8321769772364,-73.832173983824,-73.8321709888744,-73.8321679954629,-73.8321650020515,-73.8321605499067,-73.8321546405722,-73.8321487318945,-73.832142822557,-73.8321383712941,-73.8321353778816,-73.8321324217853,-73.8321287690365],"lat":[40.6095166423723,40.6095154490972,40.6095142569953,40.609511967394,40.6095091216864,40.6095040406712,40.6094989591552,40.6094961151209,40.6094938190819,40.6094937588506,40.6094959586076,40.609497016529,40.6094958244258,40.60949242378,40.609487920705,40.6094845276734,40.6094822463542,40.6094799496447,40.60947651177,40.6094719650311,40.6094674301684,40.6094629419853,40.6094596240758,40.6094562770566,40.609452876916,40.609451683132,40.6094516015686,40.6094515342225,40.6094526146477,40.6094548362336,40.6094570584899,40.6094584323542,40.6094470566729,40.6094346985127,40.609415601617,40.609389070855,40.609381605604,40.6093735396328,40.6093723101147,40.6093689182526,40.6093644141744,40.6093610659851,40.6093588745236,40.6093555270061,40.6093510234305,40.6093476303949,40.6093464596117,40.6093463851489,40.6093474359485,40.6093496428059,40.6093496138582,40.609347331362,40.6093450500376,40.6093427533212,40.6093426930775,40.609344901107,40.6093437445441,40.6093400526256,40.6093392113502,40.6093346776529,40.6093290334165,40.609323404073,40.6093189004987,40.6093143969232,40.6093110050595,40.6093105579263,40.6093087225648,40.6093064270177,40.6093063667729,40.609308573625,40.6093107963794,40.6093130174584,40.609315086221,40.6093166530769,40.6093105865258,40.6093071792637,40.6093026450632,40.6092981125374,40.6092936089631,40.6092896970549,40.609284646158,40.6092795646395,40.6092767200952,40.6092744284509,40.6092732287143,40.6092731291938,40.6092708023464,40.6092662589953,40.6092628512315,40.6092605699054,40.6092601914942,40.6092593945474,40.6092593194019,40.6092592393494,40.6092584342081,40.60925173915,40.6092375192822,40.6092220432075,40.609181214611,40.6091472813709,40.6091279635868,40.6091217010955,40.6091211507771,40.6091188540464,40.6091165425848,40.6091142463575,40.6091119645219,40.60910968252,40.6091074011901,40.6091051193553,40.6091028385278,40.6091005560218,40.6090982741876,40.6090959850738,40.6090947924311,40.6090935991209,40.609090199467,40.6090868070983,40.6090845257662,40.6090822432607,40.6090799619275,40.6090776651966,40.6090753542333,40.6090730415954,40.6090707313058,40.6090684345699,40.6090655888456,40.6090605078242,40.6090554257936,40.6090525822472,40.6090503004127,40.609048019581,40.6090457370762,40.6090434557408,40.6090411744073,40.6090388919004,40.6090366105667,40.6090343292333,40.6090320773615,40.6090287293523,40.6090242257763,40.6090219290423,40.6090230106175,40.6090252321875,40.6090252032262,40.6090229212211,40.609019512946,40.609013869208,40.6090093509002,40.6090070695649,40.6090047875617,40.6090036167603,40.6090035564918,40.6090023856933,40.6090001043565,40.6089978230215,40.6089955405132,40.6089932596807,40.6089909783459,40.6089886970106,40.608986414502,40.6089841331647,40.6089818518306,40.6089784440567,40.6089739404827,40.6089717336449,40.6089706520723,40.6089672891652,40.6089627862613,40.6089593937221,40.6089582224171,40.6089559261821,40.6089513931422,40.6089490969069,40.6089467991624,40.6089422671287,40.6089388586843,40.6089365773483,40.6089342955077,40.6089320590386,40.6089298669376,40.6089265189299,40.6089220153535,40.6089175117795,40.6089141199105,40.6089140897756,40.6089163113425,40.6089196595188,40.6089241334609,40.6089274804612,40.6089297032037,40.6089319242681,40.6089341458378,40.608932990435,40.608928457227,40.6089244857315,40.6089194052088,40.6089143236822,40.6089103531899,40.6089058199802,40.6089024133776,40.6089001308691,40.6089001007336,40.6089023229707,40.6089022928342,40.608900010826,40.6088977294899,40.6088954476478,40.6088931656391,40.6088908843027,40.608888602963,40.6088863204538,40.6088829131802,40.6088784102763,40.6088744988839,40.6088694491671,40.6088632554329,40.6088592854434,40.6088569734659,40.6088547073631,40.6088524846241,40.6088491228892,40.6088457298474,40.6088445590417,40.6088433887387,40.6088410926657,40.6088387805178,40.6088365145856,40.6088342923477,40.6088320399743,40.6088308615514,40.6088307799272,40.6088295866011,40.6088273271106,40.6088245423245,40.6088194914383,40.6088144092403,40.6088115658537,40.6088093134803,40.6088070924166,40.6088037290087,40.6088003359656,40.6087980546256,40.608795803425,40.6087930174684,40.608787966579,40.6087817738503,40.6087778192646,40.6087766484557,40.6087777300208,40.6087799368537,40.6087798765767,40.6087776094694,40.60877426247,40.6087697885307,40.6087664398585,40.6087642182924,40.608760871294,40.6087563973544,40.608755301054,40.6087575828941,40.6087587537029,40.6087576728072,40.608755450569,40.6087532290026,40.6087509783054,40.6087486957942,40.6087464144537,40.6087441331145,40.608741880743,40.6087396591763,40.6087374374424,40.6087352158756,40.6087318524674,40.6087284895609,40.6087262684985,40.6087240462616,40.6087218246945,40.6087195723211,40.6087172909829,40.6087150397822,40.6087128175462,40.6087094546382,40.6087049510641,40.6087015586904,40.6086981514185,40.6086936478424,40.6086897359489,40.6086846857315,40.6086796035328,40.608677855275,40.6086777653653,40.6086776908598,40.6086787724255,40.608680993992,40.6086843426658,40.6086888001972,40.6086898668609,40.6086875599621,40.6086863595185,40.6086862594451,40.6086873113738,40.6086895227792,40.6086883672076,40.6086838626283,40.6086805156297,40.608677152725,40.6086738052241,40.6086716131277,40.6086682656271,40.6086648732546,40.6086625912427,40.6086603395407,40.6086569920382,40.6086524884641,40.6086490811885,40.6086468442185,40.6086446516192,40.6086413046214,40.6086356757803,40.6086300605019,40.6086267130013,40.6086244914354,40.6086211432645,40.6086166847303,40.6086133666964,40.6086111598641,40.6086089382996,40.608606717236,40.6086056356699,40.6086045547731,40.6086023029013,40.6086000210591,40.6085977397218,40.6085965694157,40.6085965091397,40.6085953383338,40.6085930558201,40.6085907744799,40.6085885232811,40.6085851751081,40.6085795604996,40.6085739316585,40.6085705841574,40.6085683920611,40.6085650445585,40.6085616970571,40.6085595044547,40.6085561574553,40.6085527940472,40.608550572314,40.6085472100774,40.6085427060007,40.6085393134599,40.6085370316183,40.6085347507824,40.6085324682714,40.6085301727005,40.6085278612252,40.6085255934467,40.6085233718812,40.6085211508185,40.6085178021431,40.6085133298781,40.6085099812019,40.6085077294986,40.6085054486626,40.6085031957878,40.6085009740534,40.6084987672203,40.6084965757905,40.6084943677866,40.6084932873903,40.6084910805564,40.6084866071189,40.6084855108164,40.6084877928262,40.6084889636321,40.6084867567973,40.6084822828548,40.6084789358536,40.6084767136176,40.6084733656097,40.6084688921728,40.6084644187335,40.608459915158,40.6084553814468,40.608449738376,40.6084429819236,40.6084373749313,40.6084351906144,40.6084341320669,40.6084307762738,40.6084262733676,40.608422880829,40.6084205989878,40.6084172064491,40.6084138140779,40.6084115320709,40.6084092359993,40.6084091757269,40.608411382562,40.6084147305684,40.608419234144,40.6084226414171,40.6084248937916,40.6084271153584,40.6084293221902,40.6084315142937,40.608433721128,40.6084348020241,40.6084370088571,40.6084414822964,40.6084425785968,40.6084402818561,40.6084390809128,40.6084390059018,40.6084400879703,40.6084423090363,40.6084445306018,40.6084467523358,40.6084489750746,40.6084511819039,40.6084533733325,40.6084555801647,40.6084578029011,40.608460025137,40.6084622462002,40.6084644684357,40.6084666894977,40.6084689423738,40.6084712232119,40.6084734601808,40.6084745104344,40.6084755770974,40.608477783927,40.6084788353531,40.6084799015113,40.6084843891792,40.6084899883829,40.6084933074169,40.6084954990098,40.6084976904331,40.608501037932,40.6085044314799,40.6085067123184,40.6085089641883,40.6085123116872,40.6085167856257,40.6085212595632,40.6085257335003,40.6085302064324,40.6085346649641,40.6085357311202,40.6085334196367,40.6085333598571,40.6085367080275,40.6085401158079,40.6085424267891,40.6085446938981,40.6085469149585,40.60854913719,40.6085513582517,40.6085535655808,40.6085546170008,40.6085545265771,40.6085533261221,40.6085510293735,40.6085510004052,40.6085532219652,40.6085531913215,40.6085509104822,40.608548629138,40.6085463471227,40.6085440652781,40.608541769031,40.6085417087455,40.6085439162407,40.6085427596592,40.6085382264426,40.6085348186603,40.6085325378189,40.6085302564751,40.6085279751309,40.6085256926132,40.6085233958623,40.6085233367477,40.6085255435703,40.6085255122559,40.6085232309091,40.6085209500669,40.6085186682187,40.6085163873772,40.6085141048588,40.6085129340404,40.608512874254,40.6085139558117,40.6085161768685,40.6085161472274,40.6085138582616,40.6085126644149,40.6085103463098,40.6085058042977,40.608503508214,40.608505715035,40.6085101889658,40.6085101593229,40.6085056251003,40.608502217818,40.6084999364706,40.608499906827,40.6085021285538,40.6085009724698,40.6084964399222,40.6084930309641,40.6084907496172,40.6084884675998,40.6084861715145,40.6084849710506,40.6084848965203,40.6084837256988,40.6084814284399,40.6084791174459,40.6084768206905,40.6084756498673,40.6084755753357,40.6084754853948,40.6084754108643,40.6084742400401,40.60847195869,40.608469676672,40.6084673805837,40.6084650684157,40.6084627711511,40.6084604903053,40.6084582089546,40.6084559271036,40.6084536450836,40.6084502377979,40.608445704744,40.6084422974582,40.6084400001956,40.60843879922,40.6084387251871,40.6084375543614,40.6084352723385,40.6084341015157,40.6084340412143,40.6084328703879,40.6084305890379,40.608427181751,40.6084226491971,40.6084192402347,40.6084169890327,40.608414767983,40.6084125156097,40.6084102342583,40.6084084599682,40.6084079517334,40.6084067809073,40.6084067151624,40.6084066907785,40.6084066323288,40.6084054384702,40.608395795774,40.6083934691662,40.6083928530885,40.6083927882153,40.6083927773735,40.6083915768958,40.608389279629,40.6083869982738,40.6083847174244,40.6083824355675,40.6083801388029,40.6083778272955,40.6083755305305,40.6083732491757,40.6083709524104,40.6083686409031,40.6083663441374,40.6083640627844,40.608361780758,40.6083594994026,40.6083572175468,40.6083549355221,40.6083526541678,40.6083503723105,40.6083480902836,40.6083458089281,40.6083435275745,40.6083423567421,40.6083422969349,40.6083433773047,40.6083455841109,40.6083447734575,40.6083391137929,40.6083316086724,40.6083259632455,40.6083218072861,40.6083172730538,40.6083149762854,40.6083149088542,40.6083148265131,40.6083158855219,40.6083181001139,40.6083180699601,40.6083157879332,40.6083146170985,40.6083123203287,40.60830778777,40.6083040038803,40.6082994850596,40.6082934811317,40.6082878517884,40.608282973291,40.6082795659981,40.6082795056848,40.6082817129925,40.6082816828349,40.6082794014782,40.6082767435248,40.6082722252045,40.6082662207752,40.6082617024569,40.6082590461763,40.6082567494049,40.6082555484118,40.6082566145352,40.6082603528548,40.6082659811925,40.608268365743,40.6082582738709,40.6082410529192,40.6082146168254,40.6081882128187,40.608178521699,40.6081592992422,40.6081490147994,40.6081448421999,40.6081205364098,40.6081176037444,40.6081168196142,40.6081145228349,40.6081133372415,40.6081110102955,40.6081053517926,40.6081008322981,40.6080985509344,40.6080962997325,40.6080929515869,40.6080884486834,40.6080850413828,40.6080827440967,40.6080804330709,40.6080781362852,40.608075854921,40.6080735581391,40.6080701201681,40.6080655716818,40.6080616011605,40.608056520123,40.6080514374095,40.6080474680617,40.6080429649883,40.6080396170133,40.6080373948033,40.6080351737682,40.608032951559,40.6080307300209,40.6080285073093,40.6080262856025,40.6080229238836,40.6080184193048,40.6080150120036,40.6080127009746,40.6080104041924,40.6080069968909,40.6080024626472,40.6079990553455,40.6079967739784,40.6079944926135,40.6079921958284,40.6079898842953,40.6079875880146,40.6079853061447,40.607983024778,40.6079807427415,40.6079773503546,40.6079728467796,40.6079694838867,40.6079672623486,40.6079638994587,40.6079593953823,40.607955988078,40.6079536770477,40.6079502692425,40.6079452019465,40.6079390103911,40.6079339276758,40.6079310840953,40.6079288022246,40.6079265208588,40.6079242388193,40.6079242098265,40.607926430861,40.6079286523964,40.6079308598553,40.6079319110434,40.6079318364641,40.6079329168125,40.6079351390193,40.6079351088506,40.6079328120635,40.6079305010299,40.6079282037399,40.6079247964355,40.6079191521748,40.6079123968981,40.6079067828067,40.6079023088974,40.6078978509097,40.6078945329352,40.6078911849625,40.6078866813879,40.6078832895035,40.6078810069618,40.6078787255913,40.6078764442241,40.6078741616808,40.6078718803133,40.6078684877567,40.6078650953689,40.6078628133289,40.6078605172112,40.6078604573788,40.6078626641655,40.6078626339956,40.6078603521237,40.6078591746496,40.6078590917693,40.6078567731064,40.6078522317346,40.6078488244289,40.6078465720557,40.6078432250889,40.6078387511809,40.6078354037109,40.6078331826788,40.6078309604756,40.6078275975861,40.6078242051969,40.6078207978915,40.6078162943178,40.6078118204085,40.6078073464992,40.6078028725926,40.6077983695196,40.6077949617104,40.6077926803401,40.6077903983015,40.6077881021834,40.6077857911459,40.607783524022,40.607781301817,40.6077779389277,40.6077723100882,40.6077655548094,40.6077599252988,40.6077565624094,40.6077543408767,40.6077498527204,40.6077442084625,40.6077407999842,40.6077385038616,40.6077361928248,40.6077338955324,40.607731614666,40.6077293321218,40.6077270507494,40.6077247693802,40.6077213615713,40.6077168278274,40.607713420521,40.6077111693185,40.6077078206771,40.607703348445,40.6076999998044,40.607696638087,40.6076921328366,40.6076887409496,40.6076864595802,40.6076841729576,40.6076829873528,40.6076829070131,40.6076817214053,40.607679419527,40.6076759825529,40.6076714637239,40.6076681167575,40.6076658945549,40.6076636730227,40.6076614503164,40.6076581033506,40.6076535997769,40.6076513029855,40.6076512283954,40.6076489014315,40.6076432429237,40.6076376129123,40.6076342205221,40.6076319384802,40.607629642356,40.6076273308128,40.6076250641924,40.6076222782684,40.607617227901,40.6076110341654,40.6076070795613,40.6076047976857,40.6076025085233,40.6076013157886,40.6076023735871,40.6076045886615,40.6076045584906,40.607602276449,40.6075996184781,40.6075951006569,40.6075890957232,40.6075834668814,40.6075774619477,40.6075718478593,40.6075685008952,40.6075651375047,40.607560258004,40.607554629666,40.607548624733,40.6075441069102,40.6075414506166,40.607539168069,40.6075368866964,40.6075346343231,40.6075312868566,40.6075268129504,40.6075257171877,40.6075280068585,40.6075292007634,40.6075281412917,40.6075247872024,40.6075202831228,40.6075169202336,40.6075135727672,40.6075090993638,40.6075068925816,40.6075069529241,40.6075058709054,40.6075025080172,40.6074980044434,40.6074946120519,40.6074923300112,40.6074900338868,40.6074877228485,40.6074854260536,40.6074831446814,40.6074808478897,40.6074807875462,40.6074829795755,40.6074840302478,40.6074839556537,40.6074850364993,40.6074872587012,40.6074894797292,40.6074917019309,40.6074939234611,40.607496145159,40.6074949895529,40.6074904866494,40.6074860132464,40.6074803991582,40.6074747686424,40.6074714216789,40.6074692291484,40.607467022369,40.6074642369472,40.6074591860776,40.6074541045339,40.6074506967225,40.6074456161832,40.6074405329622,40.6074376900444,40.6074354080012,40.6074325629068,40.6074274823651,40.6074224003175,40.607419556228,40.6074161631673,40.6074116595916,40.607408267704,40.607404859892,40.6074003266486,40.6073969188365,40.607394667634,40.6073924454338,40.6073890825463,40.6073845796426,40.6073811870838,40.6073789052073,40.6073766231636,40.607373216524,40.6073686827748,40.6073652749624,40.6073629929181,40.6073607115431,40.6073584296642,40.6073561487936,40.607353866748,40.6073515853747,40.6073493479207,40.6073471570658,40.607344949617,40.6073427269156,40.6073405058877,40.6073382843569,40.607334920967,40.6073304173932,40.6073270248349,40.6073247434601,40.6073224615845,40.6073201807109,40.6073179283377,40.607315706807,40.6073123439196,40.6073078403449,40.6073044484578,40.6073021659098,40.6072998845335,40.6072976031604,40.6072953211158,40.607291913303,40.6072873807271,40.6072839729128,40.6072816920409,40.6072794094933,40.607276017604,40.6072709491352,40.6072647587524,40.607259706206,40.6072569224636,40.6072529958542,40.6072468037957,40.6072417215803,40.6072388786622,40.6072354855989,40.6072298555855,40.6072242124976,40.6072202397893,40.6072151604223,40.6072100782058,40.6072068570161,40.6072023386877,40.6071963354292,40.6071948704682,40.6071805804846,40.607172299334,40.6071583179309,40.6071247953079,40.6071155718812,40.60705285923,40.6070459814107,40.6070425873395,40.6070403052928,40.6070380540922,40.6070352676699,40.6070302173031,40.6070251352524,40.6070222916642,40.6070200552162,40.6070192218998,40.6069756523425,40.6069623333469,40.6069604286202,40.6068995942867,40.6068895528889,40.6068742207688,40.6068658494821,40.6068536707185,40.6068467837754,40.6068383799764,40.606826648257,40.6068209715482,40.6068046628902,40.606801860073,40.6067996088711,40.6067970107453,40.6067925219235,40.6067865176583,40.6067820288342,40.6067816993169,40.6067753601465,40.6067749074357,40.6067715072502,40.6067664387798,40.6067602483957,40.6067540551645,40.6067478636064,40.6067422193441,40.6067399225468,40.6067398948736,40.6067240717601,40.6067240166961,40.6067230496049,40.6067202636824,40.6067192216258,40.606715213316,40.60670901958,40.6067028285276,40.6066972151099,40.6066938664723,40.6066916442719,40.6066894227416,40.6066871715399,40.6066837630576,40.606679230479,40.6066758226666,40.606673571466,40.6066702228283,40.6066657192542,40.6066611866766,40.6066566831025,40.6066522091979,40.6066477357968,40.6066438239392,40.6066387742437,40.6066337216993,40.6066309374514,40.6066275745641,40.6066241826767,40.6066215247029,40.6066170052051,40.6066110014446,40.6066065126212,40.6066027907377,40.6065983168327,40.6065944056439,40.6065893547745,40.6065831620455,40.6065777193259,40.6065720909874,40.6065660865565,40.6065615984033,40.606560141968,40.6065590611248,40.6065556987397,40.6065523365212,40.6065501143218,40.6065478927908,40.6065456700868,40.6065434193886,40.6065411368419,40.6065388554673,40.6065376846064,40.6065376242607,40.6065364544059,40.6065341725268,40.6065330016677,40.6065352084463,40.6065396818454,40.6065418886228,40.6065418216551,40.6065417399305,40.6065405460197,40.6065382870225,40.6065360654927,40.606532702103,40.6065281990305,40.6065248439409,40.6065237849734,40.6065227276869,40.6065205121068,40.6065182899066,40.6065160688786,40.6065138466798,40.6065116251495,40.6065105436352,40.6065094627931,40.6065072560148,40.6065050644874,40.6065017165217,40.6064972129445,40.6064938512294,40.6064916285254,40.606488266141,40.6064848666277,40.6064836727169,40.6064847310167,40.6064869455882,40.606490293053,40.6064947522064,40.606495253905,40.6064901591148,40.606485075894,40.6064811070389,40.6064766183839,40.6064733004212,40.6064699524542,40.6064648851547,40.6064586941008,40.6064536498563,40.6064520281704,40.6064509703786,40.6064487564731,40.6064465342726,40.6064443115699,40.6064409646049,40.6064364907,40.6064331432317,40.6064309222046,40.6064275735654,40.6064230699891,40.6064196626798,40.6064174109764,40.6064151887745,40.6064129672437,40.6064107455455,40.6064085387648,40.6064063462331,40.6064029999387,40.6063995926288,40.6063972799097,40.6063949831153,40.6063927012405,40.6063904500384,40.6063882278377,40.6063859766357,40.6063836945914,40.6063814127152,40.6063791313419,40.6063768806428,40.6063746579382,40.6063712950501,40.6063667926486,40.606363399588,40.6063611182134,40.6063588653363,40.6063557994791,40.6063499037819,40.6063420225662,40.6063341413516,40.6063282143069,40.6063250897785,40.606322837407,40.6063206158764,40.6063184090958,40.606317357752,40.6063174335178,40.6063163515008,40.6063141447192,40.6063142050626,40.6063165089819,40.6063177017133,40.6063166439156,40.6063144300065,40.6063110818692,40.6063065777913,40.6063031704831,40.6063009192803,40.6062986977492,40.6062953348603,40.6062919714687,40.6062897504368,40.6062874985659,40.606285217194,40.6062829353196,40.606279526839,40.6062750232637,40.6062728164818,40.6062728768226,40.6062717964781,40.6062695737726,40.60626735224,40.6062651312086,40.6062617830697,40.6062573091611,40.6062528357579,40.6062483328518,40.6062449255446,40.6062426429985,40.6062403616283,40.6062381092557,40.6062358877208,40.6062336809368,40.6062314894064,40.6062292826219,40.606227059916,40.6062236981981,40.6062203051385,40.6062168978339,40.6062123937546,40.6062090462843,40.6062068247507,40.6062042264528,40.6061997382981,40.6061937333635,40.6061892452068,40.6061877899408,40.6061878491072,40.6061867687616,40.6061845460537,40.6061811997562,40.6061767251759,40.6061733777056,40.6061711561713,40.6061700746499,40.6061689938007,40.6061667870143,40.6061645954801,40.6061623886945,40.6061601659856,40.6061579444502,40.6061557234164,40.6061534715435,40.606151189673,40.6061489527184,40.6061490130546,40.6061524203595,40.6061558127468,40.6061569835986,40.6061570434316,40.6061571037668,40.6061571624263,40.6061549556387,40.6061493415469,40.6061437127053,40.6061403498153,40.6061375638865,40.6061325141849,40.6061274616355,40.6061246778855,40.606122455175,40.6061213748253,40.6061214351564,40.6061226055057,40.6061248868741,40.6061260577224,40.6061249768693,40.6061216144803,40.6061171115746,40.6061137185161,40.6061114371488,40.606109154608,40.6061068732419,40.6061045764541,40.6061022654249,40.6061004302623,40.6061004983898,40.6060864853077,40.6060462258054,40.60602290201,40.6059781618856,40.6059519468973,40.6059352019092,40.6059041591634,40.605885188242,40.6058640577462,40.6058337734428,40.6057888751503,40.6057565245809,40.6057401278525,40.605683377113,40.6056550649809,40.6056436237919,40.6056349557474,40.6056343764944,40.6056273855869,40.6056107672682,40.6055993347731,40.6055870308909,40.60549939423,40.6054805195,40.6054425488411,40.6054119802378,40.6053885599153,40.6053649822207,40.6053439774944,40.6053298691537,40.6053182068298,40.6052969485151,40.6052735607008,40.6052713181617,40.6052698202303,40.605267598667,40.6052653764333,40.6052631548715,40.6052609331405,40.6052587115767,40.6052576300156,40.6052576897948,40.6052566089016,40.6052543871717,40.6052510391676,40.6052465804679,40.6052455138083,40.6052478110592,40.6052500935725,40.6052523903203,40.6052547006282,40.6052570044935,40.6052581978248,40.6052593911581,40.605261688405,40.6052628810643,40.6052640743946,40.6052663640231,40.605268644863,40.6052709267048,40.605272097513,40.6052721567851,40.6052722170644,40.6052711354967,40.605268928664,40.6052667372361,40.6052645309055,40.6052623086681,40.605260085928,40.6052574877655,40.6052529995935,40.6052469956624,40.6052425069858,40.6052399115034,40.6052376882608,40.6052354665254,40.6052332520758,40.6052321935285,40.6052333868559,40.6052356907107,40.6052380026892,40.6052402994306,40.6052425807697,40.605244870397,40.6052460637186,40.6052450046685,40.6052427895451,40.6052394425429,40.6052349396343,40.6052304059235,40.6052259018432,40.6052225548413,40.6052203326018,40.6052192517013,40.6052193262036,40.6052182759388,40.6052160691043,40.6052160980659,40.6052183943024,40.6052184545731,40.605216247735,40.6052140254943,40.6052118044285,40.6052090179625,40.6052039675743,40.6051989221243,40.6051973026961,40.6051984953467,40.6052007844635,40.6052019552666,40.6052008736943,40.6052006850129,40.6052078679565,40.6052082800541,40.6051965226187,40.6051935466845,40.6051949413618,40.6051983486323,40.6052017552316,40.6052018154934,40.60519960865,40.6051973870759,40.6051951648338,40.6051929432596,40.605190721016,40.6051896406111,40.6051897003699,40.6051908699941,40.6051931524991,40.6051943227921,40.6051943830539,40.6051933014739,40.6051910799005,40.6051888581567,40.6051866513134,40.6051844586927,40.6051822518487,40.6051800302729,40.6051778085307,40.6051744605157,40.6051699875717,40.605168891262,40.6051711879922,40.6051746253879,40.6051791733206,40.6051825805873,40.6051848778195,40.6051860782383,40.6051861603408,40.6051862426031,40.6051851845408,40.6051829695743,40.6051796225617,40.6051751486106,40.6051729410914,40.6051730008425,40.6051719199305,40.6051696981847,40.6051667255931,40.6051611109757,40.6051536046786,40.6051479900624,40.6051450184735,40.6051428116233,40.6051417608359,40.6051418353155,40.6051396284642,40.6051351704128,40.6051341042248,40.6051364002822,40.6051375717401,40.6051376308187,40.6051365499052,40.6051343276542,40.6051321060741,40.6051298843268,40.6051270983558,40.605122047459,40.6051170102865,40.605114256616,40.6051120580507,40.605110998469,40.6051099398979,40.6051077401536,40.6051055480254,40.6051010740719,40.6050954599551,40.6050943636414,40.605096645636,40.6050989274649,40.6051012236859,40.6051035356361,40.6051058374383,40.6051070236201,40.605107102161,40.6051088503895,40.6051139381582,40.6051190180065,40.6051207531836,40.6051208122584,40.6051197313369,40.6051175239775,40.6051153318475,40.6051131249903,40.6051109039095,40.6051086816559,40.605105334137,40.6051008601809,40.6050975119898,40.6050952904079,40.6050930693268,40.6050908470727,40.605089766152,40.6050898335074,40.6050899150809,40.6050911083711,40.6050933683591,40.6050955894408,40.6050978110234,40.6051000327755,40.6051033961945,40.6051090250381,40.6051146396578,40.6051179878475,40.6051213500926,40.6051264163873,40.6051326084477,40.6051376894679,40.6051405351843,40.6051428165073,40.6051462237654,40.6051507574646,40.6051541652261,40.6051564465494,40.6051587290447,40.6051610098633,40.6051644176255,40.6051689501496,40.6051723574081,40.605174639905,40.6051769212258,40.6051792025498,40.605182609807,40.6051871440066,40.6051905512646,40.6051928325864,40.6051962398443,40.6052007434237,40.6052040921151,40.6052063137016,40.6052085359573,40.6052107570392,40.6052141050634,40.6052186086395,40.605220482941,40.6052390486769,40.6052607173927,40.6052728863128,40.6052590622017,40.6052439976678,40.6052403770252,40.6052366814621,40.6052328004356,40.6052335830981,40.6052381167929,40.605240413505,40.6052404879567,40.6052394359708,40.605237229104,40.6052350075143,40.6052328011497,40.6052317496641,40.6052306829552,40.6052284618675,40.6052273814394,40.6052262998368,40.6052218111501,40.6052161970288,40.6052139901595,40.6052140503887,40.6052118428508,40.6052073688861,40.605204020856,40.6052017985956,40.6052018298813,40.6052041111993,40.6052063920127,40.605208689222,40.6052087482769,40.6052065414078,40.6052043198148,40.6052020975546,40.6051998759628,40.6051965130434,40.6051920099696,40.6051886477204,40.6051864249554,40.6051842109778,40.6051831523731,40.6051820944454,40.6051798787887,40.605176531763,40.6051720725145,40.605169895757,40.6051680780249,40.6051624639002,40.6051549576037,40.6051493505916,40.6051475428157,40.6051476248716,40.6051476916988,40.6051466112634,40.6051443890009,40.6051433080628,40.605143368286,40.6051451005955,40.6051501827836,40.605155263799,40.6051569977845,40.6051570568331,40.605157117055,40.6051571921611,40.6051561406641,40.6051539337876,40.6051539633959,40.6051562560292,40.6051574564012,40.6051575547013,40.6051565038722,40.6051542924213,40.6051520701549,40.6051498490607,40.6051498779957,40.6051521758693,40.6051522344122,40.6051500275343,40.6051478052682,40.6051455836718,40.6051456137789,40.6051478950891,40.6051501764011,40.605152473099,40.6051547850201,40.6051570888262,40.6051582820852,40.6051583647982,40.6051584321178,40.6051573500027,40.6051551289065,40.6051529066376,40.6051506855435,40.6051507144764,40.6051529964572,40.6051541672152,40.6051530856027,40.6051508787215,40.6051486860566,40.6051464803474,40.6051465104535,40.6051488064781,40.6051511173898,40.6051534140861,40.6051556953936,40.6051579778758,40.6051613856221,40.6051658733093,40.6051680505881,40.6051679614438,40.6051667610795,40.6051644643835,40.6051632936251,40.6051643740662,40.6051665968382,40.605167677279,40.6051698841598,40.6051743877364,40.6051777954839,40.6051800762908,40.605183485211,40.6051880177232,40.6051914249678,40.6051937062748,40.6051948770365,40.6051949372483,40.6051938558002,40.6051916423149,40.6051905831926,40.6051906659015,40.6051895913888,40.6051873697904,40.6051851480223,40.6051806593308,40.6051750452019,40.6051739488687,40.6051762306791,40.6051796379223,40.6051841716056,40.6051875793513,40.6051898755414,40.6051921869529,40.6051944978595,40.6051945580697,40.605192351185,40.605190128913,40.6051879078137,40.6051851218211,40.6051800714162,40.6051750266113,40.6051734059407,40.6051745980188,40.605176887603,40.6051797309533,40.6051848136403,40.6051898941493,40.6051927391757,40.6051950211514,40.6051984277226,40.6052029625748,40.6052063691458,40.6052086658374,40.6052087255387,40.6052065186546,40.6052031711135,40.6051986976387,40.6051953489259,40.6051931420381,40.6051932022417,40.6051954989311,40.6051966691833,40.6051967441014,40.6051979444522,40.6052002416433,40.6052025224457,40.6052048042504,40.6052070862241,40.60520938224,40.6052094419418,40.6052072426621,40.605206184196,40.6052051260711,40.6052045795898,40.6052067234012,40.6052094849399,40.6052166814478,40.6052254265208,40.6052359535707,40.6052580633763,40.6052580017116,40.6052582228512,40.60525741177,40.6052540886389,40.6052539598994,40.6052527916647,40.605252273738,40.6052697456098,40.605272886977,40.6052632176565,40.6052671799616,40.6052694766323,40.6052683961636,40.6052661809805,40.6052651218173,40.6052663150329,40.6052686122062,40.6052698054187,40.6052698874043,40.6052688130294,40.6052665912429,40.605263244191,40.6052587701989,40.605256563288,40.6052566229575,40.6052566826277,40.6052567428001,40.6052556606532,40.6052511729549,40.6052455735281,40.6052433956955,40.6052423294284,40.6052401076418,40.6052401377262,40.6052424343923,40.6052424940592,40.605240287146,40.6052414424975,40.6052459761604,40.6052482728261,40.6052483324929,40.6052472508452,40.6052450297276,40.6052450586382,40.6052473405947,40.6052485113217,40.6052474296746,40.6052452227607,40.6052464083605,40.60525095673,40.605254364455,40.6052566611188,40.6052567212856,40.605254513197,40.6052545444517,40.6052568252365,40.6052591065206,40.6052613878069,40.6052636702656,40.6052659586532,40.6052671518554,40.6052660931879,40.6052638786637,40.6052616568747,40.605259435251,40.605259465332,40.6052617466184,40.6052640279037,40.6052663098568,40.6052663399375,40.6052641176442,40.6052618953511,40.6052596884325,40.6052574968903,40.6052552899726,40.6052530676778,40.6052508531571,40.6052497949855,40.6052509876823,40.6052532811378,40.6052544667309,40.6052545466651,40.6052557322597,40.6052580186116,40.6052580486905,40.6052558270644,40.6052524800054,40.6052480060042,40.6052469096446,40.6052491909254,40.6052514722093,40.6052537688657,40.6052560802285,40.6052583768826,40.6052595471022,40.6052584671217,40.6052562443209,40.6052551638394,40.6052552239954,40.6052541423389,40.6052519207123,40.6052508390555,40.6052497580683,40.6052475511454,40.6052476101268,40.6052499067839,40.6052521892355,40.6052555810781,40.6052589842318,40.6052601840232,40.6052602838892,40.6052592318061,40.6052569902362,40.6052547089548,40.6052524577535,40.6052502349527,40.6052480280261,40.605245836307,40.6052436293819,40.6052425478909,40.6052426080423,40.6052426681937,40.6052427425459,40.6052439433374,40.6052462388155,40.6052474095292,40.6052463285383,40.6052441216122,40.6052430711965,40.6052431450458,40.6052443157585,40.6052465975383,40.6052477672469,40.6052478420969,40.6052467911784,40.6052445913498,40.6052435326602,40.6052424734707,40.6052391188005,40.6052346152221,40.6052312671524,40.6052302160644,40.6052280240023,40.6052235504973,40.6052202029297,40.6052179811279,40.6052157594951,40.6052135525644,40.6052113598323,40.6052091529002,40.6052080712334,40.6052081467504,40.6052082352904,40.6052071694994,40.6052049575003,40.6052039065739,40.6052040064231,40.6052040954639,40.6052041801021,40.6052031285056,40.6052009215705,40.6052009511405,40.6052032386551,40.6052044235609,40.6052045036335,40.605203437334,40.6052012200967,40.6051984335648,40.6051933831423,40.6051883454079,40.6051855921296,40.6051833851926,40.6051811623851,40.6051778006155,40.6051744371709,40.6051710900987,40.6051666160875,40.6051655197182,40.6051678163571,40.6051701282016,40.6051724248422,40.6051747061131,40.6051769919523,40.6051781780247,40.6051782580938,40.6051771906167,40.6051749745488,40.6051727529095,40.6051705459728,40.6051683532283,40.605166160988,40.6051639694153,40.6051617732933,40.6051607250646,40.6051608306331,40.605160935028,40.6051598868038,40.605157676478,40.6051577060412,40.6051599873097,40.6051622697528,40.6051645510199,40.6051668322891,40.6051691192954,40.6051703046919,40.605170383582,40.6051693184445,40.6051659600634,40.6051626028582,40.6051615365474,40.6051616154358,40.6051628008294,40.6051651025293,40.6051651621552,40.6051629648433,40.6051619138988,40.6051620137208,40.6051609616024,40.6051587500919,40.6051576690825,40.6051577292086,40.6051566475274,40.6051544258863,40.6051544547753,40.6051567443127,40.6051579379724,40.6051580193878,40.6051580861036,40.6051581457241,40.6051570652162,40.6051548429018,40.6051548729646,40.6051571624993,40.605158142019,40.605158354983,40.6051584370688,40.6051585042848,40.6051574226019,40.6051552009576,40.6051552310172,40.605157526977,40.6051575865956,40.605155379645,40.6051554102087,40.6051577063322,40.6051577664524,40.6051555595044,40.6051544778186,40.6051533968049,40.6051511744882,40.6051512040441,40.6051534858098,40.6051557677408,40.6051580490048,40.6051603307701,40.6051626127021,40.6051626415865,40.6051604199412,40.6051581981267,40.6051559764794,40.6051560065403,40.6051582987801,40.6051595039122,40.6051596077761,40.6051597121418,40.6051586643978,40.6051564586261,40.6051553917981,40.6051554718394,40.605154882006,40.6051544060172,40.605152188259,40.6051522194895,40.6051544990739,40.6051567815049,40.6051590781309,40.6051613894454,40.6051636865716,40.6051648714483,40.6051649611132,40.6051650354165,40.6051650950245,40.6051651551358,40.6051663258197,40.6051686116438,40.6051697970209,40.6051698765521,40.6051699513521,40.6051700155208,40.6051711862042,40.6051734828248,40.6051735429335,40.6051713501627,40.6051714102699,40.6051737062205,40.605175988146,40.605179380482,40.6051827780484,40.6051839640926,40.6051840434524,40.6051829766171,40.6051807655977,40.6051796987625,40.60517977812,40.6051809641611,40.6051832570735,40.6051844512118,40.6051845332715,40.6051845960346,40.605184607563,40.60518468945,40.6051858820832,40.6051881857894,40.6051904970948,40.6051928018121,40.6051939944408,40.6051951869044,40.6051974814886,40.605198667024,40.6051987458724,40.6051976800368,40.6051954781332,40.6051932865279,40.6051910795613,40.6051911084373,40.6051933896916,40.6051956716151,40.6051979675556,40.605200280031,40.6052025857658,40.6052037864915,40.6052038857614,40.6052050864837,40.6052073927169,40.6052074528135,40.605205250409,40.6052041840655,40.6052042634084,40.6052043388636,40.6052032617206,40.6052010547493,40.6052011143411,40.6052034114543,40.6052056922003,40.6052079893109,40.6052091888559,40.6052092709001,40.6052093527721,40.6052094424068,40.605209532044,40.6052107244952,40.605213028694,40.6052130877807,40.6052108808081,40.6052109113538,40.6052132079611,40.6052144081729,40.6052144824451,40.6052156531148,40.6052179348635,40.6052191050295,40.6052191722118,40.6052192547476,40.6052193366158,40.6052182621649,40.6052160403345,40.6052160698774,40.6052183664794,40.6052195671884,40.6052196419631,40.6052197010424,40.6052197656898,40.605219840461,40.6052199204607,40.605221105813,40.6052233916163,40.6052245629523,40.6052246218633,40.6052257925246,40.6052280891267,40.6052304004105,40.6052327041064,40.6052338977173,40.6052350903264,40.6052373791606,40.6052385498247,40.605238625261,40.6052398254625,40.6052421355719,40.6052444475263,40.6052467446266,40.6052490258701,40.6052513116752,40.6052524976904,40.605252577012,40.6052537625252,40.6052560488278,40.6052560783655,40.6052538565305,40.6052538860667,40.6052561684822,40.6052584492223,40.605261841548,40.6052652498991,40.6052675611801,40.6052698628403,40.6052710481849,40.6052711269994,40.6052728740527,40.6052779622717,40.6052830422487,40.6052858872111,40.6052881838054,40.6052893850046,40.6052894587569,40.6052906294143,40.6052929255054,40.6052952372856,40.6052975338777,40.6052998162889,40.6053021117121,40.6053044229866,40.6053067354358,40.6053090462084,40.6053113569817,40.605313668757,40.6053159800323,40.6053160396008,40.6053138326135,40.6053138621473,40.6053161438869,40.6053184251257,40.605320707034,40.6053229887766,40.6053252706843,40.6053275519223,40.6053298336614,40.6053321155702,40.6053344114899,40.6053367222602,40.6053390188496,40.6053413000878,40.6053435824965,40.6053458637346,40.6053492567291,40.6053537591348,40.6053571521314,40.6053594333671,40.605361729958,40.6053617895227,40.6053595830342,40.605359611894,40.6053618938025,40.605364175039,40.6053664716258,40.6053687833986,40.605371079985,40.6053733612216,40.6053767537132,40.6053801472118,40.6053824279438,40.6053847096831,40.605384739212,40.6053825180425,40.6053825469015,40.6053848338704,40.6053860192017,40.6053860991741,40.6053872840033,40.6053895856481,40.6053918969156,40.6053942005912,40.6053953936784,40.6053977125359,40.6054022527311,40.605405659901,40.6054079411369,40.6054107850873,40.6054158677401,40.6054209475437,40.6054237931692,40.6054260806408,40.6054272654653,40.6054273447625,40.6054274196681,40.6054274836173,40.6054286549322,40.6054309508464,40.6054343880446,40.6054400475904,40.6054456764369,40.6054490841087,40.6054513960403,40.6054537073014,40.6054560180606,40.605458329322,40.605460640581,40.6054629371629,40.6054652188957,40.6054675007982,40.6054686714423,40.6054675897091,40.6054653680324,40.6054620192443,40.6054575610416,40.6054576210971,40.6054621688812,40.6054655760486,40.6054689683688,40.6054734731213,40.6054768649388,40.6054791473429,40.6054813985467,40.6054847461618,40.6054892497404,40.6054926569086,40.6054960492308,40.6055016787474,40.6055073229406,40.6055107301076,40.6055130118414,40.6055152930703,40.6055175749724,40.6055198567056,40.6055221379355,40.6055244198352,40.6055267157443,40.6055267757974,40.6055245687951,40.6055245983181,40.6055268795494,40.6055291619501,40.6055314431798,40.6055348503458,40.6055393827778,40.6055427911185,40.6055450728487,40.6055462424819,40.6055463025362,40.6055474731742,40.605549754904,40.6055531620714,40.6055576956759,40.6055611028409,40.6055633845716,40.6055667917365,40.6055713253408,40.6055747325059,40.605577014907,40.6055792961348,40.6055815844522,40.6055827775239,40.6055850958642,40.6055896065292,40.6055929553205,40.6055951770006,40.605597399353,40.6055996205325,40.605601843385,40.6056052051777,40.6056108351979,40.6056175899812,40.6056232199985,40.6056266129905,40.6056288942169,40.6056311749428,40.605633456169,40.6056357090481,40.6056379302278,40.6056412931931,40.6056457967716,40.6056491890934,40.6056514709898,40.6056537522178,40.6056549228553,40.6056549824009,40.6056561530398,40.6056584489425,40.6056607608639,40.6056630267446,40.605665249599,40.6056686120622,40.6056720043826,40.6056742862792,40.6056765379828,40.6056787603368,40.6056821226325,40.6056866262129,40.6056900232595,40.6056912085726,40.6056912885225,40.6056935997719,40.6056981379302,40.6057026708625,40.6057072044642,40.605710611627,40.6057128940266,40.6057163011892,40.6057208336186,40.6057242424576,40.605726523682,40.6057299308444,40.6057344632747,40.6057389968766,40.6057446410682,40.6057502710874,40.605753663405,40.6057570705671,40.6057627147607,40.6057672330162,40.6057706401782,40.6057762855413,40.60578175792,40.6057819143878,40.6057852773545,40.6057881280153,40.6057931132094,40.6057931884525,40.6071925329425,40.6078515139207,40.6079531163546,40.6080513433467,40.6081458412101,40.6082362696842,40.6083223031595,40.6084036318508,40.6084799629124,40.6085510214929,40.6085532358856,40.6085601522587,40.6085925523794,40.6087137853568,40.6087263356554,40.6087370733699,40.6087530301449,40.6087537932993,40.6087560013851,40.608757058875,40.6087581180433,40.6087603178515,40.6087625105579,40.6087658576102,40.6087703605155,40.6087737246209,40.6087759457379,40.6087781673583,40.6087803891449,40.6087826107624,40.6087848330518,40.6087870558434,40.608789276958,40.608791498578,40.6087925802207,40.60879252005,40.6087936021961,40.6087958091064,40.6087980001344,40.6088002070433,40.6088024293316,40.6088046362412,40.6088068277709,40.6088090275785,40.6088100862346,40.6088111453977,40.6088133497709,40.6088134008408,40.608814400655,40.6088143012532,40.6088153528072,40.6088175642809,40.6088197858961,40.6088220076791,40.6088242304681,40.6088264373749,40.6088286289,40.6088308358063,40.6088330585949,40.6088352808785,40.6088375019917,40.6088397531949,40.608843162097,40.6088488051457,40.6088533229291,40.6088556048905,40.6088578866837,40.6088612944128,40.6088657908875,40.6088679748053,40.6088690339639,40.6088712491443,40.6088734702563,40.6088756918717,40.6088779136533,40.6088801281667,40.6088811873185,40.6088810970504,40.6088810072809,40.6088809252888,40.6088808579998,40.608883065407,40.6088875388934,40.608891262536,40.6088957502293,40.6089017544941,40.6089062722796,40.6089089301679,40.6089112121291,40.6089134939259,40.6089157758893,40.6089191824474,40.6089248278408,40.6089293456257,40.6089321889647,40.608937271642,40.6089402312173,40.608942352142,40.6089451971564,40.6089474791202,40.6089486498546,40.6089487100349,40.6089493624486,40.6089665806442,40.6089847721669,40.6089835670704,40.6089812852762,40.6089801145407,40.6089800548615,40.6089811365003,40.6089833434013,40.6089832832215,40.6089809723412,40.6089797715119,40.6089796959487,40.6089807775852,40.6089829991976,40.6089829702797,40.6089806878119,40.6089784065199,40.6089761245555,40.6089749538154,40.6089748936331,40.6089759752677,40.6089781968803,40.6089804186581,40.6089826368763,40.6089837019572,40.6089836229969,40.608984688745,40.6089869057856,40.6089868756935,40.6089845938953,40.6089834231551,40.6089833639732,40.608982193232,40.6089799119358,40.6089787411949,40.6089809480942,40.6089854220787,40.6089887691223,40.6089909914028,40.6089935879334,40.6089980767974,40.6090040805596,40.6090085699261,40.6090111676302,40.6090133892406,40.6090161725609,40.6090212261536,40.6090274172093,40.6090324840034,40.6090358474337,40.6090380690439,40.609040283047,40.6090413421892,40.609042400832,40.6090446148313,40.609046837111,40.6090490587205,40.6090512809977,40.609054643925,40.60905914683,40.6090625393523,40.6090648211505,40.6090682136727,40.6090727165777,40.6090760806777,40.6090783017842,40.6090805233945,40.6090804944707,40.6090782120009,40.6090759307031,40.6090736494039,40.6090724779919,40.6090735596195,40.6090757818993,40.609078003004,40.6090802246115,40.6090824473927,40.6090846691674,40.6090868907746,40.6090890976685,40.609091289852,40.609094637394,40.6090997025145,40.6091058962487,40.6091109767529,40.6091138217724,40.6091161037426,40.6091172744888,40.6091173346817,40.6091162530517,40.6091140314433,40.6091140603667,40.6091163423343,40.6091197500704,40.6091242536486,40.6091276011924,40.6091339041277,40.6091342640071,40.6091342365893,40.6091325806673,40.6091319552908,40.6091296734894,40.6091273915225,40.6091251102245,40.609122828423,40.6091205476265,40.6091182663282,40.609115984359,40.6091136883473,40.6091136281527,40.6091158201642,40.6091179259026,40.6091180118413,40.6091202187345,40.6091224403396,40.6091246472325,40.6091268394135,40.6091290468064,40.6091312685795,40.6091334825791,40.6091345417137,40.6091356008497,40.6091378148455,40.6091405986653,40.6091456517498,40.609150693879,40.6091523167324,40.6091533753677,40.6091544118539,40.609156730515,40.6091601377516,40.6091624491523,40.6091647162417,40.6091680644514,40.6091725673584,40.6091759757667,40.6091782570677,40.609180538368,40.6091827895692,40.6091861382817,40.6091906418598,40.6091940484259,40.6091963007998,40.6091988968225,40.6092033856851,40.6092093894476,40.6092138634261,40.6092141798237,40.6092118760338,40.6092106834622,40.6092117414231,40.6092139554187,40.6092139264894,40.6092116445193,40.6092093627143,40.6092070814141,40.6092059099915,40.6092069916135,40.6092092138879,40.6092114349892,40.6092147984164,40.6092181613409,40.6092186079853,40.6092199297872,40.6092672764139,40.6092909802441,40.6092947761849,40.609296225314,40.6092984469161,40.6093006686833,40.609302891458,40.6093051130598,40.6093073353294,40.6093106816956,40.6093151852704,40.6093185936833,40.6093208448843,40.6093230664869,40.6093252892599,40.609327511028,40.6093297326294,40.6093319548996,40.6093341759974,40.6093363975985,40.6093386051529,40.6093396564997,40.6093395820774,40.6093417889609,40.6093462619289,40.6093496099691,40.609351127149,40.6093521506953,40.6093734099206,40.6093926955692,40.6093947211068,40.6093992097966,40.6094052130562,40.6094097019146,40.6094134265477,40.6094190406707,40.6094246695125,40.6094280336082,40.6094308167507,40.6094358688279,40.6094409197319,40.6094437057236,40.6094459273204,40.6094492748565,40.6094537483242,40.6094570958589,40.6094593176242,40.6094615403955,40.609463747275,40.6094659387681,40.609468130927,40.6094691817642,40.6094691073361,40.6094701882782,40.6094724029378,40.6094734620519,40.6094733798456,40.609473312521,40.6094743929604,40.6094777558801,40.6094822594547,40.6094856074913,40.6094877991464,40.609490006023,40.6094922276192,40.6094944503895,40.6094944197775,40.609492138468,40.6094909670345,40.6094909084925,40.6094919889293,40.6094942116978,40.6094964327909,40.6094986550544,40.6094986244439,40.6094963436375,40.6094940623253,40.609491773238,40.6094905789678,40.6094904974263,40.6094904255238,40.6094903504185,40.6094902709061,40.609491337125,40.6094935536423,40.6094957754025,40.6094979969956,40.6094979673885,40.6094956713552,40.6094933592635,40.6094910632298,40.6094887807443,40.6094864994329,40.6094853291664,40.6094864096004,40.6094886164716,40.6094885574209,40.6094862607172,40.6094839794042,40.6094816821968,40.6094816229798,40.6094838146249,40.6094860066072,40.609488214147,40.6094892950803,40.6094892353581,40.6094908785058,40.6094959310813,40.6095009737019,40.6095025960216,40.6095036551263,40.6095058691027,40.6095080913638,40.6095103129524,40.6095125347107,40.6095147563014,40.609515837903,40.6095157776748,40.6095157184525,40.6095156593963,40.6095167398257,40.6095189614156,40.6095189312988,40.6095166423723]}],[{"lng":[-73.7847854748629,-73.7847244609279,-73.7846775292334,-73.7846505400005,-73.784589502599,-73.7845188267875,-73.7845028423138,-73.7844965513595,-73.7845512669908,-73.7845818498871,-73.7845385990048,-73.7844101694645,-73.7843556902111,-73.7843462425229,-73.7843881314287,-73.7844557929835,-73.7844527373456,-73.784401449158,-73.784321206898,-73.7842957519414,-73.7842991928768,-73.7843378863217,-73.7843399851261,-73.7843734604438,-73.7844281373653,-73.7844476809789,-73.7844532624962,-73.7844608706805,-73.7843808978531,-73.7842686751004,-73.78418536377,-73.7841472094808,-73.7841523762496,-73.7841570440552,-73.7841218177159,-73.7840667058982,-73.7840544672971,-73.7839679358515,-73.7839006093885,-73.7839032727818,-73.7839075652966,-73.7838180292134,-73.7837088530103,-73.783664730795,-73.7836607050474,-73.7836600298764,-73.7836449441638,-73.7835543329955,-73.7835326045824,-73.7834459710985,-73.7833339654362,-73.7832782049081,-73.7832671796212,-73.7832255453001,-73.7831002126499,-73.7829884433586,-73.7829811856548,-73.7827563555369,-73.7825669578421,-73.782489931275,-73.7823840963144,-73.7823104265699,-73.7823071385404,-73.7822818171642,-73.7823175208933,-73.7822952747142,-73.7822117597891,-73.7821313541849,-73.7820510914975,-73.781996568771,-73.7819774464429,-73.7818909028362,-73.7818682803373,-73.7818790370823,-73.7818422212802,-73.7818100802742,-73.7817170091247,-73.7816401428138,-73.7815824002244,-73.7814957768698,-73.781476173289,-73.7814414949289,-73.7814159727366,-73.7812778553397,-73.7812202316685,-73.7812039941561,-73.7811526921111,-73.7811399071764,-73.781149685736,-73.7811593498576,-73.7811305028675,-73.7811106789466,-73.7810630097608,-73.7809859774887,-73.7808578917134,-73.7807937650353,-73.7808103408425,-73.7808041576838,-73.780765825415,-73.7807243385718,-73.7807587832983,-73.7807662193605,-73.7807535478932,-73.7807088719528,-73.7808504647604,-73.7809724937758,-73.7811490607304,-73.7811459042271,-73.7811205512035,-73.781040345156,-73.7810019908935,-73.7809218586978,-73.7808836083436,-73.7809062162165,-73.7809898005402,-73.7810572025978,-73.7811599977808,-73.7811922651317,-73.7811957666552,-73.7812216652058,-73.7812795280656,-73.7812605110188,-73.7813795993259,-73.781601368462,-73.7817783661047,-73.7819750677261,-73.7823195430791,-73.7823933773236,-73.7823902365223,-73.7826155746762,-73.7827279659439,-73.7827857060683,-73.7828790134915,-73.7829146271154,-73.7829212197201,-73.7829600531171,-73.7830245049805,-73.7831594202563,-73.7832269661074,-73.7833042980316,-73.7833557578069,-73.7834586135213,-73.7835263575679,-73.783552214374,-73.7837129934768,-73.7837605485183,-73.7838281499225,-73.7839437367008,-73.7842227194624,-73.784369636636,-73.7844743756727,-73.7845896836484,-73.7845878934896,-73.7845799363939,-73.7846408665288,-73.7847276066494,-73.7847598147519,-73.7847728543081,-73.7848563808454,-73.7849752335334,-73.7850106634997,-73.7850718538506,-73.7850912926421,-73.7850593111439,-73.7850679220691,-73.7850725159015,-73.7851628291734,-73.7852111618244,-73.7852242315045,-73.7854497395892,-73.7855108038021,-73.7855398464927,-73.785778093158,-73.7862184317922,-73.7864697280093,-73.7868244526521,-73.7868451869728,-73.7871025375844,-73.7871989741232,-73.7872151286211,-73.7871960260386,-73.787228359488,-73.7872299935147,-73.7872317891488,-73.7871998481037,-73.7872610742468,-73.7874154456816,-73.7875761083308,-73.7875957852785,-73.7876144287936,-73.7877074263747,-73.7878392581516,-73.7879132621436,-73.7879060283867,-73.7878748558184,-73.7878589433008,-73.7882414091299,-73.7882926483522,-73.7883248006772,-73.7883603051875,-73.7883701200715,-73.7885372534959,-73.7885947548343,-73.7886591062755,-73.7887140233627,-73.7887077763631,-73.7887080088047,-73.7887692642939,-73.7887951403092,-73.7887568040912,-73.7887601166097,-73.7888050709401,-73.7888404121762,-73.788866202909,-73.7889370631352,-73.7889752548654,-73.788991653735,-73.7890816016591,-73.7890978712878,-73.7891118434417,-73.7891174686825,-73.7891016246603,-73.7890343548219,-73.7890184023864,-73.7891695734102,-73.7892852802478,-73.7893880580657,-73.7893913031006,-73.7894811886813,-73.7895391374164,-73.7896065737254,-73.7896485269094,-73.7898477625204,-73.7899538936236,-73.7899861225797,-73.7899990709194,-73.7900666091606,-73.7901116708335,-73.7900957887504,-73.7900123655259,-73.7900126427264,-73.790077061333,-73.7901736401271,-73.7902894141494,-73.7902967074235,-73.7903986637015,-73.790472694918,-73.7904812468437,-73.7904825000936,-73.7904699748835,-73.7903802061457,-73.7905444442656,-73.7907159208581,-73.7907210467459,-73.7907757513973,-73.7908562132544,-73.7908659950587,-73.7908565890348,-73.7908398483957,-73.7908922590036,-73.7908891629514,-73.790876591002,-73.7909119158013,-73.7909858461103,-73.7909889207575,-73.7910472314355,-73.7911879834329,-73.7913389960443,-73.7913905875811,-73.791391922156,-73.7913972101207,-73.7914741623095,-73.7914796291137,-73.7915636938065,-73.7915989500812,-73.7915111469059,-73.7915097492739,-73.7914081310552,-73.7912860419162,-73.7911575130445,-73.7911155561006,-73.7910736003925,-73.7911728767263,-73.7912658352144,-73.7913332501362,-73.7914198089476,-73.7914741014063,-73.7914077703632,-73.7914072695204,-73.791471779852,-73.7915198548593,-73.7918041573751,-73.7919276975148,-73.7919059200445,-73.7917711712072,-73.7914478962644,-73.791167766717,-73.7909358021964,-73.7906609263916,-73.7904719121013,-73.7902400892638,-73.7900941938293,-73.7900023182117,-73.7899859970566,-73.7899266476787,-73.7898833599228,-73.7898242188424,-73.7897974341725,-73.7897486126225,-73.7896568014728,-73.7895379076984,-73.789634335072,-73.7897947034957,-73.7898908868335,-73.7900251076149,-73.7900730646336,-73.7901703233882,-73.7900618562502,-73.7899174334123,-73.7897951541918,-73.7897230709714,-73.7897586468253,-73.7895993225955,-73.7893973342634,-73.7888140990727,-73.788418086351,-73.7881589471224,-73.7878930346177,-73.7877063452841,-73.7876054615705,-73.7874184411016,-73.787202394203,-73.7870364925742,-73.7867338364509,-73.7862873019259,-73.7859199386958,-73.7856622169009,-73.7854989828955,-73.7853917032413,-73.7851492436872,-73.7850243354481,-73.7849949340066,-73.7849652270537,-73.7852133765997,-73.7855001412835,-73.7854796268355,-73.7852686051974,-73.7852870070127,-73.7856589949099,-73.7858114312901,-73.7862030532889,-73.7862594634542,-73.7861338467484,-73.7858545935028,-73.7856241513253,-73.7852691917584,-73.7852154307668,-73.7850778490225,-73.7851233143976,-73.7851752444352,-73.7851437246904,-73.7851603236813,-73.7852087026594,-73.7851833013974,-73.7851545601093,-73.7851711510989,-73.785164955724,-73.7851492078539,-73.78515920006,-73.7850632794474,-73.7848836826546,-73.7847811181678,-73.7847685601904,-73.7847753479548,-73.7847829173256,-73.7848109305889,-73.7848110647501,-73.7847854748629],"lat":[40.6179807223381,40.6179732641098,40.6179793925548,40.6179829174091,40.6179828030488,40.6179826705894,40.6179581609033,40.6179165329787,40.617884811164,40.6178550506013,40.6178284828192,40.6178062100777,40.6177644905875,40.6177057209927,40.617666630705,40.6176055572804,40.6175565909316,40.6175222226019,40.6175000401253,40.6174241035781,40.6173531179643,40.6173091254848,40.6173047976159,40.6172357523768,40.617216270744,40.6171330746209,40.6170885413766,40.6170278346271,40.6169224192516,40.6168561128373,40.6167898594225,40.616667386643,40.616635245952,40.6166062042871,40.6165718659855,40.6165437188948,40.6165374680001,40.6164736561468,40.6164319134605,40.6163691075182,40.6162679087487,40.616140444209,40.6161255503631,40.616114250908,40.6161132200621,40.6161092267339,40.6160201646863,40.6159962999243,40.6159905772501,40.6159585903622,40.6158261852177,40.6157012810989,40.6156179781034,40.6155787307233,40.6155931834459,40.6156412464225,40.6156443666929,40.6156317018091,40.6155897275691,40.6155675498869,40.6155134927298,40.6154472573654,40.6154365600827,40.615354177962,40.6152416368429,40.6151681536776,40.6151655477052,40.6151947712826,40.6151799316596,40.6151528995937,40.6151063504633,40.6150474343938,40.6150890081159,40.6151648558532,40.6151991196311,40.6152039536692,40.6151768487967,40.6151057102113,40.6150811207766,40.615046683989,40.6150103977158,40.6149462115804,40.6148923067022,40.6148871484348,40.6148813092698,40.6148796638833,40.6148501891031,40.6148305805736,40.6148047437072,40.6147792096828,40.6147595705718,40.6147624082991,40.6147692344705,40.6147495035372,40.6146244092986,40.6145875670924,40.6144309260274,40.6143574731925,40.6142913030322,40.6142079915964,40.6141778567691,40.6141713515443,40.6141174705192,40.6140268090059,40.6139511902222,40.6139636630104,40.6139982714798,40.6139811290527,40.6138758160096,40.6138134967706,40.6137850133937,40.6137310043416,40.6136403546364,40.6136036766188,40.613584251713,40.6136015170362,40.6136017127872,40.6135577097855,40.6134695879277,40.6134084363757,40.6133963062887,40.6133179335051,40.6132471667858,40.6132108684228,40.6131132842979,40.6128835426437,40.6126516344977,40.6126664622757,40.6126444243653,40.6124979686369,40.6125104213403,40.6125350113775,40.6124886747904,40.6124030607976,40.6123516653306,40.6122636096307,40.6122000831892,40.6122003377834,40.6121735365044,40.6121002424347,40.612080755244,40.6120613648656,40.6119733634341,40.6119244519809,40.6118733462053,40.6119351031009,40.6120228915473,40.6120402452889,40.6119403798368,40.6118877889444,40.6118502959485,40.6119533291071,40.6119596206711,40.6119875830082,40.6120195209082,40.6120172356189,40.6119903677552,40.6119316390938,40.6119293476902,40.6119295700882,40.6119002604086,40.6118514146972,40.6118000419531,40.6117559182239,40.6116841017204,40.6116457819184,40.6115308935416,40.6114844709926,40.6114159517456,40.6112131866441,40.611203508848,40.6111619468807,40.6109934770708,40.6109110645828,40.6106789689817,40.6107883309109,40.6107947235883,40.6106776955546,40.6106558416672,40.6106264949495,40.6105726038908,40.6105065666775,40.6104739240748,40.6104380281816,40.6103816649134,40.6103205778961,40.6102621110971,40.6102452717107,40.6102817618142,40.6103163346403,40.6103654677624,40.6103240938431,40.6102850627005,40.610276750111,40.6102409272248,40.6101943849784,40.6101265465684,40.6101756011049,40.6101658678893,40.6101120764018,40.6100557903357,40.6100242742132,40.6101247485599,40.6100905942268,40.6099927748921,40.6099364587682,40.6098630181337,40.6097921386053,40.6097358815143,40.6096697144931,40.609637895679,40.6096428745045,40.6096404921659,40.609611163085,40.6095500928708,40.6095535879678,40.609555089318,40.6095528059673,40.6094867387469,40.6094134595207,40.6093839576834,40.6093153849369,40.6092565083992,40.6092222069447,40.6091588362024,40.609137015912,40.6091300852883,40.6091298662423,40.6091471666605,40.6091056566201,40.6090710693147,40.6090495527256,40.6090229889924,40.608981566326,40.608947353045,40.6089155518,40.6088887469926,40.6088594533305,40.6088031201852,40.6087735913447,40.608685463307,40.6086292763331,40.6085609078317,40.6085170545179,40.6085162504483,40.6085050142615,40.6084561879144,40.6084092339349,40.6084023500878,40.608299510227,40.608245490173,40.6081111476531,40.6081304766208,40.608131053544,40.6080993294051,40.6080480672454,40.6080015721593,40.6079281151453,40.6078764071977,40.6078204667972,40.6077837407119,40.607695588785,40.6076981013277,40.6076810995388,40.607725169573,40.607747327334,40.6077524595802,40.607738045854,40.6076744908646,40.6076616657218,40.6076108547474,40.6076550583252,40.607661824875,40.6077658724401,40.6078095101193,40.6081545214169,40.6081555158496,40.6082277755759,40.6082373457033,40.6082518013892,40.6083153727763,40.6083789451552,40.6084745986062,40.6085359678203,40.608548330938,40.6086023437486,40.6087028115105,40.6087840471453,40.6089443404381,40.6090102191742,40.609158269911,40.6096478876416,40.6098084062042,40.6098741277825,40.6098492234131,40.6097499951293,40.609650843159,40.6096709729817,40.6096170406708,40.6096988987811,40.6096738149442,40.6097639706133,40.6098254549715,40.6098706358226,40.6098787475345,40.6099238802544,40.6098662301149,40.6098086396249,40.6098989723429,40.6099399055373,40.6100177797429,40.6102234617952,40.6106758670702,40.6109596391078,40.6111530597201,40.6113381019855,40.6115663901528,40.6117579966983,40.6119495379311,40.6119602749894,40.612014944195,40.612135571984,40.6124914898749,40.6126938844995,40.6129339408364,40.613092136666,40.6131738611963,40.6131240494955,40.6130360226386,40.6131015979319,40.6131176930418,40.6132159354358,40.613374552782,40.6135712764554,40.6137841715796,40.6139752930672,40.6139866862725,40.6140594500658,40.6146218782117,40.6154763260769,40.6155564674467,40.6157536972311,40.6160459164245,40.6164044154127,40.6166826111867,40.6170990629427,40.6171205894951,40.6173617496983,40.6179762191384,40.6182833906992,40.6187590651798,40.6191098983966,40.6194092460406,40.6197740678905,40.6198686276696,40.6199191128869,40.6200634937445,40.6199666135807,40.6198149210435,40.6196510003735,40.6194624445238,40.6192960093745,40.6192373479179,40.6191442759481,40.6190903659164,40.6189263796879,40.6188553755496,40.6187574247264,40.6186472824834,40.6185051185543,40.6184093096599,40.6183356766787,40.6182450764224,40.6181324809376,40.6181163518148,40.6180566587726,40.6180150428934,40.6179807223381]}],[{"lng":[-73.7667193111324,-73.7667082778141,-73.7682595905592,-73.7708750037695,-73.7685486812336,-73.7674592695054,-73.7667193111324],"lat":[40.6150042316476,40.614910865683,40.6154010139779,40.615863723217,40.6205596782733,40.6205113220626,40.6150042316476]}],[{"lng":[-73.8125179355306,-73.8125563103183,-73.8125988436589,-73.8126184298911,-73.8126561387765,-73.8126878128169,-73.8126802597159,-73.8126528994868,-73.8126096750109,-73.8125965045985,-73.8125912553826,-73.8125959135656,-73.8125517195803,-73.8125299105605,-73.8125210347757,-73.8125158880653,-73.8125241352705,-73.8125244895588,-73.8125482160698,-73.8125449182551,-73.8125264569317,-73.8125175055886,-73.8125179355306],"lat":[40.6201998225506,40.6201648462332,40.6202290120735,40.6202480500183,40.6203442546287,40.6204632784256,40.6205718893533,40.6206331031496,40.6206474170889,40.6206382438361,40.6206167381031,40.620565671581,40.620517654522,40.6204773873306,40.6204486930341,40.620421468856,40.6203902804997,40.6203613618562,40.6202916613341,40.6202658856135,40.6202485341641,40.6202241303332,40.6201998225506]}],[{"lng":[-73.7734733756138,-73.7736372919772,-73.7741146646997,-73.7745604951998,-73.7750332232726,-73.775118912546,-73.7751804593555,-73.7751579428594,-73.7751187772907,-73.7750646097998,-73.774953281833,-73.7750058817608,-73.7749946157902,-73.7749397682599,-73.7747664059602,-73.7748201277047,-73.7748088545659,-73.7747562573892,-73.7745828859097,-73.7746343752235,-73.7746219889329,-73.7745716255244,-73.7743982501581,-73.7744508590996,-73.7744384762708,-73.7743858730955,-73.7742147332739,-73.7742695879897,-73.7742572092837,-73.7742034742909,-73.7740289787562,-73.7740838322533,-73.7740714399195,-73.7740165901812,-73.7738454652752,-73.7738969463845,-73.7738856814622,-73.7738330834997,-73.7736608298803,-73.7737167944795,-73.7737021591347,-73.7736484359924,-73.7735006729403,-73.7734733756138],"lat":[40.6213440261014,40.6211357243606,40.6205225202132,40.6199519591277,40.6193431786951,40.6192338469849,40.6192647178849,40.6192937155651,40.6192739932893,40.6193432401132,40.6194863558229,40.6195112295071,40.6195282899229,40.6195042665682,40.6197225938911,40.6197474698574,40.6197662380351,40.6197405112075,40.6199605460269,40.619982854,40.6199990597931,40.619975898115,40.62019678671,40.6202190976318,40.6202344480069,40.6202104287941,40.6204330287883,40.6204544911436,40.620468987275,40.6204475277832,40.6206675595504,40.6206898760558,40.6207077889011,40.6206846188353,40.6209020937479,40.6209269657334,40.6209431729818,40.6209174440593,40.6211366254403,40.6211615063329,40.6211802684524,40.6211553924686,40.6213439091744,40.6213440261014]}],[{"lng":[-73.7701681485259,-73.7701882916573,-73.7702465645625,-73.7703933261692,-73.7705258776894,-73.7707109005398,-73.7708758215718,-73.7710931866691,-73.7712405584762,-73.7714053156574,-73.7714807221,-73.7715449897513,-73.7716236008474,-73.7716545462262,-73.7717100301521,-73.7717169944713,-73.7715638278995,-73.7698155809728,-73.7696148745548,-73.7696662398712,-73.7697291658997,-73.7698070996912,-73.7699127019949,-73.769988271782,-73.7701116661843,-73.7701748254663,-73.7701800461835,-73.770165345323,-73.7701234010725,-73.7701681485259],"lat":[40.6198290916268,40.6197910104191,40.619817862911,40.6198161990556,40.619824087653,40.6198492364445,40.6199010302931,40.6199777077808,40.6200409032211,40.6201403485369,40.6201990873302,40.620265993276,40.6203574531415,40.6204164268156,40.6206692634239,40.6209616793006,40.6213605272864,40.6213773515024,40.6211469686728,40.6210213130064,40.6209089786188,40.6207966740805,40.6206405844453,40.6204882465891,40.6202502292911,40.6200692750887,40.6200063839418,40.6199167670452,40.619872697168,40.6198290916268]}],[{"lng":[-73.8319099613493,-73.8319977175148,-73.8320480860324,-73.832099716663,-73.8321565524414,-73.8322794019607,-73.832353086481,-73.8325129938865,-73.83241551492,-73.8324966249311,-73.8325525717088,-73.8326048500616,-73.8326198607137,-73.8326031546145,-73.8326722665085,-73.8327507078643,-73.8327862398614,-73.8327919249027,-73.8328592868516,-73.8329173180429,-73.8329584914346,-73.833003427198,-73.8330390202953,-73.8330970533539,-73.8331140227598,-73.8331365742807,-73.833138546928,-73.8331201227558,-73.8331183776771,-73.8331054574596,-73.8331149295418,-73.8331522138069,-73.8331950762352,-73.833249236902,-73.8332343966491,-73.8331934577424,-73.8331953890101,-73.833148710972,-73.8331169306427,-73.8331000829185,-73.8330516426869,-73.8330461770943,-73.8330630717135,-73.8330818584971,-73.8330856980111,-73.8331082209013,-73.8331437736929,-73.8331979809231,-73.8332671126592,-73.8333231744311,-73.8333960679202,-73.8334614742119,-73.8335343604456,-73.8336821495258,-73.8336224200233,-73.8335279275021,-73.8333578196393,-73.8332880466661,-73.8332182584935,-73.8331373171354,-73.8330842499919,-73.8330562139958,-73.8330728267281,-73.8330281332658,-73.8330308638461,-73.8330754349327,-73.8331366717853,-73.8331393743839,-73.8331922869127,-73.8332285012333,-73.8332089406851,-73.8331475438638,-73.8330498649177,-73.8330079574517,-73.8330134609981,-73.8330413038047,-73.8330328923315,-73.8330012200066,-73.832986188142,-73.8329650019117,-73.8329473307616,-73.8329402499524,-73.8329322960159,-73.8329305094981,-73.8329234308734,-73.8328951897324,-73.832863423345,-73.832827239801,-73.8327954693871,-73.8327592922057,-73.832742538614,-73.8327381438571,-73.8327169754535,-73.8327081302848,-73.8327081055236,-73.8327133664942,-73.8327212818728,-73.8327265613823,-73.8327239014135,-73.8327071278812,-73.8326841653234,-73.832676200486,-73.8326885371397,-73.8327008774643,-73.8327087933657,-73.8327096595851,-73.83272287911,-73.8327263892688,-73.8327228433671,-73.8327228260076,-73.8327378256711,-73.8327545886175,-73.8327713438081,-73.832776649233,-73.8327669922835,-73.8327661524646,-73.8327741114718,-73.8327794273521,-73.8327521336898,-73.8327609880539,-73.8327663308619,-73.8327655011397,-73.8327787758677,-73.8327893998558,-73.8328097223935,-73.8328265010389,-73.8328432834046,-73.8328670811288,-73.8328847088169,-73.8329102603819,-73.8329340635135,-73.8329464344256,-73.832964960819,-73.8329782448908,-73.8329941443045,-73.8330196924975,-73.8330373372008,-73.8330373691255,-73.8330488715584,-73.833048903481,-73.8330471689172,-73.8330330729827,-73.8330375069083,-73.8330445879702,-73.8330631088408,-73.8330842447109,-73.8331044955543,-73.833117673092,-73.8331370840386,-73.8331679211616,-73.833187286775,-73.8331987001974,-73.8332065842354,-73.8332233093081,-73.8332135624468,-73.8332152924438,-73.8332337955417,-73.8332593471339,-73.8332506029965,-73.8332532981401,-73.8332736144731,-73.8332807072438,-73.8332816421668,-73.8332905047653,-73.8333090581644,-73.8333258041579,-73.8333293641698,-73.8333082349857,-73.8332977007447,-73.8332800889885,-73.8332660163281,-73.8332792842789,-73.8333092795984,-73.8333419181617,-73.8333578407993,-73.8333807992775,-73.8334090377053,-73.833431951782,-73.8334451358616,-73.8334706856979,-73.8334944799999,-73.8335279702595,-73.8335482228092,-73.833575506421,-73.8335592388045,-73.8334300831896,-73.8333921984621,-73.8333914777722,-73.8333848986859,-73.8333535905156,-73.8333209801931,-73.8332629080209,-73.8331937280131,-73.8331923569293,-73.8331935790455,-73.833159636043,-73.8331264014071,-73.8330996913291,-73.8329817209417,-73.8328845452644,-73.8328082289796,-73.832699954918,-73.8326626737309,-73.8326372141646,-73.8326046073307,-73.832571956956,-73.832515155977,-73.8324746575443,-73.8324119759325,-73.8323812813335,-73.8323426853898,-73.8323249611111,-73.8322843734816,-73.8322451295608,-73.8321994392546,-73.8321563904725,-73.8321120466581,-73.8320605516525,-73.8320201725087,-73.8319928483232,-73.8319616504478,-73.8319356531636,-73.8318946467137,-73.8318497436505,-73.8318152618187,-73.8317931690803,-73.8317848831953,-73.8317869251037,-73.8317818278285,-73.8318242949613,-73.8318673641987,-73.8319091371748,-73.8319099613493],"lat":[40.624175722088,40.624016898144,40.6239489199358,40.6238978329884,40.6238502300122,40.6237351695935,40.6235007655591,40.6230103043779,40.6229247963854,40.6229201880956,40.6229401809278,40.6229345681094,40.6229033003963,40.6228662982215,40.6228464875034,40.6228281133084,40.6228011418886,40.6227670164475,40.6227002693043,40.6226335085606,40.6225894792686,40.622534077691,40.6224829284876,40.6224147458358,40.6223465030488,40.6222853794672,40.6222427155261,40.6221459764323,40.6220976183097,40.6220392880466,40.6219838344308,40.6220023780619,40.6220294621975,40.6220167407115,40.6219797418342,40.6219299033554,40.6219043065433,40.6219099270877,40.6219297922908,40.6219496796677,40.6219140538006,40.6218600008178,40.621821624506,40.6217732956914,40.6217306344595,40.6216808885753,40.6216453846498,40.6216141737417,40.6215858297684,40.6215588884564,40.6215191716198,40.6214879768167,40.6214511050282,40.6213813056865,40.6226026388295,40.6225704795293,40.6225597271634,40.6226000502627,40.6226509978227,40.6226998124229,40.6227613983082,40.6228740029617,40.6229675158341,40.6230227328365,40.6230673600074,40.6231077689103,40.6231991907918,40.6232650688104,40.6233246088581,40.6233565108468,40.6233862465173,40.6234180755614,40.6234690023022,40.623526345598,40.6235837257548,40.6236198718843,40.6236538660529,40.623688656373,40.6237128496862,40.6237195574266,40.6237363535086,40.6237524848097,40.6237625641953,40.6237793729704,40.6237934862188,40.6237968279192,40.6237954587646,40.6237981201254,40.623800113924,40.6237987421787,40.6237886437821,40.6237745208891,40.6237677818915,40.6237832386521,40.6238020651942,40.6238276191849,40.6238484686341,40.6238605754304,40.6238706586509,40.6238753530342,40.6238907998031,40.6239082752269,40.6239203879401,40.6239318275257,40.623951331383,40.6239647800316,40.6239775641418,40.6239930313413,40.6240044586983,40.6240185790251,40.6240199348827,40.6240226375565,40.6240307178985,40.6240246799955,40.6240085458023,40.6239917513028,40.623981687349,40.6239709480937,40.6239574742377,40.623942038261,40.6239205515553,40.6238997278295,40.6238795954063,40.6238614748356,40.6238426970797,40.6238313025326,40.6238178934518,40.6238199420848,40.6238213116281,40.6238267219264,40.6238260852304,40.6238146842605,40.6238093373506,40.6237851761796,40.6237724359101,40.6237791900971,40.623773842565,40.6237610804168,40.623744303843,40.6237315416949,40.6237201208993,40.6237167413035,40.6237060007552,40.6236945915894,40.6236912605325,40.6237000230024,40.6237101279339,40.6237282830866,40.6237215941851,40.6237283560156,40.6237398035658,40.6237586274382,40.6237787901069,40.6237888899021,40.6238083550332,40.6238217916963,40.623825848449,40.6238312598424,40.6238023636465,40.6237822163256,40.6237661244718,40.6237500141089,40.6237285209867,40.623709727029,40.6236936321099,40.6236949996371,40.6236815718175,40.6236701217341,40.6236526418925,40.6236445565315,40.6236317739281,40.6236136566438,40.6236049678553,40.6235962833935,40.6235748119963,40.6235593959122,40.6235480178882,40.6235507377532,40.6235662062148,40.6235722883451,40.6235756812641,40.6235790883861,40.623588521283,40.6235979172793,40.6239360345,40.6239752703739,40.6240045221686,40.6240323379795,40.6240561708414,40.6240625828698,40.6240684962781,40.6240892746268,40.6241199714691,40.6241467927202,40.6241795777466,40.6241969146553,40.6241914026279,40.6241839128337,40.6241733096453,40.6241890640873,40.6242058412263,40.6242280367781,40.6242766620999,40.6242905322944,40.6242944587781,40.6243162669024,40.6243499622077,40.6243811966188,40.6244203470955,40.6244416606229,40.6244947546031,40.6245434071605,40.6246104059728,40.6246615112425,40.6246837976262,40.6246921794211,40.624697578465,40.6246945224102,40.6246790656582,40.6246561757772,40.6246188762497,40.6245875448314,40.6245616540804,40.6245302949966,40.6245019314821,40.6244735860844,40.6243985680315,40.6243642972601,40.6243171007269,40.6242804051448,40.6242640762618,40.6242437715112,40.624175722088]}],[{"lng":[-73.8122341921654,-73.8122468687948,-73.8122690544799,-73.8123253065864,-73.8123291937485,-73.8123177396165,-73.8123088633672,-73.8122840952387,-73.8122436891669,-73.8122505778737,-73.8122758093185,-73.8123352352649,-73.8124385746238,-73.8124400510686,-73.812437895435,-73.8124198898849,-73.8123829489562,-73.8123353179843,-73.8123179819093,-73.8123146688412,-73.812294798347,-73.8122784542789,-73.8122674219611,-73.8122388682573,-73.8122165228713,-73.8122058150837,-73.8121993891422,-73.8121601773099,-73.8121160632373,-73.8121045238735,-73.8120738859506,-73.8120223813664,-73.812003834514,-73.8119916433773,-73.8119387429676,-73.8119269875686,-73.8118636692195,-73.8117973170439,-73.8117578406179,-73.8117508599302,-73.8117502053064,-73.8117345710745,-73.8117339783489,-73.8117335484606,-73.8117296129317,-73.8117238141483,-73.8117195678984,-73.8117088904763,-73.8117068278298,-73.8116999960766,-73.811695583117,-73.8116913655518,-73.8116807817771,-73.811695838035,-73.811720043672,-73.8118094933803,-73.8119314585368,-73.8119600294984,-73.8120142543803,-73.812039528205,-73.8120834413368,-73.8121428649396,-73.8122025006023,-73.8122526694397,-73.8123120081663,-73.812380224777,-73.8124464561012,-73.8124614014527,-73.8124916110395,-73.8125114825042,-73.8125157998231,-73.8125299114561,-73.8128545365516,-73.8128822197189,-73.8129922808296,-73.81299674151,-73.8130126517747,-73.8130371944915,-73.8130375978332,-73.8130435011207,-73.813250953106,-73.8130124292926,-73.8130124124673,-73.8130124121808,-73.8130125162088,-73.8130319049184,-73.8130367324283,-73.8133072886587,-73.8136944378738,-73.8137304094008,-73.8137402816472,-73.8137476759827,-73.8137453460214,-73.8137336893922,-73.8137315699441,-73.8137290279267,-73.8137285104463,-73.8139968299479,-73.8138619876158,-73.813920723347,-73.8139727020187,-73.8140103707743,-73.8141192086406,-73.814197231454,-73.814275592523,-73.8143417361907,-73.8143949076987,-73.8144291002877,-73.8144614760826,-73.8144670634335,-73.8144682039114,-73.8144690790101,-73.8144710286969,-73.8144716134872,-73.8144741371586,-73.8144749940891,-73.8144756096801,-73.8144761617777,-73.8144787077427,-73.8144748534598,-73.8144691674935,-73.8144469633901,-73.8144418129835,-73.8144377653487,-73.8144356631156,-73.8143846732879,-73.8143748449195,-73.814361966603,-73.8143434894106,-73.8143031740943,-73.8141993999917,-73.8141903080392,-73.8141670398003,-73.8141585664167,-73.8141280694099,-73.8140831192668,-73.8140690389077,-73.8140493608202,-73.8140315096806,-73.8139630793254,-73.8139541539677,-73.8139464173803,-73.8139303521273,-73.8139125994896,-73.8138919125869,-73.8138736663039,-73.8138583383954,-73.8138463302036,-73.8138379561495,-73.8138334354989,-73.8138328866227,-73.8137625849609,-73.8136893561986,-73.8136139486235,-73.8135371327898,-73.8135369237287,-73.8134987505919,-73.8134972893993,-73.8134746424626,-73.8134443384847,-73.8134159758566,-73.8133991379374,-73.8133819504199,-73.8133693089456,-73.8133635602673,-73.8133518463418,-73.813342768497,-73.8133403683551,-73.8133330999199,-73.8133071717734,-73.8132830473069,-73.8132040739386,-73.8131813854487,-73.8131798724314,-73.8131429125829,-73.8131289658863,-73.8131133184131,-73.8130563338969,-73.8130508921345,-73.8130446485341,-73.8130339637076,-73.8129687207595,-73.8129627399254,-73.8129380730635,-73.8129291598846,-73.8129128796617,-73.8129023025672,-73.8128915709941,-73.8128729666731,-73.8128512312955,-73.8128294265957,-73.8128212646962,-73.8127934534126,-73.8127765135138,-73.8127606398957,-73.8127518053459,-73.8127390677736,-73.812701314413,-73.8126311935017,-73.8126179277311,-73.8126149315965,-73.812610459024,-73.812604508036,-73.8126000361224,-73.8125970207729,-73.812591831952,-73.8125727003303,-73.8125606983347,-73.8125555751433,-73.8125453243527,-73.8125460091303,-73.8125463662321,-73.8125473585922,-73.8125491979522,-73.8125499852729,-73.8125498540441,-73.8125500745298,-73.8125506908293,-73.8125543665181,-73.8125563167205,-73.8125667309294,-73.812569282444,-73.8125716443747,-73.8125714515361,-73.8125708150853,-73.8125683174142,-73.8125613912453,-73.8125563686399,-73.8125470510686,-73.8125367346004,-73.8125164005707,-73.812491495812,-73.8124714416557,-73.8124692455921,-73.8124665056738,-73.8124650562193,-73.8124632464048,-73.8124630517856,-73.8124640171069,-73.8124653059255,-73.8124685328079,-73.8124651341084,-73.8124298292708,-73.812423891477,-73.8123958980296,-73.8123874160978,-73.8123811638024,-73.8123598587377,-73.8123173637047,-73.8123045717844,-73.8122559619415,-73.812246828312,-73.8122285626043,-73.8122255676712,-73.8121633850272,-73.8121602818292,-73.8121525219688,-73.8121478668408,-73.8121199336892,-73.8121153689204,-73.8121141675038,-73.8120651593907,-73.8120551067404,-73.8120402161043,-73.8120286889857,-73.8120134597921,-73.8119975179794,-73.8119909788115,-73.8119875201315,-73.8119884942342,-73.8119887368115,-73.8119915918875,-73.8119911109123,-73.8119901813581,-73.8119878182086,-73.8119868596631,-73.8120068938838,-73.8120371114333,-73.81207979907,-73.812093027227,-73.8121466191684,-73.8122194441926,-73.8122341921654],"lat":[40.6253000883674,40.625114303895,40.6249214675631,40.6247480498527,40.6247051868417,40.6246454815455,40.6246167877478,40.6246022322528,40.6245875156833,40.6245518335178,40.6245401753252,40.6245407861563,40.624534698254,40.6244512907701,40.6243964477736,40.6243533592284,40.6243196108561,40.624242833599,40.6242203589113,40.6242166244722,40.6241942213667,40.6241705229847,40.6241545270487,40.6241283339826,40.6241078349778,40.6240866118198,40.6240738769843,40.6240496274156,40.624022346089,40.6240160663319,40.6239993904974,40.6239713587527,40.6239612632763,40.623954628453,40.6239375000307,40.6239336939724,40.6239206552808,40.6239120916515,40.6238880375207,40.6238816591463,40.6238810608331,40.6238667776661,40.6238518741428,40.6238410545759,40.6238271308171,40.6238066105632,40.6237960559757,40.6237695204718,40.6237643947232,40.6237445886281,40.6237317939023,40.623719569933,40.6236496436997,40.6236340345441,40.6236023766738,40.623558630503,40.6234950383496,40.6234714973194,40.6234124669816,40.6233984258076,40.6233917284133,40.6233923393417,40.6233810349094,40.6233743997706,40.6233797776818,40.6234138481891,40.6234752064134,40.6234890529521,40.6235170393846,40.6235354482303,40.6235394483276,40.6231339533592,40.6225438980176,40.6224935792976,40.6222935221981,40.6222854151803,40.6222602279241,40.6222871065113,40.6222876166234,40.6222951008714,40.622558092075,40.62356434768,40.6236624121613,40.6236632992275,40.6236634454821,40.623856768422,40.6238583989598,40.6242337729692,40.6246072350109,40.6246623862464,40.6246775222445,40.6246888591908,40.6246953101446,40.6247275650692,40.6247334295094,40.6247404663035,40.6247446848528,40.6249991726204,40.6250438994207,40.6251005230045,40.6251356071318,40.6251610316456,40.6251979012285,40.6252082374106,40.6251995076012,40.6251739682446,40.6251745146354,40.6251867825342,40.625267066811,40.6253256332728,40.6253375811094,40.6253467572517,40.6253718895926,40.6253794315227,40.6254119598582,40.6254230057631,40.625430936913,40.6254380589625,40.6254708743109,40.6254792924585,40.6254917095847,40.6255401956995,40.6255514431629,40.6255602826677,40.6255648712466,40.6256455397924,40.6256610880452,40.6256685110708,40.6256791595375,40.6257023933657,40.6257204704563,40.6257231072451,40.6257298530567,40.6257323102465,40.6257411518806,40.6257541844967,40.6257582673613,40.6257639727361,40.6257705456804,40.6257957425815,40.6257990289638,40.625801877673,40.6258077935946,40.6258171980886,40.6258274485063,40.6258401068484,40.625854841674,40.6258712671721,40.6258889532635,40.6259074368615,40.6259262339977,40.6259510354226,40.6259703024192,40.6259838381071,40.6259915041714,40.6259918040444,40.6259990038416,40.6259992797371,40.6260035518446,40.6260100435129,40.6260161195012,40.6260197262142,40.6260234087504,40.6260261154357,40.6260281586698,40.6260323200061,40.626035545783,40.6260363982949,40.6260389796763,40.6260481903738,40.6260567593429,40.6260931083352,40.6261016028877,40.6261021680176,40.6261160048248,40.6261212258165,40.6261270836679,40.6261592028427,40.6261622708331,40.6261657900152,40.6261703805268,40.6261984119208,40.6262009823062,40.6262107558597,40.6262142876124,40.6262207382975,40.6262239133515,40.6262271325484,40.6262327153304,40.6262392378767,40.6262457805769,40.6262478340952,40.6262548330752,40.6262590960773,40.6262630897515,40.6262648441351,40.6262673726787,40.6262748665737,40.6263044471795,40.6263100441491,40.6263122652246,40.6263144713288,40.6263166619559,40.6263188680608,40.62632221557,40.6263290789869,40.626354385566,40.6263702633353,40.6263814707188,40.6264038873206,40.6264158376155,40.6264220935657,40.6264237981166,40.6264287021786,40.6264328739309,40.6264398278486,40.6264465008908,40.6264494827404,40.6264567695466,40.6264598649777,40.6264734484603,40.6264777383486,40.6264848643624,40.6264876066664,40.6264892162532,40.6264922171503,40.6264968358594,40.6264991568274,40.6265027587559,40.6265067477224,40.6265178227473,40.6265406753139,40.6265287483762,40.6265277796592,40.6265256710249,40.6265237983661,40.6265194141938,40.6265161371753,40.62651330064,40.6265116179025,40.6265091331815,40.6265089118602,40.6264995406555,40.6264960115174,40.6264793724226,40.6264743318719,40.6264676243594,40.6264447704552,40.6264240635205,40.626416190215,40.626386272243,40.6263734160566,40.6263477031816,40.6263442557353,40.6262727137305,40.6262691426366,40.6262602142283,40.6262548587591,40.6262227187324,40.6262161972396,40.6262144809512,40.6261444567911,40.6261279320429,40.6261034554906,40.6260845051888,40.6260594702074,40.6260364680293,40.6260270333226,40.6260220436765,40.626006962124,40.6260031966345,40.6259590260632,40.6259522725145,40.6259392074119,40.6259060046446,40.6258925382623,40.6257696842538,40.6256532032783,40.6255392333322,40.6254988499532,40.6254755667229,40.6254262617648,40.6253000883674]}],[{"lng":[-73.7988198157662,-73.7987893966972,-73.7987248838813,-73.7987129420507,-73.7987010002177,-73.798677115009,-73.7986726612627,-73.7986667505547,-73.7986623595506,-73.7986594849556,-73.7986565893715,-73.7986566309027,-73.7986596453695,-73.7986612242942,-73.7986613254879,-73.7986628637604,-73.798665879102,-73.7986659597491,-73.798663065705,-73.7986601508962,-73.7986572418394,-73.7986558447587,-73.798655953677,-73.7986545557135,-73.7986516473109,-73.7986487333849,-73.7986458290703,-73.7986024179852,-73.7985937723556,-73.7985678418563,-73.7985591977821,-73.7985520881802,-73.7985443796513,-73.7985408354459,-73.7985375042137,-73.7985279141559,-73.79849077032,-73.7984841160112,-73.7984762665579,-73.7984712684814,-73.7984407518037,-73.7984201278321,-73.7983999681144,-73.7983850547764,-73.7983672758279,-73.7983422760774,-73.7983245236675,-73.7983079082663,-73.7982459203961,-73.7982343234093,-73.7981851860113,-73.7981614451311,-73.7981412218776,-73.7981263185745,-73.7980698451124,-73.7980475422077,-73.7980367585536,-73.7979980685025,-73.7979468898433,-73.797935269544,-73.7978675535371,-73.7978186646067,-73.7978010952924,-73.7978157330801,-73.7978280381095,-73.7978584181345,-73.7978674446949,-73.7979652912656,-73.7979689781353,-73.7980095379033,-73.7980829357629,-73.7980930019126,-73.7981716447902,-73.7981813226561,-73.7982087784823,-73.7982116538885,-73.7982145485313,-73.7982174624077,-73.7982203778212,-73.7985413979685,-73.7985436878421,-73.7985433033587,-73.7985429617349,-73.7985427488386,-73.7985459145846,-73.7985488686378,-73.7985537432857,-73.7985565911701,-73.798567904918,-73.7985679829168,-73.798574914403,-73.798585070447,-73.7985923087302,-73.7985992595657,-73.7986081266989,-73.7986172280406,-73.7986324946242,-73.798662032667,-73.7986965280999,-73.7987137743009,-73.7987256138541,-73.7987296364931,-73.7987548251918,-73.7987595279295,-73.7987753899579,-73.7987830418362,-73.7988576087725,-73.7988673292286,-73.7989515678361,-73.7989580932104,-73.798960994647,-73.7989683646959,-73.7990297316143,-73.7990364176843,-73.7990752790559,-73.7991006711687,-73.7991131069279,-73.7991331428799,-73.7991711429613,-73.7992665180005,-73.7992709992113,-73.799419608464,-73.7994242579251,-73.7995026650745,-73.7995116464149,-73.7997227376964,-73.7999384595531,-73.7999470201592,-73.800128600721,-73.8001344388712,-73.8001569297018,-73.8001599250588,-73.8001818905816,-73.8002003649179,-73.8002527854925,-73.8002917277012,-73.800325762201,-73.8003726525518,-73.8003923305967,-73.8003626914821,-73.8002789905428,-73.8002346046984,-73.8001556913516,-73.8000389882086,-73.7998002232343,-73.7996586692875,-73.7995269251847,-73.7994030701545,-73.7993860973364,-73.7992270150986,-73.7992149342776,-73.7991032241697,-73.7989626576248,-73.7988578604736,-73.7987764112656,-73.7986993181502,-73.7986570926195,-73.798671622946,-73.798677169956,-73.79873436864,-73.7988286188867,-73.7988974422292,-73.7989617840008,-73.7997491410325,-73.7997827834102,-73.7997822127553,-73.7997761059276,-73.7997718514853,-73.7997699191992,-73.7997685056876,-73.79976668411,-73.7997651516107,-73.799762028777,-73.7997598758549,-73.7997589775021,-73.7997584333126,-73.7997578048787,-73.799753127323,-73.7997563650689,-73.7997658033487,-73.7997717130913,-73.7997760495783,-73.799779880058,-73.7997851298372,-73.7997899096246,-73.7997941566007,-73.7998051544892,-73.799823877979,-73.7998363667178,-73.7998851003863,-73.7999145519983,-73.7999301904776,-73.7999335161088,-73.799942682231,-73.799958596133,-73.7999595335745,-73.7999629231813,-73.7999657113381,-73.7999734346375,-73.8000431740878,-73.8000545405403,-73.8001364298768,-73.8001391652877,-73.8001627399737,-73.8002119387542,-73.800227525895,-73.8003355569709,-73.8003986164605,-73.8004526787374,-73.8005564784145,-73.8007408255081,-73.8009019578677,-73.8011217454249,-73.8012738294876,-73.8013009297271,-73.8013100924504,-73.8013248054033,-73.8013277000116,-73.8013290814871,-73.8013306009375,-73.8013319795796,-73.8013378538078,-73.801348105844,-73.8013518564778,-73.8013635995144,-73.8013643520319,-73.8013651777488,-73.8013734236241,-73.8013766742848,-73.8013839505213,-73.8014081499134,-73.8014160418769,-73.8014464672866,-73.8014720841858,-73.8014815018087,-73.8014994080861,-73.8015352401922,-73.8015457324851,-73.8015574278114,-73.8015630599804,-73.8016537681934,-73.8017170701776,-73.8017265961262,-73.8017285145121,-73.80175263132,-73.8018135594461,-73.801866324688,-73.8018951984921,-73.8020641985362,-73.8020636353883,-73.8020649558242,-73.8020661913321,-73.8020679534173,-73.8020702873402,-73.802070716437,-73.8020746740361,-73.8020733134026,-73.8020700725046,-73.8020670565101,-73.8019894537716,-73.801984738033,-73.8019245641137,-73.8019095720896,-73.8018700168048,-73.8018603114492,-73.801837810718,-73.8018355951876,-73.8018283777841,-73.8018231118073,-73.8018168901401,-73.8018070312224,-73.8017896081147,-73.8017869114038,-73.8017698783069,-73.8017584666912,-73.8017531518389,-73.8017372616619,-73.8017349318128,-73.8017160588646,-73.8016808526197,-73.8016526891044,-73.8016099046588,-73.8016078068972,-73.8015875597546,-73.8015847305629,-73.8015826759323,-73.8015804831526,-73.8015196268165,-73.80151779606,-73.8015080968707,-73.8015076997429,-73.8014836699482,-73.801478303427,-73.8014757503995,-73.8014752793191,-73.801457781055,-73.801451143083,-73.801466475473,-73.8014697273449,-73.8014577285232,-73.8014210525689,-73.8013808017219,-73.8013510551647,-73.8013704403518,-73.8013163734467,-73.8013104490546,-73.8013262099852,-73.8013418304725,-73.801462163892,-73.8014930044463,-73.8015013275632,-73.8015071828647,-73.8015081368044,-73.8015064863809,-73.8015022746651,-73.8014965399556,-73.8014888986048,-73.8014881829178,-73.8014879128731,-73.8014926995208,-73.8014956145021,-73.8015040446065,-73.8015072020523,-73.8015073223904,-73.8015074226767,-73.8015109250349,-73.8015110444941,-73.8015341937724,-73.8015357820698,-73.8015510158117,-73.8015528723599,-73.8015596243317,-73.8015945075254,-73.8015984119068,-73.8016288890194,-73.801649823639,-73.801716602535,-73.8017197132417,-73.8018254771108,-73.8018345134178,-73.8018363419295,-73.8018690983381,-73.8018709370706,-73.8018779004215,-73.8018809712489,-73.801891264064,-73.8018983898891,-73.8019057531365,-73.8019060922542,-73.8019336044894,-73.8019471727734,-73.8019557396833,-73.8019672958646,-73.8020688988855,-73.8020804128019,-73.8021322274154,-73.8021554583714,-73.8021635095729,-73.8021669640586,-73.8021826910005,-73.8022109247146,-73.8022867621231,-73.8024033950663,-73.8024226089439,-73.8024889495178,-73.8026730315717,-73.8034741130816,-73.8036209232682,-73.8037988920715,-73.8040801719613,-73.8045178847388,-73.804535171958,-73.8044787116839,-73.8044813392726,-73.8044812583677,-73.8044826770091,-73.8044855907984,-73.80448850591,-73.804491400793,-73.8044942747918,-73.8044971496689,-73.8045000252081,-73.8045029189944,-73.8045403361942,-73.8045454645956,-73.8045579076586,-73.8045666396765,-73.8045738079988,-73.8045755736907,-73.8045748879728,-73.8045740682154,-73.8045742513335,-73.8045715605705,-73.8045693187452,-73.8045579568418,-73.804556407947,-73.8045608312461,-73.8045709621464,-73.8045769898448,-73.8045776207282,-73.8045811003699,-73.8045889902308,-73.8045994601301,-73.8046058936979,-73.8046077534896,-73.8046107936353,-73.804616960244,-73.8046164950264,-73.8046123128912,-73.8046085992465,-73.8046083646046,-73.804609714412,-73.8046150451828,-73.8046197268145,-73.8046207024892,-73.8046203751487,-73.8046167302523,-73.8046163183979,-73.804630010929,-73.8046338309407,-73.8046529281669,-73.8046563341666,-73.8046686364703,-73.804675916544,-73.8047378649808,-73.8047449240722,-73.804762316509,-73.8047786252227,-73.8047913048648,-73.8048010961516,-73.8048052925441,-73.8048076801906,-73.8048105748986,-73.8048178513296,-73.8048188172143,-73.8048244006866,-73.8048248670404,-73.8048188683378,-73.8048115978474,-73.8048110671555,-73.8048058790588,-73.804797946587,-73.8047969552637,-73.8047946362157,-73.8048329292158,-73.8048337432441,-73.8049256253514,-73.8049404925278,-73.8049757154478,-73.804981551342,-73.8050026647463,-73.805016029361,-73.8050395283566,-73.8050490343725,-73.8050822538644,-73.8050950700709,-73.8051191280238,-73.8051282591082,-73.8051436761769,-73.805147637242,-73.8051529707656,-73.8051554812954,-73.8051532228989,-73.80515459099,-73.8051641732507,-73.8051646930397,-73.8051652115282,-73.8051985684995,-73.8052024614326,-73.8052034051539,-73.8052068628751,-73.8052154967045,-73.805200728463,-73.8052565974391,-73.8053065423379,-73.8053134676039,-73.8053138200994,-73.8053140757825,-73.8053143347617,-73.8053360378548,-73.8053418250699,-73.8053663408828,-73.8053762822316,-73.8053862235859,-73.8053890972689,-73.8053919927056,-73.8053956479201,-73.8054022759,-73.8054104025627,-73.8054170496542,-73.8054214631085,-73.8054243778772,-73.8054272924258,-73.8054294947378,-73.8054302071963,-73.8054331210893,-73.805436037178,-73.8054389526085,-73.8054433447545,-73.8054492144937,-73.8054536066403,-73.805456520533,-73.8054594366245,-73.8054623520533,-73.8054667442043,-73.805492893181,-73.8055144581299,-73.8055234037143,-73.8055355009781,-73.8055642321304,-73.805567948856,-73.8055797600861,-73.8055857336324,-73.8056001865143,-73.8056333883365,-73.8056540223689,-73.8056660429603,-73.80567365523,-73.8056787300083,-73.8056842305757,-73.8056989008201,-73.8057088543134,-73.805726983809,-73.8057376810064,-73.8057421830823,-73.8057490916147,-73.8057930460386,-73.8057987593697,-73.8058060971103,-73.8058205395956,-73.8058277421887,-73.8058303572398,-73.8058319600758,-73.8058528815819,-73.8058481490115,-73.8058479322441,-73.8058611047331,-73.805873483192,-73.8058844736813,-73.8058896633606,-73.8058888332899,-73.8058868438707,-73.8058821582536,-73.8058987061726,-73.8059014632438,-73.8059040919861,-73.8059003585435,-73.8058993234687,-73.8058974751224,-73.8058943907889,-73.8058910791679,-73.8058894794617,-73.8058851828986,-73.8058176838534,-73.8057219311672,-73.805661238353,-73.8056429305347,-73.8064092786662,-73.8061672281016,-73.8061693347909,-73.8061800781626,-73.806182602277,-73.8061836023836,-73.8061838908815,-73.8061966469872,-73.8061992797887,-73.8062008990257,-73.8062078653004,-73.8062234581819,-73.8062263730857,-73.8062292871068,-73.8062322026706,-73.8062351166954,-73.8062380329158,-73.8062409482619,-73.8062286054392,-73.8062255899818,-73.8062255113884,-73.8062284063162,-73.8062313203431,-73.8062342359078,-73.8062371512523,-73.8062400661592,-73.8062429801868,-73.8062458957503,-73.8062488097799,-73.8062517047083,-73.8062545805387,-73.8062560074109,-73.8062595653594,-73.8062666518375,-73.80626745864,-73.8062662352512,-73.8062603307578,-73.8062628156183,-73.8062642022733,-73.8062655893718,-73.8062684940648,-73.806268454333,-73.8062654388769,-73.8062653580861,-73.8062682536793,-73.8062711685892,-73.8062740635235,-73.8062769393599,-73.8062791023245,-73.8062837015331,-73.8062881790355,-73.806289829389,-73.8062902420901,-73.8062848380021,-73.8062853236255,-73.8062881981482,-73.8062910930821,-73.8062910526898,-73.8062880578689,-73.8062850615089,-73.8062820666858,-73.8062790718611,-73.8062760768214,-73.8062730826574,-73.8062700865163,-73.8062685487096,-73.8062684679204,-73.8062669307765,-73.8062639359518,-73.8062609395864,-73.8062579352184,-73.8062563665638,-73.8062562577885,-73.8062561474691,-73.8062545701454,-73.8062515333866,-73.8062480067859,-73.8062420553337,-73.8062341767769,-73.8062282472777,-73.8062247582164,-73.806220304832,-73.8062143944329,-73.8062099425867,-73.8062054694447,-73.8061995186466,-73.8061935678499,-73.8061876170509,-73.8061846031221,-73.8061815876553,-73.8061756765952,-73.8061712842449,-73.8061683295928,-73.8061653334432,-73.8061608813773,-73.8061534935403,-73.8061527784739,-73.806409505884,-73.8060420033794,-73.8059717869416,-73.8059498164644,-73.805416493441,-73.8050183412367,-73.8048499133249,-73.8048608171464,-73.8048679127841,-73.8048752603957,-73.8048766587504,-73.8048736218056,-73.8048741218014,-73.8048747474385,-73.8048761151921,-73.8048684879927,-73.8048553340717,-73.8048543060409,-73.8048418837385,-73.8048167782302,-73.804806992715,-73.8047918531946,-73.8047795405569,-73.8047565918652,-73.8047308335699,-73.8047256815149,-73.8046931377865,-73.8046867397724,-73.8046812324832,-73.8046752827724,-73.8046603866242,-73.8046617966583,-73.8046624933521,-73.8046634601467,-73.8046717250279,-73.8046677856425,-73.8046910365829,-73.8047054010912,-73.8046991888925,-73.804684263148,-73.8046753066876,-73.8046612822755,-73.804651262888,-73.8046475309275,-73.8046408598229,-73.8046327338825,-73.804626083446,-73.8046216703404,-73.8046180184008,-73.8046113886291,-73.8046047601762,-73.8045996285583,-73.804593757756,-73.8045893650983,-73.8045864488237,-73.8045820572657,-73.804574689632,-73.8045673006745,-73.804562888233,-73.8045600151929,-73.8045195705295,-73.8044827160522,-73.8044549929951,-73.8044470724022,-73.8044362285158,-73.8044351546345,-73.8044309458361,-73.8044274751909,-73.8044175077855,-73.8044162157764,-73.8044140233184,-73.804405529751,-73.804388543046,-73.8043884523427,-73.8043883414063,-73.804388229599,-73.8043881413112,-73.8043889545158,-73.8043873717348,-73.8043430711846,-73.804292366971,-73.8042815354702,-73.8042017508556,-73.8041268794535,-73.8041269674033,-73.8041254927509,-73.8041217861352,-73.8041172847633,-73.8041139622514,-73.8041068749559,-73.8041046814412,-73.8040839727033,-73.8040800275648,-73.8040622607737,-73.8040575220641,-73.8040543511106,-73.803835342779,-73.8038218286153,-73.8037817721307,-73.8037703436843,-73.8037474859091,-73.8037160347547,-73.8037130397205,-73.8037015828809,-73.803688711472,-73.8036786722709,-73.8036743156094,-73.8036576236202,-73.8036600152697,-73.8036633444765,-73.8036583876887,-73.8036568196491,-73.8036537730174,-73.803647813845,-73.8036433388866,-73.8036403451642,-73.8036366102733,-73.8036299412862,-73.8036232736195,-73.8036195380696,-73.8036165421479,-73.8036135464437,-73.8036105513976,-73.8036075563561,-73.8036045597721,-73.8036000870093,-73.8035941352112,-73.803588186266,-73.8035822344656,-73.8035777617017,-73.8035747666565,-73.8035710330808,-73.8035643632117,-73.8035576950997,-73.8035539586665,-73.8035510041084,-73.8035480884964,-73.8035451874143,-73.8035438106924,-73.803543945143,-73.8035425668844,-73.8035396849417,-73.8035368107011,-73.8035339155568,-73.8035333945611,-73.8035316858988,-73.803523229059,-73.8035091723073,-73.8034996874446,-73.8034938323924,-73.8034839177675,-73.8034810331942,-73.8034730330508,-73.8034519357207,-73.8034325927445,-73.8034258354107,-73.8034207586937,-73.8034127081476,-73.8034055659674,-73.8033951749134,-73.8033867203549,-73.8033674175039,-73.8033621521542,-73.8033530421233,-73.8033507833046,-73.8033466569457,-73.8033362214788,-73.8033209926154,-73.8033141418617,-73.8032741266833,-73.8032429639651,-73.8032347754564,-73.8032112373767,-73.8031973000875,-73.8031690833452,-73.8031335399693,-73.8031051837641,-73.8031007501679,-73.803084529126,-73.8030805765122,-73.8030730538283,-73.8030680712763,-73.8030577297828,-73.8030494100194,-73.8030333531416,-73.8030183289898,-73.8030165132377,-73.803013455384,-73.8030055845666,-73.8030007740564,-73.802994410539,-73.8029906350618,-73.8029832318838,-73.8029701879052,-73.80294573123,-73.8019662963145,-73.8016274197228,-73.7995644190667,-73.7992307740578,-73.799060218574,-73.7988455133661,-73.7983165607971,-73.7975919035937,-73.7989766379127,-73.7988665481387,-73.7988198157662],"lat":[40.625327944831,40.6253258522646,40.6253465756092,40.6253532081219,40.6253598406334,40.6253731044771,40.6253741852824,40.6253741233326,40.6253718253519,40.6253672903296,40.625363882239,40.6253616310551,40.625358283741,40.6253526700915,40.6253470407868,40.6253436783227,40.6253403321828,40.6253358286379,40.6253324205502,40.6253301378868,40.6253274791306,40.6253229592603,40.6253169560441,40.6253124373451,40.6253097807677,40.6253074974355,40.6253046520596,40.6252529649813,40.6252404880124,40.6252030589558,40.6251905808143,40.6251749811097,40.6251580679318,40.6251502917192,40.6251429809407,40.6251219405669,40.6250964060118,40.625091833032,40.6250836622786,40.6250784602813,40.6250466983734,40.6250252335597,40.6250042493598,40.6249887359749,40.6249702405691,40.6249442325499,40.6249257668366,40.6249110733589,40.6248562591201,40.6248460034066,40.6248240964873,40.6248135115295,40.6248044956226,40.6247964578749,40.6247660012408,40.6247539733434,40.6247504833635,40.6247379611042,40.6247213958489,40.6247100755837,40.624644104518,40.6245792402174,40.624512319111,40.6244531544549,40.6244262561677,40.6243804034134,40.624371488807,40.6243544903996,40.6243549048122,40.6243594561464,40.624387245486,40.6243928455719,40.6244365891569,40.6244419727757,40.6244572446805,40.6244617792135,40.624465187314,40.6244674699874,40.6244697533335,40.6246994317097,40.624736615636,40.6247580074306,40.6247771462005,40.6247889666848,40.6248022921404,40.6248147289853,40.624835251137,40.6248412682459,40.6248651777268,40.6248653420421,40.6248799910413,40.6249014512262,40.6249117793472,40.6249216953451,40.624934347435,40.6249416666438,40.6249539451268,40.6249776982142,40.6250321094329,40.6250593141978,40.6250646335382,40.6250664405138,40.6250777581476,40.6250764933254,40.6250722271499,40.6250701687096,40.625032658744,40.6250277503932,40.6249852144917,40.6249825975379,40.6249814344308,40.6249784785343,40.6249538705838,40.6249511890727,40.62494737032,40.6249448762928,40.6249436546217,40.6249416859812,40.6249379519688,40.6248939008902,40.6248912775016,40.6248042814927,40.6248010529412,40.6247465896108,40.6247401555687,40.6245889754488,40.6244493335279,40.6244437923201,40.6242985904774,40.6242939218727,40.6242759375134,40.6242737172628,40.6242574293909,40.6242437331546,40.6242048656738,40.6241759926651,40.6241475404968,40.6241083417001,40.6240079667618,40.6239350985786,40.623968430889,40.6240013385889,40.6240410388704,40.624094646648,40.6241517532554,40.6241955678422,40.6242156507624,40.6242185556219,40.6242189530376,40.6241934643686,40.6240847129886,40.6240311777198,40.6239516451345,40.6238638057088,40.6237448457906,40.6236648228652,40.6236038478772,40.6235353088248,40.6234349544876,40.6233032286062,40.6231777279195,40.6230568279278,40.6229230064046,40.6210540101885,40.6207395812584,40.6207340506274,40.6206749060286,40.6206336974863,40.6206149894828,40.6206012965325,40.6205836486791,40.6205687982296,40.6205288417605,40.620501307095,40.6204898043137,40.6204828550911,40.6204748194622,40.6204149665236,40.6203973412198,40.6203459727594,40.6203138134199,40.6202902114134,40.6202683320662,40.6202383504614,40.6202110578873,40.6201868013548,40.6201531730989,40.6200959256158,40.6200577424873,40.6199939097348,40.6199553322757,40.6199348498944,40.6199268293564,40.6199047265907,40.6198663567504,40.6198640917111,40.6198559230202,40.6198491953743,40.6198305750386,40.6197322069299,40.6197221900234,40.6196500333379,40.619647622657,40.6196268498078,40.6195971444351,40.6195877332611,40.619583358455,40.6195554111709,40.6195059197222,40.6194736288348,40.6194850776527,40.6195701738741,40.6196987813657,40.6198339474555,40.6198886542301,40.619915400026,40.6199583442654,40.6199617516191,40.6199671794407,40.6199731563264,40.6199785759342,40.6200016675928,40.6200419690524,40.620056714085,40.6201028821449,40.6201083675144,40.620114374529,40.6201744746414,40.6201981695606,40.6202134492379,40.6202642616143,40.620280834506,40.62034472072,40.6203624222069,40.6203689298926,40.6203813041985,40.6204060648978,40.6204133155827,40.620428638561,40.6204360158832,40.6205698330984,40.6206662062631,40.6206869690087,40.6206911498258,40.6207437093137,40.6208312368076,40.620852945228,40.6208438937966,40.6207909137965,40.6207891638219,40.620774646171,40.6207610390627,40.6207416440566,40.6207159522768,40.620711230367,40.620667664005,40.6206551822437,40.6206254350348,40.6205977689257,40.6203920196406,40.6203849035881,40.6202940722961,40.6202714440912,40.6202117363592,40.6201958706971,40.6201590816974,40.6201554614249,40.6201436594493,40.6201350521014,40.6201248800582,40.6201087609899,40.6200802777868,40.620073520369,40.6200308347074,40.6200022362182,40.6199889207088,40.6199491014276,40.6199432625339,40.6198959668042,40.6197986342468,40.6197207683289,40.6196160232408,40.6196108846819,40.6195613165364,40.6195543201557,40.6195492436566,40.6195438243217,40.6193933910928,40.6193849700902,40.619340409664,40.6193385847524,40.6192281733192,40.6192035141342,40.619191786699,40.6191896202349,40.619109218363,40.6190910814068,40.6190536106541,40.6190116949245,40.6189829685682,40.6189349168012,40.6188067425056,40.6187379597182,40.6186865067852,40.6186114803648,40.6185428737644,40.6185010867078,40.6184687343187,40.6184548273654,40.618409384538,40.6183637073159,40.6183160979052,40.6182627170243,40.6182150304891,40.6181320149812,40.6180984169695,40.6180536163338,40.6180336070781,40.6180260156934,40.6180044086635,40.6179912551112,40.6179532014909,40.6179389476896,40.6179321929499,40.6179265624646,40.6177306633064,40.6177239080625,40.6176689707892,40.617662724187,40.6176028468782,40.6175955521732,40.6175690156331,40.6174762038161,40.6174658193842,40.6173868382043,40.6173355706663,40.617219311327,40.6172106256088,40.616915277632,40.6168862690972,40.6168804033635,40.6167752641699,40.6167693600891,40.6167564198993,40.6167507121083,40.6167315849359,40.616718343137,40.6167046598046,40.6167040284686,40.6166528997007,40.6166262842469,40.616609479904,40.6165868108192,40.6164284637355,40.616411498771,40.6163852647647,40.6163454617619,40.616315036887,40.6162616812353,40.6162218016508,40.6161820516406,40.6161389811579,40.6159132803466,40.6158181396449,40.6157463683382,40.6156862166278,40.6144009639249,40.6160205656298,40.6163122563968,40.6165688977942,40.6169682648099,40.6169840372666,40.6175534157655,40.6175565091391,40.6175610126906,40.6175644055606,40.6175666880767,40.6175689695898,40.6175723780377,40.6175769119116,40.6175814462894,40.6175859799983,40.6175893879415,40.6176210804227,40.6176213883499,40.6176232535005,40.6176263919291,40.6176337042031,40.6176403594565,40.6176479465284,40.6176496529281,40.6176498087066,40.6176651365772,40.6176779092171,40.6176935560636,40.6177095682218,40.6177233344173,40.6177406016257,40.6177504113292,40.6177588510177,40.6177661828198,40.6177726025508,40.6177795888949,40.6177885659962,40.6177987522556,40.6178130764833,40.6178325163372,40.6178366525139,40.6178423365418,40.6178490000718,40.6178524010194,40.6178554297297,40.6178606643628,40.6178658725955,40.617869034023,40.617872783944,40.6178805960041,40.6178809972067,40.6179206416492,40.6179274382694,40.6179614166732,40.6179668741979,40.6179865868258,40.6179982508552,40.6180876642648,40.6180985204233,40.6181252661878,40.6181431729414,40.618157095213,40.6181880687312,40.6182013436705,40.6182332747781,40.6182366832174,40.6182452499506,40.6182460503701,40.6182520967663,40.6182544860226,40.6182608218454,40.6182680415706,40.6182689337679,40.6182806019145,40.6182942135982,40.6182959471828,40.6183018297199,40.6183919351733,40.6184205368124,40.6185875946118,40.6185976432816,40.6186214499777,40.6186253943024,40.6186396645753,40.6186486979722,40.6186613276501,40.618666437498,40.6186842911302,40.6186911803865,40.6187055961872,40.6187044128273,40.6187067852081,40.618708675956,40.6187137584517,40.6187226355577,40.6187305669196,40.6187347276491,40.6187426460767,40.6187430032924,40.6187435047485,40.618771075778,40.6187814735431,40.6187839966248,40.6187932315019,40.6188162931282,40.6188865196444,40.6189146870096,40.6189315307303,40.6189575022859,40.6189714986098,40.618981601558,40.6189918559581,40.6190178612499,40.6190247962054,40.6190588325794,40.6190814561399,40.6191040802019,40.6191086150572,40.61911202298,40.6191143129262,40.6191155070701,40.6191155916915,40.6191156600704,40.619116831869,40.6191191143624,40.6191213970229,40.6191231206055,40.6191236790136,40.6191259605001,40.6191282429955,40.619130524987,40.6191328227126,40.619135136676,40.6191374344012,40.6191397163897,40.6191419983819,40.6191442815456,40.6191465780976,40.6191717949512,40.6191925881406,40.6192012152819,40.6192103490014,40.6192320415386,40.6192385035636,40.6192590403413,40.6192694241885,40.6192875912075,40.6192997402786,40.6193072905252,40.6193237422803,40.6193444289246,40.619358219127,40.6193811722219,40.6193978717045,40.6194092036186,40.619428534127,40.6194501658191,40.6194592724415,40.6194732419799,40.6194945291291,40.619497569552,40.6194977736012,40.61950216984,40.6195079450111,40.6195126754273,40.6195201269862,40.6195368122131,40.6195536539739,40.6195658197472,40.6195753998704,40.6195832122232,40.6195917885096,40.6196000343492,40.6196045344576,40.6196064052477,40.6196080858626,40.6196191127675,40.6196342067792,40.619648597789,40.6196709253077,40.619677122476,40.6196881665666,40.6197013122346,40.619715425335,40.6197222407378,40.6197318880239,40.6197929154887,40.6198300616252,40.6198656633672,40.6198917596018,40.6211130716888,40.6213737945839,40.6213800112908,40.6214117175494,40.6214348515542,40.6214440286462,40.6214466652042,40.6214772011449,40.6214835016651,40.6214873795123,40.6215110996505,40.6215484201085,40.6215507020784,40.6215529852194,40.6215552671903,40.6215575491585,40.621559832303,40.6215621137707,40.621591263483,40.6215946114969,40.6215991150514,40.6216025229512,40.6216048049195,40.6216070873929,40.6216093700333,40.6216116520029,40.6216139339709,40.6216162171141,40.6216184985794,40.6216219069812,40.6216264413143,40.6216284984645,40.6216313305104,40.6216414493207,40.6216464807438,40.6216514298395,40.6216595641526,40.6216619970108,40.6216670783297,40.6216721584766,40.6216750065094,40.6216772571969,40.6216806040391,40.6216851080924,40.6216885159923,40.6216907984636,40.6216942063622,40.6216987401922,40.6217018613875,40.6217039408034,40.6217074260864,40.621709979834,40.6217157309685,40.6217251529175,40.6217258531701,40.6217303858249,40.6217337947282,40.6217360459173,40.6217382669987,40.6217404879098,40.6217427094937,40.6217449315801,40.6217471519907,40.6217493735754,40.6217515944866,40.6217549570537,40.6217594606044,40.6217628219999,40.6217650435832,40.6217672656665,40.6217700481213,40.621775099833,40.6217812913605,40.6217874845607,40.6217930988207,40.6217975715901,40.6218020396807,40.6218042293083,40.6218041485151,40.621805213388,40.6218074286089,40.6218085090368,40.621808447475,40.6218095280726,40.6218117339276,40.6218139247268,40.6218161148555,40.6218183056541,40.6218216529992,40.6218249998391,40.6218249382742,40.6218226412474,40.6218226109688,40.6218248325474,40.6218259124726,40.6218258358519,40.6218259361688,40.6223395565286,40.623171620843,40.6233305974222,40.6233803389465,40.6237918619331,40.6237538015464,40.6237935810327,40.6238078527535,40.6238079262805,40.623810254842,40.6238147729635,40.6238192461982,40.6238244314038,40.6238309376225,40.6238451712098,40.6238586049912,40.6238571729064,40.6238574462442,40.623857931263,40.6238551889102,40.6238525543183,40.6238484767528,40.6238464235494,40.6238349255846,40.6238290288708,40.6238278497612,40.6238306077961,40.6238321192641,40.6238341453868,40.6238363366114,40.6238429389226,40.6238539793113,40.623858436938,40.6238636113781,40.6238700811563,40.623925218022,40.6239474157667,40.6239706501595,40.6239874772907,40.6239957675782,40.6240007418822,40.6240137343983,40.6240230145712,40.6240252276559,40.6240262856585,40.624026200985,40.6240261320533,40.624024960226,40.6240226704298,40.6240214760716,40.6240202818828,40.6240179756662,40.6240156628322,40.6240133650749,40.6240110830618,40.6240087853062,40.6240075838281,40.6240075076065,40.6240063351079,40.6240048316756,40.6240381516388,40.6240269007012,40.6240344955597,40.6240366658296,40.6240465297606,40.6240542704608,40.6240603616972,40.624062384236,40.6240647162057,40.6240647332736,40.6240667283339,40.6240733957837,40.6240867323575,40.6240917986195,40.6240979918157,40.6241041821624,40.6241092494337,40.624146418163,40.6241714518628,40.6242332129914,40.6242587740594,40.6242860635404,40.6243184997074,40.6243684526606,40.6243689017885,40.6243725641435,40.6243778909509,40.6243810179192,40.6243821529641,40.6243828873979,40.6243827635419,40.6243953197436,40.6243977108651,40.6244126385931,40.6244166203907,40.624432860287,40.6245378442051,40.6245391732729,40.6245477658349,40.624553278141,40.6245643017431,40.6245876233909,40.624589844237,40.6245968573813,40.6246047365801,40.6246108843419,40.6246150336352,40.6246309348049,40.6246469712604,40.62466927943,40.6246709179437,40.6246759694523,40.6246810036931,40.6246837580813,40.6246859638334,40.6246881848474,40.6246903983968,40.6246914558418,40.6246925127861,40.6246947258312,40.6246969466734,40.6246991681859,40.624701390202,40.6247036105428,40.6247058320536,40.6247080378077,40.6247102272974,40.6247124184671,40.6247146084588,40.6247168142121,40.6247190352221,40.6247212487716,40.6247223057088,40.6247233631511,40.6247255761926,40.6247255453446,40.624723263809,40.6247202290873,40.6247145856936,40.6247070789427,40.6247014348763,40.6246972765691,40.6246927426748,40.6246893347079,40.6246889265542,40.6246893111292,40.6246927068999,40.6247013228564,40.6247046833625,40.6247060496067,40.6247075126121,40.6247076839221,40.6247081587616,40.6247080481447,40.6247083888316,40.6247101021578,40.6247131148653,40.6247194295127,40.624721912311,40.6247229886745,40.6247229192664,40.6247211318883,40.6247201818714,40.6247212428315,40.6247181313023,40.6247173881212,40.6247147330268,40.6247096747347,40.6247066030949,40.6246985143394,40.6246784370904,40.6246777715552,40.6246758559461,40.6246764563023,40.6246776711662,40.6246818070802,40.6246972780843,40.6246972326296,40.6246970642901,40.6246992880029,40.6247022564661,40.6247036044147,40.624705022257,40.6247051726857,40.6247042860878,40.6247035538763,40.6247040903765,40.6247075462891,40.624714263621,40.6247171407325,40.6247186927075,40.6247182607138,40.6247158996038,40.6247099529168,40.6247180043329,40.625227814323,40.6255961902316,40.626120235048,40.6263173469786,40.6265805259218,40.6265363687405,40.626181851214,40.6261014226995,40.6253375624135,40.6253311583878,40.625327944831]}],[{"lng":[-73.785363207581,-73.7849799610084,-73.784878887409,-73.7813619589162,-73.7841948329788,-73.7842632690792,-73.7843383029745,-73.7844193633205,-73.7845058328913,-73.7845970532773,-73.7846923298988,-73.7847728622127,-73.7848486090085,-73.7849190031256,-73.7853149276639,-73.78584280107,-73.7864483193084,-73.7867560813542,-73.7869014098451,-73.7867499475051,-73.7864647586121,-73.7864464450241,-73.7860828694664,-73.7860741943184,-73.7860658698523,-73.785894423243,-73.7857517207639,-73.785559997454,-73.7854746395223,-73.7857173544918,-73.7858524578362,-73.786140785236,-73.7865153354535,-73.7871680339463,-73.7876766269252,-73.7880219876485,-73.7882619467143,-73.7884826135045,-73.7886553151572,-73.7887994848893,-73.7892604064447,-73.7897979615201,-73.7899707321737,-73.790200776761,-73.7903546445938,-73.7904321742188,-73.7904909642324,-73.7906737085925,-73.7907428393901,-73.7907442823333,-73.7906309241883,-73.7912629805581,-73.79163665158,-73.7920489018327,-73.7924996611883,-73.7927974263321,-73.7929803167553,-73.7930483602257,-73.7928294998398,-73.792417449561,-73.7927494862633,-73.792920727321,-73.7929260604449,-73.7929336167664,-73.7929965663598,-73.7930574754366,-73.7931140851038,-73.7932116183028,-73.7932724972324,-73.7932854153553,-73.7932948291804,-73.7933075422929,-73.7934005185141,-73.7935193811179,-73.7935579122277,-73.7936510409549,-73.7937279348292,-73.7937278062446,-73.7937758068837,-73.7938143292343,-73.7938527911191,-73.7939489361698,-73.7939423901411,-73.7938813226546,-73.7938799776454,-73.7938394441154,-73.7938456491542,-73.7938968839496,-73.7939771424012,-73.7940635912879,-73.7941544822746,-73.7941855761566,-73.7942466746913,-73.7943365175403,-73.7944327005328,-73.794541665147,-73.7945447865624,-73.7944670069628,-73.7944611650664,-73.7944674687868,-73.7945251063292,-73.7945217821378,-73.7945536921461,-73.7946760057186,-73.794678680564,-73.7947587210392,-73.7948099509313,-73.7947832517034,-73.7947616920489,-73.7947615716317,-73.794806338752,-73.7948737276432,-73.7949475245913,-73.7950565509741,-73.7950855014361,-73.7951400671816,-73.7952396526014,-73.7952973602529,-73.7953744143885,-73.7955574786516,-73.7956602693908,-73.7957917895717,-73.7960323297315,-73.7962442225572,-73.7963789333768,-73.7965520935236,-73.7967991943689,-73.796895560959,-73.7969244192897,-73.7969178822804,-73.79691732271,-73.796914528677,-73.796965819257,-73.7970107765337,-73.797119991983,-73.7971624469129,-73.7972227823352,-73.79731593658,-73.7973673172267,-73.7973704548094,-73.7973638566323,-73.7973573982985,-73.7974567619571,-73.797527504764,-73.7977106464951,-73.7979418447844,-73.798083159448,-73.7982470203558,-73.7983634556353,-73.7983786924035,-73.7983906171319,-73.7985070549989,-73.7984844212728,-73.7984874499731,-73.7985258411968,-73.7986413933354,-73.7987635384671,-73.7988695794995,-73.7989852939449,-73.799039827924,-73.7991294687579,-73.799125969565,-73.7991255423271,-73.7991123901811,-73.7991731805965,-73.7993209441868,-73.7993788393439,-73.7993823595355,-73.7993918417739,-73.7994497292638,-73.7996105031141,-73.799706856492,-73.7997262371791,-73.7997808699546,-73.7998838165807,-73.7998839413328,-73.8000159585107,-73.8000770350037,-73.8001734011713,-73.8002570007024,-73.8003050235409,-73.8003434961505,-73.8003981046409,-73.800436695706,-73.8004947240393,-73.8005266899619,-73.8005395167722,-73.8005714929456,-73.8005714472353,-73.800571383249,-73.8005616295976,-73.8006033005496,-73.8006546021935,-73.8006994711898,-73.8007411201218,-73.8008012591963,-73.800737754748,-73.8007119835992,-73.8006797737325,-73.8006219231277,-73.8005608836139,-73.8004774226873,-73.8004195001909,-73.800351970019,-73.8002394891915,-73.8001994472001,-73.8001943345343,-73.8002134613916,-73.8001908002015,-73.8000713448239,-73.8000712568441,-73.8000583048417,-73.8000454334216,-73.7999906707152,-73.8000162583542,-73.8000605820703,-73.8000707436309,-73.8000899291909,-73.8000897899015,-73.8000767792092,-73.800068488315,-73.8000573663307,-73.8000155029863,-73.8000121376653,-73.8000087203396,-73.7999924386555,-73.7999343527161,-73.799870039477,-73.7997800736902,-73.7997222005773,-73.7996867102728,-73.799603190612,-73.799542126579,-73.799479021908,-73.7994681113871,-73.7993748959442,-73.7993169407748,-73.7993038784767,-73.7993517832537,-73.7993920014626,-73.7994223226329,-73.799471574033,-73.7995379448826,-73.7995925248692,-73.7996502507532,-73.7996595570501,-73.799685101531,-73.7996367993324,-73.7995990326458,-73.7995176703321,-73.7994751083205,-73.799506989338,-73.7994779974583,-73.7994425953046,-73.7995067834673,-73.7995131121903,-73.7995102137435,-73.7995065334814,-73.7995026610984,-73.7994614868959,-73.7994581712256,-73.7994768899999,-73.7994996087411,-73.7994576270069,-73.7994403285964,-73.7993674150581,-73.799376838763,-73.7993915994728,-73.7994022436694,-73.7992958159236,-73.7992852448007,-73.7991703110054,-73.799121895715,-73.7990959459049,-73.7990636461913,-73.7990462009094,-73.7990299158934,-73.7990152254082,-73.7990025211972,-73.7990020509173,-73.7990062323278,-73.7990149819702,-73.7990259291251,-73.7990399167358,-73.7990567414784,-73.7990549295291,-73.7990489771707,-73.7990390350686,-73.7990253548791,-73.7990082828797,-73.7989718744833,-73.7989388123595,-73.7989100123454,-73.7989024492685,-73.7988821565946,-73.7988615312915,-73.7988411335632,-73.7988215174324,-73.7988032156936,-73.7987867254413,-73.7987724945687,-73.798760909602,-73.7987522852032,-73.7987468556221,-73.7987447683342,-73.7987596034448,-73.7987733773527,-73.7987246333844,-73.7986799465238,-73.7986405493917,-73.7986075287031,-73.7985817952926,-73.7985640589902,-73.7985546896173,-73.7985446566274,-73.7985342139979,-73.7985236260775,-73.7985131608913,-73.7985030833588,-73.7984936485851,-73.7984850954053,-73.7984776403369,-73.7984714720989,-73.7984667468357,-73.7984635464294,-73.7984620426427,-73.7984622747704,-73.7984642367459,-73.7984678773013,-73.7984411026855,-73.7984092142302,-73.7983729306479,-73.7983330697082,-73.7982905298045,-73.7982462697079,-73.7982074088251,-73.7981686623893,-73.7981630061175,-73.7981294853532,-73.7981023185961,-73.7980829110916,-73.7980702377123,-73.7980645605952,-73.7980659971733,-73.7980837150869,-73.7981019597317,-73.7981202325046,-73.7981380340335,-73.7981548778247,-73.7981703035578,-73.7981838896666,-73.7981952648578,-73.7982041182605,-73.7982102079204,-73.7982133674123,-73.7982135103895,-73.7982109934522,-73.7981997721981,-73.7981800633439,-73.7981522475437,-73.7981168620377,-73.7980745902768,-73.7980772606589,-73.7980779220855,-73.7980765578981,-73.7980732024523,-73.7980679402536,-73.7980609038284,-73.7980522703868,-73.7980422573597,-73.797996005607,-73.7978958598792,-73.7977991154676,-73.7977062365273,-73.79761766867,-73.7975500607796,-73.7974865779025,-73.7974228477564,-73.7973861607783,-73.7973522035017,-73.7973219532894,-73.7972962808087,-73.7972759249726,-73.7972614716719,-73.7972533369118,-73.7972517548365,-73.797256770991,-73.7972682410066,-73.7972858347583,-73.7973034490624,-73.7973214090535,-73.7973392809023,-73.7973566329083,-73.7973730459283,-73.7973881234997,-73.7974015014187,-73.7974128565358,-73.7974219145633,-73.7974287328036,-73.7974325761392,-73.7974333415385,-73.7974216409284,-73.7974030478434,-73.7973782829107,-73.7973884678413,-73.7973974440677,-73.797405005675,-73.7974109791993,-73.7974156789969,-73.7974179973926,-73.797417865287,-73.7974152866165,-73.7974103382352,-73.7974031676248,-73.7973939884989,-73.7973830744344,-73.7973743778026,-73.7973650912734,-73.7973025665809,-73.7972348170957,-73.7971622569712,-73.79714541725,-73.7971331735342,-73.7971619489449,-73.797195040226,-73.7972323081246,-73.7972385924013,-73.797243335581,-73.797246858221,-73.7972479822611,-73.7972466788611,-73.7972429814604,-73.7972369849204,-73.7972288430903,-73.797220824485,-73.7972087620982,-73.7971953419212,-73.7971809300662,-73.7971659196997,-73.7971507203152,-73.7971357465626,-73.7971115205478,-73.7970829894867,-73.7970507658212,-73.7970155412593,-73.7969780719281,-73.7969518296935,-73.7969250570034,-73.7968984887845,-73.7968728543502,-73.7968488573807,-73.7968271566057,-73.7968152892506,-73.796804886242,-73.7967962433993,-73.7967896064901,-73.7967851642427,-73.7967830429772,-73.7967833030151,-73.7967859369631,-73.7967908699233,-73.7967979616229,-73.7968071180709,-73.7968153609292,-73.7968224659631,-73.7968282398905,-73.7968325256403,-73.796835206624,-73.7968362099093,-73.7968355082026,-73.7968331205922,-73.7968113042191,-73.7967964533369,-73.796789005692,-73.7967891808194,-73.7967943202308,-73.7968036640707,-73.7968150682218,-73.796835512781,-73.7968553018503,-73.796879317585,-73.7969009816489,-73.7969250248242,-73.7969763966506,-73.7969891279853,-73.7970049966818,-73.7970048477886,-73.7969727004397,-73.796898811059,-73.7968570552419,-73.7968217469163,-73.7967889295846,-73.7967607374129,-73.7967093220995,-73.7966546491373,-73.7966095900419,-73.7965581525134,-73.7965131693017,-73.7965002358277,-73.7964552451265,-73.7964103073449,-73.7963556790424,-73.7963362531319,-73.7963295678748,-73.7963519209302,-73.7963421563258,-73.7962938552165,-73.7963130043824,-73.7962872133894,-73.7962325623863,-73.7962260323648,-73.7962837319506,-73.7962836273539,-73.7962191517374,-73.796200077669,-73.7961878406154,-73.796182668224,-73.7961846567244,-73.7961937691392,-73.7962098359701,-73.7962325583496,-73.7962503880361,-73.7962919725533,-73.7962339362778,-73.7961534037414,-73.7961243484337,-73.7961531271284,-73.7961883089091,-73.7961592093666,-73.7960271851914,-73.7959703456468,-73.7959693271902,-73.7959242981344,-73.7959305290349,-73.7955953430841,-73.7955595766074,-73.7955768073314,-73.7955241564327,-73.7954750789817,-73.7954959990951,-73.7955148071642,-73.7955328199416,-73.7955468406825,-73.7955457564101,-73.7955435485394,-73.7955402726017,-73.7955316735389,-73.7955212896427,-73.7955093869275,-73.7954962703178,-73.7954501690334,-73.7954045014509,-73.7953603959942,-73.795318942489,-73.795281165234,-73.7952479976923,-73.7952202594253,-73.7952037246208,-73.7951598925857,-73.7951206161494,-73.7950866674996,-73.7950587140814,-73.795037305475,-73.7950228625906,-73.7950156693915,-73.7950152182058,-73.795019424652,-73.795041213477,-73.7950691725628,-73.7951026724656,-73.7951409589967,-73.7951831702013,-73.7952018935665,-73.7952168000418,-73.7952275494936,-73.7952338966411,-73.7951680194709,-73.7950974175047,-73.7950229389193,-73.7949454784681,-73.7948946713092,-73.7948813347087,-73.7948657680025,-73.7948483673651,-73.7948295756453,-73.7948098710948,-73.7947897551986,-73.7947697399094,-73.7947503346203,-73.7947320331988,-73.7947153014194,-73.7947005651076,-73.7946973381314,-73.7946913345487,-73.7946827246322,-73.7946717525748,-73.7946587295622,-73.7946440249486,-73.7946280557809,-73.7946112749699,-73.7945941584458,-73.7945729161008,-73.794553901725,-73.7945355209769,-73.794518195792,-73.7945023238741,-73.7944882695681,-73.7944763554948,-73.7944668551467,-73.7944605430756,-73.7944496992821,-73.7944362661674,-73.7944446771231,-73.794458961007,-73.7944787248361,-73.7945034248573,-73.7945323815073,-73.7945647981083,-73.794599782788,-73.7946243378347,-73.7946467227992,-73.794666286345,-73.7946824592295,-73.794694770867,-73.7947028630221,-73.7947065002332,-73.7947062719799,-73.7947025845429,-73.7946952145054,-73.7946953719163,-73.7946872070622,-73.7946708446447,-73.794646534587,-73.7946146482169,-73.7945756725959,-73.79453020308,-73.7944789342251,-73.794422649179,-73.7943622077163,-73.7942289526855,-73.794093975279,-73.7939577745772,-73.7938208541836,-73.7936837203645,-73.7935468801746,-73.7934108395829,-73.7928947407442,-73.7926070334482,-73.7922656807014,-73.7918812355272,-73.7916219707411,-73.791428026323,-73.7907581879362,-73.7906127572341,-73.7905017674769,-73.790335055409,-73.790212419652,-73.7901074357171,-73.7900850050578,-73.7899240008694,-73.7898513194859,-73.7897260245712,-73.7895581435555,-73.7894000604213,-73.7892410490038,-73.7891627044642,-73.7890216243097,-73.7889742857903,-73.7888237975357,-73.7884302820751,-73.7882285621159,-73.7859405825424,-73.785363207581],"lat":[40.6267066568383,40.6265449862134,40.626631470708,40.6248427461149,40.6208926699104,40.6208327232292,40.6207775508047,40.6207275727345,40.620683169564,40.6206446793896,40.6206123952836,40.6205728728768,40.620528193475,40.6204786916246,40.6206060416205,40.6204608892352,40.6200236047402,40.6197392092106,40.6192718405877,40.6186577855906,40.6178827294198,40.617612342422,40.6173632334751,40.6170782504161,40.6166836654385,40.6163253105314,40.6159743167282,40.6159593448057,40.6156669114498,40.6147320878222,40.6144619860241,40.6142506245977,40.6140613421616,40.6138433471735,40.6137127645967,40.6136549469795,40.6135750143371,40.6135315795014,40.6134953628571,40.6133860250833,40.6131676656969,40.6129713651808,40.6129132266386,40.6129355672985,40.6127897109659,40.6125268058819,40.6121250356309,40.6119426970137,40.6112998206803,40.6108394914684,40.6102985780806,40.6105335469828,40.6106145998981,40.6106226537735,40.6105796272856,40.6104048001658,40.6101713103913,40.6098718525961,40.6093380581437,40.608703007815,40.6086463663756,40.6086751632376,40.6086760605845,40.6086815840743,40.6087275955094,40.60876687408,40.6087714714751,40.6087793917097,40.6088284618733,40.6088568071342,40.6088774621856,40.6089215489804,40.6089780214493,40.6089733393267,40.6089783042522,40.6089858154717,40.6090496021197,40.6090912180471,40.6091500560877,40.6091574691865,40.6091844663565,40.6092556320388,40.6092947880179,40.6093069192295,40.6093081744611,40.6093460125063,40.6094170157455,40.6094685167183,40.6094833485812,40.6095740803058,40.6095924833882,40.6095987785364,40.6095768559606,40.6096088411472,40.6096677651118,40.6097487449797,40.6097781265106,40.6098098661272,40.6098122496764,40.6098514293303,40.609910285456,40.609946999452,40.610015601327,40.6101068540381,40.6101088487307,40.6101946729311,40.6102486212541,40.6102621170021,40.6102730148281,40.6103121829926,40.6103783599787,40.6104005122237,40.6104275714058,40.6104889661943,40.61048901781,40.6104891150753,40.6104868452531,40.6105236679764,40.6105360453802,40.6105461635652,40.6105463463493,40.6106053324849,40.6107281607596,40.6107652565077,40.6108315922813,40.6109298196763,40.6110085928584,40.6110087631795,40.6110259510864,40.6110626589664,40.6110704268188,40.6111091659043,40.6111435291774,40.6111485042926,40.6111486971155,40.6111487720429,40.6111488785,40.6111490428011,40.6111540289357,40.6111785153703,40.6112131447972,40.6112470371732,40.6113182043963,40.6112938493014,40.6112794826154,40.6113068174434,40.6113144109321,40.6113024584647,40.6113113215346,40.6113124812637,40.611316368591,40.611354322496,40.6114032429464,40.6114644490875,40.6115159242869,40.6115455038856,40.6115187896244,40.6115067345241,40.6114824572167,40.6115070323024,40.6116075581896,40.6117030250592,40.6118450089806,40.6119453551913,40.6120262464293,40.612026504502,40.612002125168,40.6119882129715,40.611950738792,40.6119288078507,40.6118752314094,40.6118802955618,40.6118687907458,40.6118363605969,40.6117851308024,40.6117435148795,40.6116384804078,40.6116238986845,40.6116240662551,40.6115972828882,40.6116512231716,40.6116757697324,40.6116758645741,40.6116612436111,40.6116431814795,40.6116442640803,40.6116516303245,40.6117006459329,40.6117159469816,40.6117373656687,40.6117765176159,40.611805965852,40.6118378792173,40.6118722296805,40.611909021813,40.6119339039791,40.6119604238741,40.6119848595922,40.6120141796827,40.6120238717785,40.6120262141596,40.6120064846307,40.6120406567291,40.6120650198518,40.6120819601693,40.6121361613781,40.6121430825109,40.6121920758801,40.6122507890396,40.6124513190348,40.6124806953234,40.6125149449468,40.6125261038017,40.6125735798283,40.6126103447749,40.612644276885,40.6126520556926,40.6126814649996,40.612727977609,40.6127818113137,40.6128016626921,40.6128282898961,40.6128624897227,40.6129138917587,40.6129824306168,40.6130558428011,40.6131438700305,40.6131657906972,40.6131729780091,40.6131900134304,40.613241360148,40.6132412145707,40.6132508998514,40.613288359582,40.6132948358289,40.6133142573519,40.613358220089,40.6134291898563,40.6135222986828,40.613547492586,40.6135664856972,40.6135696995689,40.6135740313792,40.6135839183065,40.6136158433132,40.613726020465,40.6137774740431,40.6138165575487,40.6138452072465,40.6139069265845,40.6141736865428,40.6142545266434,40.6142814047375,40.6143033749251,40.6143230710796,40.6143549069956,40.6143775564295,40.6144063034051,40.6144084008193,40.6144307045472,40.6144649720811,40.6145136617886,40.6145727563453,40.6146461241159,40.614662993624,40.6147340956659,40.6148051041742,40.6148620197119,40.614903069235,40.6150424203089,40.6150485880389,40.6151156421085,40.6151914462843,40.6152746331858,40.6153333297646,40.615337673281,40.6153441225448,40.6153525055768,40.615362598831,40.6153877264695,40.6154126538314,40.6154368833503,40.6154566395184,40.6154752481398,40.6154924387166,40.6155124434482,40.6155319760103,40.6155505419854,40.6155676714223,40.6155829307318,40.6155698729977,40.6155523944439,40.6155309792369,40.6155239931009,40.6155211711933,40.6155209274844,40.6155232685935,40.6155281309335,40.6155353824384,40.61554482615,40.6155562055673,40.6155692116133,40.6155834910302,40.6155986559735,40.6156142945467,40.6156658091465,40.6157147126174,40.6157302972448,40.6157518147499,40.6157786716065,40.61581012701,40.6158453133113,40.6158832599487,40.6158870182721,40.6158895966468,40.6158909298032,40.6158909839932,40.6158897578452,40.6158872823982,40.6158836203164,40.6158788643029,40.6158731347528,40.6158665767055,40.6158593561735,40.61585152959,40.6158434123161,40.6158352164613,40.6158271561888,40.6158194421186,40.6157918751293,40.6157676732519,40.6157473819528,40.6157314585607,40.6157202619592,40.615714044499,40.6157127929233,40.6157153860376,40.6157160902836,40.615746335047,40.6157800792529,40.6158147877386,40.6158512587211,40.6158887378644,40.6159264499792,40.6159228937534,40.6159216105106,40.6159226353205,40.6159259401761,40.61593143476,40.6159389689119,40.6159483367328,40.6159592822116,40.6159715062216,40.6159846746953,40.6159984277537,40.616012389542,40.6160603661031,40.6161076134253,40.6161532189414,40.616196301794,40.6162360298485,40.6162716357655,40.6162811509419,40.6162908682173,40.6163005428652,40.6163099312317,40.6163187968735,40.6163269165113,40.6163340856539,40.6163401237483,40.616354100869,40.6163888992197,40.6164288968956,40.6164739020009,40.6165236986153,40.6165669237533,40.616571590944,40.6165697156696,40.6165796410232,40.6165941493661,40.6166128231185,40.6166351248108,40.6166604125533,40.6166879585107,40.6167169698503,40.6167466115619,40.6167760304904,40.6168043798919,40.6168308438046,40.6168280975166,40.616827464227,40.616828959233,40.6168325464224,40.6168381391454,40.6168456023078,40.6168547556345,40.6168653780239,40.6168772128882,40.6168906784664,40.6169048113891,40.6169192327881,40.6169673780153,40.6170174852917,40.6170660172321,40.6170715265539,40.6170781448119,40.6170857201833,40.6170940788893,40.6171043194325,40.6171150233448,40.6171258716047,40.6171365408885,40.6171467132061,40.6171560853793,40.6171643780775,40.6171713441427,40.6171753977242,40.6171786026489,40.6172314272305,40.6172803679849,40.6173251257287,40.617352562807,40.6173813796619,40.6174328141228,40.6174827186229,40.6175308831432,40.6175393132112,40.6175483095574,40.6175595416993,40.6175710583363,40.6175825639919,40.6175937634713,40.6176043694348,40.6176141097703,40.6176078276849,40.6176007802417,40.6175953419362,40.6175916611294,40.6175898382365,40.6175899229872,40.6175919130696,40.6176157201371,40.6176365742348,40.6176540277105,40.6176677059093,40.6176773152156,40.6176814256284,40.6176821778587,40.6176795512573,40.617673617926,40.6176645407382,40.6176525688681,40.6176584445439,40.6176657561905,40.617674295895,40.6176838208225,40.6176940601232,40.6177047226327,40.6177155051522,40.6177261010704,40.6177362090819,40.6177455417552,40.6177491996975,40.617753954777,40.6177596776391,40.617766212602,40.6177733818917,40.6177809904785,40.617788831382,40.617796691302,40.6178043564207,40.6178339547967,40.6178659605778,40.6178994303787,40.61793337766,40.6179585498028,40.6179830095206,40.6180388700336,40.6180932134682,40.6181303353699,40.6181659798228,40.6181927112054,40.6182182342201,40.6182281167114,40.6182673075411,40.6183309841249,40.6183799439581,40.6183872311667,40.6183871006438,40.6183845790924,40.6183747249408,40.618369399645,40.6183648246717,40.6183696299693,40.6183891174434,40.6184159658827,40.618428115557,40.618430483207,40.6184573889683,40.6184622055254,40.6184498857563,40.6184546845354,40.6185036113897,40.6185892795458,40.6186333830322,40.6186749830207,40.6187116173434,40.6187532673891,40.6187825981134,40.6187947409423,40.6188290020032,40.6188707203822,40.6189049923299,40.6189783195345,40.619015613356,40.6190545380436,40.6190943695169,40.6191343668258,40.619173785934,40.6192118935599,40.619247980817,40.6192696886962,40.6193285142357,40.6193969561439,40.6194678065736,40.6195142666992,40.6195583822855,40.6196098530292,40.6196710017149,40.6197711366594,40.6197806551556,40.6197808257357,40.6197978827105,40.6198615418216,40.6202110131047,40.6203504862911,40.62052658481,40.6206693974712,40.6207649021858,40.6207946064277,40.6208251197102,40.6208605014846,40.6208969173968,40.6209023986517,40.620907680359,40.6209126296747,40.6209216801306,40.620929569282,40.6209360950241,40.6209410901801,40.6209404295238,40.6209452818628,40.6209555272982,40.6209709126702,40.6209910578134,40.6210154649502,40.6210435309906,40.6211019931963,40.621124463809,40.6211513850595,40.6211822276712,40.6212163852718,40.6212531863154,40.6212919072833,40.6213317869102,40.6213637211182,40.6213954959269,40.6214281681669,40.6214579885326,40.6214842856686,40.6215064675385,40.6215240347538,40.6215422630332,40.6215624322522,40.621584082198,40.6216067188707,40.6216423695317,40.6216723124609,40.6216961879363,40.6217137091273,40.6217928965052,40.6218043954127,40.621814131992,40.6218218584455,40.6218273781337,40.6218305505798,40.6218312950442,40.6218295925802,40.6218254865158,40.6218190813511,40.6218105400988,40.621800080135,40.6217872647551,40.6217750437321,40.6217637636741,40.621753744502,40.6217452703755,40.6217385816344,40.6217338679819,40.6217312631048,40.6217308408815,40.6217305799435,40.6217326750305,40.6217369349023,40.6217432617724,40.621751510406,40.6217614914535,40.6217729757974,40.6217856998111,40.621825547415,40.6218795183375,40.6219331500798,40.6219607556232,40.6219869220363,40.6220109294082,40.6220321172284,40.6220499025598,40.6220637960768,40.6220734155287,40.6220815430557,40.6220927322595,40.6221066575678,40.6221229137958,40.6221410279355,40.622160472919,40.6221806829538,40.6221956340266,40.6222139837877,40.6222316776251,40.6222830761133,40.6223340968342,40.6223839604323,40.6224319052253,40.6224771988401,40.6225191493994,40.6225571160915,40.6225905189587,40.6226188477567,40.6226416697495,40.6226663505686,40.6226848146263,40.6226969936514,40.6227028426119,40.6227023398811,40.6226954873179,40.6226823102598,40.6225070556175,40.6224208673645,40.6223394277511,40.6223449356957,40.622306449479,40.6222776578454,40.6223283683243,40.6224535435625,40.6225284319805,40.6225963741058,40.6225969826666,40.6225874834513,40.6225884498496,40.6225953832988,40.6226078617277,40.6226553230033,40.6227919944187,40.6228745275353,40.6229462849279,40.6229997511309,40.6231156455189,40.6232525603521,40.6233926234205,40.623639389654,40.6237651285535,40.6258470051772,40.6267066568383]}],[{"lng":[-73.8142937322395,-73.8146688684082,-73.8153154921312,-73.8161736161592,-73.8164455189788,-73.8159697587256,-73.8152760546781,-73.8146741430527,-73.8142937322395],"lat":[40.6291424017459,40.6275025618228,40.6277585445179,40.628901435199,40.629836064928,40.6303787183565,40.6302281047302,40.6299852894046,40.6291424017459]}],[{"lng":[-73.8359764679521,-73.8359542973316,-73.8359529636213,-73.835921654089,-73.8359197081448,-73.8358936007712,-73.8358686252286,-73.8358673226963,-73.8358599527261,-73.8358501000523,-73.8358483479572,-73.8358392466916,-73.8358129219505,-73.8357923014171,-73.8357547099801,-73.8357307652751,-73.8356506824867,-73.835611442714,-73.8355107661637,-73.8354249791608,-73.8353617889139,-73.8353476095701,-73.8353149680485,-73.8352758786559,-73.8352386649524,-73.8351862382521,-73.83514902525,-73.8350947970617,-73.8350631402472,-73.8350482413307,-73.835050764569,-73.8350567166304,-73.8350626660514,-73.8350671382484,-73.8350701325622,-73.83507166915,-73.8350717679392,-73.8350703877521,-73.8350674909104,-73.8350645745755,-73.8350616777345,-73.8350588003886,-73.835055922163,-73.8350560010218,-73.8350590154886,-73.8350620098036,-73.835065004116,-73.8350679999671,-73.8350709942774,-73.8350719730547,-73.8350725308638,-73.835071111687,-73.835064211955,-73.8351035585437,-73.8351428320223,-73.835143319023,-73.8352573187343,-73.8352935457262,-73.835344296769,-73.8354653565547,-73.8355221323154,-73.835588517012,-73.8356395621251,-73.8356762157678,-73.8357083989501,-73.8357407716642,-73.8357411522756,-73.8357426486351,-73.8357929989655,-73.8358156204618,-73.8358475254427,-73.8358886914861,-73.8359370894886,-73.8359704502056,-73.8360035609716,-73.836026621075,-73.8360610469431,-73.8361286762583,-73.8361355477649,-73.8361726124846,-73.8361755965921,-73.8361891209395,-73.8361900302787,-73.8361722687065,-73.8361886783311,-73.8361881074611,-73.8361858587566,-73.8361854107605,-73.836186865694,-73.8361902220198,-73.8361974565248,-73.8361840210524,-73.8361648310577,-73.8361466035225,-73.8361460602544,-73.8361393897242,-73.8361327218353,-73.8361304447015,-73.8361289081627,-73.8361259138685,-73.8361229193529,-73.8361184659882,-73.83611255465,-73.8361081023833,-73.8361051067687,-73.836102092338,-73.8361020148687,-73.8361049117782,-73.8361033947134,-73.8360959855632,-73.8360900547475,-73.8360870597912,-73.8360826077426,-73.8360766964024,-73.8360707850592,-73.8360648730593,-73.8360604210103,-73.8360574264926,-73.836054431538,-73.8360528949929,-73.8360528161996,-73.836050542579,-73.8360438711647,-73.8360372019484,-73.8360334683742,-73.8360304725372,-73.8360289173931,-73.8360302985489,-73.8360331954566,-73.8360331551807,-73.8360301602206,-73.8360286236764,-73.8360300433512,-73.8360329411379,-73.8360358185681,-73.8360387156987,-73.8360416312051,-73.8360445480317,-73.8360445073144,-73.8360415136746,-73.8360385193744,-73.8360355182173,-73.8360339617503,-73.8360338575013,-73.8360323016935,-73.8360278414603,-73.8360219307677,-73.8360175174492,-73.8360131225105,-73.8360072120423,-73.8360012612954,-73.8359953112093,-73.8359922967652,-73.835992275032,-73.8359922188487,-73.8359921400543,-73.835992135675,-73.8359827021616,-73.8359782721326,-73.8359764679521],"lat":[40.6322166955384,40.6321679120009,40.6321649741544,40.6321303357713,40.6321299197007,40.6321243330473,40.6321259815655,40.6321253000415,40.632124099898,40.6321240002251,40.6321242508598,40.6321194942857,40.6321220900842,40.6321204510193,40.6321060942139,40.6320969501216,40.6320603891026,40.632049982403,40.6320103540398,40.6319780272038,40.6319416362459,40.6319397615644,40.6319354440025,40.6319164582493,40.6318974915883,40.6318898123144,40.6318708451227,40.6318588582343,40.6318442369764,40.6317949848944,40.6317950116332,40.6317928188424,40.6317906265501,40.6317884195737,40.6317861979126,40.6317828344614,40.6317772061351,40.6317715607772,40.6317681536076,40.631765871869,40.6317624646992,40.6317579315957,40.6317533986583,40.6317488950923,40.6317455474987,40.6317433246651,40.6317411028366,40.6317388811778,40.6317366600192,40.6317345155457,40.631733296568,40.6317299035801,40.6317257495206,40.6316787531227,40.6316593719009,40.6316591321952,40.6315801961572,40.6315650747991,40.6315438912558,40.6314907677537,40.6314641685027,40.6314247944789,40.6314038576608,40.6313470231031,40.6313166974462,40.6313047709116,40.6313046918791,40.6313047895083,40.6313238888568,40.631318397064,40.6313187182039,40.6313262834359,40.6313496535965,40.6313743011367,40.631413248074,40.6314295428248,40.6314538695318,40.6314841164488,40.6314875133412,40.6315390534821,40.6315594230481,40.6316453658723,40.6317011484228,40.6317510241074,40.6318870497791,40.6319199353876,40.631941364656,40.6319671024846,40.631991428913,40.632014343939,40.6320301483658,40.6320471742826,40.6320712923746,40.6320895950649,40.6320898243078,40.6320908836358,40.6320919417945,40.6320952971681,40.6320986594606,40.6321008818194,40.6321031046802,40.6321041852602,40.6321041252357,40.6321052063194,40.6321074286757,40.6321107762966,40.6321152798649,40.6321186870084,40.6321209240369,40.6321219762785,40.6321230415164,40.6321252638733,40.6321263449563,40.6321262849299,40.6321262260759,40.6321261660479,40.6321272471301,40.6321294694868,40.63213169067,40.6321350536316,40.6321395577006,40.6321429129101,40.6321439712261,40.63214502988,40.6321472446484,40.6321494663323,40.6321539545585,40.6321595999059,40.6321630070512,40.6321652587493,40.6321674811046,40.6321708428932,40.6321742358698,40.6321776435189,40.6321821765979,40.6321855830732,40.6321878649533,40.6321901466676,40.6321923990353,40.6321946207226,40.6321968425764,40.6321994386799,40.632203928077,40.6322099318282,40.6322144212262,40.6322158772251,40.6322158188721,40.6322146482523,40.6322123516969,40.6322122916682,40.6322144840074,40.6322166756772,40.6322200244678,40.6322212623077,40.6322245280355,40.6322290309316,40.6322292917679,40.6322316761522,40.6322284469122,40.6322166955384]}],[{"lng":[-73.8233759212934,-73.8227710543868,-73.8226504676488,-73.8225379103756,-73.8224334785434,-73.8223372611933,-73.8222493403534,-73.8221697909692,-73.8220986808411,-73.8220360705655,-73.8219820134843,-73.8219365556389,-73.8218997357321,-73.8218715850944,-73.8218521276578,-73.8218413799368,-73.8218393510129,-73.8218460425281,-73.8210750553346,-73.8208495608084,-73.8206721594249,-73.8203539314199,-73.8202334758526,-73.8201667486734,-73.820100034908,-73.8199384775572,-73.8196953586557,-73.8182563726933,-73.8182370498478,-73.8178886809715,-73.8172614946007,-73.816230961211,-73.8161754898308,-73.8166737311873,-73.8167526471157,-73.8179528472082,-73.8186434511545,-73.8186620428672,-73.8175487805414,-73.8175789028936,-73.8167223836549,-73.8166236989349,-73.816207121148,-73.8153871915868,-73.8153072224518,-73.8154317470428,-73.8163913131518,-73.8168245591878,-73.8171805387845,-73.8174442611113,-73.8174464513896,-73.8176471107445,-73.817774298345,-73.8177572675076,-73.8176029863246,-73.8175171781405,-73.8171684613709,-73.817118936222,-73.8165268124435,-73.8174981097032,-73.8201734801783,-73.8207589250475,-73.8214160164138,-73.8215706029161,-73.8216392193982,-73.8217020804838,-73.8217647149711,-73.8223496103741,-73.8239953676249,-73.8241032709012,-73.8244482123991,-73.8245832033166,-73.8246745163795,-73.8247394370676,-73.8246079747781,-73.8246858434753,-73.824907237176,-73.8252068396124,-73.8252583464622,-73.8254016108567,-73.8255575899788,-73.8257532210527,-73.8259360337329,-73.8260928708576,-73.8261974964758,-73.8261977813484,-73.8263539086596,-73.8266288985761,-73.8267315737102,-73.8270383421776,-73.8271519474536,-73.8272563663299,-73.8273737343204,-73.8274735189522,-73.82747779183,-73.8275819290487,-73.8276720422748,-73.8277256849005,-73.827875254718,-73.827698861069,-73.8275812353864,-73.8273200321807,-73.82724153727,-73.8275022260954,-73.8277370944182,-73.8280765353853,-73.828455031825,-73.829002879519,-73.8293287842879,-73.8296417160514,-73.8300981509802,-73.8305457528592,-73.8309199600142,-73.8314812223769,-73.8317032436122,-73.8320297090665,-73.8324609196554,-73.8333110544017,-73.834018881345,-73.8339526640577,-73.8338077661465,-73.8337015227225,-73.8336081783957,-73.8335912949263,-73.8335483123636,-73.8335072318595,-73.8334586571777,-73.8334194106556,-73.8333857710428,-73.8333353219143,-73.8332662117225,-73.8331952384341,-73.8331578812583,-73.8331130922959,-73.8330514157697,-73.8329953136776,-73.8329578518818,-73.8328737626083,-73.8328251418931,-73.832798960896,-73.8327690216982,-73.8327651501454,-73.8327295929849,-73.8326734939921,-73.8326472707438,-73.8326173463155,-73.8325892806985,-73.8325480893316,-73.8325144670319,-73.8324902204753,-73.8324510411224,-73.8323819508536,-73.8323315701518,-73.8322998638145,-73.8322532186429,-73.8321728876518,-73.8321336367909,-73.8320999866716,-73.8320663736944,-73.8320309249128,-73.8319636581743,-73.8319057748947,-73.8318404263981,-73.8317993015815,-73.8317563035912,-73.8317226380719,-73.8316946042604,-73.8316590931429,-73.8316384980199,-73.8316291215766,-73.8316066741456,-73.8315879871434,-73.8316103493483,-73.8316439423473,-73.8316831146168,-73.8317279291727,-73.8317802024354,-73.8318325325844,-73.8318773578466,-73.8319241043283,-73.8319782799546,-73.832011891694,-73.8320305884786,-73.8320567705584,-73.8320941354636,-73.8321389433815,-73.8321762912584,-73.8322099284132,-73.8322547463684,-73.8323107301797,-73.8323592322511,-73.8323983994221,-73.8324468649433,-73.8324842342156,-73.8325234457836,-73.8325682423085,-73.8325683029577,-73.832603813118,-73.8326374176247,-73.8326765970603,-73.8327119639433,-73.832724933689,-73.8327211048435,-73.8327434129356,-73.8327619719396,-73.8328178918205,-73.8328681853239,-73.8328849198722,-73.8328904236477,-73.8328884708882,-73.8328827903829,-73.832867757971,-73.8328508780279,-73.8328228407241,-73.8327854842174,-73.832742550467,-73.8327313118329,-73.8327312298567,-73.832721812402,-73.832721730421,-73.8327515631703,-73.8327589578337,-73.8327402318547,-73.8326973115872,-73.8326674224341,-73.8326654922636,-73.8326355739008,-73.8326224192804,-73.8326148889102,-73.8325886861861,-73.8325569430297,-73.8325495383924,-73.8325477395335,-73.8325104370176,-73.8324731137552,-73.8324674566832,-73.8324879182545,-73.8325083847799,-73.8324877968933,-73.8324317503431,-73.8323981311015,-73.8323589406791,-73.8323215773942,-73.8322879726416,-73.8322618552976,-73.8322014982464,-73.832114804863,-73.8320375145266,-73.8319585093952,-73.8318980289922,-73.8318139782879,-73.8317450064777,-73.8316827755386,-73.831644146905,-73.8315718569312,-73.8315180409617,-73.831455838636,-73.8314037314766,-73.8313582578548,-73.8313362476453,-73.8312872524811,-73.8312517791989,-73.8311692138363,-73.8311085530908,-73.831091603245,-73.8310841967325,-73.8310763474981,-73.8310157246783,-73.8309013340215,-73.8308223350161,-73.8306812115369,-73.8305956018596,-73.8305586919293,-73.8305184856258,-73.8305220829856,-73.8305237097447,-73.8304706528846,-73.8303872312681,-73.8304240238869,-73.8303799419262,-73.830292041815,-73.8302319697498,-73.8302086677887,-73.8302222747994,-73.8302081841187,-73.8302103379422,-73.8301639448881,-73.8301129666531,-73.8300736566377,-73.8300711362878,-73.8300802123258,-73.8301562876654,-73.830232332472,-73.8302044500376,-73.8301442788854,-73.8300934703574,-73.8300611591003,-73.8300379328586,-73.830049248654,-73.8300398630562,-73.8299866222995,-73.8299564470733,-73.8299287977163,-73.8299220366198,-73.8299453302756,-73.8299316463859,-73.8298694330131,-73.8298530228166,-73.8298551891372,-73.8298134709629,-73.829787888331,-73.8297393282784,-73.8296793226072,-73.829697680926,-73.8295913307002,-73.8295242759038,-73.8294780269887,-73.8294317038665,-73.8294269798487,-73.8294268673707,-73.8293412928432,-73.8293180343957,-73.8292948170917,-73.8292553450875,-73.8292482873694,-73.8291880922351,-73.8291902277972,-73.8292618578733,-73.8293056990631,-73.8293612317956,-73.8293613758258,-73.8294445683259,-73.8295092127359,-73.8295762179029,-73.8296617695621,-73.8297196499088,-73.8297890278127,-73.8298238865449,-73.8298424434401,-73.8298749869597,-73.829914396236,-73.8299722620289,-73.8300462835807,-73.8300786122956,-73.8301132480145,-73.8301086971932,-73.8301273659143,-73.830129824151,-73.8301483839719,-73.8301738265053,-73.8301947109853,-73.8301948095185,-73.830185719662,-73.830222767935,-73.830250551658,-73.8302829885276,-73.8303177574495,-73.830322476199,-73.8303203184423,-73.8303458274858,-73.830369004211,-73.830392086971,-73.8303990715104,-73.830396828034,-73.8304361962001,-73.8304432299114,-73.8304271502536,-73.8304272262889,-73.8304550097559,-73.8304851536161,-73.8304991277064,-73.8305246512436,-73.8305178270499,-73.830478566416,-73.8304438962746,-73.8303930219504,-73.8303329445102,-73.830330750958,-73.8303308404633,-73.830358650702,-73.8303725809676,-73.8303934648328,-73.8304143435429,-73.830476699172,-73.830527529283,-73.8305736663369,-73.8306174443813,-73.8306889668975,-73.8307535790271,-73.8308043693077,-73.8308574340461,-73.8308781662529,-73.830868870671,-73.830831884838,-73.8308317866742,-73.8308663542352,-73.8308755166627,-73.8308776755666,-73.8308314118656,-73.8307874638337,-73.8307296534187,-73.8306972341276,-73.8306532681445,-73.8306300392614,-73.830604529937,-73.8305951805968,-73.8306227898881,-73.8306642540166,-73.8306872118387,-73.8307125421441,-73.8307078450583,-73.8306730763158,-73.8306637314416,-73.8306590204847,-73.83066816504,-73.8307027411718,-73.8307072690305,-73.8306956354429,-73.8306493769701,-73.8305753834365,-73.8305105906999,-73.8305128112323,-73.830533561297,-73.8305565945019,-73.8305541945086,-73.8304986581091,-73.8304708295234,-73.8304615157621,-73.8305216696421,-73.8305910341751,-73.8305980895674,-73.8306074613417,-73.8305751823392,-73.8305544671419,-73.8305868549033,-73.8306492206318,-73.8306955014715,-73.8307210341668,-73.8307373418566,-73.8307674983799,-73.8307537327977,-73.8307237731772,-73.8306960998669,-73.8307239696321,-73.8307425425439,-73.8307311467422,-73.8307011948341,-73.8306528572061,-73.8306390975489,-73.830653035874,-73.8306785594515,-73.8307295194786,-73.830794252523,-73.830854325111,-73.8309259501455,-73.8309768022766,-73.8310115706015,-73.8310394258664,-73.8310672991321,-73.8310951803786,-73.8311900030527,-73.8312708959048,-73.8313402145292,-73.8314187754238,-73.8315319870868,-73.8315850486464,-73.8316057536137,-73.8316380385471,-73.8316425699972,-73.831674828331,-73.8317186870796,-73.8317579688555,-73.8317971898372,-73.8318086440141,-73.8318454752964,-73.8318800834269,-73.8319285903,-73.8319564036935,-73.831944963381,-73.8319150243081,-73.8318803273174,-73.8318226851232,-73.8317881119177,-73.8317488658906,-73.8317004117841,-73.8316658482189,-73.8317051889521,-73.8317422448339,-73.8318137493616,-73.8318898930882,-73.8319498761985,-73.8319982905429,-73.8320287707212,-73.832065208836,-73.8320974674288,-73.8321342717192,-73.8321479968431,-73.8321559345696,-73.83200070338,-73.8319382877551,-73.831868405635,-73.8318426244161,-73.8317691917133,-73.8316590943936,-73.8315928236445,-73.8315486228185,-73.8314349041801,-73.831306491512,-73.8311780644007,-73.8311156187926,-73.8310568135874,-73.8309650089429,-73.8309574555405,-73.8308986371005,-73.8309129378885,-73.8309204100084,-73.8309752129145,-73.8311473069032,-73.8312387948608,-73.8313448655704,-73.8312750366819,-73.8311721917097,-73.8310806674468,-73.8310184048743,-73.8309267666869,-73.8308350731633,-73.8307690273646,-73.8307578963226,-73.830768694767,-73.8308272451585,-73.8308858521623,-73.8309334143977,-73.8309516090878,-73.8309331316114,-73.8308927120929,-73.830855954534,-73.8307972411926,-73.8307348356858,-73.8306798277897,-73.8306539675109,-73.8306428150299,-73.8306316766887,-73.8306276178109,-73.8306529973528,-73.8306820180032,-73.8307403497918,-73.8307511335866,-73.830750914186,-73.8307690168512,-73.8308238141347,-73.830915269841,-73.8310324024004,-73.8311239148599,-73.831193505857,-73.8312666956599,-73.8313471764139,-73.831424030864,-73.8315447633113,-73.8316069785967,-73.8316691655482,-73.8317717809463,-73.8318927875941,-73.8320210363661,-73.8321017296601,-73.8321787436578,-73.8322629307207,-73.832303014962,-73.8323100676466,-73.8322988183626,-73.8322328758855,-73.8321924918405,-73.8321923795654,-73.8322362027886,-73.8322984256453,-73.8323827114867,-73.8324119247542,-73.832463082091,-73.8324739309704,-73.8324554259257,-73.8324223183043,-73.8324074774948,-73.8323962983473,-73.8323668255506,-73.8323299843616,-73.8323041816921,-73.8322893735351,-73.8322160276443,-73.8321281907883,-73.8320476857726,-73.8319414634487,-73.8318498216098,-73.8317764403368,-73.831699325325,-73.8316772413056,-73.8316551218383,-73.8315927359193,-73.8315816543516,-73.831566868123,-73.8315593877206,-73.8315738570228,-73.8315956588619,-73.8316174622842,-73.8316723253089,-73.8317125139066,-73.8317746886713,-73.8318772223345,-73.8317894466856,-73.8317822616801,-73.8317310900439,-73.8317238826696,-73.8317021018117,-73.8316326921047,-73.8316548543252,-73.8316843562244,-73.8317576612715,-73.8318492661057,-73.8318603686112,-73.8318092462955,-73.8318863203082,-73.8319889218761,-73.8320767319349,-73.8321058400589,-73.8321387448847,-73.8321645267494,-73.8322744266119,-73.832362300278,-73.8324575342142,-73.8325417790493,-73.832626050568,-73.8326115451951,-73.832618998135,-73.8326666251942,-73.832714126992,-73.832776448611,-73.8328132130913,-73.8328793937625,-73.8329234764744,-73.8330115448135,-73.8330554458405,-73.8330516010842,-73.8330367532762,-73.833032929,-73.833018157948,-73.833041008418,-73.8328652873168,-73.8328650873443,-73.8328772179744,-73.8328856085721,-73.8328954895678,-73.8326855931439,-73.8326635580099,-73.8323603667122,-73.8321920703231,-73.8319608076813,-73.8318864960235,-73.8318333464554,-73.8318966639819,-73.8317109063511,-73.831663941336,-73.8316080863105,-73.8315434359509,-73.8314700998554,-73.8313882023573,-73.8312978823149,-73.8311992928761,-73.8311726114635,-73.8311539318301,-73.8311433342335,-73.8311408642215,-73.8311465324369,-73.8311603145704,-73.831182151465,-73.8312119493692,-73.8312495803393,-73.8312862588257,-73.8313311286414,-73.8315519507209,-73.8316839754055,-73.8319387847268,-73.8319116731582,-73.8319063136744,-73.8319578778669,-73.8321207636504,-73.8323134547505,-73.8324909443572,-73.8324589578356,-73.8326358069717,-73.8329068393488,-73.8330942385032,-73.8334060797923,-73.8329495625692,-73.832899743612,-73.832812666356,-73.8322165881918,-73.8293800399574,-73.8286678210973,-73.8280856735329,-73.8270637908345,-73.8266549676336,-73.8265099853922,-73.8263630675972,-73.8262147996403,-73.8260657722917,-73.8259165793467,-73.8257678152601,-73.8256200727785,-73.8254739405789,-73.8253300009235,-73.8251888273406,-73.8250509823398,-73.8249170151707,-73.8247874596352,-73.8246628319609,-73.8245436287441,-73.8244303249717,-73.8241357769007,-73.8245737989033,-73.8241933192129,-73.8233759212934],"lat":[40.6389876558977,40.6355769140851,40.6353688441429,40.635158179711,40.634945100565,40.6347297885397,40.6345124273731,40.6342932025507,40.6340723011461,40.6338499116619,40.6336262238686,40.6334014286428,40.6331757178039,40.632949283951,40.6327223202979,40.6324950205089,40.6322675785326,40.6320401884374,40.6297337740637,40.6293836070039,40.6289148614295,40.6284245197344,40.6282389063357,40.6280279747693,40.6278170361434,40.6276820850489,40.6275868906501,40.6269960227519,40.6263871037166,40.6259084501446,40.6253859502227,40.6246898258483,40.624412640035,40.6240119613651,40.6239484978257,40.6240932796148,40.6233749043579,40.6228831561929,40.6220874012559,40.6217561608776,40.6215682928929,40.6219672339799,40.6220878772519,40.6214977796418,40.6206872651089,40.6201165312423,40.6196219555073,40.619461564854,40.6192672744932,40.6189117554092,40.6181108964938,40.6176119454629,40.6175011216957,40.6173071488158,40.6169838325815,40.6163964121645,40.6158431977223,40.6152821923455,40.6149470096586,40.6142141315642,40.6151806191388,40.6152326795177,40.6150547639347,40.6149086908311,40.6148706148947,40.6148241913903,40.6147644579723,40.6142600261963,40.6125162775592,40.6123260974856,40.6123411266579,40.6123998815441,40.6124199141226,40.6125493205895,40.6129072049827,40.6130764187567,40.6132657449525,40.613494977196,40.6137636192897,40.6138831978856,40.6141321047108,40.6141920815401,40.6141625182093,40.614083181727,40.6140037654279,40.6138943510091,40.6137861570237,40.6137458008556,40.6136649561239,40.6133950021527,40.6133785571548,40.6133787141246,40.6134186779709,40.6135523633269,40.6135580893556,40.6136676592836,40.6136241488628,40.6135982481675,40.6136976285985,40.6138767177697,40.6139362215035,40.6139955106903,40.6140650205719,40.6142046667202,40.6142348592424,40.6142055271274,40.6142160391517,40.6143561100772,40.6145157433296,40.6146455161249,40.6148053400601,40.6149330607807,40.6150054870335,40.6150063112282,40.6149569024455,40.6148976998606,40.6147093398113,40.6144933113214,40.6143811664197,40.6157578334979,40.6187701020658,40.6209786013443,40.6210401851634,40.6210742944406,40.6210955658696,40.6211026176559,40.6211210368112,40.6211408906123,40.6211579085527,40.6211791690804,40.6211989807029,40.621217366086,40.621228689613,40.6212257804607,40.6212584023022,40.6213009881268,40.6213535564262,40.6213918343883,40.6214287422207,40.6214486148089,40.6214784385124,40.6215338997476,40.6215708270448,40.6216119897243,40.6216489300785,40.6216730643087,40.621700045379,40.6217511857904,40.6217610927292,40.621753946128,40.6217467784291,40.6217580547805,40.6217522925275,40.6217422908649,40.6217351110348,40.6217634387201,40.6217847150677,40.6218059995819,40.6218116392702,40.621805898697,40.6218342446533,40.6218426936281,40.6218511316542,40.6218752492876,40.6219022094788,40.6219291821421,40.6219433634843,40.6219618005012,40.6219873704591,40.6220044239187,40.6220243023733,40.6220328079252,40.6220470632304,40.6220485347526,40.6220585475269,40.6220515023603,40.6220473118965,40.6220203658509,40.6220090536762,40.6219764106385,40.6219580009879,40.621952361156,40.6219395884165,40.621919715335,40.6219055475335,40.6219013458355,40.6218942892564,40.6218786946586,40.6218702264673,40.621874574605,40.6218860230796,40.6218974579248,40.6219231286895,40.6219075389484,40.621901906624,40.6219019718751,40.6218777941679,40.6218593575392,40.6218565611523,40.6218637294577,40.6219021811039,40.6219406008222,40.6219789960968,40.6220145840867,40.6220572783947,40.6220872258063,40.6221285439201,40.6221541683641,40.6221925767068,40.6222267075801,40.6222594107126,40.6222992120255,40.6223318982038,40.6223475023046,40.6223574033896,40.6223587632554,40.6223743916053,40.6224071028756,40.6224412223816,40.6224739336516,40.622486778287,40.6225152327985,40.622539383852,40.6225350544338,40.6225449668498,40.6225705641558,40.622591854257,40.6226273906354,40.6226529804568,40.6226813865589,40.6226856074621,40.6226614182134,40.6226343931561,40.62262296108,40.6226200625567,40.6226428097849,40.6226712838575,40.6226969144628,40.6227196404405,40.6227394700925,40.6227479540097,40.6227450527274,40.6227577982951,40.6227605940871,40.6227548665289,40.6227370619154,40.6227162642706,40.6226674240396,40.622631403924,40.6225902824432,40.622552973085,40.6225426131839,40.6225284171462,40.6224975853267,40.6224679866179,40.622453802819,40.6224280659577,40.6224036256329,40.6224176638775,40.6224702058945,40.622545789458,40.6225983116998,40.6226392235374,40.6226699096934,40.6227173296918,40.6227384844313,40.622760905542,40.6227762038252,40.622758083546,40.6227194984584,40.6226256838317,40.6225396427763,40.6224947088519,40.622422840763,40.6223751574089,40.6223536043441,40.6223419140058,40.6223908476578,40.6224595607087,40.6225316755761,40.6225720371246,40.6225719484304,40.6226493754375,40.6227497430982,40.6228395073121,40.6229011273474,40.6229732387162,40.6230312597922,40.6230435253004,40.62312626401,40.6231914152357,40.6232584260253,40.6233377603234,40.6233993364996,40.6234379778185,40.6234291000928,40.6234149688377,40.6234624671858,40.6235557905603,40.6236121120142,40.6236507639983,40.6237052941359,40.6236753250095,40.6236084166369,40.6235345113107,40.623464071069,40.6233970801443,40.6234903618351,40.6235467003709,40.6235976929323,40.6236627928664,40.6236785661926,40.6236520690351,40.6237013906495,40.6237276401604,40.6237469057654,40.6237626812357,40.6238066254142,40.6238471090036,40.6238911210631,40.6239244432492,40.6239842656769,40.6240282429284,40.624103885159,40.6241531684227,40.624200612353,40.6242692749586,40.6242676202952,40.6242905715388,40.6242589658591,40.6242026295741,40.6241974726755,40.6242169330741,40.6242170324215,40.6241925131757,40.6241468261321,40.6241222816622,40.6240431112953,40.6240149705966,40.6239375578521,40.623886561854,40.6238461568517,40.6238128171179,40.6238199063186,40.6238287601523,40.6238005852609,40.62372843346,40.6236703406987,40.6236404405641,40.6236299144391,40.6235947357075,40.6235560056495,40.623496135936,40.6234645013613,40.6234416557421,40.6234064945535,40.6233625329784,40.6233238092361,40.623263949763,40.6232270172654,40.6231988838001,40.6232077203359,40.623186604556,40.6231601941437,40.6231250424664,40.6230845615698,40.6230475677081,40.6230176395915,40.6229947939218,40.6229525867067,40.6229085955837,40.6228663820483,40.6228241196508,40.6228170196808,40.6228222500731,40.6228397801551,40.6228414515665,40.6227956760386,40.6227604659172,40.6227270577697,40.6227006712207,40.6226654922818,40.6226320738942,40.6226427295731,40.6226428045156,40.6226710395162,40.6227186373822,40.6227592340109,40.6227910177747,40.622806936597,40.622836943414,40.6228616204553,40.6228827330324,40.6228897200276,40.6229284505914,40.6229637112022,40.6229954133055,40.6230552734411,40.623076330955,40.6230956312959,40.6231149118802,40.6231430318075,40.623169374657,40.6232186336842,40.6232555669142,40.6232978043004,40.6233436177712,40.6233929726015,40.6234511028094,40.6234845892969,40.6235145099372,40.6235584709595,40.6235989484638,40.6236341512722,40.6236728954471,40.623704634991,40.6237416124711,40.6237732834582,40.6237925815158,40.6238153579673,40.6238539931682,40.6238892061886,40.6239068419021,40.6239350435156,40.6239702502272,40.6240036175428,40.6240440671064,40.6240722210346,40.6240406211069,40.6240213576541,40.6239720748079,40.6239210343088,40.623894579643,40.6238628604918,40.6238470641638,40.6238541974629,40.623826098635,40.6237803634452,40.6237275725844,40.6236800842988,40.6236413333292,40.6236113604906,40.6235901941599,40.6235338993685,40.6234987169664,40.623437082836,40.6234035895466,40.623331338461,40.623290826922,40.6232609198969,40.6232187051562,40.623167725888,40.6231519771212,40.6231520655215,40.6231521708809,40.6231434431775,40.6230994825641,40.6230484691937,40.6229904137589,40.6229288378731,40.6228920070031,40.6228815627142,40.6228799043705,40.6228782585331,40.6228784244903,40.6229101915288,40.6229454321105,40.6229701254329,40.6230053418181,40.6230405993057,40.623056507574,40.6230548045044,40.6230777480392,40.6231164955039,40.6231711246512,40.6231905409546,40.6231958928979,40.6231607238082,40.6231166948579,40.6230779203821,40.6230937142101,40.623046097218,40.6230125974504,40.6230002164151,40.6229737383889,40.62293671697,40.6229121273579,40.6228769725188,40.6229246098333,40.6229652124731,40.6230005104219,40.6230428323447,40.6230581133152,40.623076379302,40.623111636168,40.6231768282248,40.6232314230307,40.623305451969,40.623483603459,40.6235421224369,40.6236564474531,40.6237122290828,40.6237818943128,40.6238654609834,40.6239993280187,40.6240969455907,40.6241637618767,40.6242473006817,40.6243364223944,40.6244061033381,40.6244841635357,40.6245761285139,40.6246654269657,40.6247490682911,40.6248022489655,40.6248300372725,40.624885936518,40.6249113075322,40.6249449327595,40.6250064889723,40.6250984870995,40.6252099734362,40.6251903020986,40.625187420237,40.6252124043069,40.6252597143121,40.6253042721394,40.6253600739098,40.6254354448595,40.6254578582922,40.6254579445164,40.6254803429038,40.6255278145455,40.6255919787965,40.6256421567774,40.6256923384564,40.6257341162202,40.6257870521488,40.6258120899457,40.625898570538,40.625962744357,40.6260213376366,40.6261776241559,40.6262809250788,40.6263926052942,40.6265015371212,40.6265824897728,40.6266690081237,40.6267527625791,40.626811452908,40.6268590328298,40.6268926964255,40.6269179496756,40.6269208422374,40.6269488586651,40.6269908404034,40.6270188627763,40.6270776499202,40.6271000683192,40.6271336502717,40.6271142635726,40.6270642041561,40.6270476455776,40.6270059004676,40.6269697299856,40.6269949721377,40.6270787584138,40.6271876146242,40.6272908617378,40.6272935563977,40.6273297798822,40.6273744342319,40.6274275259654,40.6274471531345,40.6274333220555,40.6274696458894,40.6275199578633,40.6275757918122,40.6276511198804,40.6277068897686,40.6277822231688,40.6278575619046,40.6279245012047,40.6280081752765,40.6280723285445,40.6281337074821,40.6281670918536,40.628136263116,40.6281026546594,40.6280997085748,40.6281246927027,40.6281720307322,40.6282472729044,40.6282891047221,40.6283448916462,40.628389454792,40.6284257203064,40.6284787259171,40.6285401154939,40.6286127013561,40.6286825059188,40.6287523111492,40.6287858823654,40.6288278053418,40.6288669689403,40.6288810740798,40.6288251263882,40.6287692977422,40.6287245678515,40.6286771112604,40.6285989339908,40.6285234773403,40.6284509462999,40.6283728429298,40.6283562053677,40.6283451757516,40.6283005363068,40.6282362701305,40.6281777738524,40.6281639693392,40.6282059617714,40.6282841496731,40.6283093158388,40.6282535353413,40.6282509048543,40.6282677783708,40.628270708724,40.6282736218203,40.6282653717692,40.6282067416507,40.6281565150894,40.6281537940545,40.6282013085539,40.628181862826,40.6281288885188,40.6280313024525,40.6279811296118,40.627919857691,40.6279422487007,40.6280148077852,40.6280929316154,40.6281571169604,40.6282045413847,40.6282612710596,40.6284083502626,40.6284882026479,40.6285920739921,40.6286639075247,40.628903478733,40.6290149678854,40.6290235918699,40.6291422577473,40.6293815690751,40.6296527298793,40.6300279279385,40.6303233042284,40.6305723940522,40.6312614980979,40.6314267205643,40.6315903295952,40.6317520476757,40.6319116004961,40.6320687174176,40.6322231319317,40.6323745821114,40.6324669885278,40.6325605279219,40.63265479857,40.6327493956057,40.6328439127594,40.6329379441026,40.633031085792,40.633122937803,40.6332131056486,40.6334158776627,40.6336176914277,40.6338443831601,40.6339781177747,40.6342362254285,40.6345762184361,40.6346434256874,40.6349788805658,40.6351254373473,40.6352988089747,40.6355785518356,40.635794106455,40.6363293744819,40.6369286608493,40.6374399891538,40.6385013558991,40.6388234942368,40.6388626850669,40.638881937219,40.6389284902208,40.6370749273681,40.636614718448,40.6358797268366,40.6358114565237,40.6358108409342,40.6357839816398,40.6357641443094,40.6357514079843,40.635745823412,40.6357474128442,40.6357561699478,40.6357720598304,40.6357950191791,40.6358249565128,40.6358617525467,40.6359052606675,40.635955307517,40.6360116936835,40.6360741944953,40.6361425609163,40.6362165205382,40.6387879967046,40.6393538732393,40.6399540721631,40.6389876558977]}],[{"lng":[-73.8362610972438,-73.8363307472129,-73.836589550425,-73.8373877877964,-73.8372940791441,-73.8368133457516,-73.8359232007328,-73.8362610972438],"lat":[40.6453516770483,40.6453211492796,40.6458924652605,40.6491181499693,40.6491370624168,40.6492494150021,40.645499790675,40.6453516770483]}],[{"lng":[-73.830798778959,-73.8314872351721,-73.8345349730474,-73.8346528817715,-73.834768948913,-73.8348827314799,-73.8349937951982,-73.8351017161689,-73.8352060824859,-73.8353064958075,-73.8354025728767,-73.8354622853076,-73.8355170245918,-73.8355658711894,-73.8356080045444,-73.8356427168687,-73.8356694250324,-73.8356876803601,-73.8356971761692,-73.8356977529232,-73.835732481736,-73.8357605262252,-73.8357817029928,-73.8357958735459,-73.8358029452041,-73.835802871705,-73.835972234305,-73.8354713658254,-73.8345606990977,-73.8336384528618,-73.8327190986577,-73.8317960415922,-73.8310888527372,-73.830798778959],"lat":[40.6489765592065,40.6478872785163,40.6480251307883,40.6480450710976,40.6480705189918,40.6481013773446,40.64813752838,40.648178834121,40.6482251369168,40.6482762600439,40.6483320083805,40.6483583419314,40.6483903366385,40.6484274550422,40.6484690736118,40.6485144932202,40.6485629508866,40.6486136325943,40.648665686964,40.6487182395553,40.6487801814213,40.648844057984,40.6489094515642,40.6489759345618,40.6490430722521,40.6491104256279,40.6493487634152,40.6494129637872,40.6495443036767,40.6496762240526,40.6498085002564,40.6499406829504,40.6500539328134,40.6489765592065]}],[{"lng":[-73.8267194354685,-73.8263924291048,-73.8265028981986,-73.8266446165348,-73.8268003393198,-73.8270150257283,-73.827422970595,-73.8276941936826,-73.8280113905908,-73.8282148522688,-73.8284604110572,-73.8289147559749,-73.829062796234,-73.8292814682135,-73.8294167422872,-73.8295969736259,-73.829271963309,-73.8289555302084,-73.8272431490016,-73.8268962339085,-73.8267194354685],"lat":[40.6495788193193,40.6483243486167,40.6483290266986,40.6484647462561,40.6486287580172,40.6487597127323,40.6488948564302,40.6489410825038,40.6490283200157,40.6490461715483,40.6491186777248,40.6493791558207,40.649501261032,40.6495776252135,40.6497338045871,40.6498276580859,40.6500467760495,40.6500818827522,40.6502871718497,40.6503497089878,40.6495788193193]}]],[[{"lng":[-74.1331958010138,-74.133012076688,-74.1330261157129,-74.133206962516,-74.1332156758573,-74.1333831291903,-74.1333690539633,-74.1332065670927,-74.1331958010138],"lat":[40.5363067420506,40.5362560650429,40.5362403369511,40.536290635641,40.5362786938578,40.5363244208309,40.5363561952254,40.5363113688086,40.5363067420506]}],[{"lng":[-74.1330758570279,-74.1329426645362,-74.1329712040365,-74.1331723597519,-74.1331612014116,-74.1330906261181,-74.1330758570279],"lat":[40.5363974880403,40.536322033082,40.5362946885775,40.5363551977209,40.536374002701,40.536352730957,40.5363974880403]}],[{"lng":[-74.1299384318979,-74.1300492851493,-74.1300583613018,-74.1300639275467,-74.130056678687,-74.1302086936159,-74.1301246813823,-74.1299291682386,-74.1298477133491,-74.1297640561907,-74.1296942741141,-74.129683755087,-74.129845555035,-74.1298581995889,-74.1297838485732,-74.1301198429037,-74.1301288370855,-74.1301405145484,-74.1302275429785,-74.1305216428305,-74.1304304813732,-74.130156229619,-74.1300844001854,-74.1300114871368,-74.1300027281495,-74.1301693579847,-74.1301780432739,-74.1301050558659,-74.130448398878,-74.1305417652116,-74.130839068519,-74.1307518766589,-74.1307392231043,-74.1306632732578,-74.130652542691,-74.1305787886114,-74.1305630482493,-74.1305024944502,-74.1304773330467,-74.1304074352643,-74.1303336609828,-74.130322448993,-74.1303431377212,-74.1303512139389,-74.1303993064345,-74.1304478491413,-74.1304629234235,-74.1304727724267,-74.1304852836062,-74.1304960178829,-74.1304253151432,-74.1306550137505,-74.1306730762554,-74.1307244736057,-74.1307595935483,-74.1307714868165,-74.130859188541,-74.1311532871527,-74.1310729489018,-74.1310333259679,-74.1309849719329,-74.1309722667295,-74.1308937147626,-74.1308810405841,-74.1308038106651,-74.1307192580885,-74.1306477472194,-74.1306376580377,-74.1306542804183,-74.1306632570622,-74.1307123044281,-74.1307213485793,-74.130724857721,-74.1307773681137,-74.1307997189629,-74.1308109301528,-74.1307378245925,-74.1308096571595,-74.1310905454396,-74.1311743698497,-74.1314742421533,-74.1313905948432,-74.1313815435178,-74.1313032651567,-74.1312929345616,-74.1312129025488,-74.131201984445,-74.131125475331,-74.1311151749001,-74.13103945369,-74.1309666880344,-74.1309567806802,-74.1309750911599,-74.1309848364327,-74.1310326382864,-74.1310430653383,-74.1310648833717,-74.1311021331362,-74.1311196228259,-74.1311306476128,-74.131059066661,-74.1311352951375,-74.131144777607,-74.1312251352698,-74.1314155635083,-74.1314974007248,-74.1317935081566,-74.1317117623692,-74.1317008480922,-74.1316216880518,-74.1316110719538,-74.1315333870204,-74.1315233806709,-74.1314446149421,-74.131433398168,-74.1313886951315,-74.131345587368,-74.13128102023,-74.1312554660054,-74.1311646637856,-74.1311954575527,-74.1312833709033,-74.1313327919193,-74.1313210134975,-74.1315130781355,-74.1315256488318,-74.1313541233686,-74.1313595632135,-74.1313765677607,-74.1312926979978,-74.1313615393585,-74.1317335677133,-74.1318138720177,-74.1321124449556,-74.1320291207995,-74.1320160616864,-74.1319400120769,-74.1319277612658,-74.1318502874135,-74.1318390526834,-74.1317657174954,-74.1316953037346,-74.1316840932061,-74.1316976760207,-74.1317211833283,-74.1317570017448,-74.1317653008701,-74.1318165419999,-74.1318266564925,-74.131846271476,-74.1318566132485,-74.1317852073063,-74.1318574037158,-74.1320320939242,-74.1320375804802,-74.1320494137472,-74.1321356051246,-74.1322158158141,-74.1324243851322,-74.1323510639316,-74.1319981705119,-74.1319219095146,-74.1319118212463,-74.1319349951574,-74.1319776807087,-74.1319894662691,-74.1319993425555,-74.1320484676798,-74.1320583272896,-74.1320795227956,-74.1320926020664,-74.1320182117625,-74.1320867758648,-74.1321320095263,-74.132175696402,-74.1322787327083,-74.1323581122609,-74.1323689455815,-74.1324530276407,-74.1327548049012,-74.1326690965781,-74.1325706919733,-74.1325423684931,-74.1324810728003,-74.1324340036424,-74.1323938063227,-74.1323220559062,-74.1322471738396,-74.1322359626934,-74.1322592520323,-74.1322652804669,-74.1323146229853,-74.1323980158417,-74.13240922529,-74.1323376970766,-74.1324105649482,-74.1326908356858,-74.1327760371171,-74.1330744557155,-74.1329948579623,-74.1329806082851,-74.1329126291606,-74.1328978564072,-74.1328652860073,-74.1328091729315,-74.132729246377,-74.1327179495538,-74.1326469400417,-74.1325668307093,-74.1325578613907,-74.1325813345097,-74.1326149153789,-74.1326419729534,-74.1326509029038,-74.1326683069897,-74.1327087688678,-74.132735602333,-74.132743451717,-74.1326672694533,-74.1327409674243,-74.132751514058,-74.1328316896652,-74.1328400770757,-74.1329184484724,-74.1329273713109,-74.13300283995,-74.1330172192023,-74.1330945751147,-74.1333918737734,-74.1333073206761,-74.1332965672141,-74.1332180691644,-74.1332084439259,-74.1331285324121,-74.1331193805895,-74.1330434052739,-74.1330308822823,-74.1329557718341,-74.1328863404222,-74.13287438281,-74.1328920362654,-74.1328992555211,-74.1329485062369,-74.1330138544643,-74.1330350883953,-74.1330440563831,-74.1329725293473,-74.1330465188757,-74.1332928568643,-74.133316868147,-74.1333278648839,-74.1334100436547,-74.1336813422143,-74.1336895773249,-74.1336657647278,-74.1338082326314,-74.1338605414038,-74.1335954379034,-74.1332106058526,-74.132775131134,-74.132465128574,-74.1322025929126,-74.1319373146341,-74.1311770640338,-74.131047864237,-74.1306287248031,-74.1300813626206,-74.130076208929,-74.1300717233712,-74.1300832539011,-74.1299693420299,-74.1299384318979],"lat":[40.5399471355583,40.539838507603,40.5398434374536,40.5398381341781,40.5398326703497,40.5397026638173,40.5396465870144,40.5395211535548,40.5394688955219,40.5394152229496,40.5394782403846,40.5394717195925,40.5393268569616,40.5393352417892,40.5393986762358,40.5396158083173,40.539621620972,40.5396291663654,40.5396837175563,40.5394255581197,40.539362920806,40.5391687766731,40.5391179263737,40.539180041715,40.5391723936585,40.5390328780234,40.5390400052993,40.5391017359679,40.5393451134319,40.5394093062557,40.5391475928925,40.5390899944717,40.5390810833725,40.5390275948343,40.5390200373593,40.5389680944134,40.5389570095824,40.5389143630738,40.5388966436845,40.5388474157642,40.5389090003818,40.5389004712445,40.5388824868442,40.5388754656979,40.5388336580322,40.5387914579815,40.5387783552353,40.5387697922956,40.5387589162553,40.5387659307763,40.5388303122301,40.5389909511321,40.5390035836325,40.539039527205,40.5390640878557,40.5390724054213,40.5391313398024,40.5388735741037,40.538818056361,40.5387915406734,40.5387591822643,40.5387506801908,40.5386981109949,40.5386896291471,40.5386379461253,40.5385813619149,40.5386421426947,40.5386353212863,40.538617311133,40.5386097061022,40.5385681458324,40.5385604830897,40.5385575091184,40.538513015779,40.5384924903141,40.5385001658394,40.5385644327865,40.5386122215632,40.5388015673798,40.538855160896,40.5385983148828,40.5385438431884,40.5385376519115,40.5384841126816,40.538477046175,40.5384223066917,40.5384148389432,40.5383625086463,40.5383554640357,40.5383049794674,40.5383676717246,40.538360738059,40.5383417499021,40.5383335460537,40.5382933063672,40.5382845286147,40.538266162333,40.5382348052208,40.5382188923252,40.5382269220237,40.5382889810629,40.538338357329,40.5383447330862,40.5383987657699,40.5385268082834,40.5385813808756,40.5383259919918,40.5382685275976,40.538261123051,40.5382074203662,40.5382002180133,40.5381475160776,40.5381407269852,40.5380872916074,40.5380796814869,40.5380493542243,40.5380201097101,40.5379763060431,40.5379589694089,40.5379001358684,40.5378724087738,40.5379334908337,40.5378913294398,40.5378846180804,40.5377107057328,40.5377185426384,40.5378715148574,40.5378752147379,40.5378874914995,40.5379567018708,40.538001720429,40.5382518403588,40.5383073586857,40.5380522966777,40.5379964806442,40.5379876716748,40.5379363722039,40.5379281091143,40.5378758484241,40.5378682691893,40.5378174462926,40.5378790286063,40.5378713531662,40.5378571233157,40.5378373567632,40.537807236782,40.53780025934,40.5377571700436,40.5377486648149,40.5377346437995,40.5377426182579,40.5378022907491,40.5378518889548,40.5379679843511,40.5379716303687,40.5379794938646,40.5380331271827,40.5379649260929,40.5377749602324,40.5377193985969,40.5374809844387,40.5375396629451,40.537532840977,40.5375137983262,40.5374787215402,40.5374690369734,40.5374609206732,40.537420553223,40.5374124501718,40.5373950336378,40.5374046522509,40.5374646022346,40.5375148908452,40.537545070135,40.5375742170234,40.5376429608344,40.5376959206564,40.5377031489924,40.5377602808614,40.53750453648,40.5374426083084,40.5373751270326,40.5373557044439,40.5373136708129,40.5372813927803,40.5372538274721,40.5372052220395,40.5372702254523,40.5372625512392,40.5372419009366,40.5372365553053,40.5371928058915,40.5371188644301,40.5371256843926,40.5371881207843,40.537236724416,40.5374268800733,40.5374840109159,40.5372291233041,40.5371745487339,40.5371648513319,40.5371185881608,40.537108534012,40.5370863689221,40.5370481798159,40.5369937872119,40.536986097732,40.5369370388106,40.5369973767242,40.5369914077574,40.5369717348832,40.5369458108326,40.5369249245722,40.5369180295992,40.5369045945043,40.5368733589693,40.5368545352432,40.5368613597278,40.536920189085,40.5369705140949,40.5369777152516,40.5370324622135,40.537038189751,40.5370917053819,40.5370977978442,40.5371493305393,40.5371591485777,40.5372120174252,40.5369579843476,40.536898641975,40.536891364213,40.5368382366512,40.5368317228501,40.5367776389289,40.5367714445542,40.5367200239293,40.5367115481735,40.5366612387219,40.5367260424113,40.5367196323024,40.5367014587936,40.5366950708849,40.5366515013971,40.536593692433,40.5365748756259,40.5365808445572,40.5366432820171,40.5366927380174,40.5368579800738,40.5368740867004,40.5368814630208,40.5369397223736,40.5367090843605,40.5367034248136,40.5366876435447,40.5365621761787,40.5365979624939,40.536817170339,40.5371460895409,40.5375198346231,40.5377851947322,40.5380100868674,40.5382371143753,40.5388894125571,40.5389976502628,40.5393660435279,40.539848874055,40.5398451195104,40.539851135241,40.5398594400534,40.5399677691115,40.5399471355583]}],[{"lng":[-74.1278675677062,-74.1278862637558,-74.1279283050762,-74.127691754505,-74.1275666076284,-74.1275576058033,-74.1277314342736,-74.1278982496164,-74.1278675677062],"lat":[40.543315180066,40.5433080770748,40.543373247056,40.5434557081918,40.5434993339345,40.5434803547261,40.5434230848037,40.5433661720648,40.543315180066]}],[{"lng":[-74.1277537560856,-74.1279896839074,-74.128030684975,-74.1280105487933,-74.127980052533,-74.1278189344656,-74.1276389685455,-74.1276299410406,-74.1277537560856],"lat":[40.5435660251842,40.5434843436311,40.5435505582789,40.5435572506073,40.5435090302188,40.5435643996446,40.5436281905961,40.5436088936174,40.5435660251842]}],[{"lng":[-74.1974980000875,-74.1936329911255,-74.1917684424512,-74.1906405300715,-74.1904620703501,-74.1903770210933,-74.1900602667698,-74.189980916187,-74.1899221412573,-74.1898963711543,-74.1899205888627,-74.1899751756534,-74.1900695778584,-74.190108808563,-74.1902518234609,-74.1901329419416,-74.1891953797036,-74.1892512669193,-74.1891966091692,-74.1890943144194,-74.1890398957837,-74.1890096735266,-74.1890353667766,-74.1891250824619,-74.1892227173139,-74.1891802498931,-74.1889207766972,-74.188666890252,-74.1884187174249,-74.1881763822238,-74.1879400057353,-74.1877097060639,-74.1874855982733,-74.1872677943703,-74.1870564031241,-74.186851530137,-74.18665327775,-74.1864617449917,-74.186277027529,-74.186099217619,-74.1860271449661,-74.185919772638,-74.1857085213456,-74.1847420761179,-74.1838252136254,-74.1834662119469,-74.1831259388962,-74.1793691998134,-74.1790769996092,-74.1783981394257,-74.1775803674472,-74.1765936607424,-74.1764087227188,-74.1762207053066,-74.1760299334002,-74.175836736932,-74.1756414494582,-74.1754444084295,-74.1753308557817,-74.1752187756933,-74.1751085148576,-74.1750004144386,-74.1748948087025,-74.1747920243117,-74.1742166231723,-74.1734645182208,-74.1722550766378,-74.1719192139948,-74.1718516652276,-74.171777239006,-74.1715081866497,-74.1712509821698,-74.1711033637115,-74.1707862269769,-74.1704674823617,-74.1701472932972,-74.1698258238223,-74.166889720225,-74.1659198171382,-74.1655501357253,-74.1649961655394,-74.1648521499664,-74.1647661213767,-74.1644273761467,-74.1643866512156,-74.1625647565192,-74.1526287023336,-74.1516371359177,-74.1501459479379,-74.1480214873466,-74.1472356836284,-74.1469905773909,-74.1458047420613,-74.1441858820751,-74.1418476464932,-74.1411063134086,-74.1402400878657,-74.1384659707023,-74.1381387369323,-74.137042581878,-74.1363534324276,-74.1357919339248,-74.1346185566227,-74.1342774930893,-74.133786066999,-74.1336031137798,-74.133421074384,-74.1332400720371,-74.133060229789,-74.1329214536417,-74.1327843625368,-74.1326491995887,-74.1325162036901,-74.1319538353831,-74.1309404878287,-74.1292832020009,-74.1291446441952,-74.1281479757139,-74.1278471150735,-74.1277349354834,-74.1276733110061,-74.1276175241908,-74.1275683879978,-74.1275266186025,-74.1274928245819,-74.127467498419,-74.12706747024,-74.1266568893801,-74.125672678039,-74.1253527570123,-74.1251589568915,-74.1240583616202,-74.1234975648371,-74.1233397304328,-74.1233395532961,-74.1233393647001,-74.1231838072792,-74.1231836648387,-74.1231835234829,-74.1230333613109,-74.123033196429,-74.1230330420598,-74.1228913599735,-74.1228912772967,-74.122891205807,-74.1227608403022,-74.1227606984399,-74.1227605800866,-74.1226437541449,-74.1220960212705,-74.1217262391975,-74.1218533359744,-74.1218307982974,-74.1217007550939,-74.1216043917063,-74.1213929926679,-74.1213604469873,-74.1213435208248,-74.121343520693,-74.1213425480553,-74.1213575078366,-74.1213575197575,-74.1213575435243,-74.1213881541003,-74.1213873134497,-74.1214453570591,-74.1216256400038,-74.1221685656974,-74.1225964492859,-74.1227896727344,-74.1231160913419,-74.123170037416,-74.1232219633198,-74.1234164888568,-74.1234515303664,-74.1235840138025,-74.1241856038726,-74.124899043723,-74.1239506369465,-74.1235966318533,-74.1232920615201,-74.1230928113978,-74.1216663634852,-74.1202400898627,-74.1194800974205,-74.1187603887196,-74.1180405535346,-74.1172129034508,-74.116410527291,-74.1163633640869,-74.1163000392628,-74.1161742246439,-74.1150993995063,-74.1147179679246,-74.1142986670062,-74.1135152232929,-74.1121123978743,-74.1101394717195,-74.1093621450181,-74.1086159408723,-74.1078679586248,-74.1071040086103,-74.106906924319,-74.1061723704817,-74.1055764550874,-74.104846271245,-74.1041315213253,-74.1039083073734,-74.1036812220584,-74.1034503639065,-74.1032158330786,-74.1029777313271,-74.102736162177,-74.1024912301959,-74.1022430416423,-74.1019917041854,-74.1017373268587,-74.1018921804773,-74.1027890436984,-74.105726964432,-74.1064492029203,-74.108910797,-74.1095362958096,-74.109846583999,-74.1099579851235,-74.1116526818833,-74.1120559474584,-74.1125256900003,-74.113684352106,-74.1142159849182,-74.1144180206408,-74.1149690458863,-74.1165629005628,-74.1167163144766,-74.1167626888337,-74.1183416929299,-74.1195748044552,-74.1196085410251,-74.1194585929116,-74.1207628817176,-74.1226989576037,-74.1238003156366,-74.124020471276,-74.1257267505036,-74.1272522789842,-74.1273005782192,-74.128116971999,-74.1289614164244,-74.1297560235694,-74.1304245963892,-74.1310866524171,-74.1317782811874,-74.1331682599924,-74.1345586822585,-74.1352807604433,-74.1360734337128,-74.1373898816613,-74.1376973159297,-74.1384119372381,-74.1386526590918,-74.138607417331,-74.1382019389324,-74.1374574353012,-74.1371118563389,-74.1369599246983,-74.1358571256614,-74.1364115311903,-74.1364906305002,-74.1364591218192,-74.1365161343927,-74.1365851134253,-74.1368062212155,-74.1369712915121,-74.1370644605967,-74.1370089477201,-74.1370234291123,-74.1370962780885,-74.1371325901367,-74.13706316638,-74.1371798712987,-74.1371561953731,-74.1371427044082,-74.1371277742088,-74.137078213445,-74.1370625904048,-74.1370106897443,-74.1369949419771,-74.1369447844645,-74.1369268016948,-74.1368768940086,-74.1368587469149,-74.136810493692,-74.1367926984513,-74.1367436503657,-74.1367253237981,-74.1366792756241,-74.1366605805461,-74.1366151533632,-74.1365882155452,-74.1365281077823,-74.1365012248162,-74.1364428921273,-74.1362608528093,-74.1361344825825,-74.1361154072406,-74.1362395396177,-74.1363837980196,-74.1364028731746,-74.1362843324106,-74.1363651085338,-74.136435225192,-74.1364391717441,-74.1366079566773,-74.1366125961063,-74.1371703182408,-74.1371728196847,-74.1371928751972,-74.1375083350885,-74.1374894199194,-74.1374795860377,-74.1374665685691,-74.1374500543941,-74.1374297615573,-74.1374154359189,-74.1373563462388,-74.1373418106858,-74.1373181132333,-74.1373065226544,-74.137245360787,-74.1372407714819,-74.1368443601136,-74.1368411843495,-74.1368158856208,-74.1368067000907,-74.1367446104737,-74.1367337016138,-74.1367145113051,-74.136611871107,-74.1365890707116,-74.1366338868159,-74.1368330007153,-74.1368734863086,-74.1368909529476,-74.1367488875703,-74.1374243461791,-74.13743335928,-74.1374155880228,-74.1374716610331,-74.1374878628649,-74.1375028996037,-74.1375299444234,-74.1374472348423,-74.1375029313671,-74.1375002251057,-74.1375179942879,-74.1375287784891,-74.1375493297227,-74.1378845693202,-74.1379496605065,-74.1380660822677,-74.1382249378188,-74.1382929754464,-74.1384106088553,-74.138487683166,-74.1385597655046,-74.1386260998263,-74.13868599038,-74.138738809006,-74.1387840017239,-74.138821094543,-74.1388496984331,-74.1388695134042,-74.1386948824643,-74.1387431508701,-74.1387215872574,-74.1387078443273,-74.1386878159363,-74.1386502624752,-74.1386275264903,-74.138585032909,-74.1385617721914,-74.1385207049438,-74.1384965123955,-74.1384582025146,-74.1384337707142,-74.1384212676957,-74.138368939089,-74.1383429695579,-74.1381781226809,-74.1381604783656,-74.1381219813778,-74.138104041929,-74.1380928465482,-74.1380414391879,-74.1376243074514,-74.1377562075567,-74.1377797569523,-74.1376791549426,-74.1376791831007,-74.1377049727256,-74.1377398788633,-74.137810487583,-74.1378440051603,-74.1378625017347,-74.1380279169009,-74.1380469476643,-74.1381006405007,-74.1381174254527,-74.1381708505838,-74.1381935223513,-74.1382488081468,-74.1382707348388,-74.1383276860086,-74.1383481216329,-74.1384066939789,-74.1384253020398,-74.1384846101395,-74.1385025718634,-74.1385626841155,-74.138580529965,-74.1386419764041,-74.1386572401004,-74.1387181944371,-74.1387350968491,-74.1387348404019,-74.1387553470346,-74.1390196507931,-74.1389909520359,-74.1389695667455,-74.1389175565917,-74.1388945440295,-74.1388407458788,-74.1388159437414,-74.1387626853579,-74.1387400277797,-74.1386884970684,-74.1385405135774,-74.1385335231334,-74.1384801032705,-74.1384569251964,-74.138433507414,-74.1383777036408,-74.1383567367762,-74.1382821167182,-74.1382582657618,-74.1381866993306,-74.1381626091427,-74.1380856119781,-74.1380616643531,-74.1380482078875,-74.1380019498981,-74.1379899016442,-74.1379799708294,-74.1378937755026,-74.1378679852454,-74.1379321825399,-74.1380434689781,-74.1380658961542,-74.1380100182888,-74.1380496762585,-74.1380750508895,-74.1380995242209,-74.1381081262648,-74.1390330717863,-74.1395393791575,-74.1394325300265,-74.1394223199802,-74.1394143618905,-74.1394209124511,-74.1393709360766,-74.1393646364857,-74.1393199694616,-74.1393128114546,-74.1392930274949,-74.1392859361402,-74.1392447370994,-74.1392361306353,-74.1391965238308,-74.1391880796118,-74.1391518746155,-74.1391452511424,-74.1391083881035,-74.1391510849762,-74.1391454134623,-74.1391027172494,-74.1391002975316,-74.1390326599032,-74.1390413466357,-74.139093349263,-74.1391126417672,-74.1392266068724,-74.1392695268101,-74.13927673845,-74.1393251494984,-74.1393317886663,-74.1393777453498,-74.1393835741522,-74.1394049744142,-74.1394100796816,-74.1394206933788,-74.1393389503218,-74.1392876729529,-74.1389745422676,-74.1389074304837,-74.138918176049,-74.1389598382897,-74.1389719318678,-74.1390105180371,-74.1391567587631,-74.1391556516464,-74.1391639630939,-74.1392059245196,-74.1392139823334,-74.139222498242,-74.1392459198726,-74.1391955356248,-74.1392203285981,-74.1392094720653,-74.1391221455991,-74.1390826685501,-74.1390591908738,-74.1390666913549,-74.139007249952,-74.1389663107242,-74.1389553685813,-74.1389149140473,-74.1389029151456,-74.1388922503264,-74.13883900359,-74.138839021337,-74.1388973366776,-74.1388757038836,-74.1388630956039,-74.1388135720421,-74.1387537487529,-74.1387481673031,-74.1387281244596,-74.1387459500122,-74.1388074727915,-74.1388283941223,-74.1390416557894,-74.1390505864382,-74.1390775065864,-74.1389511644535,-74.1388346058562,-74.1388032572411,-74.1388101931831,-74.1387890406868,-74.1387288051017,-74.138724315108,-74.1386543774743,-74.1386286421722,-74.1385438169607,-74.1385375337886,-74.1385386754694,-74.138598110509,-74.1385858115911,-74.1384415152368,-74.1384153583871,-74.1384231779986,-74.1384610259313,-74.1384960696307,-74.1385117433714,-74.1385228670692,-74.1385856815562,-74.1386034038477,-74.1386297991656,-74.1386857614533,-74.1387080850497,-74.1387263623944,-74.1387489078357,-74.1387662448573,-74.1387854116191,-74.1387971330171,-74.1388232546166,-74.1385399626833,-74.1385207723835,-74.1385234727591,-74.1384611529644,-74.1384480911765,-74.1384487663985,-74.1384743101221,-74.1384618395166,-74.1383777302258,-74.1383564588628,-74.1382983348389,-74.1382659207828,-74.1382066726707,-74.1382055862372,-74.1382930544063,-74.1382796445606,-74.138150686211,-74.1383653128652,-74.1384180179557,-74.1384392933049,-74.1384560524148,-74.1384659577477,-74.1385264974458,-74.1385074375195,-74.1385074357489,-74.1384481932546,-74.1384414872676,-74.1384112119993,-74.1384827478185,-74.1384467162899,-74.1383749174478,-74.1383415128872,-74.1385228283524,-74.1385559775708,-74.1384597196787,-74.1384928086554,-74.1385900530628,-74.1386203303137,-74.1385331454255,-74.1387295920718,-74.1388170234484,-74.1390334816122,-74.1390816750737,-74.1391016603784,-74.1391557062022,-74.1391857860319,-74.1392274114775,-74.1392807657693,-74.1393037714436,-74.1393113600942,-74.1393171794194,-74.1394234983264,-74.1394530007924,-74.1394582610717,-74.1394706125482,-74.1395334575353,-74.1395697169857,-74.139836977862,-74.138946327733,-74.1389104138615,-74.1387063239728,-74.1389063653945,-74.1389303781806,-74.1387714022684,-74.1388606107824,-74.1390367192296,-74.1390607329629,-74.1389444737817,-74.1389959210228,-74.138983556086,-74.1390255321564,-74.1396764048069,-74.1398649649508,-74.1398889740626,-74.1397035069418,-74.1398652726445,-74.1400411597063,-74.1399938355915,-74.1400128383593,-74.1400531071707,-74.1403107801387,-74.1403590481794,-74.1403857307362,-74.140417653353,-74.1403954453647,-74.1404605465627,-74.1403086580595,-74.1403294518924,-74.140328486945,-74.1403143311892,-74.1402968135332,-74.1402481747275,-74.1402349117956,-74.1402849149242,-74.1402845810487,-74.1402435066555,-74.1402146168789,-74.1401994549969,-74.1401481306896,-74.1401237224228,-74.1400820974482,-74.1400597053837,-74.1400123251471,-74.140002816377,-74.1399456670363,-74.1398928355638,-74.1398640229818,-74.1398230015271,-74.1397835972965,-74.1397475759366,-74.1397018303631,-74.1396943683802,-74.1394343803689,-74.1393499484191,-74.1392418163462,-74.1392199348589,-74.1392398700021,-74.1392662024225,-74.1392976032395,-74.1394081007749,-74.1394335677836,-74.1393844546519,-74.1393850803355,-74.1394248599056,-74.1394517752989,-74.1394779108185,-74.1394889321991,-74.1395469031382,-74.1395574303407,-74.1396172103362,-74.1396265230697,-74.1396822673311,-74.1396938075877,-74.1397485048107,-74.1397617742256,-74.1398181529452,-74.1398531321059,-74.1398843928231,-74.139914123457,-74.1399522746247,-74.1399655641107,-74.140020807982,-74.1400346596462,-74.1402264153127,-74.1402957194717,-74.1402093756951,-74.1402138440382,-74.140126382196,-74.1402873453912,-74.1402099773015,-74.1401968563254,-74.1401234502256,-74.1401109294879,-74.140036949704,-74.1400260673189,-74.1399503890821,-74.1399395295931,-74.139865047743,-74.1398541018355,-74.1397790278328,-74.1397692726916,-74.1396925037659,-74.1396821805463,-74.1396070989075,-74.1395962056269,-74.1395510241322,-74.1395102374656,-74.1394575344069,-74.1393871175655,-74.1393613280403,-74.1395368154802,-74.1395637247472,-74.1394787720568,-74.1395325973095,-74.1395604458975,-74.1396165251469,-74.1396291817578,-74.1397004841452,-74.1398717306776,-74.1398769801203,-74.1398943278236,-74.1399648500681,-74.1399847618294,-74.1400511078222,-74.1401472042111,-74.1402218880646,-74.1402334508699,-74.1403063425824,-74.1406271556695,-74.1405364876761,-74.1405232836345,-74.1404331722908,-74.1404217145911,-74.1403531925726,-74.1403189574444,-74.1402305954427,-74.1402202471597,-74.1401388731898,-74.1401169217058,-74.1400580003808,-74.1400158651296,-74.1399967396663,-74.1397558489045,-74.1396586048651,-74.1396316907417,-74.1398585989168,-74.1398855083912,-74.1397748477659,-74.1406461486982,-74.1408452030384,-74.1408723827923,-74.1410444264414,-74.141090698972,-74.1409666136991,-74.1409842195068,-74.1411054211201,-74.1412567340974,-74.1413242679425,-74.1412880791593,-74.1412833162767,-74.1403850059005,-74.1404050835934,-74.1404089750761,-74.1404377831108,-74.1404068533478,-74.1402867336948,-74.1401651003757,-74.1402809629197,-74.1403268363326,-74.1403352822975,-74.1403587418791,-74.1402072360658,-74.1402407304093,-74.1402863024433,-74.1404065630069,-74.1404811921024,-74.140430953861,-74.1404271920767,-74.1412093428835,-74.1413046198024,-74.1412971876655,-74.1413338750065,-74.1414107356041,-74.1410789211906,-74.1411614790294,-74.1410666361407,-74.1410843680481,-74.1411787955051,-74.141186931837,-74.1412951184685,-74.1413265310582,-74.1412282081443,-74.1411237594645,-74.1411431129907,-74.1412494936626,-74.1413354719298,-74.1413155442272,-74.1412861937638,-74.1412195802226,-74.1412501120361,-74.1411981178077,-74.1411865365783,-74.1411269185524,-74.1411143566795,-74.1410439934951,-74.1410303146288,-74.140953507469,-74.1409427941321,-74.1408591544129,-74.1408480146602,-74.1407599655757,-74.1407479289836,-74.1406579755258,-74.1406454973486,-74.1405689769331,-74.1405408621766,-74.1404637825669,-74.140412617325,-74.1404051034956,-74.140262904007,-74.1402951165258,-74.1404750371843,-74.1404958101131,-74.1405372971381,-74.1405784498144,-74.1405974111504,-74.1406282146711,-74.1406586485687,-74.1406799809315,-74.1407035302887,-74.1405947234336,-74.1406341728333,-74.1406191991196,-74.1407910422767,-74.1408209855653,-74.1408971857562,-74.1409910926802,-74.1410037561309,-74.1410154329907,-74.141110381509,-74.1412192420469,-74.1413432013884,-74.1413375849731,-74.141349013796,-74.1414615158544,-74.1412765750322,-74.1412944212369,-74.1414809747445,-74.1415310943973,-74.1413485469455,-74.1413633083768,-74.1415495790598,-74.1416491130329,-74.1417971995705,-74.1417725253279,-74.1408945109062,-74.1408870279018,-74.1408463314218,-74.1406609522099,-74.1406398417213,-74.14095816833,-74.1409804858693,-74.1408957868829,-74.1408947758341,-74.1418126777277,-74.141851928913,-74.1418730797193,-74.1416722624308,-74.1416923709882,-74.1417256964483,-74.1417603771746,-74.141811459477,-74.1418620810854,-74.1419107125197,-74.1419558844323,-74.1420382920603,-74.1420772433622,-74.1421052671333,-74.1421198139798,-74.142134677456,-74.142152671742,-74.1421683426095,-74.1421798108254,-74.1422071446211,-74.1422335491381,-74.1422449401418,-74.1422557582954,-74.1422573033014,-74.1422638016156,-74.1422709609045,-74.1422775702886,-74.1422835843889,-74.1422889674903,-74.1422929736676,-74.1422963224616,-74.1422989863035,-74.1423009433418,-74.1423021723809,-74.1423026676015,-74.1423024207737,-74.1423014350807,-74.142299720518,-74.1422974331687,-74.1422942338295,-74.1422901533955,-74.142285234167,-74.1422795263458,-74.1422730893579,-74.1422628937245,-74.1422532871972,-74.1422443058514,-74.1422359842281,-74.1422283505018,-74.1421892720889,-74.1421862311809,-74.1421840057632,-74.1421826077949,-74.1421820474816,-74.1421823260244,-74.1421834428668,-74.1421853913058,-74.1421881587051,-74.1421894647174,-74.1421915168819,-74.1421943086864,-74.1421978294436,-74.1422020653937,-74.1422069996969,-74.1422126130997,-74.1422188826151,-74.1422374015423,-74.1422420473591,-74.142247424173,-74.1422535208409,-74.1422603211703,-74.1422678113811,-74.1422759715399,-74.1423143853146,-74.1423176270807,-74.1423217499556,-74.1423267423735,-74.1423325923288,-74.142339285394,-74.142343506224,-74.1423470276568,-74.1423498146734,-74.1423518377538,-74.1423530783546,-74.1423535214562,-74.1423531667456,-74.1423520126031,-74.1423500765002,-74.1423244729782,-74.1423240877764,-74.1423244768684,-74.142325642308,-74.142327577351,-74.1423302781133,-74.1423337382978,-74.1423379443544,-74.1423428866883,-74.1423518133823,-74.1423615091497,-74.1423719525286,-74.142383120511,-74.1423949883431,-74.1424075332345,-74.1424166286494,-74.1424252486312,-74.1424333442687,-74.1424408664404,-74.1424477721831,-74.142454021165,-74.142459576142,-74.1424644068979,-74.1424684827766,-74.1424717825796,-74.142474282463,-74.1424759733085,-74.1424769228071,-74.1424771396287,-74.1424766223596,-74.1424753766066,-74.142473414127,-74.1424707550166,-74.1424674248611,-74.1424634578086,-74.1424588912874,-74.1424537721654,-74.1424465453577,-74.1424402279978,-74.1424348540059,-74.1424304509485,-74.1424270404606,-74.1424239201753,-74.1424199956322,-74.1424152809657,-74.1424097931572,-74.1424035531522,-74.1423965842932,-74.1423889092743,-74.1423805582456,-74.1423715637779,-74.1423605126077,-74.1423500904051,-74.1423403211545,-74.1423312292868,-74.142322834615,-74.1423151567419,-74.1423038948644,-74.1422918550031,-74.1422790563085,-74.1422655170535,-74.142251990225,-74.1422390501061,-74.142226712763,-74.142214993161,-74.142209330651,-74.1422044753351,-74.1422004448579,-74.1421972493989,-74.1421949013318,-74.1421934073192,-74.1421963826621,-74.1422002584717,-74.1422050205657,-74.142210651021,-74.1422171268755,-74.1422244236183,-74.1422403126868,-74.142260540763,-74.14227115485,-74.1422679383822,-74.1422640596368,-74.1422595439468,-74.1422544199476,-74.1422487191163,-74.1422424799543,-74.1422357400829,-74.1422261946584,-74.1422161018874,-74.1422054910173,-74.142194384483,-74.1421828053818,-74.1421707822984,-74.1421583438163,-74.1421367387072,-74.1421155289057,-74.1420947383713,-74.1420743908393,-74.1420666586712,-74.1420594666685,-74.1420528559647,-74.1420468626468,-74.1420415247836,-74.1420368705712,-74.142032925565,-74.1420297153256,-74.1420272588336,-74.1420255671603,-74.1420246509445,-74.1420250107977,-74.1420261167223,-74.1420279628964,-74.1420305338338,-74.1420338094375,-74.1420377630136,-74.1420423654518,-74.1420475773192,-74.1420533199621,-74.1420585082227,-74.1420630796289,-74.1420669739073,-74.1420701422171,-74.142072543628,-74.1420741501806,-74.1420749378643,-74.1420748993622,-74.1420674056883,-74.142059238979,-74.1420504128864,-74.1420409375537,-74.1420308266335,-74.1420200926767,-74.1420087497775,-74.1420014600035,-74.1419933905226,-74.1419845888643,-74.1419751056213,-74.1419649979698,-74.1419530996405,-74.14194144745,-74.1419300800708,-74.1419190381606,-74.1419083628128,-74.141905178021,-74.1419028165796,-74.1419012902253,-74.1419006087309,-74.1419007796708,-74.1419017978841,-74.1419036601825,-74.1419063545986,-74.1419087088378,-74.1419103404395,-74.1419112488061,-74.1419114274114,-74.1419108785163,-74.1419096017471,-74.1419076017762,-74.1419048824009,-74.1418992661718,-74.1418927602908,-74.1418853852731,-74.1418771699633,-74.1418681407949,-74.1418560509222,-74.1418432286935,-74.141829705789,-74.1418155075133,-74.1418097456629,-74.1418041589966,-74.1417988338566,-74.1417938552907,-74.1417893002303,-74.1417852379461,-74.1417817339772,-74.141778845324,-74.1417766138326,-74.141775074119,-74.14177425312,-74.1417741608571,-74.1417745828461,-74.1417757347006,-74.141777599875,-74.1417801484221,-74.141783344899,-74.1417871389231,-74.1417914761493,-74.1417962927772,-74.1418015148865,-74.1418070639425,-74.1418128587465,-74.1418188152345,-74.1418248412064,-74.1418308468454,-74.1418367449663,-74.1418424463789,-74.141849574525,-74.1418562281915,-74.141862348381,-74.1418678848933,-74.14187278885,-74.1418770170853,-74.1418805367691,-74.1418833124347,-74.1418853246515,-74.1418865535556,-74.1418869900384,-74.1418866300506,-74.1418866778648,-74.1418859580124,-74.1418844690196,-74.1418822195245,-74.1418792126679,-74.1418754605931,-74.1418709734659,-74.1418657658507,-74.1418589827459,-74.1418528874453,-74.1418474874538,-74.1418427922617,-74.1418388084981,-74.141835543235,-74.1418329998135,-74.1418323787521,-74.141832518549,-74.1418334217093,-74.1418350813001,-74.1418374901552,-74.1418406347515,-74.14184449782,-74.1418490636366,-74.1418543050503,-74.141860195569,-74.1418667047398,-74.1418738012359,-74.1418814475652,-74.1418896792612,-74.1419588983603,-74.1419842894971,-74.1420066635637,-74.1420045928259,-74.141981813544,-74.1419293290513,-74.141874586726,-74.1418258931128,-74.1417672134245,-74.1417415875669,-74.141728926513,-74.141736984962,-74.1417643319954,-74.1418878357749,-74.1420304581729,-74.1420989413994,-74.1421719510024,-74.1422193470573,-74.1422729651163,-74.1423035127585,-74.1422370026981,-74.1422563863939,-74.1423383157749,-74.1421518306091,-74.1417658779377,-74.14226513008,-74.1422492838908,-74.142208249259,-74.142213223178,-74.1418676229157,-74.1418378938827,-74.1422005257148,-74.142206652117,-74.1422299229476,-74.1421979471238,-74.1420789364411,-74.1421671801914,-74.1421475252518,-74.1421393773751,-74.1412186533555,-74.1411977050378,-74.1410673688248,-74.1410415791645,-74.1412032253678,-74.1412982547183,-74.1413207359166,-74.1412374249006,-74.1412411305159,-74.1421757693925,-74.1421624077917,-74.1421857484178,-74.1423896368971,-74.1415828769089,-74.1417341057238,-74.143051626138,-74.1438338568534,-74.1439151265721,-74.1439909709676,-74.1440610657712,-74.1441251113002,-74.1441828337391,-74.1442339863104,-74.1442783503291,-74.1442810860083,-74.1442965012326,-74.1443739905695,-74.1443887449075,-74.1445550732394,-74.1447406981358,-74.1447885097663,-74.1448892910995,-74.1450977156786,-74.1454337438297,-74.1455865445807,-74.1457353409081,-74.1458027725311,-74.1458547637556,-74.1460200828477,-74.1459498106447,-74.1459966961509,-74.146192474232,-74.1466964768539,-74.1470185317634,-74.1479432004613,-74.1485105181235,-74.148701589091,-74.1492173326397,-74.1497771748935,-74.1497782491362,-74.149718302903,-74.1497584648982,-74.1498063382385,-74.1498615444959,-74.1499236472845,-74.1499921557098,-74.1500165372708,-74.1501287989923,-74.1503004530457,-74.1502625151295,-74.1502424780305,-74.1502150610648,-74.1502678863653,-74.1502934762355,-74.1502789130223,-74.150315444394,-74.1504652407391,-74.1506955361828,-74.1510243472269,-74.1511039228103,-74.1511202569053,-74.1512500770393,-74.1514503586113,-74.1517579883162,-74.1517616998489,-74.1517644226165,-74.1517660749064,-74.1517666071321,-74.1517660033212,-74.1517642815949,-74.1517614936241,-74.1517577230783,-74.1517336092612,-74.15171021697,-74.1517023907076,-74.1516955352866,-74.1516898270363,-74.1516854127791,-74.1516824060544,-74.1516808841982,-74.1516808863538,-74.1516824124653,-74.1516854232789,-74.1516898413528,-74.1516955530488,-74.1517719199291,-74.1518533774449,-74.1518850288432,-74.151917979421,-74.1519513001553,-74.1519840515869,-74.1520153103075,-74.1520441949941,-74.1520685032794,-74.1520925680253,-74.1521158866009,-74.1521491673471,-74.1521806163944,-74.1522249361209,-74.1522729493926,-74.152323461553,-74.1523519720638,-74.1523885251543,-74.152423652256,-74.1524566093669,-74.1527708160401,-74.153289681867,-74.1534143069551,-74.1535087770206,-74.1536428715169,-74.1538317430854,-74.1540010766683,-74.1540081009582,-74.1539913543887,-74.1539025493866,-74.1538902523837,-74.1538983168261,-74.1539140261925,-74.1539424526646,-74.154095269167,-74.1541038153475,-74.1541182739415,-74.1541396143106,-74.15421587091,-74.1542925426001,-74.1543106878642,-74.1542860193601,-74.154267605261,-74.1542641335083,-74.1544981889385,-74.1545435689491,-74.154587002738,-74.1546149415534,-74.1546280787068,-74.1546449027018,-74.154697948992,-74.1544965236643,-74.1545435737446,-74.154928948494,-74.155046498919,-74.1551594972906,-74.1552676930732,-74.1553708463825,-74.1554687285176,-74.1555611224676,-74.1556478233932,-74.1554708552025,-74.1555035725126,-74.1557315343504,-74.1558637078412,-74.1559900032041,-74.1561101114859,-74.1562237388739,-74.1563306074144,-74.1564304556928,-74.1564486815002,-74.1561343743413,-74.1561873185234,-74.1566710520816,-74.156769179131,-74.1570186194639,-74.1572094846264,-74.1576097571092,-74.1578975357057,-74.158261031073,-74.1579488662245,-74.1579723945791,-74.1583264512699,-74.1584868712747,-74.1586405629104,-74.1586769630403,-74.1589018064882,-74.1591709240627,-74.1592831615918,-74.1593946054225,-74.1597013452021,-74.1598827705104,-74.159943678737,-74.1599934162541,-74.160011461602,-74.1600402239584,-74.1600555468368,-74.1600841922727,-74.1601306592996,-74.1601683936671,-74.1601935940524,-74.1602075174051,-74.1602258248754,-74.1602323185639,-74.1602571671364,-74.1602645075876,-74.1603042631384,-74.1603409737604,-74.1614641213904,-74.1615266651522,-74.1615462537772,-74.1615821742364,-74.1616474346922,-74.1616914131532,-74.161758815513,-74.1618274907331,-74.161897175874,-74.1619669783145,-74.162031175121,-74.1620663617327,-74.1620979686216,-74.1621439048381,-74.1622024479696,-74.1622257796204,-74.1622719610877,-74.1623303919198,-74.1623851256374,-74.1624403983034,-74.162506987289,-74.1625653612058,-74.1626319894437,-74.1626985531513,-74.1627628075159,-74.1628275785467,-74.1628952014166,-74.1629575060758,-74.1630173201183,-74.1630784953536,-74.1631260853713,-74.1631718120642,-74.1632265451311,-74.163285897986,-74.1633490917514,-74.1634086582535,-74.1634684903538,-74.163515959225,-74.1635640401489,-74.1636173829083,-74.1636730582785,-74.1637200159474,-74.1637890486374,-74.1638400880735,-74.1638862937316,-74.1639346428997,-74.1640126284717,-74.1640812281049,-74.1641591907777,-74.1642465201276,-74.1645396785121,-74.1649949200173,-74.1653067215738,-74.1655417511386,-74.1656435384182,-74.1660596182414,-74.1662403892162,-74.1665789678752,-74.1669046254078,-74.1675586747795,-74.1682956077942,-74.1683909100364,-74.1688443181989,-74.1689855713685,-74.169200668004,-74.1693513613477,-74.1694477174347,-74.1695529927632,-74.1696371449395,-74.1696796034277,-74.1698324896499,-74.1699971116147,-74.170072694894,-74.1701458605859,-74.1702249873314,-74.1703319375672,-74.1704077231625,-74.1705079166037,-74.1706048569997,-74.1706369257331,-74.1706604380607,-74.1708469488819,-74.1708994109652,-74.1709765805536,-74.1710880310484,-74.1711491599993,-74.1712868206729,-74.1713583289623,-74.171963361618,-74.1726966726301,-74.1727827109066,-74.1734263592897,-74.1750681074511,-74.1760124547907,-74.1776199213664,-74.1775997471967,-74.1775996944692,-74.1775805755356,-74.1775704157284,-74.1775501786415,-74.1775688185343,-74.1775829552211,-74.1775865413838,-74.1775902825326,-74.1775940836053,-74.1775978480174,-74.1776014801158,-74.1776048876094,-74.1776079839143,-74.1777192357539,-74.1777871892956,-74.178270812738,-74.1783187669066,-74.1783708290041,-74.1784255844891,-74.1784936298496,-74.1785603594698,-74.1786252593936,-74.1787024096099,-74.1787812820957,-74.1788611417559,-74.1789412442945,-74.1790208431516,-74.1790991964618,-74.1791755739694,-74.1791799693001,-74.1791856464765,-74.1791924374071,-74.1792001410245,-74.1792085292384,-74.1792173536889,-74.1792263530999,-74.1792352610151,-74.1792438136874,-74.1792517578875,-74.1792588584019,-74.179264904997,-74.1792697186436,-74.1792731568179,-74.1792977324759,-74.1793230341673,-74.17935437769,-74.1793913755334,-74.1794335702766,-74.1794371660199,-74.1794651674372,-74.1797077029207,-74.1798101694893,-74.1799933878635,-74.1801035094662,-74.1802422811957,-74.1803392618544,-74.1805045748491,-74.1806538541483,-74.1808915887945,-74.1810519274683,-74.1811654866347,-74.1814789842872,-74.1818200684788,-74.1818943444168,-74.181921553696,-74.1819566713462,-74.1820408128408,-74.1821336206489,-74.182434614175,-74.1828826819165,-74.1831685505845,-74.1833234677978,-74.1833677961302,-74.1834237058341,-74.1838130349663,-74.184036962428,-74.1841732275698,-74.1842854831701,-74.1848311647976,-74.18516290371,-74.1854614088712,-74.1858873016409,-74.1865673319121,-74.1876196413375,-74.1878073273764,-74.1879892297976,-74.188165194138,-74.1883350709814,-74.1884987160854,-74.1886559905034,-74.1888067607031,-74.1889508986794,-74.1890614099309,-74.1891673811421,-74.1892687555733,-74.1888461438681,-74.1888440421474,-74.1888423047587,-74.1888409826161,-74.1888401144651,-74.1888397257468,-74.1888398278525,-74.18884041779,-74.1888414782712,-74.1888429782185,-74.1888448736759,-74.1888471090971,-74.1888496189729,-74.1888523297514,-74.1888551619932,-74.1888580326995,-74.1894093308204,-74.189450739747,-74.1894948529025,-74.1895404387342,-74.1895862245739,-74.1896309321696,-74.1896733133725,-74.189712184984,-74.1915809030147,-74.1916204737185,-74.1916686351526,-74.1917250268369,-74.1917892266977,-74.1918607542278,-74.1919390740823,-74.1920236000862,-74.1921136996209,-74.1922086983595,-74.192799963814,-74.1928156738428,-74.1931659556441,-74.1933080731872,-74.1934431834744,-74.1935710900063,-74.1936916067663,-74.1938045584914,-74.1939097809266,-74.1940071210637,-74.1940964373637,-74.1952133999907,-74.1959348560981,-74.1960308768679,-74.1961269306449,-74.1962224082411,-74.1963167041221,-74.1964092202473,-74.1964993698621,-74.1965865812193,-74.1967023697331,-74.1968133887229,-74.1969191830281,-74.1970193189038,-74.1972539980279,-74.1974831421117,-74.1977065735328,-74.1977915453048,-74.1978824520969,-74.1979789235048,-74.1980805664466,-74.1981814404798,-74.1982866801963,-74.1983958922196,-74.1984996773164,-74.1986083170499,-74.1987213206051,-74.1988381774482,-74.1989583596335,-74.1990813241889,-74.1992065155691,-74.1993333681666,-74.1994613088668,-74.1994923997767,-74.1995244739947,-74.1995567375451,-74.1995883917653,-74.1996186530759,-74.1996467723775,-74.1996720535937,-74.199693870902,-74.1997116842251,-74.1997710447361,-74.1998237174284,-74.1998690772684,-74.1999065859931,-74.1999357984984,-74.1999563681213,-74.1999680507544,-74.1999707077438,-74.1999643075351,-74.1999489260498,-74.1999426916604,-74.1999442106262,-74.1999534483213,-74.1999701940979,-74.1999940660883,-74.2000245199122,-74.2000501593101,-74.20006802266,-74.2000779248485,-74.2000797632515,-74.2000735187982,-74.2000592561698,-74.20003712313,-74.1999296094449,-74.1999024792595,-74.1989257279387,-74.198957974612,-74.1990730709549,-74.1991872469476,-74.1992544893992,-74.1992860307516,-74.1993612740788,-74.199438223551,-74.1995157502401,-74.1995927167488,-74.1996679938991,-74.1997075319591,-74.1997459515191,-74.1998140831403,-74.1998846562205,-74.1999565998814,-74.2000288224486,-74.2001002280157,-74.2001852001867,-74.2002730485091,-74.2003632241255,-74.2004551636361,-74.2005482926195,-74.2006420292218,-74.2007357877921,-74.2008289825424,-74.2009773805587,-74.2012423234314,-74.2026808110234,-74.2032300331207,-74.2039166855279,-74.2041974636685,-74.2044774626474,-74.2046446630922,-74.2046701067149,-74.2047020342323,-74.2047426293845,-74.2047973790682,-74.2048531733814,-74.2049096658699,-74.2051961350977,-74.2052509043924,-74.2053053218315,-74.2053586899099,-74.2075686699832,-74.2077840491888,-74.2079958384085,-74.2082037057757,-74.2084073255726,-74.2086063787409,-74.2088005533821,-74.2089895452463,-74.2091730582089,-74.2093508047349,-74.2095225063295,-74.2096878939744,-74.209277766522,-74.2092212241766,-74.209189968252,-74.209322004642,-74.2093583773562,-74.2093018345794,-74.2097137420588,-74.2098533812855,-74.2099930965332,-74.210134660336,-74.2102697002434,-74.210398036021,-74.2105194963871,-74.2106339192421,-74.2107411518841,-74.2108410512128,-74.2109334839203,-74.2110183266687,-74.211095466255,-74.2111064976277,-74.2111198592798,-74.2111408668886,-74.2111652490544,-74.2111925033261,-74.2112220680678,-74.2112471378024,-74.2112702601689,-74.2112909292144,-74.2113086926695,-74.2113231618443,-74.2113394556123,-74.2113566629597,-74.2113715574167,-74.2113883208903,-74.2114965088055,-74.2115985998612,-74.2116944383744,-74.2117838782008,-74.2117883227622,-74.2117948024028,-74.2118034799095,-74.2118146692043,-74.211819320854,-74.2118169404581,-74.2118131463351,-74.2117947880251,-74.2117844061872,-74.2117847784607,-74.21179183198,-74.2118044751174,-74.2118293511967,-74.2118495249945,-74.2118620610049,-74.2118724325809,-74.2118827557614,-74.211892724218,-74.2119020421485,-74.2119104330541,-74.2119868247556,-74.2120572830471,-74.2121214688054,-74.2121790731023,-74.2122298186913,-74.2122734613416,-74.2122664549997,-74.2122612179734,-74.2122579031508,-74.2122566073031,-74.2122573682604,-74.2122601638064,-74.2122649123281,-74.2122714751975,-74.2122796608196,-74.2122892302252,-74.2122999040476,-74.2123113706781,-74.2123232953635,-74.2123353299782,-74.2123471231873,-74.2123593518628,-74.2123714471938,-74.212383097428,-74.2123940022854,-74.2124038806978,-74.2124124780536,-74.2124195727599,-74.2124249819541,-74.2124691096852,-74.2125214504811,-74.2125815581687,-74.2126042925506,-74.2126319137639,-74.2126639360668,-74.2128140336436,-74.2129603391751,-74.2129976722794,-74.2130397063935,-74.2130860894128,-74.2131364328057,-74.2132229856602,-74.2133048157586,-74.2133816997362,-74.2134534277324,-74.2135198039636,-74.2135269208752,-74.2135320636739,-74.2135350941804,-74.2135359309698,-74.2135345515597,-74.213530993014,-74.2135179402934,-74.2135135996397,-74.2135181001989,-74.2135313080367,-74.2135586929415,-74.2135845459427,-74.2136082860393,-74.2136293797135,-74.2136473529202,-74.213751712362,-74.2138077855147,-74.2138309431717,-74.2138553384754,-74.213880317884,-74.2139052122079,-74.2139293545365,-74.2143425012972,-74.2145052736095,-74.2146634888394,-74.2148168795194,-74.2149651863416,-74.2151081585963,-74.2152455545961,-74.2153771420838,-74.2155210259931,-74.2156583741019,-74.2157889225522,-74.2159124205547,-74.2160286308701,-74.2161373302652,-74.2162383099411,-74.2163313759347,-74.2164163494906,-74.2173545344275,-74.2174097577808,-74.2175185365031,-74.2175264844758,-74.2175362057039,-74.2175475509568,-74.2175640128425,-74.2175824016435,-74.2176022630016,-74.2176231061741,-74.2176447374611,-74.2176662990698,-74.2176872421387,-74.2177070335513,-74.2177251695065,-74.2177411883435,-74.2177920071116,-74.2178438051409,-74.2178954222846,-74.2179457024478,-74.217993519481,-74.2180378024052,-74.2180775593984,-74.2181119000112,-74.2181431786796,-74.2181764843791,-74.2182299748596,-74.2182869203572,-74.2183465805589,-74.218408179861,-74.2186133212829,-74.2188160935154,-74.2190162409393,-74.2192135112463,-74.2194076557571,-74.2195984297351,-74.2196832114636,-74.2197701641712,-74.2198587726487,-74.2199485118778,-74.2200388501409,-74.2201292521715,-74.2202191823253,-74.2203227695365,-74.2204276251281,-74.2205330717296,-74.2206384281524,-74.2207430137902,-74.220846153017,-74.2209471795517,-74.2210454407631,-74.2211213338563,-74.2211968090267,-74.2212711050549,-74.2213434726154,-74.2214131818338,-74.2214795296489,-74.2215404818999,-74.2216040753143,-74.2216627154293,-74.2217222375347,-74.2217820215153,-74.2218414445281,-74.221939076959,-74.2219950025788,-74.2220532290661,-74.2221126269591,-74.2221720440724,-74.2222303278478,-74.2222863477123,-74.2223390170093,-74.2223676625078,-74.2223998766726,-74.2224348308833,-74.2224716260416,-74.2225093156969,-74.2225469303908,-74.2225782450258,-74.2226103663468,-74.2226481858619,-74.2226865132473,-74.2227210401842,-74.2227555011132,-74.2228336896027,-74.2229106203597,-74.2229855590458,-74.2230465785226,-74.223105070806,-74.2231597129541,-74.2232092691086,-74.2232526184467,-74.2232743418426,-74.2233000725146,-74.2233291655852,-74.2233608919084,-74.2233944563438,-74.2234290176843,-74.2235120988358,-74.2235953298102,-74.2236781218466,-74.2237598892896,-74.2238400537323,-74.2239180481081,-74.2239933207026,-74.2241009857825,-74.2242121725971,-74.2243267067723,-74.2244444086865,-74.224756315054,-74.2248115505803,-74.2248716718424,-74.2249356331322,-74.2250023219543,-74.2250705783751,-74.2251392151967,-74.2252070386055,-74.2252728689349,-74.225487896769,-74.2257006466115,-74.2259109267258,-74.2261185475994,-74.2262369002877,-74.2263595604079,-74.2264860167511,-74.2266157422837,-74.226748196344,-74.2268828268962,-74.2270190728311,-74.227156366306,-74.2272941351108,-74.2274318050542,-74.227568802357,-74.2276942517113,-74.2278211025843,-74.2279487799773,-74.2280767051459,-74.2282042982228,-74.2282213834966,-74.2282366809369,-74.2282520673362,-74.2282675027534,-74.2282829459344,-74.2282983580354,-74.2283136951541,-74.2283289215001,-74.2283443424342,-74.2283599010297,-74.2283755669847,-74.2283913014476,-74.228407070604,-74.2284228362744,-74.2284385657472,-74.2284938457048,-74.2285494278077,-74.2286052868356,-74.2287364062092,-74.2287777092498,-74.228818937087,-74.2288600651486,-74.2289010679784,-74.2289520575636,-74.2290032537433,-74.2290546330555,-74.2290759103973,-74.2290971179797,-74.2291182279393,-74.2291392181128,-74.2291600617395,-74.2291807309597,-74.2292012018696,-74.2292214494668,-74.229241446339,-74.2292703849778,-74.229299523384,-74.2293288334679,-74.2293582930866,-74.2293878728434,-74.2294175516761,-74.2294213819878,-74.2294384115576,-74.2294552871692,-74.2294974050212,-74.2295393637853,-74.229581143268,-74.2296102216364,-74.2296393921326,-74.2296686178942,-74.229684458175,-74.2297002119538,-74.2297158423707,-74.2297313134496,-74.2297465881203,-74.2297954659519,-74.2298440671971,-74.2298923852785,-74.2299153620445,-74.2299387087545,-74.2299623909907,-74.2299863756456,-74.2301602913138,-74.2301787340639,-74.2301969411927,-74.2302148848441,-74.2302325360823,-74.2302498690442,-74.2302668572034,-74.2302834709696,-74.2302996869051,-74.2303068645294,-74.2303144167313,-74.2303222817067,-74.2303303993764,-74.2303326562515,-74.2303366315678,-74.2303360734208,-74.2303328539762,-74.2303274394503,-74.2303298941554,-74.2303335822622,-74.2303389250018,-74.2303430464309,-74.2303471844981,-74.2303542283421,-74.2303628392934,-74.2303658228657,-74.2303805628857,-74.2303842677215,-74.2303894844166,-74.2303939032026,-74.2304017685484,-74.2304102463541,-74.230419290636,-74.2304288508023,-74.2304388699183,-74.2304492921526,-74.2304600572945,-74.2304752718761,-74.2304907181546,-74.2305063557174,-74.2305221446015,-74.2305380448389,-74.2305540178014,-74.2305700202341,-74.2305860097911,-74.2306160641473,-74.2306460493301,-74.2306759449317,-74.2307057331863,-74.2307353934625,-74.2307649077854,-74.2307942574984,-74.2308234208933,-74.2308485121185,-74.2308523804172,-74.2308811202911,-74.2309533108145,-74.2311449495875,-74.2311805719308,-74.2312035396864,-74.2312232711202,-74.2312246922924,-74.2312335769277,-74.2312444324419,-74.2315487998119,-74.2318493571725,-74.2321458762227,-74.2324381317325,-74.2327259017144,-74.233008967592,-74.2330474416912,-74.2331442461824,-74.2332104963622,-74.2335990411974,-74.2344137827854,-74.2349457770194,-74.2350136083593,-74.2350809179298,-74.2351739594293,-74.2352649594805,-74.235353341166,-74.2354385441698,-74.2355200283308,-74.2355972770666,-74.2356626910522,-74.235731575408,-74.2358034265234,-74.2358777191002,-74.2359539099924,-74.2361053655781,-74.236252451358,-74.2363513066114,-74.2364278402264,-74.2364725698873,-74.2365298183211,-74.2366196366983,-74.2367060628852,-74.2367884562405,-74.2368662060195,-74.2369387359019,-74.237005508264,-74.237066028164,-74.2371840759894,-74.2372966753226,-74.2374036202323,-74.2375047151324,-74.2375997751396,-74.2376886264117,-74.2376677035993,-74.2377480524737,-74.2377714600998,-74.2378198277798,-74.2378684094721,-74.2379286357946,-74.2379873737906,-74.2380436396549,-74.2380964909903,-74.238441049034,-74.2385132163553,-74.2389515070693,-74.2394402430258,-74.239668450413,-74.2397123757566,-74.2397628957089,-74.2398191372131,-74.2398485123682,-74.2398801727993,-74.2399133551013,-74.2399472591742,-74.2399810675151,-74.2400139649291,-74.2400451581855,-74.2400738951437,-74.2401302307609,-74.2401897211127,-74.2402511280145,-74.2403131733902,-74.2403745658747,-74.2404607227861,-74.2405481496858,-74.2406361400522,-74.2407239828109,-74.2408109680801,-74.2408590548483,-74.2409086640414,-74.2409589539855,-74.2410090714564,-74.2410581661563,-74.2411054051405,-74.2412351082125,-74.2413652297601,-74.2414951169444,-74.2416241181027,-74.2417515860185,-74.241876881169,-74.2419993749348,-74.2420664185161,-74.2421337409193,-74.2422007032813,-74.2422666701553,-74.2423310155406,-74.2424166830076,-74.2425056345687,-74.2425970696254,-74.2426901652246,-74.2427840834661,-74.2428779790449,-74.2429710068598,-74.2431168553781,-74.2432637817685,-74.2434114690993,-74.2435595987979,-74.2437078513377,-74.2438559069275,-74.243974815743,-74.2440936150123,-74.2442115778588,-74.2443279825243,-74.2444421167859,-74.2445532823144,-74.2446607989474,-74.2447640088514,-74.2449516297375,-74.2451352257519,-74.2453145571668,-74.2454893898262,-74.2456594954518,-74.2458246519407,-74.2459070323559,-74.246033007977,-74.2461658925644,-74.246305421237,-74.2464513158762,-74.2466032856798,-74.246761027742,-74.2469662671495,-74.2471712538789,-74.2473756040992,-74.2475789351704,-74.24778086636,-74.2479810195556,-74.2481790199721,-74.248374496854,-74.2485670841685,-74.2487564212912,-74.2489421536807,-74.2491239335425,-74.2493014204802,-74.2494742821321,-74.2496421947941,-74.2497171770668,-74.249925535982,-74.2499909309134,-74.2501192957722,-74.2502067630047,-74.2503270675016,-74.2505071514244,-74.2506831179459,-74.2508548942225,-74.2508610850957,-74.2509006651923,-74.2509333388545,-74.2509588814226,-74.2509771172632,-74.2509879209774,-74.2509912182631,-74.2509869864273,-74.2509881338782,-74.2510034623457,-74.2510279779859,-74.2510615764837,-74.251104114858,-74.2511677324562,-74.2512365220158,-74.2513101556005,-74.2513882821775,-74.251470529292,-74.2515565048421,-74.2517294986342,-74.2519121054223,-74.2520003455448,-74.252074841391,-74.2520838090742,-74.2522536098982,-74.2524256499883,-74.2525998273998,-74.2527076123073,-74.2528101183997,-74.2529070268642,-74.2529980362936,-74.2530828636237,-74.2531612450135,-74.2532329366664,-74.2532977155883,-74.2533553802815,-74.2534057513717,-74.253448672166,-74.2535774576177,-74.253703417368,-74.2537429142345,-74.253790457716,-74.2538459062065,-74.2539090945462,-74.2539798345135,-74.2540579153851,-74.2541431045636,-74.2542351482701,-74.2542740765672,-74.254720276116,-74.2552340893497,-74.255279472083,-74.2553157308447,-74.2553427472319,-74.2553604330081,-74.2553687303919,-74.255358505049,-74.255330046082,-74.2553071037762,-74.2553253287078,-74.2553525261439,-74.2553795022521,-74.2554117241756,-74.255449158497,-74.2554917663877,-74.2555275063789,-74.2555570546528,-74.2555776815867,-74.2555891599136,-74.2555913631521,-74.2555718022384,-74.2555318585476,-74.2555291316082,-74.2554527293791,-74.2552481775317,-74.2550429371597,-74.2548988820703,-74.2546285670991,-74.2547027248385,-74.2547310475766,-74.2549018717664,-74.2549041226039,-74.2549813000949,-74.2549729037077,-74.2548963650734,-74.2548996177544,-74.2547152381856,-74.2546841498808,-74.2546185072802,-74.2544871166484,-74.2543454321541,-74.2541200083633,-74.254100106239,-74.2540499811001,-74.2540379191157,-74.2540282148799,-74.2540116272635,-74.2539975307934,-74.2539859254997,-74.2539768114079,-74.2541112131857,-74.2540380456785,-74.2543071301246,-74.2543487444013,-74.2543887773702,-74.2543145416931,-74.2542817708006,-74.2542908355701,-74.2540206950553,-74.2538916993927,-74.2537335511525,-74.2536891188106,-74.2537053550855,-74.2536760469523,-74.253693398375,-74.2541332493149,-74.2543325654762,-74.2543493712604,-74.2545681551288,-74.2546233620281,-74.2546465126291,-74.2545262173243,-74.2545003878926,-74.254553336373,-74.2541246246756,-74.2536681037926,-74.2536639382743,-74.2536481251826,-74.2536071125547,-74.2535029786814,-74.2534783588696,-74.2533157980513,-74.2532441155391,-74.253192615033,-74.2531498424314,-74.2531273084317,-74.2530639455309,-74.2532600826831,-74.2532580688567,-74.2530627481103,-74.2530377993435,-74.2530084727755,-74.2530203792397,-74.2530819503437,-74.2531802039699,-74.2534335044842,-74.2534860296363,-74.253493005716,-74.2534590765935,-74.2534874070102,-74.2535239695037,-74.2535319502287,-74.2534951778508,-74.2535268507671,-74.253502112522,-74.2531715192468,-74.2530928696424,-74.2530619950523,-74.2530363538155,-74.2530320796236,-74.2530000872132,-74.2529971390104,-74.2529994082116,-74.2530068453473,-74.2530192882703,-74.2530364656908,-74.2530580030906,-74.2530764161371,-74.2530903675943,-74.2530998452821,-74.2531045661135,-74.2531043890805,-74.2530993194659,-74.2530895086866,-74.2530752497713,-74.2524327066728,-74.252165701871,-74.2519519748847,-74.2519293126906,-74.2519946799881,-74.2520895529462,-74.25214378895,-74.2521259139706,-74.2517918647828,-74.2517859200256,-74.2517558319888,-74.251723467407,-74.2516804893075,-74.2516345376171,-74.251585923665,-74.2515354692339,-74.2514897816228,-74.2514493247613,-74.2514145094673,-74.2513856892752,-74.2513838388142,-74.251379512511,-74.2513728394958,-74.2513640189434,-74.2513533141287,-74.251341044568,-74.2513275764828,-74.2513133118681,-74.2512986764943,-74.2512841071978,-74.2512700388432,-74.2511852835102,-74.2511033407768,-74.2510247540684,-74.2509500445562,-74.2508797077018,-74.2507566808428,-74.2506826658665,-74.2506119306635,-74.2505450049674,-74.2504823899852,-74.2504245546436,-74.2503719320777,-74.2503675748727,-74.2503606500959,-74.2503513152432,-74.2503397826254,-74.2503263145402,-74.2503112173058,-74.2502948342942,-74.250255030142,-74.2502207310143,-74.2501926244717,-74.25011171057,-74.2500615339114,-74.2500756883247,-74.2501788058399,-74.2501708666371,-74.2502808361239,-74.2502741615749,-74.250285675205,-74.2502933063894,-74.2505552641356,-74.2504550992383,-74.2501960157145,-74.2502751830964,-74.250261753471,-74.2502522096782,-74.2501562651677,-74.24988824875,-74.2504762730612,-74.2505350704566,-74.2505600727201,-74.2504153592139,-74.2503948747817,-74.2504513932562,-74.2498437459406,-74.249356609239,-74.2492773432396,-74.2493572627288,-74.2493377524369,-74.2492561503189,-74.249215286761,-74.2495248092737,-74.2496322010924,-74.2496227030045,-74.2495004712373,-74.2495330306043,-74.2495139367868,-74.2499415880804,-74.2498986190374,-74.2494822975976,-74.2494642033826,-74.2494309689909,-74.2490558650878,-74.2490305596249,-74.2486476463211,-74.248715836413,-74.2487067981853,-74.2488432366461,-74.248829666094,-74.2486818927435,-74.2486246694039,-74.2487595831515,-74.2487369563467,-74.2485458929168,-74.248550133631,-74.248512456013,-74.2485749638382,-74.2486008082305,-74.2482842208389,-74.2489462466561,-74.2493781403809,-74.249407707891,-74.2485144905604,-74.248487203267,-74.2489191065305,-74.2482217169458,-74.2475181183553,-74.2469304800848,-74.2468714783545,-74.246594999352,-74.2464403965114,-74.246125608767,-74.2461246219707,-74.2461285767929,-74.2461366705125,-74.2461474809529,-74.2461599320057,-74.2461746405067,-74.2461829824629,-74.2462354960649,-74.2462528628355,-74.2463008510686,-74.2465299241723,-74.2465987343713,-74.2467499719407,-74.246593392362,-74.2465104026768,-74.2466976942679,-74.2466932357773,-74.2467070672106,-74.2467103390456,-74.2469955699659,-74.2469689277689,-74.2466825860255,-74.246695276209,-74.24668162674,-74.2466652168927,-74.2464789970533,-74.2464439138661,-74.2464237395008,-74.2463773643563,-74.2465643992026,-74.2465368283426,-74.2463496980177,-74.2459817688652,-74.2459527699214,-74.2452086152836,-74.2456698900138,-74.2455993874938,-74.2457127669422,-74.24566427146,-74.2456347316995,-74.2455687984226,-74.2455658738584,-74.2455266715401,-74.2454905567098,-74.2453707849363,-74.2453056843134,-74.2452456049424,-74.2451979221515,-74.2450880446054,-74.2449277566778,-74.2448608805258,-74.2447739994527,-74.2446920008419,-74.2446005452964,-74.2445129261746,-74.2444081239548,-74.2443175109761,-74.2442983521761,-74.244193186438,-74.2439995737616,-74.2438212660942,-74.243652285116,-74.2430194647866,-74.2428233742268,-74.2426371194286,-74.2423247783328,-74.2420912312278,-74.2418696458423,-74.2412596867522,-74.241090759216,-74.2410312291872,-74.2408696198014,-74.2407592863767,-74.2405964580786,-74.240490696877,-74.2403956006752,-74.240244337913,-74.2401880289655,-74.2400965083314,-74.239916123958,-74.2398497761881,-74.2398351231082,-74.2398225831696,-74.2399182071525,-74.239919182413,-74.2400314206172,-74.240333808136,-74.2405558430752,-74.2407328454876,-74.2408465963771,-74.2409397790787,-74.2409219219437,-74.2409737789022,-74.241172935522,-74.2412192461465,-74.2412395676566,-74.2413321957552,-74.2413837903956,-74.2415721732834,-74.2418906572721,-74.2429323503633,-74.2429053428242,-74.2428989451509,-74.2428110550662,-74.2425954289643,-74.2425837563927,-74.2425908252118,-74.2426426604603,-74.2427080622872,-74.242714698633,-74.2427321595413,-74.2427624678372,-74.2427484903932,-74.242692273727,-74.2426548781215,-74.2426234553968,-74.2426212927106,-74.2426139783843,-74.2426166693986,-74.2426579383822,-74.2426938333162,-74.2427106539166,-74.2427288635407,-74.242739576131,-74.2427535591874,-74.2427512240465,-74.2427402365314,-74.242744234157,-74.2427534582012,-74.2427623745006,-74.2427657586154,-74.2427651787903,-74.2427575681128,-74.2427589030104,-74.242764711474,-74.2427978436625,-74.242816736939,-74.242818346593,-74.2428164123671,-74.2428144907602,-74.2428088271665,-74.2428067828124,-74.2428065825145,-74.2428025219365,-74.2428015700958,-74.242813048835,-74.2428622700346,-74.2429056493349,-74.2429400141673,-74.2429898509025,-74.2430243234192,-74.2430399030754,-74.2430807255026,-74.2431129397074,-74.2431752459305,-74.2432643670938,-74.2433009533232,-74.2433268788749,-74.2433579268568,-74.2433850451045,-74.2434076892373,-74.2434888239248,-74.2436079354575,-74.2439650075886,-74.2439676170694,-74.2439683583908,-74.2433388388386,-74.2430738951392,-74.2430510131855,-74.2430599177191,-74.243060193601,-74.2430518379124,-74.2430349382765,-74.24300967194,-74.2429763039152,-74.2429351842008,-74.2428867441113,-74.2428758456771,-74.2428794017542,-74.2428951506731,-74.2429286256467,-74.2429456376025,-74.2429479983287,-74.2429397117687,-74.2429098368302,-74.2428726178986,-74.2428574567957,-74.2428507654261,-74.2428422671204,-74.2428585620702,-74.2428872377435,-74.2428867138121,-74.2427612055676,-74.2427567585976,-74.2427021858181,-74.2426634595534,-74.2426421851728,-74.2426264072631,-74.2426125770198,-74.2426126787257,-74.2425936214811,-74.2425673230953,-74.2425506216696,-74.2425102899755,-74.2425091986698,-74.2425241625684,-74.2425350955649,-74.2425333215477,-74.2424993130418,-74.2424902351684,-74.2424840574474,-74.2424592642565,-74.242427813883,-74.2424200283784,-74.2424129392698,-74.2424198762823,-74.2424340210846,-74.242449565412,-74.2424558174114,-74.2424568439242,-74.2424554102524,-74.2424448920478,-74.2424205427977,-74.2423948955005,-74.2423754322075,-74.2423646431012,-74.242360583125,-74.2423369565593,-74.2423089235807,-74.2422836580587,-74.2422549073463,-74.2422111306344,-74.242197645364,-74.2421880176231,-74.2421804099388,-74.2421726016683,-74.2421725440045,-74.2421665692659,-74.2421676987588,-74.2421764118526,-74.2421893930521,-74.2422013157834,-74.2422283014056,-74.2422381043392,-74.2422456550831,-74.2422463725044,-74.2422452813732,-74.242234216558,-74.2420246491306,-74.2419910818515,-74.241940420909,-74.2419063466737,-74.2418671379308,-74.2418432069507,-74.2418292001307,-74.2418177216543,-74.2418070887561,-74.2417870231277,-74.2417670305463,-74.2417475434775,-74.2417285451407,-74.2417116046185,-74.241689360719,-74.2416811012402,-74.2416721867006,-74.2416572991303,-74.2416409703834,-74.2416241753438,-74.2416071574775,-74.2415960535109,-74.2415884124059,-74.241569160089,-74.2415492890359,-74.24153508696,-74.2415242727567,-74.241507333229,-74.2415024755319,-74.2415003265563,-74.2414996447622,-74.2415033943973,-74.2415059401506,-74.2415079178329,-74.2415079114565,-74.2415309233201,-74.2417192406669,-74.2416678421322,-74.2418106162153,-74.2421779966323,-74.2422820033816,-74.2422637891136,-74.2422460277608,-74.2422297257609,-74.2422053380652,-74.2421812723467,-74.2421597127004,-74.2421369184625,-74.2421194761951,-74.2420958972059,-74.2420704435515,-74.242052527956,-74.2420207437613,-74.242020060732,-74.2419977733681,-74.2419875715102,-74.2419767477285,-74.2419705278007,-74.2419645887046,-74.2419628595331,-74.2419650645094,-74.2419706166489,-74.2419864190501,-74.2419983514787,-74.2420132919138,-74.2420153829306,-74.2420117836351,-74.2420086716507,-74.2420031641497,-74.2420025400726,-74.2420003069947,-74.241996898444,-74.2419892099715,-74.2419908584443,-74.241993075881,-74.2419915502287,-74.2419899521689,-74.2419874913321,-74.2419901739893,-74.2419935494477,-74.241999603385,-74.242018011135,-74.2420235789525,-74.2420275948896,-74.242035086739,-74.242040562708,-74.2420457028601,-74.2420531820557,-74.2420650025183,-74.2420846657795,-74.2420975354873,-74.2421132321489,-74.2421245558554,-74.2421364386929,-74.2421464585447,-74.2421551372007,-74.2421658989142,-74.2421832546157,-74.2422115281905,-74.2422249409136,-74.2422449163343,-74.2422691365065,-74.2422870247734,-74.242306516928,-74.2423289138408,-74.242349300283,-74.2423585392059,-74.2423748617443,-74.2423880475389,-74.2424002687923,-74.2424182732257,-74.2424424252232,-74.2424742241645,-74.2425049423469,-74.2425312930964,-74.2425572374163,-74.2425803102056,-74.2425902260343,-74.2425955168685,-74.2426118404504,-74.2426328967562,-74.2426394849947,-74.2426411209488,-74.2426410794858,-74.2426402907303,-74.2426383836097,-74.242636364647,-74.2426336754027,-74.2426306493315,-74.2426289661799,-74.2426301545667,-74.2426360055353,-74.2426461402434,-74.2426543005016,-74.2426654034641,-74.2426793010274,-74.2426917073319,-74.2427042612402,-74.2427461488747,-74.2427543108195,-74.2427679882174,-74.2427788652709,-74.2427874713551,-74.2427968230464,-74.2428106811463,-74.2428234621743,-74.2428379963647,-74.2428506652579,-74.2428660920976,-74.2428758904254,-74.2428809552207,-74.2428838921917,-74.2428922317054,-74.2429001254382,-74.2429125730392,-74.2429260275361,-74.2429399256747,-74.2429557602023,-74.2429602652575,-74.2429592522849,-74.2429541420741,-74.2429473889565,-74.2429457804533,-74.2429487592942,-74.2429564118979,-74.2429684290388,-74.242981931381,-74.2429957104401,-74.2430255015692,-74.2430546734529,-74.2430726338237,-74.2430800374972,-74.2430866688536,-74.2430874458234,-74.2430881629084,-74.2430924736146,-74.243101516515,-74.2431152687786,-74.243134439671,-74.2431510113658,-74.2431724445371,-74.2431797234909,-74.2431930456904,-74.2432062415269,-74.2432176678038,-74.2432387884949,-74.2432533746218,-74.2432657306843,-74.2432887965426,-74.2433079959678,-74.2433167269081,-74.2433245938664,-74.2433296455406,-74.2433315674803,-74.243332873353,-74.2433338374263,-74.2433368466732,-74.2433554390665,-74.2433702175335,-74.2433877305729,-74.2434006491671,-74.2434088076486,-74.2434228734857,-74.24343286487,-74.2434519523223,-74.2434745312867,-74.2434914748865,-74.243509979365,-74.2435261639004,-74.2435445241721,-74.2435552260323,-74.2435706428835,-74.2435867016199,-74.2436060426295,-74.2436277699824,-74.2436366301592,-74.2436518912927,-74.2436652907174,-74.2436708768866,-74.2436790415025,-74.2436844430017,-74.2436967058746,-74.2437135918848,-74.2437336610108,-74.2437791545938,-74.2438114132269,-74.2438462434818,-74.2438668914013,-74.2438848724942,-74.2439101680879,-74.2439703025988,-74.2440008019766,-74.2440179491223,-74.2440372361235,-74.2440574707854,-74.2440743071522,-74.2440912992845,-74.244105232958,-74.2441065700621,-74.2441164373789,-74.2441249598849,-74.2441291704222,-74.2441274256644,-74.2441215439361,-74.2441085602413,-74.2440544742024,-74.2440347898134,-74.2440166727705,-74.2439974217068,-74.2439856689694,-74.2439810016812,-74.2439781094153,-74.2439765510658,-74.2439785395895,-74.2439790272007,-74.2439846719106,-74.2439978112266,-74.244010498483,-74.2440267636125,-74.2440454174463,-74.2440647284455,-74.244081739201,-74.244089369495,-74.244101769706,-74.2441114292603,-74.2441234626605,-74.244130494315,-74.244147825387,-74.2441639165067,-74.2442013532868,-74.2442213094155,-74.2442565192626,-74.2442870672058,-74.244324941055,-74.2443440001688,-74.2443854947255,-74.2444201876918,-74.244451681701,-74.2444820775425,-74.2445004747937,-74.2445180947902,-74.244554225154,-74.2445659943732,-74.2445875391072,-74.2446742323204,-74.2447035632394,-74.2447287561833,-74.2447501862577,-74.2447585949594,-74.2447709286853,-74.2447813434745,-74.2447863495393,-74.2447924245903,-74.2448009435216,-74.2448163601389,-74.2448285534017,-74.2448392777946,-74.24485718067,-74.2448864243409,-74.2449055505107,-74.2449198103863,-74.2449369311447,-74.2449556476098,-74.2449837012121,-74.2450042406165,-74.2450631106776,-74.2450866278506,-74.2451085251394,-74.2451371605196,-74.2451678287288,-74.2451719678184,-74.2451886282462,-74.2452139308518,-74.2452330138516,-74.2452471064904,-74.2452550633074,-74.2452983554065,-74.245320463995,-74.2453365117606,-74.2453423785573,-74.2453480746893,-74.2453523977035,-74.2453534215194,-74.2453588575299,-74.2453601430708,-74.2453595704844,-74.2453524512177,-74.2453410933465,-74.2452923119924,-74.245258711065,-74.2452394900789,-74.2452196022401,-74.2452053047094,-74.2451701810958,-74.2450843692602,-74.2449995566853,-74.2449807560409,-74.2449619248464,-74.244943004618,-74.2449240237111,-74.244906101693,-74.2448869697577,-74.2448418170095,-74.2448010457436,-74.2447872950513,-74.2447757799697,-74.2446810086538,-74.2445910098009,-74.2445864459826,-74.2445818819481,-74.2445684032992,-74.2445193481976,-74.2445048086586,-74.2444935368203,-74.2444890028919,-74.2444855276317,-74.2444668213694,-74.2444513491577,-74.2444391123205,-74.244431227809,-74.2444276960781,-74.2444274892203,-74.2444316646172,-74.2444402552428,-74.2444509610368,-74.2444600010806,-74.2444702508516,-74.2444765092851,-74.2444827661829,-74.244541839624,-74.2445651460675,-74.2446214966826,-74.2446448346039,-74.2446669641377,-74.2446742204043,-74.2446814760063,-74.2446824144433,-74.2446833513353,-74.2446842592107,-74.2446840780636,-74.2446804511073,-74.2446731699251,-74.2446611136106,-74.2446609632329,-74.2446597249355,-74.2446605116753,-74.2446671961374,-74.2446742090531,-74.2446844897087,-74.2446991231873,-74.2447181677526,-74.2447361857289,-74.2447585558708,-74.2447900465837,-74.2448560662819,-74.2449037764419,-74.2449329679343,-74.2449663401177,-74.2450167723644,-74.2451141989974,-74.2451591620807,-74.2452134465138,-74.2452566073174,-74.2453227668903,-74.2452971171052,-74.2452969950917,-74.2453077381704,-74.2453233614296,-74.2453481686853,-74.2453680983046,-74.2453850986478,-74.2453937621991,-74.2453974561007,-74.2454004798434,-74.2453847027209,-74.2453648427296,-74.245362950303,-74.2453790638141,-74.2454023234798,-74.2454048810826,-74.2454172398465,-74.2454232990037,-74.2454294717718,-74.2454325476109,-74.2454290807348,-74.2454256685194,-74.2454218831117,-74.245412767019,-74.2454296977673,-74.2454537872224,-74.2454764785426,-74.2455191032127,-74.2455925099258,-74.2456020569832,-74.2456077070552,-74.2456204793982,-74.2456385647627,-74.245680776278,-74.2457058938208,-74.2457307294372,-74.2457571498966,-74.2457838487959,-74.2458074166718,-74.2458236379357,-74.2458316931469,-74.2458450812153,-74.2459928479056,-74.2460474987923,-74.2460613718713,-74.246081527459,-74.246103138322,-74.2461476496422,-74.2461979748304,-74.2462141402734,-74.2462602701774,-74.2463209455191,-74.246356763494,-74.2464067714964,-74.2464666069475,-74.2464861481579,-74.2465138936479,-74.2465339196642,-74.2465748653085,-74.2465928758198,-74.2466222013665,-74.2466483706023,-74.2467619348106,-74.2467781542564,-74.2468625313222,-74.2476777803961,-74.2479224470968,-74.2480346373569,-74.2477055007221,-74.2476193746375,-74.2467107668221,-74.2461374376871,-74.2436380714494,-74.2436020272568,-74.2433664876997,-74.243402085638,-74.2433634655277,-74.2432987867762,-74.2433406330886,-74.2433503331024,-74.2435844765135,-74.242935859292,-74.2426654607375,-74.2423172680375,-74.2422980077531,-74.2422296126203,-74.2422031846325,-74.2421183077613,-74.2420496763575,-74.2419645976758,-74.2419029027681,-74.2418544332214,-74.241798505443,-74.2417211760694,-74.241693354481,-74.2416069188521,-74.2415096496595,-74.2414510754695,-74.2414025350411,-74.2413394483685,-74.2412802950916,-74.2412293679671,-74.241172751756,-74.241121134047,-74.2410726698807,-74.2410166706548,-74.2409742253416,-74.2409364265183,-74.2408673905927,-74.240827039079,-74.2407697713206,-74.2407236357914,-74.2406334137084,-74.2405763307283,-74.2404584755949,-74.2403918281006,-74.2403534157227,-74.2403130059052,-74.2402764411718,-74.2402373021857,-74.2402039240967,-74.2401253987944,-74.2400349130996,-74.2399828187916,-74.2399616716266,-74.2399407299478,-74.2399125332328,-74.239877537873,-74.2398437282875,-74.2398186419272,-74.2397913136389,-74.2397576447181,-74.2397006544121,-74.2396249662085,-74.2395931308525,-74.2395420884637,-74.2394995130994,-74.2394574635706,-74.2394274566773,-74.2393919575044,-74.2393408534097,-74.2393141463748,-74.239302732516,-74.239289072888,-74.2392675122024,-74.2392444806732,-74.2392227085428,-74.2391863343971,-74.2391500321938,-74.2391256369584,-74.2391019311523,-74.2390695043964,-74.2390229998338,-74.2388802047475,-74.2387688286098,-74.238706726485,-74.2386541448786,-74.2385872314847,-74.2385252684764,-74.2384724157821,-74.2384192245846,-74.2383719130423,-74.2383301218049,-74.2382810798592,-74.2382256235756,-74.2381488617792,-74.238100870985,-74.2380104531594,-74.2379484587302,-74.2379031000523,-74.2378119443384,-74.2378098017333,-74.237764720133,-74.2377115782049,-74.2376652976361,-74.2376196346733,-74.2375608091403,-74.2375171583826,-74.2374649628326,-74.2374067248125,-74.2373651746587,-74.2373191816265,-74.2372628389899,-74.2372261612756,-74.2371981195924,-74.2371711791323,-74.2371331359663,-74.237087557679,-74.2370364339828,-74.2369846741355,-74.2369319989532,-74.2368827811418,-74.2368179273547,-74.2367549307669,-74.236692554971,-74.2366297834716,-74.2366031556606,-74.2365457880099,-74.2365010401947,-74.2364583494724,-74.236414597268,-74.23639375851,-74.2363783743206,-74.236349703765,-74.2363192567089,-74.2362882513389,-74.2362780546759,-74.2362804765915,-74.2362845563475,-74.2362623847167,-74.2362394474028,-74.2362348629263,-74.2362131235959,-74.2362016897619,-74.2361890942824,-74.2361776128584,-74.2361706804036,-74.2361671357436,-74.2361647313612,-74.236165752554,-74.236170169762,-74.2361790470889,-74.2362117622877,-74.2362496289907,-74.2362925658643,-74.2363404806807,-74.2363877330321,-74.236428852992,-74.2364630279391,-74.2364895824954,-74.236507991874,-74.2365178922508,-74.2365190879553,-74.2365115553396,-74.2364954432463,-74.2364710700693,-74.2364389174623,-74.2363996208214,-74.2363539567293,-74.2348986580081,-74.2348845511625,-74.2348688701524,-74.234836374079,-74.2347870569584,-74.2347747234872,-74.2347601443951,-74.2347107919558,-74.2346906068464,-74.2346681857736,-74.2346581018198,-74.2346480208642,-74.2346043413092,-74.2345685074076,-74.2345606707498,-74.2345382833365,-74.2345304436817,-74.2345270841435,-74.2345237222681,-74.2345203597315,-74.2345169948563,-74.23451362932,-74.2345102637879,-74.2344911722998,-74.2344844388981,-74.2344260814209,-74.2343711045133,-74.2343509156733,-74.2343273711033,-74.2343015942301,-74.2342265094612,-74.2342052111753,-74.2341861506116,-74.2341502629073,-74.2341390404516,-74.2341345483756,-74.234131177532,-74.2341266824594,-74.2341233086257,-74.234112031649,-74.2341086548245,-74.2341052803304,-74.234079437684,-74.234027781708,-74.23398398868,-74.2339402089833,-74.2338953202698,-74.2338493210905,-74.2338268869672,-74.2338033357937,-74.2337775501176,-74.233749525506,-74.2336867633761,-74.233600480673,-74.2335646261153,-74.233535498012,-74.2335097394781,-74.2334862256431,-74.2334571193138,-74.2334291388676,-74.2334045209112,-74.2333810262875,-74.2333597754711,-74.233341884825,-74.2333240008032,-74.2333094786135,-74.2331855182814,-74.2329900763466,-74.2329554547687,-74.232915236113,-74.2328157969089,-74.2328102073451,-74.2328035001738,-74.2327889597489,-74.2327363721512,-74.232718473056,-74.2327028225037,-74.2326961146645,-74.2326916537147,-74.2326414342372,-74.232555531031,-74.2323959870613,-74.2322911293316,-74.2322665927849,-74.2322443060731,-74.2322231481769,-74.2322031167834,-74.2321842149747,-74.2321653263281,-74.2321464541539,-74.2321231550848,-74.2320998330062,-74.2320603723539,-74.2320026353048,-74.2319664823074,-74.231955448719,-74.2319553730415,-74.2319333144494,-74.2318870713614,-74.2318159763954,-74.2316830032451,-74.2315623258065,-74.2315006311882,-74.2313562024378,-74.2312179321108,-74.2311445614961,-74.2310694379242,-74.2309896185452,-74.230874727915,-74.2308400791119,-74.2307878104018,-74.2307551124586,-74.2307103619812,-74.2306557610154,-74.2306087628246,-74.2305551438645,-74.2305080463149,-74.2304597965684,-74.2304246984795,-74.2303447353474,-74.2302495215351,-74.2301751939204,-74.2300430646574,-74.2299262674491,-74.2297886241267,-74.2296804086392,-74.2296049689339,-74.2294714942974,-74.2293796342545,-74.2293195418571,-74.2292737490792,-74.2292487391849,-74.2292477939141,-74.2292522614386,-74.2292698646023,-74.2292835640624,-74.22929656578,-74.2293086435881,-74.2293195873909,-74.2293309992085,-74.229340201224,-74.2293469611662,-74.2293511084044,-74.2293525382555,-74.2293365613314,-74.2293132809132,-74.2292833387291,-74.2292475601453,-74.2292355876615,-74.2292225554966,-74.2292087843102,-74.2291946129461,-74.2291803900943,-74.2291664657122,-74.2291531824126,-74.2291408670347,-74.2291054163109,-74.2290903971221,-74.2290729956389,-74.2290763976549,-74.229083060942,-74.2290744340807,-74.2290516218764,-74.2289992681535,-74.228949058748,-74.2289010475268,-74.2288159888286,-74.2287242997478,-74.2286281403802,-74.2285450583171,-74.2284827455627,-74.228465250963,-74.228441220978,-74.2284128783488,-74.2283954556654,-74.2283692767811,-74.2283321437201,-74.228267637297,-74.2282129640223,-74.2281615499231,-74.2281079299899,-74.2280728553878,-74.2280453846809,-74.2280136069691,-74.227973125647,-74.2278330723504,-74.2277017305229,-74.2276327283441,-74.2275592821066,-74.2274368273053,-74.2272412433907,-74.2270825621751,-74.2269249779245,-74.2269023090319,-74.2268700682655,-74.2268383534212,-74.2267957140918,-74.2267694919016,-74.2267373147939,-74.2266734121505,-74.2266100107087,-74.2265794285045,-74.2265729934221,-74.2265370073045,-74.2264766116768,-74.2264049454295,-74.2263702081348,-74.2263320167536,-74.2261869214748,-74.226114204926,-74.2260685451071,-74.2239033413449,-74.2238642149809,-74.2234426510631,-74.2234721093353,-74.2237191044499,-74.2237574121032,-74.2237743837533,-74.2237860670896,-74.2231947052734,-74.2231612894274,-74.2231298673657,-74.2231129667092,-74.2231035372131,-74.2230967257303,-74.2230422836596,-74.2230015599764,-74.2229711957524,-74.2229721969876,-74.2228831003073,-74.2228187658904,-74.222739601243,-74.2226556883406,-74.2225748680138,-74.2225183304901,-74.2224748211386,-74.2224222599362,-74.222370770987,-74.2223203663616,-74.2222475290559,-74.2222245233586,-74.2222172756694,-74.2221969976091,-74.2221224448783,-74.2220111270966,-74.2219018415173,-74.2217986388705,-74.2217487267106,-74.2216967575853,-74.2216672422115,-74.2216539687517,-74.2216029861863,-74.2215884454116,-74.221570066132,-74.2215445018061,-74.2214987669607,-74.221493773087,-74.2214728095629,-74.2214526081937,-74.2214546937205,-74.2214624302176,-74.2214544643975,-74.221431953254,-74.2214005495371,-74.2213467762411,-74.2212986460446,-74.221255042479,-74.2212137505748,-74.2212071393661,-74.2212028442142,-74.221197424942,-74.2211931265043,-74.2211832282347,-74.2211597670403,-74.2210936928059,-74.2210533827537,-74.2210399857697,-74.2210244895006,-74.2210101085919,-74.2209901341243,-74.220979045272,-74.2209432973212,-74.220867150934,-74.2208223165641,-74.2207696226611,-74.2206956786855,-74.2206217594913,-74.2205534015106,-74.2205287038639,-74.2204994179498,-74.2204690155966,-74.2204571404394,-74.2204453822721,-74.2204229060158,-74.220418238229,-74.2204058715872,-74.2203330147874,-74.2202971180895,-74.2202858530571,-74.220277828543,-74.2202665585135,-74.2202665556956,-74.2202194369726,-74.2201845618246,-74.2201788089621,-74.2201831028015,-74.220181790769,-74.2201793685452,-74.2201623873266,-74.2201431677601,-74.2201352263147,-74.2201436988322,-74.2201447431832,-74.2201062716494,-74.2200514315675,-74.2199933460683,-74.2199207243151,-74.2198651840271,-74.2198022919714,-74.2197435693072,-74.2196721472014,-74.219600267411,-74.2195611261846,-74.2195298716999,-74.2194844686722,-74.2194088361905,-74.2193232128561,-74.2192555290343,-74.2191758631708,-74.2191101491143,-74.2190806089935,-74.2190900512675,-74.2191283505424,-74.2191733979614,-74.2192345849937,-74.2192582450444,-74.219233301271,-74.2191955465313,-74.2192097819695,-74.219252237166,-74.2192951087831,-74.2193101550094,-74.2193205266263,-74.2193370127899,-74.2193053958899,-74.2192863963964,-74.2192171637093,-74.2191944345817,-74.2191823263441,-74.2191796802852,-74.2191813621982,-74.219189054418,-74.219178494691,-74.219169392286,-74.2191363295125,-74.2190920208725,-74.2190754688576,-74.2190706851673,-74.2190678720263,-74.2190440724613,-74.2189901474795,-74.2189583263323,-74.2189139092068,-74.2188697347666,-74.2187807748567,-74.2185932578281,-74.2185398175648,-74.2185327233396,-74.2185650173142,-74.2185508708539,-74.2185363814707,-74.2185676824066,-74.2186388956635,-74.2187007098445,-74.2187591863369,-74.2187974474673,-74.2188190596518,-74.2187539992374,-74.2188020251887,-74.2187503688056,-74.2187076756,-74.2186704432801,-74.2186567937259,-74.2184151987498,-74.2182699919592,-74.218173601934,-74.2181215645929,-74.2181285554603,-74.2180714638306,-74.2179149889179,-74.2177534239174,-74.2174127277268,-74.217190725648,-74.2169722657385,-74.2167576873947,-74.2165473239862,-74.2162418355111,-74.2160424606064,-74.2158515638771,-74.2155682464113,-74.2147405319882,-74.214912175889,-74.2149705299989,-74.2150181720181,-74.2149925696477,-74.2146234047829,-74.2145835975558,-74.214493575094,-74.2144753323965,-74.2144356260735,-74.214344476313,-74.2142821281772,-74.2142269885425,-74.2141661398686,-74.2141227760576,-74.2140577137868,-74.2140102780821,-74.2139693406919,-74.2139553744972,-74.2138687441303,-74.213863593664,-74.2139008816072,-74.2138875548331,-74.2138685860586,-74.2138468660943,-74.2138369925401,-74.2138163455419,-74.213790344588,-74.2137771979085,-74.2137646731759,-74.2137350361449,-74.2137115694009,-74.2136620747585,-74.2136290446142,-74.2135959459592,-74.2135643962424,-74.2135207218246,-74.2134739230008,-74.2133956062077,-74.2133333235227,-74.2132745729138,-74.2132403140867,-74.2132469734043,-74.2132439733105,-74.2132387154599,-74.2132292959265,-74.2132191690179,-74.2132083377696,-74.2131968076357,-74.2131891269533,-74.2131822272608,-74.2131761234,-74.2131708251728,-74.2131663478646,-74.2131626957845,-74.2131598789405,-74.2131579009795,-74.2131579261457,-74.2131571400776,-74.2131555441653,-74.2131531475014,-74.2131499622381,-74.2131460060339,-74.2131412972026,-74.2131358632894,-74.2131297309678,-74.2131229346012,-74.2131155057056,-74.2131074874477,-74.2130975646827,-74.2130869253811,-74.2130755973581,-74.2130636018386,-74.2130509642282,-74.213037711915,-74.21302387294,-74.213009478215,-74.2129966159449,-74.212983216339,-74.2129693063621,-74.2129549138571,-74.2129400631547,-74.2129247836458,-74.2129091018612,-74.2128930485152,-74.2128766565132,-74.2128515267461,-74.2128263108875,-74.2128010262941,-74.2127934512715,-74.2127860265831,-74.2127788312555,-74.2127719361686,-74.2127654135101,-74.2127593299413,-74.2127537486182,-74.2127487258524,-74.2127443139989,-74.2127405601281,-74.2127272159464,-74.2127135888021,-74.2126997485021,-74.2126857655263,-74.212671709701,-74.2126650895761,-74.212658904433,-74.212653204027,-74.2126480348263,-74.2126434379907,-74.2126394487659,-74.2126361017159,-74.2126334210855,-74.2126314289053,-74.2126301412834,-74.2126295690501,-74.2126297168736,-74.2126305819701,-74.2126321586891,-74.2126344345807,-74.212637390819,-74.2126410048619,-74.2126452464761,-74.2126500821384,-74.2126723151641,-74.2126761343476,-74.2126790530317,-74.2126810680636,-74.2126821736473,-74.2126823736697,-74.2126816632101,-74.2126836825679,-74.2126848169119,-74.2126850630667,-74.2126844218057,-74.2126828914874,-74.2126804785941,-74.2126771872046,-74.2126730266548,-74.2126622112392,-74.2126506339365,-74.2126383078657,-74.212625251629,-74.2126114814137,-74.2125970169269,-74.2125818783117,-74.2125660852828,-74.2125522599428,-74.2125378511429,-74.2125228759539,-74.2125073527919,-74.2124912976429,-74.2124747330814,-74.2124576733534,-74.2124515690885,-74.2124401414777,-74.2124097325393,-74.2123798416544,-74.2123216809138,-74.2123101277296,-74.212299104267,-74.2122886385641,-74.2122787628428,-74.2122695040373,-74.212260888203,-74.2122529392056,-74.212245680014,-74.2122391314085,-74.2122336948165,-74.2122333141621,-74.2122282409203,-74.2122239265175,-74.2122203862407,-74.2122176272267,-74.2122156588287,-74.2121984490164,-74.2121818859828,-74.2121659841867,-74.2121507591754,-74.2121362229735,-74.2121223913527,-74.2121092750196,-74.2120968864473,-74.212085237213,-74.2120743395769,-74.2120641998454,-74.2120496360293,-74.2120357687576,-74.2120226061117,-74.2120101581541,-74.2119984316425,-74.2119874370783,-74.2119771823254,-74.211967671726,-74.2119589146791,-74.2119509159709,-74.2119436792857,-74.2119372138045,-74.2119315210077,-74.2119266061279,-74.211922470871,-74.2119191211143,-74.2119165568148,-74.2118986761295,-74.2118801739018,-74.211861052304,-74.2118413119796,-74.2118209551066,-74.2117999832014,-74.211778400422,-74.2117562045513,-74.2117557355902,-74.2117560257779,-74.2117570773848,-74.2117588808004,-74.2117614202853,-74.211764683166,-74.2117686427183,-74.2117732715689,-74.2117785364115,-74.2117844002197,-74.2117908187227,-74.2117977489803,-74.2118131007146,-74.2118282773711,-74.2118432400286,-74.2118579447356,-74.2118723497269,-74.2118864132158,-74.2119001006777,-74.2119133672482,-74.2119261792656,-74.211933493293,-74.2119402780977,-74.2119464953551,-74.2119521128957,-74.2119571035868,-74.2119614365707,-74.2119650913001,-74.2119680487559,-74.2119702916881,-74.2119718109616,-74.2119725970017,-74.2119726446295,-74.2119719543672,-74.2119705304811,-74.2119683800942,-74.2119655129617,-74.2119571680197,-74.2119479986395,-74.2119380150909,-74.2119272186446,-74.2119156180329,-74.2119076805553,-74.2119005612493,-74.2118942710298,-74.2118888118123,-74.2118841951628,-74.2118804232168,-74.2118739842734,-74.2118668321391,-74.211858982563,-74.2118504427377,-74.2118412262157,-74.2118313450163,-74.2118208124835,-74.2118096454639,-74.2117978584115,-74.2117865057193,-74.2117744574968,-74.2117617264333,-74.2117483258635,-74.2117342739682,-74.2117195862903,-74.2117042768412,-74.2116883679669,-74.2116718761034,-74.2116570688627,-74.2116429073887,-74.2116294166529,-74.2116166233805,-74.2116045490308,-74.2115932172453,-74.2115826481558,-74.2115605971606,-74.2115392574803,-74.2115186385339,-74.2114987451194,-74.2114795848924,-74.2114706758209,-74.2114610765041,-74.2114507954528,-74.2114398440373,-74.2114282347239,-74.2114159782246,-74.2114030914068,-74.2113895825611,-74.2113754700936,-74.2113371348124,-74.2112994457548,-74.2112624114704,-74.2112260429112,-74.2112170869814,-74.2112088164436,-74.2112012470388,-74.2111943934066,-74.2111882715095,-74.2111828911493,-74.2111782660818,-74.2111744025993,-74.211171310284,-74.2111689954197,-74.2111674627595,-74.2111667139709,-74.2111667511696,-74.2111652129818,-74.2111646385031,-74.2111650301013,-74.2111663870647,-74.2111687082446,-74.2111719931474,-74.2111720908169,-74.211173035604,-74.2111748207353,-74.2111774339365,-74.2111808482327,-74.2111850368657,-74.2111899645226,-74.2111955862306,-74.211201855051,-74.21120871725,-74.2112185734891,-74.2112280701041,-74.2112371523306,-74.2112457726394,-74.2112538848202,-74.2112614448448,-74.2112684108739,-74.2112747474338,-74.2112804188239,-74.2112866930577,-74.2112921561914,-74.2112967876847,-74.2113005735879,-74.2113035061059,-74.211305575238,-74.2113067742805,-74.2113115501129,-74.2113154561792,-74.2113184831428,-74.2113206214492,-74.2113218659333,-74.2113222123118,-74.2113242577885,-74.2113255094852,-74.2113259686844,-74.2113256316022,-74.211326378096,-74.2113281579796,-74.2113309669828,-74.2113347984142,-74.2113396479999,-74.2113402624883,-74.2113400528133,-74.2113390182396,-74.211337162206,-74.2113344830916,-74.2113309869674,-74.2113266818899,-74.2113215719452,-74.2113156658441,-74.2113089725234,-74.2112792614834,-74.2112500720887,-74.2112214109095,-74.2111932829551,-74.211193237312,-74.2111924221417,-74.2111908417665,-74.2111884967697,-74.2111853906034,-74.2111815304391,-74.211176917965,-74.2111715656315,-74.2111610526318,-74.2111513036203,-74.2111423231712,-74.2111341160886,-74.2111262660106,-74.2111192450137,-74.2111130550165,-74.2111077047475,-74.2111031954716,-74.2110995337209,-74.2110967214153,-74.2110947587227,-74.2110936484364,-74.2110933920394,-74.2110939905707,-74.211093919191,-74.2110945907058,-74.2110960035523,-74.2110981598844,-74.2111010559432,-74.2111046912448,-74.2111090646681,-74.2111599476683,-74.2111665601608,-74.2111739458856,-74.2111820940349,-74.2111910045573,-74.2112006684055,-74.2112110793738,-74.2112222325942,-74.2112737238345,-74.2112834846032,-74.2112925564301,-74.2113009348778,-74.2113086155006,-74.2113155914547,-74.2113218571922,-74.2113274098245,-74.2113337013013,-74.211339209844,-74.2113439248554,-74.2113478478115,-74.2113509725126,-74.2113532984646,-74.2113552934058,-74.2113529246125,-74.211351297588,-74.2113504168928,-74.2113502800428,-74.2113508880727,-74.2113522418014,-74.2113543380946,-74.2113571755675,-74.2113607499855,-74.2113650562325,-74.2113668553601,-74.2113693778171,-74.2113729660878,-74.2113758216734,-74.2113779423426,-74.2113793282843,-74.2113799785878,-74.2113700861941,-74.2113593678171,-74.2113478306639,-74.2113354847811,-74.2113223371415,-74.2113083982404,-74.2112936757136,-74.2112763977053,-74.211259819303,-74.2112439507953,-74.2112287985121,-74.2112143674767,-74.2112006670956,-74.2111876993125,-74.2111754728744,-74.2111490865083,-74.2111233811435,-74.2110983600475,-74.2110740251871,-74.2110503824717,-74.2110274327639,-74.2110051797808,-74.2109836250382,-74.2109627740123,-74.2109347587435,-74.2109216553023,-74.2109075560058,-74.2108924590527,-74.210876373178,-74.2108677408998,-74.2108599377639,-74.2108529700861,-74.2108468408946,-74.2108415569357,-74.2108371218981,-74.2108132147265,-74.2107881955909,-74.2107797307137,-74.2107597610058,-74.2107531682425,-74.2107433054226,-74.21072667691,-74.2107179266924,-74.2107085089516,-74.2106974351864,-74.210677331985,-74.2106399339168,-74.2106234374394,-74.2105846227725,-74.2105623268847,-74.2104755960659,-74.210451761209,-74.210396395501,-74.2103755852281,-74.2103607965636,-74.2103339682664,-74.2103085149873,-74.2102847312101,-74.2102575093867,-74.2102356775115,-74.2102093503541,-74.210114587757,-74.2100369420817,-74.2099764118817,-74.2099219893646,-74.2098834898241,-74.2098558616214,-74.2097973714863,-74.2097769134287,-74.2097613438043,-74.2097385637958,-74.2097151907235,-74.2096997128649,-74.2096779547163,-74.2096465523344,-74.2096282498897,-74.2096095952877,-74.2095963852099,-74.2095792922388,-74.2095564385293,-74.209541258574,-74.2095289203796,-74.2095246132284,-74.2095239073365,-74.2095299121373,-74.209540693739,-74.2095508790996,-74.2095720711381,-74.2095617405607,-74.2095512247081,-74.2095384978262,-74.2095346723291,-74.2095275511693,-74.2095139351494,-74.2094848888728,-74.2094476662524,-74.2094237327747,-74.2093851536311,-74.2093478026957,-74.2093217526834,-74.209310883544,-74.2093030250985,-74.2093022276102,-74.2093033834499,-74.2092688612379,-74.2092652588303,-74.2092704269466,-74.2092579431796,-74.2092416854709,-74.2092194802886,-74.2091858841011,-74.2091623580789,-74.2091250068416,-74.2090903132898,-74.2090581658526,-74.2090448997466,-74.2090342903803,-74.2090181063204,-74.2089929848336,-74.2089698884802,-74.2089423684784,-74.2089114296085,-74.2088842631788,-74.2088666111219,-74.2088556676376,-74.2088457271546,-74.2088429976674,-74.2088431863838,-74.2088430955048,-74.2088453824513,-74.2088530589109,-74.2088719055218,-74.2088864018067,-74.2088924805896,-74.2088915346961,-74.208891593364,-74.2088908511529,-74.2088957966369,-74.208900313545,-74.2088799705518,-74.2088901389141,-74.2089114173387,-74.2089248946428,-74.2089263632867,-74.2088830288257,-74.208853075435,-74.2088470544806,-74.2088274127123,-74.2088049636777,-74.2087781874855,-74.2087583030141,-74.2087271211846,-74.2087013089674,-74.2086822793365,-74.2086518771391,-74.208618818326,-74.2085869104527,-74.2085566234875,-74.2084688231757,-74.2084402231042,-74.2083752241598,-74.208333391512,-74.2082908180197,-74.2082556763688,-74.2082198108416,-74.2081792633823,-74.2081116395715,-74.2080764799493,-74.208058974781,-74.2080342415126,-74.2080170538142,-74.2080081154483,-74.2080050305256,-74.2080054602359,-74.2080074684795,-74.208013601338,-74.2080277629518,-74.2080469413281,-74.2080738341233,-74.2080998882646,-74.2081254798898,-74.2081469996813,-74.2081685110219,-74.2078355901513,-74.2072734007967,-74.2072629820731,-74.2072315961312,-74.2071916590324,-74.2071271152609,-74.2070780041042,-74.2070812725485,-74.2070814108665,-74.2071184953354,-74.2071585868643,-74.2071814237471,-74.2072048365536,-74.2072265020605,-74.2071926714753,-74.207156691061,-74.2071189613316,-74.2070913697962,-74.207073133584,-74.2070702436618,-74.2070928750448,-74.2071261252015,-74.2071540445461,-74.2072004985494,-74.2072284180299,-74.2072716759952,-74.2072872336889,-74.2072843141318,-74.2072320502591,-74.2071736424704,-74.2071060177028,-74.2069741238682,-74.2069251207469,-74.2068739530644,-74.2068531146025,-74.2068314875071,-74.2068120562678,-74.2068188460739,-74.2068205403253,-74.2068382465956,-74.206846371558,-74.2068497191497,-74.2068737187725,-74.2068865558776,-74.20692807001,-74.2069711179594,-74.2070221322372,-74.2070555944011,-74.2070954581273,-74.2070891717934,-74.2070733377331,-74.2070511302468,-74.2070401023572,-74.2070146886313,-74.2069813061001,-74.2069399228888,-74.2069367859877,-74.2069368876106,-74.2069273996345,-74.2069051353393,-74.2068844114949,-74.2068540757068,-74.2068253518858,-74.2067918940203,-74.2067393654126,-74.206702747361,-74.2066470961086,-74.2066147196221,-74.2065804053206,-74.2065550934209,-74.2065361739342,-74.2065268053321,-74.2065253290733,-74.2065312542969,-74.2065477957595,-74.20659246376,-74.2066355459368,-74.2066658630576,-74.2066929750963,-74.206693061562,-74.2067058777524,-74.206729863902,-74.2067474500446,-74.2067777592813,-74.2067984974578,-74.2068160648222,-74.2068161663884,-74.2068082796181,-74.2067796654767,-74.2067509902721,-74.2067160282676,-74.2066890479285,-74.2066748099254,-74.2066701396916,-74.2066606734004,-74.2066352823779,-74.2065970932302,-74.2065461044337,-74.2065046836454,-74.2064728750412,-74.2064442936041,-74.2064188986813,-74.2063950714984,-74.2063517696305,-74.2063234419536,-74.2062949354444,-74.206266428888,-74.206230057074,-74.2062063610091,-74.2061985332781,-74.2061811721045,-74.2061686393901,-74.2061514087366,-74.2061595102619,-74.2061748245,-74.2061739020672,-74.2061651805497,-74.2061511244108,-74.2061334339959,-74.2061088669828,-74.2060954249186,-74.2060756171571,-74.2060629581204,-74.2060463200759,-74.206039230342,-74.2060313291472,-74.2060194179043,-74.2060067395652,-74.205989313912,-74.2059774432636,-74.2059639960465,-74.2059537275925,-74.2059490115257,-74.2059371536162,-74.2059348200609,-74.205917325094,-74.2060664901368,-74.2060284124252,-74.2053989146549,-74.2044119994804,-74.2029499998021,-74.2005840002506,-74.1988762263611,-74.1974980000875],"lat":[40.5788590005879,40.5772617088882,40.5766236356205,40.5766850285199,40.5766791202205,40.5763185234041,40.5748930690814,40.5744948794977,40.5739353174637,40.5732826221847,40.5727996205986,40.5723104626349,40.5717614809775,40.5715953050637,40.5710571385717,40.5710373525912,40.5709312067735,40.5713355039409,40.5717305371768,40.5721864095687,40.5726665061419,40.5732498561291,40.5738817225564,40.5746106996704,40.575321436036,40.5755255649528,40.5753372479939,40.5751445550771,40.5749475825282,40.5747464288116,40.5745411944807,40.5743319821281,40.5741188963337,40.5739020436207,40.573681532379,40.5734574728336,40.5732299769819,40.5729991585379,40.5727651328751,40.5725280169689,40.5725004743426,40.5724573031455,40.5723355342815,40.5717146255052,40.5720734943531,40.5721932001548,40.5722605918989,40.5705483133979,40.5698750000021,40.5671106388179,40.5637554402341,40.5632413293207,40.563181887334,40.5631283585313,40.5630808354085,40.5630394000365,40.5630041240522,40.5629750684109,40.5629572776488,40.5629346998332,40.5629074048034,40.5628754772072,40.5628390155932,40.5627981327469,40.5625729717263,40.5622869362441,40.5617048371558,40.561551719835,40.5615209230203,40.5614924158657,40.5613977305618,40.5613202637955,40.561285029582,40.5612281161901,40.5611766930729,40.5611307867612,40.5610904206046,40.5604766053655,40.5602904102697,40.5606424482222,40.5614469703726,40.5623456418449,40.562951695702,40.5653379837258,40.5656248615302,40.5667293999793,40.5703824434124,40.5707469288205,40.5712740617826,40.5714105750647,40.5714610589974,40.5720133209792,40.5718477694807,40.5720374100049,40.5723326139677,40.5724225526331,40.5725273721191,40.5727398873731,40.5727796429604,40.5729084522082,40.5729913095805,40.5730519498333,40.5731977126844,40.5732382283604,40.5732966040146,40.5733215435835,40.5733501081286,40.5733822778878,40.5734180314265,40.5734463493115,40.5734790937297,40.5735162067815,40.5735576226782,40.5737425306182,40.5741060101974,40.5746824823603,40.5747300541427,40.5750565385785,40.5751675762499,40.5752066245533,40.575240724315,40.5752802376302,40.5753245886939,40.575373131217,40.5754251577883,40.5754799102494,40.5764052186687,40.5762849329162,40.5759844469469,40.5759010430202,40.5758813539717,40.5758328716827,40.5758079333258,40.5757870129121,40.57578698613,40.5757869407644,40.5757518528895,40.5757518161857,40.5757517719419,40.5757027727791,40.5757027191787,40.5757026474738,40.5756405814445,40.5756405458491,40.5756405003575,40.5755667879619,40.5755667068616,40.5755666257362,40.5754830196804,40.5751325873752,40.5749069850808,40.5746531813966,40.5742170889656,40.573832027759,40.5735559198829,40.5729755487895,40.5728267437394,40.5726757347448,40.5726756622045,40.5725238710791,40.5723728007548,40.5723727112814,40.5723726119111,40.5722236682536,40.5720922110721,40.5717756146804,40.5715013938681,40.5709394937403,40.5705964331634,40.5704298447689,40.5701783647501,40.5701375377127,40.5700983608072,40.5699491962305,40.5699205329322,40.5698325286489,40.5694245377283,40.5689491424445,40.5684307186556,40.5682399812729,40.5680758638436,40.5679663664545,40.5670884600852,40.5662274656848,40.5657795527173,40.5653552243262,40.5649216420596,40.5644177637808,40.5639435159133,40.5639156379859,40.5638792104359,40.5638027318887,40.5631660707364,40.5629324875105,40.5626757240841,40.5636898192186,40.5655055577586,40.564310666832,40.5639089377653,40.5635283633471,40.5631455882576,40.5627698833931,40.5626670460355,40.5622963328294,40.5619899734925,40.5615952394129,40.5611732280791,40.5610296731188,40.5608896948932,40.5607533541202,40.5606207099398,40.5604918198884,40.5603667395555,40.5602455235095,40.5601282243285,40.5600148928915,40.5599055783561,40.5597200764875,40.5586914631006,40.5561875166401,40.5552880458486,40.5534236290893,40.5528108407792,40.5524646516058,40.5525130226466,40.550376512558,40.550148394863,40.5498584511809,40.550948085111,40.5506455113435,40.5505305226699,40.550215477254,40.549127741725,40.5490230404453,40.5489913911023,40.5504596952959,40.5516307519132,40.5517865892298,40.5522219060446,40.5530819500847,40.5543585024633,40.5550846581718,40.5552308277777,40.5563280570063,40.5572654909115,40.5572951724478,40.5565344367978,40.5557698719063,40.5550326257449,40.5544370425603,40.5539737593305,40.5534899710139,40.5523561791593,40.5512550782035,40.5508632389527,40.5504333007767,40.5495923695195,40.5493835464295,40.5486918314848,40.5484858167766,40.5484414795959,40.5480317959159,40.5473096046666,40.5470234823076,40.5469804431863,40.5464516962123,40.5462523500419,40.5460732244525,40.5459750074768,40.5459147476352,40.5459231816687,40.5459704975242,40.5459749884054,40.5459574964829,40.5458946559959,40.5458849643527,40.545952218157,40.5459309743596,40.5458640079923,40.5457928646606,40.5457731072957,40.5457740977644,40.5457603717557,40.5457148039238,40.5457004402763,40.5456527216079,40.5456382428392,40.5455921271677,40.5455755924444,40.5455297076368,40.5455130226567,40.5454686570221,40.5454522949455,40.5454071989604,40.5453903489881,40.5453480113057,40.5453308218429,40.545289054841,40.5452642880667,40.5452090218232,40.5451843060599,40.5451306719182,40.544963297436,40.5450394688265,40.5450198456799,40.5449445312017,40.5448546715063,40.5448742951115,40.5449470405893,40.5450238192585,40.5450882369259,40.5450918619453,40.5452469277242,40.5452511903707,40.5457567488644,40.5457658702388,40.5457842947001,40.5455775572387,40.5455590957828,40.5455649178379,40.5455505192948,40.545532251471,40.5455098039339,40.5454953158143,40.5454355517738,40.5454208509651,40.5453968824532,40.545385159485,40.5453232997171,40.5453186570778,40.5449177165074,40.5449145055556,40.5448889173232,40.5448796259871,40.544816826207,40.5448037420239,40.5448036539685,40.5448620754521,40.5448454865986,40.5448211866394,40.5447053237361,40.5446825939101,40.5446994427068,40.5447825844806,40.5454662480497,40.5454612400055,40.5454426240457,40.5454114740534,40.5454284455648,40.5454200927668,40.5454484235702,40.5454943697428,40.5455527144634,40.5455542162613,40.5455717980466,40.5455654720921,40.5455848658974,40.5458940185288,40.5460003370781,40.5459133413148,40.5457946368569,40.5457058589417,40.5456064142105,40.5455721970229,40.5455321456487,40.5454866801769,40.5454362774832,40.5453814662269,40.5453228213066,40.545260957829,40.5451965246579,40.5451301976073,40.5449910703051,40.5449454240186,40.5449292869276,40.5449284564968,40.544914183496,40.5448874196628,40.544871216455,40.544840933227,40.5448243557069,40.5447950889822,40.5447778466406,40.5447505435395,40.5447331324352,40.5447242225053,40.5446869291927,40.544668420924,40.5445509381739,40.5445383639836,40.5445109276413,40.5444989905795,40.5444998582801,40.5445477528052,40.5442535664183,40.5441449287782,40.544162838483,40.5442449588073,40.544258625718,40.5442765315792,40.5443013253921,40.5443514784496,40.5443752863069,40.5443884232617,40.544505916169,40.5445041843163,40.5444586518959,40.5444733494014,40.544510694784,40.544526541823,40.5445651876447,40.5445805135414,40.5446203221569,40.5446346067922,40.5446755480971,40.544688555326,40.5447300111945,40.5447425668588,40.5447845844508,40.5447970583205,40.5448400097493,40.5448506779014,40.5448932851064,40.5449050991852,40.5449178200611,40.5449339584269,40.54471556103,40.5446960197026,40.5446818790667,40.5446434591453,40.5446275210224,40.5445891931926,40.5445733505321,40.5445360228384,40.544519037862,40.5444809345596,40.5443767196152,40.5443717978033,40.5443341776655,40.54431785467,40.5443013640935,40.5442620652816,40.5442472998096,40.5441947502053,40.5441779531994,40.5441275534566,40.544110588686,40.5440563641666,40.5440394992188,40.5440301187969,40.5439983235619,40.5439900437894,40.5439983499749,40.5440704511219,40.544052544131,40.5439984073891,40.5439045624638,40.5439199102475,40.5439712269146,40.5439982661931,40.5440155653411,40.5440331609231,40.5440393445033,40.5447049103001,40.5442951408722,40.5442172175162,40.5442254011984,40.5442316344396,40.5442361065785,40.5442739819937,40.5442787563759,40.544312607951,40.5443180327188,40.5443330263793,40.5443384011407,40.5443696244542,40.5443761461185,40.5444061637795,40.544412562779,40.5444400015295,40.5444450210537,40.544472957985,40.544505211599,40.5445095806226,40.5444773275082,40.5444791913647,40.5444280973331,40.5444214053763,40.5444606893719,40.5444456693691,40.5443569516712,40.5443235391704,40.5443179250311,40.5442802370123,40.5442750703671,40.5442392924676,40.5442347548736,40.5442180963305,40.5442141211748,40.5442059435372,40.5441525974467,40.5441165894046,40.5443761018197,40.5443289755327,40.5443200698636,40.5443493236649,40.5443488962347,40.544318789923,40.5441981105066,40.5441858409325,40.5441785488252,40.5441417327933,40.5441346627998,40.5441405560712,40.5441215186911,40.5440854651292,40.5440667001713,40.544060565981,40.5439969718145,40.543968224884,40.543985337042,40.5439911568362,40.5440387663385,40.5440715559807,40.5440803196593,40.5441127211991,40.5441223321786,40.5441308732031,40.5441735200841,40.5441820619241,40.5442255537704,40.5442435579349,40.5442338592804,40.5441957596372,40.5441497361791,40.5441454422561,40.5441300225351,40.544115549509,40.5441632574432,40.5441592412467,40.5439747122355,40.5439800483146,40.5439601531657,40.5438774495436,40.5437913588905,40.5438126838452,40.5438232084188,40.5438378923764,40.5438866537949,40.5438902884259,40.5439469034463,40.5439677364073,40.5440364036957,40.5440414886138,40.5440517369006,40.5440960817845,40.5441046384903,40.5439977944383,40.5439784273163,40.5439698765311,40.5439977709135,40.5440236013432,40.5440235824375,40.5440145543871,40.5439635765562,40.5439491938079,40.5439277726949,40.5438823558692,40.5438642394978,40.5438494052361,40.5438311084937,40.5438170379593,40.5438014818984,40.543802712815,40.5437840548959,40.5435879281902,40.5436039925254,40.5436145321102,40.5436642762901,40.5436786523925,40.543686146544,40.5437051466693,40.5437152873997,40.5436504721831,40.5436522062883,40.5437001090255,40.5437274814488,40.5437736783601,40.5437890544156,40.5438538662149,40.5438666945706,40.5437720367572,40.5436017996904,40.5436410270242,40.5436418556121,40.5436238991206,40.5436291045691,40.5435785423061,40.5435657530921,40.5435648988578,40.543613657257,40.5436196446624,40.5435983275946,40.5435393030491,40.5435155516826,40.5435765193703,40.5435518283115,40.5434015512519,40.5434241559779,40.5435062859916,40.5435307495557,40.5434503403666,40.5434725121242,40.5435443673409,40.5436823398945,40.5437437454514,40.5438957708517,40.5439296180854,40.5439436550206,40.5439816123553,40.5440027373064,40.5440319717899,40.5440694440666,40.5440856024233,40.5440909312311,40.5440950189436,40.5441696882746,40.5441904087687,40.5441941029544,40.5442027774085,40.5442469146201,40.5442722748305,40.5440524628434,40.5434073986827,40.5434322645814,40.5432914108344,40.5431317776023,40.5431500400007,40.543291332203,40.5433656938733,40.5432269939407,40.543245255808,40.5433394629086,40.5433733694009,40.543384411373,40.543413938684,40.5438889958587,40.5437368233215,40.543752471885,40.5439087771863,40.5440268445121,40.5438839996238,40.5438458259352,40.5438304268448,40.5438588508326,40.5440504020557,40.5440166175625,40.5440331850079,40.5440027251731,40.5439890166955,40.5439320173566,40.5438253117535,40.5438078380735,40.5438020872711,40.5437939557338,40.5437931679677,40.5438342865225,40.5438261083167,40.5437852598346,40.5437716251276,40.5437420400476,40.5437212323946,40.5437103111862,40.5436733429661,40.5436557619803,40.5436257801328,40.5436096515059,40.5435755242495,40.5435686743094,40.5435275102707,40.5434894563346,40.5434687032815,40.5434391565184,40.5434107731119,40.5433848268248,40.5433518771983,40.5433465020236,40.5431592324521,40.5430960850942,40.5431819620798,40.5431660851379,40.5431506630977,40.5431302904842,40.5431059987132,40.5430165845853,40.543036067581,40.5430768690463,40.5430887818619,40.5431174603055,40.5431368636368,40.5431557046726,40.5431636501416,40.543205441983,40.5432130312066,40.5432561273817,40.5432628408876,40.5433030279158,40.5433113466614,40.5433507773596,40.5433603439366,40.5434009874839,40.5434262037489,40.5434487406994,40.543470173304,40.5434976764815,40.5435072567479,40.5435470825237,40.5435570671846,40.5436960628256,40.5436404571555,40.543579062284,40.5435747864831,40.5435133934169,40.5433850711192,40.5433322071432,40.5433226618805,40.5432692567445,40.5432601471557,40.5432063248439,40.5431984072355,40.5431433490584,40.5431354490045,40.5430812599675,40.5430732956792,40.5430186769224,40.5430115791504,40.5429557266973,40.5429482168146,40.542893592426,40.542885666581,40.5428527941093,40.5428231206305,40.5427856020985,40.5428437706569,40.5428258639987,40.5426821508698,40.5427000561277,40.5427684925777,40.5428068644754,40.5428269923885,40.5428675223118,40.5428766701538,40.5429282013251,40.5430519652023,40.5430557597329,40.5430682961604,40.5431192648812,40.5431336547392,40.543181604243,40.5432510554187,40.5433050294196,40.5433133869505,40.543367110617,40.5431130296925,40.5430472783767,40.5430377024273,40.5429723549339,40.5429640455432,40.5429143532478,40.5428895259002,40.5428254458213,40.5428179415459,40.5427589285252,40.5427430096214,40.5427002793811,40.5426697228317,40.5426558523688,40.5424811556552,40.5425607111017,40.5425410975662,40.5423571751292,40.542375935051,40.5424640483013,40.5430942149021,40.5429388449791,40.5429599417193,40.5430869856264,40.5430520553559,40.5429632647988,40.5429489975874,40.5430417205875,40.5431501468887,40.5430941338302,40.5430695963227,40.5430736957838,40.5424207713665,40.5424038195649,40.5424065008183,40.542382175047,40.5423608554505,40.5424557885189,40.5423662189361,40.5422722590173,40.5422350579976,40.5422282092595,40.5422454849487,40.5423652242984,40.5423893295243,40.5424221265302,40.5423270825521,40.5423820380138,40.5424217411359,40.5424246629401,40.5429864583076,40.5430548917787,40.5430612886838,40.543086165326,40.5430224150804,40.5427911718516,40.5427186737149,40.5426540462122,40.5426389142065,40.5427034664817,40.5426963222036,40.5427687707537,40.5427470474874,40.542678053538,40.5426046137452,40.5425876588514,40.5426603408564,40.5425887924703,40.5425745060639,40.5425991302564,40.5425555531585,40.5425314984727,40.5424952485722,40.5424870997357,40.5424451520926,40.5424363132244,40.5423868041995,40.5423771789671,40.5423231362245,40.5423155972807,40.5422567462003,40.5422489080592,40.5421869541269,40.5421784841463,40.5421151913906,40.5421064111717,40.542052568689,40.5420582173768,40.542127442536,40.5420906280288,40.5420605363927,40.5419615115226,40.541934230415,40.5420597877724,40.542060855324,40.5420265558486,40.54199253403,40.541976857628,40.541951390829,40.5419262308872,40.5419085934737,40.5419248177307,40.5420165071128,40.5420422671676,40.5420560216439,40.5421770000803,40.5421980803777,40.5422517253996,40.5423178348248,40.5423267498079,40.5423349715886,40.5424018135867,40.5424802182529,40.5425641394291,40.5425688718672,40.5425775231316,40.5424839022239,40.5423530792411,40.5423358758857,40.5424677090705,40.5424260008006,40.5422904648709,40.5422784513675,40.5424106175046,40.5423215221428,40.5422004153824,40.542181628521,40.5415711106901,40.5415840478445,40.5415555067285,40.5417093464562,40.5416945420373,40.5414320784676,40.5414476828109,40.5415165838995,40.5415370948605,40.5421867693591,40.5421517799348,40.5421666581294,40.5423354640952,40.5423478381945,40.5423563520693,40.5423606932836,40.5423620634359,40.5423566647289,40.542344660279,40.5423264127885,40.5422871753172,40.542264548242,40.5422517606604,40.542246097558,40.5422409354799,40.5422437040901,40.5422509952046,40.5422619317851,40.5422900245845,40.542306895009,40.5423017688811,40.5422959634566,40.5422949843387,40.5422911093551,40.5422860884831,40.5422806444406,40.5422748141406,40.5422686349865,40.5422633725886,40.5422578491556,40.542252111965,40.5422462119733,40.5422401987957,40.5422341238712,40.5422280411548,40.5422220015717,40.5422160583841,40.5422090520893,40.5422022576778,40.5421957459763,40.5421895812639,40.5421838257997,40.5421785423337,40.5421712147971,40.5421634347007,40.5421552306478,40.5421466325835,40.5421376714661,40.5420677825307,40.5420596847022,40.5420514337465,40.5420430770597,40.5420346637156,40.5420262422964,40.5420178610517,40.5420095692435,40.5420014142986,40.5419922521287,40.5419831702869,40.5419742044652,40.5419653891881,40.5419567598213,40.541948349054,40.5419401905836,40.541932317777,40.5418929336118,40.5418812575336,40.541869764833,40.5418584821607,40.5418474368444,40.5418366547005,40.5418261593753,40.5417694857165,40.5417559958502,40.5417426454497,40.5417294690402,40.5417165008128,40.5417037719457,40.5416985762918,40.5416930839711,40.5416873498094,40.5416814328141,40.5416753904711,40.5416692849527,40.5416631753975,40.5416571261391,40.5416511947862,40.5415903465424,40.5415790955221,40.5415678390187,40.5415566135513,40.5415454491161,40.5415343780513,40.541523434038,40.5415126477512,40.5415020510333,40.5414892733255,40.5414768250331,40.5414647338249,40.5414530231836,40.5414417217872,40.541430852113,40.5414263607386,40.5414213534576,40.5414158581406,40.5414099068471,40.5414035363195,40.5413967812868,40.5413896828401,40.5413822823971,40.5413746208732,40.541366746376,40.5413587019905,40.5413505368143,40.5413449543664,40.5413393260867,40.5413337097748,40.5413281602064,40.5413227328191,40.54131748036,40.5413124554019,40.5413077096692,40.541303288516,40.5412992357772,40.5412897295282,40.5412798539191,40.5412696569891,40.5412591936542,40.5412485178322,40.5412383072167,40.5412282594328,40.5412184119899,40.5412087987077,40.5411994587623,40.5411904226151,40.5411817255867,40.5411733982976,40.5411654737108,40.5411557147043,40.5411455608858,40.5411350350099,40.5411241631812,40.5411129686621,40.5411014790708,40.5410853672383,40.5410695852307,40.5410541543003,40.5410390960356,40.5410258492583,40.541012265352,40.5409983610498,40.5409841519138,40.540973323574,40.5409622673982,40.5409510197188,40.5409396173799,40.5409280963853,40.5409164920757,40.5409049463953,40.5408935610987,40.5408823794263,40.5408714409373,40.5408607907256,40.5408504683586,40.5408420874097,40.540826282341,40.5408139592355,40.5408075448023,40.5408013479737,40.5407954060776,40.5407897602907,40.5407844457554,40.5407794962649,40.5407749449436,40.5407660630899,40.5407575397578,40.5407493941772,40.540741643408,40.5407343060174,40.5407273995606,40.5407209410901,40.5407114723906,40.540701500942,40.5406910376045,40.540680091228,40.5406748334769,40.5406691429964,40.5406630522368,40.5406565956645,40.5406498104245,40.5406427378617,40.5406354168118,40.5406278884556,40.5406201978354,40.5406123881603,40.5406045056554,40.540598069201,40.5405916822504,40.5405853954048,40.5405792581048,40.5405733202993,40.5405676275894,40.5405622250766,40.5405571572053,40.5405536455357,40.540549662954,40.5405452623097,40.5405404979572,40.5405354304354,40.5405301227865,40.5405246449051,40.5405190648383,40.5405134527903,40.5404992055738,40.540485174801,40.5404713777103,40.5404578338902,40.5404445609142,40.5404315746822,40.5404188939397,40.5404108903189,40.540403334465,40.5403962720548,40.5403897434005,40.540383786963,40.5403808834643,40.5403774497619,40.5403734970326,40.5403690404715,40.5403640937654,40.5403562304812,40.5403482021672,40.540340055215,40.5403318418818,40.540323613255,40.5403154209403,40.5403073148657,40.5402993471479,40.540289092895,40.540278758283,40.5402683719604,40.5402579627504,40.5402475611408,40.5402371977899,40.5402269011723,40.5402167014386,40.5402051730844,40.5401939185685,40.5401829814234,40.5401723981348,40.5401622073694,40.5401491180907,40.5401364358087,40.5401241881267,40.5401123991374,40.5401116074695,40.5401102737922,40.5401084177674,40.5401060699482,40.5401032649183,40.5401000491657,40.5400964698529,40.5400925862155,40.5400884563348,40.5400841461749,40.5400797247252,40.5400752579801,40.5400706703133,40.5400661557937,40.5400617821238,40.5400576140074,40.5400537134743,40.5400501388872,40.5400469440903,40.5400441769086,40.5400418763002,40.5400400798889,40.5400388117318,40.540038090696,40.5400379306328,40.5400383299779,40.540039285656,40.5400407810242,40.5400371188861,40.5400329693182,40.5400283669046,40.5400233524173,40.5400179688045,40.5400122603477,40.5400062783517,40.5400000732871,40.5399936984524,40.5399872098275,40.5399806612008,40.5399741103752,40.5399634302627,40.5399527653389,40.5399421452585,40.5399316046894,40.5399211747884,40.5399108863661,40.5399007695652,40.5398908578737,40.5398774715407,40.5398638950484,40.5398501468159,40.5398362496157,40.5398222230408,40.5398080885263,40.5397938685173,40.5397857732175,40.5397776632404,40.5397695808004,40.5397615704693,40.5397536701175,40.5397459231521,40.5397383667862,40.5397310419164,40.5397239856004,40.539717234895,40.5397108231763,40.5397047856642,40.5396991498799,40.5396941035808,40.5396781777007,40.5396619908601,40.5396206559256,40.539567959667,40.5395359733082,40.5394997836444,40.539462641489,40.5394221864642,40.5393873278675,40.5393655036751,40.5393394840971,40.5393097127344,40.5392756564253,40.5392097474064,40.5391752333985,40.539157705916,40.5391540039188,40.539139249467,40.539102899839,40.5390699752897,40.5390306542488,40.5390129140767,40.5389491904084,40.5388165531869,40.5385420409998,40.5381403536647,40.5381296833588,40.5381646208624,40.5381675290584,40.5384440912218,40.5384216204268,40.5381264417345,40.5381319726977,40.5381144533773,40.538091054995,40.5380039642851,40.5379327610682,40.5379165805348,40.5379214851866,40.5372539984325,40.5372540241964,40.5373656436452,40.5373468849647,40.5372159731227,40.5371381779484,40.5371535206805,40.5372156176087,40.5372346917341,40.5378945990974,40.5379021496463,40.5379177777889,40.5377532605048,40.5370875779524,40.5370395113774,40.5372398738565,40.5371369118496,40.5370756048685,40.5370103767763,40.5369415064662,40.5368692884037,40.5367940313668,40.5367160571262,40.5366356990691,40.536567403579,40.5365280926544,40.5363948711375,40.5363583733621,40.5359469312721,40.5358010442112,40.5357909517087,40.5358027579223,40.5358292720841,40.535823072827,40.5357477204432,40.5356678394425,40.5356476545468,40.535641866177,40.5355535282229,40.5354323197583,40.5353903928119,40.535361539395,40.5354143085487,40.5352432584207,40.534923016993,40.5346108136568,40.5345110030593,40.5342415877609,40.5338878693042,40.5338261818855,40.5334919100224,40.5334243027555,40.5333596843561,40.5332985655887,40.5332414295541,40.5331887278712,40.5331705972071,40.533087117843,40.532922721866,40.5329028518302,40.5329181930097,40.5328973452198,40.5328569009363,40.5328763589281,40.5328916924455,40.5329083517551,40.532734330709,40.5325458389371,40.5327066747915,40.5327422230621,40.5327413825067,40.5326830307651,40.5325953508908,40.5324017940281,40.5323976689349,40.5323931169975,40.5323882748235,40.5323832877312,40.5323783053879,40.532373477318,40.5323689484165,40.5323648545997,40.5323453549426,40.5323264400132,40.5323222867094,40.5323172322173,40.5323114065443,40.5323049595336,40.5322980570095,40.532290876513,40.5322836027344,40.5322764227637,40.5322695212777,40.5322630757902,40.5322572520863,40.5322081280847,40.5321640210233,40.5321560618396,40.5321522556251,40.5321527096938,40.5321574112436,40.5321662277168,40.532178910538,40.532178965163,40.532176345745,40.5321711069948,40.532157849563,40.5321422039742,40.5321216067012,40.5321065831868,40.5320975072425,40.5320960981753,40.5320906370885,40.5320811856354,40.5320679440009,40.5318130592167,40.5313921495921,40.5313079637789,40.5312384517676,40.5311189897351,40.5309611935645,40.5308315533215,40.530810023445,40.5307920975387,40.5307103123453,40.5306893639066,40.5306737729356,40.5306617893665,40.5306635436603,40.5307528668954,40.5307608219976,40.5307524984412,40.5307330386086,40.5306708423917,40.5306134188423,40.5305933226354,40.5305686068575,40.530549566642,40.5305337628022,40.5303177432654,40.5303398092679,40.5303575800478,40.5303597580135,40.5303542962514,40.5303310711297,40.5302488801038,40.5301021668611,40.5300621363037,40.5302254835757,40.5301538145175,40.5300780026229,40.5299982159896,40.5299146315279,40.5298274345685,40.529736818451,40.5296429840957,40.5294775054709,40.5294380263377,40.5296009045325,40.5295126932989,40.5294196032163,40.5293218620271,40.5292197088514,40.5291133936019,40.5290031763727,40.5289318417014,40.5286493688204,40.5286113710917,40.5289933116072,40.5290231637554,40.5289776563122,40.528841505123,40.52865910433,40.5285288141413,40.528300499163,40.5280851039537,40.5280670858444,40.5282784267832,40.5281972294126,40.5281170720973,40.5280980880003,40.5279359090663,40.5276697515068,40.5275117248349,40.5274277521444,40.5272959928316,40.5273693585489,40.5273646079802,40.5273473391559,40.5273428107855,40.5273432396092,40.5273449381143,40.5273609010182,40.5274019173638,40.5274483323148,40.5274892531592,40.527508208063,40.5275244488837,40.5275302094021,40.5275474380615,40.5275525336403,40.5275557473221,40.5275498276286,40.5270595497459,40.5270293818294,40.5270237724847,40.5270134782793,40.5270146587978,40.5270239030137,40.527048016213,40.5270716154377,40.5270880273121,40.5271041776311,40.5271303477768,40.5271443746886,40.5271569737561,40.5271804594812,40.5271960760596,40.5272022748899,40.5271942623083,40.5271660617172,40.5271262777397,40.527095443792,40.5270689614862,40.5270368533743,40.5270073279163,40.5269749474563,40.5269447132819,40.5269180438899,40.5268902637081,40.52685384596,40.5268166307513,40.5267867241057,40.5267609336909,40.5267147415284,40.5266750471119,40.5266384434019,40.5266030782771,40.5265668079199,40.526528296433,40.526495391343,40.5264521666551,40.5264136812566,40.5263788574045,40.5263500324935,40.526334504293,40.5263226073243,40.5263245187315,40.5262825873425,40.5262515017366,40.5262132814696,40.5261726641486,40.5261320338757,40.5259886550839,40.525730674806,40.5255515269588,40.5254196191842,40.5253791789195,40.5252562850225,40.5251875176356,40.5250165043661,40.524831290062,40.5244090287685,40.5239498681102,40.5238904875368,40.523590681654,40.5235291616386,40.5234381032053,40.523360544525,40.5233279558493,40.523276289946,40.5232294378258,40.5232057986647,40.5231338998142,40.5230457724524,40.5230265516223,40.5230079376034,40.5230089725672,40.5230131584889,40.5230306375563,40.5230487197855,40.5231017320268,40.5231366967413,40.5231623170834,40.5232847006658,40.5233129442849,40.5233729837318,40.5234316188942,40.523449273612,40.5234577671397,40.5234531918728,40.5232584599243,40.5229687355236,40.522920949968,40.5225691599175,40.5214942737874,40.5208759628291,40.5193299350362,40.519326893238,40.5193091947127,40.519300686764,40.519296166422,40.5192715799371,40.5192484260111,40.5192308668661,40.51922990368,40.5192293875981,40.5192293317337,40.5192297375065,40.5192305946058,40.5192318812529,40.5192335647542,40.5193325738797,40.5193635103998,40.5199236756649,40.5199457856311,40.5199615835295,40.5199706401264,40.5199798115526,40.5199935005712,40.5200116017489,40.5200280771721,40.5200387985227,40.5200436658772,40.5200426338715,40.520035712124,40.5200229651458,40.5200045117393,40.5199985158799,40.5199931838113,40.5199886734064,40.5199851182101,40.5199826234855,40.5199812630969,40.5199810773228,40.5199820716637,40.519984216679,40.5199874488586,40.5199916725036,40.5199967625594,40.5200025683186,40.5200089178831,40.5201581797857,40.5202007856501,40.5202409844866,40.5202782792899,40.5203122089584,40.5203147724197,40.5203332660757,40.5204936689529,40.5205523377061,40.5205808783856,40.5205853058774,40.5205787058088,40.520577315098,40.5205855592801,40.5206042312744,40.5206340889505,40.520663254038,40.5206558362017,40.5205646487761,40.520477649293,40.5204341782043,40.5204182530117,40.5204196076221,40.5204342013278,40.5204083932686,40.5203182058023,40.5201239042575,40.5199062737628,40.5198557396094,40.5198596575412,40.519889724568,40.519751736011,40.5196187051481,40.5196041141342,40.5195783538744,40.5193413586009,40.5191292826255,40.5189223439431,40.5186361994914,40.5181158499023,40.517099383436,40.5169500089103,40.5167965238957,40.5166390587583,40.516477747244,40.5163127263647,40.5161441362818,40.5159721201875,40.5157968241822,40.5156480936163,40.5154974509458,40.5153449768724,40.5151048448747,40.5151033524069,40.5151016082269,40.5150996634479,40.5150975750616,40.5150954042684,40.5150932146834,40.5150910704723,40.5150890344715,40.5150871663457,40.5150855208407,40.5150841461778,40.5150830826417,40.5150823613992,40.5150820035864,40.5150820196889,40.5153336921358,40.5153487368792,40.5153583096294,40.5153621431337,40.5153601303682,40.5153523275253,40.5153389524453,40.5153203785343,40.5133407219017,40.513263554525,40.5131892862216,40.5131184728341,40.513051644346,40.5129893009154,40.5129319091319,40.5128798985248,40.5128336583491,40.5127935346722,40.5122093280971,40.5121938044375,40.511847698588,40.5117095219588,40.5115673095967,40.5114212683779,40.5112716107466,40.5111185544069,40.510962322005,40.5108031408059,40.5106412423623,40.5099776529557,40.5098562035786,40.5098529663838,40.5098555713856,40.5098640020625,40.5098782049461,40.5098980899591,40.5099235309876,40.5099543666802,40.5100084204281,40.5100680191675,40.5101329185599,40.5102028525349,40.5103521353916,40.5105063465628,40.5106653665367,40.5107384369497,40.5108072207406,40.510871437633,40.5109308259588,40.5109877054959,40.5110397737803,40.5110868361809,40.5111446556132,40.5111970231465,40.5112437021885,40.5112844818466,40.5113191778806,40.5113476335358,40.5113697202508,40.5113853382388,40.5113944169383,40.5113877594692,40.5113849063618,40.5113859282429,40.5113907998165,40.51139940049,40.5114115173595,40.5114268504797,40.5114450202888,40.5114655770046,40.5115100342276,40.5115591556391,40.5116123583604,40.5116690110821,40.5117284415553,40.5117899445677,40.5118527903124,40.511916233047,40.511979519943,40.5120419000192,40.5120808383308,40.5121200491621,40.5121586383311,40.5121957258308,40.5122304658977,40.5122620662993,40.5123194490483,40.5123785238637,40.5124386786369,40.5124992900676,40.5125597301222,40.5126193725409,40.5126775993272,40.5127129461866,40.5127218647023,40.5127773059984,40.5128444028168,40.513083884537,40.5130931616501,40.513041606944,40.5129959397419,40.5130101944293,40.5130174015275,40.5130174553009,40.5130103549605,40.5129962046758,40.5129816976301,40.5129655345281,40.5129471700076,40.5129353381225,40.5129302184102,40.5129318885572,40.5129403232207,40.5129706812136,40.5129958222639,40.5130155892948,40.5130298588055,40.5130385416425,40.5130415835568,40.5130389655432,40.5130307039585,40.5130073014905,40.5129655204626,40.5127386617546,40.5126209339615,40.5124737440776,40.5124160257219,40.5123584177991,40.5123281034607,40.5123234901946,40.5123164388421,40.5123053432371,40.5122935697886,40.5122851231381,40.512280055735,40.5123307415171,40.5123307357927,40.5123260051471,40.5123166102162,40.5118561521304,40.5117901779802,40.5117177497125,40.511638980824,40.511553994747,40.5114629246558,40.5113659132577,40.5112631125696,40.5111546836795,40.5110407964937,40.510921629471,40.5107973693424,40.5104833803483,40.5105235303545,40.5104990574578,40.5103986288955,40.5104223618203,40.5104617110697,40.510777703243,40.5106719253248,40.510551077023,40.5104167503305,40.5102785662265,40.510136709184,40.5099913685779,40.5098427384325,40.5096910171622,40.5095364073064,40.5093791152593,40.5092193509943,40.5090573277834,40.5090404461131,40.5090245755197,40.5090054327478,40.5089887830527,40.5089749695383,40.5089642768625,40.5089556202973,40.5089442356828,40.5089303721324,40.5089143330023,40.5088964692536,40.5088626559722,40.5088380305789,40.5088211868046,40.508805399405,40.5086878369841,40.5085671398746,40.5084434921724,40.5083170824729,40.5083133753558,40.5083061247222,40.5082964162066,40.5082749134012,40.5082623741733,40.5082512796434,40.5082380389711,40.5082180224169,40.5081983496566,40.5081939209599,40.508173273495,40.5081664474016,40.5081656236427,40.5081720926355,40.5081777315365,40.5081782006834,40.5081773042565,40.5081750688562,40.5081715608152,40.5081668842308,40.5081035920046,40.5080364092435,40.5079656593226,40.5078916827861,40.5078148357078,40.5077354879772,40.5077280135702,40.5077197378709,40.5077109024784,40.5077017653311,40.5076925931768,40.5076836537852,40.5076752081305,40.5076675027729,40.5076607626606,40.5076551845624,40.5076509313236,40.5076481271121,40.5076468537931,40.5076471485396,40.5076490027467,40.5076491184129,40.5076477389132,40.5076448998037,40.5076406742613,40.5076351711976,40.5076285324519,40.507620929135,40.5076125572192,40.5075430279719,40.5074769014428,40.5074147412903,40.5073853983644,40.5073586095533,40.5073348459549,40.5072301463024,40.5071223649931,40.5070818127037,40.5070440355633,40.5070093500107,40.5069780465877,40.5069107548499,40.5068401044387,40.5067662882154,40.5066895076831,40.5066099724358,40.5066011954946,40.506591649018,40.5065815895075,40.5065712872488,40.5065610190502,40.5065510608044,40.5065132291021,40.506474248041,40.5064352775466,40.5063974772279,40.5064037279916,40.5064130332562,40.5064251839024,40.5064399068661,40.5064568712744,40.506547060729,40.5065955199787,40.5066027625498,40.5066070246731,40.5066081921677,40.506606233757,40.506601201906,40.5065189112873,40.5064368534876,40.5063497576698,40.506257771082,40.5061610492402,40.5060597556653,40.5059540616068,40.5058441457524,40.5057327147326,40.5056165779357,40.5054959585003,40.5053710881762,40.5052422068792,40.5051095622301,40.504973409079,40.504834009015,40.504691629864,40.5036428964581,40.5035619715451,40.5033913444992,40.503380022029,40.5033695367064,40.5033600494907,40.5033496724217,40.5033413926607,40.5033354147875,40.5033318865055,40.5033308995103,40.5033325511098,40.5033367992616,40.503343535827,40.5033525893232,40.5033637292888,40.5033716489292,40.5033736907076,40.5033698088931,40.5033600904287,40.5033447529838,40.5033241400785,40.5032987133897,40.5032690424103,40.5032477156804,40.5032282593617,40.5032027594782,40.5031820733024,40.5031664697617,40.503156151707,40.5031079906492,40.5030543011242,40.5029951508156,40.5029306142912,40.5028607729086,40.5027857147127,40.5027616770117,40.5027426884599,40.5027288615672,40.50272027826,40.5027169893954,40.5027190144605,40.5027263414565,40.5027415774996,40.5027504141498,40.502752794322,40.5027487026403,40.502738165537,40.5027212510821,40.5026980685436,40.502668767681,40.502668499749,40.5026624225508,40.5026505973792,40.5026331434992,40.5026102369451,40.5025821087448,40.502561485376,40.5025461997724,40.5025373076502,40.5025330247904,40.5025333958129,40.5025384168524,40.5025736198384,40.5025892411257,40.5025987796368,40.5026020503461,40.5025989898093,40.5025896573939,40.5025742341277,40.5025530191871,40.5025342199735,40.5025191581877,40.5025082212514,40.502501690486,40.5024997338767,40.5025024017519,40.5025112367726,40.5025181822652,40.5025237946775,40.5025267888586,40.5025272274982,40.5025255405477,40.5025186212199,40.502505910684,40.5024875302679,40.5024781790128,40.5024619483508,40.5024392053775,40.5024104644796,40.5023763757005,40.5023556759509,40.50233785254,40.5023233521669,40.5023125382466,40.5023056818024,40.5023029546736,40.5023069849779,40.5023056718248,40.5022990245033,40.5022870900353,40.5022699528431,40.5022477341517,40.5022205911319,40.502151063865,40.5020848451253,40.5020220387575,40.5019627432547,40.5018582355501,40.5018271084699,40.501801800727,40.5017827525048,40.5017702951134,40.5017646452266,40.5017659011142,40.5017740409321,40.501788923103,40.5018443926255,40.5019047643097,40.5019699837486,40.5020399921661,40.50209386762,40.5021418014689,40.5021835939361,40.5022190708406,40.5022480843228,40.5022705134609,40.5022862647753,40.5022952726177,40.5022974994456,40.5022929359778,40.5022816012341,40.5022624762581,40.5022498382964,40.5022437446353,40.5022442228963,40.5022512709117,40.5022496525929,40.502248025765,40.5022469993571,40.5022465739511,40.5022467513043,40.5022475319967,40.5022489134351,40.5022508906647,40.502253422033,40.5022553903884,40.5022567914354,40.5022576237434,40.5022578826889,40.5022575708608,40.5022566853088,40.5022451995566,40.5022345992477,40.5022248892905,40.5022107946337,40.5022087722884,40.5022060028895,40.5022024893344,40.5021982326788,40.5021895533675,40.5021816042242,40.5021743909915,40.5021731610588,40.5021713641687,40.502169003225,40.5021660792771,40.5021625967343,40.5021585595057,40.5021539731674,40.5021488427956,40.5021431748113,40.5021374175906,40.5021322523533,40.502127679658,40.5021237060825,40.5021203350361,40.5021175682361,40.502117221328,40.502115057793,40.5021122869281,40.5021073876936,40.5021017950156,40.5020955085996,40.5020931321258,40.5020915086798,40.5020906405135,40.502089572295,40.5020879202341,40.5020856875877,40.5020828794538,40.5020795017704,40.5020623815728,40.5020448057211,40.5020267764068,40.5020183729186,40.5020105857016,40.5020034258814,40.5019969027384,40.5019239170975,40.5019195487571,40.5019146330598,40.5019091749199,40.5019031842799,40.5018966712439,40.5018896444091,40.5018821148922,40.5018740959754,40.5018706242314,40.501867646287,40.5018651870606,40.5018632625884,40.5018601629217,40.501854705994,40.5018513182956,40.5018318057113,40.5018117321154,40.5018082763832,40.5018048171701,40.501804178372,40.5018073079564,40.5018154584137,40.5018314476809,40.5018493761571,40.5018555882513,40.501878153577,40.501882861804,40.5018908003454,40.5018990165797,40.5019054544204,40.5019114232839,40.5019168899239,40.5019218212707,40.5019261906335,40.5019299729946,40.5019331463607,40.5019369338376,40.50194012963,40.5019427251072,40.5019447146534,40.5019460913127,40.5019468546598,40.5019469992532,40.5019465285286,40.5019443106683,40.5019415725876,40.5019383153328,40.5019345422902,40.501930253334,40.5019254548666,40.5019201465904,40.5019143342454,40.5019088638069,40.5019080193748,40.5019012087118,40.5018869544787,40.5018512163846,40.5018372271486,40.5018228556278,40.5018168541104,40.5018164423034,40.5018175508798,40.501826860319,40.5017245374731,40.5016158508088,40.5015008828905,40.5013797210534,40.5012524573379,40.5011191884188,40.5011017728305,40.5010793195174,40.5010956471732,40.5009125316013,40.5007740942329,40.5006591577963,40.5006536150626,40.5006451409607,40.5006283835104,40.5006060285483,40.5005782177998,40.5005451275785,40.5005069676685,40.5004639799939,40.5004308318277,40.500402070555,40.5003779064463,40.5003585161628,40.5003440414644,40.5002662166543,40.5001836522673,40.5001255811003,40.5000774120319,40.5001130393443,40.5000994322511,40.500072282322,40.5000393353429,40.5000008355382,40.499957068293,40.4999083580372,40.499855065841,40.4997975867376,40.4997022426368,40.4996031326497,40.4995004380587,40.4993943467022,40.4992850526305,40.4991727557511,40.4991232554364,40.4991008453765,40.4991803513882,40.4991838455324,40.4991835019192,40.499177685819,40.4991659808482,40.499148583054,40.4991257838329,40.4989358561812,40.4988960758663,40.4984433840666,40.497938579618,40.4977029249419,40.4976623372096,40.497626498768,40.4975960289495,40.4975830136406,40.4975736269044,40.4975680950763,40.4975665515412,40.4975690335169,40.4975754811576,40.4975857389962,40.4975995596931,40.4976194069172,40.497632859332,40.4976396369494,40.4976395987053,40.4976327453956,40.4976189903634,40.4976111975922,40.4976094300577,40.4976137020438,40.4976239790273,40.4976353165101,40.4976417864513,40.4976432790815,40.4976397690764,40.4976313159872,40.4976180632298,40.4976260850383,40.4976270777944,40.4976210365174,40.4976079915171,40.4975880082422,40.4975611869515,40.497527662211,40.4975229787388,40.497523297359,40.4975286150482,40.4975388813436,40.4975539988219,40.4975835603278,40.4976067914486,40.4976234830946,40.4976334850339,40.4976367072446,40.4976331207255,40.4976227577567,40.4976024495692,40.4975873331067,40.4975774409763,40.4975727945163,40.4975734037494,40.4975792673614,40.497581750367,40.4975771307861,40.4975654368839,40.4975467402097,40.4975211551595,40.4974888382758,40.4974499872897,40.4974048399108,40.4973223888393,40.4972348168163,40.4971422381953,40.4970447738671,40.4969425511017,40.4968357033822,40.4967852569442,40.496664934793,40.4965490249588,40.4964377584558,40.4963313570427,40.4962300327809,40.4961339876118,40.4961350557024,40.496142901358,40.4961575098879,40.4961788539381,40.4962068935425,40.4962415761977,40.4962828369612,40.4963305985731,40.4963847716006,40.4964452546054,40.4965119343336,40.4965846859275,40.4966633731595,40.4967478486871,40.4968379543285,40.4968859564021,40.4970829033178,40.4971708507987,40.4973170270398,40.4974142932893,40.4975385265438,40.4976916622383,40.4978475627591,40.4980061635952,40.4980292149233,40.4980916014136,40.4981562766408,40.498222795947,40.4982907019942,40.4983595279091,40.4984288004923,40.4984980434721,40.4985102384084,40.4986181711168,40.49872511105,40.4988306029834,40.4989341978542,40.4989930906544,40.4990484918837,40.4991001374209,40.4991477810494,40.4991911956308,40.4992301741881,40.4992916155125,40.4993632133301,40.499400419586,40.4994332098564,40.4994372442445,40.4995090446916,40.4995776687945,40.4996430758863,40.4997130687038,40.4997875394894,40.4998662566383,40.4999489753388,40.5000354383335,40.5001253767188,40.5002185107816,40.5003145508689,40.5004131982884,40.5005141462376,40.5006170807576,40.5009588582138,40.5013012488962,40.5014146471709,40.5015262314677,40.5016356693446,40.5017426347526,40.5018468090075,40.5019478817393,40.5020455518173,40.5021395282469,40.5021611805097,40.5029652011596,40.5039345697351,40.5040555319572,40.5041782751198,40.5043023985762,40.5044274971723,40.5045531625685,40.5051701277708,40.5059651012041,40.506536454119,40.5067001870569,40.5068631932827,40.5069878208672,40.50711172047,40.5072347634825,40.5073568221844,40.507448663102,40.5075124444041,40.5075782383622,40.5076453201444,40.5077129507291,40.5077631050358,40.5078612288519,40.5078671412342,40.5080327763056,40.508243230713,40.5083974073779,40.5084336858024,40.5086748257271,40.5087160631388,40.5087240107788,40.5087643834418,40.5087563679415,40.5087711727758,40.5088056616307,40.5087865843331,40.5087768055205,40.5087360906861,40.5087241175428,40.5086839087999,40.5088043748303,40.5087916521513,40.5089911676056,40.508983190378,40.5089531131464,40.5089489447205,40.5089487661495,40.5089559975255,40.5089703148108,40.5089917179729,40.5090202069629,40.5091670471808,40.5092526716457,40.509376263846,40.5093290171447,40.5093441841346,40.509413694649,40.5093971242181,40.509391556843,40.5092729762901,40.50942393252,40.5093768927459,40.5094255964392,40.50943441373,40.5094673901707,40.5094769883739,40.5096829275579,40.5097737610049,40.5097809547389,40.5098801102975,40.509814602109,40.5098262459244,40.5099730153836,40.5099631967047,40.5098959731815,40.5096936597677,40.5094799147632,40.50947795816,40.5094705304363,40.5094809004459,40.5096020117476,40.5096727021023,40.509861504541,40.5100518185863,40.5102417657313,40.5103884965418,40.5107125810455,40.5110552573698,40.5110786437933,40.5110886893808,40.5110676534578,40.5111360772354,40.5111939897054,40.5112851461071,40.511392839393,40.5114581697316,40.511636688346,40.5115951978661,40.5115989922828,40.511630437916,40.5116494452441,40.5116189890877,40.5116227214743,40.511655887242,40.5116777660319,40.5117009178519,40.5114660621807,40.5114107659354,40.5114193781019,40.5114331604588,40.5114682279405,40.5118322699747,40.511859145417,40.5118860592251,40.5119124245936,40.511937666674,40.5119612351087,40.5119826160301,40.5119977773678,40.5120166851172,40.512037143881,40.5120585425898,40.512080242099,40.5121015942791,40.5121219613739,40.5121407350499,40.5125943288518,40.5127828131173,40.5129970025473,40.5132094449929,40.5133474300147,40.5134605297994,40.5135534708155,40.5137103798,40.5140048054485,40.5140100462964,40.5140369383815,40.5140622438935,40.5140911899284,40.5141173402795,40.5141405177726,40.5141747245711,40.5142126330703,40.5142538583395,40.5142979817682,40.5143445553166,40.5143556560213,40.5143663479782,40.5143763120543,40.5143852508423,40.5143928975376,40.5143990239017,40.514403447075,40.5144060350346,40.5144067105352,40.5144054534144,40.5144023011947,40.5144260465691,40.5144549765631,40.514488899321,40.5145275898762,40.5145707916429,40.5146232028531,40.5146497086461,40.5146809990421,40.5147168397105,40.5147569622438,40.5148010661675,40.5148488211901,40.5148621032715,40.5148747342273,40.5148864267787,40.5148969149899,40.5149059603164,40.5149133570308,40.5149189369018,40.5149465302598,40.5149781373393,40.5150131245524,40.5150448198551,40.5151388665138,40.5152190922518,40.5153294396867,40.5153339969147,40.5154411671746,40.5154455598171,40.5154572072675,40.5154528132084,40.5157163424289,40.5157720071091,40.5155099310939,40.5154630667598,40.5154506938884,40.5154550921156,40.5153611881995,40.515521545193,40.5161172992994,40.5160860435421,40.5161067410325,40.5161883350259,40.5161641686354,40.5161294593824,40.5155180502089,40.5150059281938,40.5150500962005,40.5151288709251,40.5151408143794,40.5150611950858,40.5150848612993,40.5154099582512,40.5155453779511,40.5155747299395,40.5156464885669,40.5156821642143,40.5156939809765,40.516137488191,40.5161600624044,40.5157165315774,40.5157252176842,40.5156878855975,40.5159040961153,40.5158812361306,40.5161126284968,40.5161695490199,40.516176485625,40.5163058895621,40.5163128360029,40.5161817278563,40.516215751053,40.5163562211343,40.5163649169489,40.5161699171485,40.5161957472779,40.5162257179013,40.5162886959993,40.5163133319179,40.5164869495537,40.5171945397867,40.5169514963223,40.5169808309211,40.5174756262651,40.5174497456811,40.5172084336925,40.5164860197475,40.5157358647787,40.5160664544178,40.5160368817765,40.5160724435157,40.515965028006,40.516116596447,40.5161273687957,40.5161373925737,40.5161467400325,40.5161537595176,40.516157605294,40.5161592304624,40.5161592663479,40.5161540565712,40.5161533984429,40.516140611034,40.516377700643,40.5163582023269,40.5164956132405,40.5165868265981,40.516669855306,40.5168793844854,40.5168818628046,40.5168954320692,40.5168939812546,40.5171820851956,40.5171982420842,40.5169069563709,40.5169014960667,40.5168850070146,40.5168916172023,40.5166873272109,40.5167025451673,40.516715162018,40.5167390938615,40.5169457921992,40.5169599603795,40.516753371935,40.5169432418591,40.5169319936506,40.5172897436241,40.5177897080513,40.5178572950031,40.5179844216215,40.5180494691411,40.5180755807458,40.518089862109,40.5180904952668,40.5180808625016,40.5180600230042,40.5180399130353,40.518029374765,40.518034064011,40.5180377840478,40.5180668394042,40.5181200211493,40.5181553245625,40.5182083203211,40.518258670008,40.5183395629248,40.518417044539,40.5184773788572,40.5185132270437,40.5185150031078,40.5185076467845,40.5184411593901,40.5183293846925,40.5182946146232,40.5183079242669,40.5183081832958,40.5182427688344,40.5183265250218,40.5184853174982,40.5187421218894,40.519180469823,40.519345603829,40.5195425131905,40.5194940801612,40.5193196571287,40.5192098124494,40.5191916289701,40.5192790998913,40.5195174984686,40.5196638079804,40.5198682305318,40.5200104641699,40.5200016848208,40.5200496587652,40.5200907119464,40.5201136784601,40.5201619710606,40.5203131190185,40.5204085289132,40.5204475289001,40.5205691516538,40.520653520167,40.5207536732821,40.5208068368255,40.520887399467,40.521060131432,40.5210324881871,40.5209478378477,40.5208945175802,40.520902279026,40.5209471383504,40.5209775494917,40.5212271606302,40.5214166865378,40.5214585449422,40.5216561980676,40.5220616542492,40.522198648498,40.5222516378235,40.5224113594454,40.5225727261597,40.5226567593634,40.522700777372,40.5227267891276,40.5228000781047,40.5228409302677,40.5228839377759,40.5229471351977,40.5230253393361,40.5230809375245,40.5230989378896,40.5231322288421,40.5231516126756,40.5231775442322,40.5232294093114,40.523267486031,40.5233670369891,40.523512274621,40.5235638506278,40.5235827177116,40.5236062505351,40.5236261080459,40.5236376263438,40.5236499529848,40.5236841448777,40.5237000687133,40.5237213078897,40.523760892376,40.5238036299162,40.5238324527127,40.5238479661431,40.5238633879074,40.5238919510028,40.5239252572832,40.5239517089902,40.523980193473,40.5240072962867,40.5240288737737,40.5240873508413,40.5241338135428,40.5241880948735,40.5242539206657,40.5243383284857,40.5243799987951,40.5244536426971,40.5245111044123,40.5245910796743,40.5247121770018,40.5247737290467,40.5247946017169,40.5248189133178,40.524834807612,40.5248453875907,40.5248612589508,40.5248448398466,40.5249053663379,40.5249509544872,40.5249989335866,40.52585380518,40.5266941777193,40.5268122893443,40.5268763125236,40.5269406949059,40.5270047611486,40.5270678392234,40.5271292674655,40.5271884015147,40.5272446210742,40.5272973364176,40.5275862583635,40.5276094521853,40.5276338961244,40.527667928706,40.5276978453756,40.5277260170556,40.5278002135596,40.5278668530282,40.5279227828697,40.527943815604,40.5279601301742,40.5280029745604,40.528031988595,40.528049101178,40.5282001308261,40.5283057272884,40.5283096931001,40.5283412582118,40.5283695886232,40.528394609924,40.5284082926777,40.5284163473034,40.5284175712362,40.5284209612882,40.5284148646244,40.5284175239479,40.5284459352659,40.528452137552,40.5284864584706,40.5285111366202,40.5285284416112,40.5285842152749,40.5286393855964,40.528661824991,40.5286833276684,40.5287119193927,40.5287344362276,40.5288325555689,40.528867268551,40.5288917904898,40.5289137849492,40.5289306973837,40.5289429459066,40.5289546995459,40.5289638220335,40.5289809989562,40.5290019274515,40.5290293196263,40.5290544427088,40.5290829278327,40.529137579352,40.5291973647668,40.5292613203743,40.5293125325604,40.5293767770006,40.5294081804538,40.5294375516603,40.5295006465767,40.5295901915116,40.5296664461275,40.5296913345426,40.5297048081704,40.5297222161771,40.5297424900077,40.5297597413011,40.5297836374173,40.5297948424696,40.5298080028346,40.52981657672,40.529822779505,40.5298350031157,40.5300622186607,40.5301105977654,40.5301872852151,40.53024455907,40.5303148823187,40.5303623347349,40.5303978822769,40.5304173128875,40.5304314162471,40.5304531426898,40.5304755824888,40.5304983512554,40.5305168090924,40.5305372925642,40.5305740381879,40.5305975512667,40.5306193371411,40.5306510157163,40.5306817372039,40.5307128439861,40.5307418376663,40.5307648072238,40.5307808261797,40.5308287364365,40.530874891264,40.5309267166376,40.5309801255867,40.5310413427952,40.5310802203233,40.5311228525491,40.5311434401659,40.5311754368563,40.5312231085837,40.5312428122419,40.5312732529333,40.5314700737949,40.5316097276535,40.5319233194476,40.5325626754215,40.5325761384766,40.5333874965178,40.5334044979461,40.5334172439722,40.5334256500478,40.5334366807957,40.533446585555,40.5334535473715,40.5334577406616,40.5334594787218,40.5334651284958,40.5334794008373,40.5334992276784,40.533533688414,40.5335344331879,40.5335587970897,40.5335724872598,40.533593673228,40.5336145750768,40.5336337184332,40.5336529358445,40.5336655568175,40.5336790227974,40.5337110215386,40.5337280411337,40.533760782844,40.533772005342,40.5337913370988,40.5338063852396,40.5338251423671,40.5338418052859,40.5338607223718,40.5338729435533,40.5339159161509,40.5339636177273,40.5339900457198,40.5340159875538,40.5340412163619,40.5340672151169,40.5341024803808,40.5341309645501,40.534163175491,40.5342297266423,40.5342570259348,40.5342734314612,40.5343059132815,40.5343279157796,40.5343463770505,40.5343650535251,40.534380646657,40.5343961145234,40.5344038547814,40.5344167228886,40.5344326524585,40.5344523631896,40.5344730133404,40.5344914731742,40.5345208832814,40.534557774971,40.5346041391003,40.5346171964618,40.5346335825483,40.5346518757233,40.5346607239726,40.5346706279636,40.5346829466395,40.5346954375881,40.5347038572792,40.5347228301898,40.5347412920504,40.534752927393,40.5347591025912,40.5347593633673,40.5347532570657,40.5347499357237,40.5347515637461,40.5347536169764,40.5347566643644,40.5347593130154,40.5347611627675,40.5347697547674,40.5347833548115,40.5348046576673,40.5348195043022,40.5348298567845,40.5348452701069,40.5348600022673,40.5348774350921,40.5348868482966,40.5349043678526,40.5349171655647,40.534928969112,40.5349380705868,40.5349491070345,40.5349568746064,40.5349678260783,40.5349839263954,40.5350005398268,40.5350178902475,40.5350469939228,40.535051289912,40.5350624423285,40.535075328242,40.5350895776311,40.5351056776626,40.5351217780472,40.5351337557664,40.5351440537985,40.5351552626182,40.5351716181778,40.5351872907248,40.5351979853921,40.5352149937681,40.5352450006491,40.535261583062,40.5352712843988,40.5352808990008,40.5352935583713,40.5353129604403,40.5353302234933,40.5353441007,40.5353541410764,40.5353700364427,40.5353836036373,40.5353936999398,40.5354067616979,40.5354159467722,40.5354224646282,40.5354273037417,40.5354378559357,40.5354510534029,40.5354592932408,40.5354648198177,40.5354759448961,40.5354844236569,40.5354972052362,40.5355110689942,40.5355207770167,40.5355298920595,40.5355419813586,40.5355535765825,40.53557639059,40.5355855325703,40.5355992525943,40.5356116751914,40.5356192788284,40.5356289837029,40.5356331127557,40.5356363936328,40.5356394348625,40.5356423355141,40.535643844724,40.5356496537653,40.5356579214227,40.5356647244582,40.5356790864457,40.5356895520577,40.5357038182932,40.5357376180839,40.5357578353606,40.5357833339408,40.5358073368274,40.5358196883252,40.5358317324438,40.5358394577133,40.5358489752046,40.5358602887568,40.5358710448191,40.5358828511692,40.5358973474522,40.5359159749487,40.5359273443368,40.5359418871402,40.5359552369336,40.5359718316996,40.5359905750062,40.5359980666076,40.5360109041002,40.5360278079945,40.5360405825868,40.536057184642,40.5360676688104,40.5360801114245,40.536094559451,40.5361068553192,40.5361292021546,40.5361448291076,40.536160058568,40.5361706509038,40.5361762450931,40.5361803387483,40.5361831930289,40.5361875627541,40.5361878067581,40.5361873980348,40.5361849301841,40.5361817878715,40.5361803518608,40.5361821881944,40.5361828089009,40.536187310916,40.536196295729,40.5362064706342,40.5362212689829,40.5362264960506,40.5362373657428,40.5362827160319,40.536310809888,40.5363348101468,40.5363631776583,40.5363862042681,40.5364082007514,40.5364438896021,40.5364604985592,40.536492553851,40.5365179144538,40.5365466968021,40.536578069666,40.5366045845956,40.5366351821819,40.536669645486,40.536706796258,40.5367446935754,40.5367650713715,40.5368011120278,40.5368256581957,40.5368500616052,40.5368643465737,40.536881409917,40.5368936731239,40.5369193674361,40.5369261870475,40.5369333298733,40.5369340065399,40.5369315379676,40.5369292203306,40.5369228457604,40.5369165406049,40.5369104618827,40.5369092991663,40.5369128568749,40.5369203950905,40.536932696146,40.5369341823716,40.5369329270729,40.5369003809511,40.5368928799101,40.5368758094477,40.5368528445587,40.5368407213658,40.5368191762532,40.5367946970765,40.5367763510032,40.5367649744417,40.5367534554614,40.5367390951945,40.5367283088632,40.5367194207705,40.5367055212666,40.5366848452456,40.5366711895625,40.5366651754493,40.5366638769172,40.5366664714077,40.5366740422415,40.53668297337,40.5367062067076,40.5367124970447,40.536718901238,40.5367285841924,40.5367424344816,40.5367446928365,40.5367537816525,40.5367664075135,40.5367806140712,40.5367972438954,40.5368087277161,40.5368610344875,40.5368858010645,40.5369059944347,40.5369166877819,40.5369295208609,40.5369409020371,40.5369552284173,40.5369855482388,40.5370029190981,40.5370133506172,40.5370311418462,40.537057796466,40.5371139176075,40.5371460894479,40.5371570220122,40.5371649114617,40.5371687638757,40.5371763305214,40.5372002762859,40.53722673516,40.5372346457023,40.5372433885994,40.5372546213573,40.5372675136333,40.5372812600646,40.5372983039003,40.5373422175217,40.5373853926896,40.5374042114149,40.5374214157372,40.5375722931934,40.5377116381422,40.5377173576462,40.5377230783231,40.5377344255772,40.5377657929651,40.5377762872267,40.5377868502521,40.5377917402439,40.5377974815502,40.5378328149087,40.5378690460443,40.5379061754582,40.5379433966261,40.5379807118934,40.538016433399,40.5380514183244,40.5380848341388,40.5381199549326,40.5381409177338,40.5381585817918,40.5381661919508,40.5381738021127,40.5382265630738,40.5382445023768,40.5382822504714,40.5382993597441,40.5383197670836,40.5383298920868,40.5383400149131,40.5383441899563,40.5383483628249,40.5383533668751,40.5383583486191,40.5383682426704,40.5383888602752,40.5384210091413,40.5384251590298,40.5384292882847,40.5384376127167,40.5384635107818,40.5384802765505,40.5384971100736,40.5385140358427,40.5385293936701,40.5385430678212,40.5385568332104,40.5385856218998,40.5386412070319,40.5386892363448,40.5387222139784,40.5387677409539,40.5388300510951,40.5389386831538,40.5390221022161,40.5391133685951,40.539216203417,40.5393841523268,40.5394309091567,40.5394437337245,40.5394611914278,40.5394742091916,40.5394915259352,40.539513312429,40.5395332660278,40.5395516747157,40.5395692325816,40.5395855446137,40.5395990509836,40.5396190247196,40.5396353000146,40.5396569485744,40.5396884435529,40.5396932277889,40.5397170428338,40.5397506259848,40.539775619259,40.5398000130267,40.5398454746964,40.539896015277,40.5399723014307,40.5402135639307,40.5403857648649,40.5405185079056,40.5406330007916,40.5407576069281,40.5409267512491,40.5409495945773,40.5409597663464,40.5409695380618,40.5409762242218,40.540988485612,40.5409990531431,40.5410115993066,40.5410244434604,40.5410353118255,40.5410455807612,40.5410539451843,40.5410628206342,40.5410830767513,40.5412789321578,40.5413665126777,40.5414015623638,40.5414623713348,40.5415371214307,40.5416846431556,40.541809149598,40.5418413397944,40.5419306122808,40.5420221031478,40.5420663562588,40.5421241916123,40.5421927392043,40.5422133926557,40.5422343310506,40.5422401350427,40.5422501475459,40.5422624352719,40.542277831181,40.5422975141036,40.5423667996851,40.5424232559993,40.5425101014437,40.5431254033029,40.5430491192714,40.5430932404414,40.5435243204416,40.5435093317794,40.5448529483178,40.545696446932,40.547666195738,40.5476378111074,40.5478085075191,40.5478355113769,40.5478651352359,40.5478283445317,40.5477987150307,40.5478036175284,40.5476239908786,40.5471132197478,40.5470107997116,40.5469640127685,40.5469613240017,40.5469538091342,40.5469486777976,40.5469498453868,40.5469559732602,40.5469715229909,40.5469756889523,40.546984958823,40.5470016277856,40.5470505106587,40.5470683556056,40.5470960131832,40.547133217426,40.5471647693367,40.5471841400858,40.5472112811313,40.547231634753,40.5472581206082,40.547283738351,40.5473083311725,40.5473393384619,40.5473661092852,40.5473800866478,40.5473949885636,40.5474290593353,40.5474545610345,40.5474891835389,40.5475072313294,40.5475432672756,40.5475692984962,40.5476254843001,40.5476633101738,40.5476879567583,40.5477177408137,40.5477457590788,40.5477785866563,40.5478021521379,40.5478596562124,40.5479090397311,40.5479402364182,40.5479578079917,40.5479773179629,40.5480047570634,40.5480283899923,40.5480431696274,40.5480557817858,40.548075362195,40.5481034658855,40.5481447231582,40.5482105530967,40.5482398442218,40.5482729280895,40.5482934531067,40.5483149218837,40.5483333687509,40.5483602848393,40.5484167853267,40.5484542133651,40.548487115187,40.5485149542236,40.5485286485324,40.548524547457,40.5485242728314,40.5485349819311,40.5485583704181,40.548589476691,40.5486270433434,40.5486788101094,40.5487304733173,40.5488586741484,40.5489416752438,40.5489669897191,40.5489816317789,40.5489978120367,40.5490244172822,40.5490605397482,40.5491054626009,40.5491415668143,40.5491854570921,40.5492493100916,40.5493090068767,40.5493927876124,40.5494585262547,40.5495942100295,40.5496845546914,40.5497429760929,40.5498960519076,40.5498996515494,40.5499726885203,40.5500380950603,40.5500838898238,40.5501234685786,40.5501635367616,40.5501899811091,40.5502042731909,40.5502098354965,40.5502159885042,40.5502204659918,40.5502158289035,40.550207696017,40.5502165889972,40.550235820014,40.5502628927677,40.5502712459618,40.5502675850771,40.5502779487908,40.5502877186312,40.5502979227586,40.5503214550011,40.5503503994715,40.5503851599568,40.5503962049358,40.5504009600366,40.5504109283418,40.5504301436097,40.5504658895495,40.5505082234499,40.5505485894311,40.5505791769856,40.5506095459487,40.5506436085871,40.5506936990031,40.5507465110193,40.5508057805022,40.5508558156437,40.5509501666866,40.5510539010068,40.5510736188918,40.5511602011478,40.551203919967,40.5512562127038,40.5513110827821,40.5513539546876,40.5513934050192,40.5514294246617,40.5514534457627,40.5514723282535,40.551499799906,40.5515851770012,40.5516693060407,40.5517520062811,40.5518331000481,40.5518639173796,40.5518994844882,40.5519390984983,40.5519819765579,40.5520272713097,40.5520740876356,40.5521215003465,40.5521685724651,40.5522143737434,40.5522579990459,40.5522985862375,40.5523353332217,40.5523675137921,40.5530052166713,40.553005651786,40.5530048296193,40.5529989162419,40.5529862053543,40.5529819590446,40.5529760090161,40.5529530473146,40.5529454026044,40.5529386143521,40.5529369271517,40.5529360935121,40.552934474443,40.5529345476405,40.5529354172146,40.5529380254837,40.5529380414941,40.5529380483549,40.5529372016528,40.5529363542817,40.5529346528451,40.5529329507396,40.5529312498067,40.5529159133481,40.5529116567453,40.5528759005787,40.5528461168127,40.5528367618997,40.5528291228085,40.5528231960723,40.552807119724,40.5528011838318,40.5527943891346,40.5527790880418,40.5527722768529,40.5527688698978,40.5527654599865,40.5527611976267,40.5527569341536,40.5527347488035,40.5527296310983,40.5527253664533,40.5527006482454,40.5526597536277,40.5526256753612,40.5525950155097,40.5525677728411,40.5525430956321,40.5525328916314,40.5525226899005,40.5525142000163,40.5525057156887,40.5524913222139,40.5524752687453,40.5524693623427,40.5524660047963,40.5524652024344,40.5524661049837,40.5524687262001,40.5524730551039,40.5524782297294,40.5524842568072,40.5524919871261,40.5524997106138,40.5525091435659,40.5525194227505,40.5526170497514,40.5527686349536,40.5527951843808,40.5528225988845,40.5528877177281,40.5528902921079,40.5528937213153,40.5528988765517,40.5529117953626,40.5529169567266,40.5529246767473,40.5529281059498,40.55293324008,40.5529828842609,40.5530761629553,40.5532464654878,40.5533636979757,40.5533927900091,40.5534244388601,40.5534586486398,40.5534945644455,40.5535338947471,40.5535766401266,40.5536245127384,40.5536869139895,40.5537433362884,40.5538087773588,40.5538960128494,40.5539641920227,40.5540215201006,40.5540782358358,40.5541498301172,40.5542133200254,40.5542760948024,40.5544116317185,40.5545317791373,40.5545889380731,40.5547417333923,40.5548607840476,40.5549458009707,40.5550438329569,40.5551472535713,40.5553513037561,40.5554480985892,40.5555082416734,40.5555366580429,40.555557594259,40.5555752142087,40.5555786429469,40.5555637413842,40.5555379879935,40.5554955582395,40.5554622758758,40.5554165736652,40.5553867461627,40.5553902311873,40.5554346886008,40.5554862050538,40.5555164984662,40.5555208842654,40.555518532878,40.555489615686,40.5554814598646,40.5554915869628,40.5555275339146,40.555566774392,40.5556101361591,40.5556376434375,40.5556701289613,40.5556734822786,40.5556781815564,40.55568414505,40.5556912690233,40.5557012178997,40.5557124197142,40.5557245917192,40.5557374266781,40.5557506006204,40.5557852838731,40.5558174728418,40.5558462802193,40.5558709119129,40.555876798904,40.5558811854707,40.5558839636802,40.5558850651739,40.5558844628494,40.555882171527,40.5558782475853,40.5558727875739,40.5559155654796,40.5559369007815,40.5559636178882,40.5559994666251,40.5560294717631,40.5560645100242,40.5561070821051,40.5561422082308,40.5561656557033,40.5561924337997,40.5562551423876,40.5562970171392,40.5563105500536,40.5563115487116,40.5563125071648,40.5563117074991,40.5563175923925,40.5563418300989,40.5563618772567,40.5563794400924,40.5563903543115,40.5563888147754,40.5563855873968,40.5563765169267,40.5563616142242,40.5563350014883,40.5562941972232,40.5562725812173,40.556263488957,40.5562287446537,40.5561839786645,40.556146591495,40.5560883691282,40.5560385335164,40.5560354112466,40.5560585393957,40.5561012440972,40.5561073873266,40.5561107870519,40.5561070970169,40.5561063467583,40.5561109856868,40.5561331461376,40.5561482808225,40.5561500737047,40.5561584728676,40.5561951743784,40.5562306798821,40.5562538620644,40.5562557128459,40.5562498014911,40.5562157097815,40.5562290889671,40.556252367094,40.5562118792838,40.5558970655445,40.5560976940829,40.5560465699035,40.5559458700666,40.5559811002982,40.5559810256695,40.5559647609212,40.5558802675072,40.5557955614932,40.5557871426918,40.5557675579621,40.5557368400967,40.5556830692758,40.5556369421343,40.5555957933604,40.5555756195297,40.5555372411572,40.5555033736214,40.5554728600306,40.5554539633024,40.5554341889625,40.5554153306156,40.5554062097797,40.5554268220372,40.5554570571033,40.5554793677396,40.5554871540743,40.55548383538,40.5554703093969,40.5554661219303,40.5554652433524,40.5554458904455,40.5554168847142,40.5554027159695,40.5553933757712,40.5554170707591,40.5554393453128,40.5555030704898,40.5555551977382,40.5555892037056,40.5556362104214,40.5556462026804,40.5556489829577,40.55563420919,40.5555920558003,40.5555620366215,40.5555418487652,40.555529074999,40.5554820906085,40.5554513266668,40.5554129035281,40.5553787794529,40.5553643204767,40.5553584448025,40.5553662246856,40.5553876639592,40.5554313054143,40.5554637761489,40.5555193059903,40.555573982754,40.5556286573585,40.5556833439201,40.5557004728413,40.5556997458239,40.5557015312229,40.5557143698967,40.5557690665478,40.5558229069806,40.5558784664815,40.555911800557,40.555938348008,40.5559402022778,40.5559283310136,40.5559104943423,40.5559012410238,40.5558988210052,40.5558852841704,40.5558673947937,40.5558162003098,40.5557658638741,40.5557482891152,40.5557308875244,40.5557070145355,40.5556497941233,40.555635296662,40.5556157906798,40.5555979210628,40.5555774438252,40.5555210839151,40.5554997514427,40.5554988967083,40.5554733614595,40.5554255948957,40.5553786279028,40.5553222443684,40.5552641627717,40.55520864635,40.5551531583414,40.5550976741182,40.5550669391446,40.5550601355795,40.5550059234361,40.5549288129258,40.5548419072737,40.5547645037675,40.5546984378754,40.5546507855019,40.5546215637843,40.5546126720725,40.5546268358581,40.5546547233885,40.5547021463244,40.5547186469989,40.5547221648009,40.5547253297247,40.5547545323154,40.554745466985,40.5547587941402,40.554801299016,40.554847002198,40.5549280655237,40.5549747097994,40.5550714335956,40.555118169686,40.5551561951189,40.5552645263114,40.5553946478262,40.5554555836068,40.5554746065513,40.5554892643519,40.5555121822516,40.5556137481532,40.5556913669811,40.5557508520458,40.5557953823719,40.5557969698786,40.5557794458626,40.5557526527255,40.5557029764862,40.5556562016539,40.5555655530597,40.5555281053873,40.5555173636249,40.5555314801662,40.5555287106553,40.5555071405332,40.555442015202,40.5553525389268,40.5552279970314,40.5550470798131,40.5548575834158,40.5547776560985,40.5547387918329,40.5546722897858,40.5546742102478,40.5547073881393,40.5547388841095,40.5548200423723,40.5548736475094,40.5549328819815,40.5550402534272,40.5552700780666,40.5554761247155,40.5556624132944,40.5558129836863,40.5558747189862,40.5558934697881,40.555955465545,40.5560277405373,40.5560410156986,40.5560504118362,40.5560331498668,40.5557276261541,40.5556905496529,40.5556005232485,40.5555104132051,40.5554652717783,40.5552929288252,40.5550950434755,40.5550052847762,40.5550938654166,40.5551590894186,40.5552309357496,40.5553092927941,40.5553940388212,40.5554803152356,40.5555441187831,40.5556586489737,40.5558130984218,40.5562423891321,40.5565239272557,40.55665149155,40.5567556383799,40.556794932796,40.5569133622209,40.5568991652001,40.5567242985429,40.5566888641017,40.5567003056785,40.5567265713545,40.5566367520729,40.556557317917,40.5565887294133,40.5566197328443,40.556632232104,40.5566308113933,40.5566583358338,40.556657154797,40.5565872958573,40.5565744865323,40.5565421654975,40.5565138138674,40.5564961264968,40.5564876701396,40.5564712218028,40.5564292634126,40.5564012878501,40.556399062055,40.5563969433253,40.5564133032036,40.5564350035155,40.5564871921683,40.5565118197531,40.5565258804821,40.5565292877499,40.5565338979699,40.5565399136965,40.5565599037075,40.5565859579645,40.5566249342766,40.5566726237383,40.5567046944305,40.5567644573872,40.5567790816549,40.5568031387357,40.5568270275884,40.5568507359773,40.5568742525,40.5568874753485,40.5569009482098,40.5569146414035,40.5569285289445,40.5569425824919,40.5569567755679,40.5569710779986,40.5569854623024,40.5569940388014,40.5570025941895,40.5570110823932,40.557019461848,40.5570276862931,40.5570357139806,40.5570435021561,40.557051009891,40.5570581984364,40.5570650296988,40.5570714681033,40.5570774809012,40.557089579252,40.5571013225943,40.5571126857471,40.5571236433734,40.5571341723068,40.55714425122,40.5571538567741,40.557162970483,40.5571726221359,40.5571818393726,40.557190605725,40.5571989047231,40.5572067204065,40.5572140394855,40.5572208471682,40.5572271318377,40.5572328801982,40.5572302675659,40.557228209613,40.5572267078149,40.5572275568211,40.5572289868784,40.5572309830977,40.5572335244065,40.5572365865467,40.5572401342135,40.5572441349567,40.5572485452816,40.5572533206959,40.5572584126962,40.5572618052748,40.5572644919006,40.5572664592096,40.5572676983593,40.5572682020168,40.5572716990729,40.5572756334148,40.5572799719471,40.5572846839257,40.557289727057,40.5572950642514,40.5573006512171,40.5573064450216,40.5573123972077,40.5573184618424,40.5573245909921,40.5573307330488,40.5573368414442,40.5573428660971,40.5573487599547,40.5573544741329,40.5573599652829,40.5573651890653,40.5573701026542,40.5574127977916,40.5574329112739,40.5574531153822,40.557473385998,40.5574936966623,40.5575140265942,40.5575343483278,40.5575485248539,40.5575627584714,40.557577017858,40.5575912701764,40.5576054829286,40.5576196225968,40.5576336596878,40.5576475600081,40.5576635098191,40.5576791432349,40.5576944414674,40.5577093832056,40.5577239474781,40.5577381149821,40.557751865409,40.5577651818013,40.5577784444584,40.5577913438152,40.5578038604063,40.557815983308,40.5578276972452,40.5578389865958,40.5578498414487,40.557853465531,40.5578602476887,40.5578773129462,40.55789490211,40.5579316128322,40.5579389777118,40.5579468016491,40.5579550603007,40.5579637324983,40.5579727920575,40.5579822127956,40.5579919705443,40.5580020354409,40.5580123801398,40.5580222820111,40.5580229749496,40.558033790027,40.5580447931786,40.5580559563988,40.5580672443256,40.558078627959,40.5580948212349,40.5581114003082,40.5581283530903,40.5581456643075,40.5581633161796,40.5581812949404,40.5581995826445,40.558218164359,40.558237019624,40.5582561355173,40.5582754919238,40.5582954632922,40.5583157208548,40.5583362500217,40.5583570375396,40.5583780669784,40.5583993249165,40.5584207974345,40.5584424682743,40.5584643226759,40.5584863458882,40.5585085219889,40.5585308367214,40.5585532718222,40.5585758147169,40.5585984489846,40.5586211575264,40.558643926605,40.5587044284709,40.5587648282817,40.5588251188292,40.5588852957562,40.5589453536973,40.5590052864508,40.5590650896529,40.5591247572762,40.5591316201801,40.5591384877153,40.559145313807,40.5591520462034,40.5591586395327,40.5591650454021,40.5591712177899,40.5591771138588,40.5591826899448,40.5591879069138,40.5591927269857,40.5591971163984,40.5591993019999,40.5592021072815,40.5592055189128,40.5592095304412,40.5592141322271,40.5592193077622,40.5592250448807,40.5592313264098,40.5592381351561,40.5592434987111,40.5592492557655,40.5592553735544,40.5592618206414,40.5592685608902,40.5592755610193,40.5592827835399,40.5592901879449,40.559297737577,40.5593053917432,40.5593131097515,40.5593208517392,40.55932857465,40.5593362386039,40.5593438040505,40.559351230262,40.5593778390797,40.5594042917722,40.5594305715672,40.5594566638872,40.5594825519627,40.5595012076988,40.5595200552546,40.5595390729989,40.5595582413273,40.559577536094,40.5595969378618,40.5596115220237,40.559625911993,40.5596400869668,40.559654029341,40.5596677183166,40.559681134438,40.5596942604246,40.5597070751364,40.5597195649766,40.5597353428009,40.5597508166665,40.5597659706342,40.5597807844082,40.5597952420392,40.5598093269131,40.5598230242609,40.5598363154455,40.559849188374,40.5598603475444,40.5598719836542,40.5598840747112,40.5598965975472,40.5599095308465,40.5599228487663,40.5599365269777,40.559966135345,40.5599960452926,40.5600262482594,40.56005673318,40.5600874894862,40.5601037657049,40.560119812002,40.5601356107709,40.5601511457401,40.5601663997984,40.5601813568431,40.5601960022675,40.5602103182982,40.560224290661,40.5602578561961,40.5602918448836,40.5603262511797,40.5603610651807,40.5603725561317,40.5603843416801,40.5603963981751,40.5604087009632,40.5604212268959,40.560433949653,40.5604468429072,40.5604598818525,40.5604730401691,40.5604862903705,40.560499607151,40.5605129620274,40.5605263291962,40.560557982003,40.5605896521364,40.5606213238441,40.5606529800394,40.5606846043064,40.5607161790553,40.5607231725926,40.560730128386,40.5607369883147,40.5607436912528,40.5607501814623,40.5607564021996,40.5607623005899,40.5607678254516,40.5607729291248,40.5607775684854,40.560781040015,40.560785055338,40.5607895927764,40.5607946262831,40.5608001301434,40.5608060741155,40.5608124254405,40.5608191500076,40.5608262113611,40.5608375375949,40.5608491074018,40.5608608856381,40.5608728373159,40.560884928776,40.5608971235153,40.5609093856946,40.5609223489411,40.5609354816529,40.560948749001,40.5609621166593,40.560975549121,40.5609890118828,40.5610174065029,40.5610458267077,40.5610742616055,40.5611026957904,40.5611220255619,40.5611413150676,40.5611605334897,40.5611796485071,40.5611986281294,40.5612144882576,40.5612303530853,40.5612461986571,40.5612620011774,40.5612777345142,40.5612933736946,40.5613088964219,40.5613242752137,40.5613394862645,40.5613545077788,40.5614011391879,40.5614479738491,40.5614950052168,40.5615422193773,40.5615573824536,40.5615725325373,40.5615876473388,40.5616027030678,40.5616176801169,40.5616325541808,40.5616473034776,40.5616619058702,40.5616943474884,40.5617269287616,40.5617596371167,40.5617924631633,40.561814811046,40.5618373194059,40.5618599694761,40.5618827426451,40.5619056218225,40.5619285884005,40.5619516241149,40.5619747122124,40.5619978327518,40.5620209681398,40.562044099276,40.5620732317379,40.5621023584785,40.5621314712918,40.5621605562688,40.5621896053749,40.5622186042033,40.5622475452172,40.5623930635767,40.562415668165,40.5624381329512,40.5624604437152,40.5624825840387,40.5625045407035,40.5625262961301,40.5625478389351,40.5627152883389,40.5627353651293,40.5627556293122,40.5627760671585,40.5627966622587,40.5628174040709,40.5628382750149,40.5628592648768,40.562880492612,40.5629018476027,40.5629233132829,40.562944870384,40.5629665036722,40.5629881960605,40.5631182142499,40.5631344328511,40.5631507031944,40.5631670085184,40.5631833272163,40.563199639015,40.5632159248146,40.5632321658575,40.5632483408698,40.5632644304257,40.5632804142635,40.56329507219,40.5633156168015,40.5633508706127,40.5633861664819,40.5634214938589,40.5634568433615,40.5634922052749,40.5635158299911,40.5635392426254,40.5635624300968,40.5635853742934,40.5636080574439,40.5636304642835,40.5636525783799,40.5636784339357,40.5637045560829,40.5637309332432,40.5637575523379,40.5637844039764,40.5638114754093,40.5638387559115,40.5638662325672,40.5639125294586,40.5639590514252,40.5640057894149,40.5640527397388,40.5640998951828,40.564147250217,40.5641947989716,40.564242534073,40.5642904501503,40.564411630274,40.5644626002625,40.564513415102,40.5645640615607,40.5646145238742,40.5646377893915,40.5646612240992,40.5646848103953,40.5647085330291,40.5647323715496,40.5647563112075,40.5648563749541,40.5649686563648,40.5650691606796,40.5651394090472,40.5651828441244,40.5652281791292,40.5652739113621,40.5652970201072,40.5653218960115,40.565348623983,40.5653880208953,40.5654783944367,40.5655202001746,40.5655723953342,40.5656127855108,40.5657646766958,40.5658420978541,40.5659530616871,40.5659968521444,40.5660324800556,40.5660966211937,40.5661397882163,40.5661768033178,40.5662074588971,40.5662352204058,40.566275425732,40.5664147062594,40.5665604058212,40.5667003641124,40.5667917023392,40.5668530094794,40.5669150104237,40.5670287794258,40.5670703733084,40.5670982072199,40.5671334098729,40.5671747339821,40.5672090724096,40.5672490223286,40.5672899224859,40.5673183646423,40.5673611629271,40.5673953867993,40.5674424366568,40.567488948025,40.5675145848745,40.5675518270458,40.5675781570675,40.5676060187817,40.567638286862,40.5676672524185,40.5677014622518,40.5677907117819,40.5678252054795,40.5678458107647,40.5678852214847,40.5679280486581,40.5679353183823,40.5679492210779,40.5679495484677,40.5679477498916,40.5679482332954,40.5679617246303,40.567988171498,40.5680253007569,40.5680481031507,40.5680907163569,40.568123381156,40.5681589512212,40.5682496209371,40.5682828666464,40.5683243045152,40.5683719771764,40.5684098583772,40.5684454709937,40.5684752036048,40.5684913030333,40.5685177761293,40.5685419113513,40.5685750180244,40.5686027372391,40.5686403050682,40.5686790369875,40.5687256890681,40.5687639393424,40.568803322623,40.5688429042718,40.5688800904079,40.5689097939292,40.568943905532,40.5689883884386,40.5690246254702,40.5690620094681,40.5690902806721,40.5691079810947,40.5691340698344,40.5691756205568,40.569195658271,40.5692288051082,40.569271899254,40.5693019004363,40.5693410703216,40.5693686191907,40.5693975144406,40.56947561342,40.569538972065,40.5695642686089,40.5695917744844,40.56962429845,40.5696711203306,40.5697032346921,40.5697235847966,40.5697503549568,40.5697655197113,40.5697892291567,40.5698077373297,40.5698155893354,40.5698139892464,40.5698176744665,40.5698333202102,40.5698625856053,40.5699039524468,40.5699561034307,40.5701349051544,40.5701816562309,40.5702255072126,40.5702465814758,40.5702720202204,40.5702918471233,40.5703216932909,40.5703622522663,40.570411726478,40.5704371796881,40.5704564520564,40.5704895723132,40.5705179574008,40.5705493193003,40.5705642846515,40.5705864340291,40.5706071811697,40.5706233638559,40.5706399729415,40.5706493249187,40.5706621493878,40.5706719834503,40.570683135969,40.5706932253429,40.5707194234143,40.5726100009491,40.5740709849086,40.5741130277728,40.5741439596735,40.5741745573534,40.5742145921254,40.5742663402166,40.574327384941,40.5743719994408,40.5744141994022,40.574432912588,40.5744421467035,40.5744516141501,40.5744867964118,40.5745009465386,40.5745419525767,40.5745644791768,40.5746044472986,40.5746819683268,40.5747430253223,40.5747994711207,40.5748885088244,40.5749542066369,40.5750386553155,40.575104353109,40.5751512382511,40.5752028685576,40.5752545328726,40.5752828048705,40.5753157842927,40.5753558239328,40.575525127206,40.5756120970368,40.5756828746145,40.5757669615972,40.5758542300493,40.5759220201882,40.5759610605443,40.5759938585247,40.5760521391429,40.576103148283,40.576155380449,40.5761881377616,40.5762172710596,40.5762463522036,40.5762559935734,40.5762656204043,40.5762667750268,40.576277636849,40.5763055898362,40.5763372039776,40.5763688307762,40.5764089402397,40.5764344973347,40.5764588540215,40.5764722919368,40.5764880913083,40.5765208916516,40.5765439903516,40.5765573938155,40.576553787193,40.5765331887233,40.576518662148,40.5765187223779,40.5765346106395,40.5765431805194,40.5765797256094,40.576610461596,40.5766527368367,40.5767110941713,40.5767755148121,40.576837489263,40.5768751518161,40.5769016373689,40.5769273501177,40.5769454915328,40.5769660664752,40.5769805902315,40.5769890454447,40.5770169862721,40.5770400454918,40.5770679439849,40.5770873500021,40.5770994433858,40.5771079100462,40.5771212417852,40.5771540426293,40.5771795687926,40.5772002722201,40.5772015387563,40.5772307575801,40.5772648225804,40.5772976480489,40.577332887834,40.5773632750294,40.5773961217276,40.5774119841292,40.5774108603815,40.5774121502727,40.5774304296781,40.5774620666376,40.5774936978646,40.5775168229513,40.5775277811375,40.5775388189649,40.5775947527893,40.5776506867739,40.5777394357274,40.5778050798083,40.5778500434844,40.5779035275872,40.5779727967408,40.5780687993701,40.5781125195304,40.5781450560169,40.578163474742,40.5781738043745,40.5781884604905,40.5781999491033,40.5782321480402,40.5782594731698,40.578286810219,40.578310493682,40.5783335783241,40.5783566458399,40.5783748602953,40.5783827686304,40.5783997789014,40.5784258979093,40.5784465464842,40.5784726595279,40.5784969448158,40.5785157611864,40.5785412630765,40.5785582549629,40.5786166475536,40.5796032749716,40.5797642671455,40.5798424570515,40.5801700009204,40.5801020000802,40.5795110004113,40.5793036186336,40.5788590005879]}]],[[{"lng":[-73.897923512633,-73.8979673872822,-73.8980065291825,-73.8980403733342,-73.8980684312123,-73.8980902978177,-73.8981056575226,-73.8980911934983,-73.8980683174928,-73.8980371566637,-73.8975210877602,-73.8974703131031,-73.8974260640104,-73.8973884526943,-73.8973575745283,-73.897318413995,-73.8972874816492,-73.897264822315,-73.8973324762698,-73.8974219698374,-73.8972443746733,-73.8967343767552,-73.8963103780021,-73.8961557356709,-73.8957308002896,-73.8957024792063,-73.8956727864848,-73.8956446981448,-73.8955464921217,-73.8954708500579,-73.8952404495164,-73.8948968982871,-73.8944468875035,-73.8934431381874,-73.8921786575121,-73.8916898855302,-73.8912701795326,-73.8908867031674,-73.8905035830003,-73.8902542797344,-73.890177442278,-73.890159837874,-73.8901336687324,-73.8900515142445,-73.8896716347519,-73.8887607883856,-73.8883831716343,-73.8882358782069,-73.8877019927043,-73.8885228590148,-73.8891031898245,-73.8899345067149,-73.891138527973,-73.8913849792518,-73.8917501641674,-73.8923264405576,-73.8925555458947,-73.8927840566608,-73.8930108811507,-73.8932349445219,-73.893474082341,-73.8937090565305,-73.8939378054027,-73.8941583550504,-73.8942464489958,-73.8944075965432,-73.8945753186968,-73.8945754485786,-73.8945755791367,-73.8947480902758,-73.8947482794019,-73.8947484799933,-73.8949242170837,-73.895101334044,-73.8960293159074,-73.8965110517443,-73.8969118803862,-73.8978323694189,-73.8980688299364,-73.8980689598616,-73.898069101461,-73.8983078669028,-73.8983079961665,-73.8983081274275,-73.8985475866269,-73.8985477282389,-73.8985478709664,-73.8987862131798,-73.8987863429133,-73.898786461428,-73.8990220996638,-73.8992294476897,-73.8994334853201,-73.899632578958,-73.8998251310634,-73.9000096941265,-73.9000973899021,-73.9001821122135,-73.9002634864665,-73.9003411528722,-73.900414768038,-73.9004840064317,-73.9005485620062,-73.9006081493443,-73.9006625049975,-73.9007113886511,-73.900910948234,-73.901079709003,-73.9025965084254,-73.9041685326732,-73.9042188893803,-73.9051805791977,-73.9055774010374,-73.9057242363777,-73.9067302812899,-73.9069304991158,-73.9070686729543,-73.9071225307847,-73.9071670524445,-73.907300137503,-73.9074099735685,-73.9080468088052,-73.9088917379157,-73.9097164608149,-73.9113450690157,-73.9125718774385,-73.9131696980579,-73.9138482830903,-73.9142363291455,-73.9159775500327,-73.9161064067709,-73.9161065483886,-73.9161066790083,-73.9162316696665,-73.9162317520526,-73.9162318472211,-73.9163499523687,-73.9163500230956,-73.9164582462002,-73.9164584231399,-73.9164586007739,-73.916554679467,-73.9178930845565,-73.9190389757071,-73.9200671217348,-73.9205319833439,-73.9202753834074,-73.9203706416967,-73.9203784758091,-73.9203935863349,-73.9204096691618,-73.9204245680087,-73.920440613174,-73.9204594870263,-73.9204725382298,-73.9204892684868,-73.920508354633,-73.9205258077789,-73.9205441937068,-73.9205637391544,-73.9205865749245,-73.9206121432909,-73.9206268153005,-73.920640090708,-73.9206666344579,-73.9206917819405,-73.9207160196419,-73.9207365054163,-73.9207593479,-73.9207817057936,-73.9208164191427,-73.9208388119997,-73.9208588364714,-73.9208751461612,-73.9208891362726,-73.9209070691402,-73.9209247883789,-73.9209462455049,-73.9209639261338,-73.9209835116709,-73.9210063028364,-73.9210305009436,-73.9210500951436,-73.921069170603,-73.9210854764631,-73.9211003602585,-73.9211210645027,-73.9211373296538,-73.9211554651799,-73.9211773128802,-73.9212010450519,-73.9212229310019,-73.9212420038773,-73.9212615530438,-73.9212783211176,-73.9212941527061,-73.9213118324226,-73.9213318560393,-73.9213486251067,-73.9213649328236,-73.9213810125257,-73.9213955720277,-73.9214045064076,-73.9214170974647,-73.921433865007,-73.9214608364391,-73.921471767485,-73.9214847786441,-73.9214998865271,-73.9215137430053,-73.9215181799062,-73.9215332859704,-73.9215458268432,-73.9215632859764,-73.9215779153546,-73.9215937042001,-73.92160762415,-73.9216214246638,-73.9216344361816,-73.9216493313895,-73.9216656341425,-73.9216856551197,-73.9217019481027,-73.9217177447742,-73.9217354590234,-73.9217547948118,-73.9217754928398,-73.9217948304397,-73.9218148936461,-73.9218337989168,-73.9218445118109,-73.921861070586,-73.9218766582319,-73.9218946254405,-73.9219125537207,-73.9219244072777,-73.9219344352587,-73.9219464716273,-73.9219573905526,-73.9219743828753,-73.9219937196353,-73.922011651306,-73.9220321719551,-73.9220507846261,-73.9220698622336,-73.9220880381662,-73.9221062154286,-73.9221276108213,-73.9221462605746,-73.9221639664142,-73.9221825827191,-73.9221998268746,-73.9222186896429,-73.9222340595316,-73.922251723296,-73.9222680257458,-73.9222862028089,-73.9223039225149,-73.9223200136042,-73.9223354169007,-73.9223563826482,-73.9223741023187,-73.9223932169671,-73.9224184041264,-73.9224407734077,-73.9224621946858,-73.9224822182109,-73.9224999227984,-73.9225157558973,-73.9225329963935,-73.9225493037422,-73.9225632682978,-73.9225830276643,-73.922591261957,-73.9225979219738,-73.9226118696129,-73.9226253566582,-73.9226416597122,-73.9226588627156,-73.9226761032647,-73.9226909998883,-73.9227093903446,-73.9227266327153,-73.9227457620729,-73.9227625341968,-73.9227830219704,-73.9228026091175,-73.9228433687201,-73.9228612993968,-73.9228792284309,-73.9228981288989,-73.9229160606941,-73.9229312116517,-73.9229407760558,-73.9229631428591,-73.9230112747129,-73.9231477900728,-73.9232087602716,-73.9232142898864,-73.9232572329583,-73.9234449385153,-73.9234628472146,-73.9235012152602,-73.9236463752569,-73.9236866286138,-73.9237382036233,-73.9237514865551,-73.9240693967572,-73.9241270832848,-73.9241468540513,-73.9241764431352,-73.9241921799115,-73.9242843453707,-73.9243568372605,-73.9244806333846,-73.924557371089,-73.9246532739554,-73.9246880312783,-73.9249031616518,-73.9249873243426,-73.9250650689491,-73.9251366604138,-73.9251384459361,-73.9251696390122,-73.9252822231221,-73.9253014448664,-73.9253950325553,-73.9255238699896,-73.9255380741783,-73.9256878512807,-73.9261999127306,-73.9262280389225,-73.926556639124,-73.9265728603484,-73.9266199471805,-73.9269261311045,-73.9270877469128,-73.9271379695701,-73.927234332344,-73.9272172111994,-73.9277619680096,-73.9278527894414,-73.9281097231047,-73.9282834334517,-73.9284859122038,-73.9285567608544,-73.928614866243,-73.928655375073,-73.9287082478099,-73.9287755675614,-73.9288196428459,-73.9288988531177,-73.92893416423,-73.929102834849,-73.9292348587617,-73.929392573708,-73.9299441513706,-73.9304397104302,-73.9307087143373,-73.9309916366931,-73.9311926779665,-73.9312634539215,-73.9312980015332,-73.9314339805235,-73.9320430867127,-73.934130163278,-73.9345317637569,-73.9358875133336,-73.9359282069928,-73.9361331048847,-73.9363631594391,-73.9364456396713,-73.9364813861403,-73.9372540559563,-73.9377791569555,-73.9380447850717,-73.9387573597812,-73.9390136209659,-73.9391105457482,-73.9391741165019,-73.9392102684031,-73.9393686320022,-73.9394097369897,-73.939419187766,-73.9394525345588,-73.9394877863568,-73.9394964568393,-73.9394122092593,-73.9394641421489,-73.9394718657831,-73.9394848808119,-73.9395419671341,-73.9396676288666,-73.9397490270061,-73.939784369903,-73.939869831538,-73.939910498297,-73.940032009911,-73.9400562035605,-73.9401010733239,-73.9401653864096,-73.9400973777696,-73.9400180701291,-73.9400613502006,-73.9400798277736,-73.9401043685313,-73.9400670932704,-73.9403436597211,-73.9404503357523,-73.940664998562,-73.940864985927,-73.9412248046703,-73.9416219224385,-73.9416359680015,-73.9416229064841,-73.9416165522437,-73.9416247263647,-73.9418014397327,-73.9419045919499,-73.9419664127334,-73.9420304961384,-73.9420581884512,-73.9420836067158,-73.9421048338245,-73.9421480767947,-73.9421664528765,-73.942240434426,-73.9422794992248,-73.9422995102579,-73.9424079751155,-73.9425606631001,-73.942617301401,-73.9426417150165,-73.9426498587399,-73.9426591860719,-73.9427017688081,-73.9427115820274,-73.9427200810748,-73.9427367921152,-73.9427563072033,-73.9428693794647,-73.9429146802193,-73.9430393438586,-73.9431672166461,-73.9432420818111,-73.943288616927,-73.9433858428463,-73.9434315732658,-73.9434641066379,-73.9435767539787,-73.9435948034264,-73.943779415083,-73.943959137652,-73.9444505283114,-73.944846287513,-73.9454262974247,-73.9456025888231,-73.9457998131248,-73.9458912560021,-73.9459214586883,-73.9459286679214,-73.9459319100017,-73.9459347845989,-73.9459372701498,-73.9459393290148,-73.9459409598722,-73.9459421541397,-73.9459441033305,-73.9459451407771,-73.9459466981785,-73.9459474966501,-73.9459447990511,-73.9459372612599,-73.9459182746334,-73.9459117592784,-73.9459057556435,-73.9459000009114,-73.9458972659904,-73.9458946374178,-73.9458920914062,-73.9458896537249,-73.9458872862647,-73.9458568643379,-73.9458390231052,-73.9458253661904,-73.9458192949661,-73.945817518687,-73.9458156852472,-73.945813790249,-73.945811813659,-73.9458076700698,-73.945803158901,-73.9457942664955,-73.9457754367941,-73.9457233690433,-73.94568038334,-73.9456673765824,-73.9456386218702,-73.9456245960259,-73.9455853649194,-73.9455286316558,-73.9454881134532,-73.945455768032,-73.945425546034,-73.9453967338846,-73.9452426523583,-73.9451023158267,-73.9450582404641,-73.9450145771769,-73.9449646122529,-73.9449113999564,-73.9448983466561,-73.9448744062937,-73.944863816275,-73.9448539146758,-73.9448420965231,-73.9447876213864,-73.9447751976231,-73.9447650236028,-73.9447549529381,-73.944682454244,-73.9446579409492,-73.9446386006481,-73.9446350724616,-73.9446314383786,-73.9446277087421,-73.9446238370888,-73.9446156584657,-73.9446080364032,-73.9445995029498,-73.944566923444,-73.9445529583087,-73.9445454668576,-73.9445384229629,-73.9445316995587,-73.9445252592166,-73.9444955775668,-73.9444789503138,-73.9444625485796,-73.94402128752,-73.942578858122,-73.9428038426762,-73.9428008081442,-73.9425561280529,-73.9421533811752,-73.9414617346317,-73.9414088639151,-73.9413498379434,-73.9410177404142,-73.9407780174328,-73.9405088880573,-73.9403615928505,-73.9405614496908,-73.9402823024227,-73.9399239012415,-73.9396561121527,-73.9391087413809,-73.938669917532,-73.9385878697679,-73.9393074627925,-73.9397443589877,-73.9397560191852,-73.9400192297567,-73.9401485852122,-73.9396530152138,-73.9400481510223,-73.940084062907,-73.9401418148429,-73.940799728835,-73.9411881669621,-73.9415947003003,-73.9416500187961,-73.9418350499272,-73.9420336716566,-73.9420866491637,-73.942159377748,-73.942379730083,-73.942413219496,-73.9424481652732,-73.942481649229,-73.9425107645857,-73.9425340596049,-73.942570455487,-73.9425966684488,-73.9426156104155,-73.9426258139417,-73.9426491363561,-73.9426797256272,-73.9427001278653,-73.9427103405852,-73.9427276612133,-73.9427904564007,-73.9427113900596,-73.9426958836671,-73.9427060899211,-73.9427910693753,-73.9429014182886,-73.9432902686682,-73.9435316603867,-73.9435685336872,-73.9436055474795,-73.9436420113335,-73.9436772450775,-73.9437506879647,-73.9438227227753,-73.9438931341384,-73.943921871638,-73.9439417005788,-73.9439578703336,-73.9439699565719,-73.9443388253848,-73.9445925287479,-73.9448015954323,-73.9452386207262,-73.945294204149,-73.9453584794754,-73.9454823659012,-73.9460113525308,-73.9471508718118,-73.9503362620347,-73.9503931919435,-73.9507246822391,-73.9513603083832,-73.9513807145184,-73.9519220819225,-73.9521967275852,-73.9522153737711,-73.9522972079241,-73.9524335527293,-73.9524980537741,-73.9525664843774,-73.952602379668,-73.9526340058747,-73.9526988253611,-73.9527541290096,-73.9528313441821,-73.952916526892,-73.9530157405372,-73.9533183512227,-73.9534145447716,-73.9535001416298,-73.9536714854542,-73.953753519181,-73.9537772420148,-73.9537987880868,-73.9538088392085,-73.9538200274479,-73.9538588161983,-73.9538740654047,-73.9539963171034,-73.9540453811646,-73.9541609615426,-73.9542133515198,-73.9543425424345,-73.9544533926845,-73.9545743156288,-73.9546740564898,-73.9547421060803,-73.9547842177981,-73.9547966734193,-73.954810219488,-73.9548569689626,-73.9548758546972,-73.9549139806915,-73.9549396627944,-73.9549863108683,-73.9550231434197,-73.9550599759685,-73.9552036359052,-73.9552288078567,-73.9552906377164,-73.955319159808,-73.9553663637438,-73.9554117894204,-73.9554189159671,-73.9554267290453,-73.9554597198399,-73.9554676506792,-73.9554749670514,-73.9554944182283,-73.9555140840359,-73.9555150908609,-73.9555372448559,-73.9555513001427,-73.9555616242946,-73.9555680315287,-73.955574852079,-73.955602149902,-73.9556084627258,-73.9556145010639,-73.9556242935186,-73.9556352800724,-73.955679273707,-73.9556891959379,-73.9556980042799,-73.9558754192204,-73.9559807251381,-73.9561189747227,-73.956149084249,-73.9562149296224,-73.9562426116474,-73.956365934831,-73.9565418961317,-73.9565585662982,-73.9565767891618,-73.9566348235061,-73.9566558300674,-73.9567365002671,-73.9567987103568,-73.95682353901,-73.9568505322203,-73.9568802250153,-73.9569150907999,-73.9569190094735,-73.9569230334554,-73.9569315567593,-73.956957277261,-73.9569658816246,-73.9569736231516,-73.9569773173151,-73.9569809400718,-73.957020529486,-73.9570617922787,-73.9571046178665,-73.9571488910412,-73.9571745741813,-73.9572299336225,-73.9572534143635,-73.9572836920608,-73.957365367112,-73.95741470766,-73.9574660744286,-73.9575201657168,-73.9575786755596,-73.9575845020469,-73.9575899846836,-73.9575952093785,-73.9576002193402,-73.9576095673322,-73.9576345580439,-73.9576394031314,-73.9576443785898,-73.957649577856,-73.9576550372954,-73.9576916767166,-73.9577897723986,-73.9578129824212,-73.9578330544065,-73.9578717466859,-73.9579604436271,-73.9579851477651,-73.9580084880639,-73.9580372037262,-73.958106343487,-73.9581231238344,-73.9581376652032,-73.9582551216388,-73.9583670556231,-73.9584668239542,-73.9585843141115,-73.9586826049701,-73.9587857625724,-73.9588127854476,-73.9588750495311,-73.9589024865603,-73.9589248691931,-73.9589846885233,-73.959028446772,-73.9591362462812,-73.9591846931789,-73.9592059752958,-73.9592508637652,-73.959262363876,-73.9592734612116,-73.9593940815361,-73.9595318171985,-73.9596359543352,-73.9597242033729,-73.9597827034658,-73.9598369952847,-73.9598540465424,-73.9598734988492,-73.9599315835669,-73.9599529882304,-73.9600050997662,-73.9600176720868,-73.960028978455,-73.9600417288496,-73.9600546238286,-73.9600675790184,-73.9600804629095,-73.9600932301301,-73.9601055477781,-73.9601171329303,-73.9601275926811,-73.9601308516625,-73.9601334583407,-73.9601354506273,-73.960136863153,-73.9601384853693,-73.9601405649698,-73.9601426522078,-73.9601454720285,-73.9601490854786,-73.9601535168225,-73.9601604797993,-73.960169172422,-73.9602004587855,-73.9602111521168,-73.9602203656888,-73.9602240367821,-73.9602271534165,-73.960270489743,-73.9602854405677,-73.9607258037368,-73.961709101642,-73.9619544165528,-73.96209998909,-73.9621340461378,-73.9621641612823,-73.9621650561931,-73.9621658360878,-73.9621661744799,-73.9621664767356,-73.9621667637832,-73.9621670010405,-73.9621674098782,-73.9621676909266,-73.9621678571628,-73.9621679085983,-73.9621677386252,-73.9621672184747,-73.962163966583,-73.96215651228,-73.9621314673515,-73.962126540587,-73.962124687892,-73.9621248357296,-73.9621253712254,-73.9621263051699,-73.9621276250102,-73.9621314611295,-73.9621369520018,-73.9621432103087,-73.9621510758661,-73.9621821806658,-73.9622646205233,-73.9623520161974,-73.9623985933468,-73.9624253826674,-73.9624508562119,-73.9624747508786,-73.9624968456262,-73.9625169130367,-73.9625348459021,-73.9625505238162,-73.9625638494875,-73.9625918523497,-73.9626081981691,-73.9626201589866,-73.9624307900526,-73.9622091655788,-73.9617904832917,-73.961536557733,-73.9614315748347,-73.9614102719547,-73.9612851752416,-73.9612469794547,-73.9612468221942,-73.961261079398,-73.9613158836933,-73.9615053657722,-73.9617199019427,-73.9618263897672,-73.9619375008643,-73.9618880631812,-73.9618039742302,-73.961652517354,-73.9614589377523,-73.9612186285201,-73.9611177038758,-73.9610735862415,-73.96107392568,-73.9611090115081,-73.9612699680906,-73.9612909109322,-73.9613642674758,-73.9613661128063,-73.9613648658307,-73.9613605637523,-73.9613533349278,-73.9613469751279,-73.9613394216988,-73.9611081450143,-73.9611727785115,-73.9615525316896,-73.9611902978902,-73.9611136948121,-73.9610954865457,-73.9609716838548,-73.960934498066,-73.9606460218035,-73.9605972658329,-73.9605425204063,-73.9604826192219,-73.9604184744982,-73.9603510630808,-73.9602814115662,-73.9602105806668,-73.9601396490567,-73.9597747079781,-73.9597198152903,-73.9597558631759,-73.9597059836081,-73.9597572719071,-73.9600156892823,-73.9600219619768,-73.9599315706844,-73.9599331442771,-73.9599468523336,-73.960073636994,-73.9601237537595,-73.9601288535214,-73.9600349409628,-73.9600419950784,-73.9600576584307,-73.960177787216,-73.960216548921,-73.9602126194294,-73.9605088734164,-73.9605209098166,-73.9605685685849,-73.9605173253627,-73.9601195191879,-73.9601060263757,-73.9599229878987,-73.9599331149754,-73.9596322502396,-73.9595540130476,-73.9593619820903,-73.9594036821736,-73.9593910660958,-73.9594601317309,-73.9594691321388,-73.9597128047115,-73.9597285522864,-73.9601552551769,-73.9601260096239,-73.9600114713926,-73.9600261005691,-73.9598015174163,-73.9597913938324,-73.9595432284935,-73.9595241081917,-73.9593685295413,-73.9592997163362,-73.9592336894569,-73.9592159711042,-73.9591604228998,-73.9590995602886,-73.9590340408699,-73.9589448263477,-73.9588541993578,-73.958818415847,-73.9587753700448,-73.9591872398515,-73.9592218857206,-73.9594113400176,-73.9594181944255,-73.9594247965274,-73.9594310751916,-73.9594369665559,-73.9594424094085,-73.9594473453995,-73.959451726095,-73.959455498879,-73.9594586327234,-73.959461088671,-73.9594628429674,-73.959463877582,-73.9594641795542,-73.9594637511212,-73.9594632905869,-73.9594620474797,-73.9594600317459,-73.9594572667691,-73.959453776372,-73.9594495936257,-73.9594447610742,-73.9594393250003,-73.9594333382968,-73.9594268580354,-73.9594199474553,-73.9594126726536,-73.9594051050138,-73.959397318998,-73.9593893870819,-73.9593813868067,-73.9593733968078,-73.9588791994333,-73.958758548348,-73.9596490110313,-73.9596659058759,-73.9596367513388,-73.9596015058519,-73.9590666925803,-73.9590762888058,-73.9586225591623,-73.9584938930312,-73.9584785470835,-73.958471422987,-73.9584525226965,-73.9586245122263,-73.9586245007113,-73.9587375240832,-73.9591404409601,-73.9591694989292,-73.9591980100273,-73.9592253302228,-73.9592508423848,-73.9592739702227,-73.9592941913043,-73.9593110488566,-73.9593298227356,-73.9593407193065,-73.9593434270197,-73.9593378684471,-73.9593242024971,-73.959302819873,-73.9592743319041,-73.9592433877305,-73.9592055760204,-73.9591616778229,-73.9591125999168,-73.9590593560795,-73.9589674608343,-73.9588256570137,-73.9586415292084,-73.9585639815858,-73.9585022745932,-73.9585087621338,-73.9585201270168,-73.9585360582178,-73.9585561197422,-73.9585999347702,-73.9591437169293,-73.9587780625431,-73.9587203632678,-73.9586649067498,-73.9585774430487,-73.958483404791,-73.9584069333275,-73.9583981422614,-73.9583580081882,-73.9583078232392,-73.9584531679355,-73.9575188932101,-73.957493440047,-73.9570409727684,-73.9548539426804,-73.9547334795327,-73.9547056124169,-73.9543931791822,-73.9543059177703,-73.9543043432594,-73.9543724770986,-73.9543661914581,-73.9541516116393,-73.9541547616021,-73.9542275940771,-73.9542346639028,-73.9543027974418,-73.9543647478346,-73.9531838249286,-73.953053755714,-73.9547838786981,-73.9563216250967,-73.9561349924058,-73.9560116030271,-73.9560613473487,-73.9560688724459,-73.956249267227,-73.9562219902069,-73.9560453582323,-73.9560557026516,-73.9560006509462,-73.9557603914094,-73.9561741649249,-73.9561995300734,-73.9562013686724,-73.9561206641136,-73.9560879451089,-73.9560624580052,-73.9555951726589,-73.9554643693641,-73.9553492851445,-73.9552152996592,-73.955228094294,-73.9551323915248,-73.9552027504087,-73.9550665256017,-73.9545158457339,-73.9546500041312,-73.9544758598269,-73.95449874596,-73.9539571769585,-73.9539852368413,-73.953932227402,-73.9538018878991,-73.9536778274565,-73.9530311226815,-73.9530024245874,-73.9530115416991,-73.9528990276141,-73.9526932201441,-73.9521726229454,-73.9520814316973,-73.9517794957792,-73.951625387182,-73.9513674855783,-73.9510179266641,-73.9508770201765,-73.9508391707598,-73.9508076381835,-73.9491129519947,-73.9490827060623,-73.9490420195343,-73.948970213573,-73.9487795492734,-73.9478967108823,-73.9462957550284,-73.9440358037089,-73.9438353681251,-73.942719280804,-73.9425402228334,-73.9423834770959,-73.9418744195925,-73.9417770356669,-73.9410861243826,-73.9405203088532,-73.94039280634,-73.9402628154808,-73.9400209980992,-73.9394428434305,-73.9386371583589,-73.9379820917095,-73.9378116270893,-73.9374297356962,-73.9374154885158,-73.9373262628454,-73.9372960072456,-73.9373804606774,-73.937381538012,-73.9373836877828,-73.9373855812787,-73.9373928572593,-73.9373965378215,-73.9368348054646,-73.9367254201155,-73.9353868532155,-73.933939394172,-73.9315191206656,-73.9265160561276,-73.9246336947016,-73.9225504306775,-73.9216120809142,-73.921014801325,-73.9207124344269,-73.920539001505,-73.9202133376663,-73.9195757355013,-73.9181837583396,-73.9152560093149,-73.9131433924495,-73.9126711659089,-73.9098431864611,-73.9103411180102,-73.9106747489712,-73.9102312473466,-73.9082366112783,-73.907594259872,-73.906908897675,-73.9066854594976,-73.9061170803334,-73.9058644026395,-73.9049169137475,-73.9039228060483,-73.9029891234458,-73.9024721300924,-73.9021212034403,-73.9012134795135,-73.9003027629588,-73.8995734847149,-73.8992154677058,-73.8987381642835,-73.8986294744263,-73.8985422311188,-73.897923512633],"lat":[40.7542400026781,40.7542120009671,40.7541802000438,40.754145058949,40.7541070849377,40.7540668261564,40.7540248637308,40.7539385829134,40.7538533612141,40.7537696722237,40.752832376769,40.7527347880438,40.7526353790247,40.7525344018712,40.7524321127191,40.752268388305,40.7521036484609,40.7519381322374,40.7517890264151,40.7515416182159,40.7513005544233,40.7505204292329,40.7496277093708,40.7493346015193,40.7486150514112,40.748566072085,40.7485182124273,40.748473705578,40.7483222864038,40.7482056553529,40.7478504020762,40.7472810572633,40.7465352708128,40.7449579546392,40.7428727780394,40.7421448441982,40.7414282487896,40.7406872451642,40.7399027504751,40.7393922541524,40.7392349338419,40.7391988790892,40.7391444634683,40.7389736031946,40.7383151394919,40.7365363637948,40.7357583823087,40.7354411608881,40.7342913227586,40.7345311600154,40.7345923964625,40.7345599567433,40.7345129691644,40.734504989054,40.7344848097319,40.7344701402597,40.7344781263096,40.734495962249,40.7345235751979,40.7345608120557,40.7346021780483,40.7346574527841,40.7347262100445,40.7348077916827,40.7348418131671,40.7348993231489,40.7349464923144,40.7349465286191,40.7349465550403,40.7349827514936,40.7349827873496,40.7349828150073,40.7350077216808,40.7350211830895,40.7350178916089,40.7350967415428,40.7350866013284,40.7351603541823,40.7351835987958,40.7351836082923,40.7351836166265,40.7351941743269,40.7351941843251,40.735194184441,40.7351919100571,40.7351919101819,40.7351919009261,40.7351768201689,40.7351768109014,40.7351767929127,40.7351490839862,40.7351115982715,40.7350625906685,40.7350023583031,40.7349313950196,40.7348503206148,40.7348185058024,40.7347823281338,40.7347419475685,40.7346975426484,40.7346493097091,40.7345974622771,40.7345422293309,40.73448385508,40.7344225976226,40.7343587278039,40.7341260367359,40.7339146347793,40.7321044283459,40.7301865910331,40.7301252689164,40.7289565769738,40.7286366843154,40.7285200195862,40.7277326828304,40.7275760302747,40.7274665227726,40.7274247284378,40.7273886537873,40.7272943699146,40.7272087388807,40.7267338879102,40.7260684259766,40.7254459561267,40.7241821699518,40.7232396349499,40.7230815258964,40.7228984123538,40.7227736942151,40.7222516912755,40.7222258862613,40.7222258600627,40.7222258244747,40.722187436076,40.7221874093316,40.7221873737177,40.7221369855947,40.7221369499629,40.7220758660017,40.7220757667866,40.7220756406003,40.72200550648,40.7222706962186,40.722524493285,40.7227430484489,40.7229403423924,40.7236607855359,40.7236811133181,40.7236826847762,40.7236857748695,40.7236885779895,40.7236919116838,40.7236954612728,40.7236999229867,40.7237037774119,40.7237082096633,40.7237132122922,40.7237189609603,40.7237248803091,40.7237313961802,40.72373893087,40.7237472695576,40.7237519441213,40.7237554105225,40.7237606976998,40.7237648661705,40.7237676736917,40.7237693357573,40.7237712514014,40.7237725552349,40.7237745246019,40.7237762417369,40.7237784529514,40.7237792024513,40.7237792120646,40.7237791431343,40.7237783620656,40.723779800275,40.7237824243232,40.7237861920411,40.7237912865893,40.7237972373222,40.7238022495912,40.7238072234726,40.723811215086,40.7238157821822,40.723824693213,40.7238325752655,40.7238410162932,40.7238522067961,40.7238628397152,40.7238720485613,40.7238784914546,40.7238827010359,40.7238863322528,40.7238899459069,40.7238939384273,40.7238971036239,40.7238993395006,40.7239017906668,40.7239073213198,40.7239169132897,40.7239279230503,40.7239308680538,40.723934967485,40.7239474224041,40.7239533003333,40.723960396762,40.7239665750643,40.7239697728803,40.7239715588922,40.723978538637,40.7239842843049,40.7239936882538,40.7240036308816,40.7240147892013,40.7240252540257,40.7240356100422,40.7240426158222,40.7240491640267,40.7240553168185,40.7240613458219,40.7240658863242,40.7240698500272,40.7240745002159,40.724078601346,40.7240818838573,40.7240844452432,40.7240839643298,40.7240822747587,40.724081571215,40.7240816087554,40.7240822500712,40.7240830099327,40.7240861731042,40.7240918370142,40.7241000467622,40.7241103757445,40.7241155691048,40.7241207144791,40.7241232570681,40.7241246652159,40.7241275067979,40.7241321843508,40.7241354657121,40.7241385219742,40.7241423259064,40.7241465903655,40.724150448387,40.724151973292,40.7241535525858,40.7241550140158,40.7241582419337,40.724163601278,40.7241709966144,40.7241774825313,40.7241812864349,40.7241809377084,40.7241760678405,40.7241722328219,40.7241693655015,40.7241690442385,40.7241696603877,40.7241708033092,40.7241723038395,40.7241744081636,40.724177771344,40.7241803857907,40.7241833854595,40.7241880077322,40.7241908738616,40.7241930532286,40.7241995776115,40.7242032660563,40.7242062513375,40.7242125731217,40.7242188408186,40.7242254166448,40.7242312448986,40.7242358408482,40.7242401551167,40.7242435984115,40.7242460593935,40.7242452158334,40.7242449307307,40.724246177972,40.7242480015681,40.7242527196385,40.7242544613666,40.7242564815203,40.7242587717047,40.7242595489735,40.7242591188554,40.7242589352816,40.7242614721968,40.7242620697934,40.7242637655656,40.7242634192584,40.7242518153514,40.7242512407179,40.7242487448856,40.7242489281714,40.7242538431058,40.7242662947255,40.7242687708209,40.7242854558133,40.7242843118587,40.724289222582,40.7242926009261,40.724289850096,40.724280702018,40.7242757416934,40.7242910120934,40.7243072505331,40.7243393712908,40.7243592870883,40.7243876439844,40.7244036955173,40.7245065756715,40.7245549333568,40.7245948586997,40.7246339247652,40.7246349887159,40.7246534691011,40.7247208738991,40.7247329797924,40.724799840256,40.7248874171908,40.7248982412345,40.7250180341859,40.7254040876602,40.7254240425388,40.7256690652872,40.7256864285543,40.7257393187844,40.7260717647408,40.7262484303061,40.7263023933037,40.7264120557468,40.7264606452629,40.7269298647454,40.7269989907689,40.7272613806745,40.7275120908344,40.7277585796662,40.7278448281856,40.7278765596005,40.7278906800666,40.7279302757471,40.7279806886589,40.7280086136282,40.728056596974,40.7280810197028,40.7281976786858,40.7282601657611,40.7283085559944,40.7284331003509,40.7285631377871,40.7286066676042,40.7286175985837,40.7286429877768,40.7286772038105,40.7287254411126,40.7287425659902,40.7288097811031,40.7290519061202,40.729104806535,40.7294651148721,40.729481770739,40.7295633626513,40.7296433833015,40.7296721455986,40.7296865198416,40.7301346044158,40.7304004763208,40.7305099678461,40.7310782012054,40.7312984572628,40.7313798065256,40.7315062355775,40.7315595100273,40.7318610389953,40.7319348128633,40.7319815626066,40.7320870567146,40.7321661851417,40.7321994819165,40.7322358627536,40.7323017087395,40.7323351125699,40.7323809009008,40.732507029299,40.7327527266578,40.7329097093187,40.7329819945689,40.7331615192898,40.7332763283618,40.7332450443058,40.7332863764852,40.7333630289839,40.7334863743447,40.7335113349513,40.7335404412753,40.7336442347693,40.733688156104,40.7337529505413,40.7337621529801,40.7341952789314,40.7344325362747,40.7347788841614,40.7350704090911,40.7354428900986,40.7357987836502,40.7358190793985,40.7358238997184,40.7358328477718,40.7358414423382,40.7359625782013,40.7360134911547,40.7360422846099,40.7360667204671,40.7360790715554,40.7360917727964,40.7361047325959,40.7361356684894,40.7361466545562,40.7361843606823,40.7362016969772,40.7362105681503,40.7362526752734,40.7363146441841,40.7363400037614,40.7363495160144,40.7363516900405,40.7363530550001,40.7363542009677,40.7363552686377,40.7363571014167,40.7363626568636,40.7363708431974,40.7364244160105,40.736444096365,40.7364975946782,40.736548986957,40.7365790821462,40.7365960172028,40.736630545671,40.7366474884829,40.736659732885,40.7366982585715,40.7367177897736,40.7367754858605,40.736836101268,40.7370018298426,40.737127794559,40.7373232463832,40.7373820972261,40.7374521320005,40.7374825857392,40.7374937930369,40.7374962634162,40.7374977877537,40.737499454651,40.7375012388017,40.7375031127137,40.737505076554,40.7375071214396,40.7375125157005,40.7375183702311,40.7375245483317,40.7375331304154,40.7375454031408,40.7375564400968,40.7375675787257,40.7375709352409,40.7375733637321,40.7375749453263,40.7375753946876,40.7375756092267,40.7375755904403,40.7375753373352,40.7375748586049,40.7375688827107,40.737555735726,40.7375489580515,40.7375464783171,40.7375459460875,40.7375455582389,40.7375453058901,40.7375451781425,40.7375453386934,40.7375460304649,40.7375485113668,40.7375554275424,40.7375848673955,40.7376123127513,40.737622292531,40.7376482142303,40.7376592744045,40.7376843533437,40.7377157995456,40.7377370049668,40.7377523519926,40.7377646748233,40.737774224412,40.7378165297427,40.7378565620556,40.73787025609,40.7378855344341,40.7379058174502,40.7379309432528,40.7379386634942,40.7379560767953,40.7379629242265,40.7379679896726,40.7379727560031,40.7379905247232,40.7379962640849,40.7380026159957,40.7380112835054,40.7381079720933,40.7381295730668,40.7381383525421,40.7381389541087,40.7381392400044,40.7381392206209,40.7381388855493,40.7381372874349,40.7381348975227,40.7381314624769,40.7381155793674,40.7381097284854,40.738107338632,40.7381057241384,40.7381048650078,40.7381047449722,40.7381073145981,40.7381125754566,40.7381189062452,40.7382876639356,40.7388160202686,40.7388615469588,40.7388807235393,40.7390208657467,40.7390800517606,40.7392485836272,40.7392995707064,40.7393616308016,40.7396797728978,40.7399217814536,40.7401139417531,40.7403353456582,40.7404183229342,40.7407992824137,40.7413544306388,40.7417692158685,40.7426170356793,40.742534082025,40.7429308826875,40.743067754025,40.7431595125988,40.7431440174894,40.7432082722108,40.7428324414601,40.7427310870957,40.7420712263407,40.7420632446415,40.7419691861873,40.7408976683984,40.740290217792,40.739864126169,40.7398641542097,40.7396926207141,40.7396569385612,40.7395925870015,40.7395516335298,40.7394304719696,40.7394227376092,40.7394138966174,40.7394116994843,40.7394117140219,40.7394084027621,40.7394062070561,40.7393951478029,40.7393752264604,40.739358622475,40.7393232004168,40.7393021776813,40.7392778281562,40.7392512585251,40.7392315971958,40.7391937212044,40.7391436928612,40.7391338808317,40.7391150629787,40.7390690334541,40.7390038015044,40.7390086223932,40.7389228054914,40.7389255094908,40.7389243666841,40.7389193983884,40.7389106972788,40.7388926307465,40.7388715378655,40.7388474817,40.7388366292644,40.7388206171424,40.7388023798776,40.7387823960599,40.7386462397649,40.7385738880032,40.7385005783264,40.7383568236452,40.7383148585616,40.7382694853972,40.7382070312938,40.73812081425,40.7379001233448,40.7390069858434,40.7390275603396,40.7391305045488,40.7393149740384,40.7393364772951,40.739487305928,40.7395362548649,40.7395034567502,40.7395186285267,40.7395439344966,40.7395586394451,40.7395757779564,40.7395840236409,40.7395912888693,40.7396061794554,40.7396197002591,40.7396359957054,40.7396521130941,40.7396691732872,40.7397185986865,40.7397362699555,40.7397539274847,40.7397943388995,40.739813003818,40.7398172182536,40.7398198657746,40.7398202929779,40.7398198292286,40.739815116679,40.7398140698843,40.7398140913087,40.7398120578614,40.7398032702577,40.7398007334731,40.7397988486606,40.7398002791693,40.7398047487874,40.7398115330321,40.7398158997322,40.7398159162735,40.7398147151407,40.7398122435794,40.7397997084929,40.7397957810348,40.7397899874927,40.7397872687069,40.7397845773776,40.7397831858867,40.7397817960593,40.7397788080742,40.7397767923013,40.7397680902076,40.739765571126,40.7397648868244,40.7397670831009,40.7397679504634,40.7397694664182,40.7397777908352,40.7397790905562,40.7397796785547,40.739779560931,40.7397779656367,40.7397778847754,40.7397746336025,40.7397717845462,40.7397696986389,40.7397678824448,40.7397652193964,40.7397519387162,40.7397496711674,40.7397481424713,40.739746723946,40.7397461249164,40.73974760101,40.739747432946,40.7397467166414,40.7397217861325,40.7397113091255,40.739705157043,40.7397017556643,40.7396919293287,40.7396890133316,40.7396803340086,40.739668901197,40.7396668812549,40.7396632859752,40.7396476029152,40.7396427301099,40.7396273793441,40.7396173618367,40.7396147240636,40.7396135551297,40.7396138001178,40.7396154879278,40.7396158857611,40.739616580658,40.7396189344083,40.7396295068967,40.7396325359735,40.7396343756251,40.739634890306,40.7396351342375,40.7396349508352,40.7396318328136,40.7396257977201,40.7396168624302,40.7396098849612,40.7395921200965,40.7395859690372,40.7395801454955,40.7395671003274,40.7395565820116,40.7395434185115,40.7395274360221,40.7395081411281,40.7395057669126,40.7395027611632,40.7394991064889,40.739494740921,40.7394841908708,40.7394503220458,40.7394454529987,40.7394413031901,40.7394377934143,40.7394348859913,40.7394202211314,40.7393895954446,40.7393812110453,40.7393726728758,40.7393524702881,40.7392999126522,40.7392873513257,40.7392773013871,40.7392680362533,40.739250609197,40.7392451043522,40.7392391123621,40.7391836297192,40.7391333320791,40.7390950519714,40.7390411620124,40.7389982611435,40.7389546055505,40.7389441516876,40.7389221922991,40.7389111977878,40.7389003909397,40.738868272825,40.7388480540614,40.7388012208244,40.7387790593536,40.7387669185506,40.7387358309905,40.7387292437332,40.7387239975487,40.7386773579076,40.738618332731,40.7385762702298,40.7385355987465,40.7385117106613,40.7384939716428,40.7384900965041,40.7384874639052,40.7384846395307,40.7384851596066,40.7384912475323,40.7384920984087,40.7384921648208,40.7384909901947,40.7384881751989,40.7384837496238,40.7384777481017,40.7384701704494,40.7384611959724,40.7384510334783,40.7384400240825,40.7384356390347,40.7384307691071,40.7384253658978,40.7384193428077,40.7383797925649,40.7383668622572,40.7383610451228,40.7383558953321,40.7383513490785,40.738347343883,40.7383427800249,40.7383385062503,40.7383269907481,40.7383223656887,40.738316866132,40.7383138866028,40.7383107004895,40.738259935851,40.7382439923271,40.7380801701792,40.7382189186632,40.738240882265,40.7382601917795,40.7382658858129,40.7382722349097,40.738272538259,40.7382729249986,40.7382731490926,40.7382734011516,40.7382736729737,40.7382739700759,40.7382746409859,40.7382753931043,40.7382762572601,40.738277213015,40.7382790513939,40.7382812508446,40.7382912417207,40.7383188570031,40.7383928456819,40.7384154147254,40.7384359052745,40.7384385266086,40.7384411078638,40.7384436520593,40.7384461568454,40.7384510706508,40.7384559256958,40.7384602315062,40.7384647420592,40.7384800306847,40.7385233847426,40.7385645528017,40.7385832356519,40.7385970576164,40.7386120979002,40.7386281898972,40.7386451772341,40.7386628846054,40.7386812161523,40.7387000458566,40.7387192673085,40.7387682091899,40.7387955390568,40.7390326621261,40.7396714805854,40.7400061749957,40.7400131304171,40.7401598231021,40.7402966906947,40.7403236216282,40.7403492848866,40.7404235966126,40.7404247312156,40.740446795044,40.740470639565,40.7405302673822,40.7405994347961,40.7406316341944,40.7407948788159,40.7409821698098,40.741097673472,40.7411327570986,40.7411375051767,40.7411078601302,40.7415372776615,40.741625928074,40.7416945047522,40.7417940714644,40.7418310892129,40.7417939466234,40.7418100670162,40.7418236127327,40.7418371979019,40.7418504171917,40.7418628761863,40.7418707247334,40.7418779353153,40.7418280254053,40.7418863341411,40.7419932614072,40.7426448552597,40.7427485491379,40.7427819472288,40.7427540542637,40.7428297600225,40.7433927062632,40.7434319833622,40.7434663939715,40.743495414059,40.743518601683,40.7435356037229,40.7435461612573,40.7435501135071,40.7435474002838,40.7435046837005,40.7436930454653,40.7436988494501,40.7438586500612,40.7438747506824,40.7439201098011,40.7439073061033,40.7437997595164,40.7437887403534,40.7437845758951,40.7439299583349,40.7439392079025,40.7439264037928,40.7438131975336,40.7438030740234,40.7438036750124,40.7439478637493,40.7439574075467,40.7439809340804,40.7440419926505,40.7440197400753,40.7440296660829,40.744105341081,40.7440296722944,40.744058709807,40.7440270420961,40.7439945884111,40.7439346319142,40.7440154967009,40.7442139760372,40.7442260747472,40.7442833242413,40.7442925197971,40.7442677526999,40.7443148174134,40.7442721156194,40.7443687826056,40.7444439369915,40.7444225430444,40.7443738623127,40.744329368581,40.7443558442473,40.7443087787924,40.7443548959061,40.7443248053434,40.7443242221792,40.7443100430265,40.7443260261298,40.7443671621899,40.7444036904814,40.7444352163242,40.7444547603548,40.7444700911574,40.7445089072683,40.7445555998635,40.7446210112571,40.7445538056309,40.7445911441275,40.7445927598206,40.7445949009543,40.7445975435473,40.7446006626157,40.7446042206122,40.7446081835084,40.7446125097409,40.7446171535566,40.7446220660268,40.7446271973826,40.7446324904894,40.7446378935751,40.7446433486711,40.7446487984842,40.7446548773471,40.7446608917721,40.7446667851386,40.7446724993233,40.7446779787158,40.7446831720647,40.744688026279,40.7446924978181,40.7446965397933,40.7447001155363,40.7447031888835,40.7447057323841,40.7447077190912,40.7447091304357,40.7447099543813,40.7447101798984,40.7447098081875,40.7446243314547,40.7449450052529,40.7451338399505,40.7451703005826,40.7452031697384,40.7452073738491,40.7451103453052,40.7450924688073,40.745007815675,40.7449878649163,40.7450380916259,40.7450602413873,40.7451190118222,40.7451494306627,40.74516797196,40.7451950894374,40.745291763707,40.7452928734379,40.7452972827844,40.7453048921447,40.7453155296324,40.7453289549593,40.7453448648631,40.7453628999574,40.7453972477559,40.7454335101988,40.7454706505309,40.745507606896,40.7455433226958,40.745576776799,40.7456070127355,40.7456451435442,40.7456795068178,40.7457093927298,40.74573418394,40.7457533683464,40.7457750773656,40.7457533279257,40.7457291152278,40.7457346976412,40.7457649742178,40.7457878836226,40.7458096660897,40.745829725486,40.7458475128344,40.7458955754472,40.7460006036785,40.7465567369716,40.7466463016142,40.7466420206964,40.7467510848496,40.7468377779646,40.7468873073044,40.7469178016035,40.7469740165977,40.7470683491952,40.7470979456289,40.7483036195923,40.7483364647629,40.7489203508738,40.748040794641,40.7480187257111,40.7480136204525,40.7479563806244,40.7479948159126,40.7480079198554,40.7480162859838,40.748044874348,40.7480144114447,40.7479882035637,40.7479989540376,40.7479691747137,40.7479769446576,40.7479511725337,40.747734811961,40.7480874872293,40.7484276877732,40.7490815539323,40.7492646262748,40.7493739942268,40.7494028769619,40.7493928736635,40.7494865777093,40.7495173030304,40.7494193113742,40.7494114521468,40.7493837032092,40.7495966595302,40.7496650944919,40.7496707144228,40.7496856328214,40.7497598853697,40.7497687291696,40.7497642778299,40.7496839685396,40.7496742130827,40.750013856904,40.7499919676893,40.7499434460404,40.7499264243323,40.7496765374095,40.7496327303754,40.7505866989768,40.7508310409595,40.7510972655599,40.7512187593357,40.7517646302687,40.7517875337532,40.7518516068715,40.7519572932794,40.7520372637952,40.7526834337548,40.7527179394544,40.7527750921768,40.7528898407764,40.7530679250892,40.7537027611479,40.7537570412217,40.7540867135073,40.7542491593592,40.7545238832373,40.7550869197248,40.7551669147052,40.7552180836162,40.7552636801144,40.7545236203242,40.7545564576391,40.7546006186048,40.7546785623059,40.7548904187012,40.7544853006744,40.7537146046939,40.7526266199747,40.7525301225546,40.7520369517853,40.7519592388872,40.7518912083212,40.751670283674,40.7516279845761,40.7513278799854,40.7510793920614,40.7510225312797,40.750967100744,40.7508606171018,40.7506060198224,40.7502587994197,40.7499720872667,40.7498974782205,40.7497510932775,40.7496922815123,40.7496337966918,40.7495204983681,40.7494677129278,40.7493937359716,40.7492460641682,40.7491983147121,40.7490147471783,40.7489164399634,40.7483945519164,40.7484714113581,40.7494119331534,40.750269645274,40.751152455671,40.7515130743283,40.7516433456615,40.7515764796352,40.7513715516221,40.7509726094671,40.7504680069492,40.7497508278526,40.7498108010836,40.7499439122082,40.7502344982949,40.7508456259457,40.7509670521758,40.7510645887011,40.7516386798306,40.7526768150166,40.7529950763249,40.7529765234734,40.7531624245448,40.753222284605,40.753284848735,40.7533079423502,40.7533788762879,40.7534038487453,40.753505277894,40.7536113241357,40.7537083825432,40.753763037953,40.7538010119785,40.7539022110865,40.7539913147834,40.7540635323673,40.754106218947,40.7541536704362,40.7541615224451,40.7541701124326,40.7542400026781]}]],[[{"lng":[-73.8877019927043,-73.88710945095,-73.886794729562,-73.8862888460147,-73.8856999561787,-73.8856503153903,-73.8856119788771,-73.8855933098002,-73.8850919561427,-73.8846141461265,-73.8841609538133,-73.8840905169682,-73.8835332114184,-73.8829754338343,-73.8820851986599,-73.8817230176511,-73.881309176877,-73.8808979364915,-73.8808848465233,-73.8804906821248,-73.880088774892,-73.879693540886,-73.8786587482635,-73.8783662923012,-73.8778940272635,-73.876997241884,-73.8762830236057,-73.8753864726791,-73.8750915415561,-73.8749534951893,-73.8747547553187,-73.8740891317392,-73.8731694263047,-73.8723522953997,-73.8715474999877,-73.8714607424957,-73.8714098075705,-73.8711328338978,-73.8710112740359,-73.8710015610708,-73.8709308131908,-73.8708453942418,-73.8707456101135,-73.8706318513309,-73.8702113590573,-73.8697076535123,-73.8693102591821,-73.8692927042302,-73.8692721567242,-73.8687681732168,-73.868453052108,-73.8682106853056,-73.8676592737985,-73.8673090828058,-73.8671140456211,-73.8665724107751,-73.8660417615264,-73.8654761087032,-73.8652387061175,-73.8646872952352,-73.864122975782,-73.8635711113709,-73.8630185014243,-73.8627219509845,-73.8624254052537,-73.8621363821695,-73.8618336832683,-73.8615288665559,-73.8612240638327,-73.8606266329048,-73.8600378987578,-73.8599285549996,-73.8598335677945,-73.8597535876575,-73.8596890729929,-73.8596403110687,-73.8596361698067,-73.8596351129799,-73.8596425479584,-73.8596541683763,-73.8596606676163,-73.8597131364884,-73.8597593286286,-73.8597766601653,-73.8597838926762,-73.8597761798592,-73.8597534605845,-73.8597158631146,-73.8596636207086,-73.8596351660726,-73.8596250536085,-73.8595585851161,-73.8595394885174,-73.8594845604181,-73.8593868164633,-73.8592851159699,-73.8592636325765,-73.8592385824414,-73.859202767927,-73.8591948564638,-73.8591414922119,-73.8590819836905,-73.8590106373112,-73.8589277465738,-73.8588337133272,-73.8587587683495,-73.8586800647054,-73.8585976714024,-73.858511660872,-73.8584221083407,-73.8583290923231,-73.858276818239,-73.8582327984575,-73.8581773669283,-73.8581251154846,-73.8574306238659,-73.8567325773891,-73.8559200537607,-73.8558129540011,-73.8557145429801,-73.8556258725154,-73.8555977094858,-73.8555667831852,-73.8554395493513,-73.8553942350219,-73.8554283910726,-73.855350187959,-73.8553183028424,-73.8552927590464,-73.8552957150926,-73.8553891051467,-73.8563093401744,-73.8572276271792,-73.8572793404126,-73.8573922105983,-73.8582740576156,-73.8589322439911,-73.8582349496568,-73.8581989070063,-73.8583102747183,-73.8585456206014,-73.8588871191326,-73.8592241210709,-73.8597750087561,-73.8601307335372,-73.8605650630781,-73.8609387576988,-73.8622049653039,-73.8624074743969,-73.8627929587684,-73.8629210432223,-73.8631813516721,-73.8635709250918,-73.8639599298141,-73.8644898364108,-73.8646174232949,-73.8652378763399,-73.8654285679917,-73.8659355955898,-73.8666167732328,-73.8668554454553,-73.8668905494134,-73.8670847383692,-73.8673025313442,-73.8675068605491,-73.8676959937506,-73.8678684597139,-73.8680230761879,-73.8681129138768,-73.8681850269878,-73.8682546171208,-73.8683317597814,-73.8686502416753,-73.8688673074056,-73.8689484527443,-73.869043054218,-73.8691505174281,-73.8692700488922,-73.8694786510802,-73.8699033016364,-73.8701174316062,-73.8702112900175,-73.8703416191591,-73.8705739316604,-73.8705545830779,-73.8705140361971,-73.8689176275678,-73.8700429289989,-73.8710755255059,-73.8740205324067,-73.8793931510817,-73.879506412209,-73.8795613942397,-73.8811746909754,-73.8822666544277,-73.8837769864928,-73.884522508914,-73.887283929256,-73.8880834184255,-73.888092663383,-73.8882981117232,-73.8890889528668,-73.8896278757877,-73.890154186729,-73.8906308685609,-73.8916601065927,-73.8925830316834,-73.8927414244319,-73.8934403131568,-73.893985686658,-73.8940409878327,-73.8941425555181,-73.8941746326718,-73.8949106745415,-73.8950492683729,-73.8953050494877,-73.8955485950465,-73.8956147649848,-73.8957794543699,-73.8959972738213,-73.8962016955736,-73.8962863475366,-73.8963589890351,-73.8963679902941,-73.8964190907378,-73.8964301047751,-73.8964662506299,-73.896526442364,-73.8989768735436,-73.9011615506039,-73.9004246511309,-73.9018877625489,-73.9013984066204,-73.9014395867372,-73.9015539023884,-73.9017609660887,-73.9020727736498,-73.9027882470701,-73.9035405707189,-73.9038660054109,-73.9042879271097,-73.905042952955,-73.9057959700921,-73.9049142425983,-73.9048043538206,-73.9042601834566,-73.9046638475369,-73.9050048476836,-73.9054012773038,-73.9057653602042,-73.9061162600322,-73.9065235071222,-73.9068458346055,-73.9072745239221,-73.9075698522655,-73.9080224924566,-73.9087736610297,-73.9095327313856,-73.911034895788,-73.9118082010449,-73.9106788273735,-73.9114224265737,-73.9121616973804,-73.9129040412196,-73.9118071006943,-73.9125491390839,-73.9132916243198,-73.9140309747051,-73.9147706384764,-73.9155125050607,-73.9158973862979,-73.9162525203122,-73.9166089237908,-73.9166494811254,-73.9169950680197,-73.9173652032122,-73.9177366290558,-73.9180816760575,-73.9181029964512,-73.9184767086711,-73.9188434257222,-73.9192216260329,-73.9195647335138,-73.9199595293086,-73.9207006591888,-73.9214347597289,-73.9218918463265,-73.9207485304976,-73.9211202010852,-73.9212207352637,-73.9215460162964,-73.9218188030682,-73.9222346647762,-73.9231393634936,-73.9240401133402,-73.9240590973699,-73.9236835215252,-73.9237491153489,-73.9240522324596,-73.924122415755,-73.9240993129093,-73.9240624402141,-73.9239737525084,-73.9238970964526,-73.9238151312858,-73.9237638904394,-73.9236689576321,-73.9235983444235,-73.923560113471,-73.9235447073561,-73.9235332307986,-73.9235275210041,-73.9235274739841,-73.9235254725108,-73.9227919667243,-73.922329701677,-73.9206425894054,-73.9205692009295,-73.920568217331,-73.9205680891069,-73.9205690553611,-73.920573003167,-73.920578613887,-73.9206042510004,-73.9210948282622,-73.9212764627774,-73.9214071462264,-73.921700059875,-73.9217184781469,-73.9221695881019,-73.9222376112434,-73.9222820768139,-73.922327739569,-73.922349725625,-73.9223584472247,-73.9223512238468,-73.9224148847761,-73.9224837931259,-73.9225192815479,-73.9225977191975,-73.9226761578557,-73.922794147454,-73.9230576938633,-73.9232392822604,-73.9234261670814,-73.9234660265416,-73.923464646914,-73.9234408331729,-73.9234422540663,-73.9234476277227,-73.9234571659079,-73.9234679458739,-73.9234769482587,-73.9234831417299,-73.9234935914122,-73.9235046909438,-73.9235138017346,-73.9235224401305,-73.9235304024016,-73.9235381027946,-73.9235437943912,-73.9235491556811,-73.9235547999705,-73.9235596968507,-73.9235636845036,-73.9235676122674,-73.9235721422235,-73.923576233619,-73.9235792096976,-73.9235820088276,-73.9235857756141,-73.9235894370586,-73.9235935965215,-73.9236006165548,-73.9236064298081,-73.9236127962909,-73.9236192364079,-73.9236256716535,-73.9236317176537,-73.9236373013324,-73.9236427673784,-73.9236500747469,-73.923656618493,-73.9236621693762,-73.9236692575383,-73.9236768886436,-73.9236841297714,-73.9236893513344,-73.923695611748,-73.9237026752406,-73.9237101668778,-73.9237197150031,-73.9237261139587,-73.923731648007,-73.9237369052813,-73.9237446573535,-73.9237549176179,-73.9237663820715,-73.9237820267751,-73.9237940284995,-73.9238067467151,-73.9238219800125,-73.9238351219119,-73.9238437687801,-73.9238533492379,-73.9238600781395,-73.923867060324,-73.9238745498032,-73.9238795888901,-73.923888557963,-73.9238943450098,-73.9239028517397,-73.9239090414078,-73.9239164980205,-73.9239242754028,-73.9239325226696,-73.9239386732935,-73.9239431281534,-73.9239460344799,-73.9239478665674,-73.9239494390175,-73.9239505017461,-73.923953410184,-73.9239548419979,-73.923955191999,-73.923959035937,-73.9239638145542,-73.9239678681566,-73.9239701685264,-73.9239714045988,-73.9239726858481,-73.9239728785403,-73.9239733665381,-73.9239743474109,-73.923975051392,-73.9239755511968,-73.9239759929686,-73.9239753727637,-73.9239747379345,-73.9239746445257,-73.9239751187831,-73.9239756048683,-73.9239769537967,-73.9239766143334,-73.9239753976932,-73.9239739334666,-73.9239723675487,-73.923971596218,-73.9239713340061,-73.9239716717476,-73.9239725906934,-73.9239725009699,-73.9239724131001,-73.9239726121227,-73.9239725247451,-73.9239714681915,-73.9239704834588,-73.9239692004742,-73.9239683914068,-73.9239673706331,-73.9239665259541,-73.9239648383139,-73.9239628779626,-73.9239606577603,-73.9239595500558,-73.9239587793112,-73.9239574720444,-73.923955063197,-73.9239520891845,-73.9239481555846,-73.923931078394,-73.9239161472029,-73.9238981717334,-73.9238836528079,-73.9238708020666,-73.9238541963012,-73.9238411988924,-73.9238382644765,-73.9238456531245,-73.9238558080838,-73.9238638750884,-73.9238720872618,-73.9238776364686,-73.9238803188037,-73.9238787917846,-73.9238754994155,-73.9238706054306,-73.923866377769,-73.9238610247713,-73.9238563462614,-73.9238529498243,-73.9238477721269,-73.923844799903,-73.9238406412174,-73.9238386051869,-73.9238368621676,-73.9238357540565,-73.923839275926,-73.9238439814355,-73.9238492669483,-73.9238545188003,-73.9238604579411,-73.9238668386539,-73.9238746140054,-73.9238825445883,-73.9238918671833,-73.9238983156302,-73.9239055793795,-73.923911343209,-73.923919623192,-73.9239266377356,-73.9239325067287,-73.9239382293463,-73.9239435893412,-73.9239505323345,-73.9239567200091,-73.9239633091374,-73.9239731338836,-73.9239752226747,-73.923980688974,-73.9239859047206,-73.9239909792476,-73.9239959452948,-73.9240015488769,-73.9240073423725,-73.9240119419635,-73.9240160474747,-73.9240200707185,-73.9240257259172,-73.924031442296,-73.9240367308852,-73.9240416270804,-73.9240460151631,-73.9240509718202,-73.9240565184879,-73.924061611986,-73.9240649973678,-73.9240695644381,-73.9240753987935,-73.9240833126564,-73.9240911679561,-73.9241026553375,-73.9241141091499,-73.9241250334001,-73.92413761147,-73.9241502250365,-73.9241601319247,-73.924168667299,-73.9241790110887,-73.9241890266868,-73.9241999127456,-73.924208126276,-73.9242158655835,-73.9242216641565,-73.9242271624757,-73.9242299640774,-73.9242289797435,-73.9242261507128,-73.9242225288932,-73.9242209654276,-73.924216984968,-73.9242117748301,-73.9242057726275,-73.924208032398,-73.9242146911238,-73.9242178124387,-73.9242122056621,-73.9241980583624,-73.9241892771197,-73.9241831264193,-73.9241783328675,-73.9241755497644,-73.9241730390654,-73.9241688362885,-73.9241665808918,-73.924166530512,-73.9241678189765,-73.9241689863824,-73.9241707310908,-73.9241734239755,-73.9241803303899,-73.9241889386326,-73.9241972879216,-73.9242037353105,-73.9242099247461,-73.9242169397046,-73.9242220506965,-73.9242294695364,-73.9242344265724,-73.9242354642779,-73.9242346884764,-73.9242333760299,-73.9242346651039,-73.9242379261757,-73.9242436492101,-73.9242544168658,-73.9242703432464,-73.9242864952211,-73.9243004514696,-73.9243134618658,-73.9243283136747,-73.924341639228,-73.9243497124568,-73.9243623578131,-73.9243767750514,-73.9243925653769,-73.9244088274067,-73.9244250895905,-73.9244395062162,-73.9244562287895,-73.9244748652158,-73.9244919516253,-73.9245079836075,-73.9245236261411,-73.9245400943333,-73.9245477646652,-73.9245573802735,-73.9245611536046,-73.9245632710669,-73.9245636119707,-73.9245638414921,-73.9245701837073,-73.9245802289316,-73.9245899956589,-73.9246013126009,-73.924614983339,-73.924624964795,-73.9246370355188,-73.9246465521955,-73.9246649657762,-73.9246872887747,-73.924712383837,-73.9247352201419,-73.9247598780161,-73.9247798991604,-73.9247962026206,-73.9248110991235,-73.9248259823025,-73.9248376006182,-73.9248541151798,-73.9248706313357,-73.9248822361775,-73.9248972291883,-73.9249124113132,-73.9249264196654,-73.9249359699209,-73.9249436033662,-73.9249504772168,-73.9249578610383,-73.9249661794357,-73.9249761992485,-73.924984978383,-73.9249919040885,-73.9250010864603,-73.9250105515441,-73.9250192017173,-73.9250293176931,-73.9250424369067,-73.9250501793337,-73.9250574946242,-73.9250703868396,-73.9250814154722,-73.9250895592128,-73.9251010823691,-73.9251100169207,-73.9251211155162,-73.9251275896857,-73.9251355914159,-73.9251410947329,-73.9251420406149,-73.9251466765988,-73.9251520004648,-73.9251544690648,-73.9251520727199,-73.9251467162845,-73.9251409957791,-73.9251406405557,-73.9251349215354,-73.9251294655166,-73.9251199570656,-73.9251126278734,-73.9251047753209,-73.9250959628691,-73.9250832980838,-73.9250779609385,-73.9250690290653,-73.9250611520521,-73.9250535624929,-73.9250448459051,-73.9250356305136,-73.9250243525934,-73.9250127532683,-73.9250070708941,-73.9249981748532,-73.9249853074184,-73.9249786184233,-73.9249734931929,-73.9249637677976,-73.9249541832127,-73.9249450387536,-73.9249380159633,-73.924931904309,-73.9249255083754,-73.9249192447023,-73.9249102531088,-73.9248994707111,-73.9248940865169,-73.9248816246287,-73.9248716341861,-73.9248672897159,-73.9248599173775,-73.9248507721765,-73.924841911265,-73.9248329804376,-73.9248201520031,-73.9248116292523,-73.924802919002,-73.92479598408,-73.9247828978064,-73.9247701043804,-73.9247637139263,-73.9247591948804,-73.9247491533878,-73.924737296106,-73.9247322648406,-73.9247271626391,-73.924721349485,-73.9247142921069,-73.9247088695133,-73.9247040983238,-73.9246993502328,-73.9246946509333,-73.9246893707238,-73.9246840907286,-73.9246775516788,-73.9246717226952,-73.9246674861785,-73.924662995269,-73.9246554295016,-73.9246514833814,-73.924646412337,-73.9246413546892,-73.9246370058885,-73.9246335593798,-73.9246283098604,-73.9246235370711,-73.9246161933592,-73.9246091811413,-73.9245990153625,-73.9245872402939,-73.9245785228291,-73.9245724880282,-73.9245637030681,-73.924554029708,-73.9245438011551,-73.9245354552228,-73.9245317955016,-73.9245270265035,-73.924517342125,-73.9245000483342,-73.9244836458559,-73.9244229875493,-73.924336933923,-73.9243140533913,-73.9242893862099,-73.9242618570813,-73.9242320537093,-73.9242145604347,-73.924195658019,-73.9241772524377,-73.9241583836863,-73.9241382136637,-73.9241135085051,-73.9240896213146,-73.9240681481268,-73.924045895307,-73.9240293333561,-73.9240178862699,-73.9239997028337,-73.9239696127908,-73.9239490861267,-73.923930467329,-73.923909942456,-73.9238903891307,-73.9238745184626,-73.9238582081174,-73.9238381829421,-73.9238200042459,-73.9238008888995,-73.9237775819501,-73.9237495735823,-73.9237344205743,-73.9237164516081,-73.9236958537906,-73.9236752096362,-73.9236567779992,-73.9236378741682,-73.9236208751435,-73.9236052491437,-73.9235872792603,-73.9235688840095,-73.9235449610039,-73.9235218673536,-73.923503947584,-73.9234869503431,-73.9234708665931,-73.9234557036048,-73.923440091448,-73.9234235304246,-73.9234055974964,-73.9233845983407,-73.9233598820427,-73.9233367884478,-73.9233145206556,-73.9232857321677,-73.9232626388793,-73.9232395559501,-73.9232156674292,-73.9231991069633,-73.9231804524082,-73.9231616864687,-73.9231319636397,-73.9231122576179,-73.9230952382453,-73.923078715218,-73.9230639895022,-73.9230420879399,-73.9230192156096,-73.9229973006625,-73.9229606910422,-73.9229341342886,-73.9229117791737,-73.9228940991563,-73.9228782646348,-73.9228633314708,-73.9228416888578,-73.9228212044169,-73.9227969673748,-73.9227727632223,-73.9227494603527,-73.9227252102129,-73.9227033156731,-73.9226828296879,-73.9226613985247,-73.9226413528796,-73.9226190230157,-73.9225910700687,-73.9225654605077,-73.9225472838386,-73.9225281561382,-73.9225076664927,-73.9224857688588,-73.9224638234505,-73.9224451801978,-73.9224269874703,-73.9224027446284,-73.9223799108225,-73.9223579754138,-73.922332312687,-73.9223108843703,-73.9222989721924,-73.9222871899019,-73.9222776561882,-73.9222656940553,-73.9222504231605,-73.9222335939774,-73.9222144702518,-73.9221948382105,-73.922181078954,-73.9221624363503,-73.9221433096128,-73.9221195824235,-73.9220920937652,-73.9220755739322,-73.9220580844322,-73.9220415642131,-73.9220245728791,-73.9220080534333,-73.9219929069434,-73.9219782219471,-73.9219493719238,-73.9219305100287,-73.9219066311651,-73.9218844207231,-73.9218650880964,-73.9218467231106,-73.921827861557,-73.9218108818306,-73.9217966703229,-73.9217829200533,-73.9217701178659,-73.9217478034495,-73.9217249683635,-73.9217073045583,-73.9216872829614,-73.9216649195655,-73.9216426032981,-73.9216179360352,-73.9215927936962,-73.921568126361,-73.9215516213436,-73.92153369523,-73.9215250681611,-73.9215125662603,-73.921486949024,-73.9214709053492,-73.9214539161304,-73.9214378722059,-73.9214136785831,-73.9213890130932,-73.9213762485606,-73.9213539269868,-73.9213330261284,-73.9213125415283,-73.9212912061004,-73.9212721262882,-73.9212521208949,-73.9212260408723,-73.9212099937589,-73.9211929639228,-73.9211844910777,-73.921177378785,-73.9211622312922,-73.9211466094912,-73.9211182316325,-73.9211035467085,-73.9210755965235,-73.9210609477789,-73.9210481430037,-73.9210253166322,-73.9210038869307,-73.9209806225512,-73.9209417503183,-73.9209266033675,-73.9209105091525,-73.9208953986056,-73.9208807131255,-73.920855107482,-73.9208355610809,-73.920819267122,-73.9207987738136,-73.920775045045,-73.9207517407668,-73.9207335609413,-73.9207230594616,-73.920713915833,-73.9207013895249,-73.9206912665927,-73.9206824928509,-73.9206727733512,-73.9206641989165,-73.9206594970202,-73.920655372381,-73.9206513103748,-73.9206475793133,-73.9206432094334,-73.9206325696137,-73.9206264031795,-73.9206242227211,-73.9206161369675,-73.9205996279007,-73.9205837353695,-73.9205669376539,-73.9205587447375,-73.9205433809753,-73.9205252015948,-73.9205124013345,-73.9205074882824,-73.9204878908698,-73.9204664208658,-73.9204551942117,-73.920438734578,-73.9204264602166,-73.9203969262659,-73.9203706416967,-73.9202753834074,-73.9205319833439,-73.9200671217348,-73.9190389757071,-73.9178930845565,-73.916554679467,-73.9164586007739,-73.9164584231399,-73.9164582462002,-73.9163500230956,-73.9163499523687,-73.9162318472211,-73.9162317520526,-73.9162316696665,-73.9161066790083,-73.9161065483886,-73.9161064067709,-73.9159775500327,-73.9142363291455,-73.9138482830903,-73.9131696980579,-73.9125718774385,-73.9113450690157,-73.9097164608149,-73.9088917379157,-73.9080468088052,-73.9074099735685,-73.907300137503,-73.9071670524445,-73.9071225307847,-73.9070686729543,-73.9069304991158,-73.9067302812899,-73.9057242363777,-73.9055774010374,-73.9051805791977,-73.9042188893803,-73.9041685326732,-73.9025965084254,-73.901079709003,-73.900910948234,-73.9007113886511,-73.9006625049975,-73.9006081493443,-73.9005485620062,-73.9004840064317,-73.900414768038,-73.9003411528722,-73.9002634864665,-73.9001821122135,-73.9000973899021,-73.9000096941265,-73.8998251310634,-73.899632578958,-73.8994334853201,-73.8992294476897,-73.8990220996638,-73.898786461428,-73.8987863429133,-73.8987862131798,-73.8985478709664,-73.8985477282389,-73.8985475866269,-73.8983081274275,-73.8983079961665,-73.8983078669028,-73.898069101461,-73.8980689598616,-73.8980688299364,-73.8978323694189,-73.8969118803862,-73.8965110517443,-73.8960293159074,-73.895101334044,-73.8949242170837,-73.8947484799933,-73.8947482794019,-73.8947480902758,-73.8945755791367,-73.8945754485786,-73.8945753186968,-73.8944075965432,-73.8942464489958,-73.8941583550504,-73.8939378054027,-73.8937090565305,-73.893474082341,-73.8932349445219,-73.8930108811507,-73.8927840566608,-73.8925555458947,-73.8923264405576,-73.8917501641674,-73.8913849792518,-73.891138527973,-73.8899345067149,-73.8891031898245,-73.8885228590148,-73.8877019927043],"lat":[40.7342913227586,40.7327442933385,40.7319225785439,40.730601703117,40.7287269714786,40.7284963822676,40.7283421776956,40.7282744399751,40.7283602924179,40.7284030066901,40.7284435111192,40.7284494117285,40.7284974480576,40.728540950784,40.7286103753503,40.7286352540297,40.7286808265212,40.7287413119397,40.7287437302178,40.7288165420463,40.7289062742142,40.7290101589161,40.7293996769841,40.7295158866319,40.7297159303876,40.7300483531401,40.730313093919,40.7305906728702,40.7306713632197,40.7306186957731,40.7305418917538,40.7302827923819,40.7299506191985,40.7296554848453,40.729362383331,40.7293263741385,40.7291781024809,40.7283717202997,40.7279576114015,40.7279245240285,40.7277032066697,40.7274845934406,40.7272695393737,40.7270588540253,40.726187326382,40.7251464341414,40.7244659908253,40.7244359294742,40.7244118357159,40.7238209071637,40.7234854940857,40.7232547486383,40.7226612566289,40.7222890245247,40.722076403898,40.7214866374512,40.7209009226014,40.7202809377529,40.7199767100267,40.7194270756022,40.7188448079169,40.7182766798916,40.7177078818569,40.7174280189449,40.7171481470524,40.7168767739987,40.7165925433462,40.7163149367086,40.7160373287648,40.7154871695649,40.714932235724,40.7147562704477,40.7145749229762,40.7143892338106,40.7142002939749,40.7140092192411,40.7139781313718,40.7139199103773,40.7134931446792,40.7133799614124,40.713294646745,40.7126055390835,40.7118450597847,40.7116338113396,40.7114303226755,40.7112263569445,40.7110228860619,40.7108208540233,40.7106212108104,40.7104216041147,40.7103461644909,40.709850568005,40.7096858418024,40.7092625701052,40.7084923136751,40.7076759187473,40.7075034553001,40.7072727451099,40.707092043384,40.707053550507,40.706874064142,40.7067107912256,40.7065500158478,40.7063924788172,40.7062388976188,40.7061414321087,40.7060456977616,40.7059517784979,40.705859756802,40.7057697131799,40.7056817265627,40.7056361659763,40.705591689885,40.7055496042367,40.7055135695479,40.7050346140336,40.7045614742863,40.7040032402576,40.703926400887,40.7038428266498,40.7037534210224,40.7037262256514,40.7036805227357,40.7034874101538,40.7033486380369,40.7033181986624,40.7030131506169,40.7026730950705,40.7025955017877,40.7019910096105,40.7019769163009,40.7018235547299,40.701651719352,40.7012125133222,40.701213978868,40.7012236592381,40.7013203447589,40.7028328906715,40.7029110743658,40.7028562524738,40.7027477508212,40.7026210537247,40.7025329459159,40.7024450985606,40.7024221897877,40.7024379260682,40.7024848986747,40.7027093527079,40.7027467860454,40.7027872924558,40.702795356548,40.7028117445371,40.70282000485,40.7028120723206,40.7027983351115,40.7027811816812,40.7026977612825,40.7026535745541,40.7025360879046,40.7023189457641,40.7022137363015,40.7021954664947,40.7020944040107,40.7019617486236,40.7018167769618,40.701660727143,40.701495006793,40.701321177326,40.7012043125006,40.7010930557246,40.7009779599717,40.7008241331062,40.699759639585,40.6990230152974,40.6988719840545,40.6987251460306,40.6985835179112,40.6984480637176,40.698257905675,40.6979766243612,40.697868012383,40.6978277570425,40.6977718562824,40.6976889006651,40.6976598743711,40.6975990705662,40.6951465615148,40.6949414841501,40.694746747868,40.6941912952175,40.6912096316943,40.6911467688432,40.691104780826,40.6898725878353,40.6890385511502,40.687863411185,40.6866847490949,40.6856224754499,40.6852936321711,40.6852876279233,40.6851541932134,40.6846405530012,40.6842364542529,40.6850039898045,40.6847001780487,40.6840441779094,40.6834919108878,40.6836701856633,40.6844567900322,40.6850705947104,40.6851328346005,40.6852471462724,40.6852832481706,40.6845084863337,40.6843625985359,40.6840805200677,40.6837918923162,40.6837074215681,40.6834971833575,40.6831968787779,40.682891482754,40.6827583825879,40.6826208667338,40.6825997571336,40.6824798757412,40.6824463593363,40.6823364219728,40.6824032992416,40.6852976980837,40.6878779353556,40.6881838988769,40.6910777200733,40.6915899920378,40.6916121057659,40.6916798589335,40.691807310892,40.6919992313042,40.6924183392061,40.6928487817959,40.6930357122295,40.6932780687472,40.6937040067602,40.6941271555136,40.6950735713309,40.6951481695847,40.6957003714427,40.6959322465276,40.6961187462833,40.6963503058835,40.6965485551254,40.6967505571315,40.6969761436171,40.6971635493117,40.6973991897234,40.6975717504737,40.6978254091374,40.6982552266944,40.6986751051255,40.6995321139707,40.6999380026219,40.7010459695667,40.7014865880167,40.7019231641026,40.7023618912967,40.7034349520267,40.7038734198365,40.7043126385472,40.7047491130351,40.7051894377752,40.7056264446535,40.7058548171301,40.7060655429796,40.7062754946701,40.7062993881245,40.7065029645781,40.7067224690084,40.7069427389294,40.7071473301108,40.7071599694582,40.7073815627365,40.7075979984019,40.7078151343449,40.7080239783973,40.7082572885237,40.708694630124,40.7091287657063,40.7093960967104,40.7105336489583,40.7107354078152,40.7107905585565,40.7110432835344,40.7117820674471,40.7128559543629,40.713394728091,40.7140083126289,40.7141115601475,40.7140828414082,40.7142112760549,40.7148702451401,40.7151380484452,40.7151807081993,40.7152180648467,40.7152976647172,40.7153715283082,40.7154413003412,40.7154797172099,40.7155355679381,40.7155612575952,40.7155751624193,40.7155826723069,40.7155906250634,40.7156050833709,40.715605190892,40.7156166083679,40.7158002637476,40.7160765451724,40.7157731925314,40.7159711638162,40.715971973968,40.7159910729582,40.7160037083407,40.7160187759263,40.7160274246908,40.71603600719,40.7161417663361,40.7161803788276,40.7162097799717,40.716273771146,40.7162774863519,40.7163684819169,40.7163824404941,40.7164832729921,40.7165926441224,40.7166464913915,40.7166678400386,40.7166709329076,40.7168025404294,40.7169521966107,40.7170181562535,40.7171657131289,40.7173132692782,40.717534576144,40.7177615736409,40.7179264880667,40.7180973680073,40.7181303343223,40.7181362588319,40.7181478780773,40.7181570184526,40.7181670448256,40.7181787674966,40.7181905255029,40.7182046434509,40.7182121127338,40.7182231233481,40.7182353960384,40.718246964631,40.7182593970128,40.7182721720399,40.7182865574962,40.7182975661184,40.7183082232171,40.71831959132,40.7183320212145,40.7183433877144,40.7183547553471,40.7183682389092,40.7183820729812,40.7183973391703,40.7184133073472,40.7184310403919,40.7184480900244,40.7184644010261,40.7184832347031,40.7185020412772,40.7185234239441,40.7185422309333,40.7185564535453,40.7185685333973,40.7185809468234,40.7185930262901,40.7186091949689,40.7186202041502,40.7186305006834,40.7186429414071,40.7186550223075,40.7186667516449,40.7186754537725,40.7186868222763,40.7186987046144,40.7187097232995,40.7187230652694,40.718736902037,40.7187505757301,40.7187596373918,40.7187701253544,40.7187814960014,40.7187953624229,40.7188076193319,40.7188172361165,40.7188314635466,40.7188513391333,40.7188684218337,40.7188826190917,40.718899312447,40.7189142467262,40.7189252650638,40.7189382191746,40.7189501902922,40.7189631810636,40.7189740009276,40.7189871533906,40.7189972878325,40.7190074149025,40.71901719088,40.7190292721699,40.719042756787,40.7190594462455,40.7190740003884,40.7190864012686,40.7190988388331,40.7191108879012,40.7191245598485,40.7191350156446,40.7191495686011,40.7191623309926,40.719175481491,40.7191910985112,40.7192074089399,40.7192244294822,40.7192421883453,40.7192599190151,40.7192780018539,40.7193004343509,40.719316409844,40.7193247218527,40.7193410573554,40.7193566449869,40.7193736642934,40.7193928182499,40.7194123315912,40.7194332508259,40.7194538374193,40.7194719284226,40.7194903708206,40.719507740883,40.719521219899,40.7195339792416,40.7195449564344,40.7195600313958,40.7195742153304,40.7195909099942,40.7196057864901,40.7196185476461,40.7196320276382,40.7196462095981,40.7196586186684,40.7196720983735,40.7196862811667,40.7196994003596,40.7197143033273,40.7197302504358,40.7197472681959,40.7197639269418,40.7197799012374,40.7197919490933,40.7198070224651,40.7198220869005,40.719835367974,40.7198397865772,40.7198484739605,40.7198543989012,40.7198618521856,40.719869632252,40.719877168998,40.719887567801,40.7198997437681,40.7199086024905,40.7199164332281,40.7199274442819,40.7199414791543,40.7199541099119,40.7199660006173,40.7199794742312,40.7199904857676,40.7200019829698,40.7200182797627,40.7200306855144,40.7200434423282,40.7200569192833,40.7200671835857,40.7200826056997,40.7200942925855,40.720107410371,40.720118745902,40.7201318652852,40.7201481640782,40.7201637901306,40.7201783365851,40.7201932436058,40.7202063939172,40.7202181228824,40.7202284199522,40.7202383572585,40.7202486828265,40.7202630705003,40.7202747986275,40.7202879239646,40.7202989326132,40.7203129671191,40.720326830581,40.7203392709825,40.7203541782875,40.7203669421816,40.7203808055946,40.7203935789137,40.7204070814068,40.72042680078,40.7204319348471,40.720444365096,40.7204571645759,40.720471000451,40.720485546568,40.7205011739889,40.7205178648278,40.7205316998858,40.7205437784334,40.720554433451,40.720566513021,40.720578043143,40.7205901224704,40.7206039582254,40.7206167571562,40.7206297090789,40.7206439054449,40.7206600550423,40.720670700926,40.7206829504858,40.720694148645,40.7207078227142,40.7207216867196,40.7207360763052,40.7207495913773,40.7207606029131,40.7207739567253,40.7207872743737,40.7207976000511,40.720805954206,40.7208166314732,40.7208258594163,40.7208381411083,40.7208491508514,40.7208608804796,40.7208725994485,40.7208873445919,40.7209013672599,40.7209130641739,40.7209231663586,40.720934329639,40.7209456666592,40.7209594960605,40.720971703495,40.7209835591041,40.7209938534409,40.7210085993485,40.7210224327541,40.7210300562256,40.7210431136707,40.7210528517526,40.7210703894379,40.7210913051902,40.7211028297065,40.7211147150874,40.7211356213442,40.7211526400829,40.7211657605841,40.7211774502829,40.7211920026004,40.7212083295748,40.7212228840697,40.7212392144433,40.7212573120049,40.7212732925262,40.7212860840943,40.7212978127019,40.7213116491726,40.7213239178462,40.7213363580782,40.721347699389,40.7213620804077,40.7213782169194,40.7213876086152,40.7213987762996,40.7214140419827,40.7214294987586,40.7214429858895,40.7214575666773,40.7214708866367,40.7214799276877,40.7214883110749,40.7215004246506,40.7215132202284,40.7215228068952,40.7215387364505,40.721548461807,40.7215582155378,40.7215692848291,40.7215804172759,40.7215901163224,40.7216022569082,40.7216175596433,40.7216321686354,40.7216471094742,40.7216623827638,40.7216794670548,40.7216892429163,40.7217059357268,40.7217190587326,40.7217300637845,40.7217424730548,40.7217595203997,40.721771762892,40.7217843668196,40.721793819552,40.7218028325355,40.7218130706751,40.7218203535701,40.7218328242946,40.7218426018604,40.7218558694699,40.7218663119487,40.7218749551548,40.721881282496,40.7218880792604,40.721893630779,40.7218989453284,40.7219041959665,40.7219097434515,40.7219139834344,40.7219213156388,40.7219268460909,40.7219334729825,40.7219459099029,40.7219601388115,40.7219750876531,40.7219871697155,40.7219988898424,40.722011330844,40.722023771005,40.7220365374466,40.7220514743011,40.7220653383421,40.722074564703,40.7220872042169,40.7221012312038,40.7221136733582,40.7221275112945,40.7221438825154,40.722153298207,40.72216307263,40.7221811997159,40.7221947057008,40.722205003847,40.7222201123782,40.7222313113264,40.7222460600668,40.7222558351109,40.7222661331614,40.7222769072059,40.7222787352034,40.7222922457367,40.7223053697301,40.7223204636577,40.7223353393183,40.7223519953721,40.7223650034602,40.7223658321519,40.7223775161087,40.7223881386189,40.7224024601657,40.7224152157483,40.7224300866861,40.7224463891855,40.7224680019552,40.7224774635794,40.7224948013146,40.7225096722333,40.7225234723397,40.722538703396,40.7225553564294,40.7225741248201,40.7225953606701,40.7226065325147,40.7226227175155,40.7226460950369,40.7226579420273,40.7226676907579,40.7226861001389,40.7227038244263,40.7227208019977,40.7227349631508,40.7227491511992,40.722762952075,40.7227764280346,40.7227941264031,40.7228143180768,40.7228240579234,40.7228435095391,40.7228651334108,40.7228762699353,40.7228957610553,40.7229127660928,40.722929752552,40.722946054953,40.7229648135992,40.7229755954193,40.7229856937745,40.7229947211172,40.723011696603,40.7230308241603,40.7230408878424,40.723049232247,40.7230637415462,40.7230817987128,40.7230932942954,40.7231048173059,40.7231166730621,40.7231296006784,40.7231411234785,40.7231529799151,40.7231648544595,40.7231756399439,40.7231864508472,40.723199018939,40.7232140893921,40.7232284396092,40.7232388910117,40.7232536840394,40.7232770654935,40.7232910562563,40.7233057676532,40.7233201188759,40.7233348300748,40.7233466873753,40.7233622719715,40.7233761001937,40.723390611917,40.7234062035669,40.7234246126271,40.7234444528188,40.723459674456,40.7234690630595,40.7234812676613,40.723494354379,40.7235069192211,40.7235189621101,40.723530459755,40.7235409119756,40.7235522424996,40.7235641714647,40.7235720584231,40.7235899754836,40.7236038402738,40.723604752999,40.7236044667283,40.7236030432407,40.7236018445786,40.7236013103821,40.7236012441627,40.7236016997782,40.7236026238256,40.7236038452103,40.7236051974563,40.7236068026992,40.7236080490115,40.723609601547,40.7236116793442,40.7236127071062,40.7236145412503,40.7236171783594,40.723618515739,40.7236192149257,40.723619560876,40.7236191071894,40.7236180245259,40.723617275953,40.7236154435351,40.7236140892843,40.7236142116618,40.72361521396,40.7236184913368,40.7236200754856,40.7236217115429,40.7236234534074,40.7236247006984,40.723626363914,40.723628295694,40.7236301486567,40.7236317324747,40.7236333948129,40.7236348154598,40.7236361406287,40.7236366210033,40.7236368253762,40.7236365440291,40.7236357856678,40.7236355055352,40.7236361521952,40.7236368256964,40.7236377497403,40.7236390242175,40.7236406557291,40.7236422338696,40.7236443347365,40.7236463960741,40.7236477048169,40.7236490041805,40.7236511587291,40.7236532539982,40.7236536297131,40.7236579846143,40.7236593064968,40.7236579785889,40.7236562643126,40.7236564432505,40.7236575318848,40.7236609212247,40.723664804618,40.7236692924136,40.7236691516603,40.723666224953,40.7236630847757,40.7236600839242,40.7236570744221,40.7236539929826,40.7236488194938,40.7236448521326,40.723642008199,40.7236400471486,40.7236378883461,40.7236359002829,40.7236337956898,40.7236311705274,40.7236272926314,40.7236226328096,40.7236178721058,40.7236137653275,40.7236098214467,40.7236075042198,40.7236070773924,40.7236076130918,40.723608371823,40.7236091228116,40.7236098217417,40.7236101426968,40.7236115486633,40.7236133437343,40.7236155263934,40.7236169682435,40.7236204922876,40.723624356631,40.7236393865535,40.7236535458482,40.7236698372912,40.7236822085499,40.723690185029,40.7236968989814,40.723703692665,40.7237075825522,40.7237088309248,40.7237075570188,40.7237036967349,40.723697419505,40.7236937254169,40.7236899576284,40.7236865967459,40.723682578502,40.7236785599051,40.7236752806941,40.7236722272849,40.7236658673453,40.7236614601625,40.723655896822,40.7236496050295,40.7236436577778,40.7236387645882,40.7236340786242,40.7236295733562,40.7236262952568,40.7236225217573,40.723618640678,40.7236116548924,40.7236034633933,40.7235970302493,40.7235922077767,40.7235858801544,40.7235793637572,40.7235699900936,40.7235614631165,40.7235521624838,40.723546225817,40.7235413603507,40.7235392382727,40.7235322591289,40.7235244437939,40.7235190564153,40.7235133088769,40.7235073906012,40.7234978821902,40.7234863115323,40.7234800448533,40.7234689358169,40.7234570882837,40.723443683702,40.7234291532576,40.7234186217083,40.7234105938808,40.7234044618152,40.723401838925,40.7233993865722,40.7233979618206,40.7233967651662,40.7233944223199,40.7233922684519,40.7233871426294,40.7233841155777,40.7233778377884,40.7233747574826,40.7233725787283,40.7233679524013,40.7233629938171,40.7233578451672,40.7233490110964,40.7233462274564,40.7233428667039,40.7233398398359,40.7233372984156,40.7233302301171,40.7233238504937,40.7233197776022,40.7233143788609,40.7233120300603,40.7233100953381,40.7233098127705,40.723311885553,40.7233168236427,40.7233299080729,40.7233417606573,40.7233543167777,40.7233666928247,40.7233803294613,40.7233927347634,40.7234068882702,40.7234192945155,40.7234313403036,40.7234430355202,40.7234625154055,40.7234710292219,40.7234740359973,40.7234844582954,40.7235021511432,40.7235194832259,40.7235304846822,40.723532703953,40.7235331528775,40.7235320775406,40.7235266565839,40.7235272026799,40.7235342130438,40.7235434557455,40.7235479405559,40.7235542420954,40.7235544855734,40.7236054336764,40.7236811133181,40.7236607855359,40.7229403423924,40.7227430484489,40.722524493285,40.7222706962186,40.72200550648,40.7220756406003,40.7220757667866,40.7220758660017,40.7221369499629,40.7221369855947,40.7221873737177,40.7221874093316,40.722187436076,40.7222258244747,40.7222258600627,40.7222258862613,40.7222516912755,40.7227736942151,40.7228984123538,40.7230815258964,40.7232396349499,40.7241821699518,40.7254459561267,40.7260684259766,40.7267338879102,40.7272087388807,40.7272943699146,40.7273886537873,40.7274247284378,40.7274665227726,40.7275760302747,40.7277326828304,40.7285200195862,40.7286366843154,40.7289565769738,40.7301252689164,40.7301865910331,40.7321044283459,40.7339146347793,40.7341260367359,40.7343587278039,40.7344225976226,40.73448385508,40.7345422293309,40.7345974622771,40.7346493097091,40.7346975426484,40.7347419475685,40.7347823281338,40.7348185058024,40.7348503206148,40.7349313950196,40.7350023583031,40.7350625906685,40.7351115982715,40.7351490839862,40.7351767929127,40.7351768109014,40.7351768201689,40.7351919009261,40.7351919101819,40.7351919100571,40.735194184441,40.7351941843251,40.7351941743269,40.7351836166265,40.7351836082923,40.7351835987958,40.7351603541823,40.7350866013284,40.7350967415428,40.7350178916089,40.7350211830895,40.7350077216808,40.7349828150073,40.7349827873496,40.7349827514936,40.7349465550403,40.7349465286191,40.7349464923144,40.7348993231489,40.7348418131671,40.7348077916827,40.7347262100445,40.7346574527841,40.7346021780483,40.7345608120557,40.7345235751979,40.734495962249,40.7344781263096,40.7344701402597,40.7344848097319,40.734504989054,40.7345129691644,40.7345599567433,40.7345923964625,40.7345311600154,40.7342913227586]}]],[[{"lng":[-73.961284507884,-73.9612826200821,-73.9613418424428,-73.9614047239524,-73.9614017191776,-73.9616867065907,-73.9619102874724,-73.9618858636067,-73.961959204528,-73.9620249626652,-73.9619779494498,-73.9622147445928,-73.9624196427876,-73.9624854657924,-73.9625493395233,-73.9624778771383,-73.9624515741811,-73.9622673536835,-73.9622522887658,-73.9621946350352,-73.9622015691589,-73.9619440992803,-73.9617072421667,-73.9613527907771,-73.961284507884],"lat":[40.7301590617017,40.7300610250103,40.7300636775881,40.730061052264,40.7301110261134,40.7300818688011,40.7299625806154,40.7299525656679,40.7298596684481,40.7298854222378,40.7299440187498,40.7299169357768,40.7298012081141,40.7297111676151,40.7297440678466,40.7298369660556,40.7298283801201,40.7299312482395,40.7299855669819,40.7299759737556,40.7299540992371,40.7299868943748,40.7301211947923,40.7301519570532,40.7301590617017]}],[{"lng":[-73.9619703936979,-73.9619704078395,-73.9617128948076,-73.9616984824574,-73.9616744677247,-73.9619905022661,-73.961998003523,-73.962900068031,-73.9629025856754,-73.9632007653757,-73.96319829673,-73.9632809866388,-73.9632809740348,-73.9635591199135,-73.9635516415297,-73.9636593923288,-73.9636993813906,-73.9635841096573,-73.963566616573,-73.9632809572295,-73.9632934316184,-73.9629075478494,-73.962915054783,-73.9619703936979],"lat":[40.7315771116855,40.73155233267,40.7315661138451,40.7315323413948,40.7314812535528,40.7314665657085,40.7314932531542,40.7314478016774,40.7314287411495,40.7314174006247,40.7313506869078,40.7313430888365,40.731365962071,40.7313355533916,40.7312631197445,40.7312498114821,40.7314366195573,40.7314575502823,40.7313717711523,40.7313964596052,40.7314955793285,40.7315164229639,40.7315335801009,40.7315771116855]}],[{"lng":[-73.9605173253627,-73.9605685685849,-73.9606720464549,-73.9606486370075,-73.9605173253627],"lat":[40.744105341081,40.7440296660829,40.7440512158562,40.7441303171115,40.744105341081]}],[{"lng":[-73.964212303957,-73.9642736475246,-73.9643372932239,-73.9643776540431,-73.9644452275265,-73.9645831842695,-73.9645870239943,-73.9645451819259,-73.964475436577,-73.9643744377219,-73.9643375867175,-73.9642725620221,-73.9642161668237,-73.9641598028843,-73.9641251448618,-73.964133829335,-73.9642119246276,-73.964212303957],"lat":[40.7466043179741,40.7465418445525,40.7465457265932,40.7464950880389,40.7464104252606,40.7464544006734,40.7465158985447,40.746564150473,40.7466408331979,40.7467045306431,40.7467348481814,40.7467513080841,40.746837000831,40.7468655473596,40.7468457606054,40.7468127961655,40.746666676803,40.7466043179741]}],[{"lng":[-73.9576357683628,-73.957493440047,-73.9575188932101,-73.9576668047197,-73.9577265433446,-73.9578395394205,-73.9576883184342,-73.9575765046784,-73.9576357683628],"lat":[40.748406347465,40.7483364647629,40.7483036195923,40.7483734790189,40.7482940618958,40.7483380033753,40.7485350268717,40.7484885253783,40.748406347465]}],[{"lng":[-73.9621355905809,-73.9621938183841,-73.9622312516559,-73.9626870304654,-73.9628972920254,-73.9628689676923,-73.9631607404974,-73.9637357228317,-73.9647095284111,-73.9649444475547,-73.9653240558648,-73.9679127299439,-73.9681189339928,-73.9681737610107,-73.9682357475346,-73.9683651932415,-73.9682317171579,-73.9682962211324,-73.9682981145153,-73.968301910059,-73.9683161371577,-73.9683261043342,-73.9683469659132,-73.9683611884478,-73.9684000831416,-73.9684313915879,-73.9684636369071,-73.9684769194294,-73.9685006403585,-73.9685148595502,-73.9685347900078,-73.968544278662,-73.9685888522455,-73.9685916956957,-73.9686002347227,-73.9686097199753,-73.9686173087695,-73.9686391246467,-73.9686637979664,-73.9686704342135,-73.9686922519053,-73.9687045808976,-73.9687107654443,-73.9687527124037,-73.968943011093,-73.9689667053751,-73.9689736684949,-73.968988992317,-73.9689998159544,-73.9690030281009,-73.9690164175405,-73.9690196111592,-73.9690719333325,-73.9691309611885,-73.9692113592128,-73.9692343217233,-73.9692470758419,-73.969250288817,-73.9693259143739,-73.9693322802656,-73.9693392445918,-73.9693829064479,-73.9694002232787,-73.9694008665211,-73.9694175339956,-73.9694329238989,-73.9694621003831,-73.969520461252,-73.9695505965864,-73.9695974026117,-73.9696237058341,-73.9696320418026,-73.9696948777757,-73.9696967884592,-73.9698756140306,-73.9699057526526,-73.9699122797576,-73.9699313961495,-73.9699270495905,-73.9699737702628,-73.970047589049,-73.9700912317571,-73.9701296257695,-73.9702160228864,-73.9703393116125,-73.9703257132142,-73.970325719311,-73.9703781194052,-73.9704425548898,-73.9704606370362,-73.9704724057644,-73.9705056003266,-73.9705687722909,-73.9706238151065,-73.9707883477664,-73.9708570443435,-73.9708768823386,-73.9708896337672,-73.9708974206771,-73.9709094613216,-73.9709172484544,-73.9709285803236,-73.9709406296042,-73.9709822271237,-73.9710139239607,-73.9711143812398,-73.9707827612868,-73.9707775771611,-73.9707583395368,-73.9707508495514,-73.9707182349404,-73.9707057872082,-73.9707031753169,-73.9707227747486,-73.9707425727203,-73.9707506138201,-73.9707612352471,-73.9707920969472,-73.970798929893,-73.9708358740414,-73.9708359548652,-73.9708735785134,-73.9709596499281,-73.9709630019347,-73.9711734675316,-73.9711819357608,-73.9712061650298,-73.9712736246231,-73.9713575294187,-73.9712342398151,-73.9712054630197,-73.9712810183168,-73.9713556340918,-73.9714942127042,-73.9716377224042,-73.9716792120082,-73.9718888891307,-73.9717626132706,-73.9717405971582,-73.9717750124804,-73.9719595585625,-73.9720492631671,-73.972069496828,-73.9721016398068,-73.9721526357218,-73.9721980481378,-73.972286182485,-73.9722899209922,-73.9722128259938,-73.972195672753,-73.972182685701,-73.9721684838787,-73.9721647736866,-73.9721654976082,-73.972215254259,-73.9722251561434,-73.9722350431717,-73.9722356621101,-73.9721964164779,-73.9722168542233,-73.9722675364213,-73.9722700133416,-73.9722533231916,-73.9722483780364,-73.9722997959086,-73.9723103043909,-73.9723314172173,-73.9724388898142,-73.9726574380304,-73.9726552896889,-73.9726506037968,-73.9726443106242,-73.9726451272195,-73.9726467483074,-73.9726325645517,-73.9726310099864,-73.9726278745753,-73.9726263054338,-73.9726279218981,-73.9726208476636,-73.9726192965623,-73.9726275395251,-73.9726388480015,-73.9726383333126,-73.9726280732874,-73.972624526085,-73.9726327464414,-73.9726332710736,-73.9726225471807,-73.9726194686601,-73.972614740173,-73.9726060999749,-73.9726187294744,-73.9726124265646,-73.9726045730769,-73.9726140422564,-73.9726062119662,-73.9725903822468,-73.9725829245611,-73.9725797979851,-73.9725752587103,-73.9725562261096,-73.9725633368431,-73.9724899417474,-73.9725101678602,-73.9728693917847,-73.9744138581653,-73.9744597507046,-73.9744167735479,-73.974411543466,-73.9743995234331,-73.974026921043,-73.9740467925448,-73.9744293236688,-73.9744277547443,-73.9744664704729,-73.9745037601323,-73.974474717553,-73.9744408292406,-73.9744337287996,-73.9741406201839,-73.9741512763478,-73.9744472233676,-73.9744482861283,-73.9744782818308,-73.9745048828594,-73.974514597726,-73.9745079393816,-73.9744885407906,-73.9744507771782,-73.9744623333546,-73.9742498246837,-73.974246306583,-73.974258667755,-73.9744704050787,-73.9744696202373,-73.9744777543119,-73.9744715494167,-73.9744653776737,-73.974392239182,-73.974391854932,-73.974263758843,-73.9742647479944,-73.9741923370844,-73.9741895600019,-73.9741574743053,-73.9741461652347,-73.9740928793795,-73.9740900799467,-73.9734186958256,-73.9734388180185,-73.9732803029099,-73.9730569871205,-73.9728066171046,-73.9729367397369,-73.9729303192646,-73.9727630838035,-73.9729969520248,-73.9729639526809,-73.9729318560978,-73.9728851285693,-73.9728640311616,-73.9728374594346,-73.9729452075868,-73.972967197858,-73.9729451903181,-73.9729956023659,-73.9729708363561,-73.9730029119927,-73.9730368471371,-73.9732989504614,-73.9733218745816,-73.9733163834515,-73.9732989767244,-73.9732788163409,-73.9732724114406,-73.9732770085148,-73.9732962736297,-73.9733292904358,-73.9733687094268,-73.9734182124835,-73.9734594591503,-73.973522708343,-73.9735447288396,-73.9744406508259,-73.9744261618416,-73.9744112671412,-73.9743906308142,-73.9743741794684,-73.9743505499802,-73.9743155973787,-73.9742714792683,-73.9742554346787,-73.9742119222655,-73.9741831728198,-73.974169179789,-73.9741511084035,-73.9741059171423,-73.9740601621633,-73.9740217458826,-73.9739923708974,-73.9739590502971,-73.9739432192494,-73.9739353135699,-73.9739070269519,-73.9739013771137,-73.9738912038226,-73.973866318656,-73.9738629295861,-73.9738527519364,-73.9738448385489,-73.9738652080241,-73.9738573003649,-73.9738414596266,-73.9738493738128,-73.9738312684669,-73.9738097684656,-73.9737837578338,-73.9738029884743,-73.9737837686717,-73.9737645264947,-73.9737407689937,-73.9737271870777,-73.9737079516958,-73.9736898498261,-73.9736762757606,-73.9736943809861,-73.9736921285981,-73.9737158891425,-73.9737260735636,-73.9737373976232,-73.9737577603273,-73.9737781392266,-73.9738052975527,-73.9738188717185,-73.9738403679705,-73.9738720617402,-73.9738681077621,-73.9737703082617,-73.9736770279925,-73.9736473576662,-73.9736273640125,-73.9736083334664,-73.9735396928971,-73.9735213791428,-73.9734132173086,-73.9733818141015,-73.973365910007,-73.9733406468868,-73.9733171542638,-73.9732832111114,-73.9732362541794,-73.9732001291541,-73.973145927916,-73.9730985814847,-73.9730530485382,-73.9730060597536,-73.9729192910019,-73.9728321556286,-73.9727461164317,-73.9726427049241,-73.9725599000729,-73.9724797005302,-73.972459364719,-73.9723327743952,-73.9722401857878,-73.9722337012091,-73.9720891859023,-73.9720538521498,-73.9720102603346,-73.9719634030125,-73.9719023851281,-73.9718560894905,-73.9718299284167,-73.9717482235701,-73.9717449479008,-73.9717002903813,-73.9716272999856,-73.9715771944183,-73.9715188262802,-73.9715081603157,-73.9714799490723,-73.9714571612231,-73.9714398156672,-73.9714322181422,-73.9714213920824,-73.9714123510978,-73.9714065967207,-73.9714061790852,-73.9714194637928,-73.9714271844355,-73.9714526955966,-73.9714566218295,-73.9714734381999,-73.9715104844795,-73.9715555351495,-73.971569316471,-73.9715727876014,-73.9715896514999,-73.97161872707,-73.9716358615215,-73.9716516007559,-73.9716851486658,-73.9715860410633,-73.9715611436591,-73.9715368659274,-73.9715207678963,-73.9715128218126,-73.9714926005824,-73.9714903909286,-73.9716269727173,-73.9717960198696,-73.9718567123771,-73.9719124415182,-73.9719768505994,-73.9720501541323,-73.9732979683815,-73.9756678261324,-73.9758124489941,-73.9761963235918,-73.9769043637167,-73.9775384383504,-73.9780269795085,-73.9791080389467,-73.9799210997628,-73.9803400750025,-73.9816665703113,-73.9819091150614,-73.9824687621402,-73.9825562923175,-73.9829644066345,-73.9832146714656,-73.9834664420825,-73.9835605212129,-73.984945506,-73.9871804967054,-73.9875719527018,-73.9887793168407,-73.9882860036744,-73.987816450892,-73.9873871843564,-73.9869611550926,-73.9865350000197,-73.9876064539275,-73.9871753728691,-73.9872886374606,-73.9868534526938,-73.9872282000595,-73.9873015486895,-73.9870359272105,-73.986960482836,-73.9866496967712,-73.9864719497867,-73.9852322461129,-73.9847423100253,-73.9842577192636,-73.9838113565054,-73.9833596221309,-73.9832796584488,-73.9829118010137,-73.982455207304,-73.9820087537404,-73.981559970852,-73.9811085987999,-73.9806584262387,-73.9802097127826,-73.9797234650314,-73.9812591988635,-73.981340686616,-73.9814328194381,-73.9829569102128,-73.9824721204708,-73.9820246450754,-73.98157269673,-73.9811232286508,-73.9806734524911,-73.9802208997001,-73.9787064217339,-73.9786072413417,-73.9784850338427,-73.9769857072833,-73.9765348538745,-73.9760482492897,-73.9755580087778,-73.9751026616537,-73.9746479807628,-73.9741893717431,-73.9737341050976,-73.9732755973791,-73.9728196744526,-73.9723627592047,-73.9719067600844,-73.9714504804381,-73.9709937066437,-73.9705341753114,-73.970081008278,-73.9696250012669,-73.9691324742657,-73.9686422611989,-73.9681868780361,-73.9665833842226,-73.9643135356523,-73.9635561893216,-73.963080735288,-73.9619657361163,-73.9597218041865,-73.9590368100845,-73.958934485137,-73.9588635886981,-73.958777908227,-73.9590700303121,-73.9591726424884,-73.9591810321999,-73.9596577087666,-73.9596640030011,-73.9600390099062,-73.9603645514082,-73.9606563818047,-73.9607970991498,-73.9607972298593,-73.9610279086717,-73.9616292753492,-73.9621355905809],"lat":[40.7545732314733,40.7545043151533,40.7545221304219,40.7540043732867,40.7537655170943,40.7537425091569,40.7534122073282,40.7527837757771,40.7517194150958,40.751462643217,40.751047718272,40.7479709356422,40.7477258297499,40.7476667537418,40.7475912183926,40.7474334946201,40.7473684764892,40.7472956513671,40.7472833950029,40.7472732992446,40.7472740243593,40.7472520340963,40.7472412183101,40.7472181449838,40.7471669539643,40.7471294566203,40.7470941284857,40.7470725008057,40.7470443845072,40.7470328439981,40.7470003977796,40.7469881423127,40.7469434435808,40.7469333470503,40.7469210913198,40.7469146031031,40.7468994552753,40.7468792741441,40.7468468198124,40.74683600998,40.7468086079577,40.7468006827962,40.7467882639172,40.7467427152167,40.7465183356965,40.7465305002969,40.7465290068339,40.7465057914948,40.746501935275,40.7464908083793,40.7464811520863,40.7464724389026,40.7464129830064,40.7463407153067,40.7462445153039,40.7462222840115,40.7462077819937,40.7461961714427,40.7461040877104,40.7461016723375,40.7460926560884,40.746035949025,40.7460208432655,40.74601402713,40.745996966332,40.7459769887287,40.7459445776336,40.7458690411165,40.7458388276936,40.7457827841118,40.7457467167945,40.745743305646,40.745666796891,40.745657000293,40.7454447891377,40.7454582051452,40.7454517594362,40.7454630019199,40.745467792035,40.7454957474306,40.7454028612993,40.745351129151,40.7453053665944,40.7452005790328,40.7450496320225,40.7450369494644,40.7450232614002,40.7449523055833,40.7448703765122,40.7448647433907,40.7448662417477,40.7448237642593,40.7447318653061,40.7446564262101,40.7444062176904,40.7444326373972,40.744445573431,40.7444477297019,40.7444547367798,40.7444563520942,40.7444633603434,40.7444633632042,40.7444714440254,40.7444076347199,40.7443586148051,40.7442043609325,40.7440472468869,40.7440466247194,40.7440391903824,40.7440298046648,40.7440169278482,40.7440025619868,40.7439904949088,40.7439695157213,40.7439483246601,40.7439486336106,40.7439421076417,40.7439560099325,40.7439527970038,40.7439696722381,40.743969703586,40.7439876747694,40.7440256969871,40.7440236727749,40.7441075350083,40.7441032327079,40.7440660298467,40.7439647484236,40.7438384553595,40.7437846461903,40.7437715103013,40.7436519420514,40.7435396493495,40.7433346744651,40.7431172009847,40.7430544640598,40.742724819853,40.7426726715347,40.7426635800115,40.7426159121446,40.7423379215437,40.7418877537763,40.7417889059348,40.741623202061,40.7413885876013,40.7411446686918,40.7407382735764,40.7407210390318,40.7407116636083,40.7407095794614,40.7407062799096,40.7406931203005,40.7406757221292,40.74067216505,40.7404265635194,40.7404166969312,40.740413403402,40.7404054152252,40.7404025792529,40.7403076250616,40.7403137432772,40.7403085743457,40.7403001055548,40.7402911718587,40.740034962743,40.7400185126749,40.7400109081997,40.7400217499733,40.739222754277,40.7391782684801,40.7390582657156,40.7390174623353,40.738958668311,40.7388458715124,40.7387894695502,40.7387402650081,40.7387090614696,40.7386658640845,40.7385938691686,40.7385206654936,40.738463068046,40.7384003859874,40.7383953097772,40.7383796859765,40.7383679672454,40.738243363457,40.7382324242622,40.7382238332985,40.7382170682118,40.738044278245,40.7380298693481,40.7379386722888,40.7379146768007,40.7378978725717,40.7378222730757,40.7377982763333,40.7376662775704,40.7367696548423,40.7367446845935,40.7366906890767,40.7366465089315,40.7364614855275,40.7364458816321,40.7358032801077,40.7357871298597,40.7357708612856,40.736414393859,40.7362940197184,40.7362777261068,40.7362852790468,40.7362840835871,40.7361257672455,40.7360999294321,40.7362606334915,40.7362661990414,40.7362784568299,40.7360645884441,40.736062380713,40.7360504791544,40.736053716367,40.7359556566648,40.7359337926681,40.736033472954,40.7360377923566,40.7360441854511,40.7360422810393,40.7358945984113,40.7357969457724,40.7358756802464,40.7358691299667,40.7358311445682,40.73579718202,40.7357801104559,40.7357662681639,40.7357978722552,40.7357878680719,40.7357878616661,40.735727223758,40.7356668860637,40.7356675345683,40.7356719481347,40.7356714742932,40.7356758766068,40.7356801267981,40.7356599127694,40.7356578419828,40.7356716215104,40.7356407250289,40.7356446542345,40.7353677373002,40.7353412178141,40.735273365428,40.7351774534156,40.7355239185212,40.7355992492997,40.7356076143967,40.7355050874736,40.7351865068911,40.7351690661774,40.735205312369,40.7351802039019,40.7352122670153,40.7351997167045,40.7350651700712,40.7350784307669,40.7351077005132,40.7351279379832,40.7351572169713,40.7351725600353,40.7351279476476,40.7352423550771,40.7352019186648,40.7351963427821,40.7351768158837,40.7351475274143,40.7351189338515,40.7350791957984,40.7350408566426,40.7350108778943,40.7349892747627,40.7349711581611,40.7349683768512,40.734975360847,40.7349443261015,40.7353167719006,40.7352342191836,40.7351782459545,40.7350921329331,40.7350306363395,40.7349423126339,40.7348036771935,40.7346306089814,40.7345668858633,40.7344058689429,40.7343009569165,40.7342397122951,40.7341639661661,40.7339935435475,40.7338110724424,40.7336638939344,40.7335545747563,40.7334211655385,40.7334030888633,40.733366076784,40.7333497166083,40.733327337305,40.7333092619045,40.7333109760868,40.7332911823961,40.7332825714011,40.7332653611138,40.7332464280397,40.7332163036386,40.7332197403656,40.7332326551063,40.7332455651092,40.733248999373,40.7332274812081,40.7332119875398,40.7331999343244,40.7332128433879,40.7332093889371,40.7332197143509,40.733213685205,40.7332188506035,40.7332059338881,40.733195609011,40.7331740962501,40.7331697967472,40.7331594705595,40.7331431193724,40.7331396848629,40.7331241914603,40.733120757987,40.7330992476546,40.7331035562959,40.7330949548067,40.7330656871956,40.7326884461769,40.7323102307488,40.732175493264,40.7321074456079,40.7320426897297,40.7317643328235,40.7316901647813,40.7312824164287,40.7312360239194,40.7312200199484,40.731183041662,40.7311579271731,40.7311126759086,40.731056926741,40.7310166323901,40.7309608809961,40.7309136798907,40.730867303253,40.7308231324131,40.7307502415027,40.7306814808071,40.7306058319469,40.7305235378074,40.7304580936181,40.7304008073629,40.7303863293777,40.7302965724682,40.7302304976386,40.7302256778432,40.7301183570417,40.7300866504325,40.7300451714876,40.7300003772175,40.7299307086445,40.7298755502673,40.7298456919728,40.7297420145446,40.7297345485885,40.729665702454,40.729557884146,40.7294691361353,40.7293513617402,40.7293239664924,40.7292495771959,40.729169407558,40.7290958498645,40.7290636190442,40.7289958439723,40.7288798560217,40.7287944713058,40.7287187642511,40.7285688275441,40.728485825885,40.7283414333132,40.7283192380143,40.7282092559281,40.7280027634041,40.7277031085981,40.7276937671985,40.7276459197677,40.7276400336933,40.7276505581858,40.7276479741213,40.7276432125347,40.7274058866366,40.7273969330527,40.7273946882477,40.7273929651008,40.7273861657371,40.7273743080786,40.7273731233514,40.7273500976074,40.7266284529969,40.7267136796566,40.7267586854661,40.7267910087674,40.7268303562017,40.7268809467975,40.72742800886,40.7284625320068,40.7285197676225,40.7286619765265,40.728957824278,40.7292262479172,40.7294330591074,40.7299105584781,40.7302622052087,40.7304424608738,40.7309985475813,40.7310951283115,40.7313148847332,40.7313501340519,40.7315208425476,40.7316241682911,40.731731080616,40.7317702249338,40.732349672818,40.7332921477617,40.7334569906786,40.7339653997385,40.7346590025307,40.7352922810599,40.7358789328976,40.736464342419,40.7370500104712,40.7374978246478,40.7380841334007,40.7381307864771,40.7387147516696,40.7388709785074,40.7389030260365,40.7392663785494,40.7392355272563,40.7391009115229,40.7393628214297,40.738840230795,40.7395103601641,40.7401685929103,40.7407898806718,40.7414121661736,40.7415217628685,40.7420259399277,40.7426469600848,40.7432646208938,40.7438818838497,40.7444982793065,40.7451158253887,40.7457333623706,40.7464028758359,40.7470457052569,40.7470786636824,40.7471197779358,40.7477643531884,40.7484315019191,40.749049540406,40.7496680890156,40.750282458774,40.7509051014574,40.7515219796268,40.7508846466341,40.7508424848914,40.7507882418086,40.7501569592558,40.7507755069916,40.7514413933756,40.7521161830587,40.7527413795409,40.7533671226279,40.753993511311,40.7546187736035,40.7552435380833,40.7558705520048,40.7564977256586,40.7571246738538,40.7577492320373,40.7583733305535,40.7590006498643,40.7596249069017,40.7602514400397,40.7609291906075,40.7615999606762,40.7622268213259,40.7615509355766,40.7605992313504,40.7602808185822,40.7600831637403,40.7596194607855,40.7586630636816,40.7583837826046,40.7583351554485,40.7583060704377,40.7582709208488,40.7579390980203,40.757864780394,40.7578561110523,40.7572601451233,40.7572114121869,40.7567253502389,40.7562694111334,40.7559231495502,40.7558047727407,40.755804655852,40.7556105845791,40.7551523842592,40.7545732314733]}]],[[{"lng":[-73.9240590973699,-73.9240401133402,-73.9231393634936,-73.9222346647762,-73.9218188030682,-73.9215460162964,-73.9212207352637,-73.9211202010852,-73.9207485304976,-73.9218918463265,-73.9223369695204,-73.9228621886442,-73.923062441265,-73.9238514837559,-73.924169050099,-73.9249070671207,-73.9251376222063,-73.9259618393912,-73.9260893009301,-73.9266480844634,-73.9281093220348,-73.928737731971,-73.9297999423443,-73.930236889214,-73.931155339243,-73.9317287178306,-73.9326978492492,-73.9335226266566,-73.9339509297254,-73.9353365296369,-73.9369807406091,-73.9372906345065,-73.937378979284,-73.9375289602967,-73.9376549335342,-73.9381159247666,-73.9382713952967,-73.938365196089,-73.938868641261,-73.9395100827194,-73.9398249573838,-73.9400171205594,-73.9402056390494,-73.9404205787432,-73.9419307881624,-73.9437235275685,-73.9443878859653,-73.9446176611153,-73.9463155753173,-73.9471276214676,-73.9472480870593,-73.9481322539088,-73.9497937934865,-73.9500909464941,-73.9510111210262,-73.9513727858213,-73.9515373886443,-73.9517725790113,-73.9519516224498,-73.9525480011187,-73.9533700073659,-73.9542905331819,-73.9551837082092,-73.9560745618457,-73.9570199312341,-73.9579593822098,-73.9588587462741,-73.9601968885747,-73.9610510070001,-73.9618983782424,-73.9623307288082,-73.9623590331906,-73.9623976909045,-73.962482959087,-73.9628396371634,-73.9623657998502,-73.9621797815518,-73.9625193039367,-73.9625499252884,-73.9631825209575,-73.9638688939085,-73.9645184480918,-73.9652043896813,-73.9658741864341,-73.9660741357412,-73.9665374718372,-73.9666697024391,-73.9672096204262,-73.9676154779079,-73.9679513912622,-73.9683893374683,-73.9692929641454,-73.9696225211887,-73.9698486482354,-73.9698889946892,-73.9699419663263,-73.9696148570143,-73.9696054133035,-73.96968584951,-73.9699926916954,-73.9700990269547,-73.9700128529068,-73.9699407692469,-73.9698521150036,-73.9696843672288,-73.9696310612746,-73.969737433141,-73.969812412881,-73.9697891849518,-73.9696923082645,-73.9694180924718,-73.969385311673,-73.9698257281511,-73.9698093487901,-73.9697119420397,-73.9696620679486,-73.969554331394,-73.9693170560697,-73.9692856264722,-73.969234929313,-73.969291015522,-73.9692335267394,-73.9691448322554,-73.9690958002747,-73.9690797859159,-73.9688847322085,-73.9688659155737,-73.9688161207987,-73.9688653751136,-73.968838175985,-73.9689407930188,-73.9689246627715,-73.968905972631,-73.9688959500675,-73.9688724852357,-73.9688371173459,-73.9688244978786,-73.9688069333314,-73.9687838634211,-73.9687319475613,-73.9687224361543,-73.9687169871728,-73.9686660573397,-73.9685438824263,-73.9684984755434,-73.9684697334704,-73.9684729800564,-73.9684540558431,-73.9684703137231,-73.9685715752624,-73.9685067261952,-73.9688482866971,-73.9683912521389,-73.9680083068735,-73.9676544824914,-73.9673639169947,-73.9672923533356,-73.9672440434898,-73.9672633138167,-73.9671135428995,-73.9671515999891,-73.967267984221,-73.9667684172985,-73.9665969026662,-73.9671834322379,-73.9671928262696,-73.9673074154044,-73.9672301330496,-73.967182436973,-73.9670686768916,-73.9670909626731,-73.9671510117258,-73.966562418975,-73.9665522968005,-73.9665379520819,-73.9665293242056,-73.966515124115,-73.9663243339293,-73.9662336347475,-73.966216840297,-73.9661631672506,-73.9660520999234,-73.9660858848832,-73.9661129297724,-73.9661305929221,-73.9658789353267,-73.9663425984009,-73.9663706791417,-73.9666299336091,-73.9665434463055,-73.9663189780678,-73.9663650323923,-73.9658584717515,-73.9657063633605,-73.965702983132,-73.9656322842164,-73.9655299347028,-73.9651195041622,-73.9652801928745,-73.9654011712709,-73.9653916321955,-73.9653273238765,-73.9652810913342,-73.9651173682371,-73.9656765569886,-73.965598233114,-73.9650327839416,-73.964479462231,-73.9643819088928,-73.9643335973677,-73.964447548536,-73.9643347539806,-73.9643973566168,-73.9648644086133,-73.9649258175784,-73.9650310006452,-73.9649307430027,-73.9648530414549,-73.9647528719096,-73.9648343360944,-73.9643610795633,-73.9642746249727,-73.9649505973669,-73.9648428486345,-73.9642019309861,-73.9640659131032,-73.9643750430115,-73.9643084623728,-73.9640261745855,-73.9639979365841,-73.9635595835819,-73.9635385541452,-73.9634375955293,-73.9634152282094,-73.9629656640302,-73.9627566548873,-73.9622534632019,-73.9622350496432,-73.9620727194389,-73.9624679001106,-73.962471951129,-73.9624434091143,-73.9623904304463,-73.9623659688944,-73.962007448651,-73.9619025618004,-73.9618942677825,-73.9616598430135,-73.9621146156684,-73.9619023964316,-73.9617607035081,-73.9615367935869,-73.9614126357784,-73.9611636636839,-73.9604323024061,-73.9603665103636,-73.9587592816989,-73.9583307822691,-73.9581429250712,-73.9580391674166,-73.957941834895,-73.9579509621324,-73.9582758822373,-73.9583517707886,-73.9584261184392,-73.9601249713324,-73.9602854494421,-73.961063435117,-73.96161518902,-73.961652808281,-73.9616171702982,-73.9614992010534,-73.9614182688696,-73.9611415931247,-73.9610168813666,-73.9611509325364,-73.9612826200821,-73.961284507884,-73.9613014367309,-73.9614318767787,-73.9616744677247,-73.9616984824574,-73.9617128948076,-73.9617549570839,-73.9620345849863,-73.9622634048936,-73.9623039187058,-73.9623406226019,-73.9623083769673,-73.9623550595522,-73.9623246789464,-73.9622852023693,-73.9621855287732,-73.9620903444991,-73.9619847787049,-73.9619096467635,-73.9617620845885,-73.9615749430675,-73.9611900313403,-73.9605191671798,-73.9605115504618,-73.9604674814229,-73.9604226223434,-73.9602955704477,-73.9602386308907,-73.9602228845032,-73.9602157750854,-73.9601876530762,-73.9601473184298,-73.9600952141967,-73.9600771355493,-73.9600338318451,-73.9600010657914,-73.9599165921341,-73.9598950195285,-73.9598508141779,-73.9598293114784,-73.9598158325267,-73.9597990733821,-73.9597797455522,-73.9597224391933,-73.9597058590907,-73.9596922503639,-73.959665432361,-73.9596023986839,-73.9595831145233,-73.9595643178502,-73.9594701001917,-73.9594013832884,-73.95936872915,-73.9593057412758,-73.9591910755679,-73.9591637296287,-73.9591099041089,-73.9590895340494,-73.9590279708699,-73.9589885658971,-73.9588881976613,-73.9588333204565,-73.9588247447747,-73.958814324506,-73.9587779705527,-73.9587654299908,-73.9587303631383,-73.9586780030557,-73.9586403101832,-73.9586134230507,-73.9584874691582,-73.9584586868082,-73.9584318951817,-73.9583750790278,-73.9583123551326,-73.9582421355096,-73.9581558807683,-73.9579598711734,-73.9578942469992,-73.9578544414846,-73.9577648807612,-73.9577167367704,-73.9576340960703,-73.9575470386147,-73.9574182351603,-73.9571547953331,-73.9570932951827,-73.9569585107304,-73.9569464079314,-73.9569300286512,-73.9569182000966,-73.9569034729188,-73.9567781691444,-73.955640045761,-73.9556351553076,-73.9556300411183,-73.9556145431914,-73.9555833632283,-73.9555306715092,-73.9551966091339,-73.9549228049316,-73.9548075756689,-73.9547631402039,-73.9547153325348,-73.9546632150002,-73.9546035338013,-73.9545464481909,-73.9544412511326,-73.9543955541709,-73.954283170276,-73.9542326293959,-73.954193512678,-73.9541562788532,-73.9541218660032,-73.9540277811602,-73.9539724039831,-73.953815514917,-73.9537378328537,-73.9535808906475,-73.9535146185367,-73.9533674459887,-73.9532329903767,-73.9529235572418,-73.9528623207419,-73.9528230147117,-73.9527870757471,-73.9527178138873,-73.9526570290261,-73.9525552757203,-73.9523844877751,-73.9521866942478,-73.9521773188058,-73.9521450608481,-73.9521054173809,-73.9520333747342,-73.9520175131944,-73.9520051419177,-73.9519879435446,-73.9519773122518,-73.9519728512576,-73.9519546919035,-73.9519492725807,-73.9519436860237,-73.951935886692,-73.9519275902918,-73.9519105667552,-73.9519023635228,-73.9518945132561,-73.9518871496452,-73.9518803528664,-73.9518800444408,-73.9518797608839,-73.9518794878858,-73.951879250341,-73.9518790257653,-73.9518788119751,-73.9518784695848,-73.9518782086344,-73.9518780306528,-73.9518778989462,-73.9518782520032,-73.9518804005861,-73.9518806844618,-73.9518806953028,-73.9518806002769,-73.951880446284,-73.9518803395728,-73.951880220321,-73.9518800896361,-73.9518799358311,-73.9518797582595,-73.9518795696814,-73.9518793676876,-73.951879143242,-73.9518786452734,-73.9518780658649,-73.9518578844408,-73.9518126933136,-73.9517171496976,-73.9515420295665,-73.9506452173329,-73.9505097388958,-73.9504645828052,-73.950387481977,-73.9502194406016,-73.9500484853742,-73.9499651646993,-73.9496477167888,-73.9494843055123,-73.9493970100016,-73.949257432886,-73.9488437740077,-73.9486120038477,-73.9485840832611,-73.9484052177219,-73.9481229165706,-73.9481067530303,-73.9480917268227,-73.9475421149279,-73.9472014958558,-73.9471813979384,-73.9471617858923,-73.9471363414268,-73.9470955720832,-73.9470493494224,-73.9470361798764,-73.9470340024367,-73.9470057003398,-73.9469886118082,-73.9469682797806,-73.9469104765004,-73.9468599083619,-73.9468397774887,-73.9468215743279,-73.9467782401273,-73.9467592546025,-73.9466991905293,-73.9466158952047,-73.9465805064899,-73.9465235285479,-73.9464422914086,-73.9466617484334,-73.9466751535911,-73.9469037682147,-73.9470014458955,-73.9471998336716,-73.9471869111846,-73.9471577585992,-73.947086434635,-73.9470653291539,-73.9465980670735,-73.9466282822118,-73.946736923407,-73.9466971949813,-73.9465591900049,-73.9465538324106,-73.9465466944821,-73.9465410522329,-73.9465281650494,-73.9465125404017,-73.9464897659012,-73.9464643481678,-73.9464431007418,-73.9464305125695,-73.9464005067587,-73.9463072009062,-73.9462474829692,-73.9461719588151,-73.9458731056289,-73.9455704845722,-73.9455325990528,-73.9455199804413,-73.9455452848521,-73.9454158498641,-73.9454000312712,-73.945358971799,-73.945207437018,-73.9452011393878,-73.9452201211517,-73.9450780667231,-73.9450590833407,-73.9450338142478,-73.9449990888949,-73.944999104756,-73.9452549227956,-73.9451850718132,-73.9450329903192,-73.9450278576712,-73.9450217993007,-73.9450064221209,-73.9449905853296,-73.9449612448358,-73.9449230922739,-73.9448854042497,-73.9448621404606,-73.9448365341482,-73.9447855127091,-73.9447727208076,-73.9447592102149,-73.9447395406782,-73.9446905205898,-73.9446709474212,-73.9446330062904,-73.9446127299451,-73.9445772611248,-73.9445676624135,-73.944549625305,-73.9445490329952,-73.9445483700264,-73.9445467944337,-73.9445448877422,-73.944542613803,-73.944539168612,-73.9445271511209,-73.944524297879,-73.9445219171834,-73.944520069636,-73.9445185058877,-73.9445172153366,-73.9445161724513,-73.9445156506814,-73.9445153425662,-73.9445152715396,-73.9445152474309,-73.9445152816791,-73.9445153765078,-73.9445155184606,-73.9445157079921,-73.9445162630205,-73.944517044022,-73.9445180500948,-73.9445200849663,-73.9445228060318,-73.9445369136418,-73.9445399894343,-73.9445411961087,-73.9445422028042,-73.9445429831163,-73.9445436341022,-73.94454415356,-73.9445445438963,-73.9445447914801,-73.9445449211989,-73.9445447525729,-73.9445440411409,-73.9445428076356,-73.9445410648893,-73.9445388600858,-73.9445332210585,-73.9445300112339,-73.9445266713042,-73.9445200873574,-73.944515421174,-73.9444924208175,-73.9444813883173,-73.9444640823815,-73.9444283719635,-73.9443908967087,-73.9443235508269,-73.9442224871692,-73.9432996801761,-73.9432134765295,-73.9431678832003,-73.9431050709283,-73.9430069111081,-73.9429441431141,-73.9428804403222,-73.9428418960536,-73.9423944354243,-73.9421224596296,-73.9421053659689,-73.9419689213012,-73.9417723107772,-73.9417381958986,-73.9417918916102,-73.9417861664157,-73.9417630650352,-73.9416936883217,-73.9416065819686,-73.9415456683245,-73.9412980185681,-73.9411474670195,-73.9409974659992,-73.9411561580941,-73.9411353395534,-73.9410384327478,-73.9409420754878,-73.9409291468145,-73.940917580517,-73.9408181722585,-73.9407549070069,-73.9407256205499,-73.9406442348713,-73.9405911274645,-73.9405686893025,-73.9406849160134,-73.9403665895295,-73.939887851462,-73.9398132262545,-73.9397460775415,-73.9389150347707,-73.9385612041251,-73.9381033496067,-73.9380890091206,-73.9372951126293,-73.9371187450795,-73.9369312479987,-73.9368400137809,-73.9365589437499,-73.9360824548658,-73.9356359123366,-73.9356145398115,-73.9352743816798,-73.9350119320212,-73.9349292639187,-73.9348084572107,-73.9342557278262,-73.9342303276802,-73.934235240337,-73.9342287100879,-73.9341542156219,-73.9337667607522,-73.933527616527,-73.9334994819438,-73.9334855598164,-73.9334827199932,-73.9332572980561,-73.9330165861012,-73.9329111623526,-73.9326268266163,-73.9324078986619,-73.9323870036787,-73.932360906291,-73.9323459884982,-73.9321339751577,-73.9320042045381,-73.9319608529366,-73.931881254929,-73.9317484132201,-73.9316831782669,-73.9316685874969,-73.9315735618688,-73.9312077015134,-73.9308047913176,-73.9307225423455,-73.9303263555996,-73.92991812728,-73.929835312754,-73.9296630804213,-73.9296548490522,-73.9296322460576,-73.9296240063502,-73.9296273430395,-73.9296116352238,-73.9295802069088,-73.9295111773887,-73.9294247630484,-73.9293758860378,-73.9292878754255,-73.9292433394839,-73.9292689889354,-73.9292434125346,-73.9291793419222,-73.9291110261476,-73.9288695325505,-73.9284941854016,-73.9283373801302,-73.9281587072564,-73.9281307474383,-73.928054295343,-73.9279551407347,-73.9279391262521,-73.9279275436285,-73.9279017185606,-73.9278825766521,-73.9278717240503,-73.9278643199705,-73.9278589538521,-73.9278028716823,-73.9277965010413,-73.9272027596346,-73.9256147051662,-73.924817989437,-73.9248153715802,-73.9247089165573,-73.9247109844173,-73.9247450310812,-73.924676223692,-73.9246088564732,-73.9245343256218,-73.9245199941513,-73.9245201859684,-73.924520830482,-73.924538549858,-73.9245535587675,-73.9245794808889,-73.9246295419992,-73.9246900485712,-73.9247022780711,-73.9247718325362,-73.9248155567726,-73.9248641350911,-73.92493181379,-73.9249920442661,-73.9250867752077,-73.9261579023423,-73.926383666008,-73.928379301015,-73.9283915383406,-73.9284037507559,-73.9284212741908,-73.9284241972088,-73.9284268816078,-73.9284293775785,-73.928431718539,-73.9284356896591,-73.9284456138612,-73.9284495386324,-73.9284516558226,-73.928453890207,-73.9284619456356,-73.928470830849,-73.928480640266,-73.928491537878,-73.9285135383971,-73.9285742522137,-73.9285917078937,-73.9286066756521,-73.9286372006141,-73.9286677468448,-73.928698268136,-73.9287286693929,-73.9287353864659,-73.9287420797614,-73.9287684578225,-73.9287760856202,-73.928779989409,-73.9287839882596,-73.9287896305719,-73.9287956187773,-73.9288085531668,-73.9288225296615,-73.9288371369767,-73.9288520289608,-73.9288664256039,-73.9288796518002,-73.9288910810599,-73.9289685070605,-73.9289822116627,-73.9290741935762,-73.9290934667455,-73.9291100394285,-73.9291243277067,-73.9291364861019,-73.9291385605439,-73.9291402089788,-73.9291423120929,-73.9291429714401,-73.9291424545693,-73.92914397868,-73.9291453078458,-73.9291470154509,-73.9291570069504,-73.9291698977279,-73.9291853904298,-73.9292029421139,-73.9295685690548,-73.9296057883535,-73.9296394007181,-73.9296487614611,-73.9296672372045,-73.9296829561913,-73.9296957285304,-73.9297053991533,-73.9297076228221,-73.9297084843028,-73.9297079860933,-73.9297061273464,-73.9296984781283,-73.9296928553877,-73.9296861770914,-73.9295071485949,-73.9295023492771,-73.929498461682,-73.9294956154654,-73.9294939059558,-73.9294934720096,-73.9294946497543,-73.9294963979435,-73.929497314861,-73.9295016940007,-73.9293199976608,-73.929315726363,-73.9293165196558,-73.9293218797777,-73.9293317763478,-73.9293448342123,-73.9293613166862,-73.9293825020932,-73.9294005289397,-73.9294198181735,-73.9294406781308,-73.9294632508139,-73.9294735692146,-73.9294853192335,-73.9294983453227,-73.9295124723109,-73.9295274741894,-73.9295431388072,-73.929559203856,-73.9295754332346,-73.9302996242696,-73.9314930461092,-73.9315129843278,-73.9315332550619,-73.9315359654061,-73.9315589243162,-73.9315843812833,-73.9316592671744,-73.9317053453831,-73.9317500895425,-73.9317926722912,-73.9318324282947,-73.9319048299599,-73.9319881491739,-73.9320446165217,-73.9320804705364,-73.9321047811306,-73.9321299951439,-73.9321557326612,-73.9321975314633,-73.932206073073,-73.9322136328231,-73.9322252981197,-73.9322303771756,-73.9322341491633,-73.9322346904511,-73.9322353635064,-73.9322339746947,-73.932230015088,-73.9322151930618,-73.9321969843875,-73.9321736792135,-73.9321566533723,-73.9321536155983,-73.9321499860121,-73.9321412815338,-73.9321368692123,-73.9317535718227,-73.9315904835653,-73.9315566200755,-73.9315420382568,-73.9314260410093,-73.9313674684806,-73.9313130786729,-73.9314360302114,-73.9312406705949,-73.9314530173299,-73.9315560427115,-73.9315914426215,-73.9316452739167,-73.9319718412763,-73.932451631567,-73.9325504173053,-73.9325776548012,-73.932595636195,-73.9326105193551,-73.9326167598056,-73.9326222660991,-73.9326315998166,-73.9326390524246,-73.9326443754896,-73.9326462145881,-73.9326474728588,-73.9326482349775,-73.9326491737302,-73.9326469395629,-73.9320326298051,-73.933384846153,-73.933283493203,-73.9319010192086,-73.9316639886082,-73.9315109259059,-73.9312657270327,-73.9310297877014,-73.9309322754774,-73.9307949018102,-73.930791803705,-73.9307874517292,-73.9307869429517,-73.930783526474,-73.9307800270698,-73.9307769310975,-73.9307719933312,-73.930768572108,-73.9307660006668,-73.9307668365166,-73.9307660262381,-73.9307627053335,-73.9307599915477,-73.9307565310478,-73.9307390315692,-73.9307188219671,-73.9306959378436,-73.9306704392642,-73.930641803742,-73.9305721330634,-73.9305429663506,-73.9305279439577,-73.9305257228551,-73.9305158586311,-73.9305071231641,-73.930502031801,-73.930501000832,-73.9303609456584,-73.9303734795637,-73.9303772099989,-73.9303818492877,-73.9303856313317,-73.9303857407662,-73.9303846690073,-73.9303802173511,-73.9303728780508,-73.9303628542563,-73.9303505350377,-73.9302887981322,-73.9302662809465,-73.9302650972975,-73.9302565183526,-73.9302503884903,-73.9303767140616,-73.9306809942876,-73.9309983562131,-73.9311583696588,-73.9315461374687,-73.9308888191221,-73.9308596617392,-73.9308357102641,-73.9308163730948,-73.9308084145055,-73.9308015902649,-73.9307878093358,-73.9307828650395,-73.9307793659171,-73.9307773691761,-73.9307768754867,-73.9307778853387,-73.9307789473705,-73.9307803752297,-73.930790204141,-73.930800805444,-73.9308125804357,-73.9308189429891,-73.9308256373481,-73.930833692726,-73.9308468254447,-73.9308552876547,-73.9308640944476,-73.9316103273489,-73.9318204207725,-73.9318333498546,-73.9318412232115,-73.9318463511817,-73.9318486887745,-73.93184794873,-73.9318424949343,-73.9318341574614,-73.9318218728667,-73.9318163387005,-73.9318097033648,-73.931792859637,-73.9317722642453,-73.9317343685178,-73.9306678864662,-73.9305711431028,-73.9305464277637,-73.9305271320737,-73.9305190693687,-73.9305120595293,-73.9305060787523,-73.9305011378325,-73.9304915043938,-73.930473615222,-73.9304641824193,-73.9304360384999,-73.9304305881457,-73.9304263110575,-73.930424485839,-73.9304229431307,-73.9304226389901,-73.930771665474,-73.9309507359177,-73.9310523190167,-73.9308519013403,-73.9299166552832,-73.9299027990128,-73.9293141228578,-73.9292716706695,-73.9292536656753,-73.9284388181459,-73.9289024285406,-73.9289059898621,-73.9289060126502,-73.9289025104378,-73.9288955189768,-73.928884418546,-73.9288707269487,-73.9288544671095,-73.9288356617239,-73.9287905809,-73.9287680502739,-73.9287453198781,-73.9287111132049,-73.9286772879615,-73.9286436542239,-73.9286100919124,-73.9285758110837,-73.928489109203,-73.9284362240153,-73.9283224194212,-73.9282714510703,-73.9282526348971,-73.9282325304488,-73.9282113500457,-73.9281892718894,-73.9281665195066,-73.9281433662164,-73.9281200610616,-73.928096887447,-73.9259516394395,-73.925940911088,-73.9251460605983,-73.9249974068021,-73.9249747370717,-73.9249548965358,-73.9249425244251,-73.924926210813,-73.9249023936849,-73.9248891124791,-73.9248629971176,-73.9248373090317,-73.9248221434472,-73.9247946191773,-73.9247717357909,-73.9247507718374,-73.9247290613489,-73.9247122757727,-73.9246936210236,-73.9246759143407,-73.924660040746,-73.9246451386399,-73.9246255503999,-73.9246033947608,-73.9245869348676,-73.9245840710721,-73.9245682413708,-73.9245529097176,-73.9245380167142,-73.9245208166272,-73.9245075570141,-73.9244926653785,-73.9244778104609,-73.9244606131204,-73.9244506295892,-73.9244292467153,-73.9244087753188,-73.9243902055648,-73.9243692700281,-73.9243507009103,-73.9243330315124,-73.9243130678671,-73.924293056077,-73.9242758587178,-73.9242600692737,-73.9242456522157,-73.9242335769337,-73.9242219623099,-73.9242057123545,-73.9241908235595,-73.9241808416879,-73.9241659886564,-73.9241506260189,-73.924135311216,-73.9241199951014,-73.9241028009434,-73.9240842361937,-73.92406646436,-73.9240482660733,-73.924030423535,-73.9240145690646,-73.924001231726,-73.9239891245494,-73.9239772799705,-73.9239656378104,-73.9239545032466,-73.9239403746935,-73.9239313285829,-73.923903678816,-73.9238941706456,-73.9238732614853,-73.9238518917777,-73.9238323896616,-73.9238147213608,-73.9238065716195,-73.9237952188527,-73.9237824235474,-73.9237701371041,-73.9237487547003,-73.9237283193838,-73.9237097150153,-73.9236873979866,-73.9236737038475,-73.9236600084222,-73.9236398926207,-73.9236269941497,-73.9236149949463,-73.9236015524262,-73.9235878623398,-73.9235760424432,-73.9235660685178,-73.923558754813,-73.9235495029838,-73.9235353436641,-73.9235272708796,-73.9235190216807,-73.9235105240247,-73.923496119394,-73.9234849854512,-73.9234748199425,-73.923462786962,-73.923452338527,-73.9234400204305,-73.9234289199994,-73.9234186143472,-73.9234106992331,-73.9234052216491,-73.9234013059782,-73.9233929943387,-73.9233853977937,-73.9233783416715,-73.9233705225069,-73.92336526384,-73.9233535568471,-73.9232865323734,-73.923231571136,-73.9231677608526,-73.9231344572239,-73.9231171816841,-73.9231114960376,-73.9231036112499,-73.9230757991148,-73.9230550001433,-73.9232603979891,-73.9233124491608,-73.9233347737978,-73.9233662758325,-73.9233857974686,-73.9234049108595,-73.9234316927592,-73.923471440708,-73.9236114515555,-73.9235900100315,-73.9243132996157,-73.9245940828105,-73.9248328755903,-73.924885535076,-73.9248523093602,-73.9247874513713,-73.9247662928441,-73.9247612878214,-73.9247625720616,-73.9247649334008,-73.9247615504935,-73.9247298162903,-73.9246900933839,-73.9246601307839,-73.9246150150585,-73.9245556874402,-73.9245258166989,-73.9245122616133,-73.9244822173475,-73.9244315317407,-73.9244191096702,-73.924414531177,-73.9244091086461,-73.9243902805051,-73.924367188328,-73.9243475111798,-73.9243377960684,-73.9243369910777,-73.924336374636,-73.9243358975712,-73.9240590973699],"lat":[40.7141115601475,40.7140083126289,40.713394728091,40.7128559543629,40.7117820674471,40.7110432835344,40.7107905585565,40.7107354078152,40.7105336489583,40.7093960967104,40.7090062604165,40.7085454975254,40.7083689691659,40.7076762980633,40.7073944496271,40.7067443945278,40.70653890478,40.7058097831741,40.7056797011623,40.7055292245019,40.704963939698,40.7047169507642,40.7043045299944,40.7041311315899,40.7037723348702,40.7035459911243,40.7031703912226,40.7028489818732,40.7026745926979,40.7023148258386,40.7019102776596,40.7018284443381,40.7018051310971,40.7017655535374,40.7017323123984,40.7016106683499,40.7015696423227,40.7015448898458,40.7014276729813,40.7012797812481,40.7012087986458,40.7011661481724,40.7011243056465,40.701076598295,40.7007252341929,40.7005058357302,40.70042452328,40.7004053004199,40.7002149527619,40.7001228108842,40.7001049092465,40.7000062728164,40.6998233144236,40.6997905932375,40.6996779853941,40.699633724601,40.6996135788452,40.6995847944241,40.6995628810171,40.6994947771409,40.6994045406529,40.6992953542764,40.6991929024127,40.6990900019673,40.6989739143496,40.6988200032159,40.6986773264163,40.6984627274387,40.6983260788191,40.6981883325315,40.6981195943247,40.6981150917399,40.6981089457377,40.6980953847548,40.6980386683399,40.6996055858518,40.7002207106044,40.7004726819675,40.7004970336439,40.7010000953747,40.7015418892111,40.7020749782679,40.7026227448141,40.7031576959966,40.7033201529412,40.7036966129153,40.7038066038877,40.7042557091534,40.704961635387,40.7057312170614,40.7068291867471,40.7070933310958,40.7076275885551,40.7080030416877,40.7085748720672,40.7093020533538,40.7101477491818,40.7102708438748,40.7103217314837,40.7103820507433,40.7104578579221,40.7105227497149,40.7105169554208,40.7105169201751,40.7104940194041,40.710656945988,40.7106798225086,40.7107327842513,40.7107919337904,40.7108469029217,40.710938127262,40.711005576651,40.7112039882907,40.7112226637601,40.7112121679025,40.7111852418907,40.711163402436,40.7110906560018,40.7111747120036,40.7112405414383,40.7112701993124,40.7114331322863,40.7114569945475,40.7115631136033,40.7116234424766,40.7121768592334,40.7122318986553,40.7122519477066,40.7122723596265,40.7123896419288,40.712418772448,40.7124634269349,40.7125067765303,40.7125283147768,40.7125787434364,40.7126323818693,40.7126606171347,40.7127086204145,40.7127565262057,40.7127405699145,40.7127376458277,40.7127469447746,40.7128571934916,40.7128207009424,40.7128069037367,40.7128247093462,40.7128534282115,40.7129243861121,40.7129277731031,40.7129488751829,40.7131054718895,40.7132276370316,40.714261918674,40.7151207233035,40.7158691092228,40.7164836790553,40.7165155721164,40.7165853499164,40.7166661666832,40.7168975386014,40.7169192736823,40.7169857409558,40.7177054035189,40.7179679813901,40.7182759210276,40.718265144022,40.7183130671844,40.7184146688431,40.7184830563018,40.7184390357913,40.7184057668083,40.7183161264351,40.7180158668063,40.7180370561811,40.7180330990489,40.7180307184972,40.7180491778381,40.7182972155567,40.7182474368664,40.7182382194703,40.7182838732036,40.7183871933501,40.7184119939305,40.7184318476272,40.7184894944578,40.7187550776865,40.7190187424302,40.7189897083511,40.7191324278609,40.7192229424695,40.7191084200085,40.719056330784,40.7187732288491,40.7189149026368,40.7189178616616,40.7189284611104,40.7188887083911,40.7192268939974,40.7193485112609,40.7195510125624,40.7198291796064,40.7200424027964,40.720125184468,40.7203163388564,40.7206789605404,40.7207444584025,40.7203770694752,40.7200361882556,40.7201394246605,40.7202083196805,40.7202769739059,40.7203865389111,40.720441833924,40.7207755418605,40.7207202844473,40.7207908413709,40.7208813500634,40.7209528048595,40.7208774838425,40.7207955469382,40.7204772398772,40.7205757675939,40.7214241816044,40.7214641760947,40.7206538937544,40.7207999109626,40.7209925507686,40.7210556694882,40.720880892566,40.7209384380726,40.7215394874682,40.7215733785144,40.7215590951624,40.7215816274453,40.7220344771229,40.7223990151263,40.7235322975463,40.7235702592653,40.723880300403,40.7241315796013,40.7241749892735,40.7241997854814,40.7241935671868,40.7242090616143,40.7239919011055,40.7240982899786,40.7241067021013,40.7248604544631,40.7251480633989,40.7253205003086,40.7252287916082,40.7251089188521,40.7251772194927,40.7252646063335,40.7251141086606,40.7250473093859,40.7245413543696,40.7244117007662,40.7244042839001,40.7244274408787,40.7246492026999,40.7250364391684,40.725167457041,40.7251980573018,40.7254005358322,40.725319636637,40.725948122413,40.7258448991855,40.7258655630743,40.7262039262311,40.7266614219913,40.7267510906227,40.7273561797049,40.7281037254046,40.7287044401018,40.7295362047707,40.7300610250103,40.7301590617017,40.7302529429247,40.7309651711453,40.7314812535528,40.7315323413948,40.7315661138451,40.7316646781653,40.7323803700424,40.7329155516238,40.7331136604796,40.7333892266331,40.7335323247664,40.7337132611241,40.7339077603459,40.7340476958767,40.7342490166328,40.7345079978736,40.7346380331482,40.7347508062467,40.7348916147792,40.7351796149286,40.735602796583,40.7363421923001,40.7363506088976,40.736399645353,40.7364445560135,40.7365629198,40.7366137610139,40.7366366556025,40.7366451810799,40.7366754728731,40.7367156937461,40.7367585487333,40.7367785610387,40.736834313893,40.7368691346129,40.7369540503563,40.7369790590649,40.7370368558599,40.7370609006332,40.7370727378713,40.7370843933693,40.7370956609817,40.737126312529,40.737136852015,40.7371472570096,40.7371721644954,40.7372369515062,40.7372541631057,40.7372686718343,40.7373347818313,40.7373810160274,40.737404328377,40.7374520685889,40.7375391162866,40.7375570089685,40.7375860397879,40.7375980090169,40.7376373578487,40.7376647276904,40.7377411635235,40.7377854672204,40.7377908032214,40.737795833999,40.737809445915,40.7378148084692,40.737833742475,40.7378664927029,40.7378999420698,40.7379212020659,40.7380166834734,40.738039203051,40.7380586443721,40.7380969493687,40.7381370264709,40.7381799196203,40.738230830411,40.7383483913731,40.7383864052726,40.7384101097699,40.7384643593652,40.7384933202474,40.7385381177614,40.7385822459951,40.738649241835,40.7387763216203,40.7388059892583,40.7388738732591,40.7388791820021,40.7388870730716,40.738888914788,40.7388899626838,40.7389055931794,40.7390443167101,40.7390447018122,40.739044699842,40.7390458104334,40.7390400711877,40.7390326932623,40.7390845416937,40.739103300665,40.7391188429977,40.7391235355563,40.739126541959,40.7391279531344,40.7391278483742,40.7391249169296,40.73911765397,40.7391147725225,40.7391073703734,40.7391073502993,40.739106957143,40.7391069148531,40.7391007688459,40.7390831445748,40.7390749458279,40.7390531258635,40.7390453331872,40.739032977285,40.7390269269752,40.7390105142204,40.7389926836408,40.7389349423952,40.7389215603005,40.73891247885,40.7389041749163,40.7388910848033,40.7388788764745,40.7388576813775,40.73882039306,40.7387852540356,40.7387835840928,40.7387782574259,40.7387709838699,40.7387572569284,40.7387537651017,40.7387515174384,40.7387476204743,40.7387312890866,40.7387274336166,40.7387089390017,40.7387048212873,40.7387017118441,40.7386985208971,40.7386958973214,40.7386926931404,40.7386922038881,40.7386924525689,40.7386934397414,40.7386951567277,40.7386952648208,40.7386953997286,40.7386955527337,40.738695715135,40.7386959127223,40.7386961195281,40.7386965970028,40.7386971463804,40.7386977852517,40.738699307509,40.7387020534142,40.7387098977303,40.738711456347,40.7387126085981,40.738713050493,40.7387134099403,40.738713563685,40.7387136986614,40.7387138061588,40.7387139054376,40.7387139767297,40.7387140398083,40.7387140759097,40.7387140934061,40.7387140756078,40.7387139859066,40.7387082953116,40.7386941832534,40.7386652189662,40.7386112582023,40.7383644721523,40.7383226845242,40.7383095807951,40.7382848371257,40.7382215316004,40.7381580526832,40.7381244810761,40.7379977311122,40.7379338594584,40.7378996643399,40.7378449878044,40.7376858919138,40.7375954501017,40.7375845502646,40.7375138345934,40.7373971546085,40.7374337079595,40.7374677048648,40.7372789165484,40.7371664488197,40.7371612531526,40.7371549317598,40.73714465423,40.7371248600172,40.7370999575793,40.7370917936557,40.737090279723,40.7370706175265,40.7370610640049,40.7370525985793,40.7370317343376,40.7370073886882,40.7369991489907,40.7369937641603,40.7369840188966,40.7369787236565,40.7369577507113,40.7369245549604,40.7369442689772,40.7369268539582,40.7367806262632,40.736365663237,40.7363406240721,40.7359136581787,40.7357169108341,40.7353551776116,40.7352307821005,40.7350322972516,40.7345459154896,40.7344019928193,40.7344422243473,40.7345847893349,40.7352949437199,40.7353666414143,40.7356079137531,40.7356176283049,40.7356299983298,40.7356401166552,40.7356628312826,40.7356903516416,40.735730512737,40.7357757602102,40.7358131844558,40.7358353589379,40.7358890685369,40.7360575195062,40.736166165227,40.7362028887743,40.7361018312582,40.7366123039105,40.7366050805178,40.7365906629183,40.7365378328546,40.7365017440082,40.7365377640788,40.7365497545759,40.7365088505162,40.7364872304083,40.7364440057189,40.7363934976849,40.7364391251824,40.736448720264,40.7364366937126,40.7364174787705,40.7358927890038,40.7354791526778,40.7354286156834,40.7354505230167,40.7354749061166,40.7355314418091,40.7355703087646,40.7356342491509,40.7357027865971,40.7357663704945,40.7358105389372,40.7358677811913,40.7359645433152,40.7359857612772,40.7360041078243,40.7360242427751,40.7360641382862,40.7360827521311,40.7361238502515,40.7361473987429,40.736191181305,40.7362028211145,40.7362246578818,40.7362252883337,40.7362258731844,40.7362269258321,40.7362278076109,40.7362285536839,40.7362293177883,40.7362310137339,40.7362315806092,40.7362322540914,40.7362329914904,40.7362338372483,40.7362348280481,40.7362359441096,40.736236762895,40.7362375554818,40.7362379511451,40.7362383387897,40.7362387345037,40.7362391128242,40.7362394998787,40.7362398787473,40.7362406442756,40.736241401704,40.736242176161,40.7362434111412,40.7362447354086,40.7362506676149,40.7362523532397,40.7362531728577,40.7362539935521,40.736254785993,40.7362556328177,40.736256533355,40.7362575068717,40.7362585247142,40.7362595863919,40.7362618743871,40.7362643234489,40.7362668974016,40.7362695260577,40.7362721462824,40.7362771686903,40.7362793371145,40.7362811722658,40.7362836541816,40.7362843908928,40.7362830737726,40.7362814930355,40.7362787262004,40.7362702787069,40.7362587376441,40.7362325909117,40.7361877201332,40.7358236122307,40.7357905300162,40.7357675086524,40.7357357977102,40.7356886519511,40.735660191794,40.735632947046,40.7356172323656,40.7354257499476,40.7352337614063,40.7352190381247,40.7351189764035,40.73498208139,40.7349507179176,40.7349128966475,40.7348949369233,40.7348593823185,40.7347693781114,40.7346877021639,40.7347343359348,40.7343762934337,40.7341529275376,40.7337904855558,40.7337489096099,40.73370281125,40.733488260203,40.7335086520785,40.7335113918772,40.7334840471214,40.7332489094403,40.7332778099146,40.7332911854071,40.7331705114796,40.7330917657177,40.7330584942577,40.7330170771246,40.7322125869148,40.7312956210336,40.7311526889121,40.7310654754721,40.7303837947332,40.7301336432188,40.7297285195214,40.7297468462605,40.7293005567874,40.729189932065,40.7291080912656,40.7290879139383,40.729017826267,40.7288827118521,40.7287519526528,40.7287459856344,40.7286510190735,40.7285724277312,40.728543915753,40.7285286107039,40.7284329144726,40.7284313151652,40.7283954955784,40.7283908269012,40.7283816536207,40.728333938938,40.7283073975901,40.7283041392015,40.7282944147814,40.728281563846,40.7282407028148,40.7282103422337,40.7282333159417,40.7281806135635,40.7281459238374,40.7281476945562,40.7281677703671,40.7281823938847,40.7281596034337,40.7281450828935,40.7281256243596,40.7280953827941,40.7280537276967,40.7280317265996,40.7280382823069,40.7280182945584,40.7279413386244,40.7278488392617,40.7278410726897,40.727795142249,40.7276388983563,40.7276078893267,40.7275433977113,40.7275476520488,40.7275645947863,40.7275775745762,40.7276000540057,40.7276112194395,40.7276128207087,40.7275699311767,40.7275117520126,40.7274799695389,40.7274255040288,40.7273979423187,40.7273652153212,40.7273420003438,40.7272838446055,40.7272197405277,40.7270026311259,40.7266146033079,40.7264175826986,40.7262052307578,40.7261726868244,40.7260723401626,40.7259165175137,40.7258837290458,40.7258790568471,40.7258757804416,40.7258664846255,40.7258540511977,40.7258266790583,40.7257545989973,40.7250102671816,40.7249256687137,40.7236529471862,40.7200616622125,40.7202651374753,40.7202255585509,40.7199988755664,40.7199911954769,40.7199852472463,40.7198856959834,40.7197896928349,40.7196661577725,40.7196127304242,40.7195683707742,40.7195535665119,40.7193425802045,40.7192791311942,40.7191625233348,40.7189869743737,40.7187223355559,40.7186883041007,40.7185646108553,40.718486835906,40.7184404454135,40.7184058287495,40.7183847877612,40.7183842192043,40.7180994676333,40.7180848075262,40.7175783672901,40.7175787536806,40.717580192961,40.7175842105983,40.7175853026808,40.7175867541275,40.7175885743514,40.7175908089404,40.7175959539825,40.7176118628106,40.7176160882683,40.7176177732295,40.7176191980942,40.7176231203817,40.7176262868002,40.7176287324213,40.7176304958777,40.7176320943452,40.7176331316613,40.7176350605051,40.717638338238,40.7176479572927,40.7176593131039,40.7176723806816,40.7176871410362,40.7176911876186,40.7176964688592,40.7177220422503,40.7177272702909,40.7177293163667,40.7177310024858,40.7177328521224,40.7177342973951,40.7177359709466,40.7177359976812,40.7177343674604,40.7177311077119,40.717726344604,40.7177203186236,40.7177133111643,40.7176475401509,40.7176365712372,40.7175713328194,40.7175561612246,40.7175416011124,40.7175272927246,40.7175130713107,40.717510038005,40.7175067618582,40.717499332999,40.7174907159879,40.717464519654,40.7174566139918,40.717453139464,40.7174499159569,40.717436414578,40.7174235551023,40.7174116501187,40.7174010980063,40.7172215360652,40.7171901845551,40.7171564988538,40.7171459421695,40.7171225489422,40.7170984430439,40.7170739290912,40.7170492793892,40.7170402038032,40.7170306673566,40.7170208074229,40.7170108015802,40.7169910302404,40.7169817248743,40.7169730752338,40.716590780876,40.7165855184292,40.7165796537786,40.7165734208713,40.7165670343678,40.7165632699394,40.7165357692718,40.7165268197134,40.7165221377296,40.7164997898054,40.7161120088327,40.7160781012698,40.716043837806,40.7160120704493,40.7159765609796,40.7159389179831,40.7158983155449,40.7158516280597,40.7158165187663,40.7157850036969,40.7157565786164,40.7157310447563,40.7157214526212,40.7157124274356,40.715704069285,40.7156965052146,40.7156898412978,40.7156841961809,40.715679649111,40.7156762731529,40.715507876364,40.7152084805726,40.7152119046247,40.7152139884879,40.7152141608097,40.7152148502648,40.7152142527501,40.7152085523943,40.7152031676125,40.7151945849368,40.7151829750912,40.7151685283298,40.7151375838835,40.7151001364142,40.7150741719206,40.715056497541,40.7150425992693,40.715025603784,40.7150060591763,40.7149721074904,40.7149639809294,40.7149551066193,40.7149357974609,40.7149215452463,40.7149020158329,40.7148934612194,40.714882853138,40.7148644283749,40.7148469655459,40.7148056135094,40.7147664493887,40.7147221395195,40.7146948344854,40.71469104223,40.7146874647303,40.7146812910892,40.7146790464748,40.7147416755057,40.7143994924812,40.714393384423,40.7143596070047,40.7143823430806,40.7142524913519,40.7141440248959,40.7141261825179,40.7137248108847,40.7134388449662,40.7133994727547,40.7133848159179,40.7133427937582,40.7132532609103,40.7131217169368,40.7130953712621,40.7130891116558,40.7130837006766,40.7130772882474,40.7130736721442,40.7130697498743,40.7130613711127,40.7130525861694,40.7130437018088,40.713039272298,40.7130348786333,40.7130310430458,40.713015815055,40.7130007307889,40.7115902230743,40.7112337277457,40.7109787069554,40.7113384714282,40.7108102434826,40.7104698083942,40.709924443553,40.7093585122073,40.7091653112542,40.7091147015711,40.7091129348106,40.7091100051606,40.7091095903927,40.7091067975045,40.7091033012877,40.7090994814834,40.7090910130348,40.7090811325744,40.7090606535207,40.7090191674455,40.7090025435792,40.7089863770596,40.7089793784905,40.7089729827373,40.708947316942,40.708921739475,40.7088963130113,40.7088710744416,40.7088469416653,40.7087948682607,40.7087688708975,40.7087511838697,40.7087476083384,40.7087317623618,40.7087112251342,40.7086902944068,40.7086812250396,40.7087177380327,40.708739303505,40.7087475186101,40.7087577687139,40.708774538789,40.7087823191489,40.7087897655831,40.7088028477628,40.7088158732468,40.708828465054,40.708840137758,40.7088857287389,40.7089049235904,40.7089060937203,40.7089165433867,40.7089279134226,40.7092223400329,40.7099209529672,40.7106182251161,40.7110010485448,40.7118553517511,40.7120560068582,40.7120649411568,40.7120749314833,40.7120862210696,40.7120923842966,40.7120988907977,40.7121164792172,40.7121253193263,40.7121339071707,40.7121420645364,40.7121497825448,40.7121570139537,40.7121604279555,40.7121637066479,40.7121808222605,40.7121946963534,40.7122058059496,40.7122103490857,40.7122142342072,40.7122179224641,40.7122214063722,40.7122206637821,40.7122181926869,40.7120380226804,40.7124789836111,40.7125075279878,40.7125282627781,40.7125472486356,40.7125647741833,40.7125934910591,40.7126272379906,40.7126553745774,40.7126794652262,40.7126871609876,40.7126947748458,40.7127100378027,40.712724956611,40.7127492922381,40.7130212668937,40.7130510969147,40.7130557464607,40.7130615614071,40.713065031889,40.7130688824544,40.7130731375483,40.7130777908112,40.7130904192119,40.7131199628539,40.7131316723203,40.7131560864507,40.7131615490608,40.7131667878934,40.7131695870043,40.7131725586711,40.7131916312695,40.7139294680851,40.7143638194785,40.714610224426,40.7149029855928,40.7151498169994,40.715124963477,40.715279834187,40.7153142169788,40.7153288025398,40.7155309495758,40.7165728123179,40.7165963547318,40.7166189573121,40.7166401079375,40.7166595189858,40.7166804216683,40.7167014490641,40.7167225742146,40.7167437785373,40.7167879385702,40.7168073306165,40.7168251283484,40.7168497458599,40.7168724087257,40.7168932436464,40.7169123312956,40.7169298336846,40.7169710419118,40.7169988342672,40.7170624562006,40.7170897288322,40.7170985958669,40.7171064542534,40.7171132397932,40.7171188802252,40.7171233328014,40.7171265248179,40.7171284364942,40.7171290346693,40.7176910705699,40.7176741521623,40.7178556123768,40.7178895550873,40.7178938995342,40.7178981459748,40.7179008843457,40.7179048541483,40.7179094223188,40.7179115474451,40.7179165005926,40.7179219234235,40.7179250925122,40.7179317739369,40.7179369466248,40.7179404439534,40.7179440506878,40.7179461559121,40.7179481248846,40.7179499225918,40.7179514432337,40.7179531089174,40.7179538432647,40.7179533060734,40.7179507026463,40.7179502407415,40.7179448819069,40.7179391347341,40.7179323717961,40.7179244813952,40.7179176377709,40.7179096758377,40.7179009855197,40.7178908795682,40.7178853796423,40.7178722988444,40.7178588948115,40.717848256553,40.7178364200925,40.7178252323396,40.7178139907289,40.7178021548969,40.7177900658966,40.7177806075764,40.7177708807965,40.7177617307075,40.7177545638337,40.7177477480631,40.7177369762748,40.717726971146,40.7177202470784,40.7177099719165,40.7176999927721,40.7176895817727,40.7176793600758,40.7176671372024,40.7176521951309,40.717638567158,40.7176243368092,40.7176093935301,40.7175947770652,40.7175834044082,40.7175720139663,40.7175599209211,40.7175464150863,40.7175336105183,40.7175208138552,40.7175141359514,40.7174956206966,40.7174890594182,40.7174745466417,40.7174607554303,40.7174484773809,40.7174366324262,40.7174314948456,40.7174235539266,40.7174145936554,40.7174059944051,40.7173921763616,40.7173782765184,40.7173673136266,40.7173531067925,40.717344038361,40.7173355194153,40.7173206574934,40.7173085730942,40.7172968225012,40.7172847377382,40.7172715806369,40.7172584259481,40.717245271981,40.7172347760864,40.7172205509276,40.7172045664914,40.7171951504717,40.7171850146385,40.7171738146762,40.7171546153978,40.7171421726421,40.7171308008586,40.7171176460163,40.717105896437,40.7170929297029,40.7170819992296,40.7170690157387,40.7170569252481,40.7170444944562,40.7170320832986,40.7170153907456,40.7170029496637,40.7169942462993,40.7169814450528,40.7169745258731,40.7169658994891,40.7168340031082,40.7166994391576,40.7164789153861,40.7164794689454,40.7164761884565,40.7164691882316,40.7164515324939,40.7163892347664,40.7163426647934,40.7162497341354,40.7162288498968,40.7162253262613,40.7162173056064,40.7162127886707,40.7161924044799,40.7161725210986,40.7161466666239,40.7161035081713,40.7160281486949,40.7158470565768,40.7155343758555,40.7152829120414,40.7152671876526,40.7151986006984,40.7150755935461,40.7150320495119,40.7150194746817,40.7150040762739,40.7149886527709,40.7149759714484,40.7149379664753,40.714880957033,40.7148668804073,40.7148270836542,40.7147536537328,40.714690417847,40.7146207721807,40.7145234523006,40.7143647761764,40.7143496125249,40.7143485385189,40.714349912868,40.7143491791324,40.7143308294748,40.7143070530095,40.7142537087109,40.7142015873513,40.7141400817555,40.7141225934664,40.7141115601475]}]],[[{"lng":[-73.8525475023021,-73.852241585414,-73.8522610366254,-73.8524939623295,-73.8525305061513,-73.8525395503782,-73.8525539727034,-73.8526653448466,-73.8526891729137,-73.8525607000627,-73.8525660456009,-73.8525475023021],"lat":[40.760069811743,40.759921607984,40.7598959113081,40.7600104121597,40.7600056578146,40.7599943523337,40.7599995155202,40.7599183267704,40.7599283156638,40.7600166710964,40.7600468580992,40.760069811743]}],[{"lng":[-73.8527010783819,-73.8527155183443,-73.8527427464126,-73.8527587008236,-73.8527748332086,-73.8527937652885,-73.8527783645368,-73.8527972731736,-73.8527782869497,-73.8529907939976,-73.8529740888236,-73.8527010783819],"lat":[40.760128117819,40.7601005142437,40.760108029594,40.7600804279491,40.7599642281752,40.7599721661337,40.7600862082713,40.7600914111682,40.7601213107524,40.7601917882932,40.7602170867005,40.760128117819]}],[{"lng":[-73.8397005336242,-73.839894946295,-73.8405407985583,-73.8406256288308,-73.8414440958441,-73.8419868148216,-73.8420174078952,-73.8424402247995,-73.8426131219734,-73.8423114797328,-73.8421165215355,-73.8418332213885,-73.8410708526977,-73.8405263547938,-73.8404651959791,-73.8401672408474,-73.8399281323675,-73.8397005336242],"lat":[40.7652895884368,40.7650940540317,40.7641096110879,40.7640234198922,40.7637724706044,40.7636346482519,40.763688570101,40.7645042729928,40.764682989692,40.7648316653291,40.7649010341971,40.7649750539696,40.7652084067205,40.7653879897001,40.7653028700007,40.7653085449268,40.7653502119004,40.7652895884368]}],[{"lng":[-73.8397005336242,-73.8395782685355,-73.8394581344615,-73.8391318926341,-73.8392562170269,-73.8395267864783,-73.8395437155588,-73.8396977254908,-73.8397377880207,-73.8397338680685,-73.8396937599099,-73.8395605054185,-73.8395100059495,-73.839498057958,-73.8395907260982,-73.8396817500014,-73.8397538798215,-73.8397875047296,-73.839869578183,-73.8399392217747,-73.8399402231328,-73.8398843082264,-73.8399019091333,-73.8400075897093,-73.840113137722,-73.840223744468,-73.8402702092048,-73.840274380491,-73.8403117031529,-73.8405722221806,-73.8408651507117,-73.8408475949733,-73.8408401364553,-73.840836443574,-73.8408600710315,-73.840871220179,-73.8408650021131,-73.8408888353827,-73.8410219192257,-73.8410080289379,-73.8410788870798,-73.8410849707359,-73.8410576192273,-73.841056430088,-73.8412053056116,-73.8412033740023,-73.8411957449596,-73.8412007549781,-73.8412367974932,-73.8412367682111,-73.8412230910439,-73.8412272392916,-73.8414436438792,-73.8417228607504,-73.8417012582299,-73.8416732380633,-73.8416621163819,-73.8417130964574,-73.8417448125708,-73.8419644492187,-73.8419840191644,-73.8419654658316,-73.8419157397382,-73.841915728522,-73.8418734447532,-73.8418623149472,-73.8419033560001,-73.8419058306349,-73.8423186823178,-73.8423174449702,-73.842357230672,-73.8423646345371,-73.8423285691252,-73.8423260973578,-73.8422726159543,-73.8422899117665,-73.8423182801006,-73.8425134757182,-73.8424927236075,-73.8424815287943,-73.842472878599,-73.8425226165896,-73.8425275458323,-73.8425113777536,-73.8425362349485,-73.8426819600242,-73.8429591563736,-73.8433696975304,-73.8434682069571,-73.843599743765,-73.8437063352786,-73.8439474833579,-73.8440790636557,-73.844265680065,-73.8444889588419,-73.8449133284601,-73.8452816354158,-73.8459302329294,-73.8460271598125,-73.8461407214992,-73.8462002403795,-73.8465217041874,-73.8466676854462,-73.8468496463689,-73.8470130919798,-73.8471218859345,-73.8472306797614,-73.8473826309707,-73.8476935357508,-73.8478057510442,-73.8478616771611,-73.8479223456838,-73.8479904827163,-73.8480424881757,-73.8480941144258,-73.8482132401846,-73.8482822285698,-73.8483741186846,-73.8484203827973,-73.8485033313528,-73.8486231381937,-73.8485253028606,-73.8485114987878,-73.8482713408881,-73.8482363010162,-73.8482084111575,-73.8481883341731,-73.8481765472404,-73.848173330512,-73.8481787604554,-73.8481927080345,-73.8482148417744,-73.8482446356389,-73.8482813815304,-73.8483242061195,-73.8483720916009,-73.8484238998825,-73.8485630381577,-73.848573301391,-73.8485838064554,-73.8485942755272,-73.8486044317349,-73.8486140064813,-73.8486227465464,-73.8486304207847,-73.8486368262383,-73.8486417935039,-73.8486451912138,-73.848646929509,-73.8486469624171,-73.8487454360023,-73.8489965636812,-73.8488219438439,-73.848514351803,-73.8484931402133,-73.8484769230442,-73.8484661676675,-73.8484611840512,-73.8484621158264,-73.8485936853999,-73.84859790419,-73.8486102761274,-73.8486219128766,-73.8486452704888,-73.8486715286884,-73.848747467963,-73.8488263633886,-73.8489052706554,-73.8491299111492,-73.8493381477534,-73.8494940271186,-73.8495760947736,-73.849609790169,-73.8497323042617,-73.8497380449763,-73.8497730365678,-73.8498050147528,-73.8498226879864,-73.8499325288583,-73.849940466773,-73.8499424188297,-73.8502018833616,-73.8502024009588,-73.8503039745047,-73.850310750245,-73.850283798234,-73.8502906085098,-73.8503141582523,-73.8503380881852,-73.85037848157,-73.8503682352618,-73.8512605246145,-73.8512674258831,-73.8513010837448,-73.8512703762072,-73.8512400780663,-73.8512537491334,-73.8503614653021,-73.8503341056926,-73.8502970778994,-73.850297175739,-73.8501973454494,-73.8501948666894,-73.849951625173,-73.849962928372,-73.8499462080866,-73.8498690241191,-73.8500373857281,-73.8500406554625,-73.8498395837767,-73.8497276954476,-73.8495716095589,-73.8491858043713,-73.8489761986719,-73.8489611240003,-73.8491236529015,-73.8492119720892,-73.8492198600987,-73.8492189792075,-73.8492093333181,-73.8491909655552,-73.8490932500087,-73.849062203239,-73.8490334958886,-73.8490144282875,-73.848968509044,-73.8489298868185,-73.8489890559831,-73.8490964175549,-73.8490965844089,-73.8491924041105,-73.8491897329178,-73.8490932343741,-73.8490264586265,-73.8491273741165,-73.8491256356391,-73.8490217298192,-73.8490197116363,-73.8490349131232,-73.84901842052,-73.8489994143167,-73.848977716763,-73.8489740492575,-73.8489716598805,-73.8489568088469,-73.8489545091338,-73.8489555932542,-73.84896008359,-73.8489680254469,-73.8489738348037,-73.8489820746995,-73.848992542023,-73.8489938074022,-73.8490049192053,-73.8490188266483,-73.8490338863596,-73.8490496960331,-73.8490659137323,-73.8491140666188,-73.8491760538887,-73.8492056110266,-73.849236627992,-73.849287646568,-73.8493120634356,-73.8493333857542,-73.8493453407138,-73.8493567111171,-73.8493676162693,-73.8493782575125,-73.8493958540834,-73.8494353566523,-73.8494784449966,-73.8494943632536,-73.8495075733188,-73.849517316323,-73.8495252080799,-73.8495311450571,-73.8495350564192,-73.8495358659634,-73.8496919692504,-73.8496962613019,-73.8497474142047,-73.8497444580872,-73.8495366469045,-73.8495343034801,-73.84952990131,-73.8495285897792,-73.8495265700725,-73.8495238381854,-73.8495203371549,-73.8495113336778,-73.849481318617,-73.8494772242041,-73.8494738893154,-73.8494712409086,-73.8494692797771,-73.8494584613067,-73.8494510632477,-73.8494461945274,-73.8494438267176,-73.8494439741274,-73.8494467073114,-73.8494490536041,-73.8494520389504,-73.8494556650752,-73.8494599557768,-73.8494690484616,-73.8494795769649,-73.8495051386488,-73.8495368533371,-73.8495772081674,-73.8496042924005,-73.8496868797888,-73.8496951331868,-73.84973917397,-73.8497578686036,-73.8497731134845,-73.8497854085521,-73.8497903057578,-73.8497943604447,-73.8497975864761,-73.8497999937689,-73.8498015715241,-73.849801320979,-73.8499335329618,-73.8499308085666,-73.849800881122,-73.8497961047961,-73.8497922389795,-73.8497904499096,-73.8497879996375,-73.8497848969631,-73.8497811431635,-73.8497716115908,-73.8497592371477,-73.8497310839671,-73.8496617948397,-73.8496581187053,-73.849653982055,-73.8496440972789,-73.8496016047256,-73.8495957738881,-73.8495930234844,-73.8495861258342,-73.8495824620826,-73.8495793189661,-73.8495766621077,-73.8495744894822,-73.8495727922538,-73.849571554537,-73.8495775485019,-73.8495792144374,-73.8495828564967,-73.8495883373438,-73.8495954771789,-73.8496040054478,-73.8496137809668,-73.8496246034214,-73.8496363163359,-73.8496396893303,-73.849643241763,-73.8496509609571,-73.8496595245861,-73.8496691205745,-73.8496877344868,-73.8497318773017,-73.8497426251204,-73.8497486904764,-73.849751900693,-73.8497540443524,-73.8497385127623,-73.8500700712478,-73.8500911408919,-73.8500939813191,-73.8501286695787,-73.8501114813009,-73.8506722779776,-73.850657884151,-73.8509671895646,-73.8509470572425,-73.8511870038709,-73.8511927579449,-73.8514760606033,-73.8514875548042,-73.8512042618531,-73.8512099815756,-73.8510133961941,-73.8510276713211,-73.8510507916471,-73.8510794601664,-73.8510505558126,-73.8510390476669,-73.8509465557471,-73.8509493705478,-73.8507441542307,-73.8507355559626,-73.8501574165167,-73.8501401731583,-73.8501112588136,-73.8501227525042,-73.8500369687846,-73.8497930434762,-73.8498172006613,-73.8498785983377,-73.8498753731961,-73.8499864327529,-73.8500054245655,-73.8500070194975,-73.8523526788141,-73.8523208624222,-73.8523566193624,-73.852388327784,-73.8523623209583,-73.8523575191727,-73.8499749305626,-73.8498210225987,-73.8498436284433,-73.8498424903832,-73.8498411266337,-73.8498404033678,-73.8498395261934,-73.8498363029474,-73.8498322511673,-73.8498137596969,-73.8498058694271,-73.8498020776475,-73.8497988767489,-73.8497962211328,-73.8497950943898,-73.8497940862725,-73.8497701402023,-73.8497544934995,-73.8497381878454,-73.8497217813201,-73.8497055321618,-73.8496894070345,-73.8496734158977,-73.8496642425201,-73.8496539355512,-73.8496185152682,-73.8496102005045,-73.8496001652216,-73.8495912905816,-73.8495863362687,-73.8495814397404,-73.8495766122702,-73.8495719387722,-73.8495674417425,-73.8495632520746,-73.8495594523538,-73.8495561490703,-73.8495525938664,-73.8495500198537,-73.8495476758588,-73.8495484951426,-73.8495485770481,-73.8495524547828,-73.8497308600606,-73.8497326928696,-73.8496367777574,-73.8496386669402,-73.8498688587428,-73.8498695681708,-73.8503147615601,-73.8503147395773,-73.8503742647849,-73.8503764244708,-73.8504163523557,-73.8504184001099,-73.8504499279542,-73.8504565603158,-73.8504817801942,-73.8504837158839,-73.8516228678168,-73.8516356332863,-73.8516902808542,-73.8516709916224,-73.8516226613418,-73.8516249264616,-73.8504857822591,-73.8504751054994,-73.8504204557043,-73.8504183032119,-73.8503678606033,-73.8503658086133,-73.8499980041286,-73.8497371104991,-73.8494938120832,-73.849489779298,-73.8494874774245,-73.8494868694162,-73.849487193038,-73.8494879433641,-73.8494910274917,-73.8494957465128,-73.8495123606577,-73.8495263735185,-73.8495653283724,-73.8495749556846,-73.8495821916793,-73.8495859647979,-73.8495887290542,-73.8495913141527,-73.8495907270451,-73.8495861252853,-73.8495861868718,-73.849591292068,-73.8495970795902,-73.8496031561403,-73.8496103773161,-73.8496130358924,-73.849617400299,-73.849623434817,-73.8496310337892,-73.8496401257918,-73.8496504409401,-73.8496617154408,-73.8496735742172,-73.8496791492526,-73.849685329843,-73.8496921628949,-73.849699778369,-73.849708427545,-73.8497514675155,-73.8497609454888,-73.8497690463917,-73.8497773348782,-73.8497810051181,-73.849784389933,-73.8497874793645,-73.8497903179067,-73.8497928720839,-73.8497951894794,-73.8498016276668,-73.8498070799836,-73.8498082942797,-73.8498150315213,-73.849817465627,-73.849819114673,-73.8498194312396,-73.8498194304299,-73.8498121479652,-73.8498106738803,-73.8498100889878,-73.8498117316842,-73.8498148830908,-73.8498267696491,-73.8498498080579,-73.8498567369541,-73.8498826323617,-73.8498856081573,-73.8498880083087,-73.8498893208179,-73.8499121999631,-73.8509397094504,-73.8509364639653,-73.8499185528998,-73.8498872806375,-73.8498447080574,-73.8498409204437,-73.8498366001427,-73.8498317255162,-73.8498262943367,-73.8498131350058,-73.8497989693572,-73.8497668772079,-73.8497362003665,-73.8496531836167,-73.8495843534843,-73.8495464630235,-73.8494905339534,-73.8494510762917,-73.8493616991155,-73.8492881538969,-73.8492012595272,-73.8491997794827,-73.8491983569139,-73.8491969699857,-73.8491956292934,-73.8491943489423,-73.8491931267296,-73.8491908492488,-73.8491888299035,-73.8491870941846,-73.8491856773962,-73.849184603081,-73.8491836140263,-73.8491843320554,-73.8491853185187,-73.8491866746324,-73.8491883858081,-73.8491904054503,-73.8492029285044,-73.8492177284127,-73.849234925789,-73.8492548508884,-73.8492746246153,-73.8492887645058,-73.8492976002976,-73.8493870577167,-73.8494234520113,-73.8494421137358,-73.8494588065872,-73.8494738402559,-73.849487379028,-73.8495012434971,-73.8495137890027,-73.8495247660925,-73.8495338918321,-73.8495409427998,-73.8495456102457,-73.8495477426599,-73.8495472582156,-73.8495406937947,-73.8495291345937,-73.8495216158552,-73.8495129851483,-73.8495033275319,-73.8494926631581,-73.8494729490394,-73.8494538829606,-73.8494481288945,-73.8494227221584,-73.8493618666762,-73.8493342037846,-73.8493117668668,-73.8492939241004,-73.8492695022477,-73.849251862032,-73.8492406454269,-73.8492374298696,-73.8492358036873,-73.8492364433759,-73.8492386676868,-73.8492421263771,-73.8492467598012,-73.8492525818285,-73.8492595424889,-73.849263456849,-73.8492676449515,-73.8492960072154,-73.8493290404437,-73.8493673000706,-73.8494136653904,-73.849477556218,-73.8495231920476,-73.8495649005389,-73.849603367286,-73.8496446346406,-73.8497424654662,-73.8497865521717,-73.8498276497408,-73.8499344172467,-73.8499944211066,-73.8501756039079,-73.8502096129721,-73.8502303385557,-73.8502323040437,-73.850234220722,-73.8502360685135,-73.8502378544331,-73.8502412846246,-73.8502445600841,-73.8502498394481,-73.8502606656706,-73.8502636551281,-73.8502666224842,-73.8502698746824,-73.8502715669128,-73.8502733055723,-73.8502751045427,-73.8502769638241,-73.8502788948754,-73.8502808965778,-73.850285208824,-73.8502896179352,-73.8502941212662,-73.85029868704,-73.8503079857205,-73.8503171116785,-73.850321124998,-73.8503250914903,-73.8503404094519,-73.8503447798017,-73.8503493383474,-73.8503539659174,-73.8503591841537,-73.8503713617038,-73.8503857403835,-73.8504019872408,-73.8504421173962,-73.8504623769214,-73.8504836628953,-73.8505012124317,-73.8505186990861,-73.8505278566229,-73.8505729439596,-73.8506445275671,-73.850802556775,-73.8508519106285,-73.8509597436332,-73.8510586521182,-73.8511588822416,-73.8511666176466,-73.8511745163957,-73.8511824502199,-73.8511902860846,-73.8512051392021,-73.8512118475053,-73.851217914744,-73.851225019733,-73.8512304773424,-73.8516873553553,-73.8519205472727,-73.8520158256492,-73.8520964483179,-73.8521603986763,-73.8522809761908,-73.8523442645095,-73.8523815719044,-73.8525345815865,-73.8526005387797,-73.8527763562536,-73.8528552953956,-73.8529739584343,-73.8531499306918,-73.8532233094994,-73.8532440720573,-73.8532669278286,-73.8532919615053,-73.8533193385004,-73.8534681212245,-73.8536450698241,-73.8536797409506,-73.8537171100586,-73.8537579607567,-73.8538051223873,-73.8539565077767,-73.8540557089919,-73.8541396953641,-73.8541715708133,-73.8542402730513,-73.8542681772494,-73.8542940146698,-73.8543523304115,-73.8543783332217,-73.8544982659683,-73.8545964185493,-73.8546314693325,-73.8547096110761,-73.8547442826478,-73.8548062259648,-73.8548542920655,-73.8549001856964,-73.8549644151702,-73.8550584217123,-73.8551673946048,-73.8551957726588,-73.8552245033217,-73.8552534429529,-73.8552824278659,-73.8553022800623,-73.855320504664,-73.855336429502,-73.8553496148037,-73.8553663118615,-73.8553794260627,-73.8553884517444,-73.8554506283493,-73.8556161701541,-73.8557347526391,-73.8557346758225,-73.8558186269766,-73.8558756799679,-73.8558745893039,-73.8559265654997,-73.8559329668011,-73.8559397928041,-73.8559460569667,-73.8559515743171,-73.8559561819346,-73.8561213757192,-73.8561409367522,-73.8564537874142,-73.8564399366304,-73.8566769089333,-73.8566715926442,-73.8566533206465,-73.8566213363517,-73.8566187594762,-73.8566094295479,-73.8566028691233,-73.8566495109061,-73.8566534100588,-73.8566813904766,-73.8567025683102,-73.856703774319,-73.8567107416798,-73.8567166980192,-73.8567187222903,-73.8567267682451,-73.8567440555453,-73.856783191625,-73.856803652428,-73.8568247680223,-73.8568320988492,-73.8568412901467,-73.8568520938422,-73.856864192288,-73.8568772045523,-73.8568905755415,-73.8569038060162,-73.8569097784974,-73.8569157487935,-73.856916424825,-73.8569305618581,-73.8569871461256,-73.857080732806,-73.8571287329935,-73.8571778452565,-73.8572794625962,-73.8572982732324,-73.8573185003105,-73.8573405231684,-73.8573682487103,-73.8573952026222,-73.8574199855093,-73.857442612377,-73.8574630450794,-73.8574935136815,-73.8575173357796,-73.8575267060602,-73.8575343581186,-73.8575756101128,-73.8576122335284,-73.8576342068337,-73.8576593241534,-73.857687047151,-73.8577167816424,-73.8577478903299,-73.8580099583406,-73.8580359580916,-73.8580606029558,-73.8580831810342,-73.8580928560566,-73.8580937671542,-73.8581026647801,-73.8581092059747,-73.858114888409,-73.858135725119,-73.8581586875018,-73.8581692814619,-73.8581720906369,-73.8581734007758,-73.8581728999853,-73.8581697266112,-73.8581497386987,-73.8581365752164,-73.8581340679924,-73.8581254220579,-73.85812274224,-73.8581193244985,-73.8581103439309,-73.8580985169115,-73.8580840204605,-73.8580668514261,-73.8580475264075,-73.858026553258,-73.8580047619792,-73.8579968497707,-73.8579877553578,-73.857957159486,-73.8579462618326,-73.8579359943457,-73.8579314448641,-73.8579272140556,-73.8579083833539,-73.8578968091742,-73.8578922103488,-73.8579016554721,-73.8579717930963,-73.8579736503145,-73.8579779869261,-73.8580071092676,-73.8579968441452,-73.8579912078299,-73.8579857118921,-73.8579808467939,-73.8579788421786,-73.8579770612822,-73.8579755371838,-73.8579742709989,-73.8579732600888,-73.8579728610185,-73.8579725322007,-73.8579722747739,-73.85797207351,-73.8579719445013,-73.8579718855387,-73.8579722069898,-73.8579735840979,-73.8579760273527,-73.8579795821829,-73.8579884170501,-73.8580106807068,-73.8580507336236,-73.8581331189015,-73.8581663862647,-73.8582759765529,-73.8583105479409,-73.8583397920101,-73.8584118313145,-73.8584636537244,-73.8584749951258,-73.8585022696847,-73.8585118198584,-73.8585173177108,-73.8585214909577,-73.8585248542611,-73.8585252017042,-73.8590017140746,-73.8590564453236,-73.8590950000835,-73.859091930461,-73.8590811990642,-73.8590300448282,-73.8590747615189,-73.8591230174794,-73.8591072442365,-73.8591073220796,-73.8592069151527,-73.8592520435447,-73.8592512623232,-73.8592034906694,-73.8592361058371,-73.8592996965809,-73.8593419053047,-73.8594632808303,-73.8593119145823,-73.8593486011995,-73.8595083348476,-73.8594158876295,-73.8590999872229,-73.8591031712013,-73.859066385959,-73.859088877022,-73.8589904893737,-73.8589403443186,-73.8589694590099,-73.8589980889287,-73.8590255282003,-73.859051100305,-73.8590741747574,-73.8590941826513,-73.8591106306864,-73.8591231133293,-73.8591313228145,-73.8591350567309,-73.8591343198297,-73.8591318830869,-73.8591280401277,-73.8591228585809,-73.8591153905055,-73.8591059796067,-73.8590785149879,-73.859073094663,-73.8590665971082,-73.8590459572914,-73.8590427912807,-73.8590340303879,-73.8590260006667,-73.8590227377988,-73.8590199353911,-73.8590150068732,-73.859012474675,-73.8591246122371,-73.8591032279805,-73.8590075486967,-73.8590076575516,-73.8590126256115,-73.8590158623747,-73.8590267291246,-73.8590304506407,-73.8590316943146,-73.8590322609396,-73.8590313789377,-73.8590278402291,-73.8590212250379,-73.8590158599166,-73.8590081859403,-73.8589981662399,-73.8589857998795,-73.8589711614874,-73.8589540346852,-73.8589107413936,-73.8588557160953,-73.8588048897857,-73.8587566398488,-73.8587103004744,-73.858651027365,-73.8586507788746,-73.858638071021,-73.8586270572705,-73.8586117707735,-73.8585986022946,-73.8585931069524,-73.8585884050855,-73.8585845314169,-73.8585815239076,-73.8585764279673,-73.8585723356879,-73.8585662329842,-73.8585649236142,-73.8585664570324,-73.8585694261782,-73.8585784455328,-73.8585912769972,-73.8586081570027,-73.8586303130777,-73.8586413032532,-73.8586690018288,-73.8586791994799,-73.8586887976565,-73.8586944557939,-73.8586968468518,-73.8586968111797,-73.8586959592165,-73.8586907357678,-73.8586828335007,-73.8586722305374,-73.8586588762671,-73.8586094910695,-73.8585672513092,-73.8585449318842,-73.8584830336685,-73.8584712422876,-73.8584450638356,-73.8584295364326,-73.8584256195931,-73.8584209222441,-73.8583971812771,-73.8583918434039,-73.8583874538475,-73.8583230983823,-73.8582674310271,-73.8582615204913,-73.858255747815,-73.8582341240623,-73.8582053737903,-73.8581695641935,-73.8581575411004,-73.8581435417625,-73.8581281715849,-73.8581120350973,-73.8580913167539,-73.8580690623594,-73.8580455195342,-73.8580358282388,-73.858021091643,-73.8579996160449,-73.8579799805232,-73.8579620284476,-73.8579456899835,-73.8579217200928,-73.8578631484034,-73.8578059968867,-73.8577298616972,-73.8577090935057,-73.8576848260181,-73.857602556052,-73.857573784934,-73.8575473410334,-73.8575358112572,-73.8575252176092,-73.8575054207683,-73.8574657686572,-73.8574473935771,-73.8573774340095,-73.8573613658272,-73.8573483429966,-73.8572937439897,-73.8572855959106,-73.8572434981615,-73.8572383645425,-73.8572324711961,-73.8572180769616,-73.8572031450029,-73.8571681858959,-73.8571535620552,-73.8571234576355,-73.8570511235634,-73.8570304295576,-73.857011189699,-73.8570088928026,-73.8570065822965,-73.85700423682,-73.8570018440101,-73.8569969380467,-73.8569917453668,-73.8569816544257,-73.8569625005109,-73.8569521826025,-73.8569485775113,-73.8569441800101,-73.8569399361998,-73.8569358006761,-73.8569154596122,-73.8568664875655,-73.8568415584446,-73.8568113376548,-73.8567842570316,-73.8568309468409,-73.8566251050963,-73.8565943049048,-73.85658367207,-73.8565601248598,-73.8565517820311,-73.8565428156593,-73.8565210751089,-73.8565168695887,-73.8565123593114,-73.8565074691837,-73.8565021433667,-73.8565003764531,-73.8564985392624,-73.8564946154943,-73.8564903374551,-73.8564855973523,-73.8564763470182,-73.8564516069263,-73.8564445353755,-73.856441347344,-73.856438338054,-73.8564098120099,-73.8563852262836,-73.8563646514819,-73.8563558975458,-73.8563481731828,-73.8563343560463,-73.8563213857149,-73.8562849514648,-73.8562691866179,-73.8562533829157,-73.8562107120178,-73.8562002031507,-73.8561920416779,-73.8561785660261,-73.8561690442091,-73.8561637123685,-73.8561627502643,-73.8561704583648,-73.8561760427645,-73.8561760439437,-73.8561743696005,-73.8561737828743,-73.8561727578656,-73.8561712812902,-73.8561693571337,-73.8561669694893,-73.8561641329056,-73.8561569904048,-73.8561491032481,-73.8561393208458,-73.8560977299245,-73.8560810462333,-73.8560750929999,-73.8560664806243,-73.8560569353308,-73.8560374216807,-73.8560202758011,-73.856005866244,-73.855994502745,-73.8559864295653,-73.8559818202406,-73.8559790045778,-73.8559742376895,-73.8559676482223,-73.8559594140093,-73.8559497572716,-73.8559389386217,-73.8559272500289,-73.8559150069408,-73.8559025397695,-73.8558901849745,-73.8558782759827,-73.855364155737,-73.855228869316,-73.8552279423134,-73.8552218638764,-73.8551274939933,-73.8549497141386,-73.8549154203117,-73.8548368560723,-73.8548017316441,-73.8547645733254,-73.8547313812559,-73.8547070531823,-73.8546802286187,-73.8545703238903,-73.8545388696969,-73.8545109791795,-73.8544987783975,-73.8544845470797,-73.8544674801146,-73.8544499838544,-73.8544275447974,-73.8544158710038,-73.8544053243703,-73.854392114847,-73.8543774136702,-73.8543140923596,-73.8542988328643,-73.8542849819707,-73.8541687791334,-73.8540180561719,-73.8539315220122,-73.8537152444741,-73.8535406808038,-73.8534518446134,-73.8533645753844,-73.8533203375243,-73.8532843310634,-73.8532539136759,-73.8532286567929,-73.8531394532828,-73.8530431848867,-73.8530198637786,-73.8529945522266,-73.8529374264022,-73.8528729257569,-73.8528525604419,-73.8528423013387,-73.8528420113836,-73.8528617928357,-73.8528899026119,-73.8529729685184,-73.853066638841,-73.8531259333368,-73.8531642037782,-73.8532509376302,-73.8532896704259,-73.8534696174507,-73.8535377195181,-73.8535905188923,-73.8536144229767,-73.8536726190396,-73.8536995815986,-73.8538649677078,-73.8540177076405,-73.8541534556627,-73.8542411911325,-73.8543260101729,-73.8543536350784,-73.8543836478858,-73.8544161171376,-73.8544644028455,-73.8545002771564,-73.8545350335831,-73.8545682818972,-73.8545997369168,-73.8546311018012,-73.8546621264137,-73.8546934145886,-73.8547274472931,-73.8547654977257,-73.8547851813468,-73.8547924992481,-73.854797686158,-73.8548008362411,-73.854801947332,-73.8548006534152,-73.8547953603152,-73.8547935555014,-73.8547928987249,-73.8547917082223,-73.8547901501402,-73.8547882875254,-73.8547748875346,-73.8547748676024,-73.8547725437133,-73.8547670010299,-73.8547509245973,-73.8547451367765,-73.8547271693993,-73.8547134155777,-73.8547006703473,-73.854693308821,-73.8546740230833,-73.8546667849742,-73.8546457583267,-73.8546375473026,-73.8546148631208,-73.8546074354342,-73.8545936426242,-73.8545792407035,-73.8545612018878,-73.8545485136166,-73.8545315068943,-73.8545261443121,-73.8545254129659,-73.8545234573319,-73.8545212436374,-73.85451938179,-73.8545147646745,-73.8545077372496,-73.8545029730325,-73.8544961845873,-73.8544864837776,-73.8544773471365,-73.8544719407123,-73.854465992515,-73.85445942841,-73.8544522277977,-73.8544472824194,-73.8544348052176,-73.8544237147415,-73.8541592614838,-73.8540697206796,-73.8538989057514,-73.8538312013555,-73.8536295532005,-73.8535519793621,-73.8534774943624,-73.8534095404109,-73.8533785130151,-73.8533068131877,-73.8532744562699,-73.8531679145579,-73.8531286860247,-73.8530937697147,-73.853005963764,-73.8528362203768,-73.8527991299458,-73.8527712656627,-73.8527451415859,-73.8527359569694,-73.852720981704,-73.852698951807,-73.8526885390596,-73.8526792733986,-73.8526711413716,-73.8526641451899,-73.8526583069305,-73.8526535906472,-73.8526475996978,-73.8526474241987,-73.8526529909005,-73.8526641843186,-73.8526807110952,-73.8527070359152,-73.8527343133696,-73.852762579209,-73.8527918796175,-73.8528350217929,-73.852858796491,-73.8528846908182,-73.8529094802153,-73.8529791055956,-73.8530608095311,-73.8531465716288,-73.8531747881396,-73.853201198733,-73.8533545089095,-73.853424455239,-73.8534617023301,-73.8535700185279,-73.8536655370685,-73.8537169511726,-73.8537433789416,-73.8537533639223,-73.8537613721071,-73.8537629995277,-73.853769898906,-73.8537722241845,-73.8537752195276,-73.8537776078747,-73.8537785491069,-73.8537779734007,-73.8537759581933,-73.8537726775182,-73.853731265373,-73.8536973940717,-73.8536903856595,-73.8536723572886,-73.8536660273111,-73.8536578451733,-73.8536496767006,-73.8536360708706,-73.85363080166,-73.8536315280859,-73.8536365935801,-73.8536504217716,-73.8536839681405,-73.8537108977222,-73.8537263587465,-73.853740514107,-73.8537335159383,-73.853718255533,-73.8536856184859,-73.8535845163886,-73.8535323717638,-73.8535176462218,-73.8533882035106,-73.8532170102761,-73.8530403426025,-73.8529022710568,-73.8528287203345,-73.8527662719851,-73.8526850827292,-73.8526372529344,-73.8526241681154,-73.8526231078306,-73.8526571103394,-73.8526587999629,-73.8526309825624,-73.8525926125183,-73.8525804269362,-73.8525561151049,-73.8525315320726,-73.8524907658293,-73.8524265122297,-73.8523360101605,-73.8522547863188,-73.8521406258595,-73.852002889473,-73.8519316067721,-73.8518973071364,-73.8518165129967,-73.8516807217834,-73.8515907715734,-73.8514372374564,-73.8512917816523,-73.8511201166095,-73.8509703415275,-73.8507980725843,-73.8506280829412,-73.8504908278996,-73.850326381366,-73.8501676964223,-73.8500072169576,-73.8498408564086,-73.8497346793859,-73.8496225183908,-73.8494823389847,-73.8493365487603,-73.8492203438544,-73.8491345572552,-73.8490616083509,-73.8489834275515,-73.848930518328,-73.8489013144504,-73.8488619839784,-73.8488489472311,-73.8488584837078,-73.8488796549556,-73.8489014742577,-73.8489619483971,-73.849017211755,-73.8490781479572,-73.8490316303219,-73.8489627121751,-73.8487837015379,-73.8487774547026,-73.848771220004,-73.8487845736854,-73.8488469096149,-73.8488716220684,-73.8488765456334,-73.8488456648997,-73.8488137643307,-73.8487099936133,-73.8485598873898,-73.848400677251,-73.8482344227651,-73.8480593399491,-73.8479236486364,-73.8478196718063,-73.8476376207219,-73.8474584037846,-73.8472983967437,-73.8471264674746,-73.8468583117691,-73.8467714617375,-73.8467308665806,-73.8466091425802,-73.8465163191613,-73.8464472761264,-73.8463782325881,-73.8463226431793,-73.8462442065603,-73.8461155783733,-73.8460330637517,-73.8459656757289,-73.8458748717784,-73.845692560646,-73.8456625160152,-73.8456082717433,-73.8455780270891,-73.8455817326852,-73.8456152437029,-73.8456046907874,-73.8455653750983,-73.845506387169,-73.8454278023763,-73.8453669860478,-73.8452788515889,-73.8451963347884,-73.8450589172057,-73.8449801717,-73.8449476501911,-73.844886607545,-73.8448708565802,-73.8447994423333,-73.8446668184044,-73.8445991504444,-73.8445139190618,-73.8443847198837,-73.8442231186504,-73.8440788737386,-73.8439052393605,-73.8438249965106,-73.8437985793812,-73.8437323304134,-73.8435466893899,-73.8434326202129,-73.8433851140708,-73.8433376087611,-73.8433241415377,-73.8433558880399,-73.8433641564146,-73.8433511805362,-73.8433063238679,-73.8432346215896,-73.8431796131482,-73.8431483000161,-73.8431105900181,-73.8430436391916,-73.8429342686601,-73.842895458472,-73.8428605365847,-73.842848653224,-73.8428925458173,-73.8432849719419,-73.8432065363665,-73.8428087524122,-73.8422595936833,-73.8429206902527,-73.8428667525936,-73.8421674734113,-73.8420880490143,-73.8420333490165,-73.8419786496746,-73.8419048025206,-73.841820621436,-73.841727017147,-73.8415967418836,-73.841548646721,-73.8415080407278,-73.8414212272911,-73.8413729488767,-73.8413071108237,-73.8412908228942,-73.841309210666,-73.8413449688797,-73.8414198844707,-73.8414224368436,-73.8413886311956,-73.8413064226972,-73.8412855112433,-73.841279032704,-73.8413004755521,-73.8412994354598,-73.8405998229451,-73.8401393036445,-73.8404397757594,-73.8404005522561,-73.8404151797583,-73.8392338815539,-73.8392094832411,-73.8384194408379,-73.8384291582917,-73.8378996750371,-73.8378704405095,-73.8383901335455,-73.8391900472718,-73.8402242579982,-73.8402586080913,-73.8399709959005,-73.839036768124,-73.8384336828721,-73.8384008307784,-73.8373622528982,-73.8373024877491,-73.8372279142248,-73.8371749743957,-73.8370840676992,-73.8370649888026,-73.8370714677767,-73.8371260469754,-73.8368630862893,-73.8366328892337,-73.8366294253706,-73.8365907861628,-73.8366102142351,-73.8366159894419,-73.8366935352506,-73.8367625557923,-73.836829904335,-73.8368845519323,-73.8369090553901,-73.8369850193697,-73.8370959764528,-73.8371487549736,-73.8372298811017,-73.8372477046244,-73.8373208541538,-73.8374471459377,-73.8375111765367,-73.8375133794964,-73.8375156667403,-73.8375168383489,-73.8375158801366,-73.83751584646,-73.8375104031856,-73.8375060145697,-73.8374999820409,-73.8374667297139,-73.8374598338326,-73.8374547848095,-73.8374456942373,-73.837441615315,-73.837442180247,-73.8374442254277,-73.837447468808,-73.8374483292751,-73.8374493806748,-73.8374520266737,-73.8374554564251,-73.8374597128238,-73.8374686881968,-73.8374910219434,-73.837500207957,-73.8375036379504,-73.8375063812467,-73.837508464171,-73.8375092561835,-73.8375099010895,-73.8375208894185,-73.8375270569787,-73.8375316673332,-73.8375338039271,-73.8375331672405,-73.8375281726597,-73.837527081776,-73.8375278139443,-73.8375301828611,-73.8375192836421,-73.837514377804,-73.837507601637,-73.8375035888358,-73.8373803439679,-73.8373782033161,-73.8370268279212,-73.837026885597,-73.8368181495703,-73.836814104385,-73.8370187262289,-73.8370125769383,-73.8373722220789,-73.8373721299883,-73.8374819140324,-73.8374508919051,-73.8374200148674,-73.8374143511726,-73.8373942918109,-73.83739029705,-73.8373878196751,-73.8373868129715,-73.8373872643558,-73.8373914393444,-73.8374084843626,-73.8374107295372,-73.8374100065504,-73.8374080353147,-73.8373973446218,-73.8373926697835,-73.8373822323697,-73.837377900121,-73.8373744303478,-73.8373734632574,-73.8373735206522,-73.8373750628347,-73.8373863455611,-73.8373890635478,-73.8373889413932,-73.8373874204076,-73.8373844756458,-73.8373800841348,-73.8373755570148,-73.837369596236,-73.8373644340958,-73.8373472569724,-73.8373396629284,-73.8372873952907,-73.8372791334292,-73.8372716779358,-73.8372589211474,-73.8372490846532,-73.8372355414541,-73.8372320821526,-73.8372309850249,-73.8372311986952,-73.8372321098003,-73.8372376576321,-73.8372389297466,-73.8372386293318,-73.8372359179059,-73.8372343655256,-73.8372319940143,-73.837228781882,-73.8372246700367,-73.8371932389034,-73.8371840541178,-73.8371806869702,-73.8371781504834,-73.8371764070544,-73.8371754453492,-73.8371730234024,-73.8371742727186,-73.8371767424435,-73.8371791828275,-73.8371876673392,-73.8372267484199,-73.8372393458872,-73.8372421560892,-73.8372607251764,-73.8372722567523,-73.8372804584517,-73.8372808514521,-73.8372807613386,-73.837280656971,-73.8372804913477,-73.8372803978697,-73.8372803502172,-73.8372802912989,-73.8372802444608,-73.8372801729376,-73.8372801015876,-73.8372800429803,-73.8372799709277,-73.8372799001519,-73.8372798170114,-73.8372797461712,-73.8372796629879,-73.8372795804186,-73.8372794024147,-73.8372790108047,-73.8372785823879,-73.8372775827064,-73.837266001129,-73.8372443196715,-73.8371835081318,-73.8371631119537,-73.8371421058783,-73.8371403549997,-73.8371396215367,-73.8371412213885,-73.8371465826774,-73.8371620804049,-73.8371675553936,-73.8371706706596,-73.8371700220552,-73.8371688384306,-73.8371666829684,-73.8371635673516,-73.8371595053576,-73.8371545086411,-73.8371486225017,-73.8371343298951,-73.8371166282192,-73.8370969993734,-73.8370769836274,-73.8370674341211,-73.8370585143649,-73.8370244177763,-73.8369875229484,-73.8369533227849,-73.8368751148168,-73.8368372548438,-73.8368030213076,-73.8367708647443,-73.8367046913399,-73.8365594745967,-73.8365002315705,-73.8364746941772,-73.8364012061894,-73.8363780957213,-73.8363573014982,-73.836324280858,-73.8362883747538,-73.8362546207189,-73.8361739331066,-73.8361320352926,-73.8360115515264,-73.8358970710529,-73.8358420654401,-73.8357872203977,-73.835733118655,-73.8356802206902,-73.8356580816107,-73.8356361852022,-73.8356155114778,-73.8355966535509,-73.8355802632775,-73.8355663876003,-73.8355552153945,-73.8355506795717,-73.8355468539768,-73.8355328510253,-73.8355204071833,-73.8355092848568,-73.8354988958976,-73.835496906232,-73.835495972851,-73.8354963427606,-73.8354945129096,-73.8354911034666,-73.8354834603427,-73.8354724855882,-73.8354581455256,-73.8354404160666,-73.8354194845401,-73.8353949047019,-73.8353664018567,-73.8353315024208,-73.8352873522948,-73.8352390508021,-73.8351858044978,-73.8351538256697,-73.8351250094095,-73.8349780269809,-73.8348305034449,-73.8347838186912,-73.8347783348525,-73.8345718401692,-73.8344094198247,-73.8343230279735,-73.8342825536445,-73.8342429246197,-73.8342080856836,-73.8341656427456,-73.8341495333757,-73.8341356652128,-73.8341040311044,-73.8340944160126,-73.8340866372143,-73.8340700485124,-73.8340556094338,-73.8340386640801,-73.8340238877849,-73.8340153585356,-73.8340130586667,-73.8340119530419,-73.8340133190867,-73.8340100722631,-73.8340050630477,-73.8340009128614,-73.8339953026959,-73.8339602331381,-73.8339173279228,-73.8339012951562,-73.8338741748252,-73.8338576792035,-73.8338426105596,-73.8338278680335,-73.833813167647,-73.8337954810989,-73.8337759787702,-73.8337544480732,-73.8337302141756,-73.8336582986799,-73.8336243060336,-73.833599746345,-73.8335801772682,-73.8335378246062,-73.8335186358529,-73.8335031118512,-73.8334884608336,-73.833472644589,-73.8334566482067,-73.8334409313363,-73.8334260048772,-73.8334039699257,-73.8333541772204,-73.833309302012,-73.8332755900768,-73.833266887727,-73.833257595359,-73.8332370922419,-73.8332137172594,-73.8331834262378,-73.8331639070994,-73.833119556496,-73.8330984850652,-73.8330617942645,-73.833011201537,-73.8329690119346,-73.8329487737087,-73.8329293717141,-73.8329207297279,-73.8329126686747,-73.8329022798741,-73.832891400987,-73.8328562425718,-73.8328420054377,-73.8328075819369,-73.8327968490003,-73.8327867590612,-73.8327782953704,-73.832768660113,-73.8327261578566,-73.8326597673408,-73.8326010642634,-73.8325688586259,-73.8325387240547,-73.8325106364789,-73.8324845939412,-73.8324076713228,-73.8323253960775,-73.8322854413618,-73.8322482535866,-73.8322319869708,-73.8321961405534,-73.8321831471979,-73.832161006322,-73.8321408429274,-73.83211813286,-73.8320967198753,-73.8320862807575,-73.8320670430497,-73.8320580512578,-73.831982011453,-73.831954187398,-73.8319364253556,-73.8319189243068,-73.8319017675677,-73.8318657116592,-73.8318379215461,-73.8318168066416,-73.8318011223299,-73.8317924013116,-73.8317800623501,-73.8317731964558,-73.8317646012586,-73.8317543363848,-73.8317425561311,-73.8317185418299,-73.8316893160563,-73.8316657849287,-73.8316420224039,-73.8316264284816,-73.8316100547248,-73.8315749348592,-73.8315632822403,-73.8315513726695,-73.8315266952119,-73.8314980541268,-73.8314733739143,-73.8314652067866,-73.8314580484436,-73.8314520518862,-73.8314473475409,-73.8314459006845,-73.8314445011178,-73.8314418774933,-73.8314395731395,-73.8314376710139,-73.8314362888939,-73.831435487383,-73.8314353129363,-73.8314357681011,-73.8314362860445,-73.8314369940182,-73.8314486380926,-73.831462773095,-73.8314786815224,-73.8314871408735,-73.8314958517997,-73.8315759380439,-73.831595633309,-73.8316686331891,-73.8316777614239,-73.8316882051471,-73.8317197321571,-73.8318005388155,-73.8318331730223,-73.831863178599,-73.8318836035021,-73.8318915404827,-73.8318983771186,-73.8319162764075,-73.8319334019433,-73.8319511846373,-73.8319654857831,-73.8319764602668,-73.83198460174,-73.8319905352748,-73.8319927096875,-73.8319923460442,-73.8319896769523,-73.8319896071371,-73.831989214208,-73.8319919695185,-73.8319996926694,-73.8320145825813,-73.8320342959017,-73.8320400085848,-73.8320698642152,-73.8320938108713,-73.8321027574814,-73.8321184197733,-73.8321362575627,-73.8321411593998,-73.8321487200091,-73.8321491450611,-73.8321482043049,-73.8321420712418,-73.8321320657602,-73.8321205720609,-73.8320926141504,-73.8320711081038,-73.8320547674901,-73.8320522465236,-73.8320138440064,-73.8319663976775,-73.8319552968357,-73.8319150734245,-73.8318957473128,-73.8318755490509,-73.8318567064817,-73.8318419080428,-73.8318305799804,-73.8318248335112,-73.8318191832819,-73.8318135381466,-73.8318090153389,-73.83180861575,-73.8318036961292,-73.831793952622,-73.8317704456483,-73.8317569299928,-73.8317537170288,-73.8317433157102,-73.8317244357661,-73.8316911764934,-73.8316608092787,-73.8316353113213,-73.8315549569592,-73.8315088724828,-73.8314859742178,-73.8314377301935,-73.8313852926183,-73.8313735338278,-73.8313590483407,-73.8313415544379,-73.8313181047826,-73.8312710216949,-73.8312331137441,-73.8311548609695,-73.8310761015808,-73.8310300162704,-73.8309921604013,-73.8309626970729,-73.8308818630855,-73.8307803563245,-73.8307054772942,-73.8306597213265,-73.8306123010916,-73.8305677931393,-73.8305250120632,-73.8304838384136,-73.8304511252325,-73.8303998595889,-73.8303630805944,-73.8302747655989,-73.830270481087,-73.8301913154801,-73.8301544391422,-73.8301233950612,-73.8301087619912,-73.8300926392661,-73.8300747093041,-73.8300518978067,-73.8300074152255,-73.8299732710481,-73.8298832526848,-73.8297751081308,-73.8297371745017,-73.8296859687039,-73.8295605073398,-73.8294772382874,-73.8294266966538,-73.8292878158699,-73.829161940046,-73.8291357944974,-73.8291091360507,-73.8290813648905,-73.8290488866591,-73.8289503571012,-73.8288785592665,-73.8288154319914,-73.8287125364049,-73.8286501058817,-73.8286005124541,-73.8285189301212,-73.8285911382139,-73.8292971366424,-73.8292317465186,-73.8284799993745,-73.8283974307666,-73.8283227582265,-73.828087887253,-73.8280748924746,-73.8280632079706,-73.8280379589597,-73.8280211013301,-73.8280191198214,-73.8279650829266,-73.8279141374605,-73.827920208738,-73.8279197337085,-73.8277927784251,-73.8277857137446,-73.8277837841145,-73.8277845736865,-73.827797207354,-73.8278045224107,-73.8278137932253,-73.8278202839657,-73.8278292637064,-73.8278639049884,-73.8278875081374,-73.8278975202539,-73.8279096865817,-73.8279170518339,-73.8279202263338,-73.8279203171207,-73.8279178345461,-73.8279063864718,-73.8278974695319,-73.8278939457798,-73.8278872039361,-73.8278865058678,-73.8278872228765,-73.8278887132359,-73.8278941359297,-73.8278989464259,-73.8279155637413,-73.8279338422016,-73.8279597782931,-73.8279732152972,-73.8279776450364,-73.8279799623541,-73.827980373964,-73.8279791603718,-73.8279729345594,-73.8279688570556,-73.8279695086866,-73.8279672449034,-73.8279667384919,-73.8279699773486,-73.8279717197728,-73.8279740950432,-73.8279774341962,-73.827979489617,-73.8279818186779,-73.8279837577867,-73.8279860185326,-73.8279885877119,-73.8280191712943,-73.828022553604,-73.8280159507809,-73.8280129803821,-73.828010436448,-73.8280083766549,-73.8280068369433,-73.8280054641173,-73.8280056547058,-73.8280064503866,-73.8280137235592,-73.8280248715984,-73.8280522646091,-73.8280838802924,-73.8280936084658,-73.8281070896524,-73.828115985711,-73.8281378530296,-73.8281427741165,-73.8281469011996,-73.8281601150291,-73.8281750547651,-73.8281991620083,-73.828207996744,-73.8282139355277,-73.8282301195962,-73.8282439276414,-73.8282598831811,-73.8282603202986,-73.8282626283355,-73.8282857216235,-73.8282916389549,-73.828311457451,-73.828314536548,-73.8283247688867,-73.8283265100748,-73.8283427607983,-73.8283587502388,-73.8283852812648,-73.8283992593345,-73.8283994205969,-73.8284127982247,-73.8284354021509,-73.8284470120795,-73.8284598336017,-73.8284735119724,-73.8284877636888,-73.8285183200744,-73.8285296539386,-73.8285401721286,-73.8285578243105,-73.828572424305,-73.8285764426279,-73.8285808528249,-73.8285997419102,-73.8286045318389,-73.8286089526041,-73.8286101140829,-73.8286112985239,-73.8286136914404,-73.8286161302811,-73.8286185568929,-73.8286209827162,-73.828623300956,-73.8286254524083,-73.8286269776096,-73.8286273551027,-73.8286318074325,-73.8286353444791,-73.8286378746646,-73.8286393137288,-73.8286395783191,-73.8286365763191,-73.8286343147076,-73.8286255772901,-73.8286214492205,-73.8286218963724,-73.8286240286923,-73.8286272547001,-73.828631902214,-73.8286486203378,-73.8286692597616,-73.8286843346028,-73.8286916168457,-73.8286951052269,-73.8286984305136,-73.8287015559444,-73.8287030474011,-73.8287044929586,-73.8287058789741,-73.8287072190932,-73.8287084992292,-73.8287097325843,-73.8287120462173,-73.8287143718711,-73.8287228629976,-73.8287244418332,-73.8287260072009,-73.8287408724285,-73.8287549721202,-73.8287561103734,-73.8287572831818,-73.8287585046233,-73.8287597597326,-73.8287610513783,-73.8287623535247,-73.8287650403317,-73.8287677866013,-73.8287704596177,-73.8287729072672,-73.8287749507548,-73.828780109538,-73.8287840688513,-73.8287867477618,-73.8287880867679,-73.8287881173917,-73.8287873645984,-73.8287834262599,-73.8287633247015,-73.8287546722156,-73.8287532714507,-73.8287535319323,-73.8287546416061,-73.8287565917898,-73.8287632487474,-73.8287863496255,-73.828806159871,-73.8288077283588,-73.8288096294295,-73.8288143216992,-73.8288199627045,-73.8288230397387,-73.8288262351358,-73.8288350536631,-73.8288421105,-73.8288467939715,-73.8288490244251,-73.8288626793351,-73.8288872484245,-73.8289357005723,-73.82895826242,-73.8289768362135,-73.8289953996389,-73.829013966959,-73.8290305441415,-73.8290471191507,-73.8290583740773,-73.8290696086922,-73.8290815241437,-73.8290960772771,-73.8290993621062,-73.82910198708,-73.8291052421193,-73.8291045343394,-73.829102029492,-73.8290726813123,-73.8294515775454,-73.829487990964,-73.8295496252148,-73.8298572613695,-73.8298236118633,-73.8299406091385,-73.8300329443145,-73.8300156145071,-73.830041505216,-73.8300319757947,-73.8299853707851,-73.8299680875736,-73.8299351608173,-73.8299402970841,-73.8299800013606,-73.8299756518178,-73.8299333662679,-73.8299091686461,-73.8298797006409,-73.8298813907157,-73.8299279917501,-73.8299175973826,-73.8298735816801,-73.8298528402873,-73.8298225129244,-73.8298242000693,-73.8298716692633,-73.8298630009959,-73.8298129404613,-73.8297956491651,-73.8297627264713,-73.8297670088826,-73.8298144727028,-73.8298023533342,-73.8297557465548,-73.8297358677,-73.8297072676678,-73.8297089564714,-73.8297529658668,-73.8297451643854,-73.8296976951446,-73.8296778137927,-73.8296466147608,-73.8296534908379,-73.8296949122683,-73.8296914282374,-73.8296396415092,-73.82962062784,-73.8295885638311,-73.8295937185881,-73.8296368583435,-73.8296307782157,-73.8295833185762,-73.8295608443769,-73.829492276532,-73.8294707247006,-73.8295040012882,-73.82976585679,-73.8297866030409,-73.8298307789223,-73.8298273637335,-73.8297540210477,-73.8297704757728,-73.8298420856107,-73.8298602362405,-73.8299044120343,-73.829904445595,-73.8298285197538,-73.8298406490147,-73.8299139891951,-73.8299312725471,-73.8299780379271,-73.8299746269444,-73.8299056078384,-73.8299160056104,-73.8299893478836,-73.8300109562862,-73.8300525355158,-73.8300525724024,-73.8300335622905,-73.829976644932,-73.829992230628,-73.8300543467955,-73.8300828612234,-73.8301270266901,-73.8301227477592,-73.8300485497951,-73.8300684464461,-73.8301348729292,-73.8301547509279,-73.8301989255712,-73.8301989657734,-73.8301264912601,-73.8301386247866,-73.8302085067143,-73.8302318413919,-73.8302742840467,-73.8302734586587,-73.8301983991715,-73.8302174345567,-73.8302855888015,-73.8303054659663,-73.8303487823446,-73.8303470854679,-73.8302797968067,-73.8302884700164,-73.8305222756408,-73.8305058345289,-73.8303945364234,-73.8303772531652,-73.8302958387891,-73.8302949263392,-73.8304122666409,-73.8303984157369,-73.8302793497512,-73.8302629286933,-73.8301789076457,-73.8301806032634,-73.8302522262501,-73.8303022656767,-73.8302849525636,-73.8302124176842,-73.8301684784509,-73.8301485933849,-73.8301182774176,-73.8300714993509,-73.830074046676,-73.8301922576882,-73.8301766722053,-73.8300601894346,-73.830042040873,-73.8299597501245,-73.8299597115421,-73.8300796563303,-73.8300666688711,-73.8299467213843,-73.8299311651675,-73.8298497393932,-73.82984969743,-73.8299679047682,-73.8299566400493,-73.8298392898919,-73.8298159596576,-73.8297847702346,-73.8297191848798,-73.8297278412522,-73.829509171038,-73.8290596676864,-73.8290090743692,-73.828960444934,-73.8289095957073,-73.8288579293983,-73.8288068712561,-73.828757829753,-73.8287121577285,-73.8286645165372,-73.828585483157,-73.8285003272194,-73.8284097063524,-73.8283143203924,-73.8282149059798,-73.8281122308697,-73.8280070880018,-73.8279002893762,-73.8276056090772,-73.8276027889433,-73.8275885963555,-73.8275785493864,-73.8275607571205,-73.8275380084077,-73.8275157986197,-73.8274968849233,-73.8274795080914,-73.8274590338144,-73.8274405711723,-73.8274242282285,-73.8274055025788,-73.8273776931525,-73.8273588429042,-73.8273531368229,-73.8273447009813,-73.8273331767463,-73.8273199967443,-73.8273106614427,-73.827300198207,-73.8272904333818,-73.8272850387962,-73.8272836072227,-73.8272897646315,-73.8272976506556,-73.827298282291,-73.8272971026192,-73.8272944488063,-73.8272929981584,-73.8272902749056,-73.8272887537967,-73.8272821144383,-73.8272670484356,-73.8272499611361,-73.8272432851017,-73.8272345277413,-73.827222907285,-73.8272141262322,-73.8272092466439,-73.8272033286361,-73.8271893127914,-73.8271721960532,-73.8271576051503,-73.8271435742503,-73.8271264131901,-73.827110274994,-73.8270931742999,-73.8270741648767,-73.8270600857157,-73.8270431688529,-73.8270280644883,-73.8270120797275,-73.8269986882981,-73.8269877699252,-73.8269836152528,-73.8269791299634,-73.8269761331764,-73.8269750965656,-73.8269709151065,-73.8269700163889,-73.8269695833253,-73.8269703797001,-73.8269720485954,-73.8269752051808,-73.826979789216,-73.8269827931124,-73.8269855433577,-73.826990797513,-73.8269934694809,-73.8269989718579,-73.8270121432221,-73.8270333026989,-73.827046543209,-73.8270583749397,-73.8270744122585,-73.827088431521,-73.8271015684704,-73.8271122553128,-73.8271196969115,-73.8271272872512,-73.8271364852386,-73.8271490459672,-73.827161276906,-73.8271723586359,-73.8271803954517,-73.8271866948234,-73.8271924001669,-73.8271961600784,-73.8271978557148,-73.8271970542192,-73.827194950571,-73.827191016701,-73.8271864326282,-73.8271821380805,-73.8271736560119,-73.8271632624306,-73.8271494703902,-73.8271291243554,-73.8271143925931,-73.8270962341913,-73.8270722150752,-73.8270674456251,-73.8270607189322,-73.8270381895881,-73.8270305591211,-73.8269793177835,-73.8269192831184,-73.8268997881391,-73.8268841823594,-73.8268684709321,-73.8268666088378,-73.8268510044664,-73.8268473410131,-73.8268307631098,-73.8268100142613,-73.8267927031821,-73.8267763627913,-73.8267580782078,-73.8267385616669,-73.8267154511218,-73.826694572381,-73.8266717458493,-73.826652866685,-73.8266339533126,-73.8266160544051,-73.8265749359417,-73.8265359831284,-73.8264999472252,-73.8264665002288,-73.8264488063056,-73.8264109479002,-73.826403243279,-73.826383533314,-73.8263640011442,-73.8263574907308,-73.8263426926312,-73.826330073524,-73.8263128189316,-73.8262983637238,-73.8262636490374,-73.8262382879492,-73.8262025899919,-73.826160296923,-73.8261182190996,-73.8260718964991,-73.8259993048382,-73.8259412067233,-73.8259073669954,-73.8258716398926,-73.8258179151769,-73.825772677445,-73.8257221928607,-73.8256702140956,-73.8256118196272,-73.8255621423105,-73.8255267623435,-73.8254981285771,-73.8254915821559,-73.825479264461,-73.8254418543866,-73.8254115588335,-73.8253786421847,-73.8253419934664,-73.8253034523545,-73.8252677084013,-73.8252326919296,-73.8252087751785,-73.8251820325112,-73.8251647119696,-73.8251403602042,-73.8251158863622,-73.8251024306893,-73.8250799026241,-73.8250649669944,-73.8250461253825,-73.8250250372478,-73.8250100948325,-73.8249936410678,-73.8249767018886,-73.8249597380397,-73.824942338682,-73.8249254043183,-73.8249089784118,-73.8248925106846,-73.8248765554671,-73.824838276494,-73.824817871704,-73.8247994595369,-73.8247840021649,-73.8247694962471,-73.8247559988863,-73.8247425029705,-73.8247309675253,-73.8247199270591,-73.8247044490539,-73.8246889907999,-73.8246731445774,-73.8246583728353,-73.8246428314557,-73.8246289249748,-73.8246160804289,-73.8246050455444,-73.8245952714944,-73.8245775723814,-73.8245564072595,-73.8245339044116,-73.8245212496349,-73.8245081508399,-73.8244949802952,-73.8244813185571,-73.8244684357805,-73.8244553616135,-73.8244280438463,-73.8244142788195,-73.8244005086863,-73.8243853220088,-73.8243805728507,-73.8243712434107,-73.8243583255907,-73.824338223092,-73.8243187626452,-73.8242957429416,-73.824271534035,-73.8242594650701,-73.8242468190298,-73.8242350622741,-73.8242232297059,-73.8242087674522,-73.8241939794438,-73.8241799325721,-73.8241651823112,-73.8241514101767,-73.8241379837773,-73.824124868116,-73.824111356663,-73.8241027258485,-73.8240738849599,-73.8240504555702,-73.824032035458,-73.8240141961936,-73.8239935653759,-73.8239843314779,-73.8239801779165,-73.8239797824764,-73.8239828057809,-73.8239890844756,-73.8239991490447,-73.8240089505248,-73.8240206163171,-73.8240333687886,-73.82408466091,-73.8240391744904,-73.8239504507964,-73.8239478785763,-73.8242331874496,-73.8242066629029,-73.8239317610895,-73.8239173778405,-73.8239076208602,-73.8239002731479,-73.8238994815355,-73.8238899102278,-73.8238842393207,-73.8238781341523,-73.8238731354905,-73.8238676785514,-73.8238612291018,-73.823859483847,-73.8238477661748,-73.8238299397591,-73.8238150195748,-73.8237981656644,-73.8237776714884,-73.8237522166074,-73.8237377897914,-73.8237243379906,-73.8237104220852,-73.8236820351623,-73.8236695665341,-73.8236600143127,-73.8236433399257,-73.8236292240782,-73.8236104082985,-73.8235895924163,-73.8235736238433,-73.8235635697473,-73.8235491326251,-73.8235384160622,-73.8235281548401,-73.823518373176,-73.8235072089332,-73.8234985809342,-73.8234944639465,-73.8234946001946,-73.8234954114755,-73.8235029352361,-73.8235131524603,-73.823513657306,-73.8235060001573,-73.8235014844061,-73.8234930480537,-73.8234838582191,-73.8234725126417,-73.8234607319843,-73.8234503338251,-73.823433234508,-73.8237572349898,-73.8237234821917,-73.8234087230988,-73.823411525855,-73.8234097025365,-73.8234030406431,-73.8233893803275,-73.8233752995912,-73.823360587572,-73.8233475141383,-73.8233333843507,-73.8233143755997,-73.8232882383827,-73.8232772556516,-73.8232537106009,-73.8232424180278,-73.823233651955,-73.8232197511897,-73.8232120542041,-73.8232113933426,-73.82320630261,-73.8231935154969,-73.8231738265833,-73.8231618117355,-73.8231502723526,-73.823140207653,-73.8231240065516,-73.8231139697611,-73.8231076966837,-73.8231083912214,-73.8231159049384,-73.8231233781971,-73.8231357311568,-73.823137660082,-73.8231367392194,-73.8231284109347,-73.8231148951217,-73.8231085737902,-73.8230960275046,-73.8233055249758,-73.8232711822339,-73.8230536068968,-73.8230372416952,-73.8230210340875,-73.8230026297057,-73.8229830729671,-73.8229590940557,-73.8229480961611,-73.8229270091917,-73.8228959053395,-73.8228747760199,-73.822854142911,-73.8228341676642,-73.8228234170841,-73.8228132370193,-73.8228029953688,-73.8227911152968,-73.822779308267,-73.822767800657,-73.8227552022074,-73.8227426916024,-73.8227306453943,-73.8227176491408,-73.8227046664776,-73.8226916815406,-73.8226806068443,-73.8226585825854,-73.8226355362199,-73.8226110157918,-73.8225993561728,-73.8225874570764,-73.8225780007387,-73.8225691285687,-73.8225532677467,-73.822540564193,-73.8227927062575,-73.8227550476576,-73.8225191645587,-73.8225033003103,-73.8224965989514,-73.822479619967,-73.8224603870063,-73.8224506114262,-73.8224409568012,-73.8224310609939,-73.8224122700474,-73.8226778789685,-73.8226488535693,-73.8223875473663,-73.8223376525748,-73.8222899216731,-73.8222832151028,-73.8222182404191,-73.8221779369783,-73.8221397825815,-73.8220930471913,-73.8220703694761,-73.822049207835,-73.821978067137,-73.8219005893767,-73.8218798602792,-73.8218492253245,-73.8217761612472,-73.8216990004616,-73.8216178917917,-73.8215087966158,-73.8214037411502,-73.821302920133,-73.8212065204556,-73.8211460474444,-73.8210875836676,-73.8210368860973,-73.8209807192305,-73.8209197049688,-73.8208545188894,-73.8207858827653,-73.8207145565726,-73.8206413300755,-73.8206252188405,-73.820604795339,-73.8205940665487,-73.8205743375102,-73.8205557928915,-73.8205382327478,-73.8205187163785,-73.8204933804734,-73.8204690302308,-73.8204495125835,-73.8204324596663,-73.8205281078842,-73.820499199953,-73.8204045492723,-73.8203917839438,-73.8203756253297,-73.8203569679969,-73.8203373245228,-73.8203222859607,-73.8203060193374,-73.8202919885794,-73.8202760924161,-73.8202561038768,-73.8202387824776,-73.8202157143401,-73.8201999529024,-73.8201836585497,-73.8201664103865,-73.8201516323712,-73.8201371228602,-73.8201176274634,-73.820102620658,-73.8200874505508,-73.8200665503948,-73.8200544450595,-73.8200454830627,-73.8200331470761,-73.8200235303213,-73.820011229364,-73.8200012231732,-73.8198930806363,-73.8198484255399,-73.8198399938566,-73.8198392533583,-73.8198257039893,-73.8198164468579,-73.8198052363464,-73.819798010517,-73.8197905641338,-73.8197845440389,-73.819777595444,-73.8197666734939,-73.8197545923601,-73.8197395700098,-73.8197209608938,-73.819701315333,-73.8196844279076,-73.8196700444016,-73.81965385459,-73.8196386710753,-73.8196255938604,-73.8196100604116,-73.8195955784965,-73.8195788260631,-73.8195628640205,-73.8195509536908,-73.8195364090156,-73.8195209388368,-73.819504742541,-73.819489335487,-73.8194627856516,-73.8194456902309,-73.8194365271893,-73.8194204493316,-73.8194071055732,-73.8193931517076,-73.8193763244573,-73.8193593289699,-73.819342673692,-73.8193245315324,-73.819302572591,-73.819291292566,-73.8192801280371,-73.819268091075,-73.8192571899981,-73.8192476928964,-73.8192301401039,-73.819216180064,-73.819203998996,-73.8191924199202,-73.8191768094265,-73.8191594035227,-73.8191430451187,-73.8191261669764,-73.8191110684764,-73.8190850107157,-73.8190660587927,-73.8190550267821,-73.819043179568,-73.8190311321372,-73.8190183387,-73.8190055089638,-73.8189915709464,-73.8189779170938,-73.8189624896381,-73.8189472153802,-73.8189331954723,-73.8189203355856,-73.8189076174803,-73.8188955512075,-73.8188843435727,-73.8188736095904,-73.8188634421726,-73.8188527780072,-73.8188390829564,-73.8188244067289,-73.8188097397865,-73.8187955277619,-73.8187793618741,-73.818762224734,-73.8187441577161,-73.8187089987795,-73.8186919549232,-73.8186763046139,-73.8186616293155,-73.8186501377253,-73.8186398251508,-73.8186298457822,-73.8186176007066,-73.8186050272415,-73.8185891395799,-73.8185738168624,-73.8185614263992,-73.8185516250524,-73.8185474099904,-73.8185323465083,-73.8185163501645,-73.818496019897,-73.8184739151142,-73.8184541984707,-73.8184335022854,-73.8184226932885,-73.8184122764526,-73.8184022961533,-73.8183806649418,-73.8183684116438,-73.8183556867148,-73.8183292304157,-73.8183155248189,-73.8183022996457,-73.8182871568092,-73.8182729483596,-73.8182601839083,-73.8182483887205,-73.8182360995905,-73.818212512374,-73.818199287448,-73.8181865230117,-73.8181732858177,-73.8181590780625,-73.8181463504821,-73.818133116421,-73.8181189593013,-73.8181023419335,-73.8180881696164,-73.8180734528212,-73.8180597541865,-73.8180460570544,-73.8180318516745,-73.8180171717855,-73.8180015230471,-73.817985921389,-73.8179712062428,-73.8179432986104,-73.8179305351215,-73.8179192510686,-73.8179069496441,-73.8178942237833,-73.8178814979225,-73.817871517954,-73.8178536024054,-73.8178349333941,-73.8178137732241,-73.8178019922339,-73.8177906989894,-73.8177765422893,-73.8177643143803,-73.8177527835499,-73.8177409921744,-73.8177287390086,-73.8177174565763,-73.8177057028777,-73.8176948933572,-73.8176799667018,-73.8176660098457,-73.817648705424,-73.8176266145921,-73.8176124093678,-73.8175992123081,-73.8175850200989,-73.8175619464638,-73.8175417580299,-73.8175232278205,-73.8175040189219,-73.8174852333388,-73.8174707625935,-73.8174561345641,-73.8174398004204,-73.8174247401816,-73.8174042987671,-73.8173859827669,-73.8173628228345,-73.8173391547405,-73.8173258857586,-73.8173131172399,-73.8173003120924,-73.8172870697628,-73.8172752344366,-73.8172530172023,-73.8172356687874,-73.8172206954378,-73.8172081388266,-73.8168393084002,-73.8166042840285,-73.816571090776,-73.8168191572232,-73.8166990465463,-73.816485961532,-73.8164593235967,-73.8166807166823,-73.8164913280699,-73.8162318290432,-73.816191115513,-73.8161528669631,-73.8161223114611,-73.8161136333443,-73.8158053638498,-73.815774167798,-73.8161013689338,-73.8160793513417,-73.8160673518891,-73.8160539446521,-73.8160387698372,-73.816026038666,-73.8160108208728,-73.815996134392,-73.8159833646252,-73.8159679334491,-73.8159537206731,-73.8159362958914,-73.8159205996433,-73.8159036701585,-73.8158857453396,-73.8158673357198,-73.8158477060187,-73.8158324819722,-73.8158177557999,-73.8157998567454,-73.8157841257758,-73.8157704160955,-73.8157561636016,-73.8157400097906,-73.8157203912731,-73.8157019921395,-73.8156923233418,-73.81567586907,-73.8156577209972,-73.8156398269461,-73.81562608703,-73.8156133537509,-73.8156003352455,-73.8155870933543,-73.8155719093235,-73.8155557046396,-73.8155400207041,-73.8155262660757,-73.815514253379,-73.8154981006991,-73.8154816479128,-73.8154644740023,-73.8154438767478,-73.8154264414591,-73.8154095276851,-73.8153945954023,-73.8153796206149,-73.815363167914,-73.815346974238,-73.8153305546773,-73.8153121481771,-73.8153006085692,-73.815284917883,-73.8152694888631,-73.8152498529913,-73.8152326863558,-73.8152152850832,-73.8151988441484,-73.8151782349332,-73.8151566204945,-73.8151330996782,-73.8151095459968,-73.8150840424853,-73.8150700798322,-73.8150565902428,-73.8150426388455,-73.8150291498919,-73.8150146808249,-73.8149992514518,-73.8149833102316,-73.8149668941184,-73.814953875305,-73.814940383131,-73.8149234627499,-73.8149073100879,-73.8148975378919,-73.8148820880495,-73.8148666073559,-73.8148462590269,-73.8148261357662,-73.8148035851497,-73.8147864054609,-73.8147674864042,-73.8147512901142,-73.8147323804279,-73.8147171568834,-73.8147044676819,-73.8147005292792,-73.8146927142876,-73.814679775536,-73.8146714025965,-73.8146642355555,-73.8146518005808,-73.81463789535,-73.8146248821458,-73.8146077450427,-73.8145915414399,-73.8145711516688,-73.8145539710084,-73.8145353109556,-73.8145061301752,-73.8144965672572,-73.8144783870268,-73.8144617218092,-73.8144460280099,-73.8144308316148,-73.8144136747679,-73.814397515615,-73.8143837792621,-73.8143777203316,-73.8143673656162,-73.8143531165646,-73.8143391492345,-73.8143232048633,-73.814308227583,-73.8142922819912,-73.8142716373735,-73.8142524595689,-73.8142357421299,-73.8142146243539,-73.8141979145348,-73.8141785332332,-73.8141637711834,-73.8141498148072,-73.8141250305327,-73.8141024886704,-73.8140779571246,-73.8140645064876,-73.8140505091125,-73.8140390080248,-73.8140149828785,-73.8139929119167,-73.8139747714609,-73.8139640274477,-73.8139498169543,-73.8139319303985,-73.8139164862746,-73.8138993159446,-73.8138816470127,-73.813864981552,-73.8138502636202,-73.8138382947007,-73.8138213744634,-73.8138081489672,-73.8137958909828,-73.8137770124223,-73.8137647474292,-73.8137463118747,-73.8137239657909,-73.8137089860868,-73.813694767553,-73.8136790763318,-73.8136668224697,-73.8136567255426,-73.8136444820302,-73.8136373567635,-73.8136322372784,-73.8136293095656,-73.8136288009536,-73.8136280755721,-73.8136279693076,-73.8136290534617,-73.8136309723761,-73.8136354906062,-73.8136416717813,-73.8136473087962,-73.8136527579948,-73.8136585037273,-73.813667659183,-73.8136725351919,-73.8136768879982,-73.8136866641381,-73.8136910002959,-73.8136961681689,-73.813701726909,-73.8137059163297,-73.813709190536,-73.8137174389894,-73.8137297039222,-73.8137349711501,-73.8137439111017,-73.8137491075235,-73.8137459694732,-73.813716577534,-73.8136996372512,-73.8134205041584,-73.813350137201,-73.8134864830931,-73.8136352545395,-73.8134935036856,-73.8133697499187,-73.8132773907467,-73.8132509965719,-73.8132464969534,-73.8130380186018,-73.8129903107844,-73.8129372920604,-73.8129858958536,-73.8129125254206,-73.8129093132844,-73.8129088809916,-73.8129077930367,-73.8129056438068,-73.8129022557825,-73.8129004404474,-73.8128744891472,-73.8128748386125,-73.8128618792699,-73.8128564385509,-73.8128128585723,-73.8128088930211,-73.8128016628448,-73.8127923446208,-73.8127837095386,-73.8127751529378,-73.8127723057753,-73.8127688155327,-73.8127657826656,-73.8127640509605,-73.8127625747233,-73.8127586985131,-73.8127558201595,-73.8127527130522,-73.8127491690451,-73.8127457282869,-73.8127419297457,-73.8127382042504,-73.8127332579822,-73.8127300786385,-73.812726931291,-73.8127252253463,-73.8127241119879,-73.8127226698631,-73.8127203592397,-73.8127172114867,-73.8127151199385,-73.8127117632335,-73.8127057673219,-73.8127020818842,-73.8126991207695,-73.8126957342366,-73.8126923703307,-73.8126883331545,-73.8126829889164,-73.8126773467226,-73.8126726588053,-73.8126652883366,-73.8126590083994,-73.8126536702625,-73.812647419682,-73.8126433365018,-73.8126396561113,-73.812637272487,-73.8126306288453,-73.8126264438964,-73.8126196812594,-73.8126123847577,-73.8126070761149,-73.8126028416917,-73.8125984752266,-73.8125937471706,-73.8125883589877,-73.8125839068951,-73.8125809816406,-73.8125758146831,-73.8125699013929,-73.8125650943268,-73.8125585191572,-73.8125523138586,-73.8125479897452,-73.8125397193572,-73.8125197685328,-73.8125044728914,-73.8124871944264,-73.8124721614688,-73.8124576360668,-73.8124420919372,-73.8124216396584,-73.812401683879,-73.8123809756512,-73.8123661499454,-73.8123484084577,-73.8123316688906,-73.812310006623,-73.8122932729213,-73.8122708845778,-73.8122536556717,-73.812241844721,-73.8122261406938,-73.8122116377489,-73.812194250655,-73.8121807582969,-73.8121655218004,-73.8121463549996,-73.8121249273068,-73.8117900276939,-73.8117732583477,-73.8117635643614,-73.8117609881511,-73.8117655409696,-73.8117772028576,-73.8117959227322,-73.8118216186102,-73.8116078138,-73.8114959428979,-73.8114213383556,-73.8114123624297,-73.811393727619,-73.8113748450622,-73.8113591327879,-73.8113461272937,-73.811326014507,-73.8113088595486,-73.8112931466205,-73.8112774679231,-73.8112583345784,-73.8112372164392,-73.8112171019458,-73.8111950124818,-73.8111704631286,-73.8111473896978,-73.8111218712487,-73.8110963499333,-73.8110534224336,-73.8110374576779,-73.8110219886949,-73.8110085077959,-73.8109839618659,-73.810959463459,-73.810937363928,-73.8109187391171,-73.8109045003787,-73.8108853551668,-73.810869141706,-73.8108480570369,-73.8108311111722,-73.810815642846,-73.8107999244939,-73.8107785887118,-73.810763121451,-73.8107474066232,-73.8107282714787,-73.8107044766672,-73.8106863147198,-73.8106780249655,-73.8106634785814,-73.8106553524913,-73.8106327518934,-73.8106126016818,-73.8105980902103,-73.8105802435465,-73.8105608197968,-73.8105426232119,-73.8105251812552,-73.8105067290585,-73.8104875666712,-73.8104733444217,-73.8104539199418,-73.8104354777112,-73.8104162993492,-73.8103981480666,-73.8103794823904,-73.8103573586171,-73.8103396645372,-73.8103209995797,-73.8103028092048,-73.8102841476247,-73.8102723533939,-73.810252714215,-73.8102352313956,-73.8102190260213,-73.8101988788293,-73.8101797102159,-73.8101595837814,-73.8101446446119,-73.8101274752821,-73.8101093337271,-73.8100921585912,-73.8100774310778,-73.8100634338597,-73.8100462543706,-73.8100305194369,-73.8100123652393,-73.8099975949554,-73.8099804130776,-73.809962989714,-73.8099497445596,-73.8099360015135,-73.8099217439491,-73.8099013896809,-73.8098898436133,-73.8098711356007,-73.8098576267296,-73.8098379539452,-73.8098217429013,-73.809804559448,-73.8097834075906,-73.8097645979722,-73.8097439890609,-73.8097297301429,-73.8097130241487,-73.8096990518548,-73.8096847942764,-73.8096690587717,-73.8096536150676,-73.8096373609592,-73.8096203829495,-73.8096024441237,-73.8095862261635,-73.8095655881744,-73.8095475341328,-73.8095226895855,-73.8095140906278,-73.809494418608,-73.8094725441662,-73.8094538785883,-73.8094366945283,-73.809417532436,-73.8093939185532,-73.8093693804077,-73.8093462731694,-73.8093276070367,-73.8093123774854,-73.8092900334443,-73.8092728177415,-73.8092551373472,-73.80924387841,-73.8092276737445,-73.8092102534095,-73.8091945602848,-73.8091791279406,-73.8091599658424,-73.8091411011941,-73.8091322623125,-73.8091153504846,-73.8090974560636,-73.8090861670189,-73.8090714311021,-73.8090707209728,-73.8090535442947,-73.8090334102362,-73.8090196512684,-73.8090039181027,-73.8089857719575,-73.8089740193231,-73.8089590485839,-73.8089431083111,-73.8089254616258,-73.8089099778562,-73.8088911094892,-73.8088751640465,-73.8088609093992,-73.808841030431,-73.8088240968372,-73.8088068804042,-73.808793380422,-73.8087837817191,-73.8087689894624,-73.8087574366751,-73.808745480284,-73.8087293673428,-73.8087136659147,-73.80869968005,-73.8086835188334,-73.8086675680821,-73.8086478996898,-73.8086331720157,-73.8086144017919,-73.8086018449519,-73.8085829137313,-73.8085689113518,-73.8085501949489,-73.8085339284627,-73.8085171666939,-73.8085009169147,-73.8084773311045,-73.8084591395229,-73.8084475927899,-73.8084279398142,-73.8084116980158,-73.8083964637334,-73.8083802093964,-73.8083618047731,-73.8083468279735,-73.8083328248347,-73.8083168789884,-73.8082962678463,-73.8082776206217,-73.8082550089192,-73.8082377976911,-73.808222054476,-73.8082063082925,-73.8081917791527,-73.8081755712381,-73.8081613093673,-73.8081455680237,-73.8081216321909,-73.8081099536809,-73.8077874818767,-73.8076775124593,-73.8076774056528,-73.8074719688976,-73.8074654442394,-73.8074475405136,-73.807427605629,-73.8074116102241,-73.8073939512052,-73.8070431672326,-73.8064262615134,-73.8064194096874,-73.8063633145241,-73.8063282539434,-73.8063201315526,-73.8063050394079,-73.806314519401,-73.8062733188222,-73.8062313501237,-73.8062752503751,-73.8062833766501,-73.8062984651632,-73.8062903478813,-73.8063307671466,-73.8062653557645,-73.8062319676502,-73.8061733749662,-73.8061146829595,-73.8060373315095,-73.8059608468102,-73.8058858137981,-73.8058413349594,-73.8058323840028,-73.8057530975041,-73.8057053763202,-73.805629279206,-73.8055588255115,-73.8055292711463,-73.8055078281916,-73.8054942823119,-73.8054472558832,-73.8054051597781,-73.8053957327497,-73.805377030253,-73.8053663863014,-73.8053514171302,-73.805347037172,-73.8053270077253,-73.805339561445,-73.8053171165924,-73.805278236246,-73.8052988001961,-73.8053119655859,-73.8053242611425,-73.8053297538725,-73.8053243393983,-73.8053394448756,-73.805305428945,-73.8052775176929,-73.8052570694738,-73.8052369014303,-73.8052368096802,-73.8052293820593,-73.8052171673721,-73.8052078734331,-73.8051981471905,-73.8051837356548,-73.8051682405871,-73.8051519480558,-73.8051352185824,-73.805130721999,-73.8051159367206,-73.8051014313883,-73.8050932682505,-73.8050825618474,-73.8050723816716,-73.8050631218871,-73.8050531512377,-73.8050426121881,-73.8050303668525,-73.8050160892279,-73.8050017491559,-73.804987676143,-73.8049610797921,-73.8049350578343,-73.804910254718,-73.8048872847081,-73.8047998180203,-73.8047123440482,-73.8047002997545,-73.8046866300115,-73.8046717376879,-73.8046494961376,-73.8046278207782,-73.8046292113955,-73.8046487397684,-73.8046244101049,-73.8046095345106,-73.8045932738987,-73.8045761451659,-73.8045576802621,-73.8045376901564,-73.8045199470673,-73.8044987074299,-73.8044794366572,-73.804463635446,-73.8044488403196,-73.8044323149458,-73.8044160120975,-73.8044016942814,-73.8043859370585,-73.8043612930712,-73.804348259354,-73.8043438066597,-73.8043302698808,-73.8042971136374,-73.8042929355325,-73.8042735361489,-73.8042356338897,-73.8042590781061,-73.8042673271141,-73.8043113869992,-73.8042899654997,-73.8042678261809,-73.8042535193403,-73.8042348056609,-73.8042114333508,-73.8041983928953,-73.8041771691163,-73.8041653564286,-73.8041161132764,-73.804128390967,-73.8041149774973,-73.8040650839379,-73.8040880708148,-73.8041010160078,-73.8041364476697,-73.8041281314649,-73.8041147161138,-73.8041006607418,-73.8040796996796,-73.8040671193591,-73.804049876567,-73.8040368358973,-73.8040220133602,-73.80400524331,-73.8039554562278,-73.8039672154354,-73.8039547539794,-73.803914119191,-73.8039274274208,-73.8039390000383,-73.8039741892507,-73.8039583885257,-73.8039430874496,-73.8039253416985,-73.8039070863923,-73.8038888196422,-73.8038740040376,-73.8038614177526,-73.8038461241258,-73.8038163742869,-73.8038241470429,-73.8038132886805,-73.8037982412154,-73.8037955562348,-73.8038031466057,-73.8038229419601,-73.8038145200749,-73.8037987566135,-73.8037834652302,-73.8037708407861,-73.8037580029411,-73.8037340611402,-73.8037138477622,-73.8036941095678,-73.8036758544001,-73.8036595802143,-73.8036430150915,-73.8036086781063,-73.8036181526845,-73.8036058999648,-73.8035906674373,-73.8035856589099,-73.803593785182,-73.8036128854655,-73.803595596383,-73.8035852511018,-73.8035716546947,-73.8035570860463,-73.8035408103211,-73.8035292037878,-73.8035168721132,-73.8035040359231,-73.8034834626523,-73.803445557299,-73.8034558317571,-73.8034335820571,-73.8033995735736,-73.8034164591856,-73.803428314723,-73.8034637640922,-73.8034111642757,-73.8032779298772,-73.8032506901383,-73.803263537696,-73.8032384116162,-73.8032054984747,-73.8032340835544,-73.803260669186,-73.8029800708994,-73.8029703885954,-73.8029583031669,-73.8029492516022,-73.802934382342,-73.802919664938,-73.8029054106601,-73.8028899600624,-73.8028693209155,-73.8028548386048,-73.8028430505456,-73.8028288335978,-73.8028067400295,-73.8027912566217,-73.8027786798554,-73.8027626748621,-73.8027452003599,-73.8027277563663,-73.8027105741649,-73.8026928979529,-73.8026735202478,-73.802660748789,-73.8026403602291,-73.8026347973918,-73.802630862373,-73.8026267094629,-73.8026227289253,-73.8026132224078,-73.8026047428096,-73.8025996800889,-73.8025945898493,-73.8025912788273,-73.8025793447505,-73.8025604248378,-73.8025456545461,-73.8025299485763,-73.8025129896295,-73.8024952957972,-73.802475625805,-73.8024559923277,-73.8024387724593,-73.80242602952,-73.8024060942062,-73.8023906109964,-73.8023687259994,-73.8023535941851,-73.8023353856918,-73.8023144876145,-73.8022960283176,-73.8022765961874,-73.8022603884021,-73.8022414300477,-73.8022244500396,-73.8022030242085,-73.8021865653578,-73.8021683524821,-73.8021481721449,-73.802130466399,-73.8021102705203,-73.8020945207192,-73.8020792424272,-73.8020600522875,-73.8020413472182,-73.8020282975793,-73.802011288051,-73.8019898524299,-73.8019686812946,-73.801947509527,-73.8019302375867,-73.8019120260175,-73.8018974509737,-73.8018819554925,-73.8018659498346,-73.801848926956,-73.8018216132067,-73.8018134798433,-73.8017962071802,-73.8017794769841,-73.8017633122994,-73.801775498608,-73.801765849418,-73.8017550187977,-73.8017454308867,-73.8017210683155,-73.8017555025178,-73.8017484241892,-73.8017336136855,-73.8017148930793,-73.8017037946004,-73.8016846185893,-73.8016695931901,-73.8016533732422,-73.8016316950158,-73.8016174229502,-73.801598207894,-73.80157800485,-73.8015632210194,-73.8015474275224,-73.8015341369438,-73.8015146919568,-73.801497925833,-73.8014757329999,-73.8014579968945,-73.8014377924248,-73.8014277020551,-73.8014121694856,-73.8013963731797,-73.8013813342763,-73.8013657837771,-73.8013497738193,-73.8013337624705,-73.8013199433688,-73.8013048658101,-73.8012878424983,-73.8012752557659,-73.8012635401182,-73.8012528638542,-73.8012385371124,-73.8012215067169,-73.8012057027607,-73.801191120749,-73.801175827585,-73.8011605342965,-73.801138329918,-73.8011102189341,-73.801091744991,-73.8010742560221,-73.8010569787678,-73.8010527048736,-73.8010523494083,-73.8010390964323,-73.8010260435534,-73.8010112623059,-73.8009972490819,-73.8009870947545,-73.8009793743633,-73.8009749635183,-73.8009721819278,-73.8009714982003,-73.8009717940961,-73.8009700623574,-73.800967204411,-73.8009637769024,-73.8009570656215,-73.8009488566857,-73.8009351321022,-73.8009231279294,-73.8009064570493,-73.8008905198349,-73.8008782604881,-73.800863073467,-73.8008456415488,-73.800827186681,-73.800809446101,-73.8007914990872,-73.8007754815148,-73.8007614301352,-73.8007444010151,-73.8007283962637,-73.8007123815481,-73.8006971004959,-73.8006717326892,-73.8006592016224,-73.8006446193063,-73.8006406873051,-73.8006399581187,-73.8006369837154,-73.8006357641517,-73.8006333403199,-73.8006275260228,-73.8006218474008,-73.8006162240526,-73.8006078249428,-73.8006075411921,-73.8006074491836,-73.8006059618275,-73.8006012799462,-73.8006000997627,-73.8005941145921,-73.8005792061105,-73.8005664802632,-73.8005548778182,-73.8005463536181,-73.8005363092008,-73.800527139962,-73.8005180662202,-73.8005048303709,-73.8004916010108,-73.8004751825102,-73.8004565219796,-73.8004405358603,-73.8004245871912,-73.8004054140345,-73.8003906945668,-73.8003654755477,-73.8002859118806,-73.8003216303837,-73.8002938164511,-73.8002768301992,-73.8002719637551,-73.8002566293584,-73.8002349429996,-73.8002166961748,-73.8002043800044,-73.8001630240589,-73.8001286151249,-73.8001288717903,-73.8001400193935,-73.8001589819298,-73.8001823538811,-73.8001478857996,-73.8001282099448,-73.8001100744716,-73.8001042080742,-73.8000921419159,-73.8000695379,-73.8000518451734,-73.8000371189902,-73.8000219014645,-73.8000089241668,-73.7999900640491,-73.7999704438387,-73.7999527585559,-73.7999365605216,-73.7999102863849,-73.7998920964863,-73.7998729600525,-73.7998572241805,-73.7998430044205,-73.7998277740568,-73.7998095831271,-73.7997904065649,-73.7997697575304,-73.7997495701958,-73.799733347553,-73.7997114224618,-73.7996941907505,-73.7996806790041,-73.7996658639812,-73.7996540165911,-73.7996474305403,-73.7996471880429,-73.7996491338961,-73.7996528830596,-73.7996574003359,-73.7996625990561,-73.7996691685271,-73.7996754769607,-73.7996798070314,-73.7996768809803,-73.7996736249844,-73.799668729494,-73.7996566146603,-73.7996398847831,-73.7996251133271,-73.7996054829251,-73.7995868313636,-73.7995736032431,-73.7995691350723,-73.7995650221793,-73.7995556795003,-73.7995518868551,-73.7995485594174,-73.7995389496976,-73.7995261609094,-73.7995122923087,-73.7994997824298,-73.7994848516004,-73.7994698810062,-73.7994522134826,-73.7994360479975,-73.7994186288404,-73.7994048905364,-73.7993919114274,-73.7993804449354,-73.7993739088909,-73.7993690339035,-73.7993649309701,-73.7993603694524,-73.7993530051207,-73.799339267998,-73.7993238421915,-73.7993083975589,-73.7992924518791,-73.7992767174237,-73.7992605223637,-73.7992423619815,-73.7992251928137,-73.7992094549436,-73.799190281189,-73.7991708963034,-73.7991441223516,-73.7991365074757,-73.7991222458943,-73.7991023460217,-73.7990821624019,-73.7990674369922,-73.7990480121733,-73.799031759796,-73.7990160533129,-73.7989954063732,-73.7989752604599,-73.7989617239451,-73.798947971837,-73.7989310385911,-73.7989162820213,-73.7988936889729,-73.7988841241962,-73.7988625073702,-73.7988423675561,-73.7988261696429,-73.7988094980308,-73.7987922836119,-73.7987753533385,-73.7987579262318,-73.7987440489464,-73.798737063726,-73.7987242934587,-73.7987108023999,-73.7986926579497,-73.798676720102,-73.7986678836079,-73.7986603114518,-73.7986503939319,-73.7986416602315,-73.7986259659865,-73.7986093032565,-73.7985978093236,-73.798586559548,-73.7985765536522,-73.7985675945055,-73.7985592086933,-73.7985447908015,-73.7985341351093,-73.7985248178542,-73.7985165731081,-73.7985062711381,-73.7984955433862,-73.7984799407698,-73.7984655648682,-73.7984527019277,-73.7984386099636,-73.7984220384457,-73.7984098475431,-73.7983939915718,-73.7983791862032,-73.7983627435531,-73.7983454331612,-73.7983329831837,-73.798318805127,-73.7982993220303,-73.798286676221,-73.7982693203662,-73.7982513325532,-73.7982303796086,-73.7982144655101,-73.7981981691724,-73.7981852566918,-73.7981710792899,-73.798155279673,-73.7981421064217,-73.7981289791493,-73.7981110804521,-73.798092775034,-73.7980602583789,-73.7980426863742,-73.7980215730465,-73.7980061537943,-73.7979877142593,-73.7979730167745,-73.7979597425576,-73.7979378265244,-73.7979233236591,-73.7979074089083,-73.7978983268707,-73.7976725994333,-73.7976974419377,-73.7976699400886,-73.7975829547134,-73.7976154261265,-73.7976377969031,-73.7978701491456,-73.7978446443421,-73.7978244450395,-73.7978070413419,-73.7977911281147,-73.7977744909257,-73.7977578903357,-73.7977412188076,-73.7977279329275,-73.7977131820566,-73.7976931505703,-73.7976712481886,-73.7976498080887,-73.7976331375614,-73.7976140897327,-73.797599326475,-73.7975807732134,-73.7975646779008,-73.7975477934909,-73.7975311811306,-73.7975181542886,-73.7974992057908,-73.7974798165808,-73.7974613761999,-73.7974443322619,-73.7974273247754,-73.7974117366559,-73.7973938251833,-73.7973773226005,-73.7973589713445,-73.797337055249,-73.7973219980645,-73.7973049001019,-73.7972882065268,-73.7972711960891,-73.7972567921071,-73.7972412827387,-73.7972324114631,-73.7972314456308,-73.797235080784,-73.7972395623911,-73.7972421122368,-73.79724685379,-73.7972520908842,-73.7972564330191,-73.797257959374,-73.7972581469172,-73.7972582002881,-73.7972511566096,-73.7972384940083,-73.7972201203202,-73.7972045450424,-73.7971885977539,-73.7971740825867,-73.7971595455066,-73.7971430890971,-73.7971278313319,-73.7971135742493,-73.7970986631842,-73.7970805376643,-73.7970638232038,-73.7970503877143,-73.79702796654,-73.7970099856453,-73.7969878906262,-73.7969668435592,-73.7969398425857,-73.7969150864556,-73.796890840059,-73.7968722183676,-73.7968525610062,-73.7968348752348,-73.7968186352144,-73.7967980749978,-73.796789268447,-73.7967640974351,-73.7967356766024,-73.7965193993096,-73.7965417523289,-73.7965117570959,-73.7964869033435,-73.7964670270414,-73.7964421857451,-73.7964672004413,-73.7964920644025,-73.7967058756235,-73.7966770537475,-73.7966619426277,-73.7966470777627,-73.7966357899755,-73.7966177906951,-73.7965984153865,-73.7965844639275,-73.7965717331017,-73.7965587511496,-73.7965439549709,-73.7965262368538,-73.7964993160719,-73.7964827154592,-73.7964641382384,-73.7964442097864,-73.7964247547501,-73.7964062129195,-73.7963892836488,-73.7963759977474,-73.7963584598068,-73.7963458600089,-73.7963311434106,-73.7963134906273,-73.7962929999282,-73.796278677112,-73.7962653239902,-73.7962464882874,-73.7962248347786,-73.796205999829,-73.7961869837366,-73.7961677077587,-73.7961544336422,-73.7961345386037,-73.7961159061228,-73.7959627006605,-73.7958082607835,-73.7956529915045,-73.7954973000106,-73.7953415945962,-73.79528852797,-73.7952368915094,-73.7951878539466,-73.7951514290446,-73.7951105719225,-73.7951057969207,-73.7951006977191,-73.795095407745,-73.7950900654183,-73.7950848105281,-73.7950797805765,-73.7950751071789,-73.7950709126212,-73.7950673066601,-73.7950643836501,-73.7950622200763,-73.7950608725509,-73.7950745015959,-73.7950704323447,-73.7950623685044,-73.7950085765517,-73.794951356626,-73.7948915842635,-73.7948301740533,-73.7947680656446,-73.7947062093694,-73.794693559825,-73.7946780986399,-73.7946602617106,-73.7946405519155,-73.7946195249345,-73.7945977735838,-73.7945210091966,-73.7944458784508,-73.7944367700041,-73.7944276781931,-73.7944188464611,-73.7944105112879,-73.7944028958568,-73.7943962040795,-73.7943906151357,-73.794386278675,-73.7943833108108,-73.7943817910103,-73.7943819346958,-73.7943827605593,-73.7943842446277,-73.7943863438223,-73.7943889972085,-73.7943921277654,-73.7943956446204,-73.7943994456882,-73.7944034206336,-73.7944074540735,-73.7944114289274,-73.7944152298154,-73.7944187464073,-73.7944218766251,-73.7944245296065,-73.7944518061822,-73.794478559939,-73.7945042551955,-73.7945283774633,-73.7945382189135,-73.7945464377397,-73.7945528489552,-73.7945573082585,-73.794559715282,-73.7945600158492,-73.794558203197,-73.7945247288193,-73.7944828504784,-73.7944329903368,-73.7943956666892,-73.7943645425967,-73.7943399047022,-73.7943219799084,-73.7943109332879,-73.7943068665639,-73.7943098171738,-73.7942909504923,-73.794279823568,-73.7942767061587,-73.7942816738315,-73.794294606132,-73.7943151895058,-73.7943429249022,-73.7943488264663,-73.7943569276218,-73.7943654789022,-73.7943724345706,-73.7943782987007,-73.7943827044192,-73.7943817607258,-73.7943775807479,-73.7943734844584,-73.7943703325635,-73.7943672604298,-73.794364247506,-73.794361084486,-73.7943574180086,-73.7943522610986,-73.7943478362527,-73.7943424728952,-73.7943383956929,-73.7943337320004,-73.7943288503701,-73.7943214080538,-73.7943150111846,-73.7943087462056,-73.7943104708188,-73.7943113502147,-73.7943130748269,-73.7943146613876,-73.7943152439613,-73.7943165501015,-73.7943184655083,-73.7943213974321,-73.7943258782615,-73.79433154643,-73.7943406535323,-73.7943498505217,-73.7943601205195,-73.7943685797043,-73.794375546826,-73.7943873614097,-73.7943982789798,-73.7944042164608,-73.794419657067,-73.7944311259212,-73.7944410092171,-73.7944553797338,-73.794468864275,-73.7944828200568,-73.7944982528728,-73.7945057589829,-73.7945142664085,-73.7945231077581,-73.794532212854,-73.7945464701942,-73.7945553126007,-73.7945606280312,-73.794567434884,-73.7945757379011,-73.7945847667186,-73.7945939858825,-73.7946034244886,-73.7946189788817,-73.794630466922,-73.7946416811711,-73.7946438890573,-73.7946455971384,-73.7946462422119,-73.7946477059855,-73.7946494216159,-73.7946518595399,-73.7946541071133,-73.794656561254,-73.7946587922231,-73.7946601649252,-73.7946602009965,-73.7946595991165,-73.794657383919,-73.7946523113506,-73.794647993053,-73.7946435244396,-73.7946391191856,-73.794632488227,-73.7946276203988,-73.7946212901824,-73.7946155502647,-73.7946070637687,-73.7945994499252,-73.7945925418195,-73.794586685282,-73.794582007584,-73.7945788381075,-73.7945754627589,-73.794572604912,-73.7945756539779,-73.7945813380862,-73.7945848969886,-73.7945917333896,-73.7946077917974,-73.7946248173506,-73.7946486470668,-73.7946630195593,-73.7946850647669,-73.794701793766,-73.7947182641735,-73.7947340618769,-73.7947498186069,-73.7947661192564,-73.7947812458773,-73.7947946505346,-73.7948058878594,-73.7948147225782,-73.7948235011868,-73.7948313500112,-73.794838107932,-73.7948435330899,-73.7948467521584,-73.7948494527115,-73.7948506485796,-73.7948529783923,-73.7948552478793,-73.7948560645476,-73.7948546436791,-73.7948525080319,-73.7948513009568,-73.7948519107358,-73.7948527336081,-73.7948587464797,-73.7948622035563,-73.7948666821033,-73.7948692149693,-73.7948712524958,-73.7948731036335,-73.7948760179344,-73.7948794422768,-73.7948825614369,-73.7948856236394,-73.7948916570271,-73.7948977285335,-73.7949034326896,-73.7949078401333,-73.7949120080767,-73.7949150232542,-73.7949166724605,-73.79491812087,-73.7949206793127,-73.7949221323649,-73.7949266165377,-73.7949284173611,-73.7949299207635,-73.7949325662475,-73.7949365732162,-73.7949414049897,-73.7949473339102,-73.7949526016059,-73.794956203078,-73.7949588507887,-73.7949610635079,-73.7949616050163,-73.7949607968868,-73.7949593415069,-73.7949563980658,-73.7949534903278,-73.7949505893085,-73.7949482916619,-73.7949437702274,-73.7949117390956,-73.7948877196468,-73.7948724317812,-73.7948663336926,-73.7948696081362,-73.7948305592926,-73.7947826103856,-73.7947258949344,-73.7946822264694,-73.7946346029354,-73.79443444762,-73.7944017958488,-73.7943619554122,-73.7942554441641,-73.7941190228438,-73.7941102303753,-73.7941050313695,-73.7940998729436,-73.7940942125419,-73.7940865973556,-73.794079395864,-73.7940727631524,-73.7940653436977,-73.7940574223687,-73.7940502995993,-73.7940428459774,-73.7940347384136,-73.7940286774496,-73.7940226126138,-73.794014454332,-73.7940051927443,-73.7939952515392,-73.7939862116625,-73.7939794343709,-73.7939737579885,-73.7939677325631,-73.7939607018586,-73.7939525496235,-73.7939437766355,-73.793934684159,-73.793933682169,-73.7939245140732,-73.7939159522149,-73.7939074378363,-73.79390031635,-73.7938947923841,-73.793889450275,-73.7938849006296,-73.7938765029903,-73.7938694135655,-73.7938618873091,-73.7938579485176,-73.793852778981,-73.7938412175272,-73.7938352978795,-73.7938245360673,-73.7938171757823,-73.7938116590685,-73.7938059536609,-73.7938012311754,-73.7937975146636,-73.7937928927188,-73.7937917529374,-73.7937886402979,-73.793782687033,-73.7937778335223,-73.7937715201357,-73.7937641204838,-73.793758374169,-73.793751264841,-73.7937401115893,-73.7937276153105,-73.793722074284,-73.7937036219413,-73.7936858674426,-73.793665984651,-73.7936603775312,-73.7936446964654,-73.7933843981269,-73.7934067956803,-73.7933803350498,-73.7932394178115,-73.7932602267708,-73.7933317821612,-73.7936200727617,-73.7935758027398,-73.7935563164595,-73.7935385650692,-73.7935227863601,-73.7935034662859,-73.793485556935,-73.7934699712618,-73.7934533594123,-73.7934336919603,-73.7934185672628,-73.7934008839755,-73.7933883064869,-73.7933843509896,-73.793359698335,-73.7933449020286,-73.793324920974,-73.7933084659138,-73.7932950813052,-73.793281120977,-73.7932628102149,-73.7932461891633,-73.793231111898,-73.7932172863078,-73.7932005858247,-73.7931826882644,-73.7931669237166,-73.7931520726462,-73.7931343228935,-73.7931187662353,-73.7931074783846,-73.7930876483789,-73.7930747045003,-73.7930629076335,-73.7930603044395,-73.7930459159718,-73.7930286735365,-73.7930155475456,-73.7929983722028,-73.7929204923397,-73.7928615672973,-73.7928066958046,-73.7927590792978,-73.7926879011278,-73.7926321602874,-73.7925876329098,-73.7925397321671,-73.7925150508998,-73.792496234437,-73.7924642519386,-73.7923529115414,-73.7922397076399,-73.7922047711356,-73.7921568484992,-73.7921025310121,-73.792055919124,-73.79200172967,-73.7919631785584,-73.7919421295374,-73.7919151021627,-73.7918614005513,-73.7917928040392,-73.7917525425264,-73.7916279561771,-73.790282023532,-73.7898873866892,-73.7893090713177,-73.7888314335281,-73.7883542902718,-73.7879935835311,-73.7875019994468,-73.7856810130141,-73.7838384251435,-73.7831794097532,-73.7825308066352,-73.7825226569483,-73.7844066900349,-73.7843984536896,-73.7843415305959,-73.7822733018339,-73.781747087631,-73.7817021394188,-73.7816054588198,-73.7814326046088,-73.7812336211205,-73.7810784597021,-73.7808978479111,-73.7807750313901,-73.7807789248195,-73.7808501549086,-73.7808394901414,-73.7815888154501,-73.781587816366,-73.7815815324612,-73.7816386425779,-73.7816837283031,-73.7816266232814,-73.7816087937936,-73.7816160767875,-73.7816601155538,-73.7816421343347,-73.7808215486979,-73.7808080873793,-73.7807243506983,-73.7807002551626,-73.7807918207265,-73.781005396673,-73.7813176840371,-73.7815285754529,-73.7818100376292,-73.7819038542103,-73.7825816559182,-73.7826551713862,-73.7828436204445,-73.7830747533759,-73.7831097696396,-73.7831400085433,-73.7831702627592,-73.7832152257256,-73.7832478929539,-73.7832894883369,-73.7833179668426,-73.7833204336284,-73.7832962431701,-73.7832872387991,-73.783272528907,-73.7832650292733,-73.7832686833775,-73.7832723127863,-73.7832587625303,-73.783239112949,-73.7832182224646,-73.7831740685685,-73.783136500511,-73.7831115989783,-73.7830541548124,-73.7828681478728,-73.7823667880234,-73.7820032610338,-73.781824599083,-73.7817262557558,-73.7816576105101,-73.7815415003274,-73.7798983755808,-73.7798030505223,-73.779449614565,-73.7794686919289,-73.7794330151623,-73.7793624680482,-73.77928446351,-73.7792728777514,-73.778714787626,-73.778689688201,-73.7786853036192,-73.7786710899564,-73.778653137277,-73.7786374737861,-73.7786239496225,-73.7786045630003,-73.7785865899087,-73.7785723534402,-73.7785550680796,-73.7785352098166,-73.7785181861754,-73.7784973595596,-73.7784810185005,-73.778467000366,-73.778448311218,-73.7784321848823,-73.7784120944444,-73.7783955054967,-73.7783796082476,-73.778367454402,-73.7783492400557,-73.7783328775433,-73.7783108978019,-73.7782912488836,-73.778270663011,-73.777521697539,-73.7768705048974,-73.7761788595337,-73.7758446549887,-73.7750482978347,-73.7749591310615,-73.774874162469,-73.7747937271815,-73.7747181424402,-73.7744357888758,-73.7743717434029,-73.7743143749185,-73.7742639923037,-73.7742208668211,-73.7741852306552,-73.7741712311341,-73.7741514310781,-73.7741262768627,-73.7740963355649,-73.7740776311862,-73.7740602893141,-73.774044802506,-73.7740316106298,-73.7740210883699,-73.7740135345862,-73.7740091638248,-73.7740081002253,-73.7740103739945,-73.774015920549,-73.7740245823499,-73.7740361133771,-73.7740290584891,-73.7740182219482,-73.7739806797672,-73.7739355506151,-73.77388293132,-73.7738229347715,-73.7737556896788,-73.7737490541825,-73.7737471060747,-73.7737498617783,-73.7736808347047,-73.7736324818891,-73.773567295294,-73.7734964926851,-73.773420254083,-73.7732746589103,-73.7732046717258,-73.7730798654209,-73.7728774373825,-73.7728605968493,-73.772779106503,-73.772720122682,-73.772668657467,-73.7726004175282,-73.7725275706376,-73.7724687526048,-73.7724137940309,-73.7723629616219,-73.7722731692834,-73.7722707536458,-73.7722605142219,-73.7722424878759,-73.7722384161348,-73.7722420681907,-73.7722534277751,-73.7722330375401,-73.7722060789364,-73.7721726632143,-73.7721329282647,-73.7721025534893,-73.7720259534436,-73.7719440384826,-73.7718957413781,-73.7718514388746,-73.7718121772805,-73.771778883848,-73.771752344873,-73.7717368064766,-73.771730423718,-73.7717333624005,-73.7717455461606,-73.7717186048762,-73.7716681128188,-73.771443375423,-73.7711276990068,-73.7708781604282,-73.7706312453759,-73.7708231502143,-73.7711714496876,-73.7712437174048,-73.7713134806265,-73.7713805160969,-73.7714967283403,-73.7716157862565,-73.7717375635067,-73.77190205681,-73.7719932047445,-73.7720876998626,-73.7721847160562,-73.7722834051798,-73.773790965526,-73.7739672884747,-73.7741296782694,-73.7742683605896,-73.7743460921796,-73.7743923119785,-73.7743897690103,-73.7742643952068,-73.7742000266197,-73.7741998086814,-73.7742301148685,-73.7743241010546,-73.7744461714191,-73.775019226783,-73.7762894485544,-73.7763372881872,-73.775872336885,-73.7750481043883,-73.7748624824042,-73.774806953694,-73.7747412474551,-73.7746308254633,-73.7745858466651,-73.7745623664434,-73.7745119519224,-73.7744546250304,-73.7743566127427,-73.7742646669442,-73.7740960989509,-73.7740763829778,-73.7726172080581,-73.7720920025976,-73.7716073197949,-73.7706097445486,-73.7707638281677,-73.7708686712456,-73.7709360216871,-73.7709987179751,-73.771814665066,-73.7723506921408,-73.7726695015009,-73.7732718173538,-73.7740381110771,-73.775598853662,-73.7758395833216,-73.7767836326242,-73.7776935496137,-73.7785877112417,-73.7794765605842,-73.7803618035438,-73.78279772917,-73.7840764529224,-73.7844091872914,-73.7844833065156,-73.784593393492,-73.7849148919768,-73.7856943384527,-73.786264983026,-73.7865507335238,-73.7874099159046,-73.7882697295325,-73.788939757696,-73.7891387365924,-73.7898420408074,-73.790349717911,-73.7914959869521,-73.7916352606645,-73.7922679522091,-73.7927125938287,-73.7925514464414,-73.7923669778862,-73.792289196193,-73.7921678938403,-73.7922312493825,-73.792379106946,-73.7923824381352,-73.7923901269483,-73.7924567735076,-73.7926823244245,-73.7930255136591,-73.7932248387382,-73.7933454619449,-73.7934367370331,-73.793438001825,-73.7934429997643,-73.7934403346991,-73.7934399114645,-73.7932162364112,-73.7930301581337,-73.7930144042443,-73.7927155327382,-73.7924191072557,-73.7923751799838,-73.7924309918035,-73.7934332013521,-73.7945772698999,-73.794627691541,-73.7946558385144,-73.7946832464622,-73.7947214125748,-73.7947576982429,-73.7947752525681,-73.7947910033461,-73.7948050444504,-73.7948103456185,-73.7948153134903,-73.7947354566905,-73.7947226487797,-73.7946756881825,-73.794579760412,-73.7945201930523,-73.794481238857,-73.7944812155691,-73.7944812052733,-73.7944586915747,-73.7944528269304,-73.7944528171415,-73.7944528289865,-73.7944636833295,-73.7944911461267,-73.7944911705002,-73.7944912065203,-73.7945350735507,-73.7946732717469,-73.7946734082346,-73.7946735656202,-73.7948329545002,-73.7950128584735,-73.7950129845307,-73.79501312009,-73.7952125770971,-73.7954305928757,-73.7956656682183,-73.7958930287862,-73.7958931909793,-73.795893352483,-73.7961362496825,-73.7961363119708,-73.7961363857089,-73.796394149669,-73.7963942358,-73.7963943219327,-73.7966658185437,-73.7966660174628,-73.7966662287098,-73.7969506529852,-73.7972308497208,-73.7972679511915,-73.7972788541304,-73.7972788787145,-73.7972788680565,-73.7972751758787,-73.7972751763732,-73.7972751530502,-73.7972567434465,-73.7972567079298,-73.797256650196,-73.7972238015304,-73.7972237300281,-73.7972236245784,-73.7971768666997,-73.7964083366987,-73.7962929729161,-73.7967249785875,-73.7964394004849,-73.7964117836611,-73.7964021870636,-73.7968479577502,-73.797292605541,-73.7982205892731,-73.799111957239,-73.8000029241536,-73.8008915119533,-73.8013215540357,-73.8018083430405,-73.8026863206076,-73.8036360051951,-73.8046155349878,-73.8046654326126,-73.8047129152036,-73.8056455091005,-73.8065788386773,-73.8075208191378,-73.8080525845573,-73.808448913235,-73.8089301670512,-73.8094114217823,-73.8104043557634,-73.8113972909521,-73.8122773782403,-73.8132240172633,-73.814073820425,-73.814894970308,-73.8149975569087,-73.8150499868699,-73.8151033194465,-73.8152246716851,-73.8159359422738,-73.8166446777877,-73.8171592827276,-73.8177436933596,-73.8186304914798,-73.8189066552469,-73.8194832991281,-73.8210086280554,-73.8212199748999,-73.8217006188712,-73.8230151947775,-73.8235721143048,-73.8244595325713,-73.8252857978249,-73.8253738766737,-73.8253632475165,-73.8252701510202,-73.8252057209488,-73.8251258065185,-73.8249838447333,-73.8248549614948,-73.8248117842176,-73.8249480087467,-73.8249743999207,-73.8254041332308,-73.825560793229,-73.8255647887844,-73.8256064165045,-73.8256415128456,-73.8256897373689,-73.8258136411484,-73.8258218972737,-73.8259167329176,-73.825975804621,-73.8260258503621,-73.8261403824347,-73.8262380227564,-73.8263091815382,-73.8263378820486,-73.8263916478629,-73.8264679595493,-73.8265726273055,-73.8266951412572,-73.8268719177106,-73.8269582483883,-73.8270122248051,-73.8270529611979,-73.8271388594393,-73.8272277268523,-73.8273135404409,-73.8274094222052,-73.8274550878747,-73.8274982660807,-73.8275238028317,-73.8276056949615,-73.8279003027045,-73.8279645508448,-73.8279496908658,-73.8280915257717,-73.8294675199701,-73.8305355123144,-73.8311345171537,-73.8309942308935,-73.83090596523,-73.8303961756113,-73.8303438659767,-73.8313011725404,-73.8312881943025,-73.8312400552556,-73.831198727747,-73.8311554935487,-73.8310970924222,-73.8315594226786,-73.831639755564,-73.8320706479482,-73.8329689305268,-73.833868509533,-73.8351795043705,-73.8358613187213,-73.8359019695286,-73.8359156487578,-73.8359253040333,-73.8359507145917,-73.835849677861,-73.8356755394758,-73.835569586648,-73.8354377716984,-73.8350657468726,-73.8346981123397,-73.8347781005969,-73.8348585180662,-73.8349343215961,-73.8350048058533,-73.8350693149264,-73.83514009988,-73.8350233466827,-73.8348488943387,-73.8347853545841,-73.8347334508157,-73.8347070809014,-73.8347116851386,-73.8347873606395,-73.8350804930398,-73.8355485237687,-73.8358365151829,-73.8362511917507,-73.8377803814653,-73.837989211983,-73.8380577884866,-73.8398495469039,-73.8400426281376,-73.8406799997367,-73.8407187671669,-73.840731668502,-73.8407513822146,-73.8407661408272,-73.8407754979146,-73.8407791704356,-73.840777047297,-73.8407691927133,-73.8407642340115,-73.8407515307587,-73.8407313758005,-73.840704233775,-73.8406966245417,-73.8406923733551,-73.8406901877132,-73.8406877895865,-73.8406872980397,-73.8406890093981,-73.8406910649728,-73.8406943418647,-73.8407052355804,-73.8407143317528,-73.8407214759005,-73.8407338456162,-73.8407512692184,-73.8407637206892,-73.8407663356797,-73.8407672662649,-73.8407641504865,-73.8407603880669,-73.8407554092046,-73.8407413407186,-73.8407323201707,-73.8407293073011,-73.8407297376543,-73.8407330658331,-73.8407427730881,-73.8407482775543,-73.8407518743926,-73.8407518584395,-73.8407508231658,-73.8407451513152,-73.8407431271486,-73.8407376108939,-73.840735612048,-73.8407225165151,-73.8407124298574,-73.8407041250609,-73.8406922050722,-73.8406775686861,-73.8406626902551,-73.8406577222069,-73.8406514989966,-73.8406343935757,-73.8405953295077,-73.8405532025165,-73.8405059753626,-73.8404812395459,-73.84045672255,-73.8404406373626,-73.8404247934767,-73.8404215600194,-73.840414797887,-73.840412812824,-73.8404106976494,-73.8403916635384,-73.8403821351714,-73.8403722771602,-73.8403372143646,-73.8402889935782,-73.8402335863824,-73.8402083900236,-73.8401769423668,-73.8401241631381,-73.8400912763909,-73.8400689687023,-73.8400510679703,-73.8400190454037,-73.8399027777269,-73.8398443429219,-73.8398041950025,-73.839771416636,-73.8397462785115,-73.8397245207943,-73.8396844312565,-73.8396628598361,-73.8396512084001,-73.839622600321,-73.8396024383919,-73.8395566654183,-73.8395487761811,-73.8395415306644,-73.8395344059686,-73.8395314389151,-73.8395316635444,-73.8395349525504,-73.8395355345489,-73.8395325246988,-73.8395285309119,-73.8395219457002,-73.8395169771944,-73.8395104933792,-73.8394927394836,-73.8394690964411,-73.839447439768,-73.8394060201174,-73.8393357252279,-73.839294785399,-73.8392407117513,-73.8391872975274,-73.8391410437484,-73.8390973191603,-73.8390823455288,-73.8390728451971,-73.8390653242181,-73.8390624275515,-73.8390600758805,-73.8390564035898,-73.839055356176,-73.8390546765639,-73.8390539569385,-73.8390539355273,-73.8390551859349,-73.8390562496216,-73.8390583364731,-73.8390597507521,-73.8390766786794,-73.8390943905909,-73.8390960881024,-73.8391053150766,-73.8391199522324,-73.8391220967654,-73.8391232990766,-73.839783358533,-73.8404553715744,-73.8411383911255,-73.8418314671024,-73.8425336059876,-73.843243813566,-73.8436344271319,-73.8440443109266,-73.8444497030347,-73.8447902700433,-73.8451340402415,-73.8454898618525,-73.8458523574436,-73.8454947910387,-73.8452215006881,-73.8445463383914,-73.843716577998,-73.8428314247658,-73.8426182239694,-73.8423956988243,-73.8421660064799,-73.8421131088285,-73.841984389944,-73.8418543882371,-73.8417235428068,-73.8415922956026,-73.8414610895386,-73.8413303681582,-73.8412005729918,-73.8410721424405,-73.8401778961229,-73.8394040091775,-73.8392536576608,-73.8395678280505,-73.8395986548871,-73.8396034594921,-73.8396272925196,-73.8397250358941,-73.8398320564931,-73.8399176745095,-73.839981192061,-73.8400200337903,-73.8400249430433,-73.8400268132413,-73.8400240333708,-73.8400222020751,-73.8397283042786,-73.8397005336242],"lat":[40.7652895884368,40.7652523229731,40.7654457684587,40.7659911055684,40.7660342096388,40.7661395497257,40.7662117217216,40.7663926770455,40.766650871719,40.7667344146533,40.7668248059599,40.7669168411771,40.7669741602152,40.7670170169848,40.7671108247191,40.7671048916637,40.7671204449384,40.7670514854102,40.7670865357092,40.7670642771474,40.7670018816497,40.7669522042086,40.7668241589167,40.766623420466,40.7665666646123,40.7665292403015,40.7664646665052,40.7663796729563,40.7662947978985,40.7662704043815,40.7662148697484,40.7661620202001,40.7661629545759,40.7661478309242,40.7661421939807,40.7661573274276,40.7661592088674,40.7662103797609,40.7661851487789,40.7661168842159,40.7661103677166,40.7661651820664,40.766168924393,40.7661786050842,40.7661503808775,40.7660974765248,40.7660972996561,40.7660812426624,40.7660812923348,40.7660935761373,40.7660954473175,40.7661462221189,40.7661051929873,40.7660432805295,40.7659883262833,40.765994957493,40.7659684839921,40.7659581602287,40.766038413565,40.7659897108492,40.7659651458819,40.7659273230535,40.7659329244163,40.7659376498065,40.7659489302744,40.7659252914889,40.7659140081471,40.7659187369483,40.765821028797,40.7658191370754,40.7658125765892,40.7658352660528,40.7658446651674,40.7658389928728,40.7658559282466,40.7658994198914,40.7659112518797,40.7658679679703,40.765802367585,40.7658061323363,40.7657853318745,40.765775004882,40.7657929655471,40.7657976688529,40.7658629206955,40.7658306071643,40.765854722425,40.7657252928477,40.7656530714174,40.7656434799385,40.765679968848,40.7654948814858,40.7654967613636,40.7654692150089,40.765459602584,40.7655283881786,40.7656661194826,40.7660125758185,40.7660448715539,40.7661157043138,40.7661963431665,40.7662958001292,40.766283756731,40.7662620347584,40.7662679615278,40.7662905639677,40.7663131580958,40.766419412624,40.7667059116311,40.7667729481717,40.7668502329003,40.767012496033,40.7671171613372,40.7672377807649,40.767378768977,40.767634597848,40.7677453787863,40.7678693459678,40.7679107668138,40.7678803220334,40.7681139737714,40.7681405307259,40.7681117877467,40.7682021811483,40.7682354881896,40.7682724941985,40.7683123196664,40.768354018074,40.7683965983867,40.7684390486081,40.7684803598314,40.7685195502188,40.7685556883361,40.7685879152909,40.7686154651458,40.7686376831233,40.7686540411678,40.7686365983954,40.7686348274798,40.7686343447258,40.7686351629007,40.7686372603664,40.7686405816521,40.768645038921,40.7686505142932,40.7686568629639,40.7686639170317,40.7686714899403,40.7686793814116,40.7686873827425,40.7687117475274,40.7691483140067,40.7694763635387,40.7696566229569,40.7696776973586,40.769701195878,40.7697264413064,40.7697527060891,40.7697792332942,40.7706239195225,40.7706354051099,40.7706590865698,40.7706880446292,40.77071924132,40.7707615729026,40.7708440330094,40.770913141616,40.7709822506859,40.7710637883776,40.771187619866,40.7713286168155,40.7714389166097,40.7714842044611,40.7717300940228,40.7717424198502,40.7718047991526,40.7718425892653,40.7718582908746,40.7718937785809,40.7719205974044,40.77192719326,40.7719373927848,40.7719455348769,40.7719381995896,40.7719202868164,40.7719253723929,40.7718920990567,40.7719023708404,40.7717436685388,40.7717514018896,40.7718153938307,40.7718728728169,40.7717986364652,40.7718063607977,40.7719855347437,40.7719803750371,40.7718907861486,40.7718307456479,40.7720176057582,40.7720098772678,40.7719663535201,40.7719613264906,40.7719722742625,40.7719582988771,40.7719964846866,40.7720573726163,40.7721830620083,40.772181073431,40.7722246010576,40.7722310028675,40.7724132017968,40.7725611038308,40.7731047205878,40.773561667957,40.7737426847534,40.7742602289575,40.774547634476,40.774647143387,40.7747468305643,40.7748462499292,40.7749449565996,40.7751806772603,40.7752401986213,40.7753003947951,40.7753437966687,40.7754496026242,40.7755570801295,40.7756777117085,40.7757859545258,40.7757872041511,40.7757904695304,40.7758628976196,40.7758570040435,40.7768987582343,40.7768953095458,40.7769709551684,40.7769725328638,40.7770040190173,40.7772884434292,40.7774046325397,40.7775220511735,40.7776349182881,40.7776746535854,40.7777726162806,40.7778905618542,40.7779277044723,40.7779616737314,40.7779930975469,40.7780222126916,40.778035349459,40.77804830061,40.7780607408781,40.7780619227545,40.7780722833649,40.7780825861551,40.7780913763564,40.7780984127069,40.7781035572198,40.7781146964072,40.7781268708983,40.7781313856985,40.7781350098243,40.7781409662616,40.7781454562187,40.778151013116,40.7781554680088,40.7781613363876,40.7781686807282,40.7781776358171,40.7781963620502,40.7782455631846,40.7782960661401,40.7783177984236,40.7783385362539,40.7783571533709,40.7783765783913,40.7783965952396,40.7784169520326,40.7784258855571,40.7784280226931,40.7784150676699,40.7784140540061,40.7784648141079,40.7784576207925,40.7784774737098,40.7784967206788,40.77849996042,40.778503046788,40.7785059965302,40.7785088558094,40.7785142474239,40.7785289402598,40.7785317531955,40.7785346220716,40.7785375895118,40.7785406945507,40.7785628227849,40.7785809042142,40.7785972153535,40.778611854336,40.7786252187192,40.7786370998582,40.7786425051229,40.7786475428337,40.7786522300801,40.7786565680661,40.7786637832117,40.7786703974749,40.778681831986,40.7786910397336,40.7786987387911,40.7787021144364,40.7787093897783,40.7787106971923,40.7787176895194,40.7787223057725,40.7787275670224,40.7787337148237,40.7787370807666,40.7787406432912,40.7787444116298,40.7787483857953,40.7787525659411,40.7787673065305,40.7787691233811,40.7787972078514,40.7787932848278,40.7790753440231,40.779092971224,40.7790979571351,40.7791027721457,40.779107423136,40.7791119300429,40.779120544852,40.7791287409931,40.7791422210895,40.7791686954207,40.77917013101,40.7791714321454,40.7791736610764,40.779179107167,40.7791801623394,40.7791806638393,40.7791824734944,40.7791837921646,40.7791852653028,40.7791868916915,40.7791886899235,40.779190668866,40.7791928367071,40.7793974127518,40.7794102641417,40.779423236719,40.7794358597249,40.7794477285177,40.7794584194067,40.7794677983543,40.7794756640682,40.7794819203516,40.7794832751768,40.779484414463,40.7794860543913,40.7794868489138,40.7794868257497,40.7794850214888,40.7794780826873,40.7794771327596,40.7794770512094,40.7794770016193,40.7794772014244,40.7794014466933,40.7793479301085,40.7793513879418,40.779373355586,40.7793668110852,40.7793008958767,40.7791939971125,40.779169818249,40.7791109141126,40.7790691554303,40.7790145548318,40.7790255445723,40.778964409228,40.778992978115,40.7790497196378,40.7790760853376,40.7791219566744,40.7791988509629,40.7791966839187,40.7792977581858,40.7793021135179,40.7792801335207,40.7792931924929,40.7793261428947,40.7793544313482,40.7793236703812,40.7794327419909,40.7793909869257,40.7793997352013,40.7794283042224,40.7794494320195,40.779497684695,40.7796303475517,40.7796257361652,40.7796146119484,40.7796058207622,40.7796036617876,40.7796172547142,40.7794806723308,40.7791692847038,40.7791693305224,40.779528902387,40.7795301047395,40.7794967390453,40.7796412908963,40.7796513388014,40.7797754749193,40.7797760591059,40.7797765525346,40.7797767321848,40.7797769473173,40.7797773932584,40.7797775943701,40.7797772551562,40.779777578081,40.7797780958188,40.7797788930893,40.7797799606192,40.7797806079772,40.7797813268558,40.7798040781185,40.779818952924,40.7798318720117,40.7798420252853,40.7798503157095,40.7798567695424,40.7798613687042,40.7798629683335,40.7798637569994,40.7798630981408,40.7798629428829,40.779863362337,40.7798644217452,40.7798655236281,40.7798671914877,40.7798694100939,40.7798721504081,40.7798754047535,40.7798790821672,40.779883111391,40.7798873751284,40.7798934034192,40.7798999023976,40.7799146226605,40.7799297884833,40.7799303106001,40.779956619026,40.7799541367178,40.7799755827205,40.7799772444365,40.7799932316923,40.779992164306,40.7800384925936,40.7800317570607,40.7800415360041,40.7800351500029,40.780009591583,40.7800112407751,40.7800352073006,40.7800336506964,40.7798882804164,40.7798883131417,40.7799618037754,40.779939312462,40.7798690354904,40.7798675084782,40.7800352288782,40.7800319717782,40.779958486575,40.7799777820332,40.780052854328,40.7800559787879,40.7800783418344,40.7800798737037,40.7800575053661,40.780063417452,40.7800637654157,40.7800658281143,40.7800733149272,40.780080506978,40.780087511267,40.7800909787996,40.7800944294669,40.7801028883447,40.7801119000144,40.7801355242267,40.780152066413,40.7801922887394,40.780204394645,40.780215877081,40.78022402241,40.7802327251199,40.7802522507548,40.7802711782034,40.7803150277184,40.780335081953,40.7803880829938,40.7804481086025,40.7804905309982,40.7805290820304,40.7805375497305,40.7805460020664,40.7805543490301,40.7805624361923,40.7805701745035,40.780577329243,40.7805837007107,40.7805890838684,40.7805909816672,40.7805924219055,40.7805934205594,40.7805940074504,40.7805937749811,40.7805926426787,40.7805928356284,40.7805935576707,40.7805951438864,40.7805962570201,40.7805975761732,40.7805991194254,40.780600897389,40.7806028999686,40.7806051361054,40.7806130421558,40.7806217654511,40.7806248109736,40.7806417130347,40.7806556199932,40.7806650503149,40.7806921747954,40.7806925338017,40.7807704002551,40.7807983057512,40.7808527216544,40.7808707336331,40.7808868213689,40.7809263320207,40.7809904868128,40.7810069582443,40.7810598518288,40.7810695797273,40.7810774454993,40.7810891347985,40.7810875045878,40.7810811628921,40.7811195751561,40.7811207445754,40.781121511317,40.7815925035828,40.7815963078438,40.7815996249163,40.7816024725298,40.781604861068,40.7816092744673,40.7816129120829,40.7816180841482,40.7816204397676,40.7816238793465,40.7816294265947,40.7816313939725,40.7816314472538,40.7816301979054,40.7816273708799,40.7816281569096,40.7816322931913,40.781632444373,40.7816327132327,40.7816331071132,40.7816336186571,40.7816342477153,40.7816349937825,40.7816368270498,40.7816391211826,40.7816418115496,40.7816448799365,40.781648246297,40.781655810122,40.78166340131,40.7816669065658,40.7816700955143,40.7816728897348,40.781675233045,40.7816855422035,40.781694297022,40.7817015683533,40.7817075022081,40.7817116693043,40.7817137863902,40.7817151039746,40.7817237213406,40.781728766523,40.7817326088131,40.7817371879861,40.7817425835193,40.7817488509115,40.7817574776549,40.781768120017,40.7817805696058,40.7817945127795,40.7818096322885,40.7818253345221,40.7818410783428,40.781856304946,40.7818882275847,40.7819182179949,40.7819321025794,40.7819451490889,40.7819572654948,40.7819684089369,40.7819847269812,40.7819971028197,40.7820008413416,40.7820147657062,40.7820455551029,40.7820614132617,40.782077151263,40.7820933366979,40.7821216618079,40.7821482489952,40.7821736373941,40.782185916496,40.7821979450485,40.7822241773711,40.7822360040669,40.782246777804,40.7822563658243,40.7822647750141,40.782271979174,40.7822751094832,40.7822779414523,40.7822932607292,40.7823070452062,40.7823195678342,40.7823317673307,40.7823468617589,40.7823565383288,40.7823638509943,40.7823688187471,40.7823721947953,40.7823772124648,40.7823805569578,40.7823852474595,40.7823994885058,40.7824047361298,40.7824111759684,40.7824128500344,40.782415578321,40.7824160584908,40.7824166823339,40.7824174593734,40.7824184063708,40.7824207613793,40.782423809575,40.7824304439133,40.7824471718367,40.7824508766953,40.7824538251473,40.7824562419081,40.7824571993375,40.7824579936572,40.7824586262256,40.7824590968751,40.7824594062907,40.7824595620097,40.7824594501765,40.7824587981992,40.7824576062418,40.7824558923558,40.7824508624185,40.7824439398875,40.7824400365618,40.7824353948901,40.7824143253286,40.7824096391163,40.7824057458791,40.7824026184906,40.7823997795102,40.7823949958829,40.7823914579839,40.7823892365788,40.7823655417529,40.7823596976135,40.7823556816683,40.7823538758949,40.7823533770715,40.7823535777509,40.7823545545972,40.7823574119004,40.7823656856376,40.7823661090331,40.7823644293834,40.7823648822581,40.7823669391368,40.7823675073224,40.7823687510139,40.7823706705482,40.7823732288978,40.782380055477,40.7823842065423,40.7823887261734,40.7823954522827,40.7824025473338,40.7823627485047,40.7823473517416,40.7823444313643,40.7823420129366,40.7823415905752,40.7823463020602,40.7823453746638,40.7823444047413,40.78233528002,40.7823325916867,40.7823336079911,40.7823319439296,40.7823294478093,40.7823239362762,40.7820605343677,40.7820523924323,40.7820453796002,40.7820394680011,40.7820346040685,40.7820133075259,40.7819893452158,40.7819857420443,40.7819834657389,40.7819824641859,40.7819826590508,40.7819898478721,40.7819910363287,40.7819891532956,40.7819858434604,40.7819737738869,40.7819711698128,40.7819711580894,40.7819742306819,40.7819745786585,40.7819707403591,40.7819642543566,40.781960354355,40.7819494855051,40.781945945171,40.7819417721035,40.7819400414699,40.7819401624212,40.7819419356182,40.7819463587956,40.7819541316171,40.7819571755349,40.7819617492294,40.7819678283961,40.78197538435,40.7819821898746,40.781990722551,40.7820006664206,40.78201175909,40.7820311583959,40.7820527693984,40.7820757163107,40.7831430791384,40.7831462937428,40.7831565720153,40.7831920256768,40.7831941569609,40.7833097043257,40.7831982787344,40.7831963175047,40.7833178794989,40.7833199265098,40.7833228315917,40.7833265089613,40.7833308500307,40.7833476593407,40.7833668419768,40.7833509256586,40.7831575174696,40.7831500881622,40.7830952690483,40.7829794392901,40.7829793995011,40.7829388779057,40.782939879659,40.7828922612489,40.7828923192765,40.7829379076501,40.7829399691744,40.7830971218703,40.7831492454122,40.7831816096159,40.7831994643511,40.7832055366518,40.7832210176351,40.7832478019948,40.7833056179529,40.7833324144557,40.7833578888195,40.7833649579539,40.7833713634853,40.7833769596927,40.7833815677666,40.7833850230585,40.7833871833197,40.7833879650051,40.7833876753983,40.7833873770771,40.7833873417309,40.7833856300841,40.7833787846975,40.7833698420242,40.7833660023862,40.7833632081253,40.7833607852837,40.7833618988338,40.783365399195,40.7833712705862,40.7833805717448,40.7833909159606,40.7834020408334,40.7834139376717,40.7834266144708,40.7834495245746,40.7834726521098,40.7834842355178,40.7834958250098,40.7835529504445,40.7836118705042,40.7836294639796,40.7836444302952,40.7836564486787,40.7836652615408,40.7836706799958,40.783701262811,40.7837056587245,40.7837133378409,40.7837240783392,40.7837360666499,40.783737216159,40.7837527480158,40.7837685641093,40.783787113496,40.7838563745811,40.7839312743377,40.7839922803871,40.7840038792876,40.7840143904432,40.784029104427,40.784045385003,40.7841047537112,40.7841508656469,40.7841581943129,40.784183492245,40.7841894851851,40.7841953875906,40.7842068533689,40.7842177996633,40.7842281037271,40.7842376930169,40.7842462646117,40.7842535869457,40.7842593603326,40.784260646058,40.78426120025,40.7842602952641,40.7842605084938,40.7842618368787,40.7842629736266,40.7842644314109,40.7842721828844,40.7842783382413,40.7842816306445,40.7844902808531,40.7844869928471,40.7845006749303,40.7845214338316,40.78464204265,40.7846418219353,40.7846416218333,40.7846419465937,40.784642762981,40.7846433138472,40.7846439621539,40.7846446990629,40.7846455182097,40.7846464167432,40.7846468982221,40.7846474055865,40.7846479217502,40.7846484562435,40.7846490077458,40.7846495785999,40.7846542812683,40.7846590127117,40.7846638151596,40.7846687798017,40.7846779246796,40.7846971992795,40.7847327874711,40.7847995493064,40.7848278812825,40.7849260256983,40.7849600514155,40.7849918104881,40.7850760026552,40.7851351155134,40.7851460266367,40.7851681101616,40.7851774798582,40.7851847788229,40.7851927985309,40.7852023581436,40.7852135187801,40.7851867547312,40.7854318130604,40.7854387488516,40.7854210766932,40.7854210635718,40.7852424356453,40.7852373818136,40.7854210532163,40.7854238078202,40.7854621177997,40.7854730966686,40.7854779160476,40.7854712964987,40.7853134585011,40.7853065887557,40.785474638804,40.7854847761963,40.7854948519958,40.7850329229736,40.7850272499427,40.7855349344498,40.7855238142884,40.785490787009,40.7854674413741,40.785466687763,40.7855322885732,40.7854915989337,40.7855676473883,40.785568258522,40.7855723261863,40.7855797500922,40.7855903472023,40.7856038562431,40.785619944147,40.7856382142637,40.7856582161397,40.7856794566244,40.7857014120282,40.7857086430327,40.7857175812215,40.7857258080536,40.785733131795,40.7857407941577,40.7857484372248,40.7857658557739,40.7857686317432,40.7857712532768,40.7857777385755,40.7857787343275,40.7857819826515,40.7857861246122,40.7857884162219,40.7857908990386,40.7857967552268,40.7858012183569,40.7858501596633,40.78587950877,40.7858331440172,40.7858379435863,40.7858640010405,40.7858736231374,40.7858953110374,40.7859053119992,40.7859113826315,40.7859177494582,40.7859314633508,40.7859467137198,40.7859653280889,40.7859757493133,40.7859858070305,40.7859955298419,40.7860049428746,40.7860139837321,40.7860228320711,40.7860407269143,40.786060406764,40.7860773459903,40.7860920651219,40.7861047586804,40.7861160509228,40.7861160950122,40.786119285862,40.7861229634397,40.7861300502776,40.78613862516,40.7861432828277,40.7861481401539,40.7861531412278,40.7861582619724,40.7861701689543,40.7861834550642,40.7862177485719,40.7862483282274,40.7862626208649,40.7862761856911,40.7863022756082,40.7863296299931,40.7863588004607,40.7863919296574,40.7864051903775,40.7864332749708,40.786446307886,40.7864623396077,40.7864755937846,40.7864875994094,40.7864931915313,40.7864985311968,40.7865146429146,40.7865311664753,40.7865481279856,40.7865655912097,40.7866236937792,40.7866696936795,40.7866909095136,40.7867446917686,40.7867570418366,40.7867881399263,40.7868028166846,40.7868056038515,40.7868083088096,40.7868190763193,40.7868219967646,40.786824962769,40.7868746539632,40.7869167106169,40.786922025965,40.7869284305649,40.786957292383,40.7869886573049,40.7870251198739,40.7870353797448,40.7870443224427,40.7870515610583,40.7870568095318,40.7870610245931,40.7870634921445,40.7870641652476,40.7870637207597,40.7870630366927,40.7870607052523,40.7870573945442,40.7870530675205,40.7870477078462,40.7870373942496,40.7870085512159,40.7869854726106,40.7869588672528,40.7869533043963,40.7869494384355,40.7869438697911,40.7869405383442,40.7869345633679,40.7869305506197,40.7869257918643,40.786914159889,40.7868858707636,40.7868743943249,40.7868406018259,40.7868311443964,40.7868214932216,40.7867741129347,40.7867670428218,40.7867297906616,40.786726038937,40.7867226906774,40.7867170801769,40.7867132881668,40.786706338611,40.7867023487939,40.7866910921323,40.7866603673984,40.7866529665899,40.7866473587636,40.7866468613788,40.7866465433968,40.7866463960797,40.7866464287937,40.7866470078726,40.7866482898672,40.7866523110221,40.7866618960064,40.7866669170037,40.7866681997942,40.7866694015238,40.786670161512,40.7866704802051,40.7866702304688,40.7866674589294,40.7866680581964,40.7866726136972,40.7866789999569,40.7867250942854,40.7868210958118,40.7867814844711,40.786805703958,40.78686911485,40.7868867897883,40.7869021140709,40.7869405473222,40.7869456209542,40.7869499470433,40.7869535975319,40.7869566073632,40.7869573798007,40.7869580345478,40.7869589837193,40.7869594565097,40.7869594588159,40.7869584476724,40.7869540231713,40.7869535010652,40.7869535233956,40.7869537546852,40.786958122218,40.7869644939021,40.7869728343127,40.7869777303889,40.7869831152467,40.786995560741,40.7870107630822,40.7870665582273,40.7870869352879,40.787102539164,40.7871391813683,40.787150099959,40.7871605901001,40.787184399752,40.7872103854659,40.7872378980414,40.7872660650637,40.7873564851248,40.7874367360879,40.7874632288901,40.7874870532672,40.7874902139066,40.7874932203783,40.7874960999724,40.7874988444849,40.7875014709837,40.7875039788167,40.7875087254457,40.787512604871,40.7875164561311,40.7875295070387,40.7875358166556,40.7875387538151,40.787543885084,40.7875530575746,40.7875642754802,40.7875775414562,40.7875925703506,40.7876090391171,40.7876265937591,40.787644856939,40.7876540915578,40.7876628511852,40.7876708994197,40.7876780190586,40.78768401796,40.7876887342275,40.7876920405804,40.7876938477878,40.7876941070777,40.7876928114524,40.7876899958776,40.7877012650506,40.7877406633472,40.7877408454555,40.7877415317101,40.7877479774383,40.787760244018,40.7877636317717,40.7877747077918,40.7877785363976,40.7877800112108,40.7877779701303,40.7877744366748,40.7877693420802,40.7877443942782,40.7877383573417,40.7877332970451,40.7877322639257,40.7877332993578,40.7877361785098,40.7877401363158,40.7877452411208,40.7877470363194,40.7877478326466,40.787747770894,40.7877467625796,40.7877391812691,40.787738585524,40.7877391174959,40.7877496234577,40.7877642541169,40.7877735914002,40.7877988908432,40.7878148065272,40.7878261122989,40.7878414804763,40.7878516000105,40.7878626478783,40.7878754419326,40.7878902230359,40.7879552694068,40.7880216484108,40.788040223036,40.7880636401194,40.7881256745966,40.7881798029866,40.7882007950567,40.78821137174,40.7883425559736,40.7883443198081,40.7883466700547,40.7883518368267,40.7883565481552,40.7883584792453,40.7883582035134,40.788354361055,40.7883537164766,40.7883585027618,40.7883582918015,40.7883559182099,40.7883530671375,40.7883421193779,40.7883386501492,40.7883268654901,40.788317567238,40.7883145244578,40.7883134195514,40.7883135904509,40.7883153364687,40.7883201287631,40.7883277705762,40.7883414289246,40.7883528560614,40.7883661828541,40.7883812533475,40.7883979524285,40.7884179836344,40.7884419403596,40.7884702736739,40.7885052109386,40.7885458079073,40.7885712545172,40.7885838077019,40.7885958718753,40.7886076265757,40.788619154726,40.7886424406296,40.7886791650702,40.7886916255109,40.7886996843287,40.7887130458246,40.7888025727664,40.788841633481,40.788955872243,40.7890140184268,40.7890363746053,40.7890569444254,40.7891001932848,40.7891192585846,40.7891978495561,40.7892508270213,40.7892933054345,40.7893112160053,40.7893476708363,40.7893636640657,40.7894326424126,40.7894490307779,40.7894844723069,40.789500662973,40.7895444735531,40.7895964949524,40.789669701203,40.7897613922474,40.789839561727,40.7898602595823,40.7898630841415,40.7898742202651,40.7899056090383,40.7899715681131,40.7900676017097,40.7901438739899,40.7901826438907,40.7902092631364,40.7902350585008,40.7902519232989,40.7902589753197,40.7902650106149,40.7902700630987,40.7902741788143,40.7902765226143,40.7902824409385,40.7902877220713,40.7904127194676,40.7904523273892,40.7905214314555,40.7905500358302,40.7906429548221,40.7906768141644,40.7907062924061,40.7907300418345,40.7907391966593,40.7907580336076,40.7907680508078,40.7908062321866,40.7908221208975,40.7908378437132,40.7908801362715,40.7909624692666,40.7909804673935,40.7909949843917,40.7910106020699,40.7910169207815,40.7910272026103,40.7910446716385,40.7910546453516,40.7910658077818,40.7910781619277,40.7910917047769,40.7911064206104,40.7911223175911,40.7911577175786,40.7911894064415,40.7912222992785,40.791255795028,40.791288990017,40.7913324371743,40.791374021321,40.7914138230817,40.7914518894217,40.791504695552,40.7915337855143,40.7915629676357,40.7915888437369,40.7916568213596,40.7917334591462,40.7918130109537,40.7918373960324,40.7918585827567,40.7919704847854,40.7920223256694,40.7920518097362,40.7921446096513,40.7922277032182,40.792269110706,40.7922937728053,40.7923056536358,40.7923174431689,40.7923209480197,40.7923357789069,40.7923452100119,40.7923570638797,40.7923805338499,40.7924212740071,40.7924623998931,40.7924791912423,40.792494576789,40.7926410359781,40.7927520959118,40.7927708176801,40.7928117594108,40.7928294911268,40.7928646270355,40.7929208166977,40.7930242496179,40.7930981827107,40.7931452525336,40.7932072949071,40.7933359306464,40.7934537228789,40.7935954061873,40.7937199835051,40.7938404968421,40.7939353745886,40.7939620361281,40.7940183940818,40.7941078285374,40.7941388568118,40.7941433773621,40.7941831141106,40.7942205813618,40.794263553964,40.7943152285713,40.7943552604912,40.7943892473268,40.7944749702777,40.7945422928064,40.7946134426322,40.7947501559246,40.7948750902792,40.7949197124436,40.7949448542448,40.7949356383685,40.794921584004,40.7948935654752,40.7947900575559,40.7946749747057,40.7946097588211,40.7945453656644,40.7945125465837,40.7944464925885,40.7943631810886,40.7943097895453,40.7942866563134,40.7942369078767,40.7941425580734,40.7940865310779,40.794025918326,40.7939832182086,40.7939241220337,40.7938579483241,40.7938096113682,40.7937752170512,40.7937372727052,40.7936776621959,40.7936430661054,40.7936009112341,40.7935444852096,40.7934956948206,40.7934656957081,40.7934186008034,40.7933714995663,40.793366160022,40.7933627058054,40.7933626102986,40.7933936118035,40.7934106970552,40.7934353871783,40.7934686357805,40.7935016856584,40.793591099023,40.7936548825396,40.7936682835136,40.7938049149536,40.7939248437994,40.7941453844808,40.7943380851379,40.7944084774066,40.7945421022253,40.7945797434827,40.7946173760442,40.794700915277,40.7949052303921,40.7950274880249,40.7951340416913,40.7952291665776,40.7952873147896,40.7954164812899,40.7954950602184,40.7955646214925,40.7956318413205,40.7957001884428,40.7957535136949,40.7957846954682,40.7958258147621,40.7958612647809,40.7959003503074,40.7959350617996,40.7959795421146,40.7959928896873,40.7960014793448,40.7960272349111,40.7960618337927,40.7961016793411,40.7961415161359,40.7961640887608,40.7961630954373,40.7960953012324,40.7960405418083,40.7960206501275,40.7960182462148,40.7960364754668,40.7960371406902,40.796038345425,40.7960208961932,40.7959921834845,40.7959010204484,40.7958547832608,40.7958161924222,40.7957730473326,40.7956537920135,40.7955551768003,40.7954493863021,40.7954033132889,40.7953295785435,40.7952686434177,40.7952055964521,40.7951115949874,40.7950991978634,40.7950594299096,40.7949572448069,40.7949115498753,40.7948817901689,40.7948703415296,40.7948769850736,40.7948750608418,40.7948693062064,40.7948753627733,40.7948773563773,40.7948823536506,40.7949139440105,40.7949484490879,40.7949849186198,40.7950213869604,40.7950690501908,40.7952343537995,40.7953460986688,40.7954725292437,40.7955009339915,40.7954766038033,40.7954338725297,40.795386787331,40.79526369124,40.7952147395144,40.7951911498972,40.7951827854082,40.795198875175,40.7952134016718,40.7953927788397,40.7961743926851,40.7961929035958,40.7954182224131,40.7955849689374,40.7969036861841,40.796922229072,40.7956129401637,40.7956370563647,40.795638683134,40.7956403110508,40.7956217937382,40.7955440423641,40.7954226065058,40.7952351385212,40.7951837711614,40.7951372996179,40.7951469514577,40.7951729435774,40.7952725142188,40.795529810553,40.7957073377287,40.7958312820762,40.7959683836091,40.7959997878801,40.7960350947157,40.7960972419744,40.7961422695915,40.7961719767958,40.796201242151,40.7962196693301,40.7968068037132,40.7968791878362,40.7976375132454,40.7976486295221,40.7976784372588,40.7978853064483,40.797844314354,40.7983421471381,40.7983756711534,40.7985089706841,40.7984419086133,40.798304872076,40.7977772664477,40.7976111513116,40.7975888584322,40.7969056418923,40.7970524765783,40.7967867588929,40.7967552588095,40.7942635242478,40.7942195856369,40.7941113844932,40.7940236995242,40.7939034619706,40.7938510984263,40.7937989224516,40.7936955500412,40.7930667981122,40.7925163755387,40.7923243621429,40.7920825505518,40.7918833361863,40.7917627670009,40.7916874911644,40.7916272228539,40.7915871742873,40.7915546200463,40.7915372195209,40.7915077311203,40.7914927024973,40.7914741650158,40.7914552174065,40.7914381313692,40.7913927856811,40.7911833296721,40.7910277512074,40.7910191446822,40.7910121295992,40.7910044250841,40.7909877330138,40.790986990829,40.7909672880357,40.7909572733806,40.7909466312029,40.7909002191577,40.7908888440096,40.790878303229,40.7908525585119,40.7908313562768,40.7908126724666,40.7908042298948,40.7907963322975,40.7907948205895,40.7907933795114,40.7907906440359,40.7907881153867,40.7907857390111,40.790782015015,40.7907745033427,40.7907702696939,40.7907680018807,40.7907655886923,40.7907629913001,40.7907616200489,40.790760193642,40.7907259999499,40.7906931359785,40.7906480491706,40.790611082348,40.7905919797049,40.7905505540257,40.7905323191937,40.7905243984534,40.7905156114012,40.7904857619449,40.7904751756337,40.7904656106005,40.7904616607255,40.7904581350507,40.7904879771789,40.7904969051698,40.7904733439796,40.7904699063598,40.7904337722765,40.7904293496586,40.7904089201215,40.7903984321205,40.7904361320694,40.7904344979218,40.7904016496895,40.7903652718936,40.7903585990744,40.790329213628,40.7903205911565,40.7903114196671,40.7903016031022,40.7902909683901,40.7902701105019,40.7902136099767,40.7901969180668,40.7901821212049,40.7901697682851,40.7901027777262,40.7900721756343,40.7900038366834,40.7899678015552,40.7899242871322,40.7899121529087,40.7899029136292,40.7898924798109,40.7898524231538,40.7898361731723,40.7898276176456,40.7898198989449,40.7898128523576,40.7898064081605,40.7898018805973,40.7897974691165,40.7897945649832,40.789784902337,40.7897799390664,40.7897383697499,40.7897305954614,40.7897218868489,40.7897012915246,40.7896776394661,40.7896347656684,40.7896199205454,40.7896033775379,40.7895998261337,40.789584629851,40.7895388538312,40.7895283586535,40.7895106816189,40.7894950267289,40.7894906933349,40.7894863857555,40.7894820587286,40.7894776305858,40.789452732624,40.789444092426,40.7894398832841,40.789435710496,40.7894315381581,40.789427313819,40.7893955043588,40.7893639619274,40.7893484758498,40.7893331800396,40.7893036021802,40.7892038906392,40.7891687971141,40.7891602710237,40.7891039286292,40.7890636647658,40.7890189130523,40.789012960759,40.7890110520147,40.7890103760698,40.789009872422,40.7890097010791,40.7890096284733,40.7890095659032,40.7890095207727,40.7890094751048,40.7890094487026,40.7890094392384,40.7890094297553,40.7890094390368,40.7890094570122,40.7890094925951,40.7890095281605,40.7890095829923,40.7890097259752,40.7890101492616,40.7890107519158,40.7890125060032,40.7890392349159,40.7891022119487,40.789245540709,40.7893012350331,40.7893738579389,40.7893824640929,40.7893914410781,40.7894108754482,40.7894321899102,40.7894760661054,40.7894948763895,40.7895146554894,40.7895323762479,40.7895370570781,40.789541565827,40.7895459020083,40.789550019907,40.7895539307637,40.789557587735,40.7895640330144,40.7895692575746,40.7895727058168,40.7895741096988,40.7895739968566,40.7895733359232,40.7895676955481,40.7895578458149,40.7895461723474,40.7895167139114,40.7895045219314,40.7894964138152,40.7894920903487,40.7894878361173,40.7894809666191,40.7894769752289,40.7894738950618,40.7894618763641,40.7894601786897,40.7894606793847,40.7894649099217,40.7894726309308,40.7894819935521,40.7895067775186,40.7895173977004,40.7895419267815,40.7895626562645,40.7895704025412,40.7895750618621,40.7895765695558,40.7895749175684,40.7895726709811,40.7895687318914,40.7895632633592,40.78955645587,40.7895485435499,40.7895396182709,40.7895297778033,40.7895245480567,40.7895191218109,40.7894944457748,40.789467323243,40.7894373018933,40.7894028071528,40.7893930704165,40.7893820648424,40.7893331591739,40.7893210989204,40.7893104136386,40.7892964002845,40.7892830303298,40.7892702858001,40.7892581035027,40.7892465830462,40.7892354180576,40.7892244538512,40.7892127427169,40.7892001718458,40.789189323718,40.7891799988435,40.7891756575894,40.7891717446899,40.789155676374,40.7891427409931,40.7891393150272,40.7891389201822,40.7891274759955,40.7891158515245,40.7891096669679,40.7891058171757,40.7891001055345,40.7890926171273,40.7890799571479,40.7890733609397,40.7890661365515,40.7890472527871,40.7890402333683,40.789033297172,40.7890147407899,40.7889946301841,40.7889667164861,40.7889393565653,40.7889194070805,40.7889107676648,40.788902643937,40.7888350452047,40.7887734727541,40.7887388505966,40.7887258587175,40.7887144413172,40.7886619097705,40.7886016047977,40.7885837963545,40.7885602897998,40.7885472543206,40.7885370391768,40.788528894613,40.7885226779909,40.7885171690437,40.788512638504,40.7885090415024,40.7885062601313,40.7885011037913,40.7884968047721,40.7884916542611,40.7884855299223,40.7884695833259,40.7884632432505,40.78845948417,40.7884575175306,40.7884570983135,40.7884582011377,40.7884607903143,40.7884647848294,40.7884730727962,40.7884950098003,40.7885124146259,40.7885237395001,40.788526022512,40.7885277657402,40.7885297167285,40.7885296829038,40.788527676001,40.788525207069,40.7885174257998,40.7885152791057,40.7885143613674,40.788514855148,40.7885148757639,40.7885157011463,40.7885181142032,40.7885199653959,40.7885222861663,40.7885262597179,40.7885315928645,40.7885528569813,40.7885603920656,40.788577145438,40.7885813166635,40.7885842384108,40.7885858290144,40.7885868322485,40.7885885441614,40.7885958865843,40.7886038966672,40.7886095496034,40.7886164038494,40.7886244771295,40.7886337587207,40.7886647414551,40.7886987959711,40.7887143889003,40.7887272300497,40.7887315375748,40.7887388067533,40.7887422812427,40.7887500836638,40.7887590504147,40.7887720384188,40.7887876670013,40.7887974850335,40.7888194835839,40.7888285654378,40.788893858384,40.7889195359881,40.7889388884259,40.7889629425079,40.788991697183,40.7890583724827,40.7891077420572,40.789145695126,40.7891776215153,40.7891921252012,40.7892083878162,40.7892155190687,40.7892222695243,40.7892285938699,40.7892344025369,40.789243471813,40.7892516507821,40.7892564344472,40.789259370634,40.7892601312027,40.7892598471141,40.7892561486008,40.7892537540507,40.7892502063814,40.789239634972,40.7892230142825,40.7892044825516,40.7891966716302,40.7891881877258,40.7891791920547,40.7891698821525,40.7891705107698,40.7891712657704,40.7891731881408,40.7891755897658,40.7891783514885,40.7891813565486,40.7891844349964,40.789187433614,40.7891902168771,40.7891916230055,40.7891929293991,40.7892081830342,40.7892216935229,40.7892327841852,40.7892373071763,40.789241102134,40.789271629249,40.7892796458089,40.7893060201033,40.7893087523728,40.7893111181742,40.7893160805797,40.7893245733004,40.7893321409708,40.7893432690681,40.7893534659813,40.7893583488628,40.7893633301516,40.7893786290476,40.7893952772349,40.7894147721322,40.7894329016443,40.7894504768215,40.7894687516419,40.78948843565,40.789504855641,40.789512437144,40.7895329018442,40.7895368097755,40.7895611494737,40.7895818108823,40.7896061093056,40.7896405834491,40.7896832691773,40.7896968480665,40.7897678518196,40.7898191342405,40.7898420915545,40.7898941633425,40.7899618174896,40.7899819419177,40.7900332448532,40.7900434400634,40.7900544598549,40.7900809167541,40.7901112589578,40.7901400043185,40.7901996934345,40.7902425073936,40.7902711919094,40.7902749617456,40.7903322581006,40.7904000058992,40.79041409217,40.7904602378586,40.790489188048,40.7905255301926,40.7905647007998,40.7906020861226,40.7906397834136,40.7906729845925,40.7907521131649,40.7908195349017,40.7908560882048,40.790859302769,40.7908791240621,40.7909039908807,40.7909558617997,40.7909826674085,40.7909882016103,40.7910061062816,40.7910319856811,40.7910698479439,40.7911025911598,40.7911260307549,40.7911863809625,40.7912215329647,40.7912430928392,40.7912979170084,40.7913572381043,40.7913689446621,40.7913806753732,40.7913926980327,40.7914070368904,40.7914342890164,40.7914546478222,40.7914942451025,40.7915329687798,40.791554098882,40.7915678652264,40.79157601669,40.7915958172113,40.7916244040189,40.7916419976364,40.7916502145486,40.7916558544669,40.7916579233204,40.7916559781076,40.7916507931246,40.7916440753189,40.7916304601576,40.7916209333094,40.7915970833747,40.7915959270037,40.7915705286389,40.7915598702818,40.7915526437225,40.7915504987699,40.7915495763973,40.7915498573733,40.7915514480657,40.7915565497871,40.7915635083495,40.7915878519821,40.7916177224087,40.7916310086012,40.7916542022209,40.7917153699128,40.7917555240344,40.7917768279976,40.7918276613294,40.7918732926752,40.7918843295234,40.7918985284842,40.7919161612314,40.7919395009458,40.7920140188104,40.7920710926641,40.7921242116801,40.7922026565185,40.7922868546113,40.792353130464,40.7924942361753,40.7925336706635,40.7929309066725,40.7930022876791,40.7925972864188,40.7925522975458,40.7925879798131,40.7927385281976,40.7927466063202,40.7927552600028,40.7927780163369,40.7927978948717,40.7928002315742,40.7928321983638,40.7928935928908,40.7929744250619,40.792975450948,40.793295389702,40.7933603766324,40.7933920715531,40.7934207904286,40.7934979275818,40.7935739956814,40.7936591510975,40.7937055369979,40.7937384997958,40.7938319609771,40.79389588653,40.7939282382229,40.7939797201671,40.794013329539,40.7940370975774,40.794056467828,40.7940821641805,40.7941518101459,40.7942205436928,40.79424771288,40.794320580512,40.794338895682,40.79434539841,40.7943511909803,40.7943664350018,40.7943759884469,40.7944012357006,40.7944259908969,40.7944678938515,40.7944950824909,40.7945097036748,40.7945250968455,40.7945405141435,40.7945559107558,40.794590075621,40.7946320151909,40.7946733759828,40.7947102837887,40.7947499779853,40.7947852009929,40.7947943704103,40.7948012446704,40.7948068691226,40.7948092222351,40.7948112881149,40.7948125876547,40.7948137075846,40.7948146391739,40.7948395207714,40.7948763113577,40.7948816591324,40.7948848331576,40.794888377715,40.7948922376072,40.7948963239321,40.7949048403774,40.7949090549281,40.7949130991709,40.79493240877,40.7949515242925,40.7949888095511,40.7950247332572,40.7950336356533,40.795044119891,40.7950497697134,40.7950613203545,40.7950644434948,40.7950675654511,40.7950806055523,40.7950996653981,40.7951341718389,40.7951495835963,40.7951624696138,40.7952046193068,40.7952395792921,40.7952895802148,40.7952909500502,40.7952981847181,40.7953628845531,40.7953808532513,40.7954410407666,40.7954492301356,40.795476450644,40.7954810819608,40.7955153066166,40.7955413554798,40.7955778109591,40.7955958740747,40.7955960828837,40.795613368289,40.7956380479194,40.7956481604402,40.7956570488129,40.7956644804868,40.7956702920377,40.7956801982065,40.7956828170702,40.7956843456376,40.7956854527677,40.7956848536338,40.7956842645603,40.7956832719984,40.7956778605428,40.7956769849748,40.7956765963562,40.7956765980832,40.7956766712102,40.7956770716356,40.7956777860716,40.7956787981818,40.795680116527,40.7956816958841,40.7956834996445,40.795685042307,40.7956854298517,40.7956913618401,40.7956979044375,40.7957049238224,40.7957121834917,40.7957289427782,40.7957490999816,40.7957572912853,40.7957820149089,40.7958072504737,40.7958175708626,40.7958268939663,40.7958347240356,40.795843105701,40.795866778087,40.7958950213628,40.7959125045928,40.7959190710148,40.7959214887306,40.7959232954068,40.7959244708857,40.7959248239001,40.7959250242307,40.795925062476,40.7959249470323,40.7959246695025,40.7959242392877,40.7959230723944,40.7959215173628,40.7959144617545,40.7959134107017,40.7959125390484,40.7959059425478,40.7959014697983,40.7959012470055,40.7959011306426,40.7959011324572,40.7959012430458,40.7959014612398,40.795901796382,40.7959027819041,40.7959042176548,40.7959060226898,40.795908115701,40.7959103330855,40.7959179239474,40.795926312793,40.7959353403533,40.7959447430224,40.7959510922755,40.795957862361,40.7959733725335,40.7960218881434,40.7960501059762,40.7960605135799,40.7960699695953,40.796076059112,40.7960825000051,40.7960971794118,40.7961409686457,40.7961785674522,40.7961811992583,40.7961837684011,40.7961885654197,40.7961926898928,40.7961944323696,40.7961959225614,40.7961994022571,40.7962015739794,40.7962027638297,40.7962030861097,40.7961963807478,40.7961954077164,40.7962015344996,40.7962061094235,40.796212695765,40.7962233196144,40.7962324295407,40.7962410319261,40.7962501388919,40.796262769733,40.7962829695014,40.7962971149104,40.7963178246856,40.7963314527096,40.7963435670021,40.7963688002937,40.7963859543328,40.7964130861918,40.796447324875,40.7966589605576,40.7966241157381,40.7965570361419,40.7962344002831,40.7962133347325,40.7960834717906,40.796135491225,40.7961531977153,40.7961670275782,40.7961762084853,40.7961524960761,40.7961524705822,40.7961865730344,40.7962056268936,40.7962247305741,40.7962358887113,40.7962121836578,40.7962128044846,40.7962462549905,40.7962613629018,40.7962863879073,40.7962962238925,40.7962731729633,40.7962737988795,40.7963052778375,40.7963216999809,40.7963454120549,40.7963559077844,40.7963315341766,40.7963341352735,40.7963669241161,40.796382035355,40.7964083757481,40.7964162385763,40.7963931842793,40.7963938114484,40.7964259501288,40.7964417139018,40.7964667351482,40.7964759179134,40.7964522052852,40.7964541460061,40.7964882504251,40.7965033660037,40.7965264131829,40.7965369165588,40.7965118832921,40.7965125122227,40.7965472718786,40.7965574383978,40.7965860918575,40.7965985609888,40.7965709072968,40.7965728448342,40.7966416773831,40.7966679400952,40.7966897143297,40.7968325629782,40.7968306228491,40.7967906270947,40.7967742030716,40.7967300927569,40.7967163253761,40.7967624032192,40.7967611169492,40.7967211199935,40.796707985394,40.7966599304505,40.7966481274406,40.7966935505924,40.7966935760943,40.7966548971664,40.7966371600907,40.7965917426835,40.7965805929718,40.7966253602179,40.7966240790242,40.7965853924174,40.796570943587,40.7965614538987,40.7965235459391,40.7965117473414,40.7965532141586,40.7965545692591,40.7965185130658,40.7965020889506,40.7964540366968,40.7964461848062,40.7964915982962,40.796490971057,40.7964516310196,40.7964358698009,40.7963897904002,40.7963760164304,40.796422091502,40.7964214693413,40.7963827834226,40.7963676772933,40.796318968005,40.7963098005842,40.796355217036,40.796355246301,40.7963132783136,40.7963007971953,40.7962547260251,40.7962422606771,40.7963949704071,40.7964034834863,40.7963317348935,40.796331709461,40.796402518474,40.7964215622384,40.7964959471146,40.7965051215259,40.7964300770606,40.796430709412,40.7965067691,40.7965199062475,40.796563449367,40.7965936404006,40.7966047799653,40.7965630860071,40.7965297392029,40.796533650264,40.796562227108,40.7966044654833,40.796622201283,40.7966939608685,40.7967057594933,40.7966340024399,40.7966339756815,40.7967093805579,40.7967244854143,40.7967942780775,40.7968041097503,40.7967356306351,40.7967356076837,40.796811014427,40.7968274321735,40.7969005057141,40.7969123106824,40.7968418656942,40.7968405181879,40.7968713388268,40.7968351206682,40.7968292224952,40.7967108964971,40.7964625076552,40.796508668745,40.7965219404778,40.7965289123122,40.7965293919253,40.796523366087,40.7965110010237,40.7964926378338,40.7964755754441,40.7965312143566,40.7965813653352,40.796625641075,40.7966636996436,40.7966952471217,40.7967200398739,40.7967378864299,40.7967486489636,40.7967063535991,40.7967061128356,40.7967078010353,40.7967097391838,40.7967148710052,40.7967171320665,40.796720433759,40.7967262621377,40.7967319375176,40.7967387301751,40.7967430963892,40.7967486749712,40.796758574145,40.7967809113614,40.7967972835165,40.79680220172,40.7968103651541,40.7968229533289,40.796837762752,40.7968471358761,40.7968555492327,40.7968664899154,40.7968793008641,40.7968923965129,40.7969020650773,40.7969150808727,40.7969277142277,40.796930043239,40.7969352806251,40.7969381401178,40.7969395539711,40.7969403432487,40.7969437828126,40.7969446089193,40.7969408746379,40.7969339820252,40.7969223872093,40.7969090967664,40.7968994984793,40.796898186813,40.796899817176,40.7969049018308,40.7969110689058,40.7969203686349,40.7969298900002,40.7969400477883,40.7969493485413,40.7969604494146,40.7969747446412,40.7969878147786,40.7970034968981,40.7970185714405,40.7970380361664,40.7970585789541,40.7970814394785,40.7970932312075,40.7971050048499,40.7971127612935,40.7971150022303,40.7971282776896,40.7971408202955,40.7971526532934,40.7971655762132,40.7971751874636,40.7971868628477,40.7972013042058,40.7972127811782,40.7972260945164,40.7972469936374,40.797258110602,40.79727052779,40.7972863336283,40.7973014026144,40.7973086724716,40.7973154076509,40.7973271566352,40.7973405681258,40.7973554637375,40.7973699780709,40.7973836859279,40.7973992846971,40.7974163443515,40.7974345542502,40.7974520054338,40.7974694741584,40.7974861549687,40.7974971136947,40.7975089816943,40.7975211980775,40.797539121631,40.7975557523341,40.7975716159974,40.7975852250426,40.7975981134245,40.7976095256729,40.7976222013163,40.7976320914989,40.7976452450015,40.7976637375865,40.7976738187706,40.7976849401704,40.7976983483731,40.7977007812227,40.7977042020472,40.7977144609935,40.7977184569144,40.7977381464797,40.7977495288125,40.7977548747524,40.7977594081695,40.7977637075605,40.7977642173908,40.7977678686176,40.7977688446448,40.7977732772519,40.7977780180345,40.7977824406557,40.7977869191786,40.7977917723791,40.797796245453,40.7977980469567,40.7977974665872,40.7977947490138,40.7977910647206,40.7977872270874,40.7977806891301,40.7977505285184,40.7977144568403,40.7976762876002,40.7976391426423,40.7976103143955,40.7975352801308,40.797518675991,40.7974839880151,40.7974521361705,40.7974384718839,40.797414212542,40.7973958201996,40.7973758307214,40.7973640466572,40.7973311146629,40.7973182106637,40.7973017170903,40.7972895023732,40.7972714344658,40.7972683700645,40.7972662503716,40.7972642555479,40.7972642763115,40.7972647823826,40.7972664803288,40.7972687856255,40.797272307581,40.7972828226062,40.7972924686648,40.7972989221231,40.7973025553039,40.797307197305,40.7973132285219,40.797316349296,40.7973107494062,40.797308950204,40.7973092653798,40.7972975567979,40.7972889210997,40.7972902969168,40.7972985493968,40.7973115011964,40.7973230461838,40.7973389651337,40.7973414467692,40.7973524681486,40.797359039516,40.7973692443067,40.7973757765682,40.7973848072342,40.7973971029044,40.7974062120218,40.7974174970059,40.7974291149608,40.7974407229916,40.7974514575522,40.7974609862996,40.7974710559181,40.7974832785052,40.7974945010728,40.797519008811,40.7975324577201,40.7975451361903,40.7975563151075,40.797566144378,40.797575291342,40.7975838881537,40.7975908674732,40.7975985677353,40.7976085312147,40.7976200334416,40.7976296038452,40.7976394090763,40.7976506613902,40.7976593679631,40.7976674656881,40.7976747109491,40.7976809908369,40.797693083013,40.7977054959152,40.7977181840314,40.7977249475287,40.7977314759807,40.7977385450935,40.7977456298744,40.7977537499731,40.7977614680533,40.7977768084465,40.7977841840534,40.7977918230004,40.7977991986159,40.7978015035636,40.7978060235871,40.7978117920683,40.7978208860318,40.7978294319902,40.7978387136516,40.7978493767512,40.7978555850966,40.7978623589635,40.7978688768663,40.797876388077,40.7978846508149,40.7978936397784,40.7979027099477,40.7979116765168,40.797920052207,40.7979277295078,40.7979345214076,40.7979407637219,40.7979440876544,40.7979501358625,40.7979615950126,40.7979739264029,40.7979933521978,40.7980096282737,40.7980582804202,40.7980746799906,40.798088171366,40.7981014654238,40.7981139811045,40.7981304363929,40.7981435952198,40.7981560028611,40.7981712917511,40.7982481275856,40.7982575890033,40.7982257574227,40.7982273640816,40.7986952373906,40.7987059694831,40.7982323826432,40.7982360698484,40.7982377578373,40.7982292725163,40.7982283529336,40.7982136873923,40.7982029177453,40.7981903095152,40.7981806673343,40.7981693485306,40.7981573885986,40.7981541351047,40.7981578456399,40.7981641307469,40.7981692943562,40.7981750319645,40.7981819530992,40.7981917112237,40.7981979482414,40.7982036905386,40.7982098733859,40.7982212486548,40.7982269929521,40.798232021016,40.798241711299,40.7982516316533,40.7982643900624,40.7982806388109,40.7982969949873,40.7983037327077,40.7983138420314,40.7983248291855,40.798338015134,40.7983490043875,40.7983629634207,40.7983769164523,40.7983879500603,40.7983899408036,40.7984016488759,40.7984107372477,40.7984232160979,40.7984381740251,40.7984388188324,40.798439200074,40.7984348284849,40.7984236389726,40.7984122841613,40.7984042252438,40.7984020386938,40.7984065144079,40.7988808286788,40.7988992413604,40.798417814296,40.7984333532035,40.798441832212,40.7984468201208,40.7984508603382,40.7984475165708,40.7984411542024,40.7984379464979,40.7984394645672,40.7984448200275,40.7984525420747,40.7984560648775,40.7984695361684,40.7984784968641,40.798485975987,40.7985002810908,40.7985112740179,40.7985193946269,40.7985311661874,40.7985447352149,40.7985608956554,40.7985695488316,40.7985773026229,40.7985835187838,40.7985933184414,40.7986024693497,40.7986131037729,40.7986238395195,40.7986364482758,40.7986515080311,40.7986672761986,40.7986726644238,40.7986802356531,40.7986884543933,40.798691018065,40.7986888647119,40.7986832983629,40.7989628661206,40.7989751635981,40.79866039655,40.7986518078731,40.7986462983818,40.798642289724,40.7986489233433,40.7986601164022,40.7986652596218,40.7986763214205,40.7986935895444,40.7987074707178,40.79872201739,40.7987384478854,40.7987481483266,40.798757848471,40.7987679092016,40.7987790663779,40.7987898629835,40.7987995622555,40.7988089534455,40.7988168132536,40.7988241247944,40.7988315693956,40.7988390419929,40.7988470360912,40.798854178413,40.7988658426489,40.7988786211934,40.7988931893145,40.7989018424758,40.7989115136531,40.7989201176003,40.7989279834924,40.7989437089598,40.798957277373,40.7993397832258,40.7993528298176,40.7989877356893,40.7990044058192,40.7990111678741,40.7990283857667,40.7990463039587,40.7990549069012,40.7990631223757,40.799072085143,40.7990889137537,40.7994861352365,40.7994950258741,40.7991128915737,40.7991638792443,40.7992160495453,40.7992236739993,40.7993017640174,40.7993546021811,40.7994083538574,40.7994792423947,40.7995129099436,40.7995439153402,40.7996376134367,40.7997283629062,40.7997509848059,40.799783285238,40.7998554049575,40.7999250172011,40.7999919876928,40.8000615245527,40.8001345654076,40.8002109748732,40.8002906113208,40.8003442821941,40.8003992236636,40.8004408058262,40.8004781094891,40.800510721606,40.8005382810775,40.8005604827495,40.800577080792,40.8005878914219,40.8005907757621,40.8005928326834,40.8005947071777,40.8005984680678,40.8006023383494,40.8006065609584,40.8006107535474,40.8006149464523,40.8006190509257,40.8006234691573,40.8006278644212,40.8010060238682,40.801011467819,40.8006395002925,40.8006452054087,40.8006536290276,40.8006623320353,40.8006708073441,40.80067721151,40.8006828474995,40.8006889639165,40.8006972562558,40.8007069688562,40.8007139524393,40.8007210779971,40.8007270682377,40.8007333310458,40.8007394764362,40.800744900629,40.8007511430968,40.8007612549849,40.8007711472133,40.8007831382753,40.8007984729049,40.8008055595887,40.8008033925649,40.8007998984993,40.8007968385474,40.8007909894653,40.8007858527641,40.8007950148335,40.8007982387664,40.8007956224153,40.8007951310793,40.8008000317917,40.8008018386559,40.800801504342,40.8007966195717,40.8007881075361,40.8007792073962,40.8007701257147,40.8007603533125,40.800752061192,40.8007436590975,40.8007363905628,40.8007311920203,40.8007280970468,40.800727605141,40.8007280552494,40.8007290212323,40.8007300377512,40.8007319254089,40.8007330923416,40.8007329810196,40.800729593135,40.8007262906626,40.8007226344399,40.8007187489321,40.8007138670181,40.8007074350547,40.8006936676359,40.8006815168958,40.8006760278205,40.8006687752638,40.8006650061512,40.8006619287978,40.8006577112871,40.8006528560771,40.8006465214803,40.8006394281744,40.800630899893,40.8006263803061,40.8006221128572,40.8006165018275,40.8006118258604,40.8006075906747,40.8005997395565,40.8005939109059,40.8005883589474,40.8005828320555,40.8005745415417,40.8005662663018,40.8005577841339,40.8005494323204,40.8005367296526,40.8005148960784,40.8004988376908,40.800489707842,40.8004801617524,40.8004699038679,40.8004596448109,40.8004493593939,40.8004372343164,40.8004251108561,40.8004111466899,40.8003982448718,40.8003857601495,40.8003732777502,40.8003615152604,40.8003497713835,40.8003399017859,40.8003303942833,40.800321616572,40.8003124598074,40.800302451271,40.8002919372752,40.8002820634058,40.8002745748032,40.8002668422259,40.800258683778,40.8002486683564,40.8002270103581,40.8002150428586,40.8002047517953,40.8001936713773,40.8001841526102,40.800176401245,40.8001683703009,40.8001569867948,40.8001441178272,40.8001297659028,40.8001168996411,40.8001066148654,40.8000982246856,40.8000926528636,40.8000806072077,40.800067155885,40.8000524367738,40.8000368685273,40.8000230868408,40.8000080428134,40.7999996515379,40.7999915118318,40.799983761471,40.7999683557817,40.7999596916722,40.7999503329289,40.7999310028872,40.7999209580858,40.7999121848862,40.7999030747843,40.799894650829,40.7998866967115,40.7998794117087,40.7998712070501,40.7998559694553,40.799847438318,40.7998394853649,40.7998311704803,40.7998225032653,40.7998140546588,40.7998046774972,40.7997945868954,40.7997829712809,40.7997742503374,40.7997651953252,40.7997563401005,40.7997471784729,40.7997376548569,40.7997283303476,40.7997177059865,40.7997071185531,40.7996977934796,40.7996806760747,40.7996727219218,40.799664771277,40.7996568997711,40.7996476041317,40.7996385515699,40.7996310444096,40.799617346212,40.7996020263495,40.7995879442435,40.7995799390261,40.7995714113972,40.7995612850707,40.7995521801775,40.7995437954032,40.7995354020072,40.7995270710366,40.7995188684165,40.7995093585208,40.7995017044537,40.7994918025539,40.7994822898395,40.7994706993734,40.7994543657292,40.7994442667796,40.7994343126576,40.7994242137251,40.7994079860643,40.799393627689,40.7993791906853,40.7993664181398,40.7993549154324,40.7993468784477,40.7993360668269,40.7993250367297,40.7993117036684,40.799299019785,40.7992888868213,40.7992778733734,40.7992663903801,40.7992608222578,40.7992545159733,40.7992486247569,40.799242263943,40.7992367518628,40.7992275773037,40.7992194544773,40.7992131984622,40.7992072801555,40.7991059404918,40.7994278391008,40.7994130140791,40.7991004035915,40.7990674021695,40.7993585560164,40.7993459788652,40.7990623655235,40.7990103275249,40.7987854284541,40.7987667333926,40.7987356969783,40.7986767044841,40.7986080717983,40.7990361582586,40.7990231625573,40.7985950092196,40.7985715587525,40.7985612205533,40.7985503294508,40.7985399317356,40.798532968333,40.7985253620187,40.7985186211483,40.7985127836166,40.798505257033,40.7984983725066,40.798491844034,40.7984861093734,40.7984802377157,40.7984748519642,40.7984689234913,40.7984622465737,40.7984571527694,40.7984519416533,40.7984453762167,40.7984393714312,40.798434954663,40.7984296097733,40.7984217055747,40.7984117947458,40.7984018513529,40.7983977204682,40.7983915706072,40.7983849054077,40.7983769434637,40.7983707166871,40.798364302718,40.7983583560219,40.798351959329,40.798345487659,40.798338933104,40.798332757652,40.7983276304757,40.7983221179296,40.7983143024871,40.7983076305919,40.7983005787652,40.7982927474883,40.7982859115126,40.7982787805198,40.7982711290139,40.79826553046,40.7982590748231,40.7982530967106,40.7982472525893,40.7982400017554,40.7982352913857,40.7982271171443,40.7982191041442,40.7982108066427,40.7982050432297,40.7981986755095,40.7981922017751,40.7981848111902,40.7981765461832,40.7981674766737,40.7981580194533,40.7981461010018,40.7981389098609,40.7981322795142,40.7981249270611,40.798118069883,40.7981098700907,40.7981017675952,40.7980945293765,40.7980874704829,40.7980819919458,40.7980759824299,40.7980669047112,40.7980588921757,40.7980537696434,40.7980483607379,40.7980420767964,40.7980343632471,40.7980268120528,40.7980185623952,40.798013402153,40.7980073921053,40.7980023151905,40.7979973761413,40.7979916162768,40.797982887916,40.797979855241,40.797973837232,40.7979649553493,40.7979590977686,40.7979540881288,40.7979428119441,40.797931893573,40.7979246588403,40.7979168066763,40.7979102519867,40.7979047796425,40.7979002226224,40.79789487116,40.7978842245459,40.7978802024546,40.7978729868639,40.7978661256794,40.7978593736074,40.7978525142803,40.797843535448,40.7978340181183,40.7978262789477,40.7978233602821,40.7978183816757,40.7978121271225,40.7978066662534,40.7978006877278,40.7977960529704,40.7977907509056,40.797787043479,40.7977850039486,40.7977839961477,40.797780557999,40.7977768207157,40.7977710810493,40.7977659509128,40.7977604444714,40.7977502467808,40.7977389267638,40.7977271991271,40.79771963159,40.7977119995097,40.797706190612,40.7976955615719,40.7976855845057,40.7976765591237,40.7976666278054,40.7976593011025,40.7976527436033,40.7976455867858,40.7976373742829,40.7976293849536,40.7976224967105,40.7976145384431,40.7976063162381,40.797597283421,40.7975895537179,40.7975832490384,40.7975754465399,40.7975711762729,40.7975664008293,40.7975613408038,40.7975576062452,40.7975531708164,40.797545787911,40.7975377815026,40.797529497975,40.7975180326865,40.7975064136749,40.797493861942,40.7974815020511,40.7974686064727,40.7974569973053,40.7974439304964,40.7974295158609,40.7974170111906,40.7974028265912,40.7973873299418,40.7973716342298,40.7973593235648,40.7973473921537,40.797327614679,40.7973169691255,40.7973074585474,40.7972858161778,40.797273667384,40.7972604202984,40.7972471644628,40.7972361676702,40.7972266447935,40.7972090984582,40.7971878400541,40.7971768168578,40.7971581731745,40.7971476368592,40.7971432451388,40.7971021083784,40.7970794161677,40.7976930204106,40.7976723226576,40.7973459392483,40.7970472179298,40.7970583803778,40.7970745595228,40.7971057564411,40.7971963586028,40.7972118211008,40.797177403971,40.7972920274618,40.7972791125125,40.7971687987448,40.7971677030094,40.7971684350746,40.7971690646031,40.7971706591858,40.7971725127152,40.79717543204,40.7971769984703,40.7971771424642,40.7972033908947,40.797279056443,40.7972872818129,40.7972819609745,40.7972931750437,40.7973066157503,40.7973207662203,40.7973323322138,40.7973453849535,40.7973547634205,40.7973654912641,40.797378193466,40.7973873299953,40.7973982780555,40.7974152643517,40.7974236607341,40.7974371274005,40.7974541137333,40.7974683275227,40.797483639194,40.7974978250464,40.7975123871874,40.7975258262614,40.7975415259734,40.797554039686,40.7975663843231,40.7975775837258,40.7975900976285,40.7976056261287,40.7976162749931,40.7976299119606,40.7976554771306,40.7976677988251,40.7976801397893,40.7976920749859,40.7977040376934,40.797715620532,40.7977283171322,40.7977413746001,40.7977525605183,40.7977650656939,40.7977775719712,40.7977880185479,40.7978029380739,40.7978133948986,40.7978205482768,40.7978251550331,40.7978406234021,40.7978499547934,40.7978656404162,40.7978813064079,40.7978936430504,40.7979080175413,40.7979184744063,40.7979311451997,40.7979468318825,40.797962331956,40.7979742947028,40.797987352938,40.7980002204882,40.7980114320068,40.7980235519875,40.7980347443117,40.7980470649621,40.7980591810122,40.7980748714815,40.7980824824045,40.798087011153,40.7980901118812,40.7980930234594,40.7980967348192,40.7981007357147,40.7981053413433,40.7981119257248,40.7981168097479,40.7981218322565,40.7981248219667,40.7981248954202,40.7981258041354,40.7981274156215,40.7981269468017,40.7981258279278,40.7981227595853,40.7981184855077,40.7981113433872,40.7981057193583,40.7981008687978,40.7980987481879,40.7980996762003,40.798026331252,40.7979454476399,40.7978638983258,40.7977820403465,40.7977002320891,40.7976188317214,40.7975381956243,40.7974586768314,40.7973724068804,40.797344192647,40.7973341901425,40.7973331570711,40.7973302451462,40.7973266225056,40.797323744507,40.7973215795683,40.7973181706788,40.7973150986629,40.797312219984,40.7973094753794,40.7973068410433,40.7973038712511,40.7973011456755,40.7972981188339,40.7972951598267,40.7972924915433,40.7972892339156,40.7972864435056,40.7972815710337,40.7972798151644,40.7972780606081,40.7972759486275,40.7972721003619,40.7972680528137,40.7972647751208,40.7972621594877,40.7972605783121,40.7972580963427,40.7972562050165,40.7972536479902,40.797251557777,40.7972499640184,40.7972485412257,40.7972466940818,40.7972448039657,40.7972426075398,40.797240620263,40.7972378424851,40.7972352557187,40.7972343319384,40.7972327225861,40.7972316102719,40.7972289624302,40.7972268756318,40.7972253933128,40.7972255802616,40.7972224506302,40.7972209615776,40.7972207704085,40.7972176973133,40.7972139016835,40.7972111044156,40.7972080022391,40.7972052249987,40.7972032484881,40.7971984724731,40.7971952809011,40.7971914003009,40.7971879402701,40.797184730597,40.7971809903117,40.7971761326917,40.7971737813269,40.7971707595103,40.7971686683255,40.7971670474744,40.7971638353411,40.7971584466517,40.7971522087036,40.7971468077086,40.7971386841024,40.7971302794597,40.7971238850349,40.7971192496355,40.7971160931783,40.7971109953853,40.7971064395695,40.7971027810501,40.7971006224317,40.797096441826,40.7970897494476,40.7970845416965,40.7970798447451,40.7970763090666,40.7970712872664,40.7970690433203,40.7970678064488,40.7970684148983,40.7970650590775,40.7970612682059,40.7970576464357,40.79705387488,40.7970513225824,40.797047938899,40.7970451140045,40.7970404220194,40.7970368867844,40.7970335948259,40.7970295621412,40.7970267089794,40.7970257275777,40.7970247360991,40.7970240219607,40.7970227342076,40.7970174230656,40.7970158359214,40.7970146414568,40.7970134750077,40.7970097865916,40.7970059412463,40.7970027495242,40.7969995059703,40.7969958813737,40.7969910160911,40.7969860579738,40.7969820943029,40.796979100742,40.7969762204145,40.7969705562727,40.7969660521814,40.7969619337996,40.7969588174569,40.7969526677557,40.7969449580545,40.7969382315679,40.7969315066837,40.7969238203928,40.7969158020536,40.796911365587,40.7969041425369,40.7968965665563,40.7968911181958,40.7968853815097,40.7968851047543,40.7968791509307,40.7968757136285,40.796872070443,40.7968670192847,40.796860289375,40.796855307966,40.7968488275665,40.7968416685881,40.7968345799874,40.7968291234833,40.7968224203381,40.7968169900355,40.7968127077375,40.7968072709074,40.7968034254238,40.7967988944574,40.7967959631543,40.7967960547826,40.796801659261,40.7968017838306,40.7968015932843,40.7968009895907,40.7967971813157,40.7967903500435,40.7967816164269,40.7967778889816,40.7967730557263,40.7967686913651,40.7967645178022,40.7967633984888,40.7967619353807,40.7967606243596,40.7967630332807,40.7967663834049,40.7967683367155,40.7967700926918,40.7967675503414,40.7967646112036,40.7967624039672,40.7967607233591,40.796759399718,40.7967577346576,40.7967570149201,40.796753805362,40.7967489991207,40.7967442027052,40.7967389348241,40.7967321744048,40.7967271720763,40.7967239560059,40.7967220006649,40.796720164529,40.7967198945803,40.7967203930831,40.796719402673,40.7967176497412,40.7967156242944,40.7967115507771,40.7967304414271,40.7966863375013,40.7966722152909,40.7966721782571,40.7966081706484,40.7966065925506,40.7966022495364,40.7965996675029,40.7965994513074,40.7966084371768,40.7965474877634,40.7964078541585,40.7964063034286,40.7963936059403,40.7965603362703,40.7965592933469,40.79662616655,40.7966261824799,40.7968226933324,40.7968174775829,40.7966240591093,40.7966240727667,40.7965582276634,40.7965551261951,40.7963927404361,40.7963952780836,40.796502780434,40.7965053955334,40.796505062252,40.7965000957865,40.7964900125098,40.7964748895362,40.7964633317653,40.7964607607534,40.7964341729039,40.7964129294995,40.7963725792134,40.7963266902754,40.7963044476633,40.7962869972236,40.7962753393956,40.7962304154546,40.7961827506592,40.7961708215134,40.7961685662046,40.7961681342767,40.7962283125851,40.7962449920537,40.7963397894696,40.7963355221897,40.7965060773532,40.7965074405016,40.7963368828385,40.7963373815183,40.7962519395632,40.7962262179512,40.7962251795308,40.7961639282888,40.7961596346238,40.7961592388551,40.7961607135854,40.7961636711367,40.7961636873992,40.7961651713524,40.7961680919545,40.7961707337032,40.7961739104667,40.7961794507995,40.79618441449,40.7961875764252,40.7961888666376,40.7961888903629,40.7961880039505,40.7961856541726,40.7961836427972,40.7961801729652,40.7961758848935,40.796170935987,40.7961668621053,40.7961637214574,40.7961613731479,40.7961602344117,40.7961607487963,40.7961629044818,40.7961640915676,40.7961684349114,40.7961758269478,40.7961860846087,40.7961882224755,40.7961862642878,40.796178253485,40.7961719262864,40.7961674691641,40.796362981806,40.7963650031178,40.796352655841,40.7961591959832,40.7961426875067,40.7961354578634,40.7961385181255,40.7961412135511,40.7961463423597,40.79615086465,40.7961564086317,40.7961662870947,40.7961757457245,40.7961819505285,40.7961884540596,40.7961949640347,40.7962025634672,40.7962076180378,40.7962110759925,40.7962143030893,40.7962140909928,40.7962327822798,40.7962307007495,40.7964529547914,40.7964920579981,40.7966412613285,40.7966350213082,40.7964920005073,40.7964498163874,40.7962128761601,40.7962126153062,40.796214252632,40.7962155698796,40.7962170510195,40.7962187130444,40.7962209415963,40.7962257054779,40.7962290087769,40.7965290191302,40.7965326701012,40.7966808212981,40.7966697833551,40.7965294879517,40.7965247451974,40.7962342311778,40.7962354022881,40.7962399269662,40.7962446299747,40.796248431014,40.7962516780498,40.7962562598739,40.7962584071574,40.7962621460838,40.7962673589353,40.7965283754295,40.7965276094001,40.796649389018,40.7966477801733,40.7965283991202,40.7965269179456,40.7962782559197,40.7962842713516,40.7962893422857,40.7962959851377,40.7963022932421,40.7963090427534,40.7963143126868,40.7963191275597,40.7963258546493,40.7965093401043,40.7965099247624,40.7965352572227,40.7965346596787,40.7965096856225,40.7965101481805,40.796335012841,40.7963382278933,40.7963438563831,40.7963498182124,40.7963555337943,40.7963613285861,40.7963713011477,40.796378984956,40.796385948206,40.7963924177684,40.7963983253042,40.7964060855076,40.7966051367524,40.7966072114464,40.7966323120016,40.7966309987821,40.7966040682539,40.7966040821009,40.7964208568206,40.7964291483468,40.7964337951271,40.7964395891081,40.7964451926294,40.7964518379276,40.7964579405263,40.7964645293865,40.7964697488708,40.7964711119638,40.796737515499,40.7967373140632,40.796911542686,40.7969149397281,40.7967365212011,40.7967368905426,40.7964744143103,40.796705292482,40.7967063541105,40.7969021774137,40.7969046333183,40.7970784671589,40.7970766236432,40.7969012338756,40.796706491506,40.7967087256389,40.7966116403778,40.7964095908428,40.7964049295559,40.7964002929999,40.7963967831422,40.79639253512,40.7963882857205,40.7963833878336,40.7963802916546,40.7963752475742,40.7963708283955,40.7963650277281,40.7963638215249,40.7963653936752,40.796368139504,40.7963668129547,40.7963635228903,40.7963595943296,40.7963547014824,40.7963482209296,40.796343561628,40.7963380970557,40.7963398974747,40.7963482835898,40.7963622784158,40.7963660906753,40.7963550339725,40.7963417102315,40.7963306698488,40.7963167930469,40.79630237919,40.7962954431362,40.7962938978079,40.7962921801655,40.7962898388965,40.7962871265878,40.7962838003772,40.7962797055215,40.7962756376967,40.7962727525462,40.796270452527,40.7962681133731,40.7962666276839,40.7962664826112,40.7962664028898,40.7962651381769,40.7962639495954,40.7962632602308,40.7962627311914,40.7962622088529,40.7962619593826,40.7962620389729,40.796262713688,40.7962626316676,40.7962628429866,40.7962634390819,40.7962644259028,40.7962656521953,40.7962666428712,40.796268155861,40.7962702390886,40.7962722869606,40.79627349854,40.7962754236752,40.7962796098331,40.7962824011225,40.7962855524191,40.796288098443,40.7962914980666,40.7962957328528,40.7962986684037,40.7963016303821,40.7963041855334,40.7963085510259,40.7963099687136,40.7963129016997,40.7963161418526,40.7964198068922,40.7964208571258,40.796477448021,40.7964764001181,40.796512406103,40.7965072178183,40.7963212959181,40.796323004732,40.7963263557312,40.7963301327204,40.7963322835837,40.7963339797895,40.7963340621586,40.7963335484251,40.7963353203934,40.7963372950784,40.7963397388684,40.7963434320338,40.7963462610481,40.7963497729983,40.7963523070548,40.7963560832667,40.7963596834964,40.7963634807685,40.7963667998894,40.7963711874205,40.7963733937695,40.796376851705,40.7963813000964,40.7963858310407,40.7963909373886,40.7963955467325,40.7964003998211,40.7964054823429,40.7964109222032,40.7964178892188,40.7964227843886,40.7964254211417,40.7964334442862,40.7964416861213,40.7964503560102,40.7964575775773,40.7964636753118,40.7964703670353,40.7964768779968,40.7964845205613,40.7964895509258,40.7964939676837,40.7964979986523,40.7965022192874,40.7965045807194,40.7965048407753,40.7965145435849,40.7965207258579,40.7965223745896,40.7965129584227,40.7965007839105,40.7964872638482,40.7964762245195,40.7964631267717,40.7964504191273,40.7964384526314,40.7964231043178,40.7964118788689,40.7964010044073,40.7963867734328,40.7963781424224,40.7963673840303,40.7963597631749,40.796351333319,40.7963434800101,40.7963378941425,40.7963325359084,40.7963290748715,40.7963271249859,40.7963278063124,40.7963302159738,40.7963330152807,40.7963365932914,40.7963409218599,40.7963435605256,40.7963459190695,40.79634811638,40.7963517466806,40.7963538686646,40.7963603533132,40.7963715489339,40.7963736006962,40.7963896511829,40.7964008700901,40.7964152559918,40.7964257006906,40.7964267623605,40.7964248252541,40.7964165535674,40.7964162741468,40.7964153457296,40.7964016732543,40.7963861322031,40.7963846435414,40.7963771417879,40.7963658597987,40.7963577962282,40.7963465556388,40.7963364106299,40.7963232723267,40.7963107124945,40.7963018899829,40.7962936543119,40.7962878147661,40.7962822117725,40.7962777670187,40.7962741914906,40.7962701834746,40.7962661435714,40.7962631553958,40.7963369203832,40.7963235490558,40.796253571428,40.796254973006,40.7962570597552,40.7962578038468,40.7962601492666,40.7962649205,40.7962685085958,40.7962700539455,40.7964488638335,40.7964468203378,40.7964359296236,40.796434033133,40.7963441243203,40.7962669136969,40.7962610329355,40.7962591608981,40.7962571581783,40.7962534371503,40.7962546776903,40.7962532694679,40.7962496183872,40.7962449828777,40.7962380676663,40.7962310384019,40.7962216493849,40.7962132955252,40.7962073927336,40.7962031959187,40.796196891229,40.7961933486547,40.7961891368456,40.7961854891324,40.7961817909443,40.796178936835,40.7961759601466,40.7961735136364,40.7961720005294,40.7961708939673,40.7961710008079,40.7961722511498,40.7961731301988,40.7961745027065,40.7961792583003,40.7961904312517,40.7962057376544,40.7962152642335,40.796230413585,40.7962442788059,40.7962553270823,40.7962682583554,40.7962824891596,40.7962963670364,40.7963105852366,40.7963223588603,40.7963253240965,40.7963297829874,40.7963354703582,40.7963390072238,40.7963374780061,40.7963322206057,40.7963243717786,40.7963181451459,40.7963142194604,40.7963106101781,40.7962969252013,40.7962854999088,40.7962729501573,40.7962611277644,40.7962505157407,40.796239865652,40.7962313610771,40.7962235455095,40.796217369609,40.7962096837988,40.7962025956496,40.7961951545184,40.7961890439109,40.7961823477818,40.7961733235033,40.7961641171616,40.7961497016612,40.7961351149533,40.796123112531,40.7961133564357,40.7961029854844,40.7960944850279,40.7960881358973,40.7960831736726,40.7960785631141,40.7960738430274,40.7960682105226,40.796064146439,40.7960611826399,40.7960573851098,40.7960534258819,40.7960479220904,40.7960464766463,40.7960445342972,40.7960424909856,40.796040097048,40.7960386753901,40.796036192138,40.7960347678135,40.7960328762051,40.7960306164698,40.7960275642044,40.7960251719542,40.7960233654976,40.7960198775663,40.7960170248329,40.7960122397572,40.7960092329082,40.7960026583482,40.7959973005858,40.7959931036147,40.7959893373598,40.7959845067039,40.7959797495825,40.7959750547483,40.7959714201793,40.7959695881544,40.7959646494881,40.7959591145114,40.7959522484582,40.795944503565,40.7959397687729,40.7959357218701,40.7959316428931,40.7959280523095,40.795922126993,40.7959154342236,40.7959075883597,40.7959012295417,40.7958910273509,40.7958800613974,40.795870852949,40.7958584456141,40.7958477197721,40.795836942493,40.7958286164766,40.795818575759,40.7958082104696,40.7957954778989,40.7957845017968,40.7957750967111,40.7957643373773,40.7957509097167,40.7957421891375,40.7957312379119,40.7957211625019,40.795712138128,40.7957039488554,40.7956989656414,40.7956930605255,40.7956862815263,40.7956791455982,40.795670470411,40.7956627305819,40.7956523111842,40.7956448450303,40.7956381803165,40.7956332133643,40.7956271011699,40.7956209231436,40.7956159562325,40.7956116020406,40.7956058885654,40.7956014891142,40.7955944352845,40.7955906128951,40.79558599274,40.7955832730838,40.7955801430559,40.7955776235129,40.7955747720822,40.7955690245665,40.7955652080416,40.7955615329439,40.7955592214193,40.7959371119986,40.7959484990821,40.7959938223818,40.7959672021548,40.7959237776229,40.7959294886397,40.795552012644,40.7955458537406,40.7955406312234,40.7955359094817,40.7955319549381,40.7955280890833,40.7955245121041,40.7955203411205,40.795517490145,40.7955131055824,40.7955073608248,40.7955014157698,40.7954951733269,40.7954906778326,40.7954852048392,40.7954808390031,40.7954761957883,40.7954734842671,40.7954694467343,40.7954657621504,40.7954632717854,40.7954598618552,40.7954574140837,40.795454581495,40.7954521916141,40.7954496310864,40.7954478756651,40.7954463944176,40.795445104445,40.7954443519921,40.7954426385411,40.7954413505994,40.7954374488536,40.7954369874482,40.7954392357091,40.7954492237027,40.7954528798025,40.7954475328683,40.7954380849141,40.7954270332918,40.7954146134706,40.7954101073344,40.7954017228197,40.7953897913232,40.7953766247628,40.795361696578,40.7953546913302,40.7953525839545,40.7953424769863,40.7953375108696,40.7953322646534,40.7953260873934,40.7953216919471,40.7953179654346,40.7953135454942,40.7953086896234,40.7953037184246,40.7953003711338,40.7952982369141,40.7952971340159,40.79529572619,40.7952948297269,40.7952920701367,40.7952899497651,40.7952889556217,40.7952858659017,40.7952808026263,40.7952743928774,40.7952678121403,40.7952619352008,40.7952541292207,40.7952485601612,40.7952428763797,40.7952357801117,40.7952329369245,40.7952225734819,40.7952089429181,40.7955947934966,40.7956061757654,40.7956533850828,40.7956457794413,40.7956381825837,40.7956267952361,40.7955814673312,40.7955852922816,40.7951976254493,40.7951873455096,40.7951810053223,40.7951751619455,40.7951697299543,40.7951623143456,40.7951550670143,40.7951488925356,40.7951426922328,40.7951373746793,40.7951322159191,40.7951259255581,40.7951180252777,40.7951142949961,40.7951095440073,40.7951049256547,40.7951009108913,40.7950961231001,40.7950914557574,40.7950886584013,40.7950850889454,40.7950824010195,40.795078619599,40.7950738976935,40.7950674579899,40.7950627144901,40.7950585479847,40.7950534900998,40.795047275158,40.7950417572431,40.7950373024561,40.7950324139857,40.7950295903234,40.7950260967419,40.7950242183252,40.7950029105118,40.7949875912879,40.7949783008275,40.7949750634945,40.7949778877787,40.7949820905005,40.7949922958551,40.7950082728559,40.7950374252161,40.7950629600455,40.7950647826642,40.795065996351,40.7950665693479,40.7950664866619,40.7950657504564,40.7950643799952,40.7950624111385,40.7950598954042,40.7950568986199,40.7950534992006,40.795049786097,40.7950458564675,40.7950051899456,40.7949763586193,40.7949480169059,40.794924382359,40.7949059758189,40.794893078928,40.7948858890237,40.7948845161203,40.794888981225,40.794902562165,40.7949143431989,40.7949239921826,40.7949312370814,40.7949358736388,40.7949377711359,40.7948850531692,40.7948309930432,40.794831483782,40.794830839037,40.794829076072,40.7948262420925,40.7948224129815,40.7948176912675,40.7948122033798,40.7948060962627,40.794799533441,40.7947926906413,40.7947896272578,40.7947866268725,40.794783776579,40.7947811591141,40.7947788504565,40.7947769176205,40.7947754167115,40.7947743912972,40.7947738711429,40.7947738713472,40.7947743919042,40.7947754177034,40.7947769189686,40.7947788521217,40.7947811610481,40.7947825057477,40.7947867629092,40.7947938472926,40.7948036170498,40.7947959368157,40.7947872240882,40.7947776749713,40.7947675043945,40.7947569412747,40.7947462233637,40.7947355918975,40.7946706187855,40.7946085240904,40.7945499337365,40.7945021456675,40.794451858602,40.7943995356913,40.7943456588356,40.7942907242464,40.7942352378753,40.794179710755,40.7941429389051,40.794104386994,40.7940649897099,40.7940257022351,40.7939874770882,40.7939512410301,40.7939178725952,40.7939076841751,40.7938986673315,40.793888221293,40.7938775308355,40.7938673271022,40.793855065397,40.7938420850134,40.7938301472307,40.7938180202933,40.7938053009953,40.7937933784232,40.7937834108111,40.7937737947347,40.7937649616115,40.7937524501528,40.7937412195596,40.793729106275,40.7937197241076,40.7937095327505,40.7936993910945,40.7936847362559,40.7936728829681,40.7936634325655,40.7936506737206,40.7936381566143,40.7936253977693,40.7936116598266,40.7935963996311,40.7935822440495,40.7935664481405,40.7935542541678,40.7935407942884,40.7935302261745,40.7935168025262,40.7935037501066,40.7934893553762,40.793478092821,40.7934694609362,40.7934545523103,40.7934379562742,40.793429539999,40.7934087179899,40.7933946902618,40.7933825195726,40.7933653714942,40.7933499568954,40.7933354094095,40.7933180243284,40.7933087264777,40.7932988160957,40.7932881993508,40.793276116725,40.7932558420728,40.7932408078479,40.7932298077155,40.7932186646613,40.7932066273419,40.7931935410982,40.7931782013052,40.7931628942349,40.7931395878308,40.7931223131378,40.7931057571427,40.7930903701755,40.7930747271765,40.7930576159328,40.7930419961196,40.7930260489075,40.7930121901822,40.7929977271884,40.7929826123858,40.7929700301708,40.7929574929988,40.7929420105254,40.7929268958065,40.7929147124222,40.7928970853996,40.7928834007578,40.7928720695811,40.7928633515796,40.7928494316313,40.7928378226554,40.7928249506117,40.7928162258753,40.7928038731705,40.7927926714125,40.792783279852,40.7927737759127,40.7927637036499,40.7927553282601,40.7927448076745,40.7927339504472,40.7927193412928,40.7927063578112,40.7927021103467,40.7926939454437,40.7926819268003,40.7926715074012,40.7926607965661,40.7926563043446,40.7926497122875,40.792644387134,40.7926383560676,40.792631667771,40.7926251129171,40.7926181588112,40.7926096412749,40.7926013327583,40.792592195151,40.792581824801,40.7925699194819,40.7925575915155,40.7925444792626,40.7925311001143,40.7925168804168,40.7925018967175,40.7924872155714,40.7924737277174,40.7924587142687,40.7924461283591,40.7924311773625,40.7924177078619,40.7924016194125,40.7923855703824,40.792379698068,40.7923556363611,40.7923431467872,40.7923282195247,40.7923149302141,40.7923025841956,40.7922875611227,40.7922723791175,40.7922572045534,40.7922439261697,40.7922295311272,40.7922133258981,40.7921971245895,40.7921797452576,40.792166140313,40.7921489239298,40.7921333331731,40.7921206021589,40.7921076528368,40.792091206552,40.7920750322044,40.7920443144974,40.7920315936367,40.7920188228267,40.7920046016026,40.7919904062541,40.7919755032376,40.7919598540038,40.7919441876784,40.7919281729509,40.7919139413434,40.7919004554555,40.7918868814917,40.7918733001011,40.7918596743374,40.7918373806693,40.79181508941,40.7917943388945,40.7917762854405,40.7917506942401,40.7917175058423,40.7916806160649,40.7916411305731,40.7916002328294,40.7915591486222,40.7914301120614,40.7913028203389,40.7911776277792,40.7910935548895,40.7910107316775,40.7905581785281,40.7904835968814,40.7903925904227,40.7901492932796,40.7898376722479,40.7898188539742,40.7898065263639,40.7897927664823,40.7897801036662,40.7897639169751,40.7897477409065,40.789731889178,40.7897135678892,40.7896923924075,40.7896740728203,40.7896554001676,40.7896374296181,40.7896240832484,40.7896121316893,40.7895991586705,40.7895786735077,40.7895597092666,40.7895403767393,40.7895253179801,40.7895139165964,40.7895007036371,40.7894871930301,40.7894722750455,40.7894584457043,40.7894446513067,40.7894432903802,40.7894308556516,40.7894181075607,40.7894053314099,40.7893939544099,40.7893832378042,40.7893714495273,40.7893599963782,40.7893399178261,40.7893223184787,40.7893039976545,40.7892943010974,40.7892839453035,40.7892600168798,40.7892471828775,40.7892257585472,40.7892110044688,40.789197955413,40.7891847704912,40.7891720560641,40.7891593434367,40.7891444850291,40.7891412864341,40.7891325103979,40.789118937377,40.7891098156358,40.7890982243002,40.7890847311128,40.7890733021183,40.789061933339,40.7890479920027,40.7890353444072,40.7890383340358,40.789043685616,40.7890493178751,40.7890576394628,40.7890584127739,40.7890605628664,40.7894811900042,40.7895369830024,40.7895783926207,40.7895302497038,40.7894916894739,40.7894653705433,40.7889966372473,40.7889873460682,40.7889820972664,40.7889792652778,40.7889784348985,40.788976950518,40.7889756581336,40.7889733515223,40.7889700258545,40.7889661995021,40.7889643631167,40.7889626017176,40.7889609493142,40.7889604289248,40.7889552795518,40.788951110114,40.7889452839302,40.788940590006,40.7889358741122,40.7889293117221,40.7889195893653,40.7889113561562,40.7889060339586,40.788901938617,40.7888962896761,40.7888909267287,40.7888853332382,40.7888797862819,40.7888723980403,40.7888684972599,40.7888639476077,40.7888548532293,40.7888493998157,40.7888443810112,40.7888432773692,40.7888373261527,40.7888308209956,40.7888265918603,40.7888212658642,40.7888033685811,40.7887896472166,40.7887830462462,40.7887791965015,40.7887776187236,40.7887841288378,40.7887961239585,40.7888228011319,40.7888345086226,40.7888429570702,40.7888597483707,40.78890684181,40.7889967958874,40.7890147434132,40.7890367547998,40.7890612772318,40.7890921790114,40.7891594387465,40.7892076728262,40.7892329110914,40.7892601213921,40.7892999164551,40.789351616596,40.7893864382636,40.7894861231687,40.7903169633999,40.7903719309797,40.7903800695504,40.7903571875823,40.7903278477712,40.7903496883742,40.7903088180058,40.79034067166,40.7906409546716,40.7908664642024,40.791276789432,40.7913522269072,40.7916758393326,40.7917189168617,40.7917493537949,40.7913737157181,40.7911334066446,40.7911752578666,40.7912179212233,40.7913651232937,40.7914846024618,40.7916773217791,40.7921937053516,40.7929907053406,40.7931897858639,40.7932524793774,40.7932774406755,40.7934635410126,40.7934483854298,40.7934443865819,40.7933097077681,40.7933217570109,40.793454840008,40.7934516157029,40.7934707713045,40.7934820203131,40.7935250533777,40.7933194290007,40.7933509327133,40.7933336188242,40.7936485059095,40.7940359198644,40.7943848186272,40.7946046645685,40.7947248557779,40.7948018524199,40.7949012038943,40.7948833580295,40.7949007007072,40.7949018539931,40.7949168171964,40.7949144605059,40.7948973128702,40.7948758653787,40.7948252957744,40.7947885557133,40.7947599602636,40.7947583564742,40.7947878462676,40.7948206838654,40.7948284218584,40.7948330482259,40.794879566171,40.7948895325995,40.7948994336467,40.7949239148006,40.7949412504099,40.7949635472946,40.7949845580471,40.7949876598002,40.7949897142181,40.7949910965862,40.7949865786379,40.7949596147037,40.7949754625036,40.7950772897136,40.79542750552,40.7955586233421,40.7956597373201,40.7962380983655,40.7962055284342,40.7965762380639,40.7966084412961,40.796661538074,40.7966853925349,40.7966746979701,40.7966376833156,40.796597360196,40.7966052728178,40.7966091910286,40.7966181055761,40.7966291115331,40.7966355013639,40.7966404467087,40.7966479283515,40.796654394989,40.7966595552348,40.7966658343875,40.7966726843791,40.7966786132307,40.7966842553393,40.79668803313,40.7966914371105,40.7966957960526,40.7966995017105,40.7967047044594,40.7967080497133,40.7967102160778,40.7967125514676,40.7967168488196,40.7967201132501,40.796723032494,40.7967240673674,40.796725126234,40.7966401337599,40.7964452041929,40.7960960528602,40.7957953289049,40.7950787573146,40.795030059629,40.7949772042917,40.7949203997751,40.7948598701278,40.794563473021,40.7944960610404,40.7944252613423,40.7943514551504,40.7942750398758,40.7941964269769,40.7941661826222,40.7941378721413,40.7941121337604,40.7940895477197,40.7940845837282,40.7940773030679,40.7940679125301,40.7940566788322,40.7940439210424,40.7940300015172,40.7940153156094,40.7940002804388,40.793985323045,40.7939708682581,40.793957326633,40.7939450827875,40.7938565401439,40.7937682184537,40.793643014948,40.793519266666,40.7933972390035,40.7932771936646,40.7931593881009,40.7931207894449,40.7930818909144,40.7930430205976,40.7928657560922,40.7927497562152,40.792663828398,40.7925805069941,40.7925000038301,40.7923224913521,40.7922425322319,40.7921446089334,40.7919976933209,40.7919770960304,40.7918975371453,40.7918443569973,40.7917868435775,40.7917262087873,40.7916687533236,40.791628180034,40.7915845929593,40.7915382036276,40.7910437117125,40.7909444637836,40.7908455043997,40.7907471894985,40.790659206659,40.790571213178,40.7904836002902,40.7904053426725,40.7903282414145,40.7902526146265,40.7901787743345,40.7901300001594,40.7900636925847,40.7900011624276,40.7899841772635,40.789961768167,40.7899344643841,40.7899029107607,40.7898678525119,40.7898254940857,40.7897817885629,40.789737871395,40.7896948835297,40.7896614134884,40.7895919110971,40.7893426318701,40.7890127742128,40.7887767297228,40.7884629055346,40.78798266706,40.7877637200014,40.7877316117417,40.7876964488154,40.7876583437527,40.7875904962566,40.7875255616759,40.7874636089119,40.7873865954948,40.787356113952,40.7873322361454,40.7873151708222,40.7873050671722,40.7868289578339,40.7867817742185,40.786764099156,40.7867566586548,40.7867722341351,40.7868149609292,40.7868571452982,40.7869288735466,40.7869621636423,40.7870264252499,40.787065041676,40.7870822535724,40.7871785650297,40.7873944743842,40.7885136481995,40.7884872257538,40.7880203176229,40.7871925940727,40.7870791301347,40.7869706872789,40.7869272358795,40.7869194186892,40.7868780925889,40.7868214968412,40.7867288608486,40.7866799092223,40.7866617245994,40.7866512291453,40.7862965653039,40.7859172840193,40.784191049149,40.7835696932077,40.7829962651856,40.7820797939408,40.7819966438442,40.7819400652649,40.7819018918519,40.781869696526,40.7814268719043,40.7811254518184,40.7809481422011,40.7806131514076,40.7801869518335,40.7793233661237,40.7786123726147,40.7784095832878,40.7781604165531,40.7779123920832,40.7776641699193,40.777387046691,40.7766660361785,40.7762888230571,40.7761902191018,40.7761682592347,40.7761412251906,40.7760405100574,40.7758127749039,40.7756460798116,40.7755577466778,40.7753178924042,40.7750753573297,40.7749005918048,40.7748486906747,40.774687326249,40.7745730947092,40.7742748884656,40.7742386555859,40.7739900420079,40.7737875273617,40.7729749632613,40.772041698361,40.7716493070118,40.7709766894677,40.7703812726859,40.7695569007772,40.7694838399384,40.7693924069926,40.768777094785,40.7671494936249,40.7646211916861,40.7631420081823,40.7622953428512,40.7615968308279,40.7615135266284,40.7611853370067,40.760822527218,40.7607641279613,40.7591494775036,40.7577561937756,40.7576433408061,40.7555017211948,40.7533951609421,40.7530704482596,40.753084812721,40.7533427010099,40.7535630113391,40.7527026753188,40.7519881445332,40.7512750458755,40.7506213192936,40.7498551213338,40.7495879814059,40.7491374666713,40.7487816637054,40.7486473267049,40.7484222272169,40.747704478333,40.7475993302079,40.747211928463,40.7464026828165,40.7459001592616,40.7456696943573,40.7456695318148,40.7456693704683,40.7454369542154,40.7452037573372,40.7452034318154,40.7452030909198,40.7449700217063,40.7447379378598,40.7447377484306,40.7447375679011,40.7445076382148,40.744244607082,40.7442443464862,40.7442440948066,40.7439869420689,40.743737045852,40.7437368813976,40.743736707076,40.7434955687911,40.7432642904056,40.7430442361737,40.742803857683,40.7428036877632,40.7428035272238,40.7425715241404,40.742571467124,40.7425714113005,40.7423485005303,40.7423484254631,40.7423483498933,40.7421355239413,40.7421353716756,40.7421352216096,40.7419330351485,40.7416955066349,40.7405644860259,40.7404481241979,40.7404478623968,40.7404476010363,40.7403303489093,40.7403301864092,40.7403300337513,40.7402132420446,40.7402130432953,40.7402128351253,40.7400982780954,40.7400980347206,40.7400978006675,40.7399866857629,40.7385934199823,40.7385523064316,40.7384166431246,40.7384389476447,40.738325326189,40.7382823581914,40.7382355413158,40.7381854288368,40.7381746306951,40.7382061404715,40.7382376243901,40.7382690155478,40.7382842022456,40.7383026552872,40.7383310516215,40.7383608519982,40.738391577879,40.7383929854824,40.7383939487086,40.7384186525956,40.7384472109873,40.7384808479782,40.738500294466,40.7385147868745,40.7385323803882,40.7385499718919,40.7385896483002,40.7386293072684,40.7386644514245,40.7387022549407,40.7387809020789,40.7389157436598,40.7389325861239,40.7389431338887,40.7389524852625,40.7389780482677,40.7391278608713,40.7393523000362,40.7395112749715,40.7397042613101,40.7399989035571,40.7400902263996,40.7402831022068,40.7408096601895,40.7408798052049,40.7410357525542,40.7414846222237,40.7416638128473,40.7419495404638,40.7422094961843,40.7422322404994,40.7421906660535,40.7417531841915,40.7414415368014,40.7410438045624,40.7403431380092,40.7398293639291,40.7396309598996,40.7395671055064,40.7394404262537,40.7394882257504,40.7394543595712,40.739449572182,40.7393959559896,40.7393507546433,40.7392886430774,40.7391290603414,40.7391184248319,40.7390456971277,40.7390003952147,40.7389766249098,40.7389222299026,40.7388758547659,40.7388420593962,40.7388284283118,40.738807744776,40.7387783881571,40.7387381221347,40.7386909913284,40.7386229847228,40.7385897733083,40.7385690085487,40.7385641933642,40.7385540432256,40.7385435406457,40.7385333996315,40.7385220674502,40.7385166711569,40.7385156038626,40.7385149723389,40.7385043519711,40.7385024519221,40.7385032039502,40.7378195987375,40.7370831757755,40.7370244827535,40.7375201947633,40.7385619069765,40.7385654949987,40.7391327638927,40.7391612062805,40.7394770969316,40.7395610621863,40.7402648871458,40.7409566917453,40.7416390413239,40.7423409179436,40.7427397573551,40.7427847418805,40.7423991372422,40.7424509378266,40.742593616599,40.7427722064174,40.7430720507685,40.7432279845386,40.7433798061134,40.7434308938952,40.7435005707196,40.743730569606,40.7441757626274,40.7448505175602,40.7451506314946,40.7455239740791,40.7462041091385,40.7468885585259,40.7469042832447,40.7469377497663,40.7469769533884,40.7470215294036,40.7470710629488,40.7471576525076,40.7473647340025,40.7477913486168,40.7480126684928,40.7482866879021,40.748631931769,40.7489095914899,40.7494582894496,40.7501532252542,40.7508826481068,40.7513017845451,40.7519052837267,40.7541306833468,40.7545150424789,40.7544910603547,40.7538639206673,40.7537963150002,40.7535838066692,40.7537736536655,40.7537996374089,40.753820076997,40.7538428048671,40.7538671335439,40.7538923271295,40.7539176235634,40.7539422576735,40.7539814448168,40.7540196093608,40.7540558714667,40.7540893951526,40.7541065667952,40.7541219781921,40.7541394087918,40.7541913377843,40.7542332736228,40.7542852895483,40.7543122984646,40.7543336083181,40.7543831342661,40.7544273697602,40.7544600685378,40.7544970870012,40.7545450004849,40.7545771383473,40.7545878217618,40.7545998807513,40.7546352941779,40.754663357333,40.7546854034404,40.7547251329483,40.7547688404763,40.754805613184,40.7548333033575,40.7548528044981,40.7548839126363,40.7549043703445,40.7549256717579,40.7549323448095,40.754939655397,40.7549592610277,40.7549637881394,40.75497267733,40.7549765650288,40.7550106031681,40.7550439983126,40.7550902644495,40.7551377321101,40.7551772966466,40.7552088127174,40.755216361112,40.7552241327578,40.7552414349947,40.7552748076255,40.7553066175065,40.7553414109893,40.7553607833142,40.7553819645502,40.7553982142634,40.7554177426298,40.7554229163869,40.7554377736336,40.7554413199272,40.7554443696601,40.7554657298573,40.7554739113687,40.7554807419935,40.7555002613041,40.7555293706623,40.7555635487591,40.7555817038106,40.7556090095135,40.7556583922,40.7556881710824,40.7557067351916,40.7557196150517,40.7557403182063,40.7558148351846,40.7558467050646,40.7558726903565,40.7558976071835,40.7559211210439,40.7559468090668,40.7560027737209,40.756034973066,40.7560545153688,40.7561075063088,40.7561447228374,40.7562196989529,40.7562354553661,40.7562539602731,40.7562768146641,40.7562945405022,40.7563040859573,40.7563250093719,40.7563342676821,40.7563693918972,40.7563856951799,40.7564006975291,40.7564083452159,40.7564160077115,40.7564316428249,40.7564486926966,40.7564623231062,40.7564849403806,40.7565195030352,40.7565395363441,40.7565694923169,40.7565969465104,40.7566201865045,40.7566409273383,40.7566483903217,40.7566540411119,40.7566598296928,40.7566626801253,40.7566655495795,40.7566709196953,40.7566729543457,40.7566748533111,40.7566787240042,40.7566824794097,40.7566893430308,40.7566951622001,40.7566991356548,40.7567018208982,40.7567340558191,40.7567699841103,40.7567734350087,40.7567921242221,40.7568218252855,40.756825818085,40.7568280622701,40.7565400363045,40.7562672966429,40.7560102445045,40.7557692688936,40.7555446991363,40.7553368037671,40.7561569937639,40.7569447726627,40.7577434838967,40.7584031589058,40.7590684748989,40.7597286721183,40.7604553976932,40.7606852052743,40.7608608475474,40.7612947608349,40.7617390014391,40.7620785302424,40.7621529544777,40.7622141990183,40.7622613143798,40.7622686175674,40.7622882528572,40.762302169393,40.7623103201699,40.7623126776575,40.7623092341065,40.7623000009174,40.7622850092768,40.7622643098209,40.7620524302832,40.7619316501592,40.7619080623721,40.7624757649154,40.7625398165393,40.7625482648678,40.7625901790638,40.7627553996359,40.7629781495759,40.7632065080956,40.7634386899531,40.7636722713598,40.7639584520316,40.7640675144162,40.7641273882156,40.7642324655417,40.7651457024598,40.7652895884368]}]],[[{"lng":[-73.7446137607096,-73.7442928971144,-73.74434568661,-73.7444044998039,-73.744468017882,-73.7445462970969,-73.7446156802704,-73.7448123560443,-73.744841491771,-73.744933731174,-73.7450603114964,-73.7450024879486,-73.7446137607096],"lat":[40.7789473761095,40.778747261922,40.7787162223782,40.7787312700383,40.7787985381142,40.7788546506472,40.7786720696433,40.7785568975969,40.7786352768837,40.7788890722169,40.7791429434438,40.7791989746049,40.7789473761095]}],[{"lng":[-73.7467245708425,-73.7455922427413,-73.7457355420909,-73.7458187294903,-73.7458876546068,-73.7460789852557,-73.7462557106814,-73.7464916769484,-73.7466391941569,-73.7468206555507,-73.7468401232696,-73.7469282170603,-73.7470404860418,-73.7470498727007,-73.7470840306214,-73.7470542967688,-73.7472011345441,-73.7472448071309,-73.7472102534048,-73.7471364942635,-73.7469991124608,-73.7469206041618,-73.7468712752269,-73.7467878741471,-73.7467245708425],"lat":[40.7803065257983,40.7795806792697,40.7796105943866,40.7796667168735,40.779603471322,40.7796038930759,40.7795744486399,40.7794481721916,40.7793589936387,40.7793743101578,40.7794153748702,40.7794715080051,40.7796209249126,40.7797328236124,40.7797813801263,40.7798596291098,40.7799494536327,40.7800763447095,40.7801322078755,40.7801767981221,40.7801802255466,40.7801837821185,40.7802545305928,40.7802543473645,40.7803065257983]}],[{"lng":[-73.7487310863818,-73.7485151365582,-73.7483991560592,-73.7482491101888,-73.7481337690715,-73.7480276333644,-73.7480186537227,-73.748056608542,-73.7481445240551,-73.7479942101676,-73.747872465633,-73.7477758065254,-73.7477510749064,-73.747675887334,-73.7476481466931,-73.7475326559952,-73.7474234325161,-73.7473579106255,-73.7474871041715,-73.7475748831239,-73.7476596090639,-73.7477789291149,-73.7476694454435,-73.7475817301239,-73.7474689313245,-73.7473967341298,-73.7473593841095,-73.7472751379813,-73.7471655822889,-73.7470119744345,-73.7469428653211,-73.746889637884,-73.7468142070461,-73.7467937513753,-73.746866256832,-73.7467409691547,-73.7464583980822,-73.746458695642,-73.7462911127679,-73.7462335869638,-73.7461783080177,-73.7461282617391,-73.7461008390674,-73.7460082320923,-73.7459757743357,-73.7459758834065,-73.7459008361518,-73.7458610518889,-73.7458161877857,-73.7457539544525,-73.7457189950918,-73.7456412962378,-73.745626520085,-73.7455916065369,-73.7456318270995,-73.7455692512098,-73.7454843137334,-73.7454946260544,-73.745464749902,-73.7455277180041,-73.7454777237485,-73.7454006133039,-73.7453912255148,-73.7454502217555,-73.7453677269197,-73.7453655039721,-73.7453480030487,-73.7453203056624,-73.7452998601095,-73.7453373460303,-73.7453722538791,-73.7454320954377,-73.7454567100757,-73.7455266326822,-73.7455063557253,-73.7456111197254,-73.7456007479053,-73.745673017466,-73.7456876990982,-73.7457301141593,-73.7457774637295,-73.7458925573134,-73.7459601703084,-73.7460527622024,-73.7461103025022,-73.7461053290655,-73.7459733201898,-73.7459537514426,-73.7460099642454,-73.7459206236904,-73.7457278093868,-73.7456101370233,-73.7455490594702,-73.7454594989305,-73.7454077690133,-73.7452906841548,-73.745192405603,-73.74517892998,-73.7452214891433,-73.7451374793755,-73.7450767718396,-73.7449499431247,-73.7448373013205,-73.7446639804331,-73.7446172949822,-73.7446646793409,-73.7447541835903,-73.7448862457739,-73.7449287359631,-73.7451311125746,-73.7451830055166,-73.7452398592266,-73.7451839081333,-73.7451466951776,-73.7451752035599,-73.7451990518829,-73.7452462420091,-73.7452183907857,-73.7451480903204,-73.7450918799599,-73.7450546385282,-73.7450172740409,-73.7449372161502,-73.7449510186446,-73.7451195401095,-73.7451379761579,-73.7450669361281,-73.7450712403748,-73.7451035895889,-73.7450751205001,-73.7449573545215,-73.7448349420469,-73.7447923961585,-73.7446652137936,-73.7446701889314,-73.7447176819392,-73.7445846577234,-73.7444844262264,-73.7444310162936,-73.74442453717,-73.7443993171625,-73.7443770749458,-73.744458447392,-73.7444771608828,-73.7444801030793,-73.7444101080776,-73.7444098977406,-73.7444159181414,-73.7443781342689,-73.7442809167698,-73.7442182686587,-73.7441524490722,-73.7440844303473,-73.7441042993767,-73.7441266463817,-73.7441942514571,-73.7442643931099,-73.744332144646,-73.7443344982057,-73.744296703414,-73.7442062531877,-73.7441460159234,-73.7440907434024,-73.7440409145722,-73.7434499226589,-73.7415196945707,-73.7407599148931,-73.7403662941908,-73.7400797397189,-73.7393759888705,-73.7391236200372,-73.7388622736383,-73.737702836223,-73.7368822298614,-73.7338926159133,-73.7330421584566,-73.7320586557862,-73.7312873864364,-73.7304883467394,-73.7295434194624,-73.7289331886981,-73.7279428140826,-73.7268594127359,-73.7258254369014,-73.7237886267034,-73.7229310395313,-73.7223309076035,-73.7215332474577,-73.7209758843428,-73.7208090485533,-73.7207522264702,-73.7207126990036,-73.7206308309875,-73.720214357172,-73.7165758525221,-73.7141353801854,-73.7138698269596,-73.7136555701363,-73.7135182810599,-73.7142628773707,-73.7145568590179,-73.7149821402296,-73.716125282335,-73.7161384267906,-73.7168544044493,-73.717672370657,-73.7183197181875,-73.7187778771528,-73.7189705036507,-73.7191790962089,-73.7195646072074,-73.719677323078,-73.719982969885,-73.7203159529136,-73.7206331939909,-73.7209651171016,-73.7211100148293,-73.7212117612937,-73.7214587026136,-73.7215963147849,-73.7216135707177,-73.7217633963702,-73.7218028921022,-73.7220707143631,-73.7224109479736,-73.7226454352784,-73.7227970316873,-73.722993013251,-73.7232667341128,-73.723441354726,-73.723518672625,-73.7238269889925,-73.7238445185635,-73.7247582308592,-73.7250684805801,-73.7250944536574,-73.725829888901,-73.7260296634162,-73.7264147213715,-73.7266652997626,-73.7267773946019,-73.7270938962406,-73.7273788914016,-73.7277135618633,-73.7278840110042,-73.7280535563183,-73.728253810495,-73.7283779840264,-73.7284917856987,-73.7286220742307,-73.7287195280344,-73.7289618301044,-73.7290667097408,-73.7291459381016,-73.7295344898019,-73.729646192304,-73.729931691068,-73.7304313463387,-73.7306280183626,-73.7310646188084,-73.7322691805635,-73.7323273171628,-73.732416946137,-73.7336646151422,-73.7337063066621,-73.7337548485368,-73.7343696590925,-73.7353950876422,-73.7356078673722,-73.736858942342,-73.7375103806105,-73.7381604798647,-73.7385717593228,-73.7390121035239,-73.7393315136078,-73.7397224415904,-73.7398699553434,-73.7401695182886,-73.7414462859306,-73.741516368396,-73.7415894454279,-73.7422843119843,-73.7429478585603,-73.7447241770073,-73.7455536803748,-73.7461625945476,-73.7467214036271,-73.7470453150768,-73.7473312659008,-73.7474969286838,-73.7479342385097,-73.7491718855846,-73.7498098750692,-73.7504829564986,-73.750810669395,-73.7510675391817,-73.7517767991304,-73.7518423828998,-73.7519241349113,-73.752219141375,-73.7525947100116,-73.7528907647338,-73.7531916268874,-73.7534971274941,-73.7538070928292,-73.754064692594,-73.7544222251128,-73.7552758438404,-73.7561259878482,-73.7565525339654,-73.7566365811251,-73.7567032923354,-73.7567473961243,-73.7567827271554,-73.7568485473757,-73.7578714145791,-73.7583167551701,-73.7599381830034,-73.7602421099526,-73.7611408368041,-73.7616081443854,-73.7623420983915,-73.7632753774446,-73.763818667354,-73.7643507152622,-73.7648685309736,-73.7652883037966,-73.7655885617446,-73.7656437446564,-73.76555086054,-73.7649166761364,-73.7643401501722,-73.7636997917017,-73.7637401047644,-73.7647122863809,-73.7634077835836,-73.762495339435,-73.7627330346792,-73.762528757224,-73.7624853862956,-73.7624633455236,-73.762463483763,-73.7624860927728,-73.7625308618954,-73.7625969477084,-73.7626829717928,-73.7631681653848,-73.763612254194,-73.7643149555986,-73.7651512888328,-73.7655684981059,-73.7661748475612,-73.7663375608593,-73.7664910963283,-73.766633525764,-73.7667631486094,-73.7668785359679,-73.7669786290539,-73.7676150802808,-73.7677061458968,-73.7677299142538,-73.7685770122043,-73.7693716412279,-73.7703898232084,-73.7713767848846,-73.7714521884746,-73.7715340231325,-73.771566719034,-73.7716209796026,-73.7724146100266,-73.7728126768902,-73.7732153479139,-73.7736218517439,-73.77403143122,-73.7744433045205,-73.7748638213836,-73.7755123829721,-73.7756918242702,-73.775738369271,-73.77579713377,-73.7780583566693,-73.7785992477799,-73.7796564130618,-73.7803660354377,-73.7806858491643,-73.7810056636336,-73.7812185758443,-73.7813769887811,-73.781765268269,-73.7821600971818,-73.7831101185109,-73.7834969715438,-73.7840094412037,-73.7848424455737,-73.7857705120003,-73.7866484461612,-73.7866908531654,-73.7867351682107,-73.7875944436014,-73.7884824349903,-73.7886511024846,-73.7893472725741,-73.7902075013792,-73.791115264333,-73.7920281759569,-73.7928579703722,-73.7929160314509,-73.7929788166896,-73.7936934138513,-73.794408017501,-73.7953377292228,-73.7958868169561,-73.796115847736,-73.7964021870636,-73.7964117836612,-73.796439400485,-73.7967249785876,-73.7962929729161,-73.7964083366988,-73.7971768666997,-73.7972236245783,-73.7972237300281,-73.7972238015305,-73.797256650196,-73.7972567079298,-73.7972567434467,-73.7972751530502,-73.7972751763732,-73.7972751758787,-73.7972788680566,-73.7972788787146,-73.7972788541305,-73.7972679511916,-73.7972308497208,-73.7969506529853,-73.7966662287099,-73.7966660174629,-73.7966658185438,-73.7963943219328,-73.7963942358001,-73.7963941496689,-73.796136385709,-73.7961363119708,-73.7961362496826,-73.795893352483,-73.7958931909794,-73.7958930287863,-73.7956656682183,-73.7954305928757,-73.7952125770972,-73.7950131200899,-73.7950129845309,-73.7950128584735,-73.7948329545002,-73.7946735656202,-73.7946734082346,-73.7946732717469,-73.7945350735508,-73.7944912065203,-73.7944911705002,-73.7944911461268,-73.7944636833295,-73.7944528289866,-73.7944528171416,-73.7944528269305,-73.7944586915746,-73.7944812052734,-73.794481215569,-73.794481238857,-73.7945201930523,-73.794579760412,-73.7946756881826,-73.7947226487799,-73.7947354566906,-73.7948153134904,-73.7948103456186,-73.7948050444504,-73.794791003346,-73.7947752525681,-73.7947576982429,-73.794721412575,-73.7946832464622,-73.7946558385144,-73.7946276915411,-73.7945772699,-73.7934332013522,-73.7924309918035,-73.7923751799838,-73.7924191072558,-73.7927155327382,-73.7930144042444,-73.7930301581338,-73.7932162364112,-73.7934399114646,-73.7934403346992,-73.7934429997644,-73.7934380018251,-73.7934367370331,-73.7933454619449,-73.7932248387383,-73.7930255136592,-73.7926823244246,-73.7924567735076,-73.7923901269484,-73.7923824381353,-73.7923791069461,-73.7922312493827,-73.7921678938404,-73.7922891961931,-73.7923669778863,-73.7925514464415,-73.7927125938288,-73.7922679522092,-73.7916352606646,-73.7914959869521,-73.7903497179111,-73.7898420408074,-73.7891387365923,-73.7889397576961,-73.7882697295326,-73.7874099159046,-73.786550733524,-73.7862649830261,-73.7856943384528,-73.7849148919768,-73.7845933934921,-73.7844833065157,-73.7844091872914,-73.7840764529224,-73.78279772917,-73.7803618035437,-73.7794765605842,-73.7785877112418,-73.7776935496137,-73.7767836326243,-73.7758395833217,-73.775598853662,-73.7740381110772,-73.7732718173539,-73.7726695015009,-73.7723506921408,-73.771814665066,-73.7709987179752,-73.7709360216871,-73.7708686712456,-73.7707638281677,-73.7706097445486,-73.7698101452351,-73.7693040571013,-73.7690880771458,-73.7690244549392,-73.7685805854947,-73.7683379567389,-73.7682733357088,-73.7681591544423,-73.7681345883816,-73.7682319025411,-73.7682005546003,-73.7671619368759,-73.7672072936747,-73.766997835351,-73.7670734335662,-73.7670239234651,-73.7669275026483,-73.7669580014478,-73.7668899470384,-73.7667757037394,-73.7667586863122,-73.7668691297144,-73.766863454366,-73.7670881591274,-73.7671354490991,-73.7681617305158,-73.768077888618,-73.7677945062199,-73.7676045463379,-73.7676189407549,-73.7674781736673,-73.7671371731236,-73.7670911348473,-73.7670006806978,-73.7665882727841,-73.7663282325811,-73.7662778796919,-73.7661423329391,-73.7660039832656,-73.7657279690393,-73.7651043682021,-73.7646938542461,-73.7643606700638,-73.764176331147,-73.7637840134912,-73.7622386311044,-73.7612630125984,-73.7608590005573,-73.7606052406625,-73.7605234950785,-73.7604405684868,-73.7600114229605,-73.7596007809282,-73.7593738942836,-73.7590735292443,-73.758935120937,-73.75880776561,-73.7588384787157,-73.758822044628,-73.7588273600204,-73.75879456996,-73.7587340354635,-73.7586426435808,-73.758421565508,-73.7580238719254,-73.7578703056723,-73.7576068379924,-73.7575219437506,-73.7573902080387,-73.7573452317401,-73.7571843001929,-73.7570311482004,-73.75692940163,-73.7566598285143,-73.7564108428975,-73.7564092114074,-73.7564083615959,-73.756408306114,-73.7564090326287,-73.7564131832044,-73.7564200366035,-73.756448380187,-73.756460190179,-73.7564990397731,-73.756508848166,-73.7565124009093,-73.7565146831241,-73.7565151252273,-73.7565155091384,-73.7565157265295,-73.7565157778407,-73.7565156399346,-73.7565153487326,-73.7565148782585,-73.7565142430309,-73.7565134291599,-73.7565124492458,-73.7565112924534,-73.7565084674455,-73.7565049424883,-73.7565007193764,-73.7564910753618,-73.7564787624025,-73.7564737783002,-73.7564358283957,-73.7564035715683,-73.7563875860459,-73.7563431222663,-73.7563156703824,-73.7562866441139,-73.7562555932361,-73.7562206450325,-73.7562057809939,-73.7561910361845,-73.7561770200206,-73.7561635345615,-73.7561448970506,-73.7560221033329,-73.7558829495031,-73.7554731043979,-73.7549367434126,-73.7542555341964,-73.7542523503824,-73.7541006548844,-73.7540196191293,-73.7539749824477,-73.753882348747,-73.7538508590688,-73.7538227060357,-73.7537703646453,-73.7538073375998,-73.7538044144522,-73.7537519010711,-73.7536722945569,-73.7535570448884,-73.753467453831,-73.7534099472643,-73.7533073647488,-73.7532177566978,-73.7531154099183,-73.7529744306812,-73.7528589825038,-73.7526473236616,-73.7526925441734,-73.7526412812655,-73.75249376942,-73.7523683473865,-73.7522630407005,-73.7521926153652,-73.7521223355825,-73.7520456318618,-73.7520040194554,-73.7519527555826,-73.7518901313187,-73.7518188487802,-73.7517804277757,-73.7516008270044,-73.751503453479,-73.7513972211751,-73.7512853356981,-73.751173402329,-73.7510703776262,-73.7510524589615,-73.7510403349292,-73.7510842820424,-73.7510743225256,-73.7509735123675,-73.750901704247,-73.7508218773704,-73.7507272869203,-73.7505746821474,-73.750411283387,-73.7501928997779,-73.7499854816292,-73.7494937607277,-73.7491466574023,-73.7486809083737,-73.7486122507256,-73.748531663865,-73.7484570766552,-73.7484004868574,-73.7482281259855,-73.7479657349687,-73.7478976470269,-73.7477856783314,-73.747733274254,-73.7476583327049,-73.7475351347506,-73.747461175008,-73.7472896712355,-73.7471698249883,-73.7469555869677,-73.7467301639041,-73.7465598186795,-73.7464254631054,-73.7462890449138,-73.7462858285577,-73.7462860009914,-73.746291892682,-73.7463259792522,-73.74634096547,-73.7463233354084,-73.7463032588723,-73.7463562190214,-73.7464148644748,-73.7463814416708,-73.7464030940343,-73.7464133762817,-73.7464134955851,-73.74642482956,-73.7464116758474,-73.7463715759126,-73.7463302358407,-73.7463145414671,-73.7462674358693,-73.7462483820593,-73.7462439033724,-73.7462405449713,-73.7462371874518,-73.7462360784227,-73.7462349617885,-73.746234968301,-73.7462349748072,-73.7462349813178,-73.74623499433,-73.7462372525343,-73.7462530874619,-73.7462768264514,-73.7462813571867,-73.74628363711,-73.7462847882126,-73.7462848012267,-73.7462836924199,-73.746280345103,-73.7462770053958,-73.7462613631368,-73.7462378903304,-73.7462188906347,-73.7462099395367,-73.7462077019163,-73.7462054625861,-73.7461953829455,-73.7461819373621,-73.7461752084503,-73.7461684791487,-73.7461572592268,-73.7461550133862,-73.7461482808305,-73.7461392985163,-73.7461314345495,-73.7461100861663,-73.746103342529,-73.7460977177147,-73.7460718396238,-73.7460583371605,-73.7460009489511,-73.7459806913368,-73.7459491686193,-73.7458906154765,-73.7458838559702,-73.7458770927613,-73.7458455206548,-73.745837635395,-73.7458275062291,-73.7458173801011,-73.7458072622513,-73.7457971445738,-73.7457926526606,-73.7457892814675,-73.7457847921554,-73.7457814262053,-73.7457791855548,-73.7457758222061,-73.7457601429555,-73.7457500678887,-73.7457444715135,-73.7456974812008,-73.7456795754427,-73.7456303182634,-73.7455485979349,-73.7455306935768,-73.7455206238213,-73.7454870588205,-73.7454613121112,-73.7454467482771,-73.7454299362329,-73.7453839662908,-73.7453738704466,-73.7453256374991,-73.7453043316149,-73.7452875228687,-73.7452729590776,-73.7452617662516,-73.745251697623,-73.745233836749,-73.7452271343133,-73.7451913550951,-73.7451555419652,-73.7451286679652,-73.7450939488287,-73.7450894687103,-73.7450861054042,-73.7450760152758,-73.745039013066,-73.7450289238233,-73.7450233164287,-73.7450084885698,-73.7449941770573,-73.7449818485416,-73.744980727798,-73.7449594375181,-73.7449426452472,-73.7449359336921,-73.7449303481281,-73.7449236542484,-73.7449136099371,-73.7449080361435,-73.7448935224387,-73.7448868253003,-73.7448834816394,-73.7448812604462,-73.7448757592936,-73.7448757723799,-73.7448735518497,-73.7448690817933,-73.7448679682607,-73.7448657289832,-73.7448646115154,-73.7448623713614,-73.7448567661879,-73.7448500317493,-73.7448354395602,-73.7448118618965,-73.7447927758708,-73.7447871619567,-73.7447815528578,-73.7447759422125,-73.7447714595121,-73.7447681003837,-73.7447434495468,-73.7447221733626,-73.7446762773944,-73.744644942625,-73.7446359905721,-73.7446337602459,-73.7446315268739,-73.7446281799729,-73.7446281930719,-73.744628202896,-73.7446282225441,-73.744629365317,-73.7446406799882,-73.7446418059506,-73.7446429489442,-73.7446440925967,-73.7446441089695,-73.7446452569719,-73.7446453028103,-73.7446453355551,-73.7446454206896,-73.7446421825129,-73.7446389404058,-73.7446401102504,-73.7446435252452,-73.7446446590736,-73.7446491847514,-73.7446559671608,-73.7446908691357,-73.7446900151412,-73.7446898675859,-73.7446887772025,-73.7446574864687,-73.7446541192787,-73.7446265350062,-73.7446260610741,-73.7446148381392,-73.7446058599398,-73.7446013700702,-73.7445586403078,-73.7445529283833,-73.7445403903811,-73.7445502656966,-73.744551375938,-73.7445590849611,-73.7445601853751,-73.7445656680267,-73.7445688760304,-73.7445710218453,-73.7445730842367,-73.7445763964285,-73.7445819524496,-73.7445897571554,-73.7446009329802,-73.7446154806234,-73.7446244368375,-73.7446249097816,-73.7446345175069,-73.7446423595431,-73.7446546836406,-73.7446995060563,-73.7447107113849,-73.7447163122051,-73.7447387082629,-73.7447745258563,-73.7448080913025,-73.7448215019216,-73.7448505243073,-73.7448605880151,-73.7448661833866,-73.7448729040966,-73.7449166044947,-73.7449188470491,-73.7449591987752,-73.7449738892486,-73.7449883390323,-73.7449950656361,-73.7450488734675,-73.7450600801974,-73.7450903371021,-73.745107129439,-73.7451205630638,-73.745125039926,-73.7451485406159,-73.7451630782255,-73.7451954960785,-73.7452100302295,-73.7452234567032,-73.7452402569588,-73.7452581766556,-73.7452794638312,-73.7452828262693,-73.7452873138328,-73.7452929229879,-73.7452985360705,-73.7453378376873,-73.7453513066512,-73.7453569203961,-73.7453614024937,-73.7453658898398,-73.7453692492365,-73.7454263528675,-73.7454789770749,-73.7455036178822,-73.7455506480056,-73.7455663154504,-73.7455819715772,-73.7456110278219,-73.7456266711448,-73.7456423188386,-73.745679223236,-73.7457060813346,-73.7457329557598,-73.7457598495421,-73.7457643316789,-73.745768819061,-73.7457800390093,-73.745792388621,-73.7458047410526,-73.7458182238133,-73.7458305892891,-73.7458418353149,-73.7458519605685,-73.7458992321995,-73.745927385563,-73.7459780780731,-73.7459938457391,-73.7460062265892,-73.7460129769799,-73.7460185985493,-73.746024222978,-73.746029838031,-73.746034331263,-73.746038825156,-73.7460421911073,-73.7460466817461,-73.7460545318213,-73.7460623738428,-73.746075811869,-73.7461049062021,-73.7461463202188,-73.7461608605697,-73.7461720382231,-73.7461753788079,-73.7461787187288,-73.7461853239819,-73.7461886630268,-73.7461908967381,-73.7461931295728,-73.7461964877543,-73.7461998472101,-73.7462032040704,-73.7462076868893,-73.7462177841696,-73.7462233936144,-73.7462278836038,-73.7462301301166,-73.7462559295553,-73.7463119670549,-73.7463071094461,-73.7463011030953,-73.7462929050674,-73.7462701103278,-73.7461944243327,-73.7460997318356,-73.7460621494219,-73.7461020156208,-73.7461622437191,-73.746258367141,-73.7463589302906,-73.7465537809883,-73.7467242297633,-73.7469115423723,-73.747089839716,-73.747366553645,-73.7474942415331,-73.7474971489095,-73.7475467015488,-73.7476047704845,-73.7476505701627,-73.7477434840654,-73.7479068841613,-73.748034402722,-73.7481586590462,-73.7482481009681,-73.7482454950975,-73.7482715290177,-73.7483143742703,-73.7483516962762,-73.7483451508418,-73.7483698763008,-73.7484072345006,-73.7485009511289,-73.748541460287,-73.7486634776684,-73.7487478026685,-73.74889172729,-73.7488725496159,-73.7489665531784,-73.7490824746181,-73.7490546590151,-73.7491500604039,-73.7492220217639,-73.7492490513216,-73.7492054165399,-73.7491715886307,-73.7491739446257,-73.7494702746145,-73.7496610256023,-73.7497979210247,-73.7500404213058,-73.7501884612584,-73.7503228270199,-73.7504618300976,-73.7505704936531,-73.7506384796376,-73.7508480282828,-73.7509835695331,-73.7511089924216,-73.7512310028011,-73.7513260906423,-73.7514204878961,-73.7515099562406,-73.751535450835,-73.7515694325175,-73.7515602450935,-73.751600453026,-73.7516212179659,-73.7516350320006,-73.7516383319996,-73.7516383448885,-73.7516383734937,-73.7516489966525,-73.7516506376482,-73.7516508283345,-73.7516952345571,-73.7518283443911,-73.7519761577314,-73.7520701437327,-73.7521574815897,-73.7521921982344,-73.7522224303414,-73.7522177378063,-73.7522534997686,-73.7523432667933,-73.7524014799701,-73.7524484210662,-73.7524785175615,-73.752510927501,-73.7525670418802,-73.7526624986509,-73.7527410267386,-73.7528160503571,-73.7528932785593,-73.7529829885679,-73.7530457109001,-73.7530792107005,-73.7531137350034,-73.7531459999792,-73.7531922785675,-73.7532127018819,-73.753237647802,-73.7532667758971,-73.7533282652925,-73.7533885307276,-73.7534001231941,-73.7534183226519,-73.7534416607274,-73.753469267086,-73.7534831975824,-73.7534843097526,-73.753487522447,-73.7534954047873,-73.753503314483,-73.7535120448882,-73.7535182390559,-73.7535187559146,-73.7535210070676,-73.7535213064567,-73.7535287280918,-73.753573280168,-73.7535921875176,-73.7536121348811,-73.7536320455312,-73.7536340014967,-73.7536508302104,-73.7536696851945,-73.7536741338879,-73.7536758853482,-73.7536785921258,-73.7536882270221,-73.7536997507449,-73.7537053116151,-73.7537066845901,-73.7537097616395,-73.7537219049886,-73.7537237984852,-73.753737316036,-73.7537395055209,-73.7537399433634,-73.7537405533288,-73.753742519041,-73.7537432676561,-73.7537447087516,-73.7537452677196,-73.7537457749836,-73.7537681227005,-73.7537700288709,-73.7537976599968,-73.7538287017118,-73.7538506037983,-73.7538620038602,-73.7538654162748,-73.7538697997688,-73.7538792605499,-73.7538876208657,-73.7538893477113,-73.7538920791285,-73.7538944791813,-73.7538954078997,-73.7539431094199,-73.7539575591431,-73.7539909530528,-73.7540042994855,-73.7540198350029,-73.7540342223942,-73.7540474647478,-73.7540705776829,-73.7540793684444,-73.7540804977592,-73.754087010633,-73.7541042786437,-73.754104377114,-73.754111886448,-73.7541128220731,-73.7541206401855,-73.754131665996,-73.7541463408143,-73.7541493885,-73.7541609692396,-73.7541693659911,-73.7541697518113,-73.7541938337717,-73.7542136821523,-73.754219433937,-73.7542272381381,-73.7542350483444,-73.7542763654207,-73.754282463521,-73.7542852798393,-73.7542941867074,-73.754296441075,-73.7543197505425,-73.7543419334423,-73.7543598396167,-73.7543607458207,-73.7543761797363,-73.7544345133909,-73.7544642556946,-73.7545082654964,-73.7545378273115,-73.7545423969539,-73.7545475911434,-73.7545930955986,-73.7546140585558,-73.7546383774398,-73.7546660584744,-73.7546959821427,-73.7547104160306,-73.7547270799064,-73.7547347346516,-73.7548049397892,-73.7548189487657,-73.754821606567,-73.7548360285511,-73.7548747711695,-73.7548869173083,-73.7548907827852,-73.75489569735,-73.7549175352747,-73.7549274620185,-73.7549462169186,-73.7549615783909,-73.754972557855,-73.7549856449813,-73.7549953167758,-73.7549953693009,-73.7550721084905,-73.7550760338357,-73.7549960546209,-73.7549561747356,-73.7549291189627,-73.7549245771509,-73.7549189644604,-73.7549042884009,-73.7548918486509,-73.7548816492422,-73.7548725610019,-73.7548706037508,-73.7548657108474,-73.7548627188635,-73.754859878268,-73.7548565353118,-73.754855296298,-73.7548512996063,-73.7548496011014,-73.7548468230341,-73.7548325806339,-73.7548280175187,-73.7548280169125,-73.7548279986503,-73.754827986028,-73.754827982932,-73.7548290867226,-73.7548312300767,-73.7548324391402,-73.7548347461835,-73.7548380211583,-73.7548547963937,-73.7548560543148,-73.7548615001371,-73.7548624413194,-73.7548626086195,-73.7548632480079,-73.7548637157805,-73.7548637114084,-73.7548637000603,-73.7548625614615,-73.7548614230767,-73.7548608421909,-73.754859158295,-73.7548557728255,-73.7548512638194,-73.7548500276616,-73.7548400016422,-73.754805091386,-73.7548034573359,-73.7548005817152,-73.7547960726986,-73.7547953357619,-73.7547926903714,-73.7547904271204,-73.7547813589895,-73.7547745940004,-73.7547676839497,-73.7547606853533,-73.7547574915998,-73.7547531531514,-73.7547439247949,-73.7547315044275,-73.7547218161563,-73.7547168457389,-73.7547021996303,-73.7546923613106,-73.7546841837603,-73.7546685553857,-73.7546628069064,-73.7546465639611,-73.7546403127919,-73.7546379863661,-73.7546167047864,-73.7546065894999,-73.7545942318125,-73.7545852472526,-73.7545530736197,-73.7545470598684,-73.7545454835146,-73.754538071278,-73.7545373434738,-73.7545369483927,-73.7545290808636,-73.7545276689698,-73.7545110901412,-73.7545083832145,-73.7545054690429,-73.7544919691383,-73.7544891892807,-73.7544728353093,-73.7544533204202,-73.7544514458186,-73.7544450654173,-73.7544379299329,-73.7544266604809,-73.7544175397214,-73.7544153887572,-73.7544074890571,-73.7544007110769,-73.7543961824546,-73.7543954723921,-73.7543950235997,-73.754394381209,-73.7543938826916,-73.7543943248036,-73.7543949889492,-73.754394877375,-73.7543960911064,-73.7543971660462,-73.7543983278733,-73.754400566181,-73.7544039271577,-73.7544072906218,-73.7544129270207,-73.7544151399296,-73.7544263612728,-73.7544387095357,-73.7544424605018,-73.7544432035095,-73.7544521889686,-73.7544619730294,-73.7544645118718,-73.7544645471335,-73.7544705466883,-73.7546027658762,-73.7546701842513,-73.754673554015,-73.7546763903145,-73.7546780433015,-73.7546800519154,-73.7546859027286,-73.7546905208465,-73.7546937545399,-73.7547004798819,-73.7547051792451,-73.7547072041188,-73.754711679219,-73.7547139168786,-73.7547150263036,-73.7547150243261,-73.7547150168634,-73.7547158602656,-73.75471613164,-73.7547158064279,-73.7547149539493,-73.7547129698419,-73.7547114338375,-73.7547111507077,-73.7547111363226,-73.7547111223941,-73.7547134257974,-73.754714460046,-73.7547311809782,-73.7547317559587,-73.7547322768819,-73.7547331158565,-73.754733370578,-73.7547298718332,-73.754720736877,-73.7546968258224,-73.7546875741882,-73.7546786423856,-73.7546775350123,-73.7546763379747,-73.7546751624736,-73.7546756370723,-73.7546761995354,-73.7546820222257,-73.7546861330943,-73.7546973621606,-73.754698163209,-73.7546992140293,-73.7546991416696,-73.7546944494409,-73.7546830113072,-73.7546806850853,-73.7546817234745,-73.7546841870983,-73.7546849847046,-73.7546863132397,-73.7546904447688,-73.7546959452994,-73.7547019742068,-73.7547059371668,-73.7547203878203,-73.7547248321874,-73.7547268555581,-73.7547470653856,-73.7547512282215,-73.7547548544207,-73.7547637758073,-73.7547805363482,-73.7548129826099,-73.7548722816632,-73.7549012504291,-73.7552066537824,-73.7553327945919,-73.755404150086,-73.7553997585901,-73.7555129578636,-73.755534987289,-73.7554018026175,-73.7553974111173,-73.7553421625608,-73.7554054138866,-73.7554223780355,-73.755502439619,-73.7555614028681,-73.7555733264931,-73.7555014651064,-73.7554242370358,-73.7552555566659,-73.7550826771365,-73.7551075319324,-73.75511414903,-73.7551152356232,-73.7550738686908,-73.7550749874305,-73.7550805012016,-73.7550592038605,-73.7550105425548,-73.7548546586284,-73.7547060494338,-73.7543807475754,-73.7542960028262,-73.7541985912039,-73.754033315618,-73.7539752122952,-73.7539257846815,-73.7538775605071,-73.7538086391265,-73.7537222129142,-73.7536397451796,-73.7535700090613,-73.7535060983176,-73.7534519259874,-73.7534098581235,-73.7533899402959,-73.7533669199949,-73.7533923720636,-73.7534784794408,-73.7535616749842,-73.7536224771742,-73.7536397274899,-73.7536796912164,-73.7537527724858,-73.7538076815875,-73.7538361571892,-73.7539136717676,-73.7539557393991,-73.7539802762599,-73.7540059672431,-73.7540206184198,-73.7541040610497,-73.7541211549044,-73.7541441545853,-73.7541834418297,-73.7541895302818,-73.7542740418214,-73.7542414999939,-73.7543334926649,-73.7544224891778,-73.7544830212019,-73.7545456055867,-73.754571582022,-73.7545799674909,-73.7546604244236,-73.7547091212971,-73.7547523356378,-73.7548009712007,-73.7548008272755,-73.7548195740527,-73.7548382598212,-73.7548543147689,-73.7548569144588,-73.7548868812834,-73.7549295876919,-73.7550105312519,-73.7550968405145,-73.7551366423307,-73.7551615414468,-73.7551857539433,-73.7551769714196,-73.7551069413847,-73.7550663022348,-73.7550228671798,-73.7549754937699,-73.7549684849081,-73.7549385058148,-73.7548957829689,-73.754878754446,-73.7548660633368,-73.7548580065974,-73.7548547727476,-73.7548564374598,-73.7548635403637,-73.7548735856186,-73.7548863795857,-73.7549016756391,-73.7549197011355,-73.754939838267,-73.7549819374722,-73.7548943832531,-73.7548357769242,-73.7548418087061,-73.7548492969871,-73.7548151718828,-73.7548132289344,-73.7554183128755,-73.7554243457828,-73.7555178160454,-73.755517375818,-73.7554200211088,-73.7554221421191,-73.7548121705854,-73.7547946858063,-73.7547391477637,-73.7547233193417,-73.7547083722661,-73.7546945341839,-73.7546722837533,-73.7546597253111,-73.7546490043087,-73.7545644968616,-73.754649813175,-73.7544419628203,-73.7543733654965,-73.7543018354087,-73.7543000636342,-73.7542886526156,-73.7542821406951,-73.7542737976824,-73.7542625096784,-73.754248170366,-73.7542306948311,-73.754122444388,-73.7541117187848,-73.7541314302937,-73.7541296408308,-73.7540262400954,-73.7539327546702,-73.7539065978494,-73.7535304003175,-73.7530081254972,-73.7529983929643,-73.7527478689581,-73.7524596268728,-73.7523586899674,-73.7523158955917,-73.7521791091579,-73.7520188130994,-73.7519481150122,-73.7518397628445,-73.7517268690029,-73.7513480846683,-73.7510676865771,-73.750828611401,-73.7507195192557,-73.7506209058185,-73.7503251145417,-73.7502077036602,-73.7501715134524,-73.7500647992313,-73.7499751589997,-73.749939183211,-73.7499180642073,-73.7497296757822,-73.7495351467203,-73.7492532635324,-73.7491915740152,-73.7491122803627,-73.7489935137732,-73.7489563495424,-73.7487310863818],"lat":[40.7809564388987,40.7808701945074,40.7808723237316,40.7807647797125,40.7805977464647,40.7804831496097,40.7803711481976,40.7802806924042,40.7802403803011,40.7802043128513,40.7800730041559,40.7799393671786,40.7798487754299,40.7798390799295,40.7797151246166,40.7795885935177,40.7794620777116,40.7793833080643,40.779202513643,40.779197941014,40.7791719181275,40.7791149975083,40.7790575748072,40.7790454699236,40.7790356925626,40.7790641251622,40.7789949481553,40.7788946949004,40.7788563333472,40.7788631435491,40.7789034965974,40.7788890833555,40.7790408839114,40.7790348515836,40.7788775040246,40.7787728718799,40.7785702063297,40.7784920573996,40.7783830426862,40.7783447947828,40.7783751693193,40.7783483746775,40.7783063799621,40.7782623368105,40.7782260499727,40.7781974586995,40.778151547051,40.7780637800022,40.7779931564075,40.7778748423383,40.7778366439611,40.7778288487003,40.777758291439,40.7777086562823,40.7776820595021,40.7776533298367,40.7775711819502,40.7774968670172,40.7774415251108,40.7773673276451,40.7773271888701,40.7773439942823,40.7773272091997,40.7773061615549,40.7772411724766,40.7771668310235,40.7771534495623,40.7771838858137,40.7772848627385,40.7773173489964,40.7773688901661,40.7774567017071,40.7775768388125,40.7776513297833,40.7777084680355,40.7778516545951,40.7779412169603,40.7780576473178,40.7781529839861,40.7782083534961,40.7782847004389,40.7783497610996,40.7783727826833,40.7784206389009,40.7784550750372,40.7785265422736,40.7786227462094,40.7788228413038,40.7788765728966,40.7788799501145,40.7788938199884,40.7789292991212,40.7789184427689,40.7789790009927,40.7789824603823,40.7788642642773,40.7787461079614,40.7785816792705,40.7785174430158,40.778356432681,40.7782490813512,40.7782202103651,40.7781699258035,40.7780051436468,40.7779192668156,40.7778228757671,40.7777766137021,40.7776661160962,40.777619749801,40.7775630145575,40.7775166689648,40.7774024297759,40.7772807944984,40.7771770688057,40.7770985063066,40.7770092114872,40.7769628554641,40.776869872662,40.7768125353349,40.7767588021321,40.776662224846,40.7765978124634,40.7766333746431,40.7767120300766,40.7769018192438,40.7769983549138,40.7771340056859,40.7772376586057,40.7773842590815,40.7774521006444,40.7775125955839,40.7775587854443,40.7776194479271,40.7776834953801,40.7776120286998,40.7774870475212,40.7774398159434,40.7774229155015,40.7774561535222,40.7775109386268,40.777549004433,40.7776275806377,40.7776587350261,40.7776826020904,40.7777326431414,40.7780041037167,40.7780589027202,40.778123246439,40.7781684317049,40.7781825123506,40.7781728424125,40.778172696295,40.778255459126,40.7783050613291,40.7783622939819,40.7783872225299,40.7784045328892,40.7783913404438,40.7784313740201,40.7784789411197,40.7785263925082,40.7785415075083,40.7785699762874,40.7785901047824,40.7782411534161,40.7771022454265,40.7766947104985,40.7763897044495,40.7762087953964,40.7760136691673,40.7757041430727,40.7755731579013,40.7747935857324,40.7743309613431,40.7725271787593,40.7719544343677,40.7713021427098,40.7708151144791,40.7703456867535,40.7697668703074,40.7693796333054,40.7687790301227,40.7680850628287,40.7674646250229,40.7662391177369,40.7656842956555,40.7653149779241,40.7648231895878,40.7647601592888,40.7646477158382,40.7645873521461,40.7645321905059,40.7644764035055,40.7641926055928,40.7617818115222,40.7602427097405,40.7600606159987,40.7599355703866,40.7598377308309,40.7598267478674,40.7598088089902,40.7597828650221,40.7596607143073,40.7596582791953,40.7595255140197,40.7593112115204,40.7590820756754,40.7588716921729,40.7587832370366,40.7586664369445,40.7584505604206,40.7583724994122,40.758160821513,40.7578972586201,40.7576168355581,40.7572937891688,40.7571115258158,40.7569792084914,40.7566580805462,40.7564275043306,40.7563985948905,40.7561384666047,40.7560698974494,40.7554967031379,40.7549201892485,40.7546005240278,40.7544335381729,40.7542176709969,40.753947599497,40.753790845185,40.7537214379596,40.7534690887281,40.7534568116676,40.7529081483262,40.7527218443301,40.7527075918191,40.752291720602,40.752174355186,40.7519158778128,40.7517135882693,40.7516230921697,40.7513416042427,40.7510295673998,40.7506268946116,40.7503874833239,40.750082150822,40.7496937286457,40.7493811671894,40.7490447070445,40.7485120923062,40.7481970805566,40.7476328690356,40.7473909592462,40.7472737998128,40.7467163958914,40.7465619144726,40.7461881245902,40.7455848364248,40.7453641582395,40.7448883758843,40.7438189627454,40.7437714334179,40.7436945764047,40.7428131842682,40.7427825014306,40.7427476283125,40.7423515985612,40.7418088441,40.7416962195012,40.7410504010433,40.7407154477009,40.7403764358186,40.7400921232972,40.7397464791752,40.7394744746668,40.7390360895513,40.7388669013292,40.7384818975084,40.7369387463049,40.7368603610405,40.7367820094244,40.7360864083399,40.7354565515303,40.7340110302484,40.7334043180213,40.7329272200849,40.732477150644,40.7321936537058,40.7319387409959,40.7317910511832,40.7314011962218,40.7302990688401,40.7297467500573,40.7292212943939,40.7289950387789,40.7288176983399,40.7283680781811,40.7283265024008,40.7282800322624,40.7281123435807,40.727908985978,40.7277524406117,40.7276012935542,40.7274556294987,40.727315531504,40.7272010455232,40.7270421482329,40.7267154406002,40.7264302603588,40.726270754933,40.7262464107945,40.7262294326618,40.7262728959838,40.7263057848626,40.7263558121672,40.7271068514865,40.7273624071146,40.7281584118185,40.728307611567,40.7287944142644,40.7290475344412,40.7295382907013,40.7302405411147,40.7306835738072,40.7311511921359,40.7316686396683,40.732114664552,40.7324675205314,40.7325331267391,40.7325442834415,40.7326546728048,40.7327529552508,40.7328641168479,40.7329128725579,40.7340856997238,40.7344677423728,40.7347345589718,40.7352621626723,40.7360039606939,40.7361816951815,40.7363636253029,40.7365475010895,40.7367309819523,40.7369116801443,40.7370873264227,40.7372558362195,40.7382617079325,40.7391684115849,40.7406726268385,40.7424373457594,40.7432581550272,40.7435672716866,40.7436522585927,40.7437484301853,40.7438548526521,40.7439703628017,40.7440935792063,40.744222968236,40.7455263553193,40.7457227427204,40.745776226174,40.7455222048845,40.7452203090864,40.7447379136895,40.7442510355007,40.7442215225215,40.7441916253791,40.7441795155559,40.7441597313636,40.743884845222,40.7437892494286,40.7437043961096,40.7436304626194,40.7435676012212,40.743515899643,40.7434533366434,40.7433568425023,40.7433335887637,40.743325647164,40.7433176661759,40.7429864891389,40.7429081226516,40.7427293105529,40.7425916631466,40.7425056067887,40.7424195413359,40.7423622505907,40.7423199933991,40.7422164053246,40.7421155489653,40.7418483056439,40.7417413598523,40.74159935688,40.741368529938,40.7411106793814,40.7408667486418,40.7408529864632,40.7408417760526,40.7406179583688,40.7403682781607,40.7403257146845,40.7401263377529,40.7398947039536,40.7396498394492,40.73940358109,40.7391797328983,40.7391677614787,40.7391518812423,40.7389500622674,40.7387482308308,40.7384936727728,40.738376374998,40.738336140698,40.7382823581914,40.738325326189,40.7384389476447,40.7384166431246,40.7385523064316,40.7385934199823,40.7399866857629,40.7400978006675,40.7400980347206,40.7400982780954,40.7402128351253,40.7402130432953,40.7402132420445,40.7403300337513,40.7403301864092,40.7403303489093,40.7404476010363,40.7404478623968,40.7404481241979,40.7405644860259,40.7416955066349,40.7419330351485,40.7421352216096,40.7421353716756,40.7421355239413,40.7423483498933,40.7423484254631,40.7423485005303,40.7425714113005,40.742571467124,40.7425715241403,40.7428035272237,40.7428036877632,40.7428038576829,40.7430442361737,40.7432642904056,40.7434955687911,40.743736707076,40.7437368813976,40.743737045852,40.7439869420689,40.7442440948066,40.7442443464862,40.744244607082,40.7445076382147,40.7447375679011,40.7447377484306,40.7447379378598,40.7449700217062,40.7452030909198,40.7452034318154,40.7452037573372,40.7454369542153,40.7456693704682,40.7456695318148,40.7456696943572,40.7459001592616,40.7464026828165,40.747211928463,40.7475993302079,40.747704478333,40.7484222272169,40.7486473267049,40.7487816637053,40.7491374666713,40.7495879814058,40.7498551213338,40.7506213192936,40.7512750458755,40.7519881445332,40.7527026753188,40.7535630113391,40.7533427010099,40.7530848127209,40.7530704482596,40.7533951609421,40.7555017211948,40.7576433408061,40.7577561937756,40.7591494775036,40.7607641279613,40.760822527218,40.7611853370067,40.7615135266284,40.7615968308279,40.7622953428512,40.7631420081823,40.7646211916861,40.7671494936249,40.7687770947849,40.7693924069925,40.7694838399384,40.7695569007771,40.7703812726859,40.7709766894677,40.7716493070118,40.772041698361,40.7729749632613,40.7737875273617,40.7739900420079,40.7742386555859,40.7742748884656,40.7745730947092,40.774687326249,40.7748486906747,40.7749005918048,40.7750753573296,40.7753178924042,40.7755577466778,40.7756460798116,40.7758127749039,40.7760405100573,40.7761412251906,40.7761682592347,40.7761902191018,40.7762888230571,40.7766660361785,40.777387046691,40.7776641699192,40.7779123920832,40.7781604165531,40.7784095832878,40.7786123726146,40.7793233661236,40.7801869518334,40.7806131514076,40.7809481422011,40.7811254518184,40.7814268719043,40.781869696526,40.7819018918519,40.7819400652649,40.7819966438441,40.7820797939407,40.7812977084519,40.7807819579814,40.7805328323341,40.7804505919967,40.7798768249122,40.7796348722008,40.7796202841132,40.7796359591975,40.7795896404421,40.7795016376427,40.779444179191,40.7797828756607,40.7798668286119,40.779931470526,40.7800704289944,40.7800862341583,40.7799183160521,40.779899581154,40.7797794339434,40.7798124586984,40.7797835055899,40.7797490277504,40.7797403412719,40.7796670547509,40.7797423371454,40.779396821242,40.7792520615438,40.7787455689545,40.7782990346607,40.7779946939159,40.7776555408665,40.7769377532915,40.7768448411092,40.7766952139655,40.776172594166,40.7758430543308,40.7757411863253,40.7754669597865,40.7750670069326,40.7746033280921,40.7737990387231,40.773340474352,40.7730285203453,40.7728299899402,40.7725172231501,40.7712206617706,40.7703959650743,40.7700226427234,40.7697659334573,40.7696168208548,40.7694851869315,40.7690958316268,40.768723256713,40.7686363887858,40.7684537863381,40.7683343285159,40.7681826527254,40.7680382872365,40.7679493344011,40.7677675238723,40.767653890656,40.7675492261534,40.7673571700355,40.7671990674481,40.7670753295456,40.7669464279496,40.7669699190069,40.7671067561338,40.7671666723585,40.7670698075666,40.7669520008923,40.7668232543414,40.7667976826061,40.7666503291596,40.7665142227676,40.7665101494332,40.7665060408956,40.7665018720526,40.766497641203,40.7664864925561,40.7664746475203,40.7664388489277,40.7664253664106,40.7663861952588,40.7663728348211,40.7663663937376,40.7663610496119,40.7663599976431,40.7663587106794,40.7663574682609,40.7663562705559,40.7663551180182,40.7663540090485,40.7663529370582,40.7663519086117,40.7663509260249,40.7663499781002,40.7663490753689,40.7663473939675,40.7663458735873,40.7663445055206,40.7663423776563,40.7663407212651,40.76634035993,40.7663376497125,40.7663357452595,40.7663347930804,40.7663352029743,40.7663378819601,40.7663434045519,40.7663518487009,40.7663637061534,40.7663704109361,40.7663796360682,40.7663906112129,40.7664023334739,40.7664105162213,40.7664644212102,40.7664122934621,40.7663655804165,40.7660932521389,40.7655328927883,40.7655291124655,40.7653493539646,40.7653074508247,40.7653069509386,40.7653492928971,40.7653421293731,40.765335721143,40.765304631483,40.7651153319596,40.7650682278446,40.7650304384263,40.7649716227856,40.7648688071037,40.7647758153476,40.7646926596566,40.7646387131555,40.7645506040567,40.7644331635333,40.7643400607503,40.7642909696538,40.7642025993948,40.7641343170454,40.7641000171946,40.7640362055233,40.7639493796232,40.763894066012,40.7638304185151,40.7637276980909,40.7636249637963,40.763502871086,40.7633612636982,40.763204381551,40.7629977275337,40.7628965016646,40.7625738618255,40.7623625023046,40.762232442439,40.7621117666607,40.7620039009152,40.7619174102501,40.7619028506697,40.7618404719478,40.7618038387369,40.7617636713363,40.7616857258662,40.7616625092607,40.7616811277414,40.761742422088,40.7616788158594,40.7615121726566,40.7614285535739,40.7613366452073,40.7612441167673,40.7611927905867,40.7609643423171,40.760927803076,40.7608821405618,40.7608319425781,40.7607681373088,40.7605013697669,40.7602960998588,40.7602380865391,40.7601421762591,40.7600387088588,40.759953984862,40.7598571961874,40.7598100554444,40.7597140141478,40.7596223574021,40.7595390344068,40.7594437292117,40.7593391476885,40.7592235421436,40.7590592448176,40.7590190923328,40.7589738230079,40.7589012333103,40.7587996634589,40.7586989079363,40.7586091830818,40.7585715566233,40.7585281106309,40.7584667418989,40.7583940656427,40.7583129684493,40.7582677218775,40.7582671133484,40.7582096652798,40.7581242212091,40.7580353011069,40.7579771265956,40.7579685508582,40.757949655989,40.7579385098534,40.7579350844553,40.7579316603522,40.7579282362508,40.7579248177726,40.7579231063738,40.7579213969466,40.7579196891947,40.75791798027,40.757914564766,40.7579111530352,40.7578830003903,40.7578437626607,40.7578335225235,40.7578249858654,40.7578173009392,40.7578138842626,40.7578104651151,40.7578044792204,40.7577967849059,40.7577745414492,40.7577437402339,40.7577189280607,40.7577095136157,40.7577069461988,40.7577052323263,40.7576975231602,40.7576889518562,40.7576855209947,40.7576829441826,40.7576795010789,40.75767949613,40.7576777735279,40.7576769006884,40.7576768833583,40.7576785440758,40.7576793822585,40.7576819335211,40.7576929806484,40.7576989289042,40.757725281641,40.7577354864194,40.7577542080311,40.7577916623108,40.7577967718719,40.7578027361452,40.7578342702229,40.7578402325209,40.7578453346441,40.7578495825549,40.7578521227167,40.7578538093299,40.7578537994176,40.7578537919784,40.7578529273508,40.7578520657046,40.7578503529936,40.7578486366322,40.757836644817,40.7578272261805,40.757822089357,40.7577732980425,40.7577553221084,40.757711652411,40.7576388687431,40.7576208922858,40.7576106194222,40.7575755255038,40.7575524065665,40.7575421249389,40.7575326913868,40.7575103819579,40.7575069441101,40.7574888999096,40.757479456404,40.7574691697927,40.7574588886455,40.757448612773,40.7574374868425,40.7574084067692,40.7573989955448,40.7573553554636,40.7573211095196,40.757298842231,40.7572722873228,40.7572688602009,40.7572671449919,40.7572619970184,40.7572448334427,40.7572396861372,40.7572371100658,40.7572283846226,40.7572199638788,40.7572131021704,40.757212245471,40.7571985321841,40.7571839753041,40.7571762718087,40.7571685724814,40.7571565992729,40.7571394948427,40.7571283783319,40.7571052841392,40.7570941651396,40.7570873243229,40.7570804866622,40.7570505796846,40.7570471630077,40.7570403253482,40.7570343357523,40.7570317701284,40.7570300574024,40.7570283466582,40.7570266327574,40.757024058358,40.7570223356754,40.7570197408665,40.7570171261511,40.7570145213817,40.7570136542235,40.7570119328573,40.7570102126602,40.7570076407434,40.7570050708134,40.75698878705,40.7569716570438,40.7569305563643,40.7568997373927,40.7568911758672,40.7568869011713,40.7568834785092,40.7568774923987,40.7568740757217,40.7568715132559,40.7568663883242,40.7568612663849,40.7568399378502,40.7568390856252,40.7568339631836,40.7568288412461,40.7568245703579,40.7568177389881,40.756805781875,40.7567972402663,40.7567750326196,40.7567408592185,40.7567075395243,40.7566955849027,40.7566836340853,40.7566810741109,40.756672542964,40.756661453829,40.7566401775703,40.7566132407421,40.7566085716147,40.7566000275165,40.7565581049774,40.7565572427926,40.75655130414,40.7565512020708,40.7565486152052,40.756546886361,40.7565460216857,40.7565578858326,40.7565826441605,40.7566304480649,40.7566911147806,40.7566945339487,40.7567346952877,40.7567406774241,40.7567757100229,40.7568175696494,40.7568440536697,40.7568918911217,40.7569072723864,40.7569226597988,40.7569380515265,40.7569525971795,40.7569671491338,40.7569748571218,40.7569752176824,40.7569825669316,40.7569877087881,40.7569962777875,40.7570245641608,40.7570314217354,40.7570357055742,40.7570536927837,40.7570870829757,40.7571213235584,40.7571392908459,40.7571871868352,40.7571991675115,40.757204304879,40.757209444236,40.757237728541,40.757238587725,40.7572608854053,40.7572695304729,40.7572780327757,40.7572814643719,40.7573097693248,40.7573166280407,40.7573354861253,40.7573500441561,40.7573620322657,40.7573663124248,40.7573894264695,40.7574065419911,40.7574476131635,40.757465581717,40.757479277565,40.7574921278269,40.7575058336075,40.7575204003795,40.7575221167535,40.7575238344425,40.7575255557839,40.7575264229155,40.7575299258402,40.7575325175995,40.7575333847296,40.7575359566219,40.7575376743074,40.7575402447229,40.7575882033002,40.7576327357487,40.7576515808122,40.757690121676,40.7577055313723,40.7577235023559,40.7577628577153,40.7577842458724,40.7578047804887,40.7578475686916,40.7578741072401,40.7578963743921,40.7579135171087,40.7579160894878,40.7579178071574,40.7579212486236,40.7579229848152,40.7579238667934,40.7579230418228,40.7579205054465,40.7579171135535,40.7579128661413,40.7578882001035,40.7578694710745,40.7578319994433,40.7578209312173,40.7578141251051,40.7578115775013,40.7578098809565,40.7578081855905,40.7578081979698,40.7578082078757,40.7578082177829,40.7578090794215,40.7578099428693,40.7578133768799,40.7578185191411,40.7578296535995,40.7578587582984,40.7578972860362,40.7579135472177,40.7579280927191,40.7579357865358,40.7579434813561,40.7579793710638,40.7579870653793,40.7579904875086,40.7579939084632,40.7579973325672,40.7579999019532,40.7580033260541,40.7580058989199,40.75800933787,40.7580110579937,40.7580119226057,40.7580119275546,40.7580213791101,40.7580548140228,40.7581504695632,40.7582529538047,40.7583409128492,40.758427131977,40.7585388591155,40.7586266275469,40.7587615004493,40.7589119191463,40.759024799277,40.7591505715463,40.7592908727012,40.7594501740359,40.7595274218228,40.7596012908741,40.7596828261139,40.7598790339378,40.7599766873548,40.7599816166627,40.7600656341216,40.7601563009175,40.7602238794377,40.7603086432933,40.7604687264758,40.7606116487699,40.7607263772803,40.7608384654184,40.7608503879479,40.7608954010843,40.7609472898789,40.7610212321813,40.7610950781508,40.761185671199,40.7612500833107,40.7613265305989,40.7613861845873,40.7614364849921,40.7615105291918,40.7615680254852,40.7616680536324,40.7616682585068,40.7616732753304,40.7615707635731,40.7615975268074,40.7615797470829,40.761540213373,40.7614781697673,40.7614067814246,40.7613777443254,40.7614398886086,40.7614975308269,40.7615379741041,40.7615760827397,40.7616404648094,40.7617569201395,40.7618349494158,40.7619154748216,40.7620591188232,40.7621979440518,40.7623007349987,40.7624060664095,40.7625224951399,40.7626294690689,40.7627616943668,40.7629490405715,40.7630385592112,40.7631608261247,40.7633157300872,40.7634391913064,40.7634927592685,40.7635287003539,40.763536296081,40.763536325761,40.7635363950111,40.7635578741964,40.763561191742,40.7635615786365,40.7636518273688,40.7638058610685,40.7639325933217,40.7640344387642,40.7641115012113,40.7641406164291,40.7641671590047,40.7642209609138,40.7642705784018,40.7642989588961,40.7643537502352,40.7644187655857,40.7644820374659,40.7645273769187,40.7645420183028,40.7645507637702,40.7645799740406,40.7646459042241,40.764722944412,40.7647666976778,40.7648172274352,40.7648719642767,40.7649531825268,40.7650378119553,40.7651019522589,40.7651323463595,40.7651607221497,40.7651866923857,40.7652671140945,40.7653339455862,40.7653573683082,40.7653866372661,40.7654160544221,40.7654451458213,40.7654608947978,40.7654617535724,40.7654649811413,40.7654729034094,40.7654810552465,40.7654900541771,40.7654945100613,40.7654948817354,40.765496499328,40.765496750923,40.7655029429957,40.7655313460686,40.7655459529275,40.7655682400767,40.7655947970563,40.7655974707719,40.765620476467,40.7656401977814,40.7656436353853,40.7656446503192,40.7656462201327,40.7656524899683,40.7656599879563,40.7656642850016,40.7656653446931,40.7656677210993,40.7656856981797,40.7656890596235,40.7657130705894,40.7657182002365,40.7657210524714,40.7657250264957,40.7657514653551,40.7657532192811,40.7657565939973,40.7657592839904,40.7657617152123,40.7657979838548,40.7658010774502,40.765838750025,40.7658730433347,40.7658939217003,40.765904788363,40.7659070475427,40.7659099504229,40.7659158905134,40.765921140389,40.7659221410273,40.7659237256305,40.7659261977507,40.7659271548024,40.7659760370176,40.7659880597496,40.7660112796862,40.7660215906174,40.7660370300148,40.7660550197258,40.7660755589198,40.7661166203891,40.7661337229899,40.7661366271246,40.7661533769104,40.7662174192256,40.7662177234961,40.7662404825673,40.7662426743013,40.7662609962574,40.7662789655468,40.7662959945901,40.7662995330519,40.7663109693242,40.7663192615354,40.7663195588803,40.7663381653142,40.7663521662906,40.7663562221447,40.7663605321586,40.7663639913183,40.7663804375577,40.7663839738103,40.7663856068328,40.7663916286327,40.7663935229703,40.7664130960324,40.7664362475637,40.7664590798811,40.7664602307089,40.7664850471282,40.7665894067102,40.7666421879627,40.766720285366,40.7667721495094,40.7667801685122,40.7667887591051,40.7668640194164,40.7668965415614,40.7669299361227,40.7669633525805,40.7669967803397,40.767010507354,40.7670251010369,40.7670310140922,40.7670852472239,40.7670975136632,40.7670998414017,40.7671144209162,40.7671623954451,40.7671803725709,40.7671882768134,40.7671983276247,40.7672476884731,40.7672701298059,40.7673039867316,40.7673317167,40.7673539483466,40.7673889794655,40.767429105167,40.7674293820322,40.7675331067874,40.7676637478064,40.7678478032742,40.7679910514697,40.7680157641974,40.7680211041545,40.7680277004587,40.7680473145482,40.7680694963785,40.7680933902343,40.7681207048277,40.7681292423278,40.7681505843192,40.7681803689904,40.7682086536177,40.7682260943705,40.7682325605953,40.7682475373202,40.7682539020514,40.7682614266156,40.7682999908544,40.7683187717331,40.7683189364102,40.7683238971604,40.7683273258946,40.7683281668701,40.7683332948539,40.7683365765644,40.7683384269524,40.7683423151214,40.7683478340407,40.7683683697615,40.7683702964776,40.7683786334519,40.7683822635717,40.7683829067261,40.7683853772567,40.7683871798299,40.7683875894224,40.7683914507122,40.7683957185353,40.7683999880341,40.7684010792372,40.7684042524559,40.7684085171736,40.7684127778253,40.768413618355,40.7684204408066,40.768442574811,40.7684441182715,40.7684468349568,40.768451096779,40.7684518407028,40.7684545062797,40.7684587722112,40.7684809607014,40.7685067195552,40.7685330352923,40.768548270148,40.7685552202149,40.7685625856558,40.7685782538455,40.7685953107336,40.7686048868535,40.7686098003728,40.7686208728354,40.7686269150011,40.7686319381214,40.7686381502255,40.768640433598,40.7686453341673,40.7686472190958,40.7686476351352,40.7686514402372,40.7686522734128,40.7686522470923,40.7686513732361,40.7686491451193,40.7686487294072,40.7686487248763,40.768648710258,40.7686487087074,40.7686487078657,40.7686495446506,40.7686498770302,40.7686537777379,40.7686541825773,40.7686546193076,40.7686597150044,40.7686610749229,40.7686690706146,40.7686799400149,40.7686809828916,40.76868540472,40.7686903504688,40.7686997216598,40.7687079957766,40.7687099470614,40.7687193261032,40.768729561082,40.7687389478113,40.7687447108778,40.7687483400486,40.7687512283404,40.7687534632513,40.7687551707841,40.7687577358549,40.7687611627026,40.7687637178881,40.7687649509953,40.7687662846359,40.7687688518895,40.7687714210335,40.7687731364687,40.7687762155545,40.7687774246179,40.7687808652345,40.7687834540353,40.768783461527,40.7687834636131,40.7687843369797,40.7687843578309,40.7687843615661,40.768784359966,40.7687839676727,40.7687752614047,40.7687728429977,40.7687728501729,40.7687733958143,40.7687737132781,40.768774154631,40.7687754384455,40.7687774579236,40.7687788723644,40.7687831569284,40.7687861510793,40.7687874426623,40.7687925766515,40.7687951438976,40.7687985622882,40.7687990992058,40.7688011254205,40.7688030649927,40.7688036891033,40.7688076914519,40.7688182074407,40.7688413245263,40.7688591999979,40.768936072187,40.7689399778644,40.7689437595733,40.7689496568795,40.7689523083421,40.7689882183539,40.7689922626574,40.7689959076308,40.7690018024892,40.7690035980757,40.7690386098216,40.7690787362084,40.7691649533019,40.7691936146079,40.7692212885239,40.7692286772584,40.7692366591801,40.7692511768507,40.7692617144271,40.7692742410627,40.7693027922334,40.7693229480324,40.7694066972216,40.7694126595123,40.7694314528377,40.7694510979883,40.7695048999532,40.7695603953176,40.7695817439344,40.7696048086506,40.7696273944281,40.7696347103237,40.769645109163,40.7696774290877,40.7697090439607,40.7697286427959,40.7697415229467,40.7697834067998,40.7697970833894,40.7698029197889,40.7698611915911,40.7698721570052,40.7698817081929,40.7698996635496,40.7699244694891,40.7699612671666,40.770028017197,40.7700805584376,40.770675053602,40.7709981546533,40.770981876686,40.7709700643021,40.7709450139564,40.7709855264944,40.7710172788762,40.7710054671624,40.7710221527438,40.7711518901893,40.7711866873914,40.7712825090925,40.771448699263,40.7715291259227,40.7715996804131,40.7716421353499,40.7716574387015,40.7717132289948,40.771831118261,40.7718307130066,40.771834906487,40.7718402668492,40.7718360785589,40.7718356709611,40.7717191746934,40.7717375115199,40.7717979152607,40.771870737752,40.7720412716422,40.7721303365339,40.772201766666,40.7723383770385,40.7723831213692,40.7724194655041,40.7724548872761,40.7725044314936,40.772570217951,40.7726316350122,40.7726946161293,40.7727695571326,40.7728626848093,40.7729591743141,40.7730564483266,40.7732078472609,40.7732722018087,40.7734899134641,40.7736648847328,40.7738222384132,40.7738668796444,40.7739729788297,40.7740555609262,40.7741457301085,40.7742243374328,40.7742724680917,40.7743062090752,40.7743967250921,40.7744694065534,40.7745108554909,40.7747104741482,40.7749174833217,40.7750446790469,40.7751185180931,40.7751299580397,40.7751842356672,40.7752668303653,40.7754195483559,40.7755491935454,40.7756290234276,40.7756839507017,40.7757067490442,40.7757189760408,40.7758362844872,40.7758551973224,40.7758779192365,40.7758985957846,40.7759376828401,40.7759912101342,40.776061197071,40.7761106048599,40.7761394116477,40.7761893221208,40.776246542711,40.7763125465628,40.7763773237428,40.776407195475,40.7764589308561,40.7764980708303,40.7765436732141,40.7765884219023,40.7766006791852,40.7766376161509,40.7766984471819,40.7767074476953,40.7767649857811,40.7768298461225,40.7768504719679,40.7768728308197,40.7768963995164,40.7769206265882,40.7769449451592,40.7769614698545,40.7769770874122,40.7769914967751,40.777004420176,40.7770157250146,40.7770247378237,40.7770438033628,40.7772016773563,40.7774669862017,40.7774850484619,40.7775074746918,40.7776130205784,40.7776190323056,40.7776357443254,40.7775839461739,40.7775841445225,40.7777040483642,40.7777008812502,40.7776535159125,40.777635995922,40.7776516158717,40.777688876766,40.777701797197,40.7777178122007,40.7777361446061,40.7777695079676,40.7777895957508,40.7778100608605,40.7779468701495,40.7779921062945,40.7781251565385,40.7782626939807,40.7784061114899,40.7784176159148,40.7785179351691,40.7785585160299,40.7785949594477,40.7786329632882,40.7786729692575,40.7787152922898,40.7789717412588,40.7790245689871,40.779146728652,40.7793841432376,40.7796038793947,40.7797626105804,40.7797787102639,40.7802340023881,40.7808660751885,40.7812894895222,40.7815180842781,40.7817810900659,40.7818712159459,40.7819997839284,40.7821174283092,40.7822350212694,40.7822813294286,40.7823382786307,40.7823523311301,40.7825287306358,40.7825981640434,40.7826272637828,40.782627027855,40.7826031213021,40.7824658923865,40.7823992748795,40.7823373118294,40.7822279674127,40.7821365738284,40.7820176121247,40.7819361384454,40.7818966443156,40.7817805942377,40.781535698341,40.7814183079516,40.7812765366669,40.7811857392725,40.7810665292255,40.7809564388987]}]],[[{"lng":[-73.746943206382,-73.7469397001251,-73.7469047397856,-73.7468779125462,-73.7468280291083,-73.7468085185123,-73.7467738977573,-73.7467945086395,-73.7446210730149,-73.7445149239263,-73.7440259471514,-73.7439906316605,-73.7443211473035,-73.7471166625671,-73.7474602099074,-73.7476038169861,-73.7477533982256,-73.7479087752626,-73.7480697628182,-73.748236168919,-73.7484077951259,-73.7515738419136,-73.7528415105018,-73.7541108667463,-73.7546575813913,-73.7574546223855,-73.7579393745807,-73.76277911964,-73.7635989728986,-73.7640629014157,-73.7641777017885,-73.7647545539745,-73.7656689709815,-73.7662800826662,-73.7666959390493,-73.7668759760595,-73.7672056655397,-73.7673909708656,-73.7677065346624,-73.7681199793464,-73.7683274016358,-73.768951778703,-73.7689965406991,-73.7689911301614,-73.7690490402092,-73.769743641745,-73.770286208232,-73.7721062607331,-73.7744768829416,-73.7745447294383,-73.7746032624106,-73.7752530803675,-73.7757740384892,-73.7759426865885,-73.7761158019386,-73.7762931311092,-73.776474414498,-73.7766593867108,-73.7768477768636,-73.7770393092753,-73.7772337035326,-73.7774306750304,-73.7776299353881,-73.7781347923249,-73.7782791535562,-73.7784216493244,-73.7785620757681,-73.7787002319852,-73.7788359205605,-73.7789689472066,-73.7790991216144,-73.7792262575534,-73.7793105067034,-73.7793694751359,-73.7829039833809,-73.7839398185867,-73.7841565762977,-73.7850251380631,-73.7861847037956,-73.7875117799428,-73.7881167984523,-73.7898434719976,-73.7899075998327,-73.7899673676853,-73.7900598003176,-73.7905783251857,-73.7911891908512,-73.7919946470631,-73.7925643312553,-73.7939431779478,-73.7952263042856,-73.7958191481579,-73.795890798775,-73.7964149265147,-73.7970129189816,-73.7976123758087,-73.7978588167746,-73.7998195446255,-73.801220509571,-73.8018004962112,-73.8018866747649,-73.8020320768996,-73.8018364641517,-73.8017029793769,-73.8016826655336,-73.8016057923137,-73.8015284675928,-73.8002640083731,-73.8000083910058,-73.7998270573683,-73.7993087296479,-73.7986684478486,-73.7981196214381,-73.7975311711846,-73.7969869082699,-73.7963786015381,-73.7958739653934,-73.7952869811172,-73.7949477091976,-73.7938312466941,-73.7930598086958,-73.7900299374484,-73.7894808966139,-73.7881416092969,-73.7875280945621,-73.7869186855416,-73.7868787584367,-73.7863041589221,-73.7859075824703,-73.7850689960425,-73.7844108856223,-73.7836648051584,-73.7824122428447,-73.7816168987204,-73.7803166723924,-73.7796624332781,-73.7792131093037,-73.7789686627138,-73.7784156101092,-73.7776921443559,-73.7769771393288,-73.7761539799492,-73.7752740919794,-73.7752069524185,-73.7744510767558,-73.7734358668527,-73.7722939722367,-73.7718800034976,-73.7715329052512,-73.7710884528857,-73.7701748198214,-73.7669902341904,-73.7662096331377,-73.7654426628721,-73.764403391469,-73.7634780225603,-73.7628615716047,-73.7625834337871,-73.761966576912,-73.7616801228422,-73.759971165375,-73.7590282767345,-73.7580419575247,-73.7579564366485,-73.7579189293433,-73.7576312961815,-73.757316927804,-73.7569953336142,-73.7567160246846,-73.7566845473024,-73.7564373429195,-73.7564062123614,-73.7564247873451,-73.7564612722833,-73.7564837456172,-73.7564638829438,-73.7563623925967,-73.7561823385891,-73.7560622901594,-73.75581771087,-73.7557616922747,-73.7556364696883,-73.7556223647356,-73.7554939240218,-73.7552345780572,-73.7548490967056,-73.7541785694589,-73.7539939508953,-73.7537259608402,-73.7534560422091,-73.7532868997966,-73.7532381712931,-73.7532105785222,-73.7526829098727,-73.7524705986931,-73.7522582861939,-73.7518040921566,-73.7515421552228,-73.7512579347298,-73.7510302062257,-73.750557614059,-73.7502561578794,-73.7500899113111,-73.7494454676422,-73.7488460144439,-73.7485699309448,-73.7475517543229,-73.7472861763531,-73.7462434557995,-73.7459533209743,-73.7451048500096,-73.7448795153754,-73.7448461056506,-73.7448792323999,-73.7453309842404,-73.7457314650401,-73.7460220095442,-73.7461815788437,-73.7464936723342,-73.7468190925791,-73.7471243688162,-73.7474186795521,-73.7477301211579,-73.7480407369862,-73.7483288087051,-73.7486428636018,-73.7489509461727,-73.7492501392002,-73.749556079175,-73.7498552299581,-73.7501552293658,-73.7504705818291,-73.7507743583769,-73.7512124697011,-73.7513702073877,-73.7513982866851,-73.7518426986276,-73.7523096398835,-73.7524596548407,-73.7531839938608,-73.7535751213263,-73.7536066185572,-73.7537083455682,-73.7540102453054,-73.7540478395502,-73.754075409734,-73.754353618376,-73.7547007835067,-73.7558887802178,-73.7572567144309,-73.7583272860686,-73.7591282421315,-73.7591950051836,-73.7594414294101,-73.7593851050134,-73.7586756908226,-73.7579743023855,-73.7572855504249,-73.7565465244302,-73.7557712100535,-73.7549691946279,-73.7540914239924,-73.7543963402084,-73.7546881382104,-73.7548784341632,-73.7550016504758,-73.7551681397904,-73.7555548669492,-73.7556625068433,-73.755908472002,-73.7561856596602,-73.756612219805,-73.7567032923354,-73.7566365811251,-73.7565525339654,-73.7561259878482,-73.7552758438404,-73.7544222251128,-73.754064692594,-73.7538070928292,-73.7534971274941,-73.7531916268874,-73.7528907647338,-73.7525947100116,-73.752219141375,-73.7519241349113,-73.7518423828998,-73.7517767991304,-73.7510675391817,-73.750810669395,-73.7504829564986,-73.7498098750692,-73.7491718855846,-73.7479342385097,-73.7474969286838,-73.7473312659008,-73.7470453150768,-73.7467214036271,-73.7461625945476,-73.7455536803748,-73.7447241770073,-73.7429478585603,-73.7422843119843,-73.7415894454279,-73.741516368396,-73.7414462859306,-73.7401695182886,-73.7398699553434,-73.7397224415904,-73.7393315136078,-73.7390121035239,-73.7385717593228,-73.7381604798647,-73.7375103806105,-73.736858942342,-73.7356078673722,-73.7353950876422,-73.7343696590925,-73.7337548485368,-73.7337063066621,-73.7336646151422,-73.732416946137,-73.7323273171628,-73.7322691805635,-73.7310646188084,-73.7306280183626,-73.7304313463387,-73.729931691068,-73.729646192304,-73.7295344898019,-73.7291459381016,-73.7290667097408,-73.7289618301044,-73.7287195280344,-73.7286220742307,-73.7284917856987,-73.7283779840264,-73.728253810495,-73.7280535563183,-73.7278840110042,-73.7277135618633,-73.7273788914016,-73.7270938962406,-73.7267773946019,-73.7266652997626,-73.7264147213715,-73.7260296634162,-73.725829888901,-73.7250944536574,-73.7250684805801,-73.7247582308592,-73.7238445185635,-73.7238269889925,-73.723518672625,-73.723441354726,-73.7232667341128,-73.722993013251,-73.7227970316873,-73.7226454352784,-73.7224109479736,-73.7220707143631,-73.7218028921022,-73.7217633963702,-73.7216135707177,-73.7215963147849,-73.7214587026136,-73.7212117612937,-73.7211100148293,-73.7209651171016,-73.7206331939909,-73.7203159529136,-73.719982969885,-73.719677323078,-73.7195646072074,-73.7191790962089,-73.7189705036507,-73.7187778771528,-73.7183197181875,-73.717672370657,-73.7168544044493,-73.7161384267906,-73.716125282335,-73.7149821402296,-73.7145568590179,-73.7142628773707,-73.7135182810599,-73.7133254207879,-73.7124494073072,-73.7108576899832,-73.7105449972654,-73.7078253863159,-73.7052712831666,-73.7034678191636,-73.7027349563764,-73.7021784167989,-73.7016938696175,-73.7016334589238,-73.7016221220492,-73.701347159168,-73.7011731654869,-73.7009012741335,-73.7008934002784,-73.7007796080665,-73.7005816403768,-73.7002922217535,-73.7000214039664,-73.7000090632127,-73.7000202043722,-73.7003183517693,-73.7008114709626,-73.7014707303812,-73.7020603635669,-73.7022808419969,-73.7026879452597,-73.7033149095269,-73.7035224902264,-73.7039446307764,-73.7046011435119,-73.7049953626658,-73.7052216576233,-73.7058473475467,-73.7064802819995,-73.7070997014254,-73.7076621730599,-73.7085694901585,-73.7104310957422,-73.7104999536207,-73.7105628561628,-73.7141039116818,-73.7149694480979,-73.7158797192858,-73.7161876827716,-73.716494081335,-73.7167986891995,-73.7171012819096,-73.7174016363839,-73.7176995314177,-73.7179947475078,-73.718287067127,-73.7203862725068,-73.7211926564569,-73.7217965885372,-73.7220463736031,-73.7225787930546,-73.722911703067,-73.7229571206864,-73.7229623344239,-73.7231516352961,-73.7234275402812,-73.7241967547207,-73.7245451879786,-73.7246342252152,-73.7247179242095,-73.7249016098383,-73.7250848905787,-73.7256719695944,-73.7264755945474,-73.7273282651796,-73.727971573862,-73.7281623392121,-73.7284960063421,-73.7288238352312,-73.7291443534112,-73.7294561427539,-73.7296518689654,-73.7297578845232,-73.7300483090278,-73.730326289681,-73.7303013197867,-73.729661031931,-73.7292418979373,-73.7291762951544,-73.7288375738651,-73.7285695153224,-73.7285529549538,-73.728522365303,-73.728501524541,-73.72736801316,-73.7273596177661,-73.7271887622913,-73.7269852021198,-73.7269714678306,-73.7269651552445,-73.7269000418874,-73.7268948748132,-73.7270469655292,-73.7269613562645,-73.7268949772598,-73.726835252952,-73.7267775953371,-73.7267284122114,-73.7267896122916,-73.7267130259289,-73.7266540915015,-73.7265443505858,-73.7265245222049,-73.7265114745604,-73.7265026929626,-73.7262625434881,-73.7262583124994,-73.7262588645552,-73.7262025974276,-73.7261749510041,-73.7261633831879,-73.7259961634151,-73.7259409855958,-73.72593196243,-73.7259263557322,-73.7258433000573,-73.7257978794231,-73.725801478934,-73.7258626418236,-73.7259066006047,-73.7258236759901,-73.7257985891968,-73.7257541912711,-73.7256873676077,-73.7256300511969,-73.7258410619058,-73.7260111608917,-73.7261946499739,-73.7262401352831,-73.7262943711882,-73.7263572690502,-73.726428723535,-73.7265431731976,-73.7267140299966,-73.7269938310577,-73.727141342039,-73.727440804587,-73.7275335842069,-73.7275561629064,-73.727535003023,-73.7277905018081,-73.7278835862699,-73.7279257285026,-73.7279998924634,-73.7281725558933,-73.728241311454,-73.7282221704064,-73.7282662078571,-73.7282727225497,-73.7282191195836,-73.7281425203863,-73.7281135139662,-73.7278578721934,-73.7278748669398,-73.7278090071723,-73.7277702925448,-73.7278335231988,-73.7278139239344,-73.7278175101589,-73.7283307187596,-73.7281528159182,-73.7280460790485,-73.7279312441149,-73.727591759063,-73.7272080203123,-73.726809786504,-73.7264443867425,-73.7262113990278,-73.7260287591169,-73.7259268774099,-73.7256623724025,-73.7255676977041,-73.7255497654665,-73.7255025907249,-73.7249847077882,-73.7250556911956,-73.725099345821,-73.7252260810702,-73.7264979017956,-73.7302865297218,-73.7305145730104,-73.732072630971,-73.733982598807,-73.7351350147231,-73.7367350863663,-73.7390448213143,-73.7414370597636,-73.7414389090016,-73.7414397962678,-73.7414476004277,-73.7414681120082,-73.7414852360659,-73.7416225820903,-73.7416614125175,-73.7420508488679,-73.7414227931496,-73.7422738722592,-73.7412590006758,-73.740331032634,-73.7395575963179,-73.7394712156082,-73.7398692139203,-73.7399595750441,-73.7400039041414,-73.7401745811947,-73.7402046119024,-73.7406594030945,-73.7406709619267,-73.7406651846279,-73.7407734904741,-73.7407622431204,-73.7407515090692,-73.740750476529,-73.7409092787867,-73.7408979578286,-73.7409699367394,-73.7409775478105,-73.7410355185554,-73.7410359964018,-73.741003435741,-73.7410090731667,-73.7410204905788,-73.7410306862775,-73.740945561025,-73.7409280442394,-73.7409091774957,-73.7409101985234,-73.7408049484004,-73.7407946528372,-73.7407742254765,-73.7407878120011,-73.7414432917507,-73.7414308992635,-73.7414442854066,-73.741412905495,-73.7414354507909,-73.7414567175553,-73.7414758845376,-73.7414882775369,-73.74164684545,-73.7417062098291,-73.7416959670253,-73.7416847342001,-73.7416434249556,-73.7416392535392,-73.7415583574047,-73.7415598513444,-73.7415063164798,-73.7415114017934,-73.7414888710594,-73.7414647372992,-73.7414872680117,-73.7415026099907,-73.7415439289615,-73.7415244372028,-73.741552589378,-73.7415637294683,-73.7416261580928,-73.7416145738256,-73.7416220849282,-73.74163696338,-73.7416979942779,-73.7416929626455,-73.7417018845614,-73.7417158227484,-73.7417693079242,-73.7417586535676,-73.741770383121,-73.7417986132242,-73.7417850007896,-73.7417716622889,-73.7417016314134,-73.7417193582408,-73.7417689924356,-73.7417877532228,-73.7417896065014,-73.7419170377674,-73.7419098324408,-73.7419225120595,-73.7419109274655,-73.7418874648509,-73.741881465982,-73.7419556483044,-73.7419630432563,-73.7419306601783,-73.7419389367889,-73.741976493114,-73.7419801789604,-73.7420284407194,-73.7420766353897,-73.7421239244825,-73.7421694852639,-73.7422125250678,-73.7422767203175,-73.7423382667307,-73.7423960557314,-73.7424490464192,-73.7424962843171,-73.7425369185639,-73.7425510506016,-73.7425615555178,-73.7425681401769,-73.742570620835,-73.7425689282673,-73.7425631097004,-73.7425533274947,-73.7425398546144,-73.7425230670106,-73.7425034331309,-73.7424836789464,-73.7424648811645,-73.7424476082519,-73.7424323825623,-73.7424196645394,-73.7424630864548,-73.7424730954828,-73.74250233638,-73.7424849758185,-73.7424591859473,-73.7424611762322,-73.7424272333788,-73.7423880051053,-73.7423654773219,-73.7424158673349,-73.7423912395264,-73.7424290274014,-73.7424366556818,-73.7425532913056,-73.7425853984359,-73.742436380205,-73.7424012521536,-73.742399294471,-73.7424075245044,-73.7424271766669,-73.7424223472874,-73.7423834350799,-73.7423660384749,-73.7423134040803,-73.7422968334174,-73.7423786223836,-73.7423929367299,-73.7424206531476,-73.7423721539235,-73.7423473268347,-73.7423728426177,-73.742328901186,-73.7422982525127,-73.7422590391429,-73.7422275132439,-73.7422530548094,-73.7422614237258,-73.7422455500211,-73.7422116912842,-73.7421642532747,-73.7421098248828,-73.742048615461,-73.7419808604497,-73.7419068204723,-73.7418530830867,-73.7417746111471,-73.741794933132,-73.7417499694806,-73.7417319335768,-73.7415876770313,-73.7416244759344,-73.7416202275854,-73.7415791197198,-73.741474570602,-73.7414935305285,-73.7414690191478,-73.7415030390689,-73.7415262790633,-73.7415509289841,-73.7415053877831,-73.7414831548753,-73.7414964246262,-73.7414606873598,-73.7414175218352,-73.7413972337303,-73.7412495918248,-73.7412573590277,-73.7412347149689,-73.7412898566471,-73.7412862665105,-73.7412320879926,-73.7411678073531,-73.7412181885352,-73.7412138500331,-73.7411614857111,-73.7411458666319,-73.7411881532555,-73.7411810066354,-73.7411374012685,-73.7410230900335,-73.7411179417445,-73.7411024469396,-73.741023775441,-73.7409787082064,-73.7409648768637,-73.7410942192873,-73.7411298950691,-73.741152784543,-73.7411730649558,-73.7411864435453,-73.7412009538615,-73.7412165879649,-73.7412333509219,-73.7412534595919,-73.7412907868505,-73.741303724911,-73.7413056658438,-73.7413182551544,-73.7413361518615,-73.7413484588492,-73.7413540421292,-73.7413596484625,-73.7413674833128,-73.7413719561146,-73.7413797936212,-73.7413829865628,-73.7413876439164,-73.7413966168832,-73.7413999840108,-73.7414022304511,-73.7414134617801,-73.741416831555,-73.7414202000014,-73.7414224420314,-73.7414246838416,-73.7414448634185,-73.7414538271192,-73.7414627914776,-73.7414851899293,-73.7415086956139,-73.7415814251785,-73.7416082861063,-73.7417224688215,-73.7418769647214,-73.7418904030561,-73.7419374796424,-73.7420249012169,-73.7421111981674,-73.7421974852488,-73.7422837706004,-73.7423879718548,-73.7424944092758,-73.7426041971993,-73.742716218246,-73.7427296630337,-73.7427644549706,-73.7428935019613,-73.7430236561582,-73.7431010700437,-73.7431807217734,-73.743261488907,-73.743344495219,-73.7435051766006,-73.7437388410157,-73.7439712849624,-73.7440381545062,-73.7437853783844,-73.7436606468547,-73.7435238926192,-73.7435222623819,-73.7435635500901,-73.7436474653792,-73.7436661124192,-73.7437342150463,-73.7437661835955,-73.7437868490737,-73.7438314892824,-73.7438464584798,-73.7440245088548,-73.7440280479543,-73.7440299754129,-73.7440256493742,-73.7440161136874,-73.7439662797157,-73.743959374556,-73.743956632636,-73.7439839192313,-73.7440357225226,-73.7440418353233,-73.7440451978797,-73.7440620216782,-73.7440786978076,-73.7440809439553,-73.744090803119,-73.7441122930937,-73.7441247678697,-73.7441832781468,-73.7441678709716,-73.744156297643,-73.7441577313485,-73.7442212441808,-73.7442633351235,-73.7444589673922,-73.7445050310441,-73.7445308373114,-73.7445532889307,-73.7445735039669,-73.7445813692433,-73.7445892362508,-73.7446027348112,-73.7446162416366,-73.7446500203473,-73.7446939616317,-73.7447289188652,-73.7447311719971,-73.7447323048636,-73.7447334562662,-73.7447323636809,-73.7447279674387,-73.7447279935795,-73.7446758574121,-73.7446865794609,-73.7447013059634,-73.7447037925836,-73.744674329365,-73.7447089599057,-73.7447138760467,-73.7447955814851,-73.7448389621327,-73.744712755117,-73.7447344746421,-73.7447427138136,-73.7447596472962,-73.7447799364705,-73.7448035844102,-73.7448114594325,-73.7448204516396,-73.7448406769869,-73.7448653806855,-73.7448923163628,-73.7449327040973,-73.7449685938785,-73.7450011098689,-73.7450302490283,-73.7450425730113,-73.7450560111387,-73.7450828745754,-73.7450833479325,-73.7451007854298,-73.7451175790956,-73.7451276632475,-73.7451366254048,-73.7451455936865,-73.7451466706037,-73.7451534451759,-73.7451635391132,-73.7451725195586,-73.745194969668,-73.7452257881081,-73.7452878075687,-73.7453095005182,-73.7453199080694,-73.745332330702,-73.7453445714967,-73.7453854460565,-73.7454006004633,-73.7454140881389,-73.7455320565953,-73.7456342919627,-73.7456713808442,-73.7457354656979,-73.7457613197752,-73.7458669503776,-73.7459220305851,-73.7459782539319,-73.7460063772045,-73.7460322562672,-73.746054775689,-73.7460735938911,-73.7460739313466,-73.7461014404632,-73.7461221412761,-73.7461435306222,-73.7461655987984,-73.7461883356296,-73.7462117333876,-73.7462365281768,-73.7462638571203,-73.7462921900067,-73.7463629009629,-73.7464308689639,-73.7464954765697,-73.7465561368644,-73.7466122987885,-73.7466807350242,-73.7467426908613,-73.7467631910028,-73.7467793619223,-73.7467907463806,-73.7467970224756,-73.7467980127441,-73.7467936891803,-73.7467841740285,-73.746769736327,-73.7466521856608,-73.746589869372,-73.7464818105477,-73.7464597351529,-73.7464539430192,-73.7463502037371,-73.7462067513302,-73.7461947212191,-73.7461388861924,-73.7461491720659,-73.7460362068704,-73.7459865386328,-73.7459674618141,-73.7457196111918,-73.7455363073641,-73.745492264095,-73.7454548133547,-73.7452713864293,-73.7452712998674,-73.7452379014123,-73.7452428031345,-73.7452448951909,-73.7451937774935,-73.7451681335059,-73.7451588677508,-73.7451621997371,-73.7451918200666,-73.7452161722481,-73.7452347922802,-73.7452473253772,-73.7452535327296,-73.7452537152606,-73.7452547324771,-73.7452576164886,-73.7452623022219,-73.7452686839502,-73.7452766176783,-73.7452859243923,-73.7452963940982,-73.745379805586,-73.7456731600425,-73.7455105825175,-73.7456650449018,-73.7457189569518,-73.7460201512612,-73.7461430025018,-73.7461572623632,-73.7461715382572,-73.7461854820224,-73.7461987535973,-73.7462110293141,-73.7462220097922,-73.7462887893466,-73.7463510240964,-73.7463578508616,-73.7463814839672,-73.7464089339532,-73.7464395090182,-73.7464470959582,-73.7464533957863,-73.746458322692,-73.746461686227,-73.7464828988755,-73.7465099920016,-73.74654231124,-73.7465719956633,-73.746608864082,-73.7466523971926,-73.7466790757272,-73.7467337866924,-73.7467816254318,-73.7468353068622,-73.7468939276613,-73.7469028739713,-73.7469142713771,-73.7469278054907,-73.7469431029851,-73.7469597418926,-73.7469772632443,-73.7469951837302,-73.7470100137691,-73.747023004408,-73.7470338408574,-73.7470422605277,-73.7470480593921,-73.7470510969311,-73.7470512995372,-73.7470509125495,-73.747042018701,-73.7470248493986,-73.7469998513829,-73.7470110239015,-73.7470378910967,-73.7470683485385,-73.7470668324994,-73.7471205352314,-73.7471363137449,-73.7471578161476,-73.7471492449572,-73.7471543585771,-73.7471301991938,-73.7471040262248,-73.7471215426247,-73.7470665547415,-73.7470648567124,-73.7470283632631,-73.7470062844618,-73.7469939119096,-73.7469998065659,-73.746943206382],"lat":[40.637529202177,40.6375542352153,40.6376319804351,40.6377479226099,40.6377836043961,40.6378006088721,40.6378532354732,40.6378716951649,40.6394461872735,40.6398622237486,40.6411537997528,40.6412470695419,40.6415831142638,40.6443718457897,40.64471575568,40.6448494288012,40.644979245241,40.6451050501743,40.6452266935595,40.6453440303174,40.6454569205046,40.6472593012057,40.6479793389674,40.6486976651584,40.6490120966032,40.6505813522893,40.6508533039385,40.6536219366957,40.6540909013783,40.6543562668311,40.6544215005823,40.6547468966045,40.6552534688908,40.6555782154991,40.655802847503,40.6558299853118,40.6558568305942,40.6558381686998,40.6557308884535,40.6556101976931,40.6556001151361,40.6556703691068,40.6556786357565,40.6557144745297,40.6557265855447,40.6559482547964,40.6562320931192,40.657478486007,40.6589018281002,40.6589381796209,40.6589699922588,40.6593200441285,40.6595671739484,40.65965855631,40.6597449586683,40.6598262545276,40.6599023248673,40.6599730583171,40.660038351381,40.6600981083457,40.6601522417218,40.6602006722528,40.6602433290318,40.6603590931561,40.6603945798054,40.6604341985495,40.6604778927086,40.6605255997728,40.6605772514111,40.6606327737113,40.6606920872454,40.6607551071615,40.6607856705753,40.6608118444399,40.6623853557278,40.6627828314206,40.662908590548,40.6634210723975,40.6636095530448,40.6638252434728,40.6639058808683,40.6641359922341,40.6641445380632,40.6641532888246,40.6641669075752,40.6642433008384,40.6643332337139,40.6644392769414,40.6645142759682,40.6647023883246,40.6648774254888,40.6649556274503,40.6649634816834,40.6650209300159,40.665073247268,40.665112528433,40.6651259895878,40.6652592619759,40.6652760575563,40.6652504410463,40.6652489173924,40.6652480253324,40.6658810937387,40.6662640702941,40.6663223525709,40.6663191854131,40.6663167738154,40.6662733954771,40.6662633605444,40.6662562369716,40.6662390891618,40.6662193926456,40.6662021767147,40.666183726289,40.6661711588822,40.6661642763963,40.6661564200896,40.6661577008222,40.6661622830918,40.6661805771446,40.6661932040816,40.6663276983717,40.6663676516217,40.6664785904247,40.6665294051331,40.6665855418631,40.6665898095678,40.666651220509,40.6666936091536,40.6667851046506,40.6668569048781,40.6669242770384,40.6670289866888,40.6670755227508,40.6671763718263,40.6672201318224,40.667250182699,40.6672665349925,40.6673035219654,40.6673519029135,40.6673907212974,40.6674354051205,40.6674540983191,40.6674555244903,40.6674715765186,40.6674599271148,40.6674468130344,40.6674249481372,40.6674053395036,40.6673893541188,40.6673154637619,40.6669716151109,40.6668781962599,40.6667864028128,40.6666720415289,40.6665702043647,40.6665023599371,40.6664717483847,40.6664038544264,40.6663723248568,40.6661842055746,40.6660804032886,40.6659702256372,40.6659554033968,40.6660125616196,40.6664511566071,40.6670403158804,40.6677412685644,40.6685625268752,40.6687585221339,40.6696663787421,40.6703729149189,40.6706335640968,40.6710940315838,40.6714898663732,40.6716840025685,40.6724292371103,40.6733723831302,40.6741968599303,40.67575274273,40.6758859094205,40.6762151785818,40.6762584734758,40.6766296731824,40.6772884092449,40.6779288383874,40.6788444857862,40.6790945072142,40.6794574278661,40.6798229563559,40.6800511448316,40.6801168860067,40.6801542881716,40.6808696168608,40.6811805143678,40.6814914114727,40.6824033234907,40.6830460426678,40.6837341259315,40.6842228673682,40.685071682496,40.6856131099465,40.6859234463587,40.6866720220613,40.6874474842651,40.6878037382071,40.6893473366572,40.6897371731037,40.691279444851,40.6916625651026,40.6927829348501,40.6930930777136,40.6931390561153,40.6932071819817,40.6941960574533,40.6950909418837,40.6957564370627,40.6961219259815,40.6967998738387,40.6975254521686,40.6981980346706,40.6988590284427,40.6995531363303,40.7002394336849,40.7008872105622,40.7015869393525,40.7022655651025,40.7029280059931,40.7036134515685,40.7042776917444,40.7049445805243,40.7056399305325,40.7063218369015,40.7073065795755,40.7076819076429,40.7077487195527,40.7088229209535,40.7099533868739,40.7103165636493,40.7120551756148,40.7129922961522,40.7130711226607,40.7133246367383,40.7138349013797,40.7138775399133,40.7139046952291,40.7142629751936,40.7147100533219,40.7162986441314,40.7181386016612,40.7195820898652,40.7206470410294,40.7207358075491,40.7210634437532,40.7210987066722,40.7215998160167,40.7220907361015,40.7225703223631,40.7230876094671,40.7236402158935,40.724159647309,40.7246919062893,40.7249214405119,40.7251111605688,40.7252210409408,40.7252865726764,40.725359040128,40.7255209269319,40.7255774665291,40.7257066612665,40.7258957432521,40.7262079265278,40.7262294326618,40.7262464107945,40.726270754933,40.7264302603588,40.7267154406002,40.7270421482329,40.7272010455232,40.727315531504,40.7274556294987,40.7276012935542,40.7277524406117,40.727908985978,40.7281123435807,40.7282800322624,40.7283265024008,40.7283680781811,40.7288176983399,40.7289950387789,40.7292212943939,40.7297467500573,40.7302990688401,40.7314011962218,40.7317910511832,40.7319387409959,40.7321936537058,40.732477150644,40.7329272200849,40.7334043180213,40.7340110302484,40.7354565515303,40.7360864083399,40.7367820094244,40.7368603610405,40.7369387463049,40.7384818975084,40.7388669013292,40.7390360895513,40.7394744746668,40.7397464791752,40.7400921232972,40.7403764358186,40.7407154477009,40.7410504010433,40.7416962195012,40.7418088441,40.7423515985612,40.7427476283125,40.7427825014306,40.7428131842682,40.7436945764047,40.7437714334179,40.7438189627454,40.7448883758843,40.7453641582395,40.7455848364248,40.7461881245902,40.7465619144726,40.7467163958914,40.7472737998128,40.7473909592462,40.7476328690356,40.7481970805566,40.7485120923062,40.7490447070445,40.7493811671894,40.7496937286457,40.750082150822,40.7503874833239,40.7506268946116,40.7510295673998,40.7513416042427,40.7516230921697,40.7517135882693,40.7519158778128,40.752174355186,40.752291720602,40.7527075918191,40.7527218443301,40.7529081483262,40.7534568116676,40.7534690887281,40.7537214379596,40.753790845185,40.753947599497,40.7542176709969,40.7544335381729,40.7546005240278,40.7549201892485,40.7554967031379,40.7560698974494,40.7561384666047,40.7563985948905,40.7564275043306,40.7566580805462,40.7569792084914,40.7571115258158,40.7572937891688,40.7576168355581,40.7578972586201,40.758160821513,40.7583724994122,40.7584505604206,40.7586664369445,40.7587832370366,40.7588716921729,40.7590820756754,40.7593112115204,40.7595255140197,40.7596582791953,40.7596607143073,40.7597828650221,40.7598088089902,40.7598267478674,40.7598377308309,40.7597301895698,40.7592417042187,40.7581950646408,40.7579910343249,40.7562164043244,40.7547704409511,40.7536833630354,40.7532505168082,40.7528859394974,40.7525368545441,40.7524933291904,40.7524255178912,40.7507805808717,40.7489243021238,40.7471285440806,40.7470572656252,40.7450414538002,40.7431838410859,40.741010602011,40.7394041661773,40.7393234126591,40.7392365417302,40.7389680825816,40.7384391523879,40.7375115609641,40.7364427566659,40.7361257966169,40.7354902222864,40.7345632568835,40.7342079448034,40.7335262617127,40.7325697474278,40.7319705575223,40.7316196302047,40.7306728543998,40.7297112987263,40.7287477145535,40.7278309345095,40.7276364179219,40.7272410619695,40.7272270874133,40.7272188718508,40.7267563359049,40.7266466103683,40.7265419056576,40.7265012269612,40.7264542043534,40.7264008724843,40.726341270653,40.7262754427947,40.7262034374028,40.7261253075361,40.7260411107663,40.7254745543822,40.7252665463892,40.7250860354402,40.7250196114389,40.7248776755337,40.7247939464662,40.7247824481086,40.7247811278044,40.7247332070367,40.7246633508996,40.7244546018606,40.7243600359046,40.7243364479079,40.7243126050022,40.7242544760628,40.724195613601,40.7240376589932,40.723752496388,40.7234119632414,40.7231591164937,40.7230841402854,40.7229907791208,40.7228836426954,40.7227630705237,40.722629528914,40.7225348581448,40.7224835794093,40.7223259148531,40.7221572967849,40.7220945169883,40.7204813842252,40.7193454595995,40.7191672145618,40.7179330185092,40.7169562927702,40.7168959461075,40.716784480638,40.7167055462257,40.7124111316229,40.7123889411133,40.7116926176865,40.7107763116538,40.7107145040335,40.7106607101172,40.7099968309999,40.7099785736194,40.7094987528105,40.7075490875973,40.7058001726043,40.7044056996457,40.7030592919015,40.7021457357555,40.701945452369,40.701446632614,40.7011126588927,40.6989826401661,40.6982580918721,40.697781192633,40.6968860740714,40.69077325317,40.6906108623216,40.6902689278962,40.6889843408107,40.68865003011,40.6884536176983,40.6869320542896,40.6863991053614,40.6863119408171,40.686225208255,40.6850154546012,40.6843538498251,40.684283780773,40.6832410809479,40.6826566051267,40.6816357506113,40.681386692625,40.680945913592,40.6802504548615,40.679587951284,40.6787521263589,40.6780783383318,40.6773855911724,40.6772210797204,40.6770581128022,40.6768969603986,40.676737888915,40.6764867291179,40.6760894619924,40.675438870362,40.675095875342,40.6744287413509,40.6742138636166,40.6741615876874,40.673930284795,40.6714895139628,40.6707964366237,40.6700971480202,40.6694050451439,40.6687174293387,40.6680240975001,40.6673136395573,40.6666062863441,40.6664295920836,40.6659145844532,40.6655143742763,40.6653453144369,40.6650679701841,40.6646951327175,40.6646140933382,40.664064398922,40.6639764374431,40.6632239694781,40.6631167834835,40.6630439437312,40.6624541425041,40.6623989965438,40.6617488351049,40.6610944877359,40.6604223211972,40.6597948561296,40.6591616154238,40.6584788173997,40.657998999374,40.6577313198555,40.6569903430917,40.6567251430814,40.6563922928124,40.6555165155723,40.6542534354056,40.6535078936419,40.6523457483118,40.6520010001475,40.6516635144002,40.6503685226744,40.6503103120065,40.6500874742202,40.6498522098002,40.6497320404669,40.6490998164975,40.6482011803444,40.64688917832,40.6463448439174,40.6460855762732,40.6459417176864,40.6455635270691,40.6452478332446,40.6427160274269,40.6421980616784,40.6414742045242,40.6405033907534,40.6401233814515,40.638897499435,40.6372603009562,40.635862534261,40.6357064318279,40.6352479127237,40.6351438098744,40.6353088647928,40.6352768658441,40.6352644711974,40.6352101791869,40.6352081861939,40.6351869366522,40.6351632000648,40.6351321134422,40.6351356624729,40.6351078316915,40.6350747080653,40.6350503323447,40.6350344066824,40.6350572160167,40.6350489031168,40.6350728201679,40.6350797038188,40.635097978714,40.6350975696916,40.6351175939735,40.6351382741896,40.635092578309,40.6351007971691,40.6351253230733,40.6351471348975,40.6351183016817,40.6351225348311,40.6351610348698,40.6350896707887,40.6350592646738,40.6350562107288,40.6349813118784,40.6349800050886,40.6350551527587,40.6350525158887,40.635082624468,40.6350471547252,40.635037546267,40.6350016904244,40.6349498170619,40.6349565148829,40.6349432815879,40.6349595592063,40.6349738394078,40.6349876571687,40.6350069683067,40.6350101340488,40.6349428893297,40.6349397235923,40.6349754976038,40.634962036699,40.6349119299478,40.6349109210412,40.6349416823386,40.6349328877973,40.6348956927193,40.6348942795678,40.6349289810027,40.6349176810648,40.6348844324586,40.6348823076239,40.6349359816355,40.6349264582781,40.6348813631154,40.6348810326208,40.6349811659342,40.6349829227358,40.6349359375127,40.6349477101437,40.6349971613787,40.6349886662097,40.635021719479,40.6350214036599,40.6349985434066,40.6349721232825,40.6349689360181,40.6349313831271,40.6349331173284,40.6349073713678,40.6348918129038,40.6349207777176,40.6349239219385,40.6349675428519,40.6349608365033,40.6349783571103,40.6349763153541,40.6349791303912,40.6349867532456,40.6349990512952,40.635015810579,40.6350275911969,40.635045814438,40.6350701520654,40.6351001657097,40.6351353147641,40.6351749661218,40.6351906633417,40.635207933688,40.6352262952433,40.6352452356401,40.6352642263582,40.6352827374731,40.6353002524425,40.6353162825208,40.6353303803973,40.6353421526777,40.6353450449,40.6353505005046,40.635358354508,40.6353683693958,40.6353802423061,40.6353910250866,40.6353503053958,40.6353531699606,40.6354325320715,40.6354292585868,40.6353995983056,40.635394361538,40.6354986522527,40.6355542229967,40.6355691171621,40.6356303001268,40.6356395211542,40.6356413815658,40.6354414597271,40.6354533566612,40.6357127551075,40.6356986751598,40.6356978907579,40.6356853182,40.6356552979282,40.6356537483539,40.6356412623409,40.6356961265499,40.6356879844579,40.6357389110572,40.6357677753385,40.6357415133589,40.6357495665948,40.6358165463661,40.6358104972116,40.6357749800512,40.6357625080488,40.6358127076857,40.6358025655278,40.635856619535,40.6358626160374,40.6358648855519,40.6358935127154,40.6358834046583,40.6359704273445,40.6360550423093,40.6361369240508,40.6362157575802,40.6362912396337,40.6363073566081,40.6363798512413,40.63639378438,40.6364272813919,40.6364164473099,40.6365585458405,40.6365841821024,40.6365909631861,40.6365669746057,40.6366699598826,40.6366788835683,40.6367086118072,40.6367270339141,40.6367025454699,40.6367176116631,40.6367665911698,40.6367542599546,40.6367389325504,40.6367175701278,40.6367611516211,40.6367503842924,40.6369397007699,40.6369412102631,40.6369885142914,40.6370038516968,40.6370099902665,40.6369958583894,40.6371282836105,40.6371442186327,40.6371500695435,40.6371337820972,40.6371630690749,40.6371953293686,40.6371993163937,40.6371683392504,40.6372720124605,40.6374681497943,40.6374713318046,40.6373128286458,40.637320231943,40.6373047750301,40.6376463551761,40.63771433358,40.6377428580379,40.6377627068143,40.6377823825753,40.6377994988576,40.6378157624305,40.6378303205812,40.6378491584204,40.6378860331623,40.6378988129185,40.6379004141735,40.6379108030042,40.6379219482723,40.637928808802,40.6379318060611,40.6379348132559,40.637938248139,40.6379416737846,40.6379442534363,40.6379442606174,40.637944271092,40.6379434382132,40.6379425910516,40.6379417418722,40.6379366425788,40.6379349418613,40.6379340947021,40.6379340997438,40.637934104785,40.6379350048949,40.637936733345,40.6379384624659,40.6379453451672,40.6379556476139,40.6379951028817,40.6380079765476,40.6380560661763,40.6381179118832,40.6381222135403,40.6381265895199,40.6381361817234,40.638146625402,40.6381596305152,40.6381734907961,40.6381933699328,40.6382149629478,40.6382399794519,40.6382675633739,40.6382701559817,40.6382616920066,40.6382355009522,40.6382127301581,40.6382009445661,40.6381900181515,40.6381808041427,40.6381724471285,40.6380839724638,40.6379691810837,40.6378800126149,40.6379860766226,40.6384287305723,40.6386471559027,40.6388866326333,40.6388894863748,40.638941682376,40.6389888483481,40.6389959995201,40.639022117664,40.6390203224613,40.6390057112132,40.6389597810222,40.6389553941113,40.6386620060729,40.6386561730462,40.6386529966278,40.638651566853,40.6386484143378,40.6386319394746,40.6386287681849,40.6386203355294,40.6385585575775,40.6384412763244,40.6384354977772,40.6384350946479,40.638433073496,40.6384349210994,40.6384349463694,40.638435058442,40.6383793703115,40.6383470429922,40.6381954225573,40.638191574143,40.638184220332,40.6381805899814,40.6380197043964,40.6379544130468,40.6376551193112,40.6375805334688,40.6375763204861,40.6375695368486,40.6375610399434,40.6375567870952,40.6375516795164,40.6375406056633,40.6375269687977,40.6374903150475,40.6374348914313,40.6373828651147,40.6373803080925,40.6373768938494,40.6373692088256,40.6373615181501,40.637338446656,40.637331613198,40.6373138319929,40.6372957532648,40.6373014045561,40.6372939195113,40.6372851152676,40.6372283902096,40.637228401124,40.6370750290762,40.6370869850748,40.6373070468943,40.637313227016,40.6372940630451,40.6372642048804,40.6372360624566,40.6372096364488,40.6372028204097,40.6371968610807,40.6371858016247,40.637176460397,40.6371696873126,40.6371637976236,40.6371613147025,40.6371613868151,40.637164868189,40.6371674580418,40.6371717593288,40.6371837762824,40.6371839798746,40.6371915035677,40.6371983748125,40.6372001049573,40.6372018332845,40.637202706723,40.6372025921745,40.6372018705632,40.6372010387025,40.6371984965806,40.637191712312,40.6371636305004,40.6371297038506,40.6371165713738,40.6371117553445,40.6371066479205,40.6371018200338,40.6370808826185,40.6370760013694,40.6370674894209,40.6370053975177,40.6369526655613,40.6369296846927,40.6368837022776,40.6368666758214,40.6368054093536,40.6367688013005,40.6367262181369,40.6367023631222,40.6366785038141,40.6366537833517,40.6366294884446,40.6366290549541,40.6366041243626,40.6365794893318,40.63655520009,40.6365312636513,40.6365076954058,40.6364845035449,40.636462655331,40.6364422191115,40.6364372679825,40.6364566468417,40.6364810660684,40.6365103038327,40.6365440945317,40.6365821312022,40.6366475188466,40.6367165545718,40.6367349197784,40.6367556420782,40.6367781355454,40.6368017641739,40.6368258598599,40.6368497412929,40.6368727332195,40.6368941855369,40.6370329902415,40.6371132639232,40.6372004920539,40.6372279786469,40.6372598208813,40.6373292413477,40.637404511645,40.6373996262433,40.6374337854925,40.6374497373783,40.6375218364239,40.6375368445498,40.6375211449612,40.6376523358983,40.6377696312171,40.6377959897852,40.6377986176782,40.6379159012454,40.6379385774692,40.6379617195057,40.6379773878107,40.6379860314231,40.6380091348591,40.6380430926544,40.6380774122521,40.6381121879731,40.6381397702723,40.6381701970209,40.6382028884832,40.638237221772,40.6382725427165,40.6382749047797,40.6382844571613,40.6382937857041,40.6383026799216,40.6383109391273,40.6383183769627,40.6383248256023,40.6383301395408,40.6382924615009,40.638124657428,40.6379438810334,40.6378363259436,40.6378240265713,40.6376438215166,40.637580922902,40.6375818521671,40.6375810788397,40.6375786217798,40.6375745409103,40.6375689357558,40.637561943015,40.6375264008985,40.6374863570571,40.6374792559786,40.6374594486467,40.6374427399799,40.6374295510729,40.637423250769,40.637416175003,40.6374083807278,40.6374001180196,40.637369946015,40.6373426421437,40.6373188658541,40.637271326941,40.6372268018522,40.6371859177214,40.6371629514534,40.6371088749687,40.6370511406719,40.6369932107298,40.6369381293077,40.6369262797345,40.6369157215936,40.6369067461217,40.6368996008991,40.6368944830199,40.6368915336563,40.6368908341635,40.6368989811979,40.6369087828243,40.6369200015303,40.6369323654645,40.6369455750241,40.6369593101153,40.6369732379091,40.6370135675781,40.6370533251495,40.6370914761127,40.6371270277604,40.6371287063577,40.6371327421065,40.6371373188243,40.637143166279,40.6371512410253,40.637058060807,40.6370605235258,40.6371258313464,40.6371263636066,40.6372168608447,40.6372112592413,40.637162275708,40.6371542497343,40.6371609992684,40.6371556731475,40.6371524505643,40.6371506451869,40.637354391911,40.637529202177]}]],[[{"lng":[-73.835900721417,-73.8357035139729,-73.8353995615279,-73.8348761972718,-73.8343772846659,-73.834047919776,-73.8344103057214,-73.8348123068994,-73.8363117940522,-73.8363696429638,-73.836391679472,-73.8365310312022,-73.836573390022,-73.8365763662954,-73.8365856505032,-73.8366260416097,-73.8369232207586,-73.8369448968254,-73.8369509368217,-73.8369679679288,-73.8373661358879,-73.8373827978206,-73.8374029131513,-73.8374093620758,-73.8374296234805,-73.8374402849152,-73.8374520301377,-73.8374571648824,-73.8374668178907,-73.8375010765286,-73.8381154639458,-73.8382490770014,-73.8382842883624,-73.8371470292285,-73.837843159085,-73.838081378743,-73.8381090773705,-73.8381285312553,-73.8381396038401,-73.8381422174135,-73.8381363534196,-73.8381220533075,-73.8380994175054,-73.8380686049643,-73.8378459516089,-73.8373309565426,-73.83696237745,-73.83856418283,-73.8394781524145,-73.8415637809442,-73.8421584479979,-73.8423651228293,-73.8423652895894,-73.8423654433828,-73.8425650701426,-73.8425652600801,-73.8425654377089,-73.8427564879882,-73.8427566424662,-73.8427567833131,-73.8429378956652,-73.8435939812998,-73.8442735217034,-73.8450247287711,-73.8470040531641,-73.8478966979251,-73.8482091285539,-73.849138372429,-73.8507084225627,-73.8510378068372,-73.8541011646925,-73.8544142783975,-73.8544996463028,-73.8543747078542,-73.8538625040373,-73.8533848640604,-73.8528326227881,-73.8527739700244,-73.8527320843455,-73.8527076981109,-73.8527011098125,-73.8527121632538,-73.8527451168608,-73.852835443863,-73.8547879606038,-73.8556742185687,-73.8565718515049,-73.8574444773962,-73.8583307891721,-73.8592849835958,-73.8601636430352,-73.8623683420772,-73.8636865642969,-73.8645570888365,-73.8668143382809,-73.8684051894918,-73.8689176275678,-73.8705140361971,-73.8705545830779,-73.8705739316604,-73.8703416191591,-73.8702112900175,-73.8701174316062,-73.8699033016364,-73.8694786510802,-73.8692700488922,-73.8691505174281,-73.869043054218,-73.8689484527443,-73.8688673074056,-73.8686502416753,-73.8683317597814,-73.8682546171208,-73.8681850269878,-73.8681129138768,-73.8680230761879,-73.8678684597139,-73.8676959937506,-73.8675068605491,-73.8673025313442,-73.8670847383692,-73.8668905494134,-73.8668554454553,-73.8666167732328,-73.8659355955898,-73.8654285679917,-73.8652378763399,-73.8646174232949,-73.8644898364108,-73.8639599298141,-73.8635709250918,-73.8631813516721,-73.8629210432223,-73.8627929587684,-73.8624074743969,-73.8622049653039,-73.8609387576988,-73.8605650630781,-73.8601307335372,-73.8597750087561,-73.8592241210709,-73.8588871191326,-73.8585456206014,-73.8583102747183,-73.8581989070063,-73.8582349496568,-73.8589322439911,-73.8582740576156,-73.8573922105983,-73.8572793404126,-73.8572276271792,-73.8563093401744,-73.8553891051467,-73.8552957150926,-73.8552927590464,-73.8551810971139,-73.8526653541771,-73.8525201905444,-73.8530566390123,-73.8537121987122,-73.8538948015939,-73.8539215421986,-73.8539610547933,-73.854112647798,-73.8547082395536,-73.854699434123,-73.8547165251997,-73.852753706286,-73.8526822571381,-73.8511012167543,-73.850590510987,-73.8504290537064,-73.8495120740421,-73.8493315621403,-73.8491459157301,-73.848957126142,-73.848767252333,-73.8485783880685,-73.8476241018882,-73.8466572411161,-73.8461595844368,-73.8456719821516,-73.8452889856384,-73.8449101116967,-73.844537388464,-73.8441728125617,-73.8438182573482,-73.8435697335957,-73.8434863043221,-73.8432588089117,-73.843146253013,-73.8429909127847,-73.8427189027115,-73.8426306799134,-73.8413393660909,-73.8406915419902,-73.8402420632721,-73.840191993236,-73.8397802516746,-73.8397243990885,-73.8395231273259,-73.8380575612948,-73.8377089419937,-73.83736817904,-73.8370370836197,-73.8370368821731,-73.8370366930364,-73.8367168530655,-73.8367166161094,-73.8367163908027,-73.8364090261818,-73.8364088015291,-73.8364085761741,-73.8361147658281,-73.8360278645999,-73.836005107525,-73.8359770711086,-73.835900721417],"lat":[40.7116413707688,40.7114646345007,40.7111922371615,40.7107231935459,40.7103027602552,40.7100293917755,40.7098464286569,40.7096433509599,40.7088372559869,40.7088915572839,40.7089120393388,40.7090415917049,40.7090832229207,40.7090853554134,40.7090945108954,40.7091343750677,40.7094076351508,40.7094245879593,40.709428224989,40.7094357214998,40.709604945203,40.7096118388699,40.7096201427989,40.7096208660767,40.709620460462,40.7096159923195,40.7096071091837,40.709602451971,40.7095923462805,40.7095493352663,40.7086650885321,40.7084640364838,40.7084093586259,40.7079570462625,40.7069519253094,40.7065620434741,40.7064879826599,40.7064124171869,40.7063358775998,40.7062589012806,40.7061820288086,40.7061057997818,40.7060307493963,40.7059574045712,40.7056295408818,40.7048549764566,40.7042124523322,40.7032969693934,40.7026901943316,40.7011005987176,40.700902563635,40.7008325439617,40.7008324904137,40.7008324281366,40.700750735857,40.7007506548659,40.7007505661518,40.7006577681377,40.7006576953068,40.700657615421,40.7005544292202,40.7001723519251,40.6997805061122,40.6993593770162,40.6988252110124,40.6986003293224,40.6985184085461,40.6982827412019,40.7002031251044,40.7002332854879,40.7005137488268,40.7005436911184,40.7005518549602,40.700420652783,40.6998648552405,40.6992542988145,40.6984077665833,40.6982650980146,40.6981181201147,40.6979685615504,40.6978182549633,40.6976690012452,40.697560750099,40.6975489621307,40.6972966237558,40.697179357049,40.697064691022,40.6969129847168,40.6967437106509,40.6965537112189,40.6963846579409,40.695950143246,40.6956914183774,40.6955204565116,40.6950653508091,40.6947311862439,40.6951465615148,40.6975990705662,40.6976598743711,40.6976889006651,40.6977718562824,40.6978277570425,40.697868012383,40.6979766243612,40.698257905675,40.6984480637176,40.6985835179112,40.6987251460306,40.6988719840545,40.6990230152974,40.699759639585,40.7008241331062,40.7009779599717,40.7010930557246,40.7012043125006,40.701321177326,40.701495006793,40.701660727143,40.7018167769618,40.7019617486236,40.7020944040107,40.7021954664947,40.7022137363015,40.7023189457641,40.7025360879046,40.7026535745541,40.7026977612825,40.7027811816812,40.7027983351115,40.7028120723206,40.70282000485,40.7028117445371,40.702795356548,40.7027872924558,40.7027467860454,40.7027093527079,40.7024848986747,40.7024379260682,40.7024221897877,40.7024450985606,40.7025329459159,40.7026210537247,40.7027477508212,40.7028562524738,40.7029110743658,40.7028328906715,40.7013203447589,40.7012236592381,40.701213978868,40.7012125133222,40.701651719352,40.7018235547299,40.7019769163009,40.7019910096105,40.7025955017877,40.7025832673792,40.7023076309691,40.7022917236176,40.7031370466141,40.7039178878835,40.7041834191978,40.7042246126051,40.7042642171313,40.7044259340715,40.7052109741452,40.7067425546217,40.7067694963278,40.707397147062,40.7074181453227,40.7079009830216,40.7080398834242,40.708087067055,40.708345661375,40.7083883336808,40.7084193204789,40.708438137523,40.708444578931,40.7084387208288,40.7083326229842,40.7083186423409,40.708350820549,40.7084103661249,40.7084766794978,40.7085603313705,40.708661054971,40.7087784213437,40.7089118196223,40.7090196089831,40.7090557752932,40.7091681796368,40.7092234564188,40.7092869276406,40.7093980733765,40.7094329772343,40.7099462343632,40.7101532140614,40.7102619316906,40.7102768294158,40.7103855240801,40.7103987655874,40.7104964514565,40.7109208727847,40.7110364842713,40.7111669287835,40.7113116142325,40.7113117050822,40.7113118036555,40.7114700753335,40.7114701919314,40.7114703162521,40.7116414996779,40.7116416261768,40.7116417697625,40.7118251468743,40.7117490639129,40.7117296715407,40.7117059569769,40.7116413707688]}]],[[{"lng":[-73.915133319182,-73.9150971106472,-73.9150553874018,-73.9149819671475,-73.9149089072476,-73.9148811142976,-73.9148613737012,-73.9148490627048,-73.9148396445783,-73.9148224973119,-73.9147966455588,-73.9147763034479,-73.914758227511,-73.9147368970149,-73.9147271941806,-73.9147090981123,-73.9146936049053,-73.9146813399378,-73.9146593741191,-73.9145744453553,-73.9145518229784,-73.9145317636042,-73.9145187944734,-73.9145100277956,-73.9145022307247,-73.9144879570341,-73.9144730675133,-73.9144484860091,-73.9144106863387,-73.9143022162539,-73.9142751008004,-73.9142566771619,-73.914245349679,-73.9142256135202,-73.9142130074535,-73.9141913886114,-73.9141659222066,-73.9141091490558,-73.9140855711148,-73.9140555096976,-73.9140318838635,-73.9140156926837,-73.913995958737,-73.9139756147861,-73.9139460155849,-73.9139117166535,-73.9138737347761,-73.9138331959138,-73.9137913018271,-73.9137492944507,-73.9137084190775,-73.9136698874435,-73.9136658534681,-73.9136627790999,-73.9136607481348,-73.9136598159296,-73.9136600078929,-73.9136613187929,-73.9136637128994,-73.9136671249584,-73.9136714619699,-73.9136685417355,-73.9136648170473,-73.913660378429,-73.9136553337558,-73.9136498056321,-73.9136439284122,-73.9136378449347,-73.9136317030512,-73.9136256520324,-73.913561806864,-73.9134996167748,-73.913440300483,-73.9133850203874,-73.9133092605195,-73.9132359622219,-73.9131657577768,-73.9130992527758,-73.9130370208962,-73.9129795989523,-73.9129033815855,-73.913847871606,-73.914122348,-73.9143631573804,-73.9147195183528,-73.9150832214209,-73.9154533335453,-73.9158289001943,-73.915944601434,-73.9170698269373,-73.9170403780771,-73.9170339610201,-73.9170276376191,-73.9170287371855,-73.9170400432002,-73.9170390377449,-73.9170290190665,-73.9170226643395,-73.9170237711214,-73.9170269941501,-73.9170147907954,-73.9169930377723,-73.9169759868208,-73.9169589459718,-73.9169291171968,-73.9169024583747,-73.9168918212955,-73.9168795944798,-73.916852448207,-73.9168274673989,-73.9167944025174,-73.9167762265553,-73.9167618179399,-73.9167469028879,-73.9167293501976,-73.9166910012725,-73.9166426187406,-73.9165856373618,-73.9165377373791,-73.9164717388202,-73.9164094258579,-73.916365244573,-73.9163285089401,-73.9162854261934,-73.9162550797345,-73.9162332212097,-73.9162180277741,-73.9162066946854,-73.9161895191418,-73.9161369879014,-73.9161123387012,-73.9160802627422,-73.9160553103666,-73.9160309865432,-73.9160047045846,-73.9159719458552,-73.9159447363411,-73.9159172454699,-73.9158897898531,-73.9158616783661,-73.9157999169683,-73.9157840515783,-73.9157645926605,-73.915756120954,-73.9157518442222,-73.9157240720084,-73.9157078300645,-73.9156938771774,-73.9156611496352,-73.9156038536518,-73.9154990107901,-73.9154695670438,-73.9154494894382,-73.9154348830657,-73.9154131303429,-73.9153872628821,-73.91535428833,-73.9152779635083,-73.9152491567722,-73.9152332859743,-73.91522159402,-73.9152112096578,-73.9151943677029,-73.9151659108836,-73.9151520415639,-73.915133319182],"lat":[40.5862693854007,40.5862665836933,40.58626722046,40.5862692575949,40.586262172972,40.5862576662828,40.586260576051,40.5862657233166,40.5862750683323,40.5862765065944,40.5862715111327,40.5862643107088,40.5862561292348,40.5862528707084,40.58625284709,40.5862495958171,40.5862424083595,40.5862364599992,40.5862304880149,40.5862009375446,40.5861971828063,40.5861993516331,40.5862067173012,40.5862150780366,40.5862231952348,40.5862337614163,40.5862366834395,40.5862371157935,40.5862281450888,40.5861827569063,40.5861711009219,40.5861683428751,40.5861707806863,40.5861724578344,40.5861706999184,40.5861593055107,40.5861402573228,40.5861060914957,40.5860988824993,40.5860953559716,40.586099241398,40.5861041332044,40.5861058098121,40.5860986085748,40.5860757711297,40.5860571430782,40.5860432766428,40.5860345828891,40.5860313195403,40.5860335833371,40.5860413071701,40.5860542620692,40.5860584538249,40.5860630944587,40.5860680574845,40.5860732076288,40.5860784045178,40.586083506504,40.5860883745262,40.5860928759003,40.5860968879355,40.5861010080283,40.5861047320327,40.5861079694413,40.5861106415731,40.586112683485,40.586114045551,40.5861146946676,40.5861146150589,40.5861138086597,40.5861081881798,40.586095825669,40.5860769633916,40.5860519709852,40.586034428581,40.5860116032495,40.5859836918861,40.5859509352593,40.5859136159331,40.5858720558297,40.5858106764392,40.5852318404784,40.5851097007037,40.5850068246937,40.584869066249,40.5847426679417,40.5846279347572,40.5845251540852,40.5846661618891,40.5857369821111,40.5857590048785,40.5857606735291,40.5857704414578,40.5857789572706,40.5857984419045,40.5858142869506,40.5858338277214,40.5858415656729,40.5858460431938,40.5858553844499,40.5858680033358,40.585883109835,40.5858888549998,40.5858905379155,40.5858914359225,40.5858915138125,40.5858976252993,40.585904173222,40.585915235988,40.5859230329885,40.5859206869234,40.5859138259938,40.5859134521851,40.5859139002422,40.5859184384598,40.5859283067923,40.5859475550103,40.5859615197883,40.5859738751461,40.5859935683525,40.5860075824415,40.5860162348491,40.5860297575494,40.5860469525497,40.5860547689704,40.5860481605857,40.5860454025279,40.5860466024858,40.58605173261,40.5860735335853,40.5860850553543,40.5860931016568,40.5861001814842,40.5861112121096,40.5861251956801,40.5861403944575,40.5861459876292,40.5861434401658,40.586133490936,40.586125760817,40.5861174372743,40.5861193651351,40.5861279409429,40.5861395111834,40.5861533128082,40.5861945303147,40.5862068167364,40.5862144233928,40.5862234545083,40.5862279720861,40.5862284028108,40.5862275758392,40.5862309701231,40.5862395610052,40.5862540523723,40.5862527547417,40.5862499615278,40.5862502659655,40.5862558655012,40.5862614960175,40.5862730556338,40.5862814135536,40.5862872892812,40.5862862329423,40.5862778154041,40.5862693854007]}],[{"lng":[-73.9199006433604,-73.9199631960034,-73.9199835610963,-73.9199877139095,-73.9199833296921,-73.9199718826697,-73.9199146361374,-73.9198650516551,-73.9198196741477,-73.9197724993102,-73.919690043808,-73.9196674291977,-73.9196387882034,-73.9195585916136,-73.9195128009455,-73.919485668104,-73.9194634744964,-73.9194367504256,-73.9193981785875,-73.9193569467423,-73.9193310968869,-73.91928832602,-73.9192658578634,-73.9192376961938,-73.919202648972,-73.91917567514,-73.9191585690273,-73.9191477699326,-73.9191424471691,-73.9191411605704,-73.9191359504542,-73.9191274227276,-73.9191157221529,-73.9190990836608,-73.9190822941847,-73.9190712317762,-73.9190561420666,-73.9190359091714,-73.9190170521918,-73.9189964313295,-73.9189739346452,-73.9189614407331,-73.9189494839437,-73.9189416667214,-73.9189345003427,-73.9189278061892,-73.9189230622087,-73.9189238994985,-73.9189317929633,-73.9189393629621,-73.9189446669312,-73.918943347467,-73.9189367403539,-73.9189236534879,-73.9189090103476,-73.9188916996777,-73.9188726171174,-73.9188568793002,-73.9188439458921,-73.9188356158988,-73.9188340934144,-73.9188309929433,-73.9188174828058,-73.9188027532796,-73.9187897589134,-73.9187729061907,-73.9187526297541,-73.9187229202248,-73.918693973028,-73.9186588759807,-73.9186246466749,-73.918601938001,-73.9185943122042,-73.9185880918601,-73.9185809834588,-73.9185740177185,-73.9185676996967,-73.9185602220429,-73.9185479546135,-73.9185248192156,-73.9185162581544,-73.9185010135044,-73.9184587927519,-73.9184567146926,-73.9184602497122,-73.9184655087395,-73.9184735379482,-73.9185086679878,-73.9185139615107,-73.9185151877483,-73.9185139330123,-73.9185095875011,-73.9185056337515,-73.9185015438579,-73.918502023378,-73.9184996222335,-73.918492504028,-73.9184453406403,-73.9184354828305,-73.9184241817476,-73.9183999537187,-73.9183825284197,-73.9183734172165,-73.9183657432805,-73.9183647682736,-73.9183618857569,-73.9183584628583,-73.9183499664369,-73.9183307496015,-73.9182676695605,-73.9182424763975,-73.9182276816967,-73.9182039982093,-73.9181882663925,-73.9181744468988,-73.9181672520988,-73.9181591250102,-73.9181494507976,-73.9181344116776,-73.9181046173185,-73.9180765125408,-73.9180458532651,-73.9179944280496,-73.9179612335588,-73.9179206484543,-73.9178865272079,-73.9178644649358,-73.9178371500943,-73.9177917663746,-73.9177729838564,-73.9177590252434,-73.917739058459,-73.9177305676084,-73.9177162426041,-73.917708719408,-73.9176780486537,-73.9176619593623,-73.9176466643518,-73.9176329168621,-73.9176158979435,-73.9176011471583,-73.9175886636265,-73.9175762556133,-73.9175613302918,-73.9175468708204,-73.9175284169118,-73.9175129083159,-73.9174582784191,-73.9174319344596,-73.9174114240795,-73.917391203015,-73.917371412598,-73.9173521232305,-73.9173285122681,-73.9173030065422,-73.9172521684484,-73.9172208211366,-73.9171859848672,-73.91716367078,-73.9171313562008,-73.9171113486772,-73.9170878537731,-73.9170691090283,-73.9170555782001,-73.9170330131274,-73.9170099056763,-73.9169850318699,-73.9169657041724,-73.9169433896202,-73.9169235969525,-73.9168949456317,-73.9168315915157,-73.9167607519508,-73.9167168437377,-73.9166990656994,-73.9166820470104,-73.9166673346892,-73.9166538808642,-73.9166349221261,-73.9166166053427,-73.9165970641423,-73.9165739938356,-73.9165468516945,-73.9165191703803,-73.9164841350737,-73.9164583891869,-73.9164331858464,-73.9163882090847,-73.9163741320582,-73.9163630452538,-73.9163525369256,-73.9163432903383,-73.9163363508623,-73.9163298768715,-73.9163199519246,-73.916305240902,-73.9162887259239,-73.9162639310834,-73.9162427571722,-73.9162433893739,-73.9162430176174,-73.9162416452983,-73.9162392936179,-73.916236162932,-73.9162337438659,-73.9162320495625,-73.9162310883265,-73.9162308334289,-73.9162298545457,-73.9162281476998,-73.9162257183695,-73.9162225671949,-73.9162203337729,-73.9162171688223,-73.9162130791255,-73.9162080661936,-73.9162021368082,-73.9161950170623,-73.9161871870219,-73.9161786539232,-73.9161694197291,-73.9161594927781,-73.9161493611691,-73.9161385429552,-73.9161270475711,-73.9161148778615,-73.916102040184,-73.9160885433173,-73.9160753817664,-73.916061579456,-73.9160471462615,-73.9160320894245,-73.9160164174995,-73.9160001414593,-73.9159464129425,-73.9159387571534,-73.9159305292407,-73.915921761041,-73.9159124835104,-73.915902736403,-73.9158925528763,-73.9158819735677,-73.9158742440111,-73.9158662261882,-73.9158580060108,-73.9158496764291,-73.9158413264496,-73.9158386715837,-73.9158356839595,-73.9158325350679,-73.9158294027273,-73.915826466914,-73.9158238976761,-73.9158218395281,-73.9158204112406,-73.9158205552971,-73.915821495223,-73.9158231208833,-73.915825244384,-73.915827615491,-73.9158299605389,-73.9158368700923,-73.9158436463508,-73.9158501991813,-73.9158564347081,-73.9158582673622,-73.9158593627109,-73.9158596713739,-73.915859186168,-73.9158570347626,-73.9158540996633,-73.9158503979552,-73.91584594695,-73.9158407698958,-73.9158348937767,-73.9158283482137,-73.9158211648145,-73.9157495649087,-73.9157442437281,-73.9157382183366,-73.9157315335158,-73.9157242417387,-73.9157163954874,-73.9157080516386,-73.915702269334,-73.9156969561004,-73.9156922085774,-73.9156881115206,-73.9156847391282,-73.9156822365428,-73.9156789426851,-73.91567489089,-73.9156701213026,-73.9156646828704,-73.9156586276222,-73.915652016376,-73.9156428210923,-73.9156331073448,-73.9156229298249,-73.9156123403681,-73.915601394993,-73.9155901495026,-73.9155808786541,-73.9155720203294,-73.9155636279037,-73.9155557430992,-73.915548412473,-73.915541676642,-73.9155355744637,-73.9155301357831,-73.9155253952732,-73.9155213755222,-73.9154835100154,-73.9154743509254,-73.9154643275877,-73.9154534489857,-73.9154415129246,-73.915440597078,-73.9154309057264,-73.9154204376922,-73.915409212502,-73.9153857076595,-73.9153630791868,-73.9153413362919,-73.9153297919425,-73.9153174693082,-73.9153043892365,-73.9152905769746,-73.9152760540304,-73.9152608491663,-73.9152509446071,-73.9152418094117,-73.9152334789215,-73.9152259858295,-73.9152193595366,-73.915203472236,-73.9151868563211,-73.915169524737,-73.9151514992188,-73.9151131826698,-73.9150742036665,-73.9150345718736,-73.9150235011752,-73.9150116866197,-73.9149991896976,-73.914986069043,-73.9149805445723,-73.9149756574759,-73.9149714903039,-73.9149681222959,-73.9149396409267,-73.9149301237839,-73.9149200834365,-73.9149095550183,-73.914898577186,-73.9148871894712,-73.9148754333927,-73.9148633509031,-73.9148128494454,-73.9148069635735,-73.9148014723568,-73.9147964961667,-73.9147921362442,-73.9147884894141,-73.9147659796407,-73.9147605046419,-73.9147540575636,-73.9147466796544,-73.914738409529,-73.9147321093824,-73.9147252051043,-73.9147177586143,-73.9147098404172,-73.9147015260729,-73.91469289247,-73.9146840206802,-73.9146749937614,-73.9146636390128,-73.9146524428996,-73.91464147134,-73.9146307882716,-73.9146171990915,-73.9146041646221,-73.9145917393309,-73.9145799789992,-73.9145718507425,-73.9145644494436,-73.9145578203215,-73.9145520024345,-73.9145454071461,-73.9145381280386,-73.9145302096819,-73.9145216979601,-73.9145126475539,-73.9145031109536,-73.9144398539781,-73.9144328871098,-73.9144264104254,-73.9144204621261,-73.9144150810711,-73.9144103001818,-73.9144061486421,-73.9144026538735,-73.9143998351648,-73.9143964915774,-73.9143923996852,-73.9143875750576,-73.9143820242508,-73.914375762396,-73.91436880748,-73.9143643360543,-73.9143606757416,-73.914357857899,-73.914355902671,-73.9143548280045,-73.914354640415,-73.9143560521525,-73.9143565530348,-73.9143561385514,-73.9143548136386,-73.9143526027973,-73.91434954174,-73.9143456837633,-73.9143338212981,-73.9143227817543,-73.91431259103,-73.9143032664485,-73.9142811022045,-73.9142368858917,-73.9142093644515,-73.9141826773458,-73.9141568340093,-73.9141071813744,-73.9140568872103,-73.914005951515,-73.9139725961951,-73.9139385441527,-73.9139037982397,-73.9138976159784,-73.913890571694,-73.9138826763328,-73.9138739503023,-73.9138684451163,-73.913863639445,-73.9138595675168,-73.9138562547672,-73.913853723549,-73.9138334602494,-73.9138289858908,-73.9138237094786,-73.9138176516204,-73.9138108375408,-73.9138033008156,-73.913795071731,-73.9137777075952,-73.9137612701867,-73.9137457832079,-73.9137351992192,-73.9137237195586,-73.913711369236,-73.9136981780982,-73.9136846401943,-73.9136705978066,-73.9136560746553,-73.9136410913766,-73.9136256738906,-73.9136098459133,-73.9136032311758,-73.9135963735642,-73.91358934624,-73.9135822258931,-73.9135750867971,-73.9135680039012,-73.9135610534738,-73.913554307619,-73.913547839105,-73.9135426389074,-73.9135371552201,-73.9135315406026,-73.91352596209,-73.913520576365,-73.9135155420536,-73.9135086014473,-73.9135022555663,-73.9134965693988,-73.9134916033147,-73.9134874130607,-73.9134840400897,-73.9134710012899,-73.9134571250311,-73.9134424358925,-73.9134350503717,-73.9134268875065,-73.9134180078898,-73.9134084778352,-73.91340112506,-73.9133944153961,-73.9133883830795,-73.9133830575126,-73.9133767120794,-73.9133711460206,-73.9133663702874,-73.9133623969313,-73.9133592331667,-73.9133290245016,-73.9133005072446,-73.9132973974194,-73.913293391619,-73.9132885069414,-73.9132827505953,-73.9132761412145,-73.9132568099071,-73.9132498263306,-73.9132420076643,-73.9132333769448,-73.91322395918,-73.9132156874962,-73.9132085417794,-73.9132025487663,-73.9131956958424,-73.913187971035,-73.9131794103295,-73.9131700523504,-73.9131599399014,-73.9131121915665,-73.9131053617516,-73.9130990532032,-73.9130933256427,-73.9130882293434,-73.9130838112728,-73.9130801115832,-73.9130758836964,-73.9130725269445,-73.913070081451,-73.9130685737094,-73.9130680181256,-73.9130684244904,-73.9130634000126,-73.9130667459139,-73.9130707849859,-73.9130754985079,-73.9130808743549,-73.913087482204,-73.9130933817974,-73.913098562115,-73.9131030103757,-73.9131067175354,-73.9131096747697,-73.913111877868,-73.9131141359411,-73.9131135825949,-73.9131121247656,-73.9131097854149,-73.9131066042111,-73.913102632917,-73.9130979349526,-73.9130943311379,-73.9130914823226,-73.9130894150251,-73.913088147192,-73.913087688415,-73.913088045432,-73.9130895484483,-73.9130903025535,-73.9130903041877,-73.9130895546238,-73.9130880566742,-73.9130858142515,-73.913087538186,-73.9130900468537,-73.9130933356168,-73.913097403347,-73.9131022458482,-73.9131078565016,-73.9131175529166,-73.9131188115122,-73.9131191203676,-73.9131184743031,-73.9131168868155,-73.9131143845976,-73.913106722527,-73.9131026758835,-73.9131028841186,-73.9131025649725,-73.9130938986187,-73.9130939124347,-73.9130947197819,-73.9130963091272,-73.9130986507024,-73.9131017026504,-73.9131054101615,-73.9131097063372,-73.9131225174648,-73.9131347279397,-73.9131463249957,-73.9131572947696,-73.9131676238308,-73.9131773007287,-73.9131863140186,-73.913191881288,-73.9131966518519,-73.913200594442,-73.9132036876761,-73.9132059132457,-73.913207253944,-73.913207705307,-73.9132063359221,-73.9132042803229,-73.9132017400721,-73.9131989655922,-73.9131962256316,-73.9131939925759,-73.9131926107232,-73.913192110058,-73.9131924985839,-73.9131937711212,-73.9131982148095,-73.9131983365354,-73.9131976446419,-73.9131961495811,-73.9131938721347,-73.91319084913,-73.913187125533,-73.9131787005045,-73.9131711819525,-73.9131646486788,-73.9131650901921,-73.9131663733328,-73.9131684865953,-73.9131714112151,-73.9131751161308,-73.9131795667644,-73.9131868675545,-73.9131934114305,-73.9131991770285,-73.9132041443037,-73.9132082951852,-73.9132116153452,-73.9132140922044,-73.9132157182404,-73.9132194198597,-73.9132223051983,-73.9132243687204,-73.913225601598,-73.9132260068675,-73.9132255789991,-73.9132243214659,-73.9132222364311,-73.9132193289064,-73.9132183716059,-73.9132166154014,-73.9132140622417,-73.913210715176,-73.9132065796674,-73.9132016603053,-73.9131959645302,-73.9131885487169,-73.9131818913423,-73.9131759985321,-73.9131708761973,-73.9131665319985,-73.9131629711875,-73.9131562860422,-73.9131571916869,-73.9131590075066,-73.9131617277256,-73.9131653368963,-73.9131698145188,-73.9131801117354,-73.9131895739264,-73.9131981900743,-73.9132059526823,-73.9132128555716,-73.9132188879447,-73.9132240477994,-73.9132315492855,-73.9132402751285,-73.91325022047,-73.9132542569776,-73.9132575851122,-73.9132601989085,-73.913262094825,-73.9132632693116,-73.9132637199272,-73.9132634470766,-73.9132631063348,-73.9132618034043,-73.9132595432722,-73.9132563403779,-73.913252206741,-73.9132437178345,-73.9132341121507,-73.913223407446,-73.9132177473899,-73.913211275877,-73.9132040411842,-73.91319610149,-73.9131875151903,-73.9131794390961,-73.9131710340264,-73.9131623509414,-73.9131534476174,-73.9131443756878,-73.9131351973332,-73.9131259670467,-73.9131167430657,-73.9130824906355,-73.9130481519274,-73.9130137579354,-73.9129793367902,-73.912945104797,-73.9129387298094,-73.9129355910524,-73.9129327540294,-73.9129303516168,-73.9129285030382,-73.9129272962904,-73.912926788801,-73.9129270061272,-73.9129279353657,-73.9129295354882,-73.9129512263198,-73.9129819927619,-73.9130089786016,-73.9130466107174,-73.9130980328505,-73.913168871009,-73.913240948823,-73.9132964103566,-73.9133518802411,-73.9134236499027,-73.9134621866577,-73.9134706538551,-73.9134750601911,-73.9134785405969,-73.913485463545,-73.9134901741944,-73.9135184002251,-73.9136344081534,-73.9136748352012,-73.9136958451518,-73.9137118474014,-73.913724730559,-73.9137426196458,-73.9137630134539,-73.9138232370166,-73.9139295519439,-73.9140029265417,-73.914047785409,-73.9140866943562,-73.9141174400444,-73.9142212292127,-73.9142886330383,-73.9143475326265,-73.9143704121119,-73.9143942267779,-73.9144186608707,-73.9144415190664,-73.9144816006691,-73.9145323131109,-73.914565484213,-73.914590776066,-73.914624014063,-73.9146697109434,-73.9147605100271,-73.9147927461738,-73.91482496107,-73.9148434029871,-73.9148543390795,-73.9148662011697,-73.9148786824852,-73.9148943144643,-73.9149074518061,-73.9149262287545,-73.9149694054121,-73.9150103764671,-73.9150529019536,-73.9151707793105,-73.9151917378252,-73.9152020636926,-73.9152062943876,-73.9152105250794,-73.915215240651,-73.9152231845253,-73.9152291606558,-73.9152447830468,-73.9152518012274,-73.9152486453364,-73.9152439083253,-73.9152479539187,-73.9152573297239,-73.9152973505864,-73.9153292343402,-73.9153685946689,-73.9153795065657,-73.9153901027232,-73.9154022898333,-73.9154222915462,-73.9154447907878,-73.9154532060606,-73.915459116394,-73.9154728581765,-73.9154885003045,-73.9154988072588,-73.915505082661,-73.9155207053473,-73.915528501591,-73.9155300466647,-73.9155421872516,-73.9155562281831,-73.9155977337417,-73.9156392327757,-73.9156688715727,-73.9156935197094,-73.9157103619504,-73.9157234585623,-73.9157374988947,-73.9157602880166,-73.9157858862607,-73.9158169348259,-73.9158414740982,-73.9158848745586,-73.9159123378295,-73.9159428273057,-73.9159574117952,-73.9159648596226,-73.9159658410901,-73.9159692050882,-73.9159654848042,-73.9159592077003,-73.9159537599741,-73.9159582069383,-73.9159645302787,-73.915979386829,-73.9159980976627,-73.9160176442525,-73.91603722802,-73.9160499289557,-73.9160567568716,-73.9160595152073,-73.9160592847214,-73.9160569267811,-73.9160548556776,-73.9160608519147,-73.9160727195372,-73.9160923272059,-73.916099873024,-73.9161023777216,-73.9160938932147,-73.9160809079497,-73.9160693358746,-73.9160572985325,-73.9160384929751,-73.9160209498559,-73.9160134886717,-73.9160079652212,-73.9160104692453,-73.9160153600638,-73.9160265475078,-73.9160439629369,-73.9160644019286,-73.9160838712855,-73.9161521689216,-73.9161675669101,-73.9161773450763,-73.9161808957229,-73.9161877245727,-73.9161996703768,-73.9162129517673,-73.9162311972886,-73.9162453771657,-73.9162585043183,-73.9162656238558,-73.916267234314,-73.9162635552359,-73.9162565548598,-73.9162522949776,-73.9162484985649,-73.9162494525181,-73.9162518590549,-73.9162639026074,-73.9162641154821,-73.9162688010084,-73.9162740285169,-73.9162797442124,-73.9162858910001,-73.9163051741629,-73.9163239447399,-73.9163421884635,-73.9163598882041,-73.9163644487019,-73.9163682796309,-73.916371346778,-73.9163736207639,-73.9163750823232,-73.9163757192208,-73.9163739092128,-73.9163729318465,-73.9163727897912,-73.9163734837425,-73.9163734104961,-73.9163740609625,-73.9163754351861,-73.9163775261784,-73.9163803236575,-73.9163838190933,-73.9163879934115,-73.9163948564784,-73.9164010264833,-73.9164064832414,-73.9164112103136,-73.9164151916958,-73.9164320109279,-73.916433427132,-73.9164311311522,-73.9164296158379,-73.9164288946666,-73.9164289749604,-73.9164298561324,-73.9164315288029,-73.916433981612,-73.9164371893554,-73.9164411290223,-73.9164457655144,-73.9164510569141,-73.9164604226293,-73.9164692181128,-73.9164774023079,-73.9164849392117,-73.9164917888687,-73.9164979229781,-73.916503311258,-73.916514281958,-73.9165259237,-73.9165382272735,-73.9165511823696,-73.9165765160747,-73.9166011582466,-73.9166251033997,-73.9166483456092,-73.9166538710308,-73.916660197403,-73.9166673014705,-73.916675159109,-73.9166837450781,-73.9166930304151,-73.9167026701456,-73.9167115691327,-73.9167196869835,-73.9167269912218,-73.9167334533267,-73.9167390463202,-73.9167538892718,-73.9167694648882,-73.9167857624129,-73.9168027697808,-73.916820472506,-73.91683861745,-73.91685613451,-73.9168730155714,-73.9168892463648,-73.9169048159176,-73.9169197123784,-73.9169380100018,-73.9169570690913,-73.9169768797784,-73.9169974304281,-73.9170187162245,-73.917027447896,-73.917036957087,-73.9170472236108,-73.9170582244267,-73.9170699336338,-73.9170823266496,-73.9170953771323,-73.9171090528015,-73.9171324239187,-73.9171564894067,-73.9171812349961,-73.917206648176,-73.9172327137972,-73.9172638046521,-73.9172943095774,-73.9173242197943,-73.9173535256386,-73.9173812292882,-73.9174096723289,-73.9174388503787,-73.9174687513626,-73.9174993636461,-73.9175306793306,-73.9175548643012,-73.9175783820556,-73.9176012216201,-73.9176233788292,-73.9176677944074,-73.9177113184974,-73.9177539464955,-73.9177907224614,-73.9178268959167,-73.9178624629142,-73.9178754355804,-73.9178891965713,-73.9179037116354,-73.9179189397124,-73.9179244513048,-73.9179306933151,-73.9179376066929,-73.9179451227077,-73.9179531651491,-73.9179616525299,-73.9179705018111,-73.9180338397107,-73.9180470399481,-73.9180608211167,-73.9180751610394,-73.9180900364391,-73.9181054244802,-73.9181212985894,-73.9181378407658,-73.9181548033581,-73.9181721606699,-73.9181898786486,-73.9182079300592,-73.9182262852408,-73.9183422119112,-73.9183527028898,-73.9183627920506,-73.9183724145856,-73.9183815199848,-73.918390050926,-73.9183979582236,-73.9184051975258,-73.9184117231716,-73.9184406465941,-73.9184777788562,-73.918481908383,-73.9184867320409,-73.9184922270216,-73.9184983634791,-73.9185051073927,-73.9185124242969,-73.9185202753283,-73.9185286203023,-73.9185374137589,-73.9185454393004,-73.9185538495057,-73.9185625679228,-73.9185715183128,-73.9185806235511,-73.9185898023316,-73.9185989739999,-73.918608060091,-73.9186169805952,-73.918626165461,-73.9186355700652,-73.9186451352712,-73.9186547968997,-73.9186644953832,-73.9186741634711,-73.918683741612,-73.918693167835,-73.9187023779835,-73.9187113151501,-73.9187199191435,-73.9187301734,-73.9187400217425,-73.9187494178239,-73.9187583133268,-73.9187666676261,-73.9187744387818,-73.9187815888108,-73.9188308261616,-73.9188309571888,-73.9188302737738,-73.9188287940674,-73.9188265634709,-73.9188236513251,-73.9188201432295,-73.9188161456412,-73.9188091820489,-73.9188027870882,-73.9187970186111,-73.9187919274469,-73.9187875595847,-73.9187905435465,-73.9187941658632,-73.918798382861,-73.9188031381213,-73.9188083736726,-73.9188140216545,-73.9188200108978,-73.9188459968369,-73.9188714108259,-73.9188962251874,-73.9189005206864,-73.9189051530466,-73.9189100223089,-73.9189150269629,-73.9189200588865,-73.9189250114883,-73.9189297812339,-73.9189345207774,-73.9189400545511,-73.918946330616,-73.9189532803328,-73.9189608366163,-73.9189689227073,-73.9189733008395,-73.9189776565332,-73.918981863209,-73.9189858022234,-73.9189893639569,-73.9189924469415,-73.9189949642266,-73.9189968444786,-73.9189980346156,-73.9189985015639,-73.9189982296095,-73.9189972289799,-73.9189936002051,-73.9189910839742,-73.918989689144,-73.9189914458569,-73.9189940590452,-73.918997492102,-73.9190017033527,-73.9190066315592,-73.9190122172363,-73.9190183839672,-73.9190351853775,-73.9190525979938,-73.919070566677,-73.9190833719594,-73.91909582871,-73.9191078989246,-73.9191195472413,-73.9191307420304,-73.9191414501346,-73.9191516399282,-73.9192066106134,-73.9192279709202,-73.9192498902815,-73.9192723465144,-73.9193499525693,-73.9193584166329,-73.9193674821084,-73.9193771090321,-73.9193872543592,-73.9193978706508,-73.9194089137598,-73.9194203294223,-73.9194320719496,-73.9194409479341,-73.9194495073556,-73.9194576733241,-73.9194653812606,-73.9194725602192,-73.9195104730215,-73.9195266076629,-73.9195434284079,-73.9195609102271,-73.919579157281,-73.9195979408793,-73.919617230049,-73.9196369881096,-73.9196662471378,-73.9196947111286,-73.9197223605453,-73.9197309495241,-73.9197401713007,-73.9197499920642,-73.9197603773394,-73.9197712889186,-73.9197840727537,-73.9197965148699,-73.9198085794588,-73.9198202311605,-73.9198314326298,-73.9198421555407,-73.9198523643165,-73.9198605018809,-73.9198692124716,-73.9198784572209,-73.9198881985773,-73.9198983937115,-73.9199090000145,-73.9199146350249,-73.9199205513129,-73.9199266680247,-73.9199329005616,-73.9199391638788,-73.9199453724822,-73.919951440645,-73.9199572861554,-73.9199628254629,-73.9199679857909,-73.9199721793007,-73.9199766768218,-73.919981375241,-73.9199861683878,-73.9199909448284,-73.9199955960027,-73.9200000175396,-73.9200041072843,-73.9200077707837,-73.9200109261241,-73.920013500638,-73.9200154346267,-73.9200166870847,-73.9200182181476,-73.9200205317017,-73.9200235621523,-73.9200272175156,-73.9200313928329,-73.9200359617981,-73.9200407932588,-73.9200459190937,-73.920051040324,-73.9200559780675,-73.9200605655565,-73.9200646452836,-73.9200680762517,-73.9200695949839,-73.9200702399514,-73.9200699932537,-73.9200688666598,-73.9200668818287,-73.9200640850284,-73.9200615613464,-73.9200597050338,-73.9200585623431,-73.9200581575581,-73.9200585068256,-73.9200595970668,-73.9200614022336,-73.9200638780323,-73.9200669656509,-73.9201009659287,-73.9201040999392,-73.920107808254,-73.9201120085278,-73.9201166102737,-73.9201215117783,-73.9201266053866,-73.9201317816675,-73.9201369243598,-73.9201423578983,-73.9201475550369,-73.9201523762624,-73.9201566897749,-73.920160380496,-73.9201633476475,-73.9201655150817,-73.9201668209448,-73.9201703374823,-73.9201746829112,-73.9201798214724,-73.9201857101547,-73.9201923037431,-73.9201995453721,-73.9202316098719,-73.9202360892332,-73.9202410881835,-73.9202465447943,-73.9202523947115,-73.9202585707198,-73.9202649957051,-73.920271595623,-73.9202764087121,-73.9202813682673,-73.9202863299054,-73.9202911547164,-73.9202957028903,-73.9202998471213,-73.9203034690987,-73.9203143661648,-73.9203258183317,-73.9203377288563,-73.9203433149429,-73.9203489110921,-73.9203544100588,-73.9203597072437,-73.9203646987275,-73.9203692904896,-73.9203733926952,-73.920376926951,-73.9203798241034,-73.92038203105,-73.9204046067784,-73.9204239359154,-73.9204439518029,-73.9204646296263,-73.9204859496263,-73.9204971207856,-73.9205088139806,-73.9205210004454,-73.9205336538252,-73.9205467435925,-73.9205602394343,-73.9205741112581,-73.9205835786957,-73.9205932816222,-73.9206031488417,-73.9206131003666,-73.9206230641104,-73.9206329583144,-73.9206427133015,-73.9206522497142,-73.9206663006935,-73.9206800923513,-73.920693585113,-73.9207067378635,-73.9207195138858,-73.9207318749134,-73.9207437899419,-73.9207478135065,-73.9207523692099,-73.9207573440168,-73.9207626185348,-73.9207680641631,-73.9207735481389,-73.920778939259,-73.9207841026029,-73.9207889182103,-73.9207932670205,-73.9207939851088,-73.9207954752559,-73.9207976837485,-73.9208005263121,-73.9208038918402,-73.9208076525018,-73.9208182892087,-73.9208294770879,-73.9208319625911,-73.9208336135727,-73.9208343300117,-73.920834068603,-73.9208328438511,-73.9208332103846,-73.9208348115476,-73.9208372958535,-73.920840655865,-73.9208448911699,-73.9208499921304,-73.920855953284,-73.9208636701551,-73.9208673233463,-73.9208717532551,-73.9208769416863,-73.9208828658238,-73.9208895010971,-73.920896820953,-73.920904792243,-73.9209114813282,-73.9209187548046,-73.9209265755675,-73.9209349102433,-73.9209437135879,-73.9209529473853,-73.9209625663909,-73.920972524469,-73.9209827719719,-73.9209919337443,-73.9210008094881,-73.921009324724,-73.9210174041009,-73.9210249801875,-73.921031987972,-73.9210383646474,-73.9210440570847,-73.9210799717563,-73.9211137690257,-73.9211482624022,-73.9211834457428,-73.9211880288036,-73.9211932334131,-73.9211990051163,-73.9212052850625,-73.9212120108803,-73.9212191102955,-73.9212265105916,-73.9212341399264,-73.9212419161186,-73.9212497600562,-73.9212575917408,-73.9212628804994,-73.9212684105679,-73.9212740854395,-73.9212797934544,-73.9212854286798,-73.9212908854198,-73.9212960626006,-73.9213008598256,-73.9213051898924,-73.9213112937609,-73.9213167535342,-73.9213215373855,-73.9213256253553,-73.9213289977092,-73.9213316377882,-73.9213350636892,-73.9213392034222,-73.9213440427387,-73.9213495643176,-73.9213557508287,-73.9213625746169,-73.921370016594,-73.9213780471223,-73.921400733169,-73.9214242033438,-73.9214484348068,-73.9214734121957,-73.9214845279767,-73.921496279558,-73.9215086173052,-73.9215214988278,-73.9215348742653,-73.9215410082147,-73.9215475468775,-73.9215544309438,-73.921561600879,-73.9215689887934,-73.921576535141,-73.9215841685042,-73.92159182339,-73.9215973802168,-73.921602739588,-73.9216077723079,-73.9216123597464,-73.9216163955998,-73.9216197852247,-73.9216224447577,-73.9216243138662,-73.9216297725668,-73.9216329863462,-73.9216371707257,-73.9216422987393,-73.9216483381445,-73.921655249445,-73.9216583341728,-73.921662152996,-73.9216666822272,-73.9216718937842,-73.9216777545277,-73.9216842315337,-73.9216912830862,-73.9216988650471,-73.9217069323972,-73.9217231009898,-73.9217395650496,-73.9217562540405,-73.9217653400537,-73.9217741176824,-73.9217825208021,-73.9217904898824,-73.9217979621017,-73.9218048849728,-73.9218112060109,-73.9218155423738,-73.9218194248033,-73.921822777319,-73.9218255309804,-73.9218276309208,-73.9218290323921,-73.9218297119677,-73.9218296503983,-73.9218288543711,-73.92182733387,-73.9218203814143,-73.9218128440554,-73.9218047466605,-73.9217961167302,-73.9217898001668,-73.92178403247,-73.9217788827079,-73.9217744096275,-73.9217706680213,-73.9217670142135,-73.9217640730799,-73.9217618734758,-73.9217604420658,-73.921759789909,-73.9217599263055,-73.9217608486934,-73.9217625479114,-73.921766260138,-73.9217708784269,-73.9217763968728,-73.9217828095664,-73.9217901116982,-73.9217975704915,-73.9218059717166,-73.9218153085887,-73.9218255719023,-73.9218367544304,-73.9218423023689,-73.9218467683653,-73.9218501460817,-73.9218513889101,-73.9218534250157,-73.9218562511432,-73.9218598596385,-73.9218642366909,-73.921869370913,-73.921884553642,-73.9219004518309,-73.9219170588992,-73.9219288650577,-73.9219398828664,-73.9219500952146,-73.9219594810315,-73.9219722927827,-73.9219858902556,-73.9220002587464,-73.9220088750983,-73.9220181702647,-73.9220281240527,-73.9220344665145,-73.9220399434605,-73.9220445120987,-73.9220481432683,-73.9220857644662,-73.9220888138627,-73.9220925117697,-73.9220968099021,-73.9221016417258,-73.9221069356452,-73.9221126132411,-73.9221185945514,-73.922124787734,-73.9221311033515,-73.9221374462479,-73.9221443721258,-73.9221511420762,-73.9221576468409,-73.9221637835241,-73.9221694494391,-73.9221745524384,-73.9221787781185,-73.9221829929591,-73.9221870400508,-73.9221907695411,-73.9221940390799,-73.9221967302906,-73.9221987393216,-73.9222042029618,-73.9222090232044,-73.9222131820687,-73.9222166571768,-73.9222194364793,-73.9222226862976,-73.9222251464813,-73.9222268074062,-73.9222276601082,-73.9222277011182,-73.9222284712605,-73.9222302792856,-73.9222331201848,-73.9222402476927,-73.9222465107496,-73.9222518992765,-73.9222597005775,-73.9222664135646,-73.9222720154372,-73.9222737660788,-73.9222746168385,-73.9222745609611,-73.9222736000366,-73.9222733571767,-73.9222717387349,-73.9222694987886,-73.9222663622689,-73.922262343075,-73.9222574597156,-73.922251730043,-73.9222238902586,-73.9221950875138,-73.9221653264388,-73.9221544319806,-73.9221428154369,-73.922130493534,-73.9221174827781,-73.9221037961574,-73.9220894530347,-73.9220744725505,-73.9220588714297,-73.9220426718903,-73.9220134910915,-73.9219850154048,-73.9219572644098,-73.9219302466931,-73.9219122298792,-73.9218935293676,-73.9218741653997,-73.9218541544766,-73.9217815294417,-73.9217418624316,-73.9216328367768,-73.9215182161155,-73.9214095375319,-73.9212908829846,-73.9211699680542,-73.9210736991064,-73.920948314347,-73.9208916323192,-73.9208687808322,-73.9208615660414,-73.9208613363902,-73.9208663980295,-73.9208775781156,-73.9208812352666,-73.9208805085479,-73.9208705564061,-73.9208489368267,-73.9208316862817,-73.9207991762107,-73.9207772529125,-73.9207545719536,-73.9207388387751,-73.9207286933285,-73.9207125712705,-73.9206903601962,-73.9206638599306,-73.9206332109225,-73.9205517694873,-73.9205163673782,-73.9204627102111,-73.9204158269712,-73.9203696653611,-73.9203087337188,-73.9202884196989,-73.9202704363787,-73.920258134295,-73.9202558476349,-73.9202533194608,-73.9202429694859,-73.920236413685,-73.920225397306,-73.9202149229112,-73.9202034350728,-73.9201920865933,-73.9201834039526,-73.9201791162964,-73.9201736416114,-73.9201624131184,-73.9201479477898,-73.9201320739547,-73.9201178545924,-73.9200925395554,-73.9200196420724,-73.919999180675,-73.9199678679597,-73.9199433634818,-73.9199262206321,-73.9199144810455,-73.9199014863666,-73.9198963077592,-73.9198959912969,-73.9199006433604],"lat":[40.5996005220902,40.5995686991021,40.5995521340897,40.5995430517043,40.5995359665218,40.5995313478121,40.5995243921599,40.5995224082257,40.5995261089586,40.5995273392058,40.5995195132845,40.5995208424033,40.5995309227156,40.5995622138382,40.5995813399158,40.599594330726,40.5996035651332,40.5996078282814,40.5996119184332,40.5996113679892,40.5996073435535,40.5995990236749,40.5995977179181,40.5995983019061,40.5996054143509,40.599608276886,40.5996092809189,40.5996059790274,40.5995999087146,40.5995917013908,40.59958299676,40.5995769241914,40.5995746372245,40.5995766298325,40.5995826021557,40.5995896480162,40.5995907906601,40.5995867696114,40.5995772862335,40.5995653312234,40.5995573011018,40.5995563859592,40.5995569544978,40.5995589258291,40.5995597716551,40.5995567190739,40.5995489753748,40.5995420047398,40.5995349836303,40.5995297190035,40.5995204727864,40.5995098483256,40.599495572354,40.5994778031823,40.599466512271,40.5994586224962,40.5994563039923,40.5994567039982,40.5994615245654,40.599471099176,40.5994799632443,40.5994835024546,40.599488681124,40.5994886157684,40.5994848170758,40.5994835156932,40.5994869598332,40.5994878451585,40.5994830492621,40.5994724283707,40.5994583782573,40.5994470815954,40.5994413121836,40.5994331001858,40.5994159676328,40.5993986430244,40.5993825820447,40.5993723117281,40.5993623388988,40.5993473907872,40.5993402476377,40.5993201723556,40.5992739468939,40.5992665356019,40.5992615425563,40.5992603385694,40.5992611396944,40.5992741469524,40.5992734924836,40.5992725607179,40.599266768343,40.5992583661843,40.5992511445465,40.5992398598933,40.5992303638395,40.5992204259785,40.599211361955,40.599173149423,40.5991663908318,40.5991615514352,40.5991559079333,40.599152546315,40.5991524580896,40.5991566241164,40.5991589834079,40.5991609582051,40.5991619713357,40.5991602360628,40.5991495445979,40.5991127463541,40.5991014215516,40.5990964972257,40.5990886297844,40.5990842000029,40.5990769433524,40.5990710648223,40.5990619183054,40.5990517293243,40.5990410957514,40.599023672425,40.5990081711853,40.5989909943326,40.5989639768988,40.5989480602119,40.5989314795123,40.5989171278701,40.598907505308,40.5988943937085,40.5988732262677,40.5988624812429,40.5988511895013,40.5988365728605,40.5988303630076,40.5988242598812,40.5988213175394,40.5988141316882,40.5988087952452,40.5988013458204,40.5987935413355,40.5987829885323,40.5987728496422,40.5987631241629,40.598749555951,40.598734998347,40.5987215928389,40.5987066204095,40.5986966731202,40.5986694603189,40.5986576667699,40.5986448058902,40.5986315339306,40.5986194420179,40.5986104252937,40.5986011863292,40.5985924745512,40.5985751100732,40.5985613635027,40.5985443206171,40.5985341219406,40.5985161470481,40.5985044409213,40.5984894088299,40.5984767423239,40.5984685531114,40.5984587366975,40.5984506514697,40.5984423441577,40.5984352480634,40.5984260094537,40.59841584053,40.5984065412076,40.5983875293904,40.5983655471843,40.5983478663345,40.5983375055033,40.5983269800361,40.5983149208332,40.5983028608659,40.5982886558801,40.5982790632694,40.5982694702698,40.5982604236982,40.59825269061,40.5982456981055,40.5982430925319,40.5982417288941,40.5982395702161,40.5982412947158,40.5982386763777,40.5982353190649,40.5982302066332,40.5982232012008,40.5982156479515,40.598208286694,40.5981985622689,40.5981855417376,40.5981742486247,40.5981611373128,40.5981058268454,40.5980996136465,40.598093386481,40.5980872420159,40.5980812742504,40.5980732757977,40.5980651363014,40.5980568907847,40.5980485766128,40.5980290894252,40.5980096154472,40.5979901717639,40.5979707719491,40.5979514319185,40.5979303936427,40.5979094238774,40.5978885477566,40.5978677878979,40.5978471701056,40.5978253393708,40.5978036508524,40.5977821182929,40.5977607542583,40.5977395698115,40.5977166718928,40.5976939562465,40.5976714361141,40.5976491218844,40.5976270267965,40.5976051612435,40.5975852841708,40.5975656619432,40.5975463066297,40.5975272274495,40.5975084383134,40.5974899522967,40.5974349890477,40.5974277448438,40.5974208751513,40.5974144052903,40.5974083615855,40.5974027650069,40.5973976390329,40.5973930012835,40.5973905878949,40.5973888028645,40.5973876643483,40.5973871861518,40.5973873721932,40.5973886855211,40.5973894821126,40.5973897136772,40.5973893687857,40.5973884675059,40.5973870602211,40.5973852279538,40.5973830749942,40.5973812530516,40.5973795750969,40.5973782345459,40.5973773902461,40.5973771388461,40.5973775094631,40.5973769529656,40.5973757837156,40.5973740192376,40.5973716824145,40.5973689784939,40.5973660495443,40.5973630139726,40.5973599910545,40.5973515865468,40.5973433181691,40.5973352320044,40.5973273687748,40.5973197673643,40.5973124668266,40.5973055067203,40.5972989194017,40.5972236875069,40.5972172804698,40.5972112468415,40.5972056293745,40.5972004714974,40.5971958094348,40.5971916800849,40.5971892999435,40.5971863525568,40.5971828889246,40.5971789724353,40.597174672668,40.597168528539,40.5971626056381,40.5971569609497,40.597151653976,40.597146735179,40.5971422516728,40.5971382520853,40.597132567434,40.5971274055953,40.5971227934138,40.5971187568945,40.5971153161819,40.5971124879024,40.597108517015,40.5971040299373,40.5970990518378,40.5970936113949,40.5970877376255,40.5970814640653,40.5970748254216,40.5970678572327,40.5970606009038,40.5970530953183,40.5969842273568,40.5969635215422,40.5969430489619,40.5969228320712,40.5968931498356,40.5968912574212,40.5968774763685,40.5968640284617,40.596850940687,40.5968228330806,40.5967943106421,40.5967653908019,40.5967511454921,40.5967372850924,40.5967238347473,40.5967108164216,40.596698254255,40.596686170885,40.5966769613658,40.5966673017595,40.5966572259332,40.5966467764637,40.5966359922395,40.5966180602466,40.5966005163816,40.5965833782443,40.5965666639437,40.5965301660319,40.5964940777293,40.5964584039007,40.5964501020108,40.5964424182552,40.5964353900383,40.5964290540922,40.596425684342,40.5964217853356,40.596417425151,40.5964126829207,40.5963833469002,40.5963764920962,40.5963700865527,40.5963641544196,40.5963587148239,40.5963537899086,40.5963493949495,40.5963455494108,40.5963316233061,40.5963298836746,40.5963275080592,40.5963245493208,40.5963210678453,40.5963171400979,40.5962636272859,40.5962537177214,40.5962441533835,40.5962349890847,40.5962262769551,40.5962212701914,40.5962167498192,40.5962127611172,40.596209338481,40.5962065161427,40.5962043204614,40.5962027719357,40.5962018846998,40.5962006053913,40.5961986735055,40.5961961011534,40.5961929026225,40.5961869423893,40.596180304073,40.5961730171996,40.5961651149815,40.5961582288469,40.5961508820441,40.5961431176618,40.5961349843127,40.596128090437,40.59612161119,40.5961155816182,40.5961100406224,40.5961050224192,40.5961005555275,40.5960654299942,40.5960609013487,40.5960559684847,40.5960506627585,40.5960450165324,40.5960390650121,40.5960328444058,40.5960263942708,40.5960197546611,40.5960083541482,40.5959970963153,40.5959860086488,40.5959751203034,40.5959644575924,40.595954048004,40.5959472347742,40.5959401460604,40.5959328373383,40.5959253667556,40.5959177924583,40.5959101749295,40.5959049504083,40.5958996308892,40.5958943061646,40.5958890687143,40.5958840078498,40.5958792103776,40.5958747614425,40.5958612207571,40.5958472821319,40.5958329730613,40.5958183237135,40.5957777109837,40.5957200926491,40.5956846081665,40.5956487554008,40.5956125459191,40.5955398424857,40.5954673965455,40.5953952107783,40.5953385545458,40.5952821398613,40.5952259717522,40.5952111347465,40.5951965210812,40.5951821642701,40.5951680889553,40.5951616493587,40.5951548919806,40.5951478605718,40.5951406002168,40.5951331605211,40.5950696855661,40.5950602943717,40.5950511491789,40.5950422898748,40.59503375501,40.5950255831414,40.5950178074622,40.5949980494318,40.5949778359119,40.5949571922176,40.5949431523538,40.5949295277917,40.5949163528935,40.594903660852,40.5948938341372,40.5948844298858,40.5948754598424,40.5948669414454,40.594858884766,40.5948513048993,40.594849254561,40.5948477325948,40.5948467568135,40.5948463358189,40.5948464770381,40.5948471755015,40.5948484257382,40.5948502135624,40.5948525209356,40.5948541479211,40.5948550814567,40.5948552935124,40.5948547788529,40.5948535499933,40.5948516462548,40.5948475189726,40.5948428699488,40.5948377493237,40.594832209412,40.5948263087235,40.5948201122907,40.5948048973464,40.594790119859,40.5947758073215,40.5947687097403,40.5947621258879,40.594756105901,40.5947506942249,40.5947439409388,40.5947368081805,40.5947293333349,40.5947215527781,40.594708950964,40.5946961368074,40.5946831387965,40.5946699844154,40.5946567026522,40.5945716728217,40.5944612835043,40.5944481148621,40.5944350877761,40.5944222367702,40.5944095958582,40.5943972014077,40.5943370751226,40.5943251387484,40.5943135086569,40.5943022155233,40.59429129505,40.5942787088598,40.5942657288204,40.5942524125823,40.5942424360612,40.5942328366596,40.5942236586323,40.5942149445608,40.594206734349,40.5941811166971,40.5941772106127,40.5941728229402,40.5941679971151,40.5941627748902,40.5941572050521,40.5941513382251,40.5941452004386,40.5941387558947,40.5941320769964,40.5941252396546,40.5941183196035,40.5941113925738,40.5940721106871,40.5940627468218,40.5940535416285,40.5940445257508,40.5940357278269,40.5940242540511,40.5940125586006,40.5940006659265,40.5939886026562,40.5939763949177,40.5939640686714,40.5939516512214,40.5939044148546,40.593898981963,40.5938936465597,40.5938884966149,40.5938836167608,40.5938790864455,40.5938749777544,40.5938690798398,40.5938629462797,40.5938566338868,40.5938501996345,40.5938437035057,40.593837202968,40.5938277427189,40.5938182309745,40.593808701573,40.5937991896965,40.5937897300257,40.5937803559018,40.5937610640266,40.593741822166,40.5937226472368,40.5937035613522,40.5936845797538,40.5936657217026,40.5936017477432,40.593596362292,40.5935908965463,40.5935854464965,40.5935801116651,40.5935749835435,40.5935614892939,40.5935522208571,40.593530010647,40.5935256511251,40.5934898249588,40.5934852882751,40.5934807945765,40.5934764244358,40.5934722540563,40.5934683609724,40.5934648119868,40.5934616752333,40.5934484093933,40.5934348197662,40.5934209217553,40.5934067289201,40.5933922606841,40.5933775344619,40.5933625634797,40.5933548926644,40.5933469160087,40.5933386807322,40.5933302367425,40.5933216362952,40.5933129296359,40.5933041697008,40.5933023142844,40.5933008711419,40.593299982658,40.5932997363045,40.5933001542308,40.5932957476953,40.5932911424429,40.5932864336529,40.5932817195036,40.5932770959853,40.5932380683592,40.5932330162692,40.5932279922121,40.5932230707463,40.5932183261031,40.5932138305153,40.5932096506935,40.593203216563,40.5931961600753,40.5931885541653,40.5931819642301,40.5931754397648,40.5931690404011,40.5931628306234,40.5931568673684,40.5931512075696,40.5931416727926,40.5931318233259,40.5931216950047,40.5931113233303,40.5931007469882,40.5930899991387,40.5930791206494,40.5930681503816,40.5930552465498,40.5930422208103,40.593029105492,40.5930159297385,40.59300272488,40.5929895187222,40.5929763449411,40.5929632303431,40.5929502084377,40.5929337998919,40.5929174296094,40.5929011203759,40.5928848938046,40.5928687743591,40.5928527821463,40.5928369419659,40.5928201975027,40.5928032696648,40.5927861793981,40.5927689436277,40.5927515861486,40.5927341237179,40.5926696158502,40.5926598252825,40.5926501101207,40.5926405174361,40.5926310961357,40.592621893447,40.5926019042554,40.5925816745301,40.5925612273819,40.5925405824063,40.5925197595347,40.5924987817108,40.592477668199,40.5924321782555,40.5923868172281,40.5923416013633,40.5923286878981,40.5923156569627,40.5923025333467,40.5922893366486,40.5922760933354,40.5922628220008,40.5922495496176,40.5922391410973,40.592228776246,40.5922185073365,40.5922083848061,40.5921984609328,40.5921780238178,40.5921578763548,40.5921380535705,40.592130790417,40.5921239317363,40.5921175325144,40.592111638363,40.5921062965694,40.5921028830884,40.592099967758,40.5920975698826,40.5920957060912,40.5920943849667,40.5920936161054,40.5920934060819,40.5920937547728,40.5920963743254,40.5920982477943,40.5920993706797,40.5920997431702,40.5920944340359,40.5920931248225,40.5920923407525,40.5920910534853,40.592089325275,40.5920872394741,40.5920848949917,40.5920824072989,40.592079895361,40.5920774796219,40.5920752766507,40.5920543299696,40.5920338842014,40.5920191546799,40.5920037364542,40.5919852501265,40.5919646638936,40.5919469463204,40.5919353902923,40.5919214484582,40.5919030125073,40.5918957096136,40.5918923903648,40.59188691229,40.5918780909722,40.5918699946328,40.5918664266211,40.5918545640057,40.5918130905742,40.5918029289688,40.5917948668203,40.5917860773484,40.5917748920406,40.5917644362263,40.5917537479155,40.5917266932132,40.5916820913096,40.5916541130568,40.5916325076913,40.5916116033259,40.5915959293114,40.5915563335398,40.5915338286896,40.591522997105,40.5915168499144,40.5915116579982,40.5915079010923,40.5915065259453,40.5915039997868,40.591504364702,40.5915075491406,40.5915087460087,40.5915103193503,40.5915123410292,40.5915089868004,40.5915112142223,40.5915182153683,40.5915247040462,40.5915295051649,40.5915376478391,40.5915472243518,40.5915520371542,40.5915546940147,40.5915559337302,40.5915617687375,40.5915709381093,40.5915824977517,40.5916164391639,40.5916203099872,40.5916212904506,40.5916202257405,40.5916191633757,40.5916144013152,40.591586976758,40.5915803096455,40.5915875081786,40.591630242721,40.5916362015903,40.5916457357098,40.5916514725533,40.5916550751506,40.591666868904,40.5916779248798,40.5916978300603,40.5917085966637,40.5917198383144,40.5917251184308,40.5917328054961,40.5917426456402,40.5917512573123,40.5917601021844,40.5917677724056,40.5917701971711,40.591771557383,40.591772386577,40.5917795844025,40.5917895614807,40.5917915399654,40.591807559334,40.5918183330786,40.5918492206352,40.5918813021536,40.5919052398959,40.5919248701401,40.5919397071674,40.5919519114019,40.5919626846212,40.5919780145173,40.591995021426,40.5920129562463,40.5920271368168,40.5920539726193,40.5920740868589,40.5920927821541,40.5921009722744,40.5921058628769,40.5921077854913,40.5921143755401,40.5921235398575,40.5921336361135,40.5921416475704,40.5921564733164,40.5921667422961,40.5921784472105,40.5921873265428,40.592192199181,40.5921951218015,40.5922025975288,40.5922130602008,40.5922238492625,40.5922353498157,40.5922499229782,40.5922641115353,40.5922776209582,40.5922891033759,40.5923022367501,40.5923134695735,40.592326564155,40.5923454685042,40.5923625865511,40.592374901725,40.5923832107639,40.5923912392706,40.5923983080836,40.592404532209,40.5924154261227,40.5924285207057,40.5924343432443,40.5924421740352,40.5924510251057,40.5924610859337,40.5924697743197,40.5925036664413,40.5925127086797,40.5925262756373,40.5925368726149,40.5925473352794,40.5925540138371,40.592557838835,40.592564603737,40.5925716957056,40.592583205994,40.5925904025463,40.5925982812841,40.5926045653089,40.5926148532097,40.5926247845946,40.5926368320451,40.5926512429434,40.5926560755732,40.5926657921722,40.5926660305541,40.5926703312632,40.592674251908,40.5926777545874,40.5926808035762,40.5926938153858,40.5927072555264,40.5927211102506,40.5927353698294,40.5927410679733,40.5927470719971,40.5927533252512,40.5927597722621,40.5927663537103,40.5927730119569,40.5927881092206,40.5928032504802,40.592818410441,40.5928335606232,40.5928420348735,40.5928504937352,40.5928589020271,40.5928672247305,40.5928754243114,40.5928834685977,40.5928913212218,40.5929003121534,40.5929095880504,40.5929191219259,40.5929288787545,40.5929388271967,40.5929931035187,40.5930693014094,40.5930756742305,40.5930821826479,40.5930887697116,40.593095379807,40.5931019553037,40.5931084402401,40.5931147803283,40.5931209206004,40.5931268094405,40.593132395224,40.5931376316823,40.5931437209786,40.5931502853079,40.5931572926423,40.5931647117954,40.5931725087297,40.5931806438879,40.5931890803918,40.5932072951145,40.5932252677412,40.5932429828521,40.5932604245245,40.5932927124169,40.5933253083908,40.5933582050712,40.5933913945805,40.5934019681806,40.5934122773299,40.5934222900133,40.5934319661737,40.5934412794905,40.5934501925836,40.5934588308496,40.5934679204046,40.5934774255355,40.593487306012,40.5934975224443,40.5935080314228,40.5935294060176,40.5935504732222,40.593571223647,40.5935916396921,40.5936117066044,40.5936294543906,40.5936475640855,40.5936660219461,40.5936848152301,40.5937039308627,40.5937233556006,40.593749855045,40.5937760432647,40.5938019036667,40.5938274265256,40.5938525969273,40.5938653572388,40.5938777897535,40.5938898688247,40.5939015662905,40.5939128565002,40.5939237139714,40.5939341140579,40.5939440359626,40.5939663285209,40.5939881873389,40.5940095998414,40.5940305532866,40.594051035601,40.5940777841083,40.5941049230312,40.5941324424797,40.594160337589,40.5941909647794,40.5942211934396,40.5942510130116,40.5942804137695,40.59430938515,40.59433791676,40.5943634310688,40.5943893062545,40.5944155299127,40.5944420934966,40.5944891509697,40.5945366885962,40.5945846964894,40.5946262576734,40.594668125831,40.5947102932534,40.5947221815249,40.5947335394579,40.594744340223,40.5947545534677,40.5947603626295,40.5947657250095,40.5947705849456,40.5947748946429,40.5947786124995,40.5947816987526,40.5947841243604,40.594814362355,40.5948256687726,40.594836564486,40.5948470328938,40.5948570587341,40.5948666249022,40.5948757154639,40.5948837711683,40.5948913017979,40.5948982930942,40.594904734646,40.5949106125287,40.5949159191824,40.5949599184164,40.5949636456911,40.5949679709265,40.5949728734706,40.5949783222946,40.594984285695,40.5949907277856,40.5949976136891,40.5950049008207,40.5950565240594,40.5951094147773,40.5951168280298,40.5951239943337,40.595130874471,40.5951374329042,40.5951436332551,40.5951494436688,40.5951548339621,40.5951597761292,40.5951642426629,40.5951676470186,40.5951704641211,40.5951726694569,40.5951742442086,40.5951751745842,40.595175451647,40.5951750728268,40.5951740422563,40.5951723692606,40.5951699971842,40.5951681955322,40.5951669786705,40.5951663509091,40.5951663194098,40.5951668839573,40.5951680386461,40.5951697789089,40.5951720904605,40.5951749618688,40.5951783709771,40.595182525082,40.5951872134849,40.595192415547,40.5951981040945,40.5952042517917,40.595210828286,40.5952178023904,40.595265129524,40.5952687115602,40.5952722568348,40.595275658812,40.5952788126505,40.595281626258,40.5952840117423,40.5952858984811,40.5952902473123,40.5952950775216,40.5953003472674,40.5953060061596,40.5953120081601,40.5953164667153,40.5953206402517,40.595324478312,40.5953279285871,40.5953309504939,40.5953335027722,40.5953355540437,40.5953488264774,40.5953627275739,40.595377245922,40.595379248248,40.5953807529145,40.5953817280204,40.5953821520504,40.5953820188969,40.5953813284849,40.5953800973266,40.5953738737742,40.595368043303,40.5953626651815,40.5953577964887,40.595353481405,40.5953497674544,40.5953495986565,40.5953499908981,40.595350934876,40.5953524016914,40.5953543513952,40.5953567277936,40.5953594644836,40.5953624845192,40.5953657022554,40.5953690248577,40.5953723618494,40.595375615903,40.5953890716425,40.5954026747543,40.5954163714678,40.5954221306876,40.5954277012031,40.5954330044171,40.5954379721157,40.5954425390869,40.595446644308,40.595450233948,40.5954589423994,40.5954669216888,40.5954741510036,40.5954788327477,40.5954840330832,40.5954897380785,40.5954959297833,40.5955025932652,40.5955097048794,40.5955172465107,40.5955589512117,40.595573451144,40.5955874601018,40.5956009660071,40.5956530333138,40.5956601037958,40.5956667262234,40.5956728709155,40.5956785120425,40.595683622096,40.5956881779259,40.5956921620711,40.5956955535581,40.5956978500735,40.5957007638792,40.5957042686194,40.5957083352662,40.5957129290915,40.5957464690468,40.5957596411116,40.595772304198,40.5957844375144,40.5957944100685,40.5958037824026,40.5958125414276,40.5958206683542,40.5958408509601,40.5958616825138,40.5958831435691,40.5958913000355,40.595899043481,40.5959063448992,40.5959131796391,40.595919519529,40.5959240545917,40.5959291109331,40.5959346759636,40.5959407297227,40.595947258112,40.5959542401708,40.5959616532578,40.5959685423758,40.5959750113942,40.5959810328112,40.5959865813033,40.5959916338893,40.5959961674202,40.5959982557466,40.5959998261006,40.5960008579874,40.5960013382808,40.5960012592149,40.5960006212329,40.5959994353321,40.5959977140199,40.5959954863881,40.5959927775156,40.5959909990973,40.595989721468,40.5959889760514,40.5959887778511,40.5959891324856,40.5959900316704,40.5959914560669,40.5959933709255,40.5959957334606,40.5959984908433,40.5960015771843,40.5960049250951,40.5960084568138,40.596012049707,40.5960153901755,40.596018379164,40.5960209304983,40.5960229650313,40.5960244273907,40.5960252717494,40.596024938247,40.5960253299753,40.5960264329051,40.5960282109015,40.5960306028743,40.5960335251285,40.5960378745746,40.5960423478872,40.5960468436987,40.596051260997,40.5960554986096,40.5960594607417,40.5960625594504,40.5960659216443,40.5960694644285,40.5960730976893,40.5960767353278,40.5960802873717,40.5960836658499,40.5960867861295,40.596089574289,40.5961127360712,40.5961158782513,40.5961186328327,40.5961209402854,40.5961227489473,40.5961240220587,40.5961247293896,40.5961248554512,40.59612439899,40.5961251620086,40.5961265922993,40.5961286515685,40.596131284105,40.5961344184614,40.5961379711381,40.5961418455856,40.5961459383951,40.5961530340273,40.5961598561572,40.596166350648,40.5961724630228,40.5961781438288,40.5961833452806,40.5961979144437,40.596201727336,40.5962051448846,40.5962081261693,40.596210636802,40.5962126459105,40.5962141298196,40.5962150708873,40.5962160381899,40.5962163748462,40.5962160713744,40.5962151360546,40.5962135949244,40.5962114931285,40.5962088892201,40.5962039012216,40.5961996981465,40.5961963142711,40.5961959603008,40.5961961985532,40.596197023593,40.596198422783,40.596200366231,40.5962028166805,40.5962057285012,40.596209045014,40.5962127020074,40.5962166290822,40.5962480732117,40.5962640635292,40.5962795564218,40.5962945347842,40.596308981179,40.5963174456179,40.5963254915936,40.596333098145,40.5963402495058,40.5963469272267,40.5963531173816,40.5963588053745,40.5963611851371,40.5963629220844,40.5963640054452,40.5963644251124,40.5963641800311,40.5963632706474,40.5963617029442,40.5963594912742,40.5963560929274,40.5963521236277,40.5963475952424,40.5963425214807,40.5963369138769,40.5963307933458,40.5963241727661,40.596321330894,40.5963189981752,40.5963172328318,40.5963160793441,40.5963155632556,40.5963156987145,40.5963164819448,40.596317893085,40.5963198995519,40.5963224513396,40.5963255409067,40.5963284651519,40.5963311126312,40.5963333817639,40.5963351868657,40.5963364603344,40.5963360252191,40.5963346906829,40.5963370786821,40.5963398559469,40.5963428553818,40.5963458987059,40.5963488013118,40.5963749868909,40.5963923493867,40.5964096526828,40.596426867624,40.596443971761,40.5964609381149,40.5964777403796,40.5965608308262,40.596570088831,40.5965791480106,40.5965879694857,40.5965965187294,40.5966047581982,40.5966126540327,40.5966201742119,40.596626776788,40.5966330118717,40.5966388472715,40.5966442553223,40.5966492101931,40.5966536900788,40.5966576694837,40.596661133131,40.5966640617203,40.5966660778681,40.596668732105,40.5966720026011,40.5966758613272,40.5966802735587,40.5966852030645,40.5966906075843,40.5966964381631,40.5967444138951,40.5967796309767,40.5968144526543,40.5968488702114,40.5968537283524,40.5968582064606,40.5968622617784,40.5968658513781,40.5968689361824,40.5968714876618,40.5968734794642,40.5968748894265,40.5968757034198,40.596875913516,40.5968755181526,40.5968738737911,40.5968727961786,40.5968723048499,40.5968724097802,40.5968731097243,40.5968743891971,40.5968762268532,40.59687858627,40.5968814246679,40.5968884061061,40.5968956923412,40.5969032481704,40.5969110390691,40.5969190259896,40.596927171059,40.5969363459659,40.5969453484711,40.5969541472368,40.59696270707,40.5969710006514,40.5969789964664,40.5969866666921,40.5969939838332,40.5970150437064,40.5970355985079,40.5970556334791,40.5970751298456,40.5970832433436,40.5970908210138,40.5970978319965,40.5971042531437,40.5971100587891,40.5971135494284,40.5971165846641,40.5971191381535,40.5971211874071,40.5971227131125,40.5971237024969,40.5971241457949,40.5971240412863,40.5971247081584,40.5971260150247,40.5971279316419,40.597130413869,40.5971334018256,40.5971368252523,40.5971406050184,40.5971446494441,40.5971890365235,40.5971984726222,40.5972076842234,40.5972166143486,40.5972252075235,40.597233409274,40.5972406362433,40.5972476556417,40.597254425738,40.5972609042957,40.5972670505826,40.5972728278871,40.597278199827,40.5972831342063,40.5972876000015,40.5972914333632,40.5972944495486,40.5972966364475,40.5972990657765,40.5973020844303,40.5973056672345,40.5973097881817,40.5973144165714,40.597319517857,40.5973250551463,40.5973272522271,40.5973298964696,40.5973329328725,40.5973363009109,40.5973399332008,40.5973437549936,40.5973476892101,40.597351657601,40.5973555799244,40.597359376108,40.5973671484211,40.5973745976745,40.5973816967453,40.5973884216954,40.5973920070459,40.5973960945197,40.5974006359154,40.5974055756536,40.5974108568115,40.5974160475633,40.5974214934445,40.5974271401955,40.5974329273564,40.5974387952944,40.5974446852129,40.5974505327791,40.5974562788488,40.5974781387491,40.5974998994185,40.5975215370639,40.597543031075,40.5975643603396,40.5975877950502,40.5976110442767,40.5976340843924,40.5976568946172,40.5976794535024,40.5977007108729,40.5977221156031,40.5977436360259,40.597754754949,40.5977658068974,40.5977767566874,40.5977875719808,40.5977982226128,40.5978086733944,40.5978365960972,40.5978642870887,40.5978917359771,40.5979058077427,40.5979202468658,40.59793502519,40.5979501180745,40.5979669584365,40.5979834337815,40.5979995258388,40.5980118140926,40.5980238134833,40.5980355010457,40.5980430930829,40.5980510671694,40.5980593666513,40.598067930696,40.5981372081032,40.5981414508381,40.5981453805654,40.5981489396222,40.5981520758617,40.5981547429973,40.5981569031142,40.5981585223172,40.5981595765874,40.5981600529643,40.5981599420019,40.5981593576615,40.5981581051084,40.5981562057124,40.5981536907319,40.5981506006394,40.5981469847938,40.5981467103946,40.598147061877,40.5981480247274,40.5981495643333,40.5981516202878,40.5981541176253,40.5981569648045,40.5981641225041,40.5981715449667,40.5981791964965,40.5981870423997,40.5981950491626,40.5982040372951,40.5982131698058,40.5982224066489,40.5982317071087,40.5982410301382,40.5982568670301,40.5982726547006,40.598288354112,40.5983033697215,40.5983186075596,40.5983340403123,40.5983479902204,40.5983622660738,40.5983768184362,40.5983869703837,40.5983971915823,40.5984074317686,40.5984176462134,40.5984189651743,40.5984277880117,40.5984384560981,40.5984489929053,40.5984593528745,40.5984694954761,40.5984793778347,40.5985255721016,40.5985714226097,40.598616915624,40.598632455292,40.5986476887289,40.5986625961774,40.5986771583825,40.5986913572597,40.5987051742262,40.5987185927093,40.5987315946269,40.5987441630733,40.598766886707,40.598790126802,40.5988138674567,40.5988380961128,40.5988550088468,40.5988714868774,40.5988875121251,40.5989030698581,40.5989590686918,40.5989890806811,40.5990576977221,40.5991196525574,40.5991804019485,40.5992426561882,40.5992977152177,40.5993392322392,40.5993984343134,40.5994311144353,40.5994476492491,40.5994584033422,40.5994698764223,40.599484427307,40.5994999436867,40.5995132311036,40.5995194327023,40.5995300773576,40.5995413973285,40.5995426486165,40.5995366700501,40.5995307255778,40.5995266761719,40.5995227940569,40.5995159250627,40.5995065547539,40.5995005008374,40.5994976005411,40.5995019162074,40.599519371763,40.5995234375091,40.5995249374664,40.599523833995,40.5995208370867,40.5995215090279,40.5995262983373,40.5995380336811,40.599556470112,40.5995715369404,40.5995790291029,40.5995903304774,40.5995913689643,40.5995890556132,40.5995858369743,40.5995868445604,40.5995900480475,40.5995941592155,40.599596736355,40.5995970619148,40.5995914552885,40.5995829072796,40.5995768313563,40.5995739657705,40.5995733454012,40.5995826550512,40.5995900786038,40.5996072942177,40.5996206163288,40.5996234868932,40.5996230938983,40.5996187486835,40.5996130083712,40.5996062011036,40.5996005220902]}],[{"lng":[-73.8978033326603,-73.8976101330835,-73.8974134466262,-73.8967821330709,-73.896677454942,-73.8959444275682,-73.8955888446442,-73.8954642725973,-73.8952054035487,-73.8944111404313,-73.8935467713984,-73.8924573741515,-73.8913654358725,-73.8900378251875,-73.8900058919058,-73.8899585373793,-73.8895289317097,-73.889085352959,-73.888628250132,-73.8881581183427,-73.887675444841,-73.8849483577282,-73.8817902790232,-73.8802966914578,-73.8791915645211,-73.8786470531725,-73.8786849317358,-73.8780368114511,-73.8779734133435,-73.8784158941397,-73.8784686650073,-73.8785641338681,-73.8785517042653,-73.8785278703982,-73.8785612751928,-73.8785892552113,-73.8786111550537,-73.8786264617375,-73.8786348167139,-73.8786360242674,-73.8786300561012,-73.8786170520011,-73.8788424524132,-73.879106730719,-73.8791321451151,-73.8791654401008,-73.8792063404996,-73.8792545082698,-73.8793095452979,-73.8793709966891,-73.8794383545271,-73.8795110620713,-73.8795885183596,-73.879670083175,-73.8797550823379,-73.8797977038345,-73.8798638128148,-73.8798940439765,-73.8798966968779,-73.879900739591,-73.8798995199382,-73.8798995176126,-73.8798825182457,-73.879874807478,-73.8798740365594,-73.8798736362229,-73.8798755855182,-73.8798892803519,-73.8799071890126,-73.8799205989621,-73.8799406962303,-73.8799541676404,-73.8799799397146,-73.8800494297017,-73.8800580570922,-73.8800953627711,-73.8801024464887,-73.8801087752118,-73.8801187857745,-73.8801248405584,-73.8801264891146,-73.8801266081373,-73.880163250385,-73.8801635999479,-73.8801659898817,-73.8801691622173,-73.8801657482871,-73.8801694841882,-73.8801701815014,-73.8801712428575,-73.8801678043809,-73.8801745580505,-73.8801913226311,-73.8801916164721,-73.8801935636742,-73.8802059008085,-73.8802078324764,-73.8802137486279,-73.8802219660698,-73.8802361406777,-73.8802333890755,-73.8802305172569,-73.8802562566604,-73.8802584968331,-73.8802864928494,-73.8803358377168,-73.8804031477204,-73.8804693203197,-73.8804838692263,-73.8804871805416,-73.8804792323826,-73.8804780102218,-73.8804958942976,-73.8805249550592,-73.8805528929325,-73.8805752249226,-73.8805986798831,-73.8806277408174,-73.880677003491,-73.8806892543181,-73.8807250540903,-73.8807362354642,-73.8807283624747,-73.8807149306578,-73.8806802514144,-73.8806275895374,-73.8806096991928,-73.8805884179952,-73.8805424621398,-73.8805267381819,-73.880460588049,-73.8804572789135,-73.8804079514431,-73.8803900360554,-73.8803586436717,-73.8803328681754,-73.8802924806857,-73.8802441955917,-73.8801906002302,-73.880190305821,-73.8801880623493,-73.8801364091892,-73.8800970822606,-73.8800711977313,-73.8800486771754,-73.8800261642626,-73.8800250448096,-73.8800250222249,-73.8800193370552,-73.8800192679419,-73.8800192372239,-73.8800247427087,-73.8800392204129,-73.8800414575423,-73.8800593155298,-73.8800608313644,-73.8800671413242,-73.8801197766652,-73.8801668275462,-73.8801892307079,-73.8801895244297,-73.8802239534878,-73.8802534515157,-73.8802788609492,-73.88029385334,-73.8803192320206,-73.8803310349823,-73.8803360775953,-73.8803653193577,-73.8803655333291,-73.8803955912832,-73.8804342026679,-73.8804583580926,-73.8804842539794,-73.880500965631,-73.8805290299146,-73.8805354467327,-73.8805413611362,-73.8805596830738,-73.8805727422563,-73.8806040882411,-73.8806399509166,-73.8806659264155,-73.8806780791352,-73.8806949085863,-73.8806993483435,-73.880732898191,-73.8807332072028,-73.880779962267,-73.8808517152622,-73.8808794632659,-73.8809245981686,-73.8809666898605,-73.8809667366908,-73.8809896139518,-73.8810103395704,-73.8810366659409,-73.8810611180493,-73.8810937911746,-73.8811327772497,-73.8811330135346,-73.881201382175,-73.8812522830563,-73.8812731240256,-73.8813280552183,-73.8813466398481,-73.8813466967837,-73.8813930623062,-73.8814255353955,-73.8814379975936,-73.8814725573114,-73.8814878299484,-73.8814879406635,-73.8815285584656,-73.8815673404369,-73.8815721019061,-73.8815722105769,-73.8815772020862,-73.8815900750037,-73.8815945020351,-73.8815955915779,-73.8816045329313,-73.8816100807203,-73.881617879409,-73.8816269244134,-73.8816289945394,-73.8816389985553,-73.8816491269725,-73.881683813367,-73.8816874221403,-73.8816874510622,-73.881699455626,-73.8817184719164,-73.8817512279546,-73.8817531443446,-73.8817701089466,-73.881793471286,-73.8818032883057,-73.8818248082783,-73.8818673371245,-73.8818887417745,-73.8819031484402,-73.8819378245726,-73.8819848475401,-73.8820093512286,-73.8820262545109,-73.8820710338718,-73.8820834479769,-73.8821012602465,-73.8821325675666,-73.8821485544379,-73.8821593900552,-73.8821996756551,-73.8822410816566,-73.8822477661491,-73.882246200987,-73.8822387016209,-73.8822049924588,-73.8821915742118,-73.8821735229399,-73.8821487591416,-73.8821352225243,-73.8821352510555,-73.8821352503442,-73.8821483256257,-73.8827018992972,-73.8830200475129,-73.8831533311727,-73.8832455446222,-73.8834199920303,-73.8836049704785,-73.8836975956031,-73.8838722339892,-73.8839954100449,-73.8841290628367,-73.8843245260121,-73.8845506370338,-73.8848075041113,-73.8855776214899,-73.8857417071963,-73.8860058292221,-73.88600571242,-73.8860910714245,-73.886244489273,-73.8867313498488,-73.8867959523455,-73.8872011346562,-73.8872203376547,-73.8872203533829,-73.8872741952881,-73.8872789606891,-73.8873229793388,-73.8873299719461,-73.887333828688,-73.8873502980822,-73.8874344470842,-73.8874012011271,-73.8873602991523,-73.8873882378126,-73.8874469336019,-73.8874622211171,-73.8874647188716,-73.8875336378742,-73.8876366864042,-73.8876658922948,-73.8876376490732,-73.8876707446012,-73.8876553101662,-73.8877109748743,-73.8877261123323,-73.8876443045171,-73.8875675598212,-73.8875316868804,-73.8875162324726,-73.8875723293541,-73.8876156618932,-73.8876410820128,-73.8876461315462,-73.8876230210014,-73.8876407216673,-73.887712111561,-73.8877708221423,-73.8878415352003,-73.8879613104371,-73.8879649405896,-73.8879653819387,-73.8880210878483,-73.8880696128443,-73.8881229334594,-73.8881539485117,-73.888227969114,-73.8884346542795,-73.8886360535893,-73.888636384341,-73.8886520498474,-73.8886721924494,-73.8886841599324,-73.8887035191367,-73.8887120376317,-73.8887382577594,-73.8887492038272,-73.8887516760089,-73.8887606071995,-73.8887784202995,-73.8887784613448,-73.8887818714047,-73.888785737428,-73.8887896332399,-73.8887903425636,-73.8887917823198,-73.8888009670933,-73.8888130437335,-73.8888802948602,-73.8889071649289,-73.8889192100957,-73.8889305801328,-73.8889306268076,-73.8889451964663,-73.888964965711,-73.8890547680365,-73.8891160112304,-73.8891499818832,-73.8892213676699,-73.8892467793602,-73.8892535996305,-73.8892625978013,-73.8892721038874,-73.8892921474433,-73.8893126313275,-73.8893335348854,-73.8893548284385,-73.8893764882512,-73.8893984888237,-73.889420800697,-73.8894382976529,-73.8894554186528,-73.8894721318268,-73.8894884079406,-73.8895042168912,-73.8895195268084,-73.8895343078074,-73.8895485366049,-73.8895621837576,-73.889575224001,-73.8895876320789,-73.8896091870524,-73.8896301004703,-73.8896503639977,-73.8896699637976,-73.8896888906478,-73.8897071329151,-73.8897193422217,-73.8897321050063,-73.8897453889677,-73.8897560495366,-73.8897734101277,-73.8897880831581,-73.8898031529833,-73.8898149112122,-73.8898412593168,-73.8898466000989,-73.8898558749603,-73.8898644592518,-73.8898723360785,-73.8898794786586,-73.8898858725186,-73.8898914950526,-73.889903275498,-73.8899157131622,-73.8899287871816,-73.8899424709771,-73.8899567414852,-73.8899715705868,-73.889989944662,-73.8900087725793,-73.8900280367598,-73.890047719843,-73.8900678007307,-73.8900882613987,-73.8901090792111,-73.8901302372426,-73.8901517102082,-73.8901734796478,-73.8901955237954,-73.8902178211033,-73.890229285237,-73.8902407627059,-73.8902521941241,-73.890263521634,-73.8902746900169,-73.890285640966,-73.890296321893,-73.890306678002,-73.8903148200937,-73.8903166586725,-73.8903262121791,-73.8903352914123,-73.8901370101697,-73.8903473469378,-73.8905352631518,-73.8905679292267,-73.8905812243994,-73.8905891828561,-73.890596954543,-73.8906044702013,-73.8906076723734,-73.8906116678353,-73.8906184832629,-73.8906319246609,-73.8906449724447,-73.8906575764932,-73.8906920634393,-73.8907082114337,-73.8907234724986,-73.8907396996315,-73.890756856595,-73.8907629410376,-73.8907698109272,-73.8907774267507,-73.8907857331583,-73.8907946761026,-73.890803524896,-73.8908129286573,-73.8908228295895,-73.8908331637341,-73.8908438680023,-73.8908529230099,-73.8908622572135,-73.8908718079561,-73.890881506846,-73.8908912881291,-73.8909010812096,-73.8909163550211,-73.8909315102687,-73.8909464985534,-73.8909612683912,-73.8909757715952,-73.8909807485967,-73.8909896348528,-73.8910029805153,-73.8910157784161,-73.8910279948662,-73.8910396016766,-73.8910505697726,-73.8910596719932,-73.8910608718441,-73.891070481891,-73.8910793796367,-73.89108753996,-73.8910949439026,-73.8911020410883,-73.891109863209,-73.8911183930687,-73.8911276086252,-73.8911374852007,-73.8911479974591,-73.8911567365719,-73.8911591224897,-73.8911708299015,-73.8911830893013,-73.89118832603,-73.8911929066581,-73.8911968058248,-73.8911999997128,-73.8912024746162,-73.8912042130967,-73.8912052071625,-73.8912054508062,-73.8912050491175,-73.8912049408827,-73.8912036847972,-73.8912016846787,-73.8911989534381,-73.8911955064074,-73.8911913641942,-73.8911876868434,-73.8911832186282,-73.8911779654608,-73.8911719286328,-73.8911651109834,-73.8911575232601,-73.8911491665384,-73.8911400502501,-73.8911301778888,-73.8911195591098,-73.891108203346,-73.891096114747,-73.8910833060537,-73.8910405899323,-73.8910021806594,-73.890998341226,-73.8909952783794,-73.8909565652046,-73.8909152631784,-73.8909130586125,-73.8908744430551,-73.8908521594433,-73.8908461261975,-73.8908172170863,-73.8907877242855,-73.8907863020696,-73.8907576550378,-73.890727017915,-73.8907149265683,-73.8906958236795,-73.8906640804567,-73.8906317979142,-73.890598985278,-73.8905656544158,-73.8905452327877,-73.8905254338721,-73.8905062763383,-73.8904877702885,-73.8904699328515,-73.8904527752209,-73.8904363099129,-73.8904205507594,-73.8904055056561,-73.8903911897488,-73.8903402373585,-73.8903212633528,-73.8903015330323,-73.8902810567167,-73.8902598460379,-73.8902379154932,-73.8902152758389,-73.8901919400286,-73.8901679225629,-73.8901282110313,-73.8901221550469,-73.8901120996377,-73.8900916525544,-73.8900771256953,-73.8900328474689,-73.8899997985235,-73.8899951792163,-73.8899893276089,-73.8899751536972,-73.8899614891697,-73.8899483507188,-73.8899357592159,-73.889923727391,-73.889912273691,-73.8899014128319,-73.8898911599533,-73.8898815288918,-73.88987253171,-73.889864180698,-73.8898564881415,-73.8898361594499,-73.8898151082957,-73.8897933478588,-73.8897708897713,-73.8897546848205,-73.8897477465543,-73.8897239294043,-73.8896994543569,-73.8896743319523,-73.8896445223008,-73.889613985502,-73.8895827301099,-73.8895507677697,-73.889518107704,-73.8894847630915,-73.8894507422767,-73.8894323816677,-73.8894146948438,-73.8893976894822,-73.8893813778799,-73.8893657674931,-73.8893508659988,-73.8894734993448,-73.8894894451721,-73.8894815257607,-73.8894101279679,-73.8891938310903,-73.8890809317505,-73.8887969084867,-73.888779002113,-73.8887610824868,-73.8889992056442,-73.8893087980161,-73.8894139481681,-73.8894218635042,-73.8894138728553,-73.8893760297505,-73.8893112237849,-73.8891879927448,-73.8891871147141,-73.8891323460895,-73.8890947396007,-73.8890604248535,-73.8890448745863,-73.8890423902258,-73.8890489028009,-73.888985775779,-73.8888956901532,-73.8888654177821,-73.8888458026407,-73.8888016423797,-73.8887814604977,-73.8887811933173,-73.8887607627378,-73.8887338175948,-73.8887291468568,-73.8887232216067,-73.8887126066979,-73.8886905447409,-73.8886660149626,-73.8886413764137,-73.8886100486939,-73.8885865544105,-73.8885824789519,-73.8885881021732,-73.8886058808228,-73.8886261017208,-73.888642837341,-73.8886357258818,-73.8886062843827,-73.8885938986803,-73.8885781071857,-73.8885500525067,-73.8885163756852,-73.8884628652518,-73.8884625474033,-73.8884446114139,-73.8883998288279,-73.8883903094234,-73.8883763677676,-73.8883525019477,-73.8883438753317,-73.8883437259361,-73.8883248617605,-73.8883128546047,-73.8883081080414,-73.8883068176624,-73.8883036443521,-73.8882863165544,-73.8882666647588,-73.8882005072666,-73.8882004729225,-73.8881978771867,-73.8881971830518,-73.8881910957765,-73.8881860587453,-73.8881860202114,-73.888185807547,-73.8881838638654,-73.8881895634224,-73.888197450704,-73.8881975837522,-73.888208719432,-73.8882064524796,-73.8882042980555,-73.8881912733654,-73.8881864038364,-73.888176393264,-73.8881899083885,-73.8882269621624,-73.8882662315028,-73.8882853135606,-73.8882918314305,-73.8883077544903,-73.8883392925627,-73.8883526223748,-73.8883739579869,-73.8884053189619,-73.8884501510236,-73.8884972019387,-73.888536179038,-73.8885364000042,-73.8885377294145,-73.8885397036874,-73.8885329769589,-73.8885329121287,-73.8885095050094,-73.8884678792331,-73.8884581424499,-73.8884501049444,-73.8884460762796,-73.888444911166,-73.8884496427119,-73.8884498097198,-73.8884531555449,-73.8884555743291,-73.8884598647732,-73.8884808434621,-73.8884845321832,-73.8885354929323,-73.888549083047,-73.8885580132433,-73.8885669395,-73.8885794408547,-73.8885950705728,-73.8886156214393,-73.8886404864065,-73.8886539856279,-73.8886545363101,-73.8886552004397,-73.8886462562195,-73.8886418159309,-73.8886149871964,-73.8885994356712,-73.8885993255203,-73.8885645969962,-73.8884996011824,-73.88843010109,-73.8883594588713,-73.8883550364736,-73.8882887873972,-73.8882278450763,-73.8881891139797,-73.8881608918387,-73.8881388653089,-73.8881026623147,-73.8880813888399,-73.8880657411518,-73.888060043625,-73.8880600122958,-73.8880568620131,-73.8880569576788,-73.8880636199673,-73.8880662700268,-73.8880673451985,-73.8880734950461,-73.8880906549401,-73.8880882339976,-73.8880944193573,-73.888137082136,-73.8881426999283,-73.8881640304334,-73.8882100789995,-73.8882144721319,-73.8882729241556,-73.8882897784556,-73.8882897892512,-73.8882898142074,-73.8882894131317,-73.888274913222,-73.8882696107507,-73.8882687707751,-73.8882629374047,-73.8882303091945,-73.8882240030451,-73.8882232229558,-73.8882531151052,-73.888256221699,-73.8882561100694,-73.8882483105599,-73.8882405361017,-73.8882256499759,-73.8882113835561,-73.8881917813462,-73.8881799759289,-73.8881283678035,-73.8881053861192,-73.8880745203193,-73.8880361981285,-73.8880285350117,-73.8880055972573,-73.8880005202701,-73.8879817286608,-73.8879624724086,-73.8879288850421,-73.8879286314985,-73.8878717545082,-73.8878395447129,-73.8878393001916,-73.8878364859783,-73.887804619525,-73.8877710878166,-73.8877643275201,-73.8877408383243,-73.887745346797,-73.8877468422897,-73.887749853391,-73.8877392553051,-73.8877150953559,-73.8876748035825,-73.8876288945357,-73.8876071915466,-73.887596455669,-73.8875847905671,-73.8875847646706,-73.8875751970743,-73.8875546216293,-73.8875427618252,-73.8875124992284,-73.8874991023325,-73.8874955194376,-73.887467762069,-73.8874616912354,-73.8874420121382,-73.8874256812615,-73.8874162715332,-73.8874114797073,-73.887409601565,-73.8874364943121,-73.8874544917707,-73.8874801709586,-73.8874802875462,-73.887485048901,-73.8874937323772,-73.8874942582483,-73.8875071840712,-73.8875016761739,-73.8875016405139,-73.8875173610867,-73.8875176084284,-73.8875476549086,-73.8876015226691,-73.8876438507178,-73.8876643710068,-73.8876713055163,-73.8877249750268,-73.8877522538269,-73.8877676193186,-73.8878090250816,-73.8878259740111,-73.8878475212705,-73.887886582198,-73.8879036735175,-73.8879169072354,-73.8879258807562,-73.8879337004716,-73.8879558736692,-73.8879650287928,-73.8879651892691,-73.8879885653265,-73.8880064712427,-73.8880253750506,-73.8880255300625,-73.8880268490781,-73.8880681212523,-73.8880719688209,-73.8880759667135,-73.8880783066116,-73.8880838316491,-73.8880838387567,-73.8880838545711,-73.8880558718278,-73.8880457157159,-73.8880099658953,-73.8879640644287,-73.8879487693024,-73.8879271047491,-73.8879125294196,-73.887881101482,-73.8878809637127,-73.887868076512,-73.8878451928548,-73.8877823900498,-73.8877352861537,-73.8876724480614,-73.887611840357,-73.887548995852,-73.8874966561793,-73.8874872687577,-73.8874255405377,-73.8874250246466,-73.8873694089588,-73.8873436166568,-73.8873148714774,-73.8873021744443,-73.8872912181404,-73.8872685828088,-73.8872529307313,-73.8872451342893,-73.8872094090394,-73.887199205875,-73.8871920591583,-73.8871835496121,-73.8871869793507,-73.8871809710147,-73.887173579731,-73.8871644921651,-73.8871500460037,-73.8871119618962,-73.8870918229423,-73.8870911770818,-73.8870907875409,-73.8870751789797,-73.887067560302,-73.8870618024612,-73.8870344533708,-73.8870147716993,-73.8869845793164,-73.8869588754986,-73.8869410265078,-73.8869365699228,-73.8869250057349,-73.8869164333014,-73.8869120345451,-73.886889641439,-73.8868717156668,-73.8868033181381,-73.8867842443031,-73.8867841553518,-73.8867789508059,-73.8867752427268,-73.8867839180963,-73.8867841964753,-73.8867942499054,-73.8867964557142,-73.8867860550348,-73.8867852374325,-73.8867482931072,-73.8867102483657,-73.8866836655693,-73.8866833639223,-73.8866774568037,-73.8866520186378,-73.8866388736411,-73.8866307773552,-73.8866304837735,-73.8866173330251,-73.886583560071,-73.8865809150806,-73.8865795037645,-73.88654888956,-73.8865511118942,-73.8865761610945,-73.886542215947,-73.8864333200532,-73.8864325000971,-73.8864258065683,-73.8864168906533,-73.8864074296283,-73.8863721085288,-73.8863618586515,-73.8863575872551,-73.8863463875928,-73.8863374930814,-73.8863050400767,-73.8862851676738,-73.8862260272726,-73.8862363352513,-73.8862466423342,-73.8862364679181,-73.8861652274431,-73.8861372067947,-73.8861291045218,-73.8861204115462,-73.8860980377358,-73.8860723356275,-73.8860721076197,-73.8860252967909,-73.8859908619233,-73.8859524100367,-73.8859101775899,-73.8858795227053,-73.8858791826368,-73.8858668500662,-73.885850381286,-73.8858279911254,-73.8858011094989,-73.8857885828904,-73.885768621624,-73.8857275231905,-73.8857002497674,-73.8856886383046,-73.8856688804522,-73.8856464878182,-73.8856223616398,-73.8856061513847,-73.8855849393403,-73.885538908857,-73.8855131618489,-73.8854849551704,-73.8854761778706,-73.8854358163807,-73.8853797761384,-73.8853521641245,-73.8853517777482,-73.8853237600689,-73.8852531466708,-73.8851903951511,-73.8851276487512,-73.8850981973541,-73.8850682742299,-73.8850212074055,-73.8849550854284,-73.8849382948492,-73.8849224496537,-73.884921512681,-73.8849139690309,-73.8849138725703,-73.8848632551552,-73.8848322247268,-73.8847993878379,-73.884751503504,-73.8847332667142,-73.8846918143662,-73.8846835451484,-73.8846335642668,-73.8846173429458,-73.884382709926,-73.8837357876379,-73.8831126192456,-73.8825163484787,-73.8819016774992,-73.8812653338029,-73.8807888972565,-73.8807668549838,-73.8805512388226,-73.8797498303041,-73.8795388801708,-73.8794552216839,-73.8793548001826,-73.8791178779807,-73.8790771564274,-73.879050608504,-73.8789668607114,-73.8788736264867,-73.8787651808329,-73.8787003914134,-73.8789370872557,-73.8789535877491,-73.8790173117542,-73.8790799104255,-73.8791451427625,-73.8791695596886,-73.8792563256351,-73.8793404042684,-73.8794340175015,-73.8795299405538,-73.879975459385,-73.8801210453158,-73.8802941853155,-73.8804057727442,-73.8805173569765,-73.8806568100395,-73.880743765109,-73.8808553316143,-73.8809570243761,-73.8810800672583,-73.8811916137202,-73.8813262524205,-73.8825543035618,-73.8834487815581,-73.8834823178755,-73.8837245750953,-73.8838199042828,-73.8841553029174,-73.8842909604013,-73.8844119453547,-73.8845162081575,-73.8846020439878,-73.884668162112,-73.8847137670356,-73.8847385226749,-73.8847426643222,-73.8847364113229,-73.8847268487133,-73.8847593778489,-73.8847407940681,-73.8847373797384,-73.8847426687268,-73.8847648202445,-73.8848030491185,-73.8848547180938,-73.8849159404165,-73.8849864586851,-73.885071781629,-73.8851682536885,-73.8852702895132,-73.8853713558031,-73.8854652995816,-73.8855475083986,-73.8859254520789,-73.8861162792192,-73.886340592969,-73.8865099810516,-73.8866990060801,-73.886902124809,-73.8871355924869,-73.8873108861771,-73.887536129845,-73.8880542078172,-73.8883663017257,-73.8912129976544,-73.8918341140108,-73.8921705698979,-73.8924879958441,-73.8928333280948,-73.8930497455622,-73.8933501530381,-73.8935835752479,-73.8937697128522,-73.8939559679226,-73.8941001952536,-73.8942383881476,-73.8944552643118,-73.8946013353659,-73.8947293509273,-73.8949051955448,-73.8950321037624,-73.8951632926857,-73.8952496934687,-73.8953636929985,-73.8954715046768,-73.89558588818,-73.8956816844572,-73.8957622250945,-73.8958748912299,-73.8962579773043,-73.8964613830911,-73.8975498986198,-73.901461611025,-73.9021161182336,-73.9028981674214,-73.903703697827,-73.9041279320763,-73.9044869797308,-73.9045447715639,-73.9046052092317,-73.904834878512,-73.9048927064581,-73.9049063484711,-73.90493526224,-73.9050114916937,-73.9050486258982,-73.9050551104066,-73.905063544578,-73.9052916082105,-73.9057960409118,-73.9059490888677,-73.9066367320419,-73.9074633316008,-73.9082520114174,-73.908263338241,-73.9082844461988,-73.9091148452629,-73.9099191284119,-73.9106566840264,-73.9112441893432,-73.9115908231538,-73.9124508362557,-73.9132168803885,-73.914145320418,-73.9143051745633,-73.9144607094102,-73.9146114888326,-73.914757090034,-73.9148971047335,-73.9150311403104,-73.9151588209049,-73.9159021108311,-73.9159508373968,-73.9160039467752,-73.9160607998865,-73.9161207125988,-73.9161829639607,-73.9162468048775,-73.9163454941254,-73.916443754872,-73.9165408671357,-73.9166361193511,-73.9167288135833,-73.9168182706426,-73.9169038350615,-73.9169848798975,-73.9170608113275,-73.917131072999,-73.9171951501062,-73.9173939467481,-73.9174314814251,-73.9174616308028,-73.9174839920899,-73.9174982665495,-73.9175042634897,-73.9175019028097,-73.9174912160695,-73.9174723460668,-73.9174455449284,-73.9174111707403,-73.9173696827633,-73.9173216352962,-73.9167274649028,-73.9166869419112,-73.9166522022989,-73.9166238711376,-73.916602458187,-73.9165883487231,-73.9165817966066,-73.9165829197164,-73.9165916978292,-73.9155793635767,-73.9150217346099,-73.9148949764836,-73.9091803329732,-73.9082635730681,-73.9046420922078,-73.9039610671126,-73.9038554066149,-73.9038795992604,-73.9038667886285,-73.9042953851388,-73.9050086857623,-73.9054620613726,-73.9054456224268,-73.9054129826684,-73.9053295804466,-73.9053187038137,-73.9053972670154,-73.9053102020986,-73.9052963871087,-73.9052144077383,-73.9052018060492,-73.905121606948,-73.9051041354597,-73.9050236675442,-73.9050096972735,-73.9049289576819,-73.9049141358098,-73.904833600891,-73.9048175268759,-73.9047366871096,-73.9047186460013,-73.9046358148505,-73.9046255301735,-73.904543592505,-73.9045286158195,-73.9044481231161,-73.9044331682043,-73.9043524899594,-73.9043343806248,-73.9042557084927,-73.9042399340886,-73.9041602661059,-73.9041444660198,-73.9040647052122,-73.9040477661521,-73.9039661855735,-73.903954842642,-73.9038695615476,-73.9038580624162,-73.9037806175106,-73.9037701745543,-73.9036998205377,-73.9036874294035,-73.903619110891,-73.9036031336258,-73.9035373680357,-73.903522487372,-73.9034543281034,-73.903440894481,-73.9034222354569,-73.9033598553629,-73.9032905968249,-73.9032778744425,-73.903208978293,-73.9031407632171,-73.9031244379258,-73.9032084827847,-73.9031522612403,-73.903070056556,-73.9030543308402,-73.903124365857,-73.9030375683652,-73.9029656876546,-73.9029303690019,-73.902882639085,-73.9028679118272,-73.9027983883607,-73.9027845026159,-73.9027116273265,-73.9026992455198,-73.9026274717336,-73.9025586567165,-73.9025465611261,-73.902630595172,-73.9031323178665,-73.9031737227908,-73.9032033436977,-73.9032704594403,-73.9030228356249,-73.9028853605296,-73.9026933327198,-73.9028326222325,-73.902786289517,-73.9027554825764,-73.902718988289,-73.9024154305031,-73.9022870793228,-73.902296940499,-73.9024038097297,-73.9027136957305,-73.9026190873502,-73.9026236445669,-73.9027193711578,-73.9027453101951,-73.9026355880259,-73.902643555547,-73.9027020908574,-73.9027123675958,-73.9028344908604,-73.9028345657888,-73.902839581404,-73.902844484734,-73.9028481626175,-73.9028749237501,-73.9028743526673,-73.9028713027798,-73.9028681966419,-73.9028680087711,-73.9027392621568,-73.902751683756,-73.9028818162023,-73.9029161957411,-73.9029258874348,-73.9029282896843,-73.9029233750588,-73.9029111997292,-73.9028919028258,-73.902865704848,-73.9028329051439,-73.9027938784895,-73.9027447653789,-73.9026925420737,-73.9026381822575,-73.9025826994467,-73.9025271280945,-73.9024725043048,-73.9024198465156,-73.9023701365109,-73.9023243011164,-73.9023133022337,-73.9023012136959,-73.9022883700091,-73.9022751265758,-73.9022618498599,-73.9022489072463,-73.9022366568749,-73.90222543773,-73.9022155602602,-73.9022072977882,-73.902200878947,-73.9021964813538,-73.9021942266949,-73.9021941773586,-73.9021963347092,-73.9021885323971,-73.9021731017475,-73.9021501527437,-73.9021198489441,-73.9020824063163,-73.9020380916971,-73.9019872208908,-73.9019301564184,-73.9018673049339,-73.9018236921877,-73.901778992381,-73.9017338255721,-73.9016888182974,-73.90159876483,-73.9015102845169,-73.9014240685029,-73.9013407902442,-73.9012611002468,-73.9011856209853,-73.9011149420401,-73.9010496154919,-73.9009901516093,-73.900937014863,-73.900890620298,-73.9008513302916,-73.900635070827,-73.9006051606847,-73.9005682539552,-73.9005253229122,-73.9004774985288,-73.9004260406836,-73.9003723049714,-73.9003177069924,-73.9002636850615,-73.9002116623188,-73.90016300924,-73.9001168933873,-73.9000935534621,-73.9000698935925,-73.9000459368711,-73.9000198034865,-73.8999933230783,-73.8999665163261,-73.8999394012711,-73.8999119974871,-73.8998843249903,-73.8998564055602,-73.8998282578906,-73.8997999044147,-73.8997713629478,-73.8997426581193,-73.8997138055493,-73.8996848303053,-73.8996557534954,-73.8996265940348,-73.8995973756714,-73.899568118413,-73.8995544519647,-73.8995403932257,-73.8995259709788,-73.899511213571,-73.8994961548393,-73.899480818956,-73.899465244386,-73.8994494577155,-73.899433492574,-73.8994173817151,-73.89940115833,-73.8993848540723,-73.8993685027986,-73.8993521379237,-73.8993357937474,-73.8993195012708,-73.8993032956773,-73.8992872097292,-73.8991827974816,-73.8990784954819,-73.8989743087886,-73.8989610632236,-73.8989475386674,-73.8989337746792,-73.8989198145566,-73.898905704238,-73.898891485273,-73.8988772025038,-73.8988629051775,-73.8988486335294,-73.8988344343923,-73.898820351964,-73.898806430668,-73.8987927142675,-73.8987792458673,-73.8987642902614,-73.8987492634061,-73.8987342007021,-73.8987191417266,-73.898704124732,-73.8986891848975,-73.8986743604695,-73.8986596897001,-73.8986452077562,-73.898630952885,-73.8986169582684,-73.8986143472153,-73.8986110997015,-73.8986072622478,-73.8986028877649,-73.8985980355486,-73.8985927763314,-73.8985871828397,-73.8985813335198,-73.8985753103544,-73.8985691977504,-73.8985630823293,-73.898557047421,-73.8985511816496,-73.8985455622144,-73.8985051500907,-73.8984643680203,-73.8984232430613,-73.8983818027059,-73.8983421137375,-73.8983023764783,-73.8982626036802,-73.8982228118342,-73.8981830165568,-73.898117675681,-73.8981096619867,-73.8980425821651,-73.8980083838214,-73.8979618889221,-73.8978722356108,-73.8977209457803,-73.8976369001461,-73.8976223342306,-73.8975898452834,-73.8975813505004,-73.8975741582977,-73.8975731455857,-73.8975014994876,-73.8974809447067,-73.8974459426413,-73.8973989789771,-73.8971916396652,-73.8970522396707,-73.896994504372,-73.8969245112827,-73.8970717166319,-73.8971479172305,-73.8972185991283,-73.8972930573074,-73.8973306853778,-73.897344056026,-73.8973668038461,-73.8973876948109,-73.8973973565469,-73.8974088802114,-73.897418411566,-73.8974167789968,-73.8974094943071,-73.8974038019086,-73.8973262920142,-73.8972603878599,-73.8972061044235,-73.8971634489842,-73.897149258593,-73.8971294394962,-73.897129112271,-73.8971274733407,-73.8971263315366,-73.8971265471953,-73.8971269679088,-73.8971302438283,-73.8971413028214,-73.8971471760744,-73.8971604866737,-73.8971812256639,-73.897209379771,-73.8972449295147,-73.8972878511016,-73.8976089486917,-73.8982671480452,-73.8983237178363,-73.8986941157259,-73.8989511291848,-73.8989922257415,-73.8990463035057,-73.8992471869184,-73.8993099461888,-73.8993442977415,-73.8993512566008,-73.8993603732891,-73.899379237745,-73.8993993704752,-73.8994447521548,-73.8994804773002,-73.8995136204795,-73.8995468022037,-73.8995906797143,-73.8996220607459,-73.8996532944496,-73.8996977350455,-73.8997616287743,-73.8998282596582,-73.8998478610297,-73.8998560588359,-73.8998643649591,-73.8999015498527,-73.8999676154556,-73.9000232051821,-73.9000591937617,-73.900087545452,-73.9001166831249,-73.9001357604735,-73.9001405876266,-73.9001503512013,-73.9001643450497,-73.9001706300606,-73.9001675645937,-73.9001765460035,-73.9001912115877,-73.9002056548761,-73.9002123922264,-73.9002073080751,-73.900198852004,-73.9001924186405,-73.9001943667207,-73.9002033105087,-73.9002284158827,-73.900262645067,-73.9002772026637,-73.9002893981053,-73.9003006998603,-73.9003267387975,-73.9003581403156,-73.900396615962,-73.9004327403557,-73.9004737367834,-73.9005331668629,-73.9005981449608,-73.9006397572874,-73.9007361551919,-73.900776429412,-73.9008488299904,-73.9008900835326,-73.9009479716564,-73.9009935376356,-73.9010634082908,-73.9010955772667,-73.9010994890884,-73.9010910943137,-73.9010610286713,-73.9010244354279,-73.9009379276118,-73.9008210296445,-73.9007775325586,-73.9007702193054,-73.9007689327142,-73.9007712927222,-73.9007341859371,-73.9007233273091,-73.9007134492869,-73.9006909742426,-73.9006804674304,-73.9006834316555,-73.9006936915894,-73.9006907078765,-73.9006603680403,-73.9006351921556,-73.900613724036,-73.9006207126255,-73.9006404407336,-73.9006534360449,-73.9006405836465,-73.9006146748875,-73.9006089729732,-73.9006246270629,-73.9006416726547,-73.9006419860525,-73.9006293536351,-73.9006248535797,-73.9006164249499,-73.9005892738051,-73.9005752276523,-73.9005574079823,-73.9005429349236,-73.9005129972769,-73.900478771376,-73.9004418776915,-73.9004241529547,-73.9003931728814,-73.9003732293538,-73.9003534685542,-73.9003415960951,-73.9003224107072,-73.9002910321893,-73.9002795000761,-73.9002859862319,-73.9003040613444,-73.9003219239301,-73.9003538059495,-73.9003737559757,-73.9003977563063,-73.9004566021521,-73.9005225556332,-73.9005480799281,-73.9005597638919,-73.9005606323696,-73.9005377147712,-73.9005149854258,-73.9005221518937,-73.9005505231578,-73.9006329002549,-73.9007627287386,-73.9007997925509,-73.9008500241438,-73.9009320516455,-73.9009845073496,-73.9009972550451,-73.9010097150375,-73.901052234631,-73.9011040485326,-73.9011457931654,-73.9011684704456,-73.9011653686314,-73.9011553977687,-73.9011526088371,-73.9011550980137,-73.9011771204405,-73.9012202703854,-73.9012676208131,-73.9012847250829,-73.901309192254,-73.90135539419,-73.9014064603621,-73.9014446327037,-73.9014741962038,-73.9014857436897,-73.9014751142047,-73.9014746142435,-73.9014658951599,-73.9014449736197,-73.9014405911301,-73.9014205570473,-73.9014015422248,-73.9013772880984,-73.9013541648618,-73.9013515231911,-73.9013490767816,-73.9013661982311,-73.9014259079255,-73.9014921109909,-73.9015543250581,-73.9015775489572,-73.901585807013,-73.9016087418389,-73.9016355110479,-73.9017156921984,-73.9017239501834,-73.9017254426589,-73.9019050030853,-73.9019714036204,-73.9020035753997,-73.9020379967165,-73.9021824487332,-73.9022230288152,-73.9022909077179,-73.9023069158266,-73.9023172256857,-73.9023323476476,-73.9024475715824,-73.9024871104336,-73.9024596126822,-73.902493929853,-73.9012194426385,-73.9012076150597,-73.9011925346545,-73.9012076728411,-73.9012356515129,-73.9012503967299,-73.9012767949627,-73.901293247317,-73.9013139570878,-73.9013296265941,-73.9013449735864,-73.9013018441844,-73.9013105739888,-73.9012538846132,-73.9012483686557,-73.9013089885229,-73.9025355512105,-73.902557307369,-73.9026400798301,-73.9026507794679,-73.9025022719906,-73.9024984853692,-73.9024671553139,-73.9024724301828,-73.9023603209621,-73.9024069353587,-73.9025070096554,-73.9025149923374,-73.9025630841481,-73.9025716876861,-73.9027185426066,-73.9027280638814,-73.9026389947444,-73.9026382774741,-73.9026671089062,-73.9026815311062,-73.9027110789619,-73.9027272659197,-73.9027581954358,-73.9027735665674,-73.9028050684898,-73.902819739052,-73.902843718119,-73.9029266698344,-73.9030278119923,-73.903043928125,-73.9029175037036,-73.9029011311734,-73.9029095306502,-73.9028054666336,-73.9027066445075,-73.9026291824535,-73.9025974474087,-73.9025811404981,-73.9025278831392,-73.9024227471758,-73.9025597512367,-73.9027112413336,-73.9041761237921,-73.9041804259029,-73.9041898239051,-73.9058710527737,-73.9059069550503,-73.9058733697039,-73.9057345590124,-73.9057502631135,-73.9057790314497,-73.9057870839,-73.9058086859139,-73.9058167572533,-73.9058434333229,-73.9058857111461,-73.9059979051369,-73.9060086541314,-73.9060332892487,-73.9059858769134,-73.9059595075557,-73.9059283188068,-73.9059663822289,-73.9059237460909,-73.9059192679266,-73.9058793762093,-73.9059589131693,-73.905962463641,-73.9069651511668,-73.9069628364508,-73.9071474543953,-73.9071729114985,-73.9069867972527,-73.9067384866641,-73.9068102317299,-73.9070631177649,-73.9072568556499,-73.9072746609148,-73.9070834696827,-73.9072259243727,-73.9074120219435,-73.9074425541207,-73.9072549471798,-73.9070216067845,-73.9071059539903,-73.9073591924334,-73.9075273513217,-73.9075433286789,-73.9073751688889,-73.907241693827,-73.9072949558037,-73.9073429922426,-73.9074750370572,-73.9075897717354,-73.9076788286201,-73.9075513560224,-73.9076194856061,-73.9075900038479,-73.9076165910457,-73.9076492629661,-73.9076717467147,-73.9077114691581,-73.9078127920195,-73.907915914535,-73.9079965006117,-73.907988892375,-73.9079963331283,-73.9079943330381,-73.9080631504784,-73.9081331824062,-73.9081725296137,-73.9082457067644,-73.9083864623968,-73.9085225257282,-73.9086035159342,-73.9087908801765,-73.9088691099089,-73.9088139602081,-73.9086333391297,-73.9086639288127,-73.9088369111078,-73.9090714515395,-73.9083540321468,-73.9083744262503,-73.9087942081917,-73.9091383944822,-73.9091385318665,-73.908598311334,-73.9084789198752,-73.9081056047634,-73.9079908725976,-73.9079730639052,-73.908156638516,-73.9081744525562,-73.908123458225,-73.9085065389191,-73.9086286169873,-73.9091767510533,-73.9091689415312,-73.9088145620859,-73.9089570612872,-73.9091144927294,-73.9094302789909,-73.9094537083595,-73.9096440604036,-73.9096362583485,-73.9095974091034,-73.9090296056528,-73.9090202084436,-73.9090078273074,-73.9086163431735,-73.908535014809,-73.9083603562737,-73.9082909214441,-73.9077759619366,-73.907275904126,-73.9070628052691,-73.9069939905885,-73.9069362516362,-73.9068409369713,-73.906736396139,-73.9066869820963,-73.9053584507717,-73.9050217969073,-73.9050246349407,-73.9050147382876,-73.9048983350137,-73.9042156949238,-73.9043548553967,-73.9043008577121,-73.9042746621034,-73.9042601969841,-73.9042798052675,-73.9042860043331,-73.9042081411341,-73.9041062988295,-73.9040433252934,-73.9040677098566,-73.9041163714217,-73.9041608387749,-73.904099299029,-73.9041408914517,-73.9038492515957,-73.9035098078224,-73.9033950928256,-73.9034051053773,-73.903310470125,-73.9032832889575,-73.9033736213701,-73.9033764820907,-73.9034940744778,-73.9034554986213,-73.9034218726651,-73.9033385611318,-73.903135787071,-73.9028649606525,-73.9027450453749,-73.9026290686441,-73.9026827792878,-73.902391382413,-73.9023236133432,-73.9022586003223,-73.9022144276591,-73.902224976396,-73.9022198334353,-73.902205162944,-73.9020749081877,-73.9021459909271,-73.9021033616366,-73.9019616421984,-73.9019619658436,-73.9019906392132,-73.9020144080904,-73.9020043464916,-73.902001309366,-73.9019968182828,-73.9019788587876,-73.9019730740152,-73.9019708640879,-73.9019474600089,-73.901916231516,-73.9018780341217,-73.9019135415302,-73.9019117758592,-73.9018877939877,-73.9018764102409,-73.9019075212497,-73.9018974527644,-73.9018689301857,-73.9017199615079,-73.901704956772,-73.9016987261811,-73.9016773960648,-73.9016863280984,-73.9017115043726,-73.9017008103719,-73.9016585810002,-73.9016480828611,-73.9016421179009,-73.9017766980998,-73.9018126727041,-73.9018503741234,-73.9018737620181,-73.9018758279152,-73.9018971006949,-73.9029190912243,-73.9038128996268,-73.9047075761312,-73.905205309798,-73.905243009921,-73.905287930234,-73.9053918142236,-73.9053353447315,-73.9054244000322,-73.9056069037709,-73.9057000105689,-73.9057520593648,-73.9058848197945,-73.9059746117786,-73.9062342240524,-73.9069550840054,-73.9070989561338,-73.9072435397904,-73.9073883383935,-73.9075328546229,-73.9076765921286,-73.9078190572357,-73.9079597606407,-73.908098219092,-73.9081851262524,-73.90835106213,-73.9084145076679,-73.9084481536089,-73.9084809317711,-73.9085697157624,-73.9086147239464,-73.9086395953543,-73.9087052910715,-73.9087459909934,-73.9088291986607,-73.908885744221,-73.9090627964693,-73.9090873738523,-73.9091332276486,-73.9091872847109,-73.9092344962552,-73.9092725433401,-73.9093380498315,-73.9098452832665,-73.9098088373603,-73.9098547878519,-73.9098515484547,-73.9097766138252,-73.909609434184,-73.9095907093664,-73.909152335878,-73.908985357892,-73.9089453186321,-73.9088569131567,-73.9087247642439,-73.9087428590494,-73.9086135794197,-73.9085784099038,-73.9085443686702,-73.9084746106101,-73.908309661749,-73.9083253683517,-73.9088994495653,-73.9089337567326,-73.9091252659386,-73.9091345297295,-73.9109227002118,-73.9124725401532,-73.91306509094,-73.9132900399955,-73.9135250091696,-73.913651197596,-73.9136253383354,-73.9137777644715,-73.913841421729,-73.9149777907493,-73.9149134535406,-73.9150040110156,-73.9150438909926,-73.9150961629301,-73.9156700690795,-73.9159188769135,-73.9159512486576,-73.9162659441616,-73.9163482853368,-73.9167355648614,-73.9166973689036,-73.9167555403451,-73.916691214279,-73.9167158360474,-73.9166044214795,-73.9167064442666,-73.9166146526477,-73.9166695535851,-73.9167211575904,-73.9166417159367,-73.9163223001753,-73.9166877515028,-73.9167839443282,-73.9165707398336,-73.9166256837356,-73.9168398111877,-73.9164870092733,-73.9165092453593,-73.9168896458732,-73.9168553679985,-73.9168739501378,-73.9168280324376,-73.9169986709837,-73.9170516577582,-73.9170883850332,-73.917028227419,-73.9168196452964,-73.9166567653347,-73.9168103695898,-73.9167995309069,-73.9167037928953,-73.9166807528295,-73.9166409980965,-73.9166637973002,-73.9165660406583,-73.9163858514521,-73.9162767815813,-73.9160607713265,-73.9161647503773,-73.9156289810896,-73.9155457767295,-73.9149203593212,-73.9149995085535,-73.9148900110566,-73.91481827328,-73.9146493305456,-73.9145593876359,-73.9144954220598,-73.9145805764986,-73.9147439564002,-73.9148625905378,-73.9148256823382,-73.9147633645915,-73.914792897811,-73.9148557036074,-73.9148697779123,-73.9149341879044,-73.9148785129801,-73.9141576235188,-73.9138605306075,-73.914079858683,-73.9141815817566,-73.9141642499162,-73.914184093778,-73.9142261959574,-73.9141120615842,-73.914165792459,-73.9142223866503,-73.9142807266294,-73.9143396603931,-73.9143969043977,-73.9144508787714,-73.9145009124253,-73.91454638327,-73.9145754123262,-73.9146017069913,-73.9146036333186,-73.9146191293957,-73.9146687577439,-73.9147562127792,-73.9147778053186,-73.9150876407781,-73.9152681819283,-73.9158022419976,-73.9159639324669,-73.916420990035,-73.9164042825166,-73.9161455612036,-73.915929075294,-73.9159145211068,-73.9159560237016,-73.9157253830337,-73.9157680735657,-73.9157500426097,-73.915971731754,-73.916247689596,-73.9158849085212,-73.9157648836179,-73.9157458523034,-73.9159657250027,-73.9159825187881,-73.9158894155016,-73.9162645276666,-73.9163867968379,-73.9163375361718,-73.9163958674589,-73.9159930713155,-73.9158809341074,-73.9158708653637,-73.9160031884948,-73.9164182793016,-73.9164586620609,-73.9165056823666,-73.9164697884776,-73.9164991210399,-73.9166280437116,-73.9157318192713,-73.9167465238931,-73.9166915481744,-73.9166710821547,-73.9165893648605,-73.9166209824894,-73.9166506988006,-73.9167158204887,-73.9166731127403,-73.9166917125713,-73.9167882790561,-73.9167808339109,-73.9168292081245,-73.9180528636206,-73.9181103667901,-73.91810261499,-73.9177434091677,-73.9177365783831,-73.9177318548392,-73.9177293225395,-73.9177290265173,-73.9178663862696,-73.9178171947312,-73.917704223101,-73.9176787075734,-73.9179627008307,-73.9179845529726,-73.9178197277143,-73.9178740030876,-73.9180158470274,-73.9180217710347,-73.9180296445981,-73.9180392919471,-73.9180504977133,-73.9180630117384,-73.918556661206,-73.9180992539838,-73.9180050050113,-73.918187285901,-73.9181230385933,-73.9185735757095,-73.9188797831433,-73.9188885240194,-73.9188985511521,-73.9189095670764,-73.9189212449933,-73.9189314197853,-73.9189416044458,-73.9190073714733,-73.9182489343411,-73.9181475953426,-73.9181381488997,-73.9183624673764,-73.9184103979026,-73.9183079453259,-73.9190231076531,-73.9193539848405,-73.9183782694015,-73.9182721564306,-73.9182526909295,-73.9185030041392,-73.9185167450281,-73.9184015935965,-73.9193710042986,-73.9194228518385,-73.9194749422927,-73.9195035891893,-73.9195045928214,-73.9195220979602,-73.9192413501154,-73.9190515017678,-73.9188771952237,-73.9186847182968,-73.918580792166,-73.9185834211486,-73.9179498050121,-73.9170178790776,-73.91712470644,-73.9156008610433,-73.9154993583362,-73.915416007354,-73.9147685316395,-73.9148935810251,-73.9144281346228,-73.9139960892504,-73.9139696125376,-73.9139518562453,-73.9138943479936,-73.9138600521234,-73.9138488563693,-73.9138010981716,-73.913821187126,-73.9138202016283,-73.9138070900703,-73.9136871851004,-73.9136933221124,-73.9137866275074,-73.9138353183267,-73.9138196676429,-73.9138242894799,-73.913855243921,-73.9138286958813,-73.913836927374,-73.913837596891,-73.9137540873682,-73.9137345589701,-73.913640756674,-73.9133270039903,-73.9134890381997,-73.9134707264901,-73.9132965103048,-73.9136383462035,-73.9136310285275,-73.9136608933892,-73.9136503020276,-73.9135780820087,-73.9134982641367,-73.9133835175516,-73.9133762053867,-73.9133383546094,-73.9133517559874,-73.913271175111,-73.9133869327257,-73.9131989162876,-73.9131843008117,-73.9133539907785,-73.9133564397609,-73.9132638382419,-73.9132492034726,-73.9130172324187,-73.9130001752337,-73.9132980629286,-73.9132822259617,-73.9133188590903,-73.9133237355469,-73.9133627931573,-73.913356706362,-73.9134751154424,-73.913403213537,-73.9133687650809,-73.913314445938,-73.9132985463573,-73.9132448525482,-73.9131759159591,-73.9131165873372,-73.9129000035977,-73.9129060487109,-73.9127386686234,-73.9127069603352,-73.9128531979508,-73.9127239862236,-73.9127489095881,-73.912886934854,-73.9129259657374,-73.9129217554562,-73.9130969130689,-73.9130599440945,-73.9129903429,-73.9129286893925,-73.9128140127467,-73.9127709317324,-73.9126741470971,-73.9125680940864,-73.9124368547521,-73.9122678192515,-73.9121213047698,-73.9119575384141,-73.9117626332563,-73.9115842768934,-73.9115783655671,-73.9118119539088,-73.9121604026645,-73.9123093997728,-73.9123215242301,-73.9125417018243,-73.9125280177496,-73.9125051581593,-73.9125141069241,-73.912306020751,-73.9122551466251,-73.9122521842669,-73.9120242222258,-73.9118294147914,-73.9116518923066,-73.9116485592092,-73.9115770834805,-73.9115741222559,-73.9115596471397,-73.9115441118299,-73.9116227784925,-73.9116256878661,-73.9120862627355,-73.9120879377322,-73.9121987574071,-73.9122096646703,-73.9122320888062,-73.9122569063315,-73.9122757464331,-73.912295598964,-73.9123186078849,-73.912342511006,-73.9123614627513,-73.9123840602915,-73.9124028406286,-73.9124356002454,-73.9124505877854,-73.9125031148365,-73.9126109867653,-73.912572904076,-73.9125588994303,-73.9125912998566,-73.9125188925805,-73.9124888282043,-73.9124752877759,-73.9124900672872,-73.9124793898826,-73.9124593363615,-73.9124079292691,-73.9124011270447,-73.9122953683368,-73.9122929248291,-73.9122584131131,-73.9122524196074,-73.9121284666316,-73.9121179120215,-73.9120873814935,-73.9120601313176,-73.9120334980105,-73.9119984503387,-73.9119731140574,-73.9119408037157,-73.9119203606018,-73.9118845971897,-73.9118697794801,-73.9118263007669,-73.911811189461,-73.9117811674936,-73.9117597752543,-73.9117202557417,-73.9117010325299,-73.9116604199448,-73.9116378201391,-73.9116000771785,-73.9115697693314,-73.911543613613,-73.9115150592302,-73.9114923292104,-73.9114618082355,-73.9114363206478,-73.9114047315496,-73.911364608642,-73.9113377030437,-73.9113057425235,-73.9112807553814,-73.9112492528857,-73.9112237960785,-73.9111897377733,-73.9111750547642,-73.9111346338553,-73.911112836378,-73.9111101227647,-73.9110492415209,-73.9110172449767,-73.910972696629,-73.9109595759846,-73.9109522497183,-73.9109400798246,-73.9109565554934,-73.9109463434671,-73.9108935517123,-73.9108863935303,-73.9108653658578,-73.910876833782,-73.9109875275015,-73.910981655004,-73.9110308200309,-73.9110514931488,-73.9115095375722,-73.911519571944,-73.9115423436918,-73.9115113505712,-73.9110845383308,-73.9110649524614,-73.911052894986,-73.911050831858,-73.9109445390473,-73.9109288688255,-73.9109162676306,-73.9109399963992,-73.9109600866328,-73.9109586354268,-73.9111202277719,-73.9113224366003,-73.911552225948,-73.911555291408,-73.9114856913811,-73.9114897901589,-73.9109155341383,-73.910758308465,-73.9107422983945,-73.91073679023,-73.9107493938426,-73.9107512397226,-73.9107022786896,-73.9106838822212,-73.9106611494385,-73.9106249117812,-73.9105976573655,-73.9105785304057,-73.9105432601986,-73.9105251165239,-73.9105017466704,-73.9104688587273,-73.9104422826864,-73.9104121722566,-73.9103861422628,-73.9103523545553,-73.9103208378816,-73.9102963020476,-73.910270324585,-73.9102424456104,-73.9102148044882,-73.9101893847206,-73.9101512395692,-73.9101326808392,-73.910093260679,-73.9100897931181,-73.910052880528,-73.9100461201669,-73.9099910825552,-73.9099658867758,-73.9099316760779,-73.9099119208131,-73.9098775546913,-73.9098631177172,-73.9098152811976,-73.9097937958812,-73.9097505190227,-73.9097384814668,-73.9097163513892,-73.9096875029287,-73.9096600741146,-73.9096395641649,-73.9096074956579,-73.9095865311005,-73.9095575254529,-73.9095296334502,-73.9094999608391,-73.9094689512308,-73.9094369077679,-73.9094219473662,-73.9093931850543,-73.9093688867897,-73.9093359855484,-73.909307090233,-73.9092895802568,-73.9092614174049,-73.9092328210496,-73.9092051264278,-73.9091840479752,-73.9091507246452,-73.9091330333045,-73.9090940335634,-73.9090734270739,-73.9090442723399,-73.9090532806522,-73.9090368953053,-73.9090184856708,-73.9090320275445,-73.9090393117698,-73.9090499955246,-73.9090687409044,-73.9095731102396,-73.9095971923446,-73.9096261497804,-73.9096407019207,-73.9096595211301,-73.9096880701234,-73.9097241752419,-73.9097312899562,-73.9097581163751,-73.9097846079937,-73.909804386964,-73.9098333188822,-73.9098548705371,-73.9098817307991,-73.9099068027643,-73.9099266067868,-73.9099493943052,-73.9099753350228,-73.909991516507,-73.910022365305,-73.9100441178693,-73.9100671150938,-73.9100951265758,-73.9101110609698,-73.9101328350718,-73.910159964161,-73.9101801924354,-73.9102091698283,-73.9102271167347,-73.9102510064443,-73.9102763390989,-73.9103029227872,-73.9104293486064,-73.910435474305,-73.9107115445703,-73.9107226252371,-73.9107156541623,-73.9107063305395,-73.9106587683433,-73.9106282960659,-73.9106207028889,-73.910589592716,-73.9105813374669,-73.9105500789177,-73.9105408852925,-73.9105103721247,-73.9104999086447,-73.9104711442972,-73.9104599776398,-73.9104274492331,-73.9104165059041,-73.9103860835126,-73.9103748320067,-73.9103380201244,-73.9103266620085,-73.9102957654785,-73.9102857910784,-73.9102505169935,-73.9102429317267,-73.9102105688297,-73.9101967479394,-73.9101699854068,-73.9101537841734,-73.9101289575217,-73.9101041862617,-73.9100813816578,-73.9100559535992,-73.9100402025379,-73.9100192395156,-73.9099962704904,-73.9099726804952,-73.9099510015438,-73.9099325120635,-73.9099042677671,-73.9098877157083,-73.909862033319,-73.9098204767692,-73.9098196478584,-73.9098003270455,-73.9097800893953,-73.9097536075464,-73.9097321626885,-73.9097081269057,-73.9096923707813,-73.9096520653915,-73.9096457348044,-73.9096336189861,-73.9096320682116,-73.9095198917507,-73.9095175536104,-73.9094270433497,-73.9094246939597,-73.9094313826584,-73.9094192457984,-73.909409343046,-73.9102518111957,-73.9102805229684,-73.910614143214,-73.91072006392,-73.9107312301327,-73.9106793461234,-73.9106010511823,-73.9104788592528,-73.9103472587772,-73.9103177976558,-73.9102926926834,-73.9102148318404,-73.9101213357175,-73.9100478549404,-73.9099718498461,-73.9099228895697,-73.9098764754276,-73.9098470289373,-73.9098107226289,-73.9097738577114,-73.9097469694355,-73.9097044035396,-73.9096630633823,-73.9095836939123,-73.909485660626,-73.9094014044668,-73.9093566680788,-73.9092749984076,-73.9092462545629,-73.9092042753668,-73.9091411824771,-73.909093643843,-73.9090408322154,-73.9089879493969,-73.9089666170899,-73.908945247947,-73.90888436065,-73.9087971052295,-73.908709712997,-73.908606386626,-73.9085770909385,-73.9086084653253,-73.9085421872401,-73.908454795471,-73.9084097956865,-73.9083593133267,-73.9082667174598,-73.9081953736763,-73.9081186656986,-73.9081316357311,-73.9080892190454,-73.9080363728425,-73.9079941774226,-73.9079625262747,-73.907898960972,-73.9078273286774,-73.9078694105898,-73.9078427909539,-73.9077476421852,-73.9076444991477,-73.9075916058584,-73.907525779151,-73.9074916020999,-73.9074123090974,-73.9073379766733,-73.9072769481949,-73.9072053502288,-73.9071445884411,-73.9070416527308,-73.9069756280333,-73.9069121435514,-73.9068726580547,-73.9067961340534,-73.9067378181099,-73.9066687813675,-73.9065286095346,-73.9064412969787,-73.9063542142878,-73.9062748514886,-73.9061980264683,-73.9061212939207,-73.9060763858697,-73.9060418500412,-73.9059837744438,-73.9059493324716,-73.9059465048718,-73.905896196087,-73.9058407988728,-73.9057932143496,-73.9057428703926,-73.9056741111668,-73.9056451726156,-73.9056028013029,-73.9055685783886,-73.9054629780363,-73.9052808301754,-73.9052093113666,-73.9051619002834,-73.9049058594987,-73.9046862998883,-73.9044851902119,-73.9043526186992,-73.9042996667813,-73.9042231325221,-73.9041361203438,-73.9040649402469,-73.9040493302895,-73.9039701297796,-73.9038116827317,-73.9037563213804,-73.9037248229739,-73.9037277449889,-73.9037064653663,-73.9036744662182,-73.903639777592,-73.9036024939532,-73.9035418014132,-73.9034732172098,-73.9034389011643,-73.9033198191293,-73.9032610350775,-73.903179976668,-73.9031213774586,-73.9030788798216,-73.903015036866,-73.9029935531539,-73.9029296645026,-73.9028708755391,-73.9027963386276,-73.9027113411626,-73.9025514999138,-73.9024820405439,-73.9024236045887,-73.9023386286848,-73.9022322410404,-73.902200202169,-73.9021364769099,-73.9019286828342,-73.9018170992619,-73.9016522984049,-73.9015514574765,-73.9015038338917,-73.9014026405001,-73.9013123069385,-73.9011636774121,-73.9010574297317,-73.9009667648136,-73.9008390318569,-73.9007116051781,-73.9006002113871,-73.9004195899776,-73.900132176409,-73.8998179892353,-73.8996357586245,-73.8994890199782,-73.899590308821,-73.8996991956042,-73.8998155845945,-73.8999393734697,-73.9000704534091,-73.9002087091887,-73.900354019115,-73.9005062556392,-73.9006652849595,-73.900830967309,-73.9010031570797,-73.9011817029494,-73.9019009310352,-73.9020593611875,-73.9021650100405,-73.9023353294384,-73.9024969040977,-73.9027871225686,-73.9029249435091,-73.9031660464263,-73.9034774716655,-73.9037857188094,-73.9040823703496,-73.9041527175597,-73.9048516225612,-73.9052452586827,-73.9053798489386,-73.9056255159958,-73.9058500735001,-73.9059437172881,-73.9064749109102,-73.9065787287486,-73.9067549321042,-73.9070156793696,-73.9070827447786,-73.9071633957955,-73.9071945075739,-73.9073351223029,-73.9074506822383,-73.9076386832031,-73.9077757111496,-73.9078430302393,-73.9078753644682,-73.9079021860949,-73.9079385640278,-73.9080293542757,-73.9081797470745,-73.9082423204567,-73.9082809116004,-73.9082832983576,-73.9083628130422,-73.9083859411146,-73.9084250129616,-73.9084672977055,-73.908489570756,-73.9084918912251,-73.9083515517494,-73.9082516232515,-73.9082383551573,-73.9082366844553,-73.90817173567,-73.9081233187932,-73.9081195215006,-73.9080916297229,-73.908076704318,-73.9080637342068,-73.9080655223171,-73.9080773021823,-73.9081154504348,-73.9081781316708,-73.9082657228423,-73.9083783478719,-73.9085158709206,-73.908677916435,-73.9088638092002,-73.9090726561231,-73.9093033056542,-73.9095544128517,-73.9098244111122,-73.9101115852793,-73.9104141071618,-73.9107300235754,-73.9110573585828,-73.9113941044518,-73.9118743668229,-73.9119061583975,-73.911918117836,-73.9119727843174,-73.9119671793707,-73.9119566271885,-73.9119370481068,-73.9119149356208,-73.9118963649721,-73.9118893612412,-73.9118873647621,-73.9118824889412,-73.9118750542976,-73.9118731269851,-73.9118631803942,-73.9118532688722,-73.9118469436141,-73.9118433908045,-73.9118366883188,-73.911826736384,-73.9118096895506,-73.9117877938878,-73.9117546110132,-73.9117162363818,-73.9116762094347,-73.9116606646326,-73.9116343454447,-73.9116306983573,-73.9116287232521,-73.9116186647837,-73.9115924344319,-73.9115831567731,-73.9115810492887,-73.911576774498,-73.9115798821267,-73.9115946134969,-73.9116019490054,-73.9116117837217,-73.9116483770056,-73.9116687154504,-73.9116783266059,-73.9117085573094,-73.9117309949561,-73.9117403129149,-73.9117711179017,-73.9118037815628,-73.9118277557483,-73.911845001611,-73.9118720568983,-73.9118821586251,-73.9118919257536,-73.9119018954122,-73.9119113838673,-73.9119108013531,-73.9119044455011,-73.9118840540437,-73.9118665939464,-73.9118618100231,-73.911863700339,-73.9118678588675,-73.9118755656036,-73.9118784336509,-73.9118728889099,-73.9118673769556,-73.9118593105859,-73.9118521617203,-73.9118504942186,-73.9118562138099,-73.9118577978271,-73.911855204609,-73.9118481101666,-73.9118439402619,-73.9118407333417,-73.9118134253642,-73.9117958260046,-73.9117541901642,-73.9117294908857,-73.9117019174995,-73.9116911952923,-73.911688554926,-73.9116921778698,-73.9116929945118,-73.9117045685122,-73.9117180381834,-73.9117234450221,-73.9117213148528,-73.9117191842418,-73.9117114260784,-73.9116991629255,-73.9116929550831,-73.9116974068571,-73.9117009134839,-73.9117027678327,-73.9117091517762,-73.9117190942474,-73.9117290255654,-73.9117318942906,-73.9117325093061,-73.9117241135686,-73.9117192808354,-73.9117031450337,-73.9116976285104,-73.9116930243378,-73.9116749306458,-73.9116763655099,-73.9116801316113,-73.9116871419638,-73.9116973704342,-73.9117095231409,-73.9117191149534,-73.9117213410074,-73.9117158483983,-73.9117123115074,-73.9116955715612,-73.9116871757854,-73.9116887308228,-73.9116960606179,-73.911707564857,-73.9117162070393,-73.9117219311672,-73.9117180397537,-73.9117035176243,-73.9116818984236,-73.9116776712768,-73.91168470756,-73.9116988350351,-73.911699462085,-73.9116936200787,-73.9116793867526,-73.9116612450379,-73.9116450268851,-73.9116198142785,-73.9116116887786,-73.9115997350567,-73.9115913640586,-73.9115803876511,-73.9115725943545,-73.9115701795048,-73.9115781774767,-73.9115839247949,-73.9115941441235,-73.9116008254478,-73.9116010492829,-73.9115944057259,-73.9115798597866,-73.9115803130229,-73.9115848068932,-73.9115916263416,-73.9115918928345,-73.9115792568454,-73.9115714665766,-73.9115703829972,-73.911563334329,-73.9115620078216,-73.9115709344824,-73.9115721997419,-73.9115708509133,-73.9115624215453,-73.9115565749761,-73.911553616626,-73.9115570652834,-73.9115602193327,-73.9115579208534,-73.9115455939725,-73.9115374514127,-73.9115341280052,-73.9115315317106,-73.911528176349,-73.9114995276518,-73.9114857900562,-73.9114902834027,-73.9114994286716,-73.911504217726,-73.9115012754567,-73.9114999805601,-73.9115030436487,-73.911510156695,-73.9115519429467,-73.9115682301968,-73.9115905547574,-73.9116014447899,-73.9116042991909,-73.9116006977331,-73.9115941804483,-73.9115907097724,-73.9115910301358,-73.9115988299734,-73.911646187886,-73.9116543903516,-73.911669007738,-73.9116836452893,-73.9116970064862,-73.9117037400628,-73.9117097959365,-73.911707061367,-73.9117075030943,-73.9117122141014,-73.9117206820519,-73.9117240832171,-73.9117215309299,-73.9117150576562,-73.9116990391291,-73.9116802606626,-73.9116801243658,-73.9116771198131,-73.911679755852,-73.9116843620905,-73.9116884092919,-73.9116899148634,-73.911701055142,-73.9117114862049,-73.9117219511953,-73.911721688759,-73.9117218105556,-73.911728112255,-73.9117351722421,-73.911742989869,-73.9117658107784,-73.9117685787144,-73.9117720834853,-73.9117763187591,-73.9117812678743,-73.9117869157096,-73.9117932438433,-73.911797357151,-73.9118021232351,-73.9118074775577,-73.9118133516169,-73.91181966657,-73.9118263415901,-73.9118342136107,-73.9118422906361,-73.911850485656,-73.9118587081337,-73.9118627571447,-73.911866645357,-73.9118702174455,-73.9118733255875,-73.9118758444038,-73.9118776698572,-73.9118766600262,-73.9118750381183,-73.911872701339,-73.9118696836153,-73.911866254237,-73.9118636680839,-73.9118619399511,-73.9118610802322,-73.9118610947074,-73.9118619825692,-73.9118650877911,-73.911869041339,-73.9118738292068,-73.9118794217832,-73.911885794733,-73.9118920142431,-73.9118974140055,-73.9119019619992,-73.911905626867,-73.9119083884633,-73.9119255970582,-73.9119289270029,-73.9119314555423,-73.9119331787577,-73.9119314584419,-73.911928931693,-73.9119256020683,-73.9119214812539,-73.9119165778638,-73.9119109062239,-73.911905124942,-73.9119001029574,-73.9118958475487,-73.9118923657824,-73.9118896627463,-73.9118877426439,-73.9118866094646,-73.911886200807,-73.9118887680061,-73.911892066311,-73.911896084992,-73.9119008117813,-73.9119062337508,-73.9119123342367,-73.911948841201,-73.9119544556616,-73.9119593358629,-73.9119634486859,-73.9119667599132,-73.9119692454409,-73.9119707313167,-73.9119730246225,-73.9119760931462,-73.9119798958833,-73.9119843781934,-73.9119894825744,-73.9119968178345,-73.9120032877257,-73.9120088461729,-73.9120134550135,-73.9120173558201,-73.9120204856179,-73.9120228275477,-73.9120243636531,-73.9120250865256,-73.912024988321,-73.9120249514191,-73.9120238438381,-73.9120216656332,-73.9120184274094,-73.912011660131,-73.9120055404427,-73.9120001029023,-73.9119953803106,-73.9119914004148,-73.9119881907456,-73.9119857671882,-73.9119841451869,-73.911984550384,-73.91198574769,-73.9119877279342,-73.9119904810667,-73.9119939906663,-73.9119982350321,-73.9120292575224,-73.9120337013521,-73.9120372447207,-73.9120398681337,-73.9120415573735,-73.9120423048166,-73.9120421063535,-73.9120369423419,-73.9120326097495,-73.9120291145445,-73.9120303641273,-73.9120308886156,-73.9120306849936,-73.9120297533259,-73.9120280996085,-73.912023613953,-73.912019813478,-73.9120167133915,-73.9120143284676,-73.9120126728226,-73.9120119329853,-73.9120120262813,-73.9120129516458,-73.9120147064698,-73.9120126440893,-73.9120115134725,-73.9120113161932,-73.9120120507474,-73.9120137171702,-73.9120174160704,-73.9120218705195,-73.9120270669305,-73.9120329939121,-73.912039636994,-73.9120689913081,-73.9120719972905,-73.9120738212379,-73.9120744583701,-73.9120750473432,-73.9120748293107,-73.9120738054029,-73.9120719776278,-73.9120693464533,-73.9120551359563,-73.9120527443818,-73.912049590565,-73.9120456848722,-73.9120410356937,-73.9120356542739,-73.9120305652397,-73.9120243377104,-73.9120169791869,-73.912015216836,-73.9120145717721,-73.9120142372172,-73.9120140482977,-73.9120146479313,-73.9120160361731,-73.9120182045055,-73.9120210442553,-73.9120211654342,-73.9120205405206,-73.9120191775284,-73.9120171040248,-73.9120143561459,-73.9120097729926,-73.912005838305,-73.9120026088655,-73.9120001331146,-73.9119984476273,-73.9119946711583,-73.9119917340344,-73.9119896422329,-73.9119884028342,-73.9119880213808,-73.9119884946226,-73.9119898263442,-73.91199201066,-73.911995037946,-73.9119989034138,-73.9120189414443,-73.9120243967626,-73.9120291418621,-73.912033173245,-73.9120364871921,-73.912039080208,-73.9120423401564,-73.9120463851029,-73.9120512045402,-73.9120567862026,-73.9120631129881,-73.9120701702087,-73.9120779392197,-73.9120887623525,-73.9121002992559,-73.9121124844895,-73.9121252545813,-73.9121303365778,-73.9121348299926,-73.9121386426114,-73.9121416919014,-73.9121439206203,-73.9121452798793,-73.9121762226843,-73.9121851171624,-73.9121932486881,-73.912200607183,-73.9122071759743,-73.9122129495995,-73.912217915564,-73.9122220664276,-73.9122295396065,-73.9122361787787,-73.9122419815482,-73.9122469415631,-73.9122510568668,-73.9122543208877,-73.9122570881906,-73.9122605681485,-73.9122647553016,-73.9122696397955,-73.912275210232,-73.9122814541188,-73.9122883580801,-73.9122959076394,-73.9123040848107,-73.9123128731363,-73.9123268081394,-73.9123399314985,-73.9123522089714,-73.9123636122518,-73.9123727439431,-73.9123811261692,-73.9123887330367,-73.9123955388756,-73.9124015283447,-73.9124073222242,-73.9124119397986,-73.9124153650891,-73.9124166505988,-73.9124172120585,-73.9124170447193,-73.9124161477926,-73.912414536749,-73.9124122347504,-73.9124092746252,-73.9124052432342,-73.9124018848584,-73.9123992347285,-73.9123973203939,-73.9123961628081,-73.9123957728196,-73.9123961527011,-73.9123982137779,-73.9124012113343,-73.9124051173296,-73.9124099008537,-73.9124155145201,-73.9124249649989,-73.912435214132,-73.9124462456873,-73.9124563380904,-73.9124672447436,-73.9124789524932,-73.9124896983524,-73.9124996606475,-73.9125088202971,-73.9125171505298,-73.9125246329206,-73.9125312514717,-73.9125369882005,-73.9125406527255,-73.9125450815883,-73.9125502638344,-73.9125561904835,-73.9125628497021,-73.9125702278972,-73.9125783444475,-73.9125872607522,-73.9125969546517,-73.9126074044242,-73.912618582855,-73.9126822012698,-73.9127038189189,-73.9127247724683,-73.9127450254625,-73.9127645530926,-73.9127798594126,-73.9127945037966,-73.9128084601213,-73.9128217055562,-73.9128265439699,-73.9128321929203,-73.9128386129114,-73.9128457585103,-73.9128609868853,-73.9128757055138,-73.9128898963912,-73.912895387577,-73.9129002134396,-73.912904327668,-73.9129076923162,-73.9129111585425,-73.912915208599,-73.9129197575117,-73.9129247121594,-73.9129299662194,-73.9129381936288,-73.9129458916705,-73.9129529797442,-73.9129593864882,-73.9129650429628,-73.9129878502072,-73.9130099986676,-73.9130314703376,-73.9130354003512,-73.9130387449909,-73.9130414322636,-73.9130433978788,-73.9130445997505,-73.9130450085435,-73.9130446180051,-73.9130438518032,-73.9130439722479,-73.9130461086365,-73.9130489895877,-73.9130526032861,-73.9130569280223,-73.9130619464842,-73.9130676310278,-73.9130739546652,-73.9130808873288,-73.9130883928005,-73.9130973506204,-73.9131058559836,-73.9131138656256,-73.9131213424388,-73.9131282526154,-73.9131372191081,-73.9131451565956,-73.9131520161545,-73.9131558695601,-73.9131607375463,-73.9131665922705,-73.9131704743165,-73.9131750502434,-73.9131802618846,-73.9131860409555,-73.9131923125738,-73.9131955046469,-73.9131980027167,-73.9131997609416,-73.9132007491004,-73.9132009442158,-73.9132003450819,-73.9131987395235,-73.9131982336503,-73.9131988301899,-73.9132029436695,-73.913207762452,-73.9132132698725,-73.913219450367,-73.9132269572388,-73.9132351618312,-73.9132440202371,-73.9132534806396,-73.9132594433088,-73.9132647242254,-73.9132692880556,-73.9132731071662,-73.9132761567814,-73.9132869742407,-73.9132891624083,-73.9132904963674,-73.9132909673992,-73.9132905720593,-73.9132906914466,-73.9132917846997,-73.9132938496629,-73.9132934681482,-73.9132941042277,-73.9132957485553,-73.9132983843204,-73.913301978881,-73.9133073070196,-73.9133132318292,-73.9133197274145,-73.9133267557979,-73.9133342796507,-73.9133422583479,-73.9133506517036,-73.913373779839,-73.9133860835059,-73.9133976309504,-73.9134084092348,-73.9134184062952,-73.9134276107307,-73.9134302311595,-73.9134321028284,-73.9134332104108,-73.9134335460657,-73.9134331081,-73.9134318974597,-73.9134299249803,-73.9134278975783,-73.9134268803897,-73.9134268822816,-73.9134279017939,-73.9134299317493,-73.9134357024326,-73.9134423569444,-73.9134498759857,-73.913458238283,-73.9134627383963,-73.9134679527196,-73.9134738529497,-73.9134804039764,-73.9134875719994,-73.9134953131057,-73.9135160129813,-73.9135359972078,-73.9135552541546,-73.9135591464792,-73.9135637239006,-73.9135689249513,-73.9135746833274,-73.9135809221581,-73.9135875619378,-73.9135948917838,-73.9136015376346,-73.9136074672346,-73.9136126546961,-73.9136170712788,-73.9136206974774,-73.9136275439903,-73.9136351353649,-73.9136434637161,-73.9136481541126,-73.9136521076035,-73.9136552855848,-73.9136576569219,-73.9136592012544,-73.9136599034983,-73.9136597545012,-73.913654622641,-73.9136503502018,-73.9136469631884,-73.9136444799075,-73.913642918456,-73.9136439303304,-73.9136456239688,-73.9136479566182,-73.913650862888,-73.9136542630815,-73.9136580643044,-73.91366216134,-73.9136664456539,-73.91366677329,-73.9137118834433,-73.9137398578549,-73.9137676257639,-73.9137951658583,-73.9138224537498,-73.9138494696654,-73.9138564479819,-73.9138632249196,-73.9138697238006,-73.9138758747671,-73.9138816046716,-73.9138868493848,-73.9138915533576,-73.9138956606042,-73.9138991250328,-73.9139015792636,-73.9139047748558,-73.9139086202827,-73.9139129982791,-73.9139177821121,-73.9139228280989,-73.9139279872609,-73.9139419778777,-73.913955815895,-73.9139694637395,-73.9139828774668,-73.9139960234632,-73.9140159093214,-73.914035140205,-73.9140536888887,-73.9140715334176,-73.914092317479,-73.9141125341551,-73.9141321654416,-73.9141511977288,-73.9141696123517,-73.9141873948224,-73.9141976307064,-73.9142070300541,-73.914215567629,-73.914223221061,-73.9142299703917,-73.9142357980833,-73.91424010991,-73.9142437083947,-73.914246559096,-73.9142486368116,-73.9142499220557,-73.9142504028121,-73.9142500747614,-73.9142455595355,-73.9142403740325,-73.9142345349943,-73.9142280646569,-73.9142272851875,-73.9142272913646,-73.9142280818037,-73.9142296265435,-73.9142318659421,-73.9142347157294,-73.914238063264,-73.9142417793986,-73.9142457208905,-73.9142649680164,-73.9142843360978,-73.9143037956834,-73.9143123007692,-73.9143206603747,-73.9143287797951,-73.9143365737824,-73.9143439522626,-73.9143508416565,-73.9143589072929,-73.9143662694607,-73.9143728792078,-73.9143786948325,-73.9143836790381,-73.9143878000207,-73.9143910303774,-73.9143930041245,-73.9143942090502,-73.9143946164819,-73.9143942168692,-73.9143930178079,-73.9143910512845,-73.9143883633448,-73.9143850149718,-73.9143789213537,-73.9143734227473,-73.9143685818539,-73.9143644503952,-73.9143610763585,-73.9143584971887,-73.9143567422005,-73.9143558290628,-73.9143568038785,-73.914358722136,-73.9143615689791,-73.9143653170206,-73.9143699346934,-73.9143782585451,-73.9143857916604,-73.9143924844364,-73.9143982969349,-73.9144031905459,-73.9144066843662,-73.914409433302,-73.9144114200535,-73.9144126281986,-73.9144130490125,-73.9144097503776,-73.9144071868314,-73.9144054444473,-73.9144045796463,-73.9144046244552,-73.914405574642,-73.9144074002569,-73.9144156495808,-73.9144248245273,-73.9144348458319,-73.914441642985,-73.9144479284816,-73.9144536353436,-73.9144587078049,-73.9144630848354,-73.9144641180745,-73.9144640431279,-73.9144628640346,-73.9144649500133,-73.9144677412069,-73.9144712319451,-73.9144754049073,-73.9144802462852,-73.9144857350229,-73.9144918526943,-73.9144985736251,-73.9145029300601,-73.9145080021394,-73.9145137409179,-73.9145200860183,-73.9145269733206,-73.9145343323228,-73.9145420739161,-73.9145497871489,-73.9145573047849,-73.9145602378311,-73.9145621004273,-73.9145628573353,-73.9145624950751,-73.9145630595414,-73.9145643695911,-73.9145664136387,-73.9145691772368,-73.9145726426407,-73.9145840411137,-73.9145961413169,-73.9146089298668,-73.9146223920615,-73.9146365116574,-73.9146512719741,-73.9146666563287,-73.9146826471603,-73.9146868281469,-73.9146915987078,-73.914696886166,-73.9147026009053,-73.9147086548418,-73.9147149506424,-73.9147213841548,-73.9147278573665,-73.914734265656,-73.9147439307897,-73.914753452997,-73.9147627716323,-73.9147718352837,-73.9147805857282,-73.9147889724421,-73.9147969438054,-73.9148044534753,-73.914808404132,-73.9148131201221,-73.9148185417417,-73.9148245971976,-73.9148312091909,-73.9148382935982,-73.9148457577195,-73.9148498609935,-73.9148539505043,-73.9148578618677,-73.9148614415052,-73.914864546417,-73.9148670538469,-73.9148688623802,-73.9148687643142,-73.914867668024,-73.9148655786262,-73.9148638975294,-73.9148629690843,-73.9148627986275,-73.9148633904068,-73.9148647389892,-73.9148668341136,-73.9148696551829,-73.9148731831401,-73.9148773905711,-73.9148857142996,-73.9148947354345,-73.9149044250006,-73.9149147560003,-73.9149234443169,-73.9149310281033,-73.9149374676563,-73.91494867331,-73.9149588192013,-73.9149678871328,-73.9149916248217,-73.9149981362713,-73.9150055411542,-73.9150138078725,-73.9150229010988,-73.9150304621422,-73.9150374429603,-73.9150438123807,-73.915049550219,-73.915054633434,-73.9150590440427,-73.9150627656017,-73.9150776010398,-73.9150915522541,-73.9151046047694,-73.9151106105252,-73.9151158490517,-73.9151202905107,-73.9151239136417,-73.9151266995989,-73.9151286291024,-73.9151260640626,-73.9151251089277,-73.9151250150574,-73.91512578544,-73.9151273986691,-73.9151298137693,-73.915132974595,-73.9151367988361,-73.9151435643307,-73.915150758119,-73.9151583215506,-73.9151662016874,-73.9151745837049,-73.91518251481,-73.915189920761,-73.915196724909,-73.9152028585199,-73.9152082627623,-73.9152150246411,-73.9152224163841,-73.9152304127473,-73.9152612915435,-73.9152657660481,-73.9152698729037,-73.9152735282044,-73.9152766487228,-73.9152791732208,-73.9152810448596,-73.9152822241716,-73.915285278068,-73.9152893551291,-73.9152944292779,-73.9153005489014,-73.9153071579587,-73.9153141870409,-73.9153215662952,-73.9153329798164,-73.9153447011838,-73.9153566317336,-73.9153623700253,-73.9153678381532,-73.9153729398914,-73.915377592433,-73.9153817142961,-73.9153995841755,-73.9154261279682,-73.9154447156952,-73.9155344739183,-73.915565852499,-73.9156039447752,-73.9156344942327,-73.9156731186942,-73.9157312968609,-73.9157838779378,-73.9158003375755,-73.9158041067247,-73.9158180528162,-73.9158535895655,-73.9158850140668,-73.9159143302012,-73.9159492348887,-73.9160369012686,-73.9160636457982,-73.9161137232452,-73.9161655196713,-73.9162078670344,-73.9162422425337,-73.9162762465608,-73.9162827623351,-73.9162972731159,-73.9163218190347,-73.9163377606311,-73.9163513221006,-73.9163561429635,-73.916371583182,-73.9163828159806,-73.9163993395496,-73.916420427806,-73.9164368010448,-73.9164544411382,-73.9164773000227,-73.9164893596636,-73.9165068142587,-73.9165250671892,-73.9165470343392,-73.916561584875,-73.9165708373062,-73.9165810191711,-73.9166161102276,-73.9166277528089,-73.9166353058762,-73.9166516433371,-73.9166698615986,-73.9166819982058,-73.9166977097354,-73.9167089854257,-73.9167221992638,-73.916737774248,-73.9167494102651,-73.9167621356519,-73.9167726001109,-73.9167849802828,-73.9168344055606,-73.9168626221947,-73.9168766160552,-73.9168770324865,-73.9168723040669,-73.9168646609248,-73.9168591408242,-73.9168586588729,-73.9168635775906,-73.9168713368964,-73.9168861909504,-73.9169038958429,-73.916919049059,-73.9169346735718,-73.9169513859822,-73.9169697627812,-73.9169883181112,-73.9170088109341,-73.9170255893388,-73.9170704074154,-73.9170912851347,-73.9171136757814,-73.9171388701236,-73.917158587198,-73.9171656255817,-73.9171647511229,-73.9171603838178,-73.9171570935442,-73.9171607583583,-73.9171670906804,-73.9171737867899,-73.9171913344825,-73.9172176133197,-73.917231558833,-73.9172466870697,-73.9172634664249,-73.9172772187407,-73.9172869351116,-73.9173005756603,-73.9173129581608,-73.9173187482439,-73.9173203243177,-73.9173239521627,-73.9173338821583,-73.9173483850213,-73.9174321152555,-73.9175046142532,-73.917542768612,-73.9175664452153,-73.9175869503373,-73.9176085345767,-73.9176267079218,-73.9176680631817,-73.9176926435318,-73.9177056653233,-73.9177092903134,-73.9177080138957,-73.9176843588364,-73.9176792535393,-73.9176840640311,-73.9176961462693,-73.9177126212793,-73.9177454576068,-73.9177812363041,-73.917795218532,-73.9178263749154,-73.917836588592,-73.9178452953707,-73.9178727996214,-73.9178929994365,-73.9179048841773,-73.9179195117059,-73.9179264385235,-73.9179339447675,-73.9179458738325,-73.9179595187873,-73.9179747044879,-73.9179904241556,-73.9180077656355,-73.918035006332,-73.918061820368,-73.9180751407819,-73.9180915283441,-73.9181142243024,-73.91812603535,-73.9181318293468,-73.9181338391021,-73.9181330924772,-73.9181327846058,-73.9181335609574,-73.9181417573795,-73.9181485581497,-73.9181889556136,-73.9182081464091,-73.9182225101546,-73.9182400366665,-73.9182488118397,-73.9182644788392,-73.9183054368037,-73.9183287507137,-73.9183770355273,-73.9184075131228,-73.9184378891984,-73.9185091212503,-73.9185293447795,-73.9185447788515,-73.9185560348778,-73.9185733692309,-73.918591903952,-73.9186091837388,-73.918620999288,-73.9186360230482,-73.9186685591237,-73.9186782867599,-73.9186931220332,-73.9187572305969,-73.9187842240964,-73.9188040970477,-73.9188251962707,-73.9188373646786,-73.9188477987169,-73.9188790185029,-73.9188940203799,-73.9189114437647,-73.918937298436,-73.9189616109319,-73.9189805985433,-73.9189823257694,-73.9189936735285,-73.9190048336398,-73.9190518481636,-73.9190694772531,-73.9190747807222,-73.9190859350909,-73.9190980529106,-73.9191008228612,-73.9191079478484,-73.9191635337563,-73.91917533855,-73.919178141683,-73.9191770574994,-73.9191634367696,-73.9191413597034,-73.9191210477844,-73.9191117134947,-73.9191114557779,-73.9191160236534,-73.919133696612,-73.919185907099,-73.9192071479771,-73.9192207157129,-73.9192325789721,-73.9192419297451,-73.9192536298802,-73.9192689379232,-73.9192847193516,-73.91930014678,-73.9193074017462,-73.9193076191793,-73.919310687955,-73.9193188674929,-73.9193378816892,-73.9193518205465,-73.919359210494,-73.9193597929412,-73.9193553319237,-73.9193230998261,-73.9193136305065,-73.9193026500493,-73.9192980448084,-73.9192979805831,-73.9193035689007,-73.9193207124202,-73.9194033608011,-73.9194177594273,-73.9194285176335,-73.9194438593342,-73.919448885459,-73.9194499175549,-73.9194519650373,-73.9194621474115,-73.9194835657343,-73.919511179236,-73.9195427157373,-73.9195731752888,-73.9196246712143,-73.9196742619384,-73.9196935323066,-73.9197120904498,-73.919728693952,-73.9197428061191,-73.9197624930116,-73.9197767033069,-73.9197825118494,-73.9197807746835,-73.9197726666242,-73.9197598449511,-73.9197537542258,-73.91975014484,-73.9197558270936,-73.9197693575246,-73.9197857005322,-73.9198039208379,-73.9198235209856,-73.9198529261122,-73.9198786538682,-73.919897634889,-73.9199220404841,-73.9199319370965,-73.9199377902387,-73.919943134884,-73.9199576304389,-73.9199779640225,-73.920011580492,-73.9200373220692,-73.9200499243745,-73.920060985755,-73.9200722678312,-73.9200975300688,-73.9201070078637,-73.9201226048244,-73.9201439928501,-73.9201601774403,-73.9201657379814,-73.9201730075279,-73.9201743340783,-73.9201743921243,-73.9201744359529,-73.920169930104,-73.9201511851903,-73.9201294010789,-73.9201088353203,-73.9200978633908,-73.9200981003469,-73.9201083123753,-73.9201277705999,-73.9201459765806,-73.9201807018588,-73.9202292153117,-73.9202524656747,-73.9202745033029,-73.9202864689777,-73.9202933607781,-73.9203028162319,-73.9203137389987,-73.9203357866021,-73.920359560006,-73.920379545077,-73.9203972169382,-73.9204201777607,-73.9204353244498,-73.9204427311025,-73.9204474743678,-73.9204557535982,-73.9204692897883,-73.9204843076467,-73.9205107612078,-73.9205300788218,-73.920550624191,-73.9205779825189,-73.9205952986218,-73.9206277940877,-73.9206554305041,-73.9206664372179,-73.9206684076842,-73.9206678527514,-73.9206699329284,-73.9206755416458,-73.9206839228055,-73.9206975665752,-73.9207239586944,-73.9207393708552,-73.920755036288,-73.9207680709548,-73.9207759900617,-73.9208085186536,-73.9208193541584,-73.9208339723948,-73.9208529867688,-73.9208774719375,-73.9208959393703,-73.9209255289305,-73.9209488139979,-73.9209558979177,-73.9209576160505,-73.9209557669246,-73.920955210087,-73.9209622206436,-73.9209777006381,-73.9209971090961,-73.9210220967272,-73.9210407084196,-73.9210588114722,-73.9210749233248,-73.9210942375575,-73.921124570816,-73.9211408413559,-73.9211491240612,-73.921156980094,-73.9211655983086,-73.9211765195159,-73.9211846275468,-73.9212051531972,-73.9212287038724,-73.9212486875537,-73.9212661098175,-73.9212811513907,-73.9212899603696,-73.921294951692,-73.9212995478703,-73.92131055775,-73.9213207840063,-73.921362780076,-73.9213856126353,-73.9213998701299,-73.9214121072998,-73.9214203434899,-73.9214250446191,-73.9214224428488,-73.9214110524726,-73.9213890714321,-73.9213749738209,-73.9213634645329,-73.9213579059916,-73.9213589029557,-73.9213682902453,-73.9214164536572,-73.9214561720882,-73.9214700235795,-73.9214783014091,-73.9214878069561,-73.9215168998195,-73.9215261209632,-73.921533220599,-73.9215369410667,-73.921535980057,-73.9215381169433,-73.9215485441989,-73.9215596523129,-73.9215697796086,-73.9215870691007,-73.9216081000255,-73.9216269382331,-73.9216409196623,-73.921651160242,-73.9216535155739,-73.9216503245389,-73.921650946481,-73.9216634928246,-73.9216825524792,-73.9217031511561,-73.9217192807532,-73.9217273061777,-73.9217393254988,-73.9217546827089,-73.9217647924982,-73.9217794065531,-73.9217946389654,-73.9218075337209,-73.9218207948173,-73.9218468548937,-73.9218870118012,-73.9219079521378,-73.9219165730451,-73.9219230174412,-73.92193443677,-73.9219496736328,-73.9219649789355,-73.9219726935911,-73.9219745563864,-73.9219850644886,-73.9219888770856,-73.9219910649248,-73.9219942193429,-73.9219985311912,-73.9220042570422,-73.9220138365327,-73.9220244662526,-73.9220355950188,-73.9220413178442,-73.9220458123504,-73.922050275685,-73.9220556792905,-73.9220603668551,-73.922069211262,-73.9220813579041,-73.9220918758037,-73.9221009857617,-73.9221422305458,-73.9221554396351,-73.9221712798768,-73.9221845687261,-73.922196675769,-73.9222305515412,-73.9222553818948,-73.9222676324509,-73.922273717557,-73.9222855220692,-73.9222919241169,-73.9223010639712,-73.9223107830385,-73.9223238587559,-73.9223352407356,-73.9223477078365,-73.9223705577354,-73.922415451752,-73.9224370350868,-73.9224456162315,-73.9224508138356,-73.9224489881639,-73.9224405368449,-73.9224239450019,-73.9224050173529,-73.9223960942728,-73.9223915997438,-73.9223910654596,-73.9223946031271,-73.9224022815045,-73.9224123719518,-73.9224416273324,-73.9224560708449,-73.9224745791333,-73.9224939509948,-73.9225188650542,-73.9225372978731,-73.9225493193939,-73.9225533116609,-73.9225553226529,-73.922558484741,-73.9225643159703,-73.9225888275678,-73.9225980450361,-73.9226093186134,-73.9226231151937,-73.9226349294418,-73.9226440024456,-73.9226506281865,-73.9226622277746,-73.9226744437425,-73.9226925401749,-73.9227048796415,-73.9227222792066,-73.9227283733311,-73.9227448416798,-73.9227840784365,-73.9228361473451,-73.9228703850745,-73.9229190473697,-73.9229480304595,-73.9229659136674,-73.9229728791972,-73.9229790890417,-73.9229864363685,-73.9229964135425,-73.9230022646799,-73.9230138419725,-73.9230390404919,-73.9230507546789,-73.923063364585,-73.9230736990785,-73.9230789556485,-73.9230851876819,-73.9230898738835,-73.9230986707884,-73.9231063890775,-73.9231134887278,-73.9231235367041,-73.9231327202103,-73.9231391639737,-73.9231495705806,-73.9231599477341,-73.9231706187,-73.9231741937473,-73.9231778118183,-73.9231770693301,-73.9231729376023,-73.9231734503977,-73.9231799046338,-73.9231898810724,-73.9231994946469,-73.9232125308211,-73.9232231512375,-73.9232285902368,-73.9232335960528,-73.9232412043377,-73.923252537869,-73.9232599135747,-73.9232621264983,-73.9232619931056,-73.9232614266486,-73.9232605341959,-73.923265116977,-73.9232720034337,-73.9232831720635,-73.9233015470242,-73.9233167543084,-73.9233282511922,-73.923349595327,-73.9233708443445,-73.9233727615419,-73.9233708677197,-73.9233675944141,-73.923359964922,-73.9233487287047,-73.9233378516854,-73.9233248849948,-73.9233166766266,-73.9233122874642,-73.9233098462805,-73.9233074889159,-73.9233122948644,-73.9233176713276,-73.9233267171408,-73.9233412374305,-73.9233564413049,-73.9233676480221,-73.9233807359722,-73.9233850740511,-73.9233876030936,-73.9233880569038,-73.9233904036554,-73.923397576587,-73.9234084211173,-73.9234205966139,-73.9234281637174,-73.923436887757,-73.9234479610256,-73.9234501690865,-73.9234506163369,-73.9234451349292,-73.9234454346587,-73.9234481416065,-73.9234564358491,-73.9234676059371,-73.9234853250785,-73.9235100986407,-73.9235278484508,-73.9235377846389,-73.9235452700752,-73.9235523243471,-73.9235587355998,-73.9235705166734,-73.9235803924271,-73.9235909565069,-73.9236154405108,-73.923622726407,-73.9236272756049,-73.9236249516773,-73.9236060461288,-73.9235934032253,-73.9235855354008,-73.92358353125,-73.9235848011176,-73.9235901059585,-73.9236002744768,-73.9236096193694,-73.9236160065525,-73.9236217056903,-73.9236316528669,-73.9236433245289,-73.9236759953347,-73.9236940481654,-73.9237052186913,-73.9237152054747,-73.9237213054259,-73.9237275545443,-73.9237296892496,-73.9237310339481,-73.9237338912794,-73.923738406398,-73.9237478912782,-73.9237557525307,-73.9237689929273,-73.9237810076312,-73.9238018730274,-73.9238268218856,-73.923850676461,-73.9238550125715,-73.9238621520257,-73.9238698639815,-73.9238770383886,-73.9238844996532,-73.9238934428193,-73.9238997184258,-73.9238994883798,-73.923900866367,-73.9239046937621,-73.9239152522287,-73.9239274704871,-73.9239298866244,-73.9239341150687,-73.9239277423937,-73.9239276076872,-73.9239347823481,-73.9239455220354,-73.9239606928678,-73.9239715747329,-73.9239817722244,-73.9239883406072,-73.9239973367065,-73.9240030785461,-73.9240123789017,-73.9240268251661,-73.9240454470132,-73.9240654724664,-73.9240801380967,-73.9240870951441,-73.924094779051,-73.92410988674,-73.9241252356463,-73.9241561770419,-73.9241638512212,-73.9241828097034,-73.924184629823,-73.9242117431256,-73.9242454101214,-73.924275786537,-73.9242907392807,-73.9243071537799,-73.9243129111789,-73.924315205492,-73.924310192793,-73.9243003928949,-73.9242955278526,-73.9242912722804,-73.9242912308895,-73.9242964769783,-73.9243065894023,-73.9243219563431,-73.9243443754088,-73.9243570803949,-73.9243714117234,-73.9243818630807,-73.9243924997064,-73.9244048698762,-73.9244145636565,-73.9244265938045,-73.9244465070079,-73.9244651164011,-73.9244815309581,-73.9245221136551,-73.9245523937624,-73.9245704293272,-73.924578417855,-73.9245824039355,-73.9245830772899,-73.9245857956167,-73.9245906838475,-73.9245987778115,-73.9246175294069,-73.9246343049759,-73.924650761776,-73.9246638050117,-73.9246738166712,-73.9246871725132,-73.9247027238631,-73.92471629808,-73.9247356794492,-73.9247494022102,-73.9247674378049,-73.9247806099445,-73.9247962660778,-73.9248254277085,-73.9248541912217,-73.9248649193498,-73.9248792445505,-73.9248950083654,-73.9249164221912,-73.9249589671474,-73.9250159449891,-73.9250452756295,-73.9250762560669,-73.9251010794198,-73.9251306445381,-73.9251468961936,-73.9251724338563,-73.9251906036021,-73.9252079878427,-73.9252152969284,-73.9252421209985,-73.9252781181391,-73.9253061219659,-73.925324177023,-73.9253808749358,-73.9254249818069,-73.9254766598619,-73.9255535786737,-73.9256219877577,-73.9256877808747,-73.9257320153266,-73.9257996295787,-73.925799717398,-73.9258064299542,-73.9258232050428,-73.9258299194332,-73.9258316432436,-73.925833275969,-73.9258377548341,-73.9258425186784,-73.9258433548601,-73.925850073628,-73.9258610094562,-73.9258646361316,-73.9258649861697,-73.9259184127532,-73.925928368708,-73.9259352151696,-73.9260337234565,-73.9260561936268,-73.926085315848,-73.9261239067441,-73.9261581201277,-73.9261704424701,-73.9261727459083,-73.9261838860385,-73.9262499858011,-73.9262603844983,-73.9262667876193,-73.9262735092793,-73.9262782620453,-73.9262802307233,-73.9262914274844,-73.9263015023,-73.9263361987899,-73.9263411859882,-73.9263518724018,-73.9263711401607,-73.9263899414806,-73.9264324902298,-73.926477282729,-73.9265836694373,-73.9265942895125,-73.9266295815794,-73.9266609279601,-73.9267247363248,-73.9267362962585,-73.9267549643136,-73.926778132084,-73.9268042272686,-73.9268361074794,-73.9268378200977,-73.9268508759536,-73.9268870950355,-73.9268989856578,-73.9269341353762,-73.9270287457061,-73.9270450257636,-73.9271089544355,-73.927130152405,-73.9271304337977,-73.9271581531183,-73.9271786461189,-73.9271839135278,-73.9272029505343,-73.9272113775148,-73.9272219851407,-73.9272802035588,-73.9273438649212,-73.9273451401178,-73.927346314367,-73.9273630537375,-73.9273764833723,-73.9273876687054,-73.9274077913679,-73.9274154778035,-73.9274301584161,-73.9274491792272,-73.9274570124265,-73.92746597086,-73.9274894852241,-73.9275152467655,-73.9275779722909,-73.9275964855019,-73.9276070923786,-73.9276197667859,-73.9277011574422,-73.9278131370969,-73.9278512081296,-73.9279385454346,-73.9279696189242,-73.9279855783604,-73.9279922977792,-73.9280001379863,-73.9280180616489,-73.9280830429901,-73.9281054483289,-73.9281155299936,-73.9281217661889,-73.928124489776,-73.9281312069713,-73.9281379252257,-73.928150290835,-73.9281569565741,-73.9281594595407,-73.9281659085721,-73.9281696644517,-73.9281737414069,-73.9281743771236,-73.9281748541818,-73.9281759700744,-73.9281765357301,-73.9281770869246,-73.9281762785052,-73.928175962724,-73.9281749117808,-73.928172584164,-73.9281725804883,-73.928172578651,-73.9281725773518,-73.9281725768125,-73.9281728601055,-73.9281748137515,-73.9281753450173,-73.9281759314819,-73.928178856782,-73.9281792907455,-73.9281798260256,-73.9281826490905,-73.9281904892852,-73.9282117688976,-73.9282173599516,-73.9282207284062,-73.9282330415723,-73.9282442362585,-73.9282542979957,-73.9282561205668,-73.9282822552591,-73.9282934437778,-73.9283057551074,-73.9283135934933,-73.9283193173991,-73.9283225523737,-73.9283326322997,-73.9283396720062,-73.9283449550823,-73.9283707227965,-73.9283744083327,-73.9283852889159,-73.9283987356808,-73.9285264887883,-73.9286486324237,-73.9286520366774,-73.9286553573977,-73.9286632031199,-73.9286807265752,-73.9286807740662,-73.928681138584,-73.9286835178315,-73.9286979560313,-73.9287279850636,-73.928739439184,-73.9287453182654,-73.9287596173288,-73.9287652224269,-73.9287674702998,-73.9287697049849,-73.9287741871033,-73.9287757542623,-73.9287786698812,-73.9287811637934,-73.9287831508361,-73.9287847874482,-73.9287865119542,-73.9287875388954,-73.9287898712497,-73.9287923597713,-73.928793231457,-73.9287943041659,-73.9287988292683,-73.9288044255409,-73.9288076282771,-73.9288133763082,-73.9288149185336,-73.9288189636975,-73.9288335008079,-73.928834201225,-73.9288469035708,-73.928875405226,-73.9288770711101,-73.9288871324126,-73.9288876450376,-73.9288983152255,-73.9289072660119,-73.9289155236538,-73.9289184567719,-73.9289318906441,-73.9289371192132,-73.9289486874746,-73.9289622730493,-73.9289666072645,-73.928985646803,-73.9289884610669,-73.929005811777,-73.9290259763731,-73.9290566721838,-73.9290752740358,-73.9291122482178,-73.9291241437997,-73.9291301776385,-73.9291817286507,-73.9291910137716,-73.9291974162892,-73.9292052584477,-73.92920595125,-73.9292108601934,-73.929307194748,-73.9294024095158,-73.9294337720649,-73.9294617725747,-73.9295067120279,-73.9295265337167,-73.929531199765,-73.929542179334,-73.9295658509882,-73.9295661690762,-73.9295840432561,-73.9295988094564,-73.9296239850041,-73.9296339519133,-73.9296340876198,-73.9296354575059,-73.9296482180399,-73.9296478101646,-73.929640633547,-73.929629077679,-73.9296255238327,-73.9296254455263,-73.9296254107018,-73.9296158974918,-73.9295988778327,-73.929595046245,-73.9295684460807,-73.9295117207443,-73.9294794281907,-73.9294493170406,-73.9294283580784,-73.9294152024961,-73.9294080822125,-73.9293999160437,-73.9293923722846,-73.9293791374652,-73.9293663010544,-73.9293413298024,-73.9293270955538,-73.9293107381106,-73.929300106235,-73.9292820117361,-73.9292420678279,-73.9291812000314,-73.9290796040099,-73.9290390611207,-73.9290190532019,-73.9290116971971,-73.9290096670351,-73.9290135071657,-73.9290161239676,-73.9290245750173,-73.9290372022201,-73.9290395640046,-73.9290405264794,-73.9290527913101,-73.9290901118504,-73.9291125387482,-73.9291299663146,-73.9291489767142,-73.9291576858894,-73.9291649047424,-73.9291668532353,-73.9291687232559,-73.9291722050192,-73.9291676770342,-73.9291695689506,-73.9291803552892,-73.9291956836582,-73.9292137458925,-73.9292401523519,-73.9292523809935,-73.929274584718,-73.9293010492842,-73.9293572634511,-73.9294087234951,-73.9294215838027,-73.9294410395181,-73.9294646491876,-73.9294913330261,-73.9295033481617,-73.9295328244803,-73.9295718189977,-73.929612280664,-73.9296423920461,-73.9296671768887,-73.9296981556522,-73.929733794945,-73.9297744443398,-73.9298111259236,-73.9298464361067,-73.9298749299692,-73.9298975087134,-73.9299235720071,-73.9299730016948,-73.9300474797363,-73.9300611862039,-73.930077115001,-73.9300807560249,-73.9300851142911,-73.9300874875835,-73.9300988165806,-73.9301098156933,-73.9301252494629,-73.9301425251589,-73.9301676270879,-73.9301932802189,-73.9302140488229,-73.9302344287917,-73.9302573077003,-73.9302694752258,-73.9302846227128,-73.9303173946355,-73.9303448641378,-73.9303762198871,-73.9303904833392,-73.930397117697,-73.930443669557,-73.9304892010015,-73.9305266957181,-73.9305652321444,-73.9306194981435,-73.9306683636012,-73.9307139099747,-73.9307470641536,-73.9307889604073,-73.9308257433845,-73.9308540629538,-73.9308759037908,-73.9309028863698,-73.9309198538557,-73.9309286146428,-73.9309438942451,-73.9309556198494,-73.9309812857934,-73.9309865025847,-73.9310033614312,-73.9310482605661,-73.9310634389551,-73.9310748887684,-73.9310821724324,-73.9310990660284,-73.9311228428378,-73.9311747616174,-73.9312084979802,-73.9312312846584,-73.9312344359678,-73.9312481133079,-73.9312749672491,-73.9313049731433,-73.9313564906459,-73.931425464815,-73.9314484634489,-73.9314815991782,-73.9315140450782,-73.9315440662299,-73.9315625716463,-73.9316074195267,-73.9316605996823,-73.9316944967631,-73.931727844346,-73.9317721416584,-73.9318209303192,-73.9318682322139,-73.931914632212,-73.9319366926158,-73.9319622706444,-73.9319720559381,-73.9319888839124,-73.932006064538,-73.9320369543099,-73.9320736302606,-73.9320931984942,-73.9321193707685,-73.9321231964614,-73.9321160883975,-73.9320982415332,-73.9320580727728,-73.9320064410066,-73.9319882344828,-73.9319733787607,-73.9319202948156,-73.9318788860884,-73.9318343113282,-73.9317889606715,-73.9317620034205,-73.9317550722581,-73.9317438456504,-73.9317211035116,-73.9317055953244,-73.9316837551458,-73.93163945295,-73.9315742784797,-73.931525907259,-73.9315039089118,-73.9314882388509,-73.9314456147065,-73.9313961451998,-73.9313723564488,-73.9313416856059,-73.931284558118,-73.9312430842816,-73.931199345991,-73.9311440592346,-73.9310891952845,-73.9310253982194,-73.9309657578804,-73.930910359915,-73.9308773357322,-73.9308535603594,-73.9308248167906,-73.9307820826574,-73.930730188218,-73.9306824586595,-73.9306822289304,-73.9306632082979,-73.9306520148848,-73.9306408232284,-73.9306399697666,-73.9306329811905,-73.9306304646084,-73.9306217813475,-73.9305792170503,-73.9305710519938,-73.9305624190717,-73.9305258229981,-73.9305086665455,-73.9304089920537,-73.9303384554811,-73.9303188583355,-73.9303240448997,-73.9303275332228,-73.9303363809153,-73.9303253811347,-73.9303068098691,-73.9302845232926,-73.930266516354,-73.9302536909923,-73.9302394503119,-73.9302205559278,-73.9301855361497,-73.9301580737881,-73.9301521926659,-73.9301446238434,-73.930136833877,-73.9301334178266,-73.9300717836611,-73.9300269612015,-73.9300155556746,-73.9298275109263,-73.9297674575298,-73.9297311454627,-73.9297031333958,-73.9296984989899,-73.9296796053814,-73.9296747525164,-73.9296695236837,-73.9296662100759,-73.9296594416093,-73.9296536647658,-73.929649361734,-73.9296404041743,-73.9296353003255,-73.9296247318835,-73.9296007208903,-73.9295866717665,-73.929566367047,-73.9295396584038,-73.9295329763197,-73.9294981881416,-73.9294430032464,-73.9293789210338,-73.9293596248876,-73.9293426803924,-73.9293301796775,-73.9293202799767,-73.9293359594061,-73.9293528014468,-73.9293943070747,-73.9294104244444,-73.9293783012561,-73.9293265092698,-73.9292749428095,-73.9292795590311,-73.9292936105745,-73.9293030085235,-73.9293115171905,-73.9293280227474,-73.929347305292,-73.9293595304215,-73.9293665378207,-73.9293622431999,-73.9293556846754,-73.9293307327231,-73.9292974468056,-73.9292559900515,-73.9292269825969,-73.9291924216628,-73.9291482359441,-73.9291053783617,-73.9290727066086,-73.9290435384601,-73.9290140186248,-73.9289876276833,-73.9289483989088,-73.9289164885186,-73.9288875332281,-73.9288689272137,-73.9288077845978,-73.9287494348255,-73.9286978030232,-73.9286525041383,-73.928627065862,-73.9286258273594,-73.9286316082062,-73.9286399562815,-73.9286416693993,-73.9286421225889,-73.9286515562876,-73.9286468612285,-73.9286411661359,-73.9286222581435,-73.9286109489663,-73.9286101826063,-73.9286223818028,-73.9286246464683,-73.9286245383917,-73.9286226194688,-73.9286030334134,-73.9285923060008,-73.9285787056342,-73.9285751879846,-73.9285686290398,-73.9285546210609,-73.9285090763263,-73.9284747682274,-73.9284348201947,-73.9284011384031,-73.9283885861441,-73.9283829548567,-73.9283832968834,-73.9283885778021,-73.9284066378799,-73.9284193577784,-73.9284305692001,-73.9284354807066,-73.9284332935406,-73.9284249552667,-73.9284064979439,-73.9283768102623,-73.9283317742871,-73.9283067134786,-73.9282777579205,-73.9282530057144,-73.9282318856454,-73.9281960446756,-73.9281687092027,-73.9281469977689,-73.9281193902246,-73.9280846158366,-73.9279977375047,-73.9279233851209,-73.9278671471758,-73.927847991663,-73.9278294647705,-73.9278247310099,-73.9278263353958,-73.9278283358679,-73.9278263345314,-73.9278173437466,-73.927802190762,-73.9277785060595,-73.9277624634073,-73.9277517890025,-73.9277274696527,-73.927712923607,-73.92769451953,-73.9276783440392,-73.9276600797816,-73.9276285310535,-73.9276004141354,-73.9275795396468,-73.927563990587,-73.9275566215088,-73.9275463270441,-73.9275341173215,-73.9275020849733,-73.9274690121999,-73.9274210074887,-73.9273614901442,-73.9273187049339,-73.9272876241028,-73.9272665837988,-73.9272664870943,-73.927264839787,-73.9272575667989,-73.9272450665125,-73.9272264149505,-73.9272113065423,-73.9272024040045,-73.9271908221473,-73.9271904335363,-73.9271926122707,-73.9271928227897,-73.9272091477677,-73.9272277740414,-73.9272361019767,-73.9272346318112,-73.9272276861663,-73.9272054023586,-73.9271722759156,-73.9271603231904,-73.9271559426837,-73.9271041392105,-73.927089010138,-73.9270530495445,-73.9270197835651,-73.9270020227237,-73.9269853109275,-73.9269622259071,-73.9269511099266,-73.9269398183663,-73.9269259966075,-73.9269031770076,-73.9268942568122,-73.9268747134275,-73.9268471064393,-73.9268270278512,-73.9268059068983,-73.9267652631131,-73.9267401777042,-73.9267233414799,-73.9266936993977,-73.9266592515151,-73.9266389162073,-73.9265996121576,-73.9265350348013,-73.926531180701,-73.9264951855823,-73.9264840697184,-73.9264754552105,-73.926467243388,-73.9264612055624,-73.9264511044743,-73.9264373273268,-73.9264147371351,-73.9263861690164,-73.9263695630675,-73.9263646394414,-73.9263547814406,-73.9263504451637,-73.9263492030368,-73.9263489112908,-73.9263444614851,-73.9263341018861,-73.9263156460135,-73.9262944827676,-73.9262836847324,-73.926268919351,-73.9262512732329,-73.9262361916386,-73.9262268739333,-73.9262221671554,-73.9262194444938,-73.9261993303113,-73.926163525531,-73.9261230146764,-73.9260984390226,-73.9260490256657,-73.926024884904,-73.9260243323216,-73.9260142531347,-73.925950578664,-73.9259425890535,-73.9259381105083,-73.9259347533845,-73.9259337534649,-73.9259315624204,-73.9259269184445,-73.9259067903029,-73.9259011958783,-73.9258956851601,-73.9258956002196,-73.92589261456,-73.9258597776118,-73.9258375331714,-73.9258205890195,-73.9258059835587,-73.9258015522391,-73.925755633124,-73.9257525155868,-73.9257365980446,-73.9256582274613,-73.9256266906352,-73.9256011263941,-73.9255641743504,-73.9255523371866,-73.925527216692,-73.9254812962653,-73.9254129715834,-73.9253625593859,-73.9253166507248,-73.925285284765,-73.9252799289894,-73.9252796957769,-73.9252561833472,-73.9252336354785,-73.925149804394,-73.9251107031777,-73.9250971787667,-73.9250479145893,-73.9250064920105,-73.924946047099,-73.9249225426097,-73.9249108197113,-73.9249012781813,-73.9248609924901,-73.9248383707141,-73.9248363788443,-73.9248326100901,-73.9248229553083,-73.9247938771283,-73.9247846543268,-73.9247793349494,-73.9247791855023,-73.924765908562,-73.9247622735301,-73.9247513614209,-73.9247400993721,-73.9247356885242,-73.9247319376334,-73.924720014367,-73.9247091511671,-73.9246897815425,-73.9246069161496,-73.9245206957027,-73.9244760783539,-73.9244613543604,-73.9244487071713,-73.9244143334285,-73.9243046244528,-73.9241859465509,-73.9241590794246,-73.9241366906365,-73.924102195222,-73.9240952758587,-73.9240855960226,-73.9240292428982,-73.9239464192516,-73.9239463825887,-73.9239285113853,-73.9239061155879,-73.9238803590294,-73.9238366820514,-73.9238232411105,-73.9238064403766,-73.9237336273621,-73.9237179459884,-73.9237045073616,-73.9236966677926,-73.9236753930123,-73.9236485223988,-73.9236381528057,-73.9236227734172,-73.923612614377,-73.9236003920107,-73.9235690554465,-73.9235355013047,-73.9235243230843,-73.9235119672284,-73.9235019776282,-73.923494150086,-73.92348519927,-73.9234807233843,-73.9234789235145,-73.9234751257418,-73.9234616898173,-73.9234615903086,-73.9234448889639,-73.9234105078047,-73.9234000899736,-73.9233877705673,-73.9233776938006,-73.9233674939144,-73.9233530647217,-73.9232959736463,-73.9232635066696,-73.923132498697,-73.9230747822124,-73.9230014994927,-73.9229779233367,-73.9229387975448,-73.9229236420458,-73.9229018553398,-73.9228873041768,-73.9228727553203,-73.9228291173511,-73.9227832490183,-73.9227664663851,-73.9227627141749,-73.9227507936472,-73.922731762706,-73.9227104871775,-73.9226853149529,-73.9226578543788,-73.922644233772,-73.922630981684,-73.922607472161,-73.922596793709,-73.9225862065855,-73.922579736243,-73.9225660626609,-73.922552135944,-73.9225492809139,-73.922541393841,-73.9225336247772,-73.9225202119299,-73.9225101611388,-73.9224889511689,-73.9224877586735,-73.9224766627582,-73.9224715207827,-73.9224621286613,-73.9224540860442,-73.9224464709582,-73.9223535997281,-73.9223529489382,-73.922338980265,-73.9223323153005,-73.9223247737697,-73.922316371013,-73.9223071320518,-73.9222970794827,-73.922286242719,-73.9222691205749,-73.9222529150898,-73.9222376534766,-73.9222329404742,-73.9222289645187,-73.9222257615906,-73.9222233575599,-73.922221776095,-73.9222218941756,-73.9222208713644,-73.9222187163707,-73.9222163910791,-73.922213328826,-73.9222095682198,-73.9222051577627,-73.9222001549721,-73.9221946279212,-73.9221886466713,-73.9221807631201,-73.9221732644181,-73.9221662276701,-73.9221597211829,-73.9221538077599,-73.9221485480034,-73.9221439943835,-73.9221273421912,-73.9221100846135,-73.9220922326256,-73.9220737976458,-73.9220562383136,-73.9220393361775,-73.922023108142,-73.9220075689087,-73.9219927393395,-73.9219786334779,-73.9219609545827,-73.9219404991777,-73.9219366182268,-73.9219166445631,-73.9219095228159,-73.9219043265567,-73.9218998405271,-73.9218974841541,-73.9218947484252,-73.9218937186505,-73.9218930438554,-73.9218924850795,-73.9218919932834,-73.9218910483446,-73.9218893690646,-73.9218873708996,-73.9218848257098,-73.9218819570818,-73.9218786379991,-73.9218743994567,-73.9218721118332,-73.9218692099591,-73.9218667250628,-73.9218615686679,-73.9218561488656,-73.921850687989,-73.9218452954848,-73.9218400772675,-73.9218351352872,-73.9218305679585,-73.9218256449113,-73.9218213958785,-73.9218178592622,-73.9218150732393,-73.9218130638916,-73.9217936671077,-73.9217903454467,-73.9217861500219,-73.9217811352477,-73.9217753632435,-73.9217692570346,-73.9217628412221,-73.9217561900634,-73.9217493826576,-73.9217424961338,-73.921735611145,-73.9217288046172,-73.9217221602952,-73.9217157500624,-73.9217096495493,-73.9217048810362,-73.9216997150594,-73.9216942303393,-73.9216885110771,-73.921682643228,-73.9216767182312,-73.921670824436,-73.9216630451577,-73.9216555100143,-73.9216482785464,-73.9216414157773,-73.9216349761799,-73.9216306114482,-73.9216274123538,-73.9216254262432,-73.9216199760735,-73.9216140012445,-73.921607558418,-73.9216007095301,-73.9215935202611,-73.9215860558565,-73.9215783868423,-73.9215569204252,-73.9215350485983,-73.9215127928867,-73.921490171742,-73.9214672097684,-73.9214439262955,-73.9214203443917,-73.9213964855873,-73.9213723747068,-73.9213480313033,-73.9213089101163,-73.9212695527818,-73.9212299773133,-73.921190204368,-73.9211502519597,-73.9211101396465,-73.9210698889591,-73.9210582137595,-73.9210464622746,-73.9210346854905,-73.9210229304371,-73.9210112489831,-73.9209996883861,-73.9209882965643,-73.9209771242956,-73.9209622611823,-73.920947158159,-73.9209318635913,-73.9209164245165,-73.9209008903923,-73.9208853115497,-73.9208697356827,-73.9208587240538,-73.9208477744974,-73.920836951843,-73.9208263156394,-73.9208159307031,-73.9208058576716,-73.9207961554237,-73.9207697999679,-73.9207581053398,-73.9207439889855,-73.9207187497152,-73.920687629181,-73.9206561072349,-73.9206242043055,-73.920591948294,-73.9205593605076,-73.9205264657742,-73.9205084636299,-73.9204903017001,-73.9204720087709,-73.920453615606,-73.9204351558251,-73.9204166555795,-73.9204074786515,-73.9203983436945,-73.9203893065269,-73.9203804234033,-73.9203717496948,-73.9203633394465,-73.9203521672796,-73.9203414206208,-73.9203311528486,-73.920321410524,-73.9203122430581,-73.92030509875,-73.920298555523,-73.9202926456423,-73.9202873965402,-73.920282835423,-73.9202789870804,-73.9202708408963,-73.920261821832,-73.9202519538033,-73.9202412600656,-73.920229767177,-73.9202183217011,-73.92020621098,-73.9201934569657,-73.920180081392,-73.9201661064345,-73.9201532223689,-73.9201399033581,-73.9201261898211,-73.9201121254745,-73.9200977571106,-73.9200874794901,-73.9200776279219,-73.920068238421,-73.92005935008,-73.9200509956168,-73.9200432057688,-73.9200360125883,-73.920029440435,-73.9200196331542,-73.9200092564773,-73.919998332139,-73.9199868814335,-73.9199749271994,-73.9199624905123,-73.9199496003646,-73.9199362776158,-73.9199225495012,-73.9199084463323,-73.9199011376501,-73.9198934161228,-73.9198861309705,-73.9198859279584,-73.9198709865229,-73.9198643447806,-73.9198116646367,-73.9198027120859,-73.919780331563,-73.9197803006148,-73.9197765155536,-73.9197724991251,-73.9197720703081,-73.9197637997451,-73.9197635421885,-73.9197614775329,-73.9197456264111,-73.9197041913585,-73.9196965324449,-73.9196873955538,-73.9195821473435,-73.9194936964816,-73.9194223213225,-73.9193862147967,-73.9193852497961,-73.919383976885,-73.9193817387566,-73.9193795001868,-73.9193776757533,-73.9193772620572,-73.9193739106027,-73.9193713879657,-73.9193672160331,-73.9193655786836,-73.9193649784972,-73.9193627422801,-73.9193614801241,-73.9193605034933,-73.9193603811943,-73.9193571449742,-73.9193123626818,-73.9192664587219,-73.9191679284425,-73.9191488916004,-73.9191341874147,-73.9190996178148,-73.9190910764339,-73.9190861794542,-73.9190810187483,-73.9190761054957,-73.9190568374373,-73.9190414027981,-73.9190067047772,-73.9189697673662,-73.9189305956604,-73.918883590141,-73.9188688709467,-73.9188556168757,-73.9188349380062,-73.918823173522,-73.9188116327407,-73.9187907378601,-73.9187845918219,-73.9187773181366,-73.9187512762786,-73.9187471353389,-73.9187325954252,-73.9187158128977,-73.9187111966399,-73.9186956673198,-73.9186743997328,-73.9186564874949,-73.9186493877576,-73.9186374540033,-73.9185926631209,-73.9185644849586,-73.9185400270366,-73.9184694690409,-73.9184541925096,-73.9184369876613,-73.9183882544599,-73.9183596986307,-73.9183360189858,-73.9183227384675,-73.9183104343813,-73.9182880213862,-73.9182589069218,-73.9182586484207,-73.9182580273313,-73.9182320319041,-73.9182126102968,-73.9182085188573,-73.9182004710366,-73.918181651294,-73.918177323231,-73.9181559042375,-73.9181312775744,-73.9181088936557,-73.9180974514365,-73.9180898680704,-73.9180451179027,-73.918044766913,-73.9180372829567,-73.918027207486,-73.9180005698735,-73.9179768208267,-73.9179656258739,-73.9179566703521,-73.9179489236582,-73.9179387657123,-73.9179208625227,-73.9179008837881,-73.9178850618686,-73.9178608909031,-73.9178548663177,-73.9177832999984,-73.917774077934,-73.917760928632,-73.9177487889554,-73.9177396760839,-73.9176714308013,-73.9176224127655,-73.9176222014365,-73.9176219900966,-73.9175763259172,-73.9175315621306,-73.9175227031169,-73.9175226080541,-73.9175114132504,-73.9174712855078,-73.9174688633542,-73.9174531941932,-73.9174397623795,-73.9174372040017,-73.9174341690128,-73.9174308157136,-73.9173905970464,-73.9173783961284,-73.9173704925592,-73.9173675405874,-73.9173593183346,-73.917356780998,-73.9173548470265,-73.9173481343415,-73.9173470150398,-73.9173461541652,-73.9173114977476,-73.9172918457409,-73.9172839319138,-73.9172765617685,-73.917273223484,-73.9172719003007,-73.9172673579677,-73.9172669885805,-73.9172639059613,-73.9172538704642,-73.9172310489464,-73.9171647142826,-73.9171052899358,-73.9170754069334,-73.9170703073424,-73.917044907494,-73.9170348755062,-73.917009721268,-73.9169933166932,-73.9169696638963,-73.9169480971895,-73.916930148324,-73.9169153646123,-73.9169084937795,-73.9169074944438,-73.9169106727824,-73.9169155773828,-73.9169343155826,-73.9169557207127,-73.9169750017461,-73.9169782490745,-73.916978831774,-73.9169692952175,-73.9169400240332,-73.9168980458869,-73.9168917182131,-73.916886098294,-73.9168714828245,-73.9168546614208,-73.9168383789929,-73.9168347573897,-73.9168285112746,-73.9168206411843,-73.9167989892455,-73.9167773338284,-73.9167625486671,-73.9167525181446,-73.9167419804853,-73.9167281993474,-73.9167138336214,-73.9167011670887,-73.9166957982761,-73.9166751864801,-73.9166366687624,-73.9166180530485,-73.9166045281198,-73.9165856229251,-73.9165826228718,-73.9165829623147,-73.9165895000649,-73.9165870007573,-73.9165770502994,-73.9165617692258,-73.9165518175944,-73.9165584358835,-73.9165655623066,-73.9165646477851,-73.9165594004014,-73.9165514873813,-73.9165334983325,-73.9165158853885,-73.9165078454085,-73.9164944761625,-73.9164768220882,-73.9164624564369,-73.9164470906232,-73.9164381384997,-73.9164292230806,-73.9164149824388,-73.9163975352469,-73.9163725966856,-73.9163449852703,-73.9163376535899,-73.9163178368848,-73.9162976373871,-73.9162758591824,-73.9162623868509,-73.9162573327127,-73.9162568192414,-73.9162561203212,-73.9162446648197,-73.916223952966,-73.9162125143615,-73.9162068276224,-73.9161909146701,-73.9161705137734,-73.9161501177061,-73.9161326246639,-73.9161122698496,-73.9160992641165,-73.9160925937234,-73.916079251405,-73.9160560203672,-73.9160273196701,-73.9159938111045,-73.915955192073,-73.9159357336787,-73.9159143732944,-73.9159016386141,-73.9159010369593,-73.9158915408334,-73.9158797753793,-73.9158450473121,-73.9158182552553,-73.9157844096923,-73.9157639779409,-73.9157298462754,-73.915712976652,-73.9156992443461,-73.9156861867102,-73.9156843058204,-73.9156865663903,-73.9156814860268,-73.9156700108887,-73.9156604731009,-73.9156589448791,-73.9156529159507,-73.9156360400999,-73.9155914032639,-73.9155489874625,-73.9155301632933,-73.9155228186343,-73.9155071807511,-73.9155019977137,-73.9154995414485,-73.9155027747764,-73.9154999543631,-73.9154891169085,-73.9154804973864,-73.9154680576691,-73.915451503773,-73.9154416494084,-73.9154340349635,-73.9154216005324,-73.9154094561203,-73.9153925436142,-73.9153804359287,-73.9153642175995,-73.9153473625054,-73.9153301591207,-73.9153173981806,-73.9152982266323,-73.915274283922,-73.9152510118643,-73.9152016425748,-73.9151783846262,-73.915156704081,-73.9151426568539,-73.9151324262792,-73.9151234580179,-73.9151164366011,-73.9150995432826,-73.9150734361884,-73.9150441987662,-73.9150299128763,-73.9150197294281,-73.9149945643239,-73.914975785844,-73.9149694417349,-73.9149640765658,-73.9149606089247,-73.9149545713095,-73.9149357714904,-73.9149147390235,-73.9149007396339,-73.9148877145628,-73.9148845635572,-73.914889377858,-73.9149018595598,-73.9149191187714,-73.9149335231025,-73.9149344393973,-73.9149390016945,-73.914938758641,-73.9149314970687,-73.9149076699125,-73.9148583790172,-73.9148173332905,-73.9147603603691,-73.9147024134157,-73.9146871227449,-73.9146635034615,-73.9146452951137,-73.9146104599485,-73.9145871398625,-73.9145641588807,-73.9145475832347,-73.914540591211,-73.914544477951,-73.9145611473274,-73.9145701149138,-73.9145797437459,-73.914583310765,-73.9145833321558,-73.9145722711073,-73.914543219669,-73.9145348243551,-73.9145378157158,-73.9145497523562,-73.9145651300669,-73.9145795283737,-73.91458498118,-73.9145856549886,-73.914579296442,-73.9145675660408,-73.914567053451,-73.9145729216681,-73.9145793893745,-73.9145823650487,-73.914581209742,-73.9145701333217,-73.9145711649863,-73.9145814379993,-73.9145891302396,-73.9145990233473,-73.9146121013319,-73.9146200828431,-73.9146252146031,-73.9146233530672,-73.9146176734119,-73.9146145540176,-73.9146168759422,-73.9146223692955,-73.9146192139587,-73.9146131491245,-73.9146041869133,-73.9145907164659,-73.9145810654453,-73.9145698381931,-73.9145490547377,-73.9145314841766,-73.9145082017844,-73.9144904024148,-73.9144801456891,-73.9144719108965,-73.9144550715459,-73.9144340482951,-73.9144031216041,-73.9143769416627,-73.9143584115918,-73.9143357145897,-73.9142956654171,-73.914278010984,-73.9142705624779,-73.9142638193823,-73.9142596575191,-73.914247213663,-73.9142367167323,-73.9142275445243,-73.9142206451325,-73.9142168778305,-73.9142118553576,-73.9142058636273,-73.9142056620668,-73.9142155010722,-73.9142288267402,-73.9142507619856,-73.9142629944839,-73.9142780872765,-73.9143034228063,-73.9143124426024,-73.9143147385561,-73.9143186045313,-73.9143442767172,-73.9144035614102,-73.9144426308692,-73.9144822973295,-73.9145155986984,-73.9145303493829,-73.9145469979544,-73.9145789818957,-73.9147149238431,-73.914816323713,-73.9149395049035,-73.9150310055409,-73.9151973648858,-73.9153147915344,-73.9154833724582,-73.9156004459609,-73.915742142964,-73.9158966219578,-73.9160501777818,-73.9161180019858,-73.9162945948816,-73.9163479150407,-73.9163574633773,-73.9163670097331,-73.9163856104158,-73.9163967884827,-73.9164143062015,-73.9164223121702,-73.916439202457,-73.9164509182284,-73.9164547143443,-73.9164558425448,-73.9164696033255,-73.9164774856516,-73.9164837832827,-73.9164911196418,-73.9165016269866,-73.9165263995563,-73.9165470007693,-73.9165670615828,-73.9165930400693,-73.9166639761764,-73.9167110595789,-73.9167438391974,-73.9167898763149,-73.9168306184822,-73.9168829969205,-73.9169379656611,-73.9169897717314,-73.9170131490069,-73.9170803751035,-73.9171379335935,-73.917254821697,-73.9173665965453,-73.9174729201113,-73.9175734708578,-73.9176679447099,-73.9177560559743,-73.9178375382034,-73.9179121450007,-73.9179796507661,-73.9180398513776,-73.9180925648084,-73.9181908779807,-73.919725107872,-73.9209599200278,-73.922307925163,-73.9233217785486,-73.9236367728711,-73.9240555304218,-73.9244041329122,-73.9254714779807,-73.9265330499539,-73.9275993669829,-73.9286685095516,-73.9295685824336,-73.9291243705818,-73.9287901015488,-73.9281313960502,-73.9299222492492,-73.9317339012848,-73.9335511715361,-73.9342626672588,-73.9360940729623,-73.9379155784185,-73.9384349357584,-73.938098082759,-73.9378905081103,-73.938347083712,-73.9384898668512,-73.9390496277481,-73.9390124693896,-73.9408289785009,-73.9426513822668,-73.9438316165953,-73.9440556093215,-73.9441745062859,-73.9443088819456,-73.9444361462781,-73.9445736645838,-73.9447954727965,-73.9448277099629,-73.9448601234275,-73.9450664280808,-73.9455166357478,-73.9459684975583,-73.9464226599836,-73.946874399467,-73.9473267222654,-73.9463262223442,-73.9454005321308,-73.9444678405052,-73.9441553525583,-73.9445399503591,-73.9448081607081,-73.9454487808206,-73.9455109552195,-73.9445364292418,-73.9435730877707,-73.942623913925,-73.9416715693295,-73.9410288926998,-73.9407095754807,-73.9405807579267,-73.9404774223896,-73.9400170267874,-73.9397372201333,-73.9396696980432,-73.9395451882993,-73.9390277231562,-73.9388318881106,-73.9385171651273,-73.9380145373732,-73.9375927357049,-73.9370366905544,-73.9364119713421,-73.9361041162562,-73.9352099304649,-73.9343051029594,-73.9333791512903,-73.932235548344,-73.9315481248931,-73.9310277683218,-73.9295845672209,-73.9287811084919,-73.9276401540758,-73.9267551566779,-73.9260813465546,-73.9255918603648,-73.9251134440834,-73.9246469500312,-73.9241931459387,-73.9238584223179,-73.9237527784941,-73.9233265458737,-73.9215494808753,-73.9202580235395,-73.9197373704819,-73.9185942316251,-73.9177670150513,-73.9159308624383,-73.9152525951674,-73.9145894931745,-73.9137267068675,-73.9129369754959,-73.9127882761001,-73.9122336906649,-73.9114921263236,-73.91136110205,-73.9108196941893,-73.9100695676753,-73.9092216277097,-73.9091489002397,-73.9084908428466,-73.9075520957351,-73.9062337671228,-73.9015385661799,-73.9012847816899,-73.9010454603378,-73.9008222483241,-73.9006166251606,-73.900429882757,-73.9002631093379,-73.9001171585725,-73.8999926378766,-73.8999442811324,-73.8999175377391,-73.8998898683659,-73.8998535044498,-73.8998250823794,-73.8997770418753,-73.8996954800287,-73.8996320551593,-73.8995872163133,-73.8995612019019,-73.8995540452846,-73.8995655897609,-73.8993165289739,-73.8992176089417,-73.8988357145382,-73.8988183473785,-73.8988069843351,-73.8988860174521,-73.8990418038891,-73.8990244634611,-73.8990033229351,-73.898872111499,-73.8985970379314,-73.8981364616514,-73.8980025574774,-73.8978033326603],"lat":[40.6536248534122,40.6534538161212,40.6535383207189,40.6538095558218,40.6538549566563,40.6541728884023,40.6543244722693,40.6543775766565,40.6544879295266,40.6548329486657,40.6552027140843,40.6537109390806,40.652364719447,40.6511781774775,40.6511486971311,40.6511053045391,40.6507050708338,40.6503134324823,40.6499307837856,40.6495575484092,40.6491940977459,40.6468021729202,40.6439490289227,40.6426378289533,40.6416523796818,40.6410658560679,40.6405385525687,40.6398722842505,40.6398071177214,40.6389121892042,40.6389609896186,40.6390435566079,40.6390646876029,40.6391052051913,40.6391303326162,40.6391590489139,40.6391906814457,40.6392244892629,40.6392596804627,40.6392954307375,40.6393309026822,40.6393652654103,40.6394657445316,40.6397577837957,40.6398247635251,40.6398897081818,40.6399520809668,40.6400113663375,40.640067074269,40.6401187443046,40.6401659493619,40.6402082992636,40.6402454439619,40.6402770764332,40.6403029352148,40.6403127825429,40.6403384769682,40.6403632791572,40.6403703881558,40.6403812227664,40.6404366717804,40.6404367419725,40.6404531770321,40.6404606332138,40.6404786382136,40.6404879639444,40.6404916918165,40.6405178771024,40.6405428047946,40.6405614712637,40.6405845017967,40.6405999432332,40.6406102208737,40.640628230498,40.6406324104561,40.6406504864935,40.6406631265399,40.6406744175287,40.6407196977066,40.6407309445163,40.6407340061444,40.6407342269036,40.6407410325794,40.6407410982798,40.6407513806592,40.6407650211267,40.6407932049232,40.6408176807213,40.6408222509575,40.6408555639491,40.6408974140312,40.6409020822165,40.6409136678676,40.6409137790777,40.6409145249333,40.6409128294971,40.640913040585,40.6409136912303,40.6409205969414,40.6409325058989,40.6409371016926,40.64094189605,40.640970109036,40.6409718203277,40.6409923497805,40.6409881296635,40.6409711166305,40.6409617900947,40.6409780345475,40.6410079331285,40.641062590615,40.6411189645532,40.641150587238,40.6412027211664,40.641255708149,40.6413086893028,40.6413608173897,40.6414129507884,40.6414548560803,40.6415018474876,40.6415480085901,40.6415659579732,40.6415787618899,40.6415659358757,40.64151977476,40.6414975131891,40.6414693072647,40.6414556183552,40.6414453203899,40.6414589703652,40.6414554855452,40.641424732739,40.6414187021882,40.6414041625139,40.6414015673405,40.6413938534723,40.6414049157332,40.641442447646,40.6414797697887,40.6414799736993,40.6414808260927,40.6415209181406,40.6415652933213,40.6416182252924,40.6416703045278,40.641718113296,40.6417290095262,40.6417292164004,40.6417736278198,40.6418120646637,40.6418291481893,40.6418846744067,40.6419402088106,40.6419436278893,40.641989772155,40.6419924180068,40.6420034466268,40.6420402294657,40.6420650491102,40.6420787404384,40.6420789208376,40.6421001304697,40.6421111738471,40.6421206862728,40.6421200689572,40.6421190205093,40.64210945619,40.6421053717302,40.6420567151733,40.6420567262852,40.6420584549509,40.6420679530952,40.6420738943114,40.6420749599049,40.6420756463811,40.642058593659,40.6420594885617,40.6420603142555,40.6420653201095,40.6420688881259,40.6420979627559,40.6421091047828,40.6421079674175,40.6421074360628,40.6421236729687,40.6421279572592,40.642177533269,40.6421776505245,40.6421955186834,40.6422032817722,40.6422039605293,40.6422050650492,40.6422128506231,40.6422128588805,40.6422170908758,40.6422280222848,40.6422419101646,40.6422569247397,40.6422769894146,40.6422914685027,40.6422915471503,40.6423095589346,40.6423187016061,40.6423224456094,40.6423301893566,40.642335092661,40.6423351074623,40.6423473399792,40.6423729982989,40.6423841050562,40.6424149004313,40.6424249323686,40.6424250055252,40.6424516860917,40.6424911862153,40.6424960378873,40.6424961477304,40.6425085632179,40.6425405822997,40.6425738992392,40.6425776151389,40.6426080766785,40.6426405395378,40.642669590147,40.6427147814033,40.6427251220555,40.6427391400841,40.6427533296215,40.6427960730299,40.642803565101,40.6428036266138,40.6428285479447,40.6428550458939,40.6429026906888,40.6429054769836,40.6429148364877,40.642927727031,40.6429387080628,40.6429627794035,40.6430089470562,40.6430329639869,40.6430491302088,40.6430978522868,40.6431397547091,40.6431670746068,40.6431859223233,40.6432286759661,40.6432402662576,40.6432568943043,40.6433081760548,40.6433387390889,40.6433594530333,40.6434064729924,40.6434534924091,40.6434782715295,40.6434875567032,40.6435320744205,40.643570476804,40.6435879439901,40.643611444491,40.6436635223294,40.6437096329118,40.6437097915906,40.6437098207398,40.6437437278406,40.6440458751311,40.644179192377,40.6443123210557,40.644437584642,40.6445238156495,40.6444614180559,40.6443519881635,40.6443286950753,40.6443679359587,40.6442898387417,40.6441022811263,40.6440086305595,40.6439463036803,40.6440409497898,40.6441819286849,40.644502890609,40.6445712577003,40.6446429652357,40.644745823788,40.6451319353229,40.6452394738166,40.6456021717169,40.6456815796135,40.6456816432897,40.6457062219115,40.6457595105207,40.6457931256929,40.6457984656452,40.6458102808509,40.6458607346133,40.6459366817738,40.6459638829904,40.6459871856828,40.6460786413691,40.6461039870834,40.6461253992822,40.6461584720126,40.6461799366696,40.6463254512651,40.6465049245539,40.6465943797746,40.6466566599826,40.6467227832965,40.6470321350494,40.6471430291999,40.647191581473,40.6472673712237,40.6473373655494,40.6474151606943,40.6474677375557,40.6475183575817,40.647588411819,40.6476234308654,40.6476973286995,40.6478023900073,40.6478744346366,40.6478919986652,40.6478785139287,40.6478804575729,40.6478805165612,40.6478806997646,40.6479039139852,40.6479039612225,40.6478831055566,40.6478709746672,40.6479069528305,40.6480074155948,40.6480244616377,40.6480244926157,40.6480450080697,40.6480706523825,40.6480876310778,40.6481150993463,40.6481188778168,40.6481305070423,40.6481493309057,40.6481535823205,40.6481775073171,40.6481989876165,40.6481990387524,40.648203152695,40.648229958133,40.6482569721725,40.6482755869412,40.6483133489042,40.6483251658583,40.6483407025606,40.6483612673405,40.6483877733434,40.6484149698143,40.6484406478243,40.6484407527422,40.6484467460688,40.6484778783668,40.6485607939285,40.6485919765882,40.6486412898288,40.6487182564979,40.6487456536068,40.6487513419006,40.6487579940716,40.6487642212087,40.6487744066311,40.6487840743083,40.6487932114882,40.6488018089279,40.6488098548773,40.6488173402653,40.6488242560166,40.6488306161341,40.6488375444789,40.6488450274509,40.6488530534626,40.6488616043922,40.6488706664721,40.6488802225857,40.6488902536127,40.6489007414319,40.6489116677588,40.6489230096178,40.6489436781853,40.6489647265901,40.6489861405846,40.6490079079263,40.6490300188899,40.6490524585547,40.6490616608709,40.6490704190961,40.6490787139334,40.6490847588609,40.6490938387875,40.6491006335616,40.6491068973139,40.6491151539924,40.6491374157798,40.6491425449189,40.6491524684677,40.6491627438341,40.6491733457054,40.6491842422258,40.6491954069118,40.6492068097546,40.6492186818757,40.6492301570797,40.6492412162483,40.6492518379121,40.6492620029507,40.6492716902283,40.6492829883299,40.6492938422422,40.6493042413939,40.6493141760516,40.6493236356405,40.6493326126045,40.6493410951947,40.6493490763586,40.6493565500409,40.6493635063395,40.6493699392024,40.6493758437507,40.6493762833984,40.6493761043753,40.6493753056196,40.6493738929396,40.6493718724811,40.6493692555806,40.6493660539149,40.6493622841847,40.6493587604515,40.6493579651049,40.6493531187401,40.649347769002,40.6491704121165,40.6490336057781,40.6492076822843,40.6492086324319,40.6492101710978,40.6492114401579,40.6492132640615,40.6492156268274,40.6492169094551,40.6492185096335,40.6492218856143,40.6492265392689,40.6492318030212,40.6492376597356,40.6492582943229,40.6492685505127,40.6492847663502,40.6493004292547,40.6493155056855,40.6493231056944,40.6493303073964,40.6493370630081,40.6493433245638,40.6493490548206,40.6493546581683,40.649359709366,40.649364177366,40.6493680326224,40.6493712519564,40.6493740986487,40.6493763621039,40.6493780240018,40.6493790757335,40.6493795098654,40.6493793204669,40.6493780980927,40.6493762081708,40.6493736560165,40.6493704504598,40.6493666016746,40.649363839661,40.6493589101847,40.6493507055657,40.6493420078926,40.6493328392475,40.6493232210474,40.6493131783941,40.6493039491657,40.6493027332084,40.6492919136104,40.6492807447104,40.6492692551322,40.6492574709923,40.6492463114424,40.6492354385494,40.6492248764209,40.6492146536834,40.6492047966151,40.6491953304888,40.6491882193055,40.6491862772289,40.6491776597577,40.649169502338,40.6491629725125,40.6491561609533,40.649149108346,40.6491418530322,40.6491344373835,40.64912689958,40.6491192848469,40.6491116353957,40.6491055993025,40.6491039917652,40.6490963990275,40.6490889005747,40.6490815371281,40.649074348574,40.6490673766464,40.6490453721651,40.6490234523748,40.6490016340339,40.6489799347339,40.6489583673772,40.6489369509044,40.6489157005615,40.6488946327751,40.648873763631,40.648853107378,40.6488326797726,40.6488124990791,40.648792575696,40.6487436754075,40.6486989977174,40.648694532797,40.6486909132909,40.6486451528961,40.6485955412349,40.6485928493077,40.6485457038524,40.6485248388216,40.6485191909062,40.6484930501414,40.6484672902771,40.6484660905958,40.648441920869,40.6484169459453,40.6484074216903,40.6483923747299,40.648368215104,40.6483444732748,40.6483211564544,40.6482982705171,40.6482809348436,40.6482631824459,40.6482450294248,40.6482264850044,40.6482075657865,40.6481882860221,40.6481686582879,40.6481486975076,40.6481284172587,40.6481078358166,40.6480405394938,40.6480163798847,40.6479925753815,40.6479691372179,40.6479460811522,40.6479234190925,40.6479011641158,40.6478793306416,40.6478579285673,40.6478252343198,40.6478202472438,40.6478117178108,40.6477943748275,40.6477820522951,40.6477433534512,40.647713590408,40.6477094297769,40.6477041607715,40.6476937708366,40.6476829927214,40.6476718406818,40.6476603291457,40.6476484743755,40.6476362936445,40.6476237993641,40.6476110136626,40.6475979486157,40.6475846250084,40.6475710589354,40.6475572693394,40.6475335832944,40.6475102664564,40.6474873293918,40.6474647875241,40.6474492858302,40.6474426505814,40.6474209313063,40.6473996422783,40.6473787940615,40.6473482231845,40.6473180697527,40.6472883483486,40.6472590665218,40.6472302334944,40.6472018605031,40.6471739555965,40.6471514861194,40.6471287043441,40.6471056225078,40.6470822525172,40.6470586071119,40.6470346988642,40.64695667214,40.6469339672562,40.6469127550683,40.6467975722778,40.6465232126519,40.6463886878661,40.6460502580564,40.6460560459366,40.6460699128613,40.6463715594754,40.6467459777211,40.6468930001539,40.6469157279725,40.6469384394916,40.6469747544232,40.6470145847782,40.6470795153901,40.6470796517499,40.6470881858025,40.6470713244939,40.6470438731899,40.6470469735472,40.6470656653142,40.6470849899721,40.6471634452779,40.6472188189086,40.6472200357357,40.6472075538358,40.6471969173174,40.6471944379818,40.6471944053904,40.6471806764433,40.6471488690594,40.6471384266808,40.6471251794998,40.6471127062851,40.6470958593827,40.6470877353033,40.6470795533161,40.647081360932,40.6470936682672,40.6471103114528,40.6471362117718,40.6471534914593,40.6471627599537,40.6471853476016,40.6472164078598,40.6472454708278,40.6472762080055,40.6473308595822,40.6473419366858,40.647360691522,40.6473631900908,40.6473632051952,40.6473580632713,40.6473144567334,40.6472929591252,40.6472614767171,40.6472489060055,40.6472443621329,40.6472441302961,40.647214446881,40.6471850517374,40.6471734312081,40.6471697250634,40.6471606153029,40.6471529931836,40.647144350566,40.6471408695291,40.647140626412,40.647121946645,40.6471169499369,40.647100178275,40.6470862946514,40.6470861892386,40.6470810567979,40.6470340834504,40.6469794232872,40.646957221709,40.6469568392034,40.646924775032,40.6469050696401,40.6468863338447,40.6468651836159,40.6468572738842,40.6468085777033,40.6467735695239,40.6467454193833,40.6467334990266,40.6467224132761,40.6467187190714,40.6467156022575,40.6467102289176,40.6467079576087,40.6467103992731,40.6467139885154,40.6467285525379,40.6467567860001,40.6467882482677,40.6467884268996,40.6468028718209,40.6468243049786,40.6468615194269,40.6468618822307,40.6468811641793,40.6468997340506,40.6469018523863,40.6469049033249,40.6469116993968,40.6469184459775,40.6469322113536,40.6469326961754,40.6469429489785,40.6469472645119,40.646954915174,40.6469571142262,40.646957500438,40.6469681491984,40.6469675523983,40.6469658609735,40.6469658696229,40.6469638412388,40.6469580774866,40.6469461993545,40.6469106740653,40.6468850618171,40.6468599250419,40.6468295425581,40.6467998495324,40.6467851129488,40.6467346920647,40.6467126253992,40.646712468821,40.6466910808265,40.6466636840549,40.646647389008,40.6466430489808,40.6466439531945,40.6466575013859,40.6466532179427,40.6466497828167,40.6466466086878,40.6466444891391,40.6466402368937,40.6466205701313,40.6465889508272,40.6465538696817,40.646553665434,40.6465342764774,40.646534020252,40.6465163452811,40.6464880546497,40.6463003913233,40.6462826846923,40.6462677856628,40.6462519349472,40.6462127865494,40.6461764613117,40.6461696339601,40.6461559884033,40.6461133248084,40.6461113582738,40.6460851985463,40.6460655693589,40.6460591213664,40.6460442155456,40.6460444188707,40.6460517612949,40.6460544454779,40.64605511109,40.6460597397624,40.6460310854832,40.6460255463916,40.6460248621173,40.6460152827393,40.6460142877909,40.6460142273722,40.6460099719417,40.6460057302724,40.6460044075754,40.6460031399257,40.6460068527338,40.6460090886501,40.6460227047609,40.6460281510345,40.6460354644416,40.6460396991145,40.6460405447086,40.6460300312383,40.6460277053547,40.6460044836899,40.6459806891245,40.6459481992659,40.6459480386941,40.6459122686969,40.6458732393411,40.6458729454252,40.6458689226674,40.6458233704129,40.645784950724,40.6457772059866,40.6457413081786,40.6457276462769,40.6457233972043,40.6457148386009,40.6457140465681,40.6457122409813,40.6456669302483,40.645625033436,40.6455924359809,40.64557631528,40.6455608348012,40.6455608012702,40.645548107164,40.6455161169189,40.6454976795353,40.6454674551086,40.6454540737341,40.6454500673036,40.6454190229184,40.6454131766001,40.6453942271256,40.6453752435664,40.6453643068073,40.6453391428568,40.6453292801243,40.645317024602,40.6453088237718,40.645306298446,40.6453062870006,40.6453087109379,40.6453131336411,40.6453132675083,40.6453165635434,40.6452792180679,40.6452789747816,40.645265323353,40.6452652466994,40.6452559569769,40.6452312390442,40.6452111468334,40.6452014048276,40.6451979910046,40.6451715688882,40.6451601211562,40.6451536727363,40.6451355306013,40.6451281043469,40.6451165868381,40.6450957058106,40.6450798367506,40.6450675492054,40.6450658489928,40.6450837932177,40.6451140426569,40.645126532113,40.6451265795124,40.6451333885267,40.6451547598159,40.6451581679949,40.6451581951179,40.6451585658025,40.6451701956006,40.6451685243957,40.6451667903462,40.6451660273533,40.645164231129,40.6451599936705,40.6451505653505,40.6451197877599,40.6451103297696,40.6450770346945,40.6450325738294,40.6450212477395,40.6450052047072,40.645003481544,40.6450213886855,40.6450214406526,40.6450263336568,40.645035019975,40.6450392301835,40.6450426002836,40.6450664564628,40.6450980001566,40.6451261260605,40.645152870548,40.6451576724471,40.645187504983,40.6451878442258,40.6452241791344,40.645224153871,40.6452045734595,40.6451959259295,40.6451861640294,40.6451659962081,40.6451377946994,40.6451061829747,40.6450842214789,40.6450779512671,40.645066637927,40.6450531653152,40.6450138770514,40.6449985508448,40.644979697309,40.644976389757,40.6449711329456,40.6449454702429,40.6449189715897,40.6448870693433,40.6448677209282,40.644813892939,40.644787129315,40.6447669023017,40.6447440262291,40.6447275644753,40.6446771393899,40.6446250104204,40.6445703254787,40.6445540939522,40.6445374036129,40.6445250320833,40.6444737776079,40.6444532569658,40.6444446970552,40.6444403582769,40.6444463187602,40.6444465052994,40.6444573635609,40.6444651024072,40.644474210426,40.6444745060529,40.644498432988,40.6445197895142,40.6445221546621,40.6445223399814,40.6444872827779,40.6444385588439,40.6444216412576,40.6444214488052,40.6444156481737,40.6443906680588,40.644382392764,40.6443522102197,40.6443520606624,40.6443453641479,40.6443314470882,40.6443297822619,40.6443306768124,40.6443124903784,40.6443110131266,40.6442943610431,40.6442320796632,40.6441930670323,40.6441924403361,40.6441868744599,40.644179458549,40.6441704276268,40.6441367071062,40.6441131851903,40.6441033803844,40.6440738551496,40.6440504025874,40.6440059499888,40.6439933625191,40.6439490558924,40.643894599054,40.6438401417108,40.643816787721,40.6438016719912,40.6437939567027,40.6437865305177,40.6437785648081,40.6437477927917,40.6436956641218,40.6436954975401,40.6436614504065,40.6436610133672,40.6436605250909,40.6436604832001,40.6436604527836,40.6436603531017,40.6436567254298,40.6436518820848,40.6436305060034,40.6436116868008,40.6436047586161,40.6435937167537,40.6435828939546,40.6435757122099,40.643569693431,40.6435594522047,40.6435389296429,40.6435276663289,40.6435200981871,40.6435130718798,40.6434978231959,40.6434721734095,40.6434630249049,40.6434601780636,40.6434558675598,40.6434395817223,40.6434193371913,40.6434190535153,40.6434096307478,40.6433907684692,40.6433650810105,40.6433368310063,40.6433202774078,40.6433034593052,40.6432863292051,40.6432640544893,40.6432469553097,40.6432259714171,40.6432247292607,40.6432207412338,40.6432206890359,40.6431939227624,40.643180195731,40.643165671456,40.6431495395663,40.643143396613,40.6431211469724,40.6431162880596,40.6430869219451,40.6430741786959,40.6429106699013,40.6424503491884,40.6418744659761,40.6413507105514,40.6408349391228,40.6402187727684,40.6397574331381,40.6395816471509,40.6391588197373,40.6384222356303,40.6382178393207,40.6381922454172,40.6381793878211,40.6382665874406,40.6383029810972,40.6384359481243,40.6384595436956,40.6384394052468,40.6383685571927,40.6383377247465,40.6378673460452,40.6378357011734,40.6377134505503,40.6375865973655,40.6374544066025,40.6374049392746,40.6372291053996,40.6370746548416,40.6369026640831,40.6367354751942,40.636026079762,40.6358084951236,40.6355642563578,40.6354059975606,40.635256474768,40.635082035605,40.6349686418916,40.6348278444788,40.634708234642,40.6345549765454,40.6344241559521,40.634263210453,40.6330044006804,40.632232088569,40.6321024657081,40.6318898090714,40.6318016911699,40.631479931125,40.6313435127016,40.6311964362661,40.6310401202817,40.6308762579708,40.6307068009622,40.6305338211574,40.6303594962852,40.6301859516969,40.6301184614918,40.6300152334118,40.6299221637511,40.6298177865945,40.6297976078495,40.629732800961,40.6296687904851,40.62960934251,40.6295577015887,40.6295160349859,40.6294692415527,40.6294319257387,40.6294077575985,40.6293991838171,40.6294067547319,40.6294290197829,40.6294629811594,40.6295609280354,40.6295901762479,40.6295902000275,40.6295902142316,40.6295593785202,40.6295262501616,40.629453600378,40.6293990570893,40.6292890808949,40.6290361258462,40.6289162349389,40.6270840111824,40.626680605523,40.6264614194652,40.6262566961515,40.6260344630684,40.6258952012101,40.6257018950258,40.6255473215584,40.6254210421054,40.6252947006402,40.6251820340768,40.6250815553665,40.6249099531853,40.6247905980889,40.624682644705,40.6245330128578,40.6244106375749,40.6242781414487,40.6241897934552,40.6240767695628,40.6239600256484,40.6238221439521,40.6237012338742,40.6235995711791,40.6234325659253,40.6229028460825,40.6230167763594,40.623489014407,40.6252314183503,40.6255332381548,40.6258775876737,40.6262178579574,40.6263062001343,40.6264752921064,40.6265025184656,40.6265309800029,40.6266391339272,40.626666367847,40.6266727909604,40.6266864131829,40.6267223055691,40.6267397903968,40.6267428390799,40.626746817817,40.6268542213158,40.627091766522,40.6271638377239,40.6274876549916,40.6278768995159,40.6282482765628,40.6282523138297,40.6282598426587,40.6285556982776,40.6289460081003,40.6292939445283,40.6295338902397,40.629674593442,40.6300920840584,40.6304660782446,40.6308705827424,40.6309295249514,40.6309948313043,40.6310663186849,40.6311437866448,40.6312270179656,40.6313157792677,40.6314098216647,40.6319496036457,40.6319821276652,40.6320103899215,40.6320340503241,40.6320528241585,40.6320664855117,40.6320748699909,40.6320742736645,40.6320672495282,40.6320538490497,40.6320341704175,40.632008357822,40.6319766003982,40.63193913084,40.6318962236953,40.6318481933534,40.6317953917419,40.6317382057474,40.6316137945316,40.6315666906195,40.6315166015534,40.6314641965442,40.6314101757429,40.6313552608869,40.6313001856561,40.6312456858717,40.6311924896649,40.631141307749,40.6310928239244,40.6310476859428,40.6310064968541,40.6307682297696,40.6307373832716,40.6307026823168,40.6306647512909,40.6306242726979,40.6305819748798,40.6305386189111,40.6304949849043,40.630451857973,40.6299956843306,40.6297599665778,40.6297238742527,40.6272014092517,40.6267836383167,40.6251331918815,40.6248336155542,40.6249401986997,40.6249494941617,40.6249688484408,40.6251832317866,40.6255451449599,40.6257748196835,40.625792780664,40.6257756176298,40.6258649560844,40.6258584656061,40.6257672676287,40.6257268809866,40.6257199010797,40.6256784827233,40.6256721159555,40.6256315959497,40.6256227696826,40.6255821131854,40.6255750552147,40.6255342623931,40.6255267738276,40.6254860843057,40.6254779634427,40.6254371193062,40.6254280036886,40.6253861543329,40.6253809587746,40.6253395590706,40.6253319924257,40.6252913241113,40.6252837683615,40.6252430053393,40.6252338550935,40.6251941065515,40.625186137303,40.6251458844419,40.6251379009189,40.6250976018434,40.6250890430678,40.6250478245146,40.6250420932601,40.6249990051079,40.6249931951422,40.6249540648112,40.6249487887973,40.6249132419243,40.6249069805418,40.624872461941,40.6248643892369,40.6248311605219,40.6248236427444,40.624789203085,40.6247824161,40.6247729884906,40.6247414698037,40.624706475775,40.6247000472108,40.6246652368816,40.6247453816744,40.6247379537638,40.624640769383,40.6246133871959,40.6247054984719,40.6246994560176,40.6246188537803,40.624575406894,40.6245394262253,40.6245217474162,40.6244978565305,40.6244904847151,40.6244556839956,40.6244487328757,40.6244122544834,40.6244060566628,40.6243701291463,40.624448887625,40.6244442391696,40.624349364751,40.6246022561968,40.6245557410155,40.624570588909,40.624484183941,40.6243679502277,40.6243105651223,40.6242133348733,40.6240509944495,40.6240391828618,40.6240680600541,40.6240523937135,40.62446290725,40.6244098539303,40.6243965183052,40.6244423970509,40.624023326836,40.6239827133039,40.6239765512653,40.624017646045,40.6239825670153,40.6239354635428,40.6239246893073,40.6239498185985,40.6239359210622,40.6239883489576,40.623988381354,40.6239905336476,40.6239926392731,40.6239942178223,40.6239580267315,40.6239577803167,40.6239564718528,40.623955138547,40.6239550576393,40.6238997867403,40.6238829880753,40.6239388525132,40.6239545312565,40.6239028916939,40.6238507589239,40.6237987286118,40.6237473952509,40.62369734537,40.6236491508316,40.6236033622981,40.6235605029404,40.6235405459163,40.6235258727886,40.6235167571318,40.6235133689033,40.6235157712752,40.6235239194564,40.6235376615274,40.6235567412731,40.6235808029592,40.623586510926,40.6235907506615,40.6235934048461,40.6235944000352,40.6235937086904,40.6235913499421,40.6235873890603,40.6235819356478,40.623575140608,40.6235671919689,40.62355830968,40.6235487395261,40.6235387463259,40.6235286066045,40.6235186009411,40.6234494339465,40.6233810148032,40.6233138310719,40.623248361508,40.6231850726506,40.6231244154975,40.6230668222918,40.6230127034416,40.6229624445962,40.6229534393256,40.6229484036109,40.6229474073054,40.6229504642295,40.6229399237097,40.6229233658442,40.6229009199713,40.6228727614224,40.6228391101519,40.6228002290189,40.6227564217342,40.6227080304873,40.6226554332732,40.62259904094,40.622539293979,40.6224766590841,40.6217727551257,40.6217379444994,40.6217072793056,40.6216815673831,40.6216614860818,40.621647564419,40.6216401691436,40.6216394950747,40.62164555997,40.6216582040574,40.6216770942442,40.6216873619028,40.6216954470039,40.6217029707679,40.621709928859,40.6217199833312,40.6217294995603,40.6217384693552,40.6217468848575,40.6217547423984,40.6217620364667,40.6217687588722,40.6217749062804,40.6217804743551,40.6217854592584,40.6217898583312,40.6217936653884,40.6217968789441,40.6217994985139,40.6218015200936,40.6218029421962,40.6218037653417,40.621796903481,40.6217905189006,40.6217846241903,40.621779229259,40.6217743485435,40.6217699901063,40.6217661611845,40.6217628728584,40.6217601311882,40.6217579398883,40.6217563040133,40.6217552276118,40.6217547120534,40.6217547597129,40.6217553696152,40.6217565411171,40.6217582703965,40.6217605553042,40.621781802944,40.6218033787748,40.621825280791,40.6218211722316,40.6218176360392,40.6218146826351,40.6218123219417,40.6218105622081,40.6218094061512,40.6218088600092,40.6218089248304,40.6218096001476,40.6218108843268,40.6218127735538,40.6218152601613,40.6218183369842,40.6218219960192,40.6218233706594,40.6218241742964,40.6218244052863,40.6218240626585,40.6218231491274,40.6218216642213,40.6218196145076,40.6218170028681,40.6218138368726,40.6218101225859,40.6218058717644,40.6218016507495,40.621797692026,40.6217940551077,40.6217907899647,40.621787940877,40.6217855494541,40.6217836472553,40.6217822636676,40.6217814156836,40.6217811166124,40.6217813692111,40.6217821720453,40.6217835122936,40.6217853715959,40.6217968366147,40.6218075157497,40.6218174001454,40.6218264844646,40.6218301016725,40.6218335199671,40.6218367395273,40.6218397598651,40.6218425769735,40.6218515616238,40.6218506421593,40.6218429520814,40.6218374914653,40.621830068884,40.6218137604164,40.6217854380092,40.621766571825,40.6217622873704,40.6217494468294,40.6217471265255,40.6217451613701,40.621744604942,40.6217052098269,40.6216956671465,40.6216876479827,40.6216820622121,40.6216831999536,40.6216839656214,40.6216735100261,40.6216551159452,40.6212436759307,40.6210161464114,40.6207715825901,40.6204083796304,40.6202248332221,40.6201216084871,40.6199461090915,40.6197563422735,40.6195594256787,40.619373928507,40.6192626318,40.6191099473268,40.6189743765835,40.6187951227492,40.6180025403001,40.6172093028479,40.6164155529934,40.6156214346673,40.6152289213095,40.614640034109,40.6145686317806,40.6142134466973,40.6139647841999,40.6138248437176,40.6135518418141,40.6132210650464,40.6127617997904,40.6125423115649,40.6123230121769,40.6121040479619,40.6118855647149,40.6116677085526,40.6114506248433,40.6101853714281,40.6083111707694,40.6081500847918,40.6067882167964,40.6054002913384,40.6054158103404,40.6054320922665,40.6055258863466,40.6055440658224,40.6055418726324,40.6055473178956,40.6055567256047,40.605569707538,40.6055757088006,40.6056003094609,40.6056130206579,40.6056111935843,40.605606683723,40.6055942207036,40.6055714371776,40.6055567198757,40.6055539217289,40.60556691424,40.6055836716385,40.605591367587,40.6056054215472,40.605614088031,40.6056246620268,40.6056317529225,40.6056360513387,40.6056326280197,40.605622187291,40.6056079577288,40.6056033350892,40.6056092657947,40.6056158223217,40.6056213223982,40.6056251426637,40.6056401402263,40.6056504323069,40.6056575573261,40.6056781119573,40.6056969569627,40.6057044271965,40.6057064828081,40.6057107306192,40.6057209380192,40.6057339100287,40.605749187867,40.6057667173356,40.6057792040205,40.6057938070603,40.6058073426654,40.6058500188413,40.6058975167934,40.6059360771564,40.6059690262586,40.6060523247569,40.6061295895492,40.6062410620256,40.606287105697,40.6063460929076,40.6063744238577,40.6065052193762,40.6065729943578,40.6067191750657,40.6067972385059,40.60693328793,40.6070084286412,40.6070677723318,40.6071074373451,40.6071518623058,40.6071968460431,40.6072792340411,40.6074504458281,40.6075434914857,40.6076163920016,40.607669785436,40.6076996173729,40.6078498569373,40.607940110737,40.6080698081008,40.6081726807072,40.6082169835802,40.6082595514346,40.6083292023167,40.6083866181618,40.6084723371921,40.6085413394309,40.6086078937517,40.6086536044136,40.6086926069988,40.6087445859261,40.6088074948927,40.6088715218823,40.6089208386905,40.6089598014005,40.6090133726754,40.6090931745925,40.6091921053485,40.609242675475,40.6092596722225,40.6092755586455,40.6092872239439,40.609330213413,40.6093924858602,40.6094291501619,40.60945397364,40.6094675931323,40.6094801533491,40.6095304693316,40.6096280883329,40.6098874824485,40.6099898361084,40.6100166668447,40.6100418269555,40.6100740101763,40.6101007758929,40.610116474304,40.6101203714447,40.6101141562852,40.6101149680017,40.6101173707301,40.610156127123,40.6102086131164,40.610242082216,40.6102747976857,40.6102962297612,40.6103270609135,40.6103712456314,40.6104060915147,40.610439897465,40.6104847785475,40.6105428443767,40.6105683508406,40.6106107485455,40.6107015803233,40.6107573537309,40.6107748637924,40.6107852289927,40.6108011624363,40.6108215299791,40.610859810763,40.6108929430532,40.6109081284033,40.6109198312834,40.6109406086871,40.6109626779231,40.6109861768946,40.6110132935497,40.6110326878591,40.611033161412,40.6110318435301,40.6110468785487,40.6110880438777,40.611145232,40.6112302828639,40.6113207502419,40.6113755070488,40.6113780877403,40.6113879406913,40.6113900522164,40.6113904935834,40.6113701182727,40.6113618632195,40.6113749833907,40.6114182336222,40.6115538988934,40.6116529269004,40.6117018406422,40.6117378097564,40.611750552314,40.611782820278,40.6118075718089,40.6118256599545,40.6118432682957,40.6118506648302,40.6118269409431,40.611824497389,40.6118240145061,40.6117659909123,40.6117420947601,40.6117430241693,40.6117557734881,40.6118664529445,40.6118975728199,40.6119606412289,40.6119517282182,40.6119459893939,40.6119614207792,40.6118856475719,40.6118618584918,40.6118393673383,40.6118149990323,40.6105752492363,40.6105815421847,40.6105638175466,40.6105546777758,40.6105377845673,40.6105288810042,40.6105129421812,40.6105030086024,40.6104905040899,40.6104810431033,40.6104988210591,40.6105250577841,40.6105333206097,40.6105647563297,40.6105802744991,40.6106389526909,40.6118262111995,40.611827233144,40.6117716399164,40.6117806211642,40.6118781891843,40.6118726551686,40.6118975612658,40.6119070078458,40.6119804121826,40.6120160166773,40.6119432909676,40.611943297738,40.6119243137495,40.6119209669434,40.611826025296,40.6118368818644,40.6118947897639,40.6119065225554,40.6119318073368,40.6119444560964,40.6119703688695,40.6119845649074,40.6120116910776,40.6120251705671,40.6120527977855,40.6120656651954,40.61208669411,40.6121594419764,40.6120842562175,40.6120952149873,40.6121865434486,40.6121750305937,40.6121684090674,40.6120787463598,40.6119942272823,40.6119258091708,40.6119483636902,40.611936401197,40.6119583792475,40.6120335600048,40.6121639739466,40.6122470670015,40.6135507534181,40.6135550894721,40.613564560182,40.6150633139773,40.6150385727035,40.6150095030529,40.6148829739438,40.614875299251,40.6149021723704,40.6149096948233,40.6149298741369,40.6149374135235,40.6149623328646,40.6150018260908,40.6149258969279,40.614934853273,40.6149533892196,40.6149899808314,40.6149701407506,40.6149907566442,40.6150241002558,40.6150539617539,40.6150505413353,40.6150774614114,40.615150178466,40.6151534240616,40.6160638715008,40.6161140175788,40.616000150328,40.6160098753384,40.6161378277568,40.6162959199902,40.616359594281,40.6162038826614,40.6160875818794,40.6161050646555,40.6162213675258,40.6163515259324,40.616235218724,40.6162585357007,40.6163780969955,40.6165336003568,40.6166098602143,40.616443881555,40.6163444325489,40.6163627367146,40.6164621857432,40.6165515018876,40.6166084499154,40.6165861334143,40.6167127445685,40.6166293764513,40.6166954400081,40.6167807396306,40.616845429918,40.6168653910846,40.616896467128,40.6168766896164,40.6169087531164,40.616873349794,40.6168605645372,40.6169035346007,40.6169636415001,40.6170394027203,40.6170851556364,40.6171752172589,40.6172006397175,40.6171581733431,40.6171939442325,40.6171854251832,40.6173910292781,40.6173209081646,40.6172654970542,40.6174363967214,40.6173907930586,40.6173310379918,40.6171678549094,40.6171504108085,40.6173116466277,40.6171604383319,40.6165309989616,40.6165174284536,40.6168729573246,40.6166325516129,40.6165316217291,40.616085198377,40.6159801902155,40.6156690164285,40.6157523867443,40.6157368440612,40.6156011240516,40.6156127838919,40.6156515622868,40.6159693598432,40.6160648226364,40.6165219474828,40.6166461618491,40.6168904418824,40.6169914848194,40.6168664615923,40.616670505789,40.6166864083358,40.6165753714996,40.6165654374337,40.6163926697994,40.6157962913698,40.6157861501057,40.6157727864047,40.6154927664738,40.6154506305757,40.6154549830879,40.615392438067,40.6152431462564,40.614798266643,40.6145366540086,40.6145580417259,40.614484133139,40.6144506995698,40.6143076571172,40.6143178615798,40.6130403392662,40.6128816747953,40.6128793665801,40.6128736371189,40.6128062434577,40.6123565720308,40.6122266982815,40.6121875388266,40.6121552711932,40.6120999581468,40.6120367595738,40.6120167810349,40.6119551526017,40.612042410287,40.6119986864317,40.6119779621676,40.612010756372,40.6119725815915,40.6119277670078,40.6118961393837,40.6116888679322,40.6114064903726,40.6114795439001,40.6114904700152,40.6115471638637,40.6115198461586,40.6114664244107,40.611469702511,40.6113890087427,40.6113474733717,40.6113112670576,40.6112714881188,40.6109675376546,40.610881933282,40.6109314687315,40.6108101878957,40.610752722667,40.6104824497254,40.6105042330877,40.6104227726005,40.6103433160321,40.6102559631195,40.6101831353653,40.6095530845587,40.6095490030531,40.6090427655628,40.6090379159839,40.6086196995301,40.6083993107518,40.6083789281505,40.6083506813982,40.6083141928554,40.6083070850216,40.6082997328633,40.6082905411419,40.6082875734561,40.6082798543432,40.6080597291121,40.6080596749922,40.6078077841515,40.6078074812434,40.6077870557599,40.6075104217712,40.6073454189906,40.607345166108,40.6072331775322,40.607233090025,40.6063475334301,40.6062583684602,40.6062213698497,40.6060945491333,40.6060951337444,40.606096766405,40.6058722212995,40.6058569219289,40.605797243755,40.6057633607389,40.6056746865559,40.6056678646822,40.605710384119,40.6057035514769,40.6057058582742,40.6057296117958,40.605475863929,40.6052539333397,40.6050317785639,40.6049081829094,40.6049100903244,40.6049347970237,40.6052268088299,40.6053242701596,40.6055402975894,40.6058978586435,40.6060055333403,40.6061165042758,40.6062976110349,40.6063840287044,40.6063539800078,40.6063589229357,40.606371394478,40.6063774212887,40.6063769826683,40.6063700801231,40.6063567373605,40.6063370002069,40.6063109364508,40.6062786356096,40.6064332975922,40.6063908422836,40.6065275750092,40.6066167467397,40.606635399067,40.6066532851099,40.6066608372663,40.6066587220479,40.6066469376475,40.6066086163553,40.6065649654979,40.606536519331,40.6064661462109,40.6064661656541,40.6064836845838,40.6064937184098,40.606483646661,40.6064525759252,40.6064776030248,40.6061683055072,40.6060808600487,40.6060271979874,40.6059997221777,40.6058226772315,40.6056577955482,40.6056651971674,40.605293847168,40.6051505096431,40.6050494265281,40.6050600737971,40.6047399699945,40.6047292670212,40.6045165478595,40.6045254997872,40.6044458559816,40.6044581630975,40.6041289500776,40.6040733739186,40.6039136725236,40.6039765286766,40.603927107042,40.6039441068494,40.6035054761007,40.6037519024197,40.6038461133724,40.6038784358375,40.6039291391616,40.603982513837,40.6040164870758,40.6042064569534,40.6041576846878,40.6052040945471,40.6052453862556,40.6053219881056,40.605355722106,40.6053236070347,40.6058388354957,40.6060621994005,40.6060997417253,40.6064406336589,40.6064605972484,40.6068145620528,40.6068359695563,40.6069064426111,40.6069385485231,40.6069885870373,40.6070893934447,40.6071633760684,40.607205259801,40.6073194996768,40.6076248467802,40.6078341464356,40.608675662669,40.6087534175416,40.6087738838897,40.6094235400486,40.6094368366582,40.6087600147206,40.6086992087224,40.60862975409,40.608710013687,40.6087609323074,40.6087629488929,40.6089060573668,40.6089367303121,40.6088141310899,40.6088208548986,40.6089748774135,40.6089313863826,40.6094367499708,40.6094669156244,40.6094941922311,40.6094727123421,40.609551335121,40.60954543189,40.6094572855877,40.6094378226778,40.6100888929049,40.610109589457,40.6104305088604,40.6105155750761,40.6108834775449,40.6109284706933,40.6112666573381,40.6113357288087,40.6113931594926,40.6113420778482,40.611455026073,40.6115708516417,40.6116532236649,40.6118953851747,40.6127082875381,40.6132985420998,40.6133252111723,40.6133702383189,40.6135326872776,40.6135003332075,40.6134930825904,40.613958155055,40.613993630319,40.6144529693109,40.6146422685683,40.614888233399,40.6148052074812,40.6147919739918,40.6147787675893,40.6148033523939,40.6149014780134,40.6149199282147,40.6149324567371,40.6149388161878,40.6149388809906,40.6149189369133,40.6148942602078,40.6148651576932,40.6148319912163,40.6148063650452,40.614779078602,40.6147728186379,40.614722430734,40.614675250551,40.6146768305711,40.6146772205063,40.6144683287447,40.6143509474298,40.6140037143864,40.6138902096963,40.6135693546927,40.61355234522,40.6137302335499,40.6138590549775,40.6138453763124,40.6138197829392,40.6136180308037,40.6135403333358,40.6136171958229,40.6138078353667,40.6136261007912,40.6133285871969,40.61340281131,40.6133848602005,40.6132363964689,40.6132517840535,40.6133097996057,40.6136056127041,40.6135296807404,40.6134835208167,40.6134468340347,40.6128819393443,40.6129245653353,40.6129100373905,40.6128597385913,40.613450267087,40.6134246710421,40.6134691219989,40.6134904505059,40.613520542098,40.6134435892655,40.6118308445138,40.6111784554682,40.6111276566865,40.6111432240611,40.6110907540043,40.6110751947341,40.6110936305744,40.6110398507016,40.6110058232506,40.6109959208572,40.6110654000929,40.6110738942881,40.6111180777229,40.6102753430802,40.6102083940582,40.610124283596,40.6098065694399,40.6097948480504,40.6097825382017,40.6097698588146,40.6097570353818,40.6093272338009,40.6093174985393,40.6096676306587,40.6096628644463,40.6087859371204,40.6087917728424,40.6093043000659,40.6093113276688,40.6088665298833,40.608856219529,40.6088466969415,40.6088381747033,40.6088308430654,40.6088248656993,40.6084983090434,40.6080933582585,40.6081497790173,40.6080245809108,40.6080806942583,40.6084879462874,40.6083007475359,40.6082944590012,40.6082894068728,40.6082857410271,40.6082835702153,40.6082829500701,40.60828346764,40.6082672549711,40.6075888729273,40.6076539337654,40.6076453869077,40.6075013694187,40.6075447316676,40.6076105077085,40.6082568681995,40.6080429227903,40.6071740219358,40.6072431434162,40.6072293506406,40.607071236027,40.6070846678652,40.6071548528981,40.6080326417445,40.6079986579748,40.6079808362169,40.6079749039753,40.6079220777348,40.6077387974348,40.6073854138607,40.6072166240866,40.6071133237112,40.6069663569929,40.6067936582573,40.6067718340938,40.6062092523422,40.6053817785037,40.6053104238462,40.6039362526545,40.6039143513684,40.6039500059302,40.6033602216727,40.6032888837601,40.6028639195633,40.6027862134982,40.6027755049857,40.6027683227844,40.6027035782713,40.6027590122662,40.6027564787071,40.602872821727,40.6028778598195,40.6028881800501,40.6028844581063,40.6028504210127,40.6028393909776,40.6028681446828,40.6027557274091,40.6027511719481,40.6027432566448,40.6026902515068,40.6026684367292,40.6026641797859,40.6026638333349,40.60259677511,40.6026079147135,40.6025241817043,40.6027637777699,40.6028986903068,40.60291169069,40.6027656146779,40.6025018702001,40.6024941523278,40.6024689100275,40.6024567749681,40.6024253932301,40.6023669755652,40.6024468335641,40.6024421799559,40.6024756165467,40.6024867815816,40.6025527210977,40.6026346115506,40.6027850620121,40.6027692474432,40.6026438822437,40.6026364479725,40.6025675884661,40.6025666474658,40.6027542487176,40.6027402916835,40.6025090507809,40.6024960246633,40.6024607277663,40.6024625913531,40.6024393811553,40.6024310098244,40.6023492958734,40.6023105604036,40.6022908278168,40.6022584481983,40.602250351749,40.6022467736836,40.6022396477052,40.6022202559288,40.60248795356,40.6024911690055,40.6027086770165,40.6026947099864,40.6025074055747,40.6024532629461,40.6024227042768,40.6024847036406,40.6024345863744,40.6024320853244,40.6022144534231,40.6022062101667,40.6022000942777,40.6022000475843,40.6021908654864,40.602182748843,40.6021791377972,40.6021654144263,40.6021476292916,40.6021368889129,40.6021398089178,40.6021548419536,40.6021557036834,40.6021354884034,40.6022178711912,40.6022327622449,40.6022597359265,40.602275084478,40.6022833281228,40.6023644399555,40.6023921789073,40.6023860411629,40.6023725436155,40.6022978911655,40.6022898918512,40.6023244471742,40.6023028085564,40.6022894288186,40.6022782578443,40.6022939286424,40.6022887414161,40.6023215120344,40.6023204035801,40.6024393231039,40.6024504457434,40.6024508564167,40.602515972583,40.6025162094103,40.602531876853,40.6025334184123,40.6025365887735,40.6025400980263,40.6025427617149,40.6025455677351,40.6025488209501,40.6025521998192,40.6025548794941,40.6025580740821,40.6025607294953,40.6025653601719,40.6025604309871,40.6025164175162,40.6025320065939,40.6026832995322,40.6026796931991,40.6025494216934,40.6025403093036,40.6026741502693,40.6026733988092,40.6026068487114,40.6025929244346,40.60258967032,40.6025826247465,40.6025816924555,40.6025671965813,40.602566861501,40.6025621311065,40.6025613103284,40.6025443213109,40.6025428745,40.6025386893903,40.6025349549231,40.6025313041836,40.6025264997554,40.6025230274085,40.6025185989844,40.6025157973086,40.6025108951302,40.6025088635341,40.6025029041754,40.6025008334797,40.6024967185385,40.6024937859353,40.6024883691877,40.6024857342638,40.6024801678899,40.6024770703247,40.6024718969813,40.6024677422281,40.602464157749,40.6024602430599,40.6024587181299,40.6024566695284,40.6024549590184,40.6024528382112,40.6024501459058,40.6024483399614,40.6024461952189,40.6024445180638,40.6024424033118,40.6024406944537,40.6024384086742,40.6024374234798,40.6024347105927,40.6024332466192,40.6024330644265,40.6024289786963,40.6024268304951,40.6024238404451,40.6024330522595,40.6024989217383,40.602497814322,40.6023757110459,40.6023646421866,40.6023630641876,40.6024923380602,40.6024904832885,40.6023423548366,40.602348369481,40.6024032064486,40.6024068259582,40.602408348885,40.6024420687611,40.6023968685694,40.6022245407857,40.602220762095,40.6021687162498,40.6021663273742,40.6021648578586,40.6021646064759,40.6021516438462,40.6022089431025,40.6022067655079,40.6021284742225,40.6021317293011,40.6021392214222,40.6021603173055,40.6021854500984,40.6022131580821,40.6021554647298,40.6021474506622,40.6021247455727,40.6020504541757,40.6020275009834,40.6021503341867,40.6024184967246,40.6024188913276,40.6024372998626,40.6024420406007,40.6024438218832,40.6024460226356,40.6024495308342,40.6024521693295,40.6024540208917,40.6024574365035,40.602459192828,40.6024614555412,40.6024646391146,40.6024672122626,40.602470127927,40.6024726482135,40.6024759183346,40.602478969582,40.6024813461012,40.6024838603713,40.602486559778,40.6024892352396,40.6024916966528,40.6024953893363,40.6024971858164,40.6025010032981,40.6025013381567,40.6025049126586,40.6025055665948,40.6025108951596,40.6025133347525,40.6025166461334,40.6025185585754,40.6025218852311,40.6025232836673,40.6025279150104,40.602529994609,40.6025341843789,40.6025353491375,40.6025374918763,40.6025402848733,40.6025429405998,40.6025449259472,40.602548030342,40.6025500598851,40.6025528674683,40.6025555683672,40.6025584407473,40.6025614427393,40.6025645449284,40.6025659928204,40.6025687769324,40.6025711293167,40.6025743142307,40.602577111451,40.6025788070999,40.6025815335193,40.6025843018069,40.6025869825119,40.602589022781,40.6025922490232,40.6025939609227,40.6025977360093,40.6025997317336,40.6026025533094,40.6026773836625,40.6026773432202,40.6025248276693,40.6025238228268,40.6025694196495,40.6025779918616,40.602576203913,40.6025280936214,40.6025257959735,40.6025230344128,40.6025216459811,40.6025198514606,40.6025171274248,40.6025136830786,40.6025130046453,40.6025104455957,40.6025079192802,40.6025060315055,40.6025032727206,40.6025012161182,40.6024986543858,40.6024962629627,40.6024943736788,40.602492198914,40.6024897247271,40.6024881817251,40.6024852387716,40.6024831636953,40.602480969973,40.6024782975171,40.6024767772565,40.6024747000024,40.6024721126157,40.6024701829101,40.6024674185377,40.6024657060021,40.6024634278354,40.6024610107357,40.6024584744885,40.6024464141567,40.6024458298981,40.6024194931783,40.6021588283835,40.602148118188,40.6021445152654,40.6021467536831,40.6021481874947,40.6021485456307,40.6021500095938,40.6021503978699,40.6021518700833,40.6021523020214,40.6021537379478,40.6021542310471,40.6021555848955,40.6021561102791,40.6021576417803,40.6021581564444,40.6021595885554,40.6021601177178,40.6021618500713,40.6021623846742,40.6021638395104,40.6021643081776,40.6021659693309,40.6021663262753,40.6021678489654,40.6021684997395,40.6021697589149,40.602170521408,40.6021716899462,40.6021728558419,40.6021739292871,40.6021751253163,40.602175866702,40.6021768537911,40.6021779342944,40.6021790444619,40.6021800649861,40.6021809348842,40.602182264874,40.6021830434725,40.6021842524942,40.6021862076276,40.6021862465141,40.602187155778,40.6021881088817,40.6021893551132,40.6021903642205,40.6021914954273,40.6021922367614,40.602194133009,40.6021944315951,40.6021950012176,40.6021950747162,40.6022003535893,40.6022004631554,40.602204722658,40.6022100462244,40.6022706292128,40.6022713058473,40.602190766258,40.6021374940651,40.6021356791902,40.6021145813573,40.6021078822754,40.6020213760277,40.6020003024256,40.6019852274149,40.6019709641885,40.6019566693689,40.6019546603244,40.6019588780471,40.6019777383277,40.6019893772129,40.6020096855776,40.6020328526463,40.6020417727388,40.6020440073769,40.6020396090894,40.6020284965373,40.6020054338454,40.6019924407801,40.6019793941798,40.6019716104516,40.6019571718541,40.6019287837607,40.6018761396736,40.6018437674106,40.6018012024864,40.6017447149137,40.6016922111089,40.6016356084143,40.6016314229658,40.601625205886,40.6016310724392,40.6016652403797,40.6017054507301,40.6017253878696,40.6017351692083,40.6017691166266,40.6018171101909,40.6018572932275,40.6019158037965,40.6019538505618,40.6019877977862,40.6020017477726,40.6020499155636,40.6020697480136,40.6020695116221,40.6020833549097,40.6021256916966,40.6021497186604,40.6021495435349,40.6021353054651,40.6021251298634,40.6021511007478,40.6022012121153,40.6022355910174,40.6022697407718,40.6022734522702,40.6022892212107,40.6022971018192,40.6022566014613,40.6022262763017,40.6022300414964,40.6022902140297,40.6023343198075,40.6023783895445,40.6023761721379,40.6023556895657,40.6023494273438,40.6023613005013,40.6023349848574,40.6023166035063,40.6023486335157,40.6024068106199,40.602428496439,40.60244834495,40.6024279142033,40.6024437610969,40.6024777426967,40.6024956123681,40.6024934483906,40.6025255574537,40.6025152931922,40.6025312896817,40.6025635052415,40.6025814628931,40.6025651660159,40.6025690339689,40.6025930344699,40.6026028751792,40.6025806234839,40.6025965942611,40.6025743249713,40.6025578588264,40.6025270396173,40.6025570092547,40.6025306683928,40.6024834878363,40.6025250466941,40.6025747220117,40.6026528247715,40.6026707723209,40.6026544027817,40.6026218861974,40.6025934510427,40.6025511043891,40.6025387536583,40.6025221089761,40.6024997693507,40.6024634112469,40.6024150843691,40.6024391806944,40.6024894231927,40.6025477145449,40.6025979376817,40.6025836363906,40.6025632650553,40.6025571076754,40.6025869170525,40.6026995036635,40.6026889041851,40.6027170504699,40.6027169075875,40.6027328894569,40.6027733076793,40.6027973864836,40.6028579244172,40.6028860170261,40.6028857305011,40.6029661741105,40.6030347735155,40.6030345763241,40.6030302403613,40.6030541767776,40.6030824115252,40.6030781467688,40.6031827216233,40.6031863932464,40.6032060819329,40.6031895449003,40.6031569913709,40.6032011892681,40.6032049324064,40.6031841841866,40.6031838237152,40.6032442536514,40.6032843114857,40.6032717329438,40.603243011613,40.6032423990735,40.6033345527554,40.6034630576613,40.6035018435102,40.6035302562173,40.6033337157131,40.6031395496582,40.6029479286463,40.6027590210335,40.6025729927906,40.6023900073572,40.6022102254256,40.6020338050139,40.6018609011165,40.6016916656375,40.6015262472569,40.6013647913002,40.6007224257862,40.6006172967681,40.6005394997349,40.6004421878207,40.60034986915,40.6001766530602,40.6001094747396,40.5999919367527,40.5998486122727,40.5997067538537,40.5995702245892,40.5995378517975,40.5992166619952,40.5990119106525,40.59893526048,40.5987839495326,40.5986470931164,40.5985768292878,40.5981782684278,40.5980803579686,40.5979142106879,40.5976683271628,40.5975857941684,40.5974865679341,40.5974482849823,40.5972752448865,40.5971330378058,40.5968897933079,40.596660945946,40.5965549837345,40.5965117752097,40.5964577740419,40.5963784851089,40.5961806050299,40.5958255678822,40.5956482055085,40.5955388143861,40.5955303424915,40.5952479116488,40.5951386420114,40.5949539854935,40.5946582059737,40.5943617534459,40.5940657889468,40.5931418129814,40.5927122640616,40.5926706050014,40.592665353465,40.5924072924776,40.592146975816,40.5921156518264,40.5918853203784,40.5916232749262,40.5913053973443,40.5912503951971,40.5909871660531,40.5906671631846,40.5903461214503,40.5900256519061,40.5897074315636,40.5893931542987,40.5890845033947,40.5887831268698,40.5884906201229,40.588208476483,40.5879380792242,40.5876806472683,40.5874372865109,40.5872088873254,40.5869961892243,40.5867997352066,40.5866198896791,40.5863656846476,40.586417452337,40.5864279659366,40.5866973574714,40.5867355921057,40.5867942064226,40.5868567234545,40.5869096652388,40.5869621255744,40.5870190309566,40.5870342384174,40.5870452676639,40.5870528552334,40.5870521142803,40.5870452188461,40.5870297365494,40.5870151085554,40.5870068933694,40.5869938728654,40.586988204912,40.5869859543062,40.5869885976983,40.5869961204242,40.5870139360131,40.587041561345,40.5870638504099,40.5871219332312,40.5871469509465,40.5871572511471,40.5871761189513,40.5872133479352,40.5872363191327,40.5872415348799,40.587262625388,40.5872883959831,40.5873051170384,40.58732083778,40.587353495323,40.5874505028999,40.5874983729816,40.5875209965069,40.5876008133338,40.5876710826952,40.5877002632586,40.58779627474,40.5879089767518,40.5879925199568,40.5880526135931,40.5881226087026,40.5881682702251,40.5882168766571,40.5882932073502,40.5884068312272,40.5884674333711,40.588523359866,40.588624886986,40.5887183248473,40.5887828409391,40.5887921704262,40.5887980699807,40.5888022589332,40.5888088909413,40.588825807326,40.5888353621585,40.5888402493375,40.5888559336521,40.5888694241856,40.5888863684762,40.5888925069634,40.5888964256647,40.5888998430154,40.5888963984273,40.5888939366353,40.5889571700909,40.589008160573,40.5891101253604,40.5891657594871,40.5892159895817,40.5892395163739,40.5892544762274,40.5892668976308,40.5892696995174,40.5892729187775,40.589284238869,40.5892992203183,40.5893079240117,40.5893166288774,40.5893247058748,40.589332281345,40.5893538578783,40.5894409708878,40.5895234203245,40.5895413360023,40.5895536199744,40.5895617412294,40.5895723169482,40.58957894896,40.5895853294542,40.5895919335467,40.58959314794,40.5896029219387,40.5896137047494,40.5896365110076,40.5897272474354,40.5897677348628,40.5897900727755,40.5898062834487,40.5898225026256,40.5898406892375,40.5898554361776,40.5898618200873,40.5898664683259,40.5898657239558,40.5898666629945,40.5898732665815,40.5898855381314,40.5899024868488,40.5899216533444,40.5899329613493,40.5899486781605,40.5899557836101,40.5899643345437,40.5899775303013,40.5899875791503,40.5899976574302,40.5900055436763,40.590009471382,40.5900207431277,40.5900373914778,40.5900648260487,40.5900942285556,40.5901189458845,40.590137328162,40.5901480939536,40.5901485634642,40.5901566329502,40.590172070314,40.5902098500165,40.5902209105975,40.5902317208325,40.5902503938137,40.5902683225871,40.5902911407633,40.5903389688079,40.5904279978046,40.5904724080131,40.5905107420246,40.5905357393038,40.5905487438091,40.5905678505283,40.5905832883963,40.5905859011882,40.5906028964769,40.5906122167903,40.5906316228917,40.5906370228345,40.5906512509038,40.5906652143559,40.5906777134107,40.5906919368903,40.5907135367613,40.590728266696,40.5907390570015,40.5907613528763,40.5907834147494,40.590807943014,40.5908874321935,40.5909193203333,40.5910566234351,40.5911087530185,40.591136033276,40.5911590000519,40.5911870193409,40.5912156151751,40.5912430204739,40.5912653720878,40.5912912368956,40.5913721890998,40.5913930989128,40.59141584681,40.5914258682505,40.5914450319521,40.5914559792356,40.5914676012618,40.5914748772397,40.5914930085187,40.5915086006134,40.5915955450695,40.591608481627,40.5916315304964,40.5916536303257,40.5916845217829,40.5917120924049,40.591740628145,40.5917724125612,40.5917961789499,40.591817341192,40.5918412718948,40.5918631412766,40.5918807230292,40.5918911219639,40.5918988736361,40.5919210189821,40.5919217161345,40.5919371203269,40.5919624015271,40.5920046244744,40.5920225570786,40.5920292309297,40.5920412171691,40.5920460857131,40.592059037741,40.5920663803508,40.592077648971,40.5921214131483,40.5921651092205,40.5922087294806,40.5922680627818,40.5922780488186,40.5922878982145,40.5922975801391,40.5923070639219,40.5923163177205,40.5923253123704,40.592329837815,40.5923339757624,40.592337671046,40.5923408743594,40.5923435454352,40.5923456486948,40.5923474668998,40.5923486473099,40.5923491767909,40.5923490502474,40.5923493458593,40.5923502546727,40.5923517395445,40.5923537402183,40.5923561756812,40.5923589460062,40.5923682776214,40.5923728020153,40.5923771397359,40.5923812276504,40.5923895033153,40.5923979570403,40.5924065353952,40.5924151896367,40.5924238698458,40.5924325220771,40.5924418995685,40.5924510889048,40.5924600456799,40.5924687268161,40.5924770878992,40.5924848166086,40.5924928948254,40.5925012732717,40.5925098991517,40.5925187169979,40.5925758494856,40.5925888124428,40.5926018801615,40.592615024159,40.5926270093974,40.5926389105881,40.5926506964056,40.5926623372064,40.5926738001611,40.5926850537851,40.5926994546985,40.592714018027,40.5927287241754,40.5927435478524,40.5927584642674,40.5927734526503,40.5927884878745,40.5928793398937,40.5928897595064,40.5929000588911,40.5929102088892,40.5929201800061,40.5929299435843,40.5929394704609,40.5929709269436,40.5929772179514,40.592983854847,40.5929907875139,40.5929979654996,40.5930053350088,40.5930106500101,40.5930157960901,40.5930207023594,40.5930252989266,40.5930295239316,40.5930333188625,40.5930409380184,40.5930490001289,40.5930574473611,40.5930662210508,40.5930734500802,40.5930808941295,40.5930885051049,40.5930962339065,40.5931040319452,40.5931118479511,40.5931271798723,40.5931424878547,40.5931577291784,40.593172860964,40.5931789959,40.593185514471,40.5931923756591,40.593199537607,40.5932069576161,40.5932145906422,40.5932223899568,40.5932303096687,40.593238188716,40.593246019954,40.5932537584778,40.5932613593817,40.5932687762477,40.5932759665065,40.5933155434321,40.5933249730393,40.5933346220905,40.5933444411498,40.5933543786073,40.5933643823557,40.5933744017978,40.5933908271112,40.5934073924452,40.5934240721724,40.5934304300294,40.5934368456314,40.5934432727382,40.5934496619286,40.5934559659639,40.5934635975113,40.5934714408377,40.5934794626163,40.5934876254995,40.5934958909665,40.5935129740355,40.5935300666216,40.5935471432593,40.593564183173,40.5935832442532,40.5936023499395,40.593621473931,40.5936405909296,40.5936596746333,40.5936715531166,40.5936832812343,40.5936948298258,40.5937061714075,40.5937172798336,40.5937659675571,40.5937856885611,40.5938054942679,40.5938253422892,40.5938417078416,40.5938580798127,40.5938744337442,40.5938907463508,40.5939069956868,40.5939518079517,40.5939631756661,40.5939744340706,40.593985554693,40.5939965077194,40.594007265516,40.5940409748853,40.5940745741535,40.5941080402071,40.594116883233,40.5941227472703,40.5941257970529,40.5941347399583,40.5941436730805,40.594152554705,40.594161344618,40.5941923082201,40.594196580813,40.5942008287105,40.5942049745201,40.5942089452201,40.5942126699734,40.5942165311979,40.5942207869477,40.5942253754481,40.5942302280492,40.5942352744167,40.5942468787931,40.5942586215214,40.5942704697703,40.5942823878617,40.5942943394459,40.5943062896743,40.5943182020284,40.5943300403175,40.5943417700229,40.5943533561274,40.5943939944811,40.5944140802288,40.5944342701383,40.594454549632,40.5944749054724,40.5944953210713,40.5945069542889,40.5945184443672,40.5945297599699,40.5945408697596,40.5945517434003,40.5945623530708,40.5945726717844,40.594580369325,40.5945874405159,40.5945938457699,40.5945995527051,40.5946024183269,40.5946058076975,40.5946096522272,40.5946138744544,40.5946183842045,40.5946230898017,40.5946684855841,40.5946828307122,40.5946974364348,40.5947122787878,40.5947273346393,40.5947425793587,40.5947579879745,40.5947735355194,40.5947969450716,40.5948204994017,40.5948441815876,40.5948679745366,40.5948918613268,40.5949158248653,40.5949274352513,40.5949389342717,40.5949502959553,40.5949614934899,40.5949725044176,40.5949833022593,40.594993864053,40.5950041683439,40.595014188146,40.5950239043481,40.5950359662008,40.595048546941,40.5950616138747,40.5950751329721,40.5950854724728,40.5950961747725,40.5951072091936,40.5951185422108,40.5951301408094,40.5951459217951,40.5951619258705,40.5951781029324,40.5951825916871,40.5951871654973,40.5951917585205,40.5951963015666,40.5952007288082,40.5952049749265,40.5952089772906,40.5952138798107,40.595219068146,40.5952244915621,40.5952300911098,40.5952358098451,40.5952415872982,40.595247366511,40.5952550529861,40.5952625590759,40.5952698159044,40.595276763975,40.5952833387527,40.5952976413976,40.5953116191409,40.5953252483482,40.5953410996178,40.5953566330334,40.5953718239582,40.5953837813363,40.5953961257797,40.5954088274536,40.5954218545074,40.5954351791173,40.5954487659227,40.5954625849222,40.5954760218853,40.595489324904,40.5955024681702,40.5955154287256,40.595528180594,40.5955406986355,40.5955531217465,40.5955652199559,40.595576964599,40.595588328352,40.5955992825464,40.59565996411,40.5956727460983,40.5956861571533,40.5957001764739,40.5957147842733,40.5957264147179,40.5957385298231,40.5957511066176,40.5957641248134,40.595771680034,40.5957788998055,40.5957857353468,40.5957921400501,40.5958028947491,40.5958140541455,40.5958256051585,40.5958306164362,40.5958360096787,40.5958417374403,40.595847741727,40.5958510188814,40.5958538810054,40.5958562668865,40.5958581272005,40.595859424005,40.5958630929313,40.5958673789689,40.5958722376616,40.5958776185292,40.5958834675752,40.5959031382097,40.5959232419068,40.5959437667586,40.5959465024705,40.5959496577351,40.5959531604606,40.5959569305192,40.5959608822718,40.5959649274082,40.5959689729449,40.5959771178065,40.5959946642448,40.5960028185064,40.5960108383028,40.5960186834179,40.5960263166437,40.5960336996028,40.5960407954177,40.5960475698921,40.5960539908374,40.5960600235475,40.5960648320463,40.5960700975572,40.5960757957558,40.5960818998096,40.596088380543,40.5960980155638,40.5961081631159,40.5961187559833,40.5961298798242,40.5961407703933,40.5961513747301,40.596156195303,40.5961606464953,40.596164670968,40.5961682177406,40.5961712390106,40.596174947002,40.5961789501583,40.5961831774124,40.5961875456472,40.5961919781167,40.5961963880401,40.596206592041,40.5962168615389,40.5962271275136,40.5962366819675,40.5962460421173,40.5962551788004,40.5962640611794,40.5962714120017,40.5962783153771,40.5962847339132,40.5962906285363,40.5962969988147,40.596303707825,40.5963107165063,40.5963179794374,40.5963254508643,40.5963693203703,40.5963768981979,40.5963845901385,40.5963923402308,40.5964000928524,40.5964178270892,40.5964355422923,40.5964532066295,40.5964602983585,40.5964673771179,40.5964743628216,40.5964811691793,40.5964877154172,40.5964941242486,40.5965002182397,40.5965059675507,40.596511338312,40.5965163043607,40.5965208393641,40.5965249173246,40.5965438178234,40.596560440808,40.5965773773388,40.5965946046223,40.5966121037187,40.5966298530084,40.5966362981583,40.5966428903373,40.5966495846363,40.5966563260995,40.5966630642996,40.5966697474705,40.5966763241891,40.5966864432726,40.5966966504,40.5967068874451,40.5967170944315,40.5967272133885,40.5967406683257,40.5967538840264,40.5967668286453,40.5967794676552,40.5967868413268,40.596793935092,40.5968007115704,40.5968071288531,40.5968131513983,40.5968187461697,40.5968405692023,40.5968627760048,40.5968853526639,40.5968900975077,40.5968944717893,40.5968984205129,40.5969018898516,40.5969048392053,40.5969072261294,40.5969145734435,40.5969222908176,40.5969303380206,40.5969386790143,40.5969472740728,40.5969560804615,40.5969729765785,40.5969896866271,40.5970061901629,40.5970117585071,40.5970176518068,40.597023810225,40.5970301761085,40.5970366879587,40.5970432831083,40.5970499007375,40.5970582070034,40.5970667928511,40.5970756038532,40.5970845900998,40.5970936939745,40.5970969215161,40.5970999771823,40.5971027803595,40.5971052505845,40.5971073227958,40.597108940634,40.5971100586194,40.597110647688,40.5971106923294,40.5971149087454,40.5971200207938,40.5971257458375,40.5971320790024,40.5971390152444,40.5971465491879,40.5971477127165,40.597149433296,40.5971516911005,40.5971544607809,40.5971577116246,40.5971614073972,40.5971655050021,40.5971699589971,40.5971747210992,40.5971781835899,40.5971812755588,40.5971839024505,40.5971859879514,40.5971874693105,40.5971883042029,40.5971884667174,40.5971903551983,40.5971928111523,40.5971958275153,40.5971993953753,40.597203504823,40.5972171426807,40.5972313186516,40.5972460111043,40.5972612020972,40.5972760960775,40.5972914387759,40.5973072162743,40.5973234154956,40.5973400236939,40.5973570267863,40.5973693624049,40.5973820783595,40.5973951444764,40.5974085233799,40.5974221822196,40.597436085634,40.5974416261964,40.5974474538741,40.5974535182151,40.5974597625757,40.5974661286414,40.5974725601133,40.5974789975153,40.5974877363253,40.5974962566794,40.5975045284347,40.597512521955,40.5975155241676,40.5975185857694,40.5975215869759,40.597524412002,40.5975269525793,40.5975291104726,40.5975308021683,40.5975319615635,40.5975325453287,40.597535207322,40.5975372984625,40.5975388187283,40.5975395541576,40.5975409624428,40.5975430270955,40.5975457266085,40.5975490324347,40.5975529071604,40.5975593799682,40.5975663243488,40.5975736940276,40.5975814442434,40.597589523202,40.597597880286,40.5976064606929,40.5976101566859,40.5976140404091,40.5976180190298,40.5976219987246,40.5976258833375,40.5976295807509,40.5976330042192,40.5976360732061,40.5976401200262,40.5976446343608,40.5976495670033,40.5976548613673,40.5976604593559,40.5976662973362,40.5976723103285,40.597678431167,40.5976860816143,40.5976936290641,40.5977010043156,40.5977081408393,40.5977149749504,40.5977223449008,40.5977301962432,40.5977384756664,40.5977471343899,40.5977561162627,40.5977626910376,40.5977694678005,40.5977763971174,40.5977834307277,40.5977905165233,40.5977933565354,40.5977966072065,40.597800161047,40.5978038959702,40.5978076888658,40.5978114120736,40.5978149404266,40.5978230256686,40.5978305093317,40.5978373310459,40.5978408367979,40.5978448576561,40.5978493501806,40.5978542682594,40.5978595574004,40.5978703381742,40.5978811471057,40.597891919029,40.5979006610852,40.5979092879036,40.5979177653038,40.5979260604372,40.5979341436408,40.597941981393,40.5979495457025,40.5979568052222,40.5979623952288,40.5979676212239,40.5979724310695,40.5979767752995,40.5979806094707,40.5979838955015,40.5979836174641,40.5979842045262,40.5979856418207,40.5979914607844,40.5979975309163,40.5980037369299,40.5980099640578,40.5980167874412,40.598023552241,40.5980302093626,40.5980367132272,40.5980430189237,40.5980588116671,40.5980742975146,40.5980894583629,40.5981042759403,40.5981187344866,40.5981328158961,40.5981465040733,40.5981597820845,40.598163549403,40.5981668857712,40.5981697348453,40.5981720530011,40.5981738009712,40.5981749540566,40.5981754919089,40.5981754055764,40.5981746978293,40.5981758259382,40.598177522702,40.5981797765163,40.5981825736057,40.5981858985142,40.5981897304309,40.5981940461986,40.5981988211562,40.5982041424684,40.5982090865692,40.5982135926014,40.5982176007036,40.5982210595544,40.598223926539,40.598226163057,40.5982259054219,40.5982262718229,40.5982272507462,40.5982288020385,40.5982308629381,40.5982333521024,40.5982361707814,40.5982475807905,40.5982589599049,40.5982702592098,40.5982766061501,40.5982830409306,40.598289515307,40.5982959731601,40.5983023662375,40.5983086407546,40.5983147477775,40.5983206368659,40.5983262619288,40.5983360735805,40.5983455207019,40.5983545747913,40.5983632076837,40.5983751254452,40.5983874754515,40.5984001963577,40.5984209888317,40.5984420973181,40.5984634859526,40.5985149684967,40.5985256154405,40.5985359160917,40.5985458303872,40.5985553127327,40.5985624218982,40.5985698698809,40.5985776275078,40.5985856662841,40.598593957713,40.5986024704532,40.5986111724946,40.5986309756976,40.5986511498252,40.5986716702402,40.5986795500586,40.5986877410818,40.5986962017408,40.5987048856142,40.5987137484606,40.5987227418499,40.5987575982662,40.5987617021946,40.5987658687449,40.5987699947213,40.5987739759047,40.5987777144279,40.5987811159303,40.5987840940736,40.5987880576176,40.5987915587618,40.5987945714955,40.5987970718231,40.5988001801492,40.5988039101779,40.5988082255007,40.5988130816659,40.5988184320497,40.5988242203191,40.5988327687963,40.5988410081438,40.5988489135484,40.5988634277676,40.5988650966425,40.5988672422018,40.5988698228366,40.5988727818606,40.598876054395,40.5988795723809,40.5988832617414,40.5988931716715,40.5989028654053,40.5989122821104,40.5989161974233,40.5989196190528,40.5989225122691,40.5989248458604,40.5989278165216,40.5989299809228,40.5989313225732,40.5989326420715,40.5989345175675,40.5989369169926,40.5989397985707,40.5989431156691,40.5989656087355,40.5990188229919,40.5990421949351,40.5991107979863,40.5991277301048,40.5991618479378,40.5991800958732,40.599190883786,40.5992027010851,40.599226180821,40.5992511704841,40.5992577943357,40.5992823095547,40.5993138453146,40.5993242996941,40.5993217953096,40.5993124879575,40.5993843290991,40.5993937907503,40.5994033248813,40.599421614484,40.5994508780447,40.5994616901424,40.5994539542965,40.5994550778033,40.5994572836759,40.5994664960574,40.5994757301474,40.599486746689,40.599490950323,40.5994968897488,40.5994987918401,40.5995034980302,40.5995139155933,40.599523012777,40.5995275550898,40.5995330613027,40.5995365560147,40.5995449677745,40.5995484120326,40.5995471098665,40.5995456667807,40.5995474565114,40.5995542166704,40.5995982681453,40.5996180671538,40.599625812483,40.5996343885941,40.5996372838107,40.599635837954,40.5996269567252,40.5996233955203,40.5996254373933,40.5996389788408,40.5996653109691,40.5996825855803,40.5996936541082,40.5996995912621,40.5997126105543,40.5997261902824,40.5997376186938,40.5997495040202,40.5997583937209,40.5997662932258,40.5997735898206,40.5997852005868,40.5997975282643,40.5998121362262,40.5998275172727,40.5998373015522,40.5998431326403,40.5998452025335,40.599842907232,40.5998341382939,40.5998256696942,40.5998233519856,40.599825779537,40.5998372851251,40.5998444910452,40.5998509031265,40.5998613514961,40.5998741833708,40.5998906297611,40.599898177327,40.5999063817703,40.5999175500789,40.5999237285175,40.5999282082897,40.5999291177736,40.5999205671633,40.5998998074473,40.5998921600665,40.5998890956272,40.5998897121538,40.5998932364814,40.5998977724597,40.5999038751463,40.599908001254,40.5999140982898,40.5999208784932,40.5999283475451,40.5999360950405,40.599942501402,40.5999674574353,40.5999886707848,40.6000034388945,40.6000165479527,40.600034568531,40.6000519311544,40.6000626769407,40.6000790369875,40.6000906107592,40.6001019835908,40.6001118119421,40.6001241900964,40.6001805524302,40.6002026438654,40.6002151910605,40.6002293902754,40.6002437579857,40.6002773766267,40.6003190402727,40.6003406809759,40.6003928264515,40.6004043069916,40.6004100767232,40.6004171242317,40.6004183452104,40.6004173381387,40.6004115021527,40.600401791076,40.6003880999188,40.6003816037802,40.6003835344115,40.6003917246969,40.6004055691369,40.6004183728677,40.6004342291698,40.6004454750927,40.6004491352179,40.6004462104469,40.6004388700781,40.6004386313874,40.6004428894166,40.6004477496977,40.6004694319679,40.6004855179025,40.6004991047388,40.600509923917,40.6005142660919,40.6005190707791,40.6005220768454,40.6005263134939,40.6005357960547,40.6005444484792,40.6005721265677,40.6006196956186,40.6006370873124,40.6006706631393,40.6006904466931,40.6007044673298,40.6007320475991,40.6007440029159,40.6007553761889,40.6007680108418,40.6007868244239,40.6007963900694,40.6008002998752,40.6007982221689,40.6007917276476,40.6007761602432,40.6007723518171,40.6007733498983,40.6007954640243,40.600807559613,40.6008123507502,40.6008143962765,40.6008171226968,40.6008239920609,40.6008562924545,40.6008678025817,40.600873853969,40.6008735708235,40.6008693885155,40.6008608106708,40.6008605570765,40.6008588979926,40.6008615407576,40.6008745848695,40.6008792172378,40.6008806121349,40.6008874550123,40.6009022025942,40.6009051957779,40.6009088793992,40.6009213530301,40.6009276188832,40.6009317105772,40.6009360191682,40.6009424592947,40.6009445298374,40.6009458879438,40.6009513989484,40.6009554879871,40.6009606519388,40.6009681028392,40.600972667879,40.6009768554629,40.6009836990186,40.6010006981671,40.6010119035621,40.6010147658105,40.6010120042918,40.6010041932712,40.6009915781002,40.600978298297,40.6009467887216,40.6009402302656,40.6009366678039,40.6009351715454,40.6009330123273,40.6009278847535,40.6009220667058,40.6009184953713,40.6009203112144,40.6009195366127,40.6009177167398,40.600913816442,40.6009067622451,40.6009023470841,40.6008999436846,40.6008973940834,40.6009021795999,40.600909132568,40.6009380186543,40.6009519651292,40.6009603924034,40.6009657737034,40.6009725324335,40.6009794094368,40.6009862364957,40.6009927900387,40.6009982197038,40.6009980910488,40.6009952437157,40.6009914688453,40.6009811888183,40.6009791418177,40.6009820062036,40.6009919298043,40.6010023973993,40.6010233985573,40.6010306436524,40.6010352767083,40.6010372714061,40.6010407531008,40.6010476400509,40.6010544785394,40.6010631609721,40.6010675646604,40.6010686472176,40.6010613328313,40.6010428809031,40.6010302721673,40.6010282267999,40.6010352979595,40.6010424962128,40.601055674786,40.6010720655443,40.6010868156967,40.6010980286803,40.6011123250666,40.6011182711678,40.601119597385,40.6011146370015,40.6011050667021,40.6010902343138,40.601084504871,40.6010805345489,40.6010826904354,40.6010865218482,40.6010878388048,40.6010912748522,40.6010961620975,40.6010994542539,40.6011019531497,40.6011056829053,40.6011216446288,40.6011501754598,40.6011825222757,40.6012029084785,40.6012144648065,40.6012283051259,40.6012470381945,40.601260143587,40.601282675591,40.6013068909399,40.6013177478893,40.6013193282368,40.6013110198857,40.6012989474867,40.6012811946104,40.6012723090652,40.601265517807,40.6012611426737,40.6012615133582,40.6012689633931,40.6012815510196,40.6012933915802,40.6013031681825,40.6013104732254,40.6013145412037,40.6013166641199,40.6013161792953,40.6013286316112,40.6013457729869,40.6013601699074,40.6013692461149,40.6013737058126,40.6013923374014,40.6014093467919,40.6014200596726,40.6014285688348,40.6014409200432,40.6014486623325,40.6014562686781,40.6014637409032,40.601468032197,40.6014710428115,40.6014722611597,40.6014712009485,40.6014723901786,40.6014752776424,40.6014962703589,40.6015001485865,40.6015021343287,40.6015024493126,40.6015045522457,40.6015093958298,40.6015205325913,40.6015319389191,40.6015405630003,40.6015494842731,40.6015593099279,40.6015734996015,40.6015833868017,40.6015874866664,40.6015895031562,40.6015931160093,40.6015977412112,40.60160741472,40.6016247729296,40.6016460863542,40.6016655666954,40.6016712321382,40.6016711285922,40.6016664123396,40.6016567297043,40.6016478166016,40.6016450498895,40.6016450639639,40.601645848732,40.6016480582321,40.6016541087583,40.6016643291277,40.6016753423305,40.6016869293862,40.6016981027091,40.6017070033668,40.601708301013,40.6017013860067,40.601700357418,40.6017030022362,40.6017091589255,40.6017181406029,40.6017314829927,40.6017384266384,40.6017487667922,40.601760772815,40.6017746518424,40.6017930066733,40.601804477278,40.6018129033375,40.6018241090858,40.6018704187798,40.6019034664338,40.6019145922976,40.6019186596984,40.6019199831393,40.6019236541412,40.601922535647,40.6019173248088,40.6019083792808,40.6018981410845,40.6018883985441,40.6018701801637,40.6018561343936,40.6018498283034,40.6018477260505,40.6018468900196,40.6018427034138,40.6018350823287,40.6018243835261,40.6018118425576,40.6018000645891,40.6017911444196,40.6017788568333,40.6017700584588,40.6017706214871,40.6017741463992,40.6017786538768,40.6017852489742,40.6018021130333,40.6018101616512,40.601815798401,40.6018166871228,40.601813923624,40.6018063301717,40.6017865298651,40.6017528504635,40.6017360397393,40.6017305471218,40.6017264431821,40.6017226631048,40.6017193521877,40.6017189777665,40.6017204646325,40.6017208232369,40.6017264028935,40.6017310991464,40.6017380723581,40.6017511397644,40.6017585799812,40.6017599562662,40.601758179754,40.6017533560952,40.6017518265652,40.6017550413115,40.6017609742228,40.6017627322858,40.6017611176189,40.6017558771348,40.6017374111982,40.6017275930104,40.6017253500565,40.601726810385,40.6017475615253,40.6017538017207,40.6017572434463,40.6017561551287,40.6017518259953,40.6017291214133,40.6017138771429,40.6017080389963,40.6017087572888,40.6017145019732,40.6017218348659,40.6017280168409,40.6017301912389,40.6017282798578,40.6017257891875,40.6017189630916,40.6017035802517,40.6016837650615,40.6016724161261,40.6016640228419,40.6016537333567,40.6016437421925,40.601635172733,40.6016252248766,40.6016139858012,40.6016068158936,40.6016008846712,40.6015970684983,40.6015890829286,40.6015822540956,40.6015753989131,40.6015632037726,40.6015606888542,40.6015618810812,40.6015651609662,40.6015695413979,40.6015738363718,40.6015791407413,40.6015835911638,40.6015884501949,40.6015936675089,40.6015966643468,40.6016071385335,40.6016083787616,40.6016066571176,40.6016028797454,40.6016008011231,40.6016017123905,40.601602101162,40.6015986236914,40.601592236485,40.6015755597379,40.6015545702657,40.6015193668312,40.6015117123325,40.6015015128357,40.6014850429415,40.6014569162588,40.601433553006,40.6013927984978,40.6013661385764,40.6013480359697,40.6013346997873,40.6013208152776,40.6012887889573,40.6012558026134,40.6012407655963,40.6012252921482,40.6012028570995,40.6011936967414,40.6011884906705,40.6011877559367,40.6011881717444,40.6011868577959,40.6011834585819,40.6011746256289,40.6011641456444,40.601158935881,40.6011575415562,40.601158262546,40.6011601321256,40.601159947599,40.6011555622577,40.6011447274058,40.6011354810121,40.6011207427054,40.6011100649042,40.6011011152462,40.6010942256163,40.6010877527499,40.6010858655007,40.6010864477233,40.6010876361746,40.6010888235133,40.601088277651,40.6010873220578,40.6010793934601,40.6010560159656,40.6010305211062,40.6010176769486,40.6010077132288,40.6009991490938,40.6009923419546,40.6009836703534,40.6009770885414,40.600971907786,40.6009631366629,40.6009551325497,40.6009464117823,40.60092348005,40.6008911051327,40.6008823504981,40.6008707381225,40.6008662630781,40.6008639792585,40.6008639168153,40.6008655290648,40.600867222176,40.6008660352834,40.6008617241742,40.6008551624373,40.6008389659852,40.600823323809,40.6008152034036,40.6008077441708,40.6008021258817,40.6007964817446,40.6007894905185,40.6007755830978,40.6007608184594,40.6007222287917,40.6007040860181,40.6006975549493,40.6006910545722,40.600687081809,40.6006843451245,40.600680068288,40.6006720043868,40.6006550489302,40.6006464037169,40.6006324335882,40.6006078914339,40.600597790796,40.600592440209,40.6005821527401,40.6005769719677,40.6005747609888,40.6005770002572,40.6005794829576,40.6005825357521,40.6005873721064,40.6005894616999,40.6005889735962,40.6005840121808,40.6005763058718,40.6005644285426,40.6005360080785,40.6005256381731,40.6005158971959,40.6005007717862,40.6004691665656,40.6004409417214,40.6004247421132,40.6004138708165,40.6004056927181,40.6003951831182,40.6003834152566,40.6003682433236,40.6003564992492,40.6003477196488,40.6003405623758,40.6003368640503,40.6003289264404,40.6003194963154,40.6003125313342,40.6003022449699,40.6002904475922,40.6002729387402,40.60023264771,40.6002218603923,40.6002102786498,40.6001982056389,40.6001864647853,40.6001762862361,40.6001561201483,40.6001345265675,40.6000902679652,40.6000340699141,40.5999881932765,40.5999757896071,40.5999669291945,40.5999606196254,40.5999546424126,40.5999482514247,40.5999373599081,40.5999287465293,40.599908818611,40.599900420447,40.5998925447531,40.5998842905438,40.5998760910415,40.5998724415094,40.5998584475785,40.5998270691614,40.5998189450786,40.5998106050305,40.599803201149,40.5997946749048,40.5997894126408,40.5997823652344,40.5997696606461,40.5997431249441,40.599730145228,40.5997222738195,40.5997155860556,40.5997123595224,40.599709106439,40.5997014312285,40.5996946287776,40.5996812387204,40.5996661528087,40.599657928548,40.5996499342073,40.5996489620738,40.5996465603193,40.5996463298272,40.5996480219977,40.5996508719205,40.5996551776721,40.5996572960462,40.5996627689808,40.5996670266743,40.5996756210933,40.5996825615424,40.5996871383516,40.5996902367826,40.5996958607826,40.5997013503523,40.5997101383695,40.5997158535881,40.5997248660577,40.5997378088798,40.5997443778541,40.5997444427383,40.5997369563694,40.5997255986892,40.5997093301919,40.5997031607714,40.5997000945222,40.5997012335792,40.5997082170372,40.5997136624721,40.5997145949631,40.5997191723106,40.5997236027324,40.5997293994599,40.599738570279,40.5997481775155,40.5997631922612,40.5997726380849,40.5997800543849,40.5997886304441,40.5997934168665,40.5997934013555,40.599786766871,40.5997854010344,40.5997890329417,40.5997942033664,40.5997955846586,40.5997887078824,40.5997862185058,40.5997906500693,40.5997981519376,40.599804941923,40.5998114929657,40.5998187038058,40.5998214824233,40.5998270088596,40.5998353907644,40.5998464389001,40.5998637051081,40.5998881156193,40.5999033408757,40.5999246057903,40.599947732624,40.5999787137975,40.6000005718665,40.6000278734749,40.6000409493982,40.6000483167527,40.6000499415165,40.6000533624919,40.6000653422936,40.6000768995739,40.6000962615995,40.6001458694783,40.6001836127829,40.6002127126208,40.6002449046247,40.6002872736616,40.6003174810273,40.6003383974964,40.6004067230537,40.6004068108957,40.6004162100988,40.6004469709101,40.6004555170544,40.6004577117942,40.6004597907124,40.6004632103606,40.6004661190609,40.6004666300619,40.6004700511549,40.60047454816,40.6004760398341,40.6004761218141,40.6004888866414,40.6004924349608,40.6004948767555,40.6005318023157,40.6005402257355,40.6005522018652,40.6005703374215,40.6005864154068,40.6005906936425,40.6005912803017,40.6005941207111,40.6006086825675,40.6006123897923,40.6006146714599,40.6006180942052,40.6006205131925,40.600621514102,40.6006292100357,40.6006386125388,40.6006770718422,40.6006819662208,40.6006924565433,40.6007071678999,40.6007215226198,40.6007531534075,40.6007839320536,40.6008497703463,40.6008572852854,40.6008822586131,40.6009096106717,40.6009728608027,40.6009829943063,40.6009993580585,40.6010186539223,40.6010403902006,40.6010631071861,40.6010643275538,40.6010724829759,40.601095109395,40.6011011620817,40.601119055274,40.6011606557521,40.6011678123799,40.6011967188912,40.6012063034432,40.6012064540628,40.6012208422877,40.6012317290908,40.6012345266474,40.6012464961024,40.6012533091554,40.6012618834828,40.6013123152887,40.6013651094842,40.601366170415,40.6013672877392,40.6013832636828,40.6013995015584,40.6014191542694,40.6014652911127,40.6014796786818,40.6015071595535,40.6015353590154,40.601544760001,40.6015524532338,40.6015686969578,40.6015815248342,40.6016097523336,40.6016200811147,40.6016259995658,40.6016346399917,40.6016901212626,40.601768774726,40.6017969854144,40.6018662272414,40.6018876912913,40.6018987156651,40.6019029913664,40.6019064123656,40.6019132571076,40.6019286724425,40.6019355188026,40.6019397965999,40.6019433687039,40.6019449272558,40.6019500560061,40.6019560394904,40.6019682582547,40.6019748427997,40.6019781897541,40.6019868074645,40.6019921347264,40.6019979161928,40.6020013311695,40.6020038961715,40.6020090214184,40.6020107515104,40.6020124393761,40.6020148955185,40.6020158542581,40.6020206389042,40.6020312279729,40.6020346447278,40.6020363525189,40.6020375602358,40.6020380614827,40.60203849422,40.6020414789678,40.6020430993068,40.6020448964235,40.6020471297401,40.6020474610489,40.6020480060207,40.6020508799047,40.602055155122,40.6020662727514,40.6020696891477,40.6020731118619,40.602085078118,40.6021004597615,40.6021184043953,40.6021220786098,40.6021747955738,40.6021910326124,40.6022055602126,40.6022115443852,40.6022159132626,40.6022183823146,40.6022235136527,40.6022259582721,40.6022277928273,40.6022346424043,40.6022352930391,40.6022372145104,40.6022380759471,40.6022398644328,40.6022476274045,40.6022471974602,40.6022467768456,40.6022459286574,40.6022417685597,40.6022417548518,40.6022416682979,40.6022407024609,40.6022348458887,40.6022218793302,40.6022169337684,40.6022149463296,40.602210113434,40.6022092626771,40.6022092640704,40.6022092654554,40.6022092682333,40.6022092692045,40.6022092710114,40.6022102227822,40.6022109827531,40.6022113987369,40.6022118383968,40.6022126207242,40.6022144030043,40.6022156693913,40.6022161128785,40.6022172609503,40.6022220951271,40.6022280783798,40.6022329710424,40.6022417502826,40.6022457592054,40.6022562748354,40.6022955684197,40.602297293231,40.6023280416904,40.6024087591307,40.6024134767774,40.6024373989625,40.6024383798278,40.6024587604873,40.6024732871162,40.6024840062158,40.6024878151299,40.6025006360672,40.602504361798,40.6025126045159,40.6025216784189,40.6025245729861,40.6025339812947,40.6025350557228,40.602541680828,40.6025476725653,40.6025551370155,40.602559662067,40.6025656624862,40.6025662374116,40.6025665282774,40.6025665600545,40.6025680830871,40.602569132246,40.6025708448691,40.6025710567177,40.6025725572845,40.6026127619256,40.6026538212017,40.6026683603814,40.6026828981592,40.6027092335044,40.6027278284961,40.6027335273481,40.6027469407672,40.6027753946895,40.6027757758457,40.6027976084748,40.6028311320614,40.6028623283396,40.6029039724707,40.6029076412744,40.6029446787859,40.6029686492961,40.6030125921077,40.6030571373985,40.6030874323242,40.6031106786694,40.6031378416285,40.6031498187679,40.6031896399795,40.6032165379177,40.6032225927541,40.6032457425526,40.6032849583449,40.6033090659134,40.6033143443695,40.6033149627515,40.6033241228721,40.6033490950828,40.6033737108185,40.6033906964865,40.6034086679167,40.6034238113633,40.6034377109836,40.6034465135939,40.6034546012224,40.6034617026087,40.6034770079949,40.603516124749,40.6035558313678,40.6036295214104,40.6036566699454,40.6036752112739,40.6036854184688,40.6036974669151,40.6037105345488,40.6037212402713,40.6037329658285,40.6037441729481,40.6037596830805,40.6037688232264,40.603782856672,40.6038065118657,40.603814238574,40.603817324654,40.6038199702679,40.6038268930818,40.6038386347894,40.603841802961,40.6038462166632,40.6038544317569,40.60387932547,40.6038956295654,40.603912077521,40.6039252076789,40.6039402597374,40.6039650346252,40.6039790675243,40.6039935748049,40.6039988050964,40.6040015301803,40.6040036203969,40.6039992360165,40.6039903010696,40.6039700309678,40.6039380978616,40.603926644062,40.6038985433799,40.6038718323139,40.6038534680991,40.6038481879253,40.6038410666896,40.6038321930296,40.6038111611038,40.6037860167078,40.603765371382,40.6037491442906,40.6037423259888,40.6037432460957,40.6037512762487,40.6037653872001,40.6037979590057,40.6038095223338,40.6038346195127,40.6038652810657,40.6038990721638,40.6039361558444,40.6039841424064,40.6040045983706,40.6040197041394,40.6040295948388,40.6040284578283,40.6040177131843,40.6039935441406,40.6039613885763,40.6039163867162,40.6038872723437,40.6038660643043,40.6038303743403,40.6038036017443,40.6037811128704,40.6037733290604,40.6037697077481,40.6037475853973,40.603735864629,40.6037311668318,40.6037268258187,40.6037328154237,40.6037349852644,40.6037448391522,40.6037582262836,40.6037785624175,40.603801038156,40.6038225733086,40.6038399061103,40.6038658612052,40.6038801174115,40.6038874782107,40.6039115318426,40.6039249609857,40.6039356805074,40.6039357094396,40.603935804164,40.603910001972,40.6038926914138,40.6038886211246,40.6038860333143,40.6038824752405,40.6038756554767,40.6038504064348,40.6038226218237,40.6037966977636,40.603778994501,40.6037518023198,40.6037273073619,40.6036850828313,40.603631535787,40.6035858755184,40.6035637936543,40.6035245353718,40.6034906838387,40.6034691276579,40.6034379846266,40.6033915144508,40.6033309958633,40.6032863867558,40.6032509706405,40.6032136952442,40.6031854796229,40.6031680238308,40.6031521040622,40.6031315586235,40.6031216376155,40.6030968573047,40.6030519624194,40.6030147256645,40.6029502966487,40.602900993732,40.602851434261,40.6027534878948,40.6027097392488,40.602688516647,40.6026729716293,40.6026534861968,40.6026450570911,40.6026460136316,40.6026467942368,40.6026491232894,40.6026442131004,40.6026363359203,40.6026131983678,40.6025963842178,40.6025789775098,40.6025356860025,40.6024827801916,40.6024342704514,40.6023798006137,40.602317577734,40.6022406566387,40.6021770314179,40.6021394140455,40.6021077291306,40.6020592311628,40.6020139954089,40.6020001742908,40.6019895873952,40.6019323247903,40.6018861061658,40.6018353550094,40.6017749918008,40.6017222582641,40.6016720999592,40.6016439854248,40.6016211428719,40.6016228802276,40.6016296999425,40.6016366538686,40.6016256764222,40.6015927618614,40.6015575980296,40.6015574271788,40.60152794699,40.6015151281084,40.6015040076374,40.6015033681661,40.6014980330026,40.6014966882348,40.6014920469587,40.6014723756132,40.601467388866,40.6014621158633,40.601437087003,40.6014253536095,40.6013537660492,40.6013031053827,40.6012885735818,40.6012546048265,40.601223892646,40.6012006501541,40.6011818421898,40.6011716746409,40.6011677349101,40.6011690421049,40.6011740029023,40.6011897488697,40.6012132603374,40.6012556071961,40.601261996323,40.6012631136864,40.6012645506747,40.6012645459394,40.6012645438628,40.6012628024379,40.6012593545457,40.6012580296489,40.6012361712061,40.6012302787078,40.6012267162848,40.6012224271602,40.6012214147946,40.6012172882166,40.6012160517299,40.6012147195212,40.6012130333226,40.6012095882985,40.6012066473061,40.6012044575788,40.6011976180777,40.6011926090138,40.6011822343298,40.6011563542926,40.6011412114355,40.6011194315928,40.6010907864958,40.6010592418489,40.601026585495,40.6010075290255,40.6009910488545,40.6009862610738,40.600969151122,40.6009404322857,40.6009032347207,40.6008560887525,40.6008318619908,40.6007786115439,40.6007597635228,40.6007599376187,40.6007683598057,40.6008012370123,40.600793445223,40.6007532431804,40.6007208329035,40.6007106268989,40.6006994377244,40.6006835577624,40.6006671244663,40.6006470088538,40.6006211227882,40.600590706347,40.6005539376168,40.6005311908051,40.6005056112292,40.6004881090186,40.6004799355925,40.6004797157016,40.6004855636824,40.6004949301833,40.6004942539559,40.6004859470522,40.600480605833,40.6004595558364,40.6004635435691,40.6004667095481,40.6004565417443,40.6004185439492,40.6003965207556,40.6003880913329,40.6003855918288,40.6003993554764,40.6004139295788,40.6004290575362,40.6004357045822,40.6004494296367,40.6004983960182,40.6005654584465,40.6005790970979,40.6005834578646,40.6005856144529,40.6005872257603,40.6005972448696,40.6006046079833,40.6006077659746,40.6006083252875,40.6006181119881,40.6006145058184,40.6006116159763,40.6006013699842,40.6005987799748,40.6005939522305,40.6005930651675,40.6005860381454,40.6005757787549,40.6005540973881,40.6005306358932,40.6005168211547,40.600496725703,40.6004786657674,40.6004575878557,40.6004393752831,40.600431916263,40.600419983943,40.6004082661572,40.6003980272542,40.6003841059145,40.600369820931,40.6003500953045,40.6003369471801,40.6003338024389,40.6003372428444,40.6003492226517,40.6003656228015,40.6003753718888,40.6003777702423,40.6003742427453,40.6003631365567,40.6003519171506,40.6003377264721,40.6003286488688,40.6003187049031,40.600316058482,40.6003001818347,40.6002819803337,40.6002635636848,40.6002445160346,40.6002304071447,40.6002194223051,40.6002118096419,40.6002028461885,40.6001862580871,40.6001675867824,40.6001457503115,40.6001423376399,40.6001454545024,40.6001517030473,40.6001580320295,40.6001605648088,40.6001556059932,40.6001436803426,40.6001367267932,40.6001246999184,40.6001211515266,40.6001224624506,40.6001066591552,40.6000873697494,40.6000565708634,40.6000154989947,40.5999881052125,40.5999584422659,40.5999346041223,40.5999243110673,40.5999166234502,40.5999149187606,40.5999184785494,40.5999167929559,40.5999125685207,40.5999100804342,40.5998981875708,40.5998901450855,40.5998801109644,40.599879139931,40.5998674019522,40.599860414546,40.5998498529151,40.5998454054243,40.5998414210352,40.5998353135504,40.5998317791404,40.5998292463977,40.5998174410217,40.59977036229,40.5997581279195,40.5997290474948,40.5996891450434,40.5996632778091,40.5996338148892,40.5996029492151,40.5995920179058,40.5995778469716,40.5995714977061,40.5995628381845,40.5995534453467,40.5995427551041,40.599531647939,40.599518378403,40.5995016210794,40.5994915486274,40.5994797312117,40.5994644594051,40.5994376517435,40.5994241791801,40.5994147795395,40.5993972689172,40.5993734044983,40.5993723018701,40.5993620150089,40.5993510836541,40.5993388109845,40.5993271101815,40.5993163472573,40.5993002288392,40.5992867974136,40.5992655662147,40.5992438639434,40.5992160205051,40.5992103779822,40.599199076176,40.5991802166444,40.5991695517765,40.5991670406618,40.5991536711568,40.5991414221522,40.5991271368317,40.599117462186,40.5991129537503,40.5991133828696,40.599115184213,40.5991091903904,40.5991004559699,40.5990909284101,40.5990781359744,40.5990648936125,40.5990414843735,40.5990085482299,40.5989905815063,40.5989656548789,40.598953533681,40.5989531704571,40.5989471841809,40.5989038846141,40.5988984513516,40.5988950312046,40.5988907580512,40.5988896666241,40.5988872772505,40.5988822111894,40.5988446158825,40.5988360704634,40.5988293377641,40.5988292323334,40.5988265268217,40.5987967519507,40.598779768731,40.5987668309057,40.5987583032867,40.5987557147798,40.5987317674794,40.5987296690046,40.5987189430483,40.5986539768159,40.5986294244369,40.598609523009,40.5985847283777,40.5985781550724,40.5985642040507,40.5985428196688,40.598513734824,40.5984904554041,40.5984692554135,40.5984512918081,40.5984472017856,40.5984470232154,40.5984299243005,40.5984150647012,40.5983598132723,40.5983318638595,40.5983221961479,40.5982845816943,40.5982486801297,40.5981897027145,40.5981649166573,40.5981512546959,40.5981401320591,40.59809056482,40.5980591468402,40.5980563814727,40.5980506237085,40.5980358723079,40.5979846040801,40.597969971067,40.5979615316509,40.5979613311881,40.5979435856745,40.5979393161577,40.5979264930268,40.5979160520989,40.5979119616644,40.597908894428,40.5978991392648,40.5978920724663,40.5978794738058,40.5978281690962,40.5977700304484,40.597736604517,40.5977255751015,40.5977154570683,40.5976879606753,40.597592222401,40.597499894193,40.5974776682865,40.5974571531231,40.5974222686836,40.597415271443,40.5974049961766,40.5973451871832,40.597254592393,40.5972545566851,40.5972392042035,40.5972238147148,40.5972092765572,40.5971878930004,40.5971819059779,40.5971759155535,40.5971536585718,40.5971476693799,40.5971408276109,40.5971359915325,40.5971228704188,40.5971032064144,40.5970942569807,40.5970809811243,40.5970697299763,40.5970561955399,40.5970160303388,40.5969647571343,40.5969416867818,40.5969100337908,40.5968844434145,40.5968699171031,40.5968570990093,40.5968519709742,40.5968503217905,40.5968468415218,40.5968382919327,40.596838246801,40.5968305924892,40.5968154924502,40.5968109169838,40.5968040759234,40.5967972351843,40.5967890928274,40.5967775731072,40.5967254310715,40.5966997856293,40.5966142809375,40.5965739744822,40.5965227974847,40.5965064018474,40.5964791933248,40.5964662172338,40.5964475638164,40.5964338876862,40.5964176490281,40.5963620990274,40.5962971526375,40.5962757862369,40.5962723071478,40.5962612557738,40.5962467218778,40.5962338959377,40.5962195813875,40.5962039635892,40.5961952956714,40.5961868630436,40.5961672003862,40.5961564719913,40.5961458321124,40.5961386945249,40.5961236108613,40.5961037527764,40.5960996830742,40.5960863369002,40.5960731928455,40.5960432885405,40.5960142402301,40.5959450388513,40.5959418057373,40.5959117185398,40.5959017427236,40.5958835212644,40.59587035122,40.595857885254,40.5957416560688,40.5957407377362,40.5956631619087,40.5956499549249,40.5956370234364,40.5956244054826,40.5956121298952,40.5956002315354,40.5955887422535,40.5955723479854,40.5955554180736,40.5955379860428,40.5955320539925,40.5955258156946,40.595519324783,40.5955126357223,40.5955058061587,40.595495376536,40.5954849769665,40.5954746781534,40.5954696381365,40.5954648326643,40.5954603237486,40.5954561700576,40.5954524265796,40.5954491422793,40.595446357746,40.5954436953934,40.5954404492937,40.5954366506598,40.5954323368971,40.5954275531136,40.5954223470963,40.5954167671291,40.5953969872237,40.5953775099659,40.5953583474251,40.5953395083202,40.595324390129,40.595308844176,40.5952928858858,40.5952765350371,40.5952598058843,40.595242717033,40.5952103432299,40.5951803199842,40.5951753859559,40.595163615851,40.5951599967349,40.5951567191789,40.5951518215946,40.5951476429855,40.5951425462256,40.5951400268905,40.5951382219739,40.5951356843631,40.5951337544266,40.595131420604,40.5951293379112,40.5951272483005,40.5951255392795,40.5951245217669,40.5951245600527,40.5951254712109,40.5951258368799,40.5951261857132,40.5951264788753,40.5951265132308,40.5951270233577,40.5951269499519,40.5951262940931,40.5951250702607,40.595123300303,40.5951210223161,40.5951160337983,40.5951106999584,40.5951050707463,40.5950992004675,40.5950931501206,40.5950527340518,40.5950467206729,40.5950410322087,40.5950357455919,40.5950309262012,40.5950284846608,40.5950265562191,40.5950251633755,40.5950243226016,40.5950240440016,40.5950243308137,40.5950251787343,40.595026578439,40.5950285152341,40.5950309648795,40.5950336466225,40.5950358608553,40.5950375726179,40.595038758346,40.5950393983296,40.5950394815742,40.5950390081399,40.5950372560092,40.5950349716364,40.5950321708098,40.5950288790383,40.5950251229963,40.5950176431877,40.5950098287804,40.5950017856851,40.5949974677537,40.5949935743184,40.5949901394262,40.5949871972954,40.5949847752778,40.5949828965371,40.5949815793819,40.594971261847,40.594961448462,40.5949521497955,40.5949433735665,40.5949351283355,40.5949274226594,40.59492026292,40.5949136551629,40.5949076072788,40.5949021246418,40.5948936290861,40.5948857947609,40.5948786273744,40.5948721272754,40.5948663001723,40.5948611464131,40.5948566710386,40.594855499863,40.5948549066097,40.5948548924867,40.5948554585313,40.5948566027689,40.5948583197035,40.5948606026669,40.5948634429826,40.5948669932607,40.5948699149695,40.594872195745,40.5948738309287,40.5948748138534,40.5948751423758,40.5948748143508,40.5948745087331,40.5948735657081,40.5948719888387,40.5948697867099,40.5948669737739,40.5948635671606,40.5948595843337,40.5948467665927,40.5948406755405,40.5948333229966,40.5948192647892,40.5948077223252,40.5947968322698,40.5947866028455,40.5947770417778,40.5947681574576,40.5947599545924,40.5947566780003,40.5947539651983,40.5947518192219,40.5947502436105,40.594749242743,40.5947488176426,40.5947486888229,40.5947480117082,40.5947467900227,40.5947450300042,40.5947427419102,40.5947399418611,40.5947355056488,40.5947304956076,40.5947249340559,40.5947188469931,40.5947122662842,40.5947059345861,40.5946992349074,40.5946922019493,40.5946848685667,40.5946772728077,40.5946694518809,40.5946558895914,40.5946426490219,40.5946297635272,40.5946172672993,40.5946051893388,40.5945926118377,40.59458039959,40.5945685737193,40.5945571543442,40.5945461594053,40.5945399971027,40.5945344005778,40.5945293856065,40.5945249671289,40.5945211610929,40.5945161595628,40.5945106812047,40.5945047491628,40.5944983860807,40.5944916154356,40.5944844630484,40.5944769575891,40.5944691282248,40.5944591616151,40.5944495355304,40.5944402690838,40.5944313822262,40.5944228897158,40.5944148103304,40.5944071586652,40.5943999503146,40.5943931990351,40.5943869189199,40.5943839329769,40.5943815912309,40.5943798766832,40.5943798287958,40.5943664572466,40.5943602356028,40.5943108946463,40.594301492853,40.594274999896,40.5942749668711,40.594271249434,40.5942673056708,40.5942669748361,40.5942606620861,40.5942604658969,40.5942592842114,40.594250203776,40.5942296739352,40.5942249946833,40.5942194130904,40.5941518596871,40.5940928614479,40.5940451644122,40.5940210353072,40.5940199312822,40.5940184723817,40.5940159071105,40.5940133435144,40.594011253479,40.5940107794159,40.5940030899823,40.5939940764759,40.5939791688014,40.5939766671101,40.5939757504712,40.5939723321418,40.5939708858133,40.5939697680425,40.5939696741403,40.59396720366,40.593935566983,40.5939039305057,40.5938415076692,40.5938312451687,40.5938243513779,40.5938081475675,40.5938037981891,40.5938013052556,40.5937973633426,40.5937936099067,40.5937779460831,40.5937653986568,40.5937346242013,40.5937012856277,40.5936628214144,40.5936158088357,40.5935987191662,40.5935833301142,40.5935566393151,40.5935414533518,40.5935241211597,40.5934927432322,40.5934829596999,40.5934713797911,40.5934205078575,40.5934124214726,40.5933902024994,40.5933696914071,40.5933651871315,40.5933500314949,40.5933320785787,40.5933192525882,40.5933144694586,40.5933064269736,40.5932824792683,40.5932701132294,40.5932593790435,40.5932319957579,40.5932267631968,40.5932208688644,40.5932073694298,40.5931994600224,40.5931906872766,40.5931857673859,40.5931803090784,40.5931703673659,40.5931558250504,40.5931556893353,40.5931553501492,40.5931412859962,40.593128572447,40.5931258939241,40.5931202597129,40.5931070833683,40.5931036350461,40.5930865658104,40.5930660478721,40.5930455315269,40.5930337092042,40.5930258723057,40.5929703174951,40.5929699763226,40.5929626264992,40.5929549322292,40.592939559329,40.5929258540609,40.5929181589864,40.5929104655097,40.5929023287752,40.592891660793,40.5928711481129,40.5928458695807,40.5928258514208,40.5927882298429,40.592778852103,40.5926609259451,40.5926475384439,40.5926284516316,40.5926118538535,40.5925993947077,40.5925139293283,40.5924552043175,40.5924549565577,40.5924547176769,40.5924028196929,40.5923566628967,40.5923490456808,40.592348968214,40.5923412730948,40.5923162715217,40.5923147667089,40.592303648929,40.5922908259656,40.5922876983651,40.5922839890953,40.5922771538343,40.5921814581377,40.5921493110401,40.592128485481,40.5921221648217,40.5921045609569,40.5920997118382,40.5920960164253,40.5920874697788,40.592086614239,40.5920863045282,40.5920738479127,40.5920672736556,40.5920611459346,40.5920521937246,40.5920414211951,40.5920371482444,40.592011975701,40.5919904830959,40.5919791180313,40.591972166379,40.5919663864311,40.5919457526258,40.5919288281763,40.5919172477605,40.5919152715898,40.5918993059704,40.5918883195247,40.5918480356827,40.5918366043636,40.5918060651039,40.5917763519265,40.591761242548,40.5917494006022,40.5917436870716,40.5917372091619,40.5917316394341,40.591723051238,40.5917109882645,40.591696894917,40.5916819776291,40.5916771211217,40.5916722626891,40.5916665465659,40.5916663893777,40.5916613080171,40.5916547971035,40.5916271820244,40.591597087872,40.5915722615897,40.5915507041925,40.5915381030293,40.591523468673,40.591511248579,40.591491689935,40.5914761667313,40.5914643259371,40.5914533114899,40.5914431205836,40.5914357540487,40.5914352775706,40.5914332245311,40.5914323538422,40.5914172424927,40.5913809293733,40.591358993143,40.5913430558099,40.5913153739451,40.5912959100498,40.5912553432307,40.5912375330726,40.5912213112338,40.5912022001353,40.5911850878112,40.5911679810309,40.5911441060351,40.5911173768751,40.5911007427239,40.5910925874377,40.5910864876435,40.5910754399219,40.5910797914342,40.5910878832917,40.5910979469495,40.5911063606778,40.591105882493,40.5910989280669,40.5910883266656,40.5910777241177,40.5910630576215,40.5910512148433,40.5910405468551,40.5910359434886,40.5910361226006,40.5910366099212,40.5910368965944,40.5910315278304,40.5910221335214,40.5910092210309,40.5910028242183,40.5909941259197,40.5909848495112,40.5909750624252,40.5909621337183,40.590947758903,40.5909355488151,40.5909277096425,40.5909186533689,40.5909027899798,40.5908839967557,40.5908637631157,40.5908557148253,40.5908396172372,40.5908215483096,40.5908129580448,40.5908092236147,40.590805964236,40.5908015352685,40.5907939374282,40.5907853867916,40.5907766227228,40.5907571272491,40.590745901708,40.5907282908896,40.5907216535199,40.5907220557518,40.5907215187541,40.5907138900726,40.5907074082182,40.5907021308537,40.5906940652888,40.5906860293679,40.5906801927957,40.5906733649268,40.5906689555094,40.5906591962898,40.5906433708469,40.590634349656,40.59062359964,40.5906088844182,40.5905968529565,40.5905938845722,40.5905941103634,40.5905923684549,40.5905887228902,40.5905869940237,40.5905772666308,40.5905646016821,40.5905604369733,40.590560173811,40.590557221672,40.5905459843551,40.5905354936187,40.5905240350374,40.5905198657963,40.5905225138724,40.590520280819,40.5905144090456,40.590499034993,40.5904834162112,40.590474367672,40.5904719016177,40.5904755051165,40.5904742293195,40.5904658965024,40.5904377818224,40.5904257978659,40.5904186859858,40.5904181639782,40.5904215457093,40.5904278532672,40.5904275922632,40.5904204921175,40.5904031449272,40.5903711875255,40.5903516795591,40.5903441084123,40.590330172631,40.5903162524595,40.5903065004036,40.5902916399285,40.5902811654362,40.5902745784037,40.5902655252731,40.5902562245531,40.5902447491459,40.5902293834214,40.5902196392543,40.5902135658598,40.5902067822907,40.5902024434959,40.5901939605887,40.5901919675,40.5901820467723,40.5901642772542,40.5901450307948,40.5901169799594,40.5900706123607,40.5900371645201,40.5899951580045,40.5899570441201,40.5899487308501,40.5899469681579,40.5899491125797,40.5899570592537,40.5899596791691,40.5899581611887,40.5899517907881,40.5899442291755,40.5899310954174,40.5899155590765,40.5899092515617,40.5898971053013,40.5898844583121,40.5898795895892,40.5898527877224,40.5897770183808,40.5897244223184,40.5896969254328,40.5896679904262,40.5896556150734,40.5896483488041,40.5896425206572,40.5896342467143,40.5896281457608,40.5896084002356,40.589578947016,40.5895507277034,40.5895312707906,40.5895074261998,40.5894789446753,40.5894557939313,40.5894385145446,40.5894253965895,40.5894186006144,40.5894193551487,40.5894225521145,40.5894225722855,40.5894172292305,40.5894043245665,40.5893887337471,40.5893716873243,40.5893512462761,40.5893356835272,40.5893271557797,40.5893266538782,40.5893317437971,40.5893460704477,40.5893630854322,40.5893752266517,40.5893824777849,40.5893848680935,40.589378968649,40.5893599394787,40.5892944392465,40.5892790847448,40.5892598135333,40.5892480786965,40.5892380211544,40.5892377134985,40.5892403451456,40.5892468608678,40.589279620358,40.5893014826739,40.5893260474797,40.5893350360962,40.5893377047495,40.5893359700782,40.5893264504279,40.5893064685498,40.5892770001732,40.5892621430324,40.589241928202,40.589224387757,40.5891968836362,40.5891360573744,40.5890808380748,40.5890283172286,40.5890049813031,40.5889845729084,40.5889583493322,40.5889398725407,40.5889255173187,40.5889172517882,40.5888868898076,40.5888359229604,40.5888082711758,40.5887906017263,40.5887680477316,40.5887529936235,40.588742326007,40.5887290166265,40.5886709376624,40.5886264033189,40.5885658574743,40.5885217855324,40.5884430913768,40.5883839923569,40.588307980062,40.5882566680944,40.5881959247377,40.5881327784743,40.5880613535331,40.5880289052097,40.5879456095403,40.587921775263,40.5879163886048,40.587911003117,40.5878930377332,40.5878802270192,40.5878638538799,40.5878538406073,40.5878503121577,40.5878387375263,40.5878250992044,40.5878154377661,40.5878106998195,40.587812736676,40.5878151836648,40.5878220510016,40.5878261213933,40.5878246577625,40.5878195394583,40.5878132135411,40.5877980810419,40.5877630808364,40.5877420349171,40.5877285547977,40.5877090994499,40.5876916177683,40.5876685992667,40.5876475852603,40.5876232066275,40.5876122059421,40.5875787941615,40.5875463378266,40.5874778795177,40.5874046260482,40.5873267989609,40.5872446336301,40.5871583785491,40.5870682945792,40.5869746541602,40.5868777404866,40.5867778466506,40.5866752747561,40.5865703350048,40.5866068549255,40.5879872778977,40.5890956514713,40.5903082078847,40.5912119158327,40.5914953697973,40.5918723492592,40.5921842516915,40.5931487882873,40.5941043148464,40.5950607791786,40.5960204511543,40.5968202649194,40.5971073036215,40.5973232949648,40.5977779281458,40.5994373827175,40.6010620694992,40.6026872808249,40.602230711367,40.6038731622438,40.605497900603,40.6059738630588,40.6061952096804,40.6065878610635,40.6070004560576,40.6069219435036,40.6074332974761,40.6075994773071,40.609229317663,40.6108564298636,40.6119194575028,40.6119928417343,40.6127225384378,40.6134117379848,40.6140808069615,40.614803772404,40.6158885305079,40.6160462091094,40.6162051569828,40.6172126872092,40.6196056119517,40.6219948159592,40.6243855672862,40.6267736686311,40.6291665672098,40.6292766427586,40.6293778123557,40.6294800515109,40.629508285208,40.6298665632107,40.6301271666631,40.6307327133548,40.6307914829014,40.6308947957303,40.6309941556314,40.631101784416,40.6312087906018,40.6313095874154,40.6313686382038,40.6313929601883,40.6314124732462,40.6315126060848,40.6315816487626,40.6315983109317,40.6316284442441,40.6317691192041,40.6318283466246,40.6319232137334,40.6320904666279,40.6322678569992,40.632509250074,40.632810290765,40.6329589540274,40.6334140627752,40.6338855739312,40.6343675942147,40.6349633387563,40.635325877722,40.6355951033264,40.636341774394,40.6367574447959,40.6373514434135,40.6378121710962,40.6381629464124,40.6384225741831,40.6386947792532,40.6389791287543,40.6392751549271,40.6395086650372,40.639582363369,40.6399002155921,40.6413446923951,40.6423662985682,40.642778147843,40.6436754767375,40.644327494557,40.645774695238,40.6462178282136,40.6466387171483,40.6471962866268,40.6477058443952,40.6478078679181,40.6481547584833,40.6486387495646,40.6487290613685,40.6490778277107,40.6495572103232,40.6501310385613,40.6501760427395,40.6505864186227,40.6511859257308,40.652048896178,40.6551715977333,40.6553646491783,40.65557059861,40.6557884673294,40.6560171284051,40.6562553167027,40.6565016437778,40.6567546437481,40.6570127948912,40.6571359524246,40.6572040535054,40.6572745209475,40.6573568607414,40.6574219175225,40.6575318475627,40.6577637018589,40.6579994798497,40.6582379457657,40.6584778011579,40.6587177706758,40.6589565756107,40.6590673908684,40.6591114041932,40.6575259418736,40.6574538129022,40.6574066618045,40.6573948832092,40.6573716575709,40.6573127030726,40.657240805857,40.6567123638255,40.6558281670742,40.6540430147487,40.6538012239551,40.6536248534122]}]],[[{"lng":[-73.9123679028881,-73.9123748607236,-73.9123923232893,-73.9124193285944,-73.9124847379624,-73.9125088520565,-73.9125205153034,-73.9125787364287,-73.9126084771918,-73.9126172003247,-73.9126175882372,-73.9126180809409,-73.9126317024624,-73.9126398258417,-73.912634196808,-73.9126167474667,-73.912602092437,-73.9125942554243,-73.9125846685284,-73.9125855857068,-73.912593183151,-73.9126126660453,-73.912638307341,-73.9126358139795,-73.912616669057,-73.9125899036262,-73.9125388956094,-73.9125210309124,-73.912504238309,-73.9125046003574,-73.9125132712553,-73.9125346754147,-73.9125681371219,-73.912606643217,-73.9126500531051,-73.9126727844487,-73.9126901490435,-73.9126990254692,-73.912706059561,-73.9127028058082,-73.9127107973976,-73.912704858546,-73.9126928262587,-73.9126791029834,-73.9126622812161,-73.912651111551,-73.9126306765385,-73.9126268602529,-73.9126109098732,-73.9125955974678,-73.9125826382142,-73.91256416724,-73.9125432334965,-73.912525844042,-73.9124835531972,-73.912451813437,-73.9124242085303,-73.9124086401795,-73.9124007270714,-73.912406606087,-73.9124210306946,-73.9124387884734,-73.9124602203607,-73.9124951143902,-73.9125707297115,-73.9126052251263,-73.9126212430634,-73.9126495750032,-73.912677482873,-73.9127040405266,-73.9127502584439,-73.9128168158525,-73.9128617308353,-73.9129671564777,-73.9130466095046,-73.9130627469508,-73.913083424819,-73.9131006349205,-73.9131076452217,-73.9131080307202,-73.9130936606921,-73.9130311612599,-73.9130131486545,-73.9130040092071,-73.9130101054408,-73.9130276523281,-73.9130543937188,-73.9130770238816,-73.9130823320629,-73.9130925917694,-73.9131153751903,-73.9131537572721,-73.9132074776382,-73.9133453000465,-73.9134426509052,-73.9135119443682,-73.9135602987766,-73.9135911465638,-73.9136289096197,-73.9136704080064,-73.9137057441612,-73.9137981788346,-73.9138419814023,-73.9138878302082,-73.913933638425,-73.9139827654238,-73.9140144821997,-73.9140488061528,-73.9140804924904,-73.9141257471768,-73.9141501966294,-73.9141869659045,-73.9142144094021,-73.9142420915365,-73.914264611633,-73.9142875703119,-73.9143048086493,-73.9143134782537,-73.9143203815268,-73.9143386907519,-73.9143481386469,-73.9143627247842,-73.9143802440391,-73.9144085262642,-73.9144253178723,-73.9144307579211,-73.9144165647472,-73.9144135471854,-73.9144260182394,-73.9144456207809,-73.9144813795111,-73.9145087196776,-73.9145405606919,-73.9145713661856,-73.9145910991113,-73.9146096161664,-73.9146316627537,-73.9147207505513,-73.9147531684699,-73.914786629988,-73.914812067686,-73.9148209234614,-73.914824357159,-73.9148196690462,-73.9148139671491,-73.9148251681042,-73.9148566460507,-73.9148814366393,-73.9148974197058,-73.9149069536754,-73.9149020081095,-73.914884639735,-73.914859618503,-73.914851264506,-73.914857513246,-73.9148785016829,-73.91487974591,-73.9148712856978,-73.9148618361729,-73.9148711327222,-73.9148975950198,-73.914921207793,-73.9149508720015,-73.9149668021376,-73.9149825348614,-73.914986856806,-73.9149935501604,-73.9150043495072,-73.9150293243891,-73.9150473894705,-73.9150639019343,-73.9150721823486,-73.9150857720053,-73.9151053823759,-73.9151404499266,-73.915166782184,-73.9152135907856,-73.9152573344254,-73.9152833390794,-73.9153536435194,-73.9153958461791,-73.9154299060241,-73.915454498169,-73.9154765054017,-73.9155053193232,-73.9155269382118,-73.915544997565,-73.9155671901143,-73.9156071309141,-73.9156530441542,-73.9156987077507,-73.9157300688921,-73.9157501285275,-73.9157588827691,-73.9157616045729,-73.9157789647609,-73.9157964642004,-73.9159008307972,-73.9159559503258,-73.9160135271607,-73.9160452893165,-73.91607986037,-73.9161222613293,-73.9161419947328,-73.9161562087907,-73.9161652638916,-73.9161634065209,-73.9161611729504,-73.9161653343487,-73.9161929139961,-73.9162545840778,-73.9162874592204,-73.9163254558276,-73.9163582813013,-73.916401109339,-73.9164738146702,-73.9165253744714,-73.9165634573712,-73.9166043299236,-73.9167443570615,-73.9168090421503,-73.9168419871632,-73.9168686550118,-73.9168841435417,-73.9169045960364,-73.9169166457056,-73.9169280467959,-73.9169473272844,-73.9169742162955,-73.9170081143389,-73.9170454990349,-73.9172215494406,-73.9172715063787,-73.9172974760781,-73.9173041099016,-73.9173107459236,-73.9172986141072,-73.9170838294655,-73.9168767663595,-73.9168456114544,-73.9168180242801,-73.9168023754274,-73.9168099685985,-73.916830958948,-73.9168329873401,-73.9168110438531,-73.9167694271823,-73.9167130311422,-73.9166355518949,-73.9165904939618,-73.9165602576572,-73.9164838423551,-73.9164297950498,-73.916410785555,-73.9163910623969,-73.9163755408858,-73.9163509359137,-73.9163331007142,-73.9163264056804,-73.9163112552774,-73.9162933048909,-73.9162906180458,-73.9162931658865,-73.9162847688571,-73.9162755368557,-73.9162610483293,-73.9162472712827,-73.9162099122437,-73.9161613368347,-73.9161435989042,-73.9161270768209,-73.9161125248706,-73.9160977630738,-73.9160827619387,-73.9160660850751,-73.9160610513273,-73.9160483111864,-73.9160431267682,-73.9160339846931,-73.9160265379797,-73.9160232783398,-73.9160315082901,-73.9160451073758,-73.9160592444141,-73.9160598299387,-73.9160553342886,-73.9160421323441,-73.9160123409459,-73.9160007626264,-73.9159967391404,-73.9159950756427,-73.9159893032506,-73.9159850675689,-73.9159732376387,-73.915961510809,-73.9159447356366,-73.9159291477184,-73.9159073662861,-73.9158997987654,-73.9158960153525,-73.9158853218926,-73.9158787393107,-73.915875254895,-73.9158623761139,-73.9158442416109,-73.9158230823414,-73.9158042230052,-73.9157805779701,-73.9157652891067,-73.9157439799606,-73.9157300442487,-73.9157189407782,-73.9157085996047,-73.915667295489,-73.9156141628192,-73.915578280018,-73.915556183783,-73.9155415816185,-73.9155302905145,-73.9155236696394,-73.9155169388029,-73.9155041366084,-73.9154929220835,-73.9154848927125,-73.915471576988,-73.9154639576831,-73.9154627460607,-73.9154555256811,-73.9154327802967,-73.9154129090081,-73.9153768011705,-73.9153363698117,-73.9152975529992,-73.9152602938725,-73.915185492377,-73.9151453494572,-73.9151034718225,-73.9150718857621,-73.9150324429906,-73.9149923101569,-73.9149562170526,-73.9149236143769,-73.9148914534752,-73.9148542962049,-73.914812003414,-73.91477047212,-73.9146947696882,-73.9146614460975,-73.9146294466243,-73.9145603874642,-73.9144206985687,-73.9143866763601,-73.9143565257403,-73.9143386047636,-73.9143279797447,-73.9143340251042,-73.9143418953652,-73.9143637397223,-73.9143943284774,-73.9144126777679,-73.9144320504709,-73.9144443935677,-73.9144557861914,-73.9144642930279,-73.9144585986722,-73.9144417752447,-73.9144030684122,-73.9143930884403,-73.9143802634552,-73.9143717701619,-73.9143664973898,-73.9143653335133,-73.9143532173149,-73.914343963579,-73.9143293246253,-73.9143108166108,-73.9142977634743,-73.9142833750804,-73.9142574196969,-73.9142369244518,-73.9142141072634,-73.9141761412381,-73.9141684620959,-73.9141668522852,-73.9141820042773,-73.9141877018788,-73.9141822088067,-73.91417322816,-73.9141539194827,-73.914139678847,-73.9141325725105,-73.9141239526859,-73.9141058657211,-73.9140810716332,-73.914054904743,-73.9140218193195,-73.9139318291414,-73.9138805329889,-73.9138505061941,-73.9138166967135,-73.9137907406298,-73.9137611149445,-73.913726006249,-73.9137094703205,-73.913702864317,-73.9136961454761,-73.9136756762096,-73.9136466739328,-73.9136143267,-73.9135275871485,-73.9134352510518,-73.9133591144628,-73.9133350692023,-73.9133100897815,-73.913293102937,-73.9132754302322,-73.9132601481827,-73.913244866795,-73.9132191248818,-73.9131830787932,-73.913145021746,-73.9131127601354,-73.9130704563262,-73.91303517142,-73.9130063968499,-73.9129778681807,-73.9129690516787,-73.9129454191364,-73.9129289192581,-73.912930629038,-73.912945016827,-73.912959078388,-73.9129720797649,-73.9129803602876,-73.9129953721431,-73.9130049373253,-73.913006822421,-73.9130481141271,-73.913054395772,-73.9130417041944,-73.9130193231835,-73.9129938424696,-73.9129818894497,-73.9129633425216,-73.9129462568751,-73.9129379387424,-73.9129438870421,-73.9129530042072,-73.9129578768319,-73.9129544439206,-73.9129462246988,-73.9129320729492,-73.9129096045791,-73.9128927058131,-73.9128884734803,-73.9128894847222,-73.9128858784707,-73.9128883021146,-73.9128947357859,-73.9128904277056,-73.9128735664389,-73.9128537958871,-73.9128299648527,-73.9128148124989,-73.9128039595741,-73.9127915566794,-73.9127698601734,-73.912753122262,-73.9127234589584,-73.9126932927514,-73.9126622109673,-73.9126422880589,-73.9125826795245,-73.9125307903315,-73.9125121275723,-73.9125011108394,-73.9124923404176,-73.9125040570049,-73.9125070558335,-73.9125073523522,-73.9124970981476,-73.9124744504414,-73.9124499909523,-73.9124027092491,-73.91237934988,-73.9123471443585,-73.9122702557757,-73.912250081346,-73.9122316671484,-73.9122205227265,-73.9122249968691,-73.9122405854893,-73.9123274913306,-73.9123696252465,-73.91241554493,-73.9124548328969,-73.912484037605,-73.9124983164753,-73.9124995142279,-73.9124900946457,-73.9124840487742,-73.9124432502063,-73.9124020267366,-73.9123755323444,-73.9123510482274,-73.9123291495486,-73.9123063260794,-73.9122884759118,-73.9122632047922,-73.9122340367465,-73.9121369264972,-73.9120428482675,-73.9119964425542,-73.9119816384673,-73.9119761950232,-73.9119740573841,-73.9119706478938,-73.9119633293296,-73.9119555465508,-73.9119360708442,-73.9119105886035,-73.9118854042794,-73.9118657297485,-73.9118483521907,-73.9118287771951,-73.9118027936418,-73.9117865670516,-73.9117524633354,-73.9116853427978,-73.9116374602404,-73.911556050379,-73.9115207341232,-73.9115023316449,-73.9114803459921,-73.9114414690023,-73.9113869136904,-73.9113200784103,-73.9112863598385,-73.9112820739052,-73.9112737538341,-73.9112782380327,-73.9112905774616,-73.9113423155129,-73.9113972019499,-73.9114520608356,-73.9114752333858,-73.9114832760197,-73.9114996013073,-73.9115174012135,-73.9115416117162,-73.9115710034729,-73.9116053180548,-73.9117501692078,-73.911838086706,-73.9119719708825,-73.9121351874067,-73.9123155420279,-73.9124878145035,-73.9126239724757,-73.9128091019642,-73.9128457496793,-73.9129824938361,-73.9131765000868,-73.9133445105788,-73.9135272991878,-73.9136239458856,-73.913711299861,-73.9137578059496,-73.9137594677359,-73.9138185656496,-73.9139558373651,-73.9140795447299,-73.9141518593633,-73.9142745011442,-73.9143867033748,-73.9144408160937,-73.914498863424,-73.9146318440628,-73.9149272537049,-73.9150142040297,-73.9150552017076,-73.9152602172067,-73.9154347891476,-73.9155338116844,-73.915654284721,-73.9157976770829,-73.9160202569389,-73.9161400152494,-73.9162085837168,-73.9163114542804,-73.9164253673688,-73.9164864681709,-73.9165644083998,-73.9166460962574,-73.9167525002006,-73.916844193686,-73.9169404636913,-73.9170590491502,-73.9171706875147,-73.9173008230307,-73.917400316965,-73.9174727568556,-73.9175428264031,-73.9176559499189,-73.9177451139125,-73.9178718350552,-73.9179531674513,-73.9180154429836,-73.9180700430863,-73.9181401186959,-73.9182225636431,-73.9184699334942,-73.9185654146302,-73.9186419887748,-73.918663987797,-73.9187688154804,-73.9188552089824,-73.9190324465495,-73.9191480033092,-73.9192758349004,-73.9194045256148,-73.9195547389229,-73.9196702977618,-73.9197966193003,-73.919889006175,-73.9200198391403,-73.9201613688444,-73.9202913480022,-73.9203859749159,-73.9204837313242,-73.9205807274262,-73.9206908544314,-73.9208180318996,-73.9209704859754,-73.9211015498323,-73.9213218375612,-73.9214412496221,-73.9215483513951,-73.9216538372553,-73.9218193970368,-73.9219564179251,-73.922072602898,-73.9222127187776,-73.922378935374,-73.9225235966035,-73.922647452215,-73.922811365913,-73.9229422666663,-73.9230930457787,-73.9232138446036,-73.9233053131361,-73.9233645621588,-73.9234322328644,-73.9235283444922,-73.9236306089874,-73.9237413694447,-73.9238189801508,-73.9239181213014,-73.9240049525131,-73.9240840821462,-73.9241424063894,-73.9242861807158,-73.9243776503876,-73.9244360409498,-73.9245204672411,-73.9246257016451,-73.9247392581667,-73.9248505137917,-73.9249632482277,-73.9250944489741,-73.9252187554043,-73.9255737274039,-73.9255918819244,-73.9255974402587,-73.9256036580788,-73.9256204999699,-73.9256344639744,-73.9256380583402,-73.9256457081107,-73.9259909277581,-73.9262678535249,-73.9263038203984,-73.9271253183681,-73.9282302525206,-73.929437458406,-73.9294466193238,-73.9294729498456,-73.929466011776,-73.929632480749,-73.929936904353,-73.9299834173285,-73.9287156972737,-73.92863344177,-73.9279589375641,-73.9270927808393,-73.925945807442,-73.9252412425509,-73.9246647476181,-73.9246539325931,-73.9240846472311,-73.923791477666,-73.9235048569352,-73.9228485463533,-73.9227960812382,-73.922367608929,-73.9211616247793,-73.9209287181441,-73.9207565880955,-73.9198693072058,-73.9190857231541,-73.9183322456026,-73.9175750002432,-73.9172301984166,-73.9171359020326,-73.9157540475484,-73.9158289001943,-73.9154533335453,-73.9150832214209,-73.9147195183528,-73.9143631573804,-73.914122348,-73.913847871606,-73.9129033815855,-73.9128439827589,-73.9127820379921,-73.9127250938929,-73.9125539169126,-73.9125337530749,-73.91255362999,-73.9125645856406,-73.9125663016206,-73.912558728073,-73.9125420851364,-73.9125168565452,-73.9124837755684,-73.9124742597049,-73.912471360111,-73.9124751148233,-73.9124854745578,-73.9125006491401,-73.9125027871405,-73.9125059887557,-73.9124983136451,-73.9124777354631,-73.9124429998138,-73.9124137811955,-73.9123941214235,-73.912381993484,-73.912377906725,-73.9123697232459,-73.9123679028881],"lat":[40.5845261742473,40.584505245574,40.5844996692697,40.5845023919406,40.5845061845565,40.5844843274259,40.5844612524211,40.5843788258298,40.584319948276,40.5842776833718,40.5842497493001,40.5842248564705,40.5842002349709,40.5841798511356,40.5841726181262,40.5841686721022,40.5841599385335,40.5841451891405,40.5841201140768,40.5840893999207,40.5840675828087,40.5840245827606,40.5839669322481,40.5839502980258,40.5839264750153,40.5839160941304,40.583916130534,40.5839137887765,40.5839005515479,40.5838863557107,40.5838757530066,40.5838754580329,40.5838863327101,40.5838946304229,40.5838942725874,40.5838879564148,40.5838751536066,40.5838527045327,40.5838306284868,40.5837538797551,40.5836999416693,40.5836752416365,40.5836503074577,40.5836234495917,40.5836059968193,40.5836041503622,40.5836084612736,40.5836107332543,40.5836202295944,40.5836429269031,40.5836540421742,40.5836556305386,40.5836447682448,40.5836270844997,40.583566931324,40.5835400283778,40.5835149340398,40.5834884754652,40.5834527611928,40.5834248055065,40.5833927840273,40.5833699735122,40.5833517539238,40.5833375354725,40.5833128584809,40.5832907249298,40.5832713527783,40.5832459135252,40.5832263247425,40.5832043250155,40.5831454049874,40.5830928733655,40.5830704598273,40.5830341700889,40.5830075484956,40.5830079647886,40.5830139218665,40.58302555473,40.5830393284431,40.5830556466096,40.5830781178634,40.5831114957203,40.5831294023787,40.5831511617276,40.5831735095837,40.5831847106544,40.5831867164534,40.5831731737396,40.5831491732927,40.5831332667575,40.5831174295006,40.5831101249159,40.5831064495378,40.583087744027,40.5830665012918,40.5830408713711,40.5830307092351,40.5830303097622,40.5830322962412,40.583028121267,40.5830207001216,40.5829913359189,40.5829809687112,40.5829846827013,40.5829895462301,40.5829898805527,40.5829862702439,40.5829759797955,40.5829681808734,40.5829674214545,40.582967244219,40.5829568409664,40.58294421935,40.5829238851826,40.582907330475,40.5829017306761,40.5828954375573,40.5828848348833,40.582873456235,40.5828562671216,40.5828520021632,40.5828576953013,40.5828646812706,40.5828667455329,40.5828578714389,40.5828452856494,40.5828295835957,40.5828115414373,40.5827989927158,40.582797920383,40.5828067895464,40.5828090541182,40.5827989313828,40.5827775678123,40.5827657716538,40.5827588465134,40.5827576344028,40.5827728358466,40.5827767104019,40.5827875842665,40.5828039846663,40.5828173853823,40.582833823241,40.5828485313676,40.5828604264247,40.5828664605972,40.5828705073167,40.5828698708126,40.5828726103676,40.5828850958631,40.5828949273539,40.582911918564,40.5829381639581,40.5829620462995,40.5829820995192,40.5830055227934,40.5830270040109,40.5830478456148,40.583074250139,40.5830944215466,40.5831052595343,40.5831124804548,40.5831211430854,40.5831334037947,40.5831491920241,40.5831528403286,40.5831533612718,40.5831514512163,40.5831305668679,40.5831252229687,40.5831252082046,40.5831245869277,40.5831179172365,40.5831085038388,40.583104517916,40.583103942297,40.5830951512282,40.5830872921916,40.5830759533725,40.5830530854807,40.5830448278762,40.5830427114222,40.583039709132,40.5830326723327,40.5830225372189,40.5830082526312,40.5829901782514,40.5829773219317,40.5829645873722,40.582955453539,40.582945633136,40.5829418403232,40.5829363934056,40.5829316788436,40.5829144708701,40.5829084994437,40.5829067560584,40.5829083695823,40.5829071479154,40.5828980497767,40.5828914289383,40.5828830288017,40.5828612380433,40.5828574376339,40.5828626082507,40.5828751586287,40.5828933278566,40.5829220099553,40.5829349119246,40.5829609264229,40.5830191062994,40.583041939564,40.5830585727647,40.5830660081703,40.5830757285758,40.5831115340889,40.5831403382153,40.5831520136998,40.5831593868615,40.5831492431489,40.5831361391065,40.5831124099561,40.5830983638143,40.583098847118,40.5831052166401,40.5831191294635,40.5831421683203,40.5831882587298,40.5832117802044,40.5832299111136,40.5832426634834,40.5832527892873,40.5832488590087,40.5832358881392,40.5832270108362,40.583218131189,40.5831908017496,40.5830589776529,40.5829233708975,40.582892885462,40.5828704393254,40.5828431210236,40.5828178694413,40.5827963291212,40.582782368347,40.5827620485571,40.5827477026872,40.5827344790914,40.5827266962727,40.5827257775073,40.5827317864467,40.5827846474601,40.5828111322666,40.5828106600774,40.5828085815956,40.5828027315618,40.5828081834884,40.5828192601164,40.5828188704256,40.5828139181088,40.5828018834514,40.5827913133986,40.5827699063266,40.5827475569682,40.5827308075115,40.5827160298983,40.5827068791122,40.5826982063461,40.5826778593002,40.5826688714655,40.5826680628027,40.5826733771036,40.5826744922903,40.582666027294,40.5826432595814,40.5826382603421,40.5826354507783,40.5826351193023,40.582633766522,40.5826277774287,40.5826158082472,40.582598467086,40.5825767936819,40.5825576996181,40.5825502335914,40.5825466620962,40.5825389120846,40.5825238493454,40.5825138229524,40.5825062718019,40.5824831307419,40.5824647912559,40.5824542212358,40.5824422995623,40.5824357583402,40.582434264438,40.5824332654465,40.5824344567239,40.5824408471258,40.5824440277518,40.5824438002923,40.5824387731062,40.5824338012951,40.5824256129071,40.582418243573,40.5824108165677,40.5824067135214,40.5824006296133,40.5823914518614,40.5823875369874,40.5823919195578,40.5824033566933,40.582410403774,40.5824184431921,40.5824145620584,40.5824070692434,40.5823998616341,40.5823885966045,40.5823781038054,40.5823754084138,40.5823750466269,40.5823911223894,40.5824060726825,40.5824075500826,40.5824033133501,40.5823931244638,40.5823837626942,40.582371927286,40.5823656534873,40.5823640737987,40.5823635806399,40.5823648683055,40.5823715649993,40.58236942347,40.5823632479205,40.5823640691622,40.5823707075749,40.5823815262375,40.5823979921967,40.5824305768173,40.5824626626632,40.5824814651558,40.5824908554891,40.5824940931083,40.5824869263417,40.5824753668309,40.5824416325292,40.5824316446358,40.5824275036584,40.5824065084561,40.5823822237872,40.5823831580494,40.5823963380756,40.5824186125049,40.582451542222,40.58248061427,40.5824915169265,40.5824980104033,40.582507503306,40.5825167401453,40.5825411552459,40.5825733895739,40.5825892624299,40.5826092778161,40.5826140506801,40.5826226002508,40.5826269642111,40.5826323646276,40.5826395727442,40.5826372888511,40.5826215565823,40.5826021511085,40.582589542854,40.5825916763123,40.5826081896694,40.582611332458,40.5826000964031,40.5825906979868,40.5825890048325,40.5825972519227,40.5826198795151,40.5826641786278,40.5827006799134,40.5827207152381,40.582751138353,40.5827729363527,40.582789647505,40.5828013616625,40.5828112571092,40.5827983453569,40.5827818712269,40.5827653684904,40.5827491332569,40.5827402209125,40.5827355083379,40.5827362527118,40.5827262754623,40.5827219556406,40.5827227560347,40.5827267649564,40.5827250716963,40.5827230737879,40.5827288938743,40.5827381314297,40.5827520146631,40.5827693847702,40.5827853166926,40.582801297148,40.5828153530152,40.5828806147181,40.5829305828947,40.5829540210144,40.5829507365569,40.5829464907756,40.5829419489652,40.5829394922091,40.5829386034885,40.582937713091,40.5829390660523,40.5829451042258,40.5829485619189,40.5829513915584,40.5829531167757,40.5829559161285,40.5829637461172,40.582974592821,40.582972802624,40.5829566727389,40.5829381328143,40.5829246302278,40.5829062504127,40.5828894908615,40.5828587034286,40.5828313434227,40.5828043190494,40.5827851401446,40.5827746838783,40.5827489134154,40.5827354960411,40.5827214605317,40.5827135397162,40.5827067401693,40.582707197184,40.5827126464398,40.5827293487509,40.5827567350282,40.5827792474581,40.5827995110272,40.5828180421405,40.5828284972333,40.582835792779,40.5828383067249,40.5828415828232,40.5828524399962,40.5828684665119,40.5828925385863,40.5829253642612,40.5829440856767,40.5829792509741,40.5829975834757,40.583007286731,40.5830122672988,40.5830108493443,40.5830070511782,40.5829925772731,40.582979254961,40.5829692480369,40.5829666002565,40.5829657543199,40.5829646878597,40.5829726515404,40.5829845768911,40.5830322362461,40.5830677150169,40.5830789539308,40.5830791931501,40.5830685629229,40.5830562477067,40.5830486200272,40.5830404955753,40.5830363425839,40.583038905455,40.5830495646465,40.5830586133972,40.5830544234308,40.5830419105473,40.5830071290306,40.5829906727825,40.5829761112937,40.5829633400481,40.5829568925756,40.5829567398022,40.5829573281724,40.582947945661,40.5829342286816,40.5829266286611,40.5829202554719,40.5829042635952,40.5828958933936,40.5828861696765,40.5828849024016,40.5828912942309,40.5828927724168,40.5828908582928,40.5828938583312,40.5829008420108,40.5828992325601,40.5828949085681,40.5828934898991,40.5828987107923,40.5829104929674,40.5829146485911,40.582915793301,40.5829203932102,40.5829270309142,40.5829367464898,40.5829559843048,40.5829642131069,40.5829687091632,40.5829678433549,40.5829633772526,40.5829507861927,40.582936910382,40.5829286346634,40.582921264093,40.5829130641873,40.5829064641352,40.5828867028039,40.5828435030038,40.5828169524676,40.5827708863958,40.5827429714065,40.5827195714557,40.5826847229584,40.5825999889115,40.5825011883746,40.5823791582415,40.5823135862924,40.5822964202554,40.5822630990806,40.5822213272183,40.5821739071326,40.5820888844634,40.5819927769279,40.5818878304872,40.5818436301023,40.5818321618675,40.581818780962,40.5818065527877,40.5817940271557,40.5817829876402,40.5817781014106,40.5817621550599,40.5817602189037,40.5817610357395,40.5817696689982,40.5817758453859,40.581769306881,40.581765759875,40.5817584077606,40.5817569534329,40.5817459954437,40.5817194078582,40.58169463881,40.5816576124537,40.5816409412492,40.5816287376978,40.5816294614978,40.5816294880422,40.5816411428525,40.5816680905005,40.5816889321124,40.5816971388253,40.5817063436689,40.5817160336423,40.5817126972276,40.5817015427681,40.581665506879,40.5815474612214,40.5815392955171,40.5815436077226,40.5815786736072,40.5816030931733,40.5816150778661,40.5816328429132,40.5816587498146,40.5816973949216,40.5817095601007,40.5817209455099,40.5817362536108,40.5817590086326,40.5817614272904,40.5817820299036,40.5818096184825,40.5818493585736,40.5818792329971,40.5819049671486,40.5819346691845,40.5819632687715,40.5819987430712,40.5820373511188,40.5820614756562,40.5820803810756,40.5821036563312,40.582110718913,40.5821128681689,40.5821082612522,40.5821125601189,40.5821227548728,40.5821386971728,40.5821651065986,40.582247295964,40.5822712989531,40.5822931013784,40.5822993646316,40.5823355889779,40.5823707566693,40.5824281920395,40.5824626114332,40.5824986851451,40.5825394534935,40.5825853420625,40.5826197609315,40.5826552572084,40.5826781029928,40.5827036378509,40.5827273421952,40.5827452461879,40.5827616434088,40.5827821049724,40.5828037473451,40.5828346744729,40.5828777732066,40.5829172112463,40.5829632492981,40.583028012458,40.5830624042043,40.5830950861595,40.5831242811271,40.5831642198465,40.5831949998774,40.5832194251268,40.5832513329165,40.5832842457575,40.5833091009023,40.5833305669783,40.583364081419,40.583395460105,40.5834226248458,40.5834429343216,40.5834523008393,40.5834613152624,40.5834720102272,40.5834831083979,40.5834965166212,40.5835116311518,40.5835187647782,40.5835251429811,40.5835298671474,40.5835317299498,40.5835301776124,40.583544490505,40.583553881969,40.5835582034443,40.5835547455107,40.5835546494114,40.5835475050069,40.5835380264727,40.5835261871336,40.5835154039357,40.5835064242463,40.5835139010564,40.583498616035,40.5834665729239,40.5834553826316,40.5834538207692,40.583461138616,40.5834773939806,40.5834887624548,40.5835231719093,40.5835506919363,40.5835529339395,40.5835792738834,40.583525761222,40.5834189297596,40.583372643646,40.5833743155054,40.5834156281985,40.5833988086255,40.584122815037,40.5842334352726,40.5842325662829,40.5842315336653,40.5842080591651,40.5841398649231,40.5840259719442,40.5839536177232,40.5838744269389,40.5838732362516,40.5838105496045,40.5837843485854,40.5837591122947,40.5837328958707,40.5837307998489,40.5837136828037,40.5837090024076,40.5837138022341,40.5837173473468,40.5837551948854,40.5838300257755,40.5839019751362,40.5840069337284,40.5840621972455,40.584077310797,40.5844232681167,40.5845251540852,40.5846279347572,40.5847426679417,40.584869066249,40.5850068246937,40.5851097007037,40.5852318404784,40.5858106764392,40.5857569797572,40.5857070064198,40.5856536876868,40.5855263360063,40.58534227012,40.5853035256613,40.585262770151,40.5852211881347,40.5851799881777,40.585140367739,40.5851034783674,40.5850703922325,40.5850267024159,40.5849824695578,40.5849382741018,40.5848946959993,40.5847417973841,40.5847316239427,40.584707306966,40.5846860195181,40.5846651774191,40.584650746268,40.5846446941103,40.5846373621049,40.5846231533945,40.5845938676349,40.5845616521784,40.5845261742473]}],[{"lng":[-73.8632747107196,-73.8638123946197,-73.8644924533569,-73.8650358927805,-73.8655792529256,-73.8663761931267,-73.8670023299128,-73.8677279690368,-73.8689509792263,-73.8689629221041,-73.869257580513,-73.8696863104371,-73.8700031364301,-73.8703477840131,-73.8705059791845,-73.8705138809595,-73.8706149779442,-73.8708474394764,-73.8709979164803,-73.8711592267543,-73.869813564821,-73.8684967164721,-73.867592757752,-73.8669026817396,-73.866350521641,-73.8647622296209,-73.8643082669254,-73.8637111879819,-73.8632727349283,-73.8627415602877,-73.8627234849807,-73.8623137461719,-73.8619321622174,-73.8614940111164,-73.8612529937737,-73.8613758412504,-73.8615082436249,-73.8615914017584,-73.8616744786746,-73.8619222039882,-73.8621862457983,-73.8624996564085,-73.8628294860507,-73.8631756329361,-73.8632747107196],"lat":[40.5838768485318,40.5836040035887,40.5836149381788,40.5833020600857,40.583026802455,40.5825386578675,40.5819770802755,40.5816634094289,40.5817135421227,40.5816937947886,40.5819096405709,40.5823087857919,40.5826366143133,40.5830641370353,40.5833419525112,40.5840823269006,40.5849153510604,40.5854210541284,40.5860617978628,40.5868738879673,40.5894609267883,40.5900898502896,40.5910057916907,40.5914730354414,40.5918926765648,40.5914922185828,40.5914147443264,40.5911292819831,40.5909080756926,40.5903664065974,40.5900745107534,40.589518746808,40.5888989453747,40.5885424730994,40.5879880859212,40.5873734200329,40.5869848199976,40.5865459962742,40.5861447949937,40.585668547723,40.5852550222771,40.5848290148766,40.5844155671425,40.5840648408604,40.5838768485318]}],[{"lng":[-73.8695270754893,-73.869670707115,-73.8702089983623,-73.8695270754893],"lat":[40.5987137503545,40.5966885636221,40.5969542327894,40.5987137503545]}],[{"lng":[-73.8701949148995,-73.8710814181148,-73.8704941191478,-73.8702628056502,-73.8701949148995],"lat":[40.5989964059019,40.5989011474702,40.6026044462046,40.601681221756,40.5989964059019]}],[{"lng":[-73.8524333580702,-73.8526902935183,-73.8528611743197,-73.8536531642096,-73.853995595994,-73.8543697470413,-73.8546586309012,-73.8549264858156,-73.8559530056204,-73.8567336439498,-73.8571613235071,-73.8577811996852,-73.8604442053396,-73.8605497798519,-73.8614148516693,-73.8617727637101,-73.8627482079274,-73.8632866313415,-73.8633599914751,-73.8629750626097,-73.8618718984724,-73.8615408126042,-73.8611749560862,-73.8611281422454,-73.8607816916686,-73.8604888421352,-73.8590591432787,-73.8548259578297,-73.8547120072918,-73.8542738736082,-73.8537209034069,-73.8527683815584,-73.8525785163532,-73.8520453763197,-73.8517604530561,-73.8507674800156,-73.8515312289378,-73.8520048190978,-73.8524333580702],"lat":[40.5973333977953,40.5971707504633,40.5972443082327,40.5968378779478,40.5966834863468,40.5966921104023,40.5965783889276,40.5963016638707,40.5961888761897,40.596075764354,40.5960436978647,40.596117814918,40.596471906099,40.5970630201917,40.5977536963778,40.5982991785712,40.599071205422,40.5998100421632,40.6003222032738,40.6010182726156,40.6021643258159,40.6023803598694,40.602486648427,40.6025503310743,40.6026084002563,40.6023393473947,40.6020614310715,40.6018671953537,40.6016490258277,40.6014304366971,40.6014006651786,40.6009488540259,40.600570687846,40.600206622801,40.5996975138126,40.5988394438374,40.5984339362205,40.5977484382743,40.5973333977953]}],[{"lng":[-73.8670290518557,-73.8676819415421,-73.8683080846471,-73.8679350537271,-73.8670260728703,-73.8670290518557],"lat":[40.6037433888539,40.6030707666774,40.6031391606436,40.603961135453,40.6041715840083,40.6037433888539]}],[{"lng":[-73.846736514711,-73.8467246739848,-73.8467055588768,-73.8466804921793,-73.8466739233521,-73.8466693383373,-73.8466752982894,-73.8466700450561,-73.8466568389331,-73.8466443263161,-73.8466495863449,-73.846659328719,-73.8466638363763,-73.8466563829927,-73.8466436728569,-73.8466332189596,-73.8466220022054,-73.8466092761314,-73.8465958033664,-73.8465935798892,-73.8465838696311,-73.8465786561206,-73.8465779371766,-73.8465764595205,-73.8465742360573,-73.8465615311845,-73.8465473158874,-73.846530853536,-73.8465226419213,-73.8465189250828,-73.8465182070224,-73.8465099842636,-73.8464995238409,-73.8465040422265,-73.8465048146988,-73.846498090792,-73.8464839074292,-73.8464697157635,-73.8464607618506,-73.8464577928126,-73.8464555805152,-73.8464443847941,-73.8464286897227,-73.8464085066558,-73.8463942887821,-73.8463763282869,-73.846358364727,-73.8463426396984,-73.8463253967818,-73.8463014115906,-73.8462894201961,-73.8462804190395,-73.8462721728868,-73.846260188046,-73.8462317358487,-73.8462092827435,-73.8461935660021,-73.8461771030216,-73.846153151946,-73.8461478912008,-73.8461314275581,-73.8461306955487,-73.8461164855483,-73.8461022667802,-73.8460850601812,-73.8460805903788,-73.8460888413737,-73.8460971052932,-73.8461106038853,-73.8461218527779,-73.8461338485705,-73.8461525894827,-73.8461638436214,-73.8461713678443,-73.8461819013588,-73.846192414272,-73.846203674962,-73.8462209204996,-73.8462433774851,-73.846274075349,-73.8463040184263,-73.8463302342058,-73.8463512185893,-73.8463662078386,-73.8463714705055,-73.8463744928972,-73.8463962211021,-73.8464037032521,-73.8464186754288,-73.8464254412917,-73.8464329772319,-73.8464300160756,-73.8464315481455,-73.8464233551849,-73.846413681099,-73.8463735381499,-73.846325594993,-73.846291841498,-73.8462545438904,-73.8462243882593,-73.8461924276592,-73.8461675596619,-73.8461338521592,-73.8460948311765,-73.8460699936649,-73.8460663870122,-73.8460876136718,-73.8460910954315,-73.8460733164406,-73.8460395761299,-73.8460359694593,-73.8460359164565,-73.8460270036693,-73.845993274242,-73.8459754702441,-73.8459683150055,-73.8459700117361,-73.8459788091496,-73.8459574603516,-73.8459254812422,-73.8458934952107,-73.8458703997309,-73.8458171341203,-73.8458046575147,-73.8457851130077,-73.8457850474284,-73.8457832247235,-73.8457601666583,-73.8457442239997,-73.8457318104911,-73.8457158240981,-73.8456927883498,-73.8456839535454,-73.8456627130823,-73.84563257286,-73.8456006842614,-73.8455723362156,-73.8455475047911,-73.8455120589601,-73.8454854628755,-73.8454446644906,-73.8454109361757,-73.8453718736031,-73.8453416801831,-73.8453167861066,-73.8453114240995,-73.8452989566857,-73.8452865049302,-73.8452669484206,-73.8452243940402,-73.8451995813894,-73.8451801101634,-73.8451677266997,-73.8451358037115,-73.8451092022314,-73.8450808235591,-73.8450542306174,-73.845009933633,-73.8449815901674,-73.8449797809213,-73.8449531612817,-73.8449354871169,-73.8449089083116,-73.8448929812799,-73.8449018845557,-73.844932040375,-73.8449550719449,-73.844988742006,-73.8450312994224,-73.8450826977838,-73.8451305827815,-73.845189108098,-73.8452281174467,-73.8452583140359,-73.8452601375669,-73.8452708409797,-73.8452655716496,-73.8452673933642,-73.8452710039135,-73.8452923055524,-73.8453188702646,-73.8453454804301,-73.8453845500937,-73.8454235320933,-73.8454501391262,-73.8454501735512,-73.8454342410304,-73.8454058984596,-73.8454183501448,-73.8454520734477,-73.8454733973939,-73.8455035594083,-73.8455514601505,-73.8455710006338,-73.84556040995,-73.845535600499,-73.8454912454161,-73.8454504207974,-73.8454096350475,-73.8453652723702,-73.8453332805979,-73.8452959874848,-73.8452569663702,-73.8452322046224,-73.8452092131513,-73.8451862427654,-73.8451720185435,-73.8451772582891,-73.8451754052001,-73.8451841912373,-73.8451681499803,-73.8451663201525,-73.8451662574417,-73.8451750665942,-73.8451590933515,-73.8451342682181,-73.8451129947705,-73.845100539859,-73.8450739227304,-73.8450561864366,-73.8450100905631,-73.8449604604763,-73.8449267567794,-73.8448895024948,-73.8448557985775,-73.8448256270548,-73.8448095990457,-73.8447988904861,-73.844784633147,-73.8447562199112,-73.844724286852,-73.8446887971244,-73.8446532727871,-73.8446355270365,-73.8445929547508,-73.8445486578985,-73.8445362878328,-73.844497337501,-73.8444566241404,-73.8444548998268,-73.8444708816056,-73.8445045877896,-73.8445489317685,-73.8445985938799,-73.8446393740301,-73.8446854936794,-73.8447192359913,-73.8447423178189,-73.8447547853824,-73.8447831897867,-73.8448151497333,-73.8448347038198,-73.8448542540942,-73.844868498578,-73.8448845135182,-73.844884576343,-73.8448952697852,-73.844900663285,-73.844907821404,-73.8449380179261,-73.8449504822388,-73.8449629528249,-73.8449594589893,-73.8449435414562,-73.8449365107872,-73.8449312743244,-73.8449543857751,-73.8449615310729,-73.8449935291146,-73.8450113208845,-73.8450167111655,-73.845011449564,-73.8449777373967,-73.8449245188521,-73.8448979358373,-73.8448855846381,-73.8448856882952,-73.8448857793855,-73.8448840713146,-73.8448788160604,-73.8448789040146,-73.8448772078555,-73.8448790422277,-73.8448897254811,-73.8449163839741,-73.8449057980898,-73.8448916446555,-73.8448987838596,-73.8449148015157,-73.8449219909514,-73.844948643096,-73.8449770589539,-73.8450142913461,-73.8450355272397,-73.845054972993,-73.8450673266688,-73.8450974036336,-73.8451150805228,-73.8451380679119,-73.8451788133362,-73.8452160358028,-73.8452444172123,-73.8452763404146,-73.8453206870008,-73.8453756798037,-73.8454182742698,-73.8454501778196,-73.8455016446784,-73.845522974638,-73.8455159202865,-73.8455088838306,-73.845523131045,-73.8455338118702,-73.8455125311149,-73.8454770576535,-73.8454397594256,-73.8454113317609,-73.8453563045752,-73.845308386451,-73.845260494972,-73.8452108431042,-73.8451718491169,-73.8451559482099,-73.845154214285,-73.8451542519129,-73.8451791268494,-73.8451951325219,-73.8452146974544,-73.8452395504173,-73.845262631822,-73.8453034528079,-73.8453478417726,-73.8453744662542,-73.8453940192407,-73.8454118013234,-73.8454419848075,-73.8454650849263,-73.8454828169123,-73.8454881130702,-73.8455058307385,-73.8455235783731,-73.8455307104605,-73.8455307323568,-73.8455449203082,-73.8455715440779,-73.8455928857658,-73.8456230379246,-73.8456478276068,-73.8456442279648,-73.8456423970208,-73.8456281871771,-73.8456139788714,-73.8456281402858,-73.8456458423583,-73.8456440310464,-73.8456776891496,-73.8457060157744,-73.8457538656898,-73.8457786780002,-73.8457999065968,-73.8458282208117,-73.8458530010609,-73.845881370181,-73.845895586057,-73.8459027243188,-73.8459187244546,-73.8459435704629,-73.8459577520056,-73.8459807740804,-73.8459966886777,-73.8460179349478,-73.8460214231025,-73.8460036317693,-73.8459893969623,-73.8459875643352,-73.8460212017192,-73.8460193584275,-73.8460210302234,-73.8460209803353,-73.8460191339224,-73.8460492364545,-73.8460864879206,-73.8461130744548,-73.8461360935678,-73.8461609029659,-73.8461839345614,-73.8461945098269,-73.8461962396016,-73.8462157246846,-73.8462494268153,-73.8462795861787,-73.8463168501528,-73.8463293002404,-73.8463275868669,-73.8462708914103,-73.8462691883159,-73.8462710221585,-73.8462923364037,-73.8463278140348,-73.8463384253725,-73.8463525821147,-73.8463738679112,-73.8464146889977,-73.8464448383116,-73.8464714149036,-73.8464908775884,-73.8465156683949,-73.8465404150494,-73.8465740836477,-73.8466095697862,-73.8466663213298,-73.8466574001051,-73.8466236243379,-73.8466058517428,-73.8466022515142,-73.8466234845722,-73.8466252064737,-73.8466074338566,-73.8465755041609,-73.8465524438006,-73.8465222881478,-73.8464761734272,-73.8464513141493,-73.8464388503006,-73.8464139736631,-73.8463890981454,-73.8463819692854,-73.8464032334182,-73.8464369378611,-73.8464794943477,-73.8465149535328,-73.8465503994142,-73.8465734156607,-73.846596454982,-73.8466195085207,-73.8466442997216,-73.8466513668647,-73.8466371516153,-73.8466317766747,-73.8466299531536,-73.8466458841174,-73.84666364437,-73.8466902801933,-73.8467186674497,-73.8467382079428,-73.8467577521907,-73.8467843327935,-73.846807346034,-73.8468268778654,-73.8468446535952,-73.8468464615394,-73.8468677629823,-73.8469067918413,-73.8469546581866,-73.8469848015338,-73.8470042954995,-73.8470398034892,-73.8470610520454,-73.8470911861199,-73.847114200778,-73.8471177079688,-73.847137177864,-73.8471549597201,-73.8471461491629,-73.8471408761023,-73.8471621509865,-73.8471833964861,-73.8472170515024,-73.8472312257943,-73.8472596114902,-73.8472826904976,-73.8472756161676,-73.8472827307001,-73.8473004784938,-73.8473306528016,-73.8473448781002,-73.8473396085085,-73.8473502982834,-73.8473716279262,-73.8473929485051,-73.8474231165792,-73.8474532815578,-73.8474780937282,-73.8474957797153,-73.8475170422595,-73.8475329696597,-73.8475577787762,-73.8475896713115,-73.8476109325694,-73.8476108893659,-73.8476232664998,-73.847640964911,-73.8476551198535,-73.8476692763493,-73.8477011685247,-73.8477224342392,-73.8477366748901,-73.8477402560299,-73.8477456173841,-73.8477704303129,-73.8478005244561,-73.8478129108988,-73.8478306179643,-73.8478447637228,-73.8478624837863,-73.847862449897,-73.8478553169331,-73.8478552676362,-73.8478605488692,-73.8478463280366,-73.8478427425131,-73.8478355917049,-73.8478568451698,-73.8478319735967,-73.8478106615772,-73.8477822372432,-73.8477645549947,-73.8477427213121,-73.8477196423054,-73.8477183471647,-73.8477144224283,-73.8477131373455,-73.8477032789624,-73.8476973712137,-73.8476742956824,-73.8476650278307,-73.8476676083017,-73.84766560304,-73.8476471115898,-73.8476207138464,-73.8475897005346,-73.8475613312032,-73.8475316472383,-73.84750989214,-73.8474808703417,-73.847455136569,-73.8474254378983,-73.8473792425945,-73.8473462439172,-73.8472993710027,-73.8472703308094,-73.8472419470223,-73.8472214732067,-73.8471977035976,-73.8471561251946,-73.8471185192691,-73.8470994087015,-73.8470968031095,-73.8470803188753,-73.84707633416,-73.847069695694,-73.8470564605503,-73.8470399396574,-73.8469983533302,-73.8469726126194,-73.8469521268444,-73.8469382361423,-73.8469296383652,-73.846900583128,-73.8468425141626,-73.8468379292647,-73.8468353187251,-73.8468320445948,-73.8468096368558,-73.8467806081665,-73.8467542324925,-73.8467364431291,-73.8467364812289,-73.846736514711],"lat":[40.6048530148517,40.6048369051903,40.6048278267474,40.6048237705972,40.6048111879216,40.6047960936122,40.6047870486141,40.6047759772999,40.6047794808121,40.6047723550105,40.6047626662698,40.6047569755654,40.6047489964621,40.6047358679674,40.6047307172403,40.6047210075318,40.6047170000048,40.6047186934953,40.6047198162205,40.604710116991,40.6047021189123,40.6046912754868,40.6046787264137,40.6046701688865,40.6046610394238,40.6046536076154,40.6046518781622,40.6046512852411,40.6046427187211,40.6046318767887,40.6046187572791,40.6046147537393,40.6046073249214,40.6045953526098,40.604584517175,40.6045799446962,40.604564525787,40.6045525291539,40.6045411097861,40.6045308391204,40.6045165769069,40.6045034440685,40.604494867543,40.6044845733706,40.6044845543693,40.6044845303637,40.6044856470583,40.6044901890319,40.6045032850313,40.6045197931279,40.6045277622086,40.6045368766647,40.6045431391057,40.6045476860707,40.604554492418,40.6045556030826,40.6045555820508,40.6045555600182,40.6045572391043,40.6045669283241,40.604566906284,40.6045594911264,40.6045560493097,40.6045560302711,40.6045537263178,40.6045445938371,40.6045366202718,40.6045223715775,40.6045104118087,40.6045001608408,40.6044904806389,40.604476246469,40.6044637134196,40.6044460414408,40.6044221000185,40.6044061436853,40.6043907582864,40.6043765221042,40.604373700298,40.6043668969515,40.6043629444391,40.6043527127948,40.6043390520293,40.604329375805,40.6043191161402,40.6043065720664,40.6042951937013,40.6042957746407,40.6042935125645,40.6042804037244,40.6042575984779,40.6042433352629,40.6042279373444,40.604211385054,40.6041874166058,40.6042194161724,40.604240984469,40.6042625710536,40.6042828009256,40.6042827605818,40.6042962381012,40.6043110767318,40.6043123830692,40.6043109793634,40.6043122975596,40.6043379808379,40.6043636978774,40.6043920935669,40.6044096464308,40.6044258246097,40.6044515078868,40.604474491666,40.6044934078588,40.6045041776895,40.6045325460301,40.6045582245492,40.6045920261985,40.604623133943,40.6046501448984,40.6046717337531,40.6046960268479,40.6047108682931,40.6047324280667,40.604758099939,40.6047715934994,40.6047999844372,40.6048216143821,40.6048202313111,40.6048107458486,40.6048093777281,40.6048188203353,40.604807972712,40.6047930889375,40.6047727806576,40.6047659803716,40.6047483620361,40.6047334515345,40.6047320660381,40.6047184986147,40.6047130550155,40.6047130001587,40.6047237704902,40.6047399418167,40.6047561252326,40.6047817796718,40.6047993479559,40.6048209635659,40.6048358187175,40.6048547205226,40.6048465506165,40.604837053133,40.604819451405,40.6048045634805,40.6048018157097,40.6047990756043,40.6047976858966,40.6047908895701,40.6047691981216,40.6047529358538,40.6047678058289,40.6047731777677,40.6047447622267,40.6047325582067,40.6047163126713,40.6047014527735,40.6047014934643,40.6047136928613,40.6047286101908,40.6047354273893,40.6047544243111,40.6047585450656,40.6047640317594,40.6047708447758,40.6047533087622,40.6047316794965,40.6047060069712,40.604683016027,40.6046627377151,40.6046357030085,40.6046289717086,40.6046479350942,40.6046466187753,40.6046277443816,40.6046467237769,40.6046467595588,40.6046318883624,40.6046183471529,40.604600732359,40.6045858771942,40.604577811112,40.6045616159097,40.6045589522006,40.6045563124904,40.6045441715958,40.6045211728446,40.6045103239786,40.6045143200754,40.6045250807109,40.6045196186821,40.6045263183084,40.6045533160009,40.6045708413096,40.6045694366492,40.6045383075198,40.6045085327307,40.6044692945689,40.6044841466509,40.6045193058848,40.6045531034347,40.6045896189043,40.6046220447094,40.6046463775535,40.6046734182093,40.6046991175148,40.6047031517134,40.6046990625478,40.6046936255317,40.6047098332908,40.6047138531318,40.604712477093,40.6047015987446,40.6046853079312,40.6046852624609,40.6046865648207,40.6046865193293,40.6046932379029,40.6047202570019,40.6047486335684,40.6047770060113,40.6047904874194,40.6047917964106,40.6047971568067,40.6048173890579,40.6048200686588,40.6048200111019,40.6047983188055,40.6047780224818,40.6047455218719,40.6047089636479,40.6046873289229,40.6046805907428,40.604679284221,40.6046806963363,40.604683467587,40.6046916341542,40.6046916964879,40.6046755187091,40.6046660858254,40.6046444709456,40.6046350452432,40.6046215686172,40.6046040188468,40.6045878213646,40.6045648567418,40.6045432471385,40.6045162064826,40.6044945891928,40.6044635011859,40.6044364712773,40.6044189353473,40.6043986730733,40.6043757060453,40.6043527174813,40.6043324157449,40.6043040140591,40.6042675033585,40.6042459033196,40.6042242805665,40.6041945793966,40.6041716195396,40.6041418836512,40.6041161884459,40.6041201986963,40.6041214790303,40.6041106269627,40.6040822192654,40.6040376031611,40.6039983960592,40.6039700020551,40.6039416027609,40.6039037471135,40.6038699447757,40.6038442598109,40.603826698727,40.6038051023093,40.603780752713,40.6037645090664,40.6037455905665,40.6037226283293,40.6036820791777,40.6036631870023,40.6036483529174,40.6036565150704,40.6036781754287,40.603706593346,40.603733650743,40.6037674901608,40.603794554727,40.603825680991,40.603848719738,40.6038609375295,40.6038609757491,40.6038637234909,40.6038637831835,40.6038625045508,40.603853098284,40.6038639573864,40.6038532103874,40.6038343109246,40.6038167254377,40.6037910278689,40.6037667122108,40.6037505020204,40.6037477698286,40.6037463695083,40.6037666001212,40.6037868409785,40.6038029909935,40.6038137420338,40.6038123261045,40.6038054992674,40.6037919269583,40.6037648654638,40.603747287625,40.6037310636322,40.6037135211383,40.6036959666929,40.6036730096944,40.6036649305551,40.603655497566,40.6036460884513,40.6036272212287,40.6036204965732,40.6036029468726,40.6035840431599,40.6035719154288,40.6035543709887,40.6035570990884,40.6035679217353,40.6035774091184,40.6035733772565,40.6035571634689,40.6035476994309,40.6035490699583,40.6035423459264,40.6035180386189,40.6035194312535,40.6035383926838,40.6035613717019,40.6035857045544,40.603593798077,40.6036018904272,40.603614078278,40.6036303254272,40.603646546368,40.6036655197019,40.6036898937155,40.6037088855762,40.603718382941,40.6037427474064,40.6037725290522,40.6037955468128,40.6038009920354,40.6037901955714,40.603771277511,40.6037564265461,40.6037510520064,40.6037551272352,40.603771382133,40.6037930351818,40.6038106391515,40.603836331935,40.6038592919492,40.603878201009,40.6039038859931,40.6039323227622,40.6039620646226,40.6040066824359,40.6040283135885,40.6040594075737,40.6040824317514,40.6040824816441,40.6040919808096,40.6041095876331,40.6041204370401,40.6041326355215,40.604162393501,40.6041813239492,40.604193517678,40.6041935627685,40.6041922509816,40.6041868936397,40.6041720378712,40.6041463474711,40.6041165284938,40.6040854297571,40.6040597447708,40.6040476049532,40.6040476523953,40.6040611863674,40.6040760772074,40.6040761056618,40.6040666961528,40.6040694406968,40.6040829964887,40.6041046542076,40.604123614948,40.6041615037573,40.6041764206211,40.6041724122702,40.6041778963478,40.6042008682959,40.6042319185121,40.6042467672086,40.6042697457513,40.6042927579394,40.6043157440876,40.6043305927843,40.604330550165,40.6043305193787,40.6043304791132,40.6043277127619,40.604338495748,40.6043587593576,40.6043776542498,40.6043951965063,40.6044100593935,40.6044195507071,40.6044195957456,40.604426413077,40.6044345718711,40.6044481401583,40.6044670978459,40.6044765926661,40.6044793276926,40.6044982889074,40.6045104659915,40.6045212632191,40.604544239394,40.6045658686812,40.6045807618517,40.6045713219844,40.6045591898633,40.604556523468,40.6045443813701,40.6045308876473,40.6045430907395,40.6045634016778,40.6045553162757,40.6045391154204,40.604524245917,40.6045175149952,40.6045162143582,40.6045284457625,40.6045338942471,40.6045420316334,40.6045285591125,40.6045448114315,40.604554315593,40.6045746258015,40.6045922071401,40.6046111599969,40.6045922566865,40.6045665563589,40.6045449176255,40.6045503542681,40.6045679580193,40.6045896344835,40.6045964138031,40.6045950994012,40.6045870181332,40.6045775446668,40.6045694426862,40.6045654093776,40.6045573380292,40.6045424845095,40.6045194936607,40.6044992287705,40.6044803289658,40.604465485365,40.6044601170696,40.6044561013939,40.6044655983903,40.604488605709,40.6044994501159,40.6045156946176,40.6045265437217,40.6045428093902,40.6045536537779,40.6045725818527,40.6045901737634,40.6046077732296,40.6046240160346,40.6046389067107,40.60465517285,40.6046646650938,40.6046430517384,40.6046281845705,40.6046106161728,40.6046201131067,40.6046471925294,40.6046607287147,40.6046742719432,40.6046945709322,40.6047027063268,40.6047175781939,40.6047337921226,40.6047554244472,40.6047730069382,40.6047865083982,40.6048027270222,40.6048270535328,40.6048419535812,40.6048581451978,40.6048689325038,40.6048878224904,40.6049076214733,40.6048976047887,40.6048905332904,40.6048794672687,40.6048643733737,40.6048492839814,40.6048316679437,40.6048180810269,40.6048095004201,40.6048225649719,40.6048482174645,40.604859279615,40.6048662960262,40.604867266709,40.6048667228312,40.6048646731803,40.6048601076661,40.604851025855,40.6048454550252,40.6048449179496,40.6048468905548,40.6048483376542,40.6048508086122,40.60486030272,40.6048627789155,40.6048667639074,40.604874783964,40.6048807876081,40.6048832466019,40.6048801788795,40.6048690891514,40.6048545004156,40.6048489466662,40.6048600061729,40.604877599142,40.6048936754011,40.604904215468,40.6049106987833,40.6049131792959,40.6049257247579,40.6049402910264,40.6049488302719,40.6049578438503,40.6049577664827,40.6049431751035,40.6049300959619,40.60491902612,40.6049069262711,40.6049043727932,40.6048962910276,40.6048841968197,40.6048676000766,40.6048530148517]}],[{"lng":[-73.8482798266716,-73.8482718721637,-73.8482602586827,-73.8482483047522,-73.8482383446829,-73.8482247402087,-73.8482131272991,-73.8482028555244,-73.8481982370712,-73.8482035586633,-73.8482085536029,-73.8482118896505,-73.8482112486073,-73.8482036385834,-73.8481847379329,-73.8481655125313,-73.8481502625949,-73.8481349869962,-73.8481316256319,-73.84811401337,-73.8480867922365,-73.8480595834012,-73.8480386880077,-73.8480201134367,-73.8480138714441,-73.8480112526741,-73.8479928149755,-73.8479822824234,-73.8479706838099,-73.8479527718675,-73.8479380345023,-73.8479206741374,-73.8479054065746,-73.8478917456295,-73.8478733327067,-73.8478686324935,-73.8478681553013,-73.8478708143167,-73.8478566080206,-73.847848209042,-73.8478350745814,-73.8478430160846,-73.8478483290589,-73.8478404571905,-73.8478367950671,-73.8478368225598,-73.8478498917147,-73.8478871736904,-73.8479095145439,-73.8479206385968,-73.8479317881064,-73.8479560058972,-73.8479858432303,-73.8479858885216,-73.8479822179441,-73.8480064566724,-73.8480437565243,-73.848090397342,-73.8481444274427,-73.8481611536162,-73.8481778892731,-73.8482132960883,-73.8482486841882,-73.8482747345733,-73.848293331234,-73.8482951695936,-73.8482746635363,-73.8482522889623,-73.8482504771925,-73.8482561056879,-73.8482614013941,-73.8482540809805,-73.8482470929625,-73.8482394514194,-73.8482407573998,-73.8482556774889,-73.8482696145289,-73.8482838830872,-73.8482895361298,-73.8483014687651,-73.8483107409892,-73.8483146894816,-73.8483159956443,-73.8483136467761,-73.8483209367406,-73.8483312343572,-73.8483478137906,-73.84836238599,-73.848363037883,-73.8483587125805,-73.8483517258854,-73.8483454003228,-73.8483437206688,-73.8483513273472,-73.8483526374507,-73.8483496374383,-73.8483416712748,-73.8483330493695,-73.8483247465644,-73.84831644185,-73.8483111214205,-73.8483174020112,-73.8483303239516,-73.848340938388,-73.8483458988456,-73.8483485376055,-73.8483607943652,-73.8483604420459,-73.8483501468793,-73.8483368792315,-73.8483202941888,-73.8483043745216,-73.8482894456859,-73.8482798266716],"lat":[40.6054332552303,40.6054297045003,40.6054299411323,40.6054342241514,40.6054364870532,40.605437480798,40.6054374654619,40.6054311306805,40.6054197446504,40.6054139353968,40.6054061027952,40.6053982675,40.6053881515694,40.6053787850074,40.6053734500344,40.605365837906,40.6053602546133,40.6053660507123,40.6053850122627,40.6053971276596,40.6054034128986,40.6054043886414,40.6054010739235,40.6053980140674,40.605392063884,40.6053844222576,40.6053743474561,40.6053670977675,40.6053646708416,40.6053549986319,40.6053417134944,40.6053215903589,40.6053087057483,40.6052857735142,40.6052648453403,40.6052439353152,40.605222226069,40.605212581576,40.6051972862765,40.6051795877492,40.6051566562049,40.6051438023111,40.6051269250713,40.6051092265709,40.6050963579849,40.6050849703843,40.6050764627901,40.6050779329548,40.6050907505352,40.6051177602572,40.6051334044887,40.6051405406091,40.6051363174614,40.6051164259294,40.6050908467209,40.6050894574597,40.6050824021985,40.6050668348782,40.6050811151092,40.6051038700965,40.6051223631484,40.6051280926758,40.6051423487389,40.6051636948693,40.605183611512,40.6051949801316,40.6051949530628,40.605196344842,40.6052079018042,40.6052134723811,40.6052190431884,40.6052283893649,40.6052372310464,40.605242026032,40.6052508786644,40.6052554498003,40.6052552150636,40.6052544758295,40.6052486665068,40.6052537397993,40.605261844205,40.6052765166065,40.6052858741717,40.6052969980327,40.6053010539889,40.6052960095338,40.6053005833499,40.6053124881105,40.6053175465126,40.6053223458813,40.6053311875709,40.6053405350657,40.6053493832547,40.6053605200851,40.6053678554087,40.605374173336,40.605375174534,40.6053733927071,40.6053766695128,40.6053814636283,40.6053867666151,40.6053966370188,40.6054047462395,40.6054057714531,40.6054131115935,40.6054201955336,40.6054288094766,40.605437407453,40.6054419453053,40.6054399048821,40.6054383656827,40.6054355630156,40.6054345316012,40.6054332552303]}],[{"lng":[-73.8839643488208,-73.8829842701189,-73.8827177721047,-73.8830089724302,-73.8829484834167,-73.8833914527329,-73.8833636794474,-73.8833273399188,-73.8832825151611,-73.8832293050911,-73.8831678283051,-73.8830982218145,-73.8830206407398,-73.882935257965,-73.8828422637521,-73.8827967085432,-73.8827572208443,-73.8827248060163,-73.8827002893387,-73.8826842949982,-73.8826772301977,-73.8826792747909,-73.8826903767047,-73.8826905832342,-73.8826827802676,-73.8826670074141,-73.8826433447077,-73.8826119122,-73.8825728693512,-73.8825264142207,-73.882471115189,-73.8824232226051,-73.8823829994748,-73.8823506666798,-73.8823264017652,-73.8823103379651,-73.8823248610385,-73.8823311696178,-73.8823291937454,-73.8823189553614,-73.8823005680591,-73.882274235824,-73.8822402507705,-73.8821989899001,-73.8821509109196,-73.8820965471626,-73.8820705161809,-73.8820502736244,-73.8820361513215,-73.8820283807696,-73.8820270893407,-73.8820277059497,-73.882021233701,-73.8820077784767,-73.8819875603815,-73.881960910141,-73.8819282636915,-73.8818901550489,-73.8818615381839,-73.8818376295631,-73.8818190237737,-73.8818061835229,-73.8817994281313,-73.8817989255927,-73.8818046883961,-73.881816573217,-73.8818246971226,-73.8818240528805,-73.8818146582887,-73.8817967726672,-73.8817708896993,-73.8817377238035,-73.8817104309229,-73.8816918245323,-73.8816823726598,-73.8816823130491,-73.8816916471807,-73.8817101402367,-73.8817373270094,-73.8817448656585,-73.8817430419853,-73.8817318599212,-73.8817113432367,-73.8816815354908,-73.8816424999381,-73.8815943193938,-73.881537096058,-73.8814709512984,-73.8813960253925,-73.88131247723,-73.8812204839752,-73.8811202406914,-73.8810119599267,-73.8809585331711,-73.8809126560756,-73.8808745846746,-73.8808445314323,-73.8808226640584,-73.8808091045724,-73.8808039286228,-73.8808071650662,-73.8808187958065,-73.8808387558971,-73.8808669339034,-73.8808732041496,-73.8808725570637,-73.8808649934018,-73.8808505214721,-73.8808287249605,-73.8807998189794,-73.8807638362481,-73.87990713259,-73.8794161717699,-73.8794080701356,-73.8798990285193,-73.87971492228,-73.879357292059,-73.8789788125648,-73.8789689043874,-73.8789241193115,-73.8792932637739,-73.8792449540145,-73.8792343976643,-73.8790174369786,-73.8790001967278,-73.8789888589541,-73.8789683125909,-73.8789684036414,-73.8790749839099,-73.8791390116136,-73.8790539499211,-73.8790345817072,-73.8790119424827,-73.8789686363356,-73.8789167745396,-73.8788564098446,-73.8787876036347,-73.8787104258653,-73.878624954992,-73.8785312778906,-73.8784294897685,-73.8783196940677,-73.8782020023599,-73.8780765342322,-73.8780288677368,-73.8779868359684,-73.8779509878502,-73.8779217915447,-73.8778996283394,-73.8778847876681,-73.8767167248207,-73.87970231664,-73.881742900221,-73.8818672452674,-73.8817467698389,-73.8820695820365,-73.8821469414322,-73.8823234776982,-73.8825006623342,-73.8826260154997,-73.88275043256,-73.882873429436,-73.882994527575,-73.8831132558135,-73.8832291522106,-73.8833417658454,-73.8834862003407,-73.8836344632157,-73.883786289109,-73.8839414062848,-73.8840817656923,-73.8842255475285,-73.8843722932402,-73.8845215348248,-73.8846727963216,-73.8847761954207,-73.8848801795165,-73.8849844237208,-73.8851031933524,-73.8852227129886,-73.8852809657266,-73.8853379207511,-73.8853928983497,-73.8854452424102,-73.8854943282512,-73.8855340163612,-73.8855704199848,-73.8855849420712,-73.8856003567013,-73.8856162729996,-73.8856322873698,-73.8856479937286,-73.8856579878948,-73.8856692821562,-73.8856815678487,-73.885694509213,-73.8857077525705,-73.885716710413,-73.8857255282977,-73.88573148505,-73.8858387288462,-73.8859496697706,-73.8860637854403,-73.8861805385268,-73.8862993792846,-73.8864197481405,-73.8865410783272,-73.8866627985516,-73.8866828423271,-73.8867592302169,-73.8868350033763,-73.8869093620346,-73.8869815213519,-73.8870507197037,-73.8870563769344,-73.8871510359753,-73.8872485943421,-73.8873482465043,-73.8874491696449,-73.887550530454,-73.8876514920082,-73.8876939583691,-73.8877407158825,-73.8878049855753,-73.887952686218,-73.8880572736722,-73.888164174346,-73.8882728491101,-73.8883827498863,-73.8884933224126,-73.8886040090384,-73.8887142515377,-73.8888234939248,-73.8889311852584,-73.8890367824211,-73.8890806784577,-73.8891306130118,-73.8891861058064,-73.8892466231093,-73.8893115828658,-73.8893803602974,-73.8894522939102,-73.8895266918572,-73.8896406060859,-73.8897553358589,-73.8898704136244,-73.8899853704128,-73.8900997377473,-73.890213049553,-73.8903248440556,-73.891040145538,-73.8911123939552,-73.8911841376729,-73.891254246968,-73.8913216178552,-73.8913851894724,-73.8914439607867,-73.8914970063571,-73.8915434909078,-73.8915826824805,-73.8917434771594,-73.89190796869,-73.8920758292435,-73.8922467242791,-73.8924203132113,-73.8925962500876,-73.8927741842784,-73.8929537611752,-73.893141547182,-73.8933275145719,-73.893511364238,-73.8936928004812,-73.893871531486,-73.8940472697901,-73.8941849227737,-73.8943208356929,-73.8944326988065,-73.8945477207822,-73.8946654348951,-73.8947853634984,-73.8949070199614,-73.8950299106438,-73.8951535368981,-73.895277397093,-73.8954009886477,-73.8955238100717,-73.8955760501105,-73.8956359931791,-73.8957035929774,-73.8957787972805,-73.895861547979,-73.8959517811235,-73.8960494269741,-73.8961544100542,-73.8962666492086,-73.8963860576659,-73.896512543106,-73.8966009021167,-73.8966830162076,-73.8967584699579,-73.8968268816361,-73.8968879051321,-73.8969412317081,-73.896986591561,-73.8970282801124,-73.8970619681131,-73.8970875589117,-73.8971049790763,-73.8971141786061,-73.8971151310749,-73.8971078337079,-73.8970923073894,-73.897068596604,-73.8970367693095,-73.896996916742,-73.8969491531553,-73.8968936154932,-73.8968304629974,-73.8967598767511,-73.8966715360673,-73.8965897759913,-73.8965803172788,-73.8965791912631,-73.896586400284,-73.8966019297511,-73.8966257481726,-73.8966578072192,-73.8966980418215,-73.896746370302,-73.8968026945405,-73.8968669001733,-73.8969388568246,-73.8971754177963,-73.8972029246977,-73.8972227303222,-73.8972343493363,-73.8972374970105,-73.8972320961978,-73.8972295661074,-73.8972330863875,-73.8972425622543,-73.8972727819876,-73.8974158963369,-73.8975013546482,-73.8975986660776,-73.8976870239908,-73.897786513427,-73.8979133794581,-73.8980186438686,-73.8981106047904,-73.8981510735252,-73.8981615661982,-73.8981673852479,-73.8981676846788,-73.8981678478404,-73.8981701655836,-73.8981629857611,-73.8981472792676,-73.8981047157334,-73.8980416874388,-73.8980018713903,-73.8979557495133,-73.897939638628,-73.897945237437,-73.8979565525015,-73.8979731350904,-73.8980392363941,-73.8980814854005,-73.8981498835083,-73.8982056198804,-73.8982578171085,-73.8982788659783,-73.8982757927803,-73.8982555921217,-73.8982385367798,-73.8982230694567,-73.8982212440209,-73.8982451889138,-73.8982630555028,-73.8983050622705,-73.898384918464,-73.8984695708251,-73.8985455781012,-73.8985971205744,-73.8986407234685,-73.8986961284724,-73.8987673794287,-73.8988045858541,-73.8988674867638,-73.8989159990881,-73.8990514438021,-73.8990921789261,-73.8991807519471,-73.8991872325984,-73.8992778751174,-73.8992569844776,-73.8993501676845,-73.8993808723408,-73.8996584253937,-73.8997334130518,-73.8996324668466,-73.8996100738978,-73.8994427492431,-73.899329070181,-73.8993111744699,-73.8992373981271,-73.8992300152655,-73.8992171004856,-73.8992247811384,-73.8991436709467,-73.8991565072907,-73.8989937173517,-73.8990097073435,-73.8990302609673,-73.8990548218975,-73.8990827253402,-73.8991538330112,-73.8992214776953,-73.8992847804204,-73.8993429186298,-73.8993951368706,-73.8994407566099,-73.8994813255303,-73.8995278402806,-73.8995792795826,-73.8996345140303,-73.8996923308877,-73.8997514607167,-73.8998106052503,-73.8998440245824,-73.8999060446049,-73.8999481128302,-73.899943834594,-73.8999347671132,-73.8998797733796,-73.8998782784665,-73.8999434505931,-73.8999446503535,-73.8999957240049,-73.9000038525531,-73.9000093251499,-73.9000647675982,-73.9003036084704,-73.9003553033137,-73.9005586004787,-73.9011570921118,-73.9011068481534,-73.9011782660363,-73.9012179188318,-73.9012301853091,-73.9011604686851,-73.9012075237375,-73.9009528562996,-73.9009189887109,-73.9003425683552,-73.9002937300776,-73.9000311566967,-73.8999682025135,-73.8999614788038,-73.8999541071711,-73.8999523407064,-73.9000785532031,-73.9001274515845,-73.9001655069839,-73.9002356197154,-73.9002749614678,-73.9003111265336,-73.9003520358429,-73.900444627436,-73.90051186094,-73.9005746544121,-73.9006212825124,-73.9006526806752,-73.9007154604566,-73.9008115206215,-73.9008803029072,-73.9009424181542,-73.9009927926347,-73.9010190968361,-73.9010789728446,-73.9011398017573,-73.9011695777667,-73.9012129675054,-73.9012601653682,-73.9013073923898,-73.9013305222222,-73.9013450777914,-73.9013539269368,-73.9014023143955,-73.9014909399419,-73.9015571156469,-73.9016106270967,-73.9016479768182,-73.9016792907157,-73.9017286837505,-73.9017736504788,-73.9018002379086,-73.9018138314068,-73.9018271149581,-73.9018407298467,-73.9018521459141,-73.9018730830575,-73.9019197055407,-73.9019476041,-73.9019732551164,-73.9019830550829,-73.9019906415916,-73.9020128011631,-73.9020378329486,-73.9020619093533,-73.9020758233953,-73.9020786577811,-73.9020846574702,-73.9020995373636,-73.9021448686589,-73.902177863105,-73.9022121138639,-73.902244764902,-73.9022761552481,-73.9023028000531,-73.9023364362419,-73.9023995829334,-73.9024614529643,-73.9025772228277,-73.9026076716146,-73.9026381204031,-73.9027037766589,-73.9027684751242,-73.9028179371104,-73.9028559755755,-73.9028952659025,-73.9029462977435,-73.9029817937592,-73.9030185288647,-73.9030460797956,-73.9030799902785,-73.903161474745,-73.9032515308429,-73.9032851377987,-73.9032994023761,-73.9033019388543,-73.903323161168,-73.9033938411317,-73.9034299527941,-73.903451474143,-73.9034644566827,-73.9035037403845,-73.903536374457,-73.9035452392034,-73.9035528254645,-73.9035575364813,-73.9035558954109,-73.9035561578455,-73.9035637330602,-73.9035868548217,-73.9036905070496,-73.9037222048383,-73.9037910282246,-73.9038947444342,-73.904017462595,-73.9040907002982,-73.9041306310855,-73.904168962877,-73.9041842517432,-73.9041972530376,-73.9042076295559,-73.9042151121715,-73.904219506815,-73.9042241529796,-73.9042299115881,-73.9042366165583,-73.9042440745147,-73.9042520703652,-73.9042603735045,-73.904268744465,-73.9042769418231,-73.904284729162,-73.9042918818901,-73.9042981937181,-73.9043659243298,-73.9048648546071,-73.9050818841452,-73.9051553687624,-73.9052355542867,-73.9058534506534,-73.9058668692897,-73.9058791985159,-73.9058900768242,-73.905899185249,-73.9059062567194,-73.9059110838903,-73.9059135252221,-73.9058923383952,-73.9058730687806,-73.9058561907213,-73.9058421196901,-73.9058312020627,-73.9058237065908,-73.9058198177866,-73.9058340125977,-73.9058565156166,-73.9058871842592,-73.9060005422514,-73.9061160973603,-73.9062336913941,-73.9063034144778,-73.9063748543122,-73.9064469789896,-73.9065187467095,-73.9065891208277,-73.9066570848311,-73.9067216570213,-73.9067932504916,-73.9068597254094,-73.9069205571219,-73.906975265519,-73.9070234188232,-73.9070646369968,-73.9070985947413,-73.9071250240639,-73.9071052923528,-73.907078046249,-73.9070440725634,-73.9070043523793,-73.9069600327209,-73.9069123934303,-73.9068628102094,-73.9068127148941,-73.9067834938513,-73.9067526049965,-73.9067180522812,-73.9066832040299,-73.9066489438129,-73.9066147612927,-73.9065813656673,-73.9065495382909,-73.9065200238246,-73.9064935128137,-73.9064706255305,-73.9064518974621,-73.9064377667817,-73.9063451302407,-73.9063351761274,-73.9063877280191,-73.9064086337729,-73.9064146314435,-73.9064155714569,-73.906409207086,-73.9064170896789,-73.9064392422378,-73.9064737780756,-73.9066545122583,-73.9068362092547,-73.907080632566,-73.9073476580153,-73.9074667947058,-73.9076194588429,-73.9078053541995,-73.907956449617,-73.9081088503597,-73.9083002775173,-73.9084661514601,-73.9086454783863,-73.9088964953132,-73.9090018208193,-73.9091045945329,-73.9093152106272,-73.9095133439718,-73.909648502307,-73.909875942286,-73.9100261077433,-73.9102120225233,-73.9103740498896,-73.9104448855846,-73.9105854539825,-73.9106974536598,-73.9107870740807,-73.9108855417119,-73.9109756463222,-73.9110653070009,-73.911153789669,-73.9112403698915,-73.9113243388076,-73.9114050089342,-73.9114817197938,-73.9115538433217,-73.9116207890084,-73.9116820087338,-73.9117427422674,-73.9118010999149,-73.9118743668229,-73.9113941044518,-73.9110573585828,-73.9107300235754,-73.9104141071618,-73.9101115852793,-73.9098244111122,-73.9095544128517,-73.9093033056542,-73.9090726561231,-73.9088638092002,-73.908677916435,-73.9085158709206,-73.9083783478719,-73.9082657228423,-73.9081781316708,-73.9081154504348,-73.9080773021823,-73.9080655223171,-73.9080637342068,-73.908076704318,-73.9080916297229,-73.9081195215006,-73.9081233187932,-73.90817173567,-73.9082366844553,-73.9082383551573,-73.9082516232515,-73.9083515517494,-73.9084918912251,-73.908489570756,-73.9084672977055,-73.9084250129616,-73.9083859411146,-73.9083628130422,-73.9082832983576,-73.9082809116004,-73.9082423204567,-73.9081797470745,-73.9080293542757,-73.9079385640278,-73.9079021860949,-73.9078753644682,-73.9078430302393,-73.9077757111496,-73.9076386832031,-73.9074506822383,-73.9073351223029,-73.9071945075739,-73.9071633957955,-73.9070827447786,-73.9070156793696,-73.9067549321042,-73.9065787287486,-73.9064749109102,-73.9059437172881,-73.9058500735001,-73.9056255159958,-73.9053798489386,-73.9052452586827,-73.9048516225612,-73.9041527175597,-73.9040823703496,-73.9037857188094,-73.9034774716655,-73.9031660464263,-73.9029249435091,-73.9027871225686,-73.9024969040977,-73.9023353294384,-73.9021650100405,-73.9020593611875,-73.9019009310352,-73.9011817029494,-73.9010031570797,-73.900830967309,-73.9006652849595,-73.9005062556392,-73.900354019115,-73.9002087091887,-73.9000704534091,-73.8999393734697,-73.8998155845945,-73.8996991956042,-73.899590308821,-73.8994890199782,-73.8993994292007,-73.8993681083491,-73.8993360836816,-73.8992803864527,-73.8992252122329,-73.899171220101,-73.8991190550145,-73.8990693401052,-73.8990084655103,-73.8989491210036,-73.8988917007438,-73.8988203657302,-73.8987537522022,-73.8986926117351,-73.8986128148341,-73.8985350515257,-73.898461978166,-73.8984174134884,-73.8984033501416,-73.8983864289434,-73.8983585286139,-73.8983314389896,-73.8982838450096,-73.8982201544585,-73.8981440052611,-73.8981051184618,-73.8980677196643,-73.8980354941385,-73.8979921856846,-73.8979760284555,-73.8979752570613,-73.897996468627,-73.8980023015969,-73.8979926835426,-73.8979787068523,-73.8979427231993,-73.8979081506146,-73.8978912392124,-73.8978641480976,-73.8978429356587,-73.8978282103621,-73.8978106194538,-73.8977966980335,-73.8977345552366,-73.8976570536081,-73.8976248760304,-73.8976050739893,-73.8975778685248,-73.8975624328717,-73.897535281396,-73.8974729710483,-73.8973667245568,-73.8972868478249,-73.8972142894708,-73.8971380934296,-73.8970589345331,-73.8970200152946,-73.8969840541064,-73.8969649702592,-73.8969583501034,-73.8969553369189,-73.8969457807556,-73.8969112266873,-73.8968672054309,-73.8968326780509,-73.8968047621885,-73.8967834101634,-73.8967605724512,-73.8967436675014,-73.8967070195135,-73.8966557591242,-73.8966279455932,-73.8965957382097,-73.8965569596432,-73.8965247609143,-73.8964954277081,-73.896452887313,-73.896418454899,-73.8963840068308,-73.8963524997939,-73.8962997438492,-73.8962286730509,-73.896153973625,-73.896097595796,-73.8960485167858,-73.8959767609178,-73.895943789859,-73.8958887996991,-73.8958279228625,-73.8957722144074,-73.8957296834125,-73.8956885826692,-73.8956342639371,-73.8956019165725,-73.8955673971082,-73.8955668476813,-73.8955629649596,-73.8955558575107,-73.8955464387147,-73.8955345900778,-73.8955206029983,-73.8955103347084,-73.8954954866095,-73.8954797064294,-73.8954633015672,-73.8954236973983,-73.8953760021763,-73.895345890906,-73.8953142683578,-73.8952848569776,-73.8952650246873,-73.8952180457626,-73.8951820618822,-73.8951496603619,-73.8951268215851,-73.8950959230208,-73.8950738799213,-73.8950467869095,-73.8950057128691,-73.8949236556173,-73.8948936126881,-73.8948188196054,-73.8947579717483,-73.8946979055401,-73.8945843896477,-73.8945177115197,-73.8944583586357,-73.8943755611032,-73.8942941661011,-73.8942244893592,-73.8941767560961,-73.8941554581835,-73.8941399938218,-73.8941274324923,-73.8941222068201,-73.8941141181562,-73.8940965258196,-73.8940760005558,-73.8940598744885,-73.8940363496209,-73.8940171529388,-73.8939912393427,-73.8939432384447,-73.8939048241924,-73.8938650001912,-73.8938200619863,-73.8937987117157,-73.8937700707645,-73.8937238396175,-73.8936973490574,-73.8936811367864,-73.8936428932998,-73.8936017315435,-73.893548150911,-73.8934946297192,-73.8934520922646,-73.893392801617,-73.893254313094,-73.8931422055962,-73.8930630839991,-73.8929971236467,-73.8929502605763,-73.8929157589905,-73.8928702734461,-73.8928343142885,-73.8927998487487,-73.8927550496876,-73.8926999739365,-73.892658875175,-73.8925899440884,-73.8925304760885,-73.8924886299564,-73.8924489158513,-73.8924040303642,-73.8923775232679,-73.8923400196565,-73.8923128376763,-73.8922776007898,-73.892198960071,-73.8921401604878,-73.8921077970024,-73.8920783780655,-73.8920475255277,-73.8920152641861,-73.891987426908,-73.8919716708278,-73.8919559136525,-73.8919119249328,-73.8918575643211,-73.891700439316,-73.8916431885735,-73.8916218671038,-73.8916056551348,-73.8916150924256,-73.891613604325,-73.8915848238888,-73.8915450783049,-73.8915230100287,-73.8914936581666,-73.8914746219644,-73.8914629405609,-73.8914409837896,-73.8914219046024,-73.8914136980484,-73.8914060748848,-73.8914087758175,-73.8913990572881,-73.8913827322693,-73.8913613018037,-73.8913332981943,-73.8912876095741,-73.8912559306291,-73.891213094539,-73.8911917408703,-73.8911621942134,-73.8911283293021,-73.891097396986,-73.8910686445046,-73.8910391407796,-73.8909964726522,-73.8909523587324,-73.8909163207241,-73.8908773454784,-73.8908339627541,-73.8907788298748,-73.8907383677684,-73.8906809126038,-73.8906323596562,-73.890562539061,-73.8905184331187,-73.8904949553484,-73.8904354935565,-73.8903854994786,-73.8903532135763,-73.89032017498,-73.8902673144349,-73.8902239503097,-73.890178348341,-73.8901283297816,-73.8900820179362,-73.8900489312225,-73.8900172432815,-73.8899841012015,-73.8899473140705,-73.8899010187877,-73.8898613590805,-73.8898121376361,-73.8897614571676,-73.889723181519,-73.8896753693208,-73.8896260040511,-73.8895988352197,-73.8895524850827,-73.8895194210865,-73.8894812253259,-73.8894481990802,-73.88942609818,-73.8893336275283,-73.889289948624,-73.8892713976391,-73.8892516881721,-73.889236021238,-73.8892210620355,-73.8892028002872,-73.8891903128421,-73.8891732126461,-73.8891503774275,-73.889140442438,-73.889133473995,-73.8891256253062,-73.8891232175619,-73.8891262483452,-73.8891321104866,-73.8891356183016,-73.8891349765639,-73.8891263709695,-73.8891127754756,-73.889090484529,-73.8890651864,-73.8890396903985,-73.8890137846694,-73.88899071977,-73.8889594931125,-73.8889244351975,-73.8888864888115,-73.8888614206187,-73.8888494645925,-73.8886795095474,-73.8885914427993,-73.8885472345815,-73.8885115257172,-73.8884894081118,-73.8884844824965,-73.8884836209356,-73.888459121027,-73.8884326548828,-73.888404502716,-73.8883751886896,-73.8883533394815,-73.8883208878745,-73.8882927195918,-73.8882692453559,-73.8882360605332,-73.8882155103837,-73.8881834584229,-73.8881521230907,-73.8881103647194,-73.8880703323683,-73.8879305241406,-73.8878798405584,-73.887818727514,-73.887756553346,-73.8876710517827,-73.887560240179,-73.8874464004964,-73.8873544086022,-73.8872498944192,-73.8871849417828,-73.8871276649822,-73.8870766100737,-73.8870001814188,-73.8869428778269,-73.8869049786911,-73.8868513336513,-73.886781074413,-73.8866878228549,-73.8865709264015,-73.8864896341742,-73.8864109717101,-73.8863218423448,-73.8862436712601,-73.8861755963654,-73.8861027051433,-73.8860240840583,-73.8859030503283,-73.88578924254,-73.8856928097833,-73.8856148781966,-73.8855174089141,-73.8852542063051,-73.885131511313,-73.8850450799092,-73.8849520098465,-73.8849109355787,-73.884866983496,-73.8848214443571,-73.8847756555268,-73.8847309617026,-73.8846886754255,-73.8846500385348,-73.8846161856995,-73.8845881110961,-73.8845666392124,-73.8845524006336,-73.8845541665854,-73.8845533643147,-73.8845500181196,-73.8845442293499,-73.8845361733371,-73.8845260940843,-73.8845142968759,-73.8845011390305,-73.8839643488208],"lat":[40.6055491404265,40.6046133535887,40.6041788371794,40.6037431545846,40.6034572083902,40.6030163225246,40.6028774580949,40.6027397472487,40.6026034967941,40.6024690102839,40.6023365873388,40.6022065229806,40.6020791069749,40.6019546231851,40.601833348941,40.6018070520703,40.6017755672524,40.6017396961015,40.6017003519081,40.6016585363854,40.6016153141657,40.601571785694,40.6015290592101,40.6014432916179,40.6013577303389,40.6012728093615,40.6011889594246,40.6011066058333,40.6010261663009,40.6009480488311,40.600873384283,40.6007958032679,40.6007157318704,40.600633609851,40.6005498882309,40.6004650268146,40.6004060797808,40.6003462954194,40.6002863369047,40.6002268693414,40.6001685523863,40.6001120329309,40.6000579379263,40.6000068674285,40.5999593879422,40.5999160261376,40.5998827684347,40.599847248139,40.5998100475379,40.5997717764627,40.5997330622926,40.5996907581445,40.599648740002,40.5996076951721,40.59956829504,40.5995311840866,40.599496969347,40.5994662104811,40.5994451079259,40.599420838639,40.5993940061828,40.5993652778626,40.5993353681324,40.5993050208258,40.5992749906575,40.5992460244544,40.5992061732341,40.5991658467783,40.5991261581601,40.5990882028452,40.5990530284559,40.5990216058552,40.5989813825657,40.5989383760653,40.5988936681859,40.5988483835552,40.598803661307,40.5987606264261,40.5987203614494,40.5985654616535,40.5984104615424,40.5982556897143,40.5981014742813,40.5979481421734,40.597796018446,40.5976454255906,40.5974966828509,40.5973501055469,40.5972060044056,40.5970646849031,40.5969264466168,40.5967915825905,40.5966603787134,40.5965848181106,40.5965064279709,40.5964256458255,40.5963429225549,40.5962587198721,40.5961735077455,40.5960877617762,40.5960019605425,40.5959165829296,40.5958321054567,40.5957489996169,40.5955894844964,40.5954298985448,40.5952704160127,40.5951112110367,40.5949497022151,40.5947888431418,40.5946288156127,40.5920479943225,40.5921320057981,40.5921034068923,40.5920206388521,40.591398891829,40.5908437352975,40.5908954193611,40.5908967731176,40.5907127802815,40.5906614313681,40.5904450478227,40.5902664094559,40.5900482026224,40.5900308620909,40.5899846661329,40.5899009350483,40.5897304181304,40.5896005348511,40.5893732002313,40.5890971005664,40.5889701772099,40.5888435688353,40.5886383506143,40.5884342886112,40.5882315900753,40.588030460869,40.5878311052592,40.5876337257095,40.5874385226751,40.5872456943989,40.5870554367105,40.586867942827,40.5866834031574,40.5866478317783,40.5866083465593,40.5865654631764,40.5865197416844,40.5864717792025,40.5864222021157,40.5849144302008,40.5801351006982,40.5795917007647,40.5794546257877,40.5791588072125,40.5790739786966,40.5791899713202,40.5791770985792,40.5791714086437,40.5791629429174,40.5791485349099,40.5791282406798,40.5791021391874,40.5790703319878,40.5790329428356,40.5789901172032,40.5789187718126,40.5788521482215,40.5787903656683,40.5787335347266,40.5786842847773,40.5786411547278,40.5786042821277,40.5785737845704,40.5785497593181,40.5785395720489,40.5785338058026,40.5785324785953,40.5785204865193,40.5785141691985,40.57850752798,40.5784960814902,40.578479966334,40.5784593748329,40.5784345527298,40.5784096825106,40.5783820451842,40.5783768735025,40.578373525005,40.5783720846012,40.5783725888159,40.5783750248635,40.5783816737884,40.5783869764222,40.5783907878476,40.5783930039009,40.578393564019,40.578392993206,40.5783916619795,40.5783890060262,40.5783450932652,40.5783068916474,40.5782745810493,40.5782483136083,40.5782282130073,40.5782143738915,40.5782068614236,40.5782057109766,40.5782062901299,40.5782047176417,40.5781971776276,40.5781837496709,40.578164575501,40.5781398574973,40.5781379631056,40.5781103268488,40.5780893563045,40.5780752246241,40.5780680484913,40.5780678871585,40.5780747419577,40.5780632388446,40.5780566662851,40.5780592768581,40.5780652744897,40.5780929594608,40.5781149150511,40.5781310305321,40.5781412246286,40.5781454459289,40.5781436731436,40.5781359152134,40.5781222112639,40.5781026304082,40.5780772713982,40.5780286237732,40.5779834885436,40.5779422998152,40.5779054537359,40.5778733046862,40.5778461618705,40.5778242863439,40.5778078885011,40.5777953687673,40.5777884165139,40.5777870600731,40.5777913049727,40.5778011339138,40.5778165068409,40.5778373611056,40.5778782334368,40.5778786239087,40.5778721122379,40.5778588009614,40.5778388996872,40.5778127217934,40.5777806794934,40.5777432773443,40.577701104302,40.5776548244462,40.5775889286761,40.5775285705682,40.5774738704117,40.57742493722,40.5773818685126,40.577344750122,40.5773136560216,40.5772886481792,40.5772569379007,40.57721951207,40.5771764308825,40.5771277636301,40.5770735885887,40.5770139928929,40.5769659432039,40.5769150953068,40.5768745461237,40.5768395097289,40.5768101282885,40.5767865210221,40.57676878372,40.5767569883539,40.5767511827852,40.576751390571,40.5767576108679,40.5767698184364,40.5769815605073,40.5771921129026,40.5774013127364,40.5776089981674,40.5778150085246,40.5780191844313,40.5782213679284,40.5784214025971,40.5786191336793,40.5788144081981,40.5790070750756,40.5790716658354,40.5791408819626,40.5792143733045,40.5792917680799,40.5793726747594,40.5794566840457,40.5795433709446,40.5796564705866,40.5797711096266,40.5798869593038,40.5800036873836,40.5801209591106,40.5802384381685,40.5803557876448,40.5804726709968,40.5805887530168,40.5807037007934,40.5808171846667,40.5809288791731,40.5810384639795,40.5811456248015,40.5812500543053,40.5816617288246,40.5820741929313,40.5822150294348,40.5823560478376,40.5824969617008,40.5826374847961,40.5827773316869,40.5829162183087,40.5830538625455,40.5831899848033,40.583324308578,40.5834565610171,40.5835864734739,40.5840183409592,40.5840543183586,40.5840931277096,40.5841338180224,40.5841753922142,40.5842168315415,40.5842265525234,40.5842462182749,40.5842700274991,40.5843208070826,40.5844827806778,40.58460850139,40.5847313631564,40.5848185674274,40.5849057166989,40.5850478785829,40.5851471418133,40.5852718621547,40.5853307263484,40.5853504905583,40.585371068504,40.5853791900962,40.585393527414,40.5854257326557,40.5854526434219,40.5854805469479,40.5855317958473,40.5856075091635,40.5856678397225,40.5857937395585,40.5858806718751,40.5859580721156,40.585999506676,40.586041800648,40.5861593500898,40.5862187390769,40.5863082742018,40.586400070773,40.5864730129292,40.5865184377471,40.5865571291395,40.5865953605759,40.5866227083947,40.5866512609817,40.5866819715362,40.5867435921549,40.5867853953524,40.5868411850035,40.5869397155655,40.5870527473032,40.5871341159832,40.5871983547487,40.5872577698476,40.5873440055766,40.5874253814731,40.5874642542751,40.5875050216571,40.5875374360611,40.5874541779086,40.5874838905266,40.5874241627775,40.5874304086007,40.5873757434895,40.587355611254,40.5872994162563,40.5872750572264,40.5870971995505,40.5871652121099,40.5872307675447,40.5872453103121,40.5873518248062,40.5874245283683,40.5874081887856,40.5874551519734,40.5874484108149,40.5874566317174,40.5874636436979,40.5875152758048,40.5875269953694,40.5876279466869,40.5876501718665,40.5876700975149,40.5876871843001,40.58770096973,40.5877210729975,40.5877472150467,40.5877790561907,40.5878161826885,40.5878581121211,40.5879042996593,40.5879372726878,40.5879653135326,40.5879878065249,40.5880042578046,40.5880143061642,40.5880177309799,40.5880144570555,40.5879791572474,40.5877940892483,40.5878052104726,40.5878140971997,40.5878118351948,40.5879669240749,40.5879711383156,40.5879834165257,40.5879799508837,40.5878325116411,40.5878341481068,40.5878183488119,40.5878295107814,40.5877325654262,40.5878065854063,40.5877277233154,40.587495511166,40.5874202450345,40.5873987256718,40.5873833400232,40.5874017154811,40.5874287654813,40.5874992545933,40.5875980606626,40.5876112004503,40.5878348359082,40.587761674812,40.5878697472449,40.588017148183,40.5880163990012,40.5880366897796,40.5880415986969,40.588060692121,40.5880843959886,40.588083130204,40.5880910045061,40.5880962635659,40.5881003200103,40.5880983248713,40.5880911737247,40.5880901054902,40.5880885596013,40.5880911487319,40.5880903766007,40.5880839953884,40.5880691022248,40.5880535238795,40.5880348123061,40.5880146687608,40.5880071333325,40.5879809303528,40.5879556921261,40.5879416236569,40.5879188297224,40.5878962729152,40.5878845953077,40.5878758565656,40.587863261636,40.5878509159478,40.5877986179319,40.5877295738134,40.5876876449705,40.5876541976483,40.5876248843298,40.5875926794697,40.5875606882521,40.5875342650912,40.5875141569765,40.5874969690155,40.5874826844083,40.5874739582069,40.5874734579993,40.5874753604204,40.5874755314024,40.5874716202817,40.5874565908205,40.5874440033121,40.5874348037055,40.5874190542313,40.5874098277826,40.5873996365497,40.5873843829582,40.5873763995803,40.5873659937433,40.5873565411764,40.5873477679102,40.5873518281036,40.5873515344288,40.5873451992762,40.5873420074023,40.5873436599546,40.5873503786703,40.5873628553044,40.5873724328958,40.5873758835447,40.5873765627224,40.5873772412219,40.5873798005644,40.587378976472,40.5873735819864,40.5873662706668,40.5873521868422,40.5873407463177,40.5873312616274,40.5873101703594,40.587294653579,40.5872851725463,40.5872756185262,40.5872699193149,40.587265757361,40.587263317741,40.5872630717645,40.5872524019143,40.5872351262527,40.5872186301642,40.5872014300764,40.5871936726442,40.5871771709885,40.5871647896521,40.587158490113,40.5871492904031,40.5871311495783,40.5871106000442,40.587089563592,40.5870755286372,40.5870643706438,40.5870426929832,40.5870366001997,40.5870367364188,40.5870392374824,40.5870320367818,40.5870229779695,40.5870115534519,40.5869952950324,40.5869853724183,40.5869737074432,40.5869606026537,40.5869463979391,40.5869314617168,40.5869261478253,40.5869215099281,40.586917681785,40.5869147738021,40.5869128698473,40.5869120248318,40.5869122631265,40.5869135778587,40.5869159311108,40.5869192550135,40.5869234537035,40.5869601620216,40.5870746694541,40.587207329551,40.5872328669365,40.5872456717007,40.5874882114337,40.5874922004707,40.5874978763043,40.5875050725124,40.5875135780934,40.5875231436535,40.5875334887186,40.5875443099586,40.5875523836285,40.5875628843007,40.58757555349,40.5875900793308,40.5876061042538,40.5876232337879,40.5876410462704,40.5877211030713,40.5878000453854,40.5878773729144,40.5879242488569,40.5879678957819,40.5880082539363,40.5880223632586,40.5880299939314,40.5880310357338,40.5880254736178,40.5880133879247,40.5879949532257,40.5879704357993,40.5879288961179,40.5878826762478,40.5878321409869,40.5877776891921,40.5877197506311,40.5876587825903,40.5875952662651,40.5875297029624,40.5874945864312,40.5874625239756,40.5874344414808,40.5874111498995,40.587393321834,40.5873814721134,40.5873759429272,40.5873768939441,40.5873872049962,40.5873941368963,40.5873976602648,40.5873969578284,40.587392047397,40.5873901128374,40.5873842265,40.587374526107,40.5873612386175,40.5873446749175,40.5873252225458,40.5873033366266,40.5872795292213,40.5871828889462,40.5871319262508,40.5871018794503,40.5870916919275,40.5870812856957,40.587077415191,40.5870689631728,40.5870520248279,40.5870338563748,40.5870209889124,40.5870049909031,40.5869935860422,40.586956451872,40.5869177083639,40.586900732785,40.5868814098164,40.5868541407555,40.5868287280606,40.5867965053016,40.5867451575068,40.5866973941053,40.5866389566361,40.5865373841483,40.586499227676,40.5864620241739,40.5863876833828,40.5863213352572,40.5862801121042,40.5862238168853,40.5861804459387,40.586133765551,40.5860947747644,40.5860777294287,40.5860391953896,40.5860024586827,40.5859753541887,40.5859476450045,40.5859482782124,40.5859551182023,40.5859681089731,40.5859871441654,40.5860120679324,40.5860426762151,40.5860787184137,40.5861198994384,40.5861658821257,40.5862162899985,40.586263888099,40.5863131835063,40.5863656846476,40.5866198896791,40.5867997352066,40.5869961892243,40.5872088873254,40.5874372865109,40.5876806472683,40.5879380792242,40.588208476483,40.5884906201229,40.5887831268698,40.5890845033947,40.5893931542987,40.5897074315636,40.5900256519061,40.5903461214503,40.5906671631846,40.5909871660531,40.5912503951971,40.5913053973443,40.5916232749262,40.5918853203784,40.5921156518264,40.592146975816,40.5924072924776,40.592665353465,40.5926706050014,40.5927122640616,40.5931418129814,40.5940657889468,40.5943617534459,40.5946582059737,40.5949539854935,40.5951386420114,40.5952479116488,40.5955303424915,40.5955388143861,40.5956482055085,40.5958255678822,40.5961806050299,40.5963784851089,40.5964577740419,40.5965117752097,40.5965549837345,40.596660945946,40.5968897933079,40.5971330378058,40.5972752448865,40.5974482849823,40.5974865679341,40.5975857941684,40.5976683271628,40.5979142106879,40.5980803579686,40.5981782684278,40.5985768292878,40.5986470931164,40.5987839495326,40.59893526048,40.5990119106525,40.5992166619952,40.5995378517975,40.5995702245892,40.5997067538537,40.5998486122727,40.5999919367527,40.6001094747396,40.6001766530602,40.60034986915,40.6004421878207,40.6005394997349,40.6006172967681,40.6007224257862,40.6013647913002,40.6015262472569,40.6016916656375,40.6018609011165,40.6020338050139,40.6022102254256,40.6023900073572,40.6025729927906,40.6027590210335,40.6029479286463,40.6031395496582,40.6033337157131,40.6035302562173,40.6035472959639,40.6035552751271,40.6035614206718,40.6035600912944,40.6035541370807,40.6035436291561,40.6035286930421,40.6035095071567,40.6034970779004,40.6034809117837,40.6034611161803,40.6034300811767,40.6033934541995,40.6033516485015,40.6032947729184,40.6032362839332,40.6032149833965,40.603295122316,40.6033107195852,40.6033224057023,40.6033228465948,40.6033165974167,40.6032996303323,40.6032792563407,40.6032554985751,40.6032558971681,40.6032512923004,40.6032472513904,40.6032487428359,40.6032509387067,40.6032576276303,40.6032672301334,40.6032750810376,40.6032839843844,40.6032884064762,40.6032955461181,40.6033116312185,40.6033121124163,40.6033058631267,40.6032962611009,40.6033017990911,40.6033006229767,40.6032966416634,40.6032656618354,40.6032245279229,40.6032093100624,40.60320868027,40.603216408442,40.6032230623472,40.6032223871251,40.6032137574113,40.6031965881724,40.6031811833686,40.6031685961946,40.6031560117501,40.6031422634563,40.6031454910537,40.6031470289094,40.6031480570168,40.6031552967195,40.6031653625229,40.6031686921413,40.603176373024,40.6031790074631,40.6031839165754,40.6031927308563,40.6032027367971,40.6032177456641,40.6032210286247,40.6032180801824,40.6032039175875,40.6031931824324,40.60318076568,40.6031643871373,40.6031547711259,40.6031518412637,40.6031466415369,40.6031431751555,40.6031340769205,40.6031317215299,40.6031197910941,40.6031021707222,40.6030873576651,40.6030670006629,40.6030550647242,40.6030329847868,40.6030300591974,40.6030242497422,40.6030189921273,40.6030114966215,40.603009096886,40.6030100702933,40.6030171217052,40.603024255205,40.6030319641953,40.6030472458935,40.6030622441558,40.6030765395966,40.6030889501315,40.6031000857108,40.6031096724719,40.6031150495358,40.6031209436787,40.6031252047375,40.6031277497066,40.6031264615634,40.6031290723198,40.6031300874388,40.6031417081173,40.6031527818086,40.6031549255339,40.6031592222214,40.6031663621718,40.6031818702798,40.6031969074691,40.6032129868678,40.6032157043401,40.603209455557,40.6032048248927,40.6031871623485,40.6031853748153,40.6031789352546,40.603170874001,40.6031588972685,40.6031277017949,40.6031117871604,40.603101495631,40.6030877500208,40.6030801467591,40.6030799008836,40.60308251228,40.6030840852002,40.6030935388704,40.6031097062653,40.6031203166044,40.6031241864485,40.6031230109369,40.6031178942754,40.6031172893739,40.6031278114723,40.6031456168688,40.603176294707,40.6032236365604,40.6032648504814,40.6032971480209,40.60332324911,40.6033332258507,40.603337580605,40.603340761461,40.6033501752222,40.6033607435481,40.6033796044526,40.6033861500838,40.6033892833553,40.6033868429603,40.6033816427957,40.6033657767424,40.6033361575299,40.6033139049842,40.6033001809448,40.6032859531152,40.6032762428718,40.6032755469797,40.6032776109347,40.6032791479966,40.6032784527734,40.6032850022476,40.6032903663902,40.6032913380459,40.603289946814,40.6032936313109,40.6032957199617,40.6033112095786,40.6033289352111,40.6033467219302,40.6033616650887,40.6033638185077,40.6033698130192,40.603385727768,40.6034022720643,40.6034178096737,40.603426082287,40.6034309835286,40.6034269693766,40.6034218049298,40.6034192270915,40.6034166475748,40.6034164782207,40.6034235569587,40.6034413808685,40.6034473199285,40.6034544945338,40.6034650647453,40.6034757114152,40.6034807451022,40.6035046799942,40.6035229695198,40.6035312896368,40.6035367602377,40.6035266107675,40.6035193105407,40.6035108227094,40.6035146798043,40.6035325258061,40.6035772401901,40.603609134607,40.6036376169485,40.6036649352514,40.6036889189155,40.6037089354679,40.603736151942,40.6037561464032,40.6037984795288,40.6038084552795,40.6038419100244,40.6038568754989,40.603875754544,40.6038968875743,40.6039163651993,40.6039363173392,40.6039473243777,40.6039628372236,40.603974438143,40.6039927333505,40.6040065004534,40.6040231053501,40.6040541953981,40.6040746995098,40.6040940026061,40.604107811914,40.6041071571243,40.6041136424694,40.6041279719871,40.6041295332201,40.6041294050313,40.6041370235579,40.6041469156232,40.6041629548606,40.6041828885974,40.6042000443701,40.6042110946108,40.6042283152757,40.6042477392241,40.6042643671285,40.6042731495673,40.604280262887,40.60428790446,40.6042977771066,40.6043194101216,40.6043360240092,40.6043632165244,40.6043709423406,40.6043880971931,40.6043935451267,40.6044012284842,40.6044067027357,40.6044177968695,40.6044688851891,40.604490238779,40.6044954365944,40.6045025518348,40.6045064327959,40.604507424056,40.6045087914164,40.6045090944999,40.6045085477818,40.6045106924149,40.6045118784882,40.6045148882971,40.6045261904542,40.6045386270068,40.6045521991253,40.6045730289944,40.6045976904977,40.6046123257317,40.6046366604274,40.6046607741956,40.6046857577593,40.6047088862132,40.604727271049,40.6047463135382,40.6047624087438,40.6047834591119,40.6048024000946,40.6048210593379,40.604830238986,40.6048330578297,40.6048834218202,40.6049102931066,40.6049291036453,40.6049423286123,40.6049619089081,40.6049734629731,40.6049731498627,40.6049848440851,40.604989597167,40.604993750694,40.6049998491048,40.60500545368,40.6050167010543,40.6050310009436,40.6050477543312,40.605082184663,40.6050991901664,40.6051199557263,40.605127687031,40.6051356611497,40.6051442314952,40.6052091315933,40.6052334950169,40.6052565306218,40.6052745071166,40.6052920841757,40.6053124991517,40.6053193128789,40.6053205507583,40.6053220615826,40.605322663271,40.6053173385774,40.6053118911386,40.6052959005803,40.605280458513,40.6052702176933,40.6052622856607,40.6052547490244,40.6052461553541,40.6052292467528,40.6052178371663,40.6052089102234,40.605198625102,40.6051922407861,40.6051878157859,40.6051777946857,40.6051704381051,40.6051637684612,40.6051518571809,40.6051468409809,40.6051451993943,40.6051452725575,40.6051565975756,40.605161074696,40.6051666189365,40.6051691054252,40.6051535668371,40.6051436014443,40.6051395019043,40.6051413886097,40.6051492061532,40.6051627249538,40.6051815479997,40.6052051225068,40.6052327561521,40.6052636374053,40.6052968593609,40.6053080317295,40.6053192682543,40.6053302285989,40.6053405807921,40.6053500112821,40.6053582344344,40.6053650011822,40.6053701065715,40.6055491404265]}],[{"lng":[-73.8484034118661,-73.8484131500268,-73.8484262837322,-73.8484330821445,-73.8484259019775,-73.8484157365848,-73.8484060211331,-73.8484051902475,-73.8483924918398,-73.8483819051446,-73.848371308852,-73.8483594451332,-73.8483454805448,-73.8483395678844,-73.8483387385431,-73.8483264826161,-73.8483231128636,-73.8483231253228,-73.8483231429106,-73.8483176458388,-73.8483117128806,-73.8483053629485,-73.8482994511732,-73.8482948083594,-73.848290157629,-73.8482825387345,-73.8482762005317,-73.8482711329021,-73.8482686086166,-73.8482736989728,-73.8482741362553,-73.8482652687855,-73.8482563857757,-73.8482530217519,-73.8482543062556,-73.8482560091973,-73.8482611001367,-73.8482691516145,-73.8482763471484,-73.8482907374081,-73.8482949520254,-73.8483080646053,-73.8483249930785,-73.8483389576446,-73.8483520684691,-73.8483605221202,-73.8483762014912,-73.8483872070535,-73.8483914139195,-73.8483926566552,-73.8483981307998,-73.8484074324081,-73.8484192668879,-73.8484213682738,-73.8484099413263,-73.8484002009792,-73.8484073701504,-73.8484213338531,-73.8484433389234,-73.8484682910698,-73.8484767557203,-73.8484771922503,-73.8484789040391,-73.8484869567561,-73.8484954273324,-73.8485009478325,-73.848506474846,-73.8485094578617,-73.8485099097609,-73.8485052650292,-73.8485018966512,-73.8485065597554,-73.8485150191269,-73.8485285588769,-73.848537455802,-73.8485526997199,-73.8485721825798,-73.84859333756,-73.8485966877315,-73.8485945393642,-73.8485856197625,-73.8485771309724,-73.8485576474377,-73.8485508563739,-73.84854152848,-73.848549123517,-73.8485605447648,-73.8485694408181,-73.8485741070701,-73.8485804429549,-73.8485795718838,-73.8485795477421,-73.8485816462204,-73.8485820391375,-73.8485926016859,-73.848607845637,-73.8486243718564,-73.8486370791157,-73.8486514789113,-73.8486663152886,-73.8486781895082,-73.8486739673811,-73.8486718665557,-73.8486794871328,-73.8486917613049,-73.8487031787565,-73.8487175485699,-73.8487196444303,-73.8486959095209,-73.8486696290718,-73.8486353059841,-73.8485908359231,-73.8485434084378,-73.8485095489073,-73.8484748441327,-73.8484376163717,-73.8484075994048,-73.8483970384852,-73.8483978993318,-73.8484034118661],"lat":[40.6059208288698,40.6059192289095,40.6059131170043,40.6059018355009,40.6058953746465,40.6058985870164,40.6058901871836,40.6058834118733,40.6058833951238,40.6058862846086,40.6058927220152,40.6058981904344,40.6058975270213,40.6058917123191,40.6058839698638,40.6058762116597,40.6058687880106,40.6058633039557,40.6058555624504,40.6058539423913,40.6058571608403,40.6058574741158,40.6058516599153,40.605845847557,40.6058439062874,40.6058442190593,40.6058393716089,40.605834203509,40.6058274266323,40.6058225942687,40.6058164656193,40.6058074219061,40.6058048295573,40.6057954707827,40.6057890205906,40.6057848299158,40.6057793530683,40.6057751696021,40.6057748562721,40.6057748752678,40.6057826228621,40.6057861886071,40.6057868566063,40.6057875195194,40.6057920530737,40.6057969028085,40.6057885364753,40.6057879065085,40.6057988791953,40.6058108162915,40.6058234034542,40.6058276098188,40.6058347218006,40.6058414987864,40.6058411608867,40.6058437286605,40.6058550285856,40.6058566593042,40.6058579789688,40.6058667210468,40.6058667322065,40.6058609270545,40.6058525422923,40.6058477138247,40.6058448220433,40.6058370879593,40.6058258047755,40.6058170988596,40.6058045190106,40.6057993514785,40.6057916056776,40.605788385545,40.6057913001451,40.6057926086357,40.6057890712526,40.6057855434051,40.6057794400168,40.605783016325,40.6057985041304,40.6058130180484,40.6058265540566,40.6058371883544,40.60584329124,40.6058523142982,40.6058593983796,40.6058694088814,40.6058726495398,40.6058691128233,40.6058646027166,40.6058700951353,40.6058807394689,40.6058913837455,40.6058994507,40.60591267732,40.605920433266,40.6059178720553,40.6059088618161,40.6059046856287,40.6059005104959,40.6058902085525,40.6058799015345,40.6058750568921,40.6058686027406,40.6058676449573,40.6058676611167,40.605872191899,40.6058812433235,40.6058902787588,40.6059044402618,40.6059221475163,40.6059398441731,40.6059530105282,40.6059635935204,40.6059635488963,40.6059628581601,40.6059553898721,40.6059405118808,40.6059314659444,40.6059253373507,40.6059208288698]}],[{"lng":[-73.8344626562024,-73.8357358758743,-73.8353261263945,-73.8352806039376,-73.8352289225224,-73.8351715156978,-73.8351088650465,-73.835041496146,-73.8349699741583,-73.8348948990896,-73.8348418007878,-73.8347926693088,-73.8347477716751,-73.8347073519011,-73.8346993643827,-73.8346942198566,-73.8346920509738,-73.8346929136598,-73.8346967856725,-73.8347035671757,-73.834713083313,-73.8347250887163,-73.8347215084134,-73.8347097744037,-73.8346901791851,-73.8346632112262,-73.8346295427904,-73.834590013178,-73.834543866253,-73.8345026377908,-73.8344666903548,-73.8344363400704,-73.8344189255579,-73.8343979707374,-73.8343738656812,-73.8344626562024],"lat":[40.6071925329424,40.6057931884524,40.6068523629794,40.6069052561388,40.6069547530282,40.6070004384121,40.607041929029,40.6070788768076,40.6071109717864,40.6071379447147,40.6071774900413,40.60721990923,40.6072649717453,40.6073124326853,40.6073254797023,40.6073393328753,40.6073536350073,40.6073680173247,40.6073821089862,40.6073955466448,40.6074079838162,40.6074190998133,40.6074587976576,40.607497571218,40.6075344539261,40.6075685263484,40.6075989391063,40.6076249340506,40.6076633008569,40.6077047934304,40.6077490468947,40.6077956720936,40.6078164017912,40.6078351319547,40.6078515139207,40.6071925329424]}],[{"lng":[-73.8670239947516,-73.8687431755927,-73.8686846882675,-73.8677750156114,-73.8670239947516],"lat":[40.6080681787694,40.6070351787767,40.6082411581839,40.6085394887784,40.6080681787694]}],[{"lng":[-73.869664429585,-73.8710933076808,-73.8710565664624,-73.8724557981188,-73.8726895931165,-73.8730012272477,-73.8718008286799,-73.8710387011171,-73.8707600854119,-73.869664429585],"lat":[40.606540123413,40.6046941739947,40.6062850879917,40.6081855303486,40.6091779983085,40.6105554584599,40.6102804135803,40.6097235825266,40.6087054014107,40.606540123413]}],[{"lng":[-73.8504762496644,-73.8504313879888,-73.8504074823758,-73.8503776011776,-73.8503517080591,-73.850308843368,-73.8502769361343,-73.8502480221231,-73.8502260932382,-73.8501921671292,-73.8501622433868,-73.8501203209173,-73.8500953606183,-73.8500843953352,-73.8500784419716,-73.8500635029703,-73.8500465681375,-73.8500146552023,-73.8499777474387,-73.8499518083619,-73.8499218692795,-73.8498959113982,-73.8498609849744,-73.8498330412887,-73.8498110874924,-73.8497901306267,-73.8497811723654,-73.8497592367392,-73.8497223279605,-73.8496894052922,-73.8496714508654,-73.8496674290618,-73.8497064526076,-73.8497344168082,-73.8498123154017,-73.8498372951397,-73.8498522963,-73.8498643405598,-73.849861393756,-73.8498454659876,-73.8498455001991,-73.8498385589291,-73.8498126148171,-73.8497916679005,-73.8497737460417,-73.8497548413992,-73.8497406347882,-73.8497301583424,-73.8497116739341,-73.8497024248075,-73.8496952753329,-73.8496860350998,-73.8496738455767,-73.8496681476015,-73.8496608061005,-73.8496469397301,-73.8496410705243,-73.849635191141,-73.8496360520317,-73.8496457476271,-73.8496562841601,-73.8496682669005,-73.8496748155562,-73.8496832492329,-73.8496799084656,-73.8496799438658,-73.849679552671,-73.8496863125054,-73.8497040169494,-73.8497229819497,-73.8497398487106,-73.849754611987,-73.8497634765047,-73.8497580517479,-73.8497370180183,-73.8497315758756,-73.8497198137323,-73.8497101736303,-73.849705138588,-73.849696727235,-73.8496743982633,-73.8496686909892,-73.8496579674418,-73.8496377584946,-73.8496162909688,-73.8495910383818,-73.8495653729975,-73.849556565578,-73.8495523761745,-73.8495604145485,-73.8495566545105,-73.8495503812889,-73.8495605172157,-73.8495862223876,-73.849586682834,-73.84959557331,-73.8495964499479,-73.8496032140999,-73.8495998733036,-73.8496007550623,-73.849604992886,-73.8496109119838,-73.849619364406,-73.8496253159554,-73.8496463879344,-73.849664491226,-73.8496693153184,-73.8496838687659,-73.8496902064248,-73.8497083414313,-73.8497256180054,-73.8497353223404,-73.8497349204302,-73.8497269406361,-73.8497118079185,-73.8496996121582,-73.8496929124874,-73.8496853599554,-73.8496778030276,-73.8496695918095,-73.8496610006838,-73.8496610346415,-73.8496635818462,-73.8496696833178,-73.8496990500481,-73.8497319944657,-73.8497659214866,-73.8497978794192,-73.8498228273431,-73.8498408150499,-73.8498468349723,-73.849847866097,-73.8498568809319,-73.8498509313653,-73.8498390037705,-73.8498270631562,-73.8498190977079,-73.849811156385,-73.8498091980022,-73.8498002467465,-73.8497873010801,-73.8497643533273,-73.8497374137516,-73.8496965095303,-73.8496795485287,-73.8496565982352,-73.8496353092838,-73.8496186533561,-73.849604702245,-73.8496047313712,-73.8496027856952,-73.8495978318436,-73.8495879348678,-73.8495869826811,-73.8495880119739,-73.8496104812204,-73.8496459481416,-73.8496659217521,-73.8496978784817,-73.8497168722435,-73.8497219117117,-73.8497229753856,-73.8497210238817,-73.849711092014,-73.8497001544185,-73.8496762650544,-73.8496473621409,-73.8496294276393,-73.8496135043556,-73.8495995749375,-73.8495966291166,-73.8496066438233,-73.8496316377729,-73.8496546114997,-73.8496776019038,-73.8496826353467,-73.8496767017306,-73.8496657600966,-73.8496617950937,-73.8496488264606,-73.8496278633064,-73.8496218502539,-73.8496337999373,-73.8496198011408,-73.8495928504379,-73.8495669052051,-73.8495492707593,-73.8495359832267,-73.8495250360894,-73.8495260602447,-73.849513105108,-73.849496157963,-73.8494961836791,-73.8495031936552,-73.8495111982481,-73.8495359246301,-73.8495610857928,-73.8495780226579,-73.8495919764137,-73.8496189395727,-73.8496429196065,-73.849656923035,-73.8496838998676,-73.8497028832346,-73.8497278438955,-73.8497408469689,-73.8497807643418,-73.8498176744621,-73.8498485916659,-73.8498825148537,-73.8499154537201,-73.8499413989039,-73.8499753351061,-73.8500162793087,-73.8500472407244,-73.8500851787183,-73.8500882258811,-73.8500932976329,-73.8500733993861,-73.8500664298605,-73.8500375834194,-73.8500146499942,-73.8499787134176,-73.8499527477889,-73.8499467348132,-73.8499477091034,-73.8499486709856,-73.8499576067836,-73.8499725363766,-73.8499784895368,-73.8499635110347,-73.8499385931599,-73.8499226591745,-73.8499187047892,-73.8498977874872,-73.8498908183693,-73.8498788751374,-73.8498719073429,-73.8498629599953,-73.8498679812158,-73.8498660057404,-73.8498490757336,-73.8498291434046,-73.8498082069004,-73.849792269996,-73.8497723577843,-73.8497364588903,-73.8497105187323,-73.8496736216393,-73.849645700908,-73.849620774175,-73.8496008462198,-73.8495819117424,-73.849561978661,-73.8495300559158,-73.8495041434422,-73.8494872135571,-73.849462666922,-73.8494483289187,-73.8494293958065,-73.8494184584088,-73.8494214881967,-73.8494344764686,-73.8494526797302,-73.8494909163366,-73.8495317245949,-73.8495725260984,-73.8496239731738,-73.849661269805,-73.8496914522794,-73.8497234332779,-73.8497482210165,-73.8497517046143,-73.8497782635273,-73.8498226125437,-73.8498687585705,-73.8498883280519,-73.8499220944621,-73.8499398701692,-73.8499487840864,-73.8499541604655,-73.849940016039,-73.8499116632058,-73.8498708973878,-73.8498798343168,-73.8498837700687,-73.8498888083775,-73.8498888722188,-73.849904929068,-73.8499085380029,-73.8499139417295,-73.8499317362491,-73.8499743065004,-73.85001149021,-73.8500220736626,-73.8500628749703,-73.8500983498639,-73.8501167399172,-73.8501550478985,-73.8501745315697,-73.8501975748692,-73.8502384139256,-73.8502809918102,-73.850316454609,-73.8503270685059,-73.8503270078835,-73.8503304849933,-73.8503623693893,-73.8503924880499,-73.8504262639256,-73.8504884026415,-73.850532830421,-73.8505577757249,-73.8505809098401,-73.8506128819898,-73.8506413256184,-73.85065377704,-73.8506839712805,-73.8507229908276,-73.8507265722173,-73.8507656424786,-73.8507958178819,-73.8508313155871,-73.8508614946553,-73.8508863309269,-73.8509235514666,-73.8509341477851,-73.850959032365,-73.8509998857726,-73.8510584569359,-73.8511081686628,-73.8511561048685,-73.8511703339973,-73.8511899051981,-73.8512182979403,-73.8512733124741,-73.8512981366576,-73.8513264986217,-73.8513477512647,-73.851369089669,-73.8513939944619,-73.8514277705319,-73.8514526660289,-73.8514314323306,-73.8514314925053,-73.8514457238762,-73.8514652916868,-73.8515078675623,-73.8515504466628,-73.8515823710757,-73.8515877811845,-73.851589659885,-73.8516075107665,-73.851616468517,-73.8516484722804,-73.8516893731972,-73.851701838627,-73.8517213921221,-73.8517046488925,-73.8516930431246,-73.8516664644907,-73.8516682744774,-73.8516700870305,-73.8516808156494,-73.8516808577031,-73.8516844534171,-73.8516986843995,-73.8517270530371,-73.8517412299638,-73.8517625082074,-73.8517855543865,-73.8518281029851,-73.8518546501516,-73.851881290826,-73.8518919461767,-73.8519327799631,-73.8519775324461,-73.8520055035247,-73.8520303185582,-73.8520391501761,-73.8520550856639,-73.8520781438778,-73.8520870503972,-73.8520977271971,-73.8521101804843,-73.8521510035539,-73.8521918142007,-73.8521918501197,-73.8521918830464,-73.8521848554902,-73.8521602665726,-73.8521405746439,-73.8521459621042,-73.8521743940502,-73.8522329561286,-73.8522542790153,-73.8523181669485,-73.8523448030708,-73.8523466513191,-73.8523538134843,-73.8523574333252,-73.8523574961155,-73.8523983633452,-73.8524569990321,-73.8525244215307,-73.8525598839158,-73.8525882883074,-73.8526166947979,-73.8526717089503,-73.8527125107978,-73.852728440566,-73.8527248541589,-73.8527248064387,-73.8526910710967,-73.8526883769409,-73.8526892038062,-73.8527016098214,-73.8527388838776,-73.8527690890412,-73.8527711375399,-73.852785210967,-73.8528118760641,-73.8528456390423,-73.8528581097185,-73.8528936431573,-73.8529185229961,-73.8529150379204,-73.852902670662,-73.8529062778643,-73.8529134278259,-73.8529205560552,-73.8529525434244,-73.8529986815449,-73.853066101619,-73.8531033127216,-73.8531476161139,-73.853167157103,-73.853213262513,-73.8532397997719,-73.8532685051427,-73.8532894267641,-73.8533284715281,-73.8533675455378,-73.8533661161996,-73.8533587921892,-73.8533198395575,-73.8532897446698,-73.8532490447188,-73.8532455624878,-73.8532438658446,-73.8532332866419,-73.8532422105899,-73.8532706167617,-73.8533025130921,-73.8533219731179,-73.8533449924267,-73.8533395907101,-73.8533395223984,-73.8533837944387,-73.8534316139241,-73.8534511183466,-73.8534671253798,-73.8534884365759,-73.8535114776229,-73.8535904180317,-73.8536534237982,-73.8536694248387,-73.8537089328419,-73.8537475320605,-73.8537847471391,-73.8538060464287,-73.8538450846663,-73.8538911841561,-73.8539355031688,-73.8539302378387,-73.8539157702279,-73.8539108419939,-73.8539339219621,-73.8539835956481,-73.8540208478696,-73.8540598519019,-73.8540704417609,-73.854085967501,-73.8541040977003,-73.8541427727595,-73.8542176805468,-73.8542691193148,-73.8542763875009,-73.8542920955336,-73.8542920276658,-73.8544587845092,-73.8544623864979,-73.8544542151283,-73.8544482940578,-73.8544483294294,-73.8544324473883,-73.8544165615375,-73.8543740749792,-73.854338618563,-73.85430317528,-73.8542641844112,-73.8542252314995,-73.8542039904924,-73.8541667944911,-73.8541437914239,-73.8540852549509,-73.8540373792284,-73.8539894908118,-73.85396111901,-73.8539256588139,-73.8538759610011,-73.8538280734778,-73.8537607080705,-73.8537323636161,-73.8537164745959,-73.8537076590497,-73.8536935524098,-73.853670550918,-73.8536316302017,-73.8536050784337,-73.8536264065348,-73.853668969413,-73.8537097367792,-73.8537452345652,-73.8537718959541,-73.8538021239875,-73.8538216935748,-73.8538908837712,-73.8539653893056,-73.8540487404731,-73.8540913417583,-73.8541551977668,-73.8542225747937,-73.8542492368594,-73.8543184683322,-73.8543876340047,-73.8544195703025,-73.8544603436696,-73.8544868913722,-73.8545098931447,-73.8545560285388,-73.8546020733955,-73.854628582922,-73.854644489174,-73.8546835165866,-73.8547438306197,-73.8548041116493,-73.8548040116762,-73.8547631557581,-73.8547418028539,-73.8547754323715,-73.8548304214386,-73.8548996221199,-73.8549528944062,-73.8550309595783,-73.8550664264055,-73.8550486342832,-73.8550521229512,-73.8550467221881,-73.8550306953552,-73.8549277686445,-73.8548426305196,-73.8547716717026,-73.8547130733887,-73.854665094511,-73.8546401676134,-73.8546631643881,-73.854689785081,-73.8547412615901,-73.8547713687735,-73.8547968777576,-73.8548052112459,-73.8548025047865,-73.8548006994845,-73.854737492857,-73.8546952823808,-73.8546993410054,-73.8547076396167,-73.8547410278943,-73.8547660215292,-73.854782610427,-73.8548034478689,-73.8548705311637,-73.8549166329124,-73.8549922262498,-73.8550593874217,-73.855122539379,-73.8552317645277,-73.8552947568622,-73.8553704465037,-73.8554335206922,-73.8555495238704,-73.8555366095147,-73.8555454320194,-73.8555476071832,-73.8555186769796,-73.8554096942408,-73.8553540455456,-73.8553183785051,-73.8552337362596,-73.855231281958,-73.85524219258,-73.8552486892998,-73.8552997127547,-73.855359731099,-73.8554353920271,-73.8555955418864,-73.8556466908172,-73.8557778552213,-73.8558546570705,-73.8559112424697,-73.8559467836783,-73.8559822737272,-73.8559888298202,-73.8559776349809,-73.8559505985188,-73.8559196988923,-73.8558929487573,-73.8558839710508,-73.8558772284775,-73.8558749214987,-73.8558903990779,-73.8559237036674,-73.8559704017594,-73.8560126756292,-73.8560349439689,-73.8560672073674,-73.8560626615349,-73.8560532559236,-73.8560569688938,-73.8560588107383,-73.8560597291283,-73.8560662719139,-73.8560859258106,-73.8560877753685,-73.856100885828,-73.8561252468488,-73.8561430366884,-73.8561557202216,-73.856171161553,-73.8561852223382,-73.8561927088565,-73.8562020880672,-73.8562020572734,-73.8561842205575,-73.8561790326617,-73.8561691903198,-73.8561691656787,-73.856176639882,-73.8561841143071,-73.8561953400286,-73.85620658423,-73.856229590309,-73.8562280699971,-73.8562280407494,-73.856232693091,-73.8562532982924,-73.8562561025874,-73.8562753827356,-73.8562701141695,-73.8562616441175,-73.8562606856815,-73.8562681700367,-73.8562643963096,-73.8562521857223,-73.856262494383,-73.8562671605926,-73.8562774452959,-73.8562877240702,-73.8562914353683,-73.8562885895194,-73.8562922964248,-73.8562932003456,-73.8562819206984,-73.8562903246016,-73.8563034499041,-73.8563147233989,-73.8563166253184,-73.8563110318695,-73.8563270038887,-73.8563382666042,-73.8563570099652,-73.8563626161654,-73.8563569653607,-73.8563691436629,-73.856375687861,-73.8563756601796,-73.856366264655,-73.8563568700055,-73.8563530978178,-73.856335257052,-73.8563314848621,-73.8563323980224,-73.8563511442704,-73.8563802249261,-73.8563801941702,-73.856380141886,-73.8563801142069,-73.8563594713018,-73.8563472767165,-73.8563378666672,-73.8563368858226,-73.8563284203551,-73.856333078905,-73.8563536673385,-73.8563686761453,-73.8563846310761,-73.856402432121,-73.8564211669944,-73.8564342868558,-73.8564539920091,-73.8564680428437,-73.8564726968188,-73.8564605008951,-73.8564445549632,-73.856442653938,-73.8564463846231,-73.8564613695105,-73.8564838673768,-73.8564969988901,-73.8565082447502,-73.8565147830712,-73.8565025847253,-73.8565035034054,-73.856527871575,-73.8565438113787,-73.8565503479581,-73.8565587695275,-73.8565728320274,-73.8565887733774,-73.8566006760669,-73.856599993154,-73.8565877855856,-73.8565708818776,-73.8565483578608,-73.8565230301596,-73.8565080035363,-73.856504232886,-73.8565060794704,-73.8564900873982,-73.8564741260525,-73.8564506927666,-73.8564338410682,-73.8564169428178,-73.8563953464409,-73.8563850124168,-73.8563606242217,-73.8563465707149,-73.8563268696604,-73.8563109021397,-73.8563061835701,-73.8563061435663,-73.8563201660897,-73.8563388816992,-73.8563322805357,-73.8563162991441,-73.8562890643722,-73.8562506019367,-73.8562243462674,-73.8561868510866,-73.8561662456508,-73.8561363141306,-73.8561213591684,-73.8560998439427,-73.8560867462911,-73.8560736438033,-73.8560605254662,-73.8560333682013,-73.8560146357575,-73.8559958870204,-73.8559668095076,-73.8559480515195,-73.8559208696191,-73.8559012201429,-73.8559031514626,-73.8559003762623,-73.8558947901582,-73.8558798152714,-73.8558591969725,-73.8558385826513,-73.8558132867305,-73.8557907935608,-73.8557664014588,-73.8557401452788,-73.8557251633732,-73.8557026841261,-73.8556820954518,-73.8556746574903,-73.8556672009893,-73.8556512912851,-73.8556475986991,-73.8556429495728,-73.8556317486275,-73.8556186403443,-73.8555980283311,-73.8555980654384,-73.8555896641428,-73.8555634288309,-73.8555418784117,-73.8555034417008,-73.8554762735061,-73.8554265756006,-73.8554050035397,-73.8553768708384,-73.8553609652267,-73.8553609992977,-73.8553629208621,-73.8553770473672,-73.8554005232522,-73.8554314809402,-73.8554530693355,-73.8554624755504,-73.8554662750471,-73.8554719547223,-73.8554938797418,-73.855507623986,-73.8555076502873,-73.8555039599936,-73.8554946240859,-73.8554890403577,-73.8555012702412,-73.8555050511495,-73.8554169490072,-73.8553287856401,-73.8552706266138,-73.8552321517282,-73.8552189920807,-73.8552002132643,-73.8551870439843,-73.8551645169636,-73.8551429254948,-73.8551241599422,-73.8551091574377,-73.8550969886168,-73.8550848266771,-73.8550774152675,-73.8550642554388,-73.8550558270629,-73.8550501969114,-73.8550333264262,-73.8550145540182,-73.8550004575757,-73.8549960620182,-73.8549929175079,-73.8549760252798,-73.8549628830143,-73.85496192261,-73.8549609535632,-73.8549374778634,-73.854911231908,-73.8548859201787,-73.8548765642571,-73.8548549958268,-73.8548362358201,-73.854829648359,-73.8548239964343,-73.8548099121554,-73.8547808473588,-73.8547508447987,-73.8547302308021,-73.8547096050275,-73.8546792304995,-73.8546642523191,-73.8546413403528,-73.8546134372986,-73.8545884980042,-73.8545615493382,-73.8545455554875,-73.8545186035011,-73.8544916771512,-73.8544837288431,-73.8544667811844,-73.8544558049471,-73.8544437782078,-73.8544337779689,-73.8544284659305,-73.854415752485,-73.8543828191052,-73.854355893637,-73.8543357140207,-73.8543230131439,-73.8542851084749,-73.8542522000173,-73.8542362310173,-73.854217272097,-73.8541983027714,-73.854161375746,-73.8541404401022,-73.8541184869633,-73.8540965265183,-73.8541034062468,-73.8540904942999,-73.8540715323929,-73.854062840563,-73.8540466386682,-73.8540276992647,-73.8540067513453,-73.8539977471624,-73.8539988448648,-73.8540006864967,-73.8539906774345,-73.8539806864467,-73.853960719312,-73.8539228038024,-73.8538978577468,-73.8538888735121,-73.8538918381189,-73.8539007940614,-73.853908762431,-73.8538917965074,-73.8538808285795,-73.8538658769695,-73.8538569276936,-73.853845964106,-73.8538210065197,-73.8538090243838,-73.8538089960721,-73.8538139566676,-73.8538199123738,-73.8538039396698,-73.8537929720897,-73.8537850036038,-73.8537770419084,-73.853774021472,-73.8537650155741,-73.853751033431,-73.853733064938,-73.8537151038981,-73.8537001529614,-73.8536971854033,-73.8536882418195,-73.8536812885828,-73.8536683171196,-73.8536663003259,-73.8536463122792,-73.8536283264539,-73.853612350629,-73.8535854170194,-73.8535614778591,-73.8535415307052,-73.8535196009019,-73.8534886776347,-73.8534707218368,-73.8534447800117,-73.8534208225038,-73.8534088468033,-73.853393863739,-73.8533818650038,-73.8533688777153,-73.8533509031869,-73.8533429358845,-73.8533289744213,-73.8533130100533,-73.8533010773575,-73.853284149872,-73.8532791951899,-73.8532792804949,-73.8532892156569,-73.8532792536892,-73.8532652698554,-73.8532493140855,-73.8532233806506,-73.8532093788588,-73.8531860836648,-73.853186372303,-73.8531704012579,-73.8531334735192,-73.8530995197823,-73.8530935033295,-73.8530994561921,-73.8531064494667,-73.8531314005541,-73.8531413437593,-73.8531453083386,-73.8531462751296,-73.8531392641077,-73.8531172858252,-73.8530973196168,-73.8530743679875,-73.8530494210136,-73.8530324720249,-73.8530205134053,-73.8529965575196,-73.8529516332671,-73.8529126977316,-73.8528957129871,-73.8528876929795,-73.8528906490201,-73.8528756639761,-73.8528507111558,-73.852838717339,-73.8528107526375,-73.8527798017227,-73.8527648149811,-73.8527478137772,-73.8527318160401,-73.8527038620244,-73.8526759274827,-73.852649009632,-73.8526260867235,-73.8525891853565,-73.8525682458384,-73.8525393076982,-73.8525063790045,-73.8524714740327,-73.8524505644276,-73.8524336154864,-73.8524116572394,-73.852409632651,-73.8523906477891,-73.8523726691132,-73.8523537088094,-73.8523237806403,-73.8522978370962,-73.852286269696,-73.8522649187274,-73.8522419933465,-73.8522111255308,-73.8521633079637,-73.8521134775984,-73.8520516163077,-73.8520087237193,-73.8519638121882,-73.851954755384,-73.8519496990107,-73.8519246794946,-73.8519295663958,-73.851965407495,-73.8519683254009,-73.8519602745652,-73.851986127102,-73.8519920571493,-73.8520309073452,-73.8520767863382,-73.8521246024009,-73.852128533787,-73.8521154849752,-73.8521473543762,-73.8521612680621,-73.8521622048547,-73.8521900679255,-73.852221983892,-73.852260877445,-73.8523037552985,-73.852334695372,-73.8523716146554,-73.8524035358441,-73.8524264244444,-73.852464307485,-73.8524998268765,-73.8525181685117,-73.8525390974557,-73.8525719966265,-73.8525939046891,-73.8526317605148,-73.8526446580399,-73.8526405703008,-73.8526405182616,-73.8526554212502,-73.8526633493177,-73.8526532959709,-73.8526223570771,-73.8526038802099,-73.8525555983036,-73.8525187866038,-73.8524809862299,-73.8524671164259,-73.8524522354028,-73.8524043298245,-73.8523684032317,-73.8523344615481,-73.8522845212308,-73.8522695140979,-73.8522305726578,-73.8521915992135,-73.8521596261123,-73.8521177042803,-73.8520747808388,-73.852051822424,-73.8520339183496,-73.8520379499764,-73.8520400070478,-73.8520400761553,-73.8520211692655,-73.8519832930584,-73.8519404034285,-73.8519014900086,-73.8518805348517,-73.8518495677383,-73.8518176001013,-73.8517806563366,-73.8517227510034,-73.8517017379504,-73.8516996675923,-73.8516716382238,-73.8517025236902,-73.8517244567142,-73.8517443776384,-73.8517602906569,-73.8517802612273,-73.8518052388981,-73.8518481100765,-73.8518700382252,-73.851894996077,-73.8519249448049,-73.8519438972568,-73.8519618222183,-73.8519637548232,-73.8519646935954,-73.8519546635018,-73.8519296807585,-73.8519076749588,-73.8518876773598,-73.8518666866459,-73.8518606521707,-73.8518476324458,-73.8518286397961,-73.8518066660026,-73.8517767181874,-73.8517647439484,-73.8517617057672,-73.8517606758819,-73.8517546447402,-73.851735638536,-73.8517176381949,-73.8517126179115,-73.8517145767865,-73.8517199514252,-73.8517284676991,-73.8517334381237,-73.8517344034624,-73.8517403353418,-73.851723341874,-73.8517033760077,-73.8516794077641,-73.8516564411363,-73.8516324711914,-73.8515985574022,-73.8515756171554,-73.8515656078221,-73.8515466226777,-73.8515176746595,-73.8514807440011,-73.8514537865038,-73.8514308079914,-73.8514018550967,-73.8513848559532,-73.8513728461028,-73.8513827877656,-73.8514076868365,-73.8514315789991,-73.8514335428904,-73.8514205474514,-73.8513956248761,-73.8513786805421,-73.8513527280025,-73.8513268275913,-73.851294923369,-73.8512620024979,-73.8512141051585,-73.8511612292601,-73.8511612437272,-73.8511612970837,-73.8511603386555,-73.8511563885801,-73.8511534587287,-73.851151523729,-73.8511326084907,-73.8511236928843,-73.8511207406258,-73.8511138140651,-73.8510839331837,-73.8510569890697,-73.8510399837668,-73.8510379652877,-73.8510479078754,-73.8510588476728,-73.8510618167239,-73.851044860614,-73.851035896276,-73.8510269253721,-73.8510109755557,-73.8509880207676,-73.850997936849,-73.8510098402733,-73.8510117599378,-73.8509867407329,-73.8509697098994,-73.850968627208,-73.8509825296504,-73.8509817072239,-73.8509774574467,-73.850968462524,-73.8509495009996,-73.850929975844,-73.8509086052947,-73.8508866448223,-73.8508686655915,-73.8508740871468,-73.8508796062097,-73.8509015352977,-73.8509114895691,-73.8509004648336,-73.8508815275121,-73.8508814816469,-73.8509024031353,-73.850920328698,-73.8509452575911,-73.8509641656976,-73.850963123747,-73.8509580909464,-73.8509181263258,-73.8508961937835,-73.8508732553844,-73.8508533163888,-73.8508353559603,-73.8508044506331,-73.8507904897753,-73.8507695066495,-73.8507565000538,-73.8507315477329,-73.8507105752314,-73.8506936011984,-73.8506795971563,-73.8506785672471,-73.8506695518534,-73.8506425924211,-73.8506545340705,-73.8506774360948,-73.8506883714473,-73.8506843095895,-73.8506872524286,-73.850694200116,-73.8506931283458,-73.8506920849917,-73.8506770924734,-73.8506601011445,-73.8506500951482,-73.850632097047,-73.8506051202775,-73.8505881061336,-73.8505721023665,-73.8505471063031,-73.8505241565495,-73.8505042277061,-73.8504942259011,-73.8504762496644],"lat":[40.6123422190572,40.6123223877252,40.6123025841529,40.6122774490552,40.6122538398042,40.612233250609,40.6122218016554,40.6122103572627,40.6121989212945,40.6121973559186,40.6121912322552,40.6121957410937,40.6122010317842,40.6121956942437,40.6121804758347,40.6121675289598,40.6121545783066,40.6121454101824,40.6121385176128,40.6121354419276,40.6121361637588,40.6121414526009,40.6121414069858,40.6121421312328,40.6121421025496,40.612142075165,40.6121321767234,40.612123782987,40.6121176512515,40.6121138049565,40.6121099794017,40.6120971904925,40.6120765633969,40.6120667137255,40.6120394372462,40.6120257810728,40.6120113514449,40.6119801868134,40.6119596502527,40.6119421373899,40.61192692746,40.6119071459279,40.6119063511144,40.6119025211656,40.6118842459419,40.6118598852735,40.6118465467925,40.6118253580779,40.6118076875594,40.6118022215532,40.6117986835373,40.611789366548,40.6117803673569,40.611778116354,40.6117752170411,40.6117639694225,40.6117527327663,40.6117463082049,40.6117382885362,40.6117325261529,40.6117274066731,40.611725140263,40.6117239015728,40.6117174964018,40.6117053007664,40.6116895797062,40.6116767456211,40.6116661666166,40.611655602593,40.6116469647901,40.6116347949037,40.611622301782,40.6116114050406,40.6115902229306,40.6115828162774,40.6115696556086,40.611558411252,40.6115391477011,40.6115317619594,40.6115275799865,40.6115349304472,40.6115368180732,40.6115403628703,40.6115409782402,40.6115396672172,40.6115364254891,40.611529654548,40.611515205355,40.611505896138,40.6114885809576,40.6114757429652,40.6114568054633,40.6114430228684,40.6114318275296,40.6114145029331,40.6113923772592,40.6113769779501,40.611364474883,40.6113525992255,40.6113346335433,40.6113224483238,40.6113112259164,40.6112964788257,40.6112711406174,40.6112612226448,40.6112609256729,40.6112595744932,40.6112554965999,40.611245238196,40.6112311448944,40.6112237883243,40.6112144972773,40.6112058341522,40.6111971611202,40.6111871952943,40.6111814042812,40.6111656755858,40.6111541150738,40.611144800787,40.6111367933769,40.61112841657,40.611113337814,40.6111040367414,40.6110961572793,40.6110848449102,40.6110788038262,40.6110796090926,40.6110682434602,40.6110682760583,40.6110568921604,40.6110424502962,40.6110272416672,40.6110128042173,40.6109960653044,40.6109747560915,40.6109595310182,40.6109519152879,40.6109328928604,40.6109161596628,40.6109032194027,40.6108910341694,40.6108894830126,40.6108879266329,40.6108833108294,40.610881767484,40.6108817374676,40.6108927843053,40.6108923343106,40.6108839509891,40.6108710224637,40.610848965536,40.6108329886626,40.6107964721038,40.6107759381435,40.6107622500091,40.6107458979017,40.6107364693517,40.6107296504014,40.61071904521,40.6107038605714,40.6106818126106,40.6106521547983,40.6106323792773,40.6106118330745,40.6105943272159,40.6105676785999,40.6105516704045,40.610539479297,40.6105204457423,40.610502175712,40.6104808777222,40.6104649211044,40.6104444199169,40.6104345637355,40.6104171029179,40.6103973365306,40.610373753055,40.6103577690227,40.6103463559351,40.6103448178068,40.6103478327141,40.6103592315763,40.6103706546085,40.6103828046111,40.6103865719258,40.6103865379722,40.6103837394348,40.6103804140097,40.6103674711146,40.6103560650564,40.610348442772,40.6103408152591,40.6103294085638,40.6103180103433,40.6103088943349,40.6103047837082,40.6103120019706,40.6103241917835,40.6103310551198,40.6103227241583,40.6103090667177,40.6102938750578,40.6102794611133,40.6102688394561,40.6102627879336,40.6102491161209,40.610248407379,40.6102537788524,40.6102614245683,40.610263750291,40.6102599907276,40.6102600246026,40.6102562668267,40.610242630779,40.6102305035289,40.6102221874455,40.6101986163741,40.6101621198812,40.6101354765517,40.6101286223845,40.6100875176461,40.6100791226541,40.6100851599137,40.6100942525094,40.6101056520589,40.6101162993098,40.6101322714605,40.610152056096,40.6101695664714,40.6101847848889,40.610189327661,40.6101763665678,40.6101618972071,40.6101451602312,40.6101284022771,40.6101207885223,40.610107083442,40.6100994696877,40.6100842485261,40.6100705656025,40.6100614377059,40.6100462049434,40.6100347715041,40.6100263785772,40.6100134303596,40.6099928704475,40.6099821770404,40.6099798610425,40.6099691658079,40.6099600033016,40.6099508448731,40.6099378902344,40.6099264580577,40.6099157848184,40.6099111807093,40.6098966970539,40.6098814654105,40.6098713444874,40.609866964755,40.6098555325548,40.6098380266681,40.6098220604118,40.6098152335227,40.6098122507196,40.609813278998,40.6098106288407,40.6098106822466,40.609810749566,40.6097918702335,40.6097810935183,40.6097595036277,40.6097811677412,40.6098095639745,40.6098325825249,40.6098326404784,40.6098232372039,40.6097989267987,40.6097719308388,40.609755730015,40.6097368147035,40.6097124852548,40.609690835584,40.6096772776162,40.6096610010149,40.6096312688793,40.6096111102024,40.6095853129264,40.6095569208272,40.6095163824686,40.6094893471268,40.6094528510727,40.6094285378391,40.6094312975011,40.609462442469,40.6094894953285,40.6094895485603,40.6094922989204,40.6095024089996,40.6095234692898,40.6095370144645,40.6095451559293,40.6095289851154,40.6095276891263,40.609535846744,40.6095493808441,40.6095764203166,40.6096075212834,40.6096291940028,40.6096468092026,40.609615757392,40.6095942058593,40.6095591121576,40.6095104726639,40.6094780553452,40.6094605209104,40.6094335183234,40.6094186625985,40.6094024779622,40.6094065843601,40.6093917171071,40.6093728402222,40.6093647674645,40.6093567021089,40.6093472772104,40.6093473094337,40.6093622289488,40.6093838750702,40.6093622749619,40.609339344092,40.609325900229,40.6093083886424,40.6092908752377,40.6092746696306,40.6092490070447,40.6092449880857,40.6092355952243,40.609241035689,40.6092505364394,40.6092667872901,40.6092438310485,40.6092127674813,40.6091817152087,40.6091547078343,40.6091303439219,40.6091033044476,40.6090857468482,40.6090614366742,40.6090614916867,40.6090601952292,40.6090629395408,40.6090237386565,40.6089764224521,40.6089264209373,40.6088872253015,40.6088548187143,40.6088102557835,40.6087886396557,40.608771089391,40.6087614856205,40.6087548287821,40.6087412747078,40.6087250536804,40.6087074793551,40.6086696381272,40.6086507093885,40.6086290823188,40.6086115251896,40.6086183222639,40.6086250998535,40.6086291830135,40.6086359732088,40.608648195716,40.6086766216175,40.608679061504,40.6086577420625,40.6086429222654,40.6086341526255,40.6086470721449,40.6086565688255,40.6086741556864,40.6086876959756,40.6086890771114,40.6086728652102,40.6086580070446,40.6086417997055,40.6086323881634,40.6086283837643,40.6086121604472,40.6085972885846,40.6085661837761,40.6085488857508,40.6085350315523,40.6085052941699,40.6084836990308,40.6084743102729,40.6084581136505,40.6084473795667,40.6084352461396,40.6084014484856,40.6083717145457,40.6083392712956,40.6083108791914,40.6082811878691,40.6082380002356,40.6082326784181,40.6082408353447,40.6082314082188,40.6082206284575,40.6082112349266,40.6082112872196,40.6082275316656,40.608245103065,40.6082667347139,40.6082802112592,40.6083024550186,40.6083221214976,40.6083275445708,40.6083181282717,40.6082965352573,40.6082638363421,40.6082262522639,40.6082005989887,40.6081749541247,40.6081506341231,40.60812634431,40.6081060958987,40.6080776997563,40.6080547000904,40.6080276646501,40.6080033383352,40.6079884750488,40.6079628285511,40.6079561275972,40.6079521575877,40.6079711332754,40.6079914701413,40.6079793267878,40.6079874982818,40.6080199795675,40.6080317462792,40.6080403225059,40.6080322604043,40.6080106785496,40.6079861980239,40.6079579397322,40.6079240899991,40.6078956599058,40.6078496402693,40.6078198921791,40.6077847378544,40.6077549812043,40.6077306566312,40.6077198767077,40.6077361414569,40.6077605015905,40.6077794590885,40.6078159558126,40.6078470516656,40.6078822601389,40.6079174727837,40.6079215533695,40.6079026461569,40.6078918571341,40.6079013505643,40.6078815289053,40.6078880116112,40.6078718086198,40.6078262244497,40.6078475715643,40.6078651949079,40.6078598141576,40.6078544554591,40.6078653302606,40.6078789063678,40.6078532122506,40.6078313792109,40.6077991073181,40.6077910252205,40.6077897362084,40.6077897835277,40.607800648747,40.6078249981603,40.6078356209645,40.6078480247254,40.6078370363149,40.6078251850073,40.6078279543285,40.6078403662358,40.6078671913309,40.6078982870168,40.6078957947096,40.607871462801,40.6078447965418,40.6078254772784,40.6078092532892,40.6077713774313,40.6077348536948,40.6076942400377,40.6076833794209,40.6076671106308,40.607650837164,40.6076169877368,40.6075953290839,40.6075695944688,40.6075425257249,40.6075410992979,40.6075315744465,40.6075274579056,40.6075220135131,40.6075138570208,40.6075259609949,40.6075218443879,40.6075014789452,40.6074838668819,40.6074486945013,40.6074243479828,40.6073851221519,40.6073580528119,40.6073093324891,40.6072836100729,40.6072647096145,40.6072701716556,40.6072850954579,40.6072770292027,40.6072527271569,40.607220317708,40.6071946545011,40.6071920383884,40.6071921330773,40.6072030544717,40.6071909409116,40.6071937267174,40.6072086834302,40.6071843819448,40.6071628373348,40.6071710375856,40.6071683732815,40.6071805925681,40.6072090183684,40.6072360870428,40.6072307382594,40.6072659480061,40.6073119492182,40.6073390088907,40.6073390582406,40.6073391344811,40.6073540825545,40.6074000501074,40.6074256865846,40.607455403915,40.6074905973973,40.607492019495,40.607483994274,40.607459726217,40.6074544163603,40.6074598694356,40.6074841822963,40.6075112262505,40.607547723726,40.6075760956981,40.6075935413234,40.6075880254847,40.6075879358465,40.6076149018467,40.6076526969333,40.6076945768712,40.6077243495965,40.6077189760813,40.6077041687413,40.6077271906261,40.6077501567703,40.6077854193027,40.6078534748037,40.607926421621,40.6079872312608,40.6080608855752,40.6081281898792,40.6081794760417,40.6082948880848,40.6084038805116,40.6085096569764,40.6085962103029,40.6086860280342,40.6087565902389,40.6088015509634,40.6088561155069,40.6088209442975,40.608869152085,40.6089076877399,40.6089077830063,40.6089078623563,40.6089825124656,40.6090217781499,40.609053981317,40.6090760094514,40.6090895273752,40.6091114174058,40.6091435394664,40.6091875463819,40.6092619896353,40.6093687289532,40.6094636243699,40.6095432657176,40.6095941598321,40.6095976241554,40.6095638325395,40.6095267589415,40.6095200457969,40.6095219050095,40.6095229768743,40.6095237670265,40.6095373653582,40.6095746852475,40.6096272173852,40.6096644782709,40.6096929091097,40.6097254012008,40.6097592537973,40.6097982126811,40.6098320898555,40.6098710564324,40.6099100454758,40.6099304195761,40.6099253947634,40.6099101987179,40.609893282876,40.609899448652,40.6099181531228,40.6099302930743,40.6099481675611,40.6099638953308,40.6099731886553,40.6099832038702,40.6100032430255,40.6100153965689,40.6100247051575,40.6100361722015,40.6100504904045,40.6100530853901,40.6100562442104,40.610059835537,40.6100677075517,40.610067719286,40.6100820153513,40.6100898551802,40.6100935492413,40.6101005580741,40.6101119950938,40.6101255852004,40.6101391758094,40.6101527711113,40.6101577889405,40.6101813054796,40.6101978437351,40.6102114244525,40.6102285852609,40.6102421922884,40.6102464842076,40.610260787333,40.6102729495629,40.6102865202275,40.6102958107004,40.6103043975543,40.6103151145359,40.6103229620808,40.6103272645574,40.6103379920932,40.6103530157365,40.6103708977545,40.6103894874129,40.6104044946375,40.6104252279938,40.6104409545862,40.6104523763606,40.610469541857,40.6104724178223,40.6104638544211,40.610451705069,40.6104359731171,40.6104231265059,40.6104195668508,40.6104267377412,40.6104367522708,40.6104474675797,40.6104539154165,40.6104639306149,40.6104767971569,40.6104846475612,40.6104917837889,40.6105010719187,40.6105103412923,40.6105203435983,40.6105317817897,40.6105375231581,40.610534700445,40.6105489965096,40.6105732994007,40.6105861652725,40.6105904285595,40.610591127999,40.6106054123411,40.6106254249893,40.6106368509555,40.6106511527138,40.6106726225162,40.610671211243,40.610666942097,40.6106755418315,40.6106870022854,40.6106920219322,40.6106877586334,40.6106963536742,40.6107127991244,40.6107142134213,40.6107149081864,40.6107263423593,40.6107363545419,40.6107463802766,40.610752126308,40.6107521427032,40.6107564463276,40.6107686057163,40.6107714493737,40.6107800280146,40.6107886359279,40.6107908006992,40.6108043889401,40.6108136922937,40.6108165693976,40.6108180181448,40.6108254056191,40.6108344724515,40.6108416051885,40.6108508769403,40.6108572814497,40.6108593947133,40.6108686676262,40.610877240413,40.6108908239738,40.6109129627577,40.6109208049726,40.6109136277422,40.6108993112628,40.6109064376201,40.61091784769,40.6109256974256,40.6109263817981,40.6109192167702,40.6109213363524,40.6109320375899,40.6109456129467,40.6109641979137,40.6109856588428,40.6110056962768,40.6110221288371,40.6110392638486,40.6110549547593,40.6110584808989,40.6110555885046,40.6110455345774,40.6110319275392,40.6109940063721,40.6109696846979,40.6109432106028,40.6109274692457,40.6109145857613,40.6109088513959,40.6108888028406,40.6108766281499,40.6108723155802,40.6108729944967,40.6108729709897,40.6108643594265,40.6108428907241,40.6108171606628,40.6107992875158,40.6107799813182,40.6107649517605,40.6107577784413,40.6107484597447,40.6107355621092,40.6107276710762,40.6107304995238,40.6107276075205,40.6107161523364,40.6107018280153,40.6106803587659,40.6106503278616,40.6106288750979,40.6106124143071,40.61058524766,40.610566657976,40.6105416256016,40.6105308874362,40.610520854522,40.6105036995797,40.6104851040066,40.610472919815,40.6104628857114,40.6104542599034,40.6104399303129,40.6104341487021,40.6104341215668,40.6104319419667,40.6104140527865,40.6103983273668,40.6103768857132,40.610350456325,40.6103376192837,40.6103347998421,40.6103269636753,40.6103148242765,40.610292670303,40.6102683749899,40.6102604931682,40.610255553258,40.610243401561,40.6102148060546,40.6101947797724,40.610174758207,40.6101576185929,40.6101440425918,40.6101153404327,40.6101152294992,40.6101187300151,40.6101269032254,40.610141537916,40.6101508064349,40.6101686601832,40.6101764939446,40.6101850442304,40.6101885954847,40.6101864316977,40.6101756941539,40.6101613833871,40.6101428657522,40.6101320512321,40.6101263219948,40.6101277444215,40.6101220052062,40.6101284148172,40.6101412624399,40.6101512583878,40.6101584079175,40.6101626761905,40.6101676621972,40.6101783833565,40.6101926775676,40.6102055150222,40.6101983332569,40.6101925828619,40.6101818498511,40.6101803925878,40.6101810835761,40.6101910822779,40.6102025121901,40.6102096418658,40.6102046018889,40.6101995602171,40.6101902424939,40.6101866421885,40.6101839407457,40.610173337313,40.6101558167839,40.6101382906074,40.6101344558117,40.6101374640461,40.6101496121233,40.6101541403359,40.610146501599,40.6101305206431,40.6101228943655,40.6101228804674,40.610146440952,40.6101563150233,40.6101701173926,40.6101851904778,40.6101866699249,40.6101790311574,40.6101650031602,40.6101561746928,40.6101492822405,40.6101393531108,40.6101400937782,40.6101400697337,40.6101446086657,40.6101468432308,40.61013769135,40.6101376634895,40.6101406767731,40.6101521961021,40.6101612024997,40.6101619386748,40.6101499591859,40.6101375722783,40.610128421739,40.6101245925559,40.6101352281021,40.6101464310014,40.610160328045,40.6101740043094,40.6101793148578,40.6101838529855,40.6101815227227,40.6101814910164,40.6101830007613,40.6101959330932,40.6102073518755,40.6102142064091,40.6102149457616,40.6102111285713,40.6102035054127,40.6101890443059,40.6101829462076,40.6101874774628,40.6101912648014,40.6102041933288,40.6102171276988,40.6102315850018,40.6102346070171,40.6102300295713,40.6102239352771,40.6102140389157,40.6102262033891,40.6102375986598,40.6102429047805,40.6102459242466,40.6102451404715,40.6102375161195,40.6102253446965,40.6102086026737,40.6101941440939,40.6101933673332,40.6102032515013,40.6102169143608,40.6102275391116,40.6102320810888,40.6102274844607,40.6102228904685,40.6102183020607,40.6102076269648,40.6102022643118,40.6101991990925,40.610197646026,40.6102014175518,40.6102021625267,40.6102089878225,40.6102196196684,40.6102264475067,40.6102325087331,40.6102248932445,40.610221072852,40.6102202920645,40.610201264784,40.6101845125395,40.6101685353212,40.6101605277017,40.6101495353901,40.6101419180211,40.6101479848307,40.6101434009649,40.610138043941,40.610152475789,40.6101623537136,40.6101775432849,40.6101798037942,40.6101820380282,40.6101941629547,40.6102070831587,40.6102230611582,40.6102192680205,40.6102170189949,40.6102337623384,40.6102459350497,40.6102596245934,40.6102717839516,40.6102831637687,40.6102869403275,40.6102869109915,40.6102868790999,40.6102800130242,40.6102723924098,40.6102754041043,40.6102844731283,40.6102920274606,40.6103018924602,40.6103186128345,40.6103353472565,40.6103429333999,40.6103459432854,40.6103542935008,40.6103649041744,40.6103724698589,40.6103808162331,40.6103975250927,40.6104119543253,40.6104180021613,40.6104149245325,40.6104034826297,40.6103905246776,40.6103813520425,40.6103737198628,40.6103736827411,40.610372880244,40.6103629492152,40.6103423884889,40.6103355223249,40.6103377755446,40.6103507015085,40.6103620845279,40.6103696662586,40.610369641905,40.610365800712,40.6103650071294,40.6103563559666,40.6103596415835,40.610347443799,40.6103177449115,40.6102811798107,40.6102522174233,40.6102483345662,40.6102406746952,40.6102436591914,40.6102778690523,40.61030828266,40.6103409519639,40.610387348101,40.6104246581223,40.6104588845781,40.6104892943291,40.6105311544711,40.6105570192341,40.6105874887034,40.6105981949067,40.6106355202878,40.6106629031346,40.6106971090436,40.6107260483262,40.6107511624314,40.6107793028452,40.6108143211204,40.610821966811,40.6108326639592,40.6108471687916,40.6108449264615,40.6108464950505,40.6108510990373,40.6108800267093,40.6108968071513,40.610904375133,40.6109082836705,40.6109204776649,40.6109349700974,40.6109555309078,40.6109844789047,40.6110187169626,40.6110620604024,40.6110856353782,40.6111153136832,40.6111404200533,40.6111738696137,40.6111761108584,40.6111713869673,40.6111303956524,40.6110801560107,40.6110261118404,40.6109804644483,40.6109408994112,40.6109438802366,40.6109445950159,40.6109506349039,40.6109711041181,40.6109885762189,40.6109991733129,40.6110242194102,40.6110424300933,40.6110469391579,40.6110529680833,40.6110559808649,40.6110301006928,40.6110118540798,40.6109837186922,40.6109525384154,40.6109289378601,40.610909117296,40.6108999355691,40.6108976045274,40.6108975775256,40.6109119861713,40.610927915354,40.610937754456,40.6109498474173,40.6109756774342,40.6110091360389,40.6110486458077,40.6110707402079,40.6110806552387,40.6110974115727,40.6111210071393,40.6111157096533,40.6111020530493,40.6111195991999,40.6111310348591,40.6111265040277,40.611121219373,40.6111242856144,40.6111410398421,40.6111699412839,40.611196559363,40.6112193617424,40.6112352992821,40.6112588471471,40.6112763122654,40.6112922556053,40.6113135414581,40.6113348188098,40.6113492440557,40.6113583410424,40.61136286542,40.6113628499782,40.6113826190273,40.6113970674264,40.6114168326153,40.6114373413156,40.6114548096504,40.611468491481,40.6114852251479,40.6114990609455,40.611520986424,40.6115293579027,40.6115445691225,40.6115689127332,40.6115825796225,40.6115855956923,40.6115939303365,40.6116007451034,40.6116098401505,40.6116029519654,40.6115975996081,40.6116112749898,40.6116226578686,40.6116264230551,40.6116301774176,40.6116362267398,40.6116483646861,40.611654411417,40.6116695994139,40.6116855542748,40.6117022982688,40.6117243850061,40.6117502723439,40.6117647241066,40.6117745940437,40.6117631544284,40.6117540067037,40.6117570154743,40.6117372090099,40.6117242391772,40.6117196330872,40.6117180504353,40.6117126587396,40.6117061700181,40.6116822387109,40.6116639856679,40.6116457282483,40.6116168255025,40.6115894453774,40.6115696484166,40.6115399771673,40.6115217215413,40.6114950956999,40.611469960114,40.6114699252031,40.6114881549688,40.6114987995029,40.6115147832801,40.6115315280934,40.6115429393379,40.6115391146208,40.6115314983512,40.6115269237323,40.6115192977369,40.6115207891458,40.6115489400351,40.611580896747,40.6116151219297,40.6116470296067,40.6116766667258,40.611714690091,40.6117451287347,40.6117727222377,40.6117823855073,40.6117884580025,40.6117891936636,40.6117854935907,40.6117807755588,40.6117837888996,40.6117913708966,40.611799291674,40.61180735481,40.6118187906542,40.6118294512181,40.611850730547,40.6118408197488,40.6118613524009,40.611876589515,40.6118933434021,40.6119017419713,40.6119253415303,40.6119451131458,40.611964118669,40.6119861213884,40.6119762062055,40.6119700927933,40.6119617013535,40.6119601568824,40.6119471882102,40.6119426070961,40.6119547481704,40.6119699412576,40.6119714295192,40.6119790076042,40.611983549052,40.6119979794147,40.6120124278036,40.6120276255631,40.6120344349401,40.6120496611006,40.6120717447307,40.6120907709848,40.6121219460715,40.6121447646877,40.6121615055216,40.6121949654019,40.6122147370127,40.6122253640162,40.6122375095858,40.6122496648994,40.612265612404,40.6122800258989,40.6123020583299,40.6123187686649,40.6123400297955,40.6123392402089,40.6123262857299,40.6123361582828,40.6123422190572]}],[{"lng":[-73.8447349265296,-73.8447229936206,-73.8447057035394,-73.8446924017881,-73.844672452951,-73.8446591630022,-73.8446472024612,-73.8446312728595,-73.8446299707323,-73.8446100115926,-73.8445913840002,-73.8445780805596,-73.8445554929216,-73.844531544806,-73.8445089483928,-73.8444756836863,-73.8444543997129,-73.8444357993846,-73.8444118678238,-73.8443852818047,-73.8443746661564,-73.844356035341,-73.8443454117264,-73.8443308086007,-73.8443108537807,-73.844288243238,-73.8442762877069,-73.8442603265959,-73.844243056165,-73.8442284365072,-73.844213834245,-73.8442072149274,-73.8441952568305,-73.8441699729367,-73.8441446731284,-73.8441313247431,-73.8441113492895,-73.8440927120422,-73.844071417098,-73.8440527886617,-73.8440368463459,-73.8440275558222,-73.8440022654655,-73.8439809776353,-73.8439490529149,-73.8439251095962,-73.8439238153723,-73.8439105184294,-73.8438892345181,-73.8438639605477,-73.8438493348779,-73.8438492993004,-73.8438373104049,-73.8438200363659,-73.843801446562,-73.8437855083859,-73.8437642158303,-73.8437535267425,-73.843742353819,-73.843709821569,-73.8436763916728,-73.8436577788051,-73.8436325447933,-73.8436019592404,-73.8435700244192,-73.8435580830358,-73.8435302093554,-73.8435023199414,-73.8434757601056,-73.843466505357,-73.8434825487096,-73.8435092124542,-73.8435464875277,-73.8435824349682,-73.8435955539724,-73.8436037855299,-73.8436557448743,-73.8436837467453,-73.8436865025941,-73.8436493299525,-73.8436360948614,-73.8436361779906,-73.8436375891791,-73.8436017604471,-73.8435885766166,-73.8435607966931,-73.8434850728361,-73.8434312967933,-73.8426418488656,-73.8421426031247,-73.8420354369124,-73.8419543412693,-73.8418912318505,-73.8418365785253,-73.8417819948889,-73.8417064523443,-73.8416687422647,-73.8416141423191,-73.8415848279028,-73.8415807366068,-73.8415598169002,-73.8415094462146,-73.8415153526835,-73.8415097049056,-73.8415224868138,-73.8415730940218,-73.8415690179674,-73.8415691320521,-73.8415776340019,-73.8415777404744,-73.8415988736229,-73.8415779001828,-73.8414853935297,-73.8414054648174,-73.8413297642604,-73.841262571892,-73.8411366758422,-73.8410191228151,-73.8409392400831,-73.8409097271296,-73.8408382161589,-73.8407793362014,-73.840708152915,-73.8406786495179,-73.840674688955,-73.8406283326262,-73.8406027793688,-73.8406006584557,-73.8405940947806,-73.8404633512916,-73.8403410559739,-73.8401515000889,-73.8399746201101,-73.8398020218296,-73.8395537524229,-73.8393223730004,-73.8391121111206,-73.8389399375165,-73.8388603078202,-73.838818619427,-73.8387726252625,-73.8387137535223,-73.8387261835229,-73.8387553022767,-73.838822345053,-73.8388431397745,-73.8388764872634,-73.83887203436,-73.8388297654202,-73.8387959226323,-73.8386905585273,-73.838576893997,-73.8384295310793,-73.8381770604344,-73.8379793668549,-73.8378363876277,-73.837710268571,-73.8373824375975,-73.8370799718539,-73.8367775784568,-73.8365382728351,-73.8363620065488,-73.8362733164666,-73.836236211469,-73.8362279975167,-73.8363589402717,-73.8365277127985,-73.8366459827445,-73.8367894210466,-73.8369707506827,-73.8371113805957,-73.8372021497535,-73.8373536056825,-73.8374126576274,-73.8374800638429,-73.8375222398563,-73.8375266557178,-73.8374973920094,-73.8374933817753,-73.8374859767051,-73.8374771458891,-73.837460871766,-73.8375619728567,-73.8376797541219,-73.8378102272631,-73.8378878469759,-73.8379286157015,-73.8379918150998,-73.8380341221359,-73.8381185042153,-73.8381822895361,-73.8382571682532,-73.8383202833473,-73.8384426014277,-73.8385185790254,-73.8385230386758,-73.8386411827455,-73.8386566155071,-73.8386627570756,-73.8386798951334,-73.8387180262269,-73.838726598829,-73.8387268852698,-73.8387566835218,-73.8387736971928,-73.8388369487246,-73.8388708044949,-73.8389802341521,-73.8390095754642,-73.8389925788957,-73.8389713833827,-73.8389711669462,-73.8389835890153,-73.8390075544954,-73.8391010956617,-73.8391894616978,-73.8392947320806,-73.8394000172514,-73.8394926651175,-73.8396020867914,-73.8396565500674,-73.8396900831466,-73.8397235993446,-73.839778171914,-73.8398454582904,-73.8399254522003,-73.8399970134174,-73.8400431989323,-73.8400682523409,-73.8400806211448,-73.8400216290304,-73.8400424848316,-73.8400675613826,-73.8401515841758,-73.8401682350298,-73.8400881946618,-73.8400627881147,-73.8400668166789,-73.8400961200363,-73.8401423828568,-73.8401257324051,-73.8401721869819,-73.8402439092965,-73.8403197289947,-73.8404250151227,-73.8404965681561,-73.8405219824354,-73.8405306286689,-73.8404845194153,-73.8404341834747,-73.8403585239177,-73.8402239970561,-73.8401483535744,-73.8401400347869,-73.8401107777867,-73.8400688741971,-73.8400058223426,-73.8399049354177,-73.8398377246423,-73.8397622668143,-73.8396783297804,-73.8395816698765,-73.8394681370959,-73.8394346367263,-73.8394020446723,-73.8393718097293,-73.839359278682,-73.8394056099844,-73.8394705995675,-73.8395317111387,-73.8396326912675,-73.8397840751769,-73.8398807886116,-73.8399944144774,-73.8400156302481,-73.8399400959425,-73.840032749957,-73.8401505941793,-73.8402180566008,-73.8403359466906,-73.8404117798632,-73.8404203354783,-73.8405129962012,-73.8406685684013,-73.8407609918428,-73.8408408155674,-73.8410132010961,-73.8412236431589,-73.8413121436932,-73.841362776236,-73.8413882575904,-73.8413927595267,-73.8414098748905,-73.8413344470237,-73.841267352949,-73.8411749302719,-73.841128799264,-73.8410364537453,-73.8409692221773,-73.8408676978385,-73.8408090878788,-73.8407664325983,-73.8407131738463,-73.8406474232933,-73.8406100996152,-73.8405693842242,-73.8405783433284,-73.8406156992576,-73.8406158089979,-73.8406123673323,-73.840582194758,-73.840582068853,-73.840555357249,-73.8405126863364,-73.8404612355841,-73.8404245509224,-73.840418801155,-73.8404189336526,-73.8404243649144,-73.840424426314,-73.8404475818357,-73.8405309807364,-73.8405328385665,-73.8404974351022,-73.8404549387876,-73.8404195896725,-73.8404197157053,-73.8404411519911,-73.8404395355822,-73.8404574391524,-73.840541016456,-73.8405766039554,-73.840597983577,-73.8406316820575,-73.8406546937252,-73.8406527776698,-73.8406703841384,-73.8407128183989,-73.840751741587,-73.8407944240837,-73.8409927689482,-73.8411064047208,-73.8412284505578,-73.8412375783217,-73.8412792333321,-73.8412681516725,-73.8411840257591,-73.8410719999349,-73.8410554055813,-73.8411003879656,-73.8412013841208,-73.8412798834686,-73.8413416134941,-73.8413249578802,-73.841207365894,-73.8411570728115,-73.841151668878,-73.8411237590197,-73.8411295289571,-73.841269685684,-73.8413538716714,-73.8413821065203,-73.8414887884929,-73.8415841458137,-73.8416512600571,-73.8417071308875,-73.8417349695759,-73.8418581059152,-73.8419478468317,-73.8420321241897,-73.8420715091649,-73.8421836765808,-73.842206343518,-73.8423522988255,-73.8425148924678,-73.8426382307298,-73.8427614782015,-73.8428121866157,-73.8428852985389,-73.8429583110585,-73.8430535971933,-73.8431599262429,-73.84326616483,-73.8433560058054,-73.843602841562,-73.8435638980328,-73.8436312041417,-73.8438329693177,-73.8439733062666,-73.8441806877136,-73.8443095422673,-73.8444272940636,-73.8445268176749,-73.8444940021314,-73.8444309008437,-73.8443845816464,-73.8443257091225,-73.8442458571163,-73.8441534504043,-73.8440441495053,-73.8439180082548,-73.8437918151786,-73.8436908565118,-73.8436193318495,-73.8435351024205,-73.8434718731325,-73.8434338128622,-73.8433916077402,-73.8432906723569,-73.8431603933092,-73.8430763966545,-73.8429418451101,-73.8428619246376,-73.8427610272104,-73.8427063351035,-73.8426431576781,-73.8426304388112,-73.8426386808705,-73.8426469546981,-73.8426552587491,-73.8426887453705,-73.8427054139716,-73.8426674580761,-73.8426212962705,-73.8425835594378,-73.8425080314681,-73.8424997744113,-73.842436747899,-73.8423861999215,-73.8423020142335,-73.8422178745521,-73.8421001343882,-73.842028751858,-73.8419488536346,-73.8419361789036,-73.8419738706307,-73.8420073869784,-73.8420620180231,-73.8421460533585,-73.8422090096454,-73.8422341101596,-73.8422718477437,-73.8423600640593,-73.8424314992509,-73.8425408317016,-73.8426165474347,-73.8427300983309,-73.8428142313857,-73.8427975717112,-73.842797699992,-73.8429154706039,-73.8429660184463,-73.8429577066272,-73.8428778843754,-73.8428443145761,-73.8428108495608,-73.8427984168461,-73.8427607253048,-73.8428238634568,-73.8428701232123,-73.8429247324202,-73.8429751367756,-73.8430255478182,-73.8430717774779,-73.8431432276526,-73.8431852072885,-73.843201906219,-73.843227006355,-73.8432394705631,-73.8432309328276,-73.8432434419889,-73.843298012708,-73.8433484024526,-73.8433190673572,-73.8432897320798,-73.8432898298672,-73.84332777048,-73.8433824837837,-73.8434202602679,-73.8434369430773,-73.8434283754323,-73.8434535523078,-73.8434955398126,-73.8435417472865,-73.8436005755113,-73.8436509504348,-73.843688688135,-73.8436885680832,-73.8437094726817,-73.8437094351696,-73.843751452938,-73.8437851358407,-73.8438229480293,-73.8437850083666,-73.8437302939203,-73.8436671472708,-73.8436586848626,-73.8436501849251,-73.8436458599018,-73.8436415505399,-73.8436456422502,-73.8436119066003,-73.8435697910323,-73.8435654734411,-73.8436032189251,-73.8436493893907,-73.843691362444,-73.8437248812552,-73.8437500278978,-73.8437751593484,-73.8437246412071,-73.8437035046801,-73.8437244611726,-73.8437327879583,-73.8437537228616,-73.8437494428749,-73.8437745969175,-73.8437955462145,-73.8438333446034,-73.8438795754816,-73.8439005321218,-73.8439090606711,-73.8438923244586,-73.8439218036658,-73.8439050518134,-73.8439009517326,-73.843875865111,-73.8439137901323,-73.8438718924608,-73.8438677767656,-73.8439224404882,-73.8439393868358,-73.8438931936972,-73.8438595480259,-73.8438175748896,-73.8438134598942,-73.8438345664936,-73.8437840935402,-73.8437210363684,-73.8437084973965,-73.8437211864011,-73.8437464979693,-73.8438096447991,-73.8438475702581,-73.843830833808,-73.8438519700832,-73.8439318611261,-73.8439949471583,-73.8440244788632,-73.8440540169153,-73.8440541741135,-73.8439912228098,-73.8439492499654,-73.843928285485,-73.8438820559874,-73.843877918509,-73.8439074794641,-73.843869695365,-73.84380667694,-73.843760477777,-73.8437059054494,-73.8436471057611,-73.843621990431,-73.8436430891426,-73.8436515733431,-73.8436558758055,-73.8436223282128,-73.8436140084964,-73.8436141060839,-73.8436058164089,-73.8436058914794,-73.8436060040863,-73.8436313534893,-73.8436482465284,-73.8436652161333,-73.8437367559516,-73.8437956826357,-73.8438965656515,-73.8439889949052,-73.8440688547443,-73.8441191917836,-73.8441442626371,-73.8441567725592,-73.8442029649474,-73.8442617032225,-73.8443288753376,-73.8443834462525,-73.8444632033723,-73.8445178348101,-73.8445682168209,-73.8446059556451,-73.8445511963998,-73.8445342731685,-73.8445383586826,-73.8445466938932,-73.8445171705728,-73.8445254901962,-73.8445548566162,-73.8445968371787,-73.8446514163262,-73.8446681248533,-73.8446217379038,-73.8446048218555,-73.8446089135903,-73.8446718749707,-73.8447011881021,-73.8447220635424,-73.8446757360693,-73.8446335314697,-73.8445913566257,-73.8445870257229,-73.8445616392546,-73.8446035836209,-73.844645527387,-73.8446917581891,-73.8446916761829,-73.8446495744421,-73.8445823432986,-73.8445403622346,-73.8444858185454,-73.8444607321131,-73.8444482889468,-73.8444483486802,-73.8443894807622,-73.8443306965795,-73.8443308310816,-73.844246727576,-73.8441878597376,-73.8441247196037,-73.8441120015107,-73.8441202377955,-73.8441201330395,-73.8441242108087,-73.8441535483533,-73.8441788364937,-73.844271402603,-73.8442965187778,-73.8443005892225,-73.8443257443588,-73.8443340637702,-73.8443381111787,-73.8443673817241,-73.8444008856648,-73.8444511947197,-73.8444973660491,-73.844522475099,-73.84457707892,-73.8446486422981,-73.8446697649016,-73.8446866809421,-73.8446868076839,-73.8446532425202,-73.844615481836,-73.8446239663994,-73.8446912214224,-73.8447289976995,-73.8447752883111,-73.8448132210653,-73.8448595935368,-73.844897488968,-73.8449522178618,-73.8450699319287,-73.8451581814246,-73.8452085570635,-73.8452799876177,-73.8452968883699,-73.8452969849093,-73.8452844970965,-73.8453056541078,-73.8453183878321,-73.8453058768757,-73.8452975864161,-73.8452598391715,-73.8452304876952,-73.8451885511006,-73.8451464510356,-73.8450959633299,-73.845049747506,-73.8450666788946,-73.8450793814595,-73.8450920929833,-73.8451005400605,-73.8451635895842,-73.8452097830512,-73.8452559684677,-73.845319041228,-73.8453947489137,-73.8453948008631,-73.845394889919,-73.8453613193322,-73.8452983290103,-73.8452395364885,-73.8451932687932,-73.8451427887159,-73.8450839210421,-73.8450587524169,-73.845050446663,-73.8450505210409,-73.8450841515641,-73.8451430117167,-73.8452060759337,-73.8452860343942,-73.8453071466422,-73.8453072357483,-73.8453073322773,-73.8452779810111,-73.845189762376,-73.8450888844541,-73.8449838329598,-73.844950299104,-73.8449083915856,-73.8449085106988,-73.8449170247396,-73.8449390597056,-73.8450117952542,-73.8450721015728,-73.8451075380719,-73.8451465095109,-73.8451748396747,-73.8452102887727,-73.8452439356139,-73.8452935667617,-73.8453450039767,-73.8453982199839,-73.8454443475309,-73.8455011454216,-73.8455189310117,-73.8455349565766,-73.8455208152221,-73.845535078568,-73.845554628578,-73.8455989971601,-73.8456220195819,-73.8456485907965,-73.84565738812,-73.8456715194846,-73.8457034064625,-73.8457459572916,-73.8457796237374,-73.8458150644845,-73.845845239241,-73.8458853976148,-73.8459116326988,-73.8459416914646,-73.8459935255172,-73.8460446784227,-73.8460504195721,-73.8460438415911,-73.8460296911847,-73.846045219229,-73.8460588271093,-73.8460547567248,-73.8460481599907,-73.8460301744177,-73.8460207334771,-73.8460548837839,-73.8460779906174,-73.8460868849336,-73.8460983214542,-73.8460879518978,-73.8460690622675,-73.8460956122559,-73.846132542225,-73.8461419399122,-73.846188977504,-73.8462205337263,-73.8462748413707,-73.8462793020998,-73.8462824556455,-73.8462585004051,-73.8462579279705,-73.8462702729731,-73.8462983392961,-73.8463184810365,-73.8463396070433,-73.8463549581849,-73.846362552251,-73.8463672573075,-73.8463874308773,-73.8464079132409,-73.8464059829668,-73.8464340305646,-73.8464630258632,-73.8465071518604,-73.8465355249001,-73.8465739602192,-73.8466250373112,-73.8466814830252,-73.8467136286114,-73.8467460962748,-73.8467931429447,-73.8468262916206,-73.8468806062335,-73.8469251344865,-73.8469472502145,-73.846981654836,-73.8470034177526,-73.8470185463289,-73.8470406234706,-73.8470586067358,-73.8470860580826,-73.8471015295498,-73.8471144809448,-73.8471258566548,-73.847132505541,-73.8471404189847,-73.8471555816326,-73.847186264103,-73.8472035374234,-73.8472314926934,-73.8472581014459,-73.8472780640355,-73.8472967132438,-73.8473219994547,-73.8473486111781,-73.8473738950662,-73.8474071600266,-73.8474478431249,-73.8474674283526,-73.8474830941582,-73.847485290091,-73.8474790696756,-73.8474685933531,-73.8474604978682,-73.8474710776743,-73.8474743715105,-73.847482731605,-73.8474837936962,-73.8474792734866,-73.847488788202,-73.8474921212367,-73.847494838285,-73.8474913809244,-73.8474918701014,-73.8474862062627,-73.84747551045,-73.847446322338,-73.8474462939929,-73.8474563311199,-73.8474562646574,-73.847444918044,-73.8474279124212,-73.8474065676336,-73.8473678111149,-73.8473453494942,-73.8473004510236,-73.8472724115819,-73.8472393297459,-73.8472163046748,-73.8471927107935,-73.8471764037968,-73.8471741126429,-73.847162228985,-73.8471941989318,-73.8472374174058,-73.8472834227156,-73.8472906636346,-73.8472726583086,-73.8472176256624,-73.847179988871,-73.8471086668699,-73.8470631661799,-73.8469969089644,-73.8469334561756,-73.8468733304052,-73.846852492672,-73.8468305280846,-73.8467867347636,-73.846741787,-73.8467142582716,-73.8466715994951,-73.846642448688,-73.8466458650911,-73.8466745282921,-73.8466930813617,-73.8467200736655,-73.8467380788477,-73.8467594358104,-73.846760607356,-73.8467651306896,-73.8467831070486,-73.8467870646168,-73.8468140301243,-73.846832596764,-73.8468298371257,-73.8468315518319,-73.8468096794549,-73.8467703547163,-73.8467484096785,-73.8467494849963,-73.846729767396,-73.8467229887737,-73.846697162719,-73.8466640926878,-73.8466310377441,-73.8465845158443,-73.8465693481907,-73.8465911860481,-73.8466091083637,-73.8466152255963,-73.846646612637,-73.8466246833438,-73.8465915389406,-73.8465897812541,-73.8465925426887,-73.8465829552932,-73.8465975038199,-73.8466233050396,-73.8466429299481,-73.846631658268,-73.8466119783197,-73.8465805027333,-73.8465389806843,-73.846514303228,-73.8464828564615,-73.8464530864459,-73.8464261107155,-73.846377216809,-73.8463642502363,-73.8463423316166,-73.8463125666837,-73.8462811126293,-73.8462350530638,-73.8462069425118,-73.8461984800592,-73.8462034748197,-73.8461888530893,-73.8461658466539,-73.8461427943188,-73.8461236717565,-73.8461073873949,-73.8460765207276,-73.8460372448246,-73.8460193254917,-73.8460025431043,-73.8459728045195,-73.8459581968995,-73.8459295659693,-73.8459099209065,-73.8459121413754,-73.8459463424081,-73.8459648347448,-73.8459878397641,-73.8460029498037,-73.8460225513655,-73.8460371047392,-73.8460511587599,-73.8460511883533,-73.846066356498,-73.8460848945702,-73.8461045119311,-73.8461241343376,-73.846158372811,-73.8462004538797,-73.8462341206655,-73.8462492211557,-73.8462536761064,-73.8462429621471,-73.8462238333264,-73.8462159192286,-73.8462181105161,-73.846198969192,-73.8461955664159,-73.8461831884732,-73.8461685673366,-73.84616797297,-73.8461482900335,-73.8461471315242,-73.8461398035331,-73.8461268873866,-73.846110047686,-73.8461083383983,-73.8461217966628,-73.8461335564893,-73.8461543224932,-73.8461643848721,-73.8461738887078,-73.8461660037995,-73.8461530646397,-73.8461681799647,-73.8461776907093,-73.8461967625744,-73.8462298834772,-73.8462467104018,-73.8462686095276,-73.8462843058774,-73.8462803491472,-73.8462724736669,-73.8462791826803,-73.8463066625615,-73.8463336006361,-73.8463498991057,-73.8463718318137,-73.8463752493269,-73.8463792021,-73.8464111887138,-73.8464189968277,-73.8464442266324,-73.8464745371526,-73.8465098964454,-73.8465200172955,-73.8465419627298,-73.8465751026303,-73.8465986887707,-73.8466216765968,-73.8466340279571,-73.846636233155,-73.8466316955492,-73.8466209889603,-73.8466108388645,-73.8466018259754,-73.8465793619473,-73.8465546324227,-73.8465321431399,-73.846507987573,-73.8464832579145,-73.846464149367,-73.8464433460035,-73.8464286890837,-73.8464269637659,-73.8464157085971,-73.8464050103455,-73.8463909553648,-73.8463757775816,-73.846362280392,-73.8463532711398,-73.8463549199082,-73.8463605055052,-73.8463750640408,-73.8464087181833,-73.8464350760565,-73.8464692817815,-73.8464962091687,-73.8465231144832,-73.8465314901909,-73.8465308854146,-73.8464904602627,-73.846464058077,-73.8464488581801,-73.846451598082,-73.846442009482,-73.8464144716567,-73.8463942506791,-73.8463903067346,-73.8464026472686,-73.8464296029182,-73.8464492881836,-73.8464689699295,-73.8464707345959,-73.8464994004375,-73.8465240963296,-73.8465481992477,-73.8465560753011,-73.8465550217555,-73.8465556255419,-73.8465360529923,-73.8465058072302,-73.84646487242,-73.8464368171189,-73.8464087870713,-73.8463875004395,-73.8463993292806,-73.8464195511628,-73.8464465372022,-73.8464465982044,-73.8464775375434,-73.846540484632,-73.8465662989658,-73.8466027538306,-73.8466370020919,-73.8466404106805,-73.8466556057604,-73.8466893276248,-73.8466770489423,-73.8466585369991,-73.8466546759774,-73.8466698988621,-73.8466553678406,-73.846630178304,-73.8466162069531,-73.8466297432352,-73.8466275701361,-73.8466287555083,-73.846633275633,-73.8466635752536,-73.8466854102264,-73.8467150851618,-73.8467234467892,-73.8467379811063,-73.8467581920525,-73.8467627200143,-73.846759963644,-73.8467560934141,-73.8467718192485,-73.8467875093137,-73.8467924781365,-73.846809242262,-73.8468266107697,-73.8468428906098,-73.8468513347219,-73.8468457785077,-73.8468318122202,-73.8468279507954,-73.8468274468614,-73.8468617413856,-73.84689095135,-73.8468724744663,-73.8468382601141,-73.8468382228223,-73.846810703705,-73.8467686080554,-73.8467338072198,-73.8466900280334,-73.8466625894622,-73.8466300007083,-73.8466164801738,-73.8465996015116,-73.8466028931304,-73.8465798377412,-73.8465585100093,-73.8465466906863,-73.8465258677535,-73.8465017050381,-73.8464775275586,-73.8464522424614,-73.8464213762561,-73.8463882593184,-73.8463416745643,-73.8462788247281,-73.8462243796058,-73.8462075889394,-73.8461931026913,-73.8461998921582,-73.8462324363734,-73.8462588275285,-73.846270116818,-73.8462926556356,-73.8463045769856,-73.8463041087022,-73.8463333344551,-73.8463216294492,-73.8463463841175,-73.8463841490159,-73.8464100890794,-73.8464444171341,-73.8465044974546,-73.8465926446059,-73.84663983014,-73.8467211971561,-73.84679137598,-73.8468301973431,-73.8468915167321,-73.846965646439,-73.8470307839784,-73.8470475627628,-73.8470829320346,-73.8471267371283,-73.8471789635597,-73.8472216197211,-73.8472637081964,-73.8473074971552,-73.8473748634714,-73.8474259749738,-73.847480976467,-73.8475354056262,-73.8475719021788,-73.8475966321568,-73.8476000668075,-73.847604024889,-73.8476164138215,-73.8476344150842,-73.8476613811097,-73.8476797813579,-73.8477045885999,-73.8477382497663,-73.8477577435819,-73.8477772349777,-73.8478055994573,-73.8478339542603,-73.8478623150133,-73.8478959980423,-73.8479349985045,-73.8479509155932,-73.8479739358657,-73.847991634763,-73.8479987062778,-73.8480217696668,-73.848051923043,-73.8480785106575,-73.8481104040756,-73.8481192114769,-73.8481298033024,-73.8481511027284,-73.8481848089312,-73.8482096163547,-73.8482433001765,-73.8482787534881,-73.848312421091,-73.848340782225,-73.8483815692561,-73.8484259327645,-73.8484543151811,-73.8484897998896,-73.8485270481652,-73.8485607320532,-73.8485855540202,-73.8486068650358,-73.8486334534416,-73.8486618076212,-73.8486653157499,-73.8486759226641,-73.8486812171507,-73.8487060363065,-73.8487379638836,-73.8487592471102,-73.8487805073757,-73.8487946821949,-73.8488106333108,-73.8488176949182,-73.8488194316181,-73.8488442538751,-73.8488460745464,-73.8488319318526,-73.848842624966,-73.8488621655849,-73.8489100855769,-73.848933177424,-73.8489704292325,-73.8489916943225,-73.8490218325103,-73.8490413248379,-73.8490501605885,-73.8490518820587,-73.8490909027691,-73.8491033784022,-73.8491176241883,-73.8491619778384,-73.8491939298478,-73.8491940031416,-73.8491958237028,-73.8492029556223,-73.8492349062696,-73.8492438168606,-73.8492278877698,-73.8492279274612,-73.8492155245294,-73.8492155703328,-73.8492297955432,-73.849251119938,-73.8492742107693,-73.8493008318994,-73.8493221030756,-73.8493344900916,-73.8493344473768,-73.8493468435533,-73.8493681090879,-73.8493893839989,-73.8494106556425,-73.8494372482468,-73.8494585540947,-73.8494958313123,-73.849501210611,-73.8495172302967,-73.8495420653506,-73.8495563087591,-73.8495918048541,-73.849635982392,-73.8496467834861,-73.8496449424131,-73.849639566215,-73.849607583235,-73.8495827068365,-73.8495666986836,-73.8495915154954,-73.8495985470238,-73.8495931586147,-73.8495930946534,-73.8495912169969,-73.8495823047528,-73.8495840355468,-73.8495697890391,-73.849564385373,-73.8495802993732,-73.8496139941548,-73.8496281401711,-73.8496316387696,-73.8496120501696,-73.8496403628918,-73.8496634233566,-73.8496846805986,-73.8496988436044,-73.8496899228845,-73.8496561847337,-73.8496490306907,-73.8496383482383,-73.8496223375981,-73.8495885954672,-73.8495601800025,-73.8495335431887,-73.8494927459699,-73.8494537372229,-73.8494129254234,-73.8493880846949,-73.8493632097502,-73.8493472020559,-73.8493170572959,-73.8492993487248,-73.8492798693227,-73.8492781318439,-73.8492834838045,-73.8492888449174,-73.84929952573,-73.8492960082593,-73.8492871782947,-73.8492641805878,-73.8492518100776,-73.8492146054203,-73.8491844579278,-73.8491578287562,-73.8491329965817,-73.8491188384753,-73.8490904963147,-73.8490709825215,-73.8490531854088,-73.8490336447532,-73.8490123583855,-73.8489786528634,-73.8489543328232,-73.8489396578239,-73.8489077364696,-73.8488864485689,-73.8488580819835,-73.8488226069714,-73.8487818127208,-73.8487569928139,-73.8487321278423,-73.8487036855439,-73.8486859011951,-73.8486432901259,-73.8485953729335,-73.8485900116402,-73.8485810861472,-73.8485792575064,-73.8485774284258,-73.8485560883379,-73.8485400780077,-73.8485400043956,-73.8485399062453,-73.8485363150859,-73.8485061337585,-73.8484671075202,-73.8484351520667,-73.8483925591821,-73.8483535228402,-73.8483339856923,-73.8483002563116,-73.8482452702949,-73.8482275772676,-73.8482294012131,-73.8482489421009,-73.8482808697004,-73.8482773770072,-73.8482454454666,-73.8482223664663,-73.8481886590586,-73.8481656125533,-73.8481585422554,-73.8481692413715,-73.8481692997929,-73.8481480118247,-73.8481214039527,-73.8480877137147,-73.8480611333172,-73.8480557644012,-73.8480326700117,-73.8480379637609,-73.848020196959,-73.8480130638106,-73.8480130207196,-73.8480165080418,-73.8480217624411,-73.848042974401,-73.8480766862563,-73.8481263440223,-73.84815293966,-73.8481688601052,-73.8481812286026,-73.8481847329069,-73.8482024474718,-73.8482272576179,-73.8482378551021,-73.8482413455995,-73.8482395247253,-73.8482345963592,-73.8481984234031,-73.8481629481098,-73.8481381219063,-73.8481097813104,-73.8480743244917,-73.8480228780035,-73.8479909377683,-73.8479608178286,-73.8479537770134,-73.8479361055956,-73.8479166446815,-73.8478954096684,-73.8478687979787,-73.8478456995201,-73.847826164906,-73.8477729690261,-73.8477090886136,-73.8476576413066,-73.8476274807159,-73.847584896917,-73.8475458589125,-73.8475529057512,-73.8475315497744,-73.8475030997333,-73.8474676050558,-73.8474303528024,-73.8473966253902,-73.8473717442603,-73.8474196132007,-73.847444400977,-73.8474443515467,-73.8474407609378,-73.8474353962068,-73.8474016718232,-73.847380429181,-73.8473609244676,-73.8473324981455,-73.847327133382,-73.8473164396325,-73.8473004164354,-73.8472861837043,-73.8472577767547,-73.8472275764518,-73.8472044622408,-73.8471973142451,-73.8471830449883,-73.8471510946003,-73.8471209010721,-73.8471066571957,-73.8470853327281,-73.8470586896271,-73.847058655559,-73.8470231663681,-73.8469929789649,-73.8469805239896,-73.8469911143198,-73.8470087960743,-73.8470229371197,-73.8470353177523,-73.8470334971579,-73.8470122042541,-73.846983802432,-73.8469660352123,-73.8469393798304,-73.8469056179418,-73.8468949401432,-73.8468860276065,-73.8468788701561,-73.8468805962389,-73.8469071781516,-73.8469355432905,-73.84695858337,-73.8469673965028,-73.8469371989769,-73.8469123198643,-73.8468839064059,-73.8468501754085,-73.8468501071746,-73.8468571445813,-73.8468986130557,-73.8468709395582,-73.84682444495,-73.8467546230246,-73.8467210419884,-73.8466749206159,-73.8466244905019,-73.8465950041963,-73.8465403100643,-73.8464940709735,-73.8463973946578,-73.8463259907791,-73.8462671890173,-73.846204106855,-73.8461283666438,-73.8460735616297,-73.8460062829947,-73.8459473401565,-73.8459598223434,-73.8459681355389,-73.8459006861952,-73.8458501746615,-73.8457785872661,-73.8457280608301,-73.8456481371384,-73.8455976624969,-73.845509358193,-73.8454757262426,-73.8454211503515,-73.845341360265,-73.8452489853405,-73.8451732965413,-73.8450934835554,-73.8449841995092,-73.8449086075543,-73.8448623381214,-73.8448999888913,-73.8449587694943,-73.845042823912,-73.8451689650871,-73.8452445418556,-73.8453242799603,-73.8453746507303,-73.8454249844575,-73.8454248805759,-73.8455005103915,-73.8456224914639,-73.8456940807396,-73.8458035351152,-73.8458835039221,-73.8459803146305,-73.8460686693409,-73.8461486902625,-73.8462412056391,-73.8462789702237,-73.8462367730337,-73.8461693090065,-73.8461187524202,-73.8460219946532,-73.8459504138359,-73.8458746136635,-73.845828255169,-73.8458113236181,-73.8459204460745,-73.8459539238551,-73.8459158867749,-73.8458064523165,-73.8457978798185,-73.8458103391959,-73.8457471093452,-73.845746968655,-73.845721567298,-73.8456373335037,-73.8455532700862,-73.8455320527278,-73.8455655520094,-73.8456286415475,-73.8456959229829,-73.845737899252,-73.8457672377796,-73.8457670897029,-73.8457627290229,-73.8457415786805,-73.8456657458134,-73.8455858499757,-73.8454933607707,-73.8454429605181,-73.8453882352513,-73.8454554338533,-73.8455562667923,-73.8456150640832,-73.8456779910245,-73.8456736450496,-73.8456146490559,-73.8455262757017,-73.8454505609284,-73.8454210665241,-73.8454545955214,-73.8455049825833,-73.8455680224644,-73.8456184229,-73.845681373951,-73.8456980615756,-73.8457357665139,-73.845735677648,-73.8457020140977,-73.8456473705077,-73.8455884911553,-73.8455296131163,-73.8455547246654,-73.8455798063803,-73.8456427947639,-73.8457352851574,-73.8457603670892,-73.8457518010638,-73.8456844754145,-73.8456045783877,-73.8455246591147,-73.8455370583472,-73.8456292600771,-73.8456921600087,-73.8457095247721,-73.8457548512181,-73.8457504163704,-73.8457334263563,-73.8457022190523,-73.845666150348,-73.8456241803107,-73.8455528636917,-73.8454562264151,-73.8453217505209,-73.8452209837994,-73.8451748608899,-73.8450868057208,-73.8449902369881,-73.8448977239226,-73.8448555013712,-73.8448804932449,-73.8450189135337,-73.845165819394,-73.8452581242005,-73.845249454442,-73.8452870259815,-73.8452699379231,-73.8452360800081,-73.8451979814699,-73.8451766655275,-73.8450881107296,-73.8450753467759,-73.845188648562,-73.8452094671394,-73.8452891288004,-73.8453016184833,-73.8454023578588,-73.8454780309238,-73.8456209268539,-73.8456579795156,-73.8457090815461,-73.8456963326668,-73.8456546076206,-73.8455658816745,-73.8455153293429,-73.8453890452969,-73.845300719866,-73.8452863840803,-73.845274362746,-73.8452836369212,-73.8453142536135,-73.8453635017833,-73.8453874566839,-73.8454140449336,-73.8454232990439,-73.8454072533455,-73.8453792710077,-73.8453379970861,-73.8452967238102,-73.8452714001662,-73.8452567123506,-73.8452606316723,-73.8452779060393,-73.8453111845649,-73.8453537936773,-73.8453710718755,-73.8453563535428,-73.8453416432756,-73.8453136685546,-73.8452857237123,-73.8452790320115,-73.8453002883219,-73.8453229075339,-73.8453614735047,-73.8453734017971,-73.8453706960724,-73.8453546865376,-73.8453320049006,-73.8453252967523,-73.84532526151,-73.8453372124266,-73.8453491836774,-73.8453597947619,-73.8453677368914,-73.8453823542844,-73.845403620073,-73.8454235838232,-73.8454542024074,-73.8455033975926,-73.8455406534994,-73.8455832205485,-73.8456217604414,-73.8456321551454,-73.845644323898,-73.8456442652822,-73.8456301337211,-73.8455736553617,-73.8455350486359,-73.8454977884076,-73.8454764474528,-73.8454675712321,-73.8454351591163,-73.8454098594437,-73.8453894493949,-73.8453272967811,-73.845286082765,-73.8452475022612,-73.8451916222918,-73.8451556967308,-73.8451317227583,-73.845107769956,-73.8450851234064,-73.8450797425702,-73.8450584065889,-73.8450171253638,-73.844973165642,-73.8449491774759,-73.8449211970709,-73.8448905240891,-73.8448798440511,-73.8448612553972,-73.8448346032667,-73.8448332074818,-73.8448331650566,-73.8448194177593,-73.8447907028927,-73.8447721168316,-73.8447668396115,-73.8447495557174,-73.8447349265296],"lat":[40.6139691718016,40.6139509038826,40.6139478386979,40.6139457929535,40.6139417102849,40.6139345936123,40.6139284939615,40.6139122484043,40.6139000784983,40.6139000515186,40.6139000263356,40.6138989949648,40.6138847683349,40.6138837213906,40.613873551626,40.6138735066236,40.6138714493812,40.6138592565665,40.6138511115762,40.6138399218304,40.613827739815,40.6138287284761,40.6138195887769,40.6138053729146,40.6138033174456,40.6137992311051,40.6137911029791,40.6137880390251,40.6137768618674,40.613769744013,40.6137545140828,40.6137403101973,40.613733195946,40.6137341750562,40.6137422526854,40.6137604863864,40.6137675573414,40.6137715877782,40.6137735873363,40.6137735620649,40.6137634005645,40.6137532475853,40.6137572701524,40.6137562267036,40.6137521271511,40.6137490528163,40.6137338410855,40.6137297673163,40.6137277104718,40.6137246338145,40.6137195443468,40.6137347537695,40.6137408216394,40.6137306582996,40.6137144096824,40.6137022197094,40.6137032041546,40.6137224559831,40.6137336181742,40.6137244173037,40.6137149620667,40.6136990037228,40.6136786898246,40.6136715501702,40.613671506715,40.6136572948789,40.6136278513812,40.6136055047262,40.6135831610476,40.6135577986,40.6135253725579,40.6135031013463,40.6134950401569,40.6134859630947,40.6134697800369,40.6134596284145,40.6134313069234,40.6134059951614,40.6133654400948,40.6133298993194,40.6132994612001,40.6132639715964,40.6132294978533,40.6131878752352,40.6131361437179,40.6130671549218,40.6130163521458,40.6129715737463,40.6131729663062,40.6127756523877,40.612690365989,40.6126819053616,40.6126946379054,40.6126881530491,40.6126528259334,40.612588627601,40.612530890334,40.6125019727824,40.6124506568903,40.6124025804223,40.6123576862626,40.6123191599891,40.6122764590751,40.6122101995178,40.6121397136472,40.6120788934113,40.6120244079645,40.6119763372902,40.6119378921755,40.6118930264916,40.6118481896182,40.6118257280492,40.6118223951778,40.6118351035889,40.6118382039496,40.611799654343,40.61169052075,40.6116102397173,40.6116037195342,40.6116357270294,40.61164524136,40.6116483646482,40.6116340386037,40.6115488787971,40.6114463221371,40.6114879195419,40.611622482446,40.6116506542339,40.611737839734,40.6118978941751,40.612041937204,40.6121762715807,40.612284986297,40.612361659543,40.612428611255,40.6124667448835,40.6124664507737,40.6123668633239,40.6122545872252,40.6121039067746,40.6119948814334,40.6119947988415,40.612071729952,40.612203164304,40.6123026041622,40.6123987748166,40.6125206012305,40.6126231461515,40.612712818719,40.612796094593,40.6128920882712,40.6129432036973,40.6130167054845,40.6130804441549,40.6130993940008,40.6130991923777,40.6130829908841,40.6130088192322,40.6128802022665,40.6127227422723,40.6125621657072,40.6124177032412,40.6123194591012,40.6122701064132,40.6121899773767,40.6119530143525,40.6117225151532,40.6115079664369,40.61131909201,40.6111110426474,40.6110820274373,40.6110633004495,40.6110346713533,40.6109610472251,40.6109098663743,40.6108586509949,40.6107721295549,40.6107015841733,40.6106214606568,40.6105289070302,40.6103810838214,40.6101567305944,40.6100831646659,40.6100673073868,40.6100501154332,40.6099355010662,40.6097535964866,40.6097024105725,40.6095967141666,40.6094814625058,40.6095007170012,40.6095233193967,40.6095073845231,40.6093537298052,40.6092352617035,40.6091295131078,40.608963033473,40.6088002977682,40.608735528012,40.6086041585204,40.6084856378246,40.6084183506612,40.6082997768531,40.6081491965993,40.6080691031034,40.6079954829453,40.6079057985426,40.6078642902127,40.6079027881651,40.6079764720502,40.6080469463871,40.6081366779521,40.6082168138895,40.60828206728,40.6083131199814,40.6082876056379,40.6082268633519,40.6081597113198,40.6081021565521,40.6080638519525,40.6081472506434,40.6081921634356,40.608243485697,40.6082820186321,40.6082789075736,40.6082373573257,40.6082054097887,40.608234317087,40.6083080601423,40.6084106280538,40.6084618221478,40.6085323551995,40.60859648445,40.6086286485109,40.6086991756903,40.6087599533755,40.6088336262129,40.6089073406759,40.6089618619644,40.6089587214813,40.6088881943006,40.6088049360477,40.608705689394,40.6086513149041,40.6085841619377,40.6085554189142,40.6084785404853,40.608379206617,40.6083182526111,40.6082669077262,40.6082539833243,40.6082409775584,40.6082216440403,40.6081831761244,40.6081094265663,40.6080484787441,40.608038776487,40.6080258173364,40.6079968818581,40.6079006351463,40.6078332189014,40.6078106501864,40.6078104916719,40.6077527601873,40.6076995160611,40.607650121692,40.6076148521626,40.6075828697271,40.6075982782207,40.6076022743614,40.6075767771198,40.6075737834058,40.6075739181788,40.6075356202347,40.6074555317319,40.6073913322059,40.6073305716712,40.6072858691026,40.6072090503755,40.6071451191704,40.6070843349616,40.6070234568098,40.6069594910608,40.6069629116663,40.6069982917702,40.6070272446816,40.607033892937,40.6069508609689,40.6068676604866,40.6067940220145,40.6066883011285,40.606563323446,40.606438363167,40.6063292981718,40.6062522923221,40.6062169126228,40.6061655733379,40.6060981464488,40.6060788261031,40.6061135867961,40.6061432487866,40.6061769897422,40.6061944914434,40.6062430722569,40.6062727641591,40.6062375561857,40.6061997128521,40.6061565005516,40.6061105330059,40.6060659126641,40.6060726306254,40.6061253581242,40.6061685851809,40.6062090853259,40.6062117180099,40.6061895051325,40.6061535237476,40.6060980921675,40.6060521320101,40.6060264439879,40.6059872689143,40.6059765684641,40.6059414188681,40.6059102744575,40.6058777675584,40.6058236388467,40.6057709113465,40.6057087500363,40.6056424998302,40.6055735731334,40.6054885135262,40.6054425951941,40.6054034169548,40.6054061679452,40.6054264794436,40.6054859649421,40.6055414211181,40.6055996147885,40.605642932838,40.6056432663827,40.605617294643,40.6055328977409,40.6055278885743,40.605486492626,40.6053912242992,40.6053356602923,40.6053483627502,40.6053054780346,40.6052114500266,40.6051559640243,40.6051219199229,40.6051177551858,40.6050922029021,40.6050238130328,40.6049638282474,40.6048953917059,40.6048099255147,40.6047586107313,40.6046902511587,40.6046904448125,40.6046521053611,40.6045666844348,40.6044984640688,40.6044772305281,40.6045456905648,40.6046269537515,40.6047081789824,40.6047938072017,40.604776838802,40.6047000421196,40.6046402743693,40.6046233365998,40.604520816484,40.604439830556,40.6044357802952,40.6044359492339,40.6044745747771,40.6043678204014,40.604269642135,40.6042141932155,40.6042228690466,40.6043042004208,40.6044239891032,40.6043642897095,40.6042962589889,40.6041680165627,40.604155289481,40.6041812013318,40.6041044787151,40.6041261245768,40.6041647560624,40.6041563698428,40.6043227817333,40.6043598420681,40.6043725760166,40.6044013556621,40.6044044807703,40.6043883495754,40.6043465621102,40.6043367998405,40.6043366286036,40.604358889838,40.60437798109,40.6043971121389,40.6044546822059,40.6045218953218,40.6046147808779,40.6046820225872,40.6046914988441,40.604662478783,40.6046207031016,40.6046205193107,40.6046332287428,40.6046266810762,40.6046394250801,40.6046842051315,40.604729053579,40.6047995684092,40.6048572644402,40.6049021423404,40.604966282554,40.6050303997416,40.6050784186534,40.6050398985938,40.6049949808856,40.6049275782037,40.6048634725138,40.6048441582829,40.6048825458339,40.6049208872132,40.604939999578,40.6049430422139,40.6049012829294,40.6049043779195,40.6049299980045,40.6049941442102,40.6050454659895,40.6050583597494,40.6050841127138,40.6051322705308,40.6051867848543,40.6052317031802,40.6052670757301,40.6052864027027,40.6052833477057,40.6052706320687,40.6052611734989,40.6052452650837,40.6051779430897,40.6051234627299,40.6051076002445,40.6050692129642,40.6050275399128,40.6049985884659,40.6049697002172,40.6048959455708,40.6048190160202,40.604754870085,40.6047261134258,40.6047229725136,40.6047454798397,40.6047679813949,40.6047872792737,40.6047969562431,40.6048098726206,40.6048387722572,40.6048900712432,40.6049445848471,40.6050086962216,40.6050631649442,40.6051080480336,40.6051465793077,40.6051754903496,40.6051337891713,40.6050920874825,40.6050504270945,40.6050088166234,40.6049864590178,40.60501535284,40.6050730597653,40.6051403473021,40.6051628147787,40.6051885094752,40.6052078008995,40.6052239044767,40.6052592250369,40.6053041423935,40.6053554184303,40.6054067218862,40.6054227460141,40.6054356213143,40.6054164392586,40.6054293088164,40.6054709189478,40.6054932772453,40.6055252385548,40.605547660894,40.6055861061874,40.6056373753297,40.6056822359942,40.6057303117505,40.6057719270403,40.6058007125774,40.6058487775603,40.6058904899494,40.6059258047859,40.6059579090598,40.6060092303342,40.6060445165418,40.6060862123942,40.6061117812277,40.6061598226742,40.6061886935176,40.6062239568572,40.6062624421722,40.6062944835359,40.6063265649116,40.6063586405671,40.6063779204419,40.6063875970847,40.6064164678954,40.6063652044565,40.6063299297087,40.6063107414018,40.606281876808,40.6062370047154,40.6061760811118,40.6061408806041,40.606076729332,40.6060382668871,40.6060383411322,40.6059838842845,40.6059581833707,40.6059613425027,40.6059292382903,40.6058907758438,40.6058555525051,40.6058618935855,40.6058553981907,40.6058233339567,40.6057913040273,40.605756086422,40.6057241250696,40.6056889245831,40.6056536498234,40.605605608351,40.6056057168631,40.6055993928391,40.6055577712289,40.6055129459566,40.605445646965,40.6053942853335,40.6053621816699,40.6053365151873,40.6053268383963,40.6052979904267,40.605243550212,40.6052178613766,40.6051953424036,40.6051728464289,40.6051343158752,40.605105393047,40.6050572880146,40.6050252695336,40.6049932338891,40.6049515792204,40.6049130767217,40.6048746085428,40.6048329469809,40.6047816606709,40.6047496135859,40.6047015423719,40.6046503018327,40.6046182776275,40.6045542056661,40.6045286654398,40.604503108027,40.6045160639355,40.6045482366264,40.6045611636765,40.6046125076602,40.6046798408712,40.6047247243658,40.6047504245066,40.6048049839805,40.6048499415125,40.604888472272,40.6049462644324,40.6049591570251,40.6049912723576,40.6050361899176,40.6050777770579,40.6051226200261,40.60517390125,40.6052059597093,40.6052443766301,40.6052828447412,40.6053117268117,40.6053406259313,40.6053759517363,40.6054240456821,40.6054816676779,40.605523306499,40.6055713822208,40.6056195386902,40.6056708533268,40.6057349758988,40.6057669604832,40.6058342026409,40.6058886254808,40.6059431001537,40.6060103650243,40.6060552882673,40.6061002103213,40.6061098873078,40.6061451392146,40.6061675149912,40.6061481962586,40.6061192971362,40.6060679471522,40.6060070236761,40.6059332979641,40.6059076605332,40.6059075808461,40.6058722492236,40.6058145647105,40.6058176556033,40.6058175758129,40.6058463325461,40.6058911811524,40.6059649006936,40.6060097670766,40.6060642524659,40.6061059539395,40.606080350715,40.6060548386622,40.6061029428778,40.6061606330857,40.6061927143423,40.6062311824633,40.6062984871442,40.6063690308173,40.6064267608721,40.6064909233321,40.6065262378259,40.6065775474851,40.6066032588472,40.6065681035818,40.606526470946,40.6064848327893,40.6064303524345,40.6063982598912,40.6063629568306,40.6063309211195,40.6063406260232,40.6063695199119,40.606353558262,40.6063151538063,40.606263940216,40.6062415581838,40.6062127901832,40.6062225622543,40.606245114525,40.6062804343978,40.6063029637545,40.6062677344878,40.6062260729302,40.6061715762641,40.6061139200496,40.6060626609933,40.6060177788038,40.60596649145,40.6059247794494,40.6058894879106,40.605841360741,40.6058637372047,40.6058764880095,40.6058604020369,40.6058123541717,40.6057739144403,40.6057322703866,40.6057162582635,40.6057259570567,40.6057516574604,40.6057805620001,40.6057806469026,40.6057711347633,40.6057487016544,40.6057102449202,40.6056813574097,40.6056460206224,40.6056138942886,40.6056202421525,40.6056297874825,40.6056297081511,40.6056040367119,40.6055591589885,40.605527111905,40.6055303620755,40.6055336462324,40.6055369360213,40.605508201335,40.6054697728977,40.6054313161625,40.6053896557741,40.6053543642455,40.6053189934321,40.6053028333304,40.6052738493407,40.6052289380817,40.6051679920047,40.6051167166358,40.6050718620986,40.6050325341671,40.6050299275145,40.6050327135837,40.6050503368469,40.6050733732108,40.605096395227,40.605108610629,40.6051329919175,40.6051492827761,40.6051520560931,40.6051521276891,40.6051494856378,40.6051346900908,40.605114433737,40.6050887678388,40.6050671176151,40.6050360403293,40.6050198432309,40.6050104387786,40.6050266930761,40.605042952805,40.6050740604052,40.6050997668184,40.6051187377628,40.6051282596154,40.6051445281661,40.6051607990873,40.6051527281294,40.6051315394362,40.6051183402993,40.6050897463174,40.6050650313315,40.6050617308493,40.6050364732766,40.6050136045881,40.6049895242346,40.6049642786,40.6049503406304,40.6049356570975,40.6049212105851,40.6049168551891,40.6049036082278,40.6048805536933,40.6048545979966,40.6048310276438,40.6048002430291,40.6047790541076,40.6047559297002,40.6047429708447,40.6047463886359,40.6047784045097,40.6047799112365,40.6047864504177,40.6047843574174,40.604774919086,40.6047682457528,40.6047513699785,40.6047256229723,40.6047116832881,40.6047251950409,40.6047528939652,40.6047644723531,40.6047944368984,40.6048092591545,40.6048220194508,40.6048364829192,40.6048533540254,40.6048689924852,40.6048906858085,40.6049131029449,40.6049451651761,40.6049625282764,40.6049986731112,40.6050283390223,40.605057528918,40.6050825973236,40.6051047779443,40.605102434612,40.605102478795,40.6050977383869,40.6050917822265,40.6050855551301,40.6050884884759,40.6050979019378,40.6051094722164,40.6051191264939,40.6051249254961,40.6051319404558,40.6051312391553,40.6051276469653,40.6051233307943,40.6051153989163,40.6051060249522,40.6051024356986,40.6050962211212,40.6051053694078,40.6050983085202,40.6050983438856,40.6050953280814,40.6050852129821,40.6050811908585,40.6050802123195,40.6050772040688,40.605075220464,40.6050763811693,40.605082477588,40.6051038875145,40.6051257065973,40.6051462322421,40.6051582827945,40.6051675955587,40.6052048269051,40.6052373423482,40.6052625924022,40.6052895439155,40.6053023709967,40.6053143612978,40.6053293381494,40.6053686972357,40.6054080486316,40.6054392769099,40.6054615137672,40.6054756165975,40.6054764337663,40.6054888386032,40.6055175136755,40.605546601867,40.605599631106,40.6056727596977,40.6056804305047,40.6056927849218,40.6056974608209,40.6056956900337,40.605684958042,40.6056703698535,40.6056763279178,40.6056848521051,40.6056980915399,40.6057181941869,40.605760956153,40.6057704099552,40.6057704674067,40.6057786558937,40.6058034769384,40.6058227027999,40.6058350362071,40.6058486744861,40.6058661182734,40.6058823136068,40.6058942030969,40.605906524656,40.6059363885845,40.6059675884484,40.6060000707512,40.6060060010503,40.6060256191144,40.6060371320401,40.6060379308784,40.6060224920231,40.6060011074465,40.6059848904879,40.605971225748,40.6059490173769,40.6059293638995,40.6059174147021,40.6058955994266,40.6058814889364,40.6058746684925,40.6058622678889,40.6058516094321,40.6058323843904,40.6058118468143,40.6057981602807,40.6057908590182,40.6058062065602,40.6058305610226,40.6058506676472,40.6058827247223,40.6059015379339,40.60590492561,40.6058852046769,40.605858637502,40.6058307700732,40.6058367389985,40.6058594407263,40.6058761475492,40.6059009664668,40.6059202588064,40.6059373411543,40.6059497017936,40.6059817828152,40.6060018921942,40.606021557388,40.6060408265928,40.6060485613433,40.6060575701162,40.6060776612714,40.6060926067666,40.6061118152117,40.6061066270161,40.6060984655426,40.606104840418,40.6061146396459,40.6061295753621,40.6061568883272,40.6061816817483,40.6061940578235,40.6062017183427,40.6062115152741,40.6062264254202,40.6062469217068,40.6062653049315,40.6062901223682,40.6063020806432,40.6062999110061,40.606316991256,40.6063340767626,40.6063370495457,40.6063357247705,40.6063296834948,40.6063116926429,40.6062872869397,40.6062833967642,40.6062897938941,40.6062918948667,40.6062922967356,40.6063029934422,40.6063188674565,40.6063317258227,40.60633517827,40.6063544489721,40.6063732973172,40.60639042792,40.6063810354526,40.606368201911,40.6063618065252,40.6063554139751,40.6063674185883,40.606376855651,40.6063769014848,40.6063833740075,40.6063876970817,40.6064112457664,40.6064262234832,40.6064480253173,40.606467250181,40.6064920503445,40.6065151535547,40.6065403668994,40.606555762308,40.6065685793243,40.6065805380999,40.6065946538246,40.6066117385849,40.6066271369961,40.6066408155018,40.6066433650943,40.6066437702507,40.6066553186037,40.606660469385,40.6066724634726,40.6066729183028,40.6066904710822,40.6067071667034,40.6067187062891,40.6067315225509,40.6067486543911,40.6067623554352,40.606767514223,40.6067649921586,40.606770147432,40.6067663269023,40.6067744757465,40.6067864482958,40.6067945656131,40.6068056965203,40.6068155722648,40.6068173194278,40.6068083586324,40.6067895651984,40.6067677529306,40.606757492187,40.6067605295213,40.6067823561207,40.6067943681746,40.6067939804612,40.6067940276872,40.606786768589,40.6067624146752,40.6067521928909,40.6067466622335,40.6067573878144,40.6067561208545,40.6067732354053,40.606794190279,40.6068121423344,40.6068330902199,40.606847194711,40.6068527256942,40.6068668092012,40.6068830350431,40.6068924140791,40.6069069252728,40.6069175944825,40.6069329661495,40.6069607530762,40.6069787171134,40.6069915351518,40.6070064931147,40.6070158851211,40.607026131532,40.6070376636292,40.607050057464,40.6070654602995,40.6070774449367,40.6070924366558,40.6071023201253,40.6071121943393,40.6071263577283,40.6071328093958,40.6071486734922,40.6071670792231,40.6071863281993,40.607191835181,40.6072012118771,40.6072208683874,40.6072499614958,40.6072700543763,40.6072849893377,40.6072913796916,40.6072977906244,40.6073016569392,40.6072952767552,40.6072781914482,40.6072619630454,40.6072268867831,40.607209386431,40.6072094194105,40.6072235686148,40.6072158788144,40.6071859327228,40.6071671114474,40.6071358576911,40.6071080119661,40.6070908461861,40.6070873859148,40.6070723767046,40.6070539537098,40.6070360020035,40.6070291846177,40.6070095431878,40.6069830208716,40.6069535457213,40.6069172688944,40.6069194420371,40.6069314678676,40.6069276637487,40.6069097019545,40.6068921829181,40.606872549915,40.6068421618179,40.6068374313916,40.6068083374613,40.6067784130843,40.6067514435978,40.606721893506,40.6066949247612,40.6066667092824,40.6066350505518,40.6066081020328,40.6065948474515,40.6065991654039,40.606623150047,40.6066548459607,40.6066796678637,40.606705781439,40.6067036697091,40.6066869923425,40.606665599534,40.606639927715,40.6066352429513,40.6066468140067,40.6066827544885,40.6067152879012,40.606728999867,40.6067277381201,40.6067166274381,40.6066918092829,40.6066635564591,40.6066340348314,40.6066087952032,40.6065844571824,40.6065742300708,40.6065545274659,40.60654421518,40.6065604703292,40.6065677057652,40.6065672226187,40.6065680314539,40.606567544861,40.6065397029199,40.6065546316975,40.6065760027887,40.6065939472756,40.6066268902714,40.6066456817484,40.6066447973702,40.6066593263153,40.6066832540269,40.6066951996007,40.6067135618564,40.606725505753,40.6067233258343,40.6067241368151,40.6067236468425,40.6067171460939,40.6067179296725,40.6066969456075,40.6066507258344,40.6066272076098,40.6066311009771,40.6066264305518,40.6065990673464,40.6065610261255,40.6065028638376,40.6064622247945,40.6064451522639,40.6064096309591,40.6063839973961,40.6063151754136,40.6062625933192,40.6062232837092,40.606213097265,40.6062016648129,40.6061850443793,40.6061928532372,40.6061843912545,40.6061442316117,40.6060827129613,40.6060652728796,40.6060520989781,40.6060782155032,40.6060744122409,40.6060633485796,40.6060514401922,40.6060514969017,40.6060549751293,40.6060507552844,40.6060452837951,40.6060295234892,40.606030879932,40.6060377965566,40.6060314287607,40.60601691683,40.6059874043986,40.6059750042704,40.6059566266507,40.6059395389067,40.6059191670712,40.6059326941517,40.6059448953483,40.6059638680762,40.6059720053327,40.6059814952142,40.6059896447134,40.6060018499094,40.6060113521887,40.6060208596618,40.6060317274621,40.6060533802371,40.6060709873593,40.6060885862663,40.606099411142,40.6060980901824,40.6060994815093,40.6061089813909,40.6061252469122,40.6061522981132,40.6061752959547,40.6061699162517,40.60616860932,40.6061808097372,40.6061903177794,40.6062011807789,40.6062174490886,40.6062269505798,40.6062324122376,40.6062257114482,40.6062257488751,40.6062230908974,40.6062244921221,40.6062340005738,40.6062394416248,40.6062286530022,40.6062381520861,40.606250357579,40.6062679376953,40.6062841756993,40.6062963503217,40.6063031434717,40.606304537624,40.606305917091,40.606318113387,40.6063248918425,40.6063316728004,40.6063465545012,40.6063627801536,40.6063682206464,40.6063479432863,40.6063262929701,40.6063046753179,40.6062925326935,40.6062817795049,40.606268290078,40.6062683390348,40.6062778310404,40.6062859832394,40.6062954724045,40.6063103564213,40.6063333425267,40.6063360968525,40.6063104263029,40.6062861090317,40.6062834624891,40.6062740403538,40.6062415930437,40.6062213158454,40.6062051011646,40.6061956790162,40.6061781147047,40.6061618697715,40.6061442943265,40.606137518249,40.6061172380517,40.6061023848036,40.6060861894066,40.6060726999097,40.60606732647,40.606074114165,40.6060876501844,40.6061065777543,40.6061160580679,40.6061255500046,40.6061309857306,40.6061377740799,40.6061445687256,40.6061364846987,40.6061257173255,40.6061000369371,40.6060757219389,40.6060757544527,40.6060527892526,40.6060447237746,40.6060283533224,40.606050204057,40.6060799447975,40.606104273738,40.6061272157372,40.6061461108093,40.6061650179862,40.6061731624007,40.6062015632922,40.606231300562,40.6062596914979,40.6063056573997,40.6063245738644,40.6063435030849,40.6063678204125,40.6064043169644,40.6064273216369,40.6064314226187,40.606451720211,40.6064733565035,40.6065071309108,40.6065382644025,40.6065382945682,40.6065518421511,40.6065640283242,40.6065870005019,40.6066018282834,40.6066275063562,40.6066450690504,40.6066653271871,40.6066815070723,40.6066963422937,40.6067084750765,40.6067070695311,40.6066989065077,40.6067042608886,40.6067069324298,40.6067244753268,40.6067433824729,40.6067379357816,40.6067243916112,40.6067094948301,40.6066932685142,40.6066797552499,40.6066621867838,40.6066459767513,40.6066324523592,40.6066148647821,40.6065864429343,40.6065661464534,40.6065444659347,40.6065403706634,40.6065497992792,40.6065484145577,40.6065335240635,40.6065159113572,40.606515885734,40.6065415504636,40.6065536924501,40.6065536644886,40.6065536202054,40.6065451568335,40.6065400491801,40.6065359510022,40.6065359230154,40.6065291257423,40.6065277276277,40.6065249697048,40.6065181772406,40.6065316642983,40.606557314293,40.6065775711377,40.6065937383992,40.6066031393514,40.606620708958,40.6066450325024,40.6066693660661,40.6066936991266,40.6067166548538,40.6067369145157,40.6067693618238,40.6068126251244,40.6068315480168,40.6068423244319,40.6068422729856,40.6068530470431,40.6068611023005,40.6068651070211,40.6068758974345,40.6068866684434,40.6068838917659,40.6068635886499,40.6068419593435,40.606829816824,40.6068312111029,40.6068068705197,40.6068068283634,40.6068149104939,40.6068162174354,40.6068094271861,40.6067986021557,40.6067742809872,40.6067485924602,40.6067485643366,40.6067485291793,40.6067417246813,40.606729521895,40.606749795054,40.6067646364299,40.6067768105779,40.60678895524,40.6068051698453,40.606824097916,40.6068511420876,40.6068808933557,40.6069133681369,40.6069107091153,40.6069161825878,40.6069216260753,40.6069419273636,40.6069635749141,40.6069825076702,40.6069933465898,40.6070041955467,40.6070244897962,40.6070501818357,40.6070704591848,40.6070908223938,40.6070873798109,40.6070859808226,40.6070818923069,40.6070629267305,40.6070534158044,40.6070546999181,40.6070587138985,40.607042450692,40.6070181049033,40.6069883377075,40.6069653281148,40.6069423161708,40.6069436330789,40.6069598263729,40.606969264072,40.6069597300676,40.6069677575456,40.6069690408245,40.6069703529727,40.6069743527294,40.6069797087998,40.6070013498617,40.6070310653512,40.6070607719271,40.6070674846334,40.6070674351895,40.6070768539748,40.6070971011929,40.6071093324013,40.6071296455611,40.6071512772102,40.607170200069,40.6071891210752,40.6071971882398,40.6071782319071,40.6071741502897,40.6071930401597,40.6072119611608,40.6072335786701,40.6072592449816,40.60727680207,40.6072875805149,40.6073064685039,40.6073294216214,40.6073523954592,40.6073861770258,40.607394245973,40.6074104291828,40.6074333940788,40.607449589747,40.6074644267079,40.6074792979007,40.6074833075599,40.6074967871569,40.6075129939425,40.6075359918841,40.6075617035216,40.6075833540578,40.6075995950746,40.6076198717342,40.6076225476514,40.6076306217779,40.6076427657734,40.6076630100323,40.6076873015406,40.6077021585552,40.6077210754792,40.6077481055024,40.6077683873868,40.6077805911168,40.6077887403267,40.6077982350705,40.6078225827759,40.6078401180604,40.6078590130521,40.607872494983,40.6078832655641,40.607913009791,40.6079387072671,40.6080120480196,40.6080311304308,40.6080631897,40.6080646057316,40.6080389234482,40.6079811772521,40.6079682906288,40.6079906839483,40.608003430275,40.6079969588596,40.6079808067006,40.6079454592441,40.6079165382692,40.6079196587119,40.607941990011,40.6080028061438,40.6080027160232,40.6080346842113,40.6080923856213,40.6081340584416,40.6082076763817,40.6082300418218,40.6082748118003,40.6083035863336,40.6083162976993,40.6083226395745,40.6083225209167,40.6083192708716,40.6082807418145,40.6082357674615,40.608177958948,40.6081778570164,40.6081424974665,40.6081231211188,40.6080813586359,40.6080877046898,40.6081710783604,40.608209615013,40.6082289562005,40.6082323310275,40.6082805041597,40.608347909505,40.6083864341234,40.6084409823405,40.6084858480436,40.6085115879045,40.6084957276329,40.6084509577547,40.6083966248024,40.6083646848836,40.6083231529749,40.6083008386683,40.6082464659646,40.6082433844276,40.6082786874527,40.6083427248549,40.6084227524331,40.6084643459332,40.6084834446892,40.6085250104506,40.6085729796761,40.6086177840147,40.6086658314761,40.6087557096606,40.6088262585484,40.6089095304127,40.6089542494959,40.6090247420087,40.6090920579018,40.6091592722403,40.6092201615602,40.6092938358112,40.6093514073906,40.6093352714644,40.609418565128,40.609479500823,40.6094731759047,40.6094732662481,40.6095053692606,40.6095470696357,40.6096111637775,40.6096784571005,40.6097329092242,40.6097936969312,40.6097935896247,40.6097838513349,40.6097581460728,40.6097837099737,40.6098190523501,40.6098576442173,40.6098897703767,40.6099539492196,40.6100148328884,40.6100692341672,40.6100979582699,40.6101074709914,40.6101330683274,40.6101811840833,40.6102132989892,40.6102294073731,40.6102551130814,40.6103096781199,40.6103673851909,40.6104283253026,40.6104667820188,40.6104763513358,40.610466663467,40.6104697892182,40.6104729149409,40.6105242236845,40.6105883517181,40.6106268931585,40.6106366318298,40.6107007593208,40.6107680469928,40.6107871849579,40.6107870776645,40.6107965842848,40.6108895381157,40.6110242598109,40.6111012579362,40.6112085786799,40.6112679875735,40.6113673274474,40.6114410139786,40.611439484934,40.6114377183309,40.6114024099721,40.6113286058395,40.6112932239504,40.611254586233,40.611187151423,40.6111294046425,40.61102032567,40.6109561011471,40.6109559763481,40.6110296276974,40.6111322125933,40.6112830206392,40.6114017934515,40.6114916500824,40.611603803569,40.6117224283005,40.611837775791,40.611930666362,40.6120395763842,40.6121645309887,40.6122701676637,40.6123342447847,40.6124369485904,40.6125267084445,40.6126293663397,40.6126838634733,40.6127641169929,40.6127738325752,40.6128092765753,40.6128376126305,40.6128766940913,40.6129343623006,40.6129441414168,40.6129726439347,40.6130110321604,40.6130653428575,40.6130716336858,40.6130975142347,40.6131177782985,40.6131350286966,40.6131289857451,40.6131219539651,40.6131199589184,40.6131301338797,40.6131554961698,40.6131899504202,40.6132071506976,40.6132182489279,40.6132293471442,40.6132475653628,40.6132698531057,40.6133012923836,40.6133114555077,40.6133054161399,40.6132922924451,40.613300427117,40.6133358975346,40.613367310572,40.6133814690163,40.6133824459636,40.6133996742008,40.6134138988974,40.613413929337,40.6134231072107,40.6134434028311,40.6134626650461,40.6134808958119,40.6135072290253,40.6135315554538,40.6135467653798,40.6135569213312,40.6135589658812,40.6135731762438,40.6135914387288,40.6135995698192,40.6136097387953,40.6136077372004,40.6136006803276,40.6136169709897,40.6136170210581,40.6136221478496,40.6136424793574,40.613653705207,40.6136668461184,40.6136921958832,40.6137176024725,40.6137306319145,40.6137386926416,40.6137406703387,40.6137629491658,40.613781893996,40.6137801315681,40.6137882094757,40.6138127908867,40.6138164900798,40.6138022385286,40.6137991447674,40.6137970417502,40.6137969933609,40.6138071014363,40.6138080825462,40.6138192062871,40.6138445488786,40.6138647998618,40.6138789402966,40.6139001751473,40.6139163661495,40.6139325524308,40.6139629304883,40.6139781260491,40.6139608637192,40.6139780649885,40.6140064547745,40.6140247065171,40.6140382286712,40.6140158911004,40.6139976137004,40.6139783413899,40.6139722338906,40.6139691718016]}],[{"lng":[-73.8337015227225,-73.8338077661466,-73.8339526640577,-73.8340188813449,-73.8340549238553,-73.8340650454801,-73.8341058115228,-73.8341784916675,-73.8343416812231,-73.8344594662892,-73.8346032336605,-73.8347239132572,-73.8348424786392,-73.834901835637,-73.8349619025123,-73.8350122087838,-73.835041773853,-73.8350662022084,-73.8351209854228,-73.8351713481256,-73.8352062395714,-73.8352550105003,-73.8353228174421,-73.8353889195752,-73.8354228868332,-73.8354544927341,-73.835469559392,-73.8354787638207,-73.8354581461233,-73.835439879285,-73.835428798389,-73.8354247935325,-73.8354277774211,-73.8354660015076,-73.8355164942013,-73.8355889456075,-73.8356577857653,-73.8357479272823,-73.8357932219405,-73.8358557262376,-73.8359045024457,-73.8359859131346,-73.8360464298303,-73.836101642926,-73.8361513804287,-73.8362017028098,-73.8362217349483,-73.8362210400551,-73.8362114540538,-73.8361537005866,-73.8361428910179,-73.8361481696719,-73.8361902526526,-73.8362319289268,-73.8362551680592,-73.8362729621881,-73.836296643472,-73.8363197142523,-73.8363440349503,-73.8363429894532,-73.8363016504599,-73.8362555309458,-73.836256190453,-73.8362586810274,-73.8362844365984,-73.8363225946108,-73.8363821447317,-73.8364208085591,-73.8364707116641,-73.8365081016467,-73.836548424924,-73.836585093377,-73.83660620421,-73.8366029365979,-73.8365920203188,-73.8366066329066,-73.8366362635533,-73.8366737023648,-73.8367397195243,-73.8367910638889,-73.8368484115524,-73.8368634180439,-73.8368896711259,-73.8369199842638,-73.836978729401,-73.8370292180859,-73.8370708085917,-73.8371224799957,-73.837177169173,-73.8372153034175,-73.8372456728408,-73.8372664239446,-73.8372628363242,-73.8372781397399,-73.8372972061423,-73.8373329658717,-73.8373677899974,-73.8373892307087,-73.837422505036,-73.8374676028083,-73.8375080870981,-73.8375307723101,-73.837573779575,-73.8376112429984,-73.8377057274092,-73.8377413708324,-73.8377670214337,-73.8377855655564,-73.8377916748415,-73.8377878317712,-73.837755562017,-73.8377251129955,-73.837711540363,-73.8376795970798,-73.8376222064016,-73.837495949028,-73.8374229981589,-73.8372996732636,-73.8372499300114,-73.8372186510887,-73.8371732756671,-73.8370492699034,-73.8370134265097,-73.836955260843,-73.8369098915,-73.8368820624732,-73.8368202713212,-73.8367477066058,-73.8366104464637,-73.8365605989013,-73.836530385384,-73.8364653987026,-73.8364402972008,-73.8363382174353,-73.8362102842952,-73.8361498330898,-73.8359416252941,-73.8357451095983,-73.8355888870073,-73.8355431630785,-73.8354318767107,-73.8352737830109,-73.8352001877936,-73.8351567994511,-73.8351060716074,-73.835067600605,-73.8350307973849,-73.8349818113316,-73.8349622264558,-73.8349541688198,-73.834942837811,-73.8349503574373,-73.834960316077,-73.8349660070491,-73.8349669990919,-73.8349785438372,-73.8350130729502,-73.835050905278,-73.8350822278179,-73.8351110576517,-73.8351473448358,-73.8351647277844,-73.8351689232542,-73.8351591311129,-73.8351484802342,-73.8351287554167,-73.8351089917363,-73.8350842823252,-73.8350538664354,-73.8350317253916,-73.8350186575449,-73.8350039738718,-73.835004125879,-73.8349894757005,-73.8349682566811,-73.8349734195504,-73.8349613891382,-73.8349607978382,-73.8349758522933,-73.8350336707774,-73.8350881781379,-73.8351220063945,-73.8351500488315,-73.8351673058481,-73.8352056672886,-73.8352129061446,-73.8352580236195,-73.8353150144401,-73.8353434918206,-73.8353565078121,-73.8353618279897,-73.8353404200956,-73.8353302749994,-73.8353355951704,-73.8353562961643,-73.8353888561235,-73.8354143575975,-73.8354351031843,-73.8354611268022,-73.8354918361831,-73.8355035026626,-73.8354938344984,-73.8354948847951,-73.8354948178916,-73.8355031030524,-73.8355207781153,-73.8355497645033,-73.8355721829268,-73.8356087250804,-73.8356595804958,-73.8357144689941,-73.8357287001622,-73.8357451368968,-73.8357470655858,-73.8357258314019,-73.8357145401232,-73.8357073321676,-73.8356673493014,-73.835649230649,-73.835638702927,-73.8356062648575,-73.8355628264294,-73.8355469640055,-73.8355369686483,-73.8355332703174,-73.8355123629349,-73.8354939159681,-73.8353830853108,-73.835316998665,-73.8352673933079,-73.8352293791051,-73.8352087585221,-73.8351961685202,-73.8351464581919,-73.8351176637602,-73.835082431984,-73.8350496237331,-73.8350126805641,-73.8349920065261,-73.834958150637,-73.8349562086194,-73.8349558553738,-73.8349555051878,-73.8349551170195,-73.8349547307974,-73.8349543433933,-73.8349539207935,-73.8349534982628,-73.834953112246,-73.834952725887,-73.8349526740325,-73.8349530577307,-73.8349534274694,-73.8349537597853,-73.8349538231921,-73.8349546689988,-73.8349559415769,-73.8349560500377,-73.8349572147898,-73.8349575746703,-73.8349577912142,-73.8349600367523,-73.8349602894884,-73.8349624981702,-73.8349628472383,-73.8349651381767,-73.8349678131547,-73.834970488724,-73.8349707236585,-73.8349708147561,-73.8349744631493,-73.8349748596191,-73.8349785064757,-73.8349788677645,-73.8349825889968,-73.8349829126306,-73.8349866323872,-73.8349869574908,-73.8349873200319,-73.8349876436657,-73.8349909538887,-73.8349913280428,-73.8349916883216,-73.8349957312985,-73.8349960576545,-73.8350001006294,-73.8350003893888,-73.8350044706901,-73.8350047573987,-73.8350088740133,-73.8350098863333,-73.8350101381706,-73.8350142166818,-73.8350146512523,-73.8350187296925,-73.8350303567066,-73.8350329547013,-73.835035627714,-73.8350388417637,-73.8350420905486,-73.8350454113645,-73.8350460063108,-73.8350486620065,-73.8350518758538,-73.8350527483464,-73.8350556643468,-73.8350599580498,-73.8350628545979,-73.8350646847321,-73.8350699521088,-73.8350761228927,-73.8350765558735,-73.8350822214234,-73.8350881028404,-73.8350938384386,-73.8350998647206,-73.8351057108908,-73.8351077682307,-73.8351108711779,-73.83511563654,-73.8351178795717,-73.835119860312,-73.8351233990678,-73.8351257453127,-73.8351265079199,-73.8351288220163,-73.835131175028,-73.8351334896464,-73.8351358058727,-73.8351392553218,-73.8351442393881,-73.8351448904941,-73.8351455113529,-73.8351464219773,-73.8351471583276,-73.8351473326706,-73.835148243368,-73.8351491540611,-73.8351494257211,-73.8351490917753,-73.835148632656,-73.8351483285457,-73.8351479582799,-73.8351468885224,-73.8351461071233,-73.8351457096841,-73.835144993865,-73.8351437763399,-73.8351427632169,-73.8351406900305,-73.8351382940466,-73.83513659621,-73.8351345117639,-73.8351327038441,-73.8351310980016,-73.8351259921634,-73.8351249877988,-73.8351203971722,-73.8351172543379,-73.835113679823,-73.835111438535,-73.8351084370432,-73.8351080784115,-73.8351047176257,-73.835102476429,-73.8350991135346,-73.8350957504204,-73.8350901355716,-73.8350823496953,-73.8350822889517,-73.8350765455416,-73.8350720393943,-73.8350688268189,-73.8350685426179,-73.8350663066242,-73.8350643232076,-73.8350625928299,-73.8350610788407,-73.8350564819439,-73.8350549463464,-73.8350538626773,-73.835052853897,-73.8350519518141,-73.8350510859881,-73.8350502914641,-73.8350474995207,-73.8350340190451,-73.8350181244029,-73.8350174383655,-73.8350167875065,-73.8350161730606,-73.8350150188325,-73.835014440574,-73.8350138994767,-73.8350133580035,-73.8350128517082,-73.8350117692039,-73.8350112281037,-73.8350081733543,-73.8350079768696,-73.8350046200055,-73.8349973994533,-73.834996938946,-73.8349935377353,-73.834989677692,-73.8349858161755,-73.8349820281611,-73.8349782393332,-73.8349739816187,-73.8349722351654,-73.8349695797157,-73.8349649997164,-73.8349603458414,-73.8349556555557,-73.8349509300929,-73.834946169317,-73.8349417322705,-73.8349396811897,-73.8349374365567,-73.8349366472464,-73.8349340715475,-73.8349318282334,-73.8349295479193,-73.8349284659933,-73.8349165094118,-73.8349049269299,-73.8349030728471,-73.8349015619161,-73.8349014869659,-73.834901415513,-73.8349013069047,-73.8349010547312,-73.8348981996759,-73.8348969468732,-73.8348948346632,-73.8348937136233,-73.8348925904721,-73.8348919737453,-73.8348914696521,-73.8348892261189,-73.8348892240046,-73.8348881010744,-73.8348878242643,-73.8348868480473,-73.834886595127,-73.8348865595945,-73.8348865221499,-73.8348864874956,-73.8348829467631,-73.8348824800686,-73.8348799830297,-73.8348799829617,-73.8348779770239,-73.8348772335999,-73.8348771974066,-73.8348748086946,-73.8348747713192,-73.8348734734939,-73.8348733607847,-73.834873177487,-73.8348715428282,-73.8348715426231,-73.8348712096223,-73.8348705209105,-73.8348678015525,-73.8348680589444,-73.8348680582626,-73.8348683345925,-73.834868368295,-73.8348686092908,-73.834868643738,-73.8348688705579,-73.8348689196081,-73.8348689552389,-73.8348694830631,-73.8348695532258,-73.8348699675616,-73.8348702612646,-73.8348717975153,-73.834873083494,-73.8348733338331,-73.8348745832996,-73.8348748346877,-73.8348760852348,-73.8348763695508,-73.8348766377702,-73.8348769009059,-73.8348770072858,-73.8348773571777,-73.8348774618856,-73.8348775679978,-73.834877672959,-73.8348777276899,-73.8348777413551,-73.8348777298149,-73.8348777264199,-73.8348777065593,-73.8348773560909,-73.8348771371727,-73.83487656804,-73.834876405793,-73.834874311164,-73.83487206296,-73.8348698154167,-73.8348630748097,-73.8348540914558,-73.8348532598478,-73.8348516000331,-73.8348498695797,-73.8348476693381,-73.8348454332642,-73.8348432325852,-73.8348413931647,-73.8348395898668,-73.8348377865713,-73.8348360554538,-73.8348320873145,-73.8348296716328,-73.8348271829766,-73.8348245869599,-73.8348218459241,-73.834820420544,-73.8348192127855,-73.8348167235162,-73.8348080715868,-73.8348049974978,-73.8348016051196,-73.8348002105884,-73.8347985363993,-73.8347934678554,-73.8347820215867,-73.8347799660519,-73.8347787296537,-73.8347756192995,-73.8347754643891,-73.8347742749141,-73.8347732007194,-73.8347731095789,-73.8347720600692,-73.8347720346959,-73.8347752830577,-73.8347753438709,-73.834776712699,-73.8347817184696,-73.8347827551249,-73.8347838644834,-73.8347842455876,-73.8347896345754,-73.8347898237672,-73.8347912485592,-73.8347929706605,-73.8347947643135,-73.8347965214561,-73.8347967010424,-73.8347994309424,-73.834802233262,-73.8348050342786,-73.8348054631281,-73.8348081235095,-73.8348114313081,-73.834814843199,-73.8348155271719,-73.8348189414525,-73.8348231839132,-73.8348274623599,-73.8348278341032,-73.8348319938026,-73.8348365260383,-73.8348409850448,-73.8348412646402,-73.8348453732592,-73.834849688398,-73.8348539328114,-73.8348546953976,-73.8348581422215,-73.8348622064133,-73.8348660574796,-73.8348692512109,-73.8348791189421,-73.8348844811744,-73.8348897331126,-73.8348902009296,-73.8348907053958,-73.8348958868924,-73.8349006027424,-73.8349058543033,-73.8349107125517,-73.8349155344521,-73.8349203559822,-73.8349241199415,-73.8349251798324,-73.8349300747496,-73.8349449784079,-73.8349465256441,-73.8349503789478,-73.834951385703,-73.8349568233634,-73.8349666933991,-73.83497299098,-73.8349788981573,-73.8349847319693,-73.8349903869734,-73.8349959325553,-73.8350364867561,-73.8350619411889,-73.8351114097911,-73.8351494542104,-73.8351892113872,-73.8352126728637,-73.8352471340972,-73.8352833721995,-73.8352988919841,-73.8353120185351,-73.8353050459971,-73.8352570359082,-73.835228061921,-73.8351794740809,-73.8351110938128,-73.8350599286959,-73.8350194544917,-73.8349766806337,-73.8349429124769,-73.8349347485128,-73.8349043679197,-73.8348827460917,-73.8348444306079,-73.834824453102,-73.8347827736635,-73.8347310977346,-73.8346794067441,-73.8346527279906,-73.8346127141456,-73.8345777052103,-73.834559364116,-73.8345460578162,-73.8345694355255,-73.83462614303,-73.8346778434283,-73.834689574062,-73.8347163193084,-73.8347297458532,-73.8347264638929,-73.8347232100316,-73.8346999821335,-73.8346633668199,-73.8346300636243,-73.8345834541984,-73.8345634743623,-73.8345235205711,-73.8344769049511,-73.8344452760072,-73.8344119830706,-73.8343786768854,-73.8343654236579,-73.8343755092232,-73.8343905863805,-73.8343589361294,-73.8343055565618,-73.834270529007,-73.8342455365804,-73.8342005543395,-73.8341605620879,-73.8341322410162,-73.8341172483734,-73.834075609784,-73.83404064383,-73.8339940223268,-73.8339640748134,-73.8339224837632,-73.8338941700059,-73.8338557951345,-73.8338007558092,-73.8337790198303,-73.8337772801058,-73.8337755546647,-73.8338305305606,-73.8338855148847,-73.8339221739153,-73.8339854906472,-73.8340204865856,-73.8340704618825,-73.8341121059441,-73.8341037142295,-73.8340986453067,-73.8340952395092,-73.8340884901161,-73.8340734064944,-73.8340716375813,-73.834095008943,-73.8341200803642,-73.8341251508249,-73.8341252329306,-73.8341353044454,-73.8341703636061,-73.8341953844502,-73.8342303883988,-73.8342436383952,-73.8342485501454,-73.8342851944559,-73.8343268436663,-73.8343484358198,-73.8343900787738,-73.8344300901345,-73.8344583654138,-73.8344733045855,-73.8344532295521,-73.8344397817051,-73.8343896657507,-73.8343646542486,-73.8343112741536,-73.834257874678,-73.8342328284572,-73.8342144085002,-73.8341993138516,-73.8341992160009,-73.8342057545651,-73.8342390160906,-73.8342756415141,-73.834322241588,-73.8343154512397,-73.8343019834162,-73.8342802175788,-73.8342401156836,-73.8341933484597,-73.8341032502094,-73.8340264935901,-73.8339647695521,-73.8338846272314,-73.833819522399,-73.8337627138631,-73.8337359329923,-73.8337015227225],"lat":[40.6209786013443,40.6187701020658,40.6157578334979,40.6143811664197,40.6143618879342,40.6143564744324,40.6143594422504,40.6143619905331,40.6143654371974,40.6143924504214,40.6144139015845,40.6144505266687,40.6144679338275,40.6144681574751,40.6144729087501,40.6144923329335,40.6145093936503,40.6145202152383,40.6145356921087,40.6145466343004,40.6145359790443,40.6145497449672,40.6145706757232,40.6145965983779,40.6146104544359,40.6146324580686,40.6146572640704,40.6146933993851,40.6147138454587,40.614730672913,40.6147547015079,40.6147723722809,40.6147745998328,40.6148734667822,40.6149487464122,40.6150289164449,40.6150986783764,40.6151629251547,40.6151843987559,40.615208999053,40.6152205139515,40.6152318849171,40.615229775946,40.6152313083341,40.6152184248794,40.6152023566694,40.6151850650413,40.6151746611596,40.6151620494748,40.6151392671333,40.6151261876325,40.6151180150423,40.6151123927661,40.615125765023,40.6151378746374,40.6151377907546,40.6151308795603,40.6151226237403,40.6151193371028,40.6151347333883,40.6151597899967,40.6151808323152,40.6151912349736,40.6152034259337,40.6152322550199,40.6152555858629,40.6152801816666,40.6152890205831,40.6152964750999,40.6152958420858,40.6152884055151,40.6152728672172,40.615242458014,40.6152085545113,40.6151796643356,40.6151547068426,40.6151455269784,40.6151539238023,40.6151708152314,40.6152081075967,40.6152498824936,40.6152701609165,40.6152867773611,40.6152925009496,40.6152931337722,40.615297404985,40.6153017183459,40.6153087090198,40.6153179535268,40.6153367545528,40.6153492588781,40.6153468997937,40.6153410487844,40.6153287738078,40.6153381599809,40.615356079754,40.6154029552737,40.6154132506208,40.615416701209,40.6154155847403,40.6154307658384,40.6154483097273,40.615477932534,40.6154908865501,40.6155026299267,40.6155092391791,40.6155222314188,40.6155393313238,40.6155596503429,40.6155999117266,40.6156430418002,40.6156924869337,40.6157043253189,40.6157171258501,40.615737301416,40.6157564749607,40.6157617784767,40.6157741477358,40.615789310913,40.6158102643932,40.6158507401747,40.6159946938111,40.6160410031714,40.6161127514913,40.6161509496178,40.61615969402,40.61615230406,40.6161318351783,40.6161130584976,40.6161123836919,40.6161214100884,40.616156714052,40.6161704023274,40.6162437078503,40.6163433802153,40.6163922898092,40.6165452624197,40.6167178485843,40.6168807210776,40.6169318527468,40.6170563006552,40.6172472219554,40.6173520500243,40.6174186320784,40.6174965116373,40.6175555518475,40.6176246136856,40.617740730025,40.6177803088119,40.6178336286353,40.6178857092358,40.6179183007631,40.6179408492371,40.6179590170627,40.6179621864628,40.6179696683019,40.6179608247481,40.6179563507277,40.6179619395423,40.6179712863045,40.6179944226899,40.6180150598984,40.6180370242923,40.6180646229048,40.6180746816604,40.6180828877639,40.6180785225901,40.6180785963733,40.6180842899368,40.618108796659,40.6181351828409,40.618173451721,40.6182142395856,40.6182682081686,40.6183134125824,40.6183811335909,40.6184689503312,40.6185329306967,40.6185918557153,40.6186481783947,40.6187032634478,40.6187301561674,40.6187376341746,40.618736341974,40.6187074042166,40.6187079438181,40.6187002956113,40.6186971938818,40.6187035751492,40.6187130901799,40.6187320912455,40.6187510552021,40.6187754687606,40.6187944715027,40.6188283988267,40.6188578427943,40.6188732496018,40.6188891156615,40.6189262076718,40.6190058524099,40.6191098958029,40.619203508123,40.6192740497668,40.619301196255,40.619315673244,40.6193789935434,40.6194274246221,40.6194457106613,40.6194731011598,40.6195049591694,40.6195372610087,40.6195505117888,40.6195755678085,40.6196115263298,40.6196626595426,40.619698984489,40.619729166952,40.6197587530719,40.6197879872992,40.6198058956831,40.619828493873,40.6198567305938,40.6198912649671,40.6199126875233,40.6199376318378,40.6199581061453,40.6199597535322,40.6199420001359,40.6199372404674,40.6199531721088,40.6199581949332,40.619950178091,40.6199431047223,40.6198997765966,40.6198906225556,40.6198915046523,40.6198886310303,40.6198826761329,40.6198672207155,40.6198392877338,40.619820892596,40.6198174880651,40.6198140021195,40.6198104058851,40.6198066449725,40.619802828606,40.6197989309373,40.6197950052915,40.6197911614522,40.6197874559914,40.6197871764784,40.6197837778639,40.6197801564156,40.6197766429699,40.619776073797,40.6197731315251,40.6197685763931,40.6197681917344,40.6197641201041,40.6197634185064,40.6197629797235,40.6197585631946,40.6197580695141,40.6197537095571,40.6197530238591,40.6197495406999,40.6197454548197,40.6197413964151,40.619741077777,40.6197409576218,40.6197370927695,40.6197367090269,40.6197328429996,40.6197324608817,40.619728568659,40.6197282106113,40.6197242925868,40.6197239625185,40.6197236073747,40.6197232493269,40.6197197522176,40.6197194130057,40.619719083658,40.6197153301081,40.6197150270139,40.619711274134,40.6197109714883,40.6197071895132,40.6197069160146,40.6197030786379,40.6197021474563,40.6197019281871,40.6196981182302,40.6196977077375,40.6196939262604,40.6196831004629,40.6196807157287,40.6196782228783,40.6196752076109,40.6196721930633,40.6196691224967,40.6196685820639,40.6196658899963,40.6196626003155,40.6196617572207,40.6196597785303,40.619656875213,40.6196549388793,40.619653671132,40.6196500830121,40.6196458637657,40.6196455624995,40.6196417010402,40.6196376740365,40.6196337577276,40.619629649177,40.6196256495966,40.6196242538471,40.6196216227301,40.6196176215989,40.6196157265439,40.619613565914,40.6196097551791,40.619607196019,40.6196058900507,40.6196017486996,40.6195976069017,40.6195935210034,40.6195894071299,40.6195832994425,40.6195727303103,40.6195713489614,40.6195685057102,40.6195644177982,40.619561102113,40.6195603019089,40.6195561843444,40.6195520684551,40.6195508550963,40.6195480895496,40.6195441083997,40.6195414581558,40.6195400456896,40.6195359269603,40.6195329136664,40.6195316433934,40.6195294948113,40.6195271665887,40.6195252201229,40.6195224405224,40.6195192361077,40.619517412799,40.6195151865309,40.6195132483068,40.6195118318906,40.6195072593998,40.6195066628959,40.6195038341165,40.619502233224,40.6195004077258,40.6194995514528,40.6194987616036,40.6194986918997,40.6194978335182,40.6194978303034,40.6194978254796,40.6194978206553,40.6194995862314,40.6195020459488,40.6195020716611,40.6195039040637,40.6195053249469,40.6195063238371,40.6195064726978,40.6195075668054,40.6195084977669,40.619509345662,40.6195100839683,40.6195122847362,40.6195133151822,40.6195140278039,40.6195146845783,40.619515314031,40.6195158622841,40.6195163826622,40.6195182511288,40.6195301898448,40.619545924822,40.619546583232,40.6195472410224,40.6195478434128,40.6195489945241,40.6195495438597,40.6195500909033,40.6195506121469,40.6195511329383,40.6195521744209,40.6195527226372,40.619555778172,40.6195559293363,40.6195589981748,40.6195656033679,40.6195660116454,40.6195683426217,40.6195710269284,40.6195736844281,40.6195763133857,40.6195789155374,40.6195818468806,40.6195830597972,40.6195845853582,40.6195872401506,40.6195898965119,40.6195926071002,40.6195953176378,40.619598083074,40.6196006293442,40.6196018044639,40.6196026559744,40.6196028453217,40.6196035042009,40.6196043557132,40.6196043442299,40.6196043508853,40.6196038874183,40.6196034623488,40.6196039230716,40.6196043122496,40.6196043039331,40.6196043038304,40.6196043036745,40.6196043033123,40.6196043074208,40.6196046004728,40.6196051568189,40.6196051552088,40.6196060071564,40.6196060200081,40.6196060055467,40.6196068565552,40.6196077112857,40.619608562731,40.6196089230236,40.619610101864,40.6196104033882,40.6196104582867,40.6196104862103,40.6196105416126,40.619614790426,40.6196153886722,40.6196191772744,40.619619204749,40.6196222162189,40.6196236753347,40.6196237307349,40.6196282551128,40.6196282550591,40.6196307503837,40.6196311636836,40.6196318496195,40.6196379944168,40.6196380773434,40.6196392889382,40.6196430714261,40.6196580749444,40.6196627200585,40.6196629956429,40.6196680728417,40.6196684022523,40.6196734541035,40.6196738379622,40.6196785768486,40.6196788344113,40.6196792730537,40.6196842698647,40.6196847914836,40.6196888280224,40.6196898155257,40.6196949225117,40.6196992605146,40.6197000025255,40.6197042582192,40.6197051094606,40.6197092839042,40.6197102444219,40.6197110462664,40.6197141697218,40.6197151596366,40.6197190292237,40.6197200729129,40.619721171051,40.6197223789191,40.6197230063942,40.619723614712,40.6197282797107,40.6197296521042,40.6197315481701,40.6197340438503,40.6197354422363,40.6197392336075,40.6197395863583,40.6197452096469,40.6197477689426,40.6197503277367,40.6197562973351,40.6197622642139,40.6197626649215,40.6197635134174,40.6197643881137,40.6197655114185,40.6197666329964,40.6197677552953,40.6197686857897,40.6197695895313,40.6197704922678,40.6197713686383,40.6197733940599,40.6197745983063,40.6197758842021,40.6197771985911,40.619778567051,40.6197792989479,40.6197800453975,40.6197815789001,40.6197869687787,40.6197893023974,40.6197918771356,40.6197929362609,40.6197946175224,40.6197997605856,40.6198164154588,40.6198193861461,40.619821488032,40.6198268359489,40.6198270667488,40.6198315286846,40.6198356047989,40.6198362749519,40.6198441454682,40.6198543956997,40.6198753639547,40.6198757543849,40.619879839539,40.6198946417307,40.6198978266085,40.6199010395681,40.6199022456552,40.6199129603522,40.6199133580032,40.6199157074685,40.6199185644716,40.619921559454,40.619924471457,40.619924663871,40.6199277974051,40.6199309848201,40.6199342546574,40.6199347355796,40.6199374429871,40.619940796982,40.6199442883326,40.6199449996388,40.6199476143131,40.6199508592489,40.6199541328838,40.6199544133591,40.6199570751744,40.6199599636892,40.6199627703443,40.6199629732887,40.619965576395,40.619968327391,40.6199710508104,40.6199715343897,40.6199731709071,40.6199750701593,40.6199769146582,40.6199783888111,40.6199826969234,40.6199850388082,40.6199873508818,40.6199875442121,40.6199877645673,40.6199900232652,40.619992100195,40.6199942097246,40.6199961369201,40.6199980932131,40.6200000215282,40.6200015293341,40.6200018119698,40.6200031364474,40.6200071390083,40.6200075419593,40.6200082166029,40.6200083822269,40.6200092963662,40.6200109869996,40.6200114324535,40.6200118527198,40.6200122459084,40.6200126651421,40.6200130574137,40.6200302980697,40.6200350842111,40.6200596936653,40.6200862612142,40.620119669241,40.6201298854601,40.6201344638349,40.6201342406812,40.620136981412,40.6201453713114,40.6201536499917,40.6201801228341,40.6201996533975,40.6202269767623,40.6202605837127,40.6202959187595,40.6203336833885,40.6203845654127,40.6204341429028,40.6204696900673,40.6204693785619,40.6204464750969,40.6204298996789,40.6204158933545,40.6204107501258,40.6204017810569,40.6203991649811,40.620397855736,40.6203939857169,40.6203888525129,40.6203875552434,40.6203735579685,40.6203608843633,40.6203584242025,40.6203572283588,40.6203343716437,40.6203089961046,40.6202747054502,40.6202530975203,40.6202200537599,40.620171732782,40.6201424530009,40.6201220732649,40.6200876962481,40.6200749595773,40.6200469458225,40.6200151098345,40.6199921913739,40.6199679991293,40.6199488901913,40.6199132902613,40.6198815370869,40.619853601887,40.6198395781615,40.6198458549439,40.6198483460357,40.6198394147099,40.6198215597597,40.6198087941533,40.619797317422,40.6197909415774,40.6197692787756,40.6197476257594,40.6197183318197,40.6196903328205,40.6196496085699,40.619635589536,40.6196431584976,40.6196456206896,40.6196684621792,40.6196976867914,40.6197205572127,40.6197435107815,40.6197626512061,40.6197741400444,40.61979583421,40.6198060509121,40.6198277262698,40.6198468473296,40.6198684372598,40.6198951154876,40.6199230668236,40.6199548259611,40.6199853015232,40.620025962638,40.6200158302011,40.6199929934655,40.6199663152392,40.6199332757713,40.6199066047604,40.6198914063381,40.6198889013472,40.6198953055369,40.6199321761862,40.6199690349793,40.6199868778913,40.6200034577988,40.6200390697495,40.6200581907063,40.6200633305028,40.6200938692249,40.6201218476569,40.6201472327457,40.6201904193002,40.6202246570721,40.6202233496592,40.6202296269464,40.6202435280948,40.6202561987283,40.6202866701671,40.6203209583559,40.6203603510055,40.6204137313511,40.620450631528,40.6204760983283,40.6205142885844,40.6205625663773,40.6206133761289,40.6206476547114,40.6206793657712,40.6207085249498,40.620726185549,40.620743865508,40.6207514002906,40.6207894069298,40.6208159983761,40.6208591209881,40.62089847555,40.6209786013443]}],[{"lng":[-73.8966648819572,-73.8966188263533,-73.8965730408542,-73.8965146421595,-73.8964747541237,-73.8964592116951,-73.8964531363604,-73.896441233469,-73.8963814651949,-73.8963667405294,-73.8963000604762,-73.8963005460908,-73.8963068767292,-73.8963132963581,-73.8963175349058,-73.8963137362031,-73.8963058886522,-73.8963010474466,-73.8962884780292,-73.896279049668,-73.8962765204942,-73.8962717592219,-73.8962669507595,-73.8962509782225,-73.8962347835979,-73.8962224331227,-73.896213835188,-73.8962046284574,-73.896125515165,-73.896100544694,-73.8960837028472,-73.8960784220068,-73.8960752320393,-73.8960804303584,-73.896080700543,-73.8960718421055,-73.8960530311997,-73.8960315992047,-73.8960208212096,-73.8960027485294,-73.8959917510126,-73.8959697150187,-73.8959422203543,-73.8959064724862,-73.8958764463915,-73.8958530526829,-73.8958158246942,-73.8957293299553,-73.8957180308928,-73.8957172889291,-73.8957261109569,-73.8957424364745,-73.8957467992111,-73.8957366762562,-73.895746326476,-73.89576993938,-73.8957796278231,-73.895777403447,-73.8957628710835,-73.8957404381813,-73.8957277395292,-73.8957083593663,-73.895698806766,-73.8956798586982,-73.8956655035056,-73.8956821361816,-73.8957011668355,-73.8957091110667,-73.8957050977126,-73.8956953200621,-73.8956743695962,-73.8956570847363,-73.8956414660354,-73.8956138850193,-73.8956184277539,-73.8956452706756,-73.8956939880069,-73.8957116624628,-73.89571934603,-73.8957167412087,-73.8957132693235,-73.8956961228619,-73.8956688618946,-73.8956408733817,-73.8956244051197,-73.8956124361602,-73.8956104467766,-73.8956279913398,-73.8956374375807,-73.8956786407145,-73.8957010465394,-73.8957206581295,-73.8957403187178,-73.8957637468172,-73.8958010353228,-73.8958266651061,-73.8958529385134,-73.8958662868526,-73.895875194153,-73.8959009137832,-73.8958997409798,-73.8958920370437,-73.8959022966381,-73.8959227590299,-73.8959474535908,-73.8959744431929,-73.8959870771419,-73.8959967376833,-73.8960086507564,-73.8960145897211,-73.8960148077333,-73.8960137254552,-73.8960199184326,-73.8960356508572,-73.8960490075756,-73.896060876142,-73.8960610538039,-73.8960612767322,-73.8960732287558,-73.8960835774604,-73.8961186944803,-73.8961602574431,-73.8961995294756,-73.8962576889647,-73.8963043296809,-73.896319616921,-73.896326143364,-73.8963385144918,-73.89634089502,-73.8963541538669,-73.8963795735807,-73.8964019740634,-73.8964207301033,-73.8964388205493,-73.8964534797444,-73.896451455604,-73.8964263867058,-73.8964078514045,-73.8964144139217,-73.8964247155975,-73.8964026207187,-73.8963971261558,-73.8964030140709,-73.896430716644,-73.8964503276905,-73.8964749857016,-73.896483754737,-73.8964651641387,-73.8964450581999,-73.8964394767218,-73.8964513003799,-73.8964760784469,-73.8964985693021,-73.8965397836322,-73.8965471522924,-73.8965292040767,-73.8965316687731,-73.8965464167863,-73.8965560811243,-73.896579472873,-73.8966051067316,-73.8966190030317,-73.8966282974112,-73.8966433522531,-73.8966425310698,-73.8966372981586,-73.8966305008977,-73.8966242402839,-73.8966012956822,-73.8965741101827,-73.8965470226457,-73.8965215956256,-73.8964863953877,-73.896470778978,-73.8964538113099,-73.8964534004968,-73.8964528984,-73.8964590060186,-73.8964673194708,-73.8964705515664,-73.8964787773187,-73.8964797659758,-73.896474991646,-73.8964738543903,-73.8964668789326,-73.8964714618066,-73.8964803149139,-73.8965020880993,-73.8965129738092,-73.896511622357,-73.8965009107415,-73.8964786028266,-73.8964512933026,-73.8964430479373,-73.8964412417415,-73.8964538748979,-73.8964628183035,-73.8964600270788,-73.8964493155114,-73.8964104897844,-73.8963839025468,-73.8963594695087,-73.896331313616,-73.8963002241372,-73.8962900198331,-73.8962783208323,-73.8962731509235,-73.896255785868,-73.896236354404,-73.8962264045079,-73.8961955415309,-73.8961705245914,-73.8961649843462,-73.8961724470908,-73.8962065895595,-73.8962271845637,-73.8962425585599,-73.8962456577012,-73.8962375685197,-73.8962143578367,-73.8961761931683,-73.8961674495314,-73.8961545074585,-73.8961517799647,-73.8961682578317,-73.8961819601655,-73.8961733697758,-73.896165315147,-73.8961442313183,-73.896110417563,-73.8960953963919,-73.8960765741882,-73.8960717522288,-73.8960684390199,-73.8960817843356,-73.8961052467118,-73.8960905437194,-73.8960607532528,-73.8960325997656,-73.8960050700418,-73.8959872530431,-73.8959886094388,-73.8959894831165,-73.8959948937292,-73.8959913445865,-73.8959837116083,-73.8959529309325,-73.8959266731793,-73.8959033626995,-73.8958885243663,-73.8958410010153,-73.8958077281093,-73.895794818165,-73.8957928770522,-73.8957918237688,-73.8957850751473,-73.8957528549671,-73.8957344515297,-73.8957370650942,-73.8957510648205,-73.8957765901637,-73.8957821500269,-73.8957875439296,-73.8958052774503,-73.8958283217262,-73.8958442321342,-73.8958515674099,-73.8958689818205,-73.8958928450205,-73.8959131096775,-73.8959491147468,-73.8959763779137,-73.8959891734012,-73.8960018347202,-73.8960171760583,-73.8960288166784,-73.8960212816377,-73.8960071986157,-73.8959728522883,-73.8959364117325,-73.895919348651,-73.8959092860417,-73.8958907151541,-73.895866416726,-73.8958622492245,-73.8958611289419,-73.895845050086,-73.8958161128408,-73.8957484560102,-73.8957167371392,-73.8956850189354,-73.8956188388825,-73.8955899991694,-73.8955825661115,-73.8955773251832,-73.8955775765203,-73.8955771749052,-73.8955719333243,-73.8955589064678,-73.8955363967229,-73.8955325292626,-73.8955219277578,-73.8955294292694,-73.8955268148037,-73.895517720667,-73.8955022129437,-73.8954794051591,-73.8954564610939,-73.8954181943246,-73.8953516114978,-73.8952740916742,-73.8951798123059,-73.8950818625676,-73.8949514433278,-73.8948739898148,-73.8947899587911,-73.8947356861192,-73.8946525742942,-73.8946011447679,-73.894527494574,-73.8944509638565,-73.894399016325,-73.8943276952913,-73.8942758140807,-73.8942095988277,-73.8941592247362,-73.8940930419318,-73.8940183533286,-73.8939516495013,-73.893915292737,-73.8938688205104,-73.8938207402508,-73.8937647388852,-73.893713192667,-73.8936774541794,-73.8936410966633,-73.8935945245514,-73.8935701409324,-73.8935393447913,-73.8934829237281,-73.8934322299478,-73.8933726946368,-73.8933058922291,-73.8932636087532,-73.8932371313793,-73.8932035527704,-73.8931505997651,-73.8930694294944,-73.892996077809,-73.892917756445,-73.8928321652225,-73.8927768847313,-73.8927055281984,-73.8926710978868,-73.8926114949625,-73.892555394561,-73.8924992624969,-73.8924350055885,-73.8923035830356,-73.8921851903461,-73.8920753684858,-73.891968495442,-73.8918911816604,-73.8918680042854,-73.8917948432373,-73.8917339540428,-73.8916579143492,-73.8915766646833,-73.8914917155381,-73.8914249689624,-73.8913758017451,-73.8913402845188,-73.8913155690616,-73.8912783137042,-73.8912310759174,-73.8912143113059,-73.8912098064092,-73.8912038320689,-73.8911872592617,-73.8911734991628,-73.8911403610433,-73.8910870297521,-73.8910367450094,-73.8909806325801,-73.8909541456468,-73.8909435536639,-73.8909491025358,-73.8909586166175,-73.8909825988295,-73.8910279027647,-73.8910435592943,-73.8910472336024,-73.8910457011408,-73.891037103025,-73.8910441064479,-73.8910669139076,-73.891092290755,-73.891127745401,-73.8911652242947,-73.8912081899751,-73.8912337431522,-73.8912560424506,-73.8912725815865,-73.8913094251673,-73.8913438617284,-73.8913729796069,-73.8913830769422,-73.8914143047419,-73.8914577118661,-73.8914961816723,-73.8915401043935,-73.8915846815314,-73.89161708481,-73.891646577468,-73.8916642358477,-73.8916801776258,-73.8916763660208,-73.8916727601363,-73.8916844810591,-73.8917198269096,-73.8917419077218,-73.8917587432829,-73.8917789805629,-73.891796366825,-73.8918115597381,-73.8918292278619,-73.8918596094374,-73.8920021457804,-73.8920736385453,-73.8920963376866,-73.8921156055985,-73.8921286317787,-73.8921157672184,-73.8921091444771,-73.8920976534755,-73.8920861604427,-73.8920963744581,-73.8921201341393,-73.8921528446363,-73.892177499894,-73.8922013661422,-73.8922285622076,-73.8922633735415,-73.8923231069566,-73.8924026289974,-73.8924742959735,-73.8925642451589,-73.8926374884221,-73.8926664306974,-73.892706380421,-73.8927487958703,-73.8927979612826,-73.8928636222239,-73.8929336328697,-73.8929773785925,-73.8930119700202,-73.8930336714232,-73.8930771466139,-73.8931149984838,-73.8931504529308,-73.8932077483893,-73.8932646390634,-73.8933062999077,-73.8933588291868,-73.8934180488138,-73.893483779084,-73.8935342917288,-73.8935926213784,-73.8936447069749,-73.8936963802044,-73.8937620387303,-73.8938365056483,-73.893884606314,-73.893932400722,-73.8939649070352,-73.894002179548,-73.8940339386831,-73.894042279015,-73.8940403298224,-73.8940409879994,-73.8940308819601,-73.8939885136291,-73.893968869809,-73.8939661674475,-73.8939583892696,-73.8939664865008,-73.893963850609,-73.8939401331766,-73.8939199740807,-73.8938934387445,-73.8938807517071,-73.8938656266567,-73.8938478244458,-73.8938323248957,-73.8937915272276,-73.8937168229822,-73.8936456169549,-73.893593814031,-73.893580855394,-73.8935747216995,-73.8935817584825,-73.893571855795,-73.8935726510378,-73.8935800940461,-73.8935949752857,-73.8936083475606,-73.8936060875694,-73.8935985132635,-73.8935776019499,-73.8935493885304,-73.8935188715207,-73.8934791662547,-73.8934580781589,-73.8934421631138,-73.8933885681998,-73.8933640516737,-73.8933132693803,-73.8932518581988,-73.8931964472586,-73.8931596216856,-73.893133357874,-73.8931159029392,-73.8930885375216,-73.8930418031411,-73.8929933904563,-73.8929361667042,-73.8929077099931,-73.892895328126,-73.8928808213098,-73.8928600719735,-73.8928193004152,-73.8927757844807,-73.8927422803436,-73.8926926974703,-73.8926603625196,-73.8926243567053,-73.892575326159,-73.8924813122802,-73.8924328995918,-73.8923714192019,-73.8922639902434,-73.8921729185508,-73.8921065677905,-73.8920434762341,-73.8920222171404,-73.8919986952915,-73.8919753522301,-73.8919417536426,-73.8919130241683,-73.8918938908652,-73.8918723204436,-73.8918605208172,-73.8918608942806,-73.891845769807,-73.8918162504582,-73.8917946530984,-73.8917677699422,-73.8917555250401,-73.8917510275932,-73.8917556844997,-73.891767510253,-73.8917673329861,-73.8917338282398,-73.8916898283412,-73.8916245375481,-73.8915780373994,-73.8915347342243,-73.8914902655565,-73.8914598178604,-73.8914422940615,-73.8914229162386,-73.8913730475449,-73.8913484258599,-73.8913228463994,-73.891277245851,-73.8912561569234,-73.891227283307,-73.8911909395723,-73.8911535299487,-73.891114883189,-73.8910863830434,-73.8910162937615,-73.8909970932319,-73.8909882098883,-73.8909986619288,-73.8910319492455,-73.8910708923046,-73.8911380178028,-73.8911505614258,-73.8911595068531,-73.8911613882108,-73.891152639307,-73.8911383350982,-73.8911231730949,-73.8910992043693,-73.8910779463262,-73.891022576505,-73.890977771294,-73.8908809593486,-73.8908299781525,-73.8907513283151,-73.8906954091548,-73.890643607718,-73.8905882756978,-73.8905493643465,-73.8904906752194,-73.8904449799142,-73.8903685663573,-73.8903339069819,-73.8903255119452,-73.8903019665162,-73.8902554140872,-73.8901893241625,-73.8901369809088,-73.8900624543933,-73.8899914950041,-73.889927800184,-73.8898737366221,-73.8898183008587,-73.8897916313015,-73.8897667138749,-73.8897357979812,-73.889715131838,-73.8897020806497,-73.8896964366385,-73.8896963184647,-73.8897077194202,-73.8897208042511,-73.8897365916125,-73.8897485743127,-73.8897568499693,-73.8897506910981,-73.8897433999619,-73.8897470078521,-73.8897540096988,-73.8897664021325,-73.889784517762,-73.8898030753887,-73.8898508863007,-73.8898819592724,-73.8899367663652,-73.8899886261971,-73.89003276808,-73.8900687474416,-73.8901075032236,-73.8901243146048,-73.8901549142776,-73.8902171644627,-73.8903021138949,-73.8904214560367,-73.8905172049769,-73.8905882283046,-73.8906610658908,-73.8907137714646,-73.890785677587,-73.8908602603516,-73.8909341202569,-73.8909930679526,-73.8910330863644,-73.8910779065652,-73.8911626406936,-73.8912635280208,-73.8913650664434,-73.8914751069734,-73.8915604955093,-73.8916965703808,-73.8918171469525,-73.8919042180364,-73.8919446144681,-73.8919729366765,-73.8919835665811,-73.8919901455717,-73.8919925108926,-73.8919815325084,-73.8919649690348,-73.8919505967327,-73.8919473024031,-73.8919469214284,-73.8919129348595,-73.8918956845558,-73.8918770605388,-73.891864950885,-73.8918655272165,-73.8918803006254,-73.8919111529,-73.8919456758464,-73.8919725162863,-73.8919805379837,-73.8919820446748,-73.8919771075809,-73.8919543422603,-73.891914916054,-73.891904287419,-73.891841478176,-73.8918129158035,-73.891793201432,-73.8917682687249,-73.8917384646052,-73.8917461729698,-73.8917525506488,-73.8917623578281,-73.8917721304933,-73.8917863254454,-73.8917930094765,-73.8917960250416,-73.8917857021248,-73.8917687630457,-73.8917613860105,-73.8917694068231,-73.8917866166984,-73.8918297521876,-73.8918594781802,-73.8919186964822,-73.8919538117462,-73.8919886506704,-73.892002269229,-73.8920126272567,-73.8920367396705,-73.8920744962619,-73.8920861910738,-73.8920957998755,-73.8921079793807,-73.8921480638507,-73.8921898262499,-73.8922520582136,-73.8922673545897,-73.8922585439279,-73.8922399635147,-73.8922373648939,-73.8922341509154,-73.8922663666659,-73.8922871295626,-73.8923104661718,-73.8923238806387,-73.8923347526969,-73.8923547482889,-73.8923665113154,-73.8923721087752,-73.8923665937145,-73.8923511711267,-73.8923223391061,-73.8922690323718,-73.8922299210863,-73.892224847529,-73.8922232040977,-73.8922408614732,-73.8922709288866,-73.8923088457973,-73.8923388780439,-73.8923741950039,-73.8924057764902,-73.8924216558238,-73.8924232720762,-73.892418749798,-73.8924000321741,-73.8923723029574,-73.892350466837,-73.8923208148942,-73.8923065527174,-73.8922875909203,-73.8922660530438,-73.8922515466934,-73.89222497129,-73.8922022717767,-73.8921764920605,-73.892172804221,-73.8921703593748,-73.8921856610637,-73.8922009566391,-73.8922061384982,-73.8922197567358,-73.8922445541159,-73.8922476512886,-73.8922647675758,-73.8922706339314,-73.8922649175475,-73.8922755182375,-73.8922865289044,-73.8923267466181,-73.8923406706305,-73.892362547195,-73.8924281002395,-73.8924586138717,-73.8924669457719,-73.8924832404149,-73.8924963496892,-73.8925039094105,-73.8925122567251,-73.892512650001,-73.8925160682589,-73.8925316136601,-73.8925345342453,-73.8925533288799,-73.8925726373485,-73.8925764469323,-73.8925792331861,-73.8925892568118,-73.8925925566797,-73.8925987716385,-73.8926274479689,-73.8926456276853,-73.8926562981233,-73.8926628882219,-73.8926686517774,-73.8926775387693,-73.8926980536611,-73.8927134948341,-73.8927294499925,-73.8927457807248,-73.8927729822488,-73.8928205208266,-73.8928597231121,-73.8929175514211,-73.8929588118857,-73.8930173584923,-73.8930510046089,-73.893078684751,-73.8931120243378,-73.8931313365312,-73.8931450934131,-73.8931619384659,-73.8931950803473,-73.893214429387,-73.8932400878238,-73.893256827852,-73.8933048814524,-73.8933307781672,-73.8933462142002,-73.8933563326656,-73.8933743712569,-73.8933985855705,-73.8934319249572,-73.8934602906867,-73.8935021684265,-73.8935322804853,-73.8935586557758,-73.8935663742215,-73.8935682955377,-73.8936103466953,-73.8936431345333,-73.8936687560408,-73.893702610662,-73.8937209246846,-73.8937509691804,-73.8937681193186,-73.8937910298784,-73.8938052630494,-73.8938239889522,-73.8938489920781,-73.8938776645143,-73.8939009881144,-73.8939280493264,-73.8939542523284,-73.8939963033267,-73.894037047817,-73.8940664066727,-73.8941198423734,-73.8941783875378,-73.8942274701388,-73.8942667062872,-73.8943311507794,-73.8943655495217,-73.8943891805254,-73.8944395610919,-73.8944779373409,-73.8945309257695,-73.8945476974328,-73.8945796596804,-73.8946178997269,-73.8946668391788,-73.8947133128377,-73.8947631475013,-73.8947979937308,-73.8948279702858,-73.8948616836842,-73.8948915917469,-73.8949290106372,-73.8949600537027,-73.894992018269,-73.8950219586699,-73.8950603394096,-73.8950919639528,-73.8951284934897,-73.8951650230412,-73.8951946917748,-73.8952439083291,-73.8952772469879,-73.8953104135116,-73.8953475604165,-73.8954135530859,-73.8954530647933,-73.8954968654536,-73.8955813413635,-73.8956296326534,-73.8956944533786,-73.8957521084812,-73.8958174463282,-73.8958785319965,-73.895913444248,-73.895966297932,-73.8960084815338,-73.8960450421947,-73.8960933645975,-73.8961128280492,-73.8961322917227,-73.8961624704545,-73.8961925141855,-73.8962258510643,-73.8962508986745,-73.8962786567386,-73.8963091409688,-73.8963423922054,-73.8963741968421,-73.8964137403908,-73.8964661234959,-73.896513613368,-73.8965533232536,-73.8966192291039,-73.8966696507697,-73.8966987359737,-73.896725731512,-73.8967603828681,-73.8968239904493,-73.8968890004358,-73.8969462734801,-73.8970027013132,-73.897024634461,-73.8970529976051,-73.8970990839521,-73.8971451296441,-73.897181954938,-73.8972293150113,-73.8972695851943,-73.8973070437233,-73.8973380821672,-73.8973626183635,-73.8973738428314,-73.8974063278037,-73.8974664912283,-73.897533751905,-73.8976073964285,-73.897678908239,-73.8977412358709,-73.8977702764431,-73.8977993572169,-73.8978285230874,-73.8978709989603,-73.8979084617761,-73.8979473239487,-73.8979910694053,-73.8980220281825,-73.8980594466855,-73.8981082952895,-73.8981437165485,-73.8981975859076,-73.8982345715058,-73.8982444557701,-73.8982583900202,-73.8982623540165,-73.8982860129755,-73.8983173043672,-73.8983387811786,-73.898502110433,-73.8985572030616,-73.8986972085319,-73.8987999324267,-73.8988219924594,-73.8988683184527,-73.8989511291848,-73.8986941157259,-73.8983237178363,-73.8982671480452,-73.8976089486917,-73.8972878511016,-73.8972449295147,-73.897209379771,-73.8971812256639,-73.8971604866737,-73.8971471760744,-73.8971413028214,-73.8971302438283,-73.8971269679088,-73.8971265471953,-73.8971263315366,-73.8971274733407,-73.897129112271,-73.8971294394962,-73.897149258593,-73.8971634489842,-73.8972061044235,-73.8972603878599,-73.8973262920142,-73.8974038019086,-73.8974094943071,-73.8974167789968,-73.897418411566,-73.8974088802114,-73.8973973565469,-73.8973876948109,-73.8973668038461,-73.897344056026,-73.8973306853778,-73.8972930573074,-73.8972185991283,-73.8971479172305,-73.8970717166319,-73.8969245112827,-73.8968430227625,-73.8968003262926,-73.8967508196571,-73.8966648819572],"lat":[40.6214773501578,40.6214619445085,40.6214623698936,40.6214444761825,40.6214282465916,40.6214159073261,40.6214087604326,40.6213947561901,40.6212640886008,40.6212318953729,40.6210712923029,40.6210147225881,40.6209974641104,40.6209691978913,40.62090700527,40.6208243286769,40.6207755735363,40.6207610777518,40.6207364999746,40.6207305078386,40.6207358292901,40.6207631362259,40.6207967556079,40.6208299812735,40.6208434160448,40.6208402210095,40.6208329394777,40.6208002132736,40.6206442375757,40.6206258798093,40.6206154337343,40.6206062894212,40.6205955817754,40.6205660799435,40.6205314958553,40.6205060155795,40.6204876908455,40.6204872596785,40.6204925468594,40.6204855598011,40.6204694654013,40.6204404329734,40.6204242686893,40.6204096335008,40.6204003838422,40.6203873796632,40.6203516647855,40.6202409157608,40.6202113165551,40.6202015713952,40.6201805816587,40.6201529838474,40.6201263089919,40.6201042585344,40.6200835441272,40.6200714066252,40.6200491539992,40.6200199205321,40.6199843347684,40.6199559338541,40.6199454921536,40.6199450897594,40.6199500491628,40.6199505814645,40.6199395338096,40.6199223121887,40.6199154942765,40.6199020246199,40.6198894223016,40.6198761841743,40.6198672713882,40.6198637429543,40.6198545342871,40.6198012871507,40.6197525986596,40.6197015143115,40.6195989855913,40.6195601079442,40.6195299501588,40.6195160041959,40.6195009046798,40.6194776682742,40.6194505529363,40.6194272780345,40.6194084618144,40.6193692821806,40.6193505333845,40.6193269441538,40.6193209146522,40.6193244379926,40.6193234427629,40.6193130851529,40.6192944379176,40.6192620711303,40.6192115726815,40.6191758861132,40.6191446193679,40.6191083177214,40.6190786277684,40.619031934111,40.6189983093218,40.6189718429928,40.6189537087326,40.618928475624,40.6189159274452,40.6188863069564,40.6188456125425,40.6188175425956,40.6187779465166,40.6187581345559,40.6187333486792,40.6186887173208,40.6186441474925,40.6185797687904,40.6185379502329,40.6185038706678,40.6184818312234,40.6184543000535,40.6184119312302,40.6183827908844,40.6183383294491,40.6182950267599,40.6182660222578,40.618227758041,40.618185008204,40.6181757176027,40.6181713581871,40.6181609396613,40.6181356079129,40.6181103409226,40.6180939493524,40.6180956982732,40.6181029619745,40.6180975436342,40.6180755710104,40.6180568496699,40.6180319312787,40.6179998833768,40.6179954970165,40.6179718741625,40.6179343049838,40.6179017741184,40.6178902239478,40.6178650242432,40.6178546676799,40.6178421181812,40.6178316952228,40.6178106534294,40.6177918340471,40.6177675644604,40.6177389749035,40.6177181641573,40.6177089064885,40.6177041676739,40.6176904228588,40.6176738007322,40.6176402066939,40.6176072274849,40.6175764401714,40.617544045203,40.6175056131625,40.6174875094142,40.617416483651,40.6173477126449,40.6172727783799,40.6172099447853,40.6171575691191,40.6171289073247,40.6171062151614,40.6170763273269,40.6170299160245,40.6169592689569,40.6168489251349,40.6168152318849,40.6167699817696,40.6167325155554,40.6167088275116,40.6166724919582,40.6166301198092,40.6165899114107,40.6165585733099,40.6165244009698,40.6164907734372,40.6164571761521,40.6164268399212,40.6163982151893,40.6163795311166,40.6163686264927,40.616363174681,40.6163515898406,40.6163377739661,40.6163222194189,40.6163033643969,40.6162559538067,40.6162124202765,40.6161717269728,40.6161420083509,40.6161298743931,40.6161160573407,40.6160899747853,40.6160699961107,40.6160550149188,40.6160482654191,40.6160514207627,40.6160585211517,40.6160760766803,40.616089274472,40.6160908513317,40.6160791953871,40.6160615099195,40.6160343639692,40.6160011837037,40.6159741693413,40.6159466468815,40.6159253501023,40.6159073348711,40.6158885749482,40.6158639563453,40.6158542335352,40.6158402959483,40.6158303533174,40.6158244447138,40.6157858132351,40.6157563585047,40.6157217340908,40.6156888089271,40.615654491231,40.6156447674416,40.6156302569694,40.6156246264228,40.6156259023166,40.6156162785191,40.6155901168529,40.6155672216906,40.6155544985368,40.6155454887596,40.6155265369872,40.6155061430519,40.6154971702033,40.6154816646163,40.6154507140996,40.6154119318619,40.6153824261054,40.6153315700352,40.615297722951,40.6152732330214,40.6152402676231,40.6152171052501,40.6151977052259,40.615173290016,40.6150908213551,40.6150392988166,40.6150034126209,40.6149782965883,40.6149602897836,40.6149456258827,40.6149121113045,40.6148877471202,40.6148751509745,40.6148586124762,40.6148435667236,40.6148347615817,40.6148177761826,40.6148093657169,40.6148151226285,40.6148209280213,40.6148290323496,40.6148408502098,40.6148509738237,40.6148610930015,40.6148688939185,40.6148707570569,40.6148645928462,40.6148529663971,40.6148314879797,40.614804600052,40.6147855718255,40.6147627766485,40.6147298634798,40.6147002410199,40.6146709386527,40.6146333807617,40.6146008107116,40.6145688672217,40.614538862351,40.6145181374948,40.6145040975656,40.6144907871289,40.6144768371304,40.6144679152488,40.6144589938617,40.6144455654721,40.6144376897081,40.6144241226554,40.6144127280994,40.6143897812085,40.6143706497004,40.6143592539708,40.6143517488977,40.6143585448639,40.6143597122094,40.6143680193845,40.6143843302937,40.6143969276072,40.6144085012923,40.614421773084,40.6144269668556,40.6144266715782,40.6144140101071,40.614381451729,40.6143408404478,40.6142845966099,40.6142256308509,40.6141561227257,40.6141182560294,40.614073877606,40.6140472045412,40.6140126537761,40.6139870246136,40.6139600306206,40.6139319639275,40.6139156390957,40.6138962507541,40.6138826437507,40.6138692156886,40.6138588763331,40.6138481655544,40.6138397519273,40.613838345484,40.6138480284523,40.6138540511098,40.6138513166936,40.6138470397009,40.6138498449018,40.6138557149033,40.6138654247563,40.6138659574519,40.6138651389473,40.6138660447384,40.6138765313853,40.6138863930703,40.6138849111825,40.6138780414865,40.6138774264341,40.6138799265075,40.6138852202251,40.6138902225177,40.6138807592132,40.6138701510327,40.6138590434626,40.6138452676953,40.6138399187075,40.6138205281529,40.6138187393003,40.6138145121595,40.613804770023,40.6137923116812,40.6137701285228,40.6137219428939,40.6136785201248,40.6136355428668,40.613596356609,40.6135639221692,40.6135527302022,40.6135136847197,40.6134805251554,40.6134404343407,40.6133916655829,40.6133374861077,40.6132967440134,40.6132760018607,40.6132562069006,40.6132389999127,40.613202294751,40.6131700536596,40.613157136718,40.6131473231263,40.6131343175529,40.6130930206982,40.6130500235712,40.6130067073774,40.6129559593845,40.6129144938561,40.6128681639333,40.6128340473171,40.6127691777256,40.612723784627,40.6126974430079,40.6126791310411,40.6126496669397,40.6126237709003,40.6126008554032,40.6125693442482,40.6125406804203,40.612509560998,40.6124814754272,40.6124691478916,40.6124604255723,40.6124484393473,40.6124276739172,40.6123951991376,40.6123480926365,40.612298894108,40.6122341798086,40.6121874404302,40.6121549152118,40.6121477153081,40.6121254476995,40.6121209866886,40.6121187717537,40.6121077522681,40.6120929455508,40.6120777693283,40.6120588311684,40.6120531106126,40.6120615796558,40.6120790329272,40.6121046385241,40.6121169741802,40.6121311157745,40.612129681248,40.6121196237481,40.6121013910147,40.6120848002267,40.6120660949977,40.6120321042314,40.6120202203295,40.6119870319718,40.6119658269514,40.6119605788032,40.6119608433246,40.6119682390584,40.6119945501563,40.6120136745864,40.6120377636933,40.6120618802719,40.6120709751293,40.6120782150857,40.6120739096264,40.6120626521873,40.6120470566755,40.6120232561944,40.6119901036662,40.6119565645328,40.6119140117319,40.6118726872225,40.6118191111016,40.6117837442919,40.6117713373143,40.6117440633536,40.6117298306345,40.6117274335901,40.6117269727893,40.6117307983806,40.6117399243887,40.6117524458829,40.6117629781939,40.611761234459,40.6117628347197,40.6117541112738,40.6117358567764,40.6117012703037,40.6116853897,40.611674816099,40.6116478067053,40.6116245093924,40.6115916472833,40.6115575823261,40.6115306777853,40.611515737263,40.6115152776222,40.6115261059793,40.6115368002185,40.6115365967242,40.6115241379265,40.6115039986215,40.6114643655653,40.6114283335632,40.6114087888304,40.6113794205862,40.611347488773,40.6113106425628,40.6112967912333,40.6112756257981,40.6112512722927,40.6112326694606,40.6112142225808,40.6111814266513,40.6111741074664,40.611168539102,40.6111747031813,40.6111961535438,40.6112247098579,40.6112325456199,40.6112271830182,40.6112082297543,40.611186480603,40.6111704024722,40.6111657254606,40.6111500464316,40.6111189543571,40.6110951753256,40.6110712408479,40.6110564257718,40.6110524047784,40.6110451165746,40.6110402561395,40.6110240817348,40.6110151417872,40.6110008976365,40.611007348222,40.6110171909575,40.6110283982061,40.6110482289476,40.6110718661859,40.61108855983,40.6111105535018,40.6111354186131,40.6111449739265,40.6111558646088,40.611161165105,40.6111750100633,40.6111933747824,40.6112060665292,40.6112100569097,40.6112055021166,40.6112086601672,40.611225693206,40.6112433282053,40.6112681224353,40.6112910308816,40.6113183278579,40.611346596615,40.6113609325401,40.6113788257816,40.611394080185,40.6114018844493,40.6114082199463,40.6114122368955,40.61143438482,40.6114735347313,40.6115091866356,40.6115362972539,40.611552487162,40.6115582581706,40.6115591698789,40.6115399343692,40.6115371854666,40.6115294735609,40.6115346707473,40.6115551260286,40.611568345369,40.6115819319929,40.6116033825925,40.6115940499134,40.6115862069817,40.6115953212198,40.6116178175549,40.6116363676667,40.6116515238839,40.611666548975,40.6116866682117,40.6117149349985,40.6117514810573,40.6117910823581,40.6118146443566,40.6118218223299,40.6118138198804,40.6118229873061,40.6118341141208,40.6118567129122,40.6119140326058,40.6119279792484,40.6119321819924,40.6119345280011,40.6119457056944,40.6119608290334,40.6119624975682,40.6119772011889,40.6119995345745,40.6120282456766,40.6120499729319,40.6120524524163,40.6120667169655,40.6120839647807,40.6121013977535,40.6121182065023,40.6121465409597,40.612163212599,40.612177193161,40.6121940200537,40.6122137468603,40.6122395074926,40.6122609562851,40.6122711168332,40.6122768618686,40.6122608609551,40.6122392449123,40.6121934248176,40.6121817110252,40.6121747473371,40.612165279042,40.6121492012599,40.6121332001728,40.6121191097847,40.6120857606671,40.6120570877463,40.6120267124001,40.6120114737293,40.6119909609993,40.6119635739979,40.6119305920057,40.6118864742697,40.6118486564987,40.6118095536494,40.6117703998861,40.6117365784499,40.6117156656098,40.6116969204277,40.6116859156746,40.6116607495201,40.6116253399043,40.6115989969041,40.6115633020282,40.6115128204364,40.6114535595923,40.6113984824481,40.6113264990457,40.6112756805074,40.6112167892792,40.6111780407037,40.6111340905778,40.6111004873017,40.6110748812615,40.6110437893859,40.6109984571789,40.6109552440054,40.6109283085462,40.6108742818474,40.610835747262,40.6107761826867,40.6107128550738,40.6106561892191,40.610612664229,40.6105674945686,40.6105291657439,40.6104716092104,40.6103972577883,40.6103176568626,40.6102168714417,40.61013980699,40.6100740269712,40.6100223562597,40.6099916378223,40.6099584392448,40.6099181615412,40.6098789541168,40.6098410764219,40.6098165484024,40.6097843390193,40.6097248583334,40.6096536971578,40.609581469516,40.6095069149588,40.6094436176133,40.6093273384785,40.6092189228194,40.6091387469027,40.6091022521483,40.609093660068,40.6090907880549,40.6090971896613,40.6091047680531,40.609122350806,40.6091432510807,40.6091663207371,40.6091772425486,40.609189209465,40.6092266995072,40.6092487234138,40.6092729424997,40.6093008456455,40.6093225844299,40.6093414001195,40.6093485387373,40.609358342165,40.6093747823991,40.6093817336846,40.6093849739408,40.6093872200544,40.6093897512979,40.609382193513,40.609385065521,40.6093838531642,40.6093842933546,40.6093933046157,40.6094219643019,40.6094555879727,40.6094772242458,40.6094754730395,40.609468263446,40.6094610538192,40.6094581034269,40.60946724927,40.6094737304595,40.6094874727028,40.6094948122866,40.60951231766,40.6095192689593,40.609522797411,40.6095074682236,40.6094993985081,40.6094723910536,40.6094501083535,40.6094196739191,40.6093949835439,40.6093812423192,40.6093482444808,40.6093188562996,40.6093028920394,40.6092619772171,40.6092367622847,40.6092149524331,40.6092018166209,40.6091812889989,40.6091652731467,40.6091567016376,40.6091553667704,40.6091369187088,40.6090967324978,40.6090195515459,40.608940959979,40.6088524896168,40.6088196738489,40.6087993731385,40.6087729862626,40.608759740532,40.6087281251552,40.6087086325012,40.6086909415579,40.6086804848581,40.6086611933495,40.608638951202,40.6086357625538,40.6086270868576,40.6086213953612,40.6086241946458,40.6086285120549,40.6086313124614,40.6086171829601,40.6085976421112,40.60857783895,40.6085582432413,40.608548521817,40.6085417252301,40.608518231286,40.6085022635721,40.6084874950768,40.6084877018478,40.6084983339059,40.6085215077919,40.608539115242,40.6085591005067,40.6085643486807,40.608560400465,40.6085509698067,40.6085447213573,40.6085031509629,40.6084871362905,40.608467488309,40.6084428265531,40.6084087308223,40.6083641032971,40.6083366445656,40.6083158987341,40.6082882539184,40.6082570823282,40.6082422433682,40.6082258665472,40.6082120463753,40.6082024600742,40.6081992831069,40.6081928334772,40.6081851009244,40.6081533050673,40.6081096185292,40.6080436955164,40.6079821392158,40.6079163182258,40.607828735517,40.6077697637156,40.6077452554263,40.6077264712029,40.6077011833056,40.6076837288226,40.6076537582865,40.6076008753554,40.6075644001424,40.6075289437173,40.6074801124798,40.6074395894204,40.60741091622,40.6073888810682,40.6073652263102,40.6073480796248,40.6073121145246,40.6072729606259,40.6072271923165,40.6071951483426,40.6071656396752,40.6071434780275,40.6071318778357,40.6071161204941,40.6071011729434,40.6070870648749,40.6070815516433,40.6070684853291,40.6070520475541,40.6070237666569,40.6070016277386,40.6069629960996,40.6068895492883,40.606861268411,40.6068285193576,40.606810144226,40.6067813964474,40.6067568545128,40.6067434462347,40.6067443899337,40.6067468216023,40.60673929587,40.6067228310295,40.6067086662676,40.6066898763101,40.6066871862148,40.6066790861503,40.6066723690131,40.6066635869039,40.6066502866627,40.606640408329,40.6066306605627,40.6066076350086,40.6065952728808,40.6065898385383,40.6065851893743,40.6065826017838,40.6065768789049,40.606578213152,40.6065723355352,40.6065690945242,40.6065544594343,40.6065452624347,40.6065316718551,40.60651837097,40.6065100099698,40.6065056722286,40.6064883475213,40.6064742388599,40.6064553163897,40.6064437150789,40.6064344144923,40.6064305760218,40.6064268916583,40.6064287775784,40.6064385568162,40.606430563216,40.6064379346427,40.6064494641696,40.6064537816179,40.6064551439287,40.6064461556842,40.6064288821611,40.606415711592,40.6064075309355,40.6064047632058,40.6063938651472,40.6063707612397,40.6063494351761,40.6063351919059,40.6063270398132,40.6063110446682,40.6062858488414,40.6062556631023,40.6062254470288,40.6062063159553,40.6061929114159,40.6061764460393,40.606154517873,40.6061204888375,40.6060656797588,40.6060392553139,40.6060116824897,40.6059730039105,40.6059524617907,40.6059311105768,40.6059098907036,40.6058819261733,40.6058551642987,40.6058447112765,40.6058312267945,40.6058234153911,40.605818973929,40.6058241783611,40.6058257742477,40.6058273694611,40.605827424205,40.6058219897262,40.6058055510447,40.6057925078911,40.6057774915066,40.6057663751408,40.6057590484267,40.6057565524422,40.6057557104032,40.6057436524483,40.6057283523951,40.6057140597093,40.60568971889,40.6056647305177,40.6056503739495,40.6056365375172,40.6056324514516,40.6056274587385,40.6056230150687,40.6056169174459,40.6056199604333,40.6056190194744,40.6056057320109,40.605589880963,40.6055767202111,40.6055640172587,40.605562165197,40.6055575624838,40.6055545772512,40.605558529518,40.6055748280624,40.6055818922358,40.6055810154075,40.6055679220776,40.605552199475,40.6055322006428,40.6055154107287,40.605499107145,40.6054901581073,40.6054784911049,40.6054587539561,40.6054482516107,40.605442548863,40.6054401136617,40.6054462996438,40.6054556325243,40.6054553363566,40.6054459375619,40.6054327110358,40.6054131340626,40.6053896713547,40.6053796335499,40.6053574685429,40.6053540261446,40.6053334760116,40.6053121760649,40.6053036592854,40.6052966901829,40.6053089180249,40.6053399930272,40.6053627917656,40.6053676881291,40.6053779691214,40.6054002913384,40.6067882167964,40.6081500847918,40.6083111707694,40.6101853714281,40.6114506248433,40.6116677085526,40.6118855647149,40.6121040479619,40.6123230121769,40.6125423115649,40.6127617997904,40.6132210650464,40.6135518418141,40.6138248437176,40.6139647841999,40.6142134466973,40.6145686317806,40.614640034109,40.6152289213095,40.6156214346673,40.6164155529934,40.6172093028479,40.6180025403001,40.6187951227492,40.6189743765835,40.6191099473268,40.6192626318,40.619373928507,40.6195594256787,40.6197563422735,40.6199461090915,40.6201216084871,40.6202248332221,40.6204083796304,40.6207715825901,40.6210161464114,40.6212436759307,40.6216551159452,40.6216200648317,40.6215710983597,40.6215143222598,40.6214773501578]}],[{"lng":[-73.8347803231749,-73.8347319094261,-73.8346607067945,-73.8346370516269,-73.8346064859116,-73.8345650075001,-73.8345304754801,-73.8344930010363,-73.8344673936666,-73.8344307891737,-73.834409004827,-73.8343694350106,-73.8342626093011,-73.8342399341093,-73.834219294585,-73.8342214082534,-73.8342224794984,-73.8342097223196,-73.8341840812289,-73.8341386534053,-73.834092170168,-73.8340140581377,-73.8339586251381,-73.8339377640601,-73.8339377100848,-73.83392577651,-73.8339069176449,-73.8338673138766,-73.8338385796002,-73.8338226529387,-73.8338245183193,-73.8338135634965,-73.833786836052,-73.8337502314451,-73.8337245054012,-73.8337145390478,-73.8336858809756,-73.8336542645498,-73.8336224200233,-73.8336821495259,-73.8337047526352,-73.8337364706052,-73.8337582318075,-73.8337849565308,-73.833836664006,-73.8338767108543,-73.8338767772716,-73.8338535342474,-73.83388696926,-73.8339487560571,-73.8339722140552,-73.83396897383,-73.8340074253541,-73.8340625213625,-73.8340875268353,-73.8341092193731,-73.8341226213258,-73.8341643121622,-73.8342176689437,-73.8342627087712,-73.8342977606197,-73.8343460863338,-73.8344194292896,-73.834491116589,-73.8345444702577,-73.8346295188742,-73.8347045788093,-73.8347679819011,-73.8348396950558,-73.8349280753408,-73.8349871609935,-73.8349757931267,-73.834932522732,-73.8348843020923,-73.8348421365286,-73.8348018316871,-73.834794209512,-73.8347709831159,-73.8347510504564,-73.8347718887184,-73.834805823094,-73.8348587319632,-73.8348753813239,-73.834868227237,-73.8348596625441,-73.834852593012,-73.8348612671132,-73.834860604311,-73.8348395210462,-73.8348117974542,-73.8347824804358,-73.8347492075249,-73.8347537141712,-73.8347729853798,-73.8348029389788,-73.8348034033985,-73.8347922790384,-73.8347518755666,-73.8347056036696,-73.8346668760949,-73.8346478271709,-73.8346442476693,-73.8346645108069,-73.8346910957331,-73.8347250042847,-73.8347590612046,-73.8347585592242,-73.834759770632,-73.8347812946888,-73.834819948265,-73.8348562212528,-73.8348770606047,-73.8348814092082,-73.8348547139485,-73.8348419367484,-73.834848244613,-73.8348977616524,-73.834971475771,-73.8349694404924,-73.8349672605839,-73.8349783591859,-73.8350007056752,-73.8350198157447,-73.835018271776,-73.8350061078969,-73.8349922033027,-73.8347803231749],"lat":[40.6226254941408,40.6226163513465,40.6226207218231,40.6226003313448,40.6225769127164,40.6225640182993,40.6225436056126,40.6225171588062,40.6224899852463,40.6224959342625,40.6225049283469,40.6225108725698,40.6225234550089,40.6225053258283,40.6224713819878,40.6224337176354,40.622411119008,40.6223847248365,40.6223665896919,40.6223521809923,40.6223558501525,40.6223571927234,40.6223751552187,40.6224022327962,40.622417299444,40.6224361081156,40.6224564088463,40.6224713937205,40.6224886597873,40.6225180071229,40.6225488981564,40.6225707225813,40.6225797067216,40.6225856571965,40.6225908752096,40.6226127022274,40.6226088751178,40.6226027809057,40.6226026388295,40.6213813056865,40.6213647917057,40.6213521296646,40.6213191220558,40.6213026419966,40.6212989036167,40.6212900667045,40.6212633807587,40.6212214133006,40.6211884220355,40.6211554727213,40.6211110304796,40.6210729032175,40.6210348368323,40.6210095012063,40.6210133504269,40.621008298397,40.6209841739471,40.6209842340959,40.6209881230102,40.6209831046179,40.6209704477309,40.6209857663765,40.6209998508323,40.6210088488525,40.6210140089888,40.6210154015686,40.6210091559779,40.6209965397091,40.6209953725547,40.6209980400732,40.6210112998889,40.6210194779207,40.6210297548553,40.6210350852363,40.6210690633922,40.6211254818782,40.6211723135623,40.6212148898622,40.6212618065442,40.6212928730999,40.6213256935697,40.6213671413928,40.6213919716732,40.6214094841003,40.621448222947,40.6214719886846,40.6215124649439,40.6215262060663,40.6215431940516,40.6215546023176,40.6215685284267,40.6215918277894,40.6216292513822,40.6216659094794,40.6217050032165,40.6217455720524,40.6217755829709,40.6218195212166,40.6218535187147,40.6219011912173,40.6219531008454,40.6219968159237,40.6220478214804,40.6220825764234,40.6221122980917,40.6221513731104,40.6221806928222,40.622213747879,40.6222341732993,40.6222470091334,40.6222698507256,40.6223008902878,40.6223227039584,40.6223484583867,40.6223778631591,40.6224252469246,40.6224592244213,40.6225317100157,40.6225666511412,40.6225922377393,40.6226289597886,40.622651279593,40.6226723585517,40.6226811045354,40.6226905429206,40.6226931469715,40.6226254941408]}],[{"lng":[-73.8502309076298,-73.8502342652207,-73.8502311500824,-73.8502038435183,-73.8501636457728,-73.8500831023781,-73.8499880387451,-73.8499010293712,-73.8498430843372,-73.8497851448792,-73.8497740221644,-73.8497564598513,-73.8497388312375,-73.8497083357134,-73.8496972297073,-73.8496667349366,-73.8495975648871,-73.8495251702842,-73.8495026853759,-73.8493948557491,-73.8492821232876,-73.8491741954384,-73.84908235073,-73.849021113128,-73.84894047909,-73.8488647041636,-73.8487390801998,-73.8486569393312,-73.8485683394826,-73.8484778158128,-73.8484636483461,-73.8484637152501,-73.8484734903511,-73.8485122642855,-73.8485445896421,-73.8485930238358,-73.848602800727,-73.8486480122872,-73.8486883669562,-73.8487464552882,-73.8487867927445,-73.8488126477115,-73.8488336982439,-73.8488741252281,-73.8489080707478,-73.8489113803082,-73.8489259412123,-73.8489904575177,-73.8490114362965,-73.8490501507761,-73.8490808062824,-73.8490969821223,-73.8490825517877,-73.8490680798187,-73.8490261757704,-73.8489987372382,-73.8489600603631,-73.8489407744318,-73.8489650729352,-73.8489973920977,-73.8490232627784,-73.849087777534,-73.8491409642194,-73.8491893198066,-73.8492199890269,-73.8492587342168,-73.8493006833405,-73.8493538279315,-73.8493925101897,-73.8494360895669,-73.8494780386004,-73.8495376156673,-73.8495971699727,-73.8496439053649,-73.84970679902,-73.8498229263462,-73.8498794080277,-73.8499488280765,-73.8500069094851,-73.8500634399438,-73.8501006177589,-73.8501151697749,-73.8501409899884,-73.8501732144715,-73.8502006117317,-73.8502570641078,-73.8502732358905,-73.850291044015,-73.8502765912313,-73.8502443826699,-73.8502057518684,-73.8501864593512,-73.8501897562307,-73.8502397118241,-73.8502767564834,-73.8503105844065,-73.8503765986413,-73.8504160043176,-73.8504506614111,-73.8504893420106,-73.8505087148131,-73.8505264671308,-73.850531334386,-73.8505313976246,-73.8505189192839,-73.8505024754569,-73.8504847836643,-73.8504735450696,-73.85049454524,-73.8505235718663,-73.8505654830727,-73.8505977197244,-73.8506267628105,-73.8506300294598,-73.8506187990853,-73.8506140096885,-73.8506140728919,-73.850617355808,-73.8506174080187,-73.8506206964266,-73.8506336372537,-73.8506449610204,-73.850653060785,-73.8506836802593,-73.850715909973,-73.8507433084172,-73.8507578189078,-73.8507610834208,-73.8507514584489,-73.8507659881468,-73.850778898706,-73.8508046560367,-73.8508271893842,-73.8508513961957,-73.8508498291982,-73.8508337428432,-73.8508208960682,-73.8508273759816,-73.8508644631179,-73.8508789845456,-73.8508790229472,-73.8508758334196,-73.8508677952972,-73.8508516815297,-73.8508372067554,-73.8508510792684,-73.8508694431416,-73.8508877974653,-73.8509061413749,-73.8509152835097,-73.8509295048173,-73.8509483258466,-73.8509860117162,-73.8510237214702,-73.8510421087652,-73.8510650493843,-73.8510802973886,-73.851086344464,-73.8510899323021,-73.8511016360977,-73.851140401752,-73.851171025426,-73.8512001026175,-73.8512312051642,-73.8512801859452,-73.8512894242435,-73.8512971206782,-73.851333354754,-73.8513466408823,-73.8513472132443,-73.8513462268524,-73.8513416704529,-73.85134018417,-73.8513358228248,-73.8513397372806,-73.8513514767397,-73.8513600121221,-73.851386897214,-73.8514126673447,-73.8514287400925,-73.8514721975027,-73.8514947290424,-73.8515253252233,-73.8515494744524,-73.8515897474933,-73.8516332541206,-73.8516735383035,-73.8517235016086,-73.8517396392544,-73.8517863901272,-73.8518089802944,-73.8518235424611,-73.8518574210593,-73.8518815921103,-73.8518896124623,-73.8518960152919,-73.8519024084158,-73.8519345896227,-73.8519780465761,-73.8520231191543,-73.852058561196,-73.8521504132856,-73.8522003690918,-73.852253543084,-73.8523002900229,-73.8523599231411,-73.8524404800214,-73.8524888457489,-73.8525308066019,-73.8525566340216,-73.8525856791025,-73.8526098908351,-73.8526373324676,-73.8526840831563,-73.8527342676751,-73.8527759302728,-73.8528226538619,-73.8528661604273,-73.8529032227726,-73.8529547803581,-73.8529869918297,-73.8530224140547,-73.8530513887075,-73.8530851953204,-73.8531012768643,-73.8531334766973,-73.8531673252469,-73.8532076181784,-73.8532495078367,-73.8532897971856,-73.8533591174695,-73.8534074587241,-73.8534670873834,-73.853497732979,-73.8535444943397,-73.8535832044147,-73.8536235127778,-73.8536816076592,-73.8536945285529,-73.8537090953138,-73.8537784341729,-73.8538139064228,-73.8538509772573,-73.8538848430976,-73.8539010086737,-73.8539027002565,-73.8539205161956,-73.8539705433364,-73.8540221170809,-73.85405109986,-73.8540720334232,-73.8540977562127,-73.8541294591784,-73.854156866285,-73.8542201202714,-73.854257162425,-73.8543183907751,-73.854368351664,-73.8544086555645,-73.8544538197251,-73.854478057869,-73.8545180551247,-73.8545519674163,-73.854589224022,-73.8546069084717,-73.8546310206092,-73.854650316628,-73.8546857022999,-73.8547324160511,-73.8547678218318,-73.8547935910306,-73.8548225953606,-73.854846765489,-73.8548677160727,-73.8549144470101,-73.8549450815647,-73.8549773418743,-73.8549983155754,-73.8550337867457,-73.8550531284333,-73.8550789127547,-73.8551015008577,-73.8551079970211,-73.8551257757757,-73.8551386983499,-73.8551532351244,-73.8551774018783,-73.8551918800389,-73.8552064061468,-73.8552080503113,-73.8552258174798,-73.8552483948598,-73.855272573128,-73.8552999664934,-73.8553209081464,-73.8553321559116,-73.8553692172228,-73.8553821497111,-73.8553805973547,-73.8554192996575,-73.8554563762292,-73.8554821334476,-73.8555030367626,-73.8555255866433,-73.8555497496052,-73.855578753849,-73.855606176427,-73.8556255437233,-73.8556416753099,-73.8556771257036,-73.8557045137401,-73.855739957729,-73.8557689486941,-73.8558140665851,-73.8558446817002,-73.8558833706495,-73.8559220454589,-73.8559494361572,-73.8559768255364,-73.8560058615508,-73.8560203769062,-73.8560381186464,-73.8560558301599,-73.8560606323505,-73.8560847679777,-73.8561153469197,-73.8561427402788,-73.8561782211173,-73.8561830861686,-73.8561815182763,-73.8561606077043,-73.8561606421014,-73.8562089922928,-73.8562347740762,-73.8562557844781,-73.8562864378796,-73.8563347439768,-73.8563508153339,-73.8563830155333,-73.8564104214054,-73.8564314092806,-73.8564539811781,-73.8564572346246,-73.8564411427769,-73.8564444285728,-73.8564493135787,-73.8564558191406,-73.8564784154183,-73.8565084496815,-73.8565515562474,-73.8565783715693,-73.8565896090148,-73.8565859648402,-73.8565798804365,-73.8565733681091,-73.8565700823734,-73.8565571040904,-73.8565650986828,-73.8565666409629,-73.8565665407022,-73.8565680889234,-73.8565680414317,-73.8565744157109,-73.8565985062171,-73.8566161806798,-73.85665804988,-73.8566886571652,-73.8567079517834,-73.8567078964304,-73.8567094607523,-73.8567399949444,-73.8567721716776,-73.8567785091976,-73.8567333403342,-73.8567300625473,-73.8567444988701,-73.8567444040029,-73.8567394415339,-73.8567634905731,-73.8568037294177,-73.8568391426159,-73.8568745929125,-73.8569068205348,-73.8569535576472,-73.8569971012347,-73.857063140623,-73.8570921398706,-73.8571404806405,-73.8572098088521,-73.8572501384454,-73.8572695423034,-73.8572761095137,-73.8572874619167,-73.8573223689736,-73.8573459571312,-73.8573818178797,-73.857401708052,-73.8574095959715,-73.8573922450456,-73.8573988268545,-73.8574280104437,-73.8574492221662,-73.8574597943935,-73.8574371339626,-73.8574131464168,-73.8573851994198,-73.8573798451359,-73.8573850998604,-73.8573743869548,-73.8573437670716,-73.8573038925644,-73.8572826687228,-73.8572707644617,-73.857228250305,-73.857202726678,-73.8571803733776,-73.8571590362081,-73.8571177645832,-73.8570898044596,-73.857045872293,-73.8570006142849,-73.8569991984303,-73.857021743475,-73.8570402313066,-73.8570627612088,-73.8570898415436,-73.8571091401701,-73.8570851479869,-73.8570595190407,-73.8570301307339,-73.8569910180597,-73.8569519088144,-73.8569139659115,-73.8569008663275,-73.8568984362241,-73.8568948440869,-73.8568699385599,-73.8568462350635,-73.8568166523894,-73.8567905850597,-73.8567988233535,-73.856808261096,-73.8567856961347,-73.8567418558684,-73.8567016054614,-73.8566767515889,-73.856637633239,-73.8566044357914,-73.8566031535285,-73.8566102021708,-73.8566433175384,-73.8566781281687,-73.8567037060881,-73.8567416039178,-73.8567463083884,-73.856728497336,-73.8566751871635,-73.8566262574887,-73.8565922632804,-73.8565858161337,-73.8566016147471,-73.8566323915526,-73.8566287851351,-73.8565967527673,-73.8566026239187,-73.8565966577053,-73.8565681610504,-73.8565231381414,-73.8565030041371,-73.8564816945726,-73.8564615968104,-73.8564461888537,-73.8564166373807,-73.8563893525278,-73.8563502434864,-73.8563383450181,-73.8563458079641,-73.8563322731485,-73.856303785432,-73.856284778152,-73.8562740711875,-73.8562870538693,-73.8562704257371,-73.8562325413774,-73.8562076636956,-73.8561837999847,-73.8561293557765,-73.8561003428445,-73.8560994311984,-73.8560970329799,-73.8560937284057,-73.8560485137302,-73.8559984200771,-73.8559628604543,-73.8558355204835,-73.8557823410725,-73.8556904651037,-73.8556018388449,-73.8555390912999,-73.8555070524117,-73.8554200611937,-73.8553298155569,-73.855299169642,-73.8553248749991,-73.8553456868584,-73.8553358860187,-73.8552987464067,-73.8552583919946,-73.855171309273,-73.8550907430343,-73.8550408046919,-73.8549989772351,-73.8549861909486,-73.8549975690249,-73.8550105480043,-73.8550106706926,-73.8549946585965,-73.8549689534345,-73.854873908432,-73.8548158957126,-73.8547530299712,-73.8546869920472,-73.8546435647286,-73.8546356429626,-73.8546256086321,-73.8546196659415,-73.8546375032283,-73.8546472925932,-73.8546280336156,-73.8546184909393,-73.8545943923642,-73.8545702753068,-73.8545542360064,-73.8545591371757,-73.8545704813002,-73.8545673149942,-73.8545851281473,-73.8546206393931,-73.8546046163797,-73.854583797228,-73.8545726245741,-73.8545662810675,-73.8545115586442,-73.8544278233718,-73.8543536841102,-73.8542731553061,-73.8541894047363,-73.8541234107571,-73.8540847908811,-73.8540235672503,-73.853952650511,-73.8538673389772,-73.8537578612249,-73.8536934735561,-73.8536774774883,-73.8535889708175,-73.853532522814,-73.8535116234851,-73.8534277832035,-73.8532843390958,-73.8531474224198,-73.8530281620764,-73.8529459124045,-73.852878080816,-73.8527893655267,-73.8527007781428,-73.8526267994771,-73.8525157156756,-73.852396441198,-73.8522949056411,-73.8521917598187,-73.8521159851947,-73.8520676361862,-73.8519967057546,-73.851853296586,-73.8518000526752,-73.8517821840826,-73.851770780886,-73.8517610669065,-73.8517239151051,-73.8516642239528,-73.8516206808132,-73.8515546632329,-73.8514709188284,-73.8514031949832,-73.8513821128721,-73.8513819570418,-73.8513785726017,-73.8513800331472,-73.8514008070984,-73.8514006458204,-73.8513747459049,-73.8513346764398,-73.8513503502229,-73.8513194779567,-73.8513047812683,-73.8512884121128,-73.8512834172644,-73.8512929295506,-73.8513201665137,-73.8513990330117,-73.8514472600952,-73.8514858114649,-73.851493739726,-73.8515370994339,-73.851585352025,-73.8516287917058,-73.8517172639136,-73.8517380507502,-73.8518104550897,-73.8518957294901,-73.8519681428933,-73.8520067052372,-73.8520533331974,-73.852130538915,-73.8521804013604,-73.8521948878003,-73.8522576052621,-73.8523122687913,-73.8523411575507,-73.8523603825202,-73.8523361357074,-73.8522603950418,-73.8521975937662,-73.8521589161634,-73.8521186772284,-73.8520769058345,-73.852051193591,-73.8519949322741,-73.8519482667627,-73.8518983036278,-73.8519110292598,-73.8519415449994,-73.851965610843,-73.8519574279193,-73.8519235499606,-73.8518783597079,-73.8518395866614,-73.8518233713514,-73.8518054830137,-73.8518020886696,-73.8517955574295,-73.8517583973335,-73.8516826239216,-73.8516214157173,-73.8515779316096,-73.8515295784461,-73.8515020798234,-73.8514327530384,-73.8513328053809,-73.8512796965883,-73.8512202156709,-73.8511478052805,-73.8510592804988,-73.8509883990511,-73.8508981482894,-73.8508046294747,-73.8506401729873,-73.8505353111138,-73.8504804370899,-73.8504352183677,-73.8503883843225,-73.8503270564228,-73.8502753837763,-73.8502480408106,-73.8502269891564,-73.850212795513,-73.850193540382,-73.8502323284938,-73.8502372474644,-73.8502309076298],"lat":[40.6233208231195,40.6232606638142,40.623212773438,40.6231734472878,40.6231341036599,40.6231217201219,40.623116684501,40.6231128874727,40.623083343622,40.6230513449468,40.6229813424962,40.6229088773285,40.6228658795835,40.6228118149703,40.6227344461146,40.6226803814905,40.6226262657641,40.6225733737626,40.6225401933561,40.622479887288,40.6224502713648,40.6224341683254,40.6224315918171,40.6224327393983,40.6224608735035,40.6224779640621,40.6224483301551,40.6224298050833,40.6224174103779,40.6224187847906,40.6223951713315,40.6223657027322,40.6223190579503,40.6222749063535,40.6222319742357,40.6221915193007,40.6221436465219,40.6221031873195,40.6220725449378,40.6220382410746,40.6220149650539,40.6219830754004,40.6219376728994,40.6218751068884,40.6218284926664,40.6217904339211,40.6217646690011,40.6217377410521,40.6217242620829,40.621705895286,40.6216887460518,40.6216617545722,40.6216298114672,40.621616286446,40.6216199155533,40.6216395244714,40.6216407011479,40.6216185747095,40.6215621259016,40.6215216502915,40.6214823930187,40.621456693168,40.6214518513595,40.6214457758713,40.6214224870141,40.6213906136622,40.6213673400761,40.6213809157522,40.6213772834775,40.6213454163988,40.621322142748,40.6213418651921,40.6213714118124,40.6213690169713,40.6213469981137,40.6212992647184,40.6212625027099,40.6212048846185,40.6211730367537,40.6211141742893,40.6210626529829,40.6210405708577,40.6210234155385,40.6210246850262,40.6210234932445,40.6209990090466,40.6209732455504,40.6209364336332,40.6209143137115,40.6209056766818,40.6208872087131,40.6208675379466,40.6208343912637,40.6208332276949,40.6208406435394,40.6208455985378,40.6208690142335,40.6208867721599,40.6208961226498,40.6208924895016,40.6208765525295,40.6208642970755,40.6208495693935,40.6208213292751,40.6208054212467,40.6207844565573,40.6207696995383,40.6207512672821,40.6207279655074,40.6207181801884,40.6207108675869,40.6207072260257,40.6206900747856,40.6206704334034,40.6206483177111,40.6206286653581,40.6206004252389,40.6205734169564,40.6205500879364,40.6205206240201,40.6204985397347,40.62047890882,40.6204592743859,40.6204580866753,40.620456899875,40.6204544799779,40.6204508153558,40.6204324019544,40.6204127438317,40.6204004841564,40.6203919070111,40.6204029909924,40.6204140707844,40.6203981395242,40.6203784918638,40.6203661929565,40.620346531329,40.6203305770686,40.6203195746374,40.6203109983979,40.620293809466,40.6202790706473,40.6202704658129,40.6202704449079,40.620258146919,40.620247157758,40.6202429079163,40.6202429317251,40.6202476178505,40.6202635583677,40.6202876634645,40.6203071121903,40.6203258092059,40.6203344054119,40.6203196660776,40.6203212492974,40.6203422487119,40.6203568868558,40.6203655705125,40.6203760751676,40.6203679667076,40.6203536318643,40.6203458995082,40.6203455517652,40.6203292983157,40.6203017267788,40.620280369579,40.6202644884527,40.6202509073021,40.6202229368919,40.6202077837878,40.6201934034019,40.6201739771583,40.6201596787785,40.6201460044246,40.6201398042778,40.6201405574679,40.6201618600381,40.6201668042959,40.6201852427089,40.6202073999651,40.620219707612,40.6202283422097,40.620238196462,40.6202431594073,40.6202432155656,40.6202432675497,40.6202384210584,40.6202273913218,40.6202176285413,40.6202041509708,40.6201771571926,40.6201587832161,40.6201588143619,40.6201747868619,40.6201944412409,40.6202177780627,40.6202386931313,40.6202608501953,40.6202817806645,40.6202855104117,40.6202831731073,40.6202820086872,40.6202820770395,40.6202747706907,40.6202687076884,40.6202737227346,40.6202627342561,40.6202333199021,40.620212479416,40.6201940990257,40.6201757125988,40.6201536466788,40.6201438840357,40.6201336717689,40.6201440016985,40.6201465169996,40.6201465726913,40.620146620121,40.6201491415537,40.6201565498406,40.6201688736721,40.6201824167363,40.6201971946263,40.6202119491878,40.6202242683646,40.6202194006572,40.620215767984,40.6202182781117,40.6202158728903,40.620201227828,40.6202012894819,40.6201976820428,40.6201842144085,40.6201695399807,40.6201524003092,40.6201414010911,40.6201021832925,40.6200886937145,40.6200592440635,40.6200360031925,40.620026225744,40.6200213614303,40.6200091264446,40.6199796228466,40.6199489842715,40.6199072601848,40.6198729441064,40.6198680986622,40.6198779580242,40.6198841235331,40.6199111694016,40.6199494578522,40.6199458386501,40.6199567543234,40.6199653968706,40.6199667019642,40.6199630811358,40.6199533102947,40.6199324938704,40.6199034274431,40.6198981466236,40.6198936682619,40.6199093366384,40.619927775975,40.6199548196868,40.6199732610545,40.6200027739783,40.6200102006095,40.6200298909714,40.620036061955,40.6200360985874,40.6200361291086,40.6200349275724,40.6200337590745,40.6200252026567,40.6200105098505,40.6199982570999,40.6199884799438,40.6199860476871,40.6199848527096,40.6199713751602,40.6199480542608,40.619923520095,40.6199088016991,40.6198928585206,40.6198941164533,40.6199051852416,40.6198941529888,40.6198794210491,40.6198597977992,40.6198512316559,40.6198475786371,40.619847613121,40.6198500949518,40.6198648431176,40.6198648897511,40.6198452610644,40.6198182463958,40.6198047885521,40.6197974680877,40.6198085510208,40.6198294509117,40.6198331622119,40.6198368767073,40.6198369131489,40.6198234415737,40.6198087312179,40.6198001563994,40.6198002009108,40.6198026914347,40.6198051913916,40.6198113667023,40.6198114233003,40.6198114616952,40.6198041432825,40.6198029642754,40.6198042260864,40.6198054883918,40.6197907912576,40.6197846698345,40.619777325635,40.6197834862449,40.6197982262684,40.619814218652,40.6198314464129,40.619831480696,40.6198167910805,40.6198020636591,40.6197824155686,40.6197651997554,40.6197492378001,40.6197443866715,40.6197444189168,40.6197149776719,40.6196978258434,40.6197138483887,40.6197335134288,40.6197458328687,40.6197397274999,40.6197213360744,40.6197152253281,40.61970049471,40.6196906527237,40.6196611881358,40.6196378651485,40.6196096330709,40.6195924718004,40.6195743585282,40.6195673224978,40.6195680399769,40.6195876984504,40.619598270682,40.6196159270171,40.6196466155713,40.6196760789903,40.6197165815351,40.6197460602014,40.6197779862896,40.619824643836,40.6198541132857,40.6198762143255,40.6199093739271,40.6199462397599,40.6199695908927,40.6199819211418,40.6199856427628,40.6200053124405,40.6200310969308,40.6200531999793,40.6200913012985,40.6201146704786,40.6201650195046,40.620188292308,40.6202140729493,40.6202447876171,40.6202889896951,40.6203491472017,40.6204056579012,40.6204265816436,40.6204438159021,40.6204438600436,40.6204439001629,40.6204402741981,40.6204231388902,40.6204354995573,40.6204379910833,40.6204380511665,40.6204197191601,40.6203988961364,40.6203669960681,40.6203105234896,40.6202761584514,40.6202606163887,40.6202651119856,40.6202803510269,40.6203036741287,40.6203452153607,40.620377609362,40.6204080062844,40.6204374188615,40.6204647949477,40.6204941844367,40.620522520004,40.6205498398678,40.6205639865317,40.6205812006988,40.6206105830946,40.6206470366811,40.6206672579711,40.6206641700092,40.6206428714992,40.6206144930534,40.6206022846916,40.6206071135093,40.6206113418153,40.6206427179479,40.6206710291529,40.6206912536811,40.6207205756059,40.620747868931,40.6207883864059,40.6208137384678,40.6208715010023,40.6209039445399,40.6209340402823,40.6209738961351,40.6210032433597,40.621021858479,40.6210233112668,40.6210259717292,40.6210268255498,40.6210367117948,40.6210664940409,40.6210944841072,40.6211116362809,40.621120635591,40.6211215085554,40.6211007029759,40.6210988650459,40.621125964748,40.6211458427631,40.6211683895225,40.6211647233089,40.6211457098658,40.6211303278651,40.6211356973118,40.6211428795908,40.6211880277276,40.6212169320893,40.6212476760943,40.6212626034447,40.6212712287301,40.6212821124087,40.6212992742459,40.6213155062161,40.6213073129332,40.6212953456346,40.6212927614834,40.6213208733509,40.6213523709201,40.6213686634721,40.6213930393021,40.621409253515,40.6214345448176,40.6214534999826,40.6214787484109,40.6214741776574,40.6214687343045,40.6214587747416,40.6214361754522,40.6214090101491,40.6214018055155,40.6214153158186,40.621416169435,40.6214378269555,40.6214723718818,40.6215064469515,40.6215271800838,40.6215488287127,40.6215677774317,40.6215930781434,40.6216102139998,40.621592107003,40.6215884642987,40.6215746340791,40.6215553535635,40.621559000711,40.6215701621944,40.6215995152986,40.6216375742525,40.621681719835,40.6217467328984,40.6217970296405,40.6218152874908,40.6218164494478,40.6218286121862,40.6218285009006,40.6217829923938,40.6216957752331,40.6216846153145,40.6216881847399,40.6217016521903,40.6217372928309,40.6217999381757,40.6218613186859,40.6218968785569,40.6219287519135,40.6219593377393,40.6219580087287,40.6219505788506,40.6219186019436,40.621870700668,40.6218252841718,40.6217847819786,40.6217283019098,40.6216816228779,40.621645983336,40.6216335848557,40.6216347395937,40.6216444827438,40.6216308932691,40.6215940037665,40.6215313734195,40.6214920289418,40.621468732885,40.6214171868304,40.6213619464672,40.621326313825,40.6212685935432,40.62123541142,40.6212108238413,40.6211764239168,40.6211457344474,40.621116280111,40.621090491548,40.6210499953475,40.6210218002305,40.6209800332446,40.6209210707077,40.6208719434338,40.6208252765681,40.6207957398104,40.6207698485793,40.620777121762,40.6207586020715,40.6207400789082,40.6207068435376,40.620682236781,40.6206784755945,40.6206857531131,40.6206438974729,40.6206007840467,40.6205700059446,40.6205159603238,40.6204618235469,40.620485080728,40.620462952497,40.6204849472332,40.6204994977607,40.6204772218412,40.6204856645087,40.620517483489,40.6205873829551,40.6206277886252,40.6206104849976,40.6205453143715,40.6204997422288,40.6205143226541,40.6205227873178,40.6205312498214,40.6205495705108,40.6205531912624,40.6205666064907,40.6205651937824,40.6205958213314,40.6206608741077,40.620716112153,40.6207369732413,40.6207774433959,40.6208092905535,40.6208251965257,40.6208030101982,40.6207820284161,40.6208028145101,40.6208629509509,40.6209329375069,40.6210053760314,40.6210729092031,40.6211515178899,40.6212239599096,40.6212767237005,40.6213174946909,40.6213773750867,40.62149275277,40.6215799106665,40.6216940784394,40.6217665142023,40.6218365139282,40.6219065359075,40.621948384599,40.6220000167113,40.6220553185913,40.6221130377162,40.6221793975101,40.6222199778752,40.6222507301182,40.6223208321868,40.6223933007128,40.6224425077047,40.6225015544618,40.6225470774027,40.6225974693458,40.6226441870231,40.6227081334949,40.6227499443353,40.6227573300483,40.622815119376,40.6228716703352,40.622924504706,40.6229748705166,40.6230092196736,40.623010349849,40.6229906235044,40.6229918017596,40.622970876397,40.6229143419352,40.6228823851949,40.6228196924519,40.6227901643506,40.622793783456,40.6228686982066,40.6229141676869,40.6229620843259,40.6230185545108,40.6230357010291,40.6230675664669,40.6231117186916,40.6231571279674,40.6232307751095,40.623308125733,40.6233461798978,40.6233903341734,40.6234061991053,40.623393840919,40.6233827342414,40.6233875834205,40.6234342055625,40.6234500786566,40.6234671384274,40.6234363740722,40.623372448801,40.6233256974099,40.6232789245944,40.6232690101832,40.6232738052856,40.6232982400222,40.6233385450397,40.6233912060182,40.623429198421,40.6234733417886,40.6235187110236,40.6235603779109,40.6235836117296,40.6235848315782,40.6235522519334,40.6234926971594,40.6234558369703,40.6234055457181,40.623367489541,40.6233208231195]}],[{"lng":[-73.8335933921562,-73.8336174675501,-73.833629942791,-73.8336327824799,-73.8336345902873,-73.8336365829234,-73.8336548436299,-73.8336702106451,-73.8336866156981,-73.8336991074219,-73.8337075749593,-73.8337076887117,-73.8336906572967,-73.8336623866821,-73.8336373157374,-73.8336372444152,-73.8336304335293,-73.833606328792,-73.8336209267452,-73.8336293118299,-73.8336350424366,-73.8336503793823,-73.8336522412148,-73.833635825799,-73.8336021277616,-73.8335771195807,-73.8335592388046,-73.8335755064209,-73.8335933921562],"lat":[40.6235949794134,40.623594280817,40.6236111739035,40.6236309876514,40.6236407607285,40.6236515369018,40.6236655040864,40.6236665907997,40.6236677513853,40.6236780416661,40.6236936855462,40.6237125385907,40.6237213263164,40.6237300820309,40.6237439860125,40.623772600371,40.6238004710318,40.6238129101908,40.6238352503737,40.6238643029961,40.6238833869823,40.6239112908645,40.6239369727435,40.6239552919114,40.623953041811,40.6239420001273,40.6239360345,40.6235979172793,40.6235949794134]}],[{"lng":[-73.862124015412,-73.8620874584394,-73.8620924186303,-73.8621267120669,-73.8621683005201,-73.8622342709098,-73.8623075528181,-73.8623368002439,-73.8623587058715,-73.8623683972524,-73.862390310594,-73.8624367145339,-73.8624904828513,-73.8625174328617,-73.8625321469116,-73.8625859342784,-73.8626080200542,-73.8626349867852,-73.8626570724888,-73.8626767923067,-73.862698698811,-73.8627720333262,-73.8627867656627,-73.862781958904,-73.8627453920016,-73.8627112804464,-73.8627650320841,-73.8627870563836,-73.8627993247553,-73.8628799082508,-73.8629165707041,-73.8629898589846,-73.863038767708,-73.8631242067206,-73.8631802930177,-73.8632217166325,-73.8632656619831,-73.8633609223538,-73.86347880947,-73.86350742741,-73.8635195844843,-73.8635195350208,-73.8634974798404,-73.8635315659003,-73.8635436894298,-73.8635411703911,-73.8635459789006,-73.8635483034932,-73.8635579688896,-73.8635969657005,-73.8636432892512,-73.8637091678756,-73.8637457392597,-73.8637773910003,-73.8637187422316,-73.8636577291184,-73.8635991952754,-73.8635382075591,-73.8634795975033,-73.8634331682966,-73.8633939421441,-73.8633938583594,-73.8634498667726,-73.8634961517186,-73.8634862960225,-73.8634349817493,-73.8633959572609,-73.8633447648866,-73.86330578239,-73.8632424063748,-73.8631765811926,-73.8631497749989,-73.8631204629701,-73.863100846776,-73.8630812411302,-73.8630258180266,-73.862973841731,-73.8629250700365,-73.8628713591559,-73.8628273471468,-73.8627638537017,-73.8627174855008,-73.8626491333771,-73.862580663177,-73.862526836891,-73.8625047624551,-73.8624777622859,-73.8624556979617,-73.8624455385797,-73.8623617467977,-73.8623041469864,-73.862235690936,-73.8621379887684,-73.8620647223128,-73.8619695801788,-73.8620870816475,-73.862077462787,-73.8620751018825,-73.862124015412],"lat":[40.62399037244,40.6239549744579,40.6239177653625,40.6238675664089,40.6238322628126,40.6238155946879,40.6238063787608,40.6238343251128,40.6238697053081,40.6239069319562,40.6239385903316,40.6239367854575,40.6239163812644,40.6238736167216,40.6238438625818,40.6238141551498,40.6237620810516,40.6237118730224,40.6236597989143,40.6236342585598,40.6236058870615,40.6235706199835,40.6235315621124,40.6234943419986,40.6234626662027,40.6234254099225,40.6234124488916,40.6233901462525,40.6233622497347,40.6233642067881,40.623349364391,40.623336427219,40.6233029917694,40.623319840053,40.6233589822717,40.6234036894182,40.6234093240931,40.6234001341358,40.6233886093158,40.6234096113863,40.6234356760672,40.6234598658473,40.6234970542061,40.6235473347593,40.6235901465953,40.6236273579811,40.6236645787342,40.6237222638841,40.6237725156082,40.6238097774313,40.6238470462561,40.6238750356995,40.6239048506157,40.6239514075582,40.6239699449859,40.623951265708,40.6239139812306,40.6238822762096,40.6238822066253,40.6238970375999,40.6239714199132,40.6240123561783,40.624090573622,40.6241464510698,40.62418923681,40.6242040619843,40.6241798251142,40.6241351070935,40.6240904023954,40.6240326446347,40.6239786047413,40.62395066218,40.6239543481019,40.6239934001984,40.6240268704074,40.6240371627014,40.6240006922026,40.6239671410071,40.6239596341461,40.6239856313849,40.623985555609,40.6239706141305,40.6239575072822,40.6240020833122,40.6240503981334,40.6240968904992,40.6241638443131,40.6242047549522,40.6242288843861,40.6242565679356,40.6242734212267,40.6243105535896,40.6243197396873,40.6243215133873,40.6242730200247,40.6241373265712,40.624064746021,40.6240256677346,40.62399037244]}],[{"lng":[-73.8458945844698,-73.8457935211543,-73.8457078351173,-73.8456222115019,-73.845517053158,-73.8454235726018,-73.8452756999025,-73.8451939218419,-73.8450925910342,-73.8449951320719,-73.8448899598636,-73.8447654539807,-73.8447461197082,-73.8447690644389,-73.8447970519189,-73.8448323230581,-73.8448441854845,-73.8448404982959,-73.8448251685962,-73.8447785733916,-73.8446696606588,-73.8445177769054,-73.8443892678519,-73.8443356972132,-73.84428413131,-73.8441790231576,-73.8441089103844,-73.844081503146,-73.8440035242233,-73.8439411158688,-73.8438359867758,-73.8438282957336,-73.8438907097327,-73.8439180902653,-73.8439260235522,-73.8439340004315,-73.8439341600177,-73.843926495388,-73.8438916327988,-73.8438139120438,-73.8437321429892,-73.8436463831987,-73.843576304234,-73.843459562042,-73.8434167524784,-73.843346708427,-73.8432844595685,-73.8432221641694,-73.8431871910034,-73.8431366615855,-73.8431094703439,-73.8430628911438,-73.8430006356072,-73.8429539601476,-73.8429423601766,-73.8429385778281,-73.8429386476541,-73.8429775914006,-73.8430242962457,-73.8430904378876,-73.8432111495434,-73.8433396639502,-73.8434449028839,-73.8435269016411,-73.8435801075551,-73.8437199090267,-73.8438910069316,-73.8440912976078,-73.8442832344089,-73.8444415931161,-73.8445957996467,-73.84474169589,-73.8448709739665,-73.8449503306274,-73.8452004227051,-73.845367040258,-73.8454502214189,-73.8453124124613,-73.8451789868127,-73.8450871066017,-73.8450993351125,-73.8452033689738,-73.8453281628692,-73.8454903848329,-73.845535798992,-73.8455397772271,-73.8454187555008,-73.8453104613489,-73.8452103969266,-73.8451642390928,-73.8452055791733,-73.8454678977559,-73.8456221509606,-73.8458012449806,-73.8458593089416,-73.8459673326214,-73.845999591347,-73.8459528172794,-73.8459068400354,-73.8458945844698],"lat":[40.6249718158164,40.6248885948126,40.6248914464517,40.6248675928199,40.6248704186702,40.6248762284045,40.6248255840025,40.6248225068092,40.6248550108273,40.6248964224661,40.6249051826058,40.6248545695733,40.6247951966605,40.6247457895071,40.6246647020553,40.6245697945746,40.6244926599704,40.6244036341133,40.6242967887334,40.6242373790237,40.6241808522199,40.6241806469087,40.6241775052618,40.6241744091759,40.624171428695,40.6241534824739,40.6241593216354,40.6242215990542,40.6242600691664,40.6243015269662,40.6242924822239,40.6242509287753,40.6242065034356,40.6241560956223,40.6240937918062,40.6240136849097,40.6239454351542,40.6238920133224,40.6238118470886,40.6237405256198,40.6237344791178,40.6237699713066,40.6237609734859,40.6237222391893,40.6237103112928,40.6236864778488,40.6236596867094,40.6236536663886,40.6236209781769,40.6235793662383,40.6235496562292,40.6234843104533,40.623460486759,40.6234366838124,40.6234010603453,40.6233535772895,40.6233239039767,40.6233239571742,40.6233358900513,40.6233626866462,40.6233687860522,40.6233689612494,40.62333052871,40.6232386530143,40.6231781641845,40.6231543510923,40.6230878696485,40.6230182506911,40.6229549737752,40.6229869570229,40.6230125802316,40.6230254846002,40.623012951875,40.622952698563,40.6229816275956,40.623048565731,40.6231376292877,40.6232327498535,40.6232357470999,40.6233023360581,40.6234230735986,40.6235089885725,40.623633052774,40.6237984668961,40.6239923159096,40.6240749187416,40.6241224090309,40.6240746104182,40.6240744757347,40.6242014876659,40.6243540320705,40.6245068736994,40.6245134346401,40.6245962729752,40.6247297781191,40.624895118865,40.6250356500322,40.625052011573,40.6250247447609,40.6249718158164]}],[{"lng":[-73.8577744101864,-73.8578735568606,-73.8579013331242,-73.8578474021551,-73.8577986915825,-73.8578138677174,-73.8578051192438,-73.8578413390383,-73.8576550876023,-73.8575330893759,-73.857334864308,-73.8573290953966,-73.8574227205988,-73.8575220044172,-73.8576734720748,-73.8577744101864],"lat":[40.6248235341474,40.6248207889991,40.624846004608,40.6249313378207,40.6249995017285,40.6250404573657,40.6250859371837,40.6251909132177,40.6253095609559,40.625262009374,40.6251456395462,40.6251169805845,40.6249752930412,40.6249104758806,40.624845722746,40.6248235341474]}],[{"lng":[-73.8404847267472,-73.8404560178746,-73.8404292362694,-73.8404027609764,-73.8403868074995,-73.8403838641029,-73.840380486999,-73.8403316018799,-73.8402741754242,-73.8402210179352,-73.8401624943099,-73.840132678584,-73.8400560618738,-73.8400188168665,-73.8399613360951,-73.8399509063907,-73.8399325670664,-73.8399027690353,-73.8398794779334,-73.8398613549117,-73.8398262935193,-73.8397880239167,-73.8397316138779,-73.8397070887422,-73.8397095126396,-73.839717654155,-73.8397410216166,-73.8397910005163,-73.8398367149886,-73.8398472750482,-73.8398386972671,-73.8398099498,-73.8397737709115,-73.8397269664689,-73.839696142918,-73.8396653384199,-73.8396154140938,-73.8395580112583,-73.8395229850707,-73.8394876479837,-73.8394670088788,-73.8394872779741,-73.8395454869679,-73.8395607673927,-73.8396214141825,-73.8396805060712,-73.839682071448,-73.8396519361172,-73.8397605253511,-73.8398220314201,-73.8398665320323,-73.8399903263649,-73.840083690532,-73.8401468370285,-73.840154539406,-73.8401698321144,-73.8402178919786,-73.8402482852745,-73.8402787370068,-73.8403041661401,-73.8404380778816,-73.8405240793374,-73.8405848416771,-73.8406052245698,-73.8406101902414,-73.8406129999231,-73.8406535189936,-73.8407212211531,-73.8407923193131,-73.840808718505,-73.8408039434837,-73.8407947777121,-73.8407890785025,-73.8408439003418,-73.8409290618351,-73.8410039168835,-73.8410746266063,-73.8411020156707,-73.8411540909223,-73.841233693773,-73.8413408447389,-73.8414370322217,-73.8415414258603,-73.8415577758545,-73.8415603698312,-73.8416345433004,-73.8416867231713,-73.8417223338065,-73.8417194765675,-73.8416589811182,-73.8416946265519,-73.8417550737014,-73.8417852404295,-73.8417906654875,-73.8417054077442,-73.841598201573,-73.8415680157531,-73.8415074192764,-73.8415072303841,-73.8415730327347,-73.8416691315994,-73.841754239893,-73.8418008464493,-73.841822621932,-73.8419268885204,-73.8420229128782,-73.8420857999955,-73.8422394167694,-73.8423817864799,-73.8423611404103,-73.8423100486586,-73.8422494007962,-73.8422247249343,-73.8421760766736,-73.8419825713118,-73.8418421351055,-73.8417549077468,-73.841686923392,-73.8416147609533,-73.8415073744778,-73.8414170393913,-73.8413415970778,-73.8412757598082,-73.841209806469,-73.8411289854834,-73.8410556696196,-73.840951508837,-73.840873945609,-73.8407804068637,-73.8406495632359,-73.840600648662,-73.840518772424,-73.8404464565166,-73.8404069872355,-73.8403696737018,-73.8403376904484,-73.8403355079327,-73.840332209226,-73.8402937777133,-73.8402564398746,-73.8402169867532,-73.8402041309526,-73.8401934115885,-73.8401646304996,-73.8401453701627,-73.8401516361425,-73.8401813429669,-73.8402345260412,-73.8402898121261,-73.8403217229434,-73.8403876762915,-73.8404301916302,-73.8404535342442,-73.8404534625207,-73.8404597843085,-73.8404884560355,-73.840550061195,-73.8406170047672,-73.8406690439082,-73.8406774729539,-73.8406656933803,-73.8406390180551,-73.8406132283396,-73.8405495439377,-73.8405112464527,-73.8404918608468,-73.8404847267472],"lat":[40.6274952885278,40.6274838962611,40.6274928301009,40.627501661832,40.6274967748121,40.627483928962,40.6274691951287,40.6274391249927,40.6274203937261,40.6273959933204,40.6273910465976,40.6273974921986,40.6273925207643,40.6273900359213,40.6273940099559,40.6273989931609,40.6274077553606,40.6274069037006,40.6273849804253,40.6273679231858,40.6273427357884,40.6273240321382,40.6273247643571,40.6273441918372,40.6273516375226,40.6273766423495,40.6273961360918,40.6274140452345,40.6274351922778,40.6274692644505,40.6274960125702,40.6275008373928,40.6274975431159,40.6274877476299,40.6274706753394,40.6274454956713,40.6274048810167,40.6273764196786,40.6273366366129,40.6273081112154,40.6272938407629,40.627257348924,40.6271805457788,40.6271209814104,40.6270787792049,40.6270824584669,40.6270327331976,40.6269750285432,40.6269290486645,40.6269168673992,40.6269080527002,40.6268332630531,40.6268237823212,40.6267911939487,40.6267354639203,40.6266701333068,40.6266163800906,40.6265664479348,40.6264915270645,40.6264069892452,40.626320680138,40.6262246937928,40.6261344385686,40.6260498936831,40.625994662748,40.625963409423,40.6258981137107,40.6258647451217,40.6258782596553,40.62591386803,40.6259432599046,40.6259996724773,40.6260854888381,40.6261378952643,40.6261401069024,40.6261330591386,40.6261591473486,40.6261947703687,40.6262471740226,40.6262765896517,40.6262746449674,40.6262622175185,40.6262644545556,40.6263209951623,40.6263858900748,40.6263880860466,40.6263965311753,40.626440538632,40.6264865857285,40.626509529115,40.6265388832048,40.6265368733138,40.626559940849,40.6265892539873,40.6266268149,40.626651786536,40.6266684497577,40.6267019005087,40.6267814433307,40.6268380525968,40.6268633042704,40.6268885400664,40.6269304695236,40.6270163237274,40.6270729851993,40.6271296345809,40.6272574105306,40.6273580979108,40.6274407862717,40.6274694948743,40.6274718578329,40.627464476739,40.6274486147448,40.6274173440341,40.6273343671925,40.6273130907396,40.6272943203865,40.627239086149,40.6271505999958,40.6271058529547,40.6270513984148,40.6270002077167,40.6269376788029,40.6269238022761,40.6268969310553,40.6268465544494,40.6267880258908,40.6267335885888,40.6266839951571,40.6266578651517,40.626639957856,40.6266090307083,40.6265862248369,40.6266242820558,40.6266509898219,40.6266736509451,40.6266963522763,40.6267401359117,40.626789547635,40.626825985077,40.6268575551964,40.6268924054656,40.6269248270202,40.6269434373398,40.6269863874346,40.6270366714182,40.6270756355563,40.6270886840878,40.6271122766051,40.6271196188255,40.6271334958615,40.6271570712511,40.6271871059034,40.627217109066,40.6272438769026,40.627270676252,40.6273226591595,40.6273673510357,40.6274136444012,40.6274493345539,40.6274801323309,40.6275084766053,40.6275289241167,40.627539166652,40.6275318151335,40.6275051154543,40.6274952885278]}],[{"lng":[-73.8687291529088,-73.8691918981228,-73.8695623896577,-73.869992900327,-73.8707590635289,-73.8710844342514,-73.8712515250932,-73.8715349498553,-73.8717588590605,-73.8719678937706,-73.8721621420211,-73.8723560849694,-73.8725500054888,-73.8727589310809,-73.8729977322284,-73.8732963093785,-73.8735351960934,-73.8739530620689,-73.8743260055674,-73.8747884518977,-73.8753552930286,-73.8757133419071,-73.8762056412654,-73.8767128563797,-73.8772498645819,-73.8775630983918,-73.8779807086464,-73.878293859901,-73.8786218875722,-73.8789646464479,-73.8792476784885,-73.8795157731661,-73.8797238960811,-73.8797531767839,-73.8797825207117,-73.8797819474835,-73.8797814766141,-73.8797810466857,-73.8797805553365,-73.8797352700206,-73.8795854787742,-73.8794805010424,-73.8793755632116,-73.8792559539565,-73.8790315676754,-73.8788819759142,-73.8786428756926,-73.8785082210804,-73.878254198493,-73.8780001748347,-73.8777909888892,-73.877477580462,-73.8772236568971,-73.8768951412764,-73.876626297179,-73.8763723697184,-73.8761332966013,-73.8758641933534,-73.8755656128396,-73.8753862716748,-73.8748138686504,-73.8664548405525,-73.8659032012413,-73.8654707843299,-73.865187862763,-73.8649798168286,-73.8648908983954,-73.8647276604543,-73.8648774518156,-73.8649819349592,-73.8652518325117,-73.8655358906139,-73.8657005929935,-73.8657011190694,-73.8658658215415,-73.8662690623231,-73.8665086032255,-73.8665093989422,-73.866375836495,-73.8661824213304,-73.8658994496943,-73.8654970664666,-73.8652293618183,-73.8650956955132,-73.865036367452,-73.8649325607174,-73.8649779588224,-73.8650083012007,-73.865068501621,-73.8651734314687,-73.8654185596023,-73.8653387669192,-73.8655038923137,-73.8656386076045,-73.865758313194,-73.8660421114301,-73.8662065447406,-73.8666095879342,-73.8668486744204,-73.8671769911555,-73.8675949696113,-73.8680575627639,-73.8682069376314,-73.8687291529088],"lat":[40.6173567850034,40.6171981709783,40.6172470924647,40.6170706440366,40.6167566195711,40.6167639983598,40.6166548670656,40.6166551841563,40.6165758625664,40.6164737904514,40.6163034970899,40.6162923447597,40.6162925599279,40.6162473228252,40.6161793836582,40.6160546723202,40.6159412624034,40.615839415733,40.6158284567228,40.6158175940294,40.6158182100695,40.6157958637291,40.6157736604281,40.6157514703475,40.6157520450454,40.6157637469553,40.6157982928784,40.6158554614284,40.6159353786905,40.6161176174877,40.6163338932321,40.6165615197965,40.6169595931841,40.6172665401394,40.617539385443,40.6178576689948,40.6181191157535,40.6183578285297,40.6186306424297,40.6189261446581,40.6192670061426,40.6195738130537,40.6198578847145,40.6200055339287,40.6203463162852,40.6205735046083,40.6208005976075,40.6210164345321,40.6212435104418,40.6214705869581,40.621652242058,40.6217201121719,40.6218903495327,40.6220605074847,40.6222307287173,40.6224009651941,40.6226053191336,40.6229119450344,40.6230252946331,40.6231956103004,40.6235871891837,40.6282553868071,40.6280615008735,40.6279359561981,40.6276628099184,40.6272533440261,40.6269576901562,40.6265255419135,40.6262301691283,40.625660706041,40.6255372045954,40.6252419882165,40.6249466312624,40.6246851842486,40.6243898275457,40.6241743193655,40.623754008018,40.623356154369,40.623003613142,40.6227419416624,40.6225028982591,40.6222978180387,40.6218882820313,40.6215925761807,40.6214219965638,40.6211149588849,40.6207967274223,40.6205466831577,40.620285306081,40.6200353492825,40.6198360278927,40.6194217102809,40.6189103752017,40.6186831874848,40.618501449958,40.6183199048115,40.618149586943,40.6180136483379,40.6178093141079,40.6177414901789,40.6175941975244,40.6175151583161,40.617413024548,40.6173567850034]}],[{"lng":[-73.8481397702266,-73.848185394944,-73.8483144988127,-73.8484068666603,-73.8484336046341,-73.8484555042687,-73.8484722569827,-73.8484836267158,-73.8484839771036,-73.8484788997307,-73.8484684824963,-73.8484400625001,-73.8484064606528,-73.8483683427021,-73.8481259367432,-73.8481004553481,-73.8480535049012,-73.8481397702266],"lat":[40.6285427045882,40.6285182938955,40.628541138998,40.6285689778093,40.6285988762892,40.6286309780194,40.6286648306746,40.6286999572573,40.6287314363124,40.6287626779133,40.6287931411615,40.6288227865722,40.6288490980282,40.6288715542207,40.6288404448054,40.6287967360251,40.6286735874904,40.6285427045882]}],[{"lng":[-73.8485199356512,-73.8484981956066,-73.8484755183415,-73.8484556262791,-73.8484399039566,-73.8484260478847,-73.848418209256,-73.8484173147326,-73.8484247441954,-73.8484247834146,-73.8484299157886,-73.8484327410127,-73.8484484929209,-73.848475795188,-73.8484998554826,-73.848525270291,-73.8485432625727,-73.8485765465696,-73.8486103146725,-73.8486366973171,-73.8486575465376,-73.8486843780153,-73.8486912754748,-73.8486898366095,-73.8486888680236,-73.8486976230646,-73.8487008332151,-73.8486970996923,-73.8486938161749,-73.8487039363097,-73.8486937426674,-73.8486803362776,-73.8486622993835,-73.8486442710626,-73.8486290200261,-73.8486105197676,-73.8485911045206,-73.8485712325826,-73.8485583016502,-73.8485402813453,-73.8485199356512],"lat":[40.6305610242755,40.6305606438206,40.6305658993052,40.6305665778821,40.6305640901283,40.6305549092065,40.6305443264611,40.6305305810464,40.6305179038802,40.6305006358944,40.630481611884,40.6304594135107,40.630448861863,40.6304439644571,40.6304404723609,40.6304524873431,40.6304736558686,40.6304825105538,40.630482202038,40.6304751886663,40.630460062121,40.6304590401613,40.6304770232427,40.6304995752574,40.6305189565695,40.6305337697685,40.6305461084728,40.6305605527565,40.6305802835029,40.6306056707415,40.6306127059367,40.6306095164695,40.6306080829745,40.6306027727027,40.6305967624632,40.6305960326413,40.6305903682217,40.6305818841892,40.6305730569826,40.6305642224003,40.6305610242755]}],[{"lng":[-73.853000146445,-73.8530168208518,-73.8530288908026,-73.8530360467788,-73.8530381052772,-73.8530350135151,-73.8530268507833,-73.8530138264124,-73.8529962744038,-73.8529746448645,-73.8529494924643,-73.8529214622115,-73.8528939888105,-73.8528691487434,-73.852847551428,-73.8528297267239,-73.8528161119333,-73.852807041073,-73.8528027366796,-73.8528033043503,-73.8528087301529,-73.8527872445,-73.8527578318799,-73.8527207276679,-73.8526762287829,-73.852624691311,-73.8525665276556,-73.8525022032373,-73.8524322327693,-73.8523571761391,-73.8522776339279,-73.8521942426059,-73.8521076694391,-73.8520186071508,-73.8519277683793,-73.8518818675454,-73.8518367333023,-73.8517937345952,-73.851754175596,-73.8517192561457,-73.8516900353626,-73.8516673995187,-73.8516520351588,-73.8516444082786,-73.8516753049462,-73.8517147353434,-73.8517622968948,-73.8518175040159,-73.8518797930721,-73.8519485281323,-73.8520230074622,-73.852102470688,-73.8521861065591,-73.8522400822719,-73.8522961057107,-73.8523532032925,-73.8524103827683,-73.852466650466,-73.8525210285578,-73.8525725720525,-73.8526203852167,-73.8526636371409,-73.852844548361,-73.8530287074291,-73.8532160031971,-73.85334176026,-73.8534688111903,-73.8535040256802,-73.8535419350678,-73.85358160589,-73.8536220613104,-73.8536623051719,-73.8537013465274,-73.8537382240402,-73.8537720296565,-73.8538019309652,-73.853827191695,-73.8538957346024,-73.8539659753895,-73.8541102263093,-73.8542606582511,-73.8544169176162,-73.8545786371135,-73.8547454366229,-73.8549169240886,-73.8550926964404,-73.8552723405407,-73.8554554341556,-73.8556415469466,-73.855830241482,-73.8560210742645,-73.8562135967734,-73.856407356518,-73.856601898101,-73.8567967642884,-73.8569914970835,-73.8571856388028,-73.8573787331518,-73.8575703262963,-73.8577599679293,-73.8578789782846,-73.8579935679069,-73.8581031692508,-73.8582072394726,-73.8583052631187,-73.8583967546784,-73.858481260989,-73.8585583634798,-73.8585507561771,-73.8585352656181,-73.8585119833375,-73.8584810469274,-73.8584426392237,-73.8583969872267,-73.8583443607593,-73.8582850708728,-73.8582376342226,-73.8581954826286,-73.8581595507892,-73.858130635486,-73.8581093779158,-73.8580962494712,-73.8580915412864,-73.8580953577805,-73.8581338205999,-73.8581648803138,-73.8581883211747,-73.8582039803499,-73.858211749053,-73.8582115733006,-73.8582034542873,-73.8581874483789,-73.8581636667209,-73.8581171737965,-73.8580628578278,-73.8580009045881,-73.8579315259796,-73.857854959309,-73.857771466476,-73.8576813330772,-73.85758486743,-73.8575356796427,-73.8574825628283,-73.8574262617726,-73.8573675659117,-73.8573072982629,-73.8572463038838,-73.8555643706512,-73.8555243347113,-73.855482139265,-73.8554389863815,-73.8553961054056,-73.8553547179356,-73.855316003024,-73.8552810635888,-73.8552508949941,-73.8552263566941,-73.8552081477486,-73.8551967869075,-73.8551925978317,-73.8551956998717,-73.855175726918,-73.8551482299439,-73.855113393551,-73.8550714516221,-73.8550226857518,-73.854967423356,-73.854906035474,-73.854838934277,-73.8547665703014,-73.8546303890244,-73.8544901004211,-73.8543461721584,-73.8541990840397,-73.8540493264051,-73.8538973984963,-73.8537438067922,-73.8535890633193,-73.8534336839455,-73.8532781866585,-73.8531230898396,-73.8529689105346,-73.8528161627297,-73.8526653556376,-73.8525169919997,-73.8524611157175,-73.8524124745414,-73.8523716891286,-73.8523392798908,-73.8523156603543,-73.8523011318843,-73.8522958798405,-73.8522999712134,-73.8523133537706,-73.8523358567245,-73.8524109408927,-73.8524927681485,-73.8525812617132,-73.8526763385589,-73.8527779094866,-73.85288587921,-73.853000146445],"lat":[40.6320228422534,40.6320018865053,40.6319791716816,40.6319552802842,40.6319308249862,40.6319064329211,40.6318827296001,40.6318603228714,40.631839787333,40.6318216495975,40.6318063747879,40.6317943546103,40.6317831509683,40.631768816393,40.6317517025651,40.6317322293503,40.6317108744986,40.6316881619227,40.631664648845,40.6316409121264,40.6316175341139,40.6315492202513,40.6314826424908,40.6314183335698,40.6313568080696,40.6312985582983,40.6312440503509,40.6311937203808,40.6311479711098,40.6311071686057,40.6310716393535,40.6310416676436,40.6310174932966,40.6309993097451,40.6309872624857,40.6309869529355,40.6309805809221,40.6309683397121,40.6309506005878,40.6309279015857,40.6309009311773,40.6308705073869,40.6308375529804,40.6308030674768,40.6307374481594,40.6306745391819,40.6306149827934,40.6305593870143,40.6305083194293,40.6304623013925,40.630421802706,40.6303872368233,40.6303589566292,40.6303443798045,40.6303353388981,40.6303319910241,40.6303343943623,40.630342507147,40.6303561883933,40.6303752003467,40.6303992126145,40.6304278079075,40.6305302196523,40.6306292145633,40.6307247328853,40.6307860721183,40.6308458438147,40.6308610798918,40.6308719314318,40.6308781312312,40.6308795266288,40.6308760832649,40.6308678859275,40.6308551364642,40.630838148812,40.6308173412668,40.6307932261837,40.6307396390503,40.6306873437152,40.6305875147269,40.6304931296478,40.6304044103195,40.6303215652663,40.6302447892047,40.6301742625863,40.6301101511736,40.6300526056508,40.6300017612695,40.629957737531,40.6299206379057,40.6298905495898,40.6298675433005,40.6298516731101,40.6298429763184,40.6298414733658,40.6298471677846,40.6298600461911,40.629880078317,40.6299072170805,40.6299413986966,40.6299860943859,40.6300370565586,40.6300940328112,40.6301567409534,40.6302248704052,40.6302980837351,40.6303760183309,40.6304582881956,40.6305366888904,40.630614412617,40.6306909999626,40.6307659982299,40.6308389641129,40.6309094663173,40.63097708811,40.6310414297827,40.6310658463608,40.631095358984,40.6311293132245,40.6311669561629,40.6312074530831,40.6312499059818,40.6312933734809,40.631336891702,40.6314034051945,40.6314721277082,40.6315425819327,40.6316142785284,40.6316867195254,40.6317594017817,40.6318318204782,40.6319034726246,40.6319738605534,40.6320768409277,40.6321775743593,40.6322757162514,40.6323709308711,40.632462892498,40.6325512865384,40.632635810602,40.6327161755363,40.6327437209531,40.6327666436903,40.6327846223316,40.6327974047855,40.6328048118196,40.6328067395743,40.6328198029409,40.6328074373556,40.6328003776622,40.6327988249778,40.6328028235357,40.6328122594244,40.6328268638331,40.6328462207092,40.6328697786109,40.6328968664162,40.6329267124415,40.6329584664254,40.632991223751,40.6330240512165,40.6330946877915,40.6331638414423,40.6332310478466,40.6332958557551,40.6333578300219,40.6334165545258,40.6334716349652,40.6335227015049,40.6335694112606,40.633626624383,40.6336777545481,40.6337226313049,40.6337611050488,40.6337930475208,40.6338183522345,40.6338369348321,40.6338487333647,40.6338537084996,40.6338518436513,40.6338431450366,40.633827641654,40.6338053851872,40.6337764498322,40.6337409320505,40.6336944673231,40.6336434981429,40.6335886748902,40.6335306971228,40.6334703046488,40.6334082680867,40.6333453790315,40.6332824399539,40.6332202539607,40.633159614547,40.6329909545053,40.6328241249912,40.6326592824388,40.6324965814183,40.6323361744904,40.6321782120636,40.6320228422534]}],[{"lng":[-73.8840472614938,-73.882632484334,-73.88313893883,-73.8836923157159,-73.8851295402378,-73.8857216703731,-73.8860111664062,-73.8860833204875,-73.8861570802403,-73.8862318125812,-73.8863068760785,-73.8863816264579,-73.886455422133,-73.8865276297122,-73.887526737062,-73.8882846126345,-73.8904229974356,-73.8914872074832,-73.893005588644,-73.8930739019846,-73.8931195160797,-73.8931894260757,-73.8932684545068,-73.8934492537216,-73.893518783167,-73.8939491170406,-73.8945279313366,-73.8946467070627,-73.8947616990121,-73.8948726026422,-73.8949791242407,-73.8951879785758,-73.8953361247067,-73.8954846797204,-73.8955337061117,-73.8955595573055,-73.8955219701346,-73.8955139976167,-73.8955223772904,-73.8955767262188,-73.8956204310028,-73.8956660187321,-73.8957261268837,-73.8958310834572,-73.8962579773043,-73.8958748912299,-73.8957622250945,-73.8956816844572,-73.89558588818,-73.8954715046768,-73.8953636929985,-73.8952496934687,-73.8951632926857,-73.8950321037624,-73.8949051955448,-73.8947293509273,-73.8946013353659,-73.8944552643118,-73.8942383881476,-73.8941001952536,-73.8939559679226,-73.8937697128522,-73.8935835752479,-73.8933501530381,-73.8930497455622,-73.8928333280948,-73.8924879958441,-73.8921705698979,-73.8918341140108,-73.8912129976544,-73.8883663017257,-73.8880542078172,-73.887536129845,-73.8873108861771,-73.8871355924869,-73.886902124809,-73.8866990060801,-73.8865099810516,-73.886340592969,-73.8861162792192,-73.8859254520789,-73.8855475083986,-73.8854652995816,-73.8853713558031,-73.8852702895132,-73.8851682536885,-73.885071781629,-73.8849864586851,-73.8849159404165,-73.8848547180938,-73.8848030491185,-73.8847648202445,-73.8847426687268,-73.8847373797384,-73.8847407940681,-73.8847593778489,-73.8847268487133,-73.8847364113229,-73.8847426643222,-73.8847385226749,-73.8847137670356,-73.884668162112,-73.8846020439878,-73.8845162081575,-73.8844119453547,-73.8842909604013,-73.8841553029174,-73.8838199042828,-73.8837245750953,-73.8834823178755,-73.8834487815581,-73.8825543035618,-73.8813262524205,-73.8811916137202,-73.8810800672583,-73.8809570243761,-73.8808553316143,-73.880743765109,-73.8806568100395,-73.8805173569765,-73.8804057727442,-73.8802941853155,-73.8801210453158,-73.879975459385,-73.8795299405538,-73.8794340175015,-73.8793404042684,-73.8792563256351,-73.8791695596886,-73.8791451427625,-73.8790799104255,-73.8790173117542,-73.8789535877491,-73.8789370872557,-73.8787003914134,-73.8786386390807,-73.8785339777289,-73.8783840233021,-73.8785566670694,-73.8785803423816,-73.87841750135,-73.8778095267733,-73.877144348686,-73.877493816927,-73.8779388963426,-73.8781371779873,-73.8782059048978,-73.8783334958633,-73.8785654291765,-73.8787277618309,-73.8789045527894,-73.8791833562457,-73.87936895387,-73.8797120639606,-73.8799876750384,-73.8801846834287,-73.8802328219403,-73.880376294891,-73.880933201223,-73.8812706810454,-73.8814449590912,-73.8816219773807,-73.8816303732891,-73.8817821476964,-73.8819789199706,-73.8820858308973,-73.8821589950239,-73.882569451828,-73.8827268494473,-73.8830136210351,-73.8832218127964,-73.8834526563568,-73.8836445172823,-73.8837550166025,-73.8837693279638,-73.8834541292338,-73.8840472614938],"lat":[40.6295601185465,40.6282742731269,40.627932651807,40.6275593734115,40.6288272586714,40.6284467152238,40.6286458835711,40.6286616516539,40.628672264541,40.6286776311416,40.6286777053938,40.6286724866603,40.6286620197339,40.6286463944525,40.6283318244825,40.6278924602235,40.6262785987977,40.6244817224152,40.6233564685934,40.6233566134023,40.6233956763061,40.6234052048171,40.6234141510446,40.6233466380991,40.6233526928488,40.6231853014206,40.6228859795138,40.6228322691382,40.6227739739439,40.6227112483238,40.6226442584046,40.622501020503,40.6224705702292,40.6224855683745,40.6225139189487,40.6225402523437,40.6225772822784,40.622585138838,40.622619583186,40.622654589642,40.6226762846161,40.6226733726317,40.6226670384533,40.622687011909,40.6229028460825,40.6234325659253,40.6235995711791,40.6237012338742,40.6238221439521,40.6239600256484,40.6240767695628,40.6241897934552,40.6242781414487,40.6244106375749,40.6245330128578,40.624682644705,40.6247905980889,40.6249099531853,40.6250815553665,40.6251820340768,40.6252947006402,40.6254210421054,40.6255473215584,40.6257018950258,40.6258952012101,40.6260344630684,40.6262566961515,40.6264614194652,40.626680605523,40.6270840111824,40.6289162349389,40.6290361258462,40.6292890808949,40.6293990570893,40.629453600378,40.6295262501616,40.6295593785202,40.6295902142316,40.6295902000275,40.6295901762479,40.6295609280354,40.6294629811594,40.6294290197829,40.6294067547319,40.6293991838171,40.6294077575985,40.6294319257387,40.6294692415527,40.6295160349859,40.6295577015887,40.62960934251,40.6296687904851,40.629732800961,40.6297976078495,40.6298177865945,40.6299221637511,40.6300152334118,40.6301184614918,40.6301859516969,40.6303594962852,40.6305338211574,40.6307068009622,40.6308762579708,40.6310401202817,40.6311964362661,40.6313435127016,40.631479931125,40.6318016911699,40.6318898090714,40.6321024657081,40.632232088569,40.6330044006804,40.634263210453,40.6344241559521,40.6345549765454,40.634708234642,40.6348278444788,40.6349686418916,40.635082035605,40.635256474768,40.6354059975606,40.6355642563578,40.6358084951236,40.636026079762,40.6367354751942,40.6369026640831,40.6370746548416,40.6372291053996,40.6374049392746,40.6374544066025,40.6375865973655,40.6377134505503,40.6378357011734,40.6378673460452,40.6383377247465,40.6382936062603,40.63816625608,40.6379041080905,40.637613120581,40.6375187565935,40.6374574871673,40.6368818642752,40.6359764980076,40.6353904239771,40.6350195711393,40.6346947318909,40.6345729436626,40.6344804179453,40.6343394650762,40.634251388647,40.6341158824162,40.6340148260288,40.633908015784,40.6336900848251,40.633514883481,40.6333096385907,40.6332268905214,40.6329802623633,40.6325870617929,40.6323691191611,40.6323050961165,40.632297105614,40.6322967272664,40.6322498009729,40.6321729589996,40.6320789043053,40.632006215385,40.6318183058851,40.6317671049003,40.6316261495354,40.63144231259,40.631155772113,40.6309433121386,40.6305564380126,40.6302217613424,40.6299076704375,40.6295601185465]}],[{"lng":[-73.8463845890998,-73.8464203814143,-73.8464563237132,-73.8464914591734,-73.846524852451,-73.8465556145821,-73.8465829266478,-73.8466060615757,-73.8466244034944,-73.8466374641293,-73.8466448957997,-73.8466465006745,-73.8466367224908,-73.8466357883211,-73.8466437016874,-73.8466604323453,-73.8466859164009,-73.8467200565543,-73.8467627224724,-73.8468137512864,-73.8468729482141,-73.8469181745619,-73.846961144185,-73.847019372374,-73.8470720889704,-73.8471189141,-73.8471595103464,-73.8471940043556,-73.8472365518028,-73.847286715006,-73.8473439779477,-73.8474077515839,-73.8474773799033,-73.8475521466751,-73.8475786667478,-73.8475994527212,-73.8476139308869,-73.8476217016405,-73.847622550511,-73.8476164540783,-73.8476035806195,-73.8475842854629,-73.8475862200991,-73.8475965937464,-73.8476153208969,-73.8476422472095,-73.8476771507818,-73.8477197439801,-73.8477696758097,-73.8478265348078,-73.8478898524346,-73.8479591069345,-73.8480337276351,-73.84811309965,-73.8481965689454,-73.8482834477288,-73.8483730201164,-73.8484645480311,-73.848516413595,-73.8485657631997,-73.8486116045834,-73.8486530160258,-73.8486891648813,-73.848719324321,-73.8487428879465,-73.8487593819823,-73.8487684748007,-73.8488547437259,-73.8489452713283,-73.8490395187477,-73.8491369249848,-73.8492369102404,-73.849338879366,-73.8494422254061,-73.8495463332104,-73.8496505830951,-73.8497543545307,-73.8498570298351,-73.84995799785,-73.8499937757455,-73.8500247019529,-73.850050002804,-73.8500690453544,-73.8500813532177,-73.8500866184841,-73.850084709424,-73.8500756737845,-73.8500328920983,-73.8499989222518,-73.849973795419,-73.8499575346823,-73.8499501550115,-73.8499516632491,-73.8499465345734,-73.849933157282,-73.8499115790425,-73.8498818767696,-73.8498441563516,-73.8497985522731,-73.8497452271359,-73.8496843710797,-73.8496162011045,-73.8495409602967,-73.8494589169629,-73.849370363673,-73.8492756162171,-73.8491750124797,-73.8490969721738,-73.849025733165,-73.8489615569053,-73.8489046789315,-73.8488553080005,-73.848813625323,-73.848779783898,-73.8487539079508,-73.8487360924767,-73.8487197237944,-73.8486946612738,-73.8486609366215,-73.8486185925288,-73.8485676826173,-73.8485082713719,-73.8484404340593,-73.8483642566323,-73.8482798356219,-73.8481872780148,-73.8481317700251,-73.8480685565381,-73.8479978590669,-73.8479199253567,-73.8478350285176,-73.847743466067,-73.8476455588874,-73.8475416501022,-73.8474321038725,-73.8473173041217,-73.8471976531893,-73.8470735704208,-73.846945490698,-73.8468138629145,-73.8466791484023,-73.8465963609227,-73.8465147506552,-73.846435241731,-73.8463587344842,-73.8462860952565,-73.8462181465859,-73.8461556578927,-73.8460993367663,-73.8460498209527,-73.8460076711334,-73.8459733645766,-73.8459472897336,-73.8459297418408,-73.8459170879623,-73.8458987748053,-73.8458691874397,-73.8458315449401,-73.8457860037775,-73.8457327532462,-73.845672014677,-73.8456040405167,-73.8455291132789,-73.8454475443692,-73.8453596727913,-73.8452658637375,-73.8451665070714,-73.8450620157074,-73.8449528238946,-73.8448690182269,-73.8447872807118,-73.8447080787966,-73.8446318654259,-73.8445590764514,-73.8444901281391,-73.8444294694815,-73.8443728187804,-73.8443204594247,-73.8442726533341,-73.8449184334688,-73.8450180413497,-73.845123322149,-73.8452338463697,-73.8453491631288,-73.8454688019961,-73.8455922749135,-73.8457190781853,-73.8458486945332,-73.8459805952054,-73.8461142421337,-73.8462490901281,-73.8463845890998],"lat":[40.6352857676889,40.6352887022148,40.6352871636155,40.63528119285,40.6352709488668,40.6352567043715,40.6352388385679,40.6352178270622,40.6351942292021,40.6351686731861,40.63514183934,40.6351144420059,40.6350055591375,40.634896424068,40.634787453308,40.6346790627391,40.6345716660266,40.6344656730409,40.6343614882931,40.6342595093918,40.6341601255251,40.634131635722,40.6341011860269,40.634053563052,40.63400234938,40.6339479140676,40.6338906493865,40.633828743569,40.63376981796,40.6337144786939,40.633663295013,40.6336167934122,40.6335754522238,40.6335396966972,40.633514995242,40.633487289684,40.6334573447273,40.6334259868848,40.6333940816653,40.6333625096848,40.6333321423601,40.6333038178574,40.6332328530637,40.6331623143081,40.6330927828459,40.6330248316306,40.6329590205922,40.6328958920236,40.6328359661125,40.6327797366548,40.6327276669859,40.6326801861634,40.6326376854314,40.6326005149973,40.6325689811461,40.6325433437168,40.6325238139616,40.6325105528055,40.6324998096727,40.6324835856754,40.6324622070267,40.6324361035832,40.6324058002011,40.6323719061836,40.6323351030285,40.6322961307259,40.6322557728793,40.632211150738,40.6321717283762,40.63213774045,40.6321093892679,40.6320868435858,40.6320702376033,40.6320596701649,40.6320552041714,40.6320568662059,40.6320646463753,40.6320784983697,40.6320983397373,40.6321196204147,40.6321449326074,40.6321736430955,40.6322050336452,40.6322383189759,40.6322726664053,40.6323072166798,40.6323411054698,40.6325625617935,40.6327849026387,40.6330079245412,40.6332314234114,40.6334551947214,40.6336790336917,40.6337844268299,40.6338893988161,40.6339935752979,40.6340965847585,40.6341980598408,40.6342976386585,40.6343949660859,40.634489695025,40.6345814876434,40.634670016579,40.6347549661078,40.6348360332703,40.6349129289512,40.6349853789119,40.6350691492613,40.6351563657852,40.6352467084264,40.6353398456542,40.6354354356815,40.6355331277184,40.6356325632597,40.6357333774005,40.6358352001749,40.6360214453583,40.6362071284982,40.6363920141501,40.636575867879,40.6367584565563,40.6369395486554,40.6371189145459,40.6372963267843,40.6374715604026,40.6376443931938,40.6377448416871,40.6378426119498,40.6379373613233,40.6380287577353,40.6381164808632,40.6382002232573,40.6382796914185,40.6383546068265,40.6384247069171,40.6384897460017,40.6385494961292,40.6386037478848,40.6386523111239,40.6386950156392,40.6387317117571,40.6387266328005,40.6387148811444,40.6386965898612,40.6386719660761,40.6386412886215,40.6386049048792,40.638563226847,40.6385167264721,40.6384659303075,40.638411413549,40.6383537935212,40.6382937226874,40.6382318812609,40.6381508309199,40.6380704104184,40.6379744475692,40.6378801363866,40.6377878688151,40.6376980283047,40.6376109882172,40.6375271102749,40.6374467430576,40.637370220554,40.6372978607738,40.6372299644265,40.6371668136717,40.6371086709468,40.6370557778766,40.6370373452191,40.6370141407369,40.6369862971345,40.6369539736466,40.6369173551279,40.6368766509955,40.6368350908267,40.6367903683255,40.6367427072178,40.6366923459296,40.6357509449138,40.6356808214314,40.6356156851685,40.6355558018408,40.6355014157352,40.6354527487123,40.6354099993023,40.6353733418948,40.6353429260279,40.6353188757781,40.6353012892543,40.6352902381976,40.6352857676889]}],[{"lng":[-73.8732703125524,-73.8730981560066,-73.8729732073257,-73.8727563570499,-73.8719488011655,-73.8718943983012,-73.8711789731836,-73.8708810717364,-73.8708450342227,-73.8706175271154,-73.8704357830426,-73.8700854422443,-73.8700795840702,-73.8698958338615,-73.8697775375914,-73.8695243518936,-73.8685978009536,-73.8680885710802,-73.8679970966813,-73.8686067398552,-73.8692669169379,-73.8696097213656,-73.8696156933926,-73.869624894667,-73.8696954981895,-73.8692084611064,-73.869559024903,-73.8697633366665,-73.8699705906323,-73.870180624162,-73.8702530857081,-73.8704296930409,-73.8706079590496,-73.8711864960206,-73.8716724430034,-73.8724346083404,-73.8725533712021,-73.8726766014874,-73.872803774841,-73.8729343501329,-73.8730677717611,-73.8732034720147,-73.8733408734895,-73.8734793915441,-73.8736801218665,-73.873877672926,-73.8740717829886,-73.8742621948765,-73.8744486563086,-73.8746309202352,-73.8748087451643,-73.8749818954824,-73.875150141766,-73.8753132610856,-73.8754710373013,-73.8756231352192,-73.8757823816996,-73.8759485961947,-73.8761215902503,-73.8763011677193,-73.8769261891869,-73.8769830257084,-73.8770458980016,-73.8771142848463,-73.8771876193009,-73.8772652934034,-73.8773466632113,-73.8774310541404,-73.877517766558,-73.8776060815833,-73.8777281390406,-73.8778502268274,-73.8779719717465,-73.8780930016485,-73.8782129465692,-73.8783507656265,-73.8784158941397,-73.8779734133435,-73.8775289455008,-73.8773424827109,-73.877096271282,-73.8768334902356,-73.876548599704,-73.8762191253342,-73.8761993303292,-73.8761776706062,-73.8761608741758,-73.8759630900538,-73.8754586187918,-73.8753064636552,-73.8749535774166,-73.8745808100912,-73.873901277361,-73.873860340091,-73.8738216037815,-73.8737570902775,-73.8736728495642,-73.8736026528691,-73.8735246246315,-73.8734535281798,-73.8734233708269,-73.8733574021275,-73.8733067800077,-73.8731859333095,-73.8733137831294,-73.8733563817569,-73.8733907484653,-73.8734167680294,-73.8734343532218,-73.8734434451045,-73.8734440132268,-73.8734360557261,-73.873419599334,-73.8733946992859,-73.8733614391354,-73.8733199304731,-73.8732703125524],"lat":[40.6439032143449,40.6439346840435,40.6438392310653,40.6432489646548,40.6423940845388,40.6422482367275,40.6412059067585,40.6407718707525,40.6405566201832,40.6403862786639,40.6402908073794,40.6398441813663,40.639211694017,40.6389345294222,40.6388441456585,40.6386457019187,40.6383495665783,40.6381856142803,40.6381152652097,40.637743362595,40.6373114813096,40.6370855346088,40.6370905648955,40.637083191837,40.6371473896151,40.637465809261,40.6379474843275,40.6378652802738,40.6377874680958,40.6377141088513,40.6376900452316,40.6376340015056,40.6375810932792,40.6373089865557,40.637080424393,40.6365485192002,40.6364933651174,40.636444226944,40.6364013137635,40.6363648081716,40.6363348654994,40.6363116131528,40.6362951500701,40.6362855463014,40.6363493166598,40.6364186099535,40.6364933343796,40.6365733909398,40.6366586735711,40.6367490692861,40.636844458323,40.636944714304,40.6370497044027,40.6371592895198,40.6372733244677,40.6374370028935,40.6375966872206,40.6377521963538,40.6379033539322,40.6380499885283,40.6384967845992,40.6385493081062,40.6385976757656,40.638641486593,40.6386803773809,40.63871402571,40.6387421526227,40.6387645249356,40.6387809571731,40.6387913131052,40.6387883236764,40.638790477641,40.6387977684149,40.6388101737115,40.6388276556105,40.6388716137451,40.6389121892042,40.6398071177214,40.6407168001053,40.6410826809833,40.6416029545283,40.6421185898394,40.6426389282807,40.6432221341946,40.6432571730929,40.6432896590227,40.6433205280068,40.6436444842541,40.6444269313803,40.6446556691015,40.6451415836971,40.6456101054833,40.6463683678613,40.6463144060991,40.6462565314282,40.646160143301,40.6460679791433,40.6459666291909,40.6458712290682,40.6457528149191,40.645650703595,40.6455944759142,40.6455826795916,40.6454450133617,40.6452220887127,40.6451147145336,40.6450056420587,40.6448952371167,40.6447838700036,40.6446719142408,40.6445597453218,40.6444477394535,40.6443362722938,40.6442257176921,40.6441164464353,40.6440088250043,40.6439032143449]}],[{"lng":[-73.8583760531767,-73.8571697829821,-73.8574134314292,-73.8576606712952,-73.8579112270487,-73.8581648194661,-73.8584211659423,-73.8586799808055,-73.8589409756355,-73.8592038595848,-73.8594683397022,-73.8597341212596,-73.8600009080795,-73.8602684028652,-73.8605284136249,-73.8607878455916,-73.8610465336103,-73.8613043130001,-73.861561019659,-73.8617875573481,-73.8620130102775,-73.8628946322439,-73.8633113893912,-73.8637986577751,-73.8643939396158,-73.8650936239441,-73.8653117366513,-73.8667041197378,-73.8661992807425,-73.8662847677707,-73.8668152820125,-73.8670299440306,-73.8673229107271,-73.8686728289509,-73.8699123933943,-73.8700170827358,-73.8706149246106,-73.8711710894152,-73.8711917294955,-73.8715717418369,-73.8719847673392,-73.8721220285791,-73.8725704310289,-73.873378282878,-73.8734250885653,-73.8734655825853,-73.8734002412763,-73.8728165793136,-73.8721847326651,-73.8713166100128,-73.8711645285202,-73.8701856522754,-73.8699327052746,-73.8696177059267,-73.8693844004147,-73.8691753364724,-73.8688921986943,-73.8688236145514,-73.8684816771708,-73.8683003031427,-73.8679313096204,-73.8675581768578,-73.8673016789663,-73.8672402628091,-73.8670922526893,-73.8669524199474,-73.8665377371266,-73.865781613718,-73.8657814362307,-73.8630437576723,-73.862415662489,-73.8605783620238,-73.8605407788259,-73.8604959572287,-73.86001322825,-73.8599126509162,-73.8590215495896,-73.8572233098447,-73.8574324941972,-73.8575526806712,-73.8575933542786,-73.8577054207763,-73.8578346941633,-73.8583760531767],"lat":[40.6472744153135,40.643678558886,40.6435934965675,40.6435146765377,40.6434421866322,40.6433761076323,40.6433165131747,40.6432634696698,40.6432170362277,40.6431772645921,40.6431441990833,40.6431178765482,40.6430983263195,40.6430855701834,40.6430705946755,40.6430506274423,40.6430256811952,40.642995771815,40.6429609183419,40.6429259048613,40.6428870410201,40.6425506796825,40.6422991290286,40.6417995776692,40.6414136062164,40.6409396756942,40.6407511914438,40.6400217634955,40.6395368333038,40.6394728836932,40.6399635276668,40.6398510690214,40.6398719839529,40.6409250792034,40.6432782029936,40.6440713724055,40.6448567418868,40.6452893035611,40.6453053568151,40.6454149623349,40.6454458718156,40.6454237038645,40.6455756123597,40.6467152052675,40.6467812305159,40.6468166334718,40.6468810876709,40.6474157972005,40.6479450700283,40.6485883154056,40.6486871358636,40.6493231823679,40.64947579544,40.6496539930983,40.6497848796895,40.6498963066432,40.6500492524762,40.6500856936291,40.6502673752048,40.6503651351014,40.6505611782635,40.6507561620547,40.6508927806821,40.6509254890873,40.6510100211849,40.6510793881619,40.6513027581793,40.6517059233221,40.6517060219567,40.6532094155741,40.6535648293056,40.654675329646,40.6546239961079,40.654558824478,40.6539734258613,40.6538402372783,40.6526601758645,40.6502786700388,40.6501582850791,40.6499325759654,40.6493972858929,40.6487459714673,40.6483023382877,40.6472744153135]}]],[[{"lng":[-73.9713963168815,-73.9712103909894,-73.9708411379564,-73.9707697608326,-73.9705455439065,-73.9703167705145,-73.9700889779307,-73.9698846467177,-73.9696861180754,-73.969484681379,-73.969399030656,-73.9689146112439,-73.9687909917334,-73.9687221844786,-73.968223433854,-73.968038684878,-73.9676273629279,-73.9682199904168,-73.9683812728676,-73.968999222299,-73.9698686933957,-73.9708756759865,-73.9719042708228,-73.9721614589298,-73.9723112916953,-73.9724148165127,-73.9725572159544,-73.9736539980313,-73.9745825640536,-73.9755101590261,-73.9764334217983,-73.9776164223733,-73.9771651199467,-73.9770709895754,-73.9769984892818,-73.9768496430902,-73.976696043719,-73.9765777562319,-73.9765334489562,-73.9765146210018,-73.975899627138,-73.9753718443551,-73.9744212241826,-73.9735315201505,-73.9725816536227,-73.9714862572631,-73.9713731442201,-73.9712075045825,-73.9709595094521,-73.970391871602,-73.9698376240615,-73.9687609035355,-73.9678341520123,-73.9669062964746,-73.9659068688001,-73.9658856448401,-73.9656256507117,-73.9651725895604,-73.9649455754421,-73.9647198338556,-73.9642679833937,-73.9638893557891,-73.9638114523662,-73.9637541865893,-73.9636224548921,-73.963564705592,-73.9633609408921,-73.9628597396146,-73.9623794782476,-73.9633709296116,-73.9642964996393,-73.9652237806769,-73.9662983547991,-73.9673997951279,-73.9676863568787,-73.9678067633597,-73.9679216879961,-73.9690408663949,-73.9699656611014,-73.9708953837774,-73.9719151872532,-73.972994339389,-73.9730265604729,-73.9732177484846,-73.9734837349883,-73.9737060382879,-73.9739470935797,-73.9739931946138,-73.9740567930897,-73.9741225370718,-73.9741824018726,-73.9742285162174,-73.9742562563154,-73.974265609942,-73.9748929575664,-73.9749726459846,-73.9768267894513,-73.9790579579084,-73.9812863830633,-73.9827363580095,-73.9834887256461,-73.9856935782417,-73.9878509553418,-73.9900935605129,-73.9925497361658,-73.9939819708341,-73.9947348567926,-73.9951180672689,-73.9954933816905,-73.995858841457,-73.9962125404841,-73.9965527313994,-73.9968777841972,-73.9971817527544,-73.9983141752881,-73.9993952679115,-74.0016269681283,-74.0037731632313,-74.0060056409891,-74.0066191489383,-74.0091227192795,-74.0093073410079,-74.0094965066905,-74.0096900302874,-74.0098877214696,-74.0100893858062,-74.0102948249559,-74.0105038368618,-74.0101605728009,-74.0095570830591,-74.0089527434016,-74.0083757478107,-74.0077879438202,-74.0072059128772,-74.0066225945808,-74.0060415268045,-74.0054578234326,-74.0048763207071,-74.0042940983291,-74.0037124585813,-74.0031251337937,-74.0025448697904,-74.0019597833134,-74.0013799010446,-74.0007978693591,-74.0002142135508,-73.9996388598532,-73.9990477303076,-73.9984657784391,-73.9978828574525,-73.9973004251067,-73.9970221625663,-73.9968137289788,-73.9962531437978,-73.9960456530866,-73.99392923789,-73.9918082348231,-73.9890587239361,-73.9883498667103,-73.9852841274358,-73.9830734007398,-73.9823093975949,-73.9818053385719,-73.9813288763919,-73.980291154772,-73.9791182187705,-73.9781907435932,-73.9772631110038,-73.9763353546432,-73.9752721343549,-73.9751731459734,-73.9750352598249,-73.9749587331438,-73.9748640363946,-73.9747284787882,-73.9746571434982,-73.9735039685979,-73.97338805027,-73.9733878261546,-73.9733876020281,-73.9732670673364,-73.9732668900588,-73.9732667358651,-73.9731476945395,-73.973147600175,-73.973147506463,-73.9730366868249,-73.9730365095256,-73.9730363553095,-73.9729390213175,-73.9722987063983,-73.9713963168815],"lat":[40.6482577861141,40.6476201544842,40.6463785715751,40.6461109073431,40.6453166681215,40.6445379413466,40.6437458395071,40.6430302975691,40.6423560097723,40.6416898970341,40.6413824462183,40.6397571597543,40.6392559332214,40.6390185382493,40.637296906442,40.6366509854364,40.6352386218227,40.6349659597113,40.6348917538486,40.6346074303302,40.6341946745982,40.6337195138168,40.63323009464,40.6331116218521,40.6330419145454,40.6329938342684,40.633713379927,40.6335908505929,40.6334883019416,40.6333856735468,40.6332891225907,40.6331536424038,40.6307466541294,40.6302522808925,40.629871496628,40.6290885814784,40.6283545647114,40.6275731868189,40.6273776054817,40.6272944904939,40.6273979582648,40.6274825055266,40.6276388064315,40.6277717559978,40.6279179673593,40.6280548772379,40.6280690128406,40.6280897121976,40.6281166832553,40.6281784163611,40.6282386812865,40.6283518810401,40.6284490347037,40.6285482244288,40.6286544813084,40.6285413336952,40.6271552220219,40.6247654848458,40.6235685520107,40.6223729612054,40.619983803788,40.6180005498844,40.6175894015448,40.617302433543,40.616589737204,40.6162387224673,40.6152044283364,40.6125494864671,40.6099863745259,40.6098786579925,40.6097764261755,40.6096744010222,40.6095552138141,40.6094596075738,40.6094177874826,40.6094031552795,40.6093891895262,40.6092531931632,40.6091504768934,40.6090497192104,40.6089359216909,40.6088141418023,40.6089824766405,40.6099813857914,40.6113710612012,40.6125723708565,40.6137959280038,40.6140298942426,40.6140284945025,40.6140131730554,40.6139832177728,40.6139414611534,40.6138935328248,40.6138455646908,40.6131863689167,40.6136681101717,40.6147764019036,40.6161258365951,40.617470905421,40.618345979472,40.6188000242624,40.6201315149502,40.6214350324407,40.6227889533431,40.6242742687793,40.6251413990506,40.625614741106,40.6257266289914,40.6258557065811,40.6260014341036,40.6261631253919,40.626339908347,40.6265307825624,40.6267101558363,40.6273882283809,40.6280287270261,40.6293467864133,40.6307116464701,40.6320168033571,40.6323754580869,40.6338882802393,40.6340008746154,40.6341090032007,40.6342125596412,40.6343114420795,40.634405553255,40.6344948005997,40.6345790963294,40.6349123382514,40.6354929641312,40.6360750812267,40.6366365576289,40.6371955287901,40.6377545819896,40.6383148016311,40.6388773342414,40.6394351358499,40.6399954645496,40.640556240282,40.6411158515382,40.6416745415814,40.6422357596208,40.6427987386857,40.6433567536584,40.6439175471607,40.6444782999913,40.6450418872787,40.6455973458957,40.6461592271116,40.6467185290791,40.6472720195273,40.6475377922889,40.6477104242787,40.6481749762339,40.648340654929,40.6470693112323,40.6457839691121,40.6441192410392,40.6445622438873,40.6457679387295,40.6466251347049,40.6469274038084,40.6471277997649,40.6471816727075,40.6472971614313,40.6474280612562,40.6475259915112,40.647627336523,40.6477261421713,40.6478306045699,40.647817625097,40.6478033942094,40.6477954978785,40.6477857238903,40.6477737093756,40.6477643729061,40.6475956805563,40.647580957036,40.6475809295095,40.6475809294576,40.647583072167,40.6475830721258,40.6475830983919,40.6476029011522,40.6476029187206,40.6476029543823,40.6476393368779,40.6476393901104,40.6476394713254,40.6476896796483,40.6479424820365,40.6482577861141]}]],[[{"lng":[-73.9563003512271,-73.9561640963249,-73.9561082560446,-73.9560378310877,-73.9560105568092,-73.9559067073484,-73.9558251843973,-73.9557908301855,-73.9557623285312,-73.9557365123291,-73.9556519624085,-73.9547302470444,-73.9546656395126,-73.9545248417564,-73.9542806129959,-73.9541771797979,-73.9541264117089,-73.9540435859013,-73.9539417253589,-73.9537485377843,-73.9536000471938,-73.9530788527286,-73.9521366111647,-73.9511598853806,-73.9501709009553,-73.9492329569703,-73.9482649965689,-73.9480146601131,-73.9477733032834,-73.9468051587991,-73.945867735272,-73.9456175464572,-73.9455109552195,-73.9454487808206,-73.9448081607081,-73.9445399503591,-73.9441553525583,-73.9444678405052,-73.9454005321308,-73.9463262223442,-73.9473267222654,-73.946874399467,-73.9464226599836,-73.9459684975583,-73.9455166357478,-73.9450664280808,-73.9448601234275,-73.9448277099629,-73.9457369191203,-73.9465736676219,-73.9474260878081,-73.9476405732208,-73.9482483442374,-73.9491197021277,-73.9499629669533,-73.9507693807591,-73.9509027889262,-73.9510101005227,-73.9511202608527,-73.9512330307057,-73.951348165338,-73.9514654146038,-73.9515845239035,-73.9516677680696,-73.9525878694897,-73.9535988878696,-73.9547955270999,-73.9557406698915,-73.9567047140635,-73.9576680137943,-73.9580473192722,-73.9585927849577,-73.9595206963374,-73.9604436188151,-73.9613726831358,-73.9623794782476,-73.9628597396146,-73.9633609408921,-73.963564705592,-73.9636224548921,-73.9637541865893,-73.9638114523662,-73.9638893557891,-73.9642679833937,-73.9647198338556,-73.9649455754421,-73.9651725895604,-73.9656256507117,-73.9658856448401,-73.9659068688001,-73.9669062964746,-73.9678341520123,-73.9687609035355,-73.9698376240615,-73.970391871602,-73.9709595094521,-73.9712075045825,-73.9713731442201,-73.9714862572631,-73.9725816536227,-73.9735315201505,-73.9744212241826,-73.9753718443551,-73.975899627138,-73.9765146210018,-73.9765334489562,-73.9765777562319,-73.976696043719,-73.9768496430902,-73.9769984892818,-73.9770709895754,-73.9771651199467,-73.9776164223733,-73.9764334217983,-73.9755101590261,-73.9745825640536,-73.9736539980313,-73.9725572159544,-73.9724148165127,-73.9723112916953,-73.9721614589298,-73.9719042708228,-73.9708756759865,-73.9698686933957,-73.968999222299,-73.9683812728676,-73.9682199904168,-73.9676273629279,-73.968038684878,-73.968223433854,-73.9687221844786,-73.9687909917334,-73.9689146112439,-73.969399030656,-73.969484681379,-73.9696861180754,-73.9698846467177,-73.9700889779307,-73.9703167705145,-73.9705455439065,-73.9707697608326,-73.9708411379564,-73.9712103909894,-73.9713963168815,-73.9715593035278,-73.9719089031181,-73.9720358499465,-73.972088461074,-73.9722222860573,-73.9717057070882,-73.9714562030853,-73.9662132202526,-73.9641466633954,-73.961880864398,-73.9615646142233,-73.9606980937955,-73.959861031131,-73.9596966586303,-73.9563003512271],"lat":[40.6550482818312,40.6537765193077,40.6532447502487,40.652701220771,40.6523142734144,40.6513688344374,40.6505298080789,40.6495229898266,40.648643289987,40.647868996887,40.6466304101446,40.6447725783615,40.644196744303,40.6428875874788,40.6405893852227,40.6396323001962,40.6391612992827,40.6388775491903,40.6384947249419,40.6385863380881,40.6384223474501,40.6384279736585,40.6384258411824,40.6384178994072,40.6384850857478,40.638547673901,40.6386071897069,40.6362669523824,40.6339981566971,40.6340588398669,40.6341175481595,40.6317774303119,40.6307914829014,40.6307327133548,40.6301271666631,40.6298665632107,40.629508285208,40.6294800515109,40.6293778123557,40.6292766427586,40.6291665672098,40.6267736686311,40.6243855672862,40.6219948159592,40.6196056119517,40.6172126872092,40.6162051569828,40.6160462091094,40.6153634067567,40.6147891311372,40.6142246005537,40.6140777104131,40.6136353579565,40.6130532176678,40.6123157278494,40.6115902447675,40.6115786468387,40.6115301384506,40.6114854926219,40.6114448062977,40.6114081679081,40.6113756569322,40.6113473439651,40.6113131859999,40.6111122395891,40.6109498656061,40.6108207661552,40.6107148274562,40.6106118778289,40.610503715219,40.6104627624443,40.6104030309351,40.6103020533396,40.6102015073052,40.6100988747117,40.6099863745259,40.6125494864671,40.6152044283364,40.6162387224673,40.616589737204,40.617302433543,40.6175894015448,40.6180005498844,40.619983803788,40.6223729612054,40.6235685520107,40.6247654848458,40.6271552220219,40.6285413336952,40.6286544813084,40.6285482244288,40.6284490347037,40.6283518810401,40.6282386812865,40.6281784163611,40.6281166832553,40.6280897121976,40.6280690128406,40.6280548772379,40.6279179673593,40.6277717559978,40.6276388064315,40.6274825055266,40.6273979582648,40.6272944904939,40.6273776054817,40.6275731868189,40.6283545647114,40.6290885814784,40.629871496628,40.6302522808925,40.6307466541294,40.6331536424038,40.6332891225907,40.6333856735468,40.6334883019416,40.6335908505929,40.633713379927,40.6329938342684,40.6330419145454,40.6331116218521,40.63323009464,40.6337195138168,40.6341946745982,40.6346074303302,40.6348917538486,40.6349659597113,40.6352386218227,40.6366509854364,40.637296906442,40.6390185382493,40.6392559332214,40.6397571597543,40.6413824462183,40.6416898970341,40.6423560097723,40.6430302975691,40.6437458395071,40.6445379413466,40.6453166681215,40.6461109073431,40.6463785715751,40.6476201544842,40.6482577861141,40.6488228287575,40.6500514098843,40.6504856276553,40.6506569087538,40.6510469517658,40.6511099064229,40.6511403124624,40.6531894045468,40.6539949723505,40.6548811920523,40.6550041171529,40.6553409246806,40.6556347894394,40.6548392152288,40.6550482818312]}]],[[{"lng":[-73.9837215268118,-73.983046594855,-73.981977400581,-73.9809372332252,-73.9807101319402,-73.9806015960486,-73.9801528345959,-73.9800780913951,-73.9799449997963,-73.9798853448458,-73.9796275845859,-73.9795736900813,-73.9794156499557,-73.9790851061331,-73.9790261723355,-73.9787617541352,-73.9785011318742,-73.9783933903959,-73.9783104901111,-73.9781819154221,-73.9776956586936,-73.9773128445781,-73.9772213207711,-73.9765127912138,-73.9758382003545,-73.9751350915463,-73.9741929026631,-73.9742016805361,-73.9742428825228,-73.9742850539179,-73.974335918312,-73.9742079975138,-73.9726033099826,-73.9716772248391,-73.9707527585702,-73.9698231824748,-73.9688973502415,-73.9679700384309,-73.9675424033235,-73.9670455920232,-73.9665263588817,-73.9659316287091,-73.9658201454498,-73.9656409195882,-73.9653598608265,-73.9642641511992,-73.9633698203609,-73.9624443468343,-73.9605166723842,-73.9604596836014,-73.9604071009965,-73.9603495358521,-73.9603171210085,-73.9603176630362,-73.9603380372185,-73.9603461500906,-73.9603419076201,-73.9603253926731,-73.9602685185012,-73.9602582590248,-73.9602431539677,-73.9602394336217,-73.9602346157069,-73.9602312436683,-73.9602275387826,-73.9602179211174,-73.9601967315189,-73.9601492412961,-73.9601050945464,-73.9600479866748,-73.9598350287983,-73.9591095880835,-73.9590076424999,-73.9574554664552,-73.9573360838997,-73.9572361001647,-73.9571329137328,-73.957031341804,-73.9569559603608,-73.95689047345,-73.9568258363904,-73.9567561828483,-73.9564572912573,-73.9560414673453,-73.9560265976333,-73.9560177456007,-73.956014466753,-73.9559960775631,-73.955962617691,-73.9559199765486,-73.9549402417257,-73.9549891767211,-73.9550496174754,-73.9550694371045,-73.9550711159212,-73.9550550541248,-73.95471326915,-73.9544382860244,-73.9543453980122,-73.9542056252297,-73.9540328089505,-73.95397148475,-73.9538405298239,-73.9536517177126,-73.9542854678707,-73.9541336080345,-73.9543979382181,-73.9551111442602,-73.955137052469,-73.9556948404436,-73.9562081659513,-73.9563450668163,-73.9563690410771,-73.9562956120362,-73.9563111145327,-73.9563453345457,-73.9563898004083,-73.9564716944755,-73.9565675090591,-73.9572005349817,-73.9579441385945,-73.9584347635904,-73.9586514713908,-73.9588841918157,-73.9589663415274,-73.9589754338893,-73.9589426846185,-73.9589871897258,-73.9590260777376,-73.9590724802757,-73.9590964219456,-73.959391822474,-73.9598286491124,-73.9602153229932,-73.9604890840351,-73.9606875536364,-73.9608141694139,-73.960908858936,-73.9621076955076,-73.9626760712735,-73.9630589978632,-73.9639829238005,-73.9645361845445,-73.965084785767,-73.9660223954298,-73.9672029410396,-73.9673897547888,-73.9674356779313,-73.9673639008057,-73.9673947223879,-73.9674262847454,-73.9674494637434,-73.967531497537,-73.9676238810411,-73.9677915522393,-73.9681850609859,-73.9683903782888,-73.9685633598548,-73.9688489394463,-73.9689721411386,-73.9690645439124,-73.9692022919878,-73.9694512620237,-73.9694683863316,-73.9692119795212,-73.9692462121557,-73.9692838522803,-73.9695589515174,-73.9697558033688,-73.9699611020173,-73.9702108938786,-73.9708536307437,-73.9710869168941,-73.9713298962634,-73.9713504458751,-73.9713778579133,-73.9711424879454,-73.9711539457254,-73.9711351515381,-73.9711830635572,-73.9712206941635,-73.9714565707675,-73.9715179092027,-73.9716070645239,-73.971836320568,-73.9724967374708,-73.9729347616272,-73.9731469334436,-73.9733450222981,-73.9733625622408,-73.9732326807863,-73.9732122456461,-73.9732499011514,-73.9732909547817,-73.9733251575625,-73.9733430697665,-73.9733490403311,-73.9733661147647,-73.9733900057704,-73.9734275866676,-73.9734480532568,-73.9737320997119,-73.9740067825874,-73.9744096194083,-73.9748476269656,-73.975285649671,-73.9754708190278,-73.9754056102001,-73.9754056409422,-73.9754569655919,-73.9754843266846,-73.9755088303411,-73.9755171882038,-73.9756026994882,-73.9756791802926,-73.9759255209153,-73.9762197885708,-73.9768425624799,-73.9768535461359,-73.9769944904983,-73.9771336414522,-73.9772705702066,-73.9774048548199,-73.9775360815003,-73.9776638458814,-73.9775682009121,-73.977598772045,-73.9776708752382,-73.9780472493389,-73.9780759979822,-73.9777153307247,-73.9776981972807,-73.977705023843,-73.9777391887408,-73.9777512794976,-73.9777650379148,-73.9777840795224,-73.9778079651891,-73.977836144068,-73.9778825890334,-73.977930801936,-73.9779992449302,-73.9780697809881,-73.9781966052419,-73.9783251607863,-73.9784548651119,-73.9785851305029,-73.9787153667008,-73.9788449835794,-73.978973393819,-73.9791000155689,-73.9794568104666,-73.979521830451,-73.9797648105728,-73.9798469446941,-73.979860648247,-73.9798059254359,-73.9797238222547,-73.9796656580905,-73.9794672106514,-73.9794455260633,-73.9794252416215,-73.9794068174228,-73.9793906713687,-73.9794432836762,-73.9795835711478,-73.9797546474568,-73.9799598892665,-73.9799874371307,-73.9800077157223,-73.980103515519,-73.9803259222603,-73.9806489086184,-73.9810444940945,-73.9813387792364,-73.9816364889063,-73.9818418065135,-73.9820407585252,-73.9820368507678,-73.9820163341175,-73.9819923913308,-73.9819205450171,-73.9816965690948,-73.9815989105754,-73.9815578547024,-73.9815441742737,-73.9815715542343,-73.9819479404239,-73.9820266291875,-73.9820950434624,-73.9821463213306,-73.982177106911,-73.9822558025301,-73.9824919005115,-73.9828272320183,-73.9830804449657,-73.9836727015326,-73.9834044073768,-73.983058092451,-73.9830432888371,-73.9833916843665,-73.9832699667533,-73.9833605803929,-73.9834852186614,-73.983821253949,-73.9838394948926,-73.9834884214668,-73.9837579044865,-73.985729317548,-73.9859353817573,-73.9864508758885,-73.9864679985272,-73.9865090582135,-73.986546685941,-73.9868614842503,-73.9872686683531,-73.9875218763042,-73.9877750842576,-73.9880371667854,-73.9886202548146,-73.9885777203887,-73.9886339755543,-73.9886647641226,-73.9886955452091,-73.9887214584883,-73.9888358220813,-73.9889282061789,-73.9891471971602,-73.9893593417585,-73.9896465753045,-73.9899376116338,-73.9901462953121,-73.9902626752744,-73.9905261484993,-73.9907731032392,-73.9907417467296,-73.9907178159274,-73.9907926476694,-73.9908272859811,-73.9908637468487,-73.9911933752362,-73.9915629151274,-73.9918913975633,-73.9922061931928,-73.9922954521958,-73.9925278285878,-73.9927285489707,-73.9929692301485,-73.992945293196,-73.9929809807217,-73.9930137268676,-73.993027407132,-73.9930528994427,-73.9931574188674,-73.9932977052498,-73.9936261803441,-73.9936750974708,-73.994019665383,-73.9944063104658,-73.9946836032281,-73.9948066423787,-73.9949376322995,-73.995138544368,-73.9951522406497,-73.9951351400428,-73.9951872608573,-73.9952480521327,-73.9952617292692,-73.9952930120326,-73.9955149204595,-73.995764696771,-73.9960007879412,-73.9964079635876,-73.996650898707,-73.9968490171764,-73.9969964077653,-73.9970443866112,-73.9971949382584,-73.9973181177229,-73.997355757509,-73.9973557607108,-73.997369448826,-73.9974196615895,-73.9974481404858,-73.9975199935546,-73.997667121352,-73.9978450441239,-73.9979955952131,-73.9981872062096,-73.9982966978162,-73.9984677790016,-73.9986324281594,-73.9989912881183,-73.9992273802893,-73.9996140257525,-73.9996413990162,-73.9996585068643,-73.9997032141999,-73.9997329117932,-73.9997295079268,-73.9997192982345,-73.9997485215655,-73.9999543184083,-74.0001605408467,-74.0003668722813,-74.0005729959457,-74.0007785953927,-74.0009257125824,-74.001070958859,-74.0012138747982,-74.0013540083489,-74.0019057237496,-74.0020116705391,-74.0020578093162,-74.0019839688837,-74.0020854763973,-74.0022008496998,-74.002228543204,-74.0023485271797,-74.0024870773771,-74.0048224779999,-74.006669156326,-74.008708657302,-74.0094289369033,-74.0100741078543,-74.0107130684611,-74.0111566872926,-74.0119019649012,-74.0120154019113,-74.0123218352068,-74.0123678861701,-74.0124047180166,-74.0124322872269,-74.0124505612036,-74.0124595183103,-74.0127972193453,-74.0130129552997,-74.0130238006225,-74.0130271545442,-74.0129622761214,-74.0129055693098,-74.0128571422026,-74.0128170871204,-74.0123503592923,-74.0122466287824,-74.0121356515214,-74.0120176217092,-74.0118927458933,-74.0117612426074,-74.0116233419888,-74.011479285376,-74.0113293248862,-74.0111737229741,-74.0110127519726,-74.0108603557124,-74.0107038895301,-74.0105435846376,-74.0103787195844,-74.0102158027042,-74.0100552919434,-74.0098976384874,-74.0097432854921,-74.0095926668394,-74.0094462059168,-74.0093043144285,-74.0091950614788,-74.0090891414802,-74.0089867425502,-74.0088880465543,-74.0088657272753,-74.0087265097831,-74.0085819919882,-74.0084325342244,-74.0082785091469,-74.0081203008027,-74.0079583036735,-74.0077929216912,-74.0076245672307,-74.0074536600817,-74.0064798483473,-74.0060473423582,-74.0048362757678,-74.0039802361643,-74.0029437415781,-74.002205828768,-74.0018599131743,-74.0011921230361,-74.0007602995901,-74.0006605529053,-74.0005598676383,-73.9996415228003,-73.9994773917243,-73.9993106358264,-73.9991415448986,-73.9989704127925,-73.9987975369086,-73.9986232176788,-73.9984477580447,-73.9982714629305,-73.9982145349434,-73.9981584276895,-73.9981042926054,-73.9980532406533,-73.9980063195204,-73.9979644921186,-73.9979286168227,-73.9978994298549,-73.997877530177,-73.9978633671985,-73.9978572315556,-73.9978592491471,-73.9979702364174,-73.9979845390404,-73.9979918166478,-73.9979918742821,-73.9979847104101,-73.9979705169629,-73.9979496741929,-73.997922740486,-73.9978904374015,-73.9978536303414,-73.9921546480925,-73.9918291279028,-73.9917471424708,-73.9916642362256,-73.9915809106585,-73.9914922463514,-73.9914042867856,-73.9913176357696,-73.9912328881298,-73.9911506256284,-73.9910714129698,-73.9906977094526,-73.9903620646656,-73.9896950130442,-73.989579561386,-73.9894479718619,-73.9889909355634,-73.9884283376943,-73.9881420829041,-73.9879832405625,-73.9876083793465,-73.9876163152134,-73.9878545690183,-73.9878664768794,-73.987512858145,-73.9874515182493,-73.9874415948843,-73.9874618696751,-73.9875974538736,-73.9875865395821,-73.9874878527,-73.9873906438841,-73.9873830220656,-73.9866953999707,-73.9867512931706,-73.9868122550081,-73.9868778839146,-73.9869477475753,-73.9870213857771,-73.9867810958389,-73.9861652674458,-73.9858856739485,-73.9859129534192,-73.9859241877661,-73.9860450991623,-73.9868447899645,-73.9869450692819,-73.9870390218689,-73.9871264179875,-73.9872070439366,-73.9872807025749,-73.9873472138026,-73.9874064150014,-73.9874581614325,-73.9875740022818,-73.9876289333413,-73.9876392579393,-73.9877334195981,-73.9877494059196,-73.987765335494,-73.9877807928605,-73.9877953748741,-73.9878087012201,-73.9878204243335,-73.9878302384635,-73.987837887648,-73.9879617102952,-73.9879725627284,-73.9879858080792,-73.9880010508576,-73.9880178359337,-73.9880356621269,-73.9880539971706,-73.9880722936048,-73.9880900051223,-73.9881066028804,-73.9881215912917,-73.9881345228212,-73.9881718948557,-73.9882137192603,-73.9882593245663,-73.9883079786021,-73.988358900248,-73.988417457349,-73.9884745692303,-73.9885292884315,-73.9885807071837,-73.9889035392383,-73.9891363620141,-73.9895419521619,-73.9896996938388,-73.9899550492177,-73.9911944079675,-73.9916300747238,-73.99174273417,-73.991682618812,-73.991730781285,-73.9918253244997,-73.9918553565664,-73.9918252957587,-73.9916955301478,-73.9903376250445,-73.9903506723531,-73.990355738165,-73.9903527680394,-73.9903417938619,-73.9903229335028,-73.9902963895521,-73.9902624471436,-73.9909761229884,-73.9926739127504,-73.9927266475071,-73.9927736783526,-73.9928139870549,-73.9928467009243,-73.9928860163815,-73.9929297108896,-73.9929769902119,-73.9930269949535,-73.9930489297209,-73.9930688071455,-73.9930860334672,-73.9931000941183,-73.9931105690939,-73.993117145498,-73.9931466251024,-73.9931795160316,-73.9932150419686,-73.9932523644047,-73.9933974570168,-73.9935475486442,-73.9937023614729,-73.9938616089541,-73.9940249963341,-73.9941922212001,-73.9943629740394,-73.9945369388126,-73.9945896184423,-73.9946405256253,-73.9946883366441,-73.9947318082924,-73.9947698102015,-73.9947958637201,-73.9948276768426,-73.9948644669247,-73.9949053288858,-73.9949492574755,-73.9949951720029,-73.9950497384471,-73.9951028058057,-73.9951529565864,-73.9951988512048,-73.9952392637668,-73.9952731148144,-73.9952874280529,-73.9953075467103,-73.9953329332768,-73.9953629095045,-73.9953966745271,-73.9954333262566,-73.995471885484,-73.9955113220396,-73.9955505823151,-73.9955886174119,-73.9958967185115,-73.9960552882052,-73.9962242980962,-73.9967257040299,-73.9973961201266,-73.9978130171092,-74.0001792285941,-74.0003088081067,-74.0004173950371,-74.0004368535805,-74.0003595179048,-74.0002468390726,-74.0001003557999,-73.9999820428925,-73.9998580944458,-73.9997397798044,-73.999632733412,-73.9995313217703,-73.9994580792612,-73.9993397630994,-73.9991538395443,-73.9989848172947,-73.9987876230712,-73.9986016987774,-73.9984608461169,-73.9982636529196,-73.9980852377601,-73.9980889918839,-73.9982867355359,-73.9986711016602,-73.9992890500947,-73.9994693390151,-73.9997059709951,-73.9997003362607,-73.9995256799036,-73.999634238235,-73.9995651157032,-73.9993566515775,-73.9989735281157,-73.9987763305323,-73.9986382638476,-73.9982805244254,-73.9982185478421,-73.99814530449,-73.9962365379423,-73.9941730563838,-73.9942350292251,-73.9955985741035,-73.9956605451227,-73.9940790462178,-73.9942155460831,-73.9933085496695,-73.9929783595407,-73.9929159153588,-73.9928606773962,-73.9925574782609,-73.9916141237686,-73.9915393444445,-73.9914734213569,-73.9906631198364,-73.99036425111,-73.990049946831,-73.9887312972833,-73.9874913607019,-73.9867631492432,-73.9864672684189,-73.9852002737078,-73.9850613649743,-73.984063802494,-73.9837215268118],"lat":[40.5958210782172,40.5954145396838,40.594763406169,40.5941369339831,40.593997228133,40.5939323051821,40.5936653067229,40.5936208352135,40.5935416487985,40.5935061546723,40.5933472320641,40.5933140021166,40.5932165610171,40.5930127592894,40.5929764216716,40.5928133880796,40.5926539529476,40.5925882793623,40.5925383440452,40.5924585327202,40.5921865378584,40.5919776507471,40.5919219335133,40.591452646914,40.5910645882994,40.5906406890456,40.5901061899912,40.5900172593661,40.5895773364773,40.5887089520017,40.587941518708,40.5879546107953,40.588118774307,40.5882220731785,40.5883219257882,40.5884266603017,40.5885285776684,40.5886314236517,40.5886808231431,40.588738199577,40.5887932710085,40.5888563457395,40.5888680664891,40.5888871750408,40.5889186179983,40.5890411764382,40.5891365659574,40.5892388640036,40.5894529116476,40.5887238198211,40.5880343523024,40.587306286074,40.5865147235995,40.5864364684721,40.5862810895005,40.5861247709756,40.5859683662622,40.5858127232536,40.5851490325848,40.5850293078417,40.5848270810659,40.5847918749835,40.584746283206,40.5846760046288,40.5846089594208,40.5845146628378,40.5842250311678,40.5835758970392,40.5834083571591,40.5832698724066,40.5831905458519,40.5828566752126,40.5828521516095,40.5830127880024,40.5830251348804,40.5830422708163,40.583045726525,40.583035332417,40.5829822625409,40.5829339794608,40.5828863086475,40.5828349700306,40.5826588505552,40.5827362543198,40.5826099228921,40.5825643168187,40.5825576242703,40.582520165018,40.5824805112151,40.5824478328215,40.5819689052405,40.5819168291301,40.5818251615806,40.5817534514838,40.581680175764,40.5816092361719,40.5806220917602,40.5795999594223,40.5791953984781,40.5784262863019,40.5774023122719,40.5773223573752,40.5767767492972,40.5758239808958,40.5757313370186,40.5743332674952,40.5743708459072,40.5743711268051,40.5743711369258,40.5743269962632,40.5742654706752,40.5742072219895,40.5741733125593,40.5738349846544,40.5738001743884,40.5737975787945,40.5738236877436,40.5741394877452,40.574170778493,40.5741866713809,40.5741448126623,40.5740888150463,40.5740515237713,40.5739915960313,40.5739472687685,40.5739045524792,40.5734671676474,40.5734306552294,40.5734519951184,40.5738455480003,40.5738638204333,40.5739121097524,40.5739293096357,40.573911179121,40.5738851815441,40.5738774219822,40.5738618099388,40.5738650289464,40.5737135200186,40.5736669390391,40.573635553518,40.5735575717327,40.573513199425,40.573469198638,40.5733885948326,40.5733263173975,40.5732589999045,40.5732089696713,40.5730445689522,40.5729950026884,40.5729851089693,40.573008064913,40.5731907323847,40.57319858544,40.5731881963182,40.5731778685462,40.5731544429401,40.5731259465519,40.5730580279477,40.5730215323048,40.5729876375129,40.5729574185167,40.5728572803632,40.5728233657055,40.5723353764235,40.5723040756546,40.5723014764519,40.5728085804608,40.5728469246904,40.5728600245875,40.5728522619818,40.5727705152799,40.5727272442156,40.5726438103841,40.5725994595428,40.5725107530989,40.572050631012,40.5719996370465,40.5719601521359,40.5719418990842,40.5719627822017,40.5724794622434,40.5725816819019,40.5726282239199,40.5726282803543,40.5725762567474,40.5724746021453,40.5724146399953,40.5723212140061,40.5722633570436,40.571905865967,40.5716684247027,40.571626686109,40.5716423502966,40.5716762786298,40.5717405704245,40.5718510996223,40.5719372080932,40.5720885467885,40.5722346707679,40.5722721069694,40.572286925094,40.5722743625466,40.5722375030022,40.5721645417659,40.5720498326686,40.571969003817,40.5715045348691,40.5714210406406,40.5714210516176,40.5714549778465,40.5715244924406,40.5716943152804,40.5718592831036,40.5719559844974,40.5720186574376,40.5720161101274,40.5719483984328,40.5719463381897,40.5719246776465,40.5718970867176,40.5718636504246,40.5718244718011,40.5717796715755,40.5717293877991,40.5712466666591,40.5711910305184,40.5711710200791,40.5711997939595,40.5712295701287,40.5712519143448,40.5713249683295,40.5713771539496,40.5715337121186,40.5716802897826,40.5717076940988,40.5717331937705,40.5717562007247,40.5717761843747,40.5717955449778,40.5718122040365,40.5718304767982,40.5718433122486,40.5718661922221,40.5718825142241,40.5718922042965,40.5718952185315,40.5718915432711,40.5718811951686,40.5718642211133,40.571840698018,40.5717427679584,40.5717140787342,40.5715862710861,40.5715393196102,40.5714819200105,40.5714036340461,40.5713462174124,40.5713331610994,40.5712992060837,40.5712933454036,40.5712850678956,40.5712745613122,40.5712620639667,40.5712209259481,40.5712261688436,40.571249682582,40.5714401905005,40.5715836058236,40.5716985096886,40.5717272264845,40.5717377022186,40.5717377329567,40.5716804203659,40.5716100203481,40.5715265735895,40.5714692035547,40.5714803705225,40.5714379242801,40.5713883460493,40.5713518133092,40.5713204925867,40.5713113718207,40.5713073954842,40.5712943428685,40.571273466987,40.5712499884249,40.5712370021575,40.5712761520892,40.5713466114785,40.5715214360821,40.5715605784545,40.5715684182897,40.571565845913,40.5715424135746,40.5715085314334,40.5714070576874,40.5701655445108,40.5702096562685,40.570145860988,40.5700946845169,40.5695418938537,40.5695299939842,40.5700890150628,40.5700457894818,40.570112467158,40.5701560300465,40.571396227251,40.5711958899815,40.5711781889224,40.5711489089104,40.5710784627252,40.571081076828,40.5711332648658,40.5711072092381,40.5710759444771,40.5710472709236,40.5710185968119,40.5709851087687,40.5708960513142,40.570697909505,40.5706951444804,40.5707290672401,40.570815174287,40.5708836920827,40.5708778085579,40.5708752082259,40.5708439191831,40.5708308929978,40.5707921554097,40.570757887126,40.5707260797864,40.5707083401173,40.5706587871255,40.5705994223404,40.570403103607,40.5702595956511,40.5702486487556,40.5704213743788,40.5706020162424,40.5706118749683,40.5705779834892,40.5705336499989,40.5704997520704,40.5704910696716,40.5704684640029,40.5704337880374,40.5703667320423,40.5702362710854,40.5701967733092,40.5702127929783,40.5702780229682,40.5703390255589,40.5703797894389,40.5703824074857,40.5703928631078,40.5703951356701,40.5704111486789,40.5703902944716,40.5703613379185,40.5703642212029,40.5703546745124,40.5703146612067,40.5701789827434,40.5700667871094,40.5700218776332,40.5700981017787,40.570228562337,40.5703212832165,40.5703538141139,40.5703929618599,40.5703929703219,40.5703747186936,40.5703721167597,40.5703669654689,40.5703626913814,40.5703564734245,40.5703486490438,40.570322560423,40.570278204148,40.5701973196832,40.5701373075429,40.5701408544459,40.5702860343931,40.5703251735622,40.5703747511662,40.5704138934095,40.5704478158532,40.5704608650693,40.5704739122748,40.570497396973,40.5705080066903,40.5704895757801,40.5704895776106,40.5704660966015,40.5704452230047,40.5703826025028,40.5703864975227,40.5704115116077,40.5704504411229,40.5704737977401,40.5704957974596,40.5705071566972,40.5705123596484,40.5705113983253,40.5705042742039,40.5704909982213,40.5704687773246,40.5704402846802,40.5704056104129,40.5703648642002,40.5702394055157,40.5702087585242,40.5701524623992,40.5695965418238,40.569585983985,40.5703037543917,40.5706098627688,40.5711059679409,40.5717383888725,40.5728902278022,40.5733936483754,40.5737598185877,40.5737972684101,40.5738308095177,40.5740290973115,40.5741667618589,40.5747901665075,40.5748850524742,40.5756526823651,40.5758568144103,40.5760620317368,40.5762680923407,40.5764747532211,40.5766817706674,40.5774892371332,40.5777585143814,40.5778043697599,40.5778508945641,40.5779925939835,40.5781363171532,40.5782817902456,40.5784287360973,40.5792218211565,40.5793555733754,40.5794859004681,40.5796125743252,40.5797353732302,40.5798540822477,40.5799684935996,40.5800784070293,40.5801836301518,40.580283978791,40.5803792773018,40.5804622452647,40.5805406861074,40.5806144839101,40.5806391772523,40.5806704980348,40.580708358218,40.5807526513803,40.5808032530175,40.5808600208924,40.5809227954348,40.5809914001895,40.5810499592236,40.5811119758964,40.5811773400696,40.58124593566,40.5812601592934,40.5813437626692,40.5814219632666,40.5814945660943,40.5815613901184,40.5816222687139,40.58167705008,40.5817255976193,40.581767790278,40.5818035228479,40.5819282569613,40.5819836530359,40.5818548435803,40.5817212956639,40.581432835521,40.5813658860204,40.5813875190182,40.5814190552519,40.581324529098,40.5813089616486,40.581297429683,40.5813165584961,40.5813671828552,40.5814125477272,40.5814525742747,40.5814871929374,40.581516343553,40.5815399754619,40.5815580475952,40.5815705285458,40.5815692661112,40.5815618147948,40.5815483275131,40.5815290810529,40.5815044703909,40.5814750005878,40.5814412764228,40.5814039899824,40.5813639064568,40.5813218484361,40.5812786790295,40.5812352841522,40.5808451859949,40.5808132473184,40.5807799575669,40.5807462085775,40.5807129044889,40.5806809375193,40.5806511640644,40.5806243817546,40.5806013080865,40.5805825612016,40.5793206254329,40.5792470809288,40.5792356141701,40.5792290401832,40.5792273987336,40.5792310868023,40.5792403585422,40.5792551503064,40.579275360555,40.5793008505525,40.5793314453197,40.5793730515998,40.5794245801205,40.579213269076,40.5791929421963,40.5790558156915,40.5788350999689,40.5788158426195,40.5788659637138,40.5789453357409,40.5790331361456,40.5790641686527,40.5790036437428,40.5790263511079,40.5791156911949,40.5791315131984,40.5791072913735,40.5791028783487,40.5790664376476,40.5790407017643,40.5790640175274,40.5790869830637,40.5791375607142,40.5798149081326,40.5798642934921,40.5799100602359,40.5799519068814,40.5799895577683,40.5800227648753,40.5802939376777,40.580950229295,40.5811444245648,40.5812270020004,40.5812674376122,40.5817206851516,40.5812321020052,40.5811364218021,40.5810370788004,40.5809343159497,40.5808283845616,40.5807195436957,40.5806080595251,40.5804942046862,40.5803782576115,40.5800314507249,40.5799588944519,40.5799175978767,40.5798182960034,40.5798190146621,40.5798177619269,40.5798145704705,40.5798095235297,40.5798027527342,40.5797944346735,40.5797847862918,40.5797740592291,40.5796718107798,40.5796604949571,40.5796507725314,40.5796429338017,40.5796372128221,40.5796337804135,40.5796327390631,40.5796341198643,40.5796378815881,40.5796439119145,40.5796520307858,40.5796619957833,40.5796906505621,40.5797154721403,40.5797360620179,40.5797520896327,40.5797632976677,40.5797689894199,40.5797803725969,40.5797972583573,40.5798193665738,40.5800086781821,40.5802148779273,40.5804153657237,40.5804211073034,40.5806616695314,40.5810283076994,40.5810798843819,40.5812001625875,40.5813834270772,40.5814865050479,40.581503706867,40.5816239785461,40.5817385203028,40.5818585032789,40.5842182553885,40.5842765286133,40.5843355184511,40.5843945912009,40.5844531122691,40.5845104529871,40.5845659973648,40.5846191487079,40.5843500308101,40.5835884433695,40.5835617743314,40.583529494152,40.5834923017129,40.5834510022473,40.5834241571917,40.5834015881593,40.5833837053864,40.5833708339265,40.5833631749459,40.5833527508315,40.5833398729631,40.5833249260171,40.5833083564751,40.5832906592872,40.5832719484415,40.5832569011834,40.5832458726691,40.5832391232011,40.5831481294867,40.583061978031,40.5829808282863,40.5829048304471,40.5828341251721,40.582768843324,40.5827091057274,40.5826550229449,40.5826498641502,40.5826383169442,40.582620681584,40.5825974166344,40.5825691270433,40.5825394809813,40.5825133055725,40.5824912447611,40.5824738412671,40.582461523235,40.5824545937014,40.5824509881391,40.5824406541185,40.5824238676736,40.5824010771904,40.5823728914293,40.5823400632642,40.5823119980898,40.5822860855699,40.5822630180003,40.5822434116683,40.5822277903883,40.5822165715072,40.582210054755,40.5822084142367,40.5822116937814,40.5822198057708,40.582157018784,40.5821289038542,40.5822019305815,40.5822534905794,40.5824296169995,40.5826100310831,40.5830739502451,40.5831770375147,40.5835459215033,40.5840489694866,40.5841864458804,40.5842637628337,40.5843754425006,40.5844312815952,40.5845429609528,40.5845773228653,40.5846331622942,40.5847018873363,40.5847534316165,40.5848608148172,40.5849424258703,40.5850154455309,40.5851528939333,40.58523020847,40.5852860463874,40.5853118156251,40.5853647215815,40.5854707412659,40.5854830629867,40.5855070132154,40.5855523660529,40.5856898190094,40.5856898198586,40.5857542496277,40.5857585446599,40.586069747936,40.5862439200957,40.5863813694157,40.5864286156059,40.5864844533866,40.5864916294609,40.5865102195849,40.5865102186407,40.5865316939072,40.5874212558796,40.5883828578208,40.5884387006483,40.5878417075542,40.5879362073439,40.5886934419906,40.5888685304828,40.5895838985805,40.589730033453,40.5897573787788,40.5897826984193,40.589921674724,40.5903564459446,40.5903909030813,40.5904493057884,40.5911671666083,40.5914319316764,40.591734112288,40.5930018990679,40.5941939819159,40.5948940656273,40.5951788221258,40.5963981261166,40.5956709188194,40.5957827199541,40.5958210782172]}]],[[{"lng":[-73.9180925648084,-73.9181253336966,-73.9180556858531,-73.9180834965313,-73.9181148925626,-73.9181397341487,-73.9181712548569,-73.9181759045984,-73.918203291296,-73.9182384602682,-73.9182625040369,-73.9183157211924,-73.9183902548444,-73.9184389381607,-73.9184860783792,-73.9185533871677,-73.9185803852933,-73.9186275379333,-73.918710305518,-73.9187705207392,-73.9188100554866,-73.9188480729359,-73.9188898880758,-73.9189408508247,-73.918969747931,-73.9190001740967,-73.9190463746481,-73.9191903317242,-73.9192343596819,-73.9192775014718,-73.9193270820224,-73.919403008127,-73.919434893581,-73.9195054592814,-73.9195139403541,-73.9196111641994,-73.9197312963758,-73.9198347083388,-73.919893001293,-73.9199761329383,-73.9200521513157,-73.9201392292381,-73.9201397073572,-73.9201823615417,-73.9201823661142,-73.9201886396458,-73.9201849119552,-73.9200494041943,-73.9200469158086,-73.9201748975064,-73.9201711734749,-73.920206300527,-73.9202112911836,-73.920252689006,-73.9202551767876,-73.9202024830337,-73.9202074588369,-73.9202174915833,-73.9202187408311,-73.9202777047249,-73.9202773349179,-73.9202953564158,-73.9203607206784,-73.920404982311,-73.9204702111616,-73.9205508081657,-73.9206253112848,-73.9207150176145,-73.9208215694194,-73.9208214566242,-73.920868429262,-73.9207586767621,-73.9207650320703,-73.920728374935,-73.9206973025786,-73.9206698086596,-73.9207390166014,-73.9207636872599,-73.9207389667976,-73.9207777402874,-73.9207819788003,-73.9208914580685,-73.9209294864426,-73.9209021757944,-73.9209752037078,-73.9209890563315,-73.9209110429072,-73.9208784302738,-73.9209060383639,-73.9209441056756,-73.921012182661,-73.9210122437971,-73.9210375789691,-73.9210816733067,-73.9211026635899,-73.9211770776568,-73.9212823073901,-73.9214708084986,-73.9215142802179,-73.9215328862022,-73.9217626135607,-73.921782402713,-73.9217580921534,-73.9217814875845,-73.921811319539,-73.9218097857828,-73.9218356083965,-73.9218995512202,-73.9219481743886,-73.9218481910777,-73.9218669875513,-73.9218992855613,-73.9218890270277,-73.9221185128986,-73.9221603528536,-73.9223046001212,-73.9223020014655,-73.922353373773,-73.9224612801045,-73.9225524871074,-73.9225626774255,-73.9226282774028,-73.9227169164716,-73.9228235815672,-73.9228492662234,-73.9229640982636,-73.9230201374972,-73.9231331298331,-73.923341180798,-73.9235351589087,-73.923698330456,-73.9238577022056,-73.9238950188409,-73.9239258458292,-73.9239720403671,-73.924016939197,-73.9240426214711,-73.9240631783945,-73.9240670527497,-73.924049095605,-73.9240093332751,-73.924010645095,-73.924021820095,-73.9242957685611,-73.9243231453673,-73.9245675494807,-73.9246794528377,-73.9247570979969,-73.9248073126316,-73.9248366945059,-73.924860511513,-73.9249384074397,-73.9249933142654,-73.9250766496435,-73.9252036151425,-73.925226947574,-73.9252225445942,-73.925283785726,-73.9254664450528,-73.9254183568755,-73.9255427763224,-73.9255944614802,-73.9256468923778,-73.9257084728563,-73.9257060094836,-73.9257906191933,-73.925934353384,-73.9260027980419,-73.9259839842762,-73.9260758183989,-73.9261305753204,-73.9262127166333,-73.9262880091751,-73.926282319535,-73.9263037348965,-73.9263701857111,-73.9264728476127,-73.9265732289015,-73.9264978183316,-73.9265326042008,-73.9265853750353,-73.9267033312267,-73.9267397767153,-73.9268423273603,-73.9267787456346,-73.9268315054989,-73.9268794657249,-73.9269578246044,-73.9270007323218,-73.9270688492858,-73.927087991468,-73.9270946291994,-73.9271278583307,-73.9269420831152,-73.926967338343,-73.9271876107817,-73.9271703287218,-73.9271411293814,-73.9271052430351,-73.9271198446927,-73.9270993562572,-73.9271108301942,-73.9271592873352,-73.927207741889,-73.9272582025461,-73.9272937317055,-73.9273400342665,-73.9273858944954,-73.9274097211316,-73.9274389275162,-73.9274700309266,-73.9275019861963,-73.9275304567609,-73.9275602919822,-73.9275730443843,-73.9276206497676,-73.9276500693362,-73.9276684596778,-73.9276828774732,-73.9276659912845,-73.9276119876814,-73.9273874493916,-73.9273705958316,-73.927353334354,-73.9273434918512,-73.9273260157413,-73.9272994485147,-73.9272772014965,-73.9272475052137,-73.9272431257597,-73.9273191529367,-73.9272648386985,-73.9272793218892,-73.9273568092889,-73.927391881747,-73.9274640249405,-73.9274945689374,-73.9275058017439,-73.9275684694141,-73.9275800288607,-73.9276464035797,-73.9276558430935,-73.9277250698898,-73.9277346389091,-73.9277983244368,-73.9279459835108,-73.9278742602053,-73.9278739383161,-73.9279162574111,-73.9280790681786,-73.9280304142927,-73.9279555522649,-73.9278503067985,-73.9278211315273,-73.9276758176573,-73.9276753802749,-73.927606679653,-73.927593262643,-73.9274692507199,-73.9274750265058,-73.9273693575354,-73.9274382362561,-73.9273901510753,-73.9274045224574,-73.927425522607,-73.9274455175553,-73.9275039620398,-73.9276360393084,-73.9277724493279,-73.9279048250055,-73.9278905685549,-73.9279017574099,-73.9280218527642,-73.9280067651898,-73.9279231804832,-73.9278587609274,-73.9278484736783,-73.9277909208589,-73.9277844315925,-73.9277689297834,-73.9276948316566,-73.9276807008589,-73.927641214998,-73.9275554387913,-73.9275672425982,-73.927557515861,-73.9275472153142,-73.927540167239,-73.9275256916758,-73.9275174175098,-73.927522581628,-73.9275167480363,-73.9275287825852,-73.9275032776782,-73.9274724164497,-73.9274546779099,-73.9274861258152,-73.9274348968193,-73.9275394277351,-73.9275503597229,-73.9276337206545,-73.9277614363911,-73.9271118631756,-73.9269510277461,-73.9266529927844,-73.9266286163416,-73.9266528016336,-73.9263611882989,-73.9260602421988,-73.9257534786633,-73.9254430813116,-73.9251395988566,-73.9248307019395,-73.9245461001638,-73.9242473574877,-73.9239546716577,-73.9239529485009,-73.9240725717561,-73.9241996339266,-73.9242599701322,-73.9242824753092,-73.924350258205,-73.9243635723445,-73.9244313541906,-73.9244479902057,-73.9245179874338,-73.9245268632088,-73.9246012993856,-73.9246568634646,-73.9246368947458,-73.9247713419953,-73.9247569207748,-73.9249102519409,-73.9249202363399,-73.9249724556452,-73.9249591474298,-73.9250869313341,-73.9250935865047,-73.9253635785871,-73.9258880101941,-73.9258750424733,-73.9260296252236,-73.9261594741434,-73.9263560850867,-73.9266523267231,-73.9269617394228,-73.9272596240534,-73.9277763602228,-73.9277646589663,-73.928159051231,-73.9283627126681,-73.9283678337329,-73.9284188580903,-73.9284129716178,-73.9283969402,-73.9283694769213,-73.9283959475282,-73.9283797729373,-73.9283643820113,-73.9283566125997,-73.9282161699486,-73.928225395315,-73.9283361999498,-73.9283586623041,-73.9284290067027,-73.9284732947543,-73.9284970962664,-73.9285216588329,-73.9285434814869,-73.9285597504688,-73.928612527365,-73.9286734493379,-73.9286765617395,-73.9286213901824,-73.9286306141564,-73.9287340774399,-73.9287492680463,-73.9287576155368,-73.9287498483861,-73.9286956708216,-73.9286465667911,-73.9286278470955,-73.9285983672652,-73.9285630571572,-73.9285356073524,-73.9285142302459,-73.9284965573578,-73.9284508988249,-73.9283903685655,-73.9283958280449,-73.9284691076032,-73.9284431266411,-73.9284318487016,-73.9283826899824,-73.9283774597152,-73.9284409049371,-73.928620264992,-73.928653800581,-73.9286510429367,-73.9287630876168,-73.9287803739474,-73.9287830164522,-73.9288035361038,-73.928829695254,-73.928850993693,-73.9289135184539,-73.9289134317756,-73.9288646454086,-73.9288813968443,-73.9289510299323,-73.928814431503,-73.9287908044539,-73.9286315870271,-73.928665938429,-73.9286912629114,-73.928734264673,-73.9288516769863,-73.9292196400519,-73.9292360368272,-73.929173481375,-73.9292524110041,-73.9292431481804,-73.929157063334,-73.9290900430843,-73.9291655424816,-73.9291569382168,-73.9290771056907,-73.9290158020728,-73.9290889138771,-73.9290787500577,-73.9290023949198,-73.92894319888,-73.9290177588667,-73.9290060298237,-73.9289318996011,-73.9288639898049,-73.9289466060801,-73.9289281068375,-73.9288482069839,-73.9288380381499,-73.9288653641496,-73.9288512899082,-73.9288247413036,-73.928814577473,-73.9288426847021,-73.9288293922925,-73.9288005049094,-73.9287570349942,-73.9289612383377,-73.9290763723165,-73.9290841723943,-73.9292157040319,-73.9293486654327,-73.929645245279,-73.9297649181975,-73.9299025816389,-73.9299818786619,-73.9300139913191,-73.9299836435058,-73.9298605507012,-73.9297576678688,-73.9297509435311,-73.9296109216188,-73.9293612835442,-73.9293731224165,-73.9295738415893,-73.9297661577336,-73.9300342745055,-73.9301590210166,-73.9303275985951,-73.9303950072048,-73.9304236378424,-73.9304388286287,-73.9305770571826,-73.9305483581632,-73.9303899033013,-73.9303407424666,-73.9302284661763,-73.9302712478116,-73.9301623550189,-73.9301032598877,-73.9301834273729,-73.9303106518828,-73.9303754324734,-73.9302978809168,-73.9303220861915,-73.9304404174526,-73.9304550184729,-73.9305668222896,-73.9305528123575,-73.9305894044737,-73.9306284936443,-73.9305890922578,-73.930569609519,-73.930467689171,-73.9305356068156,-73.9305288833326,-73.9306296071237,-73.9306313511666,-73.9306521384644,-73.9306743442139,-73.9306275782627,-73.9306313141331,-73.9305250722865,-73.9304807893012,-73.9304731415046,-73.9304713508022,-73.930474819568,-73.9304771229361,-73.9304990640672,-73.9304990544468,-73.9305233026294,-73.9305250476422,-73.9306234424658,-73.9306263915998,-73.9306474994858,-73.9306410670058,-73.9305215475604,-73.9305250201679,-73.9304938408326,-73.9304955610582,-73.9304695850755,-73.9304601366188,-73.9306929718915,-73.9306964165805,-73.9304563207587,-73.9304497032347,-73.9304496017293,-73.9307258078441,-73.9307257872983,-73.9305059228274,-73.930505966161,-73.9304449786184,-73.9303719771903,-73.9304266710375,-73.9305316928037,-73.9305247413,-73.9305697764574,-73.9305715282781,-73.9306044430696,-73.9306006690623,-73.9305642842933,-73.9305749530102,-73.930526458791,-73.9305229784207,-73.9304653676582,-73.9304994518316,-73.9304748059085,-73.9304742339743,-73.9304054166221,-73.9304618564754,-73.9305711782094,-73.9306058065659,-73.9305051636496,-73.9304652942052,-73.9304596427201,-73.9304546522736,-73.9304509192271,-73.9304249356843,-73.9304269667262,-73.9304341175533,-73.9304375809352,-73.9303990560214,-73.9303838085581,-73.9303554557071,-73.9303458431085,-73.9303310650977,-73.9303130216355,-73.9303113673272,-73.9303016192708,-73.9303443327713,-73.9303446293991,-73.9303642604191,-73.9303692274755,-73.930388506965,-73.9303874480107,-73.93038686981,-73.9303833882179,-73.9303811697719,-73.9303765033675,-73.9303749747513,-73.9303740241238,-73.930370117014,-73.9303690238812,-73.9303657000746,-73.930364436033,-73.9303418937051,-73.9303622156806,-73.9303010995104,-73.9303075161744,-73.9302865634836,-73.9302044181931,-73.930176166342,-73.9302178513572,-73.9302014945224,-73.9302060581915,-73.9302653116938,-73.9302694335103,-73.9303536445858,-73.9303430534794,-73.9303140051209,-73.9303038875219,-73.9302766892188,-73.9302651092732,-73.930253201743,-73.9303263406039,-73.9302781375918,-73.9302657919308,-73.9302328589121,-73.9302378122828,-73.9302171860075,-73.930213227886,-73.9301897065828,-73.9301252640054,-73.9301058386685,-73.930023010262,-73.9300272439805,-73.9300281142721,-73.9300295840145,-73.930029709221,-73.9301159318135,-73.9300940414468,-73.9300910824078,-73.9300890526211,-73.9301019165657,-73.9301866063072,-73.9302125148937,-73.9301788650343,-73.9301641033117,-73.9301469470835,-73.9301284525507,-73.9301175483633,-73.9301065821162,-73.93007616099,-73.9300868254382,-73.9300755821913,-73.9299995001639,-73.929999155533,-73.9299982716609,-73.929997504422,-73.9299900881551,-73.9299626370369,-73.9299125015645,-73.9299188578693,-73.9299217628181,-73.9299253407258,-73.9299906530938,-73.9299874145049,-73.9300533859283,-73.9300701842637,-73.9300751403051,-73.9300871084892,-73.9300989932411,-73.9300970112835,-73.9300937747006,-73.9300794524302,-73.9300665964161,-73.9300625849089,-73.9300524453941,-73.9300326034589,-73.9300464535553,-73.930063535292,-73.9300085775099,-73.9300116637646,-73.9299880021189,-73.929985494108,-73.9299583587549,-73.9299605293828,-73.9299066895594,-73.9299003914061,-73.9298951155917,-73.9298906696431,-73.9298320135117,-73.929712820366,-73.9297385061218,-73.9297463968903,-73.9297553773365,-73.9298033640273,-73.9298026058641,-73.9298884197121,-73.9298896134683,-73.9299812081446,-73.9300152467953,-73.9300423841959,-73.9300268937802,-73.9300203323253,-73.9299791125168,-73.9299751043989,-73.9299559190957,-73.9299357593849,-73.9299759362929,-73.9298943623797,-73.9297981654193,-73.9297414732265,-73.9297673540058,-73.9297785203566,-73.9298146554055,-73.929823173368,-73.9298932020807,-73.9299006973723,-73.9300392239667,-73.9300354613714,-73.9299044233794,-73.9298006840449,-73.9297808174206,-73.9298530583416,-73.9298567841477,-73.9298436823814,-73.9298541677514,-73.9298603203068,-73.9299188726263,-73.9299437717558,-73.9299611658137,-73.9300165095213,-73.9302151947032,-73.9301983789752,-73.9301889671515,-73.9301854141426,-73.9301670388882,-73.9301637451835,-73.9301458561133,-73.9301213553433,-73.9301102606755,-73.9301062630113,-73.9300902951192,-73.930078320307,-73.9300743711095,-73.9300501763419,-73.9300815945314,-73.9301363255648,-73.9301389906787,-73.9301649312927,-73.9301826176163,-73.9301874812405,-73.9302275628004,-73.9302876039037,-73.9302915587059,-73.9303076477373,-73.9304593456464,-73.9305248866187,-73.9303813688457,-73.9303596894153,-73.9304433031258,-73.9305433316513,-73.9305703263842,-73.9305467907066,-73.9305253712583,-73.9305202929023,-73.9304873099408,-73.9304810549937,-73.9304418098452,-73.9304339641138,-73.9304203986894,-73.9303662466,-73.9303498574764,-73.9303438620512,-73.9303368493189,-73.9303443425615,-73.9303269474639,-73.9302993440439,-73.9300401194769,-73.9300982732688,-73.9302017682316,-73.9302753348795,-73.9304324612961,-73.9305297477051,-73.9305808960941,-73.9306134962185,-73.9307518137895,-73.9307612283956,-73.9307480761072,-73.9307093672597,-73.9307026825601,-73.930664395731,-73.9306115125472,-73.9305980364645,-73.9306230568456,-73.9306417753042,-73.930649569387,-73.9306873332077,-73.9306954107376,-73.9307406167828,-73.9307491347324,-73.9307883252788,-73.9307950624999,-73.9308344643654,-73.9308069383265,-73.9307683984169,-73.9306630351011,-73.9307056780477,-73.9307690102691,-73.9308252667971,-73.9308195353674,-73.9308320658745,-73.9309351611461,-73.9309592489762,-73.9309936220311,-73.9310281289382,-73.9310361651457,-73.9311043716465,-73.9311901632604,-73.9312630157238,-73.9312128421383,-73.9312205593891,-73.9312267741993,-73.9312737148507,-73.931309875343,-73.9313251214607,-73.931317025228,-73.931276505557,-73.931240368758,-73.9311999048333,-73.9311295042133,-73.9311208709941,-73.9310457338204,-73.9310352031046,-73.930998097504,-73.9309734165763,-73.930954634264,-73.9310084298063,-73.9311109551091,-73.93117079151,-73.9311679769822,-73.9311726623496,-73.931183159927,-73.9312471362245,-73.9312561562515,-73.931325623736,-73.9313357117182,-73.9313668482681,-73.9314197928918,-73.931430230235,-73.9315113499914,-73.9315875822993,-73.9316156203621,-73.9317399477372,-73.9317422336814,-73.931742803086,-73.9317638739996,-73.9317590824142,-73.9317580816717,-73.9316317758916,-73.9316240705845,-73.9316131373722,-73.9315306422289,-73.9314604717236,-73.9313680634337,-73.9311719559049,-73.931027135004,-73.9309877167972,-73.9308462672728,-73.9307813137962,-73.9308054707999,-73.930819183776,-73.9308503666007,-73.9308847319491,-73.9310190347344,-73.9311382037501,-73.9313017105704,-73.9314301859669,-73.9315625251532,-73.9316965222578,-73.9318772173972,-73.9319050358965,-73.9319336498398,-73.9319991529869,-73.9320897293209,-73.932129648585,-73.9321666620416,-73.9322182095261,-73.9322523391236,-73.932308263954,-73.932347490834,-73.9323967790224,-73.9324521768845,-73.9324127763982,-73.9323981545495,-73.9323718826515,-73.9323908943351,-73.9324054865637,-73.9325634383933,-73.9325780349936,-73.9324376290322,-73.9324770288868,-73.9325559783654,-73.9326042055686,-73.9326714732701,-73.9327972710448,-73.9328265485289,-73.9328193283157,-73.9328073608012,-73.9328012160413,-73.9327800123477,-73.9327124166567,-73.9326765397575,-73.9325983410895,-73.9325266118923,-73.932448630395,-73.9323508999956,-73.9321655450526,-73.932000627318,-73.9319058079595,-73.9318254999622,-73.9317589074309,-73.9317446553904,-73.9316741082932,-73.9317501541549,-73.931760735344,-73.9317333820398,-73.9317109079429,-73.9316897772805,-73.9316885567517,-73.9315349529333,-73.9315505710421,-73.9316252600042,-73.9316648612787,-73.9317292508295,-73.9317408751198,-73.9316898528766,-73.9316767223383,-73.9316665789072,-73.9316159846949,-73.9315646256029,-73.9315322950395,-73.9314886172407,-73.931465974308,-73.9314657154104,-73.9314536736866,-73.931431598401,-73.9314367561381,-73.9313093229317,-73.9312719711603,-73.9312210463183,-73.9311599329319,-73.9311395605757,-73.9312007535447,-73.9312583856432,-73.9313172748192,-73.9313640679284,-73.9313999798639,-73.9310098934316,-73.9310045146082,-73.931000129223,-73.9309946597323,-73.9310571658259,-73.9310604356207,-73.9311514354325,-73.9311536017242,-73.9311634704199,-73.9313530095474,-73.9313013085501,-73.9313574055558,-73.9313931040365,-73.9314077575167,-73.9314256543975,-73.9312371374293,-73.9312426095142,-73.9311998346926,-73.9311932618725,-73.9310726222124,-73.9310704045976,-73.9310484787568,-73.9310760222574,-73.9310979480582,-73.931077024843,-73.9312305704302,-73.9312272894226,-73.9312845838047,-73.9313054163604,-73.9312459249482,-73.9314225265011,-73.9314464775722,-73.9314223218776,-73.9314929190243,-73.9314806483417,-73.9315134373057,-73.9315433466718,-73.9314808487993,-73.9314862870527,-73.9314665489463,-73.9314327242082,-73.9314568476148,-73.9314753854822,-73.9314764750353,-73.9315466498031,-73.9315593944157,-73.9315527221199,-73.9314941829165,-73.9314288310434,-73.9313961055898,-73.9314069751201,-73.9314160036077,-73.9313412598258,-73.93131907299,-73.9311330195981,-73.9312129485895,-73.9310917816458,-73.931053130244,-73.9310123654473,-73.9309273982704,-73.9308888007358,-73.9307960172694,-73.9307048853,-73.9306856805981,-73.9306243872196,-73.9305688956272,-73.9301013765885,-73.9300913827922,-73.930070047636,-73.9305361426854,-73.930544681844,-73.9305860209088,-73.9305344412818,-73.9306502192753,-73.9306353232422,-73.9305473343507,-73.9305070797936,-73.9304372696048,-73.9303996759751,-73.9303798319572,-73.9303832851466,-73.9297441078082,-73.9297284638019,-73.9303650037517,-73.9303680674256,-73.9303854525627,-73.9303596123004,-73.9303706280742,-73.9303676020135,-73.930361509338,-73.9303369865333,-73.9302909816294,-73.9302633815747,-73.9297025502045,-73.9297223264673,-73.9299037110113,-73.930218811799,-73.9307328430339,-73.9313491782407,-73.9313655619293,-73.9313513596613,-73.9313172217924,-73.9313029996669,-73.9312775124759,-73.9312519126713,-73.9311807304431,-73.9310452875479,-73.9310580930064,-73.9308144495188,-73.9308059303523,-73.9305577193578,-73.9296432215919,-73.929641815495,-73.9305509692403,-73.9308201977409,-73.9308287126032,-73.9309113518628,-73.930912792656,-73.9309569642139,-73.9309541053253,-73.9310167985159,-73.9310121806847,-73.9305282117319,-73.9296689462475,-73.9296157548258,-73.9295634331281,-73.9292889540057,-73.929194376665,-73.9290889400391,-73.9288898308486,-73.9287923654893,-73.9286935949086,-73.9285739393647,-73.9284979856844,-73.9284315342131,-73.9283688900251,-73.928296748881,-73.9282493047991,-73.9281857599151,-73.9281430268028,-73.9281146217116,-73.9280823297159,-73.9280634718816,-73.9280758896281,-73.9280864018312,-73.9280997427585,-73.928105485982,-73.9281195788438,-73.928089629255,-73.9280389440336,-73.9280435838342,-73.9280965704473,-73.9281103989253,-73.9281496937952,-73.928138197065,-73.9279193378585,-73.9279251444091,-73.9281647386094,-73.9281623937405,-73.928172739299,-73.9281950124812,-73.9282767249762,-73.9281570069562,-73.9280156889545,-73.9278599907478,-73.9277431115315,-73.9276407168966,-73.9275138693355,-73.9274440014012,-73.9274052816233,-73.9273882258095,-73.9273695578589,-73.9273368347179,-73.9275327137679,-73.927586418299,-73.9275955985747,-73.9275162199561,-73.9275116888037,-73.9273414403862,-73.9272807972705,-73.9273065040187,-73.9273205062659,-73.9273508851603,-73.9273392187588,-73.9273724766151,-73.927358535385,-73.9273197695305,-73.9273043382388,-73.9272133428372,-73.9271409664434,-73.927112034736,-73.9269729675165,-73.9268609704584,-73.9267629750653,-73.9266906575185,-73.9266626898056,-73.9266627288983,-73.9265713955133,-73.9263804188107,-73.9263056357625,-73.9263369745878,-73.9266019591251,-73.9265669067122,-73.9265482096333,-73.9261016191073,-73.9255922719012,-73.9254935435831,-73.9255286087458,-73.9256544590901,-73.9262752954224,-73.9263454207472,-73.9262824204289,-73.9262310924367,-73.9261844307319,-73.9262054728269,-73.9260407550698,-73.9258333591695,-73.9257191874578,-73.9256265628069,-73.925523553599,-73.9254698562991,-73.9254243168133,-73.9253788969,-73.9253663689133,-73.9253411186334,-73.9253265831422,-73.9253052755718,-73.9252908398168,-73.925285643146,-73.9252865643765,-73.9252805781324,-73.9252594343054,-73.9251978785368,-73.9251743963877,-73.9251449346813,-73.9251123778675,-73.9250699257747,-73.9250266856211,-73.9249689419649,-73.9249141605491,-73.9248874764359,-73.9248266946884,-73.9247627016458,-73.9246584316704,-73.9246143360199,-73.9245716873116,-73.924553438605,-73.9245420953566,-73.9245369647526,-73.9245333114586,-73.9244985545885,-73.9244742535251,-73.9244309137947,-73.9243921770531,-73.9243581081149,-73.924320194973,-73.9242837910093,-73.9242397272535,-73.9242085869865,-73.9241904044492,-73.9241494324731,-73.9241197701619,-73.9240984947511,-73.924077318692,-73.9240456501833,-73.9240298004276,-73.9240049063022,-73.9239769223904,-73.9239389404355,-73.9239041499692,-73.92387090519,-73.9238397657451,-73.9238003027011,-73.9237562703406,-73.9237425927215,-73.9237312819083,-73.9237260524461,-73.923728418624,-73.9237277600135,-73.9236974751364,-73.9236815246751,-73.9236625187516,-73.9236321998052,-73.923603362599,-73.923574523162,-73.9235411794483,-73.9235079624314,-73.9234800133194,-73.9234496631501,-73.923367618419,-73.9233075741067,-73.9232779133204,-73.9232725562978,-73.9232580544631,-73.923234474806,-73.9232025478627,-73.9231606220977,-73.923112744045,-73.9230877556041,-73.9230650299951,-73.9230338578695,-73.9229448473941,-73.9228778654286,-73.9228283466104,-73.9227803378639,-73.9227619895849,-73.9227421635345,-73.9227170390141,-73.9226957976335,-73.9226639646458,-73.9226100389661,-73.9225872486443,-73.9225340788963,-73.9224520032916,-73.9223965953316,-73.9223487501292,-73.9223230682063,-73.9222911707015,-73.922276734989,-73.9222517418297,-73.9222138285799,-73.9221637469366,-73.9221128113616,-73.922055101474,-73.9219678631651,-73.9219231081819,-73.9218767441658,-73.9218295564305,-73.9217726364444,-73.9217065440245,-73.9216571178839,-73.9216032249414,-73.9215319339081,-73.921486293591,-73.9214308843428,-73.921392938455,-73.9213565032295,-73.9213147402061,-73.9212615354203,-73.9212341138271,-73.9212084310777,-73.9211879761897,-73.9211499954696,-73.9211096837251,-73.9210837415353,-73.9210728249297,-73.921049875168,-73.921012555475,-73.9209716160869,-73.9209255753889,-73.9208666444833,-73.9208174824948,-73.9207736142829,-73.9207311924192,-73.9207107076341,-73.92066736802,-73.9206216606691,-73.9205905872205,-73.9205511907948,-73.9205185392371,-73.9204774685219,-73.9204470867256,-73.9204266295797,-73.9203842437016,-73.9203515912683,-73.9203227201578,-73.9202862523476,-73.9202489661986,-73.9202192065896,-73.9201956305344,-73.9201851392989,-73.920173166234,-73.9201489955265,-73.9201201567881,-73.920091383195,-73.920051070017,-73.9200061874141,-73.9199804371541,-73.9199457112793,-73.9199155847953,-73.9198877920805,-73.9198833852585,-73.9198682571807,-73.9198485305763,-73.9198333050467,-73.9198219932292,-73.9198168607665,-73.9198040983813,-73.919770094537,-73.9197216875786,-73.9196777215396,-73.9196610169435,-73.9196466138076,-73.9196421402877,-73.9196452975978,-73.9196445726202,-73.9196249060907,-73.9195894240246,-73.9195806861638,-73.9195615687869,-73.9195414545875,-73.9195417196382,-73.9195418083028,-73.9195079264372,-73.9194951873569,-73.9194904965566,-73.9194831082309,-73.9194639876785,-73.9194227425657,-73.9194073243292,-73.9193640507751,-73.919312412841,-73.9193097392484,-73.9192639040805,-73.9192511811915,-73.9192339216769,-73.9191993890198,-73.919192108955,-73.9191775805288,-73.9191130612258,-73.9190957806858,-73.9190873024733,-73.91908122205,-73.9190621238703,-73.9190566537012,-73.9190339319749,-73.9190185051635,-73.9190121547255,-73.9190015466285,-73.9188417753934,-73.9188375806319,-73.9189001373303,-73.9188864034861,-73.9188566097794,-73.9188684714564,-73.918855951328,-73.9188357062159,-73.9188475846642,-73.9187992774343,-73.9187964430275,-73.9187959073799,-73.9187372184421,-73.9187126847583,-73.9186739259834,-73.9186441999799,-73.9186037888212,-73.9185687020441,-73.9185304459208,-73.9184943849487,-73.9184550843232,-73.9184222249942,-73.9183987992051,-73.9183680293852,-73.9182739594856,-73.9182468610065,-73.9182393789969,-73.9182307825521,-73.9182344579085,-73.9182402205374,-73.9182485778176,-73.9182654618204,-73.9182718001922,-73.9182674493105,-73.9182562600004,-73.9182402851347,-73.9182248830273,-73.9181941445312,-73.9181628326834,-73.9181597325125,-73.9181460494465,-73.9181503975033,-73.9181616560129,-73.9181516134787,-73.9181293341389,-73.9180995394617,-73.9180452753019,-73.9180207390673,-73.9179834949758,-73.9179367467011,-73.9179266694087,-73.9178917529739,-73.9178753380753,-73.9178541388809,-73.9178323343353,-73.917814164631,-73.917793438379,-73.917783864785,-73.9177701124814,-73.9177632720561,-73.9177473991847,-73.917734083472,-73.9177175708308,-73.9177064129452,-73.9176979857736,-73.9176852802131,-73.9176709577114,-73.9176155419319,-73.9175842937967,-73.9175264586179,-73.9174561674886,-73.9174170795062,-73.9173889660026,-73.9173483332509,-73.9173436147243,-73.9173107597454,-73.9172763851523,-73.9172529673241,-73.9172201529833,-73.9171935553305,-73.9171388658952,-73.9171263303082,-73.917075658406,-73.9170698269373,-73.915944601434,-73.9158289001943,-73.9157540475484,-73.9171359020326,-73.9172301984166,-73.9175750002432,-73.9183322456026,-73.9190857231541,-73.9198693072058,-73.9207565880955,-73.9209287181441,-73.9211616247793,-73.922367608929,-73.9227960812382,-73.9228485463533,-73.9235048569352,-73.923791477666,-73.9240846472311,-73.9246539325931,-73.9246647476181,-73.9252412425509,-73.925945807442,-73.9270927808393,-73.9279589375641,-73.92863344177,-73.9287156972737,-73.9299834173285,-73.929936904353,-73.929632480749,-73.9303485009623,-73.9304342527859,-73.9305172184788,-73.930596672216,-73.9306719189001,-73.9307423002421,-73.9308072005208,-73.9308404859508,-73.9308674386196,-73.9308877057671,-73.9308905316685,-73.9308910123524,-73.9308891344592,-73.930884950186,-73.9308785758354,-73.9308701885829,-73.9308600215523,-73.9308483573357,-73.9308355201393,-73.9307637108393,-73.9307576493907,-73.9307517596794,-73.9307462157335,-73.9307411813643,-73.9307368053264,-73.9307332169219,-73.9307305221801,-73.9307288007245,-73.9307281034201,-73.9307284508704,-73.930729832809,-73.9307385503497,-73.9307501649444,-73.9307406943348,-73.9307542931208,-73.9307812297386,-73.9308085647316,-73.9308290486385,-73.9309137000996,-73.9309207715429,-73.9309600314458,-73.9310926332452,-73.931179511672,-73.9317021421091,-73.9317142204142,-73.9317249134724,-73.931745303496,-73.9317724033525,-73.9317973460914,-73.9318194619442,-73.9318282368275,-73.9318347418738,-73.9318388129291,-73.9318403472601,-73.9318393061472,-73.9318357158611,-73.9318296670004,-73.9318213122053,-73.9318108623062,-73.9318046777447,-73.931798928348,-73.9317937783065,-73.9317893746943,-73.9317858432692,-73.9317832848812,-73.9317817725926,-73.9317813495914,-73.93178392763,-73.931787560569,-73.9317921545551,-73.9317975909072,-73.9318037291821,-73.9318104108035,-73.9318634542836,-73.9319135364923,-73.9319284768204,-73.9319443127039,-73.9319606826121,-73.9319772128219,-73.9319281118676,-73.9323769574283,-73.9323719695463,-73.932013799611,-73.9319887370741,-73.9320183941154,-73.9323308350322,-73.932355992818,-73.9323800499615,-73.9324023388802,-73.9324222410602,-73.9324392042202,-73.9324746587954,-73.9325129419335,-73.9325534988149,-73.9325987705764,-73.9326447979136,-73.9326907033422,-73.9327356117021,-73.9327786668411,-73.9327911504497,-73.9328045136186,-73.9328184190432,-73.9328325157312,-73.9328464478628,-73.9328598637717,-73.9329196614074,-73.9329801590471,-73.9330404736212,-73.9330997247322,-73.9331570475047,-73.9333034022795,-73.9333930595821,-73.9334914563773,-73.9334895283372,-73.9337137801662,-73.9342097148697,-73.9342077286539,-73.9343702787297,-73.9343797014331,-73.9344692819631,-73.934559929029,-73.9345627912191,-73.9345605710198,-73.9352819437215,-73.9352760526263,-73.9352761118093,-73.9354404068803,-73.9356907163977,-73.9356895363613,-73.9357242354232,-73.9357193387555,-73.9356767646808,-73.9356735314599,-73.9358243927578,-73.9358269067191,-73.9357598191954,-73.9357665721109,-73.9357674980518,-73.9361124375298,-73.9361323359013,-73.936152282715,-73.9361717551263,-73.936190242726,-73.9362072609187,-73.9362223636256,-73.9362351549768,-73.936245299688,-73.936252531849,-73.9362543204547,-73.9362741827063,-73.9362704507023,-73.9362893368137,-73.9362875226431,-73.936287231894,-73.9362450715287,-73.9362418512818,-73.9361280221118,-73.9361286594257,-73.9361288123766,-73.9360982496962,-73.9360980770168,-73.9360966869136,-73.9362402391076,-73.9362403724473,-73.9363514911458,-73.9365660702915,-73.936564367648,-73.9363505071377,-73.9363490619603,-73.9363003120676,-73.9363016916904,-73.9363035986279,-73.9363086017894,-73.9363171612953,-73.9365391284709,-73.9365485548835,-73.9365759244078,-73.9366287604513,-73.9369742746376,-73.9369772471098,-73.9369865173925,-73.9369874367197,-73.9369876783104,-73.9369310072212,-73.9369314851825,-73.9369039740811,-73.9368916774403,-73.9368258492613,-73.936744914072,-73.9367319026441,-73.9366630028366,-73.9366492210293,-73.9366326382984,-73.9366330742246,-73.9370592167747,-73.9370562380686,-73.9370529045103,-73.937632697433,-73.9376320432883,-73.9370535633146,-73.9370527874277,-73.9370267558872,-73.9370301269195,-73.9370305103347,-73.9370055840827,-73.9370052051678,-73.9370038732406,-73.9370142304753,-73.9370148102119,-73.9370510689012,-73.937077377783,-73.9371245979845,-73.9372974407271,-73.9373204953578,-73.9373247075988,-73.9378318029718,-73.9378873268306,-73.9381191769509,-73.9380942062777,-73.9382399147974,-73.9382574576991,-73.9383308913978,-73.9385527623651,-73.9384771288587,-73.9386684665774,-73.9386664610738,-73.9386599914724,-73.938663341576,-73.9386466303217,-73.9386221889761,-73.9386275576512,-73.9387866044152,-73.9387826663901,-73.9387311533361,-73.9386685173058,-73.9386632281359,-73.9386783271204,-73.9386871999985,-73.9386974579878,-73.9392964038475,-73.9393015308489,-73.9398253885057,-73.9398288398462,-73.9398570019674,-73.939858515768,-73.9402735576653,-73.9405774582891,-73.9405753254517,-73.9405749537624,-73.9405725816192,-73.9405721499989,-73.9405696280159,-73.9405691688033,-73.9405675432505,-73.9405660894773,-73.9405419930905,-73.9405422955577,-73.9404736062161,-73.9404735774077,-73.940109523965,-73.9401090368293,-73.9401257676994,-73.9402142213517,-73.9402251803578,-73.9402670888333,-73.9402794150494,-73.9403635249099,-73.9403768838958,-73.940472814569,-73.9404865952313,-73.9405616665925,-73.9405755070221,-73.9406581674775,-73.9406765780227,-73.9406771219134,-73.9405856840527,-73.9405866718767,-73.9405872791283,-73.9405875464774,-73.9405884696087,-73.9405887280989,-73.9406285557423,-73.9406364933032,-73.9407001951475,-73.9406969032371,-73.9409164549074,-73.9409000104769,-73.9408971047742,-73.9407386846444,-73.9407384060463,-73.9407935538431,-73.9408308173342,-73.9408467712349,-73.9409163725539,-73.9409753279758,-73.9410040897775,-73.9410251791869,-73.9410258439236,-73.9409145036293,-73.940917369179,-73.9409281603307,-73.9409342208536,-73.9411569967549,-73.9411625845631,-73.9411370122831,-73.94113089391,-73.9411090597259,-73.9411062487938,-73.9410984456549,-73.941145349942,-73.9411507471981,-73.9412015572889,-73.9412056166295,-73.9411540861051,-73.9411583380938,-73.9411938439722,-73.9412092982399,-73.941246974023,-73.9412635116459,-73.9413111511611,-73.941440508572,-73.9414883378426,-73.9415443865731,-73.9415740808357,-73.942551335653,-73.9420203335275,-73.942149388102,-73.9427016776298,-73.94304709646,-73.9425631619098,-73.9426877400567,-73.9431950615803,-73.9435446753092,-73.9430933478146,-73.9432281554656,-73.9435120588953,-73.9436915300457,-73.9440676416711,-73.9436358979574,-73.9437651164146,-73.9442340358714,-73.9446182866624,-73.9441745852377,-73.9443205981808,-73.9447754408129,-73.9451747778161,-73.9447127096423,-73.9448451294087,-73.9453499250347,-73.9457301493043,-73.9452667012463,-73.9453760523788,-73.9458991188809,-73.9462863469191,-73.9457994125889,-73.9459241293531,-73.9464342905935,-73.9467894506878,-73.9463160364871,-73.946454964773,-73.946917962761,-73.9472683270527,-73.946822029472,-73.9470139088358,-73.9474686786132,-73.9483674792493,-73.9495826675518,-73.950250769568,-73.9511822698626,-73.9524744797083,-73.9534932204868,-73.953432163444,-73.9534192982367,-73.9533013599568,-73.9528629215182,-73.9523309909847,-73.9519384943325,-73.9510236946263,-73.9500883946427,-73.949696724994,-73.949374735223,-73.9480044811693,-73.9469768187522,-73.9460061663116,-73.9450294035948,-73.9441367291388,-73.9430620826782,-73.9427406259252,-73.9421653834802,-73.9412412027241,-73.9403576569333,-73.9389906579337,-73.9380568041423,-73.9371056135673,-73.9361696075799,-73.9347519384381,-73.9338128066391,-73.9338136463092,-73.9338361533937,-73.9338359807471,-73.9342995473485,-73.9351340770489,-73.9351378928337,-73.9351087911519,-73.9351061582394,-73.9350953259684,-73.9339140448124,-73.9338364511142,-73.9338362727794,-73.9338130480486,-73.9338132808982,-73.9337639173508,-73.9337631473705,-73.9336629593379,-73.9336632572223,-73.9334004288524,-73.9333993186901,-73.9336624342682,-73.9336627964387,-73.9337631343139,-73.9337580135612,-73.9330034891641,-73.9330029472605,-73.9329716189068,-73.9329635037576,-73.9329095874482,-73.9329134081496,-73.932872950224,-73.9328691636471,-73.9328063642747,-73.9327788560717,-73.9327494487057,-73.9326975326653,-73.9326407480483,-73.9325800656804,-73.9325526813435,-73.9325243366416,-73.9325034115588,-73.9324506061651,-73.9320212466452,-73.9319957687601,-73.9318149783328,-73.931826884272,-73.9316902633028,-73.9316406939416,-73.9310602810801,-73.931062883357,-73.9314422561966,-73.9315025674406,-73.9330973637817,-73.9333442095384,-73.9348088246586,-73.9348609283043,-73.9348914824417,-73.9349022910097,-73.9348935645524,-73.9349954030409,-73.93500161782,-73.9350786183044,-73.9353241049106,-73.9357572231627,-73.9362344446556,-73.9364710758659,-73.9365616343876,-73.9366035818983,-73.9366210958546,-73.936650974268,-73.9366715385713,-73.9366827328403,-73.9366948432211,-73.9367075253733,-73.936720418699,-73.9367331565961,-73.9367453768817,-73.9367567320904,-73.9367567450178,-73.9367933549786,-73.9367954948281,-73.9367985919742,-73.9368025633865,-73.9368073025964,-73.9368126825518,-73.9368185590228,-73.9368247744685,-73.9368311622605,-73.9368375511499,-73.9368437698586,-73.9368496516707,-73.9376156246729,-73.9389672078359,-73.9425090782843,-73.9425191882929,-73.9425273835129,-73.9425334559925,-73.9425372516434,-73.942538674151,-73.9425376874183,-73.9425344786556,-73.9425291296261,-73.9425217664792,-73.9425125628648,-73.9425017358384,-73.9424895407417,-73.9424762651813,-73.9424828136937,-73.9424925505653,-73.9425052182362,-73.9425204816194,-73.9425379369651,-73.9425571225406,-73.942577530844,-73.9425986220291,-73.9427406081808,-73.9428874874475,-73.9431159056162,-73.9432922062786,-73.9434725694638,-73.9436414953313,-73.9438205742343,-73.943934607276,-73.9440493743169,-73.9441643765834,-73.9442791142795,-73.944393088759,-73.9445058046935,-73.9445429369838,-73.9445769861215,-73.9446072724169,-73.9446331912961,-73.9445527223794,-73.9445662343865,-73.9445672091415,-73.9445676294428,-73.9445674848567,-73.9445667789727,-73.9445667778231,-73.9445672927579,-73.9445683130967,-73.9445698176764,-73.9445717752899,-73.9445805752262,-73.9445902566813,-73.944600540171,-73.9446063776838,-73.9446121818313,-73.9446177859037,-73.9446230289376,-73.94462776034,-73.9446423384772,-73.9446776838472,-73.9446950661317,-73.9447444166077,-73.9449196021101,-73.9450962423247,-73.9452738748199,-73.9454520345656,-73.9455429085131,-73.9456336092279,-73.9457235201333,-73.9458120300221,-73.9458985372125,-73.945982453638,-73.946036037426,-73.9460836627551,-73.946124421466,-73.9461575363431,-73.9461823759353,-73.9461984665959,-73.9462055015131,-73.9461589885057,-73.9459533007826,-73.9459214827695,-73.9459089795528,-73.9459239023584,-73.9466510173404,-73.9467119736007,-73.9467795328985,-73.9468013406923,-73.9469198029281,-73.9470850031949,-73.9477671676402,-73.9486854928755,-73.9489637597347,-73.9493881362593,-73.9495406590232,-73.94991862626,-73.9500657581516,-73.9501855243287,-73.9503087290243,-73.9505308157179,-73.9505311591346,-73.9508117706898,-73.9510478999174,-73.9513250956544,-73.9514765323082,-73.9515151797231,-73.9517776781359,-73.9521077266367,-73.9522779037294,-73.952397830766,-73.9525777536374,-73.9527849148459,-73.9529666099609,-73.953124969102,-73.9532829180936,-73.9534040835321,-73.9535266008142,-73.9537425795835,-73.9537796807437,-73.9538505137371,-73.9539349053973,-73.9539942340508,-73.9540113629754,-73.9540319979788,-73.9540833338591,-73.9541072675142,-73.9541002959486,-73.9541336080345,-73.9542854678707,-73.9536517177126,-73.9538405298239,-73.95397148475,-73.9540328089505,-73.9542056252297,-73.9543453980122,-73.9544382860244,-73.95471326915,-73.9550550541248,-73.9550711159212,-73.9550694371045,-73.9550496174754,-73.9549891767211,-73.9549402417257,-73.9559199765486,-73.955962617691,-73.9559960775631,-73.956014466753,-73.9560177456007,-73.9560265976333,-73.9560414673453,-73.9564572912573,-73.9567561828483,-73.9568258363904,-73.95689047345,-73.9569559603608,-73.957031341804,-73.9571329137328,-73.9572361001647,-73.9573360838997,-73.9574554664552,-73.9590076424999,-73.9591095880835,-73.9598350287983,-73.9600479866748,-73.9601050945464,-73.9601492412961,-73.9601967315189,-73.9602179211174,-73.9602275387826,-73.9602312436683,-73.9602346157069,-73.9602394336217,-73.9602431539677,-73.9602582590248,-73.9602685185012,-73.9603253926731,-73.9603419076201,-73.9603461500906,-73.9603380372185,-73.9603176630362,-73.9603171210085,-73.9603495358521,-73.9604071009965,-73.9604596836014,-73.9605166723842,-73.9624443468343,-73.9633698203609,-73.9642641511992,-73.9653598608265,-73.9656409195882,-73.9658201454498,-73.9659316287091,-73.9665263588817,-73.9670455920232,-73.9675424033235,-73.9679700384309,-73.9688973502415,-73.9698231824748,-73.9707527585702,-73.9716772248391,-73.9726033099826,-73.9742079975138,-73.974335918312,-73.9742850539179,-73.9742428825228,-73.9742016805361,-73.9741929026631,-73.9751350915463,-73.9758382003545,-73.9765127912138,-73.9772213207711,-73.9773128445781,-73.9776956586936,-73.9781819154221,-73.9783104901111,-73.9783933903959,-73.9785011318742,-73.9787617541352,-73.9790261723355,-73.9790851061331,-73.9794156499557,-73.9795736900813,-73.9796275845859,-73.9798853448458,-73.9799449997963,-73.9800780913951,-73.9801528345959,-73.9806015960486,-73.9807101319402,-73.9809372332252,-73.981977400581,-73.983046594855,-73.9837215268118,-73.9831403468563,-73.9822111583866,-73.981283846727,-73.9803578547385,-73.9794258684296,-73.9789057139549,-73.9785016917869,-73.9775067424922,-73.9765093450658,-73.9755881930256,-73.9750394042932,-73.9749269555482,-73.9740839048974,-73.9732398353256,-73.9731228463365,-73.9730210800516,-73.9729671326161,-73.9729111684125,-73.9725653370985,-73.9724526158844,-73.9723515208722,-73.9721774273492,-73.972397355419,-73.9725898234115,-73.9729594808647,-73.972994339389,-73.9719151872532,-73.9708953837774,-73.9699656611014,-73.9690408663949,-73.9679216879961,-73.9678067633597,-73.9676863568787,-73.9673997951279,-73.9662983547991,-73.9652237806769,-73.9642964996393,-73.9633709296116,-73.9623794782476,-73.9613726831358,-73.9604436188151,-73.9595206963374,-73.9585927849577,-73.9580473192722,-73.9576680137943,-73.9567047140635,-73.9557406698915,-73.9547955270999,-73.9535988878696,-73.9525878694897,-73.9516677680696,-73.9515845239035,-73.9514654146038,-73.951348165338,-73.9512330307057,-73.9511202608527,-73.9510101005227,-73.9509027889262,-73.9507693807591,-73.9499629669533,-73.9491197021277,-73.9482483442374,-73.9476405732208,-73.9474260878081,-73.9465736676219,-73.9457369191203,-73.9448277099629,-73.9447954727965,-73.9445736645838,-73.9444361462781,-73.9443088819456,-73.9441745062859,-73.9440556093215,-73.9438316165953,-73.9426513822668,-73.9408289785009,-73.9390124693896,-73.9390496277481,-73.9384898668512,-73.938347083712,-73.9378905081103,-73.938098082759,-73.9384349357584,-73.9379155784185,-73.9360940729623,-73.9342626672588,-73.9335511715361,-73.9317339012848,-73.9299222492492,-73.9281313960502,-73.9287901015488,-73.9291243705818,-73.9295685824336,-73.9286685095516,-73.9275993669829,-73.9265330499539,-73.9254714779807,-73.9244041329122,-73.9240555304218,-73.9236367728711,-73.9233217785486,-73.922307925163,-73.9209599200278,-73.919725107872,-73.9181908779807,-73.9180925648084],"lat":[40.5865703350048,40.5865073744992,40.5864365456763,40.5864322084016,40.5864540536665,40.5864456788133,40.586419415396,40.5863950937695,40.5863870423715,40.5864079060532,40.5864042862636,40.5863906813499,40.5863536481558,40.5863223914095,40.5863096763751,40.5862999345244,40.5862633863401,40.5862402403716,40.5861916737085,40.5861673286998,40.5861592446999,40.5861476818714,40.5861347965534,40.5861071841306,40.5860956159999,40.586077094123,40.5860587408308,40.5859624936451,40.5860088815037,40.5860147269352,40.5860147414862,40.5860820127716,40.5861133269506,40.5861336928696,40.5861145406478,40.5861690793973,40.5861355543003,40.5861008581095,40.5860916224936,40.5860592351651,40.5860500166706,40.5860569452636,40.586025009293,40.5860250389317,40.5860212132328,40.5860202618353,40.5859906098873,40.5860067742403,40.5859886002563,40.5859724306778,40.585939908785,40.585938976927,40.5859619346053,40.5859629196034,40.5859810935825,40.5859839264429,40.5860193174753,40.5860221938862,40.5860269773838,40.5860260613826,40.5860637775292,40.5860652518937,40.5860676143172,40.5860897796457,40.5860340817413,40.5860097993268,40.5859959440337,40.5859820980113,40.5859957737037,40.5859578344087,40.5859210803211,40.5858129616004,40.5858097375235,40.5857779707721,40.5857973172405,40.5857736265197,40.5857300966936,40.585753785451,40.5857720597669,40.5858038284768,40.5858006036095,40.5859030618031,40.5858733062725,40.5858304064738,40.585778304979,40.5857690486203,40.5856500522322,40.5855994633644,40.5855905815336,40.5856489935832,40.5857535958582,40.5857535558607,40.5857366263323,40.5857285446843,40.5857414503219,40.5857464678056,40.5857495427446,40.5857461951621,40.5857813375264,40.5857669009884,40.5857997054453,40.5857765402165,40.5857660927795,40.5857334862048,40.5857475856828,40.5857591743252,40.585776576424,40.5856931756735,40.5857117520443,40.5858384214364,40.5858320377786,40.5858446133875,40.5858211256566,40.5858105141531,40.5858561172118,40.5859925662073,40.5860180257399,40.5860239365624,40.586016175254,40.5860093812963,40.5860087299415,40.5860045356399,40.5859967616181,40.5859508074512,40.585955721418,40.5858944570638,40.5859264572269,40.5859627664731,40.5859952205555,40.5859777238722,40.5859415992494,40.5858584661354,40.5858007138123,40.5858007342269,40.5858418946175,40.5858928458923,40.5858997183448,40.5858948357177,40.585877211167,40.5858546759722,40.5858047063113,40.5857802257686,40.5857735353322,40.585682758902,40.5857054083196,40.5856463773686,40.5856377464535,40.5856325750993,40.5856534992268,40.5856830125098,40.5857133981574,40.5857002410519,40.5857128459713,40.5857598715735,40.5858062711555,40.5858398245601,40.5858790443537,40.5858981528953,40.5860923691072,40.5861965140625,40.5861932900707,40.5862528906471,40.5863347488031,40.5864026846226,40.5864674916164,40.5864584472685,40.5865751832022,40.5866309368622,40.586680240042,40.5866797298976,40.5867232877467,40.5867842729823,40.5868435134697,40.5868862584659,40.5869021174698,40.5868714209383,40.5869620152146,40.5870491258421,40.5870960823567,40.5871209110176,40.5871330856028,40.5872040910146,40.5871885067161,40.5872896899538,40.5873303850649,40.5873736229982,40.5874095823861,40.5874519685789,40.5875015346245,40.5875666615426,40.5875564026313,40.5875604570338,40.5875402253168,40.5873689695335,40.5873537958658,40.5875595037804,40.5875716445723,40.5875513732647,40.5875716032998,40.5875797136137,40.5875910371631,40.5876176915001,40.5876611471881,40.5877227591868,40.5877057733401,40.5876866612901,40.5876568907862,40.5876302929907,40.587615721094,40.5875978577892,40.5875788350309,40.5875592907799,40.587541877139,40.5875236292174,40.5875158305541,40.5874867139551,40.5874666932873,40.5873594171974,40.5873616001341,40.5874750134398,40.5875075927127,40.5876481286499,40.5876586772082,40.5876698832264,40.5876756416895,40.5876865790183,40.5877032072622,40.5877384649897,40.5877532747198,40.5877690507026,40.5878499299063,40.5878829990097,40.5879091693988,40.5880221762762,40.5879988001172,40.5879545358348,40.5879357950042,40.5879289015562,40.5878904518704,40.5878832584084,40.5878426338044,40.5878368427285,40.5877943659945,40.5877884954171,40.5877494198534,40.5876588205077,40.5875881588538,40.5875755029788,40.5875487358895,40.5877024605232,40.5877314843462,40.5876666035572,40.587732985372,40.587751386905,40.5878430388128,40.5878433141233,40.5878866447211,40.5878950645031,40.58797306001,40.5879796768783,40.588044598803,40.5881478913515,40.5881785950788,40.5882064451977,40.588219391397,40.5882063042317,40.5882213601303,40.588140492015,40.5880569718004,40.5879759202857,40.58796033563,40.58795340928,40.5880687563509,40.5880769993962,40.5879961872768,40.5880345564793,40.5880406841085,40.588074964004,40.5880788290168,40.5880880615342,40.5881321969524,40.5881406129447,40.5881641313252,40.5882152211497,40.5882289525983,40.5882355027287,40.588227906818,40.5882331438654,40.5882216549525,40.5882259656253,40.5882320897364,40.5882363915617,40.5882478894905,40.5882693843417,40.5882891175855,40.5882995640741,40.5883205745187,40.5883690147937,40.5884938293358,40.5885135318207,40.5884589205203,40.5886606097589,40.5890814722595,40.5891820752107,40.5893684966517,40.5893841286669,40.5894108796166,40.5895927189504,40.5897803772031,40.5899716599274,40.5901652073177,40.5903544408057,40.5905470476748,40.5907392590527,40.5909410189562,40.5911386873366,40.5911398505251,40.5912486819728,40.5913642801887,40.5913214467032,40.5913379303391,40.5912922681216,40.5913007413061,40.5912559242254,40.5912720169762,40.5912314344324,40.591238212301,40.5911993250032,40.5911578858748,40.5911417904657,40.5910563890116,40.5910445297163,40.5909515213959,40.5909591458144,40.5909287088473,40.5909151567498,40.5908297505734,40.590835680425,40.5906733402474,40.59035203456,40.5903371515992,40.590243795635,40.590165377911,40.5900379147356,40.5898458610949,40.5896452667077,40.5894521425308,40.5891022000975,40.5890771821149,40.58882524959,40.5889690160919,40.5889658248345,40.5889340350982,40.5889290341974,40.5889406237746,40.5889182156869,40.5888980331691,40.5888863735987,40.588882893466,40.5888892461941,40.5887839129039,40.5887762547007,40.5888625348115,40.588865431329,40.5888127267005,40.588779543255,40.5887617108295,40.5887432064096,40.5887267654152,40.5887152996017,40.5886781018476,40.5886351648781,40.5886256675595,40.5885802953276,40.5885726364207,40.588655223095,40.5886655853283,40.5886742970058,40.5886806480867,40.5886384346034,40.5886745591381,40.5886883308237,40.5887100184521,40.5887359957235,40.5887556462678,40.5887709506836,40.5887841492109,40.5888182502081,40.5888634578286,40.5888785043633,40.5889325551083,40.5889529207223,40.5889440326315,40.5889777372243,40.5889813236161,40.5890304276395,40.5891204362962,40.5890987407946,40.5890964224861,40.5890210034386,40.5890105015188,40.589008688311,40.5889946086241,40.5889766601528,40.5889621703253,40.5889196327745,40.5889056842255,40.5888673563162,40.5888537195754,40.5889096424096,40.5890043265495,40.5890192930559,40.589126361639,40.5891432640665,40.5891268813408,40.5891471651677,40.5890703851716,40.588813345444,40.5888240772554,40.5888693093378,40.5889395314925,40.5889506916214,40.5888788296275,40.588926286047,40.5889872446179,40.5889967703942,40.5889352003415,40.5889774395281,40.5890402121898,40.589046161586,40.5889866773582,40.5890274653285,40.5890896070101,40.5890979390407,40.5890352508016,40.589081151866,40.5891549881097,40.5891624607083,40.5890912863323,40.5890990269281,40.5891187004039,40.5891282222682,40.5891115272726,40.589118073385,40.5891377473502,40.5891460783946,40.5891258088785,40.589152966925,40.5892342330186,40.5892739697339,40.5892610664106,40.589285630589,40.589303815475,40.5893618468462,40.5894006195079,40.5894646672865,40.5895159978787,40.5894619976001,40.5894413996378,40.5893744431599,40.5893435111852,40.5893203551866,40.5893086935527,40.5892506624799,40.5892236591654,40.5892726573798,40.5892920689451,40.5894259965007,40.5895251092149,40.5896576899177,40.5897323289124,40.5897812224387,40.5897760868094,40.5898906412032,40.5899073446301,40.5897734847676,40.589807684238,40.5896881360247,40.5896531631011,40.5895636971058,40.5896061050715,40.5896766556911,40.589818527758,40.5899404597104,40.59003516763,40.5900490348098,40.5900204112388,40.5900376327123,40.5900169436062,40.5899568602871,40.5899525911326,40.5902529903378,40.5902529665436,40.590042691536,40.5900613730906,40.5902636614617,40.5903079886776,40.5903054903514,40.5902936080452,40.5902909794923,40.5905907213156,40.5905906930913,40.5903292586026,40.5903331134298,40.5906250773925,40.590740679402,40.5908596011971,40.5909078767068,40.5909207001257,40.5909207133987,40.590929956824,40.5909299714877,40.5909167683831,40.5909186942762,40.5906190006453,40.5906196836718,40.5909445664194,40.5909524168446,40.5909431760157,40.59094579826,40.5909576826589,40.5909564295722,40.5910012190209,40.591000054806,40.5910185414002,40.5910254169941,40.5910788712644,40.5910796919292,40.5910700549598,40.5910898602652,40.591093850738,40.5911111277293,40.591117027231,40.5912114008759,40.5912477158316,40.591190092991,40.5912112155772,40.5912099224987,40.5911914378681,40.591186176221,40.5914845820417,40.5914951237906,40.591229731614,40.5912257404035,40.5912415835584,40.5912734075961,40.5912960376398,40.59146198432,40.5914642023973,40.591730942143,40.5917208484941,40.5915281374321,40.5915413625085,40.5917169139653,40.5917472588918,40.5919851325328,40.5921351997628,40.5922450372618,40.592246341831,40.5921250838339,40.5919327918127,40.5917472421184,40.591755596429,40.5918296292896,40.5920281380392,40.5920954413046,40.5921322373641,40.5921887781218,40.5921939631561,40.5922991792237,40.5923013855175,40.5922980677793,40.5922990870311,40.5922435254257,40.592252239752,40.5922622680854,40.5922677474514,40.5923006993636,40.5923216963113,40.592365867781,40.5923803407174,40.5923893282566,40.5924263213872,40.5924366653248,40.5924681313465,40.5924800935136,40.5924649730626,40.5923117706091,40.5923080368534,40.5923567235912,40.5924455754654,40.5923781764713,40.5924062209704,40.5924408571781,40.592448312015,40.5924516662108,40.5924952291479,40.592491972534,40.5925549502941,40.5925626606095,40.5925838076451,40.5925911734687,40.5926109750163,40.592619404933,40.5926104951986,40.592553689837,40.5925176247102,40.5925124393904,40.592487799125,40.592483951136,40.5924685193816,40.5924715939887,40.5924541182888,40.592546697533,40.5925746041438,40.5926830463848,40.5926850164272,40.5926854210378,40.5926861047822,40.5926861624885,40.5927262780842,40.5927536199599,40.5927522435817,40.5927547812535,40.5927607661897,40.592665620317,40.5926783702925,40.5927185803395,40.5927362199116,40.5927567219398,40.5927788212136,40.5927918495356,40.5928049553849,40.5927895099413,40.5927773032086,40.5927716064022,40.5927330549768,40.5927328802013,40.5927324321921,40.5927320442294,40.5927282858821,40.5928171704239,40.5928533948731,40.5928550918009,40.5928558670553,40.5928568216414,40.5928742568568,40.5928812673253,40.5928989763144,40.5929027765538,40.5928951573214,40.5928692503329,40.5928724404524,40.5928767310125,40.5928845648917,40.5929192273728,40.5929503396256,40.5929644843638,40.5930002435208,40.5930002314411,40.5929585842145,40.5929171684681,40.5929048921328,40.5928968660083,40.5928915799497,40.5928981021803,40.5928920410189,40.592886397442,40.5928743703529,40.5928729639556,40.5928717848489,40.5928707918707,40.592903648605,40.5931200482481,40.5931234674815,40.5931245175213,40.5931257126369,40.593132097855,40.5931354076033,40.5931468283642,40.5931416189313,40.5931588869068,40.5930543971679,40.5930608793181,40.5930907311471,40.5931054688924,40.5932365634381,40.5932459751372,40.5933085723267,40.5933053216953,40.5931738154135,40.593158421667,40.5931450512278,40.5931439224456,40.5931865496794,40.5932474378241,40.5932988282366,40.5933726961014,40.5933664169611,40.5933588113477,40.5933484308838,40.5933674538902,40.5933759356175,40.5933914419607,40.5934367414716,40.5935250792281,40.5935842352589,40.5936461323504,40.5936993368409,40.5937821012394,40.5938763122136,40.5939324518857,40.5940057108167,40.5940945355596,40.5939729441846,40.5939388436041,40.5939410787585,40.5939320154433,40.5938851527021,40.5938767494417,40.5938311265415,40.5937686406428,40.5937390405164,40.5937283756832,40.5936975709029,40.5936744688665,40.5936668485714,40.5936023069232,40.5935954628713,40.5937109600285,40.5937221291514,40.5937842811981,40.5938266545742,40.5938379057807,40.5939306208969,40.5939060419233,40.5939116986035,40.5939023788237,40.5938144977448,40.5938802407008,40.5939633822249,40.593975941324,40.5940598115586,40.5941585932165,40.5941856705349,40.5941993045882,40.5941778195796,40.5941728407219,40.5941391426979,40.5941328401479,40.5940932945655,40.594085389135,40.5940717200815,40.5940171524764,40.5940006380612,40.5939945975093,40.5939877032812,40.5939827122678,40.5939654478809,40.5939380545103,40.5941048873305,40.5941608501941,40.5942389175861,40.5942969895319,40.5944026749499,40.5944512492791,40.5944674514553,40.5944768105665,40.5943876243493,40.5943819005208,40.5943687790735,40.5943301633592,40.5943234943433,40.594285298194,40.5942325414578,40.5942193330174,40.5942044976599,40.5942228425264,40.5942305777017,40.5942680533324,40.5942760669416,40.5943209272101,40.5943293803427,40.5943682702441,40.5943749557045,40.5944135713042,40.5944298923562,40.5943921221165,40.5944639509329,40.5944770397504,40.5944930153183,40.5944467575064,40.5944416504442,40.5944306556692,40.594459949861,40.5944415702909,40.5944169173925,40.5943937187183,40.5943879600316,40.5943436993341,40.5942875652701,40.5942441861187,40.5941884092193,40.5941833172628,40.5941911069058,40.5942331057652,40.5942654583594,40.59427625619,40.5942814378903,40.5942567654167,40.5942780439751,40.594303600137,40.5943497963823,40.5943554614039,40.5944047639345,40.594411674564,40.594436668934,40.5944532936219,40.5944659452062,40.5944822652154,40.5944890129844,40.594497530847,40.5945034030727,40.5945040096546,40.5945053702483,40.5945136605326,40.5945148285821,40.5945238302538,40.5945251373144,40.5945291720945,40.5945209907485,40.5945193786442,40.594506843226,40.5944950629109,40.5943659631095,40.5943708679028,40.59430090317,40.5942835124612,40.5942840992655,40.5943670080009,40.5943843287613,40.5943766225587,40.5944290809405,40.5945035184144,40.5945195537768,40.5945331942292,40.5945464507847,40.5945200932149,40.5945046898511,40.5944934212848,40.5944515252972,40.5944989552768,40.5945161012017,40.5945294278681,40.5945437151052,40.5945488916605,40.594616909501,40.5946401909827,40.5946544810895,40.5946866170627,40.5946989761846,40.5947099297313,40.5946886823703,40.5946854117663,40.5946924043024,40.5947282863058,40.5947943869441,40.5948287424691,40.5948630967674,40.5948919217799,40.5949046783187,40.5949163404872,40.5949169169366,40.5949120140488,40.5949149676658,40.5948425070207,40.5948458421366,40.5948023638896,40.5947956893184,40.594823558188,40.594763472297,40.5947857697939,40.5948436360398,40.594916096676,40.5949116860902,40.594929544525,40.5949117538167,40.5948427325185,40.5948037449692,40.5947157024411,40.5946691589953,40.5946452570163,40.5945596606102,40.5943338711616,40.5942364179676,40.594112228742,40.5940400187181,40.59395996142,40.5938684691243,40.5935630085774,40.5932876499216,40.5930858839751,40.5929911099309,40.5928301048992,40.5928341126146,40.5928539502189,40.5930111033848,40.5930370941335,40.5930445212135,40.5930503005205,40.5930077457381,40.5930048931612,40.592692830519,40.5926900933479,40.5928279487605,40.5928164551802,40.5927977673627,40.5927943936945,40.5926867929757,40.592661153688,40.5926354843446,40.5926022273217,40.5925517407717,40.5924798149176,40.5923007109402,40.5922635141393,40.5922630995174,40.592238386452,40.5922254194123,40.5921671345181,40.5921605812261,40.5921307668188,40.5920828098975,40.5920270758351,40.5920089287475,40.5919882405171,40.591965195667,40.5919467874105,40.5919283730722,40.5918048905622,40.591931042481,40.5918307414579,40.5918307388247,40.5918181989861,40.5918082058547,40.5918274324761,40.5918299941114,40.5918550696903,40.5918542401338,40.5917911939619,40.5916929706104,40.5916696887435,40.5916541661897,40.5916440092584,40.5916041841474,40.5916536881486,40.5916628859349,40.5916779051354,40.5916712137643,40.5917054109262,40.5917288122696,40.591726290866,40.5915975927682,40.5916001129938,40.5916886971561,40.5916419831331,40.5916344587678,40.5913611811785,40.5913603586684,40.5916369769959,40.5915885703906,40.5915697580716,40.5915066346912,40.5914810392866,40.5914317907456,40.5914129810017,40.5913504711831,40.5913529410094,40.5913964065531,40.591398901859,40.591239241308,40.5912367486238,40.5913345492299,40.5913420722816,40.5913379354235,40.5912929645734,40.5911997970364,40.5911665330439,40.5911363815044,40.5908094073668,40.5906999104822,40.5906091064255,40.5906154637556,40.5905275284181,40.5895461189241,40.5895313081193,40.5893265655722,40.5893303039233,40.5893117069833,40.589256258167,40.5892073401738,40.5890781513564,40.5889420667767,40.5888219542268,40.588849071569,40.5887784368194,40.5889693177816,40.588988862379,40.5889540930838,40.58876212496,40.5887708197028,40.5887512928331,40.5886795905867,40.5886698697708,40.5886235801202,40.588628541794,40.5885934130156,40.5885143863699,40.5884655204153,40.5884709063575,40.5884774471213,40.5886410797297,40.5886139158298,40.5884428251448,40.5884486290463,40.5884416160789,40.5884042986648,40.5883608666486,40.588321101382,40.5882789957141,40.5882579299451,40.5882415287279,40.5882298169219,40.5876073554742,40.5875600829038,40.5875291237003,40.5874768332291,40.5874069837847,40.5873281672295,40.5871692256316,40.587124684316,40.5870714416688,40.5870475374436,40.5868932874353,40.5868498252143,40.5867987337134,40.5868141600372,40.5869072763735,40.5869234224953,40.5868962630276,40.5869251176502,40.5870313269682,40.5870139476124,40.5869072783906,40.5868756340069,40.5869082249417,40.5869028431908,40.5868876384188,40.5868822341691,40.586890921866,40.5868855287218,40.5868304876831,40.5868572158949,40.5869553116769,40.5869798417641,40.5870356231265,40.5870552620413,40.5870875321145,40.5870950702471,40.5870838192219,40.5870906015995,40.5870818519363,40.5870615023714,40.587032490303,40.5870005883576,40.5869599998348,40.5869179560546,40.5868759288265,40.5868252892167,40.5867817283089,40.5866991622693,40.5866976939377,40.5865687912049,40.5864803613761,40.5864442590019,40.5864037173595,40.58636172267,40.5863291501996,40.5863264963894,40.5863238302567,40.5862939718823,40.5862992745232,40.5862948920627,40.586178107763,40.5861561431628,40.5861358060462,40.5860936539266,40.5861140034952,40.5861517671801,40.5861728527015,40.5861344085704,40.5861069435701,40.5858645230661,40.585870680114,40.5859174236894,40.5860500652094,40.5860453164807,40.5860251418758,40.5860157149571,40.5859923541546,40.5860154974507,40.5860065853164,40.5860403844605,40.5862594418086,40.5862541353324,40.5864000970985,40.5863982667155,40.5862701080439,40.5860991250298,40.5860439090086,40.5860207854419,40.5860261346352,40.5860012343489,40.5859941069715,40.5859592048157,40.5859210014728,40.5858926066881,40.5858659284199,40.5858124723165,40.5858124264444,40.5858035528246,40.5857197622978,40.5856573934011,40.5856003719806,40.5855469273653,40.5855024113561,40.5854668123828,40.5854185317093,40.5852957563478,40.5853615667394,40.5853792819641,40.5855290712393,40.5855575278396,40.5855753153876,40.5853398746667,40.5850713430468,40.5850192920032,40.5849783765727,40.5850414583568,40.585352647442,40.5852761547532,40.5852422945134,40.5852102225715,40.5851817136049,40.5851550284581,40.5850656342176,40.5849530767187,40.584903376891,40.5848643539804,40.5848250744776,40.5847828431806,40.5847346204372,40.5847096324114,40.5846761383218,40.5846566057423,40.5846468797561,40.5846417885912,40.5846407361673,40.5846517662773,40.5846650517936,40.5846743533238,40.5846837542238,40.5846766045508,40.5846836988751,40.584694301554,40.5847037767452,40.5847080864052,40.5847106932686,40.5847064279694,40.5846946180457,40.5846894837526,40.584677789648,40.5846596869149,40.5846337076476,40.5846287935656,40.5846157552385,40.5846118187122,40.584614774524,40.5846315973093,40.584646087547,40.5846590200997,40.5846586193133,40.5846525254128,40.5846510171256,40.5846599153094,40.584663046933,40.5846667553374,40.5846647231417,40.5846631660243,40.5846650199718,40.5846670245605,40.5846631628545,40.5846609797981,40.5846674704729,40.58468734936,40.5846943935461,40.5847096102007,40.5847178810451,40.5847181040187,40.5847281813326,40.5847416911658,40.5847401597485,40.5847427153797,40.5847435633532,40.5847413309929,40.5847471979053,40.5847553454115,40.5847634167081,40.5847732711904,40.5847792337264,40.5847805142821,40.5847777293789,40.5847808108712,40.5847815596555,40.5847823370787,40.5847871725786,40.5848064744882,40.5848176540485,40.5848178539654,40.584813160551,40.5848065873422,40.5848027254199,40.5847963813558,40.5847895364693,40.5847879556575,40.584781786494,40.584767568384,40.584762678671,40.5847662839331,40.5847722255628,40.5847677849239,40.5847475240609,40.5847311470097,40.5847140954493,40.5846976223565,40.5846878934832,40.5846776146192,40.5846725472123,40.5846732740731,40.5846786610042,40.5846743691117,40.5846745184402,40.584669075424,40.5846614718508,40.584662423032,40.5846603870543,40.5846709640895,40.5846705861854,40.5846695323776,40.5846760491165,40.5846791800451,40.5846806552338,40.5846746095924,40.5846732260333,40.5846766795762,40.5846815909558,40.5846743668986,40.5846653873912,40.5846657592661,40.5846597865538,40.5846543187103,40.5846529095493,40.584657993651,40.5846496176628,40.5846505393948,40.5846507615514,40.5846515875005,40.5846518323154,40.5846463896914,40.5846361328364,40.584646709622,40.5846520484941,40.5846493873647,40.5846415370729,40.5846289749874,40.5846047303331,40.5845875325776,40.5845750186123,40.5845799030943,40.5846044923832,40.5846314880486,40.5846462761792,40.5846615904636,40.5846716895321,40.584671262605,40.5846651666147,40.5846509724415,40.5846552048775,40.5846635767315,40.5846614675697,40.5846547703063,40.5846520594216,40.5846573964813,40.584667497122,40.5846653879121,40.5846632538404,40.5846611699435,40.5846515652375,40.5846390282843,40.5846345373673,40.5846479252323,40.5846636166019,40.5846747716754,40.5846755202546,40.5846820596949,40.5846742090305,40.5846646527365,40.5846723488669,40.5846881895486,40.5847115263479,40.5847400539912,40.5847528136471,40.5847587044899,40.5847570981955,40.5847542878211,40.5847601538456,40.5847769759168,40.5847909386307,40.584805626993,40.584822116276,40.5848287560689,40.5848283051276,40.5848301335238,40.5848371028034,40.5848469039766,40.5848509652211,40.5848580336052,40.5848750533924,40.5849074189924,40.5849109853794,40.5849071357092,40.5848957916382,40.5848920532806,40.5849035329591,40.5849017349869,40.584897896616,40.584907350654,40.5849137281667,40.584914210884,40.5849088312539,40.5849238847414,40.5849223140876,40.5849141315795,40.5849246949488,40.5849302260393,40.5849309061399,40.5849433477266,40.5849537306053,40.5849495653211,40.5849716808812,40.5849889812077,40.5850010760572,40.5850097469525,40.5850284316299,40.585045048708,40.5850561129289,40.585042943959,40.5850367065498,40.585034593897,40.5850431162911,40.5850612921161,40.5850913326035,40.585109956874,40.585099482502,40.5851490290008,40.5851512928639,40.585131281077,40.585168102723,40.5851981324227,40.5852197809199,40.5852238685948,40.585245527023,40.5852555584199,40.5852703364073,40.5852834421327,40.5852925405159,40.5853016108278,40.5853155377384,40.5853343754762,40.5853499479326,40.5853719967789,40.5853753364291,40.5853880317322,40.5854164291174,40.5854234452383,40.5854185882617,40.5854113172299,40.5853995215844,40.5853865202069,40.5853633419212,40.5853413723948,40.585331579614,40.5853218676852,40.5853186553895,40.5853167040322,40.5853220218478,40.5853428637486,40.5853624700381,40.5853734426838,40.5853986494687,40.5854124489509,40.5854237551563,40.585433134175,40.5854450076991,40.5854499924124,40.5854558775608,40.5854486851059,40.5854528728971,40.5854676745852,40.585477054062,40.5855084566338,40.5855235401427,40.5855357975252,40.5855387277719,40.5855339222619,40.5855352337654,40.5855397311119,40.5855548160084,40.5855653753518,40.5855776338463,40.5855797152481,40.5855765287412,40.5855834668558,40.5855964952804,40.5856079039803,40.5856136610872,40.5856197187679,40.5856161226201,40.5856303765757,40.5856088819961,40.5856279149058,40.5856159823474,40.5856195268637,40.5856445406409,40.5856766828211,40.585674276144,40.5856575802178,40.5856563652792,40.5856837463914,40.5856813245281,40.5857099068992,40.5857075033162,40.5857369821111,40.5846661618891,40.5845251540852,40.5844232681167,40.584077310797,40.5840621972455,40.5840069337284,40.5839019751362,40.5838300257755,40.5837551948854,40.5837173473468,40.5837138022341,40.5837090024076,40.5837136828037,40.5837307998489,40.5837328958707,40.5837591122947,40.5837843485854,40.5838105496045,40.5838732362516,40.5838744269389,40.5839536177232,40.5840259719442,40.5841398649231,40.5842080591651,40.5842315336653,40.5842325662829,40.5842334352726,40.584122815037,40.5833988086255,40.5832736926518,40.5832540183865,40.5832283218277,40.5831968277828,40.583159811778,40.5831175976484,40.583070554704,40.5830297370686,40.5829862880058,40.5829407762032,40.5829301940827,40.58291940108,40.5829086971864,40.582898379916,40.5828887360367,40.5828800335994,40.5828725144876,40.5828663876945,40.5828618235134,40.5828587543456,40.5828583884655,40.5828572365431,40.5828553326153,40.5828527329389,40.5828495143287,40.5828457718874,40.5828416161961,40.5828371700461,40.5828325648113,40.5828279365662,40.5828234220652,40.5828075438405,40.5827927831311,40.5827589476952,40.5827529102561,40.5827530383972,40.5827531691172,40.5827588159697,40.5827821509849,40.5827841007564,40.5827286107861,40.5827432334557,40.5827157123562,40.5828104470077,40.5828117788424,40.5828774200572,40.5828770001135,40.58288537179,40.5828970053988,40.5829115885519,40.5829219840521,40.5829333077863,40.5829452740036,40.5829575807401,40.5829699174389,40.5829819727869,40.5829934425703,40.5830040373523,40.5830134897758,40.5830150602646,40.5830174023055,40.5830204490151,40.5830241133857,40.583028290771,40.5830328618739,40.5830376961534,40.583042655553,40.5830478341461,40.5830526309486,40.5830569220396,40.5830605965627,40.58306355959,40.5830657345746,40.583082861252,40.5830999174631,40.5831053123198,40.5831089294249,40.5831106862004,40.5831105425392,40.5828697689353,40.5829185099782,40.5829613846996,40.5829259822475,40.5829435116021,40.5831111246186,40.5830205526583,40.5830171008412,40.5830105128434,40.5830009714811,40.5829887415259,40.5829741623575,40.582954585985,40.5829383997134,40.5829258381222,40.582919267412,40.5829175137313,40.5829206105132,40.5829284987191,40.5829410279652,40.5829460206743,40.5829494430204,40.5829512086188,40.5829512729034,40.5829496342514,40.5829463340247,40.5829391494307,40.5829375153692,40.5829414556924,40.5829509128842,40.5829657489002,40.5830147683023,40.5830313016941,40.5830587172603,40.5829645880439,40.5829671841773,40.5829797988935,40.5830942587381,40.5831102051843,40.5831390336737,40.5831525112819,40.5831654136289,40.5831249063024,40.5830201738323,40.5830969768703,40.5832178227645,40.5832429136836,40.5832539643878,40.5832750931892,40.5832548419039,40.5832539819588,40.5831526997929,40.5831535307011,40.5830194244126,40.5830211155521,40.5831519469038,40.5831559766932,40.5832775098497,40.5832775361669,40.5833130135419,40.5833144745385,40.583313468286,40.5833100211601,40.5833042235167,40.5832962273231,40.583286242175,40.583274529802,40.5832613972077,40.583247188622,40.5831839241283,40.5831812347393,40.5830592097459,40.5830602473431,40.5830093840605,40.5830009035584,40.5830000555913,40.5829761532149,40.5829793645221,40.5830054701534,40.5830111980704,40.5830116389341,40.5830047158509,40.5829487458329,40.5829466719949,40.5829520068768,40.5829504019046,40.5829576487865,40.5829869442244,40.5829797213591,40.5830046027029,40.5830029556755,40.5830097333418,40.58301909695,40.5830195383157,40.5831790512011,40.583163620918,40.5832214552797,40.58324050559,40.58324262903,40.5832303264113,40.5830660483288,40.5830661730295,40.5830266280393,40.5830162726738,40.5830155047848,40.5829949882178,40.5829946157726,40.582994449866,40.5829935577815,40.5829924620038,40.582992286305,40.5829913523961,40.5829911658764,40.5829909421266,40.5829722124067,40.5829779823202,40.583028323121,40.5830846994781,40.5830962682841,40.5831153202156,40.5831037757474,40.5831263919655,40.5831258725994,40.5830276797402,40.5830165167928,40.5830160194714,40.5830270659881,40.5830658570373,40.5830660635834,40.583233272364,40.5832354716259,40.5833297556946,40.5833467301642,40.5833488415083,40.5833404813011,40.583292818456,40.5832930939586,40.5833439671649,40.5833404789952,40.583116810717,40.5831168891333,40.5832795671417,40.5833411982782,40.5833379849913,40.5831778972712,40.5831644281751,40.583159141718,40.5831420842691,40.5831413449073,40.5831063672281,40.5831030049252,40.5830670217975,40.5830709378755,40.5830948380413,40.5830894538288,40.5830840648289,40.5831050398753,40.583137951556,40.5831394215039,40.5831649393669,40.583167268735,40.5833332150545,40.5833314462505,40.5831705356922,40.5831749723772,40.5833313340955,40.5833299305892,40.5833282255735,40.5832821364508,40.5832741176293,40.5832228621096,40.583213545574,40.5831590626892,40.5831491470539,40.5831147703437,40.5830873688107,40.5830881303294,40.5830936815741,40.5830938507278,40.5830872204,40.5830929753205,40.5830750691843,40.5830747962874,40.5830733530119,40.5830731730913,40.5830724900906,40.5830722889293,40.5830709163238,40.5830706975949,40.5830691323532,40.5830689072963,40.5830676813102,40.5830674562737,40.5830661068271,40.5830658055674,40.5830857907708,40.5830859768912,40.5831152407754,40.5831422724679,40.583154205896,40.5831954300086,40.5832069479591,40.5832052957653,40.5833283411957,40.5833276247321,40.5833024373269,40.5833024065313,40.5831229505862,40.5830876070798,40.5830912429559,40.5830756128176,40.5830746032367,40.5830739208197,40.5830736288219,40.5830723542197,40.5830712744719,40.5830707479564,40.5830703619062,40.5830854976952,40.5830883384156,40.5831233778349,40.583255342473,40.5833023064367,40.5832992274681,40.5832751161419,40.5831652834732,40.5831631108322,40.5831411412236,40.5831280240701,40.5830947766998,40.5831001799391,40.5831035324549,40.583090465205,40.5830990030751,40.5831132222253,40.5831293045491,40.5832636034395,40.5832985048831,40.5833013793596,40.5833367567982,40.583336626848,40.5833401474762,40.5835287364466,40.5835180832994,40.5836075559394,40.5835144761709,40.5831104237825,40.5831066795509,40.583508797614,40.5834921294643,40.5831273475165,40.5831228165721,40.5834896626333,40.5834710143611,40.5831345452144,40.5831308202111,40.5833370459805,40.583467754266,40.5834720091104,40.5831455739096,40.5831447188316,40.5834799516466,40.5834966260877,40.5831582912183,40.5831594248777,40.5835078044099,40.5835213782442,40.5831650445303,40.5831642348436,40.5835290521104,40.5835448750614,40.5831825185673,40.5831819316505,40.5835526626103,40.5835686852054,40.5831946402303,40.5831941044348,40.5835631525925,40.5835504676142,40.5832069407133,40.5832051680801,40.5835460332497,40.5835331820719,40.5831911918711,40.5831881009795,40.5835281953624,40.5834885962583,40.5833614377891,40.5832872646997,40.5831992651802,40.5830771769272,40.582988198261,40.582674343321,40.5826082108863,40.5820027496335,40.5820411460895,40.5820877271463,40.5821220959711,40.5822021954906,40.5822848078473,40.5823194010667,40.5822574839936,40.581996337616,40.5818004714696,40.5816154610821,40.5814292769107,40.5812591126834,40.5810562678324,40.5809955895593,40.5810046991626,40.5810193276454,40.5810333073843,40.5810541456304,40.5810683712786,40.581082852585,40.5810970957244,40.5811186541569,40.5811329257421,40.5812139890525,40.5812137358118,40.5812041376132,40.5811992769017,40.5811837895578,40.5813032767537,40.581303817021,40.5812213962226,40.5812106189632,40.5812293479839,40.5812301614114,40.5812203162711,40.5812205789826,40.5812326156076,40.58123317234,40.581193564408,40.5811946945556,40.5812129031722,40.5812153888693,40.5811648015251,40.5811623138186,40.5811845991348,40.5811834662258,40.5811320416059,40.5811446754172,40.5812814096513,40.5812836300748,40.5811451702622,40.5811457673611,40.5812837393372,40.5812860004732,40.5811484825206,40.5811474186865,40.5811984307363,40.5812372255851,40.5812692884731,40.5812767194712,40.5812647412035,40.5812400949458,40.5811960428421,40.5811469881365,40.5809712045966,40.5795418689227,40.5795210103254,40.5789586977327,40.5786804710955,40.5781788611469,40.5781708096787,40.5762659200969,40.5761631002208,40.5757009704299,40.5756605051268,40.5755899192009,40.5755657030523,40.5755318766133,40.5755277966682,40.5755154854877,40.5754853535459,40.5752216459977,40.5752264125888,40.5754356213388,40.5755094660102,40.5755969919202,40.5757272162725,40.5758424779582,40.5758604963564,40.5758192014433,40.5757724059501,40.5757227159583,40.5756227100842,40.5754284594975,40.5754235798471,40.57542020375,40.5754184272004,40.5754183007119,40.5754198278808,40.5754229652845,40.5754276237157,40.5754276610819,40.5755377945616,40.5755424016992,40.5755466808231,40.5755505172156,40.5755538080276,40.5755564650366,40.5755584170115,40.5755596116223,40.5755600168429,40.5755596218098,40.5755584371135,40.575556494514,40.5755317509135,40.5754880775628,40.5753735545318,40.5753821334367,40.5753918275846,40.5754023909897,40.575413555609,40.5754250381437,40.575436547228,40.5754473939339,40.5754577381075,40.5754673357943,40.5754759606444,40.5754834092513,40.5754895059486,40.575494106953,40.5755095118322,40.5755239035442,40.5755369013961,40.5755481615656,40.5755573861955,40.5755643312737,40.5755688130866,40.5755707130803,40.5755987880105,40.5756324663809,40.575676774845,40.5757202853315,40.5757489306385,40.5757728599584,40.5757896585766,40.5758010203754,40.5758066285627,40.5758064587654,40.5758005117216,40.5757888132769,40.5757714142722,40.5757567386283,40.5757382191423,40.5757162255022,40.5756911967471,40.5752934962107,40.5752690239823,40.5752663910593,40.5752636740749,40.5752609404769,40.5752582581253,40.5752555186664,40.5752528074915,40.5752501808339,40.5752476931739,40.5752453961087,40.5752408535587,40.5752375125227,40.5752354694497,40.5752352415627,40.5752357686018,40.5752370354291,40.5752390056582,40.5752416226989,40.5752617836983,40.5754463218017,40.5754838165848,40.57551372794,40.575538831992,40.5755570708675,40.5755683968184,40.575572780194,40.5755740357083,40.5755695787903,40.5755594397377,40.5755436874751,40.575522429085,40.5754958090802,40.575465657091,40.5754301639771,40.5753900065585,40.5753459505975,40.5752988361962,40.5752495617761,40.5751990669463,40.5751897112471,40.5752120177214,40.5751989335994,40.5751392595472,40.5751154323094,40.5750194263575,40.5750201172281,40.5750173285209,40.5750154403443,40.5750051840311,40.5749808721268,40.5749072886988,40.5748082236792,40.5747782042115,40.574689679863,40.5746499873339,40.5745516247391,40.5745621250408,40.5745595684338,40.5745335290625,40.5745205991529,40.5745205790298,40.57449199819,40.574460789116,40.5744243779154,40.57442444198,40.5744236266809,40.5744153402515,40.5743836659636,40.5743114469378,40.5742470492427,40.574204123507,40.5742008178708,40.5742417789995,40.574282902709,40.5742918898418,40.574294194837,40.5742965237054,40.574297232242,40.5742876437104,40.5742714772719,40.5742429086527,40.5742663170418,40.5742376225675,40.5740862971805,40.5740732721833,40.5741019825775,40.5742872331488,40.5743332674952,40.5757313370186,40.5758239808958,40.5767767492972,40.5773223573752,40.5774023122719,40.5784262863019,40.5791953984781,40.5795999594223,40.5806220917602,40.5816092361719,40.581680175764,40.5817534514838,40.5818251615806,40.5819168291301,40.5819689052405,40.5824478328215,40.5824805112151,40.582520165018,40.5825576242703,40.5825643168187,40.5826099228921,40.5827362543198,40.5826588505552,40.5828349700306,40.5828863086475,40.5829339794608,40.5829822625409,40.583035332417,40.583045726525,40.5830422708163,40.5830251348804,40.5830127880024,40.5828521516095,40.5828566752126,40.5831905458519,40.5832698724066,40.5834083571591,40.5835758970392,40.5842250311678,40.5845146628378,40.5846089594208,40.5846760046288,40.584746283206,40.5847918749835,40.5848270810659,40.5850293078417,40.5851490325848,40.5858127232536,40.5859683662622,40.5861247709756,40.5862810895005,40.5864364684721,40.5865147235995,40.587306286074,40.5880343523024,40.5887238198211,40.5894529116476,40.5892388640036,40.5891365659574,40.5890411764382,40.5889186179983,40.5888871750408,40.5888680664891,40.5888563457395,40.5887932710085,40.588738199577,40.5886808231431,40.5886314236517,40.5885285776684,40.5884266603017,40.5883219257882,40.5882220731785,40.588118774307,40.5879546107953,40.587941518708,40.5887089520017,40.5895773364773,40.5900172593661,40.5901061899912,40.5906406890456,40.5910645882994,40.591452646914,40.5919219335133,40.5919776507471,40.5921865378584,40.5924585327202,40.5925383440452,40.5925882793623,40.5926539529476,40.5928133880796,40.5929764216716,40.5930127592894,40.5932165610171,40.5933140021166,40.5933472320641,40.5935061546723,40.5935416487985,40.5936208352135,40.5936653067229,40.5939323051821,40.593997228133,40.5941369339831,40.594763406169,40.5954145396838,40.5958210782172,40.595884931775,40.595987010813,40.5960879017296,40.5961915417464,40.5962975233277,40.5963527300793,40.5963948531317,40.5965064534207,40.5966161089621,40.5967192064316,40.5967800269532,40.5967935381629,40.596882943568,40.5969788180569,40.5977905214336,40.5985187857771,40.5989099600676,40.5993158037006,40.6017943730231,40.6026170545397,40.6033481188611,40.6041947115372,40.6056518901444,40.6066715333735,40.6086295077702,40.6088141418023,40.6089359216909,40.6090497192104,40.6091504768934,40.6092531931632,40.6093891895262,40.6094031552795,40.6094177874826,40.6094596075738,40.6095552138141,40.6096744010222,40.6097764261755,40.6098786579925,40.6099863745259,40.6100988747117,40.6102015073052,40.6103020533396,40.6104030309351,40.6104627624443,40.610503715219,40.6106118778289,40.6107148274562,40.6108207661552,40.6109498656061,40.6111122395891,40.6113131859999,40.6113473439651,40.6113756569322,40.6114081679081,40.6114448062977,40.6114854926219,40.6115301384506,40.6115786468387,40.6115902447675,40.6123157278494,40.6130532176678,40.6136353579565,40.6140777104131,40.6142246005537,40.6147891311372,40.6153634067567,40.6160462091094,40.6158885305079,40.614803772404,40.6140808069615,40.6134117379848,40.6127225384378,40.6119928417343,40.6119194575028,40.6108564298636,40.609229317663,40.6075994773071,40.6074332974761,40.6069219435036,40.6070004560576,40.6065878610635,40.6061952096804,40.6059738630588,40.605497900603,40.6038731622438,40.602230711367,40.6026872808249,40.6010620694992,40.5994373827175,40.5977779281458,40.5973232949648,40.5971073036215,40.5968202649194,40.5960204511543,40.5950607791786,40.5941043148464,40.5931487882873,40.5921842516915,40.5918723492592,40.5914953697973,40.5912119158327,40.5903082078847,40.5890956514713,40.5879872778977,40.5866068549255,40.5865703350048]}]],[[{"lng":[-73.8260033749814,-73.8260600322682,-73.8263823750347,-73.8272072076456,-73.8289485211392,-73.8299041641565,-73.8305930643839,-73.8307132655342,-73.8308991069618,-73.8311564582916,-73.8315008443802,-73.8332165272826,-73.8333952937598,-73.8334783794503,-73.8335689574767,-73.8336425620393,-73.8341630764937,-73.8349471756521,-73.835900721417,-73.8359770711086,-73.836005107525,-73.8360278645999,-73.8361147658281,-73.8364085761741,-73.8364088015291,-73.8364090261818,-73.8367163908027,-73.8367166161094,-73.8367168530655,-73.8370366930364,-73.8370368821731,-73.8370370836197,-73.83736817904,-73.8377089419937,-73.8380575612948,-73.8395231273259,-73.8397243990885,-73.8397802516746,-73.840191993236,-73.8402420632721,-73.8406915419902,-73.8413393660909,-73.8426306799134,-73.8427189027115,-73.8429909127847,-73.843146253013,-73.8432588089117,-73.8434863043221,-73.8435697335957,-73.8438182573482,-73.8441728125617,-73.844537388464,-73.8449101116967,-73.8452889856384,-73.8456719821516,-73.8461595844368,-73.8466572411161,-73.8476241018882,-73.8485783880685,-73.848767252333,-73.848957126142,-73.8491459157301,-73.8493315621403,-73.8495120740421,-73.8504290537064,-73.850590510987,-73.8511012167543,-73.8526822571381,-73.852753706286,-73.8547165251997,-73.854699434123,-73.8547082395536,-73.854112647798,-73.8539610547933,-73.8539215421986,-73.8538948015939,-73.8537121987122,-73.8530566390123,-73.8525201905444,-73.8526653541771,-73.8551810971139,-73.8552927590464,-73.8553183028424,-73.855350187959,-73.8554283910726,-73.8553942350219,-73.8554395493513,-73.8555667831852,-73.8555977094858,-73.8556258725154,-73.8557145429801,-73.8558129540011,-73.8559200537607,-73.8567325773891,-73.8574306238659,-73.8581251154846,-73.8581773669283,-73.8582327984575,-73.858276818239,-73.8583290923231,-73.8584221083407,-73.858511660872,-73.8585976714024,-73.8586800647054,-73.8587587683495,-73.8588337133272,-73.8589277465738,-73.8590106373112,-73.8590819836905,-73.8591414922119,-73.8591948564638,-73.859202767927,-73.8592385824414,-73.8592636325765,-73.8592851159699,-73.8593868164633,-73.8594845604181,-73.8595394885174,-73.8595585851161,-73.8596250536085,-73.8596351660726,-73.8596636207086,-73.8597158631146,-73.8597534605845,-73.8597761798592,-73.8597838926762,-73.8597766601653,-73.8597593286286,-73.8597131364884,-73.8596606676163,-73.8596541683763,-73.8596425479584,-73.8596351129799,-73.8596361698067,-73.8596403110687,-73.8596890729929,-73.8597535876575,-73.8598335677945,-73.8599285549996,-73.8600378987578,-73.8606266329048,-73.8612240638327,-73.8615288665559,-73.8618336832683,-73.8621363821695,-73.8624254052537,-73.8627219509845,-73.8630185014243,-73.8635711113709,-73.864122975782,-73.8646872952352,-73.8652387061175,-73.8654761087032,-73.8660417615264,-73.8665724107751,-73.8671140456211,-73.8673090828058,-73.8676592737985,-73.8682106853056,-73.868453052108,-73.8687681732168,-73.8692721567242,-73.8692927042302,-73.8693102591821,-73.8697076535123,-73.8702113590573,-73.8706318513309,-73.8707456101135,-73.8708453942418,-73.8709308131908,-73.8710015610708,-73.8710112740359,-73.8711328338978,-73.8714098075705,-73.8714607424957,-73.8715474999877,-73.8723522953997,-73.8731694263047,-73.8740891317392,-73.8747547553187,-73.8749534951893,-73.8750915415561,-73.8747941417987,-73.8739739307465,-73.8731552720696,-73.8719205840257,-73.8714980070648,-73.8713430983512,-73.8712894048577,-73.8711223138123,-73.8710036316108,-73.8708649277179,-73.8693205085695,-73.869048387312,-73.8686094929539,-73.8684520354003,-73.868358533074,-73.8683180682867,-73.8682776151747,-73.8681058228117,-73.8679258648825,-73.8668280126407,-73.8658127061575,-73.8652477262981,-73.8649174897845,-73.8644708631116,-73.8627137642276,-73.8618182828136,-73.8616234186756,-73.8608717262406,-73.8604098922744,-73.8598592561211,-73.8593087683014,-73.8587246582933,-73.8586201644993,-73.8580176767162,-73.8566154109635,-73.8562856771093,-73.8556742771729,-73.8550508341339,-73.8541541809969,-73.8534013654509,-73.8524444347591,-73.851870674825,-73.851303526722,-73.8508760633661,-73.8507921646086,-73.8499544028441,-73.849564537853,-73.8485944796045,-73.8480129526487,-73.8475082034414,-73.8474631403263,-73.8473249412528,-73.8472136158788,-73.8468936619367,-73.8468393008462,-73.8467488196996,-73.8466465279918,-73.8464697015221,-73.8462333963283,-73.8459109394777,-73.8457582230802,-73.8456572550948,-73.8455644785115,-73.8454708956663,-73.8453836038644,-73.8453373978708,-73.8451446608186,-73.8450402111655,-73.844889056903,-73.8448547787918,-73.8448007955778,-73.8447467583562,-73.8447001317296,-73.8446759558276,-73.8445870704429,-73.8445141563524,-73.8444276585073,-73.844414828606,-73.8443543461236,-73.8442858422926,-73.8440792158507,-73.8437157627912,-73.8428458257842,-73.8427332863079,-73.8421224808986,-73.8414823138433,-73.8410026100729,-73.8405500384892,-73.839816503714,-73.8392009389378,-73.8392513141897,-73.8389995352069,-73.8389439796301,-73.8385970230017,-73.8382130123722,-73.8381325114004,-73.8378878855251,-73.837768570241,-73.8374927999677,-73.8373131229336,-73.8369773580296,-73.8360848440056,-73.8359713964449,-73.8358295092665,-73.8355481993605,-73.8341282331352,-73.8337588817707,-73.8327834605997,-73.8323212642399,-73.8318530552326,-73.8315524583811,-73.8313846950791,-73.8310200977168,-73.8306794998131,-73.8304290241852,-73.8297627450989,-73.828987611965,-73.8280832069699,-73.8277641290058,-73.8276286915821,-73.8275075320579,-73.8271407670679,-73.8263960468184,-73.8262502018818,-73.8261209530947,-73.8260033749814],"lat":[40.715413630791,40.7153993486023,40.7153106753392,40.715073713355,40.7146487412239,40.7144186894738,40.7142370635617,40.7142082424194,40.7141656017704,40.7140976747921,40.7139877114039,40.713070986944,40.7130079305458,40.7129629515836,40.7129169758843,40.7128670594696,40.7125916402772,40.7121627281736,40.7116413707688,40.7117059569769,40.7117296715407,40.7117490639129,40.7118251468743,40.7116417697625,40.7116416261768,40.7116414996779,40.7114703162521,40.7114701919314,40.7114700753335,40.7113118036555,40.7113117050822,40.7113116142325,40.7111669287835,40.7110364842713,40.7109208727847,40.7104964514565,40.7103987655874,40.7103855240801,40.7102768294158,40.7102619316906,40.7101532140614,40.7099462343632,40.7094329772343,40.7093980733765,40.7092869276406,40.7092234564188,40.7091681796368,40.7090557752932,40.7090196089831,40.7089118196223,40.7087784213437,40.708661054971,40.7085603313705,40.7084766794978,40.7084103661249,40.708350820549,40.7083186423409,40.7083326229842,40.7084387208288,40.708444578931,40.708438137523,40.7084193204789,40.7083883336808,40.708345661375,40.708087067055,40.7080398834242,40.7079009830216,40.7074181453227,40.707397147062,40.7067694963278,40.7067425546217,40.7052109741452,40.7044259340715,40.7042642171313,40.7042246126051,40.7041834191978,40.7039178878835,40.7031370466141,40.7022917236176,40.7023076309691,40.7025832673792,40.7025955017877,40.7026730950705,40.7030131506169,40.7033181986624,40.7033486380369,40.7034874101538,40.7036805227357,40.7037262256514,40.7037534210224,40.7038428266498,40.703926400887,40.7040032402576,40.7045614742863,40.7050346140336,40.7055135695479,40.7055496042367,40.705591689885,40.7056361659763,40.7056817265627,40.7057697131799,40.705859756802,40.7059517784979,40.7060456977616,40.7061414321087,40.7062388976188,40.7063924788172,40.7065500158478,40.7067107912256,40.706874064142,40.707053550507,40.707092043384,40.7072727451099,40.7075034553001,40.7076759187473,40.7084923136751,40.7092625701052,40.7096858418024,40.709850568005,40.7103461644909,40.7104216041147,40.7106212108104,40.7108208540233,40.7110228860619,40.7112263569445,40.7114303226755,40.7116338113396,40.7118450597847,40.7126055390835,40.713294646745,40.7133799614124,40.7134931446792,40.7139199103773,40.7139781313718,40.7140092192411,40.7142002939749,40.7143892338106,40.7145749229762,40.7147562704477,40.714932235724,40.7154871695649,40.7160373287648,40.7163149367086,40.7165925433462,40.7168767739987,40.7171481470524,40.7174280189449,40.7177078818569,40.7182766798916,40.7188448079169,40.7194270756022,40.7199767100267,40.7202809377529,40.7209009226014,40.7214866374512,40.722076403898,40.7222890245247,40.7226612566289,40.7232547486383,40.7234854940857,40.7238209071637,40.7244118357159,40.7244359294742,40.7244659908253,40.7251464341414,40.726187326382,40.7270588540253,40.7272695393737,40.7274845934406,40.7277032066697,40.7279245240285,40.7279576114015,40.7283717202997,40.7291781024809,40.7293263741385,40.729362383331,40.7296554848453,40.7299506191985,40.7302827923819,40.7305418917538,40.7306186957731,40.7306713632197,40.73075902678,40.7310032586413,40.7312439698152,40.7316139287872,40.7317505866538,40.7317993571146,40.7318162618719,40.7318715290089,40.7319056836445,40.731945599399,40.7324275432278,40.732513917941,40.7326531766484,40.7327133755154,40.7327401590446,40.7327536202895,40.7327670716494,40.7328262545154,40.7328725692482,40.7332457802965,40.7335838624784,40.7337622492319,40.7338665100468,40.7340072749305,40.734515053656,40.7347700602051,40.7348299731497,40.7350610856848,40.7352012602527,40.7353683856855,40.7355361283473,40.7357086441965,40.7357399071036,40.7359070835274,40.7363308371852,40.7364260425055,40.7365866581536,40.7367202216232,40.7368778133413,40.7370027582791,40.7372023129819,40.7373429291861,40.7375117275426,40.7376538599343,40.7376817560216,40.7379603043543,40.7381060928986,40.7385011710633,40.7387633444713,40.7390078070401,40.7389520315271,40.738771458077,40.7386439866839,40.7386712173942,40.7386692172142,40.7386517895016,40.7386170463539,40.7385394936967,40.7384358454849,40.7383070554127,40.7382068853172,40.7381174010484,40.7380022823602,40.7378732219504,40.7376091837968,40.7372777246965,40.7365109346524,40.7360953800625,40.7359115813815,40.7357514698091,40.7355428032014,40.7353625649347,40.7352081275373,40.7351123447011,40.7348797047254,40.7347031782081,40.7344980961156,40.7344712706516,40.7343447928451,40.73420144745,40.7338478000143,40.7332257299461,40.7320676427423,40.7319508736962,40.7313444363489,40.7307390894366,40.7302788999448,40.7298447299081,40.7290373869242,40.7282668630292,40.7281505773919,40.7277181914947,40.7276227839533,40.727026933597,40.7263674373549,40.7262015444086,40.7256974322974,40.7254339130347,40.7251278510906,40.724730158029,40.7240710603013,40.7226969573175,40.7225390861344,40.7223417181508,40.7219700249877,40.7202305328989,40.7198382960155,40.7188024294399,40.7183298975857,40.7179121433042,40.7176805628081,40.7175513171202,40.7173317240276,40.7171790647029,40.7169627709355,40.7167236830895,40.7165209811477,40.7162735966687,40.7161776325886,40.7161368980159,40.7161004581287,40.7160068511739,40.7156552145362,40.7155650238481,40.7154925266357,40.715413630791]}]],[[{"lng":[-73.9801716110372,-73.9802062856975,-73.9802064507635,-73.9802065458748,-73.9802271035243,-73.9802271618675,-73.9802271619049,-73.9802290135527,-73.980229025947,-73.9802289430904,-73.9802101227924,-73.9802100522445,-73.9802099218457,-73.9801720977647,-73.9801720148655,-73.9801718613518,-73.9801201271727,-73.9801199153776,-73.9801196428517,-73.9800602537324,-73.9800013861361,-73.9800011389069,-73.9800008903387,-73.9799268238399,-73.9799267048356,-73.9799265629445,-73.9798426188445,-73.9798422756669,-73.9798419793285,-73.9797570839648,-73.9797568353644,-73.9797565750851,-73.979680495715,-73.9796803298229,-73.9796801993435,-73.9796202571621,-73.9796200437267,-73.9796198663508,-73.9795787009564,-73.9775117140598,-73.9751573810001,-73.9744823403471,-73.9743670129249,-73.9742673549582,-73.9741845752545,-73.9741845515246,-73.9741195339228,-73.9740728354952,-73.9740728117791,-73.9740727874031,-73.9740445824795,-73.9737918996636,-73.9735549395919,-73.9732662806725,-73.9730510359984,-73.9726828851762,-73.9724290563281,-73.9723690104418,-73.972328462881,-73.9722222860573,-73.972088461074,-73.9720358499465,-73.9719089031181,-73.9715593035278,-73.9713963168815,-73.9722987063983,-73.9729390213175,-73.9730363553095,-73.9730365095256,-73.9730366868249,-73.973147506463,-73.973147600175,-73.9731476945395,-73.9732667358651,-73.9732668900588,-73.9732670673364,-73.9733876020281,-73.9733878261546,-73.97338805027,-73.9735039685979,-73.9746571434982,-73.9747284787882,-73.9748640363946,-73.9749587331438,-73.9750352598249,-73.9751731459734,-73.9752721343549,-73.9763353546432,-73.9772631110038,-73.9781907435932,-73.9791182187705,-73.980291154772,-73.9813288763919,-73.9818053385719,-73.9823093975949,-73.9830734007398,-73.9852841274358,-73.9883498667103,-73.9890587239361,-73.9918082348231,-73.99392923789,-73.9960456530866,-73.9962531437978,-73.9968137289788,-73.9970221625663,-73.9973004251067,-73.9978828574525,-73.9984657784391,-73.9990477303076,-73.9996388598532,-74.0002142135508,-74.0007978693591,-74.0013799010446,-74.0019597833134,-74.0025448697904,-74.0031251337937,-74.0037124585813,-74.0042940983291,-74.0048763207071,-74.0054578234326,-74.0060415268045,-74.0066225945808,-74.0072059128772,-74.0077879438202,-74.0083757478107,-74.0089527434016,-74.0095570830591,-74.0101605728009,-74.0105038368618,-74.011069092807,-74.0132448956053,-74.016067907324,-74.0187832339203,-74.0193110334044,-74.0195531816618,-74.0197129379459,-74.0200572173502,-74.0202929162027,-74.0205426995401,-74.0207733057556,-74.0209074004978,-74.021052986947,-74.0210873117535,-74.0211293325644,-74.0212079281793,-74.021281085446,-74.0213486517288,-74.0214104860531,-74.0214664593663,-74.0215164548883,-74.0215603682944,-74.0215981079466,-74.0216494666172,-74.0217543256647,-74.0219243974276,-74.0226109861283,-74.0229700932488,-74.0231059320848,-74.0232178021328,-74.0233168302438,-74.0234008536295,-74.0234682183412,-74.0234820367263,-74.0235178724573,-74.0235493908876,-74.0245735491043,-74.0246145327845,-74.0246637088286,-74.0257237706746,-74.0260978906359,-74.0320095332724,-74.032310843001,-74.0322687086582,-74.0322068984165,-74.0319785715731,-74.0318970849434,-74.0315976260735,-74.030518308634,-74.0290809088578,-74.0289976246877,-74.0291541899453,-74.0288624112706,-74.0288215975196,-74.0290914223967,-74.0290865428924,-74.0289695821108,-74.0285011625061,-74.0284254329046,-74.0282313430966,-74.0281905304934,-74.0284572109578,-74.0282056954501,-74.0277529818688,-74.0270343422336,-74.0260494840032,-74.0295471450287,-74.0297407821107,-74.0293899048662,-74.0291918306938,-74.0257175880481,-74.025381492653,-74.0250711143009,-74.0248395740679,-74.0246739634487,-74.0246148710311,-74.0243549693672,-74.0241456605057,-74.0251291195524,-74.0249679211714,-74.0255386457804,-74.0248443636344,-74.0252058118758,-74.0254155392946,-74.026051331968,-74.0258711376465,-74.0259280762528,-74.0257763316196,-74.0256909392053,-74.0255297154366,-74.0249112284902,-74.0250899910507,-74.0250773928451,-74.0251025719024,-74.0247716049567,-74.0245232805539,-74.0244880117486,-74.0244607759947,-74.0242891936496,-74.0242717304795,-74.0242402134753,-74.0255013904574,-74.0254160402859,-74.024177529734,-74.0238234739506,-74.0236544314197,-74.0235940029519,-74.0230599104703,-74.0230246483789,-74.0230201211284,-74.0228514179598,-74.0253689015052,-74.0252266297266,-74.0227237279578,-74.0226216193613,-74.0215413831922,-74.021344612879,-74.0212816342104,-74.0212465237341,-74.0212756487398,-74.0212756055027,-74.0213918821067,-74.0213595992164,-74.0212433243841,-74.0211852136861,-74.0211270778384,-74.0210523039221,-74.0213447436049,-74.0223373466683,-74.0222517319971,-74.0212641650561,-74.0209826122586,-74.0208986287083,-74.0209196747743,-74.0238070390313,-74.0235943449756,-74.0235343016559,-74.0233317465083,-74.0230992368154,-74.0229417228345,-74.0228892024582,-74.0228516750451,-74.021959000906,-74.0218690007394,-74.0217115188828,-74.0216215336762,-74.0212316545623,-74.0211867002789,-74.0232046472714,-74.0230621908923,-74.0221019516247,-74.0219369456161,-74.0218769355821,-74.021629462955,-74.0212845599841,-74.0212396106939,-74.0211496348449,-74.021824797455,-74.0216448641538,-74.020894697976,-74.0206396915899,-74.0206021818395,-74.0206021447956,-74.0204746182018,-74.0202421137104,-74.0200245922269,-74.0196195817725,-74.0194170284424,-74.0192520337412,-74.0191920302542,-74.019244507545,-74.0191769896448,-74.0190494830419,-74.0189669806886,-74.018921950883,-74.0188544172947,-74.0187718830647,-74.0187268658868,-74.0186223830856,-74.0181189787649,-74.0202558905293,-74.020051824543,-74.0178740722382,-74.0171531958103,-74.0174663345374,-74.0174189133139,-74.01980081652,-74.0197059641023,-74.0172671593659,-74.0169161785107,-74.0166504795976,-74.0163943753378,-74.0191084380312,-74.0189092362524,-74.01860569461,-74.0158537005682,-74.0154363226965,-74.0177423272749,-74.0176664440952,-74.0178657310968,-74.0176854917547,-74.0174862043472,-74.0175051641058,-74.0150473822186,-74.0149364589416,-74.0144213048455,-74.017458030879,-74.0166763665645,-74.0155416538901,-74.0140042839242,-74.013662739926,-74.0124685144183,-74.0118386205655,-74.0114221956705,-74.0111075041031,-74.0140224767802,-74.0131555493881,-74.0126535881149,-74.010234844318,-74.0085995696829,-74.0085726237899,-74.0077809596034,-74.007458581639,-74.0103720129722,-74.0104633172449,-74.0095507414204,-74.008683715913,-74.0061614113632,-74.0056859475689,-74.0055350125186,-74.0042835825012,-74.0041854573763,-74.0041462489221,-74.0042478861122,-74.0042541535357,-74.004261873855,-74.0042619105958,-74.0042788006124,-74.0043958054614,-74.004511732323,-74.0047016400148,-74.0047227489117,-74.0047522102546,-74.0047618286216,-74.0047687002363,-74.0049517259464,-74.0051236485758,-74.0051265893938,-74.0051267464898,-74.0051274776724,-74.0051410196299,-74.0052658954461,-74.0056203967066,-74.0057848663662,-74.0058271433906,-74.0058574019943,-74.0058579541624,-74.0058585741451,-74.0060381511255,-74.0062004623303,-74.0062269824792,-74.0062268410338,-74.0062250139011,-74.0060895834049,-74.0059290457147,-74.0059280206233,-74.0059236050303,-74.0054577555665,-74.0046014637946,-74.0042254917273,-74.0039133457195,-74.0038981294246,-74.0038314696353,-74.0038081547088,-74.0034880110065,-74.0038933418998,-74.0042393050174,-74.0043655675606,-74.00438799951,-74.0044659363108,-74.0045549848871,-74.0045552306069,-74.004558925644,-74.0045594850581,-74.0045599463601,-74.0045617924487,-74.0046015847354,-74.0045899436488,-74.004605743056,-74.0045436785081,-74.0047329812178,-74.0052384036559,-74.0053581286425,-74.0051559971932,-74.0050616081684,-74.0049801050689,-74.0049799343609,-74.0049785042413,-74.0049779670389,-74.0049751067993,-74.0049715775861,-74.0051923377509,-74.0051928192948,-74.0051974759056,-74.0051990760654,-74.0052001097679,-74.005201051297,-74.0052438497158,-74.0052315101843,-74.0052486303488,-74.0051862979809,-74.0053801441393,-74.005659649757,-74.0059974868269,-74.005795018362,-74.0056996374779,-74.005624151555,-74.0056221800746,-74.005620531528,-74.0056134868175,-74.0059083596535,-74.0059163835452,-74.0059177827927,-74.0059184740561,-74.0059201106916,-74.0063056732252,-74.0067283501606,-74.0074325142904,-74.0076637909847,-74.007721335067,-74.0077254519298,-74.0076743459451,-74.0076387753481,-74.0073051612683,-74.0072574263174,-74.0072661028004,-74.0072528355905,-74.0073187836599,-74.0071253264674,-74.0065246960012,-74.0067068594064,-74.0067991243028,-74.0068821530731,-74.0066293785957,-74.0065357955938,-74.0066415576674,-74.0064497998079,-74.0058415763249,-74.0060287077349,-74.0061193471018,-74.0062030658538,-74.0060460851898,-74.005992626418,-74.005921387034,-74.005898264369,-74.0058099935988,-74.0057578104549,-74.005779742958,-74.0057480923224,-74.0058232752111,-74.0057575379141,-74.0058927245943,-74.0057490883215,-74.0057414552513,-74.0057704613388,-74.005744630336,-74.0058349944877,-74.0058083297684,-74.0058492477061,-74.0058221184709,-74.0056414075448,-74.0056502595959,-74.005649251729,-74.0056431108041,-74.0056421339589,-74.0055631293286,-74.0043005326748,-74.0042950800297,-74.0042662247347,-74.0042637448154,-74.0036286250857,-74.0034034859563,-74.0045923863675,-74.0043229489738,-74.0052813217734,-74.0048619379266,-74.0011351950966,-74.0009442426561,-74.0009172343025,-74.0008340110844,-74.0007478568901,-74.0004941336115,-74.0005378069281,-74.000231413734,-74.0000302417739,-74.00007728967,-74.000099136671,-73.9998430156559,-73.9997100826993,-73.9995315260992,-74.0029246351639,-74.0022403099138,-74.0020328905917,-74.0020466706489,-74.0016195002109,-74.0012061134831,-74.0014647093271,-74.0006877486877,-73.9999814933912,-73.9995454149889,-73.9990260099839,-73.999053721827,-73.9989452019537,-73.9990263326417,-73.9990504410301,-73.99903627811,-73.9990432479231,-73.999063681498,-73.9990903918155,-73.9991754302429,-73.9991798832055,-73.9991897148097,-73.9992404910504,-73.9991533274088,-73.9990793532798,-73.9989695002465,-73.9986558069161,-73.998809725563,-73.9989116016789,-73.9989012653739,-73.9989168483876,-73.998892073152,-73.9987499149165,-73.9987125513134,-73.9985582446839,-73.9987136040983,-73.9987694105892,-73.9986810823641,-73.9986188803608,-73.9985412805443,-73.998456780805,-73.9982251003896,-73.9979893158487,-73.9978713002276,-73.9977147427698,-73.9976483710815,-73.9976184668881,-73.9975773213401,-73.9971162468849,-73.9969646512533,-73.9969298850858,-73.9968449048378,-73.9967524379256,-73.9965929918862,-73.9964028117054,-73.9940355463928,-73.991794990279,-73.99173365211,-73.991662828362,-73.989312730868,-73.9869510181568,-73.9845915735521,-73.9822303421316,-73.9801716110372],"lat":[40.6611546584779,40.6611059550012,40.661105712449,40.6611054605032,40.6610481277332,40.6610479746226,40.6610478483065,40.6609855784504,40.6609853264904,40.6609850557508,40.6609235563192,40.6609233224379,40.6609231336114,40.6608678802009,40.6608677538704,40.6608676188163,40.6608231246566,40.6608229358159,40.6608227913596,40.660790758261,40.6607576992805,40.66075756421,40.6607574922972,40.6607347322698,40.6607346965656,40.6607346866567,40.6607274411314,40.6607274147694,40.6607274504009,40.6607384667118,40.6607385023516,40.6607386016499,40.6607665944027,40.6607666568613,40.6607667380894,40.6608068638552,40.6608070082266,40.6608072145897,40.660853242154,40.6598627564165,40.658722794115,40.6583394497787,40.6581879035122,40.6580287871908,40.6578635778864,40.6578635053414,40.6576937524214,40.6575211934753,40.6575210859169,40.6575209783584,40.6573472525429,40.6563923239465,40.6556439390754,40.6546492613319,40.6539125067717,40.6526392779873,40.6517502587451,40.6515399489964,40.6513979285803,40.6510469517658,40.6506569087538,40.6504856276553,40.6500514098843,40.6488228287575,40.6482577861141,40.6479424820365,40.6476896796483,40.6476394713254,40.6476393901104,40.6476393368779,40.6476029543823,40.6476029187206,40.6476029011522,40.6475830983919,40.6475830721258,40.647583072167,40.6475809294576,40.6475809295095,40.647580957036,40.6475956805563,40.6477643729061,40.6477737093756,40.6477857238903,40.6477954978785,40.6478033942094,40.647817625097,40.6478306045699,40.6477261421713,40.647627336523,40.6475259915112,40.6474280612562,40.6472971614313,40.6471816727075,40.6471277997649,40.6469274038084,40.6466251347049,40.6457679387295,40.6445622438873,40.6441192410392,40.6457839691121,40.6470693112323,40.648340654929,40.6481749762339,40.6477104242787,40.6475377922889,40.6472720195273,40.6467185290791,40.6461592271116,40.6455973458957,40.6450418872787,40.6444782999913,40.6439175471607,40.6433567536584,40.6427987386857,40.6422357596208,40.6416745415814,40.6411158515382,40.640556240282,40.6399954645496,40.6394351358499,40.6388773342414,40.6383148016311,40.6377545819896,40.6371955287901,40.6366365576289,40.6360750812267,40.6354929641312,40.6349123382514,40.6345790963294,40.6347410636714,40.6353974741061,40.6361384510949,40.6369602855955,40.6370978064117,40.6372013433337,40.6372314829131,40.637437238496,40.6375973527029,40.6377745918535,40.6379594688674,40.6380803058091,40.6382266915978,40.6382635879785,40.6383087446018,40.6383981061366,40.6384901083802,40.6385845594067,40.6386812621815,40.6387800151832,40.6388806121901,40.6389828433429,40.6390864953723,40.6391176950941,40.6391813932466,40.6392848596933,40.6397085283277,40.6399346044787,40.6399953259269,40.6399015146036,40.6397977817249,40.6396857318486,40.6395673354794,40.6395332128084,40.6394447739147,40.6393203336925,40.6399239349924,40.6399533646609,40.6399833864462,40.640630519108,40.6402700203256,40.6438578080477,40.6440392144804,40.6440743792926,40.6440299288928,40.6438933802559,40.6438893493698,40.6442022398498,40.6452744247065,40.6444035969304,40.644471961493,40.6445814454196,40.6448660242256,40.6448421256519,40.6446005880281,40.6445830017997,40.6444974610169,40.6441775647027,40.6442507248249,40.6444382288378,40.6444143307089,40.6441560592482,40.6440159828903,40.6445062770219,40.6451978209834,40.6462613503262,40.648369331686,40.6484860262104,40.6488040551139,40.6486860167146,40.646615492291,40.6469123462266,40.6467256163785,40.6469444247654,40.6470945188787,40.6471511251188,40.6473992781535,40.6476151012599,40.6483231814573,40.6486059622675,40.6497821593481,40.650599638057,40.6508184678994,40.6506186970825,40.6509943007431,40.6511605357974,40.6511966531203,40.6513339779586,40.6513195464144,40.6514785506929,40.6511062852908,40.6509240026792,40.6509144129272,40.6508933055769,40.6506877074354,40.6509375534728,40.650918377161,40.6509446093354,40.6511120735898,40.6511025112466,40.6511335163134,40.6518398510342,40.6519338068551,40.6511917732122,40.6513537849132,40.6512561818363,40.6513156632538,40.6509743041348,40.6510027378937,40.6510063882352,40.6511691951618,40.6527214369273,40.6528298569597,40.6512973227688,40.6513115586734,40.6506716229113,40.6508518611848,40.6508173424369,40.6508349725643,40.6508615783713,40.6508915349418,40.6509677579884,40.6509972786109,40.6509259748308,40.6509776346733,40.6509432126181,40.6510982829278,40.6512604709084,40.6519106053817,40.6519816015068,40.651325710104,40.6511568226577,40.6512472752183,40.6512602828075,40.6530447285115,40.6532163689618,40.6530964260473,40.6529422401833,40.6529194384457,40.6528794845083,40.6528223738857,40.6527424115915,40.6522227819708,40.6522227991188,40.6522742381707,40.6523199512906,40.6526970247158,40.6528398368954,40.6540961168179,40.654233236292,40.6535879543102,40.65357656098,40.6535480123717,40.6536451652161,40.6539651085465,40.6541307688882,40.6542107552116,40.6546561757854,40.6548789828799,40.6544335754136,40.6544393333295,40.6544107795165,40.6542908243244,40.6542165892272,40.6542223434268,40.654165259253,40.6541653290523,40.6539997125671,40.6540340122128,40.6540225984942,40.6539426199811,40.6538855095091,40.653868394575,40.6538684082097,40.6537655977166,40.6536513654736,40.6535371368114,40.6534743105244,40.653491349023,40.6538852716079,40.6551182628812,40.6553359488745,40.6540615023309,40.6547751043621,40.6549268008961,40.654991840677,40.6564872105847,40.6565811637511,40.6551941879865,40.6554832749578,40.6553387965722,40.6556206428508,40.6573688843035,40.6575495644642,40.6578458740229,40.6562132400528,40.6566323967597,40.658098916725,40.6581856387715,40.6583084472986,40.6584529927612,40.6583374092433,40.6582723742977,40.6569503866935,40.6570669023843,40.6576080219514,40.6594501973867,40.6599837865673,40.6607583554761,40.6598119634401,40.6600287806369,40.6593163681453,40.6589128372748,40.6593286949617,40.6597062745807,40.6615297474401,40.661981597726,40.6619816540376,40.6604611870537,40.6595209230983,40.6595454277652,40.6602653283396,40.6605584762099,40.66239887973,40.6626421197901,40.6632676941304,40.6633720128403,40.6618450689905,40.6622747403605,40.6621838587469,40.6614448941013,40.6615283060674,40.6615616356813,40.6616232385631,40.6616270376996,40.6616317178119,40.6616317462903,40.6616419766,40.6617128945089,40.661783157976,40.6618934411057,40.6619054963952,40.6619223201888,40.6619281787486,40.6619323648217,40.6620417815344,40.662144558309,40.662149228189,40.6621494784689,40.6621512696458,40.6621844402592,40.6622701655656,40.6624939268494,40.6625825289519,40.6625901089683,40.6625751702991,40.6625748968652,40.6625752553436,40.6626788713456,40.6627725261127,40.662787827861,40.6627879667494,40.6627897570525,40.6629224019194,40.6631021581356,40.6631033065928,40.6631082507391,40.6628613666586,40.6623826685194,40.6621769612209,40.6619775273074,40.6619678058379,40.6619252162555,40.6619079457282,40.6622405561285,40.6624691744692,40.6626579634597,40.6627356766555,40.662714321342,40.6627619524186,40.6628163729128,40.6628161149099,40.6628122589389,40.6628116747466,40.662811191075,40.6628092664401,40.6627677231029,40.6627337328055,40.6627188851718,40.6626801461181,40.6624965039967,40.6627995354012,40.6628691297318,40.6630474140613,40.6629920412022,40.6630609974423,40.6630611423614,40.6630623534832,40.6630628080099,40.6630652279081,40.6630682132421,40.6632015530966,40.6632011205176,40.6631969295944,40.6631954879437,40.6631945591217,40.6631937108849,40.6631551909044,40.6631184696637,40.6631056204915,40.6630696014479,40.6628839269554,40.6630558535637,40.6632586108286,40.6634361512935,40.663376788661,40.663448288466,40.6634501554943,40.6634517162657,40.6634583902548,40.6636382836302,40.6636411938491,40.663641702057,40.6636419523083,40.6636425462783,40.6638634117764,40.6641187544208,40.6645424471289,40.6646835283664,40.6647186330198,40.6647427153915,40.6647911092658,40.6647959803311,40.6645975907526,40.6646429595109,40.6646730488294,40.6646903236431,40.6647298607577,40.6649152184743,40.6645472271604,40.6643629898568,40.6644183065336,40.664340372943,40.6641879301245,40.6642574036363,40.6643202113561,40.6645062067991,40.6641380206746,40.6639591365352,40.6640105666932,40.6639301682105,40.6638400056356,40.663890763214,40.6638495985759,40.6638756910749,40.6638740020266,40.6639227568017,40.663987763093,40.6640119423174,40.6640545638532,40.664114392912,40.6641903181232,40.6643265103922,40.6643818295162,40.6643974952811,40.6644176394675,40.6644695803183,40.6644782842434,40.6645032986197,40.6645287600596,40.6645314913933,40.6639003378438,40.6638998515595,40.6638968908038,40.6638964204332,40.6638490421734,40.6630918619022,40.6630955802223,40.6631152629881,40.6631137836403,40.6627348475346,40.6629857260957,40.6637351998329,40.6640523199753,40.664657003524,40.6650648219382,40.6629017235526,40.6630763919839,40.6630592527478,40.6630064421892,40.6630844614093,40.6633142270934,40.663333477707,40.6636279956228,40.6638213693872,40.6638452538302,40.6638563455063,40.6641055999407,40.6642301669541,40.664397485937,40.6664623121634,40.6667938351452,40.6667872586681,40.666769770351,40.6667662791745,40.6670181072029,40.6671695687076,40.6675459518988,40.6674502749087,40.6679003499712,40.668442972127,40.6688517992133,40.6689737744851,40.6690078884007,40.668921687297,40.6689171521993,40.6688802202326,40.6688734681893,40.6687314777972,40.6683196251858,40.6682966398876,40.6682982045003,40.66830628656,40.6686698811207,40.6690382718616,40.6691622442428,40.669514795548,40.6695961809436,40.6696485786396,40.6697272729153,40.6698045632178,40.6699384361749,40.67053337322,40.6706897367707,40.67133550167,40.6715353781237,40.6716020471051,40.6717391576037,40.6718301725648,40.6717046875678,40.6715680432278,40.6712028684063,40.6708420817575,40.6706614996912,40.670415448363,40.6703114375234,40.6702641422862,40.670199484385,40.6694733106429,40.669234549029,40.6691748470337,40.6690313247711,40.669060501367,40.6690931941774,40.669008413751,40.667848253555,40.6667662175984,40.6667365954421,40.6667042622991,40.6655663378135,40.6644252123044,40.6632837414232,40.6621414927937,40.6611546584779]}]],[[{"lng":[-73.7567032923353,-73.7566122198049,-73.7561856596601,-73.7559084720019,-73.7556625068432,-73.7555548669492,-73.7551681397903,-73.7550016504757,-73.7548784341632,-73.7546881382103,-73.7543963402083,-73.7540914239923,-73.754969194628,-73.7557712100535,-73.7565465244302,-73.7572855504248,-73.7579743023855,-73.7586756908226,-73.7593851050133,-73.7594414294099,-73.7595009415023,-73.760306231218,-73.7611382718999,-73.7619699488974,-73.7624033376402,-73.7627661541313,-73.7636077413815,-73.7644695172355,-73.765397945285,-73.7666409517761,-73.7673322808688,-73.7681799066302,-73.7687043494028,-73.7690621074323,-73.7691391403289,-73.7692253578,-73.7700798474792,-73.7711041071751,-73.7719212200709,-73.772758592226,-73.7735713516841,-73.7744423816123,-73.7752992789752,-73.7757145837482,-73.77618628294,-73.7771234697215,-73.7773063386292,-73.7780011969971,-73.7788695743188,-73.7795716474231,-73.779725536396,-73.7799800524784,-73.7804203408726,-73.7805889280165,-73.781782739708,-73.7822712657046,-73.7823665003101,-73.7824704324181,-73.7826254745131,-73.7835607566972,-73.7844614449882,-73.7853527219895,-73.7857519848189,-73.7861600592494,-73.7865752862753,-73.7869959870821,-73.7874204069056,-73.7878467841394,-73.7884348118371,-73.7884241033582,-73.7884240885826,-73.7884241075716,-73.7884340315063,-73.7884340590823,-73.7884341342646,-73.7884653920933,-73.7884654550029,-73.7884655771321,-73.7885160889831,-73.7885161549744,-73.7885162535477,-73.7885816801997,-73.7886396620547,-73.7886963591255,-73.7887509288496,-73.7888025602805,-73.7888504861383,-73.7888939941983,-73.7889324378942,-73.7889652459334,-73.7889919307762,-73.7890120958796,-73.7891487964827,-73.7892833506776,-73.7894141212479,-73.7902154424164,-73.791014107118,-73.7920285465067,-73.7930380005234,-73.7938960996077,-73.7947305235292,-73.7956166896185,-73.7963941803779,-73.7973140076359,-73.7977681013414,-73.7981839240752,-73.7989815214527,-73.7993042528533,-73.8002218519339,-73.8010769978964,-73.8018572811556,-73.8027872140161,-73.8044998746596,-73.8065887271707,-73.8084933305621,-73.8090007105034,-73.8096898533001,-73.8105887763747,-73.8119043619029,-73.8127805953003,-73.8144393186543,-73.8152427268333,-73.8164004666223,-73.8170276805223,-73.8170973875645,-73.817355290755,-73.8174001053499,-73.8180990519697,-73.8182167099207,-73.818285663457,-73.8186127527825,-73.8189210252736,-73.8189930568014,-73.8190501695226,-73.8191072958393,-73.8191613628179,-73.8192154306293,-73.8195442616115,-73.8197062687685,-73.8202625598922,-73.8203231300877,-73.8203905504065,-73.8204870313979,-73.8206415970137,-73.820778189738,-73.8210335440497,-73.8217471552359,-73.8226403115576,-73.8228579448664,-73.8230686423718,-73.8232722406516,-73.8234685822679,-73.823657514442,-73.8238388906146,-73.8239440598338,-73.8242644916464,-73.8242894051795,-73.8245608126472,-73.8246934397495,-73.8248322241323,-73.8254606073228,-73.8255230749373,-73.8255508516249,-73.8255786292369,-73.8255900058741,-73.8256293522369,-73.8256858368402,-73.825739346338,-73.8257850146509,-73.825896787801,-73.8259194682017,-73.825980532864,-73.8259971641182,-73.8260489242825,-73.8260563284496,-73.8260748601592,-73.8261100515755,-73.8261332357072,-73.8263017384772,-73.8262626196858,-73.8262299906233,-73.8262038903055,-73.8261843499503,-73.8261713929407,-73.8261650347962,-73.8261652832232,-73.8261721378836,-73.8261855906331,-73.8262056254452,-73.8262322184311,-73.8262653378673,-73.8263056252432,-73.8263536691524,-73.8264093876511,-73.826472685646,-73.8265434548205,-73.8266215744528,-73.8276905906447,-73.8278075050829,-73.8284558362932,-73.8285900506941,-73.828888460266,-73.8290510321779,-73.8292024845127,-73.8294162483505,-73.829650668058,-73.8299559031706,-73.8303432587079,-73.8306376733336,-73.8308841116663,-73.8310466747282,-73.8314215868743,-73.8317176497454,-73.8318518524854,-73.8320244861033,-73.8321318898429,-73.8322452210354,-73.8323286336183,-73.83244264495,-73.832537116957,-73.832605308566,-73.8328338102035,-73.8328618322206,-73.8328869747541,-73.8329172127246,-73.833721615217,-73.8339614971016,-73.8346605681255,-73.8347600499883,-73.8350136332837,-73.8351842744934,-73.8355686478378,-73.835832034463,-73.8359282197685,-73.8360070898521,-73.8361277861021,-73.8363562498459,-73.8363669167192,-73.836544046172,-73.8367283341533,-73.8367445758512,-73.8371588675407,-73.8372208649882,-73.83738179052,-73.8374424652162,-73.8375364069957,-73.8375585859024,-73.8375814379533,-73.8376795835559,-73.8377217196385,-73.8376919059955,-73.8376834280763,-73.8376057893524,-73.8373174895486,-73.8372319002147,-73.8371455035866,-73.8367585182244,-73.8361285658933,-73.8359156487578,-73.8359019695286,-73.8358613187213,-73.8351795043705,-73.833868509533,-73.8329689305268,-73.8320706479482,-73.831639755564,-73.8315594226786,-73.8310970924222,-73.8311554935487,-73.831198727747,-73.8312400552556,-73.8312881943025,-73.8313011725404,-73.8303438659767,-73.8303961756113,-73.83090596523,-73.8309942308935,-73.8311345171537,-73.8305355123144,-73.8294675199701,-73.8280915257717,-73.8279496908658,-73.8279645508448,-73.8279003027045,-73.8276056949615,-73.8275238028317,-73.8274982660807,-73.8274550878747,-73.8274094222052,-73.8273135404409,-73.8272277268523,-73.8271388594393,-73.8270529611979,-73.8270122248051,-73.8269582483883,-73.8268719177106,-73.8266951412572,-73.8265726273055,-73.8264679595493,-73.8263916478629,-73.8263378820486,-73.8263091815382,-73.8262380227564,-73.8261403824347,-73.8260258503621,-73.825975804621,-73.8259167329176,-73.8258218972737,-73.8258136411484,-73.8256897373689,-73.8256415128456,-73.8256064165045,-73.8255647887844,-73.825560793229,-73.8254041332308,-73.8249743999207,-73.8249480087467,-73.8248117842176,-73.8248549614948,-73.8249838447333,-73.8251258065185,-73.8252057209488,-73.8252701510202,-73.8253632475165,-73.8253738766737,-73.8252857978249,-73.8244595325713,-73.8235721143048,-73.8230151947775,-73.8217006188712,-73.8212199748999,-73.8210086280554,-73.8194832991281,-73.8189066552469,-73.8186304914798,-73.8177436933596,-73.8171592827276,-73.8166446777877,-73.8159359422738,-73.8152246716851,-73.8151033194465,-73.8150499868699,-73.8149975569087,-73.814894970308,-73.814073820425,-73.8132240172633,-73.8122773782403,-73.8113972909521,-73.8104043557634,-73.8094114217823,-73.8089301670512,-73.808448913235,-73.8080525845573,-73.8075208191378,-73.8065788386773,-73.8056455091005,-73.8047129152036,-73.8046654326126,-73.8046155349878,-73.8036360051951,-73.8026863206076,-73.8018083430405,-73.8013215540357,-73.8008915119533,-73.8000029241536,-73.799111957239,-73.7982205892731,-73.797292605541,-73.7968479577502,-73.7964021870636,-73.7961158477359,-73.7958868169562,-73.7953377292227,-73.7944080175009,-73.7936934138514,-73.7929788166895,-73.7929160314509,-73.7928579703721,-73.7920281759568,-73.791115264333,-73.790207501379,-73.7893472725742,-73.7886511024845,-73.7884824349903,-73.7875944436014,-73.7867351682107,-73.7866908531653,-73.7866484461612,-73.7857705120003,-73.7848424455737,-73.7840094412037,-73.7834969715438,-73.7831101185108,-73.7821600971817,-73.7817652682689,-73.781376988781,-73.7812185758443,-73.7810056636334,-73.7806858491643,-73.7803660354378,-73.7796564130617,-73.7785992477799,-73.7780583566693,-73.7757971337699,-73.7757383692709,-73.7756918242702,-73.7755123829721,-73.7748638213836,-73.7744433045204,-73.77403143122,-73.7736218517438,-73.7732153479139,-73.7728126768902,-73.7724146100267,-73.7716209796025,-73.771566719034,-73.7715340231324,-73.7714521884745,-73.7713767848846,-73.7703898232083,-73.7693716412278,-73.7685770122043,-73.7677299142539,-73.7677061458967,-73.7676150802808,-73.7669786290539,-73.7668785359679,-73.7667631486094,-73.7666335257641,-73.7664910963283,-73.7663375608592,-73.7661748475612,-73.7655684981058,-73.7651512888328,-73.7643149555986,-73.7636122541941,-73.7631681653846,-73.7626829717927,-73.7625969477083,-73.7625308618953,-73.7624860927727,-73.7624634837631,-73.7624633455236,-73.7624853862954,-73.762528757224,-73.762733034679,-73.7624953394349,-73.7634077835835,-73.7647122863809,-73.7637401047644,-73.7636997917016,-73.7643401501721,-73.7649166761363,-73.7655508605399,-73.7656437446563,-73.7655885617446,-73.7652883037964,-73.7648685309736,-73.764350715262,-73.7638186673539,-73.7632753774446,-73.7623420983915,-73.7616081443854,-73.7611408368041,-73.7602421099525,-73.7599381830033,-73.75831675517,-73.7578714145791,-73.7568485473756,-73.7567827271552,-73.7567473961243,-73.7567032923353],"lat":[40.7262294326618,40.7262079265278,40.7258957432521,40.7257066612665,40.7255774665291,40.7255209269319,40.725359040128,40.7252865726765,40.7252210409409,40.7251111605688,40.7249214405119,40.7246919062893,40.724159647309,40.7236402158935,40.7230876094671,40.7225703223631,40.7220907361016,40.7215998160167,40.7210987066723,40.7210634437532,40.7210273722768,40.7206466438225,40.7203291771857,40.7200036100347,40.7198085814109,40.7196387608677,40.7192821420549,40.7188903928791,40.7183560323431,40.7176466136632,40.7172897968106,40.7169952203389,40.7168090292282,40.7166837679547,40.7166567985854,40.716626587994,40.7163272024246,40.7159750627523,40.7156850444531,40.7153972209501,40.7151200953687,40.714905043129,40.7146963140527,40.7145984549217,40.714485574205,40.7142619940852,40.7142093168187,40.7140511241328,40.7138492976283,40.7136741597363,40.7136357700218,40.7135745712783,40.7134687101548,40.7134281756626,40.7131399931981,40.7130251300728,40.7130027431969,40.712976581028,40.7129375484909,40.7127107883543,40.7124939049805,40.7122836170325,40.7121639526009,40.7120600713426,40.7119724932768,40.7119016092442,40.7118476784602,40.7118108331664,40.7119846876091,40.7120586532517,40.712058799811,40.7120589211358,40.7121353010743,40.7121354916038,40.712135665803,40.7122095427143,40.7122096993006,40.7122098570009,40.7122763272035,40.7122764146066,40.7122765025721,40.712331847506,40.7123265072019,40.7123158381413,40.7122999988747,40.712279224786,40.712253824594,40.7122241755897,40.712190718555,40.7121539506849,40.7121144183749,40.7120727091008,40.7120568856387,40.7120317286485,40.7119975320017,40.7117170446768,40.7114325850964,40.7110693716987,40.7107110754255,40.7103523293739,40.710012461966,40.7097530791751,40.7095315794122,40.7092701987566,40.7091431883419,40.7090243932807,40.7088009926084,40.7086982316472,40.7084458015137,40.708201730875,40.7079798752269,40.7077158030576,40.7072277910612,40.7066339100103,40.7060867460048,40.7059488744024,40.7057462554824,40.7054960718278,40.7051239401774,40.7048739630061,40.7044021505635,40.7042024395625,40.7040833531051,40.7040334993715,40.7040298015878,40.7045501397848,40.7046360531532,40.7059737147275,40.7061812339367,40.7063028504822,40.7068533995611,40.7073499060442,40.7074719035871,40.7075702209151,40.7076685389046,40.707760332058,40.7078521164746,40.7084383738074,40.7086918535547,40.7095380732723,40.7096109608246,40.7096802769619,40.7097944308468,40.7099712268711,40.7101568997869,40.7104270358934,40.7110403038144,40.7117522686562,40.711939528439,40.7121313266101,40.7123275144605,40.7125279397826,40.7127324472787,40.7129408783817,40.7132332993445,40.713816425045,40.7138700661059,40.7142550301751,40.7144431443631,40.7146399929159,40.7155496455943,40.7156538817455,40.7157082448787,40.7157626086762,40.7157742713998,40.7158630879316,40.7159906102577,40.716115058784,40.7162240435448,40.7165790339299,40.716651065055,40.7168408866243,40.7168925820097,40.7170534793043,40.7170764916406,40.7171340982333,40.7172848126189,40.7184397614148,40.718668746462,40.7188111258284,40.7189544486669,40.7190985437859,40.719243239071,40.7193883616893,40.7195337382965,40.7196791949997,40.7198245582957,40.7199696545494,40.720114310444,40.7202583531872,40.7204016107181,40.7205451263331,40.7206872534833,40.72082774961,40.7209663744525,40.7211028920193,40.7212370693434,40.7228929493171,40.7230457330009,40.7237864891577,40.7239150660168,40.7241864546952,40.7243257085998,40.7244489250008,40.7246076866053,40.7247754658591,40.7249823506942,40.7252323721525,40.7254182477499,40.7255825299395,40.7256909111136,40.7259642696052,40.7262216815235,40.7263545138775,40.726540622443,40.7266713380303,40.726825720977,40.7269464473026,40.7271259312655,40.7272876978599,40.7274174436019,40.7278415325976,40.7278934438011,40.7279426412377,40.7280018088886,40.7295757349778,40.7300335936821,40.7313813846617,40.7315735251094,40.7320492584897,40.732389588995,40.7331157161877,40.7336194406291,40.7338168611038,40.7339787413259,40.7342413120032,40.7350085921502,40.735124124875,40.7370436587464,40.7384763502197,40.7386025705801,40.7400861519177,40.7402965982237,40.7408428673477,40.7410671166721,40.7413894961949,40.7414656197345,40.7415622591896,40.7419772525247,40.7423663677531,40.7432368830526,40.743300339209,40.7433120536205,40.7433453341666,40.7433554517918,40.7433644883358,40.7434027793409,40.7434358072001,40.7434308938952,40.7433798061134,40.7432279845386,40.7430720507685,40.7427722064174,40.742593616599,40.7424509378266,40.7423991372422,40.7427847418805,40.7427397573551,40.7423409179436,40.7416390413239,40.7409566917453,40.7402648871458,40.7395610621863,40.7394770969316,40.7391612062805,40.7391327638927,40.7385654949987,40.7385619069765,40.7375201947633,40.7370244827535,40.7370831757755,40.7378195987375,40.7385032039502,40.7385024519221,40.7385043519711,40.7385149723389,40.7385156038626,40.7385166711569,40.7385220674502,40.7385333996315,40.7385435406457,40.7385540432256,40.7385641933642,40.7385690085487,40.7385897733083,40.7386229847228,40.7386909913284,40.7387381221347,40.7387783881571,40.738807744776,40.7388284283118,40.7388420593962,40.7388758547659,40.7389222299026,40.7389766249098,40.7390003952147,40.7390456971277,40.7391184248319,40.7391290603414,40.7392886430774,40.7393507546433,40.7393959559896,40.739449572182,40.7394543595712,40.7394882257504,40.7394404262537,40.7395671055064,40.7396309598996,40.7398293639291,40.7403431380092,40.7410438045624,40.7414415368014,40.7417531841915,40.7421906660535,40.7422322404994,40.7422094961843,40.7419495404638,40.7416638128473,40.7414846222237,40.7410357525542,40.7408798052049,40.7408096601895,40.7402831022068,40.7400902263996,40.7399989035571,40.7397042613101,40.7395112749715,40.7393523000362,40.7391278608713,40.7389780482677,40.7389524852625,40.7389431338887,40.7389325861239,40.7389157436598,40.7387809020789,40.7387022549407,40.7386644514245,40.7386293072684,40.7385896483002,40.7385499718919,40.7385323803882,40.7385147868745,40.738500294466,40.7384808479782,40.7384472109873,40.7384186525956,40.7383939487086,40.7383929854824,40.738391577879,40.7383608519982,40.7383310516215,40.7383026552872,40.7382842022456,40.7382690155478,40.7382376243901,40.7382061404715,40.7381746306951,40.7381854288368,40.7382355413158,40.7382823581914,40.738336140698,40.738376374998,40.7384936727728,40.7387482308308,40.7389500622675,40.7391518812423,40.7391677614787,40.7391797328983,40.73940358109,40.7396498394492,40.7398947039537,40.7401263377529,40.7403257146845,40.7403682781607,40.7406179583689,40.7408417760527,40.7408529864632,40.7408667486418,40.7411106793814,40.741368529938,40.74159935688,40.7417413598523,40.7418483056439,40.7421155489653,40.7422164053246,40.7423199933991,40.7423622505907,40.7424195413359,40.7425056067888,40.7425916631466,40.7427293105529,40.7429081226516,40.7429864891389,40.743317666176,40.7433256471641,40.7433335887638,40.7433568425023,40.7434533366435,40.7435158996431,40.7435676012212,40.7436304626194,40.7437043961097,40.7437892494286,40.743884845222,40.7441597313636,40.7441795155559,40.7441916253791,40.7442215225215,40.7442510355007,40.7447379136895,40.7452203090864,40.7455222048845,40.745776226174,40.7457227427204,40.7455263553193,40.744222968236,40.7440935792063,40.7439703628017,40.7438548526522,40.7437484301854,40.7436522585927,40.7435672716866,40.7432581550272,40.7424373457594,40.7406726268385,40.7391684115849,40.7382617079325,40.7372558362195,40.7370873264227,40.7369116801443,40.7367309819523,40.7365475010895,40.7363636253029,40.7361816951815,40.7360039606939,40.7352621626723,40.7347345589719,40.7344677423728,40.7340856997238,40.7329128725579,40.7328641168479,40.7327529552508,40.7326546728048,40.7325442834415,40.7325331267391,40.7324675205314,40.732114664552,40.7316686396683,40.731151192136,40.7306835738073,40.7302405411147,40.7295382907013,40.7290475344412,40.7287944142644,40.728307611567,40.7281584118185,40.7273624071146,40.7271068514865,40.7263558121672,40.7263057848626,40.7262728959838,40.7262294326618]}]],[[{"lng":[-73.8359156487578,-73.8361285658934,-73.8367585182244,-73.8371455035866,-73.8372319002148,-73.8373174895486,-73.8376057893523,-73.8376834280764,-73.8376919059957,-73.8377217196386,-73.837679583556,-73.8375814379535,-73.8375585859024,-73.8375364069957,-73.8374424652163,-73.8373817905202,-73.8372208649882,-73.8371588675407,-73.8367445758513,-73.8367283341535,-73.8365440461719,-73.8363669167193,-73.8363562498459,-73.8361277861022,-73.836007089852,-73.8359282197686,-73.835832034463,-73.8355686478379,-73.8351842744935,-73.8350136332837,-73.8347600499883,-73.8346605681256,-73.8339614971016,-73.833721615217,-73.8329172127247,-73.8328869747542,-73.8328618322207,-73.8328338102036,-73.8326053085661,-73.8325371169571,-73.8324426449501,-73.8323286336183,-73.8322452210355,-73.8321318898429,-73.8320244861032,-73.8318518524854,-73.8317176497454,-73.8314215868743,-73.8310466747283,-73.8308841116662,-73.8306376733337,-73.8303432587079,-73.8299559031706,-73.8296506680581,-73.8294162483505,-73.8292024845129,-73.8290510321779,-73.828888460266,-73.8285900506941,-73.8284558362931,-73.8278075050829,-73.8276905906448,-73.8266215744528,-73.8265434548207,-73.8264726856461,-73.8264093876511,-73.8263536691526,-73.8263056252433,-73.8262653378674,-73.8262322184311,-73.8262056254452,-73.8261855906332,-73.8261721378838,-73.8261652832232,-73.8261650347963,-73.8261713929406,-73.8261843499503,-73.8262038903055,-73.8262299906234,-73.8262626196858,-73.8263017384773,-73.8261332357073,-73.8261100515756,-73.8260748601593,-73.8260563284496,-73.8260489242826,-73.8259971641183,-73.8259805328641,-73.8259194682018,-73.8258967878009,-73.8257850146509,-73.825739346338,-73.8256858368402,-73.8256293522369,-73.8255900058743,-73.8255786292369,-73.8255508516249,-73.8255230749372,-73.8254606073229,-73.8255971632927,-73.8258552754084,-73.8260033749814,-73.8261209530947,-73.8262502018818,-73.8263960468184,-73.8271407670679,-73.8275075320579,-73.8276286915821,-73.8277641290058,-73.8280832069699,-73.828987611965,-73.8297627450989,-73.8304290241852,-73.8306794998131,-73.8310200977168,-73.8313846950791,-73.8315524583811,-73.8318530552326,-73.8323212642399,-73.8327834605997,-73.8337588817707,-73.8341282331352,-73.8355481993605,-73.8358295092665,-73.8359713964449,-73.8360848440056,-73.8369773580296,-73.8373131229336,-73.8374927999677,-73.837768570241,-73.8378878855251,-73.8381325114004,-73.8382130123722,-73.8385970230017,-73.8389439796301,-73.8389995352069,-73.8392513141897,-73.8392009389378,-73.839816503714,-73.8405500384892,-73.8410026100729,-73.8414823138433,-73.8421224808986,-73.8427332863079,-73.8428458257842,-73.8437157627912,-73.8440792158507,-73.8442858422926,-73.8443543461236,-73.844414828606,-73.8444276585073,-73.8445141563524,-73.8445870704429,-73.8446759558276,-73.8447001317296,-73.8447467583562,-73.8448007955778,-73.8448547787918,-73.844889056903,-73.8450402111655,-73.8451446608186,-73.8453373978708,-73.8453836038644,-73.8454708956663,-73.8455644785115,-73.8456572550948,-73.8457582230802,-73.8459109394777,-73.8462333963283,-73.8464697015221,-73.8466465279918,-73.8467488196996,-73.8468393008462,-73.8468936619367,-73.8472136158788,-73.8473249412528,-73.8474631403263,-73.8475082034414,-73.8475557978618,-73.8476703373911,-73.8477574010969,-73.8477784421743,-73.8475798071804,-73.8478016462052,-73.8479588598362,-73.8489234490988,-73.8493530507701,-73.8496520730917,-73.8498443127133,-73.8499642602272,-73.8501155663642,-73.8502044455664,-73.8505116087321,-73.8508691753435,-73.8509932732465,-73.8512092908837,-73.8513510276501,-73.8515510733492,-73.8518953747769,-73.8522409742843,-73.8525773383639,-73.852923535223,-73.853254931964,-73.8536056829382,-73.8537828697177,-73.8538245071134,-73.8540545329872,-73.8543692806646,-73.8544257525366,-73.8513110504637,-73.8508643971003,-73.8507490642678,-73.8506337304074,-73.850498913962,-73.8518974626072,-73.8521614469217,-73.8521556683952,-73.8521542855528,-73.8521357137624,-73.8521275848111,-73.8520877795051,-73.851959190852,-73.8518618516849,-73.8518659886392,-73.8519004907292,-73.8519826307076,-73.8521279815657,-73.8521650798942,-73.8521911681973,-73.852336246321,-73.8523427288433,-73.8524722061685,-73.8525825246995,-73.8526633943345,-73.8529247665995,-73.8531051389512,-73.8532999892406,-73.8534402522138,-73.8536746070519,-73.8538344005143,-73.8543740621409,-73.8547827375971,-73.8549509176938,-73.8550633024279,-73.8553026602968,-73.8549980891601,-73.854663663928,-73.8545203082372,-73.854252199018,-73.8539648920126,-73.8537240393495,-73.8532844938064,-73.8530661864311,-73.8529492766167,-73.8528305667532,-73.8527937652886,-73.8527748332086,-73.8526891729138,-73.8526653448466,-73.8521036199702,-73.8520075954262,-73.8518871125705,-73.8517125242184,-73.8515855290119,-73.8514434756632,-73.8513343885052,-73.8512149537398,-73.8509512188559,-73.8506905306546,-73.8504243782249,-73.8503206130775,-73.8502197885581,-73.8501224605209,-73.8500291655468,-73.8499404179849,-73.8497090835063,-73.8495020229918,-73.8493390917869,-73.8493490666442,-73.8493011081434,-73.8498748449615,-73.8518167923385,-73.8518404651051,-73.8519741296287,-73.8520720017785,-73.8498116240904,-73.8491666240615,-73.8491414027254,-73.8489139364889,-73.8486865565904,-73.8485883455156,-73.8482124206382,-73.8479623358371,-73.8467093366402,-73.8456278799256,-73.8452320691587,-73.8447450720662,-73.8446764811764,-73.8442857642735,-73.8441156672296,-73.8437742660797,-73.843593612502,-73.8436683263363,-73.8436152375605,-73.8436878766413,-73.8436502801304,-73.8435710063455,-73.8435201394644,-73.8434362878047,-73.8431432418534,-73.8430696120356,-73.8430045063485,-73.8429834919072,-73.8430067112625,-73.8430514517534,-73.8430424081083,-73.8429847963955,-73.8427281939649,-73.8426131219735,-73.8424402247995,-73.8420174078952,-73.8419868148217,-73.8414440958441,-73.8406256288308,-73.8405407985584,-73.8398949462952,-73.8397005336243,-73.8397283042787,-73.8400222020751,-73.8400240333709,-73.8400268132414,-73.8400249430433,-73.8400200337904,-73.8399811920611,-73.8399176745095,-73.8398320564932,-73.8397250358941,-73.8396272925196,-73.839603459492,-73.8395986548871,-73.8395678280506,-73.8392536576609,-73.8394040091775,-73.840177896123,-73.8410721424405,-73.8412005729918,-73.8413303681583,-73.8414610895386,-73.8415922956026,-73.8417235428068,-73.8418543882371,-73.841984389944,-73.8421131088286,-73.84216600648,-73.8423956988243,-73.8426182239694,-73.8428314247659,-73.8437165779981,-73.8445463383915,-73.8452215006882,-73.8454947910388,-73.8458523574436,-73.8454898618525,-73.8451340402416,-73.8447902700432,-73.8444497030347,-73.8440443109266,-73.8436344271319,-73.843243813566,-73.8425336059876,-73.8418314671025,-73.8411383911255,-73.8404553715746,-73.8397833585332,-73.8391232990766,-73.8391220967654,-73.8391199522323,-73.8391053150767,-73.8390960881024,-73.8390943905909,-73.8390766786794,-73.8390597507521,-73.839058336473,-73.8390562496218,-73.839055185935,-73.8390539355274,-73.8390539569385,-73.8390546765641,-73.8390553561761,-73.8390564035898,-73.8390600758807,-73.8390624275515,-73.8390653242181,-73.8390728451971,-73.839082345529,-73.8390973191604,-73.8391410437484,-73.8391872975275,-73.8392407117513,-73.839294785399,-73.8393357252278,-73.8394060201175,-73.8394474397681,-73.8394690964412,-73.8394927394836,-73.8395104933792,-73.8395169771945,-73.8395219457003,-73.8395285309119,-73.8395325246988,-73.839535534549,-73.8395349525504,-73.8395316635444,-73.8395314389151,-73.8395344059686,-73.8395415306644,-73.8395487761811,-73.8395566654184,-73.8396024383919,-73.8396226003212,-73.8396512084002,-73.8396628598362,-73.8396844312566,-73.8397245207944,-73.8397462785115,-73.8397714166361,-73.8398041950025,-73.839844342922,-73.8399027777269,-73.8400190454037,-73.8400510679704,-73.8400689687025,-73.8400912763911,-73.8401241631382,-73.8401769423668,-73.8402083900236,-73.8402335863823,-73.8402889935783,-73.8403372143646,-73.8403722771602,-73.8403821351715,-73.8403916635383,-73.8404106976495,-73.8404128128241,-73.8404147978871,-73.8404215600195,-73.8404247934767,-73.8404406373626,-73.8404567225499,-73.840481239546,-73.8405059753627,-73.8405532025165,-73.8405953295077,-73.8406343935758,-73.8406514989966,-73.8406577222069,-73.8406626902552,-73.8406775686862,-73.8406922050723,-73.840704125061,-73.8407124298575,-73.8407225165151,-73.840735612048,-73.840737610894,-73.8407431271487,-73.8407451513152,-73.8407508231659,-73.8407518584396,-73.8407518743927,-73.8407482775543,-73.840742773088,-73.8407330658331,-73.8407297376543,-73.8407293073012,-73.8407323201708,-73.8407413407187,-73.8407554092046,-73.840760388067,-73.8407641504864,-73.840767266265,-73.8407663356798,-73.8407637206892,-73.8407512692185,-73.8407338456162,-73.8407214759005,-73.8407143317528,-73.8407052355804,-73.8406943418648,-73.8406910649729,-73.8406890093982,-73.8406872980397,-73.8406877895866,-73.8406901877132,-73.8406923733551,-73.8406966245418,-73.8407042337751,-73.8407313758005,-73.8407515307587,-73.8407642340115,-73.8407691927133,-73.8407770472971,-73.8407791704357,-73.8407754979146,-73.8407661408274,-73.8407513822146,-73.840731668502,-73.8407187671671,-73.8406799997366,-73.8400426281376,-73.8398495469039,-73.8380577884866,-73.8379892119829,-73.8377803814654,-73.8362511917508,-73.835836515183,-73.8355485237687,-73.8350804930399,-73.8347873606396,-73.8347116851387,-73.8347070809016,-73.8347334508157,-73.8347853545842,-73.8348488943388,-73.8350233466827,-73.83514009988,-73.8350693149265,-73.8350048058533,-73.834934321596,-73.8348585180663,-73.8347781005969,-73.8346981123398,-73.8350657468726,-73.8354377716985,-73.8355695866481,-73.8356755394758,-73.835849677861,-73.8359507145918,-73.8359253040333,-73.8359156487578],"lat":[40.7434308938951,40.7434358072001,40.7434027793409,40.7433644883358,40.7433554517918,40.7433453341666,40.7433120536204,40.7433003392089,40.7432368830526,40.7423663677532,40.7419772525247,40.7415622591896,40.7414656197345,40.7413894961949,40.7410671166721,40.7408428673476,40.7402965982237,40.7400861519177,40.7386025705801,40.7384763502197,40.7370436587464,40.7351241248749,40.7350085921502,40.7342413120032,40.7339787413259,40.7338168611037,40.7336194406291,40.7331157161877,40.732389588995,40.7320492584897,40.7315735251093,40.7313813846617,40.7300335936821,40.7295757349778,40.7280018088886,40.7279426412377,40.727893443801,40.7278415325976,40.7274174436019,40.7272876978599,40.7271259312655,40.7269464473026,40.726825720977,40.7266713380303,40.726540622443,40.7263545138774,40.7262216815234,40.7259642696052,40.7256909111136,40.7255825299395,40.7254182477498,40.7252323721524,40.7249823506942,40.7247754658591,40.7246076866053,40.7244489250008,40.7243257085998,40.7241864546952,40.7239150660168,40.7237864891577,40.7230457330008,40.7228929493171,40.7212370693433,40.7211028920193,40.7209663744525,40.7208277496099,40.7206872534833,40.7205451263331,40.7204016107181,40.7202583531871,40.720114310444,40.7199696545494,40.7198245582957,40.7196791949997,40.7195337382965,40.7193883616893,40.719243239071,40.7190985437859,40.7189544486668,40.7188111258284,40.718668746462,40.7184397614148,40.7172848126189,40.7171340982333,40.7170764916405,40.7170534793042,40.7168925820096,40.7168408866243,40.716651065055,40.7165790339299,40.7162240435448,40.716115058784,40.7159906102577,40.7158630879316,40.7157742713998,40.7157626086762,40.7157082448787,40.7156538817455,40.7155496455943,40.7155143369393,40.7154533969516,40.715413630791,40.7154925266357,40.7155650238481,40.7156552145362,40.7160068511739,40.7161004581287,40.7161368980159,40.7161776325886,40.7162735966687,40.7165209811477,40.7167236830895,40.7169627709355,40.7171790647029,40.7173317240276,40.7175513171202,40.7176805628081,40.7179121433042,40.7183298975857,40.7188024294399,40.7198382960155,40.7202305328989,40.7219700249877,40.7223417181508,40.7225390861344,40.7226969573175,40.7240710603013,40.724730158029,40.7251278510906,40.7254339130347,40.7256974322974,40.7262015444086,40.7263674373549,40.727026933597,40.7276227839533,40.7277181914947,40.7281505773919,40.7282668630292,40.7290373869242,40.7298447299081,40.7302788999448,40.7307390894366,40.7313444363489,40.7319508736962,40.7320676427423,40.7332257299461,40.7338478000143,40.73420144745,40.7343447928451,40.7344712706516,40.7344980961156,40.7347031782081,40.7348797047254,40.7351123447011,40.7352081275373,40.7353625649347,40.7355428032014,40.7357514698091,40.7359115813815,40.7360953800625,40.7365109346524,40.7372777246965,40.7376091837968,40.7378732219504,40.7380022823602,40.7381174010484,40.7382068853172,40.7383070554127,40.7384358454849,40.7385394936967,40.7386170463539,40.7386517895016,40.7386692172142,40.7386712173942,40.7386439866839,40.738771458077,40.7389520315271,40.7390078070401,40.739063915243,40.7391952354507,40.7392990885836,40.7393448352464,40.7397213544384,40.7400496769622,40.7400970163836,40.7403919148126,40.7405232498138,40.740614663785,40.7406655498284,40.7407017722784,40.7407235627984,40.7409020337518,40.7415188570427,40.7421804113246,40.7424225429113,40.7428440212208,40.7431190579557,40.7435072271111,40.7441797382359,40.7448409656761,40.7455056473151,40.7461819475256,40.7468235494634,40.7474968285921,40.7478029913653,40.7478540400851,40.7481583169479,40.748738930191,40.7488517268845,40.7498433761507,40.7499956418746,40.7500384918114,40.7500813409611,40.7501206987575,40.7527528596665,40.7533819947196,40.7534652339494,40.7540478926649,40.7544551502439,40.7547509201017,40.7550785717333,40.7556896704974,40.7563274102381,40.7566559922049,40.756866404551,40.7571107363121,40.757388722746,40.7574596732962,40.7575667953577,40.7578732453588,40.7578867326546,40.7581202009823,40.7582834516903,40.758397738787,40.7587110075729,40.7588890062182,40.7590596940802,40.7591684372405,40.7593246483547,40.7594269778065,40.759676255254,40.7598482997658,40.7601074960894,40.7602806988509,40.7606495847523,40.7603911707666,40.7601711695613,40.7601593448847,40.7602506777814,40.7602714222245,40.7602463886348,40.7601265127512,40.7600387044803,40.7600214018093,40.7599875935566,40.7599721661337,40.7599642281751,40.7599283156637,40.7599183267704,40.7596828266989,40.7595725001842,40.7595223672789,40.7594012585167,40.759355420657,40.7594190842762,40.7594206809652,40.7594158536328,40.759419583092,40.7594487910904,40.7595064110376,40.7595336154798,40.7595665993608,40.759605180839,40.7596491472128,40.7596982560929,40.7598388379575,40.7600067290107,40.7601885894473,40.7601982826528,40.76024287535,40.7611038129485,40.7603537328463,40.7603059788215,40.7602494073818,40.7603928846722,40.7612709740073,40.7602965842879,40.760306890639,40.7602757866728,40.7601384946081,40.7601795630874,40.7604375945079,40.7605510888334,40.7613452691361,40.7621427418613,40.7624346076183,40.7627556312059,40.7627521808586,40.7629985521512,40.7631361995793,40.7632993229664,40.7633705427875,40.7634699073962,40.7634967140607,40.7636127260837,40.7636277942923,40.7635151328046,40.7635369030913,40.7634325661937,40.7635480947651,40.7635925691529,40.763704224005,40.7638318513791,40.7639946228365,40.7640973581533,40.7643213199203,40.7644235936184,40.7646285489317,40.764682989692,40.7645042729927,40.763688570101,40.7636346482519,40.7637724706044,40.7640234198922,40.7641096110879,40.7650940540317,40.7652895884368,40.7651457024598,40.7642324655417,40.7641273882156,40.7640675144162,40.7639584520316,40.7636722713598,40.763438689953,40.7632065080956,40.7629781495759,40.7627553996359,40.7625901790638,40.7625482648677,40.7625398165393,40.7624757649154,40.7619080623721,40.7619316501592,40.7620524302832,40.7622643098209,40.7622850092768,40.7623000009174,40.7623092341065,40.7623126776575,40.7623103201699,40.7623021693931,40.7622882528572,40.7622686175674,40.7622613143797,40.7622141990182,40.7621529544777,40.7620785302424,40.7617390014391,40.7612947608349,40.7608608475473,40.7606852052742,40.7604553976932,40.7597286721183,40.7590684748989,40.7584031589058,40.7577434838967,40.7569447726627,40.7561569937639,40.7553368037671,40.7555446991363,40.7557692688936,40.7560102445044,40.7562672966429,40.7565400363045,40.75682806227,40.756825818085,40.7568218252855,40.7567921242221,40.7567734350086,40.7567699841103,40.7567340558191,40.7567018208982,40.7566991356547,40.7566951622001,40.7566893430308,40.7566824794097,40.7566787240042,40.7566748533111,40.7566729543457,40.7566709196953,40.7566655495795,40.7566626801252,40.7566598296927,40.7566540411119,40.7566483903216,40.7566409273383,40.7566201865045,40.7565969465104,40.7565694923169,40.7565395363441,40.7565195030352,40.7564849403806,40.7564623231061,40.7564486926966,40.7564316428249,40.7564160077115,40.7564083452159,40.7564006975291,40.7563856951799,40.7563693918972,40.7563342676821,40.7563250093719,40.7563040859573,40.7562945405022,40.7562768146641,40.7562539602731,40.7562354553661,40.7562196989528,40.7561447228374,40.7561075063087,40.7560545153687,40.756034973066,40.7560027737209,40.7559468090668,40.7559211210438,40.7558976071835,40.7558726903564,40.7558467050646,40.7558148351846,40.7557403182062,40.7557196150517,40.7557067351916,40.7556881710824,40.7556583922,40.7556090095135,40.7555817038106,40.755563548759,40.7555293706622,40.7555002613041,40.7554807419935,40.7554739113687,40.7554657298573,40.7554443696601,40.7554413199271,40.7554377736336,40.7554229163869,40.7554177426298,40.7553982142634,40.7553819645502,40.7553607833142,40.7553414109893,40.7553066175065,40.7552748076254,40.7552414349947,40.7552241327578,40.755216361112,40.7552088127174,40.7551772966466,40.7551377321101,40.7550902644495,40.7550439983126,40.7550106031681,40.7549765650288,40.75497267733,40.7549637881394,40.7549592610277,40.7549396553969,40.7549323448094,40.7549256717579,40.7549043703445,40.7548839126362,40.7548528044981,40.7548333033575,40.754805613184,40.7547688404763,40.7547251329483,40.7546854034404,40.7546633573329,40.7546352941779,40.7545998807513,40.7545878217617,40.7545771383472,40.7545450004848,40.7544970870012,40.7544600685378,40.7544273697601,40.754383134266,40.7543336083181,40.7543122984646,40.7542852895483,40.7542332736228,40.7541913377843,40.7541394087918,40.7541219781921,40.7541065667952,40.7540893951526,40.7540558714667,40.7540196093608,40.7539814448167,40.7539422576735,40.7539176235634,40.7538923271294,40.7538671335439,40.7538428048671,40.7538200769969,40.7537996374089,40.7537736536655,40.7535838066691,40.7537963150002,40.7538639206673,40.7544910603547,40.7545150424789,40.7541306833467,40.7519052837267,40.7513017845451,40.7508826481068,40.7501532252542,40.7494582894496,40.7489095914899,40.748631931769,40.748286687902,40.7480126684928,40.7477913486168,40.7473647340024,40.7471576525076,40.7470710629488,40.7470215294036,40.7469769533883,40.7469377497663,40.7469042832447,40.7468885585259,40.7462041091385,40.7455239740791,40.7451506314946,40.7448505175602,40.7441757626274,40.743730569606,40.7435005707196,40.7434308938951]}]],[[{"lng":[-73.9692929641454,-73.9683893374683,-73.9679513912622,-73.9676154779079,-73.9672096204262,-73.9666697024391,-73.9665374718372,-73.9660741357412,-73.9658741864341,-73.9652043896813,-73.9645184480918,-73.9638688939085,-73.9631825209575,-73.9625499252884,-73.9625193039367,-73.9621797815518,-73.9623657998502,-73.9628396371634,-73.962482959087,-73.9623976909045,-73.9623590331906,-73.9623307288082,-73.9618983782424,-73.9619407043687,-73.9617499483519,-73.9615855611724,-73.9610926416812,-73.960738582953,-73.9602928166811,-73.9602374033646,-73.960223045397,-73.9601869192427,-73.9601725613865,-73.9601467801997,-73.9600971456535,-73.9600051980264,-73.959859394257,-73.9597137475643,-73.9595677012137,-73.9594225933236,-73.9592995959325,-73.9592759867973,-73.9591320677473,-73.9589832794176,-73.9588406201994,-73.9585856668255,-73.9583957158244,-73.9582457036948,-73.9582693030691,-73.9582921680775,-73.9613465588579,-73.963292055495,-73.9641038822544,-73.9643588344663,-73.9644217717163,-73.9655104335493,-73.9665724714336,-73.9675319676566,-73.9675069776285,-73.9674779632189,-73.967678283782,-73.9708260260517,-73.9739560163829,-73.9762090823007,-73.976568723559,-73.9766665945057,-73.9787036814745,-73.9787602246293,-73.9791839057777,-73.9796168008526,-73.9800351014829,-73.9804615544368,-73.980555795898,-73.9818789449431,-73.981966344575,-73.9824246558843,-73.9825728576109,-73.9826421227732,-73.9827316934269,-73.9828543607518,-73.9824163819714,-73.982891431904,-73.983911252868,-73.9839612023882,-73.9840150709398,-73.9840879215055,-73.9841540103577,-73.9842214620033,-73.9843741079783,-73.9847980530937,-73.9869952007545,-73.9869399138158,-73.98688953828,-73.9868300516626,-73.9867226390491,-73.986614618811,-73.9865630342566,-73.9882043707081,-73.9887115609878,-73.9887879656509,-73.9888192633713,-73.9890687390283,-73.9890981342512,-73.9891284072899,-73.9910586660132,-73.9913324976056,-73.9939292961589,-73.9937873699678,-73.9936042321314,-73.9933382296489,-73.9932683000288,-73.9930045171087,-73.992928890219,-73.9926855276291,-73.9926228608666,-73.9923636704325,-73.994360928302,-73.9962327810058,-73.9977692444504,-73.9980304864499,-73.9984527178269,-73.9989382900044,-73.9991005733859,-73.9992016187204,-73.9992881956256,-73.9993654019507,-73.9995127413904,-73.9999151736663,-74.000190403862,-74.0006230353021,-74.0006843903367,-74.0007730578865,-74.0017943198103,-74.0016998937267,-74.0017436211104,-74.004007959711,-74.0037456197246,-74.0034534855666,-74.0012701496867,-74.0009586848302,-74.0030139382908,-74.0026355689017,-74.0023980258379,-74.0002687237779,-73.9998821496038,-73.9995954679651,-73.9994614351467,-73.9994197196809,-73.9994130243321,-73.9995237390351,-74.0004893340596,-74.0004314734043,-73.9995933358124,-73.9995313520267,-73.9995877000669,-73.9995538908367,-73.9994073844296,-73.9995031786187,-73.9994740682061,-73.9992946883619,-73.9991819901686,-73.9989960413919,-73.9989396903469,-73.9988720727645,-73.9987645802771,-73.9988711709766,-74.0010490312356,-74.0004876862855,-73.9983776068577,-73.9980210272511,-74.0000184043362,-73.9994746390496,-73.9974989831,-73.9973674581169,-73.9971605424392,-73.9971814844639,-73.9971758435588,-73.997244628717,-73.9966976899746,-73.9968218908586,-73.9975276327397,-73.9977601109966,-73.9978016278631,-73.9981387996549,-73.9961922729477,-73.9958861195018,-73.9951382684069,-73.9950643849151,-73.9950459274832,-73.9954456431207,-73.9952934676697,-73.9949820331283,-73.9948003827486,-73.9946629034361,-73.9948576593374,-73.9949954253394,-73.9948823996847,-73.9949104306952,-73.9949296467529,-73.9950292598249,-73.9948820472641,-73.9948363743526,-73.9947693419157,-73.9947142423515,-73.9947715812517,-73.9947923146005,-73.9947923129999,-73.9947728622857,-73.994698074708,-73.9947761435346,-73.9947022906841,-73.9946360347443,-73.9945697901693,-73.9938634103188,-73.9938068724841,-73.993781554265,-73.9937745720781,-73.9936933612929,-73.9936879222448,-73.9935860697536,-73.9936264391673,-73.9935088140361,-73.9928010422898,-73.99269135575,-73.9925121068205,-73.992308337873,-73.9921270353507,-73.9921210063909,-73.991957154312,-73.9918615918932,-73.9914179478271,-73.9909475535079,-73.990714731148,-73.9905461799855,-73.9903076849382,-73.9902849603567,-73.9902272119601,-73.9900911139344,-73.9894935897135,-73.9893473471751,-73.9892004643616,-73.9890698965258,-73.988988977578,-73.9886972330477,-73.9884074480717,-73.9883033220854,-73.9882899911129,-73.9879567655754,-73.9872696936719,-73.9869234845564,-73.9868725221264,-73.9868232284123,-73.9867767914742,-73.9867343305167,-73.9866968689139,-73.9866653095445,-73.9866404130303,-73.9866227794053,-73.9865297294605,-73.9864291160867,-73.9864342989271,-73.9847433000917,-73.9840214984895,-73.9834380628795,-73.9834262754324,-73.9834065026424,-73.9833681994415,-73.983263986722,-73.9830863915882,-73.9830898656595,-73.9828355213527,-73.9827416188599,-73.9827450812466,-73.982748593677,-73.9824595687224,-73.9824589864156,-73.9824228717988,-73.9810239061828,-73.9810173390095,-73.9823020518388,-73.982329442166,-73.9809251031199,-73.980908645638,-73.9807407049495,-73.980220042526,-73.9802371538146,-73.9795591848724,-73.9795557993369,-73.9793286532598,-73.9792798318527,-73.9792733627686,-73.9792139170391,-73.9791827086697,-73.9790504990411,-73.9790576701228,-73.9789292013753,-73.9789311028554,-73.9790608491183,-73.9792433349359,-73.9791209224227,-73.9789635508107,-73.978865177554,-73.9788190904005,-73.9789276582375,-73.9787910619265,-73.9787382948663,-73.9786390665857,-73.9786016215401,-73.9786969819046,-73.9786844058447,-73.9786452922885,-73.9784655784896,-73.9784320225012,-73.9784569266504,-73.9784489915569,-73.9784218237489,-73.9783889555222,-73.9784217833127,-73.9784127146256,-73.9783810189819,-73.9783923054377,-73.9784013614419,-73.9783990943914,-73.9788564309652,-73.9788530336073,-73.9783922995734,-73.9783877652643,-73.9783447485287,-73.978351552585,-73.9783741922705,-73.9783629065039,-73.9783413980516,-73.9783470696972,-73.9783742369881,-73.9784059750025,-73.9783855990521,-73.9783912701033,-73.9784161750832,-73.9784540532827,-73.9784268336227,-73.9785931362013,-73.9785319882069,-73.9784419071594,-73.9782830199627,-73.9781619969166,-73.9781725698714,-73.9781768884553,-73.9780206732666,-73.9773557089441,-73.9773387840461,-73.9772620458,-73.9772119633924,-73.9775121549496,-73.9773608383371,-73.9772953835568,-73.977135626254,-73.9770551895912,-73.9768324636342,-73.9762386476849,-73.9759609634482,-73.9769274918835,-73.9766405923902,-73.9763483559312,-73.9761593729202,-73.9755345648974,-73.9753298739398,-73.9759476210284,-73.9759474688819,-73.975980927235,-73.9760058784546,-73.9758959808124,-73.9758141788266,-73.9758123447576,-73.9755930179054,-73.975600718404,-73.975610869319,-73.9755008317642,-73.9754034822457,-73.9745502338837,-73.9756119226431,-73.9757995183147,-73.9758036260455,-73.975800287795,-73.9757895998045,-73.975771870182,-73.9757476100193,-73.9757175186582,-73.9756824635305,-73.9756434551527,-73.9756016179965,-73.9755581580751,-73.9755143281789,-73.9754713917629,-73.9754305865272,-73.9753930887391,-73.9753599793267,-73.9751825417921,-73.9743185017185,-73.9741151399254,-73.9738887884854,-73.9738548810652,-73.9737621093659,-73.9735441755762,-73.9735559707605,-73.9732885360235,-73.9729264284862,-73.972573119672,-73.9723920139746,-73.972621031062,-73.9729829041212,-73.9732685501583,-73.9733300014653,-73.9735197065474,-73.9735359322334,-73.973757007132,-73.973186766709,-73.9728840477198,-73.9728457419607,-73.9715691389454,-73.9711382458321,-73.9709789685752,-73.9707820058799,-73.9708052443284,-73.9725422126723,-73.9725081027299,-73.9733245610394,-73.9728351278874,-73.972515944972,-73.9698255655953,-73.9694865521811,-73.9721313835225,-73.9728388997497,-73.9726693843376,-73.9718316965493,-73.9692453920736,-73.9689347481843,-73.9689851742897,-73.9714748384582,-73.9723124627611,-73.9721579882499,-73.9714565735483,-73.9711034229883,-73.9709330788632,-73.9710196311851,-73.9734044082712,-73.9746556960804,-73.9743908350232,-73.9734762959847,-73.972548800578,-73.9732987635985,-73.9746296660442,-73.9742361696854,-73.9731062709119,-73.9722179484903,-73.9717052494159,-73.9712249291225,-73.9710965548911,-73.9710043868583,-73.9710569230618,-73.9727575699836,-73.9723203207376,-73.97066975743,-73.9705406218224,-73.9702621853229,-73.9704888184858,-73.9701689450992,-73.970180755728,-73.9676211477992,-73.9675151669107,-73.9674767449303,-73.9683326374704,-73.9692969383771,-73.9692363268524,-73.9692929641454],"lat":[40.7070933310958,40.7068291867471,40.7057312170614,40.704961635387,40.7042557091534,40.7038066038877,40.7036966129153,40.7033201529412,40.7031576959966,40.7026227448141,40.7020749782679,40.7015418892111,40.7010000953747,40.7004970336439,40.7004726819675,40.7002207106044,40.6996055858518,40.6980386683399,40.6980953847548,40.6981089457377,40.6981150917399,40.6981195943247,40.6981883325315,40.6979116822372,40.6968461689056,40.6962074884059,40.6940105041868,40.6924239053023,40.6903462499155,40.6900622223053,40.6899886278864,40.6898034564914,40.6897298620638,40.6896087768417,40.6893452100975,40.6888810337183,40.6881474512173,40.6874156345935,40.6866825554247,40.6859503064327,40.6853348451315,40.6852167050472,40.6844851487008,40.6837499156536,40.6830180530165,40.6817424827147,40.6807977922576,40.6799851049055,40.6799068951275,40.6798311339974,40.680463524301,40.680881585896,40.681052391877,40.6811058760987,40.6811190793324,40.6813440199768,40.681564814365,40.6817687836176,40.6816870214012,40.6815862903941,40.6809554553115,40.6816159417546,40.6822697328902,40.6827295496811,40.6828270590431,40.6829722147987,40.6837443233783,40.6837654444832,40.6831288379729,40.6824912697107,40.6818526267385,40.6812225467569,40.6812583040727,40.6817710147314,40.6818048802675,40.6819824661363,40.6820398895047,40.6820667273451,40.6821014331121,40.6821489634618,40.6827805660987,40.6829653834689,40.6833623114889,40.683381751998,40.6834027180336,40.6834310717892,40.6834567933793,40.6834830448405,40.6835424548719,40.6829092290303,40.6837650103203,40.6838448061587,40.6839175137674,40.6840033717286,40.6841583994584,40.6843143041887,40.6843887556392,40.6850273069238,40.6852246184797,40.6851081993238,40.6850605086136,40.6846803718351,40.6846355816056,40.6845894530735,40.6853416955314,40.6854484062361,40.6864528711465,40.6867559669351,40.6871272300482,40.6876787969339,40.6878244518285,40.68836463604,40.6885194216226,40.6890332465313,40.689160548836,40.689690123777,40.6902394800844,40.6907577745864,40.6911946978608,40.6912537228763,40.6913699834776,40.6914951450345,40.6915369744965,40.6915718343477,40.6915939599271,40.6916130782729,40.6916514503089,40.6917672300104,40.6918964471302,40.6920414906675,40.6918978147893,40.6918957573263,40.6921847767889,40.6923827671366,40.6924067497055,40.6932081996324,40.6936162029811,40.6940516306714,40.6932960621764,40.6940690835822,40.6947778444792,40.6953620370376,40.6957116548645,40.694965802578,40.6956051992456,40.6960650388367,40.6962800266043,40.6963469378186,40.6963576764533,40.6965748265435,40.6969261950881,40.6970524661786,40.6967822614744,40.6968766126194,40.6968980571682,40.6969452323968,40.6968851894461,40.6967265076964,40.696704134462,40.6967951257941,40.6968851880648,40.696812278373,40.6969409405159,40.6969237845742,40.6971207325914,40.6971575772959,40.6979082361948,40.6987577781371,40.6980632961461,40.6987617365738,40.6994660480737,40.7003227780184,40.6996388693213,40.6996342349298,40.6997928126442,40.6999944849681,40.7001059914638,40.7001414093945,40.7008769769171,40.7009907823253,40.7012288169587,40.7013594148768,40.7013193947663,40.7015187877458,40.7033771408642,40.703260077085,40.7029741147229,40.7031003136535,40.7031318397996,40.7032753054718,40.703554065898,40.7033817155352,40.7032919586446,40.7034306085592,40.7035661385261,40.7036505637143,40.7037880258375,40.7037973159588,40.7037713155864,40.7038082008681,40.7040086538952,40.703986339081,40.7039528949536,40.703996689061,40.7040493603745,40.7040684056338,40.7040888947072,40.7041045416993,40.7041647007973,40.7042458610524,40.7042925319136,40.7043344034286,40.704376263514,40.704556007433,40.7045396132142,40.7044689445438,40.7044494574088,40.7044761288379,40.7044779142116,40.7045091182182,40.7045952446574,40.704623505274,40.7046340239279,40.7046298499454,40.7046941125576,40.7046900012402,40.7046896420336,40.7043962015779,40.7042006778533,40.7040866421044,40.7040040890207,40.7040324421392,40.7043513790406,40.7044161675018,40.704839880602,40.7048664293923,40.7049340444871,40.7049434632891,40.7048090381237,40.7047296917027,40.7047238969888,40.7047059146982,40.7046903567816,40.7045645787769,40.7045545008409,40.704540468955,40.7050706589976,40.7051342174126,40.7051757206943,40.7051624624859,40.7051572773862,40.7051461519976,40.7051293544607,40.7051072896238,40.7050804892857,40.7050495993776,40.7050153643952,40.7049786094542,40.7049790991737,40.7050691799306,40.7053486074197,40.7055429072671,40.7055986345647,40.7056440948479,40.7055772208469,40.7054663706604,40.7054610650766,40.7054850666606,40.7054770907023,40.7055115418259,40.705555807398,40.7055724415327,40.7055527098694,40.7055326912395,40.7055087972254,40.7055424144699,40.705822055452,40.7058989138936,40.7057975064678,40.7057369793997,40.7055520336641,40.7053692552005,40.7059079438118,40.7058551598704,40.705851075721,40.7057632835598,40.7057436152499,40.7057702152751,40.7057654328524,40.7057894819743,40.7059171353022,40.7059066402332,40.7059652149733,40.7059669635916,40.7059528891006,40.7059315898793,40.7059249057278,40.7059460289409,40.7055511963775,40.7055300696736,40.7055021965043,40.7058679556977,40.7058624675819,40.7054961991691,40.7054738087075,40.7054630646721,40.7058306482218,40.7058229685248,40.7054562604581,40.7054541771079,40.7055910215957,40.7055622218645,40.7056786353744,40.705684670847,40.7057165454175,40.7057130939598,40.7058302545873,40.7058380142362,40.7058707503505,40.7058664367771,40.7059706823108,40.7059724071944,40.7059827452024,40.7060595051001,40.706065534782,40.7059887742332,40.706006003881,40.7059999649876,40.7059655057719,40.7059680944684,40.705863848933,40.7058595372631,40.705825077834,40.705830251823,40.7057105065468,40.7057053336731,40.7056725969224,40.7056760484656,40.7055603752341,40.7055568085091,40.7049785841429,40.7048765234297,40.7048713958432,40.7046665516455,40.7045284275768,40.7044858413329,40.7044684436196,40.7042909664562,40.7041780897739,40.7042295507855,40.7042200963345,40.7042139266243,40.7031967526635,40.7031395205108,40.7031893080875,40.7030055814026,40.7031787689004,40.7036157418713,40.7047756441907,40.7047155069431,40.7027978204004,40.7024967660949,40.7022991057427,40.7021712803569,40.7030428088057,40.7029519243383,40.7020119965027,40.7020114937218,40.7019750358996,40.7019461332792,40.7019004708804,40.7018951826446,40.7018945042766,40.7018137887684,40.7018064667816,40.7017968145074,40.7017583089657,40.7019111475676,40.7015903438023,40.7000373159549,40.6997524180009,40.6997191860433,40.6996859041901,40.6996535318427,40.6996230021835,40.6995951952749,40.6995709126913,40.6995508544124,40.6995355986459,40.6995255851599,40.6995211026068,40.6995222802019,40.6995290839997,40.6995413178714,40.6995586291593,40.6995805188418,40.6998727901459,40.7011942950089,40.7013052709169,40.7010851943931,40.7010839860283,40.7010806805463,40.7008922925296,40.7008676318813,40.7006241845523,40.7002945534277,40.7000820561209,40.7001663227523,40.7004659955762,40.7008062657463,40.7010509109721,40.7010509252276,40.70122566022,40.7013274529891,40.7015341388818,40.7016698036737,40.701416795976,40.7014347234146,40.7003006796445,40.6999178932581,40.6998564576523,40.6999786630113,40.7000975003423,40.7016364427969,40.701662386463,40.7024126560107,40.702728740744,40.702465344221,40.700245070368,40.7005190607556,40.7027497385596,40.7033464280993,40.7035013804312,40.7029786695797,40.7013647418835,40.7016158682073,40.7017470887866,40.7033165413165,40.7038445395386,40.7039702076261,40.7035087159246,40.7034597358398,40.7036247725514,40.7038156136864,40.7053043356041,40.7060742629942,40.7063257741448,40.7056862833914,40.7062044905064,40.7066977137746,40.7076810607683,40.7080243861224,40.7071355692205,40.706505493033,40.7061360326809,40.7057898999111,40.7058500565582,40.7068282409466,40.7069464338167,40.7088312790503,40.7090828838067,40.7072597088215,40.7073160763539,40.7068875042841,40.7054006656219,40.7053618534073,40.7049292705669,40.7033485056969,40.7034373573807,40.7039498709563,40.7044833845842,40.7050883312297,40.705994313001,40.7070933310958]}]],[[{"lng":[-74.0017436211104,-74.0016998937267,-74.0017943198103,-74.0007730578865,-74.0006843903367,-74.0006230353021,-74.000190403862,-73.9999151736663,-73.9995127413904,-73.9993654019507,-73.9992881956256,-73.9992016187204,-73.9991005733859,-73.9989382900044,-73.9984527178269,-73.9980304864499,-73.9977692444504,-73.9962327810058,-73.994360928302,-73.9923636704325,-73.9926228608666,-73.9926855276291,-73.992928890219,-73.9930045171087,-73.9932683000288,-73.9933382296489,-73.9936042321314,-73.9937873699678,-73.9939292961589,-73.9913324976056,-73.9910586660132,-73.9891284072899,-73.9890981342512,-73.9890687390283,-73.9888192633713,-73.9887879656509,-73.9887115609878,-73.9882043707081,-73.9865630342566,-73.986614618811,-73.9867226390491,-73.9868300516626,-73.98688953828,-73.9869399138158,-73.9869952007545,-73.9847980530937,-73.9843741079783,-73.9842214620033,-73.9841540103577,-73.9840879215055,-73.9840150709398,-73.9839612023882,-73.983911252868,-73.982891431904,-73.9824163819714,-73.9828543607518,-73.9827316934269,-73.9826421227732,-73.9825728576109,-73.9824246558843,-73.981966344575,-73.9818789449431,-73.980555795898,-73.9804615544368,-73.9800351014829,-73.9796168008526,-73.9791839057777,-73.9787602246293,-73.9787036814745,-73.9766665945057,-73.976568723559,-73.9762090823007,-73.9739560163829,-73.9742267139578,-73.974391442015,-73.9739775765495,-73.9741044872183,-73.9745039588365,-73.9751431678887,-73.9746911837325,-73.9743104817796,-73.9735088335376,-73.9730525161378,-73.9727161502031,-73.9724449244621,-73.9718859677281,-73.9714229284868,-73.9710491910434,-73.9711253178971,-73.9711938443834,-73.9712544419753,-73.9713068201652,-73.9713507283514,-73.9713859555711,-73.9714123329649,-73.9714297341057,-73.9714648996102,-73.9714782916489,-73.9714696602279,-73.9714391947519,-73.9713815054419,-73.9713814371047,-73.971381345661,-73.9713585770846,-73.9713197494639,-73.9712758520266,-73.9712269643708,-73.9711731751398,-73.9711145821566,-73.9710512914015,-73.9709834176223,-73.9709110838728,-73.9708789450566,-73.970407345277,-73.9705026252364,-73.9708544070116,-73.9713252639015,-73.9718159465479,-73.9723172091348,-73.972819906653,-73.9733228431905,-73.9738252853462,-73.9743309359185,-73.9748332761671,-73.9753371462465,-73.9758313228491,-73.9763338616919,-73.9768451680885,-73.9773425303496,-73.9778427509164,-73.9783494522871,-73.9788547591815,-73.9793505994626,-73.9796535347633,-73.9797061990158,-73.9797618363971,-73.9798192734448,-73.9798772987375,-73.9799346884464,-73.9799902323078,-73.9800427586837,-73.9800911597291,-73.9801344146106,-73.9801716110372,-73.9822303421316,-73.9845915735521,-73.9869510181568,-73.989312730868,-73.991662828362,-73.99173365211,-73.991794990279,-73.9940355463928,-73.9964028117054,-73.9965929918862,-73.9967524379256,-73.9968449048378,-73.9969298850858,-73.9969646512533,-73.9971162468849,-73.9975773213401,-73.9976184668881,-73.9976483710815,-73.9977147427698,-73.9978713002276,-73.9979893158487,-73.9982251003896,-73.998456780805,-73.9985412805443,-73.9986188803608,-73.9986810823641,-73.9987694105892,-73.9989259123907,-73.9993110109892,-73.999621399733,-73.9996281366582,-73.9999108200748,-74.0003033780888,-74.0010566411319,-74.0014152710316,-74.0022150681655,-74.0028948387695,-74.0031907527484,-74.0036946200053,-74.0036302635154,-74.0039884200628,-74.0044025343906,-74.0051011119802,-74.0051022734627,-74.0054701720859,-74.00552727454,-74.0058636618068,-74.0059724114968,-74.0060018331981,-74.006255356596,-74.0062252348656,-74.006770625536,-74.0068308552184,-74.0068671303845,-74.0068608493116,-74.0068503788535,-74.0068413093371,-74.0068339027153,-74.0068283729114,-74.0068248796409,-74.0068235237983,-74.0068243445431,-74.0068273181691,-74.0068323587888,-74.0068393208146,-74.0068480031636,-74.0068581550652,-74.0068694833049,-74.0068816606923,-74.0068943355114,-74.0069071416794,-74.0069197093195,-74.0069316754446,-74.0069426944404,-74.0069524480484,-74.0069606545575,-74.0069670769408,-74.0069715297018,-74.0069738842316,-74.006974072524,-74.0069720891396,-74.0069679913633,-74.0069618975493,-74.0069539837034,-74.0069444783991,-74.0069336561759,-74.0069218296101,-74.0069093402862,-74.0068965489313,-74.0068962959209,-74.0068814194415,-74.0068697590867,-74.0068445242866,-74.006896266221,-74.0067502379238,-74.0063063503554,-74.0062566207362,-74.0060459645889,-74.0053190755274,-74.0047538869233,-74.0054392652935,-74.0060285141717,-74.006615721184,-74.006803459389,-74.0075482161839,-74.0077965334962,-74.0070872428781,-74.0098541185563,-74.0115401754333,-74.0157487288266,-74.0169026736108,-74.01744446051,-74.0178871914939,-74.0185760501088,-74.0187633687868,-74.0193394687178,-74.0188828336333,-74.0175103708669,-74.0166876836887,-74.0165753609784,-74.016486655545,-74.0160255177601,-74.0159369853455,-74.0122796787279,-74.0108766402898,-74.0103568366732,-74.0103384594794,-74.0105598064477,-74.0109102434041,-74.0108734397819,-74.0115428803157,-74.01162173117,-74.0115144346328,-74.0116252752136,-74.0140621982817,-74.0142492693188,-74.014241804775,-74.0117535050969,-74.0117719119658,-74.0117973545628,-74.011829461988,-74.0118677661764,-74.0119117087206,-74.0119629072948,-74.0120187392263,-74.0120783174313,-74.0121406953,-74.0122048817377,-74.0122698569129,-74.0123345884613,-74.0123980478898,-74.0124592269185,-74.0125171535016,-74.0125709072726,-74.0126196341678,-74.013098246981,-74.0135519867144,-74.0135983928718,-74.0136502464596,-74.0137063452598,-74.0137628109131,-74.0138207747741,-74.0138790057052,-74.0139362668966,-74.0139913421344,-74.0142740725772,-74.0150800647109,-74.0151998057007,-74.0143692064823,-74.0141230285602,-74.0138727376325,-74.0142328945278,-74.0155964448955,-74.0156862549752,-74.0142872217899,-74.0142292319044,-74.0129758779219,-74.0133637821814,-74.0139510936525,-74.0151191866396,-74.0163209992231,-74.0145794672096,-74.0149639218457,-74.0154395663873,-74.0167076523659,-74.018168392808,-74.0188009477692,-74.0172713847013,-74.0172928251957,-74.0177524709637,-74.0177980519032,-74.0178151522344,-74.0178930147166,-74.0178797161499,-74.0179442808025,-74.0179811122353,-74.0180107732054,-74.0179576057241,-74.0179234101333,-74.0178360492119,-74.0178569494518,-74.0178018720321,-74.0181153639023,-74.0181364052083,-74.0181536139001,-74.0181664970957,-74.0181746857997,-74.0181779454721,-74.0181761827467,-74.0180451953719,-74.0180239944048,-74.0180300407372,-74.0180357497576,-74.0180091642728,-74.0180167666967,-74.0179237059139,-74.017986404728,-74.0178344757269,-74.0181498618912,-74.0181954434749,-74.0182296424114,-74.0182980265533,-74.0184123582173,-74.0183195782651,-74.0182630240997,-74.0181707090551,-74.0183869279632,-74.018475221787,-74.0184227782698,-74.0185216335545,-74.0187566135211,-74.0187674803916,-74.018779553442,-74.0187924778013,-74.0188058735751,-74.0188193470131,-74.0188325020817,-74.0188449521056,-74.018856331133,-74.0188663046924,-74.0188745796239,-74.0188809126962,-74.0188851177563,-74.0188870712008,-74.0188867156099,-74.0188840614345,-74.0184103133309,-74.0184181404245,-74.0184295373354,-74.0184442612652,-74.0184619985357,-74.0184823712713,-74.0185371072702,-74.0185348637046,-74.0185284352133,-74.0185180160516,-74.0185039210674,-74.0184865761866,-74.0184665055432,-74.0184443156401,-74.0184206770221,-74.0183963040124,-74.0180175344586,-74.0179741087094,-74.017938386837,-74.017910652233,-74.0178911249316,-74.0178799598628,-74.0178772456227,-74.0178830037701,-74.0178971886547,-74.0179196877776,-74.0179727864566,-74.0179768500939,-74.0191089030861,-74.0191214219692,-74.0197692561323,-74.0199519786468,-74.0190825738633,-74.0191418357437,-74.0191892731334,-74.0191909876797,-74.0192189273765,-74.019177439469,-74.0190876381209,-74.0190825764446,-74.0190654150209,-74.0190410871127,-74.0190338738475,-74.0184304066161,-74.018429658497,-74.0184110318318,-74.018595042201,-74.0186253260616,-74.0186278707078,-74.0186298146203,-74.0186499133297,-74.0186623577716,-74.0189540584041,-74.0189832211536,-74.0189899524726,-74.0190213741365,-74.0194723889746,-74.0195385653754,-74.0196620030694,-74.019663126515,-74.0195520810164,-74.0195184175009,-74.0194286437791,-74.019425749498,-74.0193650147008,-74.0192794279839,-74.0192767176376,-74.0192748527343,-74.019246899636,-74.0192424119533,-74.0192065036038,-74.0191207936089,-74.0190640191753,-74.019032611224,-74.0190301377812,-74.0190258798951,-74.018994459346,-74.0189902916436,-74.0189871412217,-74.0188508522899,-74.0188475707886,-74.0188243386943,-74.0188160794958,-74.0188115915917,-74.0187801720101,-74.0187750393966,-74.0187175176008,-74.0186331977281,-74.0186319129539,-74.0186017917925,-74.0185999818873,-74.0185950598254,-74.0185647616791,-74.0185105917507,-74.01840544611,-74.0184178621022,-74.0182702613937,-74.018283149009,-74.018340688269,-74.0183831379754,-74.0185788278879,-74.0194395573721,-74.0194562003954,-74.0194727993366,-74.0194889048376,-74.0195040808984,-74.0195179166799,-74.0195300376265,-74.0195401156048,-74.0195478777877,-74.0195531140397,-74.0195556826061,-74.0195555139501,-74.019552612636,-74.0192812810203,-74.0190683342972,-74.0189281398833,-74.0189910547142,-74.0177253257244,-74.0176473508548,-74.0175704949416,-74.0174692890313,-74.0168483700235,-74.0167883401621,-74.0152008227913,-74.0153205986476,-74.0150829518708,-74.0148678280074,-74.0128200039887,-74.0126242829078,-74.0121228589365,-74.0121348168879,-74.0141054964797,-74.0136086327028,-74.0138739877799,-74.0137420664441,-74.013018354221,-74.0118628137717,-74.0106085808234,-74.0096710855888,-74.0100860394786,-74.0107731233938,-74.0117827220121,-74.0119325997708,-74.0121759661464,-74.0101162546778,-74.0087859013092,-74.0086955995557,-74.0085980332971,-74.0083544653217,-74.0081641459391,-74.007981841317,-74.00793441543,-74.0078871216416,-74.007826954742,-74.0077683363514,-74.0077170756182,-74.0075447440394,-74.0070198868266,-74.0064414683234,-74.0058822418323,-74.005666802467,-74.005629863304,-74.0078329376668,-74.007420121541,-74.0050037331507,-74.0045927052177,-74.0067843850584,-74.0063646122527,-74.0038203891973,-74.0034092162452,-74.0057590073637,-74.0053420962492,-74.0029756543657,-74.0019632199286,-74.0018530452462,-74.0009615685494,-74.0006990584188,-74.0047941529455,-74.00440941326,-74.0019693859211,-74.0018176504073,-74.0017436211104],"lat":[40.6924067497055,40.6923827671366,40.6921847767889,40.6918957573263,40.6918978147893,40.6920414906675,40.6918964471302,40.6917672300104,40.6916514503089,40.6916130782729,40.6915939599271,40.6915718343477,40.6915369744965,40.6914951450345,40.6913699834776,40.6912537228763,40.6911946978608,40.6907577745864,40.6902394800844,40.689690123777,40.689160548836,40.6890332465313,40.6885194216226,40.68836463604,40.6878244518285,40.6876787969339,40.6871272300482,40.6867559669351,40.6864528711465,40.6854484062361,40.6853416955314,40.6845894530735,40.6846355816056,40.6846803718351,40.6850605086136,40.6851081993238,40.6852246184797,40.6850273069238,40.6843887556392,40.6843143041887,40.6841583994584,40.6840033717286,40.6839175137674,40.6838448061587,40.6837650103203,40.6829092290303,40.6835424548719,40.6834830448405,40.6834567933793,40.6834310717892,40.6834027180336,40.683381751998,40.6833623114889,40.6829653834689,40.6827805660987,40.6821489634618,40.6821014331121,40.6820667273451,40.6820398895047,40.6819824661363,40.6818048802675,40.6817710147314,40.6812583040727,40.6812225467569,40.6818526267385,40.6824912697107,40.6831288379729,40.6837654444832,40.6837443233783,40.6829722147987,40.6828270590431,40.6827295496811,40.6822697328902,40.681504639034,40.6810461702467,40.6809832759687,40.6806496724439,40.6807332033245,40.6808719053068,40.6802666168047,40.6797348230713,40.6786391209694,40.6779986773799,40.6775228106869,40.6771620086036,40.6763946529768,40.6757546336564,40.6752371128027,40.675155501764,40.6750700754908,40.6749812435676,40.6748894319058,40.6747950808498,40.6746986425955,40.6746005795177,40.6745013617793,40.6743034195093,40.6741032381801,40.6739028980975,40.6737045069705,40.6735097068892,40.6735094900912,40.6735092803237,40.6734554990708,40.6733641885281,40.6732742191573,40.6731857540558,40.6730989535934,40.6730139750677,40.6729309725521,40.6728500965096,40.6727714935476,40.6727131748473,40.6726472194284,40.672445493491,40.6718643647745,40.6712482248942,40.6706294753052,40.6700290975678,40.6694271775256,40.668824923261,40.6682230881444,40.6676212350908,40.6670220980278,40.6664190955295,40.6658150797262,40.6652136035386,40.6646063820106,40.6640118972666,40.6634017694639,40.6627990154146,40.6622018328287,40.6615948211,40.6612432337311,40.6612617846824,40.6612743310468,40.6612806082055,40.6612804837651,40.6612739603501,40.6612611755975,40.6612423990874,40.6612180268403,40.6611885728972,40.6611546584779,40.6621414927937,40.6632837414232,40.6644252123044,40.6655663378135,40.6667042622991,40.6667365954421,40.6667662175984,40.667848253555,40.669008413751,40.6690931941774,40.669060501367,40.6690313247711,40.6691748470337,40.669234549029,40.6694733106429,40.670199484385,40.6702641422862,40.6703114375234,40.670415448363,40.6706614996912,40.6708420817575,40.6712028684063,40.6715680432278,40.6717046875678,40.6718301725648,40.6717391576037,40.6716020471051,40.6714149055079,40.6707726390467,40.670127167893,40.6701130768115,40.6694986684217,40.6687168924971,40.6689456817173,40.6683594143471,40.6685786374413,40.6673484659494,40.6672631998149,40.6674276112084,40.6675675233565,40.667665641641,40.6677790863226,40.6679753211003,40.6679756477282,40.6679512714282,40.6678992047115,40.6679937625857,40.667882362494,40.6678903619281,40.6673383029097,40.6673356376667,40.666188861941,40.6662089567073,40.6661287894127,40.6661261855657,40.6661205657922,40.6661136770965,40.6661057184436,40.6660969197017,40.6660875350031,40.666077835404,40.6660681010557,40.6660586131131,40.6660496456141,40.6660414575647,40.6660342854579,40.6660283364438,40.6660237823459,40.6660207546989,40.6660193409495,40.6660195819305,40.6660214706818,40.666024952651,40.6660299272696,40.6660362508572,40.6660437407713,40.6660521806828,40.6660613268242,40.6660709150297,40.6660806683656,40.6660903051286,40.6660995469821,40.6661081269958,40.6661157973547,40.6661223365173,40.6661275556141,40.666131303903,40.6661334731226,40.6661340006198,40.6661339956091,40.6661324666348,40.6661590801502,40.6662124483498,40.6662233826561,40.6665382991071,40.667495533618,40.6675957547139,40.6680532429779,40.6695542853664,40.6707213594476,40.6709214682385,40.6697847457766,40.668623156272,40.6685913751657,40.6670517457336,40.6671597707772,40.6685913580332,40.6685236283354,40.6650859197567,40.6645683362917,40.6648466028415,40.6652679963518,40.6658504662854,40.67039241387,40.6710758744944,40.6716249484227,40.6716016662055,40.6710345309842,40.6654370667669,40.6650385378399,40.6649305089539,40.6648630487881,40.6654707917215,40.6657324141589,40.6686016157636,40.6686428353885,40.6690781954481,40.6691905250697,40.6691904923695,40.6697101155584,40.6697843427504,40.6701143464474,40.6704070228788,40.6705810282759,40.6697058384365,40.6697286047372,40.6698083705388,40.6706577570758,40.6707030539127,40.6707463314555,40.6707869587855,40.6708243436186,40.6708579409408,40.6708884462933,40.6709138052963,40.670933615032,40.6709475607518,40.6709554208782,40.6709570705248,40.6709524834811,40.6709417326286,40.6709249887833,40.670902517981,40.6708746772505,40.6708419089405,40.6710549599123,40.6712569343772,40.671226917313,40.6712026127228,40.6711845841027,40.6711735946862,40.6711689710886,40.6711708115139,40.671179076872,40.6711935916088,40.6713792986793,40.6706856737981,40.6707540276644,40.6714547961561,40.6716693341374,40.6718807617605,40.6721300005131,40.6709704775174,40.6710388349289,40.6722411829999,40.6722072049903,40.673327918721,40.6735915369344,40.6731115881934,40.6721569959691,40.6729082695637,40.6744140170716,40.6746776302942,40.6742728821587,40.6731937744218,40.6719392411037,40.6722507648487,40.6736086458055,40.6736282150247,40.6740477228925,40.6740158989732,40.6740303579952,40.6739652645502,40.6739565898509,40.6738828204969,40.6738996380546,40.6739131810524,40.6739869486651,40.6739753841934,40.6740404791318,40.6740578305957,40.6740954414124,40.6743427016823,40.6743586454752,40.6743770624254,40.6743974250481,40.6744191501316,40.6744416154409,40.6744641775393,40.6747679107681,40.6748527583632,40.6749241078276,40.6749588168435,40.6749935314211,40.6750094395052,40.6750759813264,40.6751251436211,40.6752582230143,40.6754678794149,40.6754403931399,40.6754620819009,40.6754591791814,40.6753654494316,40.6753028125453,40.6753502231809,40.6752909056633,40.6750968465209,40.675153191397,40.6752081013348,40.6752687125877,40.675056454035,40.67505036597,40.67504578063,40.6750428327948,40.6750416091121,40.6750421455504,40.6750444263417,40.6750483844453,40.6750539035182,40.6750608213346,40.6750689345545,40.6750780047006,40.675087765168,40.6750979290603,40.6751081976233,40.6751182690256,40.6755190609858,40.6755381677054,40.6755562034215,40.6755727838991,40.6755875559056,40.675600204736,40.6757687904999,40.6757873380552,40.6758053095626,40.6758221619521,40.675837385971,40.6758505215733,40.6758611718213,40.6758690148808,40.6758738137464,40.6758754234037,40.6758843775577,40.6759488236561,40.6760159559103,40.6760852417856,40.6761561316614,40.6762280631915,40.676300465765,40.6763727650321,40.676444387461,40.6765147648871,40.6765128286957,40.6765679162061,40.6765442818882,40.6766155846381,40.6766132249173,40.67710301045,40.6771395640476,40.6777231343278,40.6777411827303,40.6777432711799,40.6777772885465,40.677826949007,40.6778312363988,40.6778314788134,40.6778501521189,40.6778766240178,40.677876998463,40.6779083213623,40.6779275848231,40.6784071217811,40.6783977736292,40.6783695815257,40.6783695811138,40.678369580799,40.6783848758373,40.6783943460031,40.6783814863046,40.6783524407378,40.6783532931807,40.6783772049148,40.6783583370506,40.6783019525936,40.678385638959,40.6783882012706,40.6784821776007,40.6784591206158,40.6784001983931,40.6784002823106,40.6784020299783,40.6784044944436,40.6784067724368,40.6784083394682,40.6784318333736,40.6784318341242,40.6784079243723,40.6784125619095,40.6784156345743,40.6784429727554,40.6784426585475,40.6784421191424,40.6784199168621,40.6784200163914,40.6784200921312,40.678423357207,40.6784260174143,40.6784448536761,40.6784515501039,40.6784515508377,40.67843020222,40.6784303209971,40.6784316687477,40.6784336421727,40.6784347623034,40.6784609809059,40.6784609811985,40.6784609819941,40.6784396324662,40.6784405118351,40.6784422200623,40.6785495513949,40.6785542184596,40.6787282894121,40.6787286722695,40.6787448216982,40.6789830794724,40.6789332936243,40.6789324523741,40.6789337001853,40.6789370032777,40.6789422722318,40.678949364409,40.6789580878135,40.6789682062894,40.6789794459143,40.678991502414,40.6790040494006,40.6790167472074,40.6790292520846,40.6796481405954,40.6797607479765,40.6798443056137,40.6799049937038,40.6806619026736,40.6806018908417,40.6806506481243,40.6806147317008,40.6809857589876,40.6810219652923,40.6819794194281,40.6821107287806,40.6822540993206,40.6823832140473,40.6836224164973,40.6834686963917,40.6829621778509,40.6829059280251,40.6817125193755,40.6812219467282,40.681009813319,40.6809177013429,40.6804123740144,40.6813984795506,40.682468760268,40.6832687277151,40.6836554310435,40.6843586155409,40.6837599954993,40.6838877491549,40.6840951856285,40.6853415977367,40.6861466022989,40.6861933180126,40.686252564085,40.6864002002507,40.6861747171615,40.6862758220959,40.6862819429786,40.6862457947934,40.6862406283318,40.6862491366716,40.6862644290184,40.686318244091,40.6865264176967,40.6862884902322,40.686195768391,40.6866980788338,40.6867842055411,40.6873850551628,40.6882062904359,40.6876059854009,40.6882152229866,40.6888268799583,40.689669668637,40.6889296446993,40.6896132611602,40.6902364000162,40.6910916029779,40.6904265759207,40.6901363794608,40.6903879872445,40.6901287683501,40.6906118584191,40.6917616203744,40.6925288003893,40.6918432088201,40.6922219624814,40.6924067497055]}]],[[{"lng":[-74.1594560243807,-74.1597481587429,-74.1599787569962,-74.1601497797169,-74.1603248563423,-74.1604697294025,-74.160583416439,-74.1606963816236,-74.1607783314368,-74.1608538858551,-74.1609453840248,-74.1610249026959,-74.1611124252205,-74.1611433241295,-74.1611818404392,-74.1611844355879,-74.1612044150741,-74.1612209244664,-74.1612281459845,-74.1612603798077,-74.1612888334855,-74.1613940264824,-74.1614465769923,-74.1614977600833,-74.1615407729505,-74.1615340324289,-74.1580975000887,-74.1580806249854,-74.1580241608312,-74.1579643392344,-74.1579341788003,-74.1578909606118,-74.1578459610329,-74.1577455636748,-74.1576281088869,-74.1575577885595,-74.1576741520986,-74.1578116894398,-74.1579258823506,-74.1580063345771,-74.1580745482245,-74.1581268769068,-74.1581420957172,-74.1581735817058,-74.1581990404634,-74.158258867774,-74.1583299258829,-74.1584500861119,-74.1585268760503,-74.1585874256811,-74.1586095910001,-74.1586861917961,-74.1587124678574,-74.1587549677637,-74.1588109374541,-74.1592002453446,-74.1593192556198,-74.1594560243807],"lat":[40.6414483328215,40.6414165257902,40.6414464808364,40.6414946816977,40.6415761781737,40.641643622513,40.6416666435855,40.6416895211446,40.6417390346269,40.6417540665251,40.6417872393533,40.6417992408604,40.6418354532347,40.6419069435176,40.6419960397619,40.6421148459602,40.6422319920385,40.642328707326,40.6426172832742,40.6427570675602,40.6428804399975,40.6433365435004,40.6435644085618,40.6437863671136,40.6439728299198,40.6441562824211,40.6437575671228,40.6437118357355,40.6436522098154,40.6436040945142,40.6435725390313,40.6435433773604,40.6434899673416,40.6434076396278,40.6433113234465,40.643239865981,40.643173429144,40.6431476211652,40.6430853080883,40.6430236758603,40.6429337018178,40.6428183157112,40.6427151050021,40.6426487267145,40.6425950776634,40.6425641258429,40.642527364215,40.6425045717895,40.6425001840928,40.6424603840835,40.6423956274726,40.6422769002717,40.6421677470564,40.6419911835296,40.6417586352429,40.6416504034748,40.6415563865718,40.6414483328215]}],[{"lng":[-74.0822127291494,-74.0821239438788,-74.0820462949325,-74.0818660354559,-74.0816524638857,-74.0814222820374,-74.0813560383372,-74.0809559824747,-74.0807283876237,-74.0805182378836,-74.079809964287,-74.0792325272494,-74.0789954633326,-74.0770865800269,-74.0769934108888,-74.0768289568095,-74.0765065715286,-74.076209225026,-74.0759922276154,-74.0753076702205,-74.0744528256364,-74.0740781209122,-74.0739583997646,-74.0738725805337,-74.0735910791928,-74.0734985136762,-74.0737586129538,-74.0738008832219,-74.0738291123217,-74.0737788034295,-74.0738341938234,-74.0738565368473,-74.0738214319199,-74.0733381385698,-74.0732453946485,-74.0734869412914,-74.0734183875406,-74.073690118065,-74.0734642981641,-74.0733332876388,-74.073349388193,-74.0732385381076,-74.0730574496531,-74.073025205072,-74.073202259547,-74.073012400295,-74.0730555988172,-74.0734138382779,-74.0734259074759,-74.0732727290153,-74.0733451713362,-74.0731218418351,-74.072925850374,-74.0728796413302,-74.072798503415,-74.0725877555387,-74.072703082676,-74.0726922655298,-74.0725961712549,-74.0725646823295,-74.0726123279568,-74.072599349268,-74.072572639401,-74.0725258752098,-74.0725755171922,-74.0726274240843,-74.0726166243939,-74.0726231121813,-74.072666307712,-74.0725538388441,-74.0725430349205,-74.0725322202573,-74.0725862304329,-74.0725992077413,-74.0725840870201,-74.0727246714508,-74.0727904221504,-74.0727458600086,-74.0727826061293,-74.0726982879903,-74.0723310089429,-74.0717067164824,-74.0717164118445,-74.0716873737673,-74.0716582975978,-74.0716824805113,-74.071687334134,-74.0723091904679,-74.0722558843628,-74.0721614838066,-74.0720184321324,-74.0721128181298,-74.072098261866,-74.0722321839642,-74.0722919028182,-74.0721848860161,-74.07197701849,-74.0719624775731,-74.0718608087087,-74.0717564808778,-74.0718702509904,-74.071862967984,-74.0719380005509,-74.0719476957863,-74.0720581750604,-74.0720008015548,-74.0719062401355,-74.071792592434,-74.0717707521253,-74.0716496940852,-74.071588916579,-74.0716278763372,-74.0715967920116,-74.0713561217663,-74.0713410941792,-74.0714909006389,-74.0714728470501,-74.0715020640516,-74.0714820243262,-74.0714433170632,-74.0714165971652,-74.071304872901,-74.0713078799052,-74.0711430928896,-74.0711310572094,-74.0715026314746,-74.0714777732261,-74.0716454090146,-74.0716489219899,-74.0717028612152,-74.0717035196727,-74.0721843496904,-74.0721095244463,-74.070374309906,-74.0703292371539,-74.073238291836,-74.0731440058598,-74.0702465869866,-74.0701939955927,-74.0730868981938,-74.0728900560963,-74.0719628096162,-74.0719817686511,-74.0718050036704,-74.0718114182292,-74.0700184914874,-74.069983546539,-74.0717764806754,-74.0717765805276,-74.0717776041814,-74.0717795287127,-74.0717823110228,-74.0717858888039,-74.0717901819341,-74.0717950942719,-74.0718001791059,-74.0718057609803,-74.07181171212,-74.0718178962971,-74.0718241719493,-74.0718303954205,-74.0718364242488,-74.0718364346041,-74.0728504119494,-74.0727769001111,-74.0730772583775,-74.0730903557878,-74.0730326595885,-74.0729293338475,-74.0729260113635,-74.0730161802915,-74.0730144456221,-74.0729319987184,-74.0729227839391,-74.072872655067,-74.0727933688742,-74.0727207645827,-74.0726702464206,-74.0726133813185,-74.0725880905415,-74.0725817300911,-74.0726093386762,-74.072388529503,-74.0723794112938,-74.0726063279755,-74.0725813387353,-74.0725727521261,-74.0734835380173,-74.0734563615981,-74.0735344759337,-74.0734873730356,-74.0734156263282,-74.0733734288804,-74.0732402072255,-74.0732385788387,-74.0725102522106,-74.0725042146961,-74.0723958663089,-74.0723958812341,-74.072103951649,-74.0720948380751,-74.0724108424751,-74.0724108549152,-74.072507170032,-74.0725041424481,-74.0728231570719,-74.0728291971569,-74.0729014239926,-74.0729014064582,-74.0732234340433,-74.0732311600813,-74.0733160490405,-74.073358220456,-74.0730394864668,-74.0728318441043,-74.0733282131641,-74.073057512998,-74.0729847461233,-74.0727820681781,-74.0680217354395,-74.0681301924799,-74.0729117793656,-74.0729282255191,-74.0725125940682,-74.0725035430728,-74.0724583585414,-74.0724492976148,-74.0724552786585,-74.0723990061677,-74.0723698422187,-74.0722952028267,-74.0729745953726,-74.0730287128247,-74.0730725030345,-74.0731378357197,-74.0731656340586,-74.0731920605383,-74.0732136008077,-74.073232362937,-74.0732664191674,-74.0733039479736,-74.0733275803113,-74.0733609503618,-74.073387352804,-74.0734214144515,-74.0734617290564,-74.0734964689557,-74.0735372972767,-74.0735485682667,-74.0735381360336,-74.0735158230786,-74.0735269464726,-74.0735192900301,-74.0735053780985,-74.073487300458,-74.0734713142002,-74.0734407302279,-74.0733781663633,-74.0733114284679,-74.0732613715131,-74.0732099312968,-74.0731995080981,-74.0728805883925,-74.0727054337728,-74.0725678017724,-74.0722550095577,-74.0712345554911,-74.0712159830704,-74.0711470448825,-74.0710617939655,-74.070989415226,-74.0709170697731,-74.0708237583934,-74.070788793745,-74.0707596091144,-74.0707199403692,-74.0705868140295,-74.0705669376257,-74.0705657781343,-74.0705680524043,-74.0705540306489,-74.0705061765062,-74.0704956626468,-74.0704477572997,-74.0703929141398,-74.0703695680075,-74.0703368750972,-74.0702819782229,-74.0702831270951,-74.070243404139,-74.0702200628292,-74.0701675444021,-74.0700869743589,-74.0700799570712,-74.0700799300196,-74.0700647196044,-74.0700273506158,-74.0699830075234,-74.069957356764,-74.0699445353284,-74.0699205973767,-74.0699037459483,-74.0698803921236,-74.0698815482554,-74.0698909248972,-74.0699060243201,-74.0698978246624,-74.0698780033211,-74.0698581498264,-74.0698397057815,-74.0697706520898,-74.0697837365309,-74.0697554308833,-74.0694626579128,-74.0692133249811,-74.0692246048855,-74.0687575029625,-74.068392688831,-74.0683704285743,-74.0672051910483,-74.0666915792443,-74.066656533117,-74.0664933529638,-74.0664225152255,-74.0664202750844,-74.0664146674395,-74.0659606527178,-74.0659100323003,-74.0663776127702,-74.066409889533,-74.0661990795487,-74.0655728084121,-74.0654458606948,-74.0660793790845,-74.0666820798292,-74.0664155871518,-74.0660499153591,-74.0656986474414,-74.0654654995275,-74.0651374231156,-74.0651304128228,-74.0649618928048,-74.0643570515867,-74.0642572175159,-74.0650990840721,-74.0644366200503,-74.0640121170204,-74.0639089224036,-74.0643274585805,-74.0641981286968,-74.0639106023492,-74.0638681679178,-74.0638284392291,-74.0637924920711,-74.0637612998317,-74.0637357071402,-74.0637302790527,-74.0637337263122,-74.0637459633993,-74.0637666867812,-74.0636860989525,-74.0635595449629,-74.0628872404992,-74.0628800578669,-74.0618326374661,-74.0614396145728,-74.0611815141251,-74.0610394201486,-74.0608085316575,-74.0607377937743,-74.0606494058952,-74.0606742614511,-74.0606123893038,-74.0605035922461,-74.0603368079202,-74.0602364881448,-74.0600902768904,-74.0600796731915,-74.0600045732293,-74.060008504501,-74.0598544432862,-74.0598670814194,-74.0598871675371,-74.059912238422,-74.059921205866,-74.0599521919466,-74.0599613278625,-74.0599919211909,-74.0600016118392,-74.0600181691866,-74.0600417658948,-74.0600473682174,-74.0600044761045,-74.0600162511624,-74.060197727956,-74.060195940971,-74.0599991971164,-74.0597693073818,-74.0600343232964,-74.0600204843536,-74.0602722480995,-74.0600775489673,-74.0599011042858,-74.0595330674896,-74.0595031263315,-74.0594756513105,-74.0594513277861,-74.059430762503,-74.0594144684558,-74.0591137796491,-74.0590226904748,-74.0589216345498,-74.0589013342152,-74.0589274475419,-74.0590456347314,-74.0591233393982,-74.0591221407178,-74.0590858430866,-74.0585788123101,-74.0584804297112,-74.0584773643764,-74.0583271141443,-74.0577621971334,-74.0573757032285,-74.0571638387898,-74.0571340354374,-74.057032635894,-74.0569988766926,-74.0569659895738,-74.0567927048816,-74.0567718170307,-74.0578935087154,-74.0604642972133,-74.0651709125078,-74.0646841079542,-74.0643006056805,-74.0641494698955,-74.0640480244343,-74.0635056566019,-74.0640008137063,-74.0650851416127,-74.0655066319099,-74.0666288063531,-74.0689811828008,-74.0691403098743,-74.0700036821387,-74.0715149332337,-74.0733520736676,-74.0735832666406,-74.073999653081,-74.0747894220168,-74.0754323971439,-74.0755171401,-74.0758492212917,-74.0765673473533,-74.0771469658721,-74.0777808956554,-74.0801476556437,-74.081554701236,-74.0828094986345,-74.0834193337422,-74.0835513160172,-74.0840678169856,-74.0849000251211,-74.0854275631428,-74.0867299710324,-74.087164216049,-74.08796268696,-74.0887463865131,-74.0894937013172,-74.090454959314,-74.0908154106232,-74.0930568561993,-74.0941095910939,-74.0944640494356,-74.0948248911882,-74.0951902707625,-74.0955582976852,-74.0959270457183,-74.0972175072902,-74.0973045568559,-74.0977696876388,-74.0993845303205,-74.0994698982082,-74.1000361659006,-74.1008280694218,-74.1013859682836,-74.1016547806967,-74.1018122545728,-74.1023959698123,-74.1029018244486,-74.1033759701738,-74.1042949546501,-74.1054938902475,-74.1066750969231,-74.1072296390472,-74.1077864524133,-74.1083441793557,-74.1088526825127,-74.1089014622398,-74.1094569652844,-74.1100093411824,-74.1104795650208,-74.1108265435469,-74.1111363814495,-74.1126374738107,-74.1129522981178,-74.1132727787911,-74.1135976182838,-74.1139254467172,-74.1142548823079,-74.1145845146131,-74.1148066736336,-74.1150291908367,-74.1152517866413,-74.1154741813677,-74.1156960955886,-74.1159172505448,-74.1161373683003,-74.1163561722905,-74.1165733876026,-74.1167887413211,-74.1169152638732,-74.1174278136688,-74.1183752738762,-74.1199551026624,-74.1209847227257,-74.1213517962625,-74.1224721469679,-74.1225232481015,-74.1232652198775,-74.1235063919732,-74.1239812611203,-74.1245261878744,-74.1251456324918,-74.1252004038081,-74.1263049784264,-74.1265091152447,-74.1267436156091,-74.1274296081366,-74.1278426714669,-74.1287489750645,-74.1298332375903,-74.1309400232729,-74.1315687340858,-74.1321045972236,-74.1330793880416,-74.1340090913369,-74.1349425823379,-74.1361628751426,-74.1364079738768,-74.1371367889934,-74.1380692982536,-74.1390029483852,-74.1398426516882,-74.1408864119256,-74.1418444922298,-74.142879167357,-74.14355036507,-74.1439455821311,-74.1445610109588,-74.1454990358979,-74.146281774311,-74.14724381883,-74.1475909532907,-74.1478892677469,-74.1482388665267,-74.1483961498217,-74.1488696133884,-74.149099517847,-74.1496842382463,-74.150186665171,-74.1503190076634,-74.1512034824914,-74.1531727534184,-74.1537183428746,-74.1537911672324,-74.153868323359,-74.1547408023168,-74.1547926527579,-74.1565118788053,-74.1573738365634,-74.1579267386242,-74.158617417266,-74.1591052153822,-74.1598317893642,-74.1605006921234,-74.1616180742892,-74.1623477632941,-74.1633739183966,-74.1639409497624,-74.1648419038537,-74.1657068252146,-74.1660319330625,-74.1674266668983,-74.167697103615,-74.1680808633964,-74.1684731134242,-74.1687847205829,-74.1688889431174,-74.1692362454647,-74.1695365651142,-74.1698574068933,-74.1709554651375,-74.1718117809592,-74.1720711300466,-74.1723626102388,-74.1727075220247,-74.1732673084324,-74.1736124409434,-74.1739501677995,-74.1742788798559,-74.174597062586,-74.1749032855397,-74.1751962573228,-74.1761005285905,-74.1777529863655,-74.177815021471,-74.1780882019124,-74.1782817743403,-74.1788839057371,-74.1791837742976,-74.1792462347089,-74.1795447069973,-74.1799370611388,-74.180334248424,-74.1819023571359,-74.1836879109284,-74.184426877268,-74.1851706590226,-74.1859191691804,-74.1866723204915,-74.1872941765054,-74.1879115568774,-74.1885243616571,-74.1891324916308,-74.1897358483375,-74.1903343342685,-74.1909278523288,-74.19151630641,-74.1920996012195,-74.1926776422956,-74.1929756774533,-74.1961412310206,-74.1961198339255,-74.1960983457685,-74.1960330392925,-74.1960226115935,-74.1960326018283,-74.196029046913,-74.195963867063,-74.1959455848558,-74.1958835533079,-74.1958060567968,-74.1956860928936,-74.1955768805797,-74.1955597525936,-74.1955275375725,-74.1955085218472,-74.1954869269248,-74.19547347097,-74.195460045448,-74.1954289412743,-74.1953921818181,-74.1953614204139,-74.1953293491205,-74.1953070435641,-74.1953040658198,-74.1953074731055,-74.1952893503173,-74.1952551116111,-74.1952126270202,-74.1951857730962,-74.1951782949684,-74.1951860124745,-74.1952066137094,-74.1952183296772,-74.19521533742,-74.1951995801065,-74.1951912648134,-74.195182084814,-74.1951789081691,-74.1951828091959,-74.1951989606933,-74.1952180479734,-74.1952242024813,-74.1952183436443,-74.1952094167651,-74.195205241607,-74.1952045014828,-74.195200969001,-74.1951766108465,-74.1951547961312,-74.1944948077446,-74.1945135216041,-74.194538002885,-74.1945471654312,-74.1945446229226,-74.1945260684378,-74.1944932346972,-74.1944585226273,-74.1944360654234,-74.1944225685479,-74.1944138694963,-74.1944496283607,-74.1944725220626,-74.1944964540511,-74.1945029597643,-74.1945185109163,-74.1945421257978,-74.1945612901362,-74.1945941227947,-74.1946213505899,-74.1946441833098,-74.1946561206246,-74.1946648484245,-74.1946795009384,-74.1946910617938,-74.1947021131716,-74.1947340388392,-74.1947712346407,-74.1947868968247,-74.1947765738464,-74.1947715070146,-74.194770775859,-74.1947553988095,-74.1947371364667,-74.1946231014519,-74.1945406538106,-74.1945003136082,-74.1944240592381,-74.1943903812557,-74.1943800480482,-74.1943668924539,-74.1943595427586,-74.1943594357064,-74.1943580610105,-74.1943565189597,-74.1943371695146,-74.1943111983336,-74.1942810992094,-74.194257510017,-74.1942351673307,-74.1942041110516,-74.1941741280135,-74.1941327571665,-74.1940828169559,-74.1939730862765,-74.1938983633938,-74.1938269242309,-74.1937742820784,-74.1937222485417,-74.1936265512071,-74.1935831769486,-74.1937196462209,-74.1932342882869,-74.1888189669685,-74.1870234700329,-74.186524968976,-74.1862320980966,-74.1861007857335,-74.1860631840011,-74.185981704392,-74.1859089666786,-74.185638574961,-74.1855741946739,-74.1855011655489,-74.185359267435,-74.1853454296375,-74.185303320134,-74.1852045294068,-74.1851358068276,-74.1851143161488,-74.1850886090233,-74.1851058832706,-74.1851743550745,-74.1852479359728,-74.1851963785235,-74.1851663459308,-74.1851362701024,-74.1849818130333,-74.1849268329308,-74.1848915539784,-74.1848658019589,-74.184846586784,-74.1848359458085,-74.1848254951987,-74.1847888182156,-74.1847731083301,-74.184770042638,-74.1847708510448,-74.1847718395766,-74.1847666430869,-74.1847577356207,-74.1847539079795,-74.1847486006983,-74.1847211948365,-74.1847001218683,-74.1846842556461,-74.1846596165069,-74.1846403745224,-74.1846281570112,-74.1846258908309,-74.1846177183209,-74.1846048914572,-74.184594930282,-74.1845860764883,-74.1845779388453,-74.1845532530629,-74.1845353559461,-74.1845124758307,-74.1844922640951,-74.1844721980557,-74.1844553333814,-74.1844471430653,-74.1844447942823,-74.1844433893306,-74.1844447687056,-74.1844445866403,-74.1844423383707,-74.1844357613095,-74.1844244496634,-74.1844020066903,-74.1842996776201,-74.1842441201757,-74.1842004767683,-74.1841781328016,-74.1841552188563,-74.1841327565863,-74.1841131906444,-74.1840953581982,-74.1840692351307,-74.1840637750652,-74.1840603107912,-74.1840555962864,-74.1840648323192,-74.1840761373723,-74.1840885478107,-74.1841065566164,-74.1841138601742,-74.1841173716868,-74.1841209654099,-74.1841299924189,-74.1841408429177,-74.1841535980247,-74.1841647573296,-74.184175525609,-74.1841869119477,-74.1841923922089,-74.1841974353449,-74.1842069892934,-74.1842166408692,-74.1842219649985,-74.1842223268822,-74.1842266904518,-74.1842328133643,-74.1842396156352,-74.184249704116,-74.1842601014089,-74.1842731009375,-74.1842832707536,-74.1842920252666,-74.1842979494031,-74.1843143684635,-74.1843217087798,-74.1843285569187,-74.1843320875596,-74.1843272518482,-74.1843152413485,-74.1843051996152,-74.1843051813303,-74.1843107605287,-74.184322962589,-74.1843328238055,-74.1843475661551,-74.1843615740828,-74.1843626446559,-74.1843592244624,-74.1843523401954,-74.1843417439023,-74.184333589167,-74.1843327734141,-74.1843393766651,-74.1843485856654,-74.1843597625506,-74.1843680268448,-74.184370467738,-74.1843590104983,-74.1843387350607,-74.1843121008167,-74.1842961058573,-74.1842756216647,-74.1842576581548,-74.1842418913178,-74.1842228856895,-74.1842144400002,-74.1842070655628,-74.1841989571676,-74.1841913356625,-74.1841895595892,-74.1841964375187,-74.184200792563,-74.1841960862891,-74.1841796129049,-74.1841588751478,-74.1841453961376,-74.1841350549975,-74.1840911459567,-74.1840764542184,-74.1840600544655,-74.1840374409907,-74.1840245429553,-74.1840117630117,-74.1840048060138,-74.1839913917367,-74.1839805322347,-74.1839696118677,-74.1839595333209,-74.1839549067064,-74.1839432513229,-74.1839326375868,-74.1839035841427,-74.1838238028877,-74.1837275016424,-74.1837208434843,-74.1837193919353,-74.1837261239643,-74.1837268731632,-74.1836506706406,-74.1836330057828,-74.1836216377141,-74.183615004558,-74.1836127166088,-74.1836167250486,-74.1836269837024,-74.1836363169948,-74.1836564248556,-74.1836726891303,-74.1836860863565,-74.1837050188129,-74.1837220267211,-74.1837372296288,-74.1837954852913,-74.1838066513827,-74.1838087720257,-74.1838037819007,-74.1837970667756,-74.183792258642,-74.1837881288082,-74.1837906864124,-74.1838013177471,-74.1838301914733,-74.1838669763111,-74.1838893723236,-74.1839143096973,-74.1839286508954,-74.1839445054408,-74.1839494593717,-74.1839480792666,-74.1839448939396,-74.1839527758581,-74.1839652294333,-74.1839804701284,-74.1840193827904,-74.1840297054294,-74.1840261119215,-74.1840160593143,-74.1839996926629,-74.1839751438876,-74.1839603738791,-74.1839476717792,-74.1839344986337,-74.1839201359059,-74.1839158616655,-74.183911079655,-74.1839034681329,-74.1838956829287,-74.183875570326,-74.1838457593691,-74.1838232526699,-74.1838008103757,-74.1837834927905,-74.1837601691038,-74.183743224099,-74.1837383084419,-74.183730479523,-74.183723122301,-74.1837107863426,-74.183691726861,-74.1836746827703,-74.1836645411182,-74.1836556701409,-74.1836367564231,-74.1836205458328,-74.183605441721,-74.1835617273757,-74.1835450268845,-74.1835393116318,-74.1835297885603,-74.1835156916417,-74.1834967142369,-74.1834742716646,-74.1834512120989,-74.1834338477906,-74.1834044102331,-74.1833845074681,-74.1833736033659,-74.183345417832,-74.1833278275572,-74.1833095391773,-74.1832835379204,-74.183265902295,-74.1832500261245,-74.1832421227928,-74.1832439997559,-74.1832544668051,-74.1832672925711,-74.1832835392778,-74.1833019165316,-74.1833180172884,-74.1833285841235,-74.183343515093,-74.1833594976973,-74.1833810340057,-74.1833992662457,-74.1834167004061,-74.1834282289109,-74.1834377710867,-74.1834458335298,-74.1834551306499,-74.1834631571095,-74.1834698866766,-74.1834738273398,-74.1834745364066,-74.1834698738528,-74.1834669505891,-74.1834630019432,-74.1834520875405,-74.1834324825653,-74.1834136585598,-74.1833996328772,-74.1833830393912,-74.1833776405034,-74.1833767046446,-74.1833847670973,-74.1833983279884,-74.1834159088867,-74.1834331620843,-74.1834573645993,-74.1834836063872,-74.1834903184377,-74.1834988177534,-74.1835069084765,-74.1835188912456,-74.1835301110549,-74.1835334205678,-74.183542327855,-74.1835430606545,-74.183535840479,-74.1835291889149,-74.1835428958738,-74.1835630869929,-74.1836173942194,-74.1836410875689,-74.1836648501578,-74.1836849420943,-74.1836998198491,-74.1837084599113,-74.1837151090172,-74.1837162972871,-74.1837243527366,-74.183729705456,-74.1837344591972,-74.1837568631378,-74.1837936734454,-74.1838004494242,-74.1837933628714,-74.1837755512802,-74.1837621687837,-74.1837442593566,-74.1837275021522,-74.1837042685541,-74.1836839640877,-74.1836698100389,-74.1836706257302,-74.1836716056155,-74.1836674587201,-74.183659746559,-74.1836339088722,-74.1835946460288,-74.1835638912663,-74.1835395966405,-74.1835041236949,-74.1834844199444,-74.1834473052271,-74.183417511422,-74.1833919018625,-74.1833595039949,-74.1833256914269,-74.1832882327298,-74.1832678292809,-74.1832449219577,-74.1832261131577,-74.1832093571293,-74.1831831291711,-74.1831516115433,-74.1831060694867,-74.1829800010379,-74.1828893162184,-74.1827975700767,-74.1827282966811,-74.1826531803974,-74.1825850137457,-74.182510923557,-74.1824283217282,-74.1823356331157,-74.1822796854327,-74.1822209079047,-74.1820090620486,-74.1819861648959,-74.1819524617875,-74.1819282319002,-74.1818999819254,-74.1818678928017,-74.1818421995707,-74.1817939719293,-74.1817493551966,-74.1817159158691,-74.1816676335006,-74.1816270643461,-74.1815907420064,-74.1815442312971,-74.1814943987325,-74.1814499395321,-74.1814165284401,-74.1813810665639,-74.1813332727931,-74.1812950936092,-74.1812707809655,-74.1812443536097,-74.1812165934919,-74.1811843424393,-74.1811600654508,-74.1811346991412,-74.1811125703127,-74.1810865231358,-74.1810650824921,-74.1810423912372,-74.1810329091121,-74.1810070487262,-74.1809952879368,-74.1809765149715,-74.1809630964181,-74.1809444506256,-74.1809157994875,-74.1808942075147,-74.1808721251322,-74.1808501901789,-74.1808286272016,-74.1808068653847,-74.1808018321768,-74.180805128549,-74.18080739951,-74.1808078013712,-74.1808069954587,-74.1808051037246,-74.18080491631,-74.1808032855983,-74.1807999936322,-74.1807928938142,-74.1807883664043,-74.1807699430072,-74.180751927183,-74.1807129832458,-74.1806757979002,-74.1806291420583,-74.1806050729297,-74.1805815414821,-74.1805271909094,-74.1805032392335,-74.1804991783595,-74.1804899776992,-74.1804817395366,-74.1800407794923,-74.1800477217928,-74.1799067145553,-74.1799240477008,-74.1799365601228,-74.1799650727402,-74.1798956834003,-74.1798840636142,-74.1798437695035,-74.1798483940912,-74.179774527333,-74.1797298775204,-74.1793311724943,-74.1793315380847,-74.1793143250338,-74.1793047609758,-74.1792994217032,-74.1792984192646,-74.1793017747006,-74.1793110941751,-74.1793156765471,-74.1793300972013,-74.1793306293518,-74.1793332044071,-74.1793345668085,-74.1793346797657,-74.1793335402282,-74.1793311789674,-74.1793102522533,-74.1792924908406,-74.1792916601138,-74.1792883006844,-74.1792824625499,-74.1792810016676,-74.1792846610363,-74.1792933539825,-74.179306874602,-74.1793249026371,-74.179336687716,-74.179338520702,-74.1793397382094,-74.179340307993,-74.1793402149624,-74.1793394615812,-74.1793380678023,-74.1793360705394,-74.1793031962161,-74.1792512334066,-74.179211869959,-74.1792027129182,-74.1791928812337,-74.179171519671,-74.179153993854,-74.1791443307641,-74.1791278828046,-74.1791061325883,-74.1790746658389,-74.1790814414026,-74.1790676774293,-74.1790564783293,-74.1790551334485,-74.179053524621,-74.1790456580247,-74.1790494161958,-74.1790596462759,-74.1790441057025,-74.1790396659129,-74.1790261907259,-74.1790167660356,-74.1790089501765,-74.1790060458651,-74.1790019685346,-74.1790014871545,-74.1790081492062,-74.1790187639508,-74.1790356370138,-74.1790355592856,-74.1790453882432,-74.1790659065114,-74.1790795948969,-74.1791012423097,-74.1791139458235,-74.1791334360188,-74.1791620364555,-74.1791790812681,-74.1792077048166,-74.1792363054283,-74.1792540442163,-74.1792696725185,-74.1792858791854,-74.179308078267,-74.1793295090664,-74.1793389072359,-74.1793524748159,-74.1793749830344,-74.1793859617267,-74.1793953340768,-74.1794048280203,-74.1794083264653,-74.1794057831752,-74.1793958343502,-74.1793808028684,-74.1793708038433,-74.1793725304565,-74.1793807514004,-74.1793928348582,-74.1794101430954,-74.1794235198441,-74.1794354805101,-74.1794336816766,-74.179421167376,-74.1794077368491,-74.179416866805,-74.1794109227675,-74.1794072847307,-74.1794053083524,-74.1793945100098,-74.1793883898395,-74.1793852836143,-74.1793951255382,-74.1794015785892,-74.1794040163088,-74.1794084470563,-74.1794157854734,-74.1794284438358,-74.1794392413294,-74.1794544507687,-74.179469771639,-74.1794726081395,-74.1794840262465,-74.1794946243289,-74.1795238200983,-74.1795291402254,-74.1795324894015,-74.1795425331849,-74.1795418885992,-74.1795469629251,-74.1795529269747,-74.1795561160981,-74.1795703501622,-74.1795820775084,-74.1795915012831,-74.179600746756,-74.1796043799412,-74.1796022935593,-74.1796121356732,-74.179609673373,-74.1796059664849,-74.1796018181681,-74.1795975821488,-74.1795871372141,-74.1795688885904,-74.1795575356898,-74.1795538345618,-74.1795490462879,-74.1795430426735,-74.1795339820554,-74.1795227427538,-74.1795071789818,-74.179485606782,-74.179483390033,-74.1794721304225,-74.1794620870392,-74.1794049107093,-74.1793935826967,-74.179377862092,-74.1793672887672,-74.1793401762239,-74.179328358587,-74.1793220169517,-74.1793161871242,-74.1793136167691,-74.1793141070972,-74.1793039781062,-74.1792935357681,-74.1792748897108,-74.1792440480751,-74.1792211297449,-74.1791872806743,-74.1791585616137,-74.1791398613662,-74.1791228646587,-74.1790817492684,-74.179063313411,-74.1790505832986,-74.1790392681086,-74.1790188165325,-74.1789844594886,-74.1789462643083,-74.178938208876,-74.1789318779192,-74.1789220482197,-74.1789090055482,-74.1788900868083,-74.1788888924679,-74.1788375586262,-74.1788209437353,-74.1788118087669,-74.1788019079681,-74.1787907843687,-74.1787811448278,-74.1787707175887,-74.1787354316599,-74.1786761242806,-74.1786406200643,-74.1785990982218,-74.1785135615448,-74.1784831382722,-74.1784702390633,-74.1784248296991,-74.1783951236717,-74.178369901485,-74.1783492357988,-74.1783339635217,-74.178320321909,-74.1783066798634,-74.178291263983,-74.178272612486,-74.1782566214603,-74.1782449476874,-74.1782360066261,-74.1782390999614,-74.1782867414142,-74.178347617072,-74.1783600122331,-74.1783683086274,-74.1783613096398,-74.1783412701196,-74.1783171291722,-74.1782887449354,-74.1782460258198,-74.1782021765537,-74.178173240869,-74.1781522165308,-74.1781329886773,-74.1781099265079,-74.1780613329667,-74.1780076345715,-74.1779834935718,-74.177959521865,-74.1779559982533,-74.1779400335895,-74.1779307085353,-74.1778907931584,-74.1778667719044,-74.1778408806159,-74.1778235955294,-74.1778123760877,-74.1777980401847,-74.1777897840412,-74.1777854322409,-74.1777733061394,-74.1777693527224,-74.1777595736341,-74.1777431051537,-74.177728065662,-74.1777206674806,-74.1776863629984,-74.1776402154951,-74.1775312840748,-74.1774883729559,-74.1774586452386,-74.177441384621,-74.1774225480879,-74.1773959137474,-74.1773857436062,-74.177353725443,-74.1773282685309,-74.1772693509244,-74.1772589893104,-74.1772411227327,-74.1772111857095,-74.1771735255775,-74.1771404213281,-74.1771348059392,-74.1771378426717,-74.1771434442994,-74.1771483824075,-74.1771545454805,-74.1771551049564,-74.1771552839548,-74.1771511870448,-74.1771453791091,-74.1771318774029,-74.1771187583656,-74.1770989930608,-74.1770933016005,-74.1770874193489,-74.1770759221522,-74.1770577629456,-74.1770359775905,-74.1769808824638,-74.1769285450689,-74.1768873353247,-74.1768676428622,-74.1768473767409,-74.1768238689604,-74.1768129047834,-74.1768119330083,-74.1768151479469,-74.1768138074244,-74.1768051405487,-74.1767931445653,-74.1767817964472,-74.1767728228848,-74.1767673853184,-74.176771838318,-74.1767741985175,-74.1767718111686,-74.1767696150389,-74.1767611281468,-74.1767481454634,-74.1767361217451,-74.1767261157428,-74.1767159306661,-74.1767048915117,-74.1766955768324,-74.1767010143561,-74.1766993183296,-74.176694288811,-74.1766862119556,-74.1766834551962,-74.1764825728458,-74.1763907772988,-74.1763688010919,-74.1763578661753,-74.176349506657,-74.176358835594,-74.1763835687842,-74.1765921871739,-74.176652115517,-74.1766757134282,-74.1766872379122,-74.1767167439317,-74.1767244249508,-74.1767168530947,-74.1767058828444,-74.176708488327,-74.176711093376,-74.1767077904899,-74.1766839050925,-74.1766762510197,-74.1766679553825,-74.1766502809557,-74.176616451692,-74.1765848919263,-74.1765387716303,-74.1765146138673,-74.1764965409312,-74.1764732522115,-74.1764338073171,-74.1763712644375,-74.176336667138,-74.1762882750847,-74.1761039225724,-74.1759818319192,-74.1758975780591,-74.1758500274789,-74.1757796470287,-74.175731228269,-74.1757073504662,-74.1756896487599,-74.1756845067306,-74.1756756481692,-74.1756697398141,-74.175664787668,-74.1756412036402,-74.1756268457992,-74.1756025095443,-74.1755826545851,-74.1755322102409,-74.1755279766243,-74.1755166411693,-74.1754841791405,-74.1754857932712,-74.1754908667434,-74.175504080227,-74.1755034564365,-74.1755040579344,-74.1755064451168,-74.1755198580638,-74.1755395485611,-74.17557190132,-74.1755845622616,-74.1755864902898,-74.175565114645,-74.1755553273533,-74.1755323312601,-74.1755192260767,-74.1755021389857,-74.1754840199677,-74.1754769120152,-74.1754777055782,-74.1754765953167,-74.175480324392,-74.1754915945825,-74.1754925512184,-74.1754775450056,-74.1754716625528,-74.1754729135591,-74.1754771130472,-74.175494239784,-74.1755197250761,-74.1755469212418,-74.1755691163698,-74.175623523596,-74.1757076850473,-74.1757087996122,-74.1756997778929,-74.1756900921499,-74.1756900156247,-74.1756847074258,-74.1756694080407,-74.1756517059875,-74.1756247760321,-74.1756017406819,-74.1755903182852,-74.1755752846883,-74.1755589230505,-74.1755270697419,-74.1754993129942,-74.175466911572,-74.1754424095345,-74.1754052896231,-74.1753750953005,-74.1753505323223,-74.1753462838135,-74.1753466040377,-74.1753274914682,-74.1752969154506,-74.1752587960805,-74.1752088841638,-74.1751663874444,-74.17511371862,-74.1750418570967,-74.174953354567,-74.1748962052513,-74.1748554056801,-74.1747883544586,-74.1747520964775,-74.1747200385446,-74.1746801817274,-74.1746445119179,-74.1746087518242,-74.1745862147746,-74.1745513226936,-74.1745492383907,-74.1745226229698,-74.1745018207919,-74.1744825385649,-74.1744651584218,-74.1744595556281,-74.1744475844544,-74.1744320929955,-74.1743946348973,-74.1743657294361,-74.1741537399046,-74.1741110252966,-74.1740590828623,-74.1740548408656,-74.1740333926389,-74.1740124513486,-74.1739963697913,-74.1739501335386,-74.1738861956904,-74.1737873409299,-74.1736411255205,-74.173598692665,-74.1735448378662,-74.1734814746966,-74.1734312431563,-74.1733831948871,-74.1733256259606,-74.1732393164173,-74.1731548195888,-74.1730911777886,-74.1730446594831,-74.1730004279918,-74.1729742183035,-74.1729686514103,-74.1729412389165,-74.1729233337384,-74.1729229255567,-74.172916799197,-74.1729102135975,-74.1728864131037,-74.1728769823726,-74.1728888372496,-74.1729170546054,-74.1729543046914,-74.1729827885465,-74.173001854924,-74.1730162494816,-74.1730281811762,-74.1730197591178,-74.1730015458565,-74.1729731776963,-74.1729480484988,-74.1729211221144,-74.1728961418757,-74.1728933409512,-74.1728717473642,-74.1728467352471,-74.1728229721441,-74.1727838206599,-74.1727539706459,-74.1727152770952,-74.1726771463489,-74.1726366266963,-74.1725109072377,-74.1725070075418,-74.1724478448507,-74.1724339476584,-74.172424988389,-74.1724147927306,-74.1724089734547,-74.1724043087927,-74.172403448119,-74.1723884015702,-74.1723726036919,-74.1723616538658,-74.1723701911474,-74.1723981267516,-74.1724234076358,-74.1724595339966,-74.1724791236716,-74.1725080282729,-74.1725268527777,-74.1725452934826,-74.1725422440035,-74.172521417057,-74.1725008695513,-74.1724903037232,-74.1725203313273,-74.1725492365645,-74.1725558853614,-74.1725534854742,-74.1725708551334,-74.1726103004065,-74.1726368189117,-74.1726877627214,-74.1727196918095,-74.1727340354813,-74.1727317383761,-74.172728969401,-74.1727214530519,-74.1726911322785,-74.1726444633723,-74.1725900869711,-74.1725719268556,-74.1725625972165,-74.1725599060188,-74.1725524645668,-74.1725390393324,-74.1725059252311,-74.1724901252264,-74.1724798302517,-74.1724665296965,-74.1724402786201,-74.1723939799338,-74.1723698481319,-74.1723487539136,-74.1723268925558,-74.1723121538647,-74.1723025435188,-74.1722810538992,-74.1722268680073,-74.1721484102897,-74.1720978368981,-74.1720525842927,-74.1720323441418,-74.1720071529846,-74.1719853686176,-74.1719633056599,-74.1719551374492,-74.1719296911769,-74.1718808529777,-74.1718725950499,-74.1718554050919,-74.1718404989471,-74.1717938551895,-74.1717503385207,-74.171658327406,-74.1715720073874,-74.1715107741458,-74.1715081109973,-74.1714748162796,-74.1714459876187,-74.1714296151884,-74.1714236935794,-74.1714332783833,-74.1714488615698,-74.1714673009927,-74.1714829855417,-74.1714911523035,-74.171472610194,-74.1714537863652,-74.1714321947034,-74.1714064038123,-74.1713478695363,-74.1713358728181,-74.1713479329689,-74.1713682752735,-74.1713954571441,-74.1714405829383,-74.17150330553,-74.1716459422364,-74.1717694870766,-74.1718195751345,-74.1718423805154,-74.1718583448554,-74.1718604258258,-74.1718325674351,-74.1717898807473,-74.1717607840136,-74.1717501278703,-74.1717544924505,-74.1717959169155,-74.1718233683028,-74.1718462485307,-74.1718492724512,-74.1718401246179,-74.171822513898,-74.1718027201441,-74.1717829403092,-74.1717555552444,-74.171734345319,-74.1717231158891,-74.1717281302479,-74.1717583377351,-74.171770296471,-74.1717645795822,-74.1717462155455,-74.1717187278213,-74.1716960887246,-74.1716821666447,-74.1716712815487,-74.1716799981048,-74.1716942410577,-74.1717122849497,-74.1717218695049,-74.1717113031629,-74.1716975975874,-74.1716648782834,-74.1716279723204,-74.171604479422,-74.171591361068,-74.1715798619225,-74.1715618947411,-74.1715506645337,-74.1715394222351,-74.1715266618959,-74.1715085795052,-74.1714949639567,-74.1714885709421,-74.1714833247627,-74.1714787898945,-74.1714835301859,-74.1714875067279,-74.1714850688069,-74.1714787214452,-74.1714680089049,-74.171465068423,-74.1714538709737,-74.1714522887381,-74.1714630212239,-74.1714762292275,-74.1714831641924,-74.1714911412025,-74.1714937829857,-74.1714963733101,-74.1714952193453,-74.1714905486945,-74.1714866379448,-74.1714846220515,-74.1714849353251,-74.1714932806684,-74.1715070444534,-74.1715157343783,-74.1715222942605,-74.1715405942017,-74.1715605531319,-74.1715768987371,-74.1715896745471,-74.1715927998756,-74.1716021028776,-74.1716061755619,-74.171599551894,-74.1715900830608,-74.1715811380519,-74.1715732841174,-74.1715742720483,-74.1715802447481,-74.1715872192374,-74.1715971917377,-74.1716007079577,-74.1716248618878,-74.1716511916402,-74.1717056688525,-74.1717507343241,-74.1717824911718,-74.1718370645924,-74.1719130762053,-74.1719707814098,-74.1720042927544,-74.1720231585235,-74.1720543295956,-74.1720897732115,-74.172257793126,-74.1722957577536,-74.172332153088,-74.1723652739651,-74.1723921694625,-74.1724160191034,-74.1724312171361,-74.1724407109894,-74.172447589678,-74.1724607914743,-74.1724794616066,-74.172510062131,-74.1725452306331,-74.1726175741688,-74.1726525587914,-74.1727040367257,-74.1727523314146,-74.1727962478836,-74.1728432973644,-74.1729038433586,-74.172938961754,-74.1729666153532,-74.1729879887585,-74.1729992381907,-74.1730038838114,-74.17299926424,-74.1729905111473,-74.1729879880031,-74.1729799058207,-74.1729675456654,-74.1729591880983,-74.1729412319821,-74.1729191436166,-74.1728894995599,-74.1728534883566,-74.172825119327,-74.1727994132234,-74.1727561143921,-74.1727136650175,-74.1726278212175,-74.1725570483046,-74.1725012509345,-74.1724611418626,-74.1724373884874,-74.17237264272,-74.1723079886836,-74.1722154325725,-74.1721097577176,-74.172062005147,-74.1720244616686,-74.1719924762055,-74.1719657158356,-74.1719367665939,-74.1718997846608,-74.1718640859913,-74.171817169814,-74.1717762885643,-74.1717354590031,-74.1716934884309,-74.1716577376186,-74.1716231713125,-74.1716010726542,-74.1715849607511,-74.1715699468542,-74.1715590748124,-74.1715539568968,-74.1715474160606,-74.1715491453159,-74.1715663401011,-74.171565452232,-74.1715588562976,-74.171546694245,-74.1715293446476,-74.171511708403,-74.1714973088786,-74.1714932694843,-74.1714799203521,-74.1714558850582,-74.1714420386606,-74.1714385975189,-74.1714396572437,-74.1714310172024,-74.1714086451093,-74.1713974413457,-74.1713865185935,-74.171386146815,-74.171401761581,-74.1713905404507,-74.1713738235051,-74.1713274013555,-74.1711541244912,-74.1711773463552,-74.1710501723989,-74.1709920875226,-74.1712752444561,-74.1712113010523,-74.1711926095121,-74.1702863544111,-74.1700787865105,-74.1691529556914,-74.1690643162887,-74.1684023253057,-74.1682434357728,-74.1682342144125,-74.1682040289716,-74.1681254749266,-74.16801680461,-74.1677409405136,-74.1675760709251,-74.1667738499355,-74.1667169375705,-74.1665337579284,-74.1664797188299,-74.1662159991718,-74.1660998989603,-74.1663188729246,-74.1661160866904,-74.1660453490875,-74.165910141479,-74.165801107559,-74.165634097638,-74.165443100824,-74.1649413904131,-74.1651904175824,-74.1648110926634,-74.1647342653681,-74.1645713236685,-74.1644145964924,-74.1645965659758,-74.1642355930395,-74.1641688681363,-74.1640017900142,-74.1638624942036,-74.1640473151664,-74.1639965645573,-74.163944913667,-74.1638497658629,-74.1637525635069,-74.1636538853251,-74.1635543188294,-74.16345445682,-74.1632457793263,-74.1628714808786,-74.1628579940694,-74.1628050278943,-74.1627521292517,-74.1626464137992,-74.1625097636999,-74.1624347706588,-74.162069018689,-74.1620691886898,-74.1616753469423,-74.1622846525209,-74.1620256407051,-74.1618185661226,-74.1614491782689,-74.1613022180155,-74.1616601070699,-74.1612401581499,-74.1611578955031,-74.1609049077051,-74.1607365487248,-74.161064280653,-74.1610816175891,-74.1608919896109,-74.1608112684074,-74.160762219471,-74.1607506030919,-74.1604218697274,-74.1603481999317,-74.1599489963448,-74.1598641046504,-74.160206919224,-74.1602347053031,-74.160224664531,-74.1601651513392,-74.1601272556782,-74.1601109242345,-74.1600983707883,-74.160057540661,-74.1600261541872,-74.1599928110187,-74.1599583519461,-74.1599236459,-74.1598895680384,-74.159856977679,-74.1597817530621,-74.1597301046699,-74.1597373290745,-74.1597200004094,-74.1596709437014,-74.1596414652894,-74.1596314936957,-74.1596311809968,-74.1595771239791,-74.1595025801432,-74.1594570478402,-74.1594477035375,-74.1594197309645,-74.1593195403716,-74.1592271162295,-74.1591641581224,-74.1591610760113,-74.1591446080743,-74.1591271123761,-74.1591106290415,-74.1590962110192,-74.1590869513726,-74.1590766446494,-74.1590562237889,-74.159015212849,-74.1589894137285,-74.1590253286346,-74.1590095788743,-74.1588953235085,-74.1589329916066,-74.1586458000796,-74.1586347244211,-74.1581527719599,-74.1581488391503,-74.1578926295388,-74.1578412227291,-74.1577335257235,-74.1577736593691,-74.1571878278252,-74.1570707730558,-74.1563684859868,-74.1563655286372,-74.1561027649089,-74.1561148826474,-74.1556986205315,-74.1556851576991,-74.1555891193463,-74.1555864375891,-74.1548293246186,-74.1547593366532,-74.1546926386453,-74.1547782901199,-74.1546466983395,-74.1545967016333,-74.1545491989675,-74.1544542571697,-74.1543830825975,-74.1542527007352,-74.1541579187625,-74.1540299723588,-74.1538807215743,-74.1537646408605,-74.1536296525882,-74.15351122315,-74.1534140659779,-74.1532759228053,-74.1531366609852,-74.1530299679265,-74.1529659292193,-74.152920867497,-74.1528805832335,-74.1528227954896,-74.152797035114,-74.1527006075224,-74.1526960388594,-74.1527127779974,-74.1527247393579,-74.1527247451836,-74.1527250698798,-74.152725169035,-74.1526970044967,-74.1524287612682,-74.1522180688448,-74.152297861755,-74.1521367589991,-74.1520518095404,-74.1520463923327,-74.1511954500718,-74.1512628062136,-74.1513951761365,-74.1512482796657,-74.1511296509037,-74.1505563884208,-74.1504403557141,-74.1504388642439,-74.150411797284,-74.1503927537014,-74.1503085589372,-74.1501138044371,-74.1499678209055,-74.1497938612606,-74.1496788983089,-74.1494581610482,-74.1494473290005,-74.1494357640079,-74.149423723082,-74.1494114738108,-74.1493992884128,-74.1493883959118,-74.1493780966631,-74.1493685783587,-74.1493600144591,-74.1493123559733,-74.1494519410733,-74.1494188170834,-74.149317017231,-74.1493005253992,-74.1492912038271,-74.1492912077351,-74.1492913007569,-74.1492818748203,-74.1492440647119,-74.1491941815569,-74.1488817554377,-74.1485581509232,-74.1485281668494,-74.1485160249077,-74.1487779200588,-74.14761237249,-74.1474993974054,-74.1460217310172,-74.1460573361839,-74.1451927948154,-74.1448420460314,-74.1446713323417,-74.1445908527502,-74.1443392310963,-74.1442614355039,-74.1442282273141,-74.1441618166379,-74.1440930244748,-74.1440502707355,-74.1440241613658,-74.1439530270104,-74.1438867855887,-74.1438616359574,-74.1438374578704,-74.1438148224993,-74.1437942645721,-74.1437762697409,-74.1437612631091,-74.1437495991891,-74.1438419251962,-74.1438173453027,-74.1437428711006,-74.1436836356146,-74.1436457188344,-74.1436149086078,-74.1435730859379,-74.1434883376543,-74.1434247683011,-74.1434547958056,-74.1433610301084,-74.1432628436278,-74.1431767669616,-74.1431280244307,-74.1430773072675,-74.1429599995592,-74.1429372878831,-74.1429224478051,-74.1428597469843,-74.1427873013905,-74.1426832099649,-74.1425776933605,-74.1425397070128,-74.1424754916061,-74.1423879514933,-74.1423588139311,-74.1423224404163,-74.1423196970729,-74.142385583141,-74.142404638359,-74.1423806145696,-74.1422976698097,-74.1421542002926,-74.1420986415576,-74.1420543148346,-74.1415562297235,-74.1414804740345,-74.1412862402268,-74.141192218399,-74.1410243055212,-74.1407625364528,-74.1402889234368,-74.139937853155,-74.1392974576389,-74.139257448527,-74.1392038237721,-74.1391832803589,-74.1387924907908,-74.1375757483848,-74.1375268203474,-74.1374808382665,-74.1374388271393,-74.1374017234485,-74.1373703542867,-74.1373454189202,-74.1373700174998,-74.1364960506209,-74.1357074211084,-74.1357095897999,-74.1349989231714,-74.1349965524362,-74.1343526957363,-74.1343028118537,-74.1334971976667,-74.1334674003459,-74.1334153923328,-74.1333157728423,-74.1332279961608,-74.1331450268027,-74.1329917239349,-74.132889031136,-74.1328250505301,-74.1327421638914,-74.1326616657202,-74.132562222538,-74.1325150401328,-74.1324204314397,-74.1324028357712,-74.1317279495978,-74.1313446802939,-74.1312558118026,-74.1314619976482,-74.1310808393752,-74.1307364496511,-74.1303250354803,-74.1301756735989,-74.1301232490168,-74.1302788704305,-74.1301837001321,-74.1301278287223,-74.1296778516623,-74.1294905763737,-74.1299774026272,-74.1298775073671,-74.129920885797,-74.1293071318685,-74.1292297726106,-74.128933012099,-74.1289177930478,-74.128994963095,-74.1289072903345,-74.1288276699353,-74.1288120184713,-74.1281321491913,-74.1281090048587,-74.1278348594618,-74.1275267724088,-74.1273956855128,-74.1273911938027,-74.127347703174,-74.127244818385,-74.127147745639,-74.12702736021,-74.1270612003737,-74.1270762595555,-74.1270985553174,-74.1271025962817,-74.1271016294187,-74.127104566553,-74.1271244300904,-74.127097762782,-74.1270875403209,-74.127081560709,-74.1270536220526,-74.1265152929335,-74.1264482391902,-74.126396102817,-74.1263463338019,-74.1262752003535,-74.1262230339262,-74.1261922059236,-74.1261494990704,-74.1260698286229,-74.1261999629165,-74.1263418044479,-74.1263680868898,-74.125640268706,-74.1256326580634,-74.1261327655123,-74.1259954242245,-74.1259302660642,-74.125808125427,-74.1256981163312,-74.1255783356939,-74.1254624989208,-74.1253309402587,-74.1252049134943,-74.1248776989751,-74.1246972888106,-74.1246151273606,-74.124529232981,-74.1244806588375,-74.124383570936,-74.1242587290791,-74.1241557844501,-74.1241072851931,-74.1240289521124,-74.1239506354574,-74.1238424516055,-74.1237491804069,-74.123637260257,-74.1235775927147,-74.1235440461204,-74.1235403980375,-74.1235479370604,-74.1235143969793,-74.1234072699929,-74.1231834384499,-74.1228563055525,-74.122779769773,-74.122651740603,-74.1226036360162,-74.1225728047916,-74.1227447642698,-74.1227968835939,-74.1228795964405,-74.1229072489857,-74.1229058179184,-74.1228569841383,-74.1228662545766,-74.1228586834476,-74.1228267295256,-74.122825654104,-74.1228239765498,-74.1227944519432,-74.1227815318064,-74.1227618539832,-74.1227211444975,-74.1226955588767,-74.1219585006234,-74.1219412972036,-74.1219020586069,-74.1218414699557,-74.121843907453,-74.1218656179933,-74.1219483099526,-74.1219428261312,-74.1219814638067,-74.1219908380754,-74.1218718277202,-74.1218741619115,-74.1218532959782,-74.1218455081297,-74.1218339180556,-74.1218066108207,-74.1217576469687,-74.1217875485973,-74.1217713220107,-74.1217791119751,-74.1217644292981,-74.1217597787933,-74.1215588656059,-74.1215534360538,-74.1217605260274,-74.1217237531887,-74.1214475336692,-74.1213869068935,-74.1213261711165,-74.1213052908301,-74.1213733293903,-74.1213119482967,-74.121240335297,-74.1212349214333,-74.1211948895787,-74.1211724627506,-74.1212807479436,-74.121214702542,-74.1211012473794,-74.1210772740512,-74.121180395077,-74.1207131758869,-74.1206463449958,-74.1205742902843,-74.1205281181158,-74.1201678368803,-74.1199348008891,-74.1199711121359,-74.1196071674787,-74.1196256560989,-74.1199569987577,-74.1198544394209,-74.1195298610576,-74.1194656129683,-74.1194498817768,-74.1194263129249,-74.119323025471,-74.1190972049372,-74.1194808715509,-74.1194002953246,-74.119003482004,-74.1186163523627,-74.1186048615348,-74.1186883410023,-74.1186517159865,-74.1188750592626,-74.1188994831259,-74.1189607740235,-74.1188362461694,-74.1186447971802,-74.1185836461846,-74.1184211759267,-74.1184018508355,-74.1181553652091,-74.1182083154939,-74.1180076709366,-74.1179172868314,-74.1177964325272,-74.1177569064589,-74.117748756418,-74.1176985031942,-74.1174978002836,-74.117121006304,-74.1172240828296,-74.1171394411701,-74.1167218766389,-74.1167370340764,-74.1168839607624,-74.1170334812623,-74.1172247008254,-74.1171490052742,-74.1170558070613,-74.1169577534559,-74.1168425818898,-74.116739672586,-74.1166660764623,-74.1166099194958,-74.116599759241,-74.1163000008275,-74.1163316697743,-74.1163048136593,-74.1167534287466,-74.1166704138269,-74.1162462970986,-74.1162194379205,-74.1161572274713,-74.1161420863572,-74.115996933113,-74.115719170423,-74.1156482343379,-74.1153508218293,-74.1151171475206,-74.1148073506757,-74.1147807642832,-74.1142953872243,-74.1137966608601,-74.1140405314602,-74.1139509406848,-74.1128880651097,-74.1128510306609,-74.1138570932216,-74.1138707838445,-74.113653709669,-74.113434037371,-74.1133302319254,-74.1123037090663,-74.1118079913692,-74.1119033368524,-74.1111612946926,-74.111116336666,-74.1117664665002,-74.111725299958,-74.1116763506341,-74.1114957114635,-74.1109228187844,-74.1097393256448,-74.1095380858385,-74.1088648989597,-74.108695537437,-74.1082362049678,-74.1077967414639,-74.1068034270611,-74.1047222159976,-74.1046457778213,-74.104396135552,-74.1043405874489,-74.1041235630175,-74.1040550911334,-74.1040223721704,-74.1039864479106,-74.1039146325034,-74.1038360955884,-74.1037642881849,-74.1037283985405,-74.1036992614275,-74.1036504880204,-74.1030729667749,-74.102316793374,-74.1016826444167,-74.1016426644115,-74.1006054200535,-74.1001321918731,-74.0997111287711,-74.0988006688581,-74.0984998162551,-74.0960455528158,-74.0946850092126,-74.0936265693011,-74.0930396026804,-74.0929882818765,-74.0930050729631,-74.0913569794201,-74.0909602408032,-74.0899233404758,-74.0893975253534,-74.0884552174832,-74.0883604348923,-74.0882744437083,-74.0882411247403,-74.087938041576,-74.087674426815,-74.086344676303,-74.0857075437821,-74.0852269841173,-74.0848440321572,-74.0848297392565,-74.084760748522,-74.0846939476186,-74.0846301835403,-74.0845702647732,-74.083903216641,-74.0825658580706,-74.0822127291494],"lat":[40.6482801622901,40.648278112186,40.6483077531151,40.6483733913572,40.6484242602179,40.6485047254469,40.648490943531,40.6483486764594,40.6482748738463,40.6482455147327,40.648383312988,40.6481863254887,40.6481425544225,40.6471998612679,40.6472058518391,40.6470805224388,40.6469688181834,40.6467238827273,40.646552023759,40.6459130220668,40.6450674882207,40.6450843289107,40.6451932054456,40.6451478163471,40.644998928043,40.6450833734751,40.6453133517729,40.645285707095,40.6453117721427,40.6453562984643,40.6454073806886,40.6454248160997,40.6454434833773,40.6457831161623,40.6457049252696,40.6455498077453,40.6454884791783,40.6453057245574,40.6451079436095,40.6450343807341,40.64502209633,40.6449638639099,40.6451450268718,40.6451312383202,40.6449439412436,40.6448386797018,40.644807917841,40.6450159184719,40.6450005680126,40.6449162794755,40.644850257929,40.644714799469,40.6448640734575,40.6448441794349,40.6449101237688,40.6447908631737,40.6446455956276,40.6446373697844,40.6447354724669,40.6447197488582,40.6446752900825,40.6446670649253,40.6446938034031,40.6446700395146,40.6446176853886,40.644643997132,40.6446505891586,40.6446538783353,40.6446209206595,40.6445600718067,40.6445633712258,40.6445567921703,40.6445304142499,40.6445369924377,40.6445468804627,40.6446208837661,40.6445520183129,40.6445240310686,40.6444918400175,40.6444412734674,40.644599873185,40.6450226498311,40.6450318657213,40.6450503282006,40.6450337464351,40.6450042193931,40.6450134394763,40.6445777535548,40.6445464311019,40.6445815353091,40.6444119329409,40.6443639174445,40.6443381042439,40.6442882697937,40.6442660478205,40.6441104648926,40.644181399058,40.6441703417333,40.6442017617702,40.6440118454986,40.6439748850298,40.6439582896924,40.6439268858153,40.6439361021897,40.6439004276987,40.6437811329696,40.6437971091786,40.643816308579,40.6437720548354,40.6437868857247,40.6435913148711,40.6435783406638,40.6434601574887,40.6434973045561,40.6434562255216,40.6434287405859,40.6433602727182,40.6433548660038,40.6432926250636,40.6432705613306,40.6431931095958,40.64321200376,40.6432211326978,40.6432509092395,40.6432052636783,40.6431293046955,40.642808293775,40.6428003596807,40.6426799316797,40.6426798980604,40.64279633528,40.6427140932891,40.6424632167928,40.6426914030532,40.6425261281323,40.6421847360824,40.6418529739776,40.6422069742969,40.6420075033079,40.6416368149697,40.6409226728761,40.6409955792581,40.6410124006536,40.6410293437563,40.6411231242019,40.6412781322375,40.6410689426143,40.6409259594685,40.6409212381017,40.6409165809514,40.6409120923109,40.6409078727,40.6409040166137,40.6409006104062,40.640897730357,40.6408949268187,40.6408927397232,40.6408912191354,40.6408903998632,40.6408903006605,40.6408909237981,40.6408922550119,40.6409018738206,40.6408036884451,40.6405289631474,40.6405133117964,40.6386189996859,40.638590610272,40.6385926498383,40.63844115456,40.6384266339324,40.6384093841189,40.6384144884302,40.6383762297535,40.638379987367,40.6383859305692,40.6383859765077,40.6383763896268,40.6383355452385,40.6383018941706,40.6382586140071,40.6382268953211,40.6382452659968,40.6381627260741,40.638136308347,40.6379418745921,40.637871909876,40.6377873579357,40.6376539456857,40.6376417226323,40.6372335292362,40.6368939509656,40.6366107256394,40.6366189197912,40.6366327973865,40.6366928746795,40.6366768285806,40.6366837747327,40.6366975321684,40.6367252309892,40.6366472776246,40.6366172712076,40.6366287356816,40.6366263813552,40.6366103328556,40.636580323407,40.6365986624511,40.6365894458338,40.6365733954361,40.6365456754272,40.636566425453,40.6365587633843,40.6365360941652,40.6347982312994,40.6336660328257,40.6320584429904,40.6306906545501,40.6303089789815,40.6302461046155,40.6287875851855,40.6285390460915,40.6299963794065,40.6299566963418,40.627768778427,40.62774814778,40.6277091963531,40.6276793941806,40.627644995425,40.627631100526,40.6275001677161,40.6271384270081,40.6271093614328,40.6271050666473,40.6270960331491,40.6270753326336,40.6270647200944,40.6270705304258,40.6270588629097,40.6270498452858,40.6270397589644,40.6270264920637,40.6270211800701,40.6270179802593,40.6270031310853,40.6269978119121,40.6269877215359,40.626967569583,40.6269360239494,40.6269262184866,40.6269235758603,40.6268642615036,40.6268631942686,40.6268557833378,40.6268494358578,40.626848388465,40.6268526354839,40.6268595417957,40.626868057022,40.6268739274194,40.6268750182767,40.6268835263227,40.6268883006597,40.6269290279663,40.6268741485629,40.6262248976367,40.624608750194,40.6230932975647,40.6230578056978,40.6229201449007,40.622793155008,40.6227088000527,40.6226564291279,40.6226236149861,40.6226124987033,40.6226032211668,40.6225774818233,40.6223812237283,40.6223288203538,40.6223095487185,40.6222808456162,40.6222524247504,40.6222044800556,40.6221849414191,40.6220890221743,40.6220481891243,40.6220215509226,40.6219780385666,40.6218847892468,40.6218687962434,40.621792417663,40.6217702216216,40.6217213908923,40.6216077226484,40.6215864060355,40.621560641124,40.6215100117923,40.6214540638507,40.6214176664008,40.621417682013,40.6214212437711,40.6214330982653,40.6214390366883,40.6214052909801,40.6213955178182,40.621392789272,40.6213883955268,40.6213510866492,40.6213510986992,40.6213191290094,40.6213232079833,40.6212685418666,40.621247173999,40.6212081398724,40.6210874930096,40.6209025647431,40.6208921854035,40.6205562599766,40.6202938937252,40.6202939942489,40.619455405543,40.6190857642475,40.6190164884376,40.6188976015952,40.6189605565051,40.6189622667614,40.6189579985178,40.6193590155938,40.6193158004039,40.6188948122841,40.6188644675671,40.6187224812888,40.6192745436,40.6192026282893,40.6186209197745,40.6180674959386,40.6178724981656,40.6181954103528,40.6179564155866,40.6181070702808,40.6178906996048,40.6178963869941,40.6177723990679,40.6182459448656,40.6181716875856,40.6175109561255,40.6170624146026,40.6174022261335,40.6173288251491,40.6169885030222,40.6169009345904,40.6168676138215,40.6168577109679,40.6168426391477,40.6168228064819,40.6167987500073,40.6167711211342,40.6167283699455,40.6166854995251,40.6166435731903,40.6166036308403,40.6165416712265,40.6164443669384,40.6157518795213,40.6157444806829,40.6147873106475,40.6143780206996,40.6138608881325,40.6135905493377,40.6130317338062,40.6130466770951,40.6128078504194,40.6125779986198,40.6123056767378,40.6121005541204,40.6119018802197,40.6119477357609,40.6120145678959,40.611998241374,40.6120331949817,40.6120383811342,40.6121029586082,40.6121434859966,40.6122078942763,40.6122882877462,40.6123170419324,40.6124164016142,40.6124456969951,40.6125437980571,40.6125748734753,40.6126279661522,40.6127036321904,40.6127215945673,40.6127265850374,40.6127636878954,40.612786375932,40.6128017746222,40.6127838996187,40.6120566471394,40.6119427345742,40.6119285742108,40.6118196399392,40.6118301792575,40.6117491730782,40.6117142545669,40.6117041253008,40.6116905298033,40.6116738072124,40.6116543746712,40.6116327169214,40.6112538175253,40.6111523585216,40.6110560548981,40.6110022864863,40.6109383775445,40.6108896384961,40.6108222890891,40.6107384290466,40.610633676752,40.6100486443875,40.6100107404537,40.6099272948093,40.6097682289801,40.60932605221,40.6089619482392,40.6087427831037,40.6086356718206,40.6084742891963,40.6083747730917,40.6082695473219,40.6079375067591,40.6078995395851,40.6074527233981,40.6064058245662,40.6042135088463,40.6035880441716,40.6030952955355,40.6027192027059,40.6024493024955,40.6021500548305,40.6022913985708,40.6025999499056,40.6027198804299,40.6031053657056,40.6039819199692,40.6040397187302,40.6043792994778,40.6049778569116,40.6055630442717,40.6056210674513,40.6057255679582,40.6058702120091,40.6059879668429,40.6059979500401,40.6060370708854,40.6061216641582,40.6061452342304,40.6061710088577,40.6062458352117,40.6062902965674,40.6064109790698,40.6065225086613,40.606551986371,40.6066814853406,40.606890132547,40.6070223905291,40.607551270117,40.607727602221,40.6080518279621,40.6083700462689,40.6086869332584,40.6090945263766,40.6092365855667,40.6101199357373,40.610406552122,40.6104852193128,40.6105480573601,40.6105946639872,40.610624778037,40.6106383474822,40.610628017665,40.6106273209652,40.6106235929402,40.6105613899334,40.610558101373,40.6105362823107,40.6105066718399,40.6104858075458,40.6104757535881,40.6104698627692,40.6104480281832,40.6104291028298,40.6104134717621,40.6103821298373,40.6103436175778,40.6102868030276,40.6102524448125,40.6102350571793,40.6102347678599,40.6102501095356,40.6102515849962,40.6102854386673,40.6103362055471,40.6104186561448,40.6105069153516,40.6105860604965,40.6109673667623,40.6110424534508,40.6111049351803,40.6111544486427,40.6111907639687,40.611213766576,40.6112234261938,40.6112341290023,40.6112388249689,40.6112375081933,40.6112301803301,40.6112168505862,40.6111975356324,40.6111722598104,40.6111410548779,40.6111039600421,40.6110610219103,40.6110380934131,40.6109327350644,40.6106668134136,40.6101733990011,40.609867130868,40.609765268159,40.6094812350474,40.6094689997097,40.6092913475462,40.6092336021972,40.6091352185802,40.609022318954,40.608908471012,40.6088984050148,40.6086996429454,40.6086629083061,40.6086319147238,40.6085497603366,40.6085002894728,40.6083917410318,40.6083039432947,40.6082143124153,40.608181172361,40.6081529236038,40.608102797299,40.6080549819727,40.6080069646996,40.6079441825366,40.6079296716997,40.6078905117743,40.6078408239624,40.6077910673952,40.607746310443,40.607693493897,40.6076415471229,40.6075854387744,40.6075747239116,40.6075904854894,40.6076150255798,40.607730378479,40.6078862737308,40.6081421177466,40.6082574343827,40.6083578921406,40.6084941448039,40.6085554435014,40.6087715775485,40.6088825569838,40.6092005379402,40.6094978111544,40.6095928146879,40.6102649953817,40.6117615217529,40.6122062818525,40.6122556122519,40.6123206275904,40.6129923178982,40.6130322309345,40.6143544820095,40.615031910829,40.6154574246042,40.615939315916,40.6163215651533,40.6168161457484,40.6172479002834,40.6179460636856,40.6183421565519,40.6188545902809,40.6191432619348,40.6195724049034,40.619954036436,40.6200945345408,40.6206772840716,40.6207902747522,40.6209362561871,40.6210458153045,40.6211240285444,40.6211511433497,40.6212164336711,40.6212705001099,40.6213123869048,40.6214421806275,40.6215433837547,40.6215786205853,40.621635798865,40.6217115382825,40.6218389838629,40.6219487408698,40.6220731685179,40.622211792356,40.6223640119917,40.6225291071353,40.6227062438796,40.6234062428804,40.6249384498507,40.6249909629019,40.6252604265177,40.625451361419,40.6259328717369,40.626137885673,40.6261805812568,40.6263623541178,40.6266012965199,40.6268346301751,40.6277558072062,40.6287379250507,40.6290802156771,40.6294164023978,40.6297464457578,40.6300703073563,40.6303354399282,40.6306065791205,40.6308836810612,40.6311667009126,40.6314555928789,40.6317503103321,40.6320508054671,40.6323570296587,40.6326689333536,40.6329864660791,40.6331428325197,40.6347927589935,40.6348069630797,40.6348277486921,40.6348771872751,40.6349105114836,40.6349733585184,40.6349958483044,40.6350305191216,40.6350388148161,40.6350669618384,40.6350583972377,40.635016864639,40.6350042185706,40.6350239861306,40.6350545992012,40.6350769829124,40.635097299845,40.6351099614397,40.6351470549,40.6351759346424,40.6351902020601,40.6351993203249,40.6352121562636,40.6352338955172,40.6352571956421,40.635287114712,40.6353009430093,40.6353337910922,40.6353771733116,40.6354157810455,40.6354429441493,40.6354665713928,40.6354912395676,40.6355114345565,40.6355209179214,40.6355240721024,40.635526886967,40.6355390911178,40.635553052173,40.6355756329752,40.6355911559285,40.6356032950041,40.6356274003454,40.6356479863639,40.6356634289239,40.6356782485853,40.6356892548175,40.6357079446463,40.6357331491755,40.6357451908225,40.6364495219479,40.6364563358594,40.6364746993382,40.6364895386255,40.6365162031439,40.6365343457506,40.6365497156124,40.6365554845436,40.6365640720228,40.6365821057106,40.6366335841286,40.6368040263822,40.6368744850037,40.6369186966176,40.6369706165594,40.6370342919478,40.6370700276279,40.6370815650844,40.6370931903118,40.6370902830047,40.6370782172894,40.6370590609251,40.6370488431369,40.6370346420343,40.6370324623429,40.6370347508389,40.6370407753954,40.6370800706339,40.6371315116642,40.6371768621376,40.6371962940214,40.6371991015366,40.6372305159649,40.6372673534972,40.6373911835637,40.6374136695932,40.6374222796309,40.6374189918364,40.6374053824372,40.6373973494715,40.6373896911795,40.6373700816126,40.6373691913774,40.6373577106001,40.637330222384,40.6373163017727,40.6373157038595,40.637327213695,40.6373358672142,40.6373371297609,40.6373230761153,40.6373105501878,40.637306411715,40.6373043983881,40.637309114699,40.6373246961031,40.6373464086746,40.6373673232498,40.6373909393516,40.6374446558369,40.6374691168847,40.6375668147327,40.6379612989748,40.6415304148924,40.6429816415239,40.6433886621715,40.6431873968553,40.6432712185117,40.6434478523187,40.6435134622308,40.6436314395018,40.6437693798774,40.6438022225883,40.6438154357988,40.6437927478422,40.6437862913064,40.6437666472322,40.6437897231349,40.6438062036945,40.64380623829,40.6438357444556,40.6438651814395,40.6439029449306,40.6439435261934,40.6439501572618,40.6439698483674,40.6439731708042,40.6440716367671,40.6440717251916,40.6440717819169,40.6440849187032,40.6441264426055,40.6441282663388,40.6441171123191,40.6440721874486,40.6440452445851,40.6440257856871,40.6440088401966,40.643998565411,40.643978449538,40.6439573805248,40.6439454314883,40.6439390742577,40.6439285557628,40.6439243330397,40.6439205805806,40.6439118582267,40.6438906302283,40.6438477591358,40.6438310008535,40.6438169584799,40.6438028066423,40.6437963389348,40.6437905884825,40.643786760445,40.643787471519,40.6437889488603,40.643787193853,40.6437813468591,40.6437719545522,40.6437537243216,40.6437345766936,40.6437170385262,40.6436986571806,40.6436871790818,40.6436805105572,40.6436688603612,40.6436602220707,40.6436506915761,40.6436383019588,40.6436067873186,40.6435983690654,40.6435904061441,40.6435839032847,40.643571933698,40.6435544364428,40.6435300836258,40.6434828375728,40.6434105557215,40.6433945376559,40.643384378729,40.643344194788,40.6433239899432,40.6433087672739,40.6432942632075,40.6432790271232,40.6432699400629,40.6432591187848,40.6432490787291,40.6432367445467,40.643227049037,40.643220775434,40.6432090970599,40.6431986211621,40.6431841795379,40.6431724532969,40.6431713609731,40.6431739257801,40.6431823768876,40.6431938410627,40.6432071779494,40.6432143793861,40.6432285446873,40.643234419242,40.6432322352567,40.6432280695808,40.6432241367873,40.6432227355306,40.6432225973624,40.6432249885555,40.6432291002011,40.6432302269615,40.6432266687312,40.6432209538596,40.6432141748535,40.6432078305245,40.6432005812317,40.6431954743146,40.6431896353723,40.6431830031202,40.6431835828786,40.6431815105378,40.6431724105362,40.6431629156356,40.6431548723674,40.6431482167645,40.643140608177,40.6431316738731,40.6431238644877,40.6431179647648,40.643112297415,40.6431057271127,40.6431009027727,40.64309957689,40.6430935913627,40.6430920703713,40.6430987932712,40.6431036931549,40.6431100428202,40.643115846655,40.6431179804335,40.6431187404691,40.6431168957695,40.643105555164,40.6430871879023,40.6430735046343,40.6430614326766,40.6430433345859,40.6430257828263,40.6430103520874,40.6429909200073,40.6429701741248,40.6429497749594,40.6429248634068,40.6427959027224,40.6427441441063,40.6427007400332,40.642662035702,40.6426274549527,40.6426038707682,40.6425767891488,40.6425520635983,40.6425370053944,40.6425262732145,40.6425088110617,40.6424941607012,40.6424764013603,40.6424636858159,40.6424324437723,40.6423748094236,40.6423071746499,40.6422977559308,40.6422888068528,40.6422742542655,40.6422733378589,40.6422396410507,40.6422606383333,40.6422801868219,40.6423006273786,40.6423231614728,40.642341777905,40.6423659091205,40.6423959902566,40.6424403469011,40.6424676502271,40.6424872695654,40.6425104815931,40.6425251676356,40.6425423180597,40.6426012577463,40.6426143331097,40.6426346350435,40.6426510471005,40.6426707061088,40.6426937865241,40.642708574857,40.6427182423721,40.6427360643452,40.6427606378837,40.6427918042576,40.6428136286044,40.6428400116956,40.6428587883335,40.6428821865101,40.6428999599205,40.6429114375127,40.6429253828431,40.642946514542,40.6429669756807,40.6429943415799,40.6430705630338,40.6430903688521,40.6431004090723,40.6431128051983,40.643124013093,40.6431408258501,40.643157436835,40.643179031171,40.6432010462535,40.6432215623469,40.6432398956551,40.6432484357096,40.6432595061197,40.6432650949313,40.6432651358033,40.6432661568074,40.6432580917661,40.643245700355,40.643232999868,40.6432171255947,40.643198114871,40.6431905547814,40.6431847428177,40.6431785091002,40.6431690416546,40.6431544813518,40.6431295831458,40.6431164463263,40.6431055893858,40.643087483095,40.6430755016919,40.643064235878,40.643035848225,40.6430191799711,40.6430089175701,40.6429918135082,40.6429753814987,40.6429616005437,40.6429492095718,40.6429407853204,40.6429375165563,40.642932228723,40.6429243988414,40.6429187728559,40.6429106598164,40.6429101531081,40.6429128342419,40.642920697268,40.642929623999,40.6429455174547,40.6429636776005,40.6429816375449,40.6429978974565,40.6430120506198,40.6430342465781,40.6430570995364,40.6430828407982,40.6431049886769,40.6431343375211,40.6431490838861,40.6431725312124,40.6431989306347,40.6432226260727,40.6432490378575,40.6432712471679,40.6432990472619,40.6433189140722,40.6433365020049,40.643366347404,40.643404058371,40.6434108567288,40.643430391653,40.6434517853815,40.6434732422288,40.6434872630331,40.6434970954078,40.6435045231663,40.6435085161339,40.6435224878559,40.643534995617,40.6435605906426,40.6435883907399,40.6436095715514,40.6436297226842,40.6436467507636,40.6436661067906,40.6437049855359,40.6437297240146,40.6437468890172,40.6437601510842,40.6437810340203,40.6438094291563,40.6438312300849,40.6438523008682,40.6438593273616,40.6438691954381,40.6438845297396,40.6439021650573,40.6439473032676,40.6440276998859,40.6440816630969,40.6441560523004,40.644195303687,40.6442093322323,40.6442673503823,40.6442964158791,40.6442979153732,40.6443009629189,40.6442978879215,40.6443038858964,40.6443504621203,40.6444114886256,40.6444319012231,40.6444578706225,40.6444848814316,40.6445147678272,40.6445358918282,40.6445483019893,40.6445579617878,40.6445709787019,40.6445836245978,40.6445914333165,40.6446008036433,40.6446104850501,40.6446156674708,40.6446250920152,40.6446294365702,40.6446313016762,40.6446308095541,40.6446368888205,40.6446408344006,40.6446509416489,40.644657069459,40.6446637301988,40.6446696244232,40.6446767807096,40.6446786586065,40.644685789148,40.6446985724089,40.6447111077265,40.644723516637,40.6447341445578,40.6447435199083,40.6447568893518,40.6447943916193,40.6448002829461,40.6447960218054,40.6447896130191,40.6447815934688,40.6447759020392,40.6447678197865,40.6447622186864,40.6447588001691,40.6447515827664,40.644746895651,40.644703943552,40.6446970804535,40.6446904782021,40.6446856615535,40.6446818723461,40.6446857822892,40.6446916616296,40.6447040142147,40.6447114330483,40.6447122819879,40.6447093142732,40.644701164253,40.6446892213639,40.6446735749073,40.644655771214,40.6446399995208,40.6446263068366,40.6446127410134,40.6445999103075,40.6445896616227,40.6445840632772,40.6445829136338,40.6445838111075,40.6445861592449,40.6445907730351,40.6445997747726,40.6446101536854,40.6446274489882,40.6446542861689,40.6446839513562,40.6447018134517,40.6447505286193,40.644771279645,40.644794027255,40.6448136988183,40.6448277947053,40.6448448553375,40.644850484762,40.6448514296784,40.6448488302889,40.6448399221844,40.644819237623,40.6448006841931,40.6447729813218,40.6447453393677,40.6447244926361,40.6446970377906,40.6446739707213,40.6446425498336,40.6446269328581,40.6446102375991,40.6445866995851,40.6445779382498,40.6445645171684,40.6445550007053,40.6445377148132,40.6445273951718,40.644515293146,40.6445120366638,40.6445066416658,40.644484695632,40.6444574516804,40.644427145744,40.6443598995839,40.6442789247765,40.6442881406737,40.6443716802273,40.6443787211669,40.6446550115468,40.6446548986564,40.6452669823029,40.6452687964781,40.6451102403665,40.645110303387,40.6451648599164,40.645166679848,40.6443807021119,40.6444005117726,40.6444866191157,40.6445155650968,40.6445373092303,40.6445598777653,40.6445827971023,40.6446055862794,40.6446383604695,40.6446717124751,40.6447037759237,40.6447046387043,40.6447101170577,40.6447158426728,40.6447216609366,40.6447274147339,40.6447329486903,40.6447594147232,40.6447871906438,40.6448030470969,40.6448187084999,40.6448339417598,40.6448592722605,40.6448844735128,40.6449089485764,40.6449321177115,40.6449534321111,40.6449642617195,40.6449670380529,40.6449700040853,40.6449730812627,40.6449761880878,40.6449792422775,40.6449821629433,40.6449848727325,40.6450091017345,40.6450418769703,40.6450498225543,40.6450469273529,40.6450434254078,40.6450307536496,40.6450147211499,40.6449884065554,40.644950223571,40.6448768145412,40.6446465070566,40.6445056965032,40.6444515895784,40.6444028698995,40.644359937401,40.6443197826043,40.6442622058529,40.6441732368951,40.644070116258,40.6439853313878,40.643908633937,40.643857669393,40.643822662186,40.643793883202,40.6437565579684,40.6437177167502,40.6436842073996,40.6436495298087,40.6435562518881,40.6434803947487,40.6433947870207,40.6433776953475,40.6433529316366,40.6433383959675,40.6433202800421,40.6433006669343,40.6432929230508,40.6432941636091,40.6432936523923,40.6432838445511,40.6432681211316,40.6432525804898,40.6432422807534,40.6432382629432,40.6432374767981,40.6432339701751,40.6432291306917,40.6432189400359,40.6431763172833,40.6431548238123,40.6431440677522,40.6431289664765,40.6431106318674,40.6430941967431,40.6430817064112,40.6430702764222,40.6430629167338,40.643047833104,40.6430414781455,40.643037679178,40.6430343913972,40.6430277626913,40.6430113449764,40.6429917154257,40.6429738378565,40.642957271455,40.6429032479566,40.6428802103018,40.6428614284672,40.6428294206618,40.6428161275168,40.6428120753297,40.6427991039017,40.6427496806378,40.6427416744242,40.642731692777,40.6426807331708,40.6426562601802,40.6426114316851,40.6425933415016,40.642565894653,40.6425501178483,40.6425444931672,40.642522720064,40.6424867605652,40.6423976283971,40.6423772750655,40.6423719883255,40.6423561269382,40.6423386469898,40.6423051684986,40.6422866060478,40.6422430115954,40.6422101425099,40.6421865294475,40.6421743503005,40.6421497754762,40.6421214830747,40.642077803546,40.64204407385,40.642032892136,40.641966310439,40.6419314992491,40.6419218716212,40.6419176834641,40.6419171942973,40.6419240021325,40.6419358758161,40.6419620400595,40.6420481139801,40.642147852464,40.6421820217516,40.6422223330262,40.6422639853626,40.6422816197156,40.6423416993605,40.6423732516511,40.6425072965153,40.6425352665259,40.6425623760907,40.6426038098765,40.6426895467992,40.6427069610777,40.6427266385058,40.6427466543811,40.642770875171,40.642812814221,40.6428852409609,40.6429124344239,40.6429389710628,40.6429683445415,40.6429782428456,40.6429875394939,40.642990643482,40.6429900606316,40.6429854412004,40.64296632353,40.6429629629641,40.6429596957041,40.6429492506491,40.6429239047328,40.6428598464723,40.6427652188389,40.6427451324483,40.6427269267319,40.6427100889701,40.642697764907,40.6426880074771,40.6426873918241,40.6425737374106,40.6425450312312,40.6425301308544,40.6425125093256,40.6424985034596,40.6424950710397,40.6424999646818,40.6425274855329,40.642564174015,40.6425723740862,40.6425714257014,40.6425479632638,40.6425211752305,40.6424934558413,40.6423992119796,40.6423293816601,40.642280223791,40.6422525224648,40.6422328193049,40.6422082954876,40.6421837704965,40.6421624969715,40.6421398177008,40.6421292278682,40.6421318200424,40.64214728759,40.6421810519,40.6423335670821,40.642477881625,40.6425170706598,40.6425454289515,40.642565132643,40.6425894759958,40.6426029897786,40.6426041042969,40.6425925534067,40.6425806963341,40.642564481668,40.6425498186196,40.6425378206797,40.6425291851136,40.642530190318,40.6425433035021,40.6425568167123,40.6425778173524,40.6425902353443,40.6426194897922,40.6426251140881,40.642630393188,40.6426225967005,40.64261134849,40.6426035871438,40.6425998441421,40.6426073134628,40.6426356568444,40.6426505918904,40.6427273808469,40.6428029444275,40.6428488354446,40.6428895573143,40.6429072823145,40.6429160002162,40.6429485965196,40.6429762996676,40.6430140479293,40.6430261923176,40.6430352691667,40.6430334255103,40.6430217024333,40.6430091158771,40.6430120909601,40.6430386879512,40.6430640495109,40.643097833222,40.6430993587953,40.6431095080841,40.6431227786031,40.6431139633044,40.6430960193717,40.6430898671525,40.6430837805121,40.6430753053168,40.6430690741854,40.6430503116933,40.6430400272481,40.6430268459798,40.6430176506082,40.6430100482224,40.6430096222208,40.6430120906921,40.6430223872931,40.6430374545449,40.6430510727993,40.6430585381604,40.6430592007196,40.643046972162,40.6430007227088,40.6429535308253,40.6429106053441,40.6428996800918,40.642884409018,40.6428591464859,40.6428270673528,40.642805195626,40.6427859294023,40.6427757899443,40.6427610934096,40.6427429929501,40.6427080181672,40.6426692024875,40.6426498683136,40.6426327004955,40.6426142310129,40.6426034416441,40.6425941006023,40.6425662211188,40.6425116203404,40.6424642603536,40.6424394238484,40.642427769281,40.642416911284,40.6424190902354,40.6424384232404,40.6424546486591,40.6424674701575,40.6424717480165,40.642472690413,40.6423915390344,40.6423437145539,40.6423300380439,40.6423272205629,40.6423366397861,40.6423490917955,40.6423618259179,40.6424796925794,40.6425116717347,40.6425303445889,40.6425521386212,40.6427898207406,40.6429713861206,40.6431102281402,40.6431725194443,40.6432140171633,40.6432555160554,40.643281372655,40.6433622116392,40.643374032498,40.6433868447717,40.6433984422937,40.6434185943495,40.6434268689776,40.6434194333286,40.6434110455599,40.6434051159779,40.6434105600479,40.6434245603014,40.6434454524162,40.6434598102466,40.6434642552639,40.6434718141627,40.6434636222808,40.6434510659088,40.643440082573,40.6434162205002,40.6433914035861,40.6433778725912,40.6433602111171,40.6433503645987,40.6433342184794,40.6433185773075,40.643310179119,40.6433061353153,40.6433065058708,40.6433112986724,40.643328183048,40.6433752146695,40.6433826984406,40.643402743967,40.6434622945127,40.6434710040452,40.6434983591025,40.643598297623,40.6436444329659,40.6436780376367,40.6436888270305,40.6436958459482,40.6437067714334,40.6437335512641,40.6437494056137,40.6437785193266,40.643798447336,40.643804319081,40.6438192513391,40.643836349888,40.6438669233176,40.6439114725585,40.6439376225731,40.6439726762406,40.6440078748774,40.6440288042438,40.644084999291,40.6440922412695,40.6441094861187,40.6441231054612,40.6441398346435,40.6441570699542,40.6441703868102,40.6441742845053,40.6441765875579,40.6442209720665,40.6443492067586,40.6445717246719,40.6446455248859,40.6446571897876,40.6446710997498,40.6446923208933,40.6447102848951,40.6447180425637,40.6447003805838,40.6446783052458,40.644649347237,40.644635592982,40.6446235783287,40.6446160546321,40.6446148405908,40.64462282197,40.6446465211023,40.6446791265644,40.6447397655818,40.6447874370219,40.644855891685,40.6448891365241,40.644927883075,40.6450303022278,40.645075076819,40.6450845852108,40.6450920717278,40.6450975255277,40.6451059553682,40.6451290244077,40.6451497114998,40.6451460479629,40.6451352779349,40.645114817059,40.6450802888808,40.6450629965293,40.6450448388349,40.6450292855353,40.6450203237775,40.6450169320322,40.6450218031221,40.6450229201838,40.645037172538,40.645061445002,40.6450826755157,40.6451037599035,40.6451122366428,40.6451233964648,40.6451297054714,40.6451369673542,40.6451362586455,40.6450800942251,40.6450548409637,40.6450251732003,40.6450218754525,40.6450051970944,40.6449775421563,40.644964876694,40.6449347715418,40.6448870034496,40.6448148480038,40.6447331555527,40.6447027590473,40.6446586068953,40.6446151855821,40.6445839229286,40.6445473744471,40.6444969230172,40.6444179520542,40.6443454253031,40.6443071439739,40.6442821815094,40.6442599702602,40.6442414647626,40.6442375343688,40.6442045228559,40.6441707816933,40.6441386260129,40.6440922773559,40.6440642525044,40.6440295002848,40.6440090081128,40.6439751799854,40.6439488754275,40.6439255364408,40.6438794590592,40.6438275209417,40.6437620409662,40.6437069921827,40.6436432620274,40.6435854050796,40.6435451503989,40.6435148906282,40.6434928141483,40.6434736810634,40.6434715355462,40.6434607557063,40.6434531638783,40.6434623007568,40.643485786969,40.6434924654482,40.6434976266598,40.6434925039341,40.6434765912429,40.643448626539,40.6434477595643,40.6434215707508,40.6434036159276,40.6433794313481,40.6433531471414,40.6433309142528,40.6433201561868,40.6433181702516,40.6432915260917,40.6432737173472,40.6432562675519,40.6432336673632,40.6432125059813,40.6432003250959,40.6431975552837,40.6432004430814,40.6432011517618,40.6431982458812,40.6431924426619,40.6431838977449,40.6431789110042,40.6431687822171,40.6431542292668,40.6431343695981,40.6431350799425,40.6431272544169,40.643101834699,40.6430661203292,40.6430521214005,40.6430420417656,40.6430205783943,40.6430005735857,40.6429855738022,40.6429681927983,40.6429545053385,40.6429484989966,40.6429588710027,40.6429763484811,40.6429863712562,40.6429870314331,40.6429745791193,40.6429396721849,40.6429124440202,40.6428907951626,40.6428582208026,40.6428404127467,40.6428322651841,40.6428217390322,40.6428120476613,40.6428177921124,40.6428386634969,40.6428534483614,40.6428624400561,40.6428599128571,40.6428526018964,40.6428498613248,40.6428613322637,40.6428417443424,40.6428514745503,40.6428578701577,40.6428718587626,40.6428774475086,40.6428652191667,40.6428581326933,40.6428689999302,40.6429089912286,40.6429463872854,40.642963844392,40.6429863785693,40.643011662163,40.6430583988166,40.6430924607523,40.6431229248505,40.6431383224019,40.643134604475,40.6431344420909,40.6431150493656,40.6430931186139,40.6430709650693,40.6430406939211,40.6430187444296,40.6430058459468,40.6430000417295,40.6429951814532,40.6429843135823,40.6429820790916,40.6429849853013,40.642974203513,40.6429461886058,40.6428738644019,40.642855765052,40.6428380151744,40.642832065403,40.6428197403486,40.6427760445867,40.6427419743965,40.6426513004364,40.6425833043637,40.6425626380803,40.64254625873,40.6425362565278,40.6425229285189,40.6425228708046,40.642526875526,40.6425247171589,40.6425167561948,40.6425061794519,40.6424708145835,40.6424387166153,40.6424011177972,40.6423804027081,40.6423547690716,40.6423305149462,40.6423115501132,40.6423072136961,40.6423034607455,40.6422955787004,40.6422832718896,40.6422558198467,40.6422227784438,40.6421969898061,40.6421827972706,40.6421673792206,40.642155588554,40.6421441563568,40.6420969430893,40.6420436434909,40.6420078614203,40.6419848228819,40.6419614931971,40.6419395441815,40.6419249916616,40.6419084852494,40.6418934377485,40.6418757845464,40.6418651500369,40.6418676190497,40.6418750845347,40.6418771923831,40.6418648855562,40.6418379501377,40.641814055451,40.6417934959885,40.6417704001779,40.6417438225675,40.6417259359772,40.6417025099936,40.6416875158048,40.6416667274334,40.6416519168383,40.6416220453766,40.641548249029,40.6415005599938,40.6414703285389,40.6414547212406,40.6414414615895,40.6414324022121,40.6414267496706,40.641414433962,40.6413908215379,40.6413631896735,40.6413471855315,40.6413336436104,40.6413185810702,40.6412960586651,40.6412729909986,40.6412489418652,40.6412222825937,40.6412117406193,40.6412105055298,40.641207273408,40.6411984279358,40.6411913231141,40.641175346939,40.6411626700665,40.6411458631036,40.641125799145,40.6411083845325,40.6410985037443,40.6410889481847,40.641076747728,40.6410660646215,40.641045856267,40.6410295933945,40.6410178555225,40.6410153909536,40.6410138886958,40.6410122518426,40.6410102683908,40.6410097388801,40.6410102305526,40.6410089714566,40.6410064358839,40.6409998164836,40.6409954174849,40.6409892151603,40.6409707311506,40.6409482619308,40.6408607617291,40.6408391949995,40.6408166529112,40.6408020433474,40.6407875439592,40.6407718151148,40.6407560191598,40.6407406604627,40.6407236736215,40.6407072986612,40.6406923329583,40.6406768196295,40.6406668071137,40.6406546758406,40.6406505302573,40.6406440213602,40.6406388556093,40.6406296340125,40.6406150533032,40.640593584776,40.6405795526974,40.6405635320457,40.6405436045151,40.6405233563166,40.6405076381456,40.6404981157248,40.6404911220025,40.6404891050663,40.6404860671957,40.64048701574,40.6404964347154,40.6405131742226,40.6405313268473,40.6405540834609,40.6405795242345,40.6405937689567,40.6406063491253,40.6406166181905,40.6406187767341,40.6406304798606,40.6406435893292,40.6406573777334,40.6406736206685,40.64069007394,40.6407488069106,40.6408009494608,40.6408563287045,40.6409141757735,40.6409416133895,40.6409554653829,40.6409641357637,40.6409687479794,40.6409713335159,40.6409749010445,40.6409772726659,40.6409819677405,40.6409851024652,40.6409922571178,40.6409980343629,40.6409963876537,40.6409946485325,40.640996343229,40.6410016015389,40.6410115320928,40.6410273605135,40.6410467738406,40.6410699534933,40.6410903029752,40.6411295854287,40.6411483079225,40.6411601533335,40.6411698638524,40.6411730220177,40.6411740096029,40.6411776728182,40.6411798121532,40.6411914436446,40.641213037584,40.6412536020253,40.6413438455043,40.6413591269008,40.6413736888144,40.6413969836962,40.6414139368806,40.6414227360215,40.6414797233171,40.6414994608959,40.6417625059358,40.6420850152681,40.6420850844395,40.6423991756879,40.6424035613688,40.64259381913,40.6425718044547,40.6421116827677,40.642067575869,40.641739626514,40.6417753082559,40.6420861605755,40.6418728598744,40.6421300167986,40.6419912410417,40.6419413503617,40.6419242742485,40.6418683735309,40.6418253315,40.6418376668154,40.6417277744985,40.6418447936081,40.6415816382253,40.6414788086972,40.6414226378837,40.6414348716778,40.6424241007305,40.6424065870012,40.641436675005,40.6413708433614,40.6413005131007,40.641257551347,40.6412245114495,40.6412143713757,40.6422805467086,40.6422090003919,40.6406423057794,40.6404337150713,40.6403914670249,40.6414186620985,40.6413967852287,40.640315745545,40.640106202243,40.6399941102304,40.6410658600068,40.6410527973438,40.6399466587996,40.6399297980373,40.6399146063186,40.6398915093209,40.6398740695887,40.6398623909551,40.6398565429523,40.6398565603983,40.6409574196882,40.6409374836165,40.6410281938828,40.6410381879223,40.641024660811,40.6409673624416,40.6409301754576,40.6409300540765,40.6407883220102,40.6407278353615,40.6406107847668,40.6387656527723,40.6386993146056,40.6386462787777,40.6394283371709,40.6393937344571,40.6386649933133,40.6385950111136,40.6386940623783,40.6393861413186,40.6393510144755,40.6386812397149,40.6385677683126,40.638541189153,40.6386329588888,40.6386236902574,40.638518400439,40.6384654123225,40.6384437264535,40.6399401367778,40.6399278236928,40.6386095752982,40.6384103169249,40.6383390613377,40.6385649889145,40.638608229932,40.6386421936614,40.6386698473517,40.6387223527499,40.6387336734765,40.6387410667237,40.6387443460614,40.6387434287966,40.6387383380594,40.6387292022195,40.6386493329043,40.6385784446768,40.6385242809746,40.6384533450618,40.6384403419276,40.6384142398279,40.6383451618001,40.6382144459171,40.6379925832119,40.6379564476538,40.6379329792115,40.6379281629851,40.637906931816,40.6378104052429,40.6377961197571,40.6378482014787,40.6378568716723,40.6378899812267,40.6379254560316,40.6379514764553,40.6379767056289,40.6379964134552,40.6380113955704,40.6380393103198,40.638268617569,40.6385789424447,40.6385838663752,40.6388225779098,40.6388152771313,40.638264017819,40.6382490079555,40.6381284790978,40.6381099656179,40.6379675114477,40.6379650512311,40.6388739149662,40.6388790351653,40.6379571597461,40.6379508052289,40.637947135641,40.6379058477389,40.6379507422603,40.6379395908862,40.6375307471645,40.6375179389042,40.6377874824072,40.6377856224882,40.6377307758654,40.6377238554188,40.639196327304,40.6391939681142,40.6377215455509,40.637444368545,40.6373433440691,40.6372964725675,40.6372298072591,40.637193798384,40.6371723108883,40.6371742441237,40.6371816360722,40.6371980828396,40.6372126801074,40.6372489638204,40.6372725894138,40.6372727190793,40.6372670047836,40.6372062971501,40.6371811663062,40.637155977959,40.6371397914595,40.6371398450259,40.6371349412126,40.6371327548526,40.6371924355622,40.6372664549911,40.6373332249639,40.6373819500577,40.6373844954816,40.6375263662621,40.6375696904026,40.6376418417247,40.6376633412542,40.6376925817169,40.6382742882636,40.6382907479557,40.6377050659607,40.6376672153155,40.6377307885362,40.6384870561229,40.6393965130575,40.639409342886,40.6385006795714,40.6385593306673,40.6384301759942,40.6384273519036,40.6383760570155,40.6383381725205,40.6382810164322,40.6382672855424,40.6381500752493,40.6378927803615,40.6375176742606,40.6374097721629,40.6374053994855,40.6374023021017,40.6374005488454,40.6374001786795,40.6374011998303,40.6374039938886,40.6374078801025,40.6374127876505,40.637418627098,40.6375259581404,40.6378851565791,40.638291640547,40.6383901203452,40.6384334660242,40.6385038808949,40.6385056277117,40.6385472062064,40.6385706863679,40.6386176702902,40.638668331372,40.6387052079733,40.6374378380299,40.6374452135167,40.6375470735979,40.6388762511278,40.6390370378426,40.6389095973122,40.6390945497008,40.6392292576899,40.6393784976548,40.6393538147065,40.6393042677268,40.6392012862071,40.6390960255786,40.639039226441,40.6390248266221,40.6389978325726,40.6389654249315,40.6389203486149,40.6389005233065,40.6388807555389,40.6388846096834,40.6388879625141,40.6388942116626,40.6389032095019,40.6389147434714,40.6389285410979,40.6389442764325,40.6389615777507,40.6390883550559,40.639207478924,40.6392294228088,40.6392331079203,40.6392331552917,40.6392313876485,40.6392267852572,40.6393255525301,40.639466337997,40.6394774581182,40.6397098451811,40.6397142566173,40.6396921463389,40.6396803731276,40.6396675867939,40.639638037398,40.6396323163824,40.639596997838,40.6395693045234,40.6395620093365,40.6395442990832,40.6395341375019,40.6395375256188,40.639569888812,40.63964121083,40.6396702072512,40.6397482552975,40.6397922669654,40.6400550105671,40.6401982512814,40.6402524566139,40.6403058070937,40.6403432477704,40.640328052065,40.6402967597074,40.640366768817,40.6400921942955,40.640145275161,40.6403886750811,40.640506668844,40.6405893969112,40.6406670241126,40.6407337391006,40.6408058377519,40.6407357267243,40.6407459676756,40.6408548920193,40.6408904498686,40.6410011523712,40.641013434811,40.6410311294717,40.6410538419185,40.6410810658639,40.641112194453,40.6411465337908,40.641295463489,40.6414667524616,40.6416213100762,40.6416455231074,40.6417853605864,40.6417606224099,40.6418867974052,40.6417537949093,40.6417169014811,40.6415957899369,40.6415471165511,40.641503906674,40.6414570735868,40.6414445326633,40.6414169366647,40.6414177509614,40.6414196303356,40.6414486089805,40.6414866112512,40.6415318562914,40.6415892267298,40.6416234210823,40.6417043889845,40.6416412802003,40.6416054374318,40.6415968307639,40.6413101040751,40.6410265606049,40.6409352910516,40.640778472307,40.6410337646028,40.6410165498942,40.64076062251,40.6407238260831,40.64079470601,40.6413853125529,40.6413548351959,40.6407298728556,40.6406868184588,40.6406289834787,40.640337411211,40.6404843723524,40.6404139294879,40.64049800621,40.6411893132411,40.6411948275862,40.6404019226678,40.6402269775039,40.6402499994381,40.6401396742933,40.6401534508588,40.6401553047165,40.6399747221563,40.6398297989621,40.6398014863811,40.6397668913595,40.6393110568502,40.6393190784869,40.6395154888531,40.6395770862248,40.6396270409007,40.6396813733377,40.6397200061715,40.639766461292,40.6398631837617,40.6399798113142,40.6400428490554,40.6401610291754,40.640241737639,40.6403717528808,40.6403779941991,40.640378051517,40.6403763017596,40.6403547169371,40.6403385277878,40.6403277302276,40.6403006985991,40.64025447319,40.641264314303,40.6412527841996,40.641332380487,40.6414184920823,40.6413417181929,40.6412643880283,40.6402312426288,40.6402108982962,40.6401798478784,40.6401559331866,40.6401473284436,40.640154839546,40.6401820251397,40.6401932985561,40.6402402499313,40.6402393510754,40.64022237752,40.6402054077809,40.6401827104909,40.6401685958874,40.6401470876681,40.6401347166401,40.6401518322845,40.6401860422086,40.6402287827855,40.6402715561482,40.6403029378346,40.6403428713939,40.6403770609393,40.6404055351323,40.6404510394839,40.6404908433828,40.6405221611902,40.6405889571093,40.6406731897375,40.6408205083463,40.6407705498022,40.6406267656311,40.6405970739028,40.6406223400942,40.6408434740032,40.6409005198084,40.6409563680764,40.6410192666171,40.6410728727707,40.6411381838706,40.6411882834404,40.641230243367,40.6412915944699,40.6412938760177,40.6412947385713,40.6413315052665,40.6413392290625,40.6413418214672,40.6413476240489,40.6413530266726,40.6414469830814,40.6414419081215,40.6414012022506,40.6414058947742,40.6414652959815,40.6415559498269,40.6415464403581,40.6415064080169,40.6415010667695,40.6415546394995,40.6415700744487,40.6415783157209,40.6415806922796,40.6415489054513,40.6415518612082,40.6414121590756,40.6414234244543,40.6415566215642,40.6415595822251,40.641592547117,40.6415949187867,40.6415878575232,40.6416216322501,40.6416116283248,40.6415743145599,40.6414286644439,40.6415027375848,40.6414853320526,40.6416065692289,40.6416007031301,40.6414764747408,40.6414525313251,40.6415866397587,40.6415848795477,40.6416750095629,40.6416691450699,40.6414324959871,40.6413968399876,40.641613282299,40.6416074200861,40.6413834453796,40.6410457821909,40.641044095621,40.6410563284083,40.6410627826018,40.6411389959884,40.6411976043839,40.6413148145623,40.6413803093542,40.6414426286761,40.6422094534291,40.6422356139048,40.6414699143219,40.641478874172,40.6414346483965,40.6414235246873,40.6414391986628,40.6414734665234,40.6423551017098,40.6423793785328,40.6414646150127,40.641530365029,40.6415632511789,40.6417976435533,40.6418088466244,40.6423873659741,40.6423836187422,40.6425045159932,40.6425418640604,40.642039609106,40.6419968711478,40.6415760495202,40.6415298005429,40.6415936842618,40.641750235376,40.6418054975333,40.6418258769522,40.6417834006461,40.6416841588456,40.6416612596708,40.6415431332859,40.6415832520433,40.6416678570459,40.6418440930802,40.6418757224445,40.6420317560966,40.6420594856166,40.6423670759278,40.6426497857494,40.6430273599626,40.6430497686523,40.6428433002025,40.6426535847745,40.642454581783,40.642281619762,40.642106766334,40.6421254323637,40.642109982964,40.6422026651023,40.6422708667767,40.6422801988119,40.6431618267024,40.6431898248929,40.6423472516388,40.6423547232526,40.6422449017898,40.6422164541504,40.6422622932307,40.6423518192141,40.6423746828319,40.6424705401582,40.6427849926779,40.6429769680848,40.642957615929,40.6432791478459,40.6436095158079,40.6440425021198,40.6441365916753,40.6445324446376,40.644473511458,40.6440760116673,40.6440445917104,40.6436875559236,40.643821251324,40.6437234970838,40.6443188004321,40.6446106749794,40.6447060272429,40.6450964231813,40.6450469023231,40.644706160345,40.6446593622287,40.6446881827913,40.6447781642249,40.6450816031901,40.6454637281848,40.6454958325368,40.645579128804,40.6455747233487,40.6455627732037,40.6455619842893,40.6455601959409,40.6455636573995,40.6456304698132,40.6456699410801,40.6457211659054,40.6457404322002,40.6456661648156,40.6456380521481,40.6456227028443,40.6456142221316,40.6456125847819,40.6456092311764,40.6456160997193,40.6456366349969,40.6456548132509,40.64563814892,40.6455426001801,40.6454067329867,40.6453965489262,40.6451323333171,40.6450640504505,40.6450557108514,40.6450470343108,40.6453703619538,40.6453727474427,40.6455557177348,40.645838658794,40.6459619978246,40.6459727807525,40.6460763148169,40.6467007241005,40.6468189430567,40.6471761321044,40.6473103595313,40.6478434705765,40.6479079053277,40.6479206500783,40.6479016564861,40.6480800937592,40.6482352936148,40.6486996093866,40.6488805533705,40.6489255522761,40.6488911473395,40.6488866575686,40.648874784994,40.6488570800996,40.648833767373,40.6488051424053,40.6485816686879,40.6483158188509,40.6482801622901]}]],[[{"lng":[-74.0734662706626,-74.0734523502963,-74.0734369851189,-74.0734222848111,-74.0734082682496,-74.0733949525516,-74.0733823557139,-74.0733775184459,-74.0733722356987,-74.0733665968554,-74.0733606957033,-74.0733546264794,-74.0733484930982,-74.0733423935521,-74.0733364324389,-74.0733307031616,-74.073325305938,-74.0733203249656,-74.0733158453224,-74.0733119419944,-74.0733086761243,-74.0733061040376,-74.0733042682129,-74.0733031990545,-74.0733029115864,-74.0733034140223,-74.0733046950211,-74.0733142034632,-74.073324634467,-74.0733359623629,-74.0733481590608,-74.0733470322516,-74.0733451501212,-74.0733425210566,-74.0733409073627,-74.0733400790659,-74.0733400485342,-74.0733408134176,-74.0733415224828,-74.0733423669688,-74.0733446947515,-74.0733477713394,-74.0733515726235,-74.0733560566965,-74.073361184721,-74.0733669037966,-74.0733731618949,-74.0733798955621,-74.0733870446286,-74.0733945333225,-74.0734104815021,-74.0734262482716,-74.0734417751959,-74.0734596099015,-74.0734780584636,-74.0734971063964,-74.0735026389055,-74.0735085233476,-74.073514668353,-74.0735209774891,-74.0735273490354,-74.073533681265,-74.0735398770525,-74.0735458368445,-74.0735514665748,-74.0735566780931,-74.0735613874205,-74.0735655197939,-74.0735690118701,-74.0735718093084,-74.0735738634746,-74.0735751468233,-74.073575635101,-74.0735753216351,-74.0735661085427,-74.0735561953353,-74.0735455997879,-74.0735343346205,-74.0735224180509,-74.0735199987435,-74.0735098654372,-74.0734966967546,-74.0735313517051,-74.0735665323044,-74.0736022264572,-74.073638417456,-74.0736996934535,-74.0737605387432,-74.0738209460722,-74.0738809055483,-74.0739404127751,-74.0740603378054,-74.074180948205,-74.074302578217,-74.074307908412,-74.0743840161996,-74.0744602881984,-74.0745453991284,-74.0746233475877,-74.0747011004747,-74.0748107071409,-74.0750828819262,-74.0749941307351,-74.0749290910491,-74.0748231878456,-74.074806762263,-74.0747899710037,-74.0747728430821,-74.074755407955,-74.0747376988076,-74.074719744434,-74.07470157736,-74.0746880048984,-74.0746746044748,-74.0746614231191,-74.0746485023713,-74.0746358877264,-74.0746236180943,-74.0746117394125,-74.0746002866382,-74.0745893011009,-74.0745788171029,-74.074568870263,-74.0745594944454,-74.0745466603601,-74.0745331784853,-74.0745190617999,-74.0745043274631,-74.0744889950446,-74.0744730799461,-74.0744566006379,-74.0744395771321,-74.0744249992943,-74.0744099388453,-74.0743944234849,-74.074378483772,-74.0743621513603,-74.0743454541681,-74.074328426925,-74.0743111021615,-74.074293511087,-74.0742756895246,-74.0742606641872,-74.0742458121771,-74.0742311792045,-74.0742168090073,-74.0742027426836,-74.0741890255155,-74.0741756966256,-74.0741627964666,-74.0741503641673,-74.0741380861275,-74.0741262857486,-74.0741149845796,-74.074104201318,-74.0740939627893,-74.0740842861516,-74.0740751923035,-74.0740666986233,-74.0740588238083,-74.0740458259264,-74.0740322084777,-74.0740180004918,-74.0740032270365,-74.0739879151553,-74.0739720916744,-74.0739557886918,-74.0739390341281,-74.0739218589794,-74.0739026886751,-74.0738831452908,-74.0738632635544,-74.0738430757786,-74.0738226158066,-74.0738019152861,-74.0737810104794,-74.0737599334711,-74.0737466204695,-74.0737336999341,-74.0737212142909,-74.0737092004745,-74.0736976967386,-74.0736867373858,-74.0736763584742,-74.0736665918949,-74.0736574646975,-74.0736490098757,-74.0736384204895,-74.0736272287757,-74.0736154514549,-74.0736031070023,-74.0735902138934,-74.0735767963148,-74.0735628720814,-74.0735484634016,-74.0735335942424,-74.073518289883,-74.0735059130219,-74.0734930909315,-74.0734798634039,-74.0734662706626],"lat":[40.5783856858974,40.5783814640073,40.578395684188,40.578410308023,40.5784253179098,40.5784406945719,40.5784564194022,40.5784592962935,40.5784616760739,40.5784635198195,40.5784647971474,40.5784654872237,40.57846557792,40.5784650668282,40.5784639639335,40.5784622889446,40.5784600652518,40.5784573335111,40.5784541358856,40.57845052845,40.5784465664501,40.5784423202124,40.578437856219,40.5784332500064,40.578428577456,40.578423915291,40.5784193405822,40.578404592083,40.5783902103865,40.5783762298524,40.5783626819938,40.5783527986379,40.5783429827761,40.5783332684114,40.5783271980035,40.5783210364608,40.578314841908,40.578308675495,40.578305902261,40.5783025958615,40.5782966623219,40.5782909308475,40.5782854564032,40.5782802927927,40.5782754882892,40.5782710901697,40.5782671396797,40.5782636775693,40.5782607343672,40.5782583382666,40.5782564122092,40.5782537583498,40.5782503866098,40.5782328968505,40.5782157799516,40.5781990503296,40.5781966400607,40.5781947775555,40.5781934928601,40.5781928076477,40.5781927305272,40.5781932639091,40.5781943989766,40.5781961166951,40.5781983930005,40.5782011887475,40.5782044619399,40.5782081593513,40.5782122227221,40.5782165884258,40.5782211874715,40.5782259466665,40.5782307898004,40.5782356433319,40.5782497619203,40.5782636031922,40.5782771473676,40.5782903729943,40.5783032631401,40.5783056789565,40.5783157978588,40.5783279597145,40.578347845577,40.5783671866214,40.5783859733058,40.5784041981017,40.5784349802237,40.5784662566341,40.5784980246578,40.5785302792759,40.5785630183141,40.5786273973871,40.5786910292131,40.5787577113008,40.5787612541185,40.5788024817991,40.5788393604236,40.5788848119472,40.5789282005783,40.5789634262395,40.579021201694,40.5791601587556,40.5792365574164,40.5791712603218,40.5790989329643,40.5790920256963,40.5790856510729,40.5790798191267,40.5790745429057,40.579069828922,40.5790656872083,40.5790621241097,40.5790601391649,40.5790575600471,40.5790543951021,40.5790506551924,40.5790463513456,40.5790415004568,40.579036116234,40.5790302179202,40.5790238247548,40.5790169596671,40.579009644078,40.5790019020898,40.5789872065188,40.5789728544671,40.5789588596634,40.5789452406922,40.5789320102727,40.5789191874933,40.5789067845712,40.5788948172411,40.5788861520065,40.5788779823,40.5788703216732,40.5788631861891,40.5788565883917,40.5788505408275,40.578845056206,40.5788401453957,40.5788358167525,40.5788320782947,40.5788299679215,40.578827234392,40.578823884713,40.5788199305833,40.5788153810232,40.578810253259,40.5788045581549,40.5787983171289,40.5787915465737,40.5787836000277,40.5787752437301,40.5787664924097,40.5787573651528,40.5787478797006,40.5787380539676,40.5787279107247,40.578717468389,40.5787067462144,40.5786955711584,40.5786848295639,40.5786745452014,40.57866473598,40.578655417965,40.5786466095672,40.5786383280212,40.5786305880514,40.5786234038777,40.5786161310216,40.5786094549748,40.5786033869394,40.5785979399617,40.5785931200509,40.5785889348929,40.5785853926732,40.5785824988995,40.5785773884135,40.5785717204708,40.5785655131376,40.5785587856562,40.5785515582732,40.5785438545884,40.5785356965254,40.5785271127113,40.5785181249078,40.5785087655945,40.5784970268867,40.5784856150789,40.5784745500963,40.5784638488474,40.5784535284082,40.5784436046784,40.5784340935615,40.5784250102885,40.5784163709267,40.5784081858464,40.5784017517526,40.5783958443202,40.5783904844646,40.5783856858974]}],[{"lng":[-74.0643600372125,-74.0644088166617,-74.0645875231509,-74.0645418613377,-74.0643600372125],"lat":[40.5882678911748,40.5882389243158,40.5884031574157,40.5884339923943,40.5882678911748]}],[{"lng":[-74.0549886783945,-74.0549991647687,-74.0550337313576,-74.0550519409882,-74.0550195433676,-74.0550559101294,-74.0551040353216,-74.0551725101646,-74.0552871969713,-74.0551600112236,-74.0549886783945],"lat":[40.6066606969118,40.6066457447841,40.6066598261434,40.6066338609728,40.6066206629666,40.6065688056947,40.6065884106716,40.6064907673493,40.6065388900787,40.6067304918535,40.6066606969118]}],[{"lng":[-74.1961412310206,-74.1929756774533,-74.1926776422956,-74.1920996012195,-74.19151630641,-74.1909278523288,-74.1903343342685,-74.1897358483375,-74.1891324916308,-74.1885243616571,-74.1879115568774,-74.1872941765054,-74.1866723204915,-74.1859191691804,-74.1851706590226,-74.184426877268,-74.1836879109284,-74.1819023571359,-74.180334248424,-74.1799370611388,-74.1795447069973,-74.1792462347089,-74.1791837742976,-74.1788839057371,-74.1782817743403,-74.1780882019124,-74.177815021471,-74.1777529863655,-74.1761005285905,-74.1751962573228,-74.1749032855397,-74.174597062586,-74.1742788798559,-74.1739501677995,-74.1736124409434,-74.1732673084324,-74.1727075220247,-74.1723626102388,-74.1720711300466,-74.1718117809592,-74.1709554651375,-74.1698574068933,-74.1695365651142,-74.1692362454647,-74.1688889431174,-74.1687847205829,-74.1684731134242,-74.1680808633964,-74.167697103615,-74.1674266668983,-74.1660319330625,-74.1657068252146,-74.1648419038537,-74.1639409497624,-74.1633739183966,-74.1623477632941,-74.1616180742892,-74.1605006921234,-74.1598317893642,-74.1591052153822,-74.158617417266,-74.1579267386242,-74.1573738365634,-74.1565118788053,-74.1547926527579,-74.1547408023168,-74.153868323359,-74.1537911672324,-74.1537183428746,-74.1531727534184,-74.1512034824914,-74.1503190076634,-74.150186665171,-74.1496842382463,-74.149099517847,-74.1488696133884,-74.1483961498217,-74.1482388665267,-74.1478892677469,-74.1475909532907,-74.14724381883,-74.146281774311,-74.1454990358979,-74.1445610109588,-74.1439455821311,-74.14355036507,-74.142879167357,-74.1418444922298,-74.1408864119256,-74.1398426516882,-74.1390029483852,-74.1380692982536,-74.1371367889934,-74.1364079738768,-74.1361628751426,-74.1349425823379,-74.1340090913369,-74.1330793880416,-74.1321045972236,-74.1315687340858,-74.1309400232729,-74.1298332375903,-74.1287489750645,-74.1278426714669,-74.1274296081366,-74.1267436156091,-74.1265091152447,-74.1263049784264,-74.1252004038081,-74.1251456324918,-74.1245261878744,-74.1239812611203,-74.1235063919732,-74.1232652198775,-74.1225232481015,-74.1224721469679,-74.1213517962625,-74.1209847227257,-74.1199551026624,-74.1183752738762,-74.1174278136688,-74.1169152638732,-74.1167887413211,-74.1165733876026,-74.1163561722905,-74.1161373683003,-74.1159172505448,-74.1156960955886,-74.1154741813677,-74.1152517866413,-74.1150291908367,-74.1148066736336,-74.1145845146131,-74.1142548823079,-74.1139254467172,-74.1135976182838,-74.1132727787911,-74.1129522981178,-74.1126374738107,-74.1111363814495,-74.1108265435469,-74.1104795650208,-74.1100093411824,-74.1094569652844,-74.1089014622398,-74.1088526825127,-74.1083441793557,-74.1077864524133,-74.1072296390472,-74.1066750969231,-74.1054938902475,-74.1042949546501,-74.1033759701738,-74.1029018244486,-74.1023959698123,-74.1018122545728,-74.1016547806967,-74.1013859682836,-74.1008280694218,-74.1000361659006,-74.0994698982082,-74.0993845303205,-74.0977696876388,-74.0973045568559,-74.0972175072902,-74.0959270457183,-74.0955582976852,-74.0951902707625,-74.0948248911882,-74.0944640494356,-74.0941095910939,-74.0930568561993,-74.0908154106232,-74.090454959314,-74.0894937013172,-74.0887463865131,-74.08796268696,-74.087164216049,-74.0867299710324,-74.0854275631428,-74.0849000251211,-74.0840678169856,-74.0835513160172,-74.0834193337422,-74.0828094986345,-74.081554701236,-74.0801476556437,-74.0777808956554,-74.0771469658721,-74.0765673473533,-74.0758492212917,-74.0755171401,-74.0754323971439,-74.0747894220168,-74.073999653081,-74.0735832666406,-74.0733520736676,-74.0715149332337,-74.0700036821387,-74.0691403098743,-74.0689811828008,-74.0666288063531,-74.0655066319099,-74.0650851416127,-74.0640008137063,-74.0635056566019,-74.0626077283667,-74.0621249908936,-74.0620926651399,-74.062067039671,-74.0619561793393,-74.0610841405996,-74.0612897002948,-74.0619200267061,-74.0620634236495,-74.0628407291809,-74.0637593335814,-74.0636262262527,-74.0635794712449,-74.0632995364789,-74.0628960002703,-74.0624820031818,-74.0620555868396,-74.0617388295381,-74.0605601754054,-74.0615077639733,-74.0618181575796,-74.0626009358209,-74.0626881084882,-74.0626882494532,-74.0626884036215,-74.0627935288087,-74.0627936469587,-74.0627937886333,-74.0629138457672,-74.0629139874503,-74.0629141293707,-74.0630447619832,-74.063044997929,-74.0630452578556,-74.0631008501731,-74.0631641537116,-74.0633605055731,-74.0641789596957,-74.0644478548609,-74.0653380118304,-74.0657763656931,-74.0665617301802,-74.0666255950235,-74.0666737077574,-74.0687483925866,-74.0690253902049,-74.0692873830133,-74.0695335598975,-74.0697632175143,-74.0699757532453,-74.0702116931775,-74.0711977234038,-74.0713115058186,-74.0714436987433,-74.0715929326755,-74.0717574744879,-74.0719351994526,-74.0721560935358,-74.0723667002151,-74.0725659217358,-74.0727527782497,-74.0729264086931,-74.0735337984666,-74.0736450889696,-74.0741241000606,-74.0746968511872,-74.0747511641769,-74.0752516172839,-74.0767304009693,-74.077726921944,-74.0778023740842,-74.0778714792686,-74.0791509238097,-74.0795429885944,-74.079947275494,-74.0803630521683,-74.0807895390109,-74.0817159143092,-74.0824393056807,-74.0829075260775,-74.0833421756386,-74.0837683881891,-74.0842588883333,-74.0848880868417,-74.0854585227023,-74.0858020348512,-74.087697375959,-74.0877817102823,-74.0879193916578,-74.0881335529947,-74.0883388800727,-74.0885344761313,-74.0887195034333,-74.088766266508,-74.0888140769824,-74.0891785702706,-74.0894176459207,-74.0894603771765,-74.0894625259192,-74.089706213169,-74.0902776030581,-74.0910709118548,-74.0920445158073,-74.0927507430531,-74.0927705822398,-74.0938729485011,-74.094605968253,-74.0953463096093,-74.0960885193106,-74.0968216684653,-74.0975663500422,-74.0983201493462,-74.0990495449778,-74.0997875664952,-74.100540513185,-74.1012715078008,-74.1020293093996,-74.1027719714833,-74.1035224424516,-74.1042693696863,-74.1047097914178,-74.1052429037728,-74.1048925340597,-74.1030623502508,-74.1039162653103,-74.1039260189981,-74.1040819676967,-74.1042374150949,-74.1043918930113,-74.1045449361854,-74.1046960836793,-74.1048448802657,-74.1049908778003,-74.1051336365711,-74.1052727266234,-74.1054077290547,-74.105531591107,-74.105650641249,-74.1057645053775,-74.1058728256901,-74.1059752618094,-74.1060714918527,-74.1061612134433,-74.1062441446606,-74.1066215258488,-74.1066043939317,-74.1054729455723,-74.1046693161401,-74.1038698555966,-74.1030703666264,-74.1020893826292,-74.1015496156722,-74.1007865099782,-74.1000228097541,-74.0989520165496,-74.0976300813006,-74.0979713491121,-74.0982572108537,-74.0985353612661,-74.0988205963189,-74.0988854901243,-74.0990498808949,-74.0993511497426,-74.099643467734,-74.0999637517971,-74.1002705391573,-74.1007127169145,-74.1008081517748,-74.1012385736843,-74.1015227350791,-74.1017373268587,-74.1019917041854,-74.1022430416423,-74.1024912301959,-74.102736162177,-74.1029777313271,-74.1032158330786,-74.1034503639065,-74.1036812220584,-74.1039083073734,-74.1041315213253,-74.104846271245,-74.1055764550874,-74.1061723704817,-74.106906924319,-74.1071040086103,-74.1078679586248,-74.1086159408723,-74.1093621450181,-74.1101394717195,-74.1121123978743,-74.1135152232929,-74.1142986670062,-74.1147179679246,-74.1150993995063,-74.1161742246439,-74.1163000392628,-74.1163633640869,-74.116410527291,-74.1172129034508,-74.1180405535346,-74.1187603887196,-74.1194800974205,-74.1202400898627,-74.1216663634852,-74.1230928113978,-74.1232920615201,-74.1235966318533,-74.1239506369465,-74.124899043723,-74.1241856038726,-74.1235840138025,-74.1234515303664,-74.1234164888568,-74.1232219633198,-74.123170037416,-74.1231160913419,-74.1227896727344,-74.1225964492859,-74.1221685656974,-74.1216256400038,-74.1214453570591,-74.1213873134497,-74.1213881541003,-74.1213575435243,-74.1213575197575,-74.1213575078366,-74.1213425480553,-74.121343520693,-74.1213435208248,-74.1213604469873,-74.1213929926679,-74.1216043917063,-74.1217007550939,-74.1218307982974,-74.1218533359744,-74.1217262391975,-74.1220960212705,-74.1226437541449,-74.1227605800866,-74.1227606984399,-74.1227608403022,-74.122891205807,-74.1228912772967,-74.1228913599735,-74.1230330420598,-74.123033196429,-74.1230333613109,-74.1231835234829,-74.1231836648387,-74.1231838072792,-74.1233393647001,-74.1233395532961,-74.1233397304328,-74.1234975648371,-74.1240583616202,-74.1251589568915,-74.1253527570123,-74.125672678039,-74.1266568893801,-74.12706747024,-74.127467498419,-74.1274928245819,-74.1275266186025,-74.1275683879978,-74.1276175241908,-74.1276733110061,-74.1277349354834,-74.1278471150735,-74.1281479757139,-74.1291446441952,-74.1292832020009,-74.1309404878287,-74.1319538353831,-74.1325162036901,-74.1326491995887,-74.1327843625368,-74.1329214536417,-74.133060229789,-74.1332400720371,-74.133421074384,-74.1336031137798,-74.133786066999,-74.1342774930893,-74.1346185566227,-74.1357919339248,-74.1363534324276,-74.137042581878,-74.1381387369323,-74.1384659707023,-74.1402400878657,-74.1411063134086,-74.1418476464932,-74.1441858820751,-74.1458047420613,-74.1469905773909,-74.1472356836284,-74.1480214873466,-74.1501459479379,-74.1516371359177,-74.1526287023336,-74.1625647565192,-74.1643866512156,-74.1644273761467,-74.1647661213767,-74.1648521499664,-74.1649961655394,-74.1655501357253,-74.1659198171382,-74.166889720225,-74.1698258238223,-74.1701472932972,-74.1704674823617,-74.1707862269769,-74.1711033637115,-74.1712509821698,-74.1715081866497,-74.171777239006,-74.1718516652276,-74.1719192139948,-74.1722550766378,-74.1734645182208,-74.1742166231723,-74.1747920243117,-74.1748948087025,-74.1750004144386,-74.1751085148576,-74.1752187756933,-74.1753308557817,-74.1754444084295,-74.1756414494582,-74.175836736932,-74.1760299334002,-74.1762207053066,-74.1764087227188,-74.1765936607424,-74.1775803674472,-74.1783981394257,-74.1790769996092,-74.1793691998134,-74.1831259388962,-74.1834662119469,-74.1838252136254,-74.1847420761179,-74.1857085213456,-74.185919772638,-74.1860271449661,-74.186099217619,-74.186277027529,-74.1864617449917,-74.18665327775,-74.186851530137,-74.1870564031241,-74.1872677943703,-74.1874855982733,-74.1877097060639,-74.1879400057353,-74.1881763822238,-74.1884187174249,-74.188666890252,-74.1889207766972,-74.1891802498931,-74.1892227173139,-74.1891250824619,-74.1890353667766,-74.1890096735266,-74.1890398957837,-74.1890943144194,-74.1891966091692,-74.1892512669193,-74.1891953797036,-74.1901329419416,-74.1902518234609,-74.190108808563,-74.1900695778584,-74.1899751756534,-74.1899205888627,-74.1898963711543,-74.1899221412573,-74.189980916187,-74.1900602667698,-74.1903770210933,-74.1904620703501,-74.1906405300715,-74.1917684424512,-74.1936329911255,-74.1974980000875,-74.1988762263611,-74.2005840002506,-74.2029499998021,-74.2044119994804,-74.2053989146549,-74.2060284124252,-74.205961542947,-74.2059864121584,-74.2060030986441,-74.2060127029352,-74.2060116443702,-74.2059982457698,-74.2059890732033,-74.2059860292211,-74.2059876812101,-74.205994144246,-74.2059925508149,-74.2059834198857,-74.2059466029055,-74.2059215985032,-74.2059186149627,-74.205917533295,-74.2058970544075,-74.2058907981489,-74.205820692153,-74.2057755076904,-74.205764942217,-74.2057598276791,-74.2057573425926,-74.2057549623512,-74.2057533294656,-74.2057627005456,-74.2057719724298,-74.2057744110879,-74.2057678712305,-74.2057469274952,-74.2057426294888,-74.2057437992123,-74.2057420614764,-74.205738088377,-74.2057240328971,-74.2056970265166,-74.2056590104846,-74.2056175719187,-74.2055746990717,-74.2054430299924,-74.2054173705709,-74.2054115908095,-74.2054067987036,-74.2053929112427,-74.2053770659722,-74.2053569952066,-74.2053222937089,-74.2052879682221,-74.2052722088488,-74.2052695881313,-74.2052693620202,-74.2052720215424,-74.2052670037838,-74.2052492056191,-74.2052128771437,-74.2051654526205,-74.2051375063797,-74.205125214952,-74.2051223107756,-74.2051115804904,-74.2050813698724,-74.205069473241,-74.2050682243607,-74.2050785313772,-74.2050897605968,-74.205108004006,-74.2051220944173,-74.2051236729696,-74.2051188839012,-74.2050909582431,-74.205074227356,-74.2050701239878,-74.2051018651468,-74.2051251085444,-74.2051307703334,-74.205132259195,-74.20512670483,-74.2051050512329,-74.2050967103753,-74.2050954230204,-74.2050933954492,-74.2050885447482,-74.2050689754382,-74.2050564590789,-74.2050551441379,-74.2050426312567,-74.2050350678488,-74.2050190317369,-74.2050022790396,-74.2049911958832,-74.2049829179168,-74.2049802230257,-74.2049655945386,-74.2048866223186,-74.204876875487,-74.2048643038844,-74.204831410145,-74.2048019833523,-74.2047781530964,-74.2047697629106,-74.204762800828,-74.2047621602706,-74.2047622192459,-74.2047559701127,-74.2047356972107,-74.2047224023388,-74.2047091190273,-74.2047028688956,-74.204702944229,-74.2047163529982,-74.2047262326815,-74.2047459499098,-74.2047509413077,-74.2047495901842,-74.2047398144363,-74.2047251117314,-74.2047118159388,-74.2047048341604,-74.2047034748333,-74.2047035256027,-74.2047112806183,-74.20472604416,-74.2047358887146,-74.2047457332754,-74.2047541750516,-74.2047556122377,-74.2047493434149,-74.2047445073956,-74.2047431669758,-74.2047390119264,-74.2047271220416,-74.2047053942523,-74.2046640441503,-74.2046381497119,-74.2046241736579,-74.2046193214423,-74.2046193803717,-74.20461943767,-74.2046061705148,-74.2045970827756,-74.2045894076441,-74.2045810428921,-74.2045434173059,-74.2045302398873,-74.2045150339666,-74.2045102722502,-74.2044998430847,-74.2044740288426,-74.2044272139775,-74.2044007643369,-74.2043987721181,-74.2043975271852,-74.2044018874198,-74.2044138919413,-74.2044470555812,-74.204456975569,-74.2044683523493,-74.2044859834887,-74.2045380821564,-74.2046147608249,-74.2046303060135,-74.204633902081,-74.2046297780441,-74.2046025344736,-74.2044214540837,-74.2043977140959,-74.2043768080517,-74.2043643389908,-74.2043616759436,-74.204367414599,-74.2043962998548,-74.2044139254873,-74.2044245698881,-74.2044232853829,-74.2044178168425,-74.2044193911699,-74.2044420011903,-74.2044385710287,-74.2044260291989,-74.2044121012049,-74.2044108136356,-74.2044221001769,-74.2044004957286,-74.2044104092736,-74.2044147166378,-74.2044042830932,-74.2043636722888,-74.2043412730566,-74.2043258879498,-74.2043198233287,-74.2043189388621,-74.2043186709932,-74.2043182896575,-74.2043185492583,-74.2043225489158,-74.2043422452022,-74.2043507166695,-74.2043500952635,-74.2043362196457,-74.2043075773417,-74.2042452874235,-74.2041738351582,-74.2041395456036,-74.2041199929543,-74.2041194025833,-74.2041412497183,-74.2041707691207,-74.204205423295,-74.2042235687755,-74.2042594366548,-74.204274942826,-74.2042771354465,-74.2042557048767,-74.2042585709211,-74.2042586542666,-74.2042538170947,-74.2042398435841,-74.2042202647798,-74.2042154111593,-74.2042022853119,-74.2042024062095,-74.2042169336981,-74.2042354561409,-74.2042370672539,-74.2042456083701,-74.2042457129551,-74.2042458567567,-74.2042504045647,-74.2042581287547,-74.2042653300289,-74.2042921520311,-74.2043541224735,-74.20437820037,-74.2043826647357,-74.2043857935899,-74.2043831912767,-74.2043791782155,-74.2043863332232,-74.2043976229699,-74.2044256759408,-74.2044901874018,-74.2045421222818,-74.2045646538937,-74.2045789393469,-74.204580656948,-74.2045514329175,-74.2044983379422,-74.2044339517499,-74.204410234173,-74.2044052367818,-74.2043782968335,-74.2043523480943,-74.204328146734,-74.2043063980027,-74.2042877356799,-74.2042727036055,-74.2042617398313,-74.204255163856,-74.2042531673141,-74.2042558083912,-74.2042612346108,-74.2042606807441,-74.2042439920567,-74.2042249077046,-74.204203858014,-74.2041813176277,-74.2041569224048,-74.2041302137659,-74.2041219535706,-74.2041220096959,-74.2041303813918,-74.2041469538477,-74.2041714997652,-74.204203682475,-74.2043230214239,-74.2045742207294,-74.2047052984863,-74.2044681031451,-74.2044354840094,-74.2046460894321,-74.2044089255159,-74.2042030060916,-74.2041007534238,-74.2038588660928,-74.203699743358,-74.2039416761199,-74.2038855045637,-74.2026586697188,-74.2026340159662,-74.2026046654403,-74.2025713667473,-74.2025349691915,-74.2024964011137,-74.2024566462135,-74.2024167184607,-74.2023776362332,-74.2023403963442,-74.2023059486182,-74.2022751716654,-74.2022168883266,-74.2021537443157,-74.2020860296481,-74.2020140553344,-74.2024677595674,-74.2025862272912,-74.203052549115,-74.2029634019565,-74.2024549506314,-74.202027339207,-74.2020672733737,-74.2020885797091,-74.2021069333324,-74.2021128970273,-74.2021178437595,-74.2021216397466,-74.2021241823272,-74.2021254027382,-74.2021252679735,-74.2021237816774,-74.202120984046,-74.2021169507396,-74.2021058230419,-74.2020902183828,-74.2020706076674,-74.2020239800381,-74.2019794768125,-74.2019376422769,-74.2018989880804,-74.2018717090535,-74.2018511296591,-74.2018376001095,-74.2018282943149,-74.2018257314604,-74.2018299820351,-74.2018409291553,-74.201858271778,-74.2018815329784,-74.2019226692231,-74.2019588649275,-74.2019893996557,-74.2020034981303,-74.2023028459175,-74.2023174356984,-74.2022872787704,-74.2023164576832,-74.2023086400305,-74.202280579096,-74.2021000909813,-74.2020203245778,-74.2020596087162,-74.2020094455734,-74.2019436762176,-74.2017547894857,-74.2018244360961,-74.2017824822654,-74.2017216016059,-74.2013033939439,-74.2012892598436,-74.2009254049636,-74.2007488080641,-74.2006897679247,-74.2006312785556,-74.2005745767087,-74.2005208613405,-74.2004712682611,-74.2004268461184,-74.2004288647193,-74.2004234595496,-74.2004107158449,-74.2003908345855,-74.2003641293271,-74.2003310212563,-74.200292032548,-74.2002254073941,-74.2001565682654,-74.2000440359903,-74.1999370342864,-74.1998358133172,-74.1997406097351,-74.1996516461287,-74.1995691305016,-74.1994932557867,-74.1994241993941,-74.1993621227969,-74.1993889882595,-74.1994232276861,-74.1994642489926,-74.1994735213771,-74.1994816556487,-74.1994884089285,-74.1994935795723,-74.199497013191,-74.1994986072605,-74.1994983141833,-74.199497363626,-74.1994923645753,-74.1994834487973,-74.1994708512993,-74.1994563211772,-74.19943168324,-74.1993999986457,-74.1993621758988,-74.1993279905563,-74.1992911618253,-74.1992108242351,-74.1990246572613,-74.19894864455,-74.1988949898269,-74.198888882422,-74.1988744354111,-74.1988610114675,-74.1987971341399,-74.1987714026434,-74.1987680545815,-74.1987323255373,-74.198696623404,-74.1986732421609,-74.198655486674,-74.1986321125436,-74.1986255626401,-74.1986302228065,-74.1986281079242,-74.1986092208703,-74.1985847317169,-74.1985613714359,-74.1985290229493,-74.1984955632754,-74.1984542398731,-74.1984275075589,-74.1984029664992,-74.198350420328,-74.1983079661438,-74.1982531582802,-74.1982230587191,-74.1981918348391,-74.1981550034999,-74.1981204131753,-74.1980824663724,-74.1980445103724,-74.1980088001168,-74.1980010580027,-74.1979966845435,-74.1979654616298,-74.1979622670407,-74.197950028516,-74.1979143164048,-74.197883954734,-74.1978772970357,-74.1978752065185,-74.1978729711544,-74.1978349717546,-74.1978003799241,-74.1977679544497,-74.1977299271094,-74.1976863621059,-74.1976371771622,-74.1976047161768,-74.1975935096174,-74.197557684993,-74.1975487296359,-74.1975184758748,-74.1975135771886,-74.1975144866894,-74.1975223843042,-74.1975145823943,-74.1974765417413,-74.197457644656,-74.1974544831274,-74.1974524331473,-74.1974548688037,-74.1974830546024,-74.1974887949506,-74.1974967092989,-74.1974810681359,-74.1974329636377,-74.1973837882814,-74.1973760324073,-74.1973616638333,-74.1973439198129,-74.1973126963709,-74.1972993393776,-74.1973061971382,-74.1973343937785,-74.1973760161972,-74.1974176437281,-74.197438932521,-74.1983818129487,-74.198759582053,-74.1991833388908,-74.2001486675991,-74.2013852747252,-74.2022184985106,-74.2028162837459,-74.202739270472,-74.2026729916908,-74.2023017901411,-74.2024437444953,-74.2006422973026,-74.2004532444463,-74.2005898644603,-74.2006900130349,-74.2007629080135,-74.2008089237767,-74.2008280438635,-74.2008304096493,-74.2008372382107,-74.2008474252264,-74.2008453524152,-74.200843286058,-74.2008468081847,-74.2008626758844,-74.200876296246,-74.2008764607542,-74.2008766278349,-74.2008913696865,-74.200899384049,-74.2009073971022,-74.2009142323828,-74.2009098670507,-74.200878584907,-74.2008730128366,-74.2008911002278,-74.2008934656438,-74.2009002735356,-74.2008913855701,-74.2008769051662,-74.2008747874013,-74.2008468081713,-74.2008154337286,-74.2007829044989,-74.2007637976405,-74.2007400934952,-74.2007085566909,-74.2006950752679,-74.2006412520387,-74.2005841006868,-74.2005527564982,-74.2005415633182,-74.2004867496923,-74.2004386710961,-74.2004152908061,-74.2003874236246,-74.2003629250218,-74.2003485065203,-74.2003520385625,-74.2003656610187,-74.2003960797443,-74.2004231348726,-74.2004423126977,-74.2004839361972,-74.2005165714904,-74.2005671260383,-74.2006366965343,-74.2007073781953,-74.2007724770938,-74.2008084179395,-74.2008399145064,-74.2008344149688,-74.2008154237475,-74.2007583564286,-74.2007113690562,-74.2006979927424,-74.2006959274555,-74.2006904952547,-74.2006805395224,-74.2006807141483,-74.2006909292732,-74.2007078921841,-74.2007147232489,-74.200739547533,-74.2007531613425,-74.2007576474083,-74.2007757492182,-74.2007983279402,-74.2008209169792,-74.200858062602,-74.2008963265329,-74.2009356989252,-74.2009649963309,-74.2009729628049,-74.2009708977308,-74.2009755282761,-74.2009936301872,-74.2010161895566,-74.2010286835011,-74.2010354832875,-74.2010265753964,-74.2010053312689,-74.2009952585928,-74.2009830333952,-74.2009821738937,-74.2009809584708,-74.2009844920294,-74.2009868438433,-74.2010037523627,-74.2010407757325,-74.2010688259973,-74.2010699746923,-74.2010520698347,-74.2009971557567,-74.2009231855452,-74.2008492046015,-74.2007740792591,-74.2007000264049,-74.2006405172708,-74.2005798912497,-74.2005361350731,-74.2005058812991,-74.2004667406196,-74.2004578309905,-74.2004624009499,-74.2004905276733,-74.2005051534754,-74.2004951474254,-74.2004705294054,-74.2004324510315,-74.2004280019192,-74.2004370934675,-74.2004595529638,-74.2005268800416,-74.200567251228,-74.2006412284866,-74.2007151890816,-74.2007734748508,-74.2008475082582,-74.200873315822,-74.2008767449405,-74.2008768991777,-74.200899357555,-74.2009296667265,-74.2009296950112,-74.2009219200421,-74.2009309452916,-74.2009826019349,-74.2009904780778,-74.200986158669,-74.2010008972181,-74.2010211961115,-74.2010683691378,-74.2010898345989,-74.2011213819469,-74.2011248343392,-74.2011271819975,-74.2011384820717,-74.2011497744335,-74.2011790613172,-74.2011971691267,-74.201210796147,-74.2012311382102,-74.2012313055957,-74.2012336636187,-74.2012584731012,-74.2012888342665,-74.2013314535806,-74.2013830378687,-74.2014323999804,-74.2014357887568,-74.2014224095955,-74.2014022547962,-74.2013293950202,-74.2013081077916,-74.2013014781412,-74.2012994120438,-74.2012962216331,-74.2012896637072,-74.2012830046591,-74.2012662853391,-74.2012651893585,-74.2012597067796,-74.2012430558625,-74.2012308920349,-74.201226575976,-74.2012312268074,-74.2012448463135,-74.2012618232833,-74.2012776856668,-74.20129466954,-74.2013127655428,-74.20132414579,-74.2013231915088,-74.2013110214574,-74.2012876035383,-74.2012753426313,-74.2012843589773,-74.2013022972531,-74.2013762481191,-74.2014502083927,-74.2015241991573,-74.2015455333477,-74.2015613264202,-74.2015670984459,-74.201574000629,-74.2015853772703,-74.2016023559998,-74.2016193383799,-74.2016284744285,-74.2016320110412,-74.2016321787644,-74.2016334667117,-74.2016313969507,-74.2016248443253,-74.2016126773318,-74.2015993939951,-74.2015849443556,-74.2015625854995,-74.2015166791995,-74.2014449565263,-74.2013720912927,-74.2013440890535,-74.2013340454838,-74.2013374852188,-74.2013801947627,-74.2014083169122,-74.2014117624972,-74.2013973307357,-74.2013649706972,-74.2013292449223,-74.2012789255904,-74.2012263478617,-74.2011782330442,-74.2011357660296,-74.2010989240154,-74.2010766279033,-74.201081283896,-74.2010904271504,-74.2010883594742,-74.2011042163682,-74.2011391215753,-74.2011448901549,-74.2011439415058,-74.2011396286715,-74.201134189277,-74.2011197860988,-74.2011053796627,-74.201088729916,-74.2010709587325,-74.2010565544187,-74.2010443924931,-74.201036711609,-74.2010301557307,-74.2010224773963,-74.2010136740913,-74.2010085351875,-74.2010059946951,-74.2009960772787,-74.200985042391,-74.2009784804138,-74.200981958026,-74.2010100798537,-74.2010370679299,-74.2010517640194,-74.2010609057429,-74.2010610807166,-74.2010623688921,-74.2010636579491,-74.2010615850544,-74.2010595083271,-74.2010608003345,-74.2010766627469,-74.2010958727414,-74.2011318960846,-74.201170147798,-74.2011825235367,-74.2012083135554,-74.2012161553162,-74.2014167066776,-74.2013926063758,-74.2009862556541,-74.2008047968128,-74.2007548389544,-74.2006212335449,-74.2006112133297,-74.200579878649,-74.2005249774727,-74.2004768171586,-74.2004511906391,-74.2004356587747,-74.2004257378512,-74.2004236656096,-74.2004249542167,-74.2004251004293,-74.2004241478587,-74.2004231933758,-74.2004222382351,-74.200413439778,-74.2004081277162,-74.200725721301,-74.2007259406904,-74.2007272487523,-74.2007296067241,-74.2007329447304,-74.2007371638545,-74.2007421390686,-74.2007477229399,-74.2007537499986,-74.200760041642,-74.2007664114268,-74.200772670594,-74.2007786336628,-74.2007841239267,-74.2007889786898,-74.2007930540885,-74.2007962293544,-74.200798410393,-74.2007995325724,-74.2007995626381,-74.200798499699,-74.2007916938454,-74.2007900531536,-74.2007874488768,-74.2007839564835,-74.2007796771786,-74.2007747349708,-74.2007692730789,-74.2007634497816,-74.2007574338305,-74.2007513995605,-74.2007455218368,-74.2007399709885,-74.200734907872,-74.2007304792101,-74.2007268133394,-74.2007240164922,-74.2007221697174,-74.200716953545,-74.2004031164306,-74.2003892830183,-74.2003748747354,-74.2003638279674,-74.2003561484403,-74.2003439823211,-74.2003351882087,-74.2003297547489,-74.200327683645,-74.2003222411599,-74.2003067104727,-74.2002866954248,-74.2002722901604,-74.2002578816457,-74.2002434705453,-74.2002301813125,-74.2002157708256,-74.2002024815483,-74.2001869465593,-74.2001869542459,-74.2001846215905,-74.2003614865723,-74.2003724648818,-74.2003767774272,-74.2003818373219,-74.2003875040384,-74.2003936201966,-74.200400015934,-74.2004065136234,-74.2004129328063,-74.2004190952045,-74.2004248296711,-74.2004299769445,-74.2004343940705,-74.2004379583734,-74.2004405708625,-74.2004421589816,-74.2004426786241,-74.2004042757766,-74.2004005311311,-74.2003960175844,-74.2003908585792,-74.2003851952115,-74.2003791823709,-74.2003729845055,-74.2003667711233,-74.2003607121568,-74.2003549733154,-74.2003497115532,-74.2003450707762,-74.200341177907,-74.2003381394133,-74.2003360383959,-74.2003349323162,-74.2003348514246,-74.2003458123817,-74.2001726540773,-74.2001570067433,-74.2001381058405,-74.2001079859317,-74.20006776011,-74.2000207995478,-74.1999704760824,-74.1999178947118,-74.199860828096,-74.1998048856528,-74.1997534272433,-74.1996986010278,-74.1996751207576,-74.1995813819546,-74.1992239618957,-74.1988891094792,-74.1988306761224,-74.1987348557128,-74.1986649196422,-74.1986224779907,-74.1985674909544,-74.1985100206544,-74.19843746919,-74.198368813536,-74.1983272698561,-74.1982697421849,-74.1982146141594,-74.198167032012,-74.1981095948968,-74.1980296116513,-74.1979746931524,-74.1979948616342,-74.1980050158084,-74.198042754962,-74.19805286271,-74.1980251993393,-74.1979978101797,-74.1979702041423,-74.1979451159957,-74.1978975167805,-74.1978274903918,-74.1977825059901,-74.1977650823139,-74.197758099691,-74.1977290387076,-74.1977027614617,-74.1976642835046,-74.1976370156922,-74.1976238290096,-74.1975993735931,-74.1975655907895,-74.197525254861,-74.1974858830618,-74.1974558445895,-74.1974126603351,-74.19737034865,-74.1973439606133,-74.1973361947318,-74.1973081429976,-74.1972565793611,-74.1971894017817,-74.1971237751068,-74.1970785077629,-74.1970676955196,-74.1970787258873,-74.1970584922606,-74.1970178836044,-74.1969538204287,-74.1968866713236,-74.1968773141207,-74.1968398993352,-74.1967853063197,-74.1967370056033,-74.1967356218844,-74.1967732980772,-74.1968124980791,-74.1968391866412,-74.1968361395884,-74.1968284444275,-74.196845673867,-74.1968738772257,-74.1968786566836,-74.1968521147611,-74.1968068189623,-74.1967662463501,-74.1967366157925,-74.1967100920207,-74.1966663245121,-74.1965991678593,-74.1965585661401,-74.1965319126956,-74.1965037536452,-74.1964319548283,-74.1963664701807,-74.1963103119084,-74.1962667378237,-74.1962092047991,-74.1961937804894,-74.1961767889133,-74.1961754221726,-74.1961739873556,-74.1962035955031,-74.1961987972533,-74.1961607404317,-74.1961412310206],"lat":[40.6347927589935,40.6331428325197,40.6329864660791,40.6326689333536,40.6323570296587,40.6320508054671,40.6317503103321,40.6314555928789,40.6311667009126,40.6308836810612,40.6306065791205,40.6303354399282,40.6300703073563,40.6297464457578,40.6294164023978,40.6290802156771,40.6287379250507,40.6277558072062,40.6268346301751,40.6266012965199,40.6263623541178,40.6261805812568,40.626137885673,40.6259328717369,40.625451361419,40.6252604265177,40.6249909629019,40.6249384498507,40.6234062428804,40.6227062438796,40.6225291071353,40.6223640119917,40.622211792356,40.6220731685179,40.6219487408698,40.6218389838629,40.6217115382825,40.621635798865,40.6215786205853,40.6215433837547,40.6214421806275,40.6213123869048,40.6212705001099,40.6212164336711,40.6211511433497,40.6211240285444,40.6210458153045,40.6209362561871,40.6207902747522,40.6206772840716,40.6200945345408,40.619954036436,40.6195724049034,40.6191432619348,40.6188545902809,40.6183421565519,40.6179460636856,40.6172479002834,40.6168161457484,40.6163215651533,40.615939315916,40.6154574246042,40.615031910829,40.6143544820095,40.6130322309345,40.6129923178982,40.6123206275904,40.6122556122519,40.6122062818525,40.6117615217529,40.6102649953817,40.6095928146879,40.6094978111544,40.6092005379402,40.6088825569838,40.6087715775485,40.6085554435014,40.6084941448039,40.6083578921406,40.6082574343827,40.6081421177466,40.6078862737308,40.607730378479,40.6076150255798,40.6075904854894,40.6075747239116,40.6075854387744,40.6076415471229,40.607693493897,40.607746310443,40.6077910673952,40.6078408239624,40.6078905117743,40.6079296716997,40.6079441825366,40.6080069646996,40.6080549819727,40.608102797299,40.6081529236038,40.608181172361,40.6082143124153,40.6083039432947,40.6083917410318,40.6085002894728,40.6085497603366,40.6086319147238,40.6086629083061,40.6086996429454,40.6088984050148,40.608908471012,40.609022318954,40.6091352185802,40.6092336021972,40.6092913475462,40.6094689997097,40.6094812350474,40.609765268159,40.609867130868,40.6101733990011,40.6106668134136,40.6109327350644,40.6110380934131,40.6110610219103,40.6111039600421,40.6111410548779,40.6111722598104,40.6111975356324,40.6112168505862,40.6112301803301,40.6112375081933,40.6112388249689,40.6112341290023,40.6112234261938,40.611213766576,40.6111907639687,40.6111544486427,40.6111049351803,40.6110424534508,40.6109673667623,40.6105860604965,40.6105069153516,40.6104186561448,40.6103362055471,40.6102854386673,40.6102515849962,40.6102501095356,40.6102347678599,40.6102350571793,40.6102524448125,40.6102868030276,40.6103436175778,40.6103821298373,40.6104134717621,40.6104291028298,40.6104480281832,40.6104698627692,40.6104757535881,40.6104858075458,40.6105066718399,40.6105362823107,40.610558101373,40.6105613899334,40.6106235929402,40.6106273209652,40.610628017665,40.6106383474822,40.610624778037,40.6105946639872,40.6105480573601,40.6104852193128,40.610406552122,40.6101199357373,40.6092365855667,40.6090945263766,40.6086869332584,40.6083700462689,40.6080518279621,40.607727602221,40.607551270117,40.6070223905291,40.606890132547,40.6066814853406,40.606551986371,40.6065225086613,40.6064109790698,40.6062902965674,40.6062458352117,40.6061710088577,40.6061452342304,40.6061216641582,40.6060370708854,40.6059979500401,40.6059879668429,40.6058702120091,40.6057255679582,40.6056210674513,40.6055630442717,40.6049778569116,40.6043792994778,40.6040397187302,40.6039819199692,40.6031053657056,40.6027198804299,40.6025999499056,40.6022913985708,40.6021500548305,40.601945577091,40.601855487904,40.6016907451458,40.6015601477326,40.6012364554469,40.5998163931775,40.5997489746976,40.5995422411895,40.5994947946257,40.5992375997249,40.5989348595219,40.5987524157589,40.5986967716816,40.5983636065895,40.5978622277705,40.5973476524014,40.5968490112399,40.5964112311185,40.5949115147772,40.5943675906145,40.5941894178399,40.5935819063333,40.5934954723356,40.5934953372301,40.5934952202106,40.5934186366082,40.5934185454077,40.5934184640786,40.5933547047808,40.5933546328331,40.5933545794811,40.5933059513644,40.5933058606016,40.5933057973005,40.5932926098742,40.5933138094327,40.5929065569067,40.5923414485486,40.5921394185354,40.5914348591443,40.5910628098845,40.5903962231406,40.590342019704,40.5902947235609,40.588255067406,40.5879911110863,40.5877177928864,40.5874358677838,40.5871461449712,40.5868494771359,40.5865666142673,40.5853631101048,40.5852070513839,40.5850583827193,40.5849189520807,40.5847904069636,40.5846741280705,40.584534930743,40.5843859602722,40.5842279009276,40.5840615278771,40.5838877063468,40.5833109123411,40.5831951509086,40.582723652505,40.5821263867667,40.582066980334,40.5815195671638,40.5802039500301,40.5793173431667,40.5792502129355,40.579189758485,40.5780499732385,40.5777834800652,40.5775274330632,40.5772823169445,40.5770485655325,40.5765203918729,40.5761079397351,40.5758353027021,40.5755796615393,40.5753317975795,40.5750445770901,40.5746781759357,40.5743291781514,40.5741347150593,40.5730618845432,40.5730191736173,40.5729494451845,40.5728277202268,40.5726972199249,40.5725585065765,40.5724122347462,40.5723744850151,40.5723249465657,40.5719472890497,40.5717207835254,40.5716802983745,40.5716093452059,40.5713629872354,40.5707810161172,40.5699291958546,40.5688923387405,40.5680960483853,40.5679434106031,40.5684089429083,40.5687896237727,40.569181388867,40.5695603057981,40.5699477987303,40.5703424444386,40.5707315307686,40.5711107821095,40.5715038446983,40.5718819128259,40.5722784655153,40.5726616791725,40.573046622403,40.5734282841132,40.5738112682864,40.5740059394047,40.573094039891,40.5729151645648,40.571924855219,40.5708942937548,40.570299595655,40.570295891921,40.5702856699422,40.5702689605055,40.570245813937,40.57021629995,40.5701805074356,40.5701385441942,40.5700905366114,40.5700366292767,40.5699769845483,40.5699141511519,40.5698461237492,40.5697731161182,40.5696953576866,40.5696130928106,40.5695265800072,40.5694360911413,40.5693419105715,40.5689150672086,40.5687782687683,40.5682553426664,40.567877127458,40.5675006495187,40.5671228251282,40.5666484041572,40.5663858570257,40.5660148190989,40.5656434882968,40.5651239930237,40.5644821710468,40.5641118321154,40.5637901625775,40.5634779466084,40.5631595190582,40.5630870199658,40.5629033648193,40.5625714143414,40.562249060569,40.5618845559932,40.5615464656662,40.5610493425846,40.5609420476326,40.5604680011701,40.5601514945116,40.5599055783561,40.5600148928915,40.5601282243285,40.5602455235095,40.5603667395555,40.5604918198884,40.5606207099398,40.5607533541202,40.5608896948932,40.5610296731188,40.5611732280791,40.5615952394129,40.5619899734925,40.5622963328294,40.5626670460355,40.5627698833931,40.5631455882576,40.5635283633471,40.5639089377653,40.564310666832,40.5655055577586,40.5636898192186,40.5626757240841,40.5629324875105,40.5631660707364,40.5638027318887,40.5638792104359,40.5639156379859,40.5639435159133,40.5644177637808,40.5649216420596,40.5653552243262,40.5657795527173,40.5662274656848,40.5670884600852,40.5679663664545,40.5680758638436,40.5682399812729,40.5684307186556,40.5689491424445,40.5694245377283,40.5698325286489,40.5699205329322,40.5699491962305,40.5700983608072,40.5701375377127,40.5701783647501,40.5704298447689,40.5705964331634,40.5709394937403,40.5715013938681,40.5717756146804,40.5720922110721,40.5722236682536,40.5723726119111,40.5723727112814,40.5723728007548,40.5725238710791,40.5726756622045,40.5726757347448,40.5728267437394,40.5729755487895,40.5735559198829,40.573832027759,40.5742170889656,40.5746531813966,40.5749069850808,40.5751325873752,40.5754830196804,40.5755666257362,40.5755667068616,40.5755667879619,40.5756405003575,40.5756405458491,40.5756405814445,40.5757026474738,40.5757027191787,40.5757027727791,40.5757517719419,40.5757518161857,40.5757518528895,40.5757869407644,40.57578698613,40.5757870129121,40.5758079333258,40.5758328716827,40.5758813539717,40.5759010430202,40.5759844469469,40.5762849329162,40.5764052186687,40.5754799102494,40.5754251577883,40.575373131217,40.5753245886939,40.5752802376302,40.575240724315,40.5752066245533,40.5751675762499,40.5750565385785,40.5747300541427,40.5746824823603,40.5741060101974,40.5737425306182,40.5735576226782,40.5735162067815,40.5734790937297,40.5734463493115,40.5734180314265,40.5733822778878,40.5733501081286,40.5733215435835,40.5732966040146,40.5732382283604,40.5731977126844,40.5730519498333,40.5729913095805,40.5729084522082,40.5727796429604,40.5727398873731,40.5725273721191,40.5724225526331,40.5723326139677,40.5720374100049,40.5718477694807,40.5720133209792,40.5714610589974,40.5714105750647,40.5712740617826,40.5707469288205,40.5703824434124,40.5667293999793,40.5656248615302,40.5653379837258,40.562951695702,40.5623456418449,40.5614469703726,40.5606424482222,40.5602904102697,40.5604766053655,40.5610904206046,40.5611307867612,40.5611766930729,40.5612281161901,40.561285029582,40.5613202637955,40.5613977305618,40.5614924158657,40.5615209230203,40.561551719835,40.5617048371558,40.5622869362441,40.5625729717263,40.5627981327469,40.5628390155932,40.5628754772072,40.5629074048034,40.5629346998332,40.5629572776488,40.5629750684109,40.5630041240522,40.5630394000365,40.5630808354085,40.5631283585313,40.563181887334,40.5632413293207,40.5637554402341,40.5671106388179,40.5698750000021,40.5705483133979,40.5722605918989,40.5721932001548,40.5720734943531,40.5717146255052,40.5723355342815,40.5724573031455,40.5725004743426,40.5725280169689,40.5727651328751,40.5729991585379,40.5732299769819,40.5734574728336,40.573681532379,40.5739020436207,40.5741188963337,40.5743319821281,40.5745411944807,40.5747464288116,40.5749475825282,40.5751445550771,40.5753372479939,40.5755255649528,40.575321436036,40.5746106996704,40.5738817225564,40.5732498561291,40.5726665061419,40.5721864095687,40.5717305371768,40.5713355039409,40.5709312067735,40.5710373525912,40.5710571385717,40.5715953050637,40.5717614809775,40.5723104626349,40.5727996205986,40.5732826221847,40.5739353174637,40.5744948794977,40.5748930690814,40.5763185234041,40.5766791202205,40.5766850285199,40.5766236356205,40.5772617088882,40.5788590005879,40.5793036186336,40.5795110004113,40.5801020000802,40.5801700009204,40.5798424570515,40.5797642671455,40.5800469937658,40.5800769889694,40.5802037445182,40.5802525597538,40.58027822891,40.5803016974059,40.5803181267576,40.5803385376937,40.5803668484597,40.5803952006911,40.5804103839359,40.5804239328707,40.5804508726813,40.5804690020193,40.5804852225868,40.5805124623759,40.5805323165266,40.5805552074656,40.5806028286459,40.5806380821522,40.5806558106616,40.5806767280564,40.580706052586,40.5807280428035,40.5807458452777,40.5807632162562,40.5807874001827,40.5808089041418,40.5808334802621,40.5808558374443,40.580867852512,40.5808820108823,40.5809071493432,40.5809443217942,40.5809656889322,40.580979610103,40.5809944874679,40.581008287362,40.5810262685058,40.5810534569073,40.5810694869829,40.5810911307874,40.5811204830544,40.5811378715184,40.5811403926892,40.5811463112105,40.5811690793957,40.5812028815901,40.5812291385635,40.5812584490829,40.5812943350605,40.5813511423765,40.5813738750962,40.5814040361395,40.5814428473468,40.5814746998999,40.5815045118213,40.5815262841726,40.5815473183795,40.581572371863,40.5815994688027,40.5816328263075,40.5816598995237,40.5816861933707,40.581691516357,40.5816989639992,40.5817229822306,40.5817812193347,40.581818629267,40.5818534085676,40.5818822907642,40.5819148905247,40.5819821564197,40.5820200503907,40.5820382058824,40.5820665214703,40.5820836288167,40.5821066431926,40.582129099045,40.582165967466,40.5821905497292,40.5822081905728,40.5822253222625,40.5822574034547,40.5822857245496,40.5823188728992,40.5823659049972,40.5823931835209,40.5824145850326,40.5824568151325,40.5824995736415,40.5825348438231,40.582563721078,40.5826343910058,40.5826557805075,40.5826696938313,40.5826841786435,40.5826858346976,40.5826848083329,40.5826912351574,40.5827062073128,40.5827259776492,40.5827452131562,40.5827644589001,40.5827805241178,40.5827869596786,40.5827976694069,40.5828163808968,40.582840958902,40.5828713897633,40.5828938137903,40.5829247669896,40.5829525420853,40.582969107836,40.5829808801573,40.5829851817186,40.5829916172797,40.5830001780981,40.5830140714263,40.5830306351812,40.5830455827862,40.5830610509826,40.5830717189978,40.5830823880174,40.5830930585309,40.5831042767849,40.5831171116975,40.5831400948585,40.5831598671112,40.58317590193,40.5831839385832,40.5831829089594,40.5831819137843,40.5831937148081,40.5832065629382,40.5832242042653,40.5832434380962,40.5832621395201,40.583277656979,40.5832851533705,40.5832958530974,40.583310828911,40.5833819583817,40.5834268627544,40.5834963488739,40.5835428423617,40.5835701108287,40.5836080922327,40.5836535900332,40.583712945842,40.5837487471651,40.583800043335,40.583850794275,40.5838801593292,40.5839538335597,40.583989615361,40.5840430250751,40.5840793255605,40.5841567073391,40.5842516773363,40.5842933245432,40.5843232388013,40.5843494272078,40.58437832805,40.584519172556,40.5845480671154,40.5845865738468,40.5846341493707,40.584680104359,40.5847233726373,40.5847730111076,40.5848071751037,40.5848504346508,40.5848883723921,40.5849337982869,40.5849898977092,40.5850502328868,40.5850742840444,40.5850978151507,40.5851272263384,40.5851640952436,40.5851962986888,40.5854569116788,40.5854900212227,40.5855236753274,40.5855493396897,40.5855617015821,40.585570289797,40.5855810027124,40.5855982695714,40.5856007842592,40.58560760722,40.5856173492547,40.5856184538198,40.5856355079445,40.5856589827123,40.5856792710876,40.5857049184956,40.585751428175,40.5857813997674,40.5858087592367,40.5858195734585,40.5858361970535,40.5858592069977,40.5858955410758,40.5859350401366,40.5859627711656,40.5860135582314,40.5860401511594,40.5860812293739,40.586110054127,40.5861394361311,40.5862361831605,40.5862564820087,40.5862837317572,40.5863061808071,40.5863200977211,40.5863350927663,40.5863516652329,40.5864142021425,40.5864537403029,40.5866206834019,40.5867189623309,40.5867910782001,40.586830079369,40.586864275199,40.5869112935227,40.5870234881881,40.5872574995136,40.587320535043,40.5873824661778,40.5874795996537,40.5875607707489,40.5876451832481,40.5877520378998,40.5878172268619,40.587880281658,40.5879283563462,40.5879529143911,40.5879592763524,40.5879698476155,40.5879932644636,40.5880274196945,40.588115020045,40.5882176036827,40.5882871147319,40.5883427761877,40.588372812417,40.5884091871309,40.5884196021333,40.5884222855607,40.5884284230424,40.5884378357267,40.5884502493196,40.5884653020775,40.588482555349,40.5885015063574,40.5885216028518,40.5885422592,40.588562873455,40.5885948162405,40.5886270230018,40.5886401777959,40.5886512792104,40.588660076923,40.5886663725567,40.5887202042464,40.5887733939243,40.5888272508126,40.5888814745784,40.5889353214605,40.5889880528657,40.5890389454992,40.5890873012867,40.5891366174734,40.5887191393255,40.5887723708306,40.5891826956187,40.5892183977943,40.5892857454659,40.5897067638116,40.5896429717417,40.5898427574125,40.5902495253617,40.5901999064748,40.5898073963993,40.5897861102389,40.5907221457824,40.5906981489716,40.5906774501351,40.5906605772088,40.590647960546,40.5906399219416,40.5906366664244,40.590638277028,40.5906447126732,40.5906558092154,40.5906712836315,40.5906907412379,40.5907469534115,40.5908000270429,40.5908497183599,40.5908957991251,40.59083882536,40.5908767106414,40.5911405418099,40.5912309227767,40.590951125852,40.590999079292,40.5911445337713,40.5911785921522,40.5912136353702,40.5912179904483,40.5912230317468,40.5912286229259,40.5912346127745,40.5912408392997,40.5912471341074,40.5912533269571,40.5912592503657,40.5912647441368,40.591285204547,40.5913038881894,40.5913202312398,40.5913329291473,40.5913494743583,40.5913696645209,40.5913932527047,40.5914311283716,40.5914713887355,40.5915133486854,40.5915438622736,40.5915751286555,40.5916062879902,40.5916364833797,40.5916648844338,40.5916907101065,40.5917152550176,40.5917439687676,40.5917762798461,40.5917807647951,40.5914693217744,40.5914769848639,40.5915086410983,40.5915239651028,40.5915325212073,40.5915163411663,40.5917039023588,40.5917867150196,40.5918088541896,40.5918602999611,40.59182367412,40.5920173248185,40.5920529563697,40.5920951342854,40.5920530216791,40.5925314886406,40.5925243352552,40.5928663793049,40.5927503394198,40.5927499534597,40.5927560988071,40.5927686455191,40.5927873282969,40.5928117520944,40.592841400472,40.5928864545672,40.592931346235,40.5929753674429,40.5930178238859,40.5930580459372,40.59309539921,40.593129294563,40.593166186907,40.5932006363957,40.5932857849758,40.5933749804862,40.593468014412,40.5935646692644,40.5936647190886,40.5937679299926,40.5938740606929,40.5939828630797,40.5940940827956,40.5941382700945,40.5941793880979,40.5942167257585,40.5942211523864,40.594226729726,40.5942332912452,40.5942406410261,40.5942485596137,40.5942568105696,40.5942651475309,40.594284278007,40.5943030391008,40.5943209362904,40.594337497825,40.5943511576151,40.5943845896874,40.5944143736053,40.5944396553549,40.59445624323,40.5944691304008,40.594543609478,40.5946764480182,40.5947800077604,40.5948788164817,40.5949047572918,40.5949449277604,40.5949526392622,40.5949501865812,40.5949638974913,40.594968174786,40.5950117983105,40.5950639641139,40.5951144008081,40.5951725143671,40.5952255130708,40.5952836077576,40.5953433920377,40.5953861031874,40.5954408019264,40.5954955115158,40.5955527810124,40.5956023784321,40.5956553945287,40.5957015906619,40.5957554493537,40.5957930746548,40.5958333119979,40.5958760922571,40.5959095005945,40.5959616554064,40.5960129597583,40.596062564801,40.596112165968,40.5961634818796,40.596212235261,40.5962618371508,40.5962960178226,40.5963327547204,40.5963840573315,40.5964404383956,40.5964703548037,40.596519104275,40.5965483326819,40.5965547422697,40.5965567545496,40.5965584661955,40.5965926989502,40.5966414452839,40.5966654182896,40.5966902544884,40.5967364541957,40.5967766837495,40.5967886993435,40.5967887186129,40.5967998828956,40.5968033160622,40.5968033680657,40.5967989865394,40.5973491860573,40.5973645483503,40.5973773789475,40.5973962478457,40.5974424171323,40.5975013700334,40.597557758994,40.5976149928053,40.5976636316579,40.5977037722723,40.5977242596034,40.5977388136444,40.5977645388815,40.5978056428094,40.5978321402144,40.5978911155413,40.5979466800639,40.5979928738409,40.5980202382734,40.598059522241,40.5981115795508,40.5981567749026,40.5982036802049,40.5984608345548,40.6008617836935,40.6017119751763,40.6023587364845,40.6036833500987,40.6046369662085,40.6059696796165,40.6082708279673,40.6088322117635,40.6098278612319,40.6118756420391,40.613284693932,40.6160332370762,40.616327997309,40.6170289273895,40.6170415714279,40.6170534015445,40.6170729673295,40.6170942885509,40.6171352840281,40.6171694381884,40.6172027324161,40.6172591114856,40.6173171983368,40.6173701503678,40.617428205883,40.6174845575294,40.6175392232193,40.6175947436389,40.6176510928202,40.6177065995251,40.6177621050587,40.6177988223986,40.6178381218422,40.6178723420963,40.6178834568463,40.6179338213952,40.6179748173709,40.6180021377068,40.6180286322463,40.618059407549,40.6181004108559,40.6181149808463,40.6181193059799,40.6181116757203,40.6180946254613,40.6180400003805,40.617989660967,40.6179794337234,40.6179735495642,40.6179787738547,40.6179924942406,40.6179976394936,40.6180353179511,40.6180755466641,40.6181285472837,40.6181806981374,40.618234553754,40.6182858292698,40.6183421985547,40.6183994028086,40.6184505989974,40.6185009479833,40.6185419141494,40.6185913829833,40.618634034632,40.6186715292832,40.6186953255302,40.6187165555922,40.6187446293824,40.618767629521,40.6188043026073,40.6188393332019,40.6188607203284,40.6188941325272,40.6189249645711,40.6189497581308,40.6190086997014,40.619065937681,40.6191103714222,40.619168454347,40.6192102908495,40.6192598026496,40.6192948110373,40.6193494336584,40.6193880138174,40.6194040696927,40.6194595582768,40.6195124770132,40.6195688129886,40.6196199972988,40.6196703260812,40.6197163819225,40.6197675810882,40.6198068589673,40.6198657993648,40.6199144779475,40.6199699669974,40.620016052875,40.6200706969907,40.6200954558053,40.6201151170339,40.6201330913692,40.6201382347054,40.6201732768938,40.6201962513455,40.6202288007152,40.6202851699678,40.6203218939601,40.620353469122,40.6203636534846,40.6203721467422,40.6203815402751,40.620391821699,40.6203961880455,40.6204005888462,40.6204015723567,40.6203948700693,40.6203719364663,40.6203395825611,40.6203080848054,40.6202953478371,40.6202996721013,40.6203304908551,40.6203501520419,40.6203783315361,40.6204124485647,40.620430359238,40.6204577110937,40.6204722751249,40.62048429892,40.6204954110169,40.6205363947611,40.6205500219638,40.6205729674538,40.6205780215774,40.6205761846938,40.6205683690085,40.6205665589329,40.6205826573301,40.6205911552237,40.6206133562362,40.6206646063405,40.6206773792278,40.6206918473547,40.6207012433495,40.620725173411,40.6207439490549,40.620774608745,40.6207839910191,40.6208386645297,40.6208941594537,40.6209342688207,40.6209649368146,40.6210204199609,40.6210733229382,40.6211032121526,40.6211382300288,40.6211681055126,40.6211954184817,40.6212423461123,40.6212995434084,40.621357602273,40.6214122337959,40.6214677541926,40.6215061871303,40.6215548308722,40.6215863819344,40.6215939948834,40.6215998838172,40.6216126089654,40.6216211448395,40.6216450847523,40.6216528083142,40.6216546437283,40.6216580982672,40.6216905676558,40.6217486544885,40.6218058897282,40.6218614202231,40.6218836405594,40.6219152740491,40.6219238177795,40.6219639734068,40.6220186690109,40.6220742109895,40.6221297392301,40.6221852512722,40.6222407481168,40.6222945306189,40.6223500235325,40.6224063687113,40.6224592951818,40.6225156489955,40.6225711718526,40.6226241513208,40.6226651919127,40.6226882762861,40.6227044888855,40.6227053127131,40.6226932241283,40.6226845527398,40.6226861320267,40.6226980520231,40.6227304832835,40.622785993846,40.62284406378,40.6228995656864,40.6229533476296,40.6230088385289,40.623064343187,40.6231215654574,40.6231770858436,40.6232326054374,40.623289836367,40.6233470775038,40.6234017647868,40.6234573087597,40.6234983336815,40.6235188737655,40.6235368904188,40.6235447048682,40.6235448325225,40.6235525686444,40.6235679608891,40.6235935797932,40.6236302342523,40.6236617885296,40.6236891163861,40.6237361210381,40.6237857191151,40.6238344683431,40.6238764107684,40.623913232072,40.6239432115243,40.6239868479375,40.6240373080103,40.6240783465898,40.6241355680853,40.6241936347899,40.6242517221085,40.6243055055772,40.6243558406368,40.6244104964829,40.6244677277797,40.6245241095581,40.6245796397459,40.6246360398458,40.624691585718,40.624746280778,40.6248018325304,40.6248573783917,40.6249137750632,40.6249693091636,40.6250256943545,40.6250820831825,40.6251367656819,40.6251739237531,40.6251922997763,40.625249544402,40.6253076480591,40.6253623254634,40.6254007564333,40.6254323108038,40.625459597502,40.6255005713776,40.6255577843508,40.6256158672357,40.6256713856478,40.625726904058,40.6257832825785,40.6258379521406,40.6258951795095,40.6259506724309,40.6260010337731,40.6260505133108,40.6260957157722,40.6261102152069,40.6261118783689,40.6260537710697,40.6260705133932,40.626248890542,40.6293441481063,40.6293325714443,40.6295946341135,40.629587638107,40.6296107184801,40.6296295645499,40.6296407646441,40.6296570775051,40.6297100803017,40.6297647732859,40.6298211659534,40.6298775444355,40.629933062828,40.6299817491987,40.6300381262307,40.6300936473596,40.6301491696621,40.6302055598669,40.6302501006946,40.6302775583719,40.6302727077439,40.630267957653,40.6302634488611,40.6302593149796,40.6302556785097,40.6302526472127,40.6302503109167,40.6302487388542,40.6302479776109,40.630248049745,40.630248953119,40.6302506609628,40.630253122667,40.6302562652828,40.6302599956833,40.630264203324,40.6302687635175,40.6302735411295,40.6302783945824,40.6302831800514,40.6303501243184,40.6303545593426,40.6303587180897,40.6303624800444,40.63036573619,40.6303683921678,40.6303703710108,40.6303716153747,40.6303720891993,40.6303717787539,40.6303706930348,40.6303688635047,40.6303663431811,40.6303632050998,40.6303595401983,40.6303554546807,40.6303510669402,40.6303206077046,40.6302923622674,40.6303747264056,40.6304302721523,40.6304849573058,40.630541345554,40.6305968873886,40.6306549863731,40.6307122237628,40.6307694569689,40.6308241323516,40.6308788263144,40.6309343813118,40.6309907817699,40.6310463269958,40.6311010184959,40.6311557075377,40.6312103990326,40.6312650880705,40.6313189279586,40.6313214904694,40.6313286694642,40.6313824794704,40.6313632412405,40.6313595380237,40.6313564318706,40.6313540090477,40.6313523368434,40.6313514616994,40.6313514079208,40.6313521770012,40.631353747581,40.6313560760412,40.6313590977138,40.6313627286789,40.6313668680944,40.6313714009976,40.6313762014971,40.6313811362699,40.6314556772389,40.6314594683086,40.6314627373502,40.6314653949574,40.6314673684459,40.6314686038421,40.6314690673586,40.6314687463183,40.6314676495017,40.631465806906,40.6314632689251,40.6314601049715,40.6314564015774,40.6314522600286,40.6314477935939,40.631443124428,40.6314383802295,40.6314131364518,40.631361080531,40.631429166609,40.6314821576157,40.6315326061237,40.631577946658,40.6316207362025,40.6316635322466,40.6317012059735,40.6317388891479,40.631777423398,40.6318159503332,40.631852774801,40.6318741689967,40.6319436877578,40.6322506608928,40.632514358315,40.6325685350598,40.632666794815,40.6327069440482,40.6327375148543,40.6327566712783,40.6327815500632,40.6327835812757,40.6327686983594,40.6327456495149,40.6327514666613,40.6327229702054,40.6327078032302,40.6327441187951,40.6327709414342,40.6328129710282,40.6328644012084,40.6329139419831,40.6329844035117,40.6330180602674,40.6330291924699,40.6330149782293,40.6329864344278,40.6329636040497,40.6329427185578,40.6329523701213,40.6329696024786,40.6330001297617,40.6330503205583,40.633058232673,40.6330561336546,40.6330526255777,40.6330326584321,40.6330155261287,40.6329948394615,40.6329927528077,40.6329956809901,40.633007185657,40.6330022334899,40.6329937301576,40.6329922888361,40.6329981470505,40.6330160300265,40.633048243901,40.633061437161,40.6330829957644,40.63309978681,40.6331272646116,40.6331725529942,40.6332011260934,40.6332333265054,40.6332500739405,40.6332668622094,40.6332979516452,40.6333063069253,40.6333456841721,40.6333922392692,40.6334518878584,40.6335126472915,40.6335626181986,40.6335982905671,40.6336339843413,40.6336613897596,40.6337030990524,40.633712600616,40.6337316127711,40.6337613877216,40.6337757285802,40.6337936764347,40.6338223378756,40.6338497887794,40.6338700857315,40.6338761174279,40.6339048236057,40.6339239546343,40.6339001737214,40.6338966481204,40.633942040648,40.6340076745894,40.6340542321293,40.6341257854301,40.6342366767243,40.6343093730877,40.6343808814942,40.6344475965391,40.6344916782021,40.6346860502338,40.6347302101752,40.6347781047903,40.6347927589935]}]],[[{"lng":[-73.8968088322377,-73.8969387299879,-73.8972360384394,-73.8979683978374,-73.8985733266556,-73.8989526183253,-73.8991943424998,-73.8985205207147,-73.8978825324011,-73.8971314979564,-73.8967852634123,-73.8968088322377],"lat":[40.7958084451598,40.7956358728536,40.7957200375371,40.795644839162,40.7960691402596,40.7962278525797,40.7965024560183,40.7969361941898,40.7971165326497,40.7967980777284,40.7963291664871,40.7958084451598]}],[{"lng":[-73.8983303627048,-73.8964666883457,-73.8979848668692,-73.8986403871492,-73.8990245556723,-73.9002100499307,-73.8997873880092,-73.8997156381744,-73.9000373581574,-73.8994891942367,-73.8993874857105,-73.8983303627048],"lat":[40.8024128214426,40.8007904708914,40.7996042808198,40.799101165124,40.79917219984,40.7992641563986,40.799509553872,40.8007988085028,40.8009087420502,40.8009011159296,40.8019356650703,40.8024128214426]}],[{"lng":[-73.8938545418665,-73.8929322610114,-73.8919127185849,-73.8909056006279,-73.8899794248792,-73.8898359917002,-73.8898056417241,-73.8896900496137,-73.8896389531624,-73.8888504620368,-73.8878951090142,-73.8863995722807,-73.8860962416716,-73.8859499963777,-73.8858721579579,-73.8857942629586,-73.8856920052475,-73.885566158875,-73.8854150101017,-73.885026388461,-73.8847896027465,-73.8839006990514,-73.8837841413457,-73.8843870535373,-73.8846093892466,-73.884613360104,-73.8846216586827,-73.8846445070049,-73.884385041061,-73.8843612859193,-73.8843321238172,-73.8842948821121,-73.8842497175018,-73.8837878612648,-73.8826592292403,-73.8824477955298,-73.8809802965942,-73.8780628326213,-73.8766345996371,-73.8767318550682,-73.8752053909248,-73.8744638192774,-73.8725011088597,-73.8723943790009,-73.87232977098,-73.8724366723508,-73.8721896101205,-73.87209716961,-73.8720368753993,-73.8721293114736,-73.8720803878503,-73.871804636402,-73.871657776834,-73.870957536841,-73.8705680692793,-73.8704709316532,-73.8705534219163,-73.8681121914008,-73.8684634695914,-73.8697896801756,-73.871518550303,-73.8716114259257,-73.8716988193081,-73.8716033619253,-73.8717450937392,-73.872380604537,-73.8724386468485,-73.8726476533188,-73.872705037586,-73.873172233272,-73.8735509657251,-73.8746771631406,-73.874730604527,-73.8752651703732,-73.8758578858133,-73.8759299807161,-73.8781421881992,-73.8780768548654,-73.877986295094,-73.8779688037537,-73.8780330023647,-73.8780629485342,-73.8781143889429,-73.8781658114006,-73.878234649218,-73.8784329551354,-73.8787434416655,-73.8789245383548,-73.8792134840769,-73.8793429218454,-73.8795099596104,-73.8796276483653,-73.8797430082038,-73.8797570457684,-73.8799166060345,-73.8800546298488,-73.8801711511879,-73.8802789879653,-73.8804183651007,-73.8805694363832,-73.880771498085,-73.8809203054526,-73.8810691031168,-73.8811796566723,-73.8813202576124,-73.881430829576,-73.8815332076575,-73.8817093195776,-73.8818212547986,-73.8819386393324,-73.8820349014337,-73.882060131274,-73.8820653925818,-73.8821925670658,-73.8823208879867,-73.8823701011564,-73.8823946520833,-73.8824477508195,-73.8824302177404,-73.8825189491205,-73.882541134022,-73.882595269443,-73.882760284008,-73.8828832397242,-73.882970590687,-73.8830709164281,-73.8832036033139,-73.8835401184932,-73.8836954242248,-73.883809410282,-73.8838384999311,-73.8838518269011,-73.8838774507143,-73.883899993125,-73.8839153677212,-73.883937916675,-73.8839646251961,-73.8837835397013,-73.8837773796317,-73.8837384573709,-73.8836903699654,-73.8836689308896,-73.8836802471624,-73.8837232666592,-73.8837744240954,-73.8837927904066,-73.8837845795789,-73.8839677470786,-73.8839894532263,-73.8850517233671,-73.8851457697334,-73.8852671450526,-73.8852726221398,-73.8853108705868,-73.8853654459887,-73.8853967640884,-73.8853803319732,-73.8853311688596,-73.8852834210594,-73.885257551695,-73.8852616650514,-73.8851551712667,-73.8852555367025,-73.8855997811227,-73.8857807388099,-73.8859142467253,-73.886008874247,-73.8860777124662,-73.8860997266448,-73.8861637705656,-73.8862757645438,-73.8864243555295,-73.8864869182356,-73.8867238924872,-73.8868487982526,-73.8870857353168,-73.8872709734712,-73.8873809562422,-73.8872473845833,-73.8873355263323,-73.8874023468318,-73.8875288602214,-73.8877112460045,-73.8876312953765,-73.8879589722395,-73.888592177064,-73.88876053714,-73.8888936421902,-73.8890644202607,-73.8891567419391,-73.8892741877571,-73.8893664037694,-73.8893378380542,-73.8892232300483,-73.8891979414091,-73.8892241609115,-73.8895563430164,-73.8895566450195,-73.8899743403498,-73.8899959817085,-73.8901475624386,-73.889374392537,-73.8895447802606,-73.8896587496353,-73.8897533298726,-73.8898134682587,-73.8898139834978,-73.8898504127416,-73.8898722925851,-73.8898990576227,-73.8899282336486,-73.8899608907001,-73.8899913911536,-73.8900593269243,-73.890135940812,-73.8902329568919,-73.8903359671524,-73.8903525976987,-73.8904366732254,-73.8905142258841,-73.8905821307971,-73.8907212261887,-73.8908635417718,-73.8910123432362,-73.8912711298405,-73.8914971718673,-73.8914990373008,-73.8914410427721,-73.891786181356,-73.8919792953427,-73.8924549463606,-73.8927064133067,-73.8927068106643,-73.8925317713942,-73.8922731584353,-73.8921636454764,-73.8918131200951,-73.8918097358281,-73.8916760418402,-73.8916869931252,-73.8915641760858,-73.8915600496647,-73.8914999793814,-73.8915075139587,-73.8913037299903,-73.8912985697377,-73.8912671062289,-73.8912840241392,-73.8913137691738,-73.891311187901,-73.8914648886088,-73.8915064566576,-73.8916956183466,-73.8917324099561,-73.8918661080939,-73.8918288899755,-73.8921973967156,-73.8923002032758,-73.8923373050778,-73.8923350700472,-73.8923980350901,-73.8924002723912,-73.8925666773841,-73.892748140374,-73.8928977090187,-73.8930465439451,-73.8931565417054,-73.8933051648915,-73.8933765511916,-73.8934542012682,-73.8935480465592,-73.8936224544214,-73.8937195431347,-73.8938360222724,-73.8939524809126,-73.8940365860741,-73.8941044950304,-73.8942209637423,-73.8945251014217,-73.8946286391834,-73.8946325235101,-73.8945739391342,-73.8947260190962,-73.8947767972104,-73.8948033737134,-73.8948536053588,-73.8947297052668,-73.8948429598363,-73.8949690952872,-73.8950983648732,-73.8952855056423,-73.8953726905782,-73.8954591186794,-73.8955063396857,-73.8954179487796,-73.8953922109978,-73.8953020614291,-73.8953118163586,-73.8952796287401,-73.8953119748753,-73.8953441670708,-73.8954054906103,-73.895466556982,-73.8955116391719,-73.8955910909182,-73.8957227377877,-73.8956991253092,-73.8956702513876,-73.8957479089886,-73.8958317488783,-73.895838380731,-73.8959779468775,-73.8959418417458,-73.8959355336319,-73.8958776634504,-73.8957906695808,-73.8958748159932,-73.8959488883551,-73.8960132058915,-73.8961082451788,-73.8962242411907,-73.8962070824305,-73.896195723522,-73.8961958530148,-73.8962304073702,-73.8962764250297,-73.896351184938,-73.8967868232375,-73.8970874830768,-73.8971143801433,-73.8971507949872,-73.8971738740818,-73.8972601499915,-73.8973129614691,-73.897386394392,-73.8974968195382,-73.8974758873537,-73.8974147269857,-73.8974859174092,-73.8975470659673,-73.8976381874115,-73.8977612664875,-73.8977506569325,-73.8977282725107,-73.8977994519539,-73.8978671583508,-73.8978736083506,-73.8980134089624,-73.8980030659638,-73.8979903705154,-73.8978712799066,-73.8979360029626,-73.898068037988,-73.898161107527,-73.8982208549524,-73.8982949488795,-73.898281719951,-73.8982730583684,-73.8982627548872,-73.8982576122462,-73.8982723922851,-73.8982746241178,-73.898244380815,-73.898193423798,-73.898116666876,-73.8981330076062,-73.8981275802739,-73.8981234882694,-73.8981208343316,-73.8981196850934,-73.8981200694086,-73.8981219776276,-73.8981253618396,-73.8981301370758,-73.8981752231325,-73.898189275444,-73.898190774742,-73.898228278324,-73.8982085961973,-73.8982455584078,-73.898277344047,-73.8982898837178,-73.898526565166,-73.8995895065898,-73.8997048984212,-73.8997376467702,-73.8997367485531,-73.8997359579793,-73.9000719306023,-73.9002655501904,-73.900525594862,-73.9007857843107,-73.9008408811077,-73.9009113159718,-73.9009729888154,-73.9012573411964,-73.9013065215338,-73.9015233141979,-73.9015309603218,-73.9018027093367,-73.9020495227796,-73.9020724544782,-73.9020939422966,-73.90212682831,-73.9021418446852,-73.9021521558646,-73.9021677804542,-73.902169118889,-73.9021691367931,-73.9021678338667,-73.9021802195705,-73.902206214732,-73.9022228476561,-73.9022462046635,-73.9028803445172,-73.9029392917129,-73.9029879543749,-73.9029976700565,-73.9030087791717,-73.903020180606,-73.9030296770311,-73.903075683378,-73.9030894659654,-73.9032427350223,-73.9034172037365,-73.9041803643575,-73.9044655147674,-73.9041833769559,-73.9038041229161,-73.9034699718379,-73.9030644378354,-73.9030098321429,-73.9025785907422,-73.9021074330696,-73.9018319525609,-73.9016631934329,-73.9016012124739,-73.9012927762711,-73.9008456123222,-73.9006114108083,-73.9002097407531,-73.9001666938695,-73.9000382996104,-73.899799199741,-73.8991214503617,-73.8989955585362,-73.8988623061277,-73.8988361737786,-73.8986771004262,-73.8986541737904,-73.8984743243382,-73.8984522996302,-73.8982046932798,-73.8979449776934,-73.8975695875859,-73.89639572974,-73.8954852276459,-73.8952915650016,-73.8951102086074,-73.8938545418665],"lat":[40.8273400367457,40.8267870360298,40.8267944502507,40.8267877841199,40.8268099922383,40.8268047342572,40.826803621043,40.8267993835699,40.8267975100074,40.8267685952441,40.8267431852966,40.8275033797394,40.827655777358,40.8277336349429,40.8277773147601,40.8278235750115,40.8278773035847,40.8279398906285,40.8280141509475,40.8281871577443,40.8282360541028,40.8282701539127,40.8282742924624,40.8268172835329,40.8253035364272,40.8252765033196,40.824956206335,40.8238142737016,40.8229513694985,40.822873801332,40.8228101429798,40.822718205268,40.8226422090826,40.8219334137713,40.8196888326195,40.819268322009,40.818235623128,40.8161826324441,40.8157115080992,40.8153864964866,40.8148787445003,40.8146452318617,40.8138881282341,40.8139743356059,40.8139218233413,40.8138509340016,40.8136736707672,40.813738021521,40.8136855133727,40.8136211686926,40.8135840546195,40.8133148905393,40.813254261976,40.8121461806095,40.8120873176225,40.8114582949917,40.811243380723,40.8067518328319,40.8059365489391,40.8041251058638,40.8018741488882,40.801914396207,40.8018052719205,40.8017518114465,40.8015473661162,40.8012901146328,40.8012706127963,40.8011901159483,40.8011671768106,40.800997839706,40.8008533027719,40.8009794228642,40.8012566376286,40.8013981525485,40.8014559875864,40.8010842230912,40.8013192903065,40.8016666440351,40.8016567155069,40.8017111151282,40.8020599068608,40.802194319345,40.8023680848793,40.8025516842475,40.8026468057683,40.8027027341923,40.802739114243,40.8027720805082,40.8027953268351,40.8027725191786,40.8027694908152,40.8027433187195,40.802743439121,40.8027434537642,40.8027600077112,40.8027601514077,40.8027242195509,40.8027210538031,40.8026679402866,40.8026328474792,40.8025874267094,40.8025585434274,40.8025358823215,40.8025297734462,40.8025112519869,40.8024947727618,40.8024813964506,40.8024473549758,40.802431914257,40.802421663907,40.8024077933889,40.8024041582823,40.8024028862876,40.8023721453342,40.802351534973,40.8023538474582,40.8023549999506,40.8023512120935,40.80226557239,40.8022521812844,40.8023356815629,40.8023257063234,40.8023062088512,40.8022891271833,40.8022842995422,40.8022598195804,40.802227997709,40.8021791746318,40.8021621236029,40.8021221957366,40.8021071844979,40.802095531658,40.8020753348686,40.8020613573485,40.8020489275725,40.8020310612954,40.8019651488623,40.8019290159247,40.80193989917,40.8019561937698,40.8019452558052,40.8019133454654,40.8018806901926,40.8018628439411,40.8018737849875,40.8019072480144,40.801919683824,40.8019574453552,40.8019038796612,40.8021309067981,40.8022595894873,40.802284394817,40.8022740289678,40.8022533267726,40.8022606397447,40.8023021530701,40.8023342852673,40.8023529026702,40.802342485539,40.802308236964,40.8022968339514,40.8022724535439,40.8024097810255,40.8025654973334,40.8026803921367,40.8027985174956,40.8029526567885,40.803054329695,40.8030853728713,40.8031756849769,40.8032642893685,40.8033451627559,40.8033792128325,40.8035302149824,40.8036352191167,40.8038091636803,40.8039470023367,40.8041106812839,40.8041861406168,40.8042931899106,40.8043743425894,40.8044017267404,40.8046147812202,40.8046713253759,40.8049979259207,40.8047892750978,40.804863178598,40.8049562274618,40.805021912402,40.8051280261683,40.805210337606,40.8053807802982,40.8055880368749,40.8056844209319,40.8058070996793,40.805845351192,40.8054316065188,40.8054312318875,40.8049131303831,40.8048862862502,40.8049606097867,40.8059252731153,40.8058070761928,40.8058477452696,40.8058754905862,40.8058773913577,40.8058773918501,40.8058571464444,40.8058313564649,40.8057852909278,40.8057484467444,40.8057147699175,40.8057042598731,40.8057043246813,40.8057146909475,40.8057369075283,40.8057666360139,40.805771435839,40.8057936387665,40.8058477929737,40.8058675228471,40.8058750287227,40.8058923713528,40.8058998860652,40.8059124218943,40.8059271989694,40.8059312382405,40.8056618990674,40.8056228920862,40.8063847089762,40.8063701066053,40.8063439899394,40.8063439485955,40.8056565515684,40.8057024331248,40.8053025925655,40.8051869554661,40.8051937849577,40.8051509531426,40.8051301101093,40.8050939399563,40.8050999805382,40.8050815880891,40.8050703110427,40.8050067883257,40.8050164982251,40.8050104894242,40.8049762818992,40.8049849383132,40.8049898214062,40.8050439869435,40.8050576930825,40.8051158434222,40.8050493634203,40.8050904874267,40.8051664720941,40.8052846879194,40.8056606056702,40.8056563701184,40.8056486794798,40.8056384889318,40.8056453248598,40.8056207100047,40.806340261302,40.8063269187964,40.8063147655121,40.8063124099211,40.806343998338,40.8062978645643,40.8062930200055,40.8062758988885,40.8062759675726,40.8062539341315,40.8062442087558,40.8062467735325,40.8062517672195,40.8062690374305,40.8062666855951,40.8062423825086,40.8062326449937,40.8062323324247,40.8060457730072,40.8060262465835,40.8062136337427,40.8062082228227,40.8062149081587,40.8057411014617,40.8057239970122,40.806231130494,40.8068636396762,40.8068427110714,40.8067035173349,40.8066030838895,40.8065953053037,40.8062677776883,40.8061768017772,40.8059014041617,40.8058694561573,40.805766184068,40.805768671035,40.8058694855306,40.8059604937492,40.8062162000154,40.8063489830049,40.8065813433475,40.8065596573083,40.8064450216897,40.806290130457,40.8062803680102,40.8064549743025,40.8065406075719,40.8065176158396,40.8063911611804,40.8062879114681,40.8060567905951,40.8058305592091,40.8058085115824,40.8060224404519,40.806268316156,40.8064961509513,40.8064770418423,40.8064158453391,40.8063240635267,40.8062410313226,40.8062104719022,40.8062061425932,40.8062105805546,40.806159258515,40.8061238376568,40.806110865929,40.8060933036286,40.8060452536476,40.8060409598473,40.8060815272947,40.8062246171367,40.8062144007051,40.8059992268215,40.8058000594781,40.8057878325167,40.8059943737508,40.8062013208389,40.8061899335016,40.8061371293254,40.8059674941373,40.8059626409115,40.8061126496745,40.8061795394924,40.8061666038593,40.8060906475138,40.8059308536481,40.8055349817596,40.8055202900289,40.8059137157085,40.8061380700999,40.8061199911542,40.8060975706984,40.8060509618393,40.8059173349156,40.8058909384904,40.8058712844663,40.8058696133827,40.805859509754,40.8058263592231,40.8058111555852,40.8057555065654,40.8056993787552,40.8056932828304,40.8056866120298,40.8056795338398,40.8056722259747,40.8056648719157,40.8056576563035,40.8056507603029,40.8056443570539,40.8056342907847,40.8056241982674,40.8056107257393,40.805571275436,40.805552914428,40.805539472704,40.8055427214199,40.8055440038298,40.805434309098,40.8052284028106,40.8052154185672,40.8051945119811,40.8051826759072,40.8051722672382,40.8051011350889,40.8050608889075,40.8050068348814,40.8049174894485,40.8049136459222,40.804899332354,40.8048760978912,40.8048818818477,40.8048744302424,40.8048415829281,40.8048401737072,40.804790086916,40.8047841405216,40.8047906435654,40.8047995498295,40.8048253095659,40.8048489099751,40.8048725057185,40.8049186568202,40.8049263698785,40.8049341496873,40.8049418662554,40.8049538283208,40.8049503432438,40.8049481131901,40.8050715024554,40.8087447930574,40.8090627010545,40.8093643005338,40.80945558286,40.8095500727788,40.8096234285296,40.8097021211851,40.809768986807,40.8098563992003,40.8107128845324,40.8115068828557,40.8121248200648,40.8122819599137,40.8130864554802,40.8141318427975,40.8150757884839,40.816106761023,40.8163177924573,40.8173697944309,40.8185051921006,40.8191533645607,40.8195504268544,40.819694858758,40.8204754421116,40.8215414176145,40.8221088079296,40.823071014629,40.8231741321428,40.823481696233,40.8240579415116,40.8256969191896,40.8259886509688,40.8262974361398,40.8263579934982,40.8267436963077,40.8267992863288,40.827235359173,40.8272887612399,40.8278891099849,40.8285217482647,40.8294230008309,40.8287628795207,40.828248541385,40.8281423498679,40.828036899455,40.8273400367457]}]],[[{"lng":[-73.83979488496,-73.8396739409273,-73.8396148723846,-73.8396149179071,-73.8396988664225,-73.8396865942083,-73.8395995556964,-73.8395964940748,-73.8396679876182,-73.8396649487313,-73.8395779273512,-73.8395779671898,-73.839664999928,-73.8396527163925,-73.8395687744623,-73.8395563892316,-73.8396372233397,-73.8396311164964,-73.8395471917215,-73.839544124431,-73.8396156120838,-73.8396033299458,-73.8395349260577,-73.8395318581117,-73.8396189069858,-73.8396065964076,-73.83951955832,-73.839513371203,-73.8396035347986,-73.8395850130332,-73.8395104064142,-73.8395073334473,-73.8395943764546,-73.8395758674236,-73.8394981515543,-73.8394981857193,-73.8394577753271,-73.8394578379758,-73.8395013454108,-73.8395013852709,-73.8395666684003,-73.8395574707152,-73.8394828813758,-73.8394829098492,-73.8395513077088,-73.8395483074206,-73.8394768138819,-73.8394613266912,-73.8396198628735,-73.8396199311504,-73.8394769391686,-73.8394738662222,-73.8396137738248,-73.8396014164854,-73.8394708559249,-73.8394646743323,-73.8396045647495,-73.8395953097228,-73.8394647426752,-73.8394431652959,-73.8394151905752,-73.8394122031088,-73.8394868100439,-73.8394837412623,-73.8395926675504,-73.8395802778292,-73.8395308516807,-73.8395688615534,-73.8395910845229,-73.8397599111196,-73.8397835872567,-73.8399204847868,-73.8401815169901,-73.8407422912492,-73.8411267526218,-73.8418172591211,-73.8422133466469,-73.842345274926,-73.8425311171007,-73.8426274568154,-73.8427588429378,-73.8427032485432,-73.842937312376,-73.8430525629734,-73.8430940865235,-73.843099509596,-73.8430211629787,-73.8430534532797,-73.8431069159991,-73.8430361270815,-73.8430339454239,-73.8429948413687,-73.8429459840538,-73.8429154807419,-73.8428952750772,-73.8428745081251,-73.8427613143411,-73.8427218778583,-73.8426699883598,-73.842650274871,-73.8426010368027,-73.8425650833819,-73.8425393448818,-73.8425332573094,-73.842481984427,-73.8424632238886,-73.8423171248032,-73.8420762064724,-73.842027270661,-73.8417046629585,-73.8417545761596,-73.8413820617807,-73.8413610674426,-73.8412739263343,-73.8412025073201,-73.8410740038714,-73.8410237668876,-73.8410063788096,-73.8408682194575,-73.840581564588,-73.8404497031631,-73.8404204444651,-73.8404323489576,-73.8404660352615,-73.8404176540198,-73.8401278555698,-73.840112537299,-73.8400175299584,-73.8400265601272,-73.8399595945986,-73.8399872601915,-73.8399234512599,-73.8398292624169,-73.8398370318464,-73.8399088667522,-73.8398581371862,-73.8398814293241,-73.839984600832,-73.8399940339281,-73.8400515092335,-73.8400535103905,-73.8401006913586,-73.8400605997814,-73.8399673052874,-73.839998604073,-73.8401462573308,-73.8402460596579,-73.840289119449,-73.8402315549765,-73.8402806697419,-73.8402850625364,-73.8403652852561,-73.8405234084931,-73.8406188149607,-73.8407033953127,-73.8408134495695,-73.8408435226979,-73.8409185621533,-73.8410445465455,-73.8411757421449,-73.8412496637642,-73.841289746031,-73.8413111172788,-73.841349263555,-73.8414247519927,-73.8415670372551,-73.841703301698,-73.8418844180047,-73.8419241389583,-73.8419490890731,-73.8419868483405,-73.8421258581763,-73.8421373384481,-73.8420936631185,-73.842375344205,-73.8427987581109,-73.8428921645095,-73.8430637903374,-73.8430430176385,-73.8431528346121,-73.8431699276372,-73.8434477697222,-73.8435800143382,-73.8437405300036,-73.8437722678201,-73.8440068651957,-73.844110201558,-73.8441839942784,-73.8441792071287,-73.8443873689674,-73.8445179136856,-73.8446412872602,-73.8447574149078,-73.8448662262433,-73.8449613212074,-73.8450499073548,-73.8451319377281,-73.8452073688511,-73.8452801923656,-73.8453684280164,-73.8454653867592,-73.8457656170223,-73.845854121851,-73.8459116691661,-73.8460260036607,-73.8461730287205,-73.8468887120835,-73.8471968450965,-73.8474677216827,-73.8475828339988,-73.847630992988,-73.8477025662252,-73.8482148651571,-73.8487628685534,-73.8493855614798,-73.8500504981515,-73.8502048669623,-73.8504106682,-73.8505247054515,-73.8506024620396,-73.8515932500799,-73.8517920051125,-73.8519812557734,-73.8521883239583,-73.8524370767289,-73.8523905801646,-73.8522495647087,-73.8522583224928,-73.8524345347244,-73.8525312722851,-73.8526193275169,-73.852800042436,-73.8529450576772,-73.8530132828713,-73.8528946349658,-73.8528420870741,-73.8526549604506,-73.8526727838091,-73.8526465127709,-73.8526730689271,-73.8526181519095,-73.8526579920883,-73.8529796270479,-73.8529510574378,-73.8529687081025,-73.8529513161469,-73.8528809058543,-73.852913985456,-73.8529799523565,-73.8533685786882,-73.8537435802723,-73.8543465558497,-73.8548423540992,-73.8549550400127,-73.8551469531533,-73.8553151178983,-73.8553803024369,-73.8553196589575,-73.8550486013369,-73.8547100821091,-73.854430755966,-73.8541126873481,-73.8538501105715,-73.8534677405863,-73.8533525874502,-73.8532390092186,-73.8531276469797,-73.8530191293157,-73.8529140687554,-73.8528479304539,-73.8527836405627,-73.8527482834068,-73.852710001515,-73.8526613338688,-73.8526101467633,-73.8525573943493,-73.8525165212839,-73.8524757539389,-73.8520635741306,-73.8519141729744,-73.8517135355406,-73.8514812422842,-73.8513635762557,-73.8511999772519,-73.851048397499,-73.8508949358727,-73.8507281130148,-73.8505666835552,-73.8504108775591,-73.8503492346868,-73.850284181508,-73.8502160577005,-73.8501452189738,-73.8500978330527,-73.8499795406617,-73.8498651685291,-73.8497552011789,-73.8496501044711,-73.849550323628,-73.8494562813482,-73.8493683760152,-73.8492869800105,-73.8492124381357,-73.8491450661521,-73.8490851494433,-73.8490329418068,-73.849038228774,-73.8490453605222,-73.8490630185004,-73.8490824094239,-73.8491105161404,-73.8491403753151,-73.8491701942888,-73.8492088394631,-73.8492404353332,-73.8492789600583,-73.8493420151683,-73.8493735898031,-73.8493842025582,-73.8493755953606,-73.8492971166623,-73.8492482752339,-73.8492134682294,-73.8491908876784,-73.8491735842485,-73.8491946982757,-73.8492490511082,-73.8493033806389,-73.849357681327,-73.8494189871434,-73.8494541199775,-73.8494787747934,-73.8494999003759,-73.8495297741913,-73.8495770633073,-73.8496435606484,-73.8497135592384,-73.8497696046884,-73.8497980452202,-73.8498099933728,-73.8498118967199,-73.8498348557813,-73.8498717157423,-73.8499089230631,-73.8497670510375,-73.8497601163408,-73.8497863390853,-73.8497915545344,-73.8498876786974,-73.8498842169862,-73.8499193870184,-73.8500201232454,-73.8498483393259,-73.8498466251808,-73.8500300110965,-73.8500424161291,-73.85004422604,-73.8500425537318,-73.8500234018868,-73.8500053510722,-73.8499955485299,-73.8499799383494,-73.849974779336,-73.8499696276366,-73.8499673290538,-73.8497477887842,-73.8497286535864,-73.849957494652,-73.8499511693801,-73.8495559567937,-73.8495507693494,-73.8499535560638,-73.8499597566972,-73.8499703010127,-73.8499721137099,-73.849966968027,-73.849942606318,-73.8499077311547,-73.8498809326432,-73.8499001913423,-73.8498666326907,-73.8497898980027,-73.8497594494487,-73.8497545288021,-73.8497441013597,-73.849731915087,-73.8497022702831,-73.8496813524957,-73.8496499390142,-73.8496116642039,-73.8491657211891,-73.8491709398646,-73.8487600774598,-73.8487096247923,-73.8491274880784,-73.849132699398,-73.8495221825685,-73.8494543115231,-73.8494450336026,-73.8493883850838,-73.8492762555412,-73.8491025592305,-73.8489555708316,-73.8487773786149,-73.8486479587444,-73.8485242676746,-73.8484164096165,-73.8483677654779,-73.8483289188505,-73.848280240183,-73.848349370762,-73.8483987979702,-73.8483795372141,-73.8482816345226,-73.8481149914892,-73.8479863058122,-73.8478500379095,-73.8476342069126,-73.847536219756,-73.8475170625152,-73.8474882264191,-73.8475277690616,-73.8476680516586,-73.8479029865274,-73.8480762459938,-73.8482536483152,-73.8484027288337,-73.8485554046479,-73.8486051818876,-73.8486478460621,-73.8487009796496,-73.8487028953815,-73.848704238784,-73.8487431721286,-73.848799921247,-73.8488355148197,-73.84883560644,-73.8488356250031,-73.848871151834,-73.8489066358098,-73.84894604006,-73.8489810966713,-73.8490307194203,-73.8490837991527,-73.8491052157553,-73.8491191059702,-73.8491651039055,-73.849214665784,-73.8493338230794,-73.8493178894178,-73.8494103633772,-73.8494285272771,-73.8495267218233,-73.8496118055207,-73.8497075610163,-73.8498210718385,-73.8499772270918,-73.8500627973219,-73.850084200019,-73.8501129120303,-73.8501215075184,-73.8501343653171,-73.8501486756431,-73.8501983903642,-73.8503356010146,-73.850362470885,-73.850649546161,-73.8509207057749,-73.8511855292595,-73.8512633899898,-73.8513241118027,-73.8514753723051,-73.8517780752275,-73.8520492259949,-73.8523456539033,-73.8525737562284,-73.8539934914496,-73.8540712042706,-73.8541247337556,-73.8542184149609,-73.8543508748237,-73.8546011424812,-73.8547998636912,-73.8550354272501,-73.8551605815095,-73.8551760519167,-73.8553887931119,-73.8556095879817,-73.8558544633539,-73.8560516293124,-73.8562460630447,-73.8564376149585,-73.8566261376771,-73.8566181343632,-73.8565778014845,-73.856496920485,-73.856397852059,-73.856268079978,-73.8561662030984,-73.856045593117,-73.8559294272059,-73.855808407844,-73.8556904709838,-73.8556138973806,-73.8555635843382,-73.8555787713098,-73.8555847936042,-73.8556049703973,-73.8557207270875,-73.8558983570519,-73.8560511716755,-73.8561254256331,-73.8563001122441,-73.8563859829374,-73.8565160409679,-73.8565236192694,-73.8566385427424,-73.8567579265952,-73.8568775395574,-73.8569486517885,-73.8570444330499,-73.8571214561418,-73.8572024052575,-73.8572449198857,-73.8572196386465,-73.8571279376042,-73.8570030245838,-73.8569262312978,-73.8568251493471,-73.8567529717633,-73.8566757965839,-73.8566748824054,-73.8567271583775,-73.8568342102445,-73.857924029087,-73.8581270569977,-73.8582813740184,-73.8584231767867,-73.8585566485381,-73.8587360635664,-73.8588903750238,-73.8589112120127,-73.8589117725049,-73.8588720650435,-73.8588264323911,-73.8587828442472,-73.8587472261362,-73.8587056115777,-73.8586660234084,-73.8586224721031,-73.8585729449642,-73.8585432556536,-73.8585056003916,-73.858481714815,-73.8584558076315,-73.8584438535961,-73.8584120914246,-73.8583624971698,-73.8583148770697,-73.8583148161362,-73.8583127496203,-73.8583463635422,-73.8583819693826,-73.8583858315419,-73.8583995957086,-73.8583975292331,-73.8583934779532,-73.8583933657708,-73.8583933144869,-73.8584190832342,-73.8584609189064,-73.858503117029,-73.8585123017872,-73.8585053317683,-73.8585102165134,-73.8585170417449,-73.858561489017,-73.8586119190109,-73.8586717643724,-73.8587475960582,-73.8588094637394,-73.8588890885491,-73.8589347172643,-73.8589919507005,-73.8590192625443,-73.8590503937845,-73.859065314354,-73.8590847585267,-73.8590920931198,-73.8590834407817,-73.859057165769,-73.8590470459352,-73.8590026327842,-73.8589743130598,-73.8589580820172,-73.8589277553267,-73.8588974286872,-73.8588570663359,-73.8588529763358,-73.8588770940308,-73.8589092914103,-73.8589314132523,-73.8589723200796,-73.8590082399906,-73.8591273340373,-73.8591954502448,-73.8592593902281,-73.8593105781951,-73.8593660233232,-73.8593663120556,-73.8593666242334,-73.8593840557894,-73.8594099178215,-73.8593974999662,-73.859401919202,-73.8593765635751,-73.8593129537783,-73.8592577527608,-73.8592575982146,-73.8592530904908,-73.8592273765277,-73.8592229055704,-73.8592226524774,-73.8592054959474,-73.8591586814882,-73.8590822548802,-73.8589804571145,-73.8588277974303,-73.8586650516919,-73.8585724249463,-73.858418327096,-73.8583899622881,-73.8586193056997,-73.8587745265453,-73.8589514122178,-73.8590006650952,-73.8590049367417,-73.8590333612196,-73.8590766256642,-73.8591520952384,-73.8593197656454,-73.8594716149286,-73.8595480961051,-73.8596661655864,-73.8598315249328,-73.8601269523558,-73.8601182635032,-73.8600804911734,-73.8600352991341,-73.8600317284643,-73.8600088165894,-73.8599598469343,-73.8599271534919,-73.8599234115955,-73.8598712321972,-73.8597783920461,-73.8597466904334,-73.8597192807567,-73.8597235542751,-73.8596707296177,-73.8596760694148,-73.8596253738816,-73.8595405986248,-73.8594739316422,-73.8594064325493,-73.8593389430534,-73.8593332977337,-73.8593291926488,-73.8593267299824,-73.8593259710346,-73.8593269346965,-73.85932959698,-73.859333891615,-73.8593569326948,-73.8593836727589,-73.8594138974704,-73.859381679263,-73.859355782334,-73.8593362415701,-73.8593230832854,-73.8593163251867,-73.8593192704232,-73.8593238377998,-73.8593299149968,-73.8593373525653,-73.8593459676029,-73.8593555482515,-73.8593658589071,-73.859371893224,-73.859378031772,-73.8593898201083,-73.8594014790834,-73.8594126798378,-73.8594231064368,-73.8594324647817,-73.8594404909056,-73.8594469584185,-73.8594750716286,-73.8595121799863,-73.8595582049871,-73.8596130492471,-73.8596540386574,-73.8597027334092,-73.8597589085073,-73.8598223043861,-73.8598926281085,-73.8599695547198,-73.8600527287487,-73.8601417658498,-73.8602362545796,-73.8603357582984,-73.8604398171872,-73.8605479503733,-73.860659658153,-73.8607744243003,-73.8608917184534,-73.8622860458276,-73.8626468066483,-73.8644033337952,-73.8676564628447,-73.8686889096087,-73.8697695585004,-73.8707780488594,-73.8712942159998,-73.8717160645012,-73.8765199603363,-73.8766345996371,-73.8780628326213,-73.8809802965942,-73.8824477955298,-73.8826592292403,-73.8837878612648,-73.8842497175018,-73.8842948821121,-73.8843321238172,-73.8843612859193,-73.884385041061,-73.8846445070049,-73.8846216586827,-73.884613360104,-73.8846093892466,-73.8843870535373,-73.8837841413457,-73.8839006990514,-73.8847896027465,-73.885026388461,-73.8854150101017,-73.885566158875,-73.8856920052475,-73.8857942629586,-73.8857804210568,-73.8857319592302,-73.8856280064155,-73.8855923603726,-73.8854678426463,-73.8853473929309,-73.8853368300031,-73.8853367000831,-73.8852801048696,-73.8852752842485,-73.8852419928355,-73.8852326819139,-73.8852282126335,-73.8852251664197,-73.8852230297459,-73.8852208952329,-73.8852190454723,-73.8852165959349,-73.8852147649757,-73.88521355038,-73.8852123256275,-73.8852107117646,-73.8852100300607,-73.8852099719983,-73.8852092884129,-73.8852086796872,-73.8852058424259,-73.8852036424639,-73.8851587849656,-73.8851241284434,-73.8845210008481,-73.8842706020193,-73.8840194346347,-73.883999123243,-73.8838089879107,-73.8835825579804,-73.8832246055431,-73.8830124553659,-73.8820240958018,-73.8820129137923,-73.8819990936337,-73.8819358895712,-73.8818171701888,-73.8818025299803,-73.8816551223218,-73.8815321581044,-73.8813335607295,-73.8812102103995,-73.8810388009345,-73.880742078211,-73.8807208158036,-73.8806788959028,-73.8805595352094,-73.8802673783566,-73.8801734789894,-73.8800914409518,-73.8799463075401,-73.8796518235077,-73.8793523626357,-73.8789939591054,-73.8786303201969,-73.8782622180322,-73.877890467801,-73.8775158530005,-73.8772276255229,-73.8769435147923,-73.8761514288291,-73.8750783721069,-73.8742583325403,-73.8738929586438,-73.8738369655606,-73.8737730880609,-73.8737582282926,-73.8736176059599,-73.8735905326388,-73.8735176630578,-73.8733483430233,-73.8733274669736,-73.8731760392855,-73.8731471467484,-73.8731272815869,-73.8729804293913,-73.8727720465853,-73.8727271842559,-73.8712060585942,-73.8703478696004,-73.8702763856525,-73.8701817822227,-73.8700652511302,-73.8695586208914,-73.8692076681603,-73.868740735508,-73.8683084692482,-73.8678225811518,-73.8674020711092,-73.8672481888945,-73.866361307901,-73.8654645019086,-73.8644801171779,-73.8643692214372,-73.8636393815755,-73.8635801404726,-73.8634723231289,-73.8617616650535,-73.8616283336918,-73.8604562735985,-73.8601849194853,-73.859724523661,-73.8591959368475,-73.8583566909684,-73.8575394249403,-73.8571924801879,-73.856184021551,-73.8555357982924,-73.8551967533145,-73.8542074576561,-73.853497466347,-73.8533352494205,-73.8532680414721,-73.8530946020703,-73.8530351029675,-73.852920440308,-73.8528699785798,-73.8526648047364,-73.8524793893949,-73.852331486691,-73.8522072094839,-73.852070059308,-73.8518586876834,-73.8516845974783,-73.8501653592554,-73.8495589063688,-73.8484861534022,-73.8454272320661,-73.8442277329463,-73.8432267235367,-73.8421823657989,-73.8400027641618,-73.83979488496],"lat":[40.8356192074919,40.8356012091667,40.8356105688684,40.8355916852755,40.8355752799166,40.8355091734125,40.8355184942249,40.8354996074832,40.835492625982,40.8354642979479,40.8354665368521,40.8354500148388,40.8354430539473,40.8353816689229,40.835395714345,40.835376813962,40.8353627642277,40.8353179103598,40.8353248738743,40.8353083475379,40.8353037266438,40.8352423404418,40.8352564074474,40.8352398811096,40.8352258400347,40.8351762555342,40.8351855762867,40.835173765936,40.8351573692941,40.8351054162397,40.8351147537728,40.8351005883448,40.835088907193,40.8350322326534,40.8350415663563,40.8350274042467,40.8350320683311,40.835006105692,40.8350061662456,40.8349896430584,40.8349802932322,40.8349283536441,40.8349306097697,40.8349188080673,40.8349071014992,40.8348622514425,40.8348692321993,40.834847968244,40.8348293056552,40.8348009819374,40.8348173050767,40.8348031398146,40.8347773698905,40.8347466684768,40.8347630100695,40.8347488386373,40.8347301512871,40.8347018146024,40.8347205149193,40.8346473151852,40.8346496361505,40.8346000651075,40.8345907288109,40.8345742007935,40.8345604756456,40.8344917235808,40.8343689182358,40.834230491945,40.8340416880906,40.8337178974949,40.8336672430954,40.8333207947995,40.8330434254738,40.8326007790162,40.8322869827392,40.8317261936547,40.8315505072772,40.8313004485228,40.8311204882084,40.8310001205188,40.8308184841429,40.8307450266699,40.8301214016875,40.8301015670816,40.8300209700228,40.8299600117952,40.8299615871206,40.8297620900394,40.8297941393199,40.8293069823434,40.8289349849401,40.8288274667015,40.8287029156992,40.8286224686762,40.8285691766244,40.8285275718086,40.8283277245031,40.8282756209145,40.8280400532971,40.8279089858429,40.8278057303519,40.827739260717,40.8275998377753,40.8275273041485,40.8274775716966,40.8273749605172,40.8271846846803,40.8265377353675,40.8265474477451,40.8257673819871,40.8257554203967,40.825147433399,40.8250850334991,40.8249089978554,40.824816858085,40.8245261134276,40.8243411658737,40.8242410271096,40.8241535072083,40.8235948361563,40.8233455664967,40.8232685250566,40.8231130437951,40.8230800235838,40.8229980294567,40.8224214270147,40.822299406219,40.822190242623,40.822067732913,40.8219998602399,40.8219219325542,40.8217395384415,40.8215715014961,40.8214313311079,40.8211547985954,40.8210099819193,40.8208968675144,40.8207947763627,40.8206825610678,40.8206144454143,40.8205120799626,40.8203227617277,40.8202300717399,40.820179082004,40.8199349473157,40.819819249055,40.8198260235228,40.8198077045539,40.8197355307711,40.8196784975575,40.8196262661264,40.8195777500243,40.8195387972248,40.8195495007785,40.8194776229621,40.8194446911904,40.8193550433897,40.8193421249209,40.8192301695992,40.8191830818138,40.819161015082,40.81915650957,40.8191361440375,40.8191229741488,40.8190418808288,40.8189404322117,40.8189042122473,40.8188500181042,40.8188323729219,40.8188049478319,40.8187743739082,40.8184582219133,40.8182590337787,40.8180595429516,40.8174898470806,40.8169370086494,40.8167304539289,40.8165586450268,40.8163773195514,40.8162734279655,40.8160510550134,40.8156980652578,40.8154683465973,40.815321699542,40.8151390707769,40.8147061226307,40.8145135766466,40.8143309923702,40.814186670559,40.8136451308272,40.8134251528926,40.8132027988456,40.8129782035971,40.8127515034169,40.812537680056,40.8123222490033,40.8121053246078,40.8118870220096,40.8117781167457,40.8117514383606,40.8117649676643,40.811582278842,40.8114294715344,40.8113301124461,40.8110237144216,40.8106766644305,40.8105213251784,40.8105804876142,40.8109039428543,40.8112817497529,40.8113517412714,40.811455764866,40.8124629089958,40.8129046861196,40.8132368653451,40.81348902434,40.8135342955192,40.8135840243911,40.8138303153466,40.8139301995395,40.8143043867503,40.8143001745273,40.8143405619206,40.8142889736524,40.8143026744951,40.8144213759092,40.8144713771398,40.814493132564,40.8144565592526,40.8145169006093,40.8145220305653,40.8144402994715,40.8145726276565,40.8145844236236,40.8144755472776,40.8143433370836,40.8143380795575,40.814242758337,40.814175817748,40.8141139613618,40.8140586921232,40.8139633995449,40.8138734844954,40.8138500306209,40.8138333256224,40.8137329415704,40.813714452174,40.8136894037016,40.8136738221008,40.8135939031363,40.813645833154,40.8138638579141,40.8140915180124,40.8141934171709,40.814368994799,40.8144121416873,40.8142888820827,40.8141615671502,40.814073189623,40.8138444014154,40.8137179190698,40.8136351468258,40.81357141221,40.8134777111061,40.8134903601797,40.8135095419874,40.8135351482582,40.8135670344586,40.8136050206081,40.8136326572108,40.813662706288,40.8136836463741,40.8137013710889,40.8137179541341,40.8137293461068,40.8137353346552,40.8137361935097,40.8137338019072,40.8137260606634,40.8136720579228,40.8136467440486,40.813590682107,40.8135500616971,40.8135531443762,40.8134918808384,40.8134333844029,40.8133272228133,40.8132163527069,40.8131009321114,40.8130633579445,40.813029263913,40.8129988280378,40.8129722092388,40.8129570027328,40.8129141444474,40.8128655303095,40.812811366271,40.812751881795,40.8126873288839,40.8126179810112,40.8125441319634,40.8124660945946,40.8123841995011,40.8122987936211,40.8122102387641,40.8121189100786,40.8120487162525,40.8119863242913,40.8119053582321,40.8118310339467,40.8117660129934,40.8116983402307,40.8116492552858,40.8115603503489,40.8114979903652,40.8114621929455,40.8113972187877,40.8113441523431,40.8112870747676,40.8112299737573,40.8111608308863,40.811122263471,40.8110598166448,40.8110000415715,40.8109243407841,40.8108606391246,40.8107797205129,40.8107094244241,40.8106524051143,40.8105874274487,40.810506484135,40.8104215445629,40.8103525329918,40.810278221125,40.8102304861637,40.8101880867715,40.8101430366365,40.8100860182303,40.8100328778851,40.8099984438153,40.8099294059674,40.8098218936515,40.8097489182566,40.8096601220894,40.8096691200087,40.8096452132205,40.8096399363505,40.8096518920214,40.8096440509126,40.809629442261,40.8096266659269,40.8092540395301,40.8092669363033,40.809252328753,40.8092351033237,40.8092154084877,40.8091875293482,40.8091543346394,40.809123772964,40.8090936343777,40.809077268519,40.8090254672838,40.8089882854678,40.808948448392,40.8088755124545,40.808913639652,40.8088751116388,40.8088300684251,40.8087147201722,40.8087447720354,40.8087208675109,40.8086934060764,40.8086762590991,40.8086497186248,40.8086205121882,40.8085780193462,40.8085328462248,40.8085009360907,40.8084762524287,40.8084096553816,40.8083370097606,40.8083073408306,40.8082693366699,40.8082498032241,40.8082245627351,40.8082046316634,40.8081780394907,40.8081554417608,40.8081381408778,40.8081241850512,40.8082251359362,40.808235764343,40.8083374577931,40.8082404704191,40.808133474599,40.8081467587698,40.8080552772177,40.8080236801959,40.8079492074627,40.8078775328363,40.8078316761258,40.807769287459,40.8077089838619,40.8076358782767,40.8075435102826,40.8074638187384,40.8073687757954,40.8072180514946,40.8070315049757,40.8068524050477,40.8066734596246,40.8065243277843,40.8063601863346,40.8062406997106,40.8061285826756,40.8061030506237,40.8060760142664,40.8060085904115,40.8059264027952,40.8057175020065,40.8054489091492,40.8053296047885,40.8051664492274,40.8050021793973,40.8049196411492,40.8049010069712,40.8048580768281,40.8047935880726,40.8047424417443,40.8046993714804,40.8047317862773,40.8048329083652,40.8048584729292,40.8048962596861,40.8048990294405,40.804845167928,40.8048048250227,40.8047966511692,40.8047724392976,40.8047670951924,40.8047621689947,40.8047806704795,40.8047969068273,40.8048535798278,40.8048977518614,40.804926401397,40.8049776732991,40.8050208644196,40.8050512182618,40.8046614657032,40.8046679762756,40.8050598281406,40.8050643984452,40.8050860726131,40.8050942829143,40.8050944308435,40.8050595949819,40.8048656385372,40.8047793315494,40.8046635506727,40.8046333281164,40.8045881072299,40.804534218813,40.804510024974,40.8045158435904,40.8045125639903,40.8044775171354,40.8044778681173,40.8044925861016,40.804530376686,40.8045598499491,40.8045983783255,40.804593976712,40.8045991162411,40.8045803292648,40.8045508887043,40.8044619131591,40.8044574624195,40.8044656683629,40.8044800286681,40.8045137652515,40.8045476503301,40.8045478195503,40.8045200549142,40.8044977900193,40.8044955281008,40.8044644272943,40.8044702050732,40.8045146461396,40.8045874295842,40.8046643402967,40.8047453191075,40.8048303037174,40.8048655711638,40.8049328514398,40.8049490132688,40.8049468357134,40.8048829935714,40.804830528366,40.8047740631394,40.804724869734,40.8046791575071,40.8046765655756,40.804703583773,40.8047849963324,40.80488219624,40.8049720217752,40.8050621570349,40.8051221041797,40.8051690602815,40.8052477602477,40.8052816812508,40.8052819314656,40.8052587039266,40.805241220476,40.80523993226,40.805263893425,40.8052733108133,40.805293592521,40.8052746147744,40.805295185031,40.8053304751588,40.8053258693481,40.8053072381161,40.8052387175942,40.8051854945613,40.8051399188192,40.8051154937251,40.8050696288985,40.8050379034914,40.8049953703208,40.8049519107047,40.8049440303138,40.8049092707154,40.8053910342372,40.8054665200493,40.805558732297,40.8056445832924,40.8057209034501,40.8057941068374,40.8058894906752,40.805912755735,40.805954126024,40.8059796891298,40.8059931927225,40.8059780734878,40.8059448850504,40.8059342883612,40.8059026012489,40.8058709099328,40.8058512633453,40.8058271222636,40.8058195427928,40.8058632041353,40.8059249417748,40.805952046195,40.8059700856388,40.8059820772959,40.8059985915148,40.806027216754,40.8060663847177,40.8061101171883,40.8061493314365,40.8061975468293,40.8062518000872,40.8062909692237,40.806331641133,40.806384370961,40.8064084762214,40.8064115216439,40.8064080427635,40.8064242697624,40.8064893617722,40.8065440139063,40.8065924747981,40.8066378837572,40.8066677300838,40.8066975135378,40.8066968749382,40.8066975810178,40.8066984362985,40.8066884903381,40.8066743586659,40.8066403951684,40.8066067502077,40.8065639677424,40.8065077147118,40.8064802181635,40.8064452708843,40.8064089782718,40.8063661745357,40.8063432370526,40.8062928076731,40.8062362360639,40.8061827077526,40.8061291988783,40.8060756889905,40.8060359639903,40.8060084299519,40.8059885086034,40.8059808155667,40.8059685456415,40.8059660672379,40.8060058829243,40.8061571817032,40.8062698778297,40.8064115816123,40.8065404124272,40.8066756832078,40.8068013585423,40.8069367031033,40.807139694813,40.8073201203072,40.8074522576481,40.8075295913373,40.8075682951727,40.8075716017341,40.8075426730078,40.8074750004846,40.807358998426,40.8072430237453,40.8071431320895,40.8070335695139,40.8069498069017,40.8068789746492,40.8068404068221,40.8068340968232,40.8068407443276,40.8068327514956,40.807314677973,40.8081120406316,40.8082588091488,40.8088468360739,40.8092339751356,40.8102714175866,40.8101976370984,40.8101047091221,40.810046091276,40.8099755581021,40.8099507698811,40.8099414625434,40.8099051142652,40.8098182502048,40.8098065647232,40.8097334773083,40.8096054998913,40.8095699615285,40.8095590833717,40.8095139348612,40.8094903215916,40.8094874765082,40.8094813973669,40.8094411885536,40.8094021534093,40.8093848833591,40.8092867574119,40.8092778819164,40.8092392856982,40.8092184023976,40.8091982538972,40.8091725522075,40.8091459780156,40.8090197024464,40.8090111990559,40.8090083964088,40.8090113294538,40.8090042280858,40.8089965404632,40.8089884579468,40.8089801817269,40.8089719178158,40.8089638719189,40.8089562443149,40.8089240355945,40.8088935217636,40.8088649474021,40.8087345851511,40.8086034119761,40.8084716047744,40.8083393412973,40.8082067999102,40.808198739901,40.8081911288513,40.8081841539296,40.8081779866606,40.8081727787076,40.8081686581428,40.8081657262977,40.8081646266597,40.8081639362338,40.8081637687324,40.8081651026023,40.8081679002197,40.8081720826732,40.8081775319904,40.8081840944647,40.8081915849913,40.8083406558843,40.8084885863622,40.8086350632338,40.8087797763837,40.8088670096549,40.8089519254399,40.8090341313331,40.8091132474497,40.8091889081822,40.8092607638896,40.8093284825134,40.8093917511126,40.8094502773096,40.8095037906416,40.8095520438111,40.8095948138282,40.8096319030419,40.8096631400531,40.809688380507,40.8099459112274,40.8100125400154,40.8102759864376,40.8105837619372,40.8118542724566,40.8134236997572,40.8144868954878,40.8147295360379,40.8149223354902,40.8161310634242,40.8157115080992,40.8161826324441,40.818235623128,40.819268322009,40.8196888326195,40.8219334137713,40.8226422090826,40.822718205268,40.8228101429798,40.822873801332,40.8229513694985,40.8238142737016,40.824956206335,40.8252765033196,40.8253035364272,40.8268172835329,40.8282742924624,40.8282701539127,40.8282360541028,40.8281871577443,40.8280141509475,40.8279398906285,40.8278773035847,40.8278235750115,40.8279143713239,40.8282121805301,40.8288509914984,40.8290700377422,40.8301119039421,40.8305648576803,40.8305982647274,40.8305986571073,40.8307705028734,40.8307831605576,40.8308706311554,40.8308950733779,40.8309068262766,40.8309148389398,40.8309204354699,40.8309260578009,40.8309309026006,40.8309373342621,40.8309421472509,40.8309453469256,40.8309485531237,40.8309528129963,40.8309545865659,40.8309547473312,40.8309563331044,40.8309577376909,40.8309642904212,40.8309693675631,40.8310729617076,40.831161082577,40.832254826651,40.8325963606578,40.8328814511171,40.8329057427893,40.8331150395822,40.8333782763501,40.8337997594966,40.8340534602036,40.8353357992776,40.8353637032037,40.8353944221834,40.8354621249856,40.8356437967682,40.8356742925784,40.8359463439712,40.8361867753265,40.8365670213302,40.836784354721,40.8370624578241,40.8374864279544,40.837521265023,40.8375051288087,40.8374591795866,40.8373442991535,40.8373105844355,40.8372811268627,40.8372262776342,40.8371260264319,40.8370349162458,40.8369329018055,40.8368412003844,40.8367600295246,40.8366895689627,40.8366299545205,40.8365831822738,40.8365608443931,40.8364985748949,40.8364230989704,40.8363790022439,40.8363634124156,40.8363611180845,40.8363587514383,40.8363981947851,40.8368187789932,40.8368965251878,40.8371144281902,40.8375920085582,40.8376519493322,40.838165830893,40.8382638989732,40.838335096416,40.8389524851857,40.8397512823361,40.8397489448,40.8396746224424,40.8396255665228,40.8396214788075,40.8396180754978,40.8396138826638,40.8395956534619,40.8396000467111,40.8398245766416,40.8399952139561,40.8401664990161,40.8402902760565,40.8403438043703,40.840592685023,40.8408568919647,40.8410877973869,40.8411090181287,40.8412652747639,40.8412779566327,40.8413059327065,40.8415127206042,40.8415278596844,40.8416616659383,40.8416890901825,40.841744019969,40.8418040334786,40.8418992866161,40.8419893968736,40.8420276484458,40.8421459172477,40.8422194899931,40.8422579925553,40.842370739177,40.8424516676459,40.8424701551548,40.8420726882375,40.8410469607221,40.8407354577473,40.8401215059892,40.8398513043708,40.8387800833759,40.8377842871409,40.837010527112,40.8363474952993,40.8356253025498,40.8347777470676,40.8342010523503,40.8343554874818,40.8344088709594,40.8345244953327,40.8349364829275,40.8350927078166,40.8352304476122,40.8353741424097,40.8356616669108,40.8356192074919]}]],[[{"lng":[-73.9213375241934,-73.9211359470915,-73.9210331764514,-73.9208389871311,-73.9205787811659,-73.9203547989368,-73.9203146552123,-73.9192378576436,-73.9191457374825,-73.9190656028214,-73.9189949684349,-73.9189872445786,-73.9189107610063,-73.9179799205819,-73.9179027981095,-73.916629852478,-73.9163985291404,-73.9154547096642,-73.9144382723331,-73.9138042827681,-73.9137838537059,-73.9145920846777,-73.9151413442617,-73.9153569891036,-73.9155211784629,-73.9163057468168,-73.9161708792398,-73.9168654058495,-73.9170792352836,-73.9171062231295,-73.9178407192205,-73.9181233087113,-73.9184333846567,-73.9185629977499,-73.9185900136679,-73.9185087695909,-73.921892481289,-73.9219953927308,-73.922190980573,-73.9224351211493,-73.9228520328015,-73.9230647313939,-73.9240114578265,-73.9240136473876,-73.9240620882918,-73.9241211399679,-73.9242362187588,-73.9242475490167,-73.924310779587,-73.9244805228042,-73.9246732967182,-73.9248839477171,-73.9250608790882,-73.9251402151916,-73.9251535184034,-73.925241953081,-73.92538939088,-73.9257180867853,-73.9271375406857,-73.9273242257486,-73.9275441076857,-73.9276039547454,-73.9276965061652,-73.9277874649514,-73.9281011898734,-73.9284926956136,-73.9291735279066,-73.9303098812945,-73.9306381969117,-73.9310535280784,-73.9326708061044,-73.9350234513451,-73.9354056628427,-73.9358129979866,-73.9359822600659,-73.93607064617,-73.9360533274152,-73.936002712407,-73.9359182384006,-73.9357934534883,-73.9357638481296,-73.935712659977,-73.93312843469,-73.9326960608632,-73.9324014551364,-73.9322407328491,-73.9321052895736,-73.9314759532981,-73.9308417873928,-73.9307294050381,-73.9297844300836,-73.9297240078186,-73.9296661054263,-73.9287194892678,-73.9285945984799,-73.9280727357571,-73.9273732689822,-73.9269225825708,-73.9268082369468,-73.9266671434606,-73.9264183404304,-73.9262543144867,-73.926104101867,-73.9260623804895,-73.9260655786846,-73.9260858770584,-73.9260891150301,-73.9260446989647,-73.926047936891,-73.9260866061662,-73.9261123376661,-73.9261529337365,-73.9261596044981,-73.9261594224978,-73.9262716852483,-73.9264418232361,-73.9265472974237,-73.9265676633997,-73.926513121857,-73.9262782642522,-73.9261455569655,-73.9259276308138,-73.9257642622022,-73.9256355690744,-73.9255872987962,-73.9255804117409,-73.9256075602625,-73.9261693977945,-73.926428059502,-73.926628984231,-73.926666623693,-73.9267379884692,-73.9267007459007,-73.9266395461271,-73.9265782480936,-73.9265067877858,-73.9263674257349,-73.9263303226732,-73.9263445156768,-73.9264265433789,-73.9264880303096,-73.9265658481599,-73.9267027226223,-73.9267388558823,-73.9268287456523,-73.9269445611787,-73.9270195067962,-73.9271148772652,-73.9271659966795,-73.9272409427353,-73.9273158785868,-73.9273806159024,-73.9274385682008,-73.92751010805,-73.9275612056603,-73.9276531907831,-73.927784099285,-73.9278688924114,-73.92789328731,-73.9279020271949,-73.9279105356631,-73.927893744986,-73.9276598280625,-73.9275783022955,-73.927320657086,-73.9272766442425,-73.9272328605244,-73.9271356372808,-73.927801414724,-73.9280005357249,-73.9282672029621,-73.9283377317929,-73.9283429113744,-73.9283421270905,-73.9283353831694,-73.9283227160924,-73.9282953104294,-73.9282652092128,-73.9273533214668,-73.9272605730301,-73.9272437665862,-73.9270978282146,-73.9270512285462,-73.9270115864135,-73.9269790933577,-73.926953906384,-73.9269361472018,-73.9269259016367,-73.9269232192152,-73.9269049272832,-73.9268906696192,-73.9268896782797,-73.9269519235601,-73.927038456716,-73.9271180694481,-73.9271851477837,-73.9273548544178,-73.9273469225273,-73.9276712262087,-73.9277069412712,-73.9273826362456,-73.9273667566067,-73.9272029970421,-73.927216892572,-73.927277202689,-73.9274392218532,-73.927475886035,-73.9272629329128,-73.9269199561588,-73.9269010544435,-73.9268826175436,-73.9268541017267,-73.9268060764352,-73.926695726295,-73.9272477078928,-73.9271146423064,-73.9270669662849,-73.9271693302249,-73.9266656548039,-73.9265535165366,-73.92674263893,-73.9267368395309,-73.9267252621683,-73.9267209116897,-73.9265384639004,-73.9265025027553,-73.9266847062115,-73.9265524180843,-73.9268452842961,-73.9268316274075,-73.9268690867946,-73.9269953130313,-73.9270464029791,-73.92688606022,-73.926509548673,-73.9258804633777,-73.9258249463873,-73.9257755181175,-73.925698261787,-73.9254929349305,-73.9252752102012,-73.9243604410757,-73.922633785949,-73.9221553889881,-73.9219109222957,-73.9213375241934],"lat":[40.8008521069996,40.800475459594,40.8002652818581,40.8000125980067,40.7996681489629,40.7994228528632,40.79937545929,40.7988810676829,40.798838987346,40.7988027973194,40.7987718427019,40.7987697122199,40.7987401378657,40.7983802019275,40.7983626532315,40.7978581394371,40.797684842039,40.797063466031,40.7956655178639,40.7945118464559,40.7938362854821,40.7927766019591,40.7920124824924,40.7918430495077,40.7917832502494,40.7911174803343,40.7910142933738,40.7903620629616,40.7904566742225,40.7904686167368,40.7901713199375,40.7900402399343,40.7898039643367,40.7896953338259,40.7894741039087,40.7894250897694,40.7857032696432,40.78575607781,40.7855106715738,40.784782837565,40.7835556934177,40.7833428847743,40.7826606898251,40.7826576439826,40.7825902784521,40.7825230740108,40.7824969150867,40.7824943391266,40.7824559565543,40.7823204906459,40.7822448605036,40.7822225827736,40.7822162939729,40.7822437675957,40.7822483748079,40.7822740488486,40.7822741443989,40.7821765579446,40.7811942691262,40.7810906293243,40.7810506348991,40.781039748349,40.781014785533,40.7809898588352,40.7809203200422,40.7810083534809,40.7814105785422,40.7820773357907,40.782261413049,40.7823965940692,40.7826936396248,40.7830063820289,40.7833944992681,40.783710081035,40.7839423681064,40.7842172156203,40.7845123681536,40.7846753713101,40.7848068799635,40.7852547813041,40.7854460392927,40.7856804894926,40.7887101794855,40.7891782236649,40.7897202906728,40.7896948492349,40.7898339521078,40.790479159258,40.7909914300016,40.7909551144309,40.7913414752266,40.7913661788456,40.791355786453,40.7909435325125,40.7909669243039,40.7908233907805,40.7908108253347,40.7907886935067,40.7907644398684,40.7907345137873,40.7906933758846,40.790694533017,40.7907316071174,40.7908278485147,40.7909365177573,40.7910038085359,40.7910917804053,40.7911771108265,40.7912650821921,40.7913536766938,40.7914126270235,40.7915472095544,40.7916196610713,40.7917153889947,40.7917569084184,40.7917959045645,40.7918270651617,40.7918581347818,40.7918968847633,40.7918785186037,40.7918473254036,40.7918755473895,40.7918572572634,40.791822158203,40.791820830907,40.7918544665083,40.7918959074664,40.7918992232049,40.7919564905445,40.7919463977503,40.7919401906083,40.7919284232944,40.7918326216568,40.7917911349967,40.7917936441892,40.7917728496547,40.7916613888376,40.7915034760539,40.7912472891195,40.7911102344215,40.7910223243008,40.7909795017132,40.7909681592702,40.7909741206745,40.7909889521535,40.7909993820255,40.7909994295056,40.7910150244606,40.7909969334045,40.7909969807409,40.7910073844259,40.7909970688294,40.7909608572457,40.7909609022626,40.7909635238249,40.7909584027292,40.7909416036542,40.7909548381319,40.7909788461784,40.7910098188341,40.7910391465825,40.791091111421,40.7913483340281,40.7914604747392,40.7917431604596,40.7917673270093,40.7917913683781,40.7919293066032,40.7919974792624,40.7921336409069,40.7923285234456,40.7928565492747,40.7929180580741,40.7929796898269,40.7930411109853,40.7931019891402,40.7931611687547,40.7932128750663,40.79446189461,40.7947298332911,40.7947791762289,40.795103604961,40.7951784925291,40.795255659259,40.795334732347,40.795415329778,40.7954970621713,40.7955795346616,40.7956623488063,40.7959838515361,40.7962345242222,40.7962520113602,40.7967084322844,40.7969887959176,40.7972038612356,40.7973498967803,40.7973165807863,40.7972939021205,40.7972170142663,40.7972986633796,40.7973770630779,40.7973468203448,40.7973867477994,40.7974154334978,40.7974074531486,40.797710538216,40.798122899665,40.7989186451221,40.7998375904774,40.7998882368496,40.7999407685033,40.7999875590461,40.8000359005377,40.8001469776551,40.800392957369,40.8005637562296,40.8005430121258,40.8004058536962,40.8001827140358,40.8003151729215,40.8004034989728,40.8004114714819,40.8004073388229,40.8004142109436,40.800333898308,40.800374917307,40.8004547572559,40.8006048255949,40.8007396467128,40.8007655290147,40.8007836767993,40.8006361761043,40.8006517430313,40.8008406483689,40.8006570315246,40.8015517419262,40.8016424897783,40.8017306009963,40.8018108713506,40.8019561686507,40.8019985227434,40.801985553419,40.8018687381411,40.8016264699749,40.8015026662536,40.8008521069996]}],[{"lng":[-73.9338058988187,-73.9338290088461,-73.9339460882535,-73.9339460993372,-73.9339417014619,-73.9339490585752,-73.9339505415139,-73.9339417347039,-73.9339417502117,-73.9339520565795,-73.9339535373093,-73.9339344570958,-73.9339462322761,-73.9339389227626,-73.9339492125554,-73.9339462843471,-73.933956590909,-73.9339485311269,-73.9339485543914,-73.9339485843049,-73.933953020921,-73.9339545215819,-73.9339442637826,-73.9339487028314,-73.9339472531391,-73.9339634453099,-73.9339678830253,-73.9339635051224,-73.9339694135805,-73.9339856595785,-73.9339893693093,-73.9339820368583,-73.9339835275384,-73.9339747351948,-73.933982106614,-73.9339733264724,-73.9339909751146,-73.9339777641613,-73.9339895420226,-73.9339954393642,-73.933980756566,-73.9339822483401,-73.9339852396395,-73.93397645066,-73.9339662095034,-73.9339912197835,-73.9340147672698,-73.9338565263882,-73.933862309728,-73.9338639144928,-73.933865102619,-73.933869278467,-73.9338723254896,-73.9339298460019,-73.9339817898682,-73.9340077020494,-73.9340384391788,-73.9340930669192,-73.9341371141607,-73.9341955874917,-73.934282278014,-73.9343041739804,-73.934314405073,-73.9343408097147,-73.9343386458474,-73.9342139101698,-73.9341963919577,-73.9341353262406,-73.934120734843,-73.9335611931148,-73.9333285236184,-73.9332590953999,-73.9331839563982,-73.9331741353949,-73.9330847174971,-73.9329328832929,-73.9326308826758,-73.9323901711915,-73.9315441743434,-73.9314960425862,-73.9314754959243,-73.931467071884,-73.9314489142783,-73.9314319858802,-73.93140904211,-73.9313909010211,-73.9313051152024,-73.9312694724058,-73.9311594998733,-73.9311268875933,-73.931114089247,-73.9310979084438,-73.9310737538932,-73.9310339009393,-73.9310278774159,-73.9309765453237,-73.9309753529652,-73.9309584321078,-73.9309342915886,-73.9309093651686,-73.9308280132428,-73.9308062811451,-73.9307163031651,-73.9307102870262,-73.9306957752588,-73.9306873327641,-73.9306390281701,-73.9306317956095,-73.9306100410067,-73.9305726120896,-73.9305726375719,-73.9305424330677,-73.93044280213,-73.9304053696452,-73.9303534505283,-73.9303329206556,-73.9303087645877,-73.9302786056748,-73.9302617139496,-73.9301917546035,-73.9301832945256,-73.9300602069385,-73.9300126130297,-73.9299737361859,-73.9299786217695,-73.93004460905,-73.9300093109045,-73.9299828842777,-73.9299100860984,-73.9298894808297,-73.9297866800015,-73.9296925121459,-73.9295769383951,-73.9295204392848,-73.929453663335,-73.9294365411877,-73.9293543599857,-73.9293312697181,-73.9293022039684,-73.9292748768804,-73.9292081759596,-73.9291183881423,-73.9290349024031,-73.9290267140667,-73.9290212358464,-73.9290164464204,-73.929007881206,-73.9289999486633,-73.9289861876299,-73.9289534865756,-73.9289376366859,-73.9289015234417,-73.9289194251578,-73.9289439694696,-73.9289712100229,-73.9290364017963,-73.9290546102875,-73.9292793674117,-73.929307732758,-73.9295305805691,-73.9296829425113,-73.9297459469162,-73.9298748577821,-73.9298424475345,-73.9298514439533,-73.9298095534999,-73.9298325404253,-73.9298874065192,-73.929901397884,-73.929916361206,-73.9299373533455,-73.929920395011,-73.9300688103554,-73.9301077102815,-73.930196643929,-73.9304198047997,-73.9311140804534,-73.9314275855796,-73.9316582110575,-73.931792925203,-73.9318750017174,-73.9320100145719,-73.9320788602176,-73.9323512886908,-73.9325092094968,-73.932538526549,-73.932672391309,-73.9328771265509,-73.9331068320781,-73.9332458739464,-73.9332713202113,-73.9334848964465,-73.9337279050359,-73.933887852657,-73.9340699772657,-73.934272217146,-73.9343403278663,-73.9345104254863,-73.9347388158446,-73.9350540605796,-73.9351076449163,-73.9351718245162,-73.935268097784,-73.9352650078894,-73.9351903929617,-73.9354676208841,-73.9355389669594,-73.9358310678891,-73.9360239182378,-73.9363201087061,-73.9366930221003,-73.9370616874706,-73.9370530457888,-73.937081043823,-73.9370724626218,-73.9370147968674,-73.9361407331412,-73.936128362353,-73.9361268927969,-73.9362185986991,-73.9362275129535,-73.9362430332505,-73.937149654611,-73.937228901673,-73.9373978860931,-73.9374167567744,-73.9375498916258,-73.9376348291229,-73.9376866938538,-73.9376956302226,-73.9377412217619,-73.9377736325512,-73.9378172269291,-73.9379476897699,-73.9379459085127,-73.9379593077519,-73.9379718180139,-73.9381157008973,-73.9381335619299,-73.9381942962532,-73.9382451995141,-73.9385393733166,-73.9392664264451,-73.9398261969646,-73.9398345399792,-73.9398428239091,-73.9398526760338,-73.9398804556066,-73.9398885206175,-73.9399100328247,-73.9399297439946,-73.9399548367934,-73.9399897801899,-73.9400130838673,-73.9400247325254,-73.9400498270758,-73.9400641572908,-73.9401143432387,-73.9401494727626,-73.9401851293105,-73.940202301813,-73.9402247528415,-73.9402379576831,-73.9402670099552,-73.9403620935133,-73.9404532074849,-73.9405337719822,-73.9405509380776,-73.940581302009,-73.9405905496837,-73.9406235705766,-73.9406737440216,-73.9407173267632,-73.9407212836151,-73.9407490172053,-73.9407675082594,-73.940788680061,-73.9408308814259,-73.9410249973189,-73.9410857371065,-73.9411108283886,-73.941137236131,-73.9411728885478,-73.9414461201894,-73.9415257681018,-73.9416745419575,-73.9418544859221,-73.9420143175309,-73.9421791859556,-73.9423138887432,-73.9423912852097,-73.9424345113706,-73.9424697044477,-73.9425722552488,-73.9426044272357,-73.9426737981828,-73.9427813753336,-73.9428678379267,-73.9429352053114,-73.9430166313694,-73.943115162113,-73.943161419105,-73.9432056553694,-73.9432398573975,-73.9432700303567,-73.9433102738203,-73.9433474936639,-73.9433967907729,-73.9434410552642,-73.9435514383947,-73.9435442071252,-73.9435697971989,-73.9436320172783,-73.9437600534063,-73.943832566099,-73.9438932460593,-73.9439546016314,-73.9440543944633,-73.9446466599195,-73.9447226452693,-73.9459218599374,-73.946444972832,-73.9470895191672,-73.9478434603698,-73.9487762622345,-73.9493317062711,-73.9503380413039,-73.9509281278826,-73.9512967085309,-73.9522294753702,-73.9524643016674,-73.9525514546904,-73.9526613672815,-73.9534164669039,-73.953713450606,-73.9541647699251,-73.9557773591232,-73.9552823348086,-73.9551041694841,-73.9548172381665,-73.954399191913,-73.9538948958825,-73.9538891708097,-73.9534368386116,-73.9531604499487,-73.9530982760681,-73.9529774055357,-73.9525222263876,-73.9520712707866,-73.9516026543104,-73.9511110237241,-73.9506288547574,-73.9501582122699,-73.9496868299651,-73.9494228781563,-73.949233270825,-73.9490651785891,-73.9487870281116,-73.9483112545438,-73.9482064153801,-73.9481538432484,-73.9481010902656,-73.9480513020299,-73.9478467911888,-73.9478166305282,-73.9477571646885,-73.9477105597932,-73.9474199623519,-73.9473759984473,-73.9473277151459,-73.9472801829742,-73.9469736680703,-73.9464613385203,-73.9459678974937,-73.945508639182,-73.9450512798452,-73.9447597648013,-73.9445991529627,-73.9447092611273,-73.9456183646418,-73.9461313104867,-73.9456926125162,-73.9452396521392,-73.9447820817178,-73.9443019458712,-73.9437747678022,-73.943157703856,-73.9428555022079,-73.9427536722819,-73.94226311155,-73.9417714017003,-73.9413174236948,-73.940860631756,-73.940403449022,-73.9399487597705,-73.9394939753992,-73.939017533146,-73.9387439450372,-73.9386375332666,-73.9383874852984,-73.9383092504302,-73.9382064268832,-73.9381355240751,-73.937617149518,-73.9371439842421,-73.9370816369499,-73.9366885488281,-73.9362095781427,-73.936135543971,-73.9360507657812,-73.9359937141727,-73.9357554821078,-73.9348734383498,-73.9346379027272,-73.9344540007277,-73.9342351954951,-73.9341281676116,-73.9340746397773,-73.9340091796638,-73.9339200430821,-73.9338001947305,-73.9337933462578,-73.9337899739921,-73.9338058988187],"lat":[40.8165124932471,40.8155853601875,40.8155876247392,40.8155764575647,40.8155652989209,40.8155563695585,40.81554298001,40.8155318089564,40.815516185466,40.8154972182193,40.8154860523891,40.815471534509,40.8154425179763,40.8154157242806,40.8154012232267,40.8153900548706,40.8153722041738,40.8153482020114,40.8153247614981,40.8152946216848,40.8152667268783,40.8152354720267,40.8152053258169,40.8151751979104,40.8151550979958,40.8151294430236,40.8151004229545,40.815069164065,40.8150390271146,40.8149475104223,40.814912357031,40.8148956127812,40.8148743974964,40.8148487282133,40.8148252930784,40.8147873318603,40.8147750681166,40.8147583111192,40.8147382276562,40.8147192578789,40.8147047425219,40.8146824205703,40.814629959141,40.8146009308253,40.8145652112515,40.8145283864341,40.8144837526248,40.8144814744192,40.8142492963205,40.8141927372835,40.8141531579557,40.8141011748166,40.8140632642607,40.8133476906338,40.8128146355453,40.8126084986973,40.812340880071,40.8119684025308,40.8117123709245,40.8113931776929,40.8108230505087,40.8104816661152,40.8103222649113,40.8099275827496,40.8095622138314,40.8090591737927,40.8090318515825,40.8087363905142,40.8086564519774,40.8076006773867,40.807318946463,40.8072372452067,40.8071561977971,40.8071453909499,40.8070269147021,40.8068710221339,40.8065529339069,40.8062991409686,40.8053977833267,40.8053511537067,40.8053280929381,40.805305969303,40.8052976457617,40.8052819578906,40.8052469138115,40.8052330696601,40.8051316064599,40.8050905537125,40.8049669402625,40.8049226779973,40.8049043505129,40.8048811775295,40.8048470510283,40.8047944822144,40.8047824945593,40.804715632512,40.8047054993978,40.8046870452911,40.8046529187679,40.8046193935175,40.8045099668058,40.8044740078063,40.8043554973326,40.804340744668,40.8043259880687,40.8043103127254,40.8042457529605,40.8042300795136,40.8042070156815,40.8041526042161,40.8041433918763,40.8041074183405,40.8039741500994,40.8039206656575,40.8038478047433,40.8038192136144,40.8037860153681,40.8037343792257,40.8037057941369,40.8035831651904,40.8035739472084,40.8033616481605,40.8032874984288,40.8031964679741,40.803190245385,40.8031061117708,40.8030401351573,40.8029847524943,40.80286455125,40.8028303574591,40.8026607487175,40.802440285948,40.8021800252157,40.8020534796156,40.801907368836,40.8018617118574,40.8016712504379,40.8015988539909,40.801495801349,40.8013731902327,40.8011475206113,40.8011130032264,40.8010809038519,40.8009698603143,40.8008955725617,40.8008307155421,40.8007723491254,40.8007100976928,40.8006021231194,40.8003093684847,40.8001708437777,40.7998552146627,40.7994581864915,40.7989115889355,40.7982588610823,40.7967625941013,40.7966944338674,40.7958531395207,40.7958102579556,40.7955077983493,40.7952962337631,40.7952087482341,40.7950351567284,40.7950150378559,40.7950014004286,40.7949831662967,40.7949490611408,40.794967292604,40.7949468243625,40.7949491121371,40.7949187862845,40.7949096723301,40.7947008286055,40.7947129910637,40.7945932243523,40.7944708723486,40.7940965013439,40.7939279883829,40.7938017404392,40.7937279617911,40.7936819218437,40.7936054861699,40.7935665088339,40.7934138451513,40.7933319015446,40.7933166821354,40.7932482327729,40.7931302513679,40.7929953282095,40.7929142960292,40.7928994633517,40.7927741713326,40.7926014783711,40.7924894770171,40.7923582937729,40.7922173157979,40.7921679680546,40.7920512946465,40.7919007687052,40.7916862313585,40.7916488886998,40.7916047395675,40.7915280258004,40.7915257634812,40.7914711601291,40.7912636520575,40.7913186936598,40.7910947048703,40.790829128126,40.7904259576486,40.7899130491591,40.7894135902135,40.7894064167575,40.78936639571,40.7893458423888,40.7893212811849,40.7889490734105,40.7889385300597,40.7889268679854,40.7888004980769,40.7887956129499,40.7887957741521,40.7891684490595,40.7889963080371,40.7886217198435,40.7885797615163,40.7882837445289,40.7880942448148,40.787973560579,40.7879572935205,40.7878539043509,40.7877833580626,40.7876884686809,40.7874772994293,40.7874691587553,40.78745627993,40.7874318733825,40.7871847627564,40.7871657903985,40.7870973302998,40.7870410681081,40.7867107770001,40.7858887530671,40.7852565524155,40.7852539723591,40.785251410364,40.7852439316502,40.7852323755102,40.7852235273471,40.785211966758,40.7852017655313,40.7851895227945,40.7851704777928,40.7851568738064,40.7851534764258,40.7851385142315,40.7851310296201,40.7851038246447,40.7850872553795,40.7850662020607,40.7850591871403,40.785045151291,40.7850371346841,40.7850221014535,40.7849719840823,40.7849228730835,40.7848787716059,40.7848667415936,40.7848537087093,40.7848466891421,40.7848296504117,40.7848035979267,40.7847805410671,40.7847805431024,40.7847675182022,40.7847574951213,40.7847474487887,40.7847274245564,40.7846352224864,40.7846091665167,40.7845971486805,40.7845831140043,40.7845660769625,40.7844314738516,40.7843909009699,40.784313830632,40.7842207466774,40.7841375848975,40.7840513633949,40.7839811657665,40.7839407261827,40.7839178303224,40.7838964609471,40.7838247241554,40.7838018309308,40.7837537431472,40.7836781900966,40.7836186558026,40.7835721060897,40.7835148654585,40.7834461706297,40.7834118304948,40.7833698429877,40.7833278516944,40.7832881546768,40.7832331809464,40.7831820329985,40.7831095028464,40.7830491821281,40.7829035084884,40.7828805238227,40.7829230780709,40.7829623236854,40.7828289317175,40.782859089475,40.7828877273326,40.7829155196513,40.7829643580463,40.7832178738028,40.7832475726415,40.7837527983547,40.7839731785782,40.7842449057949,40.7845637555659,40.7849582359268,40.7851931260554,40.7856171500132,40.7858653801727,40.7860200748652,40.7864115502316,40.7865104314209,40.7865485806622,40.786595020127,40.7869125711392,40.7870375855268,40.7872275635765,40.7879139244711,40.7885844554883,40.7888220717528,40.7892047443701,40.7897749086677,40.7904626909915,40.7904704985544,40.7910851413718,40.7914668813839,40.7915527529126,40.7917196931681,40.7923476222252,40.7929811719834,40.7936078056141,40.7942850353219,40.7949595913764,40.7955877315044,40.7962169853809,40.7966063841608,40.7968719999055,40.7971004941062,40.7974828390052,40.7981292175668,40.7982728510984,40.7983448765784,40.7984171483815,40.7984853598543,40.7987655427009,40.798806862972,40.7988883320409,40.7989521806135,40.7993502952957,40.799410524218,40.7994766714787,40.7995417892866,40.7999617029103,40.8006653058823,40.8013423951725,40.8019702312397,40.8025985987175,40.8030030414928,40.8032250478403,40.8032719273995,40.8036589775521,40.8038773575842,40.8045149486583,40.8051360144618,40.805761256464,40.8063908245811,40.8061705933247,40.8059128052393,40.8057865544534,40.8057440127946,40.8064157377451,40.8070890003497,40.8077133463811,40.8083342675993,40.8089580956456,40.8095814180327,40.8102088095336,40.8108565568745,40.8112308205668,40.8113763885697,40.8117184435789,40.8118254640113,40.811967604798,40.8120656192324,40.8127403643289,40.8134210414446,40.8135061410526,40.8140416302207,40.8146738499206,40.8147881271423,40.8149080151166,40.8149886935705,40.8153255842971,40.8165278475177,40.8169080484752,40.8171885285585,40.8175548812153,40.8177339630165,40.8178265139486,40.8179438380677,40.8181159933882,40.818349758874,40.8177766085798,40.8171513737017,40.8165124932471]}]],[[{"lng":[-73.9012927762711,-73.9016012124739,-73.9016631934329,-73.9018319525609,-73.9021074330696,-73.9025785907422,-73.9030098321429,-73.9030644378354,-73.9034699718379,-73.9038041229161,-73.9041833769559,-73.9044655147674,-73.9041803643575,-73.9034172037365,-73.9032427350223,-73.9030894659654,-73.903075683378,-73.9030296770311,-73.903020180606,-73.9030087791717,-73.9029976700565,-73.9029879543749,-73.9029392917129,-73.9028803445172,-73.9022462046635,-73.9022228476561,-73.9022341089328,-73.9022392341545,-73.9022382244946,-73.9022299342292,-73.9022117865037,-73.9022045520365,-73.9021918570056,-73.9021937275346,-73.9022265330585,-73.9022557275125,-73.9023195673461,-73.9023169760326,-73.9023032033442,-73.9022904880229,-73.9022923199277,-73.9024453913696,-73.9025229838462,-73.9027559359522,-73.9029277033109,-73.9028776056683,-73.9027127821122,-73.9027097310255,-73.9029046938851,-73.9030596673371,-73.9029731194502,-73.9030028317108,-73.9030860984648,-73.9032126892875,-73.9032556388145,-73.9033386519545,-73.9033172735504,-73.9033387705515,-73.9033563378776,-73.9033990155695,-73.9035515843465,-73.9035658381192,-73.9036355537641,-73.9036826593201,-73.9037328451555,-73.9037420133561,-73.9036653925337,-73.9036899794644,-73.9037659945388,-73.9037717752447,-73.9037994505479,-73.9038220037218,-73.9038599171088,-73.9038926971336,-73.9039273277045,-73.9038508436899,-73.9038723608316,-73.903948424406,-73.9039674817378,-73.904002323964,-73.9040705530348,-73.904016809718,-73.9040977498001,-73.9041489890094,-73.904378656104,-73.9044588404635,-73.9044808862398,-73.9044998381816,-73.9045295409573,-73.9045500408996,-73.9045756670949,-73.9046248768796,-73.9046720382826,-73.9047693111723,-73.9047986455895,-73.9048521129967,-73.9049535897656,-73.9050009800524,-73.9050301424152,-73.9050449870867,-73.9050575284657,-73.9050666697697,-73.905084916864,-73.9051140880859,-73.9051578087387,-73.9051869582197,-73.9052452798711,-73.9053123397463,-73.9053910705998,-73.9054384459595,-73.9054639558901,-73.9054912854607,-73.9055058837329,-73.9055215317456,-73.905760515838,-73.906014278218,-73.9060633650224,-73.9062038675775,-73.9065204221317,-73.9063897688755,-73.9064517112552,-73.9065858783388,-73.9067289367694,-73.9068140168889,-73.9067500914721,-73.9067013004487,-73.9067685009218,-73.9067687302411,-73.907178727963,-73.9072629877427,-73.907342721018,-73.9073937417649,-73.9074338420675,-73.907452628743,-73.907470305029,-73.90749762914,-73.9075265803846,-73.9075395149187,-73.9075704598699,-73.9076086725146,-73.9076305269052,-73.9076414651683,-73.9076433135435,-73.9077580810817,-73.9079001980398,-73.9079366355669,-73.907958477433,-73.907991215599,-73.9080203235559,-73.908073973218,-73.9080277046477,-73.907951305919,-73.9078712757074,-73.9077930755954,-73.9077348873292,-73.9076585299467,-73.9076822280089,-73.9077895070678,-73.9078495142615,-73.9079331778411,-73.9079950174484,-73.9080514070637,-73.9081020996817,-73.9081679482041,-73.9081315246987,-73.9079607647614,-73.9080263327671,-73.9081681408637,-73.9082517706627,-73.9083208691768,-73.9084219076801,-73.9084755612857,-73.9085502667626,-73.908488461634,-73.9083775607034,-73.9082903119433,-73.9082557956647,-73.9082551373358,-73.9082431077393,-73.908241332662,-73.9083030360829,-73.9091565966024,-73.9096390002743,-73.9096733476855,-73.9096745559145,-73.909740778549,-73.9097938851773,-73.9098460776918,-73.9099108288177,-73.9099464428086,-73.909965891454,-73.9100436925218,-73.9101343870527,-73.9103254478974,-73.9104679045932,-73.9106070955225,-73.9107139207357,-73.9107916849905,-73.9108922226534,-73.9109050128445,-73.9109567966998,-73.9109859346481,-73.9110506933465,-73.9110982748191,-73.9112675550274,-73.9114164396819,-73.9114941337445,-73.9116228586628,-73.9116883117506,-73.9117465332404,-73.9117885727928,-73.9118209199051,-73.9118856123664,-73.9119599884195,-73.9120343822892,-73.9120861291178,-73.912147005357,-73.9121540245585,-73.9122380852687,-73.9123448190134,-73.9126682602597,-73.9130078609773,-73.9131760491004,-73.9134477454447,-73.9137225597358,-73.9151276744479,-73.9161694719892,-73.9188039407059,-73.9188909266373,-73.9189558170617,-73.9190497876381,-73.9191238027018,-73.9202406815888,-73.9204406698039,-73.9207813392432,-73.9209564533052,-73.9213273077851,-73.9216882697391,-73.9220376596916,-73.9225961100029,-73.9229271006578,-73.9235869911203,-73.9242270684122,-73.9266579478849,-73.9270035946511,-73.9276278865885,-73.9275083495037,-73.927312484243,-73.9274368990251,-73.927282719436,-73.9276450035258,-73.9279317402624,-73.9281095963548,-73.9282059174836,-73.9283405618559,-73.9287260748988,-73.9300545889053,-73.9303195005869,-73.9305364505973,-73.9305175883918,-73.931162681293,-73.9317647687617,-73.9318105081344,-73.9318456449309,-73.9318871009773,-73.9319195675757,-73.9322826191665,-73.9325270878598,-73.9326425718146,-73.9326209528879,-73.9325943464726,-73.932822887607,-73.9328325056735,-73.9328639708333,-73.9328741200196,-73.9327868808537,-73.9326908976692,-73.9326792189946,-73.9325650330207,-73.9326168465716,-73.9326322925525,-73.9324770179711,-73.9324311938161,-73.932428399467,-73.9324263200191,-73.9324230759501,-73.9324176727652,-73.9323756888468,-73.9323424553048,-73.9323324171359,-73.9323656418263,-73.9323620926577,-73.9323406284524,-73.9323358226825,-73.9323874504284,-73.93238847622,-73.9323897132503,-73.9323304638715,-73.9321924713324,-73.9307636038365,-73.9307322542105,-73.9306973149717,-73.9306150566943,-73.9305914070116,-73.9305760349493,-73.9303150503051,-73.9300999320037,-73.9293756528765,-73.9292199763873,-73.9282765761432,-73.9280668415937,-73.9278148123178,-73.9274011385047,-73.9273165306651,-73.9272466274104,-73.9263585911154,-73.9258207067006,-73.9253853849738,-73.9251848646356,-73.9245472607947,-73.9240255724197,-73.9226526117355,-73.9219476414545,-73.9211440903874,-73.9206653919851,-73.9205434700688,-73.9204860327717,-73.9204016380274,-73.919934717123,-73.9198042462086,-73.9194430353526,-73.9193804172549,-73.9189459722908,-73.9188883685595,-73.918755706085,-73.918338258972,-73.9178827209934,-73.9178215165969,-73.9175659944301,-73.9162158862712,-73.9145055369864,-73.9128763339277,-73.9118915498783,-73.9118161575674,-73.9118078064213,-73.9117993600899,-73.9117908307274,-73.9117822077248,-73.91177350082,-73.9117646991739,-73.9117558270768,-73.9117468595878,-73.9117378214179,-73.9117287002149,-73.9117194968646,-73.9117102336493,-73.9117008880756,-73.911691470939,-73.9116819826793,-73.9116724358909,-73.9116628175499,-73.9116531402278,-73.9116434043647,-73.911633619664,-73.9116237656292,-73.9116138638591,-73.9116039148068,-73.9115939180187,-73.9115838737285,-73.9115737832594,-73.9115636567549,-73.9115534827494,-73.9115432850569,-73.9115330519899,-73.9115227837712,-73.911512492529,-73.9115021652516,-73.9114918251073,-73.9114814634685,-73.9114710772767,-73.9114606790861,-73.9114502702216,-73.9114398599554,-73.9114294273284,-73.9114189941708,-73.9114085611454,-73.9113981174453,-73.9113876846948,-73.9113772644132,-73.9113668319261,-73.9113564227262,-73.9110729859053,-73.9106999884419,-73.90990894138,-73.9094576088314,-73.9084185418301,-73.9074268174018,-73.9064572221044,-73.9056589031397,-73.9055246630307,-73.9054559226368,-73.9053277028843,-73.9052502263246,-73.9048965315111,-73.9047810379607,-73.9037931018158,-73.9028870209578,-73.9026681924117,-73.9012927762711],"lat":[40.8204754421116,40.819694858758,40.8195504268544,40.8191533645607,40.8185051921006,40.8173697944309,40.8163177924573,40.816106761023,40.8150757884839,40.8141318427975,40.8130864554802,40.8122819599137,40.8121248200648,40.8115068828557,40.8107128845324,40.8098563992003,40.809768986807,40.8097021211851,40.8096234285296,40.8095500727788,40.80945558286,40.8093643005338,40.8090627010545,40.8087447930574,40.8050715024554,40.8049481131901,40.804938797305,40.8049341350803,40.804924022594,40.8049159356741,40.8048827349566,40.8048523089941,40.8048232606454,40.804788693487,40.8047541530724,40.8047002522614,40.8045979845592,40.8045964491763,40.8045882917783,40.8045730707532,40.8045647761417,40.8044169540545,40.804463788098,40.8043285348216,40.8041972917092,40.8041575821462,40.8041768879394,40.8041636634672,40.8041390539352,40.8040174348504,40.803936771871,40.8039173527701,40.8039970878969,40.8038996395141,40.8039276761699,40.8038554124353,40.8037752824546,40.8037737441762,40.8038611236107,40.8038749071398,40.8038353681898,40.8038310231285,40.8038097707597,40.803795033096,40.8037732961173,40.8037678087909,40.803702462032,40.8036877050422,40.8037534546791,40.8037499957611,40.8037227960732,40.8036987035442,40.8036699572498,40.8036520961131,40.8036343907996,40.8035742827785,40.8035587447012,40.8036213099473,40.803607824495,40.8035790755951,40.8035209771482,40.8034709761689,40.8034165986282,40.8034556525874,40.8032745980212,40.8032113858458,40.8031916953188,40.8031834334504,40.8031702356519,40.8031500300326,40.8031236074502,40.803069203267,40.8030147966983,40.8029128418939,40.8028862439104,40.8028352289894,40.8027246134459,40.802667961258,40.8026347999513,40.8026003333846,40.8025712166684,40.8025408043612,40.8025048678798,40.8024647936445,40.8024302608664,40.8024053961776,40.8023404562078,40.802274729988,40.8021857100948,40.8021401195458,40.8021152512978,40.8020903845359,40.8020613589133,40.802019954898,40.8017998817657,40.8015529310959,40.8015833914496,40.8014929929967,40.8011755105198,40.8010907916864,40.8010369152017,40.801107478446,40.8009699675517,40.8008906396062,40.8008505945225,40.8008200298263,40.8007467104632,40.8007454173563,40.8003226335583,40.8002374484449,40.8001568384219,40.8001043353956,40.8000545897492,40.800028244451,40.8000034579154,40.799981356168,40.7999632196943,40.7999551178426,40.7999468458199,40.7999454942058,40.7999316848823,40.7999164828855,40.7998957441096,40.799799044286,40.7996608856868,40.7996277292762,40.7996222155475,40.7996319212747,40.7996360929249,40.7995728191678,40.7995614306028,40.7995447777828,40.799522589666,40.799493489538,40.7994657893,40.7994200982146,40.7993883139253,40.799442326073,40.7994700282402,40.7994963676946,40.7995143923282,40.7995268819128,40.7995396463598,40.7994619861943,40.7994313007765,40.7992834492679,40.7992378721622,40.7993223306842,40.7993721763115,40.7994054166404,40.799442092445,40.7993834153871,40.799307425389,40.7992645113959,40.7991980524277,40.7991329950906,40.7990928681811,40.799091000089,40.7990569070593,40.7990251030438,40.7989591354181,40.7983094279216,40.7979422258008,40.7979612495516,40.7979619190906,40.797912143674,40.7978684952333,40.7979005983375,40.7978588605259,40.7978343059063,40.7978048229648,40.7976795165519,40.7975886346284,40.7974290017745,40.797330785393,40.7972571474122,40.7971957756733,40.7970975092623,40.7970177950363,40.7970115600936,40.7969894759185,40.7969698329986,40.7969207199294,40.7968880708335,40.7968151848257,40.7967464708541,40.796699824564,40.7966410784967,40.7966237698883,40.796626273245,40.7966336793734,40.7966337041236,40.7966337535956,40.7966485594975,40.79665107506,40.7966560308957,40.7966781180732,40.7966806644422,40.7967102261117,40.7967176824488,40.79673513462,40.7967624319657,40.7967723914884,40.7967824285354,40.7967894387587,40.7973629485082,40.7978307189274,40.7988797297223,40.798915894597,40.7989469172748,40.798993935687,40.7990324550523,40.7996136878703,40.7998041564907,40.800275009952,40.8005988142252,40.8012845916315,40.8015857238042,40.8018771975727,40.8021882013318,40.8023732946429,40.8025157253244,40.8025450108556,40.8024098039147,40.8025119504399,40.8026956654816,40.8029332337116,40.8032117709833,40.8032774416938,40.8035082644171,40.8039886328461,40.8039994625138,40.8040129343378,40.8040480802543,40.8042398902814,40.8041036247247,40.8059023473232,40.8061901456991,40.806470276943,40.8065905635668,40.8071282957769,40.8077696934736,40.8078184179509,40.8078558449789,40.8078940243973,40.8079371336018,40.8083639736226,40.8088232817754,40.8093828645268,40.8097707417739,40.8100535573694,40.8101136173336,40.8101161525591,40.810124436886,40.810414043429,40.8104944601992,40.8105829330816,40.8107991351871,40.8108859751897,40.8114674958908,40.8119046217607,40.813423607835,40.8140168333874,40.8140606863159,40.8141175189592,40.8141517151757,40.8142087061908,40.8146515748029,40.8146856842332,40.814964274079,40.8150329648747,40.8153421183282,40.8172118198021,40.8176304043794,40.8194243871483,40.8194600278876,40.8195028473368,40.8194966721425,40.8194849814707,40.8193639086563,40.8193608031914,40.8193573402414,40.8193532472364,40.8193514280953,40.8193505317995,40.8193168805521,40.819274349927,40.819097069017,40.8190588823702,40.8188100423438,40.8187556145247,40.8186902111291,40.8185828574234,40.8185596343246,40.8185429852211,40.8183206920482,40.8181803374006,40.8180654145411,40.818012668875,40.8187126230078,40.8192853301108,40.8204943152806,40.8210315449594,40.8215630020621,40.8218368930876,40.8219338574816,40.8219795361112,40.8220612166807,40.8223522024408,40.8224369745602,40.8226716673988,40.8227123524777,40.822992672881,40.8230297738504,40.8231152185245,40.8233833871732,40.8236787768469,40.82371837133,40.8238836724325,40.8234679302259,40.822941856759,40.8224413483939,40.8221414817778,40.8220350224125,40.8220397698634,40.8220444552569,40.822049059337,40.8220536001881,40.8220580515164,40.8220624384421,40.8220667365254,40.822070961997,40.8220751056619,40.8220791696885,40.8220831512295,40.8220870432659,40.8220908457806,40.8220945664878,40.822098206393,40.8221017469107,40.8221051979148,40.8221085582422,40.8221118285635,40.8221150087183,40.8221180894773,40.8221210802383,40.8221239721229,40.822126774512,40.8221294775219,40.8221320811535,40.8221345859173,40.8221369906318,40.8221392971579,40.8221415054868,40.8221436137757,40.8221456227042,40.8221475327647,40.8221493340911,40.8221510471148,40.8221526502227,40.8221541551513,40.8221555607288,40.8221568592562,40.8221580577535,40.8221591575776,40.8221601578914,40.8221610595243,40.8221618529439,40.8221625564116,40.8221631516483,40.8221636475599,40.822242942732,40.8223241138459,40.8225511076148,40.8224324023704,40.8221812706534,40.821945061995,40.8217153645337,40.821556532635,40.8215238132751,40.8215070586095,40.8214758057734,40.8214569216134,40.8213707103807,40.8213414452237,40.8210911006587,40.8208591742366,40.8208031593847,40.8204754421116]}]],[[{"lng":[-73.8807208158036,-73.880742078211,-73.8810388009345,-73.8812102103995,-73.8813335607295,-73.8815321581044,-73.8816551223218,-73.8818025299803,-73.8818171701888,-73.8819358895712,-73.8819990936337,-73.8820129137923,-73.8820240958018,-73.8830124553659,-73.8832246055431,-73.8835825579804,-73.8838089879107,-73.883999123243,-73.8840194346347,-73.8842706020193,-73.8845210008481,-73.8851241284434,-73.8851587849656,-73.8852036424639,-73.8852058424259,-73.8852086796872,-73.8852092884129,-73.8852099719983,-73.8852100300607,-73.8852107117646,-73.8852123256275,-73.88521355038,-73.8852147649757,-73.8852165959349,-73.8852190454723,-73.8852208952329,-73.8852230297459,-73.8852251664197,-73.8852282126335,-73.8852326819139,-73.8852419928355,-73.8852752842485,-73.8852801048696,-73.8853367000831,-73.8853368300031,-73.8853473929309,-73.8854678426463,-73.8855923603726,-73.8856280064155,-73.8857319592302,-73.8857804210568,-73.8857942629586,-73.8858721579579,-73.8859499963777,-73.8860962416716,-73.8863995722807,-73.8878951090142,-73.8888504620368,-73.8896389531624,-73.8896900496137,-73.8898056417241,-73.8898359917002,-73.8899794248792,-73.8909056006279,-73.8919127185849,-73.8929322610114,-73.8938545418665,-73.8951102086074,-73.8952915650016,-73.8954852276459,-73.89639572974,-73.8975695875859,-73.8979449776934,-73.8982046932798,-73.8984522996302,-73.8984743243382,-73.8986541737904,-73.8986771004262,-73.8988361737786,-73.8988623061277,-73.8989955585362,-73.8991214503617,-73.899799199741,-73.9000382996104,-73.9001666938695,-73.9002097407531,-73.9006114108083,-73.9008456123222,-73.9012927762711,-73.9026681924117,-73.9028870209578,-73.9037931018158,-73.9047810379607,-73.9048965315111,-73.9052502263246,-73.9053277028843,-73.9054559226368,-73.9055246630307,-73.9056589031397,-73.9064572221044,-73.9074268174018,-73.9084185418301,-73.9094576088314,-73.90990894138,-73.9106999884419,-73.9110729859053,-73.9113564227262,-73.9113668319261,-73.9113772644132,-73.9113876846948,-73.9113981174453,-73.9114085611454,-73.9114189941708,-73.9114294273284,-73.9114398599554,-73.9114502702216,-73.9114606790861,-73.9114710772767,-73.9114814634685,-73.9114918251073,-73.9115021652516,-73.911512492529,-73.9115227837712,-73.9115330519899,-73.9115432850569,-73.9115534827494,-73.9115636567549,-73.9115737832594,-73.9115838737285,-73.9115939180187,-73.9116039148068,-73.9116138638591,-73.9116237656292,-73.911633619664,-73.9116434043647,-73.9116531402278,-73.9116628175499,-73.9116724358909,-73.9116819826793,-73.911691470939,-73.9117008880756,-73.9117102336493,-73.9117194968646,-73.9117287002149,-73.9117378214179,-73.9117468595878,-73.9117558270768,-73.9117646991739,-73.91177350082,-73.9117822077248,-73.9117908307274,-73.9117993600899,-73.9118078064213,-73.9118161575674,-73.9118915498783,-73.9128763339277,-73.9145055369864,-73.9162158862712,-73.9175659944301,-73.9174677276598,-73.9174045904965,-73.917317823921,-73.9172501029689,-73.9171900744019,-73.9171269375669,-73.9168919579492,-73.9167740058587,-73.916087828579,-73.9161528164556,-73.9163091751571,-73.9165696902129,-73.9166136844246,-73.9164245189577,-73.9163666165908,-73.9163038794069,-73.9162474812951,-73.9161877845351,-73.9161301185075,-73.9159228498893,-73.9154506149717,-73.9154110823548,-73.9146105170494,-73.91363149059,-73.9121698257826,-73.9116595096252,-73.9115237026997,-73.9113891821466,-73.9104901068159,-73.9096213067709,-73.9095189573599,-73.9094603951056,-73.9094225763066,-73.9093741529989,-73.9092835491321,-73.9092368150935,-73.9091777810132,-73.9091059782658,-73.9088980411655,-73.9088257599825,-73.9086913122939,-73.9085754804493,-73.9085215170721,-73.9083765599517,-73.9082398017556,-73.9081087020974,-73.9079713522339,-73.907832931392,-73.9077182166099,-73.9076266601747,-73.9075726938384,-73.9074020053082,-73.9073330702898,-73.9072711255385,-73.9072129415771,-73.9071395446096,-73.9069755048822,-73.9068849720798,-73.9067985483355,-73.906681464221,-73.9065235399408,-73.9064616962426,-73.9063567469709,-73.9062547533835,-73.905979404418,-73.905383580735,-73.904865655025,-73.9047651767355,-73.9041548191641,-73.9035755553362,-73.9029161550487,-73.9027845818396,-73.9027129170968,-73.9026881011636,-73.9013440457415,-73.9011633011518,-73.9009399949242,-73.9009631996938,-73.9010403297361,-73.9015115199571,-73.9003333035012,-73.8997327331982,-73.8996551031458,-73.8996374955661,-73.8985614225852,-73.8975178693376,-73.896587201409,-73.8955571806114,-73.8952735691077,-73.8948194262753,-73.8948475875661,-73.8953783618073,-73.8952778489266,-73.8950980727422,-73.8950141578443,-73.8949357995068,-73.8948486279507,-73.8941015052218,-73.8931709893529,-73.8921681562123,-73.8901746864267,-73.889417248692,-73.8886904083088,-73.8881375215934,-73.8875425178058,-73.8865980234512,-73.8861843210051,-73.8861197232776,-73.8861097884652,-73.8857468591637,-73.885109971338,-73.8841272455011,-73.8835182040595,-73.8831387395403,-73.882747698579,-73.8823302550307,-73.8821241001081,-73.8817724951235,-73.8816967494198,-73.881642909245,-73.8807657491459,-73.8807208158036],"lat":[40.837521265023,40.8374864279544,40.8370624578241,40.836784354721,40.8365670213302,40.8361867753265,40.8359463439712,40.8356742925784,40.8356437967682,40.8354621249856,40.8353944221834,40.8353637032037,40.8353357992776,40.8340534602036,40.8337997594966,40.8333782763501,40.8331150395822,40.8329057427893,40.8328814511171,40.8325963606578,40.832254826651,40.831161082577,40.8310729617076,40.8309693675631,40.8309642904212,40.8309577376909,40.8309563331044,40.8309547473312,40.8309545865659,40.8309528129963,40.8309485531237,40.8309453469256,40.8309421472509,40.8309373342621,40.8309309026006,40.8309260578009,40.8309204354699,40.8309148389398,40.8309068262766,40.8308950733779,40.8308706311554,40.8307831605576,40.8307705028734,40.8305986571073,40.8305982647274,40.8305648576803,40.8301119039421,40.8290700377422,40.8288509914984,40.8282121805301,40.8279143713239,40.8278235750115,40.8277773147601,40.8277336349429,40.827655777358,40.8275033797394,40.8267431852966,40.8267685952441,40.8267975100074,40.8267993835699,40.826803621043,40.8268047342572,40.8268099922383,40.8267877841199,40.8267944502507,40.8267870360298,40.8273400367457,40.828036899455,40.8281423498679,40.828248541385,40.8287628795207,40.8294230008309,40.8285217482647,40.8278891099849,40.8272887612399,40.827235359173,40.8267992863288,40.8267436963077,40.8263579934982,40.8262974361398,40.8259886509688,40.8256969191896,40.8240579415116,40.823481696233,40.8231741321428,40.823071014629,40.8221088079296,40.8215414176145,40.8204754421116,40.8208031593847,40.8208591742366,40.8210911006587,40.8213414452237,40.8213707103807,40.8214569216134,40.8214758057734,40.8215070586095,40.8215238132751,40.821556532635,40.8217153645337,40.821945061995,40.8221812706534,40.8224324023704,40.8225511076148,40.8223241138459,40.822242942732,40.8221636475599,40.8221631516483,40.8221625564116,40.8221618529439,40.8221610595243,40.8221601578914,40.8221591575776,40.8221580577535,40.8221568592562,40.8221555607288,40.8221541551513,40.8221526502227,40.8221510471148,40.8221493340911,40.8221475327647,40.8221456227042,40.8221436137757,40.8221415054868,40.8221392971579,40.8221369906318,40.8221345859173,40.8221320811535,40.8221294775219,40.822126774512,40.8221239721229,40.8221210802383,40.8221180894773,40.8221150087183,40.8221118285635,40.8221085582422,40.8221051979148,40.8221017469107,40.822098206393,40.8220945664878,40.8220908457806,40.8220870432659,40.8220831512295,40.8220791696885,40.8220751056619,40.822070961997,40.8220667365254,40.8220624384421,40.8220580515164,40.8220536001881,40.822049059337,40.8220444552569,40.8220397698634,40.8220350224125,40.8221414817778,40.8224413483939,40.822941856759,40.8234679302259,40.8238836724325,40.8239461069527,40.8239862220029,40.8240413500195,40.824084377625,40.8241225173314,40.8241626310562,40.8243119255752,40.8243870873737,40.8248378518314,40.8248569409132,40.824902866513,40.824979385864,40.8249923080049,40.8251149132185,40.825152440893,40.8251931022554,40.8252296554679,40.8252683467122,40.8253057213218,40.8254400559875,40.8257477793764,40.8257739091232,40.8262945078545,40.8269243691411,40.8279022214857,40.8287489996408,40.8289597824482,40.8291381845012,40.8307373730328,40.8322814222731,40.8324637770399,40.8325681158095,40.8326354962769,40.8327217713076,40.8328831962541,40.8329664604707,40.8330716391853,40.8331995664458,40.833570034682,40.8336988117321,40.8339383467746,40.8341444417013,40.8342404561624,40.8344983710865,40.8347416936322,40.8349749496441,40.8352193227624,40.8354655995994,40.8356696962831,40.8358325897843,40.8359286037738,40.8362322834186,40.8363424266365,40.8364413994077,40.8365343644113,40.8366516345745,40.8369137289169,40.837058376254,40.8371955162379,40.8373835254483,40.8376358430157,40.8377346502358,40.8379023261805,40.8380652802542,40.8385051953,40.8397689839726,40.8406968315902,40.8408768290624,40.8419702523602,40.8430040671536,40.8441813317002,40.8444157458766,40.8445427895467,40.8445814722859,40.8444287507698,40.8444098469549,40.8443849826749,40.8443458394087,40.8442060775786,40.8433679689654,40.8429893800162,40.8440558179051,40.8441948406573,40.8442338255314,40.8441158739513,40.8439972480106,40.8438870555599,40.8437650891061,40.8437338283405,40.8436837709689,40.8436463632951,40.8429387789566,40.8428798609365,40.8427744807562,40.8427252911291,40.842679358976,40.8426282603431,40.842190302897,40.841637343677,40.8410496397396,40.8398736671137,40.8394227333803,40.839158026468,40.8398620023848,40.8396406584809,40.8392790501085,40.8401050444709,40.8404235214813,40.8404709946356,40.8402602436551,40.8399046391549,40.8393559193069,40.8390223663263,40.8388106720048,40.8385923412635,40.8383547669226,40.8382351240816,40.8380310725181,40.8379871134609,40.8379596836389,40.8375429859006,40.837521265023]}]],[[{"lng":[-73.9026881011636,-73.9027129170968,-73.9027845818396,-73.9029161550487,-73.9035755553362,-73.9041548191641,-73.9047651767355,-73.904865655025,-73.905383580735,-73.905979404418,-73.9062547533835,-73.9063567469709,-73.9064616962426,-73.9065235399408,-73.906681464221,-73.9067985483355,-73.9068849720798,-73.9069755048822,-73.9071395446096,-73.9072129415771,-73.9072711255385,-73.9073330702898,-73.9074020053082,-73.9075726938384,-73.9076266601747,-73.9077182166099,-73.907832931392,-73.9079713522339,-73.9081087020974,-73.9082398017556,-73.9083765599517,-73.9085215170721,-73.9085754804493,-73.9086913122939,-73.9088257599825,-73.9088980411655,-73.9091059782658,-73.9091777810132,-73.9092368150935,-73.9092835491321,-73.9093741529989,-73.9094225763066,-73.9094603951056,-73.9095189573599,-73.9096213067709,-73.9104901068159,-73.9113891821466,-73.9115237026997,-73.9116595096252,-73.9121698257826,-73.91363149059,-73.9146105170494,-73.9154110823548,-73.9154506149717,-73.9159228498893,-73.9161301185075,-73.9161877845351,-73.9162474812951,-73.9163038794069,-73.9163666165908,-73.9164245189577,-73.9166136844246,-73.9165696902129,-73.9163091751571,-73.9161528164556,-73.916087828579,-73.9167740058587,-73.9168919579492,-73.9171269375669,-73.9171900744019,-73.9172501029689,-73.917317823921,-73.9174045904965,-73.9174677276598,-73.9175659944301,-73.9178215165969,-73.9178827209934,-73.918338258972,-73.918755706085,-73.9188883685595,-73.9189459722908,-73.9193804172549,-73.9194430353526,-73.9198042462086,-73.919934717123,-73.9204016380274,-73.9204860327717,-73.9205434700688,-73.9206653919851,-73.9211440903874,-73.9219476414545,-73.9226526117355,-73.9240255724197,-73.9245472607947,-73.9251848646356,-73.9253853849738,-73.9258207067006,-73.9263585911154,-73.9272466274104,-73.9273165306651,-73.9274011385047,-73.9278148123178,-73.9280668415937,-73.9282765761432,-73.9292199763873,-73.9293756528765,-73.9300999320037,-73.9303150503051,-73.9305760349493,-73.9305914070116,-73.9306150566943,-73.9306973149717,-73.9307322542105,-73.9307636038365,-73.9321924713324,-73.9323304638715,-73.9323897132503,-73.9323818170235,-73.9323749850426,-73.9324287473732,-73.9324592388034,-73.9323998255854,-73.9324247024759,-73.9324660358504,-73.9325118088919,-73.9324647565508,-73.9324987323838,-73.9325488357831,-73.9325786278701,-73.9325395002976,-73.9325736045052,-73.9326113906863,-73.9326686762827,-73.9326226467974,-73.9326600360099,-73.9327050562735,-73.9327284196167,-73.9327305415562,-73.932738439751,-73.9327469384184,-73.9327576166252,-73.9327659458116,-73.9327743340497,-73.9329594037364,-73.9329827513579,-73.9330076056631,-73.9330588174996,-73.9330725113432,-73.9330854034834,-73.9333256283996,-73.9334193672127,-73.9334755690621,-73.9335460674699,-73.9336059203671,-73.9335704473617,-73.9335639574196,-73.9335639085739,-73.9335380799096,-73.9335135809268,-73.9334867112086,-73.9334691837515,-73.9334610566967,-73.9334623570314,-73.9331993138177,-73.9331763370732,-73.9331430670921,-73.9329963900161,-73.9326562035398,-73.9323556421868,-73.9318666017283,-73.9315039543422,-73.9309581983301,-73.9308641441779,-73.9308146852843,-73.9307694505562,-73.930750079599,-73.9307157038901,-73.9306598019076,-73.9305909473463,-73.9305544179342,-73.9305157238608,-73.9305070562786,-73.9304318403857,-73.9304832452105,-73.93039907688,-73.9303668615928,-73.9298571474441,-73.9295893950809,-73.9295787088452,-73.9293801258821,-73.9291940800724,-73.929184586731,-73.9286157482235,-73.9282745470679,-73.9281192534924,-73.9280820937369,-73.9280474840184,-73.9278686981082,-73.9276707334657,-73.9276342472698,-73.9275920975169,-73.9275482844688,-73.9274601310171,-73.927421415361,-73.9273912595109,-73.9273675706093,-73.9273418451992,-73.9273019449863,-73.9271498069637,-73.9268051593282,-73.9264974755206,-73.926377829331,-73.9262244385218,-73.9261562785059,-73.9260920720706,-73.9258911698099,-73.9255378459996,-73.9246844846605,-73.924549099801,-73.9244534627579,-73.9242740136647,-73.9236095515337,-73.9235400201159,-73.9227346100817,-73.9226280853113,-73.9224698366015,-73.9215071460599,-73.9204329802783,-73.9193488243451,-73.9187717919945,-73.9183870599972,-73.9172871941725,-73.9169715243762,-73.9155882282611,-73.914774366957,-73.9141607633373,-73.9137952351787,-73.9135182652173,-73.9133829397145,-73.9132497070102,-73.9125840554476,-73.9119467035972,-73.9114163658133,-73.9112809741578,-73.9110409640953,-73.9108057940986,-73.910254353069,-73.9093592484465,-73.9084507328043,-73.9075448891075,-73.9066467555957,-73.9061182471481,-73.9055058276064,-73.9048312203632,-73.9041010735872,-73.9033865124588,-73.9026881011636],"lat":[40.8445814722859,40.8445427895467,40.8444157458766,40.8441813317002,40.8430040671536,40.8419702523602,40.8408768290624,40.8406968315902,40.8397689839726,40.8385051953,40.8380652802542,40.8379023261805,40.8377346502358,40.8376358430157,40.8373835254483,40.8371955162379,40.837058376254,40.8369137289169,40.8366516345745,40.8365343644113,40.8364413994077,40.8363424266365,40.8362322834186,40.8359286037738,40.8358325897843,40.8356696962831,40.8354655995994,40.8352193227624,40.8349749496441,40.8347416936322,40.8344983710865,40.8342404561624,40.8341444417013,40.8339383467746,40.8336988117321,40.833570034682,40.8331995664458,40.8330716391853,40.8329664604707,40.8328831962541,40.8327217713076,40.8326354962769,40.8325681158095,40.8324637770399,40.8322814222731,40.8307373730328,40.8291381845012,40.8289597824482,40.8287489996408,40.8279022214857,40.8269243691411,40.8262945078545,40.8257739091232,40.8257477793764,40.8254400559875,40.8253057213218,40.8252683467122,40.8252296554679,40.8251931022554,40.825152440893,40.8251149132185,40.8249923080049,40.824979385864,40.824902866513,40.8248569409132,40.8248378518314,40.8243870873737,40.8243119255752,40.8241626310562,40.8241225173314,40.824084377625,40.8240413500195,40.8239862220029,40.8239461069527,40.8238836724325,40.82371837133,40.8236787768469,40.8233833871732,40.8231152185245,40.8230297738504,40.822992672881,40.8227123524777,40.8226716673988,40.8224369745602,40.8223522024408,40.8220612166807,40.8219795361112,40.8219338574816,40.8218368930876,40.8215630020621,40.8210315449594,40.8204943152806,40.8192853301108,40.8187126230078,40.818012668875,40.8180654145411,40.8181803374006,40.8183206920482,40.8185429852211,40.8185596343246,40.8185828574234,40.8186902111291,40.8187556145247,40.8188100423438,40.8190588823702,40.819097069017,40.819274349927,40.8193168805521,40.8193505317995,40.8193514280953,40.8193532472364,40.8193573402414,40.8193608031914,40.8193639086563,40.8194849814707,40.8194966721425,40.8195028473368,40.8195531968433,40.8195906966822,40.8204471402953,40.8211206121411,40.8211455669272,40.8215741230965,40.8215774349762,40.8221388159179,40.8221546018248,40.8225834646109,40.8225992167529,40.8230407110459,40.8230725214571,40.8234827081246,40.8234876195757,40.8240783513856,40.8240925689179,40.8245452264743,40.8245597240005,40.8249125429573,40.8249843482537,40.8251255114366,40.8252167830761,40.8253222704127,40.825458227185,40.8256121688826,40.8269234472671,40.8272244067465,40.8275357132044,40.8280862438122,40.8281561520366,40.8282256738179,40.8300286837657,40.8307743509689,40.8312214105751,40.8315094535015,40.8327895305208,40.8328921920781,40.8329427360213,40.8329916533309,40.8330584920767,40.833148754785,40.8332714756895,40.8333951676404,40.8335194207008,40.8336438230717,40.8347703963769,40.8349435738275,40.8351941281191,40.8356787891887,40.836473476526,40.8369933356284,40.8376400557478,40.8383206895101,40.8392541469134,40.8393533688681,40.8394283456492,40.8395701776613,40.8396158221309,40.8396386297872,40.8397152322995,40.8398586815471,40.8398880098946,40.8399336426868,40.8400102740694,40.840231705388,40.8404600605671,40.840610259031,40.840620022305,40.8415674489581,40.8420835490797,40.8422766696025,40.8424671456244,40.842818415237,40.8432037576477,40.84467686503,40.844975761157,40.8453172038185,40.8453915968336,40.8454645959546,40.8455977212001,40.8460334824842,40.8460187841966,40.8460523365154,40.846087214561,40.846194776329,40.8462550834272,40.8463414836816,40.8464050608974,40.8464636414384,40.8465068673762,40.846436407628,40.8462767888972,40.8461361515057,40.8460807940868,40.8460108817896,40.8459786004336,40.845952003804,40.8458578093881,40.8456981313547,40.8453160832941,40.8452554723792,40.8451661821664,40.8450867742174,40.8447927396644,40.8447589436098,40.8447968393723,40.8448009103269,40.8448126875305,40.8448735734316,40.8449407948031,40.8449924261884,40.8450344670993,40.8450541402324,40.84510408616,40.8451152461266,40.8451471538477,40.8451654341516,40.8451777551909,40.8451832278256,40.8451859749536,40.8451872325366,40.8451844585699,40.845170587654,40.8451573020728,40.845148693223,40.8451464812193,40.8451411731634,40.8451335258673,40.845104173849,40.8450565236104,40.845007441044,40.8449584961924,40.8449163140672,40.844882557804,40.8448434358235,40.8448003420935,40.8447308221529,40.8446552958725,40.8445814722859]}]]],null,null,{"interactive":true,"className":"","stroke":true,"color":"#03F","weight":5,"opacity":0.5,"fill":true,"fillColor":"#03F","fillOpacity":0.2,"smoothFactor":1,"noClip":false},null,null,null,{"interactive":false,"permanent":false,"direction":"auto","opacity":1,"offset":[0,0],"textsize":"10px","textOnly":false,"className":"","sticky":true},null]}],"limits":{"lat":[40.4961339876118,40.9155327765027],"lng":[-74.2555913631521,-73.7000090632127]}},"evals":[],"jsHooks":[]}</script> ] --- # Chloropleth Maps * Presents a numeric variable aggregated by a geospatial unit * Represents the value of the aggregated numeric variable via intensity of color * Values presented via a sequential or diverging palette --- # Mapping Population: How to Join? ```r library(tidyverse) cd_pop <- read_csv("https://data.cityofnewyork.us/resource/xi7c-iiu2.csv?$select=borough,cd_number,_2010_population%20as%20population_2010") ``` .pull-left[ ```r cd_pop %>% select(borough,cd_number) %>% head(5) ``` ``` ## # A tibble: 5 × 2 ## borough cd_number ## <chr> <dbl> ## 1 Bronx 1 ## 2 Bronx 2 ## 3 Bronx 3 ## 4 Bronx 4 ## 5 Bronx 5 ``` ] .pull-right[ ```r nyc_cd %>% select(BoroCD) %>% head(5) ``` ``` ## Simple feature collection with 5 features and 1 field ## Geometry type: MULTIPOLYGON ## Dimension: XY ## Bounding box: xmin: -73.94193 ymin: 40.67922 xmax: -73.84751 ymax: 40.88745 ## Geodetic CRS: WGS 84 ## BoroCD geometry ## 1 206 MULTIPOLYGON (((-73.87185 4... ## 2 404 MULTIPOLYGON (((-73.84751 4... ## 3 304 MULTIPOLYGON (((-73.89647 4... ## 4 205 MULTIPOLYGON (((-73.89138 4... ## 5 207 MULTIPOLYGON (((-73.87519 4... ``` ] --- # Cleaning Geographic ID Fields ```r cd_pop <- cd_pop %>% mutate(borough_num = case_when( borough == "Manhattan" ~ 1, borough == "Bronx" ~ 2, borough == "Brooklyn" ~ 3, borough == "Queens" ~ 4, borough == "Staten Island" ~ 5)) %>% mutate(cd = str_pad(cd_number, 2, side="left", "0")) %>% mutate(BoroCD = paste0(borough_num, cd) %>% as.numeric()) nyc_cd <- nyc_cd %>% left_join(cd_pop, by = c("BoroCD" = "BoroCD")) ``` --- # NYC Commmunity District Chloropleth .pull-left[ ```r library(RColorBrewer) pal_num <- colorNumeric(palette = "YlOrRd", domain = nyc_cd$population_2010) leaflet(width = "100%") %>% setView(lat = 40.7, lng = -74.0, zoom = 10) %>% addProviderTiles("CartoDB.Positron") %>% addPolygons(data = nyc_cd, fillColor = ~pal_num(population_2010), stroke = FALSE, fillOpacity = 0.5) ``` ] .pull-right[ <div id="htmlwidget-0aa02cc981f28836b428" style="width:100%;height:504px;" class="leaflet html-widget"></div> <script type="application/json" data-for="htmlwidget-0aa02cc981f28836b428">{"x":{"options":{"crs":{"crsClass":"L.CRS.EPSG3857","code":null,"proj4def":null,"projectedBounds":null,"options":{}}},"setView":[[40.7,-74],10,[]],"calls":[{"method":"addProviderTiles","args":["CartoDB.Positron",null,null,{"errorTileUrl":"","noWrap":false,"detectRetina":false}]},{"method":"addPolygons","args":[[[[{"lng":[-73.8718461029101,-73.8719169151728,-73.8719643215682,-73.8721335784673,-73.8723174854618,-73.8723405632703,-73.8723636524935,-73.8723955806089,-73.872527839146,-73.8726780587469,-73.8727720465853,-73.8729804293913,-73.8731272815869,-73.8731471467484,-73.8731760392855,-73.8733274669736,-73.8733483430233,-73.8735176630578,-73.8735905326388,-73.8736176059599,-73.8737582282926,-73.8737730880609,-73.8738369655606,-73.8738929586438,-73.8742583325403,-73.8750783721069,-73.8761514288291,-73.8769435147923,-73.8772276255229,-73.8775158530005,-73.877890467801,-73.8782622180322,-73.8786303201969,-73.8789939591054,-73.8793523626357,-73.8796518235077,-73.8799463075401,-73.8800914409518,-73.8801734789894,-73.8802673783566,-73.8805595352094,-73.8806788959028,-73.8807208158036,-73.8807657491459,-73.881642909245,-73.8816967494198,-73.8817724951235,-73.8821241001081,-73.8823302550307,-73.882747698579,-73.8831387395403,-73.8835182040595,-73.8841272455011,-73.885109971338,-73.8857468591637,-73.8861097884652,-73.8861197232776,-73.8861843210051,-73.8865980234512,-73.8875425178058,-73.8881375215934,-73.8886904083088,-73.889417248692,-73.8901746864267,-73.8921681562123,-73.8931709893529,-73.8941015052218,-73.8948486279507,-73.8949357995068,-73.8950141578443,-73.8950980727422,-73.8952778489266,-73.8953783618073,-73.8948475875661,-73.8948194262753,-73.8952735691077,-73.8955571806114,-73.896587201409,-73.8975178693376,-73.8985614225852,-73.8996374955661,-73.8996551031458,-73.8997327331982,-73.9003333035012,-73.9015115199571,-73.9010403297361,-73.9009631996938,-73.9009399949242,-73.9011633011518,-73.9013440457415,-73.9026881011636,-73.9026635223805,-73.9024667455367,-73.9020969186615,-73.9014130321413,-73.9009612341735,-73.9008597971891,-73.9006086418721,-73.9005323134581,-73.9004903276375,-73.9000969610738,-73.8995256799479,-73.8993072725916,-73.8991358789811,-73.8983653583245,-73.8981047765657,-73.897586563372,-73.8964405256637,-73.8960552499918,-73.8960071611179,-73.8957558507174,-73.8955807657566,-73.8955344506845,-73.8953978892207,-73.8952629043714,-73.8939489307909,-73.8938102607242,-73.8932152075789,-73.8925639256652,-73.8914180242409,-73.8913802338026,-73.8910628067923,-73.890821698287,-73.8906745175993,-73.8906445360121,-73.890426808212,-73.8901621947616,-73.8898812476067,-73.8897623001672,-73.8895845351166,-73.8894933663028,-73.8892727372128,-73.8892339790122,-73.8889465404615,-73.8880146938843,-73.886778651313,-73.8850526039665,-73.8830938243834,-73.882975370899,-73.8827179466861,-73.8826762473331,-73.8827365885678,-73.8826871439014,-73.8826279138773,-73.8834306953468,-73.8835152021354,-73.8836142989056,-73.8837128967282,-73.8837573289644,-73.8837836605134,-73.883835149305,-73.8838043043127,-73.8837131635657,-73.8821935638197,-73.8818656867116,-73.881491065687,-73.8811936679622,-73.880562139514,-73.8803543879808,-73.8807235341719,-73.8808081789906,-73.8808163119302,-73.8808338762021,-73.8808248274317,-73.8808112834161,-73.8807933004684,-73.8807664263229,-73.8806908860829,-73.8807157751575,-73.8806668466648,-73.8806485810509,-73.8806289285238,-73.8805922515002,-73.8818556767412,-73.8820355312086,-73.882436695103,-73.8825688771652,-73.8827383578705,-73.8826002220831,-73.8805558967974,-73.8789334114153,-73.8774527610744,-73.87729884832,-73.8771605358724,-73.8772445605829,-73.8779813134473,-73.876978028221,-73.8768758605487,-73.8768045292585,-73.8767987212558,-73.8760844866913,-73.8745917543696,-73.8742738632541,-73.8740146905165,-73.873056329373,-73.8719023725062,-73.8718461029101],"lat":[40.8437607778558,40.8434537426466,40.8432382537739,40.842497794549,40.8416902820204,40.8415836261895,40.8414769609834,40.8413363754319,40.8407539830068,40.8401371971068,40.8397512823361,40.8389524851857,40.838335096416,40.8382638989732,40.838165830893,40.8376519493322,40.8375920085582,40.8371144281902,40.8368965251878,40.8368187789932,40.8363981947851,40.8363587514383,40.8363611180845,40.8363634124156,40.8363790022439,40.8364230989704,40.8364985748949,40.8365608443931,40.8365831822738,40.8366299545205,40.8366895689627,40.8367600295246,40.8368412003844,40.8369329018055,40.8370349162458,40.8371260264319,40.8372262776342,40.8372811268627,40.8373105844355,40.8373442991535,40.8374591795866,40.8375051288087,40.837521265023,40.8375429859006,40.8379596836389,40.8379871134609,40.8380310725181,40.8382351240816,40.8383547669226,40.8385923412635,40.8388106720048,40.8390223663263,40.8393559193069,40.8399046391549,40.8402602436551,40.8404709946356,40.8404235214813,40.8401050444709,40.8392790501085,40.8396406584809,40.8398620023848,40.839158026468,40.8394227333803,40.8398736671137,40.8410496397396,40.841637343677,40.842190302897,40.8426282603431,40.842679358976,40.8427252911291,40.8427744807562,40.8428798609365,40.8429387789566,40.8436463632951,40.8436837709689,40.8437338283405,40.8437650891061,40.8438870555599,40.8439972480106,40.8441158739513,40.8442338255314,40.8441948406573,40.8440558179051,40.8429893800162,40.8433679689654,40.8442060775786,40.8443458394087,40.8443849826749,40.8444098469549,40.8444287507698,40.8445814722859,40.8446285737885,40.8449727021133,40.8456418791357,40.8468631933053,40.8477008533084,40.8478837793599,40.8483191998351,40.8484515271086,40.8485185413804,40.849209041181,40.8501037874369,40.8504575174702,40.8507279946471,40.8519132550649,40.8523077928105,40.8531154254887,40.8549077586531,40.8555199355532,40.8555963443679,40.8559788103522,40.8562452669938,40.8563178444408,40.8565318410449,40.8567433647587,40.8587796970276,40.8589865656346,40.8598742056531,40.8605227289159,40.8616629835412,40.8617005882631,40.8615294121173,40.8613993960937,40.8613200721788,40.8613605616078,40.861654500216,40.8619820723099,40.8623020457571,40.8624269845667,40.8626137006337,40.8627022095077,40.8629163992087,40.8629512262654,40.8632095106272,40.8638889485961,40.8645614040817,40.8655027092324,40.8666021850244,40.8664497320037,40.8661329657048,40.8660891414811,40.8660485736041,40.8660041558514,40.8658587386503,40.8654695142063,40.865399532326,40.8652948506201,40.8651499981173,40.8650625061805,40.864988243559,40.8647585975429,40.864497099854,40.8642919844725,40.8624566127224,40.8621237619579,40.8618785164318,40.8616838308439,40.8611972295258,40.8605693625072,40.8588275024044,40.8583857190752,40.8583215854647,40.858183125617,40.8580901230474,40.8579508834032,40.8578861738329,40.8578059491075,40.8576222333998,40.8573874020777,40.8571256774353,40.8570470453411,40.8569680516326,40.856739973288,40.8522260962678,40.8516434322482,40.8503437699291,40.848542763224,40.8478890886555,40.847708461682,40.8463202953062,40.8452146566745,40.8441644089741,40.8441226899081,40.8440851998036,40.8440094946265,40.8428044160759,40.8424397705924,40.8424026366364,40.842376709033,40.8422997872775,40.8420647699207,40.8415206475394,40.8421389483042,40.8425376773162,40.8432429321613,40.8437208520911,40.8437607778558]}]],[[{"lng":[-73.8475082034414,-73.8480129526487,-73.8485944796045,-73.849564537853,-73.8499544028441,-73.8507921646086,-73.8508760633661,-73.851303526722,-73.851870674825,-73.8524444347591,-73.8534013654509,-73.8541541809969,-73.8550508341339,-73.8556742771729,-73.8562856771093,-73.8566154109635,-73.8580176767162,-73.8586201644993,-73.8587246582933,-73.8593087683014,-73.8598592561211,-73.8604098922744,-73.8608717262406,-73.8616234186756,-73.8618182828136,-73.8627137642276,-73.8644708631116,-73.8649174897845,-73.8652477262981,-73.8658127061575,-73.8668280126407,-73.8679258648825,-73.8681058228117,-73.8682776151747,-73.8683180682867,-73.868358533074,-73.8684520354003,-73.8686094929539,-73.869048387312,-73.8693205085695,-73.8708649277179,-73.8710036316108,-73.8711223138123,-73.8712894048577,-73.8713430983512,-73.8714980070648,-73.8719205840257,-73.8731552720696,-73.8739739307465,-73.8747941417987,-73.8750915415561,-73.8753864726791,-73.8762830236057,-73.876997241884,-73.8778940272635,-73.8783662923012,-73.8786587482635,-73.879693540886,-73.880088774892,-73.8804906821248,-73.8808848465233,-73.8808979364915,-73.881309176877,-73.8817230176511,-73.8820851986599,-73.8829754338343,-73.8835332114184,-73.8840905169682,-73.8841609538133,-73.8846141461265,-73.8850919561427,-73.8855933098002,-73.8856119788771,-73.8856503153903,-73.8856999561787,-73.8862888460147,-73.886794729562,-73.88710945095,-73.8877019927043,-73.8882358782069,-73.8883831716343,-73.8887607883856,-73.8896716347519,-73.8900515142445,-73.8901336687324,-73.890159837874,-73.890177442278,-73.8902542797344,-73.8905035830003,-73.8908867031674,-73.8912701795326,-73.8916898855302,-73.8921786575121,-73.8934431381874,-73.8944468875035,-73.8935881894753,-73.8923209052634,-73.8917504879261,-73.8914312862048,-73.890501292144,-73.8895712836084,-73.8886776620666,-73.8877832688397,-73.8876466372534,-73.8867165625313,-73.8857874052002,-73.8848553853325,-73.8839357946289,-73.882999182888,-73.8825687695602,-73.8820711212716,-73.8811374760109,-73.8802064802561,-73.8798389492007,-73.8792777995974,-73.8784577933542,-73.8783431255438,-73.8774161249239,-73.8769245825537,-73.8764795304389,-73.8762518021305,-73.8755564314717,-73.8754323616297,-73.8746294635104,-73.8739829374628,-73.8737009828374,-73.8733031009611,-73.8727735685624,-73.8723725635367,-73.8718409589812,-73.8713564854483,-73.8709705324967,-73.8703788127843,-73.8694245860326,-73.8684575765922,-73.8675141292392,-73.866556611179,-73.8641847586896,-73.8627263391242,-73.8617507144683,-73.8611170766244,-73.8587632497491,-73.8558349556606,-73.854555522564,-73.8526043258402,-73.8522045056597,-73.8521222109915,-73.8520399162594,-73.8518974626072,-73.850498913962,-73.8506337304074,-73.8507490642678,-73.8508643971003,-73.8513110504637,-73.8544257525366,-73.8543692806646,-73.8540545329872,-73.8538245071134,-73.8537828697177,-73.8536056829382,-73.853254931964,-73.852923535223,-73.8525773383639,-73.8522409742843,-73.8518953747769,-73.8515510733492,-73.8513510276501,-73.8512092908837,-73.8509932732465,-73.8508691753435,-73.8505116087321,-73.8502044455664,-73.8501155663642,-73.8499642602272,-73.8498443127133,-73.8496520730917,-73.8493530507701,-73.8489234490988,-73.8479588598362,-73.8478016462052,-73.8475798071804,-73.8477784421743,-73.8477574010969,-73.8476703373911,-73.8475557978618,-73.8475082034414],"lat":[40.7390078070401,40.7387633444713,40.7385011710633,40.7381060928986,40.7379603043543,40.7376817560216,40.7376538599343,40.7375117275426,40.7373429291861,40.7372023129819,40.7370027582791,40.7368778133413,40.7367202216232,40.7365866581536,40.7364260425055,40.7363308371852,40.7359070835274,40.7357399071036,40.7357086441965,40.7355361283473,40.7353683856855,40.7352012602527,40.7350610856848,40.7348299731497,40.7347700602051,40.734515053656,40.7340072749305,40.7338665100468,40.7337622492319,40.7335838624784,40.7332457802965,40.7328725692482,40.7328262545154,40.7327670716494,40.7327536202895,40.7327401590446,40.7327133755154,40.7326531766484,40.732513917941,40.7324275432278,40.731945599399,40.7319056836445,40.7318715290089,40.7318162618719,40.7317993571146,40.7317505866538,40.7316139287872,40.7312439698152,40.7310032586413,40.73075902678,40.7306713632197,40.7305906728702,40.730313093919,40.7300483531401,40.7297159303876,40.7295158866319,40.7293996769841,40.7290101589161,40.7289062742142,40.7288165420463,40.7287437302178,40.7287413119397,40.7286808265212,40.7286352540297,40.7286103753503,40.728540950784,40.7284974480576,40.7284494117285,40.7284435111192,40.7284030066901,40.7283602924179,40.7282744399751,40.7283421776956,40.7284963822676,40.7287269714786,40.730601703117,40.7319225785439,40.7327442933385,40.7342913227586,40.7354411608881,40.7357583823087,40.7365363637948,40.7383151394919,40.7389736031946,40.7391444634683,40.7391988790892,40.7392349338419,40.7393922541524,40.7399027504751,40.7406872451642,40.7414282487896,40.7421448441982,40.7428727780394,40.7449579546392,40.7465352708128,40.7466204605364,40.7467527474311,40.7468117271341,40.7468447364522,40.7469419392122,40.7470390537029,40.7471342773485,40.7472289262337,40.7472448393756,40.7473414625193,40.7474397539918,40.7475348115672,40.7476302420153,40.7477344024237,40.7477778459097,40.747829926818,40.7479272934953,40.7480249796925,40.7480617245398,40.7481240924725,40.7482148108683,40.7482226600425,40.7483193733449,40.748368988615,40.74841640211,40.7484388501133,40.7485136085516,40.7485273595215,40.7486139279188,40.7486856684713,40.7487173189776,40.7487581246386,40.7488129579851,40.7488515513313,40.7489055766492,40.7489569508011,40.7489992423263,40.7490640780592,40.7491568510175,40.7492638209405,40.7493757074826,40.7494641491502,40.7497195881934,40.7498679379296,40.7499675912558,40.7500242283664,40.7507169718049,40.7515772724589,40.7519619185315,40.752541966549,40.7526606818602,40.752685519396,40.7527103580457,40.7527528596665,40.7501206987575,40.7500813409611,40.7500384918114,40.7499956418746,40.7498433761507,40.7488517268845,40.748738930191,40.7481583169479,40.7478540400851,40.7478029913653,40.7474968285921,40.7468235494634,40.7461819475256,40.7455056473151,40.7448409656761,40.7441797382359,40.7435072271111,40.7431190579557,40.7428440212208,40.7424225429113,40.7421804113246,40.7415188570427,40.7409020337518,40.7407235627984,40.7407017722784,40.7406655498284,40.740614663785,40.7405232498138,40.7403919148126,40.7400970163836,40.7400496769622,40.7397213544384,40.7393448352464,40.7392990885836,40.7391952354507,40.739063915243,40.7390078070401]}]],[[{"lng":[-73.8964662506299,-73.8965263330149,-73.8965815876399,-73.8966353676674,-73.8967496595112,-73.8968693782032,-73.8968990812467,-73.896959138362,-73.8970278151516,-73.8971048866469,-73.8971901003899,-73.8972831772595,-73.8973838123863,-73.8974375614847,-73.8974931200785,-73.8976719417578,-73.8978629987368,-73.8980644469557,-73.898274189501,-73.8984899774004,-73.8987094468792,-73.8988992828747,-73.8996983025444,-73.8997455060752,-73.900245376395,-73.9004700109828,-73.9007523595447,-73.9026226228038,-73.9035258449234,-73.9040463980889,-73.9045689133247,-73.90478936068,-73.9054141661056,-73.9054930354526,-73.9055483682493,-73.9056593420266,-73.9062828712672,-73.9067194118451,-73.9070182028394,-73.9077715879164,-73.9085164231406,-73.9088602555343,-73.9090552702809,-73.9092746294856,-73.9100246099535,-73.9107695442353,-73.911511928854,-73.9122730121486,-73.9130372137234,-73.9133072811088,-73.9137970017106,-73.9145397242182,-73.9146891547908,-73.9147008338055,-73.915289635161,-73.9155003395401,-73.9160459932908,-73.9166103203224,-73.9167983288489,-73.9175522613358,-73.9176811391874,-73.9180460695848,-73.9182934576662,-73.9187832329374,-73.9190610922491,-73.9198096194062,-73.9205501314324,-73.9209610386625,-73.9212136988418,-73.9213058780854,-73.9220713379702,-73.9228070235952,-73.923169667107,-73.9236437983556,-73.9242921326796,-73.9243918330361,-73.9253490361324,-73.9255606405626,-73.9263161253153,-73.926449920673,-73.927070693955,-73.9275068527093,-73.9278112067199,-73.9280433068713,-73.9285065967179,-73.9286426904778,-73.9288283423497,-73.9288289782543,-73.9297019240275,-73.9305114666293,-73.9311451648234,-73.931211998206,-73.9314718454511,-73.9317740462147,-73.9319288999603,-73.9323660567559,-73.9331186279311,-73.9338281715593,-73.9341339729401,-73.9344878475898,-73.9345799944256,-73.9346067511236,-73.9346889265965,-73.9347969968416,-73.9352226443668,-73.9360067922188,-73.9363876262512,-73.9367597902675,-73.9373906476545,-73.9377735456835,-73.9381771855279,-73.9385685484866,-73.9389015280868,-73.9396899520913,-73.9404199145092,-73.9404630853598,-73.9411491721417,-73.9419307881624,-73.9404205787432,-73.9402056390494,-73.9400171205594,-73.9398249573838,-73.9395100827194,-73.938868641261,-73.938365196089,-73.9382713952967,-73.9381159247666,-73.9376549335342,-73.9375289602967,-73.937378979284,-73.9372906345065,-73.9369807406091,-73.9353365296369,-73.9339509297254,-73.9335226266566,-73.9326978492492,-73.9317287178306,-73.931155339243,-73.930236889214,-73.9297999423443,-73.928737731971,-73.9281093220348,-73.9266480844634,-73.9260893009301,-73.9259618393912,-73.9251376222063,-73.9249070671207,-73.924169050099,-73.9238514837559,-73.923062441265,-73.9228621886442,-73.9223369695204,-73.9218918463265,-73.9214347597289,-73.9207006591888,-73.9199595293086,-73.9195647335138,-73.9192216260329,-73.9188434257222,-73.9184767086711,-73.9181029964512,-73.9180816760575,-73.9177366290558,-73.9173652032122,-73.9169950680197,-73.9166494811254,-73.9166089237908,-73.9162525203122,-73.9158973862979,-73.9155125050607,-73.9147706384764,-73.9140309747051,-73.9132916243198,-73.9125491390839,-73.9118071006943,-73.9129040412196,-73.9121616973804,-73.9114224265737,-73.9106788273735,-73.9118082010449,-73.911034895788,-73.9095327313856,-73.9087736610297,-73.9080224924566,-73.9075698522655,-73.9072745239221,-73.9068458346055,-73.9065235071222,-73.9061162600322,-73.9057653602042,-73.9054012773038,-73.9050048476836,-73.9046638475369,-73.9042601834566,-73.9048043538206,-73.9049142425983,-73.9057959700921,-73.905042952955,-73.9042879271097,-73.9038660054109,-73.9035405707189,-73.9027882470701,-73.9020727736498,-73.9017609660887,-73.9015539023884,-73.9014395867372,-73.9013984066204,-73.9018877625489,-73.9004246511309,-73.9011615506039,-73.8989768735436,-73.896526442364,-73.8964662506299],"lat":[40.6823364219728,40.6820029184158,40.6815747184331,40.6815564953434,40.6814920260621,40.6808814490309,40.6808156027293,40.6806995818402,40.6805863664477,40.6804763273461,40.6803698249256,40.6802672079914,40.6801688126217,40.6801206915437,40.6800737767268,40.6799688549371,40.6798750111177,40.6797934311789,40.6797250434942,40.6796705087743,40.6796301706819,40.6795609349016,40.6795440916942,40.6795079600669,40.6794227910109,40.6795352440653,40.6796766435087,40.6806645034182,40.6797392425141,40.6792205980192,40.6795155370216,40.6796504568711,40.6799926433812,40.6800371581605,40.6800716022369,40.6801406914279,40.6805067560749,40.6807674219426,40.6809482797905,40.6813778465741,40.6818039438251,40.6819940364655,40.6821055747453,40.6822343235831,40.6826573710899,40.6830927012723,40.6835049900879,40.683934965192,40.6843678096827,40.6845208578216,40.6847998717835,40.6852269184801,40.6853104194227,40.6853169452405,40.6856455369953,40.6857615240279,40.6860720694707,40.6863913526917,40.6864971998719,40.6869302230498,40.6870040948014,40.687213247771,40.6873566678148,40.6876260884438,40.6877843687593,40.688211241412,40.6886409221165,40.6888720518375,40.689019477115,40.6890716435979,40.6894898413008,40.6899239253446,40.6901234059908,40.6903988375817,40.6907733573566,40.690831749277,40.691366941838,40.6914908400026,40.6919284539681,40.6920017688283,40.6923462235934,40.6926038114563,40.6927742086536,40.69290417237,40.6931657263592,40.6932410125515,40.6933500992541,40.6933504740712,40.6938633976118,40.694316523049,40.6946739753662,40.6947127697819,40.6948609024252,40.6950282153467,40.6951146575311,40.6953583772966,40.695791153846,40.6961842773079,40.6963584314036,40.6965602684784,40.6966128244709,40.6966280858393,40.6966749543876,40.6967365923545,40.6969865451318,40.6974053962503,40.6976153015073,40.6978311888305,40.6981857953999,40.6984046930499,40.698640223292,40.6988481360524,40.6990369704857,40.6994557914414,40.6998737747676,40.6998978895406,40.7002811274921,40.7007252341929,40.701076598295,40.7011243056465,40.7011661481724,40.7012087986458,40.7012797812481,40.7014276729813,40.7015448898458,40.7015696423227,40.7016106683499,40.7017323123984,40.7017655535374,40.7018051310971,40.7018284443381,40.7019102776596,40.7023148258386,40.7026745926979,40.7028489818732,40.7031703912226,40.7035459911243,40.7037723348702,40.7041311315899,40.7043045299944,40.7047169507642,40.704963939698,40.7055292245019,40.7056797011623,40.7058097831741,40.70653890478,40.7067443945278,40.7073944496271,40.7076762980633,40.7083689691659,40.7085454975254,40.7090062604165,40.7093960967104,40.7091287657063,40.708694630124,40.7082572885237,40.7080239783973,40.7078151343449,40.7075979984019,40.7073815627365,40.7071599694582,40.7071473301108,40.7069427389294,40.7067224690084,40.7065029645781,40.7062993881245,40.7062754946701,40.7060655429796,40.7058548171301,40.7056264446535,40.7051894377752,40.7047491130351,40.7043126385472,40.7038734198365,40.7034349520267,40.7023618912967,40.7019231641026,40.7014865880167,40.7010459695667,40.6999380026219,40.6995321139707,40.6986751051255,40.6982552266944,40.6978254091374,40.6975717504737,40.6973991897234,40.6971635493117,40.6969761436171,40.6967505571315,40.6965485551254,40.6963503058835,40.6961187462833,40.6959322465276,40.6957003714427,40.6951481695847,40.6950735713309,40.6941271555136,40.6937040067602,40.6932780687472,40.6930357122295,40.6928487817959,40.6924183392061,40.6919992313042,40.691807310892,40.6916798589335,40.6916121057659,40.6915899920378,40.6910777200733,40.6881838988769,40.6878779353556,40.6852976980837,40.6824032992416,40.6823364219728]}]],[[{"lng":[-73.8913802338026,-73.8914180242409,-73.8925639256652,-73.8932152075789,-73.8938102607242,-73.8939489307909,-73.8952629043714,-73.8953978892207,-73.8955344506845,-73.8955807657566,-73.8957558507174,-73.8960071611179,-73.8960552499918,-73.8964405256637,-73.897586563372,-73.8981047765657,-73.8983653583245,-73.8991358789811,-73.8993072725916,-73.8995256799479,-73.9000969610738,-73.9004903276375,-73.9005323134581,-73.9006086418721,-73.9008597971891,-73.9009612341735,-73.9014130321413,-73.9020969186615,-73.9024667455367,-73.9026635223805,-73.9026881011636,-73.9033865124588,-73.9041010735872,-73.9048312203632,-73.9055058276064,-73.9061182471481,-73.9066467555957,-73.9075448891075,-73.9084507328043,-73.9093592484465,-73.910254353069,-73.9108057940986,-73.9110409640953,-73.9112809741578,-73.9114163658133,-73.9119467035972,-73.9125840554476,-73.9132497070102,-73.9133829397145,-73.9135182652173,-73.9137952351787,-73.9141607633373,-73.914774366957,-73.9155882282611,-73.9169715243762,-73.9172871941725,-73.9183870599972,-73.9187717919945,-73.9193488243451,-73.9204329802783,-73.9215071460599,-73.9224698366015,-73.9226280853113,-73.9227346100817,-73.9235400201159,-73.9236095515337,-73.9242740136647,-73.9244534627579,-73.924549099801,-73.9246844846605,-73.9255378459996,-73.9258911698099,-73.9260920720706,-73.9261562785059,-73.9262244385218,-73.926377829331,-73.9264974755206,-73.9268051593282,-73.9271498069637,-73.9273019449863,-73.9272779806354,-73.9272247961193,-73.9271551982429,-73.9270196138204,-73.9269354595453,-73.9268793482887,-73.9268816767143,-73.9268591233208,-73.9268512760248,-73.926830232168,-73.9267740054841,-73.9267577703705,-73.9266993346751,-73.9266268744018,-73.9265660882077,-73.9265169973973,-73.9264585532798,-73.9264141327065,-73.9263042593026,-73.9261943925046,-73.9261102412782,-73.9260331017211,-73.925979329569,-73.925939578958,-73.9258647710027,-73.925771270333,-73.9252195552976,-73.9246537993034,-73.9244527324976,-73.9242240509066,-73.9240886581911,-73.9238477894583,-73.9239478950148,-73.9235176930545,-73.9233181034126,-73.9225617894648,-73.9217403540301,-73.9215426180392,-73.9213420768387,-73.9214899115396,-73.9215154370553,-73.9208007028934,-73.9203723545143,-73.9203002721343,-73.9205665595436,-73.9205501498962,-73.9205265313285,-73.9204414141774,-73.9203502478837,-73.9202939290944,-73.9203062060995,-73.9200200214284,-73.9195662094469,-73.9190236912522,-73.9182912339762,-73.9181118754949,-73.9177604125111,-73.9172066464699,-73.9169130864168,-73.9158052800855,-73.91576213211,-73.9154258348416,-73.9151297932084,-73.9150879462137,-73.9150463133379,-73.9149426305384,-73.9148334512588,-73.91467480712,-73.9145570199357,-73.9144436641967,-73.9143380384375,-73.9142430733899,-73.9141610499808,-73.9140360788766,-73.913337624556,-73.913284370514,-73.9117779598062,-73.9108848844297,-73.9107210432267,-73.9105679933912,-73.9104295272843,-73.9103088085114,-73.9102081809441,-73.9098702213687,-73.9096674783098,-73.9077748429088,-73.9072578618828,-73.9070700394927,-73.9067973494215,-73.9061454856976,-73.9058710064277,-73.9057226248422,-73.9048684721552,-73.9039081666944,-73.9036912208848,-73.903518379154,-73.90311010959,-73.9025447939267,-73.9023388722145,-73.9021172035051,-73.9018800734945,-73.9016278508774,-73.9013609036326,-73.9010796701773,-73.9002836810437,-73.8999617763096,-73.8996426168608,-73.8994367084048,-73.8984103840663,-73.8979809937002,-73.8973727479153,-73.8971437980981,-73.8969389968521,-73.8958838746736,-73.894824633207,-73.8937249076193,-73.8935591434144,-73.8928516915538,-73.8920667930097,-73.8919829788118,-73.891771887992,-73.8913802338026],"lat":[40.8617005882631,40.8616629835412,40.8605227289159,40.8598742056531,40.8589865656346,40.8587796970276,40.8567433647587,40.8565318410449,40.8563178444408,40.8562452669938,40.8559788103522,40.8555963443679,40.8555199355532,40.8549077586531,40.8531154254887,40.8523077928105,40.8519132550649,40.8507279946471,40.8504575174702,40.8501037874369,40.849209041181,40.8485185413804,40.8484515271086,40.8483191998351,40.8478837793599,40.8477008533084,40.8468631933053,40.8456418791357,40.8449727021133,40.8446285737885,40.8445814722859,40.8446552958725,40.8447308221529,40.8448003420935,40.8448434358235,40.844882557804,40.8449163140672,40.8449584961924,40.845007441044,40.8450565236104,40.845104173849,40.8451335258673,40.8451411731634,40.8451464812193,40.845148693223,40.8451573020728,40.845170587654,40.8451844585699,40.8451872325366,40.8451859749536,40.8451832278256,40.8451777551909,40.8451654341516,40.8451471538477,40.8451152461266,40.84510408616,40.8450541402324,40.8450344670993,40.8449924261884,40.8449407948031,40.8448735734316,40.8448126875305,40.8448009103269,40.8447968393723,40.8447589436098,40.8447927396644,40.8450867742174,40.8451661821664,40.8452554723792,40.8453160832941,40.8456981313547,40.8458578093881,40.845952003804,40.8459786004336,40.8460108817896,40.8460807940868,40.8461361515057,40.8462767888972,40.846436407628,40.8465068673762,40.846548036106,40.8465896568059,40.8466508296858,40.8468176577978,40.8469241441708,40.8470395065723,40.8471034020474,40.8471929359749,40.8472240910559,40.8472897601886,40.8473255626625,40.8473359016273,40.8473518705504,40.8473926865004,40.8475098231922,40.8475648403455,40.8476482548015,40.8477316704674,40.8478701014414,40.8479606115267,40.8480209498999,40.8480724152987,40.8481629286313,40.8482711928576,40.8483617046885,40.8484220428326,40.8490822472402,40.8497850435131,40.8500920769201,40.8505688770538,40.8507373501745,40.851182608716,40.8512217846166,40.8518358199715,40.8521297879621,40.8531889120299,40.8542212378405,40.8541168833817,40.8543174356577,40.8544902182887,40.8545100638914,40.8553808143945,40.8551729651367,40.8552463713415,40.8555138983137,40.8556181796815,40.8556866684018,40.85574613631,40.8557853638287,40.8558451145173,40.8559271198111,40.8562707210332,40.8568401836882,40.8573965384138,40.8581550149109,40.8583137296336,40.8587080979583,40.8589289232372,40.8592702122092,40.8604697358561,40.8606446367904,40.8603531270345,40.8600919473337,40.8600565175457,40.8600210533902,40.8599352945638,40.8598444814301,40.8597124061622,40.8597401172978,40.8597801591317,40.8598317683772,40.8598934986602,40.8599634055862,40.8599419533294,40.8597186587504,40.8596186013306,40.859089734571,40.8587761829371,40.8587062322342,40.8586205937367,40.858520856374,40.858409326605,40.8582887888709,40.8576697142193,40.8574849481506,40.8596095196221,40.8593534379199,40.8593618492395,40.8593735889313,40.8591427416386,40.8590455367974,40.8589929885651,40.8586932247089,40.8583675858159,40.8587090879507,40.8590030707098,40.8596523965619,40.8605782548338,40.8609549714692,40.8613269480236,40.86169362462,40.8620544345801,40.8624088641597,40.862756383423,40.8624718375907,40.8623502805284,40.8622104364451,40.862116911563,40.8622969666796,40.8624025398698,40.8624323645427,40.8624450651525,40.8624429292485,40.86225834337,40.8620650742478,40.8619441928009,40.8619259672592,40.8618321929932,40.8618609252411,40.8618639900443,40.8618717167501,40.8617005882631]}]],[[{"lng":[-73.875188501627,-73.8761925755019,-73.8769435202508,-73.8777275301841,-73.8798120630492,-73.8799138038693,-73.881338555091,-73.8830938243834,-73.8850526039665,-73.886778651313,-73.8880146938843,-73.8889465404615,-73.8892339790122,-73.8892727372128,-73.8894933663028,-73.8895845351166,-73.8897623001672,-73.8898812476067,-73.8901621947616,-73.890426808212,-73.8906445360121,-73.8906745175993,-73.890821698287,-73.8910628067923,-73.8913802338026,-73.891771887992,-73.8919829788118,-73.8920667930097,-73.8928516915538,-73.8935591434144,-73.8937249076193,-73.894824633207,-73.8958838746736,-73.8969389968521,-73.8971437980981,-73.8973727479153,-73.8979809937002,-73.8984103840663,-73.8994367084048,-73.8996426168608,-73.8999617763096,-73.9002836810437,-73.9010796701773,-73.9013609036326,-73.9016278508774,-73.9018800734945,-73.9021172035051,-73.9023388722145,-73.9025447939267,-73.90311010959,-73.903518379154,-73.9036912208848,-73.9039081666944,-73.9048684721552,-73.9057226248422,-73.9058710064277,-73.9061454856976,-73.9067973494215,-73.9070700394927,-73.9072578618828,-73.9077748429088,-73.9096674783098,-73.9098702213687,-73.9102081809441,-73.9103088085114,-73.9104295272843,-73.9105679933912,-73.9107210432267,-73.9108848844297,-73.9117779598062,-73.913284370514,-73.913337624556,-73.9140360788766,-73.9141610499808,-73.9142430733899,-73.9143380384375,-73.9144436641967,-73.9145570199357,-73.91467480712,-73.9148334512588,-73.9149426305384,-73.9150463133379,-73.9150879462137,-73.9151297932084,-73.9154258348416,-73.91576213211,-73.9148747020193,-73.9148093432548,-73.9147233085528,-73.914818174053,-73.9147710967512,-73.9147432388462,-73.9147002850958,-73.9146716292915,-73.9146343753192,-73.9146114381532,-73.9146114130447,-73.9146211635516,-73.9142908258902,-73.9142291806776,-73.9134146219366,-73.9127627199546,-73.9122727897698,-73.9127439764683,-73.9127605061229,-73.9127976212894,-73.9127521621649,-73.9127160731499,-73.912730540209,-73.9125260451681,-73.9126763402038,-73.9109129241202,-73.9105566861382,-73.9105128707747,-73.9104747099412,-73.9104428274195,-73.9104177443699,-73.9103998708111,-73.9103758989753,-73.9103586162277,-73.9103482710452,-73.9103450121683,-73.9103488864627,-73.9103598382439,-73.9101746817974,-73.909861764938,-73.9096669484779,-73.9094966437852,-73.9092746410747,-73.908937149299,-73.9086494317758,-73.9089323524159,-73.9089785138663,-73.9090154481035,-73.9090598039457,-73.9090893791723,-73.9090997211075,-73.9090996934467,-73.9091396166038,-73.9091751332363,-73.9091913763908,-73.9092105593452,-73.9092460468985,-73.9092652603834,-73.9092711403346,-73.9093554096112,-73.9094396619834,-73.9095113632802,-73.9095438833791,-73.9095793637417,-73.9095897310371,-73.9096000668815,-73.9096370633219,-73.9096533284654,-73.9096740347101,-73.9097095289616,-73.9097169007266,-73.909747975059,-73.9097864426944,-73.9098455962351,-73.9099076995563,-73.9099616830913,-73.9100164095228,-73.9100755691892,-73.9100948215284,-73.9101096150669,-73.9101036745551,-73.9101687622908,-73.9101791340239,-73.9101835541743,-73.9101894636508,-73.9102737816112,-73.9103551400981,-73.910445395199,-73.9105060658538,-73.9105889776575,-73.9106543931584,-73.9105378778175,-73.9102697115493,-73.9097348729607,-73.9096711788847,-73.908555795888,-73.9074648979431,-73.906699847351,-73.9066288707301,-73.9063631655063,-73.9061466892458,-73.9060791797804,-73.9060180936319,-73.9059112640522,-73.9058661677825,-73.9057142536251,-73.9046772827462,-73.9045920324781,-73.9045919493546,-73.9045918900658,-73.9045208830044,-73.9045207051659,-73.9045205754491,-73.9044690861,-73.904469014531,-73.9044689677043,-73.9044401083144,-73.9044400852579,-73.9044400732502,-73.9044342879858,-73.9044886055592,-73.9044200320979,-73.9040359264304,-73.9037497589396,-73.9031866746583,-73.9023580484644,-73.9021518605061,-73.9019415502505,-73.901727429628,-73.9015098166704,-73.901289033668,-73.9010654080736,-73.8999657564839,-73.8996522027412,-73.8996030036064,-73.8995340437299,-73.8994456161145,-73.8993385117239,-73.8992138769479,-73.8990732725348,-73.8989185429827,-73.8977896227048,-73.8973272118081,-73.894072728484,-73.8923132139066,-73.8921287553187,-73.8914069633233,-73.8912360818402,-73.891235915127,-73.8912357369374,-73.8910483410851,-73.8908453941575,-73.8906284409605,-73.8904006648889,-73.8904005817968,-73.8904004984675,-73.8901826993257,-73.8899753755408,-73.88836487605,-73.8881888660738,-73.8880029809553,-73.8878094658917,-73.8876108716749,-73.8874098703155,-73.8872091898904,-73.8870696278377,-73.8871650526528,-73.8871975479414,-73.8872123874329,-73.8872319407604,-73.887181015669,-73.887146976863,-73.8871320661323,-73.8871230358481,-73.8871070335287,-73.8871000449228,-73.8870870578614,-73.8870430407142,-73.8870483340023,-73.8870514260234,-73.8869288973406,-73.886834866747,-73.8866241303956,-73.8851649583431,-73.884526151592,-73.8843792231517,-73.88437905751,-73.8843788790354,-73.8842169644318,-73.8842168342661,-73.8842167148987,-73.8840435344224,-73.8840434159229,-73.8840432857114,-73.8838639140083,-73.8838637475968,-73.8838635811526,-73.8836834756176,-73.8836833685652,-73.8836832738419,-73.8835081045761,-73.8835078795922,-73.8835076415373,-73.8833425867325,-73.8833423486773,-73.8833421350919,-73.8831908876937,-73.8827483336087,-73.8820862367445,-73.8812442254155,-73.8799579875278,-73.8793628325953,-73.8787604168712,-73.8781494463452,-73.8781312919031,-73.8780356242649,-73.8780162797768,-73.878004801122,-73.8780012488109,-73.8779212389721,-73.8778706811214,-73.8778385700107,-73.8778312590419,-73.8776067654627,-73.8777281766151,-73.8781257522779,-73.8771700595189,-73.8762589013992,-73.8753369943113,-73.8747025549028,-73.87479240732,-73.8749458975559,-73.8740675120518,-73.8730733460093,-73.8719166182427,-73.871871006937,-73.8708356784025,-73.8706826459968,-73.8701531859727,-73.8709441474807,-73.8716071869505,-73.8725525090033,-73.8743675076247,-73.875188501627],"lat":[40.8715757563096,40.8704769567011,40.8699546815721,40.8695553386596,40.8684166479714,40.8683612516643,40.8675900882594,40.8666021850244,40.8655027092324,40.8645614040817,40.8638889485961,40.8632095106272,40.8629512262654,40.8629163992087,40.8627022095077,40.8626137006337,40.8624269845667,40.8623020457571,40.8619820723099,40.861654500216,40.8613605616078,40.8613200721788,40.8613993960937,40.8615294121173,40.8617005882631,40.8618717167501,40.8618639900443,40.8618609252411,40.8618321929932,40.8619259672592,40.8619441928009,40.8620650742478,40.86225834337,40.8624429292485,40.8624450651525,40.8624323645427,40.8624025398698,40.8622969666796,40.862116911563,40.8622104364451,40.8623502805284,40.8624718375907,40.862756383423,40.8624088641597,40.8620544345801,40.86169362462,40.8613269480236,40.8609549714692,40.8605782548338,40.8596523965619,40.8590030707098,40.8587090879507,40.8583675858159,40.8586932247089,40.8589929885651,40.8590455367974,40.8591427416386,40.8593735889313,40.8593618492395,40.8593534379199,40.8596095196221,40.8574849481506,40.8576697142193,40.8582887888709,40.858409326605,40.858520856374,40.8586205937367,40.8587062322342,40.8587761829371,40.859089734571,40.8596186013306,40.8597186587504,40.8599419533294,40.8599634055862,40.8598934986602,40.8598317683772,40.8597801591317,40.8597401172978,40.8597124061622,40.8598444814301,40.8599352945638,40.8600210533902,40.8600565175457,40.8600919473337,40.8603531270345,40.8606446367904,40.8616916999863,40.8617141896458,40.8618531823892,40.861899088983,40.8619463081492,40.8619335899814,40.861953112544,40.861981337605,40.8620204198403,40.8620529939979,40.8620725494614,40.8620966907348,40.8624280182207,40.8624885566597,40.8633674937007,40.8630291741576,40.8636321489967,40.863892568173,40.8638769139099,40.8638988754329,40.8639450568429,40.8639262294341,40.863909790277,40.8637952238378,40.8640211116025,40.8659379459877,40.8664219487232,40.866453462298,40.8664889622657,40.8665278683481,40.8665695445899,40.866613309754,40.8666546446895,40.8666978605708,40.8667423361094,40.8667874319061,40.8668324996435,40.8668768914061,40.867191215116,40.8679433156169,40.8684170395901,40.8688311566409,40.8695541323832,40.8710198403089,40.8713857838033,40.8721573479707,40.8722243538378,40.8722895870549,40.8723413287904,40.8723750756201,40.8723941917606,40.8724144256536,40.8724627949805,40.8724808143928,40.8725134259531,40.8725651466441,40.8726045258465,40.8726337614655,40.8726629959801,40.8727709770792,40.8728823345242,40.8729773835985,40.8730178762489,40.8730628660148,40.8730640000587,40.873087618491,40.8731078813788,40.8731247514355,40.8731472527285,40.8731821299476,40.8732046114176,40.8732181248313,40.8732473847979,40.8733137615274,40.8733834988589,40.8734313206819,40.8734819442078,40.8735359559607,40.8735370875009,40.8735539657266,40.8735607059034,40.8736169640159,40.8736147209173,40.8736270887152,40.8736428340945,40.8737080943758,40.8737778553092,40.8738386281182,40.8738802682534,40.8739337486811,40.8739759430611,40.874060742302,40.8742718145447,40.8746381440676,40.8745887681463,40.873775443923,40.8735473542364,40.8733967627434,40.8733803787288,40.873319047922,40.873260204729,40.8732424201914,40.873226989181,40.8731958174268,40.8731826604275,40.8731383221018,40.8726198789964,40.8725645539741,40.8725645001305,40.8725644463066,40.8724953919421,40.8724952112054,40.8724950228023,40.8724156289577,40.8724155206787,40.8724153949978,40.8723304996567,40.8723304188916,40.8723303282517,40.8722453087808,40.8705785485483,40.8703612760012,40.8699491633589,40.8695956271401,40.8691489914912,40.8686961209535,40.8686118311246,40.8685336307776,40.8684616358937,40.8683959529535,40.8683366796482,40.8682839038865,40.8680173015104,40.8685545787816,40.8687282082563,40.8688996138891,40.8690668420795,40.8692280281048,40.8693813867849,40.8695253556017,40.8696585744867,40.8708566433986,40.8714452336453,40.8755877455144,40.8778234340022,40.8780578022822,40.8789694462465,40.8791607193917,40.8791608998241,40.879161079743,40.8793438553659,40.8795170968304,40.8796795643438,40.8798569611762,40.8798570235833,40.8798570960415,40.8800417137645,40.8802331314222,40.8822675418619,40.8823371139957,40.8823945020752,40.8824385821485,40.8824685728229,40.882484072112,40.8824850739581,40.8824768960662,40.8825765113955,40.8827524355289,40.8828201576411,40.8830549784291,40.8830839422346,40.8831179381563,40.8831509449589,40.8832009399455,40.8836739859517,40.8837299443871,40.8837970273205,40.8840402323784,40.8842355206172,40.8843495758467,40.884355714854,40.8843420260654,40.8842673032099,40.8836316116553,40.8833121478351,40.8832477233281,40.8832476517975,40.883247597844,40.8831977280585,40.8831976917431,40.8831976653223,40.8831650019633,40.8831649842544,40.8831649742397,40.8831513949309,40.8831513853821,40.8831513945959,40.8831576154394,40.8831576153315,40.8831576333284,40.8831831475924,40.8831831835502,40.8831832469685,40.883226374464,40.883226437882,40.8832265189146,40.8832848345123,40.8833973868017,40.8831322219112,40.8827096330056,40.8843906289661,40.8852182399748,40.8860401998614,40.8868738073648,40.8869127973194,40.8871183217562,40.8872273922942,40.8873371754051,40.887447196229,40.8874101571805,40.8872540583453,40.8870945211764,40.8867727601815,40.8845230436198,40.8834541950845,40.8821536849745,40.8819939128098,40.8818320397059,40.8816718323973,40.881553823556,40.8800751283878,40.8799476687928,40.8800389062914,40.8801343853582,40.8802381780163,40.8803281204254,40.8804541142792,40.8804587560067,40.880350827058,40.878509695414,40.87692157251,40.875175183326,40.8727010091991,40.8715757563096]}]],[[{"lng":[-73.8966333386324,-73.8966306864356,-73.8966306858501,-73.896606136735,-73.8965958378131,-73.8965646453232,-73.8965465329252,-73.896492293823,-73.8964350345664,-73.8964113354937,-73.8963578603773,-73.896408958026,-73.8966100226111,-73.8968784456836,-73.8969705424814,-73.8970289508559,-73.8970336369263,-73.8970465142028,-73.8970732920871,-73.8971394732915,-73.8971571716543,-73.8970914908083,-73.896994928605,-73.8967074708932,-73.896431707833,-73.8967579007494,-73.897057634523,-73.8972811252072,-73.89731936279,-73.8975635771188,-73.8976960116153,-73.8977666909259,-73.8978788753162,-73.8982721693128,-73.8992249910406,-73.8993642685063,-73.8996206531463,-73.8997112766292,-73.8997825214195,-73.8997258855994,-73.8989257182505,-73.8973833610236,-73.8971564543338,-73.8968817842862,-73.896682430808,-73.8966154655592,-73.8965206906546,-73.8959567495941,-73.8950827065964,-73.8946794895308,-73.8945343134316,-73.8929164370079,-73.8928864458674,-73.8917661791393,-73.8908054398087,-73.889847018932,-73.8888964224737,-73.8884015720717,-73.8877477344924,-73.8875861260884,-73.8870514260234,-73.8870483340023,-73.8870430407142,-73.8870870578614,-73.8871000449228,-73.8871070335287,-73.8871230358481,-73.8871320661323,-73.887146976863,-73.887181015669,-73.8872319407604,-73.8872123874329,-73.8871975479414,-73.8871650526528,-73.8870696278377,-73.8872091898904,-73.8874098703155,-73.8876108716749,-73.8878094658917,-73.8880029809553,-73.8881888660738,-73.88836487605,-73.8899753755408,-73.8901826993257,-73.8904004984675,-73.8904005817968,-73.8904006648889,-73.8906284409605,-73.8908453941575,-73.8910483410851,-73.8912357369374,-73.891235915127,-73.8912360818402,-73.8914069633233,-73.8921287553187,-73.8923132139066,-73.894072728484,-73.8973272118081,-73.8977896227048,-73.8989185429827,-73.8990732725348,-73.8992138769479,-73.8993385117239,-73.8994456161145,-73.8995340437299,-73.8996030036064,-73.8996522027412,-73.8999657564839,-73.9010654080736,-73.901289033668,-73.9015098166704,-73.901727429628,-73.9019415502505,-73.9021518605061,-73.9023580484644,-73.9031866746583,-73.9037497589396,-73.9040359264304,-73.9044200320979,-73.9044886055592,-73.9044342879858,-73.9044400732502,-73.9044400852579,-73.9044401083144,-73.9044689677043,-73.904469014531,-73.9044690861,-73.9045205754491,-73.9045207051659,-73.9045208830044,-73.9045918900658,-73.9045919493546,-73.9045920324781,-73.9046772827462,-73.9057142536251,-73.9058661677825,-73.9059112640522,-73.9060180936319,-73.9060791797804,-73.9061466892458,-73.9063631655063,-73.9066288707301,-73.906699847351,-73.9074648979431,-73.908555795888,-73.9096711788847,-73.9097348729607,-73.9102697115493,-73.9105378778175,-73.9106543931584,-73.910709837435,-73.9108091320259,-73.9108517108015,-73.9109211800964,-73.9109895384145,-73.9110690965926,-73.9111127952843,-73.9111576199347,-73.9111945984318,-73.9112528804012,-73.9112629469812,-73.9112719252435,-73.9112786433575,-73.9113105894959,-73.9114842829561,-73.9115100668897,-73.9115504309977,-73.9115717328337,-73.9115975127293,-73.9115997468718,-73.9116232923755,-73.9116277654107,-73.9116389750718,-73.9116501760637,-73.911668109663,-73.9116714625678,-73.911688269509,-73.9116927550053,-73.911702841569,-73.9117342370148,-73.9117398302469,-73.9117700920411,-73.9117913916722,-73.9118093399044,-73.9118390427903,-73.9118592105802,-73.9118827471072,-73.9118961952483,-73.911915257546,-73.9119208620329,-73.9119298334881,-73.9119331812602,-73.9119444035402,-73.9119466307367,-73.9119544707725,-73.9119578449278,-73.9119657009461,-73.9119690715052,-73.9120307218896,-73.912084528002,-73.912152908261,-73.9121764464277,-73.9122145452613,-73.9122156629384,-73.9122281439391,-73.9122281334074,-73.9122379138493,-73.9122529437666,-73.9122769919046,-73.9122739725681,-73.9122844936072,-73.912295007618,-73.9123062790969,-73.9123115528349,-73.9123235580487,-73.9123333354827,-73.9123423430992,-73.9123370772946,-73.9123430889777,-73.9123491010973,-73.9123558654387,-73.9123498424775,-73.9123588554421,-73.9123648754102,-73.9123686261151,-73.9123776473639,-73.9123874153289,-73.912394925482,-73.9124046948719,-73.9124227175974,-73.9124309910199,-73.9124400024952,-73.9124520326556,-73.9124572929946,-73.9124775729438,-73.9124880924182,-73.9124903381533,-73.9125023632748,-73.9125068790847,-73.9125196549319,-73.9125256583787,-73.9125294113542,-73.9125512008152,-73.9125557024881,-73.9125917681681,-73.9126188086838,-73.9126428501273,-73.9126751704743,-73.9126962151218,-73.9127063448085,-73.9127228787879,-73.9127285970972,-73.9127431605783,-73.9127536637264,-73.9127686945859,-73.9127874725648,-73.9128002349527,-73.9128062408203,-73.9128212686581,-73.9128483068081,-73.9128565621849,-73.9128693352252,-73.9128790970967,-73.9128843630201,-73.9128948780671,-73.9129046399428,-73.9129211720722,-73.9129362006098,-73.9129437171019,-73.9135004274986,-73.9134892905208,-73.9134995514041,-73.9135089556779,-73.9135087770223,-73.9135341536284,-73.9135479740434,-73.9135687293559,-73.9135820990886,-73.9135876288886,-73.9136014690181,-73.9136222238179,-73.9136314547225,-73.9136448285832,-73.9136526767002,-73.913770655632,-73.9138635875494,-73.9138736803818,-73.9138823183431,-73.9140746732544,-73.9140684200341,-73.9153510599451,-73.9153826800639,-73.9154020517774,-73.9154254876197,-73.9154550495345,-73.9154685586008,-73.915486834987,-73.9155098987458,-73.9155290489645,-73.9155516736433,-73.915575609696,-73.91558474485,-73.91561693873,-73.9156717761469,-73.915707896733,-73.9157200644948,-73.9157422598576,-73.9157851563811,-73.9172602833729,-73.9173333891099,-73.9174010088785,-73.9174736485844,-73.9176890713815,-73.9177566939592,-73.9177892257286,-73.9178392254031,-73.9179192960557,-73.9179918722719,-73.9180845226524,-73.9182497423248,-73.9182597237627,-73.9182797400364,-73.918297275359,-73.9183298383373,-73.9190832635702,-73.91978381299,-73.9197755685445,-73.9198770358193,-73.9199213717929,-73.9199433211953,-73.9199689387989,-73.920028976625,-73.9200689960867,-73.9200564594506,-73.9200539303846,-73.9200714360169,-73.9200802849705,-73.9201114964353,-73.9201540082621,-73.9202563896501,-73.9215771042401,-73.9216063031327,-73.9216328627697,-73.9216451544793,-73.9216920371562,-73.9218221184354,-73.9220672365189,-73.9221344406294,-73.9222297956518,-73.9224079929588,-73.9224079751686,-73.9224346447601,-73.9224882995936,-73.9224899286036,-73.9225352310685,-73.9225852978175,-73.9226787992985,-73.9227378828753,-73.9227979445115,-73.9228730387105,-73.9229506536742,-73.9230408222371,-73.9230931984872,-73.9231234579005,-73.9231635067145,-73.923186039062,-73.9232436350995,-73.9232591722343,-73.9232686916151,-73.9233037539606,-73.9235917255313,-73.9236115025191,-73.923597420866,-73.9236171919142,-73.923624231508,-73.9236369528922,-73.9236791931168,-73.923666479932,-73.9236777389066,-73.9236621938806,-73.9236523348695,-73.9236297395041,-73.9237493550127,-73.923794413682,-73.9238269787748,-73.9239020994249,-73.923942152533,-73.923969678122,-73.923987187551,-73.9240372562042,-73.9240572889594,-73.9240648163391,-73.924179996217,-73.9243126860352,-73.9244904284535,-73.9245179585104,-73.9245354939648,-73.9245380322458,-73.9245806174672,-73.924615654515,-73.9246557202094,-73.9246808194912,-73.9247234218514,-73.9247785346066,-73.9249032747308,-73.923805256055,-73.9218295504334,-73.9213884275242,-73.9210641308731,-73.9205864187729,-73.9203928019909,-73.9197851074929,-73.9191594383817,-73.9188801439161,-73.9185368887621,-73.9181640545842,-73.9180026358522,-73.9178178379003,-73.9178124080557,-73.91786009435,-73.9178996312466,-73.9176348820749,-73.916941610784,-73.9168513803353,-73.9167084917179,-73.9167207100809,-73.9167273215971,-73.9167281398859,-73.9167231418735,-73.9166734321281,-73.9151845587168,-73.9152339741942,-73.9154317295843,-73.9150144958604,-73.9145903924332,-73.9142908008759,-73.9141854352988,-73.9138855399871,-73.9128685787661,-73.9128761283325,-73.9128887597666,-73.9129061978809,-73.9129280627666,-73.9129538780704,-73.9130008154489,-73.9130425669675,-73.9130782762246,-73.9131072107524,-73.9131135010061,-73.9131169990287,-73.9131176168649,-73.913115338978,-73.9131102226412,-73.9131023964972,-73.9130920573239,-73.9130794650871,-73.9129971404434,-73.9129104699953,-73.9128202172689,-73.9127271773519,-73.9126493217288,-73.9123405116745,-73.9123591844843,-73.9123221765587,-73.9122810701675,-73.9122686885144,-73.9122758401166,-73.911819523938,-73.9117749582111,-73.9115789574935,-73.911504753949,-73.9114919070374,-73.9115361890545,-73.9114488247338,-73.9114321302785,-73.9114733209973,-73.9115004578357,-73.9115502902824,-73.9116547240221,-73.9114995907482,-73.9114377620283,-73.9113805213058,-73.911328284461,-73.9112814310221,-73.9112403014074,-73.9112051944518,-73.9112019286101,-73.9112020915845,-73.9112056793843,-73.9112126041006,-73.9112226960605,-73.911235707984,-73.9112010369632,-73.9111583414952,-73.9111079047459,-73.9110500612307,-73.9109851945965,-73.9109137350774,-73.910864461345,-73.9108181472412,-73.910778009319,-73.9107423865345,-73.9107120447705,-73.9106633587891,-73.9103325684898,-73.9101127662511,-73.9085115501761,-73.9024566400494,-73.9006038605853,-73.8999535138472,-73.8981048968874,-73.8972532635489,-73.8966333386324],"lat":[40.9114173753489,40.9112989271071,40.9112988776876,40.9102022486224,40.9096276596512,40.9082858241623,40.9075066550445,40.9063396529452,40.9050929990697,40.9045045208209,40.9032001315844,40.9029611087199,40.9022035130852,40.9010405801358,40.9006111675785,40.900315204249,40.9002786212819,40.9002247030685,40.9000838913376,40.8996194349772,40.8993718266773,40.8985933177028,40.8978787238792,40.8958050299172,40.8936552799275,40.8926454435717,40.8921404575288,40.891710684183,40.8916158607094,40.8910102454727,40.890681823998,40.8905093897077,40.8902761012422,40.8894579429989,40.887530803064,40.8872490897004,40.8867794872161,40.8866387310399,40.886529123508,40.8865148870103,40.8863835018048,40.8860867717957,40.8860448242452,40.8859993472759,40.8859645908544,40.885955255508,40.8859369891962,40.8858283245211,40.8856415115047,40.8855199415863,40.8855940638741,40.8853114345968,40.8852643063068,40.885049846262,40.8848678434673,40.8846857465929,40.8845039191596,40.8844170751705,40.8842876181292,40.884255619663,40.8843495758467,40.8842355206172,40.8840402323784,40.8837970273205,40.8837299443871,40.8836739859517,40.8832009399455,40.8831509449589,40.8831179381563,40.8830839422346,40.8830549784291,40.8828201576411,40.8827524355289,40.8825765113955,40.8824768960662,40.8824850739581,40.882484072112,40.8824685728229,40.8824385821485,40.8823945020752,40.8823371139957,40.8822675418619,40.8802331314222,40.8800417137645,40.8798570960415,40.8798570235833,40.8798569611762,40.8796795643438,40.8795170968304,40.8793438553659,40.879161079743,40.8791608998241,40.8791607193917,40.8789694462465,40.8780578022822,40.8778234340022,40.8755877455144,40.8714452336453,40.8708566433986,40.8696585744867,40.8695253556017,40.8693813867849,40.8692280281048,40.8690668420795,40.8688996138891,40.8687282082563,40.8685545787816,40.8680173015104,40.8682839038865,40.8683366796482,40.8683959529535,40.8684616358937,40.8685336307776,40.8686118311246,40.8686961209535,40.8691489914912,40.8695956271401,40.8699491633589,40.8703612760012,40.8705785485483,40.8722453087808,40.8723303282517,40.8723304188916,40.8723304996567,40.8724153949978,40.8724155206787,40.8724156289577,40.8724950228023,40.8724952112054,40.8724953919421,40.8725644463066,40.8725645001305,40.8725645539741,40.8726198789964,40.8731383221018,40.8731826604275,40.8731958174268,40.873226989181,40.8732424201914,40.873260204729,40.873319047922,40.8733803787288,40.8733967627434,40.8735473542364,40.873775443923,40.8745887681463,40.8746381440676,40.8742718145447,40.874060742302,40.8739759430611,40.8740150269989,40.8740850221116,40.8741097374883,40.8741463960401,40.8741796404157,40.8742214122519,40.874242725001,40.8742657397945,40.8742819410761,40.87431007178,40.8743237041509,40.874316047891,40.8743313694988,40.8743448156469,40.8744179211002,40.874423045964,40.8744281831705,40.8744316127724,40.8744392858029,40.8744452489807,40.874447815204,40.8744563376665,40.8744571920727,40.8744733741374,40.8744759447662,40.8744878615542,40.8744904313174,40.874489579546,40.874496395223,40.8745015248325,40.8745057883776,40.8745160228703,40.8745211442426,40.8745220143366,40.874532671044,40.8745412059888,40.8745505789385,40.8745539937721,40.8745557194015,40.8745608287689,40.8745582787154,40.8745659444332,40.8745659529967,40.8745770212521,40.8745787289304,40.8745744729076,40.8745727772042,40.8745625684232,40.874583038139,40.8745958473945,40.8746137751549,40.8746214562331,40.8746350999659,40.874641908775,40.8746505629472,40.8746585412123,40.8746545589277,40.8746551385941,40.8746540215747,40.874667706562,40.8746682915078,40.8746757107073,40.8746745747573,40.8746694467038,40.8746785863202,40.8746768833404,40.8746837331538,40.8746917168083,40.8746940082284,40.8746865933778,40.8746940179323,40.8747002817259,40.8747025754246,40.8746985820648,40.87470600433,40.8747020127459,40.8747071626092,40.8747071683106,40.8747117407225,40.8747185985448,40.8747151833375,40.8747186116607,40.8747180438393,40.8747237573416,40.8747283388927,40.8747306243426,40.874736902622,40.8747403338956,40.8747340607429,40.8747352137713,40.8747437735435,40.8747494853974,40.8747517800533,40.8747569247389,40.8747643632697,40.8747797908186,40.8747837987426,40.874788955767,40.8747895481354,40.8748001090639,40.8748024002144,40.8748024045389,40.8748024155514,40.8748149727921,40.8748109961071,40.8748167094249,40.8748252803211,40.8748298399712,40.8748298513247,40.8748395676309,40.8748475586712,40.874847001251,40.8748549940972,40.8748458692532,40.8748498744516,40.874857866793,40.8748578792687,40.8748561812052,40.8748493355287,40.8750178501974,40.8750360165633,40.8750340717768,40.8750347276411,40.8750443129933,40.8750471333254,40.8750531029674,40.8750520656332,40.8750587276403,40.875065735741,40.8750646927202,40.8750654113498,40.8750619160274,40.875064726179,40.8750580795542,40.8750960324396,40.8751240097955,40.8751240168257,40.8751294885351,40.8751827016239,40.8752082358149,40.8755945293474,40.875593003956,40.8755992036011,40.875607736463,40.875620920052,40.8756319311675,40.8756365705266,40.8756431960197,40.8756455238628,40.8756538008005,40.8756581137646,40.8756627457504,40.8756776389499,40.8756852797087,40.8756929055994,40.8757094359155,40.8757130860263,40.8757169450649,40.8758090035806,40.8758020592156,40.8757869042733,40.8757622501532,40.8756806840578,40.8756636278607,40.8756769551945,40.8757378049118,40.8757777713369,40.8758044288965,40.8757949931426,40.8758179160084,40.8758445295441,40.8758559463231,40.875848356389,40.875836976332,40.8760648818263,40.876421436609,40.8764975543778,40.876508887421,40.8765450618915,40.8765468304126,40.8765488958108,40.8765926471237,40.8766268836582,40.8766569205095,40.8766629812373,40.8766800977675,40.8766801038958,40.8766801255057,40.8767238657915,40.8769519902771,40.8781365426219,40.8781571020792,40.8781847936899,40.8781985430829,40.8782509837006,40.8783517965694,40.878572414803,40.8786098637857,40.8786454964916,40.8786830902472,40.8786983342941,40.8786984631215,40.8787066447912,40.878744755446,40.8787665758689,40.8787761116834,40.8788668138341,40.8789054454279,40.8789320915677,40.8789511460479,40.8789549993146,40.8789303539074,40.8789055554322,40.8789228073068,40.8789342365734,40.8789361519494,40.8789304889712,40.8789210712965,40.8789153011101,40.8789077227411,40.8789521593327,40.878900860406,40.8788987129931,40.878852758536,40.8788549012864,40.8788153559321,40.8788260744987,40.8788634965134,40.8788656261365,40.8789115833993,40.8789115768776,40.8789639432433,40.8789840360969,40.8789935690825,40.8789802871051,40.8789765357404,40.8789841633156,40.8789993859748,40.8790146008582,40.879022235499,40.8790203483059,40.8790070502859,40.8790052256351,40.8790186150336,40.8790472389572,40.8790586595619,40.8790510693546,40.8790206636449,40.879003587085,40.8790188133257,40.879015039238,40.8789618432268,40.8789295632754,40.8789048931378,40.8788883678532,40.8803249016361,40.8845116013394,40.8854590518583,40.886155561205,40.8871826781173,40.8876485002269,40.8892864443076,40.8908943534716,40.8916057219529,40.8925456829155,40.89356661453,40.8940086163483,40.894416425568,40.8945352796889,40.8946006142797,40.8946690095369,40.8949419053522,40.8966445517024,40.8969307828571,40.8973840552705,40.8974087036203,40.8974345556726,40.897460882676,40.89748694249,40.8975270526165,40.9015842828622,40.9016967972457,40.9018126836884,40.9030812991065,40.9041190021964,40.9040932074626,40.9041403909687,40.9049577649854,40.9075354758935,40.9075620920407,40.9075875751423,40.9076113700141,40.9076329582514,40.9076518695241,40.9076768547826,40.9077066707704,40.9077407059113,40.9077782620861,40.9077912842431,40.9078048970307,40.9078187581718,40.9078325191443,40.9078458339448,40.9078583677879,40.9078698055244,40.9078798595653,40.9079179598965,40.907950036674,40.9079758073147,40.9079950447891,40.9080708119554,40.9090581947693,40.9091367335769,40.9091888449396,40.9091933610948,40.9092301485024,40.9092635165555,40.9111483348636,40.9112521873627,40.9121359593199,40.9121698793769,40.9122337693121,40.9123020622746,40.9127546825887,40.9128238262197,40.9129109035368,40.912968269326,40.9130698126947,40.9134178518967,40.9137665817048,40.9138054512633,40.9138481739078,40.9138944392452,40.9139439111429,40.9139962301711,40.9140510162135,40.9140674897336,40.9140841480481,40.9141005829813,40.9141163918308,40.9141311872345,40.9141446066626,40.9142204847831,40.9142939709988,40.914364577888,40.9144318371259,40.9144953025903,40.9145545533219,40.9145662025195,40.9145834798618,40.914604664217,40.9146300734131,40.9146591611613,40.9147964203062,40.9155327765027,40.9153987341446,40.9150022640264,40.912958933426,40.9126072658993,40.9123834347655,40.9117906000102,40.9116555204412,40.9114173753489]}]],[[{"lng":[-73.7469397001251,-73.746943206382,-73.7470491317052,-73.7470431634196,-73.7469397001251],"lat":[40.6375542352153,40.637529202177,40.6375451343996,40.6375664269618,40.6375542352153]}],[{"lng":[-73.7998195446255,-73.7978588167746,-73.7976123758087,-73.7970129189816,-73.7964149265147,-73.795890798775,-73.7958191481579,-73.7952263042856,-73.7939431779478,-73.7925643312553,-73.7919946470631,-73.7911891908512,-73.7905783251857,-73.7900598003176,-73.7899673676853,-73.7899075998327,-73.7898434719976,-73.7881167984523,-73.7875117799428,-73.7861847037956,-73.7850251380631,-73.7841565762977,-73.7839398185867,-73.7829039833809,-73.7793694751359,-73.7793105067034,-73.7792262575534,-73.7790991216144,-73.7789689472066,-73.7788359205605,-73.7787002319852,-73.7785620757681,-73.7784216493244,-73.7782791535562,-73.7781347923249,-73.7776299353881,-73.7774306750304,-73.7772337035326,-73.7770393092753,-73.7768477768636,-73.7766593867108,-73.776474414498,-73.7762931311092,-73.7761158019386,-73.7759426865885,-73.7757740384892,-73.7752530803675,-73.7746032624106,-73.7745447294383,-73.7744768829416,-73.7721062607331,-73.770286208232,-73.769743641745,-73.7690490402092,-73.7689911301614,-73.7689965406991,-73.768951778703,-73.7683274016358,-73.7681199793464,-73.7677065346624,-73.7673909708656,-73.7672056655397,-73.7668759760595,-73.7666959390493,-73.7662800826662,-73.7656689709815,-73.7647545539745,-73.7641777017885,-73.7640629014157,-73.7635989728986,-73.76277911964,-73.7579393745807,-73.7574546223855,-73.7546575813913,-73.7541108667463,-73.7528415105018,-73.7515738419136,-73.7484077951259,-73.748236168919,-73.7480697628182,-73.7479087752626,-73.7477533982256,-73.7476038169861,-73.7474602099074,-73.7471166625671,-73.7443211473035,-73.7439906316605,-73.7440259471514,-73.7445149239263,-73.7446210730149,-73.7467945086395,-73.7468202546636,-73.746841879311,-73.7468587512377,-73.746870377856,-73.7468764197157,-73.7468767004156,-73.7468712117537,-73.7468601139682,-73.7468437310593,-73.7468166874558,-73.7467855231968,-73.7467503371194,-73.7467254706872,-73.7466981118376,-73.7466686901401,-73.7466370818393,-73.7466160618808,-73.7466009130314,-73.7465920033127,-73.746589549179,-73.7465193841519,-73.74651936401,-73.7465121227545,-73.746497720916,-73.7464762789014,-73.7464479759878,-73.7464304189264,-73.7464160831199,-73.7464053815455,-73.7463986224892,-73.7463960006642,-73.7463975916018,-73.7464033494748,-73.7464059380326,-73.7464061576904,-73.7464040028586,-73.7463995283581,-73.7463928480256,-73.7463841318176,-73.7463736014865,-73.7463615249389,-73.7463508691434,-73.7463417172401,-73.7463343164017,-73.7463288665087,-73.7463255147513,-73.7463243516539,-73.74632540863,-73.7463286571343,-73.7463340094326,-73.7463413209721,-73.7463503942848,-73.7463609843208,-73.7463686244357,-73.7463724514111,-73.7463723664107,-73.7463683716262,-73.7463570365027,-73.7463542236007,-73.7463600143337,-73.7463632374785,-73.7463591289658,-73.7463477012961,-73.7463289892989,-73.7463030500265,-73.7462699625807,-73.7462298278716,-73.7461827683104,-73.7461773987399,-73.7461735352625,-73.7461712790151,-73.7461706890611,-73.7461717808448,-73.7461745257865,-73.7461788520308,-73.7461846463278,-73.7462274124437,-73.7462637918083,-73.7462928618748,-73.7463138854475,-73.7463099050335,-73.746307063574,-73.7463054369777,-73.7463050686987,-73.7463059685757,-73.7463081125694,-73.7463114434039,-73.7463158720977,-73.7463212803401,-73.7463366399571,-73.7463479350888,-73.7463549425576,-73.746357523903,-73.746359088334,-73.7463542590451,-73.7463418995853,-73.746322336371,-73.7462960860805,-73.7462841108028,-73.7462775997289,-73.7462767123012,-73.7462814702566,-73.7462917570947,-73.7463073209289,-73.7463277806545,-73.7463465353728,-73.7463590039717,-73.7463650670882,-73.7463646666717,-73.7463578065403,-73.7463515507916,-73.7463460611203,-73.7463414710065,-73.7463378920581,-73.7463354112966,-73.7463340890415,-73.7463349654594,-73.7463355117049,-73.7463357143267,-73.7463355683355,-73.7463350773262,-73.7463342533896,-73.7463331168149,-73.74633169559,-73.7463300247118,-73.7463281453253,-73.7463199886637,-73.7463154673816,-73.7463146786814,-73.746326395996,-73.7463389707448,-73.7463543736777,-73.746348795562,-73.7463743094946,-73.746431726315,-73.7465080663718,-73.7465432005981,-73.746576548184,-73.7466407000411,-73.7466758862747,-73.7467048941184,-73.7467203748709,-73.7467411640674,-73.7467534323909,-73.7467714817989,-73.7467947694639,-73.7468225950163,-73.7468541216082,-73.7468627942167,-73.7468705398447,-73.7468771551783,-73.7468824665722,-73.7468863346082,-73.7468886577542,-73.7468893750297,-73.7468884676065,-73.7468859348754,-73.7468818452874,-73.7468803255348,-73.7468846512377,-73.7468947374244,-73.7469049971575,-73.7469188472653,-73.7469359048609,-73.7469556983849,-73.7469776806417,-73.7469863653093,-73.7469947700692,-73.7470093002939,-73.747022182048,-73.747028793318,-73.7471879037269,-73.747190891057,-73.7472029394658,-73.7472239091935,-73.7472535569736,-73.7472915388541,-73.747337414187,-73.7473906507404,-73.7473963211011,-73.7474029040966,-73.7474102996091,-73.747414533152,-73.7474327798078,-73.7474502610082,-73.7474665276712,-73.7474811619149,-73.7474937877932,-73.7475040809532,-73.7475117769679,-73.7475166781292,-73.747518658527,-73.7475169513628,-73.7475169978346,-73.7475187967948,-73.7475223037913,-73.7475274321662,-73.7475340551966,-73.7475420092265,-73.7475489643806,-73.7475558432272,-73.7475624663887,-73.747568661155,-73.7475742659869,-73.7475791347288,-73.74758314042,-73.7475861786049,-73.7475881700575,-73.747589062847,-73.7475888336921,-73.7475874885682,-73.7476099448478,-73.7476392052209,-73.7476747478197,-73.7477159387255,-73.7477620432752,-73.7477687069576,-73.7477752429555,-73.7477814624691,-73.7477928895427,-73.747811856344,-73.7478285559511,-73.7478478428813,-73.7478619116874,-73.747870468285,-73.7478763547544,-73.7478869867864,-73.7479020630196,-73.7479211561207,-73.7479437248963,-73.7479691296338,-73.7479966502334,-73.7480148911809,-73.7480322808836,-73.7480482910553,-73.7480624353183,-73.7480738789326,-73.7480828765101,-73.7480891751035,-73.7480891651305,-73.7480939884751,-73.748103520305,-73.7481175139229,-73.7481356071508,-73.7481573317042,-73.7481821253114,-73.7482093462664,-73.748224505874,-73.7482384604497,-73.7482506896511,-73.7482612893203,-73.7482700665636,-73.7482768616513,-73.7482989454319,-73.748322529403,-73.7483484918886,-73.7484005977077,-73.748427570198,-73.7484508203321,-73.7484663308242,-73.7485294905456,-73.748554500353,-73.748751212618,-73.7487682838873,-73.7487655756941,-73.7487689866782,-73.7486905273169,-73.7486925485396,-73.7487810333243,-73.7488045466766,-73.7488695509985,-73.7488504791448,-73.7488971817951,-73.7489280638853,-73.7489586614961,-73.7489651597192,-73.7489777074688,-73.7489902584803,-73.7490024872893,-73.7490140767864,-73.7490374083218,-73.7490591596099,-73.7490788396554,-73.7490960042182,-73.7491102658414,-73.7491213025973,-73.749128865354,-73.7491721951647,-73.7492170233818,-73.7492869335577,-73.7493101825797,-73.7493356768327,-73.7493627341802,-73.7493906306635,-73.749418619872,-73.7494304290493,-73.7494419077666,-73.7494527427241,-73.7494626381924,-73.7494713240845,-73.7494785633274,-73.7494841583328,-73.7494878424929,-73.7494896754714,-73.7495072729692,-73.7495332921571,-73.7495670259359,-73.7496075575463,-73.7496537854822,-73.7497044534263,-73.7497207745277,-73.7497366298382,-73.7497516806455,-73.7497624530595,-73.7497724308755,-73.7497846030697,-73.749794758508,-73.7498026580152,-73.7499173743372,-73.7500684004765,-73.750115482505,-73.7502357487875,-73.7503971733813,-73.7504838151869,-73.7505279484331,-73.7505410461622,-73.7506290520016,-73.7506746049375,-73.7510750902749,-73.7511514461719,-73.7512525162195,-73.7513375785353,-73.7513595267368,-73.7513962772243,-73.7514182360126,-73.7514566807305,-73.7514857592408,-73.7515473361358,-73.7516090128214,-73.7516663139873,-73.7516763805654,-73.7517130246692,-73.7518657022745,-73.751967171878,-73.7520490267428,-73.7522092510301,-73.752526268146,-73.7527788793198,-73.7530341473332,-73.7530811747602,-73.7532709049278,-73.7534036535613,-73.7532111244768,-73.7532332826944,-73.7535419183588,-73.7535256581673,-73.7534223877159,-73.753292106749,-73.7533507681671,-73.7534063211718,-73.7534575837746,-73.7535034652691,-73.7535429894376,-73.753558734195,-73.7535765986108,-73.7535961771532,-73.7536170253786,-73.7536386700202,-73.753660619732,-73.7537198634956,-73.7537784633168,-73.7538353901608,-73.7538896443693,-73.7540619043758,-73.7542780985677,-73.7543914256183,-73.7545036960146,-73.7547559255195,-73.7548797158681,-73.7549276864291,-73.7546120843802,-73.7537928936934,-73.7536600374919,-73.7537670680897,-73.7537377082635,-73.7534018950716,-73.753436116095,-73.7536113410445,-73.7537614636137,-73.7505703281196,-73.7504850303251,-73.7503266117977,-73.7501442858551,-73.7490763129122,-73.7490018091226,-73.7489203284942,-73.7488323264253,-73.7487382947573,-73.7487070149653,-73.7486271361612,-73.7485408225266,-73.7484481674958,-73.7483492713627,-73.7482442411719,-73.748133190603,-73.7480162398473,-73.7477652491534,-73.7477037726398,-73.7476372136735,-73.747565628755,-73.7475610724981,-73.7475608971261,-73.7475492184357,-73.7475290928517,-73.7475007636394,-73.7474645732129,-73.7474209589963,-73.7474068387727,-73.7473988709937,-73.747397247222,-73.7474020064895,-73.7474130343593,-73.7474300656783,-73.7474526909529,-73.747480366195,-73.7474924164986,-73.7475038490069,-73.7475143504607,-73.7475236331129,-73.7475314426121,-73.7475375649732,-73.7475418324396,-73.7475441280805,-73.7475443889946,-73.7475426080335,-73.7475388339976,-73.7475331702987,-73.7475257721266,-73.7475168421963,-73.747506625194,-73.747485438281,-73.7474764826619,-73.7474618281017,-73.7474418328071,-73.7474344399648,-73.7474359998179,-73.7474465061909,-73.747465917741,-73.7474941581208,-73.7474844221609,-73.7474836814846,-73.74749194592,-73.7475091055172,-73.747534932013,-73.7475445368563,-73.7475500033529,-73.7475511903354,-73.7475480671544,-73.7475336922499,-73.7475272049596,-73.7475287788661,-73.7475383718393,-73.747555727165,-73.7475803804158,-73.7476202432832,-73.7476314390395,-73.7476181103501,-73.7476305730106,-73.7476644928835,-73.7476758240128,-73.7476804003228,-73.7477147538997,-73.7477422993089,-73.7477260607187,-73.7477260974419,-73.7477750015817,-73.7477795287408,-73.7477851843689,-73.747812251914,-73.7478212875051,-73.7478269577178,-73.7478281120076,-73.7478292624092,-73.7478281572006,-73.747827054556,-73.7478170347376,-73.7478159320942,-73.7478159385526,-73.7478159482368,-73.7478194975975,-73.7478299563936,-73.7478357040553,-73.7478470717831,-73.7478606716346,-73.7478957798795,-73.7479105339389,-73.7479298819564,-73.747942467055,-73.7479459592512,-73.7479451491761,-73.7479474716309,-73.7479509096296,-73.7479702100006,-73.7479951320462,-73.7480267970751,-73.7480290855586,-73.7480313757249,-73.7480315660139,-73.7480338865221,-73.7480384387038,-73.7480452397762,-73.7480803151142,-73.748092790749,-73.7480996601587,-73.748110064438,-73.7481169267196,-73.7481248858479,-73.7481271476248,-73.748143918011,-73.7481634202261,-73.7481819589211,-73.748211987735,-73.7482674701861,-73.748363469708,-73.7483981553617,-73.7484017373782,-73.7484132261591,-73.7484342180448,-73.7484576989299,-73.7484337636631,-73.7484304741552,-73.7484507265556,-73.7484964125477,-73.7485283727713,-73.7485547839491,-73.7485703750445,-73.7486475250617,-73.7486891364901,-73.748716476956,-73.7487314070713,-73.7487572942326,-73.7487963510959,-73.7489547449872,-73.7490352869346,-73.7491041885201,-73.7491829151816,-73.7492475572515,-73.7492908326172,-73.7493210684411,-73.7493544696593,-73.7494338655436,-73.7495115586185,-73.7496509467005,-73.7497643350072,-73.749868924722,-73.7499145880297,-73.7499367586389,-73.7499623415303,-73.7500653387867,-73.7501348060012,-73.7502690195163,-73.7504070966823,-73.7504843077406,-73.7505908328842,-73.7506960697414,-73.7507521403835,-73.7507721591851,-73.7507839461392,-73.7507924231261,-73.7508295962761,-73.7509636142045,-73.7510955479154,-73.7511504990934,-73.7512269167548,-73.7512908902215,-73.7513042346946,-73.7513472916091,-73.7514068715285,-73.7514934532144,-73.7515164891498,-73.7515322788031,-73.751549411876,-73.7515737562212,-73.7516371729507,-73.7518387235027,-73.7519150936973,-73.7520238550432,-73.7520785388719,-73.7521262186873,-73.7521685044792,-73.7521930035398,-73.752265336406,-73.7523359524697,-73.7523911035077,-73.7524375857295,-73.75249535224,-73.7525857831663,-73.7526402361898,-73.752740186765,-73.752943916069,-73.753053342552,-73.7531912057823,-73.7534019160191,-73.7534839772474,-73.7534999986063,-73.7535068958511,-73.753520501558,-73.7535268983105,-73.7535515731251,-73.753600295491,-73.7536789975171,-73.7537468078235,-73.7537661555233,-73.7537661032922,-73.753752130085,-73.7537574005203,-73.753786940558,-73.7538696914059,-73.7539491653516,-73.7540988170183,-73.7541071681367,-73.7541434201449,-73.7541742552585,-73.7542168444695,-73.7542710578018,-73.7542996112479,-73.7543365784819,-73.754350683643,-73.7543807018513,-73.7544131432106,-73.7544465774878,-73.7545032509407,-73.7545471738545,-73.7545763416686,-73.7545973227583,-73.7546061886553,-73.7546226607265,-73.7546412137972,-73.7546700606754,-73.7547242769989,-73.7547635567585,-73.7547910030492,-73.7548310304517,-73.7549029038447,-73.7549282037131,-73.7549741627584,-73.7549883678877,-73.7549994419332,-73.7550463474472,-73.755074977083,-73.7551063239735,-73.7551262783802,-73.7551421055717,-73.755166245897,-73.7551797262162,-73.7552025320754,-73.7552151800178,-73.7552319510911,-73.7552606355734,-73.7552825618366,-73.7552940794746,-73.7553103290995,-73.7553276077021,-73.7553389562148,-73.7553570534012,-73.7553850898911,-73.7554191403418,-73.7554611033922,-73.7555001374921,-73.755524464149,-73.7555545348726,-73.7555974801771,-73.7556139574111,-73.7556145836109,-73.7556168386635,-73.7556408545354,-73.7556609380233,-73.7556802184708,-73.7556975819166,-73.7557508704521,-73.755771979584,-73.7557830737974,-73.7557955968219,-73.7558191583279,-73.7558476146552,-73.7558590453166,-73.7558749426843,-73.7558959003854,-73.755925470456,-73.7559766009522,-73.7560027549445,-73.7560363447615,-73.7560597089083,-73.7560761288464,-73.7561050656807,-73.7561310958627,-73.756157874089,-73.7561746462377,-73.7562044900603,-73.7562253852841,-73.7562615464047,-73.7562880572202,-73.7563154476996,-73.7563308377861,-73.7563396695295,-73.7563461648814,-73.7563568605385,-73.7563704906134,-73.7563869328948,-73.7563937982453,-73.756399956022,-73.7564276628577,-73.7564484542498,-73.7564890355773,-73.7565536935129,-73.7566070666747,-73.7566445532383,-73.7566658355418,-73.7567041387217,-73.7567400497028,-73.7567922456001,-73.7568608025258,-73.7569501998047,-73.7569751566555,-73.7570007671327,-73.7570134963153,-73.7570378272589,-73.7570701816574,-73.7571188239378,-73.7571319306528,-73.7571411018584,-73.7571482629718,-73.7571589225281,-73.7571671507602,-73.7571727587296,-73.7571799633676,-73.7571927963411,-73.7572177179535,-73.7572520568775,-73.7573015381185,-73.7573459708204,-73.7573881005599,-73.7574242815303,-73.7574541816833,-73.757473277096,-73.7574838884784,-73.7574985822106,-73.7575297757395,-73.7575489943577,-73.7575730563799,-73.7576396789272,-73.7576620656359,-73.7576813462048,-73.7577069149015,-73.757735575542,-73.7577670499684,-73.7578144139575,-73.7578626842789,-73.7579037656372,-73.7579601153014,-73.7579990636154,-73.7580435357901,-73.7580889971835,-73.7581413229889,-73.7581859026266,-73.7582205583179,-73.7582670633135,-73.7583167969557,-73.7583743121067,-73.7584084189022,-73.7584351346835,-73.7584600495784,-73.7584855491345,-73.758516389643,-73.7585468931052,-73.7585679580541,-73.7586231101156,-73.7586843854913,-73.7587421556487,-73.7587808949334,-73.7588504369171,-73.7589729523689,-73.7590095540089,-73.7590418363184,-73.7590722984281,-73.7591010486608,-73.7591298748086,-73.7591592156777,-73.7591872321849,-73.7592237494763,-73.7592580465134,-73.7592898084371,-73.7593110387931,-73.7593230606495,-73.7593328523894,-73.7593490542556,-73.7593765651813,-73.7594068966934,-73.7594288145083,-73.7594520781205,-73.7594834003843,-73.7595321243526,-73.7595599534611,-73.759590478162,-73.7596189529997,-73.7596854707686,-73.7598033724689,-73.7598330649307,-73.7598683441776,-73.7598885173472,-73.7599049945028,-73.7599308570891,-73.7599472289746,-73.7599791832095,-73.7600120155399,-73.7600611930981,-73.7600906163702,-73.7601097130434,-73.7601231462507,-73.7601627856587,-73.7601927673573,-73.7602143962899,-73.7602543528186,-73.7602758974538,-73.7603175638522,-73.7603446395484,-73.7603744986221,-73.7604175948423,-73.7604428864773,-73.7604605472643,-73.7605061533219,-73.7605315984148,-73.7605700679954,-73.7606141373531,-73.7606800980296,-73.7606997266704,-73.7607199949353,-73.7607540534838,-73.7607671627936,-73.7607784108976,-73.7607890290534,-73.7607994939949,-73.7608234266874,-73.7608540408321,-73.7608854475618,-73.7609128371825,-73.760942094701,-73.7609687263903,-73.7609991775948,-73.7610266905418,-73.7610572642026,-73.7610966954456,-73.7611306782389,-73.7611682770681,-73.7612088467028,-73.7612321182093,-73.7612576118087,-73.761287857233,-73.7613131948617,-73.7613471186556,-73.7613901536528,-73.761437396878,-73.7614957850724,-73.7615181974965,-73.7615470835304,-73.7615848407413,-73.7616291920897,-73.7616782936784,-73.7617098196886,-73.7617399872956,-73.7617662441124,-73.7617861817048,-73.7618064045774,-73.7618423864632,-73.7618885122501,-73.7619210247977,-73.761968024412,-73.7619841201352,-73.76202127079,-73.7620246622602,-73.7620443916535,-73.7620643590497,-73.7620829632318,-73.7620969901392,-73.7621156332507,-73.762148768579,-73.7621940781379,-73.7622091014794,-73.7622220637493,-73.7622567824927,-73.7622760190373,-73.7622940112554,-73.7623405595861,-73.7623863707212,-73.7624338357212,-73.7625268036835,-73.7625925474565,-73.7626496260419,-73.7626999304602,-73.7627531752303,-73.7628087226907,-73.7628589049897,-73.7629007190831,-73.7629551509055,-73.7630223437053,-73.7630878967084,-73.7631069787327,-73.7631238207116,-73.7631267386084,-73.7631559831751,-73.763160551738,-73.7631652702642,-73.763170084466,-73.7631718316133,-73.7632077433603,-73.7632181445818,-73.763228297287,-73.7632381457836,-73.7632476257917,-73.7632566820462,-73.7632652603423,-73.7633128002737,-73.7633573032309,-73.7633697100868,-73.7633826654983,-73.7633960970319,-73.7634072845093,-73.7634188557223,-73.7634306823771,-73.7634414675092,-73.7634523592942,-73.7634632816264,-73.7634741604114,-73.7634849228769,-73.7635026316662,-73.763520364162,-73.7635380429598,-73.7635719955999,-73.7635779752854,-73.7635900114928,-73.7636018104818,-73.7636133240625,-73.7636192774738,-73.7636248412175,-73.7636299265296,-73.763632300871,-73.7636340019573,-73.7636349572673,-73.7636351311909,-73.7636345107518,-73.7636189263444,-73.7636178760909,-73.7636187368879,-73.7636203318978,-73.7636226024991,-73.7636254617001,-73.7636288008261,-73.7636324960768,-73.7636364076828,-73.7636801534634,-73.7637340233342,-73.7637941955143,-73.763807531616,-73.7638213577449,-73.7638356276511,-73.763870620694,-73.7639252337308,-73.7639844700796,-73.7640427240857,-73.7640656098469,-73.7640881011776,-73.7641101564682,-73.7641317310296,-73.7641675056327,-73.7642035933457,-73.7642399818538,-73.7642766279428,-73.7643135510575,-73.7643271697934,-73.7643404568497,-73.7643533655433,-73.7643658569003,-73.7643778853325,-73.7644145161047,-73.7644193266117,-73.7644246022247,-73.7644302330657,-73.764436106651,-73.7644421048351,-73.7644481020449,-73.7644577243446,-73.7644674204123,-73.7644770987767,-73.7644866675074,-73.7644960375218,-73.764499351146,-73.7645033086329,-73.7645078387513,-73.7645128665372,-73.7645183038841,-73.7645240569884,-73.7645300263729,-73.7645361088373,-73.7645431141041,-73.7645497120521,-73.7645557994821,-73.7645612787385,-73.7645660682385,-73.7645700910417,-73.7645786977438,-73.7645879752586,-73.7645978669854,-73.7646083066419,-73.7646192325521,-73.7646305737894,-73.764697364773,-73.7647130258508,-73.764728171209,-73.7647427565129,-73.7647567336962,-73.7647900421068,-73.764824083609,-73.7648588320766,-73.7648748470461,-73.7648912443045,-73.76490799289,-73.7649250649239,-73.7649352831757,-73.7649456846579,-73.7649561867252,-73.764966707369,-73.7649771619271,-73.7649874646221,-73.7649950563047,-73.7650022266063,-73.7650089140512,-73.7650150496895,-73.7650205830156,-73.765025462632,-73.76502963955,-73.7650330801634,-73.765035383361,-73.7650368995549,-73.7650376075846,-73.7650374928971,-73.7650365593866,-73.7650348221859,-73.7650323060939,-73.7650290506683,-73.7650251035974,-73.7650189362296,-73.7650121711835,-73.7650048512208,-73.7649970202133,-73.7649887226885,-73.7649800071571,-73.7649709287231,-73.7649615392217,-73.764949721541,-73.7649382928965,-73.7649273163201,-73.7649168460255,-73.7649069388625,-73.7648622800599,-73.7648527553844,-73.7648426945047,-73.7648321411054,-73.7648235424902,-73.7648143214075,-73.7648045518265,-73.764794310796,-73.76478368024,-73.7647734938918,-73.7647638035247,-73.7647547015764,-73.7647462681399,-73.7647430918824,-73.764740521842,-73.7647386362133,-73.7647374824067,-73.7647370963561,-73.7647374876024,-73.7647386461263,-73.7647428973486,-73.764747750603,-73.7647531674681,-73.7647590987901,-73.7647654969507,-73.7647723090664,-73.7647794741292,-73.7647989782821,-73.7648180940381,-73.7648367522837,-73.7649064084826,-73.7649337712963,-73.7649616233955,-73.7649899414326,-73.765018699199,-73.7650478797355,-73.7650774498148,-73.7651008950947,-73.7651240513858,-73.7651468990924,-73.7651694192791,-73.7651915846462,-73.7652133777982,-73.7652347751675,-73.7652557626529,-73.7652942981375,-73.7653324583967,-73.7653702317583,-73.7654704939803,-73.7655373025711,-73.7655915261879,-73.7656476599302,-73.7656816219455,-73.765728580802,-73.7657755646841,-73.7658118161817,-73.7658503754865,-73.7658950458283,-73.7659401031123,-73.7659729360681,-73.7660729458727,-73.7661203126078,-73.7661928358242,-73.7663986309527,-73.7664616109625,-73.7664956050691,-73.7665299787848,-73.7666708693347,-73.7666845750636,-73.7666976285451,-73.766710020056,-73.7667217409605,-73.7667327789028,-73.7667431245932,-73.76675277072,-73.7667617121689,-73.7667699337189,-73.7667774337798,-73.7668454077173,-73.766849972149,-73.7668537781107,-73.7668568074256,-73.7668590452197,-73.7668604814448,-73.7668611064935,-73.7668609175796,-73.7668599200511,-73.7668611368994,-73.7668630609252,-73.766865671705,-73.7668689409331,-73.7668728424832,-73.76687733618,-73.766882379666,-73.7668879239785,-73.7668939184278,-73.7669143172083,-73.7669345583105,-73.7669546014769,-73.7669744090876,-73.7669939419593,-73.7670000611591,-73.7670053608254,-73.7670098133368,-73.7670133976263,-73.7670160941844,-73.7670178892104,-73.7670187743919,-73.7670161662372,-73.7670145545626,-73.767013941914,-73.767014330619,-73.7670157179457,-73.7670151200684,-73.7670153472271,-73.7670163970537,-73.7670182664946,-73.7670209366862,-73.7670243942676,-73.76702861774,-73.7670335724142,-73.7670392326374,-73.7670455542743,-73.7670524987121,-73.7670600185396,-73.7670692231355,-73.7670776168137,-73.7670851915479,-73.7670919234979,-73.7670977993581,-73.7671028080338,-73.7671236249946,-73.767145146777,-73.7671673698598,-73.7672125506337,-73.7672585552604,-73.7673053758046,-73.7673530085153,-73.7674014513824,-73.7674130761345,-73.7674254688693,-73.767438623146,-73.7674525330066,-73.7674671764529,-73.767482561084,-73.7674986802709,-73.7675155218755,-73.7677211537639,-73.7677576800432,-73.7677722654865,-73.7677723140311,-73.7677690626527,-73.7677691164806,-73.7677736470697,-73.7677770298826,-73.7677815336187,-73.7678510335164,-73.767933468777,-73.7681417802164,-73.768154159527,-73.768168783196,-73.7682328635975,-73.7682564832235,-73.7682677377341,-73.7682767506316,-73.7682823976002,-73.7682869263962,-73.7682903815059,-73.7682927896086,-73.768293978947,-73.768300915172,-73.7683054617409,-73.7683111203302,-73.7683257830935,-73.7683460563229,-73.7683663208659,-73.768418084684,-73.7684417210102,-73.7684586081676,-73.7685002399896,-73.7685142264366,-73.7685634075171,-73.768604087208,-73.76861714897,-73.7686235943198,-73.7686217708324,-73.7686206953167,-73.7686203698792,-73.7686207968378,-73.7686354989914,-73.768657931023,-73.7686877045599,-73.768724304131,-73.7687377248324,-73.7687500193133,-73.7687608801198,-73.7687700356511,-73.7687772569512,-73.7687823634346,-73.7687852274022,-73.7687857772346,-73.768783999183,-73.7687811026458,-73.7687779622816,-73.7687766698261,-73.7687772562929,-73.7687797076082,-73.7687839649485,-73.7687899261525,-73.7687974481724,-73.7688063505069,-73.7688163364501,-73.7688236260515,-73.7688280503061,-73.7688295066409,-73.7688279612936,-73.7688234500943,-73.7688160776351,-73.7688088263758,-73.7688048756039,-73.7688043407445,-73.7688072374217,-73.7688134810031,-73.7688228890722,-73.7688351867583,-73.7688384171419,-73.768840794235,-73.7688422532665,-73.7688427544809,-73.7688422842213,-73.7688408553016,-73.768838506657,-73.7688353022838,-73.7687574816108,-73.7687529171153,-73.7687510345104,-73.7687518894018,-73.7687554565368,-73.7687616305503,-73.7687702290768,-73.7686675992549,-73.7686398363376,-73.7686431284678,-73.7686101564793,-73.7685840602198,-73.7685650449087,-73.7685532600749,-73.7685530892061,-73.7685525283269,-73.7685527728421,-73.7685538237634,-73.7685556796925,-73.7685583352748,-73.7685644567074,-73.7685713432294,-73.7685789930167,-73.7685873972223,-73.7685965507318,-73.7686064464519,-73.7686170746512,-73.7686269619474,-73.7686361240184,-73.7686445601803,-73.7686522688716,-73.7686592487424,-73.7686631314703,-73.7686678171728,-73.7686732954551,-73.768679563596,-73.7686866107484,-73.7686944293707,-73.7687030072846,-73.7687123358522,-73.7687224004877,-73.7687331912266,-73.7687446932749,-73.7687517391171,-73.7687594814381,-73.768767902108,-73.768776982366,-73.7687866990386,-73.7687970340151,-73.7688079584246,-73.7688194506352,-73.7688314837659,-73.7688440267366,-73.7688570546492,-73.7688705353353,-73.7688844386278,-73.7691130470866,-73.7691499748244,-73.7691862890294,-73.7692219760304,-73.7692570215096,-73.7692914146577,-73.7693251387343,-73.7693392440053,-73.7693527788617,-73.7693657183833,-73.7693780431746,-73.7693897353512,-73.7694007737456,-73.7694111433373,-73.7694208244772,-73.7694298047924,-73.769438067932,-73.7694390950985,-73.7694408895737,-73.7694433942695,-73.769446523564,-73.7694501764824,-73.7694542287931,-73.7694585477618,-73.7694629886242,-73.7694674058073,-73.7694716513948,-73.7694755838994,-73.769479075989,-73.7694820072018,-73.7694895877037,-73.7694912254507,-73.7694936474523,-73.7694968387199,-73.7695007772014,-73.7695054336039,-73.7695107781765,-73.769514882053,-73.7695184325349,-73.7695213495749,-73.7695235632093,-73.7695250210276,-73.7695256882082,-73.7695255521106,-73.7695246119716,-73.7695228923207,-73.7695264706944,-73.7695309428889,-73.769536305753,-73.7695425521572,-73.7695496754396,-73.7695576669404,-73.769566517122,-73.7695762166849,-73.7695761464365,-73.7695769083152,-73.769578498659,-73.7695809126924,-73.7695841353304,-73.7695881569764,-73.7695929566009,-73.7695985140678,-73.7696048052771,-73.7696118021809,-73.7696295605644,-73.7696467453617,-73.7696633204576,-73.7696792569755,-73.7696945194401,-73.769709082704,-73.7697146401143,-73.7697194499627,-73.7697234848295,-73.7697267179485,-73.7697291302461,-73.769730705935,-73.7697314351686,-73.7697313144761,-73.7697303441253,-73.7697285292081,-73.7697258809866,-73.7697297459426,-73.7697453106777,-73.7697899514217,-73.7697940908081,-73.769797607292,-73.7698004595915,-73.7698026182702,-73.7698040560823,-73.7698047574375,-73.7698047144284,-73.7698039279521,-73.7698024054903,-73.769800165746,-73.769813320957,-73.7698051625517,-73.7698052345856,-73.769802543787,-73.7698053570452,-73.7698191275425,-73.7698219905529,-73.7698155809729,-73.7715638278995,-73.771476093109,-73.7714106878941,-73.771305633154,-73.7712382624075,-73.7711435537743,-73.7710711807374,-73.7710411193119,-73.7710286204483,-73.770973083201,-73.770914999461,-73.7709036408786,-73.770924954283,-73.7709073547107,-73.7709509974847,-73.7709284329042,-73.7708902139605,-73.770867399063,-73.7708327024371,-73.7708112894863,-73.7708393498663,-73.7708904483996,-73.7709114570795,-73.7708857689498,-73.7708383826606,-73.7708206970797,-73.7708600125076,-73.7709246589176,-73.7709687522885,-73.7709853777765,-73.771017925095,-73.7710684101276,-73.7710920485909,-73.7711027737106,-73.7710864602151,-73.7710833712524,-73.7710999588873,-73.7711462312972,-73.7711723904254,-73.771251949954,-73.7712944169888,-73.7713575106856,-73.7714187724035,-73.7714388366401,-73.7714562079496,-73.7715551046515,-73.7716029266012,-73.7716552251946,-73.7717276028514,-73.7717874217137,-73.7716878094125,-73.7716990840581,-73.7718020508899,-73.7718065553057,-73.771973183249,-73.771870213046,-73.7718814934359,-73.7719866984392,-73.7721454697065,-73.7720313143137,-73.7720729688007,-73.7721490467795,-73.7721882402803,-73.7727241829073,-73.7730856275284,-73.7734733756139,-73.7735006729403,-73.7734773057809,-73.7735310283738,-73.7735208785545,-73.7734660342232,-73.7732926658068,-73.7733497479159,-73.7733362347928,-73.7732836324803,-73.7731091404201,-73.7731628632555,-73.773151597999,-73.7730978751548,-73.7729256144366,-73.7729815822395,-73.7729647032208,-73.7729132215353,-73.7727443212582,-73.7727935624734,-73.7727811833139,-73.7727285739533,-73.7725574403958,-73.7726089222988,-73.7725965330096,-73.7725461699329,-73.7723727896455,-73.7724253934094,-73.7724118843109,-73.7723615224445,-73.77220950704,-73.7724031363918,-73.7723626016272,-73.7721689786682,-73.7721543447311,-73.7720046057531,-73.7721546447706,-73.7721848238353,-73.7721701833477,-73.7721536035702,-73.7719966927057,-73.7718210791248,-73.7718188277178,-73.7718244240368,-73.7719990449036,-73.7719877644844,-73.7718556963892,-73.7718131678185,-73.7717389758124,-73.7718603301859,-73.7725553624243,-73.7726614887584,-73.773001506999,-73.7732353724051,-73.7733693629254,-73.7734397297613,-73.7734866840499,-73.7734861654505,-73.773810244094,-73.7738325872655,-73.7734856041889,-73.7734946161459,-73.7735789732032,-73.7736434144031,-73.7736244966693,-73.7736591533506,-73.7736836365793,-73.774075264155,-73.7765422988784,-73.7794689768795,-73.7813619589163,-73.7848788874089,-73.7836307901584,-73.7832841582038,-73.7833669921649,-73.7834897575108,-73.7837772867501,-73.7843476424215,-73.7850119049104,-73.7857029374046,-73.7857077177014,-73.7859397466634,-73.786495055162,-73.786906666845,-73.7874306008714,-73.7877997237829,-73.7883233944035,-73.7892270196835,-73.7892734983958,-73.7893161891414,-73.7893540644566,-73.7893862127706,-73.7894118603439,-73.7894303898913,-73.7894413554386,-73.7894444930579,-73.7894397272202,-73.789427172615,-73.7894966307233,-73.7895151787827,-73.7895418794146,-73.7895761424281,-73.789617210481,-73.7896641758204,-73.7897160003473,-73.7897715385619,-73.7899607917847,-73.7901516103583,-73.7903436422085,-73.7904246552064,-73.7905040977256,-73.7905815760899,-73.7906567063577,-73.790703234859,-73.7907485622124,-73.7907588497605,-73.7907694747373,-73.7907801643333,-73.7907906440798,-73.7908006448964,-73.7908099099997,-73.7908182014964,-73.7908253064918,-73.7908310425557,-73.7908352624072,-73.7908378576955,-73.7908387617828,-73.7908146477735,-73.7907840141711,-73.7907471420723,-73.7907043698241,-73.7906937920087,-73.7906845797456,-73.7906769289901,-73.790671002483,-73.7906663734017,-73.7906644949083,-73.7906654234016,-73.7906685260133,-73.7906736934272,-73.7906960992853,-73.7907238490448,-73.7907563343418,-73.790792842991,-73.7935653410954,-73.7935660842363,-73.7957794868142,-73.7980375183471,-73.7979682950392,-73.798118722262,-73.7982761548127,-73.7981234798391,-73.7980553723507,-73.7958186394161,-73.7936501727697,-73.7936494287495,-73.7911948606937,-73.7908111125051,-73.7910813277266,-73.7912093785741,-73.7913087778823,-73.7913083705343,-73.7912508846191,-73.7912289850974,-73.7917470793118,-73.791882172218,-73.7919746031248,-73.7922231803763,-73.7928695037569,-73.7930847591326,-73.7932253164992,-73.7933055098205,-73.7934336919612,-73.7935903387631,-73.7937398609715,-73.7939107482364,-73.7939458346465,-73.794102992281,-73.7942596433388,-73.7944305456898,-73.7944501324473,-73.7945943402897,-73.7947438743328,-73.7948720305742,-73.7949583546952,-73.7951568395727,-73.7954345382262,-73.7955840854956,-73.7957977084219,-73.7959116202706,-73.7960825169177,-73.7963459863727,-73.7966165683257,-73.7966877730455,-73.7968159559689,-73.7969085306423,-73.7969512359493,-73.7970651648523,-73.7972574286707,-73.7974995510502,-73.797649100452,-73.7978627314211,-73.7980193849944,-73.7982330126522,-73.7983825624036,-73.7984970049823,-73.7985249912263,-73.7985520986981,-73.7986389192264,-73.7987457376064,-73.7987713568496,-73.7989024094984,-73.7990875760913,-73.7992371198386,-73.7997355768646,-73.8001557208123,-73.8004298157185,-73.8004476694881,-73.8017722025143,-73.8029757029201,-73.8046593024144,-73.8056593965263,-73.8058035968175,-73.8060841114885,-73.8062192767137,-73.8064216049657,-73.8067020067576,-73.8074694771084,-73.808645687167,-73.8091841865688,-73.8100244310152,-73.8101171061283,-73.810757494441,-73.8111448304766,-73.8114739755981,-73.812033336833,-73.8127813810424,-73.8132238963757,-73.8136436022475,-73.8139999208905,-73.8144473326928,-73.8149426968579,-73.8153307552018,-73.8156510415763,-73.8159307910774,-73.8159671247629,-73.8161791001817,-73.8167088688832,-73.81728428683,-73.8183031695635,-73.8188184224075,-73.8190848690183,-73.8192357156489,-73.8193946496199,-73.8195615197326,-73.8197361672303,-73.8199184259501,-73.82010812248,-73.8203050763245,-73.8204549548203,-73.8205994026146,-73.8207380926851,-73.8208707110402,-73.8209969574292,-73.8211165460226,-73.8212292060586,-73.8213346824569,-73.821432736396,-73.821523145854,-73.8219362965906,-73.8221514319808,-73.8221406111046,-73.8222009320416,-73.8223293418256,-73.8225109582994,-73.8225973609004,-73.8226057267348,-73.8229606678142,-73.8232184940707,-73.8233792298587,-73.8234656042156,-73.8234212144722,-73.8228612673408,-73.8224676559656,-73.8224310112652,-73.8223873320586,-73.822336880747,-73.8222799604207,-73.8222169130385,-73.8221481173734,-73.821713048647,-73.8216632417559,-73.8216112551013,-73.8216422080524,-73.8216696270373,-73.8216932835147,-73.8216749888022,-73.8216913943942,-73.8216072624319,-73.8215726991349,-73.8215928136412,-73.8215689357557,-73.8215355246485,-73.8216034625033,-73.8217626999444,-73.8217701644304,-73.8217152044911,-73.821746502157,-73.821607002436,-73.8215117933079,-73.8197007412069,-73.8197418328961,-73.819769267185,-73.8197910961527,-73.8197709767998,-73.8197836987367,-73.8197141990923,-73.8196741704967,-73.8196979434637,-73.8196572528702,-73.819011921548,-73.8189361108069,-73.8188578489987,-73.8187774697181,-73.8186953155869,-73.8186210618969,-73.8185475047157,-73.818475430908,-73.8184056114695,-73.8183387932782,-73.817644023338,-73.8176384348895,-73.8176804549628,-73.8176804359499,-73.8176950528247,-73.8176931495326,-73.8176748796964,-73.817672964987,-73.8175049143154,-73.8175142135543,-73.8175635341206,-73.8175672711915,-73.8171796832365,-73.8169852781274,-73.8168833990105,-73.8167796049831,-73.8166742250062,-73.8165675930663,-73.8164600471169,-73.8161395470038,-73.8161335833439,-73.8161737658636,-73.8161754844336,-73.8161608734104,-73.8161608235675,-73.8159818038872,-73.8159965882614,-73.816042258399,-73.8160520303471,-73.8154613461429,-73.8153570977084,-73.8152540383297,-73.8151523558369,-73.8146814879138,-73.8146707545938,-73.8147018000603,-73.814698043002,-73.8146779499052,-73.8146760376376,-73.8145701175825,-73.8145885643114,-73.8146141412009,-73.8146253396985,-73.8140894012619,-73.8138834223295,-73.8137611356149,-73.8137496032602,-73.8135823364557,-73.8132517985096,-73.8130922803795,-73.8126212551767,-73.8126007714405,-73.812307418284,-73.8120016297788,-73.8119905123955,-73.8119325852397,-73.8115724541165,-73.8115379997173,-73.8114988257826,-73.8114383384402,-73.8114230591221,-73.8112949093216,-73.8112443529111,-73.8113011906176,-73.8113170115266,-73.8113325502064,-73.8113583092684,-73.8113822106582,-73.8114036643402,-73.8114221407026,-73.8114371836314,-73.8114484217701,-73.8114555776878,-73.8115144834633,-73.8117211780721,-73.8120090375559,-73.8122192650521,-73.8128291153082,-73.81286081322,-73.8128856288344,-73.8140837996424,-73.8141245512204,-73.8141369726351,-73.8141481982587,-73.8149455657476,-73.8150934515766,-73.8152888564165,-73.8157655353685,-73.8162203961043,-73.8165732258728,-73.8168703124716,-73.8169018883269,-73.8169979381657,-73.8170757974681,-73.8171639426998,-73.8171933980752,-73.8172115050053,-73.8172465199289,-73.817270152976,-73.8173581732293,-73.817468831129,-73.8175952861831,-73.8176935453518,-73.8177139337861,-73.8177523768762,-73.8177557257857,-73.8177726429978,-73.8179183626459,-73.8180166607845,-73.8180799206779,-73.8181692626507,-73.818302597163,-73.8183748365525,-73.8184537895829,-73.8184837458388,-73.8184971488631,-73.8185074720579,-73.8186718437416,-73.8187331088303,-73.8187444407568,-73.8187379911416,-73.8187864961107,-73.8188416790097,-73.8190033563292,-73.8197637179348,-73.8200523698372,-73.8201520597743,-73.8201532275217,-73.8201561699529,-73.8201608161179,-73.8201670539854,-73.8202010245544,-73.82027863985,-73.8213142903301,-73.8213399690981,-73.8214123305336,-73.8214877294638,-73.8215081147694,-73.8215295757148,-73.821551712373,-73.8215741122251,-73.8216460742556,-73.8217223606161,-73.8218021099299,-73.8219194556834,-73.8220334290885,-73.822143557088,-73.8222493825882,-73.822332160758,-73.8227216168943,-73.8227685388113,-73.8228143365179,-73.8229256371116,-73.8230323152441,-73.8231337644647,-73.8232294080529,-73.8233187022975,-73.8234011395873,-73.8234762512969,-73.8240212794523,-73.8240467681479,-73.8240659556743,-73.824078694969,-73.8240848883978,-73.8240844885033,-73.8240762310045,-73.8240774577491,-73.8240955805299,-73.8241196196189,-73.8241494581966,-73.8241849512657,-73.8242129650155,-73.824235740554,-73.8242528866232,-73.8242641086766,-73.8241072859903,-73.8241036885446,-73.8240413045689,-73.8240592913372,-73.8241109742534,-73.8241055791088,-73.8242677604036,-73.8242860891979,-73.8242979356982,-73.8243032248566,-73.8243019231768,-73.8243018325563,-73.8243050092408,-73.8243113648384,-73.8243300462509,-73.8243573769456,-73.8243930847355,-73.8244368140162,-73.8248516898402,-73.8249219145979,-73.8249294096332,-73.8248554196315,-73.8245107910771,-73.8244360539579,-73.8242963850378,-73.8242263337792,-73.8241516285949,-73.8241358874292,-73.8239306090713,-73.8238532110437,-73.8238071795817,-73.8236425072336,-73.8234752748071,-73.8234662547894,-73.8234545299355,-73.8234659988292,-73.8234219994719,-73.8233260000719,-73.8231809999741,-73.8229071770091,-73.8229315891618,-73.8229611349022,-73.8229950106928,-73.8230322952369,-73.823071974535,-73.8231129694609,-73.8231541651091,-73.8231944411156,-73.8233883640573,-73.8234120915168,-73.8234381461775,-73.8234930544188,-73.8235372598477,-73.8235851981415,-73.8236366776097,-73.8237086629046,-73.8237743437587,-73.8238333270885,-73.8238695456938,-73.8239036472567,-73.8239254361219,-73.8239390307236,-73.8239440457655,-73.8239403391019,-73.8239280157677,-73.8239074250038,-73.8239063194281,-73.8239093749004,-73.8239165033197,-73.8239274991418,-73.8239420453053,-73.8239597223744,-73.8239800206326,-73.8240126223632,-73.8240500699112,-73.8240914075425,-73.8241355802372,-73.8241814606169,-73.8244503685961,-73.824587603009,-73.8247231927497,-73.8247438801287,-73.8247532058711,-73.8247639393207,-73.8247758964991,-73.8247888724527,-73.8248272219504,-73.8248684317135,-73.8249114462886,-73.8249551639996,-73.824998465162,-73.8250555551778,-73.8251074946462,-73.8251532153923,-73.8251917771288,-73.8252223867936,-73.825341030858,-73.8254536597011,-73.8255196143557,-73.8255510789481,-73.8255888899322,-73.8256319006799,-73.8256788068836,-73.8257281861091,-73.8257785409294,-73.8258283443339,-73.8258596210226,-73.8258891029798,-73.8259160562406,-73.8259398097915,-73.8259597722759,-73.8259754467158,-73.825986442885,-73.8259924870238,-73.8259934286547,-73.826021617752,-73.8260445006529,-73.8260614450167,-73.826071982603,-73.8260758222121,-73.8261036173387,-73.8261057924015,-73.826111209862,-73.8261197066841,-73.8261310271583,-73.8261448305966,-73.8261710899815,-73.8261971957447,-73.8262223865878,-73.8262459278934,-73.826267133149,-73.826285383967,-73.8263001481182,-73.8262775921068,-73.8262491669738,-73.826215150844,-73.8262144414625,-73.8262093134325,-73.8261998449557,-73.8261809938835,-73.826164039328,-73.8261494233502,-73.826137527036,-73.8261286605601,-73.8261230550986,-73.8261208568021,-73.8261221229847,-73.8261268206305,-73.8261348272543,-73.8261459340955,-73.826159874788,-73.8261706183816,-73.8261778698343,-73.8261814300069,-73.826181201132,-73.8261771894978,-73.8261695052757,-73.8261720453565,-73.826178421186,-73.8261884443194,-73.8262018185141,-73.826218148485,-73.8262369515885,-73.8262576720864,-73.826282330964,-73.8263066442462,-73.8263300008531,-73.8263518137501,-73.826371534702,-73.8263920109692,-73.8264040373646,-73.8264073556986,-73.8264018947448,-73.8263877717669,-73.8263652899999,-73.8263703595005,-73.8263686781897,-73.8263602784903,-73.8263453223384,-73.8263240980612,-73.8262970148178,-73.826241489081,-73.8262203363889,-73.8263924291048,-73.8267194354685,-73.8268962339086,-73.8270132446351,-73.827125099757,-73.8272419261337,-73.827360789807,-73.8274780709591,-73.8275964175788,-73.827706836014,-73.827825075022,-73.8280718116247,-73.8282792561477,-73.828599424047,-73.8293142021882,-73.8299133575328,-73.830031319839,-73.8302937520803,-73.8310777106598,-73.8318573801724,-73.8324776821402,-73.8321184686961,-73.8320321880746,-73.8294871604184,-73.8258439379527,-73.8242605229864,-73.8230521056646,-73.817917595908,-73.8149692248572,-73.8144276302692,-73.8138875902703,-73.8133501116202,-73.8128161638551,-73.812286727852,-73.8117669494147,-73.8111660877966,-73.8112906073772,-73.811403279588,-73.8115024914701,-73.8115869511678,-73.811655742202,-73.8120035042887,-73.812011401654,-73.8120145889871,-73.8120130283954,-73.8120067385057,-73.81197113821,-73.8119302070536,-73.8118849475158,-73.8118364680822,-73.8117859560972,-73.8117346486836,-73.8116838024454,-73.8116204419967,-73.8115572396579,-73.8114955695235,-73.8096014878296,-73.808457543926,-73.807890716094,-73.8076878255338,-73.8073717986702,-73.8064743428578,-73.8061016318443,-73.8041369962541,-73.8043205057094,-73.8037752445163,-73.8029952720731,-73.8021486650281,-73.8020320768996,-73.8018866747649,-73.8018004962112,-73.801220509571,-73.7998195446255],"lat":[40.6652592619759,40.6651259895878,40.665112528433,40.665073247268,40.6650209300159,40.6649634816834,40.6649556274503,40.6648774254888,40.6647023883246,40.6645142759682,40.6644392769414,40.6643332337139,40.6642433008384,40.6641669075752,40.6641532888246,40.6641445380632,40.6641359922341,40.6639058808683,40.6638252434728,40.6636095530448,40.6634210723975,40.662908590548,40.6627828314206,40.6623853557278,40.6608118444399,40.6607856705753,40.6607551071615,40.6606920872454,40.6606327737113,40.6605772514111,40.6605255997728,40.6604778927086,40.6604341985495,40.6603945798054,40.6603590931561,40.6602433290318,40.6602006722528,40.6601522417218,40.6600981083457,40.660038351381,40.6599730583171,40.6599023248673,40.6598262545276,40.6597449586683,40.65965855631,40.6595671739484,40.6593200441285,40.6589699922588,40.6589381796209,40.6589018281002,40.657478486007,40.6562320931192,40.6559482547964,40.6557265855447,40.6557144745297,40.6556786357565,40.6556703691068,40.6556001151361,40.6556101976931,40.6557308884535,40.6558381686998,40.6558568305942,40.6558299853118,40.655802847503,40.6555782154991,40.6552534688908,40.6547468966045,40.6544215005823,40.6543562668311,40.6540909013783,40.6536219366957,40.6508533039385,40.6505813522893,40.6490120966032,40.6486976651584,40.6479793389674,40.6472593012057,40.6454569205046,40.6453440303174,40.6452266935595,40.6451050501743,40.644979245241,40.6448494288012,40.64471575568,40.6443718457897,40.6415831142638,40.6412470695419,40.6411537997528,40.6398622237486,40.6394461872735,40.6378716951649,40.6378884554684,40.6379083100579,40.6379306792711,40.6379549100297,40.6379802949059,40.6380060927762,40.6380315504588,40.6380559247027,40.638078503888,40.6381348432258,40.6381899334336,40.6382435997756,40.6382599711788,40.6382738450953,40.6382850036858,40.6382933941015,40.6383209251002,40.6383506098683,40.6383817272689,40.6384135213608,40.6387907988681,40.6388510187846,40.6389109855258,40.6389701976608,40.6390281600675,40.6390843880727,40.6390977590122,40.6391131991828,40.6391302637956,40.639148461266,40.6391672673743,40.6391861403674,40.6392045365645,40.639215728536,40.639227091659,40.6392383368395,40.6392491779838,40.6392593392776,40.6392685622025,40.6392766121138,40.6392832842098,40.6392896096282,40.6392971791111,40.639305788224,40.6393152044543,40.639325173491,40.6393354260927,40.6393456853596,40.6393556742116,40.639365122872,40.6393737761532,40.639381400349,40.6393877895466,40.6394054541848,40.6394238229908,40.639442421583,40.6394607696449,40.639498334453,40.6395368192791,40.6395751104628,40.6396761983282,40.6397772675598,40.6398780098265,40.6399781177935,40.6400772860596,40.640175212089,40.6402715971343,40.6403661471482,40.6403729294286,40.6403802825587,40.6403880140517,40.6403959215162,40.6404037979542,40.6404114371797,40.6404186392166,40.640425215533,40.6404532621898,40.6404861245303,40.640522969205,40.6405628618759,40.640567939271,40.6405734427726,40.6405792253571,40.6405851325451,40.6405910065285,40.6405966903863,40.6406020322763,40.6406068894922,40.6406111322753,40.6406323890212,40.6406550763404,40.640678745969,40.640702930234,40.6407310227911,40.6407667357707,40.6408013812687,40.6408340442568,40.6408638620657,40.6408898274788,40.6409168980741,40.6409444109791,40.6409716924897,40.6409980745671,40.6410229111959,40.6410455942034,40.6410938966037,40.6411433638858,40.6411935225503,40.6412438924791,40.6412939915306,40.6412973726736,40.6413014535106,40.6413061348172,40.6413113027684,40.6413168317065,40.6413225871967,40.6413241423607,40.6413257828168,40.6413274681693,40.6413291569169,40.6413308074748,40.6413323791986,40.6413338333851,40.6413351342255,40.641336249687,40.6413371523016,40.6413556333802,40.6413748243629,40.641394312679,40.6413999298555,40.6414043419548,40.6414078563476,40.6414519057089,40.6415282063263,40.6415840826145,40.6416391984594,40.6416908587858,40.6418254976917,40.641989359045,40.6420649294102,40.6421420073942,40.6422125314941,40.6422822590425,40.6423085612735,40.6423328534357,40.6423544049455,40.6423725676433,40.6423867952875,40.6423906310598,40.642395483279,40.6424012245798,40.6424077042597,40.6424147522347,40.6424221835033,40.6424298030033,40.6424374107313,40.642444859762,40.6424518957983,40.6424836609144,40.6425152758716,40.6425461195845,40.6425632773981,40.6425789031288,40.6425925648,40.6426038847316,40.6426125499814,40.6426144972478,40.6426170599377,40.6426233274263,40.6426314206941,40.6426442111736,40.6428786916845,40.6429429862387,40.6430066630738,40.6430689834122,40.6431292242124,40.6431866865578,40.6432407037658,40.6432906491231,40.6432965637391,40.6433019017301,40.643306581913,40.643308782157,40.6433113142601,40.6433160343807,40.6433228212614,40.6433315005513,40.6433418492843,40.643353601607,40.6433664556087,40.6433800810768,40.6433941279799,40.6434025494625,40.6434110706783,40.6434194810663,40.6434275728043,40.6434351459437,40.6434420133507,40.6434480053301,40.6434479372948,40.6434487228721,40.6434503415767,40.6434527511982,40.6434558889015,40.6434596728658,40.6434640044176,40.6434687706045,40.6434738471399,40.6434791016445,40.6434843970979,40.6434895954121,40.643529634964,40.643567038118,40.6436011377632,40.6436313257081,40.6436570635284,40.6436572049498,40.6436582038967,40.6436600315132,40.6436750728751,40.6436911145421,40.6437085573912,40.64373505675,40.6437633976237,40.6437929876085,40.6438149134223,40.643835776275,40.6438549848079,40.6438719945535,40.6438863233689,40.6438975651018,40.6439054011038,40.6439079199546,40.6439128130822,40.6439199318371,40.6439290599566,40.6439394782072,40.6439512063994,40.6439639148224,40.6439868730563,40.6440095354075,40.644031315332,40.6440516491242,40.6440700105064,40.6440859242507,40.6440989784779,40.6441088353189,40.6441147088787,40.64412211526,40.6441307076872,40.6441404756854,40.6441512414964,40.6441628092033,40.6441720476816,40.644184060291,40.6441927739142,40.644214570707,40.6442319811701,40.6442522688999,40.6442798462776,40.6443181113375,40.6443226514465,40.6444711028478,40.6445164001251,40.644558314292,40.6446001986831,40.6448165015801,40.644944215896,40.6451188804949,40.6450975027157,40.6451422876541,40.6451692701133,40.6451654525874,40.6451661657439,40.6451694300937,40.6451704598397,40.6451712473699,40.6451704905988,40.6451682091507,40.6451644621866,40.6451577668188,40.6451484844811,40.6451368247054,40.64512305069,40.645107473358,40.645090444339,40.6450723480316,40.645048333751,40.6450259720983,40.6449518481876,40.6449399045835,40.6449310077756,40.6449253958107,40.6449232188452,40.6449245351269,40.6449253183725,40.6449275719226,40.6449312342689,40.6449362054514,40.6449423497867,40.6449494995713,40.6449574596591,40.6449659055121,40.6449746951696,40.6450148490406,40.6450522551055,40.6450858967953,40.6451148598423,40.6451383571276,40.6451557500726,40.645157273066,40.6451605919673,40.6451656358758,40.6451705943607,40.6451764384011,40.6451857643899,40.6451963992227,40.6452080924353,40.6453282181856,40.6454418966431,40.6454453986222,40.645529837853,40.6456244878951,40.6456639825735,40.6456685962416,40.6456977847534,40.6457585845995,40.6457732927346,40.6460379352107,40.6460740347591,40.6461707494487,40.6462315400344,40.6462573903054,40.6462664665647,40.6462900748067,40.6463046488221,40.6463325422493,40.6463745382788,40.6464027475244,40.6464230960423,40.6464702123569,40.6465005907688,40.6465795175205,40.6465977526427,40.6466519368124,40.6467531774833,40.6469346059423,40.6470452156182,40.6472130087495,40.6472277207673,40.6473337620166,40.6471623746074,40.6470722518673,40.6470521146862,40.6471963123193,40.6472142196573,40.6471706590442,40.647343402722,40.6473564101332,40.6473757792417,40.6474010979365,40.6474318275183,40.647467314161,40.6474789663185,40.6474886844971,40.6474962480887,40.6475014853952,40.6475042775269,40.6475045611007,40.6475052740832,40.6475119473783,40.6475244638006,40.6475426035568,40.6477569035242,40.6478864220789,40.6478879333563,40.6479354790543,40.6478121988934,40.6476872079393,40.6475727210385,40.6472004589555,40.6467056046855,40.6468711391909,40.6469307812108,40.6469604235778,40.6468074612093,40.6467815424618,40.6468561822565,40.6466863226581,40.6447285566739,40.6446184524879,40.6444608362552,40.6443501686348,40.6436328700517,40.6435596092734,40.6434907928842,40.6434268054841,40.6433680046839,40.6433434923375,40.6431934577227,40.6430455054853,40.6428997957106,40.6427564860565,40.642615731583,40.6424776845846,40.6423424944252,40.6420948432851,40.6419612310742,40.6418290394412,40.6416983805409,40.6416904134092,40.6416889834983,40.6416298777659,40.6415721057636,40.6415163657409,40.641463331386,40.6414136436845,40.6413841642582,40.6413533764267,40.64132202043,40.6412908501675,40.6412606150721,40.6412320420909,40.6412058182081,40.6411825739272,40.6411804835021,40.6411769074664,40.6411719438061,40.6411657285291,40.6411584319386,40.6411502539664,40.6411414186949,40.6411321682166,40.641122756001,40.6411134399493,40.6411044753275,40.6410961077722,40.6410885665597,40.6410820583242,40.6410767613953,40.6404278514656,40.6403994639725,40.6403724867202,40.6403475791108,40.6402389285237,40.6401301385751,40.6400216369086,40.6399138500325,40.6398072016433,40.639748116685,40.6396885707488,40.6396293558618,40.6395712596463,40.6395150548425,40.6394959640996,40.6394759478726,40.6394555230762,40.6394352171756,40.6393992615655,40.6393620017422,40.6393244347555,40.6392875658734,40.6392523816811,40.6392198236813,40.6390747404679,40.6390141928642,40.6389404032052,40.6389062638241,40.6388320261826,40.6388004463367,40.6387765404185,40.6387344897499,40.6387011311289,40.6386447015042,40.6385528502046,40.6383701665821,40.6383590726792,40.6383462724537,40.6383044780084,40.6382874142052,40.6382703435236,40.6382618042453,40.6382541191898,40.6382498452749,40.6382447183072,40.6382259049217,40.6382207779538,40.638219069003,40.6382165064981,40.6381678276257,40.6380704755733,40.6380329041812,40.6379919307007,40.6379535222942,40.6378613493329,40.637814403986,40.6377384253474,40.637671827922,40.6376376688391,40.6375556678972,40.6375343190489,40.6375146809407,40.6374515154904,40.6373840908654,40.6373124106919,40.6373004571386,40.6372876500277,40.6372372543158,40.6372167601947,40.6371988323172,40.6371792015747,40.6370955697867,40.6370580142907,40.6370204470145,40.6369376147285,40.6369017552278,40.6368727316448,40.6368676120487,40.6368654457732,40.636862852918,40.6368580083674,40.6368446257198,40.6368074448122,40.6367174334314,40.6366536373199,40.6364772913637,40.6362891951181,40.6361018685144,40.6359571416487,40.6359253599241,40.6358332175275,40.6356361375862,40.6355137458597,40.6354566641753,40.6354115595757,40.6353980656848,40.6353802393749,40.6353676329543,40.6353361087588,40.6352756279904,40.6352341414999,40.6352010317566,40.6351269684129,40.6350812341905,40.6350622076527,40.6350408113612,40.6350219748059,40.6349946711076,40.6349684572236,40.6349472568423,40.6349248533121,40.6349218469062,40.6348837864508,40.6348585927858,40.6348317709188,40.6348166942747,40.6348010570673,40.6347780223169,40.634749944025,40.6347361421634,40.6347430025586,40.634721321525,40.6347093537861,40.6346689069613,40.6346279757656,40.6345975987966,40.6345767164499,40.6345594573383,40.634543420381,40.6345165289053,40.634435629729,40.6343576985233,40.634333679686,40.6342933532338,40.6342799740293,40.6342797943189,40.634244603607,40.6342105651852,40.6341687266327,40.6341372804208,40.6341009876733,40.6340627337137,40.6340481697241,40.6340402468914,40.6339701033448,40.6339555121722,40.6339196537855,40.6338867319282,40.6338496784181,40.6338167029854,40.6337984326142,40.6337790641237,40.6337621195559,40.6337168163039,40.6336767797407,40.6336558202131,40.6336237260902,40.633612115197,40.6336178884617,40.63362288938,40.6336036292399,40.6335721360746,40.6335334489909,40.6335142910791,40.6334963217319,40.6334783954787,40.6334556674758,40.6334501218983,40.6334432518108,40.6334362060838,40.6334125279321,40.6333843644273,40.6333721777368,40.6333570708448,40.6333406259042,40.6333308360618,40.6333159263964,40.6332806842004,40.6332453414514,40.6331806522174,40.6331764299124,40.6331598255436,40.6331483123549,40.633133521613,40.6331212463552,40.633110254131,40.6330953893453,40.6330887364052,40.633079766855,40.6330768717214,40.633079455732,40.6330732285653,40.6330648002932,40.6330584024605,40.6330457981158,40.6330332523461,40.6330113044826,40.6329755145995,40.6329483745999,40.6329154176522,40.6328940189968,40.6328824883632,40.6328709594207,40.6328622118239,40.6328578515239,40.6328502464791,40.632846999543,40.6328443326209,40.6328373762268,40.6328319196407,40.6328224591905,40.6328142942649,40.6328023303655,40.6327829183935,40.6327719382491,40.6327430803081,40.632733251156,40.6327288118186,40.632728350187,40.6327334198845,40.6327365465362,40.6327371021341,40.6327417776202,40.6327522890983,40.6327699508419,40.6327789585626,40.6327791677021,40.632773627807,40.6327609734034,40.6327498516011,40.6327246589965,40.6326964195897,40.6326739708504,40.6326503916053,40.63262445366,40.6326094878846,40.6325959421019,40.6325850286713,40.6325867673273,40.6325775734532,40.6325696573041,40.6325606768429,40.632555265945,40.6325565242054,40.6325492818677,40.6325568268614,40.6325550216475,40.6325388416076,40.6325328093333,40.6325324226433,40.6325242695504,40.6325123981702,40.6325083295384,40.6325015012038,40.632490747069,40.632487040245,40.632485091713,40.6324806245981,40.6324784366232,40.6324793318072,40.6324736965597,40.6324664504915,40.6324550885806,40.6324441123489,40.6324327390778,40.6324204538517,40.6324120752608,40.6324093318687,40.6324166679657,40.6324209106141,40.632421884273,40.6324128829898,40.6324025769093,40.6323905280503,40.6323761961397,40.6323640387914,40.6323507471282,40.6323413642958,40.6323325527327,40.6322913836893,40.6322643359446,40.6322623905083,40.6322564037188,40.6322500045858,40.632232708885,40.6322199147748,40.6322073105307,40.6321986762534,40.6321891139192,40.6321913655555,40.6321965186929,40.6321889846164,40.6321805783999,40.6321771647794,40.632170477632,40.6321614350448,40.6321598696127,40.63215346918,40.6321433837156,40.6321311886783,40.6321206590953,40.6321077606309,40.6320864786679,40.6320686709004,40.6320494937351,40.632014267968,40.6319858870076,40.6319491938655,40.6319256258387,40.6319076943225,40.6318777736639,40.6318651382173,40.6318542244517,40.6318384111393,40.6318238110491,40.6318192661207,40.6318143961413,40.6318180918101,40.6318166675389,40.6318086874758,40.6317989671562,40.6317869808879,40.6317805971857,40.63177848231,40.6317762134105,40.6317684899829,40.6317520881468,40.6317295712254,40.6317071523899,40.6316917691535,40.6316771368253,40.6316424350618,40.6316153936223,40.6315763389841,40.631550570038,40.6315441086097,40.6315378810786,40.6315326546277,40.6315297000245,40.6315288206918,40.6315186971928,40.6314969901663,40.6314892963799,40.6314694608957,40.6314451482229,40.6314261277217,40.6314056262465,40.6313928119158,40.6313876549102,40.6313828988392,40.6313742943171,40.6313594538979,40.63134708962,40.6313310561035,40.6313126276107,40.6312863368172,40.6312407406692,40.6311925714716,40.6311693089911,40.63115255733,40.6311397755418,40.6311272480966,40.6311138260564,40.6311021953398,40.6310793320179,40.6310382084487,40.6309863492032,40.6309758964245,40.6309743770758,40.630986195506,40.6309935047042,40.630995699061,40.6309918065262,40.6309837470639,40.6309715715569,40.6309428494485,40.6309270694497,40.6309102370909,40.6308983894726,40.6308777335543,40.6308569492558,40.6308440291103,40.6308257338061,40.6308172369152,40.6307936718364,40.6307799384418,40.6307635757744,40.6307435835198,40.6307239165197,40.6307011582822,40.6306747181646,40.6306633171896,40.6306585840236,40.6306613294494,40.6306705976092,40.6306747243344,40.6306708908956,40.6306711204207,40.6306733962755,40.6306726763518,40.6306657479907,40.6306505839078,40.630638547299,40.6306225132625,40.6306067559492,40.630595385236,40.6305869826623,40.6305767631286,40.6305666059754,40.6305508130547,40.6305362347091,40.6305244470341,40.6305134446279,40.6305113730002,40.6305149365125,40.6305187145455,40.6305255432044,40.630523348212,40.6305115070769,40.6304976218088,40.6304851519631,40.6304875200183,40.6304756847585,40.6304659773611,40.6304490074232,40.6304421041097,40.6304465811461,40.6304420309822,40.6304337423121,40.6304107062354,40.6303828031972,40.6303579079477,40.630345122969,40.6303408233181,40.6303427216344,40.6303414100292,40.6303294433933,40.6303226909431,40.6302914854452,40.6302676577456,40.6302514108848,40.6302516679855,40.6302601593393,40.6302690277091,40.6302775191381,40.6302731603951,40.6302594329565,40.6302500696592,40.6302311480727,40.6301825286689,40.6301628224432,40.6301491532381,40.6301315295626,40.630096084595,40.6300623980626,40.6300336571494,40.6299984678722,40.6299675184253,40.629936063103,40.62989810431,40.6298610554032,40.6298339107893,40.6297979896308,40.629760499761,40.6297105688096,40.629658898502,40.6296538067345,40.6296478566197,40.6296471221521,40.6296766851354,40.6296779456547,40.6296788347354,40.6296793453969,40.6296794334305,40.6296742000705,40.6296720866664,40.6296693649535,40.6296660519052,40.6296621678277,40.6296577332135,40.629652779614,40.6296290613654,40.6296085209071,40.6296024265993,40.6295970328537,40.6295923651529,40.6295891488295,40.6295868543703,40.6295855096562,40.6295842011622,40.6295835730554,40.6295836322152,40.6295843764791,40.6295858028492,40.629585110357,40.629585298277,40.6295863677901,40.6295868554315,40.6295866618343,40.6295840751379,40.629580917683,40.6295771990872,40.6295751110131,40.6295724709665,40.6295693209821,40.6295670290375,40.6295644140526,40.6295615882905,40.6295586726341,40.6295557920336,40.6295200347187,40.6295170731554,40.6295141121705,40.6295113361397,40.6295088441196,40.6295067364489,40.6295050892976,40.6295039655694,40.6295034048492,40.6294942047741,40.62948562809,40.6294681395432,40.6294612818236,40.6294550119641,40.6294493508105,40.6294390363727,40.629423431766,40.6294052253457,40.6293892153652,40.6293828059211,40.6293756349128,40.6293677164953,40.629359065152,40.6293457154248,40.6293328625502,40.6293205070052,40.6293086818719,40.6292973605526,40.6292933201889,40.6292886817344,40.6292834640245,40.6292776822245,40.6292713565122,40.6292489680824,40.6292462210779,40.6292440223444,40.629242415549,40.6292414349725,40.6292410993034,40.629241413478,40.6292423450529,40.6292425614281,40.6292420619139,40.6292408513477,40.6292389375885,40.6292350357512,40.6292314987709,40.6292283854722,40.6292257531638,40.6292236447204,40.6292220974763,40.629221136357,40.6292207820924,40.6292229396404,40.6292257451945,40.6292291568288,40.6292331193938,40.6292375719093,40.6292424462011,40.6292491572879,40.6292553262825,40.6292609162128,40.629265891929,40.6292702214743,40.6292738772286,40.6293036775051,40.6293104770667,40.629317924579,40.6293259966651,40.6293346680974,40.6293561977438,40.6293770515592,40.6293972179301,40.6294042520641,40.6294107528943,40.6294167082952,40.6294221048074,40.6294240289986,40.6294252486006,40.6294257542301,40.629425543039,40.629424616362,40.6294229800549,40.6294199098514,40.6294162986719,40.6294121825771,40.6294075969424,40.6294025847197,40.6293971923771,40.6293914692357,40.6293854673286,40.6293806956094,40.6293757431932,40.6293706871,40.6293656013482,40.6293605665271,40.6293556563807,40.6293509471853,40.6293465077087,40.6293424082431,40.6293363351009,40.6293306433736,40.6293253661518,40.6293205335127,40.6293161765401,40.6293123192899,40.6293089866688,40.6293061952007,40.6293023925871,40.6292979506385,40.6292928909275,40.6292872415426,40.6292810312476,40.6292545716585,40.6292478357641,40.6292415707021,40.6292357971678,40.6292302164364,40.6292252502686,40.6292209363421,40.6292173120057,40.6292144038967,40.6292107999414,40.6292064719335,40.6292014582588,40.6291958059895,40.6291932429942,40.6291903094918,40.6291870920875,40.6291836773235,40.6291801637804,40.6291766518279,40.6291732391149,40.6291680854002,40.6291632490448,40.6291587757056,40.6291546991229,40.6291510540451,40.6291478718595,40.6291451807536,40.6291404628243,40.6291348920435,40.6291284877034,40.6291037550778,40.6290906348501,40.6290781255901,40.6290662386417,40.6290549861806,40.6290443762132,40.6290344158752,40.6290275952466,40.6290202272073,40.6290123189214,40.6290038773865,40.6289949120963,40.6289854298842,40.6289754419266,40.6289649562364,40.6289476730158,40.6289299118932,40.6289116778709,40.6288522823997,40.6288188481457,40.6287813264486,40.6287423542981,40.6287211392633,40.6286903224611,40.6286623871936,40.6286449624428,40.628626937935,40.6286112342431,40.6285978604807,40.6285900020108,40.6285554053571,40.6285312826883,40.6284905634445,40.6283501340626,40.6282905187334,40.6282503759013,40.6282052932249,40.6280008605072,40.6279838953268,40.6279666344723,40.6279490918292,40.6279312848031,40.6279132255988,40.6278949299455,40.6278764139112,40.6278576939037,40.6278387841322,40.6278196993363,40.6276652577916,40.6276571698563,40.6276488570662,40.6276403614345,40.6276317236406,40.6276229877244,40.6276141973915,40.6276053950212,40.6275966233443,40.6275910785831,40.6275856493433,40.6275803912031,40.6275753501757,40.6275705778071,40.6275661189136,40.6275620136162,40.6275583045356,40.6275550250747,40.6275526702609,40.6275496289239,40.6275459063432,40.6275415081387,40.6275364467958,40.627527789558,40.6275188264259,40.627509596378,40.6275001506356,40.6274905350623,40.6274807978785,40.627470989829,40.6274492978811,40.6274275503224,40.6274057734601,40.6273839930985,40.6273622357017,40.6273545567916,40.6273468663186,40.6273392126938,40.6273316516983,40.6273242330501,40.6273170048028,40.6273100156638,40.6273033136438,40.6272969407404,40.627290942432,40.6272853570046,40.6272802235638,40.6272673927183,40.627254244604,40.6272408110355,40.6272271187692,40.6272132002792,40.6271990845254,40.6271399910404,40.627081046237,40.6270222504429,40.6269488828615,40.6268758127866,40.6268030452268,40.6267305833566,40.6266584355476,40.6266321375363,40.626606041945,40.626580167021,40.6265545186156,40.626529099532,40.6265039372601,40.6264790410003,40.62645442346,40.6261906164428,40.6261133439757,40.62601239885,40.6259961722294,40.6259585893464,40.6259406549429,40.6259252916074,40.6259184644183,40.6259116394932,40.6258269545819,40.6257265866857,40.6254630702849,40.6254494295508,40.6254349379365,40.6253829625118,40.6253608019398,40.6253480124878,40.6253352185166,40.6253232713224,40.6253104683126,40.6252839955964,40.6252361679889,40.6252165235557,40.6251558917631,40.6251379647372,40.6251226003023,40.625097005575,40.6250697141896,40.6250449843061,40.6249887131368,40.6249614275036,40.6249409611229,40.6248966280864,40.6248796791651,40.6248012362578,40.6247327184122,40.6246628280231,40.6245853218365,40.6245736763879,40.6245619774949,40.6245502516316,40.6245385277851,40.6244929298084,40.624449197304,40.624408087398,40.6243703118107,40.6243656794742,40.6243594930419,40.6243519072209,40.6243431117134,40.6243333264728,40.6243227962033,40.6243117842399,40.6243005659637,40.6242894219148,40.6242227025685,40.6242137717791,40.6242045785968,40.6241953436248,40.6241862884688,40.6241776304199,40.6241695772396,40.6241623221748,40.6241560393207,40.6241430883466,40.6241291323239,40.6241144948179,40.6240995151937,40.6240845407481,40.6240699186574,40.6240559879287,40.6240416952611,40.6240266704516,40.6240113524703,40.6239961888526,40.6239816226236,40.6239680793547,40.6239559547299,40.6239522063861,40.6239481041969,40.6239437599388,40.6239392919845,40.6239348220769,40.6239304720121,40.6239263603208,40.6239225990384,40.6238199884749,40.6238083543583,40.623796296545,40.6237841711913,40.6237723364487,40.6237611418844,40.6237509181563,40.6235886922432,40.6234790348402,40.6234313884199,40.6233733700765,40.6233133540856,40.6232518124522,40.623189229179,40.623187209269,40.6231711032105,40.6231549917372,40.6231388999805,40.6231228505541,40.6231068657284,40.6230862288893,40.6230657319693,40.6230453935602,40.6230252285542,40.6230052533588,40.6229854843774,40.6229659380081,40.6229261428867,40.62288624763,40.6228462596081,40.6228061856868,40.6227660350774,40.6227489399884,40.6227319646232,40.6227151263838,40.6226984490539,40.6226819537201,40.6226656592979,40.6226495903896,40.6226337650707,40.6226182047555,40.6226029296948,40.6225879579517,40.6225767826728,40.6225658766737,40.6225552690681,40.6225449805916,40.6225350364944,40.6225254603616,40.6225162719035,40.6225074957031,40.6224991482916,40.6224912525579,40.6224838238646,40.6224768819151,40.6224704398835,40.6223002077866,40.6222766546125,40.6222525535465,40.6222279159537,40.6222027495123,40.622177064588,40.6221508700269,40.6221401551747,40.6221290186777,40.6221174824324,40.6221055601376,40.6220932737039,40.6220806406796,40.6220676813058,40.622054419165,40.622040871823,40.6220270628689,40.6220237640983,40.6220206610331,40.6220178587671,40.6220154484321,40.6220135102397,40.6220121102822,40.6220112938614,40.6220110881618,40.6220114999278,40.62201251412,40.6220141002996,40.6220162037642,40.6220187540775,40.6220866097822,40.6220938736201,40.6221010105356,40.6221079678942,40.6221147010888,40.6221211613097,40.6221273049393,40.6221247901753,40.6221218285061,40.6221184884583,40.6221148472903,40.6221109926823,40.62210701235,40.6221030014248,40.6220990535539,40.62209526009,40.6220752423142,40.6220553300308,40.6220355441745,40.6220159117032,40.6219964515342,40.6219771881092,40.6219581453657,40.6219393420481,40.6219298213822,40.6219203171267,40.6219108709892,40.6219015286955,40.6218923290821,40.6218833133419,40.621874522645,40.6218659941424,40.62185776682,40.6218498769754,40.6218402529882,40.6218300433391,40.6218192647088,40.6218079386511,40.6217960875441,40.621783735462,40.6217766825521,40.6217693185502,40.6217616889696,40.6217538409998,40.6217458226838,40.6217376854215,40.6217294792844,40.6217212545245,40.6217130610659,40.6217049525282,40.6216969785227,40.6216628233448,40.6216336998905,40.6216053833513,40.621601102554,40.6215965120877,40.6215916606209,40.6215866045519,40.6215814027967,40.6215761132891,40.6215707976643,40.6215655145592,40.6215603259747,40.6215552914211,40.6215344549976,40.6215156406959,40.6214947539508,40.6214801276063,40.6214592458475,40.6214404747844,40.6214049726708,40.6213773515024,40.6213605272864,40.6215982727276,40.6216823268573,40.6217761075727,40.6218903131415,40.6220424155089,40.6221367633168,40.6222115081451,40.6222679091408,40.6223379638174,40.622403888653,40.6224474836191,40.6225070333453,40.6225714094479,40.6226523060221,40.6227021966959,40.6227555650702,40.6228263431237,40.6229115515827,40.6229497472959,40.62298885348,40.6230041994882,40.6230780792311,40.6231586960858,40.6232031919113,40.6232829979449,40.6233305383729,40.623366901282,40.6233406056121,40.6233237740589,40.6233203123985,40.6233360846393,40.6233285242029,40.6233030233045,40.6232815929735,40.6232556402179,40.6232305341324,40.6232246684094,40.6232440642526,40.6232847780791,40.6232843437313,40.6232976574733,40.6232812644237,40.623284616705,40.6232929729233,40.6233622181966,40.623406511131,40.6234817006502,40.6235850280304,40.6235040813706,40.6234577582481,40.6234389887085,40.6234878803382,40.6234819099907,40.6232721163084,40.6232240788882,40.6232036020507,40.6232533521897,40.6230461052005,40.6229912129031,40.6229391903605,40.6229767243294,40.6229957937951,40.6223083993833,40.621836760093,40.6213440261014,40.6213439091744,40.6213737210489,40.6213985976133,40.6214165154863,40.6213916367068,40.6216082528047,40.621634843872,40.6216527556001,40.6216278811549,40.621845348319,40.6218702250542,40.6218864312239,40.6218615544834,40.6220815894714,40.6221056164927,40.6221243740866,40.6220995016867,40.6223203965996,40.6223444099119,40.622358906552,40.622335740808,40.6225532142679,40.6225780868259,40.6225951449492,40.6225711293339,40.62278945113,40.6228143271634,40.6228305288178,40.6228065124547,40.6230052319845,40.6230953022989,40.6231473260043,40.6230555478412,40.6230734550298,40.623261929019,40.6233267951208,40.623340015193,40.6233596311692,40.6233528522408,40.6232815589851,40.6234964599234,40.623499017983,40.6235015911162,40.6235771044437,40.6235975819621,40.623535819944,40.6235152351454,40.6236057260734,40.6237646064849,40.6244489266691,40.6245709035614,40.6248394629498,40.624994162477,40.6250661943836,40.6250275507182,40.6250592282028,40.625085118327,40.624925596731,40.6249448482535,40.6251131482185,40.625142569371,40.6251613309521,40.6252085910338,40.6252368427773,40.6252591290789,40.6253315021739,40.6257834828402,40.627651724729,40.6273155051215,40.6248427461149,40.6266314707079,40.6281425218704,40.6289543484148,40.6294477106673,40.6301651157201,40.6306341156491,40.6313733204335,40.6317281891817,40.6320949894808,40.6320945241154,40.6320719066688,40.6322297713453,40.632261900729,40.6325765365722,40.6330241902915,40.6334250795629,40.6339472542919,40.6339631571776,40.633984345383,40.6340103089609,40.6340404230322,40.6340739628252,40.6341101211178,40.634148027666,40.6341867701477,40.6342254161204,40.6342630354626,40.6342697792021,40.6342268345031,40.6341864594126,40.6341495463604,40.634116911252,40.6340892754343,40.6340672497521,40.6340513210467,40.6340204537589,40.633995806765,40.6339774255403,40.6339625927879,40.6339434548326,40.6339201065124,40.6338926635301,40.6338730796688,40.6338519239957,40.6338496846093,40.6338487257831,40.6338490721363,40.6338507147758,40.6338536115247,40.6338576880055,40.6338628395495,40.6338689338843,40.6338758145301,40.6338833048178,40.6338912124247,40.6338993343127,40.6339521235888,40.6340029128564,40.6340512360445,40.6340966497111,40.6341032125169,40.6341108776946,40.6341194821974,40.634128842998,40.6341406756728,40.6341529394754,40.6341652662157,40.63417583058,40.6341859149839,40.6342147532706,40.6342407549867,40.6342633500857,40.6342820432051,40.6331019393767,40.6331016234109,40.6321584760959,40.6311962398075,40.6311013074749,40.6310375092612,40.631252179367,40.6313176816303,40.6312244585993,40.6321776965446,40.6331017743508,40.6331020903155,40.6341482196749,40.6343103555108,40.6342326343658,40.634292570112,40.6344013006549,40.6345315590866,40.6346888517636,40.6348570640699,40.6354930207553,40.6355801051739,40.6356399750746,40.63589008828,40.6360097202992,40.636064940587,40.6360822319664,40.6360920971834,40.6360866908474,40.6361735115862,40.6362711834168,40.6363634310634,40.6363862081909,40.6364882327303,40.6365642030472,40.6366022012166,40.6365989595324,40.6365750975797,40.636629366892,40.6367541587269,40.6368133641345,40.6369494940821,40.6371014292607,40.6371014476032,40.6371828480184,40.6373239114381,40.6374053068464,40.6375084120548,40.6376603431482,40.6377091765973,40.6377200402487,40.637736325099,40.6378556804447,40.637931642837,40.6380076137577,40.6380347642779,40.6380402058616,40.6381107522584,40.6382138430422,40.6383060896004,40.6383061038003,40.6383061155962,40.6383061185641,40.6383293540682,40.6384037790722,40.6384200637598,40.6384218411794,40.6384309283659,40.6383712706603,40.6384201097036,40.6387239530665,40.6388921636541,40.6391213814531,40.6391363116193,40.6397602839527,40.640270309687,40.6409052094967,40.6416019831263,40.6415696636522,40.641603699245,40.6416525603746,40.6417257012928,40.6417761846729,40.6421795815075,40.6428149273778,40.6430199824631,40.6433139827165,40.643336537054,40.6434923912559,40.6436968326078,40.643988777716,40.6443035750458,40.6445058073224,40.6445595266027,40.6446909495972,40.6448773174865,40.645087217952,40.6453329947271,40.6454781229252,40.6456300224321,40.6456049105077,40.6456683749205,40.6457856937028,40.6458764311449,40.6459491603232,40.646267664491,40.6465925152186,40.6469535748213,40.6471550343185,40.6473528537995,40.647546844984,40.6477368232336,40.6479226077281,40.6481040216372,40.6482808922892,40.6483651384076,40.6484547192437,40.6485494320048,40.6486490622803,40.6487533845258,40.6488621625744,40.6489751501708,40.6490920915288,40.6492127219099,40.6493367682231,40.6498149799157,40.6501352897398,40.6505863318433,40.6509008229884,40.651406306207,40.6519544232904,40.6524024910937,40.6527861068431,40.6534251983043,40.6541165567159,40.6548506537384,40.6553130155543,40.656025495147,40.6576709767502,40.6591598663989,40.6592301141421,40.6592979894433,40.6593630845114,40.6594250082577,40.6594833886456,40.6595378749258,40.6598701048257,40.6599036822915,40.6599352855983,40.6599821420396,40.6599766192576,40.6600114378434,40.6600211479092,40.6600350867431,40.660069738209,40.6600140335066,40.6600071077537,40.6599586938733,40.6599723830561,40.6600806181441,40.660027970749,40.6600444225478,40.6600636364818,40.6601183665934,40.6601610376039,40.6599821056021,40.6607240868087,40.6607889017741,40.6607778146779,40.6608126307894,40.6608209467054,40.6608460101229,40.6608737261759,40.6608124475496,40.6608041368749,40.6607419190454,40.6610065227671,40.6610370124723,40.6610636700389,40.6610863818368,40.6611050510552,40.6611028440525,40.6610948083136,40.6610810297994,40.661061655903,40.6610368938732,40.6609490324301,40.6609928868627,40.6609929534715,40.6609999098908,40.6609999330574,40.6610277555036,40.6610277265467,40.6610597227771,40.6610483262015,40.6609885162263,40.6609913771061,40.6609367342621,40.6608766109733,40.6608281598643,40.6608000618222,40.6607763743197,40.6607571724308,40.6607425170128,40.6607324545138,40.6607152543344,40.6607845824676,40.6607888198226,40.6608277787887,40.6608263644499,40.6608444502351,40.6608358165486,40.6607746243112,40.6607760890159,40.6607115742052,40.6606635857825,40.6606440659651,40.6606211755823,40.660594956353,40.6605152147618,40.6605791087256,40.6605833318737,40.6606208903848,40.6606194675287,40.6606500715558,40.6606345976391,40.6605706288359,40.6605706700597,40.6605066736532,40.6604198914205,40.6603695356803,40.6603509987519,40.6603473877674,40.6603104019507,40.6602319166585,40.6601940385564,40.6601570498984,40.6601600554948,40.6602031101359,40.6602060603484,40.6602063693609,40.6601921483329,40.6602179803782,40.6602315533773,40.6602262378414,40.6602542107736,40.6603071820085,40.6603744387353,40.6605446395667,40.6606280738625,40.6606298839367,40.6606327837653,40.6606402696738,40.6606507357184,40.660663923532,40.6606795075575,40.6606971030839,40.6607162757437,40.6607365522353,40.6607671422985,40.6608031025393,40.6608815089119,40.6608916517006,40.661009827084,40.6610021795534,40.6610125902673,40.661259193393,40.6612498516923,40.6612524749873,40.6612671470027,40.6614151792102,40.6614552514281,40.6614885868919,40.6615658605533,40.6616346928163,40.6616880860571,40.6617346536703,40.6617493884688,40.6617583015416,40.6617860972186,40.6617932629934,40.6617821643113,40.6617787763439,40.6617849139294,40.661804789683,40.661835200512,40.6618605168077,40.6618919091728,40.6619102978925,40.6619034754443,40.6619027354043,40.6619104935887,40.6619182958845,40.6619411392818,40.661952640695,40.661962310146,40.6619574257206,40.6619707592399,40.6619925092786,40.6620271956875,40.6620488976801,40.6620513995892,40.6621051253082,40.6621327769287,40.6620483462058,40.66205038747,40.6620717624722,40.6620541515832,40.6620113512369,40.6619267841141,40.6616735139504,40.6615865175566,40.66153688252,40.661528083743,40.6615195287148,40.6615114237186,40.661503964186,40.6614788228628,40.6614713202723,40.6610474332093,40.661032913706,40.6609956952824,40.6609621552984,40.6609550787743,40.6609501824102,40.6609475574506,40.6609472528116,40.6609133026505,40.660885359099,40.6608637376759,40.660826735688,40.6607840563775,40.6607358768912,40.6606823972052,40.6606148590322,40.6605165345602,40.6605018031281,40.6604851458954,40.6604416238689,40.6603918394742,40.6603360757338,40.6602746496621,40.6602079104624,40.6601362375418,40.6600600383541,40.6585936599787,40.6585396488557,40.6584841469124,40.6584275795891,40.6583703804913,40.6583129880663,40.6582857894259,40.6581612022494,40.6580960441809,40.6580320058656,40.6579693984568,40.6579085261542,40.6578794260588,40.6578477856948,40.6578141486184,40.6577790926866,40.6577503396416,40.6577625545025,40.6577556701643,40.6576959540202,40.6577041801388,40.6577218236905,40.6577465116385,40.6576850024424,40.6576225778779,40.6575596335026,40.6574965681667,40.6574816048655,40.6574668382669,40.6574526792461,40.6573858781598,40.6573208276366,40.6572581754573,40.6571985455178,40.6558996665954,40.6556667899813,40.6554415323746,40.6551580171516,40.6540232305874,40.6538920722103,40.6534701338616,40.6531730139942,40.6528637416416,40.65264311633,40.6521901032793,40.6518826256612,40.6515442216793,40.6511174790883,40.6504762958912,40.6502582317498,40.6500402422514,40.6497740006296,40.6494640003157,40.6491830000549,40.6491570004279,40.6480934460047,40.6480681164795,40.6480461873345,40.6480282549599,40.6480148070488,40.648006209333,40.6480026956378,40.6480043615221,40.6480111616803,40.6483056280203,40.6483438678202,40.6483812184878,40.6484485568015,40.6484946054715,40.6485384339952,40.6485798671092,40.6486398636551,40.6487039190168,40.6487716498568,40.6488187307825,40.6488667201395,40.6489025238921,40.648940604216,40.6489798818837,40.6490192437324,40.6490575742116,40.6490937869987,40.649112446798,40.6491309800448,40.6491488523346,40.6491655483212,40.6491805865766,40.6491935334731,40.6492040156873,40.6492291825197,40.6492500739272,40.649266156718,40.6492770204261,40.6492823877869,40.6493280689789,40.6494831491803,40.6494901388,40.6494342760847,40.6494256030301,40.6494179322498,40.6494113952256,40.6494061040062,40.6493901027105,40.6493789658552,40.6493729786742,40.6493722945092,40.6493769308829,40.64940123082,40.6494315005916,40.6494671176811,40.6495073495999,40.6495513689513,40.6496653761587,40.6496607816286,40.6495608116854,40.6495308536065,40.6495055072255,40.6494855411738,40.6494715609232,40.6494639904253,40.6494630592556,40.6494687956518,40.649475601099,40.649486068816,40.6494999382052,40.6495168639828,40.649536424775,40.6495581336076,40.6495814500299,40.6496057935685,40.6496305581793,40.6496531639198,40.6496790140424,40.649707394218,40.6497375202025,40.6497685595077,40.6500187495245,40.6500331831252,40.6500471132302,40.6500601206141,40.6500718138204,40.6500818409426,40.6500828672442,40.6500804756161,40.6500747358032,40.6500658151904,40.6500539739214,40.6500395573118,40.6500229857797,40.6499768871022,40.6499327111868,40.6498908902537,40.6498635510563,40.6498364868969,40.649810110473,40.6498022985059,40.6497922775462,40.6497803088739,40.6497667045522,40.6497518192908,40.6497360411976,40.6497197816593,40.6497034646152,40.6496875155035,40.6496723501691,40.6496583640209,40.6496445020488,40.6496290768896,40.6496125121541,40.6495952627484,40.6495778023809,40.6495606105531,40.6495441593913,40.6495269357089,40.6495102979261,40.649494737784,40.6494807151729,40.6494686445399,40.6494588826401,40.6494517179924,40.6494515458776,40.649448407758,40.6494423825059,40.6494336215573,40.6494223451062,40.6493794494994,40.6493347353188,40.6492891625772,40.6492437097182,40.6491993526102,40.6491570435936,40.6491201897203,40.6490831562612,40.6490466571306,40.6490113959411,40.64897805244,40.6489472694053,40.6486469742684,40.6483610275945,40.6483243486166,40.6495788193193,40.6503497089878,40.6508598991299,40.6513256864725,40.6518121627128,40.6523071193095,40.6527954782837,40.6532882664842,40.6537480361906,40.6542403617249,40.6552677027036,40.6560335334255,40.6571969730161,40.6588986567465,40.6596656686856,40.6598940088322,40.6604019915322,40.662056223738,40.6636539306296,40.6649682133149,40.6650328189424,40.6648386056275,40.6638245399743,40.6633884715681,40.6635192590202,40.6635538781358,40.6629560162509,40.6624726687372,40.6625141022415,40.6625699265681,40.6626400787067,40.6627244361327,40.6628228379933,40.662934535878,40.6631774741035,40.6630788107267,40.6629710683587,40.6628555502745,40.6627337587977,40.662607339599,40.6614554959732,40.661422765164,40.6613895750706,40.6613563170601,40.6613233843268,40.6612952368116,40.6612716636874,40.6612532423004,40.6612404238217,40.6612335221973,40.6612327064594,40.6612379965869,40.6612407446942,40.6612363678822,40.6612249613081,40.6608756638831,40.6606423144498,40.6605515147998,40.6604483248614,40.6606729546503,40.6638525847162,40.6648281914004,40.665074269679,40.6651207333671,40.6651601842742,40.6652166107817,40.665249953464,40.6652480253324,40.6652489173924,40.6652504410463,40.6652760575563,40.6652592619759]}]],[[{"lng":[-73.9180460695848,-73.9179989063342,-73.9179154841195,-73.9178920031827,-73.9178493747616,-73.9178353117744,-73.9177842681265,-73.9177654758854,-73.9177010938695,-73.9176643517633,-73.9176563872246,-73.9176477650869,-73.91763742515,-73.9176263055923,-73.917557632914,-73.9174129427007,-73.9172663265664,-73.9171213852814,-73.916976328249,-73.9168301141706,-73.9167620744217,-73.9166863837081,-73.916539986558,-73.916393000754,-73.9163011986149,-73.9163549218404,-73.9164574753002,-73.9164648603233,-73.9173958691575,-73.9183055032112,-73.9192356231401,-73.9201223330722,-73.9209453994001,-73.9218236101579,-73.9226854032338,-73.9228218505646,-73.9237887342265,-73.9247828359688,-73.9250569711535,-73.9251205069533,-73.9266041949648,-73.9270268374548,-73.9271490150459,-73.9275399130746,-73.927722291609,-73.9278423987194,-73.9282261392396,-73.9299300776955,-73.9300709182586,-73.9303176269034,-73.931058761596,-73.9311558184399,-73.9326755251739,-73.9327806834982,-73.9330808422055,-73.9358583708006,-73.9360224075648,-73.9361031306121,-73.9369658361889,-73.9371448242304,-73.9379107701372,-73.9386249249757,-73.9398351826436,-73.9405720421218,-73.9413766379648,-73.9417385886041,-73.9418326671478,-73.9431895075241,-73.9441512012041,-73.9469189146633,-73.9473433076129,-73.9477679288616,-73.9481927600092,-73.948617780266,-73.9486972516062,-73.9496756738763,-73.9520634525867,-73.9529867271405,-73.9541276615553,-73.9543316200652,-73.9552936159939,-73.955958623714,-73.9582921680775,-73.9582693030691,-73.9582457036948,-73.9583957158244,-73.9585856668255,-73.9588406201994,-73.9589832794176,-73.9591320677473,-73.9592759867973,-73.9592995959325,-73.9594225933236,-73.9595677012137,-73.9597137475643,-73.959859394257,-73.9600051980264,-73.9600971456535,-73.9601467801997,-73.9601725613865,-73.9601869192427,-73.960223045397,-73.9602374033646,-73.9602928166811,-73.960738582953,-73.9610926416812,-73.9615855611724,-73.9617499483519,-73.9619407043687,-73.9618983782424,-73.9610510070001,-73.9601968885747,-73.9588587462741,-73.9579593822098,-73.9570199312341,-73.9560745618457,-73.9551837082092,-73.9542905331819,-73.9533700073659,-73.9525480011187,-73.9519516224498,-73.9517725790113,-73.9515373886443,-73.9513727858213,-73.9510111210262,-73.9500909464941,-73.9497937934865,-73.9481322539088,-73.9472480870593,-73.9471276214676,-73.9463155753173,-73.9446176611153,-73.9443878859653,-73.9437235275685,-73.9419307881624,-73.9411491721417,-73.9404630853598,-73.9404199145092,-73.9396899520913,-73.9389015280868,-73.9385685484866,-73.9381771855279,-73.9377735456835,-73.9373906476545,-73.9367597902675,-73.9363876262512,-73.9360067922188,-73.9352226443668,-73.9347969968416,-73.9346889265965,-73.9346067511236,-73.9345799944256,-73.9344878475898,-73.9341339729401,-73.9338281715593,-73.9331186279311,-73.9323660567559,-73.9319288999603,-73.9317740462147,-73.9314718454511,-73.931211998206,-73.9311451648234,-73.9305114666293,-73.9297019240275,-73.9288289782543,-73.9288283423497,-73.9286426904778,-73.9285065967179,-73.9280433068713,-73.9278112067199,-73.9275068527093,-73.927070693955,-73.926449920673,-73.9263161253153,-73.9255606405626,-73.9253490361324,-73.9243918330361,-73.9242921326796,-73.9236437983556,-73.923169667107,-73.9228070235952,-73.9220713379702,-73.9213058780854,-73.9212136988418,-73.9209610386625,-73.9205501314324,-73.9198096194062,-73.9190610922491,-73.9187832329374,-73.9182934576662,-73.9180460695848],"lat":[40.687213247771,40.6869657796104,40.6865659363019,40.6864491591785,40.6862331679145,40.6861636696005,40.6859114121165,40.6858185408124,40.6855003586647,40.6853125866859,40.6852718836681,40.6852278227578,40.6851749763059,40.6851181493407,40.6847671919212,40.6840340515225,40.6833032245533,40.6825684716866,40.681834159418,40.6811009812295,40.6807555999409,40.6803713787895,40.6796374973525,40.678905848881,40.6785771124341,40.6778235366874,40.6767260282328,40.6766470400465,40.6766935840179,40.6767531813271,40.6768132004563,40.676856899742,40.6768878336249,40.676938358473,40.676984280015,40.6769915503554,40.6770460726329,40.6771011446901,40.6771162276846,40.6771197269922,40.6772013782941,40.6772233582208,40.6772297124079,40.6772500493469,40.6772603038453,40.6772670523661,40.6772886878607,40.6773900020347,40.6773983719681,40.6774130382625,40.6774533415934,40.6774586230558,40.6775412435403,40.6775469609287,40.6775632812163,40.6777146016177,40.6777235804611,40.6777280021484,40.6777752500837,40.6777850557325,40.6778251934446,40.6778625695826,40.6779239034292,40.6779701955117,40.6780082308145,40.6780279745302,40.6780331010679,40.6781070809375,40.6781563587821,40.6783205817603,40.6783472717036,40.6783717684003,40.6783940706042,40.6784141778994,40.6784171310243,40.6784566816829,40.6785863307184,40.6787219954922,40.6789579768564,40.6790008660091,40.679203151044,40.679346246648,40.6798311339974,40.6799068951275,40.6799851049055,40.6807977922576,40.6817424827147,40.6830180530165,40.6837499156536,40.6844851487008,40.6852167050472,40.6853348451315,40.6859503064327,40.6866825554247,40.6874156345935,40.6881474512173,40.6888810337183,40.6893452100975,40.6896087768417,40.6897298620638,40.6898034564914,40.6899886278864,40.6900622223053,40.6903462499155,40.6924239053023,40.6940105041868,40.6962074884059,40.6968461689056,40.6979116822372,40.6981883325315,40.6983260788191,40.6984627274387,40.6986773264163,40.6988200032159,40.6989739143496,40.6990900019673,40.6991929024127,40.6992953542764,40.6994045406529,40.6994947771409,40.6995628810171,40.6995847944241,40.6996135788452,40.699633724601,40.6996779853941,40.6997905932375,40.6998233144236,40.7000062728164,40.7001049092465,40.7001228108842,40.7002149527619,40.7004053004199,40.70042452328,40.7005058357302,40.7007252341929,40.7002811274921,40.6998978895406,40.6998737747676,40.6994557914414,40.6990369704857,40.6988481360524,40.698640223292,40.6984046930499,40.6981857953999,40.6978311888305,40.6976153015073,40.6974053962503,40.6969865451318,40.6967365923545,40.6966749543876,40.6966280858393,40.6966128244709,40.6965602684784,40.6963584314036,40.6961842773079,40.695791153846,40.6953583772966,40.6951146575311,40.6950282153467,40.6948609024252,40.6947127697819,40.6946739753662,40.694316523049,40.6938633976118,40.6933504740712,40.6933500992541,40.6932410125515,40.6931657263592,40.69290417237,40.6927742086536,40.6926038114563,40.6923462235934,40.6920017688283,40.6919284539681,40.6914908400026,40.691366941838,40.690831749277,40.6907733573566,40.6903988375817,40.6901234059908,40.6899239253446,40.6894898413008,40.6890716435979,40.689019477115,40.6888720518375,40.6886409221165,40.688211241412,40.6877843687593,40.6876260884438,40.6873566678148,40.687213247771]}]],[[{"lng":[-73.8016826655336,-73.8016677669121,-73.8015556533534,-73.8015305266934,-73.8014539825105,-73.801418975859,-73.8013428673729,-73.8012616037584,-73.8012340123843,-73.8012155284598,-73.8011995636295,-73.8011790910815,-73.8011600086592,-73.8011323614825,-73.801134301319,-73.8011369726162,-73.8011423813821,-73.8011553859723,-73.8011593493157,-73.8011723425091,-73.8011946161513,-73.8013016646212,-73.8014021065074,-73.8015645058313,-73.8015871663702,-73.8016819475972,-73.8020252177967,-73.8023890644017,-73.8026776954252,-73.8030752042896,-73.803230276536,-73.8041022658922,-73.8042828823602,-73.8046451703019,-73.8049297631947,-73.8052268279005,-73.8055181112092,-73.8057684019137,-73.8060620273092,-73.8066060873639,-73.8068607274562,-73.8070906333245,-73.8073362180269,-73.8078746961921,-73.8080734242231,-73.8085765517067,-73.8087435850634,-73.8089241714599,-73.8091446130441,-73.8091842520063,-73.8095478746414,-73.8097232667476,-73.8099560125052,-73.8102442617866,-73.8106329831089,-73.810754331847,-73.8110215873342,-73.8113979127617,-73.8117266323241,-73.811769901511,-73.8120295219687,-73.8120913555942,-73.8122418859606,-73.8124520793489,-73.8129980176373,-73.8131538158261,-73.8133890045906,-73.8136185078703,-73.8136563428962,-73.8136941977681,-73.8140705039223,-73.8141519173061,-73.8143092274701,-73.8144154871931,-73.8146694585273,-73.8149234326723,-73.8150331183611,-73.8151394016928,-73.8153719073105,-73.8154072811482,-73.8154625225467,-73.8155177755766,-73.815937029704,-73.8161385390022,-73.8163782449298,-73.8165897680259,-73.8166996124735,-73.8169667032834,-73.8170973875645,-73.8170276805223,-73.8164004666224,-73.8152427268333,-73.8144393186543,-73.8127805953004,-73.8119043619029,-73.8105887763747,-73.8096898533,-73.8090007105035,-73.808493330562,-73.8065887271708,-73.8044998746597,-73.8027872140162,-73.8018572811557,-73.8010769978964,-73.8002218519338,-73.7993042528534,-73.7989815214528,-73.7981839240753,-73.7977681013414,-73.7973140076359,-73.7963941803778,-73.7956166896186,-73.7947305235293,-73.7938960996078,-73.7930380005235,-73.7920285465067,-73.791014107118,-73.7902154424165,-73.789414121248,-73.7892833506777,-73.7891487964828,-73.7890120958796,-73.7889919307763,-73.7889652459335,-73.7889324378942,-73.7888939941984,-73.7888504861384,-73.7888025602804,-73.7887509288497,-73.7886963591255,-73.7886396620548,-73.7885816801997,-73.7885162535478,-73.7885161549744,-73.7885160889831,-73.7884655771322,-73.7884654550029,-73.7884653920933,-73.7884341342647,-73.7884340590822,-73.7884340315063,-73.7884241075716,-73.7884240885826,-73.7884241033583,-73.7884348118371,-73.7878467841393,-73.7874204069056,-73.7869959870821,-73.7865752862753,-73.7861600592495,-73.7857519848191,-73.7853527219895,-73.7844614449883,-73.7835607566972,-73.7826254745131,-73.7824704324181,-73.7823665003101,-73.7822712657047,-73.781782739708,-73.7805889280166,-73.7804203408727,-73.7799800524784,-73.7797255363961,-73.7795716474232,-73.7788695743189,-73.7780011969972,-73.7773063386292,-73.7771234697216,-73.7761862829399,-73.7757145837483,-73.7752992789752,-73.7744423816123,-73.773571351684,-73.772758592226,-73.7719212200709,-73.7711041071752,-73.7700798474793,-73.7692253578001,-73.7691391403288,-73.7690621074324,-73.7687043494028,-73.7681799066304,-73.7673322808688,-73.7666409517763,-73.765397945285,-73.7644695172354,-73.7636077413815,-73.7627661541315,-73.7624033376401,-73.7619699488974,-73.7611382719,-73.7603062312181,-73.7595009415023,-73.7594414294101,-73.7591950051836,-73.7591282421315,-73.7583272860686,-73.7572567144309,-73.7558887802178,-73.7547007835067,-73.754353618376,-73.754075409734,-73.7540478395502,-73.7540102453054,-73.7537083455682,-73.7536066185572,-73.7535751213263,-73.7531839938608,-73.7524596548407,-73.7523096398835,-73.7518426986276,-73.7513982866851,-73.7513702073877,-73.7512124697011,-73.7507743583769,-73.7504705818291,-73.7501552293658,-73.7498552299581,-73.749556079175,-73.7492501392002,-73.7489509461727,-73.7486428636018,-73.7483288087051,-73.7480407369862,-73.7477301211579,-73.7474186795521,-73.7471243688162,-73.7468190925791,-73.7464936723342,-73.7461815788437,-73.7460220095442,-73.7457314650401,-73.7453309842404,-73.7448792323999,-73.7448461056506,-73.7448795153754,-73.7451048500096,-73.7459533209743,-73.7462434557995,-73.7472861763531,-73.7475517543229,-73.7485699309448,-73.7488460144439,-73.7494454676422,-73.7500899113111,-73.7502561578794,-73.750557614059,-73.7510302062257,-73.7512579347298,-73.7515421552228,-73.7518040921566,-73.7522582861939,-73.7524705986931,-73.7526829098727,-73.7532105785222,-73.7532381712931,-73.7532868997966,-73.7534560422091,-73.7537259608402,-73.7539939508953,-73.7541785694589,-73.7548490967056,-73.7552345780572,-73.7554939240218,-73.7556223647356,-73.7556364696883,-73.7557616922747,-73.75581771087,-73.7560622901594,-73.7561823385891,-73.7563623925967,-73.7564638829438,-73.7564837456172,-73.7564612722833,-73.7564247873451,-73.7564062123614,-73.7564373429195,-73.7566845473024,-73.7567160246846,-73.7569953336142,-73.757316927804,-73.7576312961815,-73.7579189293433,-73.7579564366485,-73.7580419575247,-73.7590282767345,-73.759971165375,-73.7616801228422,-73.761966576912,-73.7625834337871,-73.7628615716047,-73.7634780225603,-73.764403391469,-73.7654426628721,-73.7662096331377,-73.7669902341904,-73.7701748198214,-73.7710884528857,-73.7715329052512,-73.7718800034976,-73.7722939722367,-73.7734358668527,-73.7744510767558,-73.7752069524185,-73.7752740919794,-73.7761539799492,-73.7769771393288,-73.7776921443559,-73.7784156101092,-73.7789686627138,-73.7792131093037,-73.7796624332781,-73.7803166723924,-73.7816168987204,-73.7824122428447,-73.7836648051584,-73.7844108856223,-73.7850689960425,-73.7859075824703,-73.7863041589221,-73.7868787584367,-73.7869186855416,-73.7875280945621,-73.7881416092969,-73.7894808966139,-73.7900299374484,-73.7930598086958,-73.7938312466941,-73.7949477091976,-73.7952869811172,-73.7958739653934,-73.7963786015381,-73.7969869082699,-73.7975311711846,-73.7981196214381,-73.7986684478486,-73.7993087296479,-73.7998270573683,-73.8000083910058,-73.8002640083731,-73.8015284675928,-73.8016057923137,-73.8016826655336],"lat":[40.6663223525709,40.6663729626695,40.6667533644458,40.6668371594929,40.6671756734129,40.6673542161349,40.6677737973427,40.6683901898973,40.6686422375113,40.6688428294487,40.6689388249048,40.669100265712,40.6698004209725,40.6705486676171,40.6712944621285,40.6713585293883,40.6714879425965,40.6717991208439,40.6718938897181,40.6722050322449,40.6724224646056,40.6731215222321,40.6735613198798,40.6740479485806,40.6741158501574,40.6743838489599,40.6751142732162,40.6758884786801,40.6764979669041,40.6773456012399,40.6776810570058,40.6794245501539,40.679817356731,40.6805798897467,40.6811769746726,40.6817981498802,40.6824082109029,40.6829323912503,40.6835543609624,40.6846811457839,40.6851799577744,40.6856303107838,40.6861254469901,40.6870983377938,40.6874528242586,40.6883308903006,40.6886258845928,40.6889448092041,40.6893310307331,40.6894004794721,40.690037546626,40.6903463441441,40.6907561131604,40.6912635868155,40.6919473825768,40.6921587015632,40.6926228874858,40.6933223136246,40.6939192986157,40.6939939048375,40.6944476309482,40.6945596210236,40.6948322361498,40.6951981245524,40.6961120625901,40.6963693587456,40.6967577542373,40.6971367385317,40.6972010516875,40.6972667958838,40.6978871298107,40.6980399706405,40.6983353320566,40.6985189733626,40.6989707122899,40.6994224400754,40.6996395966719,40.6998500093964,40.7003103108916,40.7003803378794,40.700492864456,40.7006053915253,40.701505117148,40.7019375695571,40.7024519644687,40.7029154363234,40.7031560939081,40.7037412846819,40.7040298015877,40.7040334993715,40.7040833531051,40.7042024395625,40.7044021505635,40.7048739630061,40.7051239401774,40.7054960718278,40.7057462554824,40.7059488744024,40.7060867460048,40.7066339100103,40.7072277910612,40.7077158030576,40.7079798752268,40.708201730875,40.7084458015136,40.7086982316472,40.7088009926084,40.7090243932807,40.7091431883418,40.7092701987566,40.7095315794122,40.7097530791751,40.710012461966,40.7103523293739,40.7107110754255,40.7110693716986,40.7114325850963,40.7117170446768,40.7119975320017,40.7120317286485,40.7120568856387,40.7120727091008,40.7121144183749,40.7121539506849,40.712190718555,40.7122241755897,40.712253824594,40.712279224786,40.7122999988747,40.7123158381413,40.7123265072019,40.712331847506,40.712276502572,40.7122764146066,40.7122763272035,40.7122098570008,40.7122096993006,40.7122095427143,40.7121356658029,40.7121354916037,40.7121353010743,40.7120589211358,40.712058799811,40.7120586532517,40.711984687609,40.7118108331664,40.7118476784602,40.7119016092442,40.7119724932767,40.7120600713426,40.7121639526009,40.7122836170325,40.7124939049805,40.7127107883543,40.7129375484909,40.712976581028,40.7130027431969,40.7130251300728,40.7131399931981,40.7134281756625,40.7134687101548,40.7135745712782,40.7136357700218,40.7136741597362,40.7138492976282,40.7140511241328,40.7142093168187,40.7142619940852,40.714485574205,40.7145984549217,40.7146963140527,40.714905043129,40.7151200953687,40.7153972209501,40.715685044453,40.7159750627523,40.7163272024246,40.716626587994,40.7166567985854,40.7166837679547,40.7168090292281,40.7169952203388,40.7172897968106,40.7176466136631,40.7183560323431,40.7188903928791,40.7192821420548,40.7196387608677,40.7198085814108,40.7200036100347,40.7203291771857,40.7206466438225,40.7210273722768,40.7210634437532,40.7207358075491,40.7206470410294,40.7195820898652,40.7181386016612,40.7162986441314,40.7147100533219,40.7142629751936,40.7139046952291,40.7138775399133,40.7138349013797,40.7133246367383,40.7130711226607,40.7129922961522,40.7120551756148,40.7103165636493,40.7099533868739,40.7088229209535,40.7077487195527,40.7076819076429,40.7073065795755,40.7063218369015,40.7056399305325,40.7049445805243,40.7042776917444,40.7036134515685,40.7029280059931,40.7022655651025,40.7015869393525,40.7008872105622,40.7002394336849,40.6995531363303,40.6988590284427,40.6981980346706,40.6975254521686,40.6967998738387,40.6961219259815,40.6957564370627,40.6950909418837,40.6941960574533,40.6932071819817,40.6931390561153,40.6930930777136,40.6927829348501,40.6916625651026,40.691279444851,40.6897371731037,40.6893473366572,40.6878037382071,40.6874474842651,40.6866720220613,40.6859234463587,40.6856131099465,40.685071682496,40.6842228673682,40.6837341259315,40.6830460426678,40.6824033234907,40.6814914114727,40.6811805143678,40.6808696168608,40.6801542881716,40.6801168860067,40.6800511448316,40.6798229563559,40.6794574278661,40.6790945072142,40.6788444857862,40.6779288383874,40.6772884092449,40.6766296731824,40.6762584734758,40.6762151785818,40.6758859094205,40.67575274273,40.6741968599303,40.6733723831302,40.6724292371103,40.6716840025685,40.6714898663732,40.6710940315838,40.6706335640968,40.6703729149189,40.6696663787421,40.6687585221339,40.6685625268752,40.6677412685644,40.6670403158804,40.6664511566071,40.6660125616196,40.6659554033968,40.6659702256372,40.6660804032886,40.6661842055746,40.6663723248568,40.6664038544264,40.6664717483847,40.6665023599371,40.6665702043647,40.6666720415289,40.6667864028128,40.6668781962599,40.6669716151109,40.6673154637619,40.6673893541188,40.6674053395036,40.6674249481372,40.6674468130344,40.6674599271148,40.6674715765186,40.6674555244903,40.6674540983191,40.6674354051205,40.6673907212974,40.6673519029135,40.6673035219654,40.6672665349925,40.667250182699,40.6672201318224,40.6671763718263,40.6670755227508,40.6670289866888,40.6669242770384,40.6668569048781,40.6667851046506,40.6666936091536,40.666651220509,40.6665898095678,40.6665855418631,40.6665294051331,40.6664785904247,40.6663676516217,40.6663276983717,40.6661932040816,40.6661805771446,40.6661622830918,40.6661577008222,40.6661564200896,40.6661642763963,40.6661711588822,40.666183726289,40.6662021767147,40.6662193926456,40.6662390891618,40.6662562369716,40.6662633605444,40.6662733954771,40.6663167738154,40.6663191854131,40.6663223525709]}]],[[{"lng":[-73.9596468542315,-73.9588338138987,-73.9584811140998,-73.9581729710387,-73.9583330495665,-73.958618792567,-73.9590766907229,-73.959536588682,-73.9600301850322,-73.9605227166957,-73.9607478509035,-73.9609797180793,-73.9614406065574,-73.9618998546095,-73.9623598015067,-73.9628214973773,-73.9629757948463,-73.9630793102664,-73.9632183274493,-73.9637110065635,-73.9638060104351,-73.9641759852132,-73.9646854073948,-73.9651770549901,-73.9656279953866,-73.9660950057244,-73.9665522667892,-73.967009770734,-73.9674490837313,-73.9679269635447,-73.9683847931366,-73.9688503681786,-73.9690860867996,-73.9691095043752,-73.9693357331895,-73.9698322562294,-73.9703006816215,-73.9707601311674,-73.9712229222095,-73.9717230555584,-73.9735711742329,-73.9740666825764,-73.9742929486252,-73.9745323148841,-73.9747542408034,-73.9750011189794,-73.9754593243374,-73.9759551729502,-73.9764577739989,-73.9769116822629,-73.9773708499307,-73.9778263936496,-73.9782822010231,-73.9787224679214,-73.9791921451197,-73.9796523340224,-73.9801118156174,-73.9805637066685,-73.9810229005033,-73.981679436394,-73.9817265346255,-73.9817923254865,-73.9818595171329,-73.9819272175715,-73.9819945280543,-73.9820434160202,-73.9820703645754,-73.9820927124339,-73.9822161951483,-73.9832066141372,-73.9843149130714,-73.9847636926324,-73.9849858236627,-73.987615120763,-73.9904532545266,-73.9917579375628,-73.993203471167,-73.9933251984328,-73.993410453874,-73.9934904641407,-73.9936282272451,-73.9936963935409,-73.9939369418221,-73.9938629532914,-73.9938233450535,-73.9937679139921,-73.993699309278,-73.9936227952132,-73.9935278276413,-73.993443419172,-73.9934117567152,-73.9933589415075,-73.9926226638654,-73.9925778427661,-73.9925277439515,-73.9924697458153,-73.9924038371919,-73.9922670890354,-73.9920590849371,-73.9921253723949,-73.992226867797,-73.9923293466088,-73.9923617568011,-73.9923860429603,-73.9920876847127,-73.9920187799107,-73.9914295319022,-73.9909271741497,-73.9907304133948,-73.9903961600365,-73.9901012659766,-73.9896488729282,-73.9892009588643,-73.9892006808992,-73.989175778438,-73.9890851947859,-73.9888686174,-73.9888718744998,-73.9892190228805,-73.9892778590443,-73.9894090541801,-73.989498614927,-73.9895964933882,-73.9896798129025,-73.9897527029379,-73.9898422478065,-73.9899443022715,-73.9900401021205,-73.9901379775248,-73.9902233684564,-73.9903358403322,-73.9904305986971,-73.9905076461551,-73.9906221993968,-73.9907450695054,-73.9908721142822,-73.9909616722243,-73.9910574728295,-73.991157429497,-73.9912428174044,-73.9912553182896,-73.9912948871201,-73.9913219676499,-73.9913594555695,-73.9915510592274,-73.9914198258596,-73.988886144117,-73.9889396567063,-73.9889261035307,-73.9889116802646,-73.9889116606737,-73.9889192614684,-73.9883810502026,-73.988232413847,-73.9882104208316,-73.9881441813541,-73.9881378817448,-73.9881274616869,-73.9880412880673,-73.9881002938246,-73.9880764491451,-73.9880180599722,-73.9879607928421,-73.9879196845924,-73.9878772872501,-73.9864748036859,-73.9862518700354,-73.986113727253,-73.9856158039637,-73.9854658119703,-73.9861727049655,-73.986455862402,-73.9870723456156,-73.9871190139427,-73.9864977810236,-73.9861646288063,-73.9861284224859,-73.9860711352197,-73.9860272747891,-73.9860976378494,-73.9854293212694,-73.9850811377321,-73.9851988332545,-73.9851705023899,-73.9852162186736,-73.9852550979799,-73.9852427393766,-73.9852496293302,-73.9852817791867,-73.9852400328845,-73.9856838852422,-73.9857175290046,-73.9857656602975,-73.9856828719225,-73.9856362709305,-73.9856707225647,-73.9856152376444,-73.9852051188004,-73.9852110356075,-73.9851626399471,-73.985131636312,-73.9850169640648,-73.9849359782035,-73.9846550788302,-73.985743787901,-73.9858922722833,-73.985942854995,-73.9859495615567,-73.9858123735265,-73.9851352097033,-73.9846194285841,-73.9836952162366,-73.9823466414755,-73.9818864594655,-73.9813917446855,-73.9812893737095,-73.9809470835406,-73.980537679464,-73.98043434256,-73.9801322257865,-73.9800468439799,-73.9792882208298,-73.9782894915276,-73.9777947550321,-73.9768520784519,-73.9763995193056,-73.9762852788425,-73.9758305578524,-73.9757816932119,-73.975791401302,-73.9757621948648,-73.97554385822,-73.9752678323445,-73.9750866806789,-73.9749643680818,-73.97483924436,-73.9746655672272,-73.9744872252099,-73.9741436182347,-73.9739409836669,-73.9738998905246,-73.9737747724601,-73.9737206045576,-73.973613224639,-73.9735422772157,-73.973366710678,-73.9732051804574,-73.9731285912099,-73.9730707053794,-73.9730352290207,-73.9729231700197,-73.9728680726215,-73.9728717908152,-73.9725542982963,-73.972172372418,-73.9720509552187,-73.971952924385,-73.9718184948356,-73.9717998015074,-73.9717120072709,-73.9716204956934,-73.9716111339144,-73.9714421096152,-73.9712908330033,-73.971107658523,-73.9709876800351,-73.9708414835481,-73.9707636230071,-73.9706932647336,-73.9697872200334,-73.9686070740611,-73.9685591341792,-73.9684950672613,-73.9680484926094,-73.9668032725715,-73.9667010682416,-73.9665975037666,-73.9661749517758,-73.9660350151679,-73.9655649870462,-73.9654264056685,-73.9643427774881,-73.9638612629117,-73.9610779400213,-73.9596468542315],"lat":[40.8011564232565,40.8008175046001,40.8006704780884,40.8005825409548,40.8003650535111,40.7999770261545,40.7993522339277,40.7987185255206,40.7980381078972,40.7973684689598,40.7970559756554,40.7967386440453,40.796110827184,40.7954792700612,40.7948520605607,40.7942372356913,40.7940161814964,40.7938678763279,40.7936785732783,40.7930090280449,40.7928799013058,40.7923620450278,40.7916640267989,40.7909903410994,40.7903661171291,40.7897343897667,40.7891071528256,40.7884767907422,40.7878607210931,40.7872215711261,40.786595696524,40.7859740529881,40.7856396959121,40.7856032806995,40.7852932795571,40.7846109105864,40.7839754134459,40.7833401370511,40.7827062555875,40.7820214764623,40.7794778616212,40.7788054167216,40.7784979889537,40.7781677850257,40.7778646924296,40.7775277799166,40.7768987227267,40.7762197546262,40.775532537252,40.774909124027,40.7742810072139,40.7736561919219,40.7730318787382,40.7724188982852,40.7717812660014,40.7711553275426,40.7705283686784,40.769905324566,40.7692728335597,40.7683901309362,40.7684027308167,40.7684148757762,40.7684211865087,40.7684215792369,40.7684160487471,40.7684082108152,40.768531121716,40.7688922989298,40.7689604232602,40.7693793797666,40.7698481832134,40.7692264007039,40.7693207012287,40.7704154431329,40.7716122483408,40.7721661445151,40.7727798103924,40.7728314795376,40.7728788953456,40.7729289052621,40.772993650359,40.7730348322204,40.7731795109669,40.7732695290723,40.7733817668827,40.7734839945078,40.7735621521555,40.7736322902124,40.7737144464686,40.7737705496783,40.7738026124239,40.7739268801547,40.774974056037,40.7749560163594,40.7750021104399,40.7750241595518,40.7750181403907,40.7751160338586,40.7754975986949,40.7755090750534,40.7754822110262,40.7754689009586,40.7755018997667,40.7755571799221,40.7759839708214,40.7760733407354,40.7768795605453,40.777566878763,40.7775605502426,40.7775850656791,40.7779964575167,40.778627560009,40.7792523986516,40.7792527867819,40.7792875240158,40.7794075976621,40.7796929229115,40.7797137382531,40.779697895712,40.7797234392711,40.779737706472,40.7797250443898,40.7796981466834,40.7796775686581,40.7796712447142,40.7796807526707,40.7796965927686,40.7797076771957,40.7796997697048,40.7796823617138,40.779661794395,40.779664972553,40.7796681391239,40.7796760644118,40.7796713286867,40.7796460076439,40.7796396842544,40.7796523526258,40.7796697756065,40.7796713675871,40.7796507830191,40.7796302092089,40.7796317960414,40.7795858828349,40.7795748209348,40.7797552802871,40.7798788985328,40.7799561784404,40.7800592925163,40.7800960376492,40.7801223662677,40.7802260943437,40.7809810740459,40.7812331442156,40.7812254825421,40.7813656713272,40.781379281274,40.7814017969449,40.7815859608512,40.7816028783053,40.7816509350017,40.7816341888105,40.7817709870316,40.7818334782158,40.7818920513348,40.7839165737187,40.7842387642455,40.7844389118774,40.7851418625951,40.7853607005755,40.7860684522587,40.7859192190815,40.7851896388202,40.7852103185016,40.7859512028873,40.7861218824484,40.7862390013312,40.7862407060266,40.7862289642368,40.786058225698,40.7854139421847,40.7859219351105,40.7859665521978,40.7860133341582,40.7860305018165,40.7859762055116,40.7859725721508,40.7859631398559,40.7859786209501,40.7860358581368,40.7862221239197,40.7861759946688,40.7861962748587,40.7863097862132,40.7862901501467,40.7862429119939,40.7862196457153,40.7860476692128,40.7860395548837,40.7860209992672,40.78606029702,40.7860142376983,40.786130720651,40.786534741808,40.7865700828548,40.7864265290196,40.7864528478804,40.786487113464,40.7866168653571,40.7865876183929,40.7865860163499,40.7879152813128,40.7898547812753,40.7905165804326,40.7912282460052,40.7913755094331,40.7918678937826,40.792456812625,40.7925942830968,40.7929937658858,40.7931135256665,40.7941776321634,40.7955867604609,40.796284629772,40.7976313483932,40.7982732106926,40.7984352354101,40.7990922809133,40.7991562567803,40.7992096278863,40.7992601735493,40.7995282511399,40.7999328495318,40.800189533633,40.8003696341939,40.8005582432627,40.8008135147342,40.8010574288969,40.8015168953412,40.801809025864,40.8018898635312,40.8020458459486,40.8021678152803,40.8022968598872,40.8023564112503,40.8026301133465,40.8028300582763,40.8029747155087,40.8030555484474,40.803073973742,40.8032498228439,40.8033207341761,40.8033561876453,40.8037986346502,40.8043190769591,40.8045303760101,40.8046197095542,40.804717542702,40.8047856154861,40.8049316912766,40.8050422943994,40.8050961874744,40.8053344268398,40.8055287075333,40.8057901396768,40.8057429029292,40.8056853437599,40.8056573728797,40.8056302684492,40.8053004973846,40.8048709498982,40.8048535841203,40.8048322703844,40.8046837001335,40.804207561121,40.804168476937,40.8041236771614,40.8039455048015,40.8038864986314,40.8036886012456,40.8036303177756,40.8031745614049,40.8029720383534,40.8018003577204,40.8011564232565]}]],[[{"lng":[-73.8627549019687,-73.8627202141363,-73.8622404805114,-73.8621578566161,-73.8621675106328,-73.862014930969,-73.8617687441991,-73.8615384430536,-73.8612366879785,-73.8604333775361,-73.8600169832406,-73.85975083756,-73.859490724012,-73.8594133946409,-73.8592206295408,-73.8591560763267,-73.859078934299,-73.8589205637871,-73.8589919726669,-73.8589842333017,-73.8589229811653,-73.8587920421875,-73.8586719006749,-73.8586451048795,-73.8587652597761,-73.8588872266017,-73.8588398492652,-73.858711700318,-73.8586911026821,-73.8588437150625,-73.8586191528177,-73.8585421861057,-73.8585320867144,-73.8584808798074,-73.8584728970466,-73.8584612577606,-73.8584656240617,-73.8584096899565,-73.8584013738625,-73.85833010331,-73.8583217836605,-73.8582480115053,-73.8582370154957,-73.8581655020133,-73.8581567544819,-73.8580817226887,-73.8580745152959,-73.8580018665468,-73.8579943284836,-73.8579318312431,-73.8579233217447,-73.8578681943669,-73.8578594310592,-73.8578009228025,-73.8577925082393,-73.8577385638559,-73.8577329336658,-73.8576784374159,-73.8576896537065,-73.8576547355013,-73.8577749770522,-73.8578696213026,-73.8578810310114,-73.857964578664,-73.8580547091561,-73.8581503402828,-73.8581528098025,-73.8581642151605,-73.8582546465724,-73.8582678363007,-73.8583521972594,-73.8584153874909,-73.8584863395846,-73.8585008125537,-73.8583431930898,-73.8583294889102,-73.8583953140953,-73.8583507077487,-73.8583381131557,-73.8582525686971,-73.8582413098892,-73.8581390314338,-73.8581280618517,-73.8580509708731,-73.8580391755064,-73.8579512290883,-73.8579424353982,-73.8578624550102,-73.8578497949229,-73.8577706171077,-73.8577593108406,-73.8576389653581,-73.8576006846189,-73.8575883427544,-73.8568388876788,-73.8569707835438,-73.8569635600591,-73.8566748229625,-73.8566829973625,-73.8568029095629,-73.8568542711157,-73.8568614984466,-73.8569147794775,-73.8569207292805,-73.8569749683405,-73.8569812330915,-73.8570289828961,-73.8570361350842,-73.8570833368248,-73.8570895900675,-73.8571382885443,-73.8571452335369,-73.8571946426763,-73.8572008784468,-73.8572490376032,-73.8572566628431,-73.8573064329135,-73.8573135386542,-73.8573599019776,-73.8573679585382,-73.8574166225437,-73.8574251987913,-73.8574725832161,-73.8574797474493,-73.8575281058115,-73.8575355580386,-73.8575591575233,-73.8575479382374,-73.857582854707,-73.8574642287462,-73.8573735970151,-73.8571849615311,-73.8571760689437,-73.8570911149947,-73.8570827583543,-73.8569820720167,-73.8569710568437,-73.8568841550811,-73.8568250757656,-73.8568243674957,-73.8567557112035,-73.8567435031468,-73.856690352891,-73.8566030251476,-73.8565867538866,-73.8567823689739,-73.8567985803451,-73.8567116939948,-73.8567609287029,-73.8567731878093,-73.856825587981,-73.8568366081776,-73.8568878804073,-73.8569004432687,-73.8569899902876,-73.857093112109,-73.8571052940205,-73.8571871669689,-73.8571962917514,-73.8572824076211,-73.8572917459133,-73.8573806782753,-73.8573895145346,-73.8574749996307,-73.8574845369147,-73.8576042410329,-73.857635783638,-73.8576503708522,-73.8577084468894,-73.8577156725686,-73.8577674057337,-73.8577762303999,-73.8578349741772,-73.8578413659768,-73.8578970132351,-73.8579443345331,-73.8579670241406,-73.8579750018693,-73.8580451146315,-73.8580719978761,-73.8581328871493,-73.8581412005723,-73.8581763100433,-73.857819839608,-73.8578078823446,-73.8576883479084,-73.857672576088,-73.857529509768,-73.8574600419265,-73.8573714940672,-73.8573506578043,-73.8571880166611,-73.8571630320101,-73.8570027956736,-73.8569832889211,-73.8568380003565,-73.8567763209547,-73.8566745713554,-73.8566561759732,-73.8566119581344,-73.8566277294147,-73.8567789340733,-73.8567915418135,-73.8568855747746,-73.8569005431057,-73.8569901420736,-73.8570027254228,-73.8570901125114,-73.8571053425835,-73.8571913986338,-73.8572051624175,-73.8572941135809,-73.8573086888954,-73.8573992966731,-73.8574117999749,-73.8575046775756,-73.8575184191901,-73.8576100766833,-73.8576229398933,-73.85771566634,-73.8577302417448,-73.857819481249,-73.8578332359106,-73.8581943306643,-73.8582716431614,-73.8582809200557,-73.8583615894938,-73.8584432328879,-73.858451136766,-73.8585174974233,-73.8585074029871,-73.8585852621824,-73.8571213353452,-73.8562732064007,-73.8553763338786,-73.8553345466012,-73.8553026602968,-73.8550633024279,-73.8549509176938,-73.8547827375971,-73.8543740621409,-73.8538344005143,-73.8536746070519,-73.8534402522138,-73.8532999892406,-73.8531051389512,-73.8529247665995,-73.8526633943345,-73.8525825246995,-73.8524722061685,-73.8523427288433,-73.852336246321,-73.8521911681973,-73.8521650798942,-73.8521279815657,-73.8519826307076,-73.8519004907292,-73.8518659886392,-73.8518618516849,-73.851959190852,-73.8520877795051,-73.8521275848111,-73.8521357137624,-73.8521542855528,-73.8521556683952,-73.8521614469217,-73.8518974626072,-73.8520399162594,-73.8521222109915,-73.8522045056597,-73.8526043258402,-73.854555522564,-73.8558349556606,-73.8587632497491,-73.8611170766244,-73.8617507144683,-73.8627263391242,-73.8641847586896,-73.866556611179,-73.8675141292392,-73.8684575765922,-73.8694245860326,-73.8697391384021,-73.8703788127843,-73.8709705324967,-73.8713564854483,-73.8718409589812,-73.8723725635367,-73.8727735685624,-73.8733031009611,-73.8737009828374,-73.8739829374628,-73.8746294635104,-73.8754323616297,-73.8755564314717,-73.8762518021305,-73.8764795304389,-73.8769245825537,-73.8774161249239,-73.8783431255438,-73.8784577933542,-73.8792777995974,-73.8798389492007,-73.8802064802561,-73.8811374760109,-73.8820711212716,-73.8825687695602,-73.882999182888,-73.8839357946289,-73.8848553853325,-73.8857874052002,-73.8867165625313,-73.8876466372534,-73.8877832688397,-73.8886776620666,-73.8895712836084,-73.890501292144,-73.8914312862048,-73.8917504879261,-73.8923209052634,-73.8935881894753,-73.8944468875035,-73.8948968982871,-73.8952404495164,-73.8954708500579,-73.8955464921217,-73.8956446981448,-73.8956727864848,-73.8957024792063,-73.8957308002896,-73.8961557356709,-73.8963103780021,-73.8967343767552,-73.8972443746733,-73.8974219698374,-73.8973324762698,-73.897264822315,-73.8972874816492,-73.897318413995,-73.8973575745283,-73.8973884526943,-73.8974260640104,-73.8974703131031,-73.8975210877602,-73.8980371566637,-73.8980683174928,-73.8980911934983,-73.8981056575226,-73.8980902978177,-73.8980684312123,-73.8980403733342,-73.8980065291825,-73.8979673872822,-73.897923512633,-73.8981375085596,-73.8981902645821,-73.8982414530998,-73.8982898957431,-73.8983344773505,-73.89837417164,-73.8984080648332,-73.8985607157575,-73.8985946567442,-73.8986240117079,-73.8986486550348,-73.8986684806338,-73.8991209144408,-73.899258571912,-73.8995593819381,-73.8997265043898,-73.8998147477601,-73.8998585165688,-73.8998654486951,-73.8998679400511,-73.8998659865307,-73.8998595914061,-73.8998487650756,-73.8998335252937,-73.8998083602161,-73.8997750875714,-73.8997337782537,-73.8996845202942,-73.8996274187884,-73.8995625954032,-73.8994901883096,-73.8994103518506,-73.8990607288989,-73.8986613786671,-73.8982524029575,-73.8979114523291,-73.8978952811055,-73.8974273674472,-73.8973195757752,-73.8972716766544,-73.8970608179933,-73.8967062276317,-73.8964113840346,-73.8962474473163,-73.8960849253165,-73.895984065028,-73.8958599187409,-73.8955770438276,-73.8954244779486,-73.8952747945424,-73.8952493676186,-73.8951683706391,-73.8950665769515,-73.8950575871895,-73.8949945888893,-73.8949579650197,-73.8949549761795,-73.8948022255794,-73.8946432599384,-73.8946062741715,-73.8945602113229,-73.8944998080285,-73.8944322594536,-73.8943237202154,-73.8934960594546,-73.893075162923,-73.8926678131164,-73.8923944328483,-73.8921210344678,-73.891818572436,-73.891730067629,-73.8914448974731,-73.8916546392846,-73.8918353579635,-73.8910707878575,-73.890513578572,-73.8902903458953,-73.8892561949502,-73.8888165393255,-73.888354711776,-73.8877787738584,-73.8877066182002,-73.887624529175,-73.8871342937633,-73.886719460335,-73.8866762035628,-73.886025541989,-73.885648234261,-73.8850626608288,-73.8843972942821,-73.8842680418434,-73.8838286404288,-73.8834053801751,-73.8829862095267,-73.8825712432872,-73.8821605951121,-73.8817543776954,-73.8813527020737,-73.8809556782727,-73.8805634150475,-73.8802016158719,-73.879611587844,-73.8789736513567,-73.8785491567377,-73.8781864701793,-73.8778141632007,-73.8774333983731,-73.877045371829,-73.8766513529738,-73.8761531411474,-73.8760894970797,-73.8760165651882,-73.8751757334757,-73.874759433569,-73.874263304901,-73.8738052462418,-73.8732794145531,-73.8727256165466,-73.8722357769659,-73.8717353399993,-73.8714335734198,-73.8709270425469,-73.870714474926,-73.8701612831228,-73.8696297045436,-73.8694371976398,-73.8688938272456,-73.8680987350338,-73.8672819381513,-73.8660687595497,-73.8655058871899,-73.8650929408296,-73.864840095843,-73.8647388428493,-73.8645848696249,-73.8640497569827,-73.8635306344501,-73.8634021493181,-73.8633222212668,-73.8627549019687],"lat":[40.7667645254284,40.7666706422915,40.7662830865067,40.7661917584321,40.7660479942144,40.7658909264002,40.7655940045212,40.7653425322173,40.7649606161024,40.7638688823723,40.7632642855178,40.7628778396972,40.7625626159017,40.7624832658427,40.7624827444824,40.7625196306997,40.7625228322716,40.762406401186,40.7622465237092,40.7621714744721,40.7621223460182,40.7622793387477,40.762522270509,40.7625143959091,40.76226519185,40.7621336093978,40.7621053222161,40.7622337619551,40.7622211910035,40.7620587667792,40.7619355975015,40.7620268986902,40.7620217613326,40.7620826998614,40.7620921995025,40.7621060511651,40.7621088022809,40.7621733558773,40.7621830434029,40.7622660656111,40.762275756477,40.7623616936928,40.7623745026043,40.7624578070262,40.7624679957431,40.7625553998327,40.7625637953992,40.7626484207696,40.7626572007307,40.7627300038607,40.7627399155976,40.7628041311836,40.7628143396262,40.7628824935653,40.7628922961825,40.7629551325838,40.7629616921483,40.763027748527,40.7630363052037,40.7630798233503,40.7631388351303,40.7631852837601,40.7631908844928,40.7632318869892,40.7632761204006,40.7633230536619,40.7633242660726,40.7633298629186,40.7633742448036,40.7633807171476,40.7634221189061,40.7634531304235,40.7633693463789,40.7633764330825,40.763562560958,40.763555851276,40.7634770591218,40.763454789502,40.763448502848,40.7634057935906,40.7634001728101,40.7633491099655,40.7633436332673,40.7633051458725,40.7632992570395,40.7632553491317,40.7632509593267,40.7632110271835,40.7632047068898,40.763165177065,40.7631595325573,40.7630994491364,40.7631404011361,40.7631335519922,40.7640001791157,40.7640660675689,40.764074427864,40.7639301883254,40.7639207285854,40.7639808454609,40.7639225439048,40.7639143405931,40.7638538615462,40.7638471080892,40.7637855399447,40.76377842904,40.7637242268053,40.7637161106702,40.7636625297564,40.7636554318984,40.7636001539374,40.763592270232,40.7635361849825,40.7635291068648,40.7634744396575,40.7634657833207,40.7634092878634,40.7634012232512,40.7633485942393,40.7633394499232,40.7632842084879,40.763274472439,40.763220687375,40.7632125548092,40.7631576603969,40.763149201508,40.7631224117855,40.7631155657005,40.7630729006266,40.76301478272,40.7629703785196,40.7628779609662,40.7628736038149,40.7628319820006,40.7628278880202,40.762778558001,40.7627731613803,40.7627305839387,40.7627016390982,40.7627012924442,40.762667654151,40.7626616735372,40.7626356328596,40.7627314174296,40.7627228406169,40.7625082774058,40.762516823292,40.7626156869525,40.7626398261901,40.7626458365176,40.7626715271005,40.7626769309451,40.7627020679321,40.7627082273864,40.7627521310525,40.7628026887013,40.7628086615392,40.762848801777,40.7628532749758,40.7628954970572,40.7629000737088,40.7629436754313,40.7629480077031,40.7629899192708,40.7629945949933,40.7630532817898,40.7630123219649,40.7630191733756,40.7629503952808,40.7629418350821,40.7628805522781,40.7628700979901,40.7628005104989,40.7627929380017,40.7627270184924,40.7626709621704,40.7626440834573,40.7626346320932,40.7625515751763,40.7625197292697,40.7624475987089,40.7624377508773,40.7623962947257,40.7622261338905,40.7622204271011,40.7621633737606,40.7621558457603,40.7620875602117,40.7620544022984,40.7620121377963,40.7620021924469,40.7619245639316,40.761912637771,40.7618361553394,40.7618268444867,40.761757495881,40.7617280559227,40.7616794900641,40.761670708748,40.7616495422568,40.7616290623932,40.7617009740634,40.7617069699136,40.7617516910766,40.7617588092562,40.7618014223738,40.7618074056061,40.761848966852,40.7618562104715,40.7618971370758,40.7619036827937,40.7619459857851,40.7619529184758,40.7619960094695,40.7620019563721,40.762046126614,40.7620526618803,40.7620962530655,40.7621023694236,40.7621464691142,40.7621534005787,40.7621958402194,40.7622023819975,40.7623741079838,40.7622876283529,40.7622772514764,40.7621870156245,40.7620956894799,40.7620994650089,40.7620149107,40.7620080649159,40.7619170090987,40.7611889038728,40.7609024084304,40.7606693850315,40.7606581548903,40.7606495847523,40.7602806988509,40.7601074960894,40.7598482997658,40.759676255254,40.7594269778065,40.7593246483547,40.7591684372405,40.7590596940802,40.7588890062182,40.7587110075729,40.758397738787,40.7582834516903,40.7581202009823,40.7578867326546,40.7578732453588,40.7575667953577,40.7574596732962,40.757388722746,40.7571107363121,40.756866404551,40.7566559922049,40.7563274102381,40.7556896704974,40.7550785717333,40.7547509201017,40.7544551502439,40.7540478926649,40.7534652339494,40.7533819947196,40.7527528596665,40.7527103580457,40.752685519396,40.7526606818602,40.752541966549,40.7519619185315,40.7515772724589,40.7507169718049,40.7500242283664,40.7499675912558,40.7498679379296,40.7497195881934,40.7494641491502,40.7493757074826,40.7492638209405,40.7491568510175,40.7491262710972,40.7490640780592,40.7489992423263,40.7489569508011,40.7489055766492,40.7488515513313,40.7488129579851,40.7487581246386,40.7487173189776,40.7486856684713,40.7486139279188,40.7485273595215,40.7485136085516,40.7484388501133,40.74841640211,40.748368988615,40.7483193733449,40.7482226600425,40.7482148108683,40.7481240924725,40.7480617245398,40.7480249796925,40.7479272934953,40.747829926818,40.7477778459097,40.7477344024237,40.7476302420153,40.7475348115672,40.7474397539918,40.7473414625193,40.7472448393756,40.7472289262337,40.7471342773485,40.7470390537029,40.7469419392122,40.7468447364522,40.7468117271341,40.7467527474311,40.7466204605364,40.7465352708128,40.7472810572633,40.7478504020762,40.7482056553529,40.7483222864038,40.748473705578,40.7485182124273,40.748566072085,40.7486150514112,40.7493346015193,40.7496277093708,40.7505204292329,40.7513005544233,40.7515416182159,40.7517890264151,40.7519381322374,40.7521036484609,40.752268388305,40.7524321127191,40.7525344018712,40.7526353790247,40.7527347880438,40.752832376769,40.7537696722237,40.7538533612141,40.7539385829134,40.7540248637308,40.7540668261564,40.7541070849377,40.754145058949,40.7541802000438,40.7542120009671,40.7542400026781,40.7542937004537,40.7542985273195,40.7543093679749,40.7543259728658,40.7543479597446,40.7543748224688,40.754405942652,40.754604565796,40.7546569872434,40.7547109860182,40.7547663301672,40.7548227824764,40.755306291324,40.75553507451,40.7562390969562,40.7565418668171,40.7569311081173,40.7572823057171,40.7573655635305,40.7574489665315,40.7575323778181,40.7576156605612,40.7576986779708,40.7577812937762,40.7579152845691,40.7580482491626,40.7581799040557,40.758309968538,40.7584381652174,40.7585642208499,40.7586878666643,40.7588088390255,40.7593280164121,40.759921017874,40.7605144868544,40.7610203491476,40.7610445056276,40.7617467386605,40.7619022822687,40.7619711397983,40.7622753976174,40.7627422587513,40.7631500832703,40.7633327472138,40.763473754705,40.7635431100379,40.7636284736151,40.7638279680662,40.763947245818,40.7640855986402,40.7641123010953,40.764197362231,40.7643313277878,40.7643465381524,40.764453154023,40.7646658020983,40.7646683206375,40.7651348860289,40.7656009250014,40.7657093546072,40.7658150860978,40.7659197148497,40.7660112428674,40.7661464712329,40.7659509300008,40.7659734302094,40.7659896840764,40.7660039817046,40.7660219066069,40.7660441321068,40.7660506352475,40.7660746541344,40.7661565361589,40.7662270800494,40.7662753380706,40.7663252110565,40.7663451977956,40.7665207283635,40.7665953489592,40.7666977132982,40.7668232966881,40.7668385980515,40.7668652001879,40.7669829655748,40.767091312866,40.7671032588102,40.7672829582026,40.7674076907791,40.7675989425895,40.7678421703694,40.7678947650038,40.768073553299,40.7682588313479,40.7684494093535,40.7686452351354,40.768846255076,40.76905241372,40.7692636550286,40.7694799211617,40.7697011529032,40.7699041895995,40.770232447966,40.7705564217903,40.7707719955659,40.7709275354495,40.7710704563352,40.7712002552823,40.7713165290767,40.7714189462985,40.7715234553687,40.7715369030874,40.7715510435477,40.7716767111264,40.7717199874537,40.7717533869976,40.7717679784562,40.771767401351,40.7717366426898,40.7716956590197,40.7716225853142,40.7715764672214,40.7714456069189,40.7713906900369,40.7712089858792,40.7710063659756,40.7709244820301,40.7706490218974,40.7701720086523,40.7696500032915,40.7687961821552,40.7683457683383,40.7680153147373,40.7677920552136,40.7677026492889,40.7675666903798,40.7670639471112,40.7665762242062,40.7664555117611,40.7665040708482,40.7667645254284]}]],[[{"lng":[-73.928722045946,-73.9290523546547,-73.9291675220372,-73.9294035290939,-73.9298736482734,-73.9306846549314,-73.9316021867279,-73.9315563885424,-73.9314799142061,-73.9314067937854,-73.9313256978005,-73.9310832309891,-73.9309035493227,-73.9319074382884,-73.9328465735883,-73.9338101207478,-73.9347843737798,-73.9357181332727,-73.9361792781603,-73.9366846950613,-73.9371206387431,-73.9376358398768,-73.9382040380815,-73.9385934899821,-73.9395592537714,-73.9405321468608,-73.9414626098894,-73.9424014792862,-73.9433548889922,-73.9436519320497,-73.9442878880342,-73.9448728440442,-73.9450790938835,-73.9471589632305,-73.9500666492729,-73.9529591999551,-73.9563003512271,-73.9596966586303,-73.959861031131,-73.9606980937955,-73.9615646142233,-73.961880864398,-73.9624553663317,-73.9628129850858,-73.9630772417813,-73.9630696448626,-73.9630542903218,-73.9630312649951,-73.9630006991152,-73.962962766,-73.9629176798521,-73.9628656957107,-73.9628071076408,-73.9623882227418,-73.9622497383514,-73.962131463956,-73.9609559545363,-73.9611088685433,-73.9612579166136,-73.9616162763689,-73.9618065873623,-73.9619965757854,-73.9621102108679,-73.9621944718203,-73.962523265969,-73.9625410816496,-73.9625712308473,-73.9613369555931,-73.9590472528542,-73.957973172018,-73.9552696365476,-73.9532701974491,-73.9516049595336,-73.951604648875,-73.950874696308,-73.9505022756118,-73.9477299632891,-73.9463846338309,-73.945226455804,-73.9449646848674,-73.9421962844687,-73.939426956198,-73.9366570204557,-73.9338877367781,-73.9311193782087,-73.928349671659,-73.9283599500501,-73.9283698750737,-73.92844239741,-73.9285246975042,-73.9285985544817,-73.9286840449078,-73.9286920062813,-73.928722045946],"lat":[40.6644955696853,40.6643510070426,40.664299532152,40.6641998457684,40.6639907725283,40.6636204762702,40.6632304444006,40.6627554039298,40.6620511099541,40.6613305083395,40.6605933070246,40.6582959160363,40.6566103559842,40.6565376525426,40.6564784820519,40.656422992675,40.6563603950873,40.6563032967297,40.6562739725723,40.6562418233009,40.6562159030899,40.6561675762891,40.6561480151249,40.6561223787949,40.6560627532482,40.6560015389652,40.6559442485324,40.6558848110926,40.6558283358869,40.6558097809555,40.6557700543637,40.6557347616017,40.655722046541,40.6555937877736,40.6554229972006,40.6552493004003,40.6550482818312,40.6548392152288,40.6556347894394,40.6553409246806,40.6550041171529,40.6548811920523,40.6582869780274,40.6605093928109,40.6621301945495,40.6622090098859,40.6622871674729,40.6623642251591,40.6624397470141,40.6625133055532,40.6625844849145,40.6626528824221,40.6627181111361,40.6630896130645,40.663198678195,40.6632081631204,40.6632850548343,40.6640623236647,40.6648018234093,40.6666952157605,40.667681226904,40.668662869889,40.6691956971909,40.6696410297926,40.6713797387427,40.6714601187114,40.6716222448873,40.6713567714725,40.6708822675465,40.6706572740763,40.6701249048541,40.670007205105,40.669923718844,40.6699237033007,40.6698870998396,40.6698653518951,40.66971344241,40.6696366798575,40.6695705836165,40.6695558745457,40.6694033043445,40.669248684167,40.669100570778,40.66895044556,40.6687985425918,40.6686471946908,40.6685152024712,40.6684348201971,40.6676722095451,40.666866560048,40.6659705388988,40.6650860232743,40.6649622973766,40.6644955696853]}]],[[{"lng":[-73.8627549019687,-73.8633222212668,-73.8634021493181,-73.8635306344501,-73.8640497569827,-73.8645848696249,-73.8647388428492,-73.864840095843,-73.8650929408295,-73.8655058871897,-73.8660687595498,-73.8672819381513,-73.8680987350337,-73.8688938272456,-73.8694371976398,-73.8696297045435,-73.8701612831228,-73.8707144749259,-73.8709270425468,-73.8714335734198,-73.8717353399993,-73.8722357769659,-73.8727256165466,-73.873279414553,-73.8738052462418,-73.874263304901,-73.8747594335689,-73.8751757334757,-73.8760165651881,-73.8760894970796,-73.8761531411472,-73.8766513529738,-73.877045371829,-73.8774333983731,-73.8778141632006,-73.8781864701792,-73.8785491567378,-73.8789736513566,-73.879611587844,-73.8802016158719,-73.8805634150474,-73.8809556782726,-73.8813527020736,-73.8817543776953,-73.882160595112,-73.882571243287,-73.8829862095266,-73.8834053801751,-73.8838286404287,-73.8842680418433,-73.8843972942821,-73.8850626608287,-73.885648234261,-73.886025541989,-73.8866762035627,-73.886719460335,-73.8871342937633,-73.887624529175,-73.8877066182002,-73.8877298822495,-73.887818145648,-73.8881306268389,-73.8881775922634,-73.8881854192606,-73.8881900815474,-73.8882210938927,-73.8882713106103,-73.8883397556247,-73.888423757307,-73.8885192580243,-73.8886214500178,-73.8886549578871,-73.888744440491,-73.8886884136908,-73.8887089321046,-73.8890400025454,-73.8894022625029,-73.8894128079,-73.889430390386,-73.8894508583694,-73.8894739131481,-73.8894992181914,-73.8895264042493,-73.8895550745804,-73.8903419603084,-73.890708706911,-73.8913588065009,-73.8928899263955,-73.8930694376266,-73.8932423675107,-73.8934067519724,-73.8935608381838,-73.8937030536638,-73.8944227655844,-73.895130599123,-73.8958407490838,-73.8965647755194,-73.8942324749778,-73.8928604007566,-73.8922536570346,-73.8921322903704,-73.8920407755233,-73.8918446928234,-73.8917722965256,-73.8916521596491,-73.8915305842385,-73.8914341510822,-73.891416059024,-73.891401281124,-73.891480166469,-73.8915298715755,-73.891667856477,-73.891765777786,-73.8918088345025,-73.8917925102841,-73.891832449045,-73.8917254778065,-73.8917175133582,-73.8916893512109,-73.8915275908334,-73.8914436187526,-73.8913580140461,-73.8913676627334,-73.8914518571249,-73.8912641458479,-73.8911042266552,-73.8911204433948,-73.8910668141605,-73.8909486063571,-73.8907313211423,-73.8905625059535,-73.8904983464221,-73.8904591577671,-73.8904653739512,-73.8903519308252,-73.8901736950858,-73.8900872941688,-73.8900236909521,-73.88951644381,-73.889471511432,-73.8894710539967,-73.8895551248035,-73.889561496857,-73.8895818466568,-73.8895893573396,-73.8896144877394,-73.8897890075605,-73.8898424655832,-73.8898867162958,-73.8900676015265,-73.8901917152066,-73.8900892166737,-73.889976727388,-73.8898516995968,-73.8897503517801,-73.8896071959493,-73.8895235330305,-73.8894548690374,-73.8877984380514,-73.8876794015554,-73.8858076228665,-73.8858101243798,-73.8858179236733,-73.8858279373366,-73.8858336156138,-73.8857915186703,-73.885790343976,-73.8856818235151,-73.8856829263689,-73.8856694765792,-73.885694980851,-73.8857020708613,-73.8857122164284,-73.8856739890097,-73.8856734925826,-73.8856505496484,-73.8856700766504,-73.8856265073983,-73.8856023610358,-73.8856462738149,-73.8856476757293,-73.8856677313391,-73.8856613097997,-73.885667913156,-73.8856427658466,-73.8856385336236,-73.8856323103537,-73.8856758683631,-73.885677083643,-73.8857880410921,-73.8857868343147,-73.8857947772726,-73.8857871897487,-73.8857847369767,-73.8843155668891,-73.8840826246302,-73.883916279638,-73.8839316828429,-73.8841083630135,-73.8845515053224,-73.8846598266042,-73.8847922251718,-73.8848374239114,-73.8848553608045,-73.8848351959594,-73.8847736190733,-73.8846752373353,-73.8846017535515,-73.8845488263739,-73.884455194209,-73.8844198851325,-73.8842873771221,-73.8842883055274,-73.8843321701883,-73.8843625715656,-73.8844095718806,-73.8847574440451,-73.8848232207529,-73.8849319789734,-73.8849907041199,-73.8850324865644,-73.8850552265844,-73.8851139922264,-73.8852000839678,-73.8852391439166,-73.8852502698659,-73.8852187594233,-73.8850834587663,-73.8850529174103,-73.8851241643548,-73.8850841071635,-73.8851615248084,-73.8851196888178,-73.8851696401095,-73.8851717199686,-73.885425969449,-73.8854128725115,-73.885156229515,-73.885161192192,-73.8851088700627,-73.8850249728927,-73.8851005722684,-73.8850493034367,-73.8851313884868,-73.8851497369199,-73.8851933627272,-73.8851585497607,-73.8850215825569,-73.8850578093422,-73.885008975101,-73.8849784247546,-73.8849346638127,-73.8848811373114,-73.8847822502118,-73.8844503260945,-73.8838520321947,-73.8832527144128,-73.8832403825482,-73.8829049118665,-73.8828785175137,-73.8828111603005,-73.8827444971721,-73.882640305109,-73.8823177709145,-73.8821589972443,-73.8821186300027,-73.8820829336479,-73.8820262945351,-73.8818720051719,-73.8816840768379,-73.8815587218173,-73.8813907598555,-73.8812191473708,-73.8809608791239,-73.8808700388393,-73.8807502584827,-73.8803881741067,-73.8801892943918,-73.8800224049746,-73.8799058778248,-73.8797346684311,-73.8796134393725,-73.8795864683471,-73.8795907103767,-73.8796040812677,-73.8796069243285,-73.8794746864391,-73.8794734130345,-73.8794480502349,-73.8793580603612,-73.8793040917444,-73.8792048385162,-73.8791337082858,-73.8789248868435,-73.8787056251887,-73.8790511569308,-73.8793086829525,-73.8788583748558,-73.8788883123546,-73.8788838475791,-73.8791451042141,-73.8791644572964,-73.8791807880226,-73.8791644060602,-73.8797477785358,-73.8797016367226,-73.8796778842571,-73.8797046907907,-73.8794567955536,-73.8794210653306,-73.8794062256746,-73.8794300686937,-73.8791465474987,-73.8790825117745,-73.8790602451591,-73.8791242759201,-73.8788674717129,-73.8788570569997,-73.8788314678173,-73.8783392329805,-73.8751575489346,-73.8748452733139,-73.8712485624261,-73.8708990768917,-73.8697808119264,-73.8692349176576,-73.8681712705895,-73.8682378476837,-73.8680991232402,-73.8678840753688,-73.8680330493958,-73.8681303200002,-73.8691811350391,-73.8696932571398,-73.8698700743444,-73.8694375165719,-73.8687265728841,-73.868723354284,-73.8687175011424,-73.8687173779744,-73.8687172554684,-73.8687166505421,-73.8687159795051,-73.8687154573373,-73.8687153233773,-73.8687151900795,-73.8687150545767,-73.8687149197376,-73.8687147835746,-73.8687146474128,-73.8687145099297,-73.8687143728861,-73.8687129548725,-73.8687123772111,-73.8687109523075,-73.8687093057912,-73.8687091496026,-73.8687089931934,-73.8687086711011,-73.8687085080725,-73.8687083459287,-73.868707022777,-73.8687068542448,-73.868706686375,-73.8687065163013,-73.8687063468899,-73.8687061759369,-73.8687060045427,-73.8687058329272,-73.8687056615354,-73.8687054886007,-73.8687053154458,-73.8687051403072,-73.8687049660534,-73.8687047909172,-73.8687046157806,-73.8687042626459,-73.8687039073105,-73.8687031887128,-73.8687030069699,-73.8687028211421,-73.8687026386299,-73.8687024615284,-73.8687020894458,-73.8687013536919,-73.8687009694855,-73.8687002198631,-73.8686994623186,-73.8686992691291,-73.868699076821,-73.8686983005499,-73.868697897631,-73.8686977066618,-73.8686975154733,-73.8686973174423,-73.8686971191924,-73.8686967220326,-73.8686963089864,-73.8686946994708,-73.868693869475,-73.8686930445821,-73.868690069023,-73.8686892003157,-73.8686861002091,-73.86868584201,-73.8686815013089,-73.8686796243256,-73.8686786526011,-73.8686777014221,-73.8686767432034,-73.8686764901373,-73.8686762383956,-73.8686757547786,-73.868675463549,-73.8686742865204,-73.8686717989719,-73.8686672240654,-73.8686667584026,-73.8686473214421,-73.8686266134221,-73.8686052618471,-73.8685839156568,-73.8685632236151,-73.8685438138254,-73.8685262778621,-73.8685111467641,-73.8685039837118,-73.8685019272139,-73.8684949974614,-73.8684932306935,-73.8684927492194,-73.8684902914277,-73.8684902617922,-73.8684892543769,-73.8684890601713,-73.8684883247524,-73.868488147071,-73.8684871383182,-73.8684871153036,-73.8684862169534,-73.8684862046835,-73.8684860618424,-73.868485393059,-73.8684851441984,-73.8684850043686,-73.8684847884612,-73.8684847714004,-73.8684846675253,-73.8684845656321,-73.8684844425616,-73.8684843387523,-73.8684840438641,-73.8684838742499,-73.8684836905795,-73.8684836155808,-73.8684835427878,-73.8684834556516,-73.8684833885879,-73.8684833243928,-73.8684832702145,-73.8684832189012,-73.8684831689116,-73.8684831306854,-73.8684831213461,-73.8684829634311,-73.8684828593414,-73.8684828154924,-73.868482668091,-73.8684826392309,-73.8684825890053,-73.8684825676395,-73.8684825497993,-73.8684825367373,-73.8684825254407,-73.8684825044767,-73.8684825444309,-73.8684825771528,-73.868482598984,-73.8684826475539,-73.8684830980082,-73.8684832210058,-73.86848335436,-73.8684838269195,-73.8684839925301,-73.8684845061876,-73.8684846139582,-73.8684849575446,-73.868485076775,-73.8684853247074,-73.8684855647954,-73.868485717428,-73.8684859738202,-73.8684875434332,-73.8684878612931,-73.8684880615076,-73.8684886051395,-73.8684891455523,-73.8684897664174,-73.8684903537534,-73.8684919167947,-73.8684923478841,-73.8684926154976,-73.8684930936349,-73.868493582123,-73.8684938306621,-73.8684945572059,-73.8684945912555,-73.8684950767482,-73.8684956417922,-73.8684964211953,-73.8684964572252,-73.8684978290658,-73.8684978672973,-73.8684984489427,-73.8684990404983,-73.8684996421812,-73.8685002140054,-73.8685002539972,-73.8685008346274,-73.8685008743965,-73.8685011901034,-73.8685018256992,-73.8685021477911,-73.8685027572696,-73.8685027985782,-73.8685034579517,-73.8685041287764,-73.8685051516353,-73.8685054968437,-73.8685057861672,-73.8685058449142,-73.868506106847,-73.8685063703221,-73.8685069027795,-73.8685075752296,-73.8685083456992,-73.868509035983,-73.8685090810295,-73.8685094369788,-73.8685101546069,-73.8685105778835,-73.8685124532695,-73.8685128431666,-73.8685132836112,-73.8685140289268,-73.8685140578465,-73.8685144477155,-73.8685152340572,-73.8685156861614,-73.8685176997762,-73.8685177483384,-73.8685189605854,-73.8685202891007,-73.8685219821599,-73.8685228521615,-73.8685232948789,-73.8685235160119,-73.868523738913,-73.8685239860866,-73.8685242350235,-73.8685250824587,-73.868525533753,-73.868525583629,-73.8685259876889,-73.8685264433869,-73.8685266717834,-73.8685269004005,-73.8685274101508,-73.868528284431,-73.8685283343025,-73.8685285410622,-73.8685287493672,-73.86852921496,-73.8685292663744,-73.8685294737931,-73.8685296840784,-73.8685301540726,-73.8685302048245,-73.8685310984617,-73.8685311498726,-73.8685320514311,-73.8685321026194,-73.8685323153202,-73.8685325306658,-73.8685327700594,-73.8685330101165,-73.8685332508315,-73.8685334930916,-73.8685337338043,-73.8685339767234,-73.868534462556,-73.8685349497064,-73.868535438618,-73.8685356835119,-73.8685359292885,-73.8685364210576,-73.868536914806,-73.8685374098735,-73.868537907362,-73.8685384061686,-73.8685389570354,-73.8685399105022,-73.8685401626539,-73.8685404156873,-73.868540922411,-73.8685414300116,-73.8685416836986,-73.8685419389316,-73.8685424491697,-73.8685429622683,-73.8685432190375,-73.8685434762465,-73.8685437330138,-73.8685439908827,-73.8685445077174,-73.8685447664648,-73.8685450260926,-73.8685452848368,-73.8685455457848,-73.8685458058505,-73.8685460667963,-73.8685463264187,-73.8685465880246,-73.8685468502908,-73.8685471127764,-73.8685473997444,-73.8685476895773,-73.8685479258107,-73.8685481635879,-73.8685486898694,-73.868549220997,-73.8685494856767,-73.8685497514583,-73.8685502827992,-73.8685508147956,-73.8685513503152,-73.8685518858294,-73.8685524228854,-73.868552961258,-73.8685532301123,-73.8685534996265,-73.8685540922461,-73.8685543363932,-73.8685545823033,-73.8685556691513,-73.8685559415233,-73.8685562147755,-73.8685564864817,-73.8685567603932,-73.8685573082115,-73.8685578566868,-73.8685584073629,-73.8685586819267,-73.8685589586956,-73.8685595106855,-73.868560062891,-73.8685603396534,-73.8685606177383,-73.8685608944974,-73.8685611721404,-73.8685617285218,-73.8685622864425,-73.8685628450204,-73.8685631237543,-73.8685634042549,-73.8685639641464,-73.8685645255772,-73.8685648060703,-73.8685650878844,-73.8685655474314,-73.8685656493075,-73.8685659311187,-73.8685662135908,-73.8685667794134,-73.8685673450101,-73.868567912367,-73.86856848016,-73.8685687635029,-73.8685690494929,-73.8685696174976,-73.8685701890244,-73.8685704730242,-73.8685707598881,-73.8685719049059,-73.8685724779592,-73.8685730516697,-73.868573626699,-73.8685742032667,-73.8685747798303,-73.8685753570507,-73.8685759349278,-73.8685765130212,-73.8685770924324,-73.8685773821352,-73.868577673163,-73.8685779628649,-73.8685782534471,-73.8685788335065,-73.8685791254092,-73.868579415768,-73.8685799995666,-73.8685802899198,-73.8685805818181,-73.8685808743743,-73.8685811662694,-73.8685817498347,-73.8685823336146,-73.8685829202578,-73.8685835066765,-73.8685840926486,-73.8685846806012,-73.8685852678871,-73.8685858551687,-73.8685864433301,-73.868587032808,-73.8685875369685,-73.8685877898187,-73.86858804333,-73.8685890545026,-73.8685895608552,-73.8685905744324,-73.8685911645416,-73.8685917568499,-73.8685923491541,-73.8685929414538,-73.8685941282445,-73.8685947211935,-73.8685953147986,-73.8685959086194,-73.8685965022157,-73.8685967984611,-73.8685970960278,-73.8685976904969,-73.868599475203,-73.8686000703158,-73.8686012605297,-73.8686018562911,-73.8686024513867,-73.8686030473607,-73.8686036424477,-73.8686042388527,-73.8686045363923,-73.8686048348136,-73.8686054298876,-73.8686060249561,-73.8686063231516,-73.8686066215652,-73.8686072166273,-73.8686078130053,-73.8686084089413,-73.8686090039892,-73.8686095990329,-73.8686098965519,-73.8686101940722,-73.8686107897693,-73.8686110872843,-73.8686113848,-73.8686116823127,-73.8686119798275,-73.8686122773391,-73.8686125750711,-73.868613169207,-73.8686135643389,-73.8686137628981,-73.8686139607947,-73.8686143572468,-73.8686149522514,-73.8686155457089,-73.8686161393826,-73.8686167328324,-73.8686173258374,-73.8686185107299,-73.8686188075574,-73.8686191028412,-73.868619694945,-73.8686199908867,-73.8686202870476,-73.8686205816637,-73.8686208769408,-73.8686211737566,-73.8686214690327,-73.8686218625831,-73.8686222561322,-73.8686226494588,-73.8686232386737,-73.8686244164278,-73.8686247110276,-73.8686250056297,-73.8686252993457,-73.868625592623,-73.8686258872209,-73.8686261796135,-73.8686267665982,-73.8686270611904,-73.8686273535787,-73.8686276472872,-73.8686279398927,-73.8686285246614,-73.8686288170444,-73.8686291100863,-73.8686295000744,-73.8686296948465,-73.8686298885166,-73.868630277619,-73.8686308617096,-73.8686314435904,-73.8686317344187,-73.8686320248072,-73.8686323165147,-73.8686326066804,-73.8686328975046,-73.8686331878874,-73.8686334780478,-73.8686337675494,-73.8686343465447,-73.8686349255366,-73.8686352150284,-73.8686355038621,-73.8686357924723,-73.8686360961736,-73.8686372335254,-73.8686383826459,-73.8686386692628,-73.8686389715203,-73.8686392570318,-73.8686395284434,-73.8686401007868,-73.8686406724622,-73.8686409720675,-73.8686412421515,-73.8686418272576,-73.8686421105538,-73.8686423804141,-73.8686426648118,-73.8686429478859,-73.8686435153559,-73.868643797545,-73.8686440812773,-73.868644646313,-73.8686449271747,-73.868645210022,-73.8686454924253,-73.868645773948,-73.8686463361067,-73.8686466163016,-73.8686468978179,-73.8686471771313,-73.8686474712021,-73.8686480166057,-73.8686485752207,-73.8686488538654,-73.8686491325111,-73.8686494096107,-73.8686496882521,-73.8686499660119,-73.8686502439911,-73.8686507981832,-73.8686513519297,-73.868651903909,-73.868652178353,-73.8686524547829,-73.8686535785413,-73.8686541003251,-73.8686546474373,-73.8686549317819,-73.8686551930002,-73.8686557372395,-73.8686568219565,-73.8686570910938,-73.8686573617748,-73.8686576309101,-73.8686579015891,-73.8686581700609,-73.8686584391947,-73.8686587076655,-73.8686589761351,-73.8686592446035,-73.8686595130734,-73.8686600471408,-73.8686605796636,-73.8686670756782,-73.8686846116212,-73.8686997420582,-73.8687120074901,-73.868721036027,-73.8687215401526,-73.8694234479541,-73.8704802989896,-73.8709061406768,-73.8714629235818,-73.8723228691895,-73.8720174180928,-73.8709082331228,-73.8702283750835,-73.8702191075742,-73.8709082742764,-73.8720283196516,-73.8723360399841,-73.8725573267373,-73.8723863703688,-73.8721801432673,-73.871185887052,-73.8709107023297,-73.8701948508614,-73.870157511781,-73.8682552027083,-73.86792643466,-73.8663290285311,-73.8661519869218,-73.8657606501558,-73.8651322118665,-73.8647106649719,-73.8610455233363,-73.8591787193464,-73.8590870381648,-73.858925570176,-73.8589640555545,-73.8588418254722,-73.8586335607119,-73.85840105715,-73.8579615794531,-73.8577356389315,-73.8572338759026,-73.8569004401461,-73.8567439825915,-73.8565638462565,-73.8559380688681,-73.8555107354459,-73.8550510627182,-73.8550482539028,-73.8550480307379,-73.8550545177469,-73.8550679859515,-73.8550863591034,-73.855115490055,-73.855180653368,-73.8556587255473,-73.8564239066145,-73.8564422971782,-73.856462729893,-73.8565081867766,-73.8565324020903,-73.8565570587974,-73.8565817666686,-73.8566323197187,-73.8566850341593,-73.8567115074387,-73.8567375829373,-73.8567629111172,-73.8567871552647,-73.8572894270728,-73.8573399931132,-73.857361583989,-73.8573823514903,-73.857402692164,-73.8574227925689,-73.8574377954303,-73.8574460450817,-73.8574632233434,-73.8574769159832,-73.8574889469212,-73.8574949999356,-73.8575012031003,-73.8575121437347,-73.8575367872447,-73.8575494775766,-73.8575560500044,-73.8575625281011,-73.8575690229945,-73.8575723000289,-73.8576325726631,-73.8576759217205,-73.8577161132389,-73.8577536322602,-73.8577763148345,-73.8578006583742,-73.8578834087799,-73.8578306228225,-73.8578246323172,-73.8580085824606,-73.8580129688646,-73.8580189763297,-73.8580223205577,-73.8580251112795,-73.8580280304657,-73.8580309017921,-73.8580335687389,-73.8580358692308,-73.8580385498612,-73.8580427698619,-73.8580426357556,-73.8580388407044,-73.8579870964793,-73.8577199954691,-73.857347309504,-73.8568499051845,-73.8565640028131,-73.8562126761018,-73.8561488851627,-73.8561497357846,-73.8562456574617,-73.8563129611473,-73.8564777188217,-73.8566356595733,-73.8568183370388,-73.8570479026211,-73.8571028793471,-73.8571615843033,-73.8572404200866,-73.8573125445042,-73.8576780026624,-73.8579760422921,-73.8580526188042,-73.8581970423605,-73.8583281385249,-73.8584350717563,-73.8585953895134,-73.8587737655306,-73.8589207597772,-73.8593751042978,-73.8596377997352,-73.859830281486,-73.8599865066951,-73.8601677887754,-73.860336459887,-73.8605545661331,-73.8606974309685,-73.8607746894299,-73.8608553594449,-73.8609288429741,-73.8609888367663,-73.8610076210945,-73.8610003822173,-73.8610334567885,-73.8611027721839,-73.8611899849748,-73.8612119439517,-73.8613138616611,-73.861432508727,-73.861691772079,-73.8618154531637,-73.8620214238525,-73.8620527169919,-73.8621297645646,-73.8622253933612,-73.8622005984658,-73.8622656507162,-73.8624348553379,-73.8626022140311,-73.8626886411053,-73.8627549019687],"lat":[40.7667645254284,40.7665040708482,40.7664555117612,40.7665762242062,40.7670639471112,40.7675666903798,40.7677026492889,40.7677920552136,40.7680153147374,40.7683457683384,40.7687961821552,40.7696500032915,40.7701720086523,40.7706490218974,40.7709244820301,40.7710063659756,40.7712089858792,40.7713906900369,40.7714456069189,40.7715764672214,40.7716225853142,40.7716956590197,40.7717366426898,40.771767401351,40.7717679784562,40.7717533869976,40.7717199874538,40.7716767111264,40.7715510435477,40.7715369030874,40.7715234553687,40.7714189462985,40.7713165290767,40.7712002552823,40.7710704563352,40.7709275354495,40.7707719955659,40.7705564217903,40.770232447966,40.7699041895995,40.7697011529032,40.7694799211617,40.7692636550286,40.7690524137201,40.768846255076,40.7686452351354,40.7684494093535,40.7682588313479,40.768073553299,40.7678947650038,40.7678421703694,40.7675989425895,40.7674076907791,40.7672829582026,40.7671032588103,40.767091312866,40.7669829655748,40.7668652001879,40.7668385980516,40.7669144343696,40.7672020782521,40.7682641924714,40.7684282567009,40.7684794043916,40.768509873313,40.7685922895698,40.7686718716451,40.768744806519,40.7688076442263,40.7688578407815,40.76889404946,40.7689011951585,40.7689181792537,40.7689775966221,40.7690915232464,40.7709162384816,40.7729267175712,40.7729852417294,40.7730042423989,40.773021492612,40.773036740624,40.7730497637638,40.7730603721408,40.7730684109404,40.77323760503,40.7733195299268,40.7734651438649,40.7738076612117,40.7738694852488,40.7739430191484,40.774027592863,40.7741222976583,40.7742260143936,40.7747348382503,40.7752334544951,40.7757348317729,40.7762470243256,40.7781536132297,40.777159074851,40.777204523029,40.7770909363801,40.7769628986734,40.7766855099062,40.7765935211534,40.7765623235497,40.7764767692854,40.7763805231435,40.7763389562343,40.7760448648803,40.7758968423889,40.7756056311981,40.7754845620977,40.7753571879053,40.7752196405644,40.7750887280951,40.7748801998888,40.7750520321341,40.775163632893,40.7752547378436,40.7754781353675,40.7756226947097,40.7760494084328,40.7763429985786,40.7765127692709,40.7768558553747,40.7770232069748,40.7771246997361,40.7772129253049,40.7772838451727,40.7773320498678,40.7774039209643,40.777462635852,40.7775504972535,40.7777032192871,40.7778003207775,40.7778508127779,40.7777841931043,40.7772471264064,40.7759367144457,40.7757380565234,40.7755355514699,40.775278709613,40.7750922386026,40.7750350501164,40.7749587101926,40.7748456871422,40.7742368611699,40.7741003785568,40.7740173490743,40.7739624837535,40.7736468762251,40.7736264355249,40.7737236106506,40.773753297364,40.7737173958503,40.7736203381615,40.7735751800064,40.7735329511273,40.7737112974247,40.7738187917233,40.7740222244754,40.7740360176663,40.7740789987405,40.7740779480581,40.7741092404399,40.7741136550724,40.7741071872505,40.7741185680432,40.7741246454603,40.7741260560839,40.7742666104456,40.7742658671313,40.7743217716242,40.7743257799489,40.7743230506312,40.7743254574896,40.7744330712169,40.7744376397921,40.7743045639391,40.7742999595285,40.7743076912231,40.7743055884074,40.7742702056446,40.7742695127773,40.7741309333886,40.7741313776544,40.7740970747886,40.7740925068702,40.7740992025686,40.7740875662063,40.7740809177599,40.7740800846539,40.7740382692639,40.7740247121646,40.7741843644867,40.7741044801434,40.7741326065916,40.7741846448552,40.7741670828963,40.7743606218296,40.7744801012102,40.7748070631201,40.7749529802431,40.7751022115724,40.775220842116,40.7753322805866,40.7753967659726,40.7754205106945,40.7754280491009,40.7754648038506,40.775456465702,40.7754720556635,40.7754830970367,40.7754829703682,40.7754933737328,40.7755493603748,40.7772541381827,40.777512397707,40.7779050221045,40.7781452173882,40.7782998317229,40.7784053127442,40.7784755290346,40.7785135712636,40.7785592206734,40.7786129017425,40.7786613623025,40.7786713131621,40.7787754351695,40.7790612087805,40.7793525711136,40.7794132647191,40.7795113753826,40.7795335691941,40.7795272490212,40.7796398721741,40.7796599600353,40.7795504594895,40.7795441510686,40.7795223100439,40.7795573184395,40.7796124313351,40.779625245829,40.7797361179981,40.7797286309762,40.7797862140992,40.7797983303711,40.7796148540401,40.7796002377286,40.7795648071174,40.7797443824052,40.7799369123045,40.7799871962388,40.7800384799953,40.7801546008236,40.7802643202571,40.7802654229022,40.7803257232738,40.7803486967373,40.7802363201094,40.7802189366977,40.7802234235696,40.7802858574564,40.7803605487958,40.7803678670606,40.7803958631772,40.7804508361673,40.7804850430253,40.7804984548699,40.7805000621364,40.7805466257367,40.7806016084081,40.7806106167351,40.7805855772364,40.7805730596728,40.7805743262462,40.7806194164029,40.7806349674191,40.7806447198398,40.7806391446684,40.7806548175474,40.7806943189554,40.7806981103576,40.7807791487166,40.7807791626867,40.7808503130653,40.7808569510752,40.7807026889142,40.7807004765119,40.78065668063,40.7807594073783,40.7807673893349,40.7806782288797,40.780673551649,40.7805859099502,40.7817305328608,40.7818536578298,40.7823981786812,40.782414426612,40.7824189392437,40.7825445677957,40.7825231314298,40.7825299236165,40.7825513642733,40.7828365642071,40.7828828180723,40.7828726295066,40.7828376483594,40.7827154225929,40.7827560407917,40.7827458614949,40.7827063594834,40.7825682855527,40.7826506586608,40.7826404710236,40.7825603561656,40.7824369911601,40.7824448855713,40.7824307144944,40.7830259207495,40.7815094491507,40.7816849245779,40.7860381507525,40.7858714255035,40.7853379333259,40.785969915419,40.7872561961563,40.7872796430849,40.7874586618192,40.7873610366954,40.7871820299535,40.7872327778442,40.7859434895708,40.7852961632549,40.7850859065657,40.7836383993112,40.783731698254,40.7837421635882,40.7837541475548,40.7837543538059,40.7837545595551,40.7837555326914,40.7837566133037,40.7837574191765,40.7837576215621,40.7837578234459,40.7837580258299,40.7837582270419,40.7837584289224,40.7837586303004,40.7837588310068,40.7837590323838,40.783761032195,40.7837618143833,40.7837636198571,40.783765706186,40.7837658926314,40.7837660790766,40.7837664608352,40.7837666511259,40.7837668397424,40.7837683461315,40.783768533233,40.7837687196651,40.7837689060947,40.7837690920225,40.7837692772784,40.7837694627013,40.7837696486266,40.7837698328768,40.7837700171253,40.7837702013736,40.7837703856196,40.7837705681913,40.7837707512646,40.7837709345055,40.7837712991411,40.783771662099,40.7837723843201,40.7837725647055,40.7837727488555,40.7837729281511,40.7837731020083,40.7837734633556,40.7837741678832,40.7837745303057,40.7837752263575,40.7837759163693,40.783776089538,40.7837762628753,40.7837769491803,40.7837773006922,40.7837774656547,40.7837776301144,40.783777799592,40.7837779683993,40.7837783055106,40.7837786514827,40.7837799682416,40.7837806279325,40.7837812705417,40.7837834910517,40.7837841109112,40.7837862312665,40.783786400508,40.7837891232951,40.7837902240601,40.7837907784672,40.7837913081878,40.7837918313667,40.7837919682816,40.783792104193,40.7837923604584,40.78379251492,40.783793127057,40.7837943717005,40.7837964961543,40.7837967006747,40.7838035628133,40.7838077551542,40.7838091509255,40.7838077064724,40.7838034669292,40.7837965604996,40.7837871974333,40.7837756621254,40.7837684748167,40.7837661152196,40.7837567483353,40.7837538781159,40.7837530491532,40.7837484330325,40.7837483731922,40.7837462421239,40.7837458137073,40.7837441160028,40.7837436904529,40.7837411208015,40.7837410564454,40.7837384951287,40.7837384584267,40.7837380240377,40.783735841758,40.783734965316,40.7837344568841,40.7837336342553,40.7837335683984,40.7837331565023,40.7837327452785,40.7837322323427,40.7837317871091,40.7837304462339,40.7837296187996,40.7837286546486,40.7837282406076,40.7837278255639,40.7837273078109,40.7837268932764,40.7837264770699,40.7837261223567,40.7837257676467,40.7837254124357,40.7837251269287,40.7837250572274,40.7837237741373,40.7837228013658,40.7837223500022,40.7837205422343,40.7837200898827,40.7837191845178,40.7837187316721,40.783718279333,40.7837178626823,40.7837174448609,40.7837155613483,40.7837132981251,40.7837124648908,40.783712012597,40.7837111897674,40.7837065225198,40.7837056218758,40.7837047222487,40.7837020303189,40.7837012025971,40.7836989042315,40.783698459742,40.7836971273016,40.7836966833277,40.7836957980711,40.7836949788106,40.7836944728903,40.7836936563288,40.7836892215435,40.7836884166113,40.7836879228072,40.7836866284559,40.7836854016136,40.7836840596055,40.7836828437059,40.7836798389103,40.7836790615815,40.7836785892976,40.7836777597546,40.783676934244,40.78367652275,40.7836753488906,40.7836752939811,40.7836745343046,40.7836736691778,40.7836725134715,40.7836724602395,40.7836705185096,40.7836704664528,40.783669676564,40.7836688907069,40.7836681102223,40.7836673829767,40.7836673324297,40.7836666102198,40.7836665608452,40.7836661763995,40.7836654101932,40.7836650291053,40.7836643188227,40.7836642711251,40.7836635176779,40.7836627691019,40.7836616553871,40.78366128689,40.7836609814861,40.7836609200713,40.783660645796,40.7836603716899,40.7836598249918,40.7836591461083,40.783658384579,40.7836577150973,40.7836576717596,40.7836573329267,40.78365665577,40.7836562632382,40.7836545757162,40.7836542335715,40.7836538526186,40.7836532172073,40.7836531931167,40.7836528652115,40.7836522134296,40.783651843379,40.7836502471485,40.7836502093432,40.7836492846456,40.7836482997714,40.7836470879811,40.783646482364,40.7836461781402,40.7836460286247,40.7836458767659,40.7836457101926,40.7836455436212,40.7836449813674,40.7836446865349,40.7836446530867,40.7836443933807,40.783644100731,40.7836439560821,40.7836438114334,40.7836434908686,40.7836429505913,40.7836429193208,40.7836427939126,40.7836426673335,40.7836423862544,40.7836423549858,40.7836422305835,40.7836421056818,40.7836418279583,40.7836417971915,40.7836412762016,40.7836412466082,40.7836407321609,40.78364070374,40.7836405831967,40.7836404626565,40.7836403295794,40.7836401953303,40.7836400627573,40.7836399290133,40.7836397976128,40.7836396650423,40.7836394025815,40.7836391424676,40.7836388833609,40.7836387551482,40.783638626434,40.7836383711837,40.7836381181134,40.7836378667198,40.7836376170043,40.7836373694681,40.7836370983702,40.7836366372551,40.7836365167569,40.7836363962597,40.7836361574439,40.7836359209743,40.7836358043309,40.7836356860141,40.7836354532331,40.7836352228008,40.7836351078362,40.7836349933747,40.7836348794152,40.7836347656245,40.7836345405573,40.7836344282753,40.7836343166644,40.7836342060578,40.7836340954536,40.7836339853509,40.7836338759194,40.783633766989,40.7836336580608,40.7836335496359,40.7836334417138,40.7836333246058,40.7836332075011,40.783633112281,40.7836330163927,40.7836328067485,40.7836325982826,40.7836324953888,40.7836323924963,40.7836321877162,40.7836319857847,40.7836317855325,40.7836315879607,40.7836313908932,40.7836311966752,40.7836311003196,40.783631004635,40.783630795569,40.7836307107446,40.7836306259222,40.7836302555903,40.7836301635944,40.7836300722697,40.7836299826185,40.7836298922995,40.7836297140072,40.7836295378935,40.7836293632899,40.7836292774949,40.7836291910324,40.7836290209536,40.7836288530528,40.7836287699408,40.7836286868303,40.7836286053935,40.7836285227851,40.7836283609199,40.7836282007318,40.7836280427223,40.7836279656434,40.7836278868914,40.7836277332389,40.7836275812636,40.7836275063646,40.7836274321372,40.7836273107027,40.7836272840148,40.7836272112951,40.7836271385762,40.7836269948146,40.7836268539006,40.7836267144964,40.783626577438,40.7836265102484,40.7836264418892,40.7836263091867,40.7836261786661,40.783626113655,40.7836260491498,40.7836257979948,40.7836256756846,40.783625555553,40.7836254370982,40.783625320823,40.7836252067256,40.7836250948067,40.783624985234,40.7836248776718,40.7836247724565,40.783624721189,40.7836246687504,40.7836246179855,40.7836245678917,40.7836244692106,40.7836244201235,40.7836243715372,40.7836242767135,40.7836242309751,40.7836241840658,40.7836241388325,40.7836240935984,40.7836240053078,40.7836239198655,40.7836238354315,40.7836237531751,40.7836236737662,40.7836235958672,40.7836235208154,40.7836234479414,40.7836233760736,40.7836233070552,40.7836232500013,40.7836232223129,40.7836231946252,40.7836230875568,40.7836230365363,40.7836229395222,40.7836228857493,40.7836228343243,40.7836227850771,40.7836227380077,40.783622650405,40.7836226093672,40.7836225710106,40.7836225349996,40.7836225009987,40.783622484919,40.7836224693434,40.7836224398666,40.7836223633322,40.7836223425674,40.7836223072364,40.7836222930059,40.78362228112,40.7836222707429,40.7836222632126,40.7836222578617,40.7836222560231,40.7836222541856,40.7836222531888,40.7836222550399,40.7836222558825,40.7836222578979,40.7836222629321,40.7836222713182,40.7836222802064,40.7836222924441,40.7836223068595,40.7836223154075,40.7836223234529,40.7836223417223,40.783622352448,40.7836223626712,40.7836223745696,40.7836223852954,40.7836223976964,40.7836224100977,40.7836224377467,40.7836224579652,40.7836224674054,40.7836224775151,40.7836224989077,40.7836225330912,40.7836225694507,40.7836226079883,40.7836226482009,40.7836226905908,40.7836227830754,40.7836228070349,40.7836228314952,40.7836228837681,40.7836229099043,40.7836229365435,40.7836229643535,40.7836229921643,40.7836230221547,40.783623050468,40.7836230904527,40.7836231309399,40.7836231725996,40.783623236931,40.7836233727966,40.7836234088153,40.7836234436614,40.7836234808518,40.783623516869,40.783623553893,40.7836235915845,40.7836236691478,40.7836237090196,40.7836237488889,40.7836237897649,40.7836238313097,40.7836239149015,40.7836239574512,40.7836240011743,40.7836240592476,40.7836240891217,40.7836241189945,40.7836241792446,40.7836242715468,40.7836243666945,40.7836244152734,40.7836244633492,40.7836245131016,40.7836245623499,40.7836246131066,40.7836246640302,40.7836247159588,40.783624766714,40.7836248722449,40.7836249794511,40.783625035232,40.7836250893369,40.7836251451168,40.7836252039294,40.7836254310502,40.783625669576,40.783625730212,40.7836257948025,40.7836258571961,40.7836259168095,40.7836260426034,40.7836261717471,40.7836262401039,40.7836263023961,40.7836264384236,40.7836265065943,40.7836265705616,40.7836266389011,40.7836267079092,40.7836268462619,40.7836269169443,40.7836269874608,40.7836271308366,40.7836272041978,40.7836272763886,40.7836273502542,40.7836274236161,40.7836275730195,40.7836276490604,40.7836277257728,40.7836278018127,40.7836278825601,40.7836280344573,40.7836281925678,40.7836282724601,40.7836283518496,40.7836284329127,40.7836285144802,40.7836285960466,40.7836286781159,40.7836288439276,40.7836290120842,40.7836291822491,40.7836292688375,40.7836293542554,40.783629712868,40.7836298836686,40.7836300632093,40.7836301585204,40.7836302460988,40.7836304294894,40.7836308039723,40.7836308992661,40.7836309940589,40.7836310903577,40.7836311861557,40.7836312836264,40.7836313805954,40.7836314785687,40.7836315772121,40.7836316763581,40.783631774834,40.7836319753005,40.7836321767704,40.7836348428025,40.7836442058475,40.7836557411322,40.7836690988433,40.783683871974,40.7836849507422,40.7835913149178,40.7823061123153,40.7822282317644,40.7821264007409,40.7811007616325,40.780955752131,40.7811489619764,40.7812673815643,40.7812473268679,40.7811277348648,40.7809333622233,40.7810850527823,40.7808211215426,40.7807405269745,40.7805259156709,40.7800015988523,40.7798753162314,40.7795468039817,40.7794979456391,40.7785126440758,40.7783942477985,40.7776419990615,40.777590680485,40.7773581201926,40.7769664700143,40.776733185751,40.7749758741902,40.7740726202339,40.7740937051816,40.7740302391693,40.7739385180323,40.7739096083789,40.7738088345996,40.7737213360543,40.7734892058888,40.7733848147567,40.7731836298121,40.7730587728694,40.7729790725725,40.7728996682579,40.7726367415652,40.7724389681712,40.7721953899891,40.7721143507141,40.7720370783252,40.7719246579164,40.7718702301477,40.7718313882775,40.7718132337877,40.7717835813867,40.7711507397379,40.7703004339178,40.77028616889,40.7702730618289,40.7702512516371,40.770242930629,40.7702365380527,40.7702321700844,40.7702288235128,40.7702320509758,40.7702361033485,40.770241714216,40.7702488089299,40.7702572924202,40.7704497281736,40.7704756604658,40.7704848310911,40.7704923175611,40.7704982636018,40.7705027064674,40.7705033892714,40.7705022334986,40.7705037078698,40.7705025368823,40.7704994161827,40.7704967859752,40.770493392873,40.7704859422903,40.7704667634149,40.7704589576595,40.7704560997532,40.7704541781993,40.7704531603001,40.7704529837582,40.7704740127125,40.770498347292,40.770529546012,40.7705680050028,40.7705804875431,40.7705963058926,40.77065971164,40.7704397997069,40.7704373110901,40.7702210226943,40.7702221304197,40.770225133352,40.7702259911846,40.7702260127161,40.7702257248182,40.7702251470416,40.7702243120284,40.7702232740249,40.7702213950075,40.7702158009912,40.7702099704246,40.7702035222029,40.7701736137114,40.7703002478254,40.7701842322154,40.7695424525416,40.7693779437551,40.7691957977579,40.7690787964731,40.7689868469449,40.7688857141991,40.7688784405843,40.7689051574058,40.7689403297536,40.769038846179,40.7691395564514,40.7690925001274,40.7689914017088,40.7688815751449,40.7687636086762,40.7682762653915,40.768114830471,40.7680906563705,40.7679433141032,40.7678241855551,40.7677054409588,40.7674850142725,40.767349995601,40.7672735605669,40.7670753289427,40.7670279682222,40.7670318046986,40.7669579364812,40.7669422272733,40.7669594333953,40.7670003192596,40.7670113343589,40.7669945156697,40.7669321185918,40.7669419506213,40.7670142707441,40.7670593813267,40.7671739162468,40.7672567941806,40.7672719425306,40.7672071668697,40.7670310899356,40.7669406317438,40.766914785036,40.766917042038,40.7669373615674,40.7669131335556,40.7669126121612,40.7669113353639,40.7668946020137,40.7668398937505,40.766803167772,40.7668889175288,40.7668939798399,40.7668759105041,40.7667645254284]}]],[[{"lng":[-73.906473146101,-73.9025117370094,-73.9023993608407,-73.9020632788676,-73.9020342853376,-73.9016968608997,-73.9007737589174,-73.9003262974382,-73.9001075937135,-73.8996163794179,-73.8992474849267,-73.8978318016958,-73.8972553665103,-73.8970241037333,-73.8969399356256,-73.8965120491361,-73.8963790528033,-73.8964008604913,-73.8963525132234,-73.8963036609653,-73.8963502624675,-73.8963688834432,-73.8965025483398,-73.8963785598223,-73.8962678562046,-73.8962865269983,-73.8962180352292,-73.8960437666813,-73.8961138186447,-73.8961332278004,-73.8962425979326,-73.8961401508982,-73.8960051677202,-73.8960274447233,-73.8959800132279,-73.8959296297553,-73.8959767322096,-73.8959997537749,-73.8961263263259,-73.8958291437706,-73.8968317382439,-73.8967770075138,-73.8967585725261,-73.8967226928147,-73.8967344194978,-73.896725136462,-73.8967300542102,-73.8967205217383,-73.8967556481393,-73.896771827075,-73.8967884498549,-73.8968280794559,-73.896806600943,-73.8968593888039,-73.8971553445903,-73.8970770778155,-73.8970670374688,-73.8970351011218,-73.8970438920438,-73.8970307401823,-73.8970608713766,-73.8970715206267,-73.8970834327814,-73.8971191326535,-73.8971109707653,-73.8971927355054,-73.8972969922041,-73.8974219896458,-73.8973312936992,-73.8973218790434,-73.8972874299452,-73.8972999827729,-73.8972874593484,-73.8973157079374,-73.8973420387514,-73.8973720966417,-73.8973620507754,-73.8974542605217,-73.8976139659438,-73.8977222652819,-73.8976401114823,-73.8976313250949,-73.8975962455615,-73.8976138130609,-73.8975987852621,-73.897631422534,-73.8976583777849,-73.8976859245572,-73.8976802682669,-73.8977534240651,-73.8978104387458,-73.8976751806963,-73.898761626615,-73.8988562039788,-73.9011457755211,-73.9017237316452,-73.9017493505536,-73.9017909311379,-73.9018523162193,-73.9018692558847,-73.901886114081,-73.9019194928561,-73.9019509578695,-73.9019834514795,-73.9020525643442,-73.9021170795793,-73.902171328119,-73.90217815316,-73.902183594596,-73.902187819089,-73.9023044303681,-73.9025124804179,-73.9025804939892,-73.9026772358211,-73.9026767708108,-73.9025792967235,-73.9023430388268,-73.9022548092287,-73.9021830370666,-73.9021496741191,-73.9020356579012,-73.9012912761893,-73.9012175409469,-73.9007284702245,-73.9003457266802,-73.9003496078034,-73.899479477527,-73.8986543784404,-73.89718604766,-73.8971138425062,-73.89705399045,-73.8970495925256,-73.8970432306266,-73.897035085108,-73.8970253868894,-73.8970144109085,-73.8970024683272,-73.89698989771,-73.8969770554258,-73.8969368091958,-73.8969343156557,-73.8969301725558,-73.8969245030632,-73.8969174757228,-73.8969092994462,-73.896900217301,-73.8968904992853,-73.8968804343006,-73.8968703215634,-73.8968194082322,-73.8968142358783,-73.8968073547501,-73.8967989511907,-73.8967892527708,-73.8967785221271,-73.896767049849,-73.8967551466102,-73.8967120798327,-73.8967051055797,-73.8966961158285,-73.8966853733364,-73.8966731920909,-73.8966599281328,-73.8966459691492,-73.8965946784282,-73.8965929555898,-73.896589913318,-73.8965856323322,-73.8965802262181,-73.8965738384145,-73.8965666384066,-73.8965588172303,-73.8965505824025,-73.8965421524156,-73.8965337509399,-73.8964843103949,-73.8964803061435,-73.8964747453439,-73.8964677705297,-73.8964595604788,-73.8964503256308,-73.8964403026929,-73.8964297485727,-73.8964189337935,-73.8963637901165,-73.8963617553213,-73.8963583714974,-73.8963537393544,-73.8963479967541,-73.8963413146082,-73.8963338917914,-73.8963259492222,-73.8963177232884,-73.8963094588111,-73.8962554267883,-73.8962475440766,-73.8962374163611,-73.8962253353687,-73.8962116490908,-73.8961967517591,-73.8961810724901,-73.8960029772821,-73.8960029746129,-73.8960018476962,-73.8960007212292,-73.8959995927677,-73.8959984678451,-73.8959973407167,-73.8959950891201,-73.8959939635351,-73.8959928364075,-73.8959905863624,-73.8959883354373,-73.8959872105117,-73.8959849602476,-73.895982710202,-73.8959804586154,-73.8959793336912,-73.895977083425,-73.8959737095955,-73.8959714602123,-73.8959692106069,-73.895966961234,-73.895964713186,-73.8959624629191,-73.895959091071,-73.8959568416994,-73.895953469189,-73.895951221138,-73.8959478470865,-73.8959455990354,-73.8959422278604,-73.8959399798119,-73.8959366084164,-73.8959343590428,-73.8959309885288,-73.8959276160194,-73.8959253684223,-73.8959219972472,-73.8959197498705,-73.8957431744655,-73.8957420473301,-73.8957409195167,-73.8957397923812,-73.895738666112,-73.8957364158353,-73.8957352895812,-73.8957341611062,-73.8957319117116,-73.8957296620967,-73.8957285349607,-73.8957262842434,-73.8957240348486,-73.8957217839099,-73.8957195345157,-73.8957172851206,-73.8957150361807,-73.8957127861239,-73.8957105360681,-73.8957082864685,-73.8957049139479,-73.8957026645511,-73.8957004149522,-73.8956970437537,-73.8956947943731,-73.8956914218521,-73.8956891722528,-73.8956857997317,-73.8956835516743,-73.8956801811532,-73.8956768077503,-73.8956745597077,-73.8956711885101,-73.8956678166666,-73.8956655699464,-73.8956621978825,-73.8954844938979,-73.8954833662952,-73.8954811153277,-73.8954799884034,-73.895478860579,-73.8954766111734,-73.8954754335978,-73.8954732323984,-73.8954709809903,-73.8954698551667,-73.8954676030979,-73.8954653536906,-73.895463104285,-73.8954608533346,-73.8954574794645,-73.8954552291761,-73.8954529784477,-73.8954507290404,-73.8954473562888,-73.8954451055591,-73.8954417323475,-73.8954394842822,-73.8954361117514,-73.8954327378792,-73.8954293653481,-73.8954271157387,-73.8954237432067,-73.8954203713384,-73.8954169988062,-73.8954136276165,-73.895410255086,-73.8954068832148,-73.895404635608,-73.8954012644182,-73.8953978912252,-73.8953945200354,-73.8949705077847,-73.8949693828254,-73.8949682543154,-73.894967127127,-73.8949659994976,-73.8949648723338,-73.8949637451451,-73.8949614950554,-73.8949603665449,-73.8949581162335,-73.8949569899512,-73.8949547391754,-73.8949524888647,-73.8949502387741,-73.8949479893448,-73.8949457390327,-73.8949434882816,-73.8949412388519,-73.8949389878791,-73.89493673845,-73.8949333645507,-73.8949311149247,-73.8949288654934,-73.894925492061,-73.8949232413079,-73.894919869418,-73.8949164968651,-73.8949142487821,-73.8949108768902,-73.8949075036785,-73.8949052540518,-73.8949018828475,-73.8948985109571,-73.8948951384036,-73.8948917671993,-73.8948895204644,-73.8948861490397,-73.8948827773691,-73.8948794052832,-73.8947140757471,-73.8947129472233,-73.894711820905,-73.8947106937316,-73.8947095658695,-73.8947084373462,-73.8947061879054,-73.8947050607061,-73.8947039335331,-73.8947016820809,-73.8946994326406,-73.8946983054666,-73.8946960551453,-73.8946938030321,-73.8946915535895,-73.8946893026067,-73.8946870531658,-73.8946848037244,-73.8946825547536,-73.8946791815009,-73.8946769307378,-73.8946746804425,-73.8946713078516,-73.8946690591005,-73.8946656851869,-73.8946634362145,-73.8946600645345,-73.8946566904281,-73.8946544423371,-73.8946510697734,-73.8946476978734,-73.8946443257804,-73.894640954098,-73.8946387058156,-73.8946353332523,-73.8946319633632,-73.8946285914905,-73.8946252202789,-73.8946218490674,-73.8946196023277,-73.8946162295734,-73.8946128596842,-73.8946094885024,-73.8946061179521,-73.8946027480936,-73.8946005027043,-73.8945971321541,-73.8945937614142,-73.8945903924367,-73.8945881448464,-73.894584777,-73.8945825316119,-73.8945791608725,-73.8945769155157,-73.8945735463174,-73.8945713022821,-73.8945679324247,-73.8945656868488,-73.8945634428147,-73.8945611978994,-73.8945589525423,-73.8945567085086,-73.8945544644752,-73.894552218899,-73.8944420040288,-73.8944442475896,-73.8944453679978,-73.894446487559,-73.89444760797,-73.8944487274988,-73.894449846586,-73.8944509676892,-73.8944520880998,-73.8944532063065,-73.8944532022452,-73.894454322656,-73.8944543185941,-73.8944543145321,-73.8944554340623,-73.8944554300004,-73.8944554259376,-73.894454298285,-73.8944542942231,-73.8944542901619,-73.8944531616248,-73.8944531589177,-73.8944520325872,-73.8944509040518,-73.8944508999889,-73.8944497721154,-73.8944486449014,-73.8944463941278,-73.8944462671622,-73.894445265592,-73.8944441370569,-73.8944430120791,-73.89444076039,-73.894438510278,-73.8944373817425,-73.8944351322915,-73.8944328819579,-73.8944306298273,-73.8944283803759,-73.8944261293816,-73.8944238799281,-73.8944216304763,-73.8944193794809,-73.8944160069077,-73.8944137565729,-73.8944103835275,-73.894408133886,-73.8944047599595,-73.8944025118598,-73.8943991399498,-73.8943957653598,-73.8943935157171,-73.8943901431456,-73.8943867712326,-73.8943834000141,-73.8943800274397,-73.8943777793414,-73.8943744079024,-73.8943710362094,-73.8943676641092,-73.8943642922293,-73.8943609210107,-73.894357549792,-73.8943541792346,-73.8943508080159,-73.8943474367973,-73.8943440669349,-73.8943406963775,-73.8943384509869,-73.8943350795819,-73.8943317077022,-73.8943283385014,-73.8943249692988,-73.8943227232499,-73.8943193554051,-73.8943159846592,-73.8943137386097,-73.8943103701031,-73.8943081238334,-73.8943047562078,-73.8943025106339,-73.8942991407729,-73.8942968967401,-73.8942946518266,-73.8942924071347,-73.8942901622207,-73.894287916866,-73.8942856741927,-73.8942834292791,-73.8942811845867,-73.8942800641801,-73.8942778201492,-73.8942767010686,-73.8942744557148,-73.8942733353093,-73.8942723422792,-73.8942722177708,-73.8942699737407,-73.8942688533372,-73.8942677329321,-73.8942677370013,-73.8942666179195,-73.8942654961601,-73.8942655002274,-73.8942643813682,-73.8942643854367,-73.8942643895059,-73.8942632684402,-73.8942632725095,-73.8942632765797,-73.8942644057823,-73.8942644098516,-73.89426441392,-73.8942655409201,-73.8942655449885,-73.894266672175,-73.8942677993945,-73.8942689279354,-73.8942700564771,-73.8942711828155,-73.8942723099998,-73.8942734378792,-73.894274566202,-73.8942768158749,-73.8942779422112,-73.8942801929866,-73.8942824440162,-73.8942835712018,-73.8942858213149,-73.8942880736684,-73.89429032312,-73.8942925725715,-73.8942948235676,-73.8942981966093,-73.8943004482653,-73.8943026972429,-73.8943060705046,-73.8943083199573,-73.8943116925259,-73.8943139432988,-73.8943173152041,-73.8943195641813,-73.8943229381042,-73.8943263100111,-73.8943296825783,-73.8943319306403,-73.8943353040898,-73.8943386759937,-73.8943420472051,-73.8943454191115,-73.894348790984,-73.8943521628896,-73.8943555334397,-73.8943589053122,-73.8943622758622,-73.8943656483959,-73.8943678953559,-73.894371265212,-73.8943746364234,-73.8943780056176,-73.894381376829,-73.8943847466873,-73.894388116543,-73.8943914870608,-73.8943937333264,-73.8943971023026,-73.894400472379,-73.8944027177641,-73.8944060856054,-73.8944094561256,-73.8944117016982,-73.8944139457301,-73.8944173155867,-73.8944195611597,-73.8944218058522,-73.8944251736954,-73.8944274177267,-73.8944296633013,-73.8944319073339,-73.894541001719,-73.8945398799546,-73.8945376359526,-73.8945365163923,-73.89453539598,-73.8945331504042,-73.8945320321953,-73.8945309104302,-73.8945297900202,-73.8945297940785,-73.8945286745167,-73.8945275541051,-73.8945275581642,-73.894526439075,-73.8945264431342,-73.8945253213707,-73.8945253254291,-73.8945253294883,-73.8945253335476,-73.8945253376068,-73.8945264647825,-73.8945264688409,-73.8945264729019,-73.894527600109,-73.8945276041682,-73.8945287313436,-73.8945298576689,-73.8945309861973,-73.8945321133734,-73.8945332396995,-73.8945343682266,-73.8945354947423,-73.8945366232711,-73.8945388727138,-73.894539999007,-73.894542250683,-73.8945445001243,-73.8945456273008,-73.8945478787551,-73.8945501290769,-73.8945523785188,-73.8945546295015,-73.8945568789414,-73.8945591270302,-73.894561377793,-73.8945647525855,-73.8945670006741,-73.8945692516562,-73.8945726233318,-73.8945748729912,-73.894578245549,-73.8945804949569,-73.8945838661921,-73.8945872402916,-73.8945894883797,-73.8945928609344,-73.8945962334916,-73.894599605357,-73.8946018543245,-73.8946052246471,-73.8946085974245,-73.894611967747,-73.8946153398327,-73.8946175865674,-73.8946209584327,-73.8947840379855,-73.894784042034,-73.8947851669972,-73.8947862955161,-73.8947874231513,-73.8947885503176,-73.8947896775111,-73.8947919269416,-73.89479305546,-73.8947941819647,-73.894796433405,-73.8947986843778,-73.894799810691,-73.8948020614424,-73.8948043117537,-73.8948065618455,-73.8948088121558,-73.8948110615862,-73.8948133110147,-73.8948155619858,-73.8948178114148,-73.8948211852849,-73.8948234355963,-73.8948268081412,-73.894829058232,-73.894832429457,-73.8948346790773,-73.8948380516245,-73.8948402997037,-73.8948436715877,-73.8948470447958,-73.8948504188847,-73.8948526669645,-73.8948560375002,-73.8948594100442,-73.8948627812412,-73.8948661524381,-73.8948695243234,-73.8948717723757,-73.8948751435726,-73.8948785141083,-73.8953092724716,-73.8953104009646,-73.8953115281341,-73.8953126552828,-73.8953137815697,-73.8953149087193,-73.8953160372109,-73.8953171628165,-73.8953194131044,-73.8953205415949,-73.8953216665402,-73.8953239172712,-73.8953261668974,-73.8953272940454,-73.8953295434521,-73.8953317941801,-73.8953340444678,-73.895336293875,-73.895338544823,-73.8953407928864,-73.8953430422914,-73.8953464177021,-73.8953486664265,-73.8953509151508,-73.8953542876952,-73.8953565373026,-73.8953587853663,-73.8953621578895,-73.8953644072755,-73.8953677791391,-73.8953711525463,-73.8953733992666,-73.8953767717895,-73.8953801423107,-73.8953823916963,-73.8953857637603,-73.8953891342814,-73.8953913823437,-73.8953947535261,-73.8955713262016,-73.89557132888,-73.8955724573594,-73.8955735825164,-73.8955747096552,-73.8955747123353,-73.8955758401351,-73.8955769650705,-73.8955780915489,-73.895580342266,-73.8955814680828,-73.8955825952229,-73.8955837201572,-73.8955859710962,-73.8955870982343,-73.8955893462907,-73.8955904725471,-73.8955927228235,-73.8955949708789,-73.8955972209365,-73.895598346734,-73.8956005956716,-73.895602845067,-73.8956050944426,-73.8956073427189,-73.8956095907729,-73.8956118401502,-73.8956140890867,-73.8956163371423,-73.8956185867381,-73.8956219592533,-73.895624205969,-73.8956264555653,-73.8956287029421,-73.895632074796,-73.8956343237155,-73.895636570431,-73.8956388198078,-73.8956421889995,-73.8956444370374,-73.8956466839733,-73.895828878691,-73.8958300058209,-73.8958311307467,-73.8958322592144,-73.8958333856847,-73.8958333883564,-73.895835638403,-73.8958367655325,-73.8958378939982,-73.8958390195848,-73.8958401467149,-73.8958423969822,-73.8958435219092,-73.8958457714978,-73.8958468970859,-73.8958491480114,-73.8958513973939,-73.8958536467645,-73.8958547719114,-73.8958570219557,-73.8958592715438,-73.8958615195917,-73.8958637689755,-73.8958660192246,-73.895868268815,-73.895870517523,-73.895873889365,-73.8958761374117,-73.8958783861203,-73.8958806350467,-73.8958840075514,-73.8958862555845,-73.8958885038521,-73.8958918763548,-73.8958941243879,-73.8958974942336,-73.8958997438234,-73.8959019905341,-73.8959053617021,-73.8959076097352,-73.8960637773843,-73.8960547506216,-73.8960463862991,-73.8960389060176,-73.8960325079566,-73.8960273616236,-73.8960236033629,-73.896021332744,-73.8960206099233,-73.8960214540502,-73.8960178238461,-73.8960142093417,-73.8960107200648,-73.8960074617487,-73.8960045331278,-73.8960020229462,-73.8960000072682,-73.8959985471735,-73.8959976869062,-73.8959974525343,-73.8959868494676,-73.8959760940446,-73.8959654931479,-73.8959553492511,-73.895945951788,-73.8959375688945,-73.8959304397581,-73.8959247677924,-73.8959207148341,-73.8959183965248,-73.8959178790117,-73.8959191770602,-73.8959163006894,-73.8959133159773,-73.8959103093565,-73.8959073678945,-73.8959045767714,-73.895902016814,-73.8958997621548,-73.8958978780854,-73.8958964191656,-73.8958954276434,-73.8958949322317,-73.8958949472769,-73.8958845381499,-73.8958740139161,-73.8958636612248,-73.8958537620529,-73.8958445860247,-73.8958363830681,-73.8958293766075,-73.8958237574776,-73.8958196787265,-73.8958172514469,-73.89581654175,-73.8958175689652,-73.8957935707561,-73.8957821287704,-73.8957706996527,-73.8957595923658,-73.8957491071725,-73.8957395275183,-73.8957311123695,-73.8957240892117,-73.8957186479012,-73.895714935532,-73.8957130524595,-73.8957130495879,-73.8957084636016,-73.8957041433333,-73.8957001838266,-73.8956966721887,-73.895693685674,-73.8956912899842,-73.8956838888882,-73.895674662904,-73.8956651184079,-73.8956555363855,-73.8956461989271,-73.8956373809234,-73.8956293419722,-73.8956223187364,-73.8956165179765,-73.8956121104639,-73.8956092259531,-73.8956079493623,-73.8956083182731,-73.8956103218245,-73.895605533545,-73.8956009456853,-73.8955966666507,-73.8955927975496,-73.8955894298037,-73.8955866429886,-73.8955845029531,-73.8955830602634,-73.8955824394269,-73.8955822772928,-73.8955825762164,-73.8955708104995,-73.8955588883595,-73.8955470942263,-73.8955357094756,-73.8955250057165,-73.8955152383113,-73.8954253684801,-73.8947742905354,-73.8954219797167,-73.8953575056751,-73.8953508303022,-73.8952787246653,-73.8952879617353,-73.894624393384,-73.8946009177459,-73.8952373986715,-73.8952126420444,-73.8952434310706,-73.8952661225134,-73.8953109816393,-73.8953166783332,-73.8953409217013,-73.8953485046738,-73.8953255801008,-73.8953559003853,-73.8953444784229,-73.895284679113,-73.8952764808978,-73.8952657942618,-73.8952529208588,-73.8952382240694,-73.8952315192508,-73.8952227873264,-73.8952122200424,-73.8952000494487,-73.8951865428028,-73.8951862108404,-73.895180952602,-73.8951709274137,-73.8951564390474,-73.8951379265152,-73.8951159507683,-73.8950911776987,-73.8950643579624,-73.8950609539905,-73.895055825154,-73.8950491106284,-73.8950409926186,-73.8950316914145,-73.8950214594134,-73.8950105742711,-73.895004260641,-73.8949934506938,-73.8949784651241,-73.8949597485055,-73.8949378561018,-73.894913437394,-73.894887216812,-73.8948849683982,-73.8948809497007,-73.89487526177,-73.89486804763,-73.8948594886814,-73.8948498001409,-73.8948392256292,-73.894828031045,-73.8948200560961,-73.8948082181827,-73.8947927834442,-73.8947740988851,-73.8947525845744,-73.8947287242006,-73.8947030541983,-73.8947014981501,-73.8946981733793,-73.8946931762352,-73.8946866515312,-73.8946787883488,-73.8946698145581,-73.8946599902137,-73.8946496000191,-73.8946429797258,-73.8946321465195,-73.8946173996284,-73.8945991463844,-73.8945778909718,-73.894554220501,-73.8945287887917,-73.8945228951785,-73.8945147639889,-73.8945045911926,-73.8944926219647,-73.8944791447768,-73.8944644844443,-73.8944590452341,-73.8944499051551,-73.894437302588,-73.8944215662195,-73.8944031064703,-73.8943824047906,-73.8943600011036,-73.8943364797234,-73.8943356369929,-73.8943331255908,-73.8943290128501,-73.8943234090378,-73.8943164643985,-73.8943083651259,-73.8942993283712,-73.8942895964207,-73.8942794301997,-73.8942730855967,-73.8942627145791,-73.8942486220937,-73.8942312225139,-73.894211027456,-73.8941886307359,-73.8941646909079,-73.8941399119007,-73.8941150223186,-73.8940907540174,-73.8940678205844,-73.8940468963558,-73.894028596588,-73.894013459367,-73.8940017780384,-73.8939899417857,-73.8939782281633,-73.89396691185,-73.8939562582079,-73.8939465170594,-73.8939379168297,-73.8939306591893,-73.8939071510805,-73.8938833881688,-73.8938599927784,-73.8938375776086,-73.8938167296871,-73.8937979949969,-73.8937818641769,-73.8937687596732,-73.8937590246751,-73.8937529141281,-73.8937407594954,-73.8937294363085,-73.8937192615912,-73.8937105202124,-73.8937034569106,-73.8936982694417,-73.8936677269819,-73.893639367224,-73.8936140085998,-73.8935923829304,-73.8935751143059,-73.8935627010757,-73.8935540271686,-73.8935457752744,-73.8935381578219,-73.8935313709076,-73.8935255892472,-73.893520961678,-73.8935176073273,-73.893515612546,-73.8934896507279,-73.8934652803588,-73.8934432307169,-73.8934241616321,-73.8934086437408,-73.8933971414096,-73.8933899988393,-73.8933809946988,-73.8933720653866,-73.8933634460653,-73.8933553637334,-73.8933480312474,-73.8933416417156,-73.8933363634124,-73.8933323353471,-73.8933296636024,-73.8933284185409,-73.8933286329521,-73.8933098487454,-73.8932911350585,-73.893272957584,-73.8932557686707,-73.8932399960665,-73.8932260322741,-73.893214224783,-73.8932048674228,-73.8931981930507,-73.8931943677572,-73.8931620256145,-73.8931341497277,-73.8931080016682,-73.893083410282,-73.8930609069206,-73.8923075020365,-73.8922970209444,-73.8928149442209,-73.8927491787641,-73.8921459358378,-73.8916545912373,-73.8917169010549,-73.8918895562188,-73.892141627146,-73.8922419109737,-73.8930098618019,-73.8930006898945,-73.8929894404066,-73.8929790227935,-73.8929697252278,-73.8929618048996,-73.8929554809009,-73.8929509281662,-73.8929237824389,-73.8928981286231,-73.8928746889067,-73.8928541231468,-73.8928370102942,-73.8928238320945,-73.8928149595269,-73.8927960712337,-73.8927787537252,-73.8927634710011,-73.8927506325414,-73.8927270755011,-73.8927049909514,-73.8926848969815,-73.8926672649821,-73.892652508587,-73.8926409739694,-73.8926329317211,-73.8926189481545,-73.8926059083424,-73.8925940928388,-73.8925837558559,-73.8925751197953,-73.8925683704623,-73.8925434699855,-73.8925199037092,-73.8924982278119,-73.8924789538568,-73.8924625367194,-73.8924493638516,-73.8924397461381,-73.892428338347,-73.8924176831658,-73.8924080361711,-73.8923996287568,-73.8923926625838,-73.8923873047433,-73.892355971522,-73.8923269032759,-73.892300891891,-73.892278645976,-73.8921783240054,-73.892161842019,-73.8921114885468,-73.8920848045048,-73.8922462702623,-73.8922350351257,-73.8922264084098,-73.8922206484647,-73.8922179277865,-73.8921977424317,-73.8921778678319,-73.8921588203941,-73.8921410950328,-73.8921251523102,-73.8921114064692,-73.89210021467,-73.8920918677101,-73.8920865824686,-73.8920844962708,-73.8920775931037,-73.8920705839726,-73.892063679936,-73.8920570888881,-73.892051009298,-73.8920456242341,-73.892041095851,-73.8920375605068,-73.8920351246574,-73.8920338616507,-73.892033809518,-73.8920349698288,-73.8920147354005,-73.8919948511951,-73.8919758490286,-73.8919582371257,-73.8919424865274,-73.8919290184922,-73.8919181932298,-73.8919103002665,-73.8919055507023,-73.8919040715649,-73.8919040639767,-73.8919068306299,-73.8919123031394,-73.891920346239,-73.891868794552,-73.8918487937602,-73.8918271316131,-73.8918044376359,-73.8917813713405,-73.8917586030588,-73.891736794462,-73.8917165793315,-73.8916985451401,-73.8916832159796,-73.8916710373299,-73.891662363113,-73.8916574454077,-73.8916564271246,-73.8916593378529,-73.8916660930011,-73.8916588007794,-73.8916523411459,-73.8916469081293,-73.8916426649219,-73.891639738977,-73.8916382181814,-73.8916381482149,-73.8916395311786,-73.8916423255321,-73.8916464473406,-73.8916369736213,-73.8916194579814,-73.8916047514405,-73.8915932607966,-73.8915853038919,-73.8915811008207,-73.8915807678416,-73.8915843141621,-73.8915916416842,-73.8916025477181,-73.8916167305895,-73.8916337979839,-73.8916532777989,-73.8916746312029,-73.8916798893539,-73.8916874147561,-73.8916983210651,-73.8917116359191,-73.8917270606879,-73.8917286120636,-73.8917338981269,-73.8917427776598,-73.8917550134465,-73.8917702786107,-73.8917881653483,-73.8918081958217,-73.8918298349251,-73.8918525045794,-73.8918497245071,-73.8918481315026,-73.8918477722286,-73.8918486572089,-73.8918507605199,-73.8918540205501,-73.8918583418053,-73.891863597705,-73.8918696342912,-73.8918762747375,-73.8918833245292,-73.8918905771609,-73.8918978201856,-73.8919048414375,-73.8919084321567,-73.8919158972964,-73.8919270368795,-73.8919415524999,-73.8919590553161,-73.8919790764671,-73.8920010796329,-73.8920244754003,-73.8920253185006,-73.8920279063255,-73.8920321717801,-73.8920380042741,-73.8920452525888,-73.8920537287979,-73.89206321314,-73.8920734597159,-73.8920842028644,-73.8920909215776,-73.8921016569689,-73.8921161450781,-73.8921340296756,-73.8921548710217,-73.8921781566782,-73.8922033141086,-73.8922095907272,-73.8922174335573,-73.8922266796097,-73.8922371367338,-73.8922465188453,-73.892256444581,-73.8922667735545,-73.8922675963712,-73.892269538286,-73.8922764099764,-73.8922872007676,-73.8923015855565,-73.8923191309631,-73.8923393083863,-73.89236150993,-73.8923869334564,-73.8923859472595,-73.8923859422902,-73.8923869186986,-73.8923888469189,-73.8923933526454,-73.8923989738098,-73.8924055948459,-73.8924130796313,-73.8924185390669,-73.892424355932,-73.8924304139368,-73.8924365919707,-73.8924427665236,-73.8924450471548,-73.8924476314052,-73.8924523947012,-73.8924592226352,-73.8924679512107,-73.892478370781,-73.892490231085,-73.8925032472575,-73.8925171066718,-73.892534845649,-73.8925128172442,-73.8924961922682,-73.892497107066,-73.8925439480314,-73.8925401814555,-73.8924774877329,-73.8924585642639,-73.8924370134927,-73.8924134110009,-73.8923883871692,-73.89236261034,-73.8923367689675,-73.8923115532295,-73.8922876365943,-73.892226234128,-73.8921639309213,-73.892101376906,-73.8920392246303,-73.8919781224518,-73.8918179184095,-73.8916685970292,-73.8915071884852,-73.8912965852538,-73.891195897044,-73.8921833074636,-73.8925225986089,-73.8925027192329,-73.8922536570346,-73.8928604007566,-73.8942324749779,-73.8965647755196,-73.895840749084,-73.8951305991231,-73.8944227655844,-73.893703053664,-73.8935608381839,-73.8934067519725,-73.8932423675106,-73.8930694376266,-73.8928899263955,-73.891358806501,-73.8907087069111,-73.8903419603085,-73.8895550745803,-73.8895264042492,-73.8894992181914,-73.8894739131481,-73.8894508583693,-73.8894303903859,-73.8894128079001,-73.8894022625029,-73.8890400025454,-73.8887089321047,-73.8886884136908,-73.8887444404909,-73.8886549578872,-73.8886214500179,-73.8885192580243,-73.8884237573072,-73.8883397556247,-73.8882713106102,-73.8882210938927,-73.8881900815474,-73.8881854192606,-73.8881775922634,-73.888130626839,-73.887818145648,-73.8877298822495,-73.8877066182002,-73.8877787738584,-73.888354711776,-73.8888165393255,-73.8892561949502,-73.8902903458953,-73.890513578572,-73.8910707878575,-73.8918353579635,-73.8916546392846,-73.8914448974731,-73.891730067629,-73.891818572436,-73.8921210344678,-73.8923944328483,-73.8926678131164,-73.893075162923,-73.8934960594546,-73.8943237202154,-73.8944322594536,-73.8944998080285,-73.8945602113229,-73.8946062741715,-73.8946432599384,-73.8948022255794,-73.8949549761795,-73.8949579650197,-73.8949945888893,-73.8950575871895,-73.8950665769515,-73.8951683706391,-73.8952493676186,-73.8952747945424,-73.8954244779486,-73.8955770438276,-73.8958599187409,-73.895984065028,-73.8960849253165,-73.8962474473163,-73.8964113840346,-73.8967062276317,-73.8970608179933,-73.8972716766544,-73.8973195757752,-73.8974273674472,-73.8978952811055,-73.8979114523291,-73.8982524029575,-73.8986613786671,-73.8990607288989,-73.8994103518506,-73.8994901883096,-73.8995625954032,-73.8996274187884,-73.8996845202942,-73.8997337782537,-73.8997750875714,-73.8998083602161,-73.8998335252937,-73.8998487650756,-73.8998595914061,-73.8998659865307,-73.8998679400511,-73.8998654486951,-73.8998585165688,-73.8998147477601,-73.8997265043898,-73.8995593819381,-73.899258571912,-73.8991209144408,-73.8986684806338,-73.8986486550348,-73.8986240117079,-73.8985946567442,-73.8985607157575,-73.8984080648332,-73.89837417164,-73.8983344773505,-73.8982898957431,-73.8982414530998,-73.8981902645821,-73.8981375085596,-73.897923512633,-73.8985422311188,-73.8986294744263,-73.8987381642835,-73.8992154677058,-73.8995734847149,-73.9003027629588,-73.9012134795135,-73.9021212034403,-73.9024721300924,-73.9029891234458,-73.9039228060483,-73.9049169137475,-73.9058644026395,-73.9061170803334,-73.9066854594976,-73.906908897675,-73.907594259872,-73.9082366112783,-73.9102312473466,-73.9106747489712,-73.9103411180102,-73.9098431864611,-73.9126711659089,-73.9131433924495,-73.9152560093149,-73.9181837583396,-73.9195757355013,-73.9202133376663,-73.920539001505,-73.9207124344269,-73.921014801325,-73.9216120809142,-73.9225504306775,-73.9246336947016,-73.9265160561276,-73.9315191206656,-73.933939394172,-73.9353868532155,-73.9367254201155,-73.9368348054646,-73.9373965378215,-73.9373928572593,-73.9373855812787,-73.9373836877828,-73.937381538012,-73.9373804606774,-73.9372960072456,-73.9373262628454,-73.9374154885158,-73.9374297356962,-73.9378116270893,-73.9379820917095,-73.9386371583589,-73.9394428434305,-73.9400209980992,-73.9402628154808,-73.94039280634,-73.9405203088532,-73.9410861243826,-73.9417770356669,-73.9418744195925,-73.9423834770959,-73.9425402228334,-73.942719280804,-73.9438353681251,-73.9440358037089,-73.9462957550284,-73.9478967108823,-73.9487795492734,-73.948970213573,-73.9490420195343,-73.9490827060623,-73.9491129519947,-73.9508076381835,-73.9507712265949,-73.9507348149569,-73.9506634182629,-73.949150218094,-73.9478318958303,-73.9459642421985,-73.9458055480488,-73.9457052564074,-73.944730489721,-73.9447146080307,-73.9446762807938,-73.9435028203273,-73.9415852327176,-73.9413117494145,-73.9404625695171,-73.9403510378443,-73.9398355934912,-73.9395332166372,-73.9393658722384,-73.9389550245331,-73.9381973075476,-73.938069432176,-73.937887684264,-73.9377781667848,-73.9379620093891,-73.9379582289513,-73.9374710911687,-73.9368146065473,-73.9366853911941,-73.9367073798919,-73.9364038180227,-73.9361691391956,-73.9357402143262,-73.9352401683119,-73.9348953389456,-73.9346949906703,-73.935147154026,-73.9350081387223,-73.934940272005,-73.9349389295669,-73.9349048128265,-73.9345273010944,-73.9344854830391,-73.934857909749,-73.9348701816343,-73.9349539871494,-73.9349294331986,-73.9348371529981,-73.9348428269752,-73.9344801508905,-73.9344352574318,-73.934826227617,-73.9348085889711,-73.9348068134416,-73.9351501780753,-73.9355484466961,-73.935567971159,-73.9356085344977,-73.9355892281931,-73.9360533502869,-73.9374663853708,-73.9378133596951,-73.9378581182278,-73.937654830247,-73.9370470215374,-73.9370301277382,-73.936380228837,-73.936089196991,-73.935854526415,-73.9355093886364,-73.9350823255826,-73.9347435301128,-73.934373228561,-73.9338113285941,-73.9328924547043,-73.9327747786772,-73.9327412296534,-73.9327221045397,-73.9326493117339,-73.931846460775,-73.9317883430521,-73.93104964299,-73.9310737714675,-73.9308830426319,-73.9306285655417,-73.9298805856625,-73.9290357214348,-73.9286051502335,-73.9283956114139,-73.9282773083272,-73.926318334039,-73.9258220124597,-73.9257452164664,-73.9256507624441,-73.9255730426292,-73.9248734454787,-73.9242336300752,-73.9231869439802,-73.922956526902,-73.9226301383084,-73.9220996549944,-73.9209756209968,-73.9199645879303,-73.9190903474066,-73.9184738422549,-73.9181886300531,-73.917738074403,-73.9172451642752,-73.9171711864643,-73.9171820067968,-73.9168327701642,-73.9157517289456,-73.9154171875742,-73.915343512709,-73.9152601400216,-73.9155871020589,-73.9142394796457,-73.9125998597762,-73.9124081100032,-73.9126674836073,-73.9122295242643,-73.9120685357867,-73.9119511090557,-73.9120797509054,-73.911837777361,-73.9116934237208,-73.9112495910534,-73.9109429750036,-73.910904870988,-73.9102221578412,-73.9098586292578,-73.9067799142077,-73.906473146101],"lat":[40.7901811752081,40.7894720845257,40.7895516206859,40.7894944059978,40.7894146869293,40.789320323824,40.7891438182516,40.7890076628257,40.7888504895971,40.7884004962364,40.7881486596258,40.7871821703941,40.786750956944,40.7866581569601,40.7866246689697,40.786068659026,40.7861310815836,40.7861579117736,40.7861793102033,40.7861192015626,40.7860973196128,40.786120230201,40.7860574678441,40.7859089810945,40.7859605719464,40.7859837186365,40.7860160228713,40.7857999874805,40.7857673421654,40.7857914035649,40.785740432992,40.7856071672883,40.7856666502386,40.7856892864258,40.785711675769,40.7856489443138,40.7856270877598,40.7856557520184,40.7855931688089,40.7852215273835,40.7844276637035,40.7843884209637,40.7844032760117,40.7843775493258,40.7843680998444,40.7843614421092,40.7843574786778,40.7843506439794,40.7843223393758,40.7843339410958,40.7843205484267,40.7843489645512,40.7843662706263,40.7844041204828,40.7841949628569,40.7841338313281,40.7841400172814,40.7841161627917,40.7841071162344,40.7840990042975,40.7840732993185,40.7840785501965,40.7840780848955,40.7841005127352,40.7841081296958,40.7841685374298,40.7840948569066,40.7839963147211,40.7839282029087,40.7839348653813,40.7839152982092,40.7839062549849,40.7838962377009,40.7838719598007,40.7838710303746,40.7838934536134,40.7839029755204,40.7839708738884,40.7838449677848,40.7837434648356,40.7836821189856,40.783688305432,40.7836711196673,40.7836616044223,40.78365015495,40.7836249284895,40.7836259059847,40.7836507087883,40.7836597575081,40.7837142604789,40.7836844615451,40.7835842727554,40.782748945882,40.782804304604,40.7827111060906,40.7821292546379,40.7821172376041,40.7821019195106,40.782080999301,40.7820740337806,40.7820658177788,40.7820456213517,40.7820212890945,40.7819904835165,40.7819180789937,40.781847706125,40.7817896965917,40.7817805618635,40.7817697698042,40.7817571387903,40.7815198932185,40.7811082513607,40.7808148981236,40.7805941317424,40.7803525720467,40.7802891208356,40.7801872448046,40.7802741683168,40.7803593666495,40.7807804939543,40.781203101963,40.7818584192704,40.781819112422,40.781979495284,40.7820660545113,40.7821644100274,40.7821698859373,40.7819954203208,40.7828072099636,40.7827230742387,40.7827563539879,40.7827655343607,40.7827740237438,40.7827815814688,40.7827879932791,40.782793077404,40.782796689712,40.7827987277962,40.7827991338784,40.7828215131264,40.7828289764549,40.7828360032633,40.7828423846557,40.7828479309232,40.7828524771841,40.782855888285,40.7828580628191,40.7828589361411,40.7828584822882,40.7828867930694,40.7828950374301,40.7829025253683,40.782909054108,40.7829144468487,40.782918557553,40.7829212749014,40.7829225253072,40.7829464718299,40.7829559205995,40.7829643282805,40.7829714491281,40.7829770750098,40.7829810414889,40.7829832326306,40.7830117517103,40.7830180363387,40.7830240249902,40.7830295587699,40.7830344908517,40.7830386903741,40.7830420459124,40.7830444684352,40.7830458936663,40.7830462837904,40.7830456284566,40.7830731198721,40.7830807781939,40.7830878526371,40.7830941618698,40.7830995441738,40.7831038615901,40.7831070034549,40.7831088892358,40.7831094705966,40.783140132948,40.7831462329441,40.7831519763329,40.7831571921793,40.7831617252486,40.7831654406273,40.7831682277377,40.7831700036297,40.7831707154489,40.78317034201,40.7832003873084,40.783210988532,40.7832204238211,40.7832284213932,40.7832347508789,40.7832392299579,40.7832417296106,40.7833367268055,40.7833384357296,40.7833409960083,40.7833427039183,40.7833452653683,40.7833469721069,40.7833486800163,40.78335123928,40.7833529466881,40.7833546539273,40.7833563608231,40.7833580665454,40.7833597749592,40.783361480682,40.7833631875777,40.7833648932992,40.7833666005403,40.7833683074356,40.7833691574295,40.7833708631529,40.7833725700487,40.7833734227327,40.7833742737425,40.7833759806376,40.783376831638,40.7833776833166,40.7833785349864,40.7833793876712,40.7833802381668,40.7833810908515,40.7833810878076,40.783381938817,40.7833819357727,40.783382788456,40.7833827854124,40.7833836360762,40.7833836340464,40.7833836310019,40.7833836289722,40.783481696872,40.7834834036062,40.7834859655568,40.7834876722909,40.7834902332377,40.7834919401283,40.7834936468632,40.7834962088131,40.7834979152019,40.7834996214229,40.7835013281568,40.7835030345443,40.7835047407653,40.7835064476551,40.7835081533735,40.7835098595944,40.7835107122739,40.7835124186617,40.7835141243793,40.7835149758853,40.7835158275478,40.7835175344385,40.7835183854419,40.7835192371053,40.7835200892813,40.7835209409434,40.7835217919465,40.7835226436084,40.7835234951153,40.7835234920643,40.7835243437251,40.7835243416901,40.7835251923476,40.783525189295,40.783525187261,40.7835251842081,40.7836258131566,40.7836283734296,40.7836309345265,40.7836326412582,40.783635202201,40.7836369084172,40.7836394319568,40.7836411767475,40.7836437371737,40.7836454444089,40.7836480043318,40.7836497112179,40.7836514169313,40.7836531238159,40.7836548285091,40.7836565347241,40.7836582404361,40.7836599468193,40.783660798474,40.7836625046884,40.7836642105544,40.7836650620566,40.7836659132086,40.7836676184036,40.7836684695554,40.7836693217261,40.7836701733802,40.7836710233597,40.7836718750137,40.7836718719543,40.7836727224354,40.7836735740897,40.7836735720498,40.78367356899,40.7836744201403,40.7836744170803,40.7839097751559,40.783911482387,40.7839140433241,40.783916604765,40.7839191662055,40.783920873602,40.7839234350428,40.7839251412483,40.7839277021854,40.7839294090607,40.7839311162904,40.7839336762044,40.7839353824095,40.7839370887823,40.7839387949881,40.7839405018632,40.7839422075651,40.7839439137708,40.7839456201425,40.7839473258455,40.7839490310259,40.7839498836894,40.783951590565,40.7839524410311,40.7839541474027,40.78395499787,40.7839558495093,40.7839567016713,40.7839575533111,40.7839584032743,40.7839592559373,40.7839592528629,40.7839601033296,40.7839609549683,40.7839609518936,40.7839609498445,40.7839609467694,40.7839617974034,40.7839617943276,40.784052182325,40.7840547442647,40.7840573052013,40.7840590130978,40.7840615745355,40.7840641359726,40.7840658428438,40.7840684031094,40.7840701105033,40.7840726709143,40.7840743771152,40.7840760850117,40.7840777907092,40.7840803506168,40.7840820579903,40.784083763687,40.7840854698877,40.7840871762559,40.7840880277424,40.784089733586,40.7840914392827,40.7840922919406,40.7840939971145,40.7840948487685,40.784096553941,40.7840974060973,40.7840982565572,40.7840991081875,40.7840999603444,40.7841008119759,40.7841016619327,40.78410165885,40.784102510482,40.7841025084265,40.784103359555,40.784103356474,40.784103353391,40.7841033503086,40.784103347226,40.7841033451716,40.7841033420874,40.7841033390058,40.7841024817111,40.7841024786286,40.7841016208323,40.7841007657395,40.7841007626568,40.7840999048594,40.7840990475661,40.7840981907958,40.7840964799616,40.7840956243659,40.784094766568,40.7840930560903,40.7840921994664,40.7840904896598,40.7840896318624,40.7840879208817,40.7840862105724,40.7840845000947,40.7840827902867,40.7840810799772,40.7840793695002,40.7840776591893,40.7841347859639,40.7841373499844,40.7841399146514,40.7841416234305,40.7841441864223,40.7841467499158,40.7841493139114,40.784151023362,40.7841535868563,40.7841561503485,40.7841587123103,40.7841612758046,40.784163838269,40.7841664007334,40.7841689637242,40.7841715261887,40.7841740891556,40.7841766500884,40.7841792125528,40.7841817745146,40.7841843371219,40.784186044873,40.784188605807,40.7841911672415,40.7841937302085,40.784196291141,40.7841988530793,40.7842005594416,40.7842008474689,40.784203120876,40.7842056818079,40.7842073890337,40.7842099506121,40.7842116563047,40.7842142172365,40.7842159229296,40.7842176291245,40.7842201907023,40.7842218963953,40.7842236020868,40.7842253089525,40.7842270146453,40.7842287208393,40.784229572464,40.784231278826,40.7842329839918,40.7842338361425,40.7842355408047,40.7842363934593,40.7842372434088,40.7842389492428,40.7842398018958,40.7842406518444,40.7842415034688,40.7842415003793,40.7842423520028,40.7842432034842,40.7842432003942,40.7842440520183,40.7842440489275,40.7842440458369,40.7842440427467,40.7842440396564,40.7842440365666,40.7842440334761,40.7842440303855,40.7842431725816,40.7842431694915,40.7842423143936,40.784241456588,40.7842414534964,40.7842405956926,40.7842397390615,40.7842388822874,40.7842371702728,40.7842363141425,40.7842354578709,40.7842337465255,40.7842328902536,40.7842311794114,40.7842294684255,40.7842286106203,40.7842269008084,40.7842251904931,40.7842234795079,40.7842217696951,40.7842200598818,40.7842174941838,40.7842157843709,40.7842140740555,40.7842115115647,40.7842098012499,40.7842072365825,40.784205526769,40.7842029637756,40.7842006880375,40.7842003997796,40.7841986892971,40.7841961252985,40.784193562305,40.7841909998407,40.7841884363458,40.7841867263903,40.7841841650986,40.7841816004312,40.7841790384694,40.784176476005,40.7841739130109,40.7841713505465,40.7841687875795,40.78416622665,40.7841636641856,40.7841611022238,40.7841585402871,40.7841559783253,40.7841542704331,40.7841517089992,40.784149148069,40.7841465866363,40.7841440246989,40.7841423179793,40.7841397570485,40.7841371944428,40.784135488753,40.7841329278207,40.7841312216292,40.7841286612261,40.7841269533337,40.7841252476441,40.7841226860694,40.7841209803791,40.7841192746887,40.784117567827,40.7841158631672,40.7841141569761,40.7841133048269,40.784111600167,40.7841098933037,40.7841090416822,40.7841073359926,40.784106485543,40.7841056333935,40.7841039282311,40.7841030766086,40.7841022254892,40.7841022275504,40.7841013759291,40.7841005259814,40.7841005290723,40.7840996774492,40.7840996805404,40.7840988294197,40.7840988325096,40.7840988356005,40.7840988386902,40.7840988417815,40.7840988438411,40.7840997011417,40.7840997042316,40.784100562034,40.7841005651237,40.7841014212513,40.784102279054,40.7841031363547,40.7841039931276,40.7841048497565,40.7841057075591,40.7841065638285,40.7841082751706,40.784109131298,40.7841108422818,40.7841125520915,40.7841134098934,40.784115120877,40.7841168311897,40.7841185420287,40.7841202525082,40.7841219628216,40.7841236726309,40.7840656918014,40.7840639818484,40.7840614173268,40.7840597073759,40.7840571438824,40.7840554340737,40.7840528710847,40.7840511618018,40.7840485971356,40.7840460351737,40.7840443263954,40.7840417629019,40.7840392004374,40.784036636945,40.7840340744806,40.7840323645275,40.7840298025656,40.7840272401012,40.7840246776367,40.7840221151723,40.7840204084502,40.7840178464883,40.7840152828512,40.7840127214146,40.7840101589502,40.7840084522281,40.7840058907907,40.7840033298579,40.7840016226332,40.7839990605256,40.7839965002629,40.7839947923675,40.7839922309321,40.7839905240642,40.7839888173411,40.7839862569335,40.7839845507356,40.7839828428406,40.7839802829352,40.7839785772406,40.7839768703724,40.7839751646784,40.7839734589828,40.7839726063252,40.7839709001282,40.7839691942894,40.7839683416317,40.7839666359373,40.7839657848099,40.7839640791142,40.7839632274849,40.7839623765034,40.7839615248727,40.7839606737471,40.7839598210889,40.7839589711344,40.7839581195045,40.7839581225885,40.7839572711035,40.7839572741858,40.7839564225558,40.783956425638,40.7839564287217,40.7839564307762,40.7839564338594,40.7838677521965,40.7838651902346,40.7838634830053,40.7838609203947,40.783858358956,40.7838566522313,40.7838540912947,40.783852385092,40.7838498224813,40.783848115756,40.7838455558456,40.7838438496441,40.783841287534,40.7838395818348,40.7838378756326,40.7838361687601,40.7838344630604,40.7838327561872,40.7838310504866,40.7838293447874,40.7838276385841,40.7838267869489,40.7838250800762,40.7838242301148,40.7838225232419,40.7838216716039,40.7838208206175,40.7838199689806,40.7838191168201,40.7838182663551,40.7838174147185,40.7838165635852,40.7838157109218,40.783815713997,40.7838148640347,40.7838148671103,40.7838148701858,40.7838140185474,40.7838140205981,40.7838140236734,40.7838140267479,40.7835761138405,40.7835735517273,40.7835709902829,40.7835692830504,40.7835667221078,40.7835650142052,40.783562452762,40.7835607455281,40.7835590398183,40.7835564788776,40.783554770973,40.7835530635883,40.7835513578778,40.7835496506452,40.7835479442644,40.7835462385548,40.7835445323422,40.7835428254586,40.7835411197491,40.7835402675788,40.7835385618678,40.7835368566767,40.7835360045068,40.7835351523369,40.7835334476455,40.7835325944711,40.7835317417979,40.7835308918208,40.7835300391487,40.7835291879982,40.7835283363464,40.7835283383862,40.7835274884087,40.7835274914686,40.783526638796,40.7835266418571,40.7835266449168,40.7835257927454,40.7835257958055,40.7834302920782,40.7834285843268,40.783426022881,40.7834243149741,40.7834226082416,40.7834208993175,40.7834191925856,40.7834174853485,40.7834157779453,40.7834140722308,40.7834123649945,40.7834106570892,40.7834089503546,40.7834072434676,40.783405536735,40.7834046840572,40.7834029773238,40.7834012711061,40.7834004189308,40.7833987115401,40.7833978595207,40.7833970068435,40.7833952999547,40.7833944489531,40.7833935962752,40.7833927447697,40.7833918925952,40.7833910404204,40.7833901877421,40.7833893367404,40.7833884850804,40.7833884871153,40.7833876356109,40.7833876376463,40.7833867859855,40.7833867880221,40.7833867900568,40.7833859378818,40.7833859409328,40.7833859429685,40.7833859450032,40.783287882832,40.783286176097,40.78328446936,40.783281907409,40.7832801995007,40.7832784917492,40.7832767848565,40.7832750781214,40.7832725171755,40.783270810439,40.7832691032013,40.783267395806,40.7832656878962,40.78326483689,40.7832631289808,40.7832614232612,40.7832597175402,40.7832588648585,40.7832571569487,40.7832554507256,40.7832545997192,40.7832537470361,40.7832520401422,40.7832511891363,40.7832503364544,40.7832494842743,40.7832486337791,40.7832477815982,40.7832469289154,40.783246077908,40.7832452262404,40.7832452282714,40.7832443755879,40.7832435250927,40.7832435271236,40.7832435301677,40.7832426774852,40.7832426795147,40.7832426825598,40.7832426845904,40.7831572018052,40.7831546582469,40.783151035274,40.7831464288721,40.7831409610814,40.7831347767635,40.783128039763,40.7831209285673,40.7831136315775,40.7831063421167,40.7831065143863,40.7831062055301,40.7831054249072,40.7831041961724,40.7831025565592,40.7831005557516,40.7830982543788,40.7830957221776,40.7830930358798,40.7830902768863,40.7830916480729,40.7830916431729,40.7830902623259,40.7830875449316,40.7830835685248,40.7830784465636,40.783072325192,40.7830653790698,40.7830578063894,40.7830498232204,40.7830416573447,40.7830335417574,40.7830342141582,40.7830345061134,40.7830344091684,40.7830339261306,40.7830330709882,40.7830318685046,40.783030353502,40.7830285698527,40.7830265692084,40.7830244095048,40.7830221532836,40.7830198658816,40.7830210529763,40.783020922568,40.7830194782084,40.7830167592378,40.783012839713,40.7830078263901,40.7830018558175,40.782995090616,40.7829877150495,40.7829799300068,40.782971947529,40.7829639850353,40.7829458710968,40.7829465288193,40.78294575252,40.7829435631848,40.7829400199977,40.7829352187416,40.7829292892086,40.7829223916914,40.7829147126501,40.7829064596717,40.7828978558582,40.7828891337957,40.7828880275271,40.782886417817,40.7828843400782,40.7828818400199,40.7828789726423,40.7828758010261,40.7828703328313,40.7828723529492,40.7828731445115,40.7828726842147,40.7828709856099,40.7828680987032,40.7828641084838,40.782859132422,40.7828533170106,40.7828468334527,40.7828398726211,40.7828326394391,40.7828253468482,40.7828182095384,40.7828174961035,40.7828162332781,40.7828144509011,40.7828121910881,40.7828095072353,40.782806462759,40.7828031295962,40.7827995865052,40.7827967168999,40.782793811363,40.7827909121037,40.7827923769492,40.7827924470797,40.782791120822,40.782788429817,40.7827844382647,40.7827792413927,40.7827199708044,40.7822535924943,40.7817177710163,40.7816576571335,40.78166394584,40.7817226869596,40.7817292382265,40.7822698091908,40.7822531589814,40.7817346547735,40.7817170967076,40.7816920153175,40.7817081101756,40.7816715658941,40.7816756057517,40.7816558547445,40.7816492654844,40.781626273911,40.781595651496,40.7815855663113,40.7815412492548,40.7815530729708,40.7815636865223,40.7815727903174,40.7815801273806,40.7815909328328,40.7816008664813,40.7816097101899,40.7816172697569,40.781623379179,40.781644994973,40.781666239517,40.7816864690752,40.781705070667,40.7817214806404,40.7817352017521,40.7817458182341,40.7817530083932,40.781761208572,40.7817688727072,40.7817757928249,40.7817817811409,40.7817866751561,40.7817903420666,40.7817926823669,40.7818130142095,40.7818322209178,40.7818497326873,40.7818650299965,40.7818776590197,40.7818872450916,40.7818935038217,40.7819021525235,40.7819104223285,40.7819181052907,40.7819250082202,40.781930957541,40.7819358036561,40.7819394247086,40.7819417296461,40.7819618240189,40.7819807861312,40.7819981896728,40.7820136433733,40.7820267997989,40.7820373631632,40.7820450959781,40.7820531234857,40.7820608340575,40.7820680042461,40.7820744262638,40.7820799140047,40.7820843084373,40.7820874822137,40.7820893433597,40.7821090981059,40.7821277465665,40.7821447736393,40.7821597090071,40.782172140129,40.7821817236355,40.7821881948132,40.7821995325474,40.7822100402741,40.7822194647452,40.7822275788204,40.782234186941,40.7822391298438,40.7822569409151,40.7822738541986,40.7822894285774,40.7823032578541,40.7823149813454,40.7823242932891,40.782330950819,40.7823347802988,40.7823426053488,40.7823502209624,40.7823574229561,40.7823640182359,40.7823698299743,40.7823747023517,40.7823785047336,40.7823811351737,40.7823825231465,40.7824008524804,40.7824180884099,40.7824337241294,40.7824472998856,40.7824584164962,40.7824667470877,40.7824720467065,40.7824741595222,40.7824730234095,40.7824686717745,40.7824612325733,40.7824509245488,40.7824380507988,40.782422989864,40.7824244429928,40.7824245233791,40.7824232291378,40.7824205906182,40.7824166696924,40.7824115583042,40.7824053763131,40.7823982686837,40.7824009200656,40.7824006544732,40.7823974788621,40.7823914763978,40.7823828042783,40.7823716896166,40.782358423493,40.782343353332,40.7823268738034,40.7823094164866,40.7823064018013,40.7823018888178,40.7822960038896,40.7822889117816,40.7822808110567,40.782271928517,40.7822641057377,40.7822524661711,40.782237345723,40.7822191807537,40.7821984954845,40.7821758868696,40.7821744117371,40.7821719011388,40.782168419705,40.7821640570587,40.7821589255075,40.7821531571533,40.782146900491,40.7821403165861,40.7821350106263,40.7821263830711,40.7821146920984,40.7821002875585,40.7820836005041,40.7820651302916,40.7820454296374,40.7820456351824,40.7820447309683,40.7820427408084,40.7820397171158,40.7820357395223,40.7820309127821,40.7820253640121,40.7820192393448,40.7820127000794,40.7820059184339,40.7819990730097,40.781999861872,40.7819983955219,40.7819947104497,40.781988898359,40.7819811038842,40.7819715209919,40.7819603881534,40.7819479824104,40.781934612481,40.7819206110766,40.7819002808308,40.7818764330712,40.7818698262456,40.7818603770672,40.7818482897072,40.7824660415738,40.7825343504886,40.7829132149827,40.7829657066848,40.7825408426915,40.7821947815307,40.7821422860273,40.7822580658053,40.7824317265032,40.7824107995637,40.7817980235622,40.7817797192584,40.7817766177032,40.7817721417665,40.7817664152622,40.7817595965972,40.7817518743901,40.781743462253,40.7817384165366,40.7817299919599,40.7817184256857,40.7817040433197,40.7816872497439,40.7816685177189,40.7816483745744,40.7816422346831,40.7816338347736,40.7816233999105,40.7816112096827,40.7816052557874,40.7815966371554,40.7815855559745,40.7815722722023,40.7815570974673,40.781540387759,40.7815225350758,40.7815184127877,40.7815127799254,40.781505757681,40.7814974971392,40.7814881760273,40.7814779948904,40.7814728319313,40.7814648307299,40.7814541801194,40.7814411314608,40.7814259927101,40.7814091211508,40.7813909149612,40.7813878835019,40.781383549446,40.7813780167509,40.7813714181245,40.7813639118426,40.7813556779515,40.7813471834275,40.7813348868921,40.7813191233317,40.7813003221828,40.7813707510488,40.7813581916557,40.7813951792091,40.7813736503221,40.7812547522979,40.7812439935277,40.7812319234787,40.7812189036229,40.7812053238765,40.7812050943529,40.7812024025733,40.7811973184792,40.7811899741718,40.7811805604802,40.7811693220027,40.7811565507513,40.7811425785644,40.7811277684842,40.7811125053238,40.7811134282587,40.7811134301702,40.7811125110007,40.7811106984283,40.7811080470329,40.7811046366534,40.7811005699829,40.7810959694766,40.7810909736648,40.7810857329809,40.781080405232,40.7810751508469,40.7810747794766,40.7810719060851,40.781066607523,40.7810590255039,40.7810493628135,40.7810378778865,40.7810248778943,40.7810107105294,40.7809957547061,40.7809804104263,40.7809669558761,40.7809536667006,40.78094087137,40.7809288861475,40.7808926841164,40.780901419761,40.780907446138,40.7809105881145,40.7809107543811,40.780907940106,40.7809022270752,40.7808937813154,40.7808828482697,40.780869745664,40.7808548542739,40.7808386068586,40.7808214755846,40.7808039583037,40.7807865640852,40.7807697984216,40.7807666150957,40.7807625225033,40.7807576435743,40.7807521248576,40.7807461321198,40.7807398453655,40.7807334534307,40.7807271483107,40.7807211193931,40.780715547769,40.7807085969404,40.780696824524,40.7806830082004,40.7806675301453,40.7806508184995,40.7806333355259,40.780615564823,40.7805979979478,40.7805811208187,40.7805654002746,40.7805512711621,40.7805391243065,40.7805292957019,40.780522057217,40.7805089203533,40.7804964371654,40.7804835551032,40.7804720555873,40.780462196532,40.7804446725114,40.780427574667,40.7804113597616,40.78039646097,40.7803832763076,40.780372157997,40.7803634030591,40.7803572453781,40.7803538494537,40.7803487393235,40.7803433436792,40.7803378205724,40.7803323317885,40.7803270381074,40.7803220945939,40.7803176460556,40.7803138228009,40.7803107368222,40.7803084785153,40.7803071140315,40.7803066833397,40.780307199056,40.7803086460738,40.7802903670559,40.7802727780973,40.7802563503657,40.7802415239221,40.7802286959321,40.7802182100273,40.7802103471005,40.7802053177805,40.7801970025639,40.7801888979995,40.7801812142133,40.7801741504215,40.7801678897663,40.7801625945664,40.7801584021098,40.7801554210935,40.7801537288057,40.780133795168,40.7801149049577,40.7800975226389,40.7800820755997,40.7800689436444,40.7800584496548,40.7800508516516,40.7800422267075,40.780034377403,40.7800274668613,40.7800216386966,40.7800177330085,40.7800147016058,40.7800125873637,40.7800030726554,40.7799936523649,40.7799759689011,40.7799594550567,40.7799446083531,40.7799318760848,40.7799216418432,40.7799142139603,40.7799074284637,40.7799031912418,40.7798988882171,40.7798946496856,40.7798906039905,40.7798844290687,40.7798788074543,40.7798738547224,40.7798696726965,40.779867452147,40.7798658391036,40.7798648658141,40.7798645517362,40.779864903149,40.7798420608318,40.7798311879623,40.7798207491949,40.7798109952518,40.7798021604065,40.7797944568575,40.7797880696311,40.7797831521378,40.7797798224875,40.7797705195885,40.7797417868495,40.7797021126964,40.7796744120368,40.7795755957472,40.7795518342715,40.7795146526437,40.7795280935235,40.7795390119236,40.7795471162329,40.7795521899995,40.779554097712,40.7795527884187,40.7795482970886,40.7795407436772,40.779531644327,40.779527353468,40.7795279158617,40.7795333256412,40.7795435263729,40.7795885736286,40.7794925389073,40.7790978666683,40.778915764469,40.7785632878871,40.7777218134874,40.7774046289891,40.7773646943,40.7772045230289,40.777159074851,40.7781536132297,40.7762470243255,40.7757348317729,40.775233454495,40.7747348382503,40.7742260143936,40.7741222976583,40.774027592863,40.7739430191483,40.7738694852488,40.7738076612117,40.7734651438648,40.7733195299268,40.7732376050299,40.7730684109404,40.7730603721408,40.7730497637638,40.7730367406239,40.773021492612,40.7730042423989,40.7729852417294,40.7729267175712,40.7709162384816,40.7690915232463,40.7689775966221,40.7689181792537,40.7689011951585,40.76889404946,40.7688578407815,40.7688076442263,40.768744806519,40.7686718716451,40.7685922895697,40.7685098733129,40.7684794043916,40.7684282567008,40.7682641924714,40.7672020782521,40.7669144343695,40.7668385980515,40.7668232966881,40.7666977132982,40.7665953489592,40.7665207283635,40.7663451977956,40.7663252110565,40.7662753380706,40.7662270800494,40.7661565361589,40.7660746541344,40.7660506352475,40.7660441321068,40.7660219066069,40.7660039817046,40.7659896840764,40.7659734302094,40.7659509300008,40.7661464712329,40.7660112428674,40.7659197148497,40.7658150860978,40.7657093546072,40.7656009250014,40.7651348860289,40.7646683206375,40.7646658020983,40.764453154023,40.7643465381524,40.7643313277878,40.764197362231,40.7641123010953,40.7640855986402,40.763947245818,40.7638279680662,40.7636284736151,40.7635431100379,40.763473754705,40.7633327472138,40.7631500832703,40.7627422587513,40.7622753976174,40.7619711397983,40.7619022822687,40.7617467386605,40.7610445056276,40.7610203491476,40.7605144868544,40.759921017874,40.7593280164121,40.7588088390255,40.7586878666643,40.7585642208499,40.7584381652174,40.758309968538,40.7581799040557,40.7580482491626,40.7579152845691,40.7577812937762,40.7576986779708,40.7576156605612,40.7575323778181,40.7574489665315,40.7573655635305,40.7572823057171,40.7569311081173,40.7565418668171,40.7562390969562,40.75553507451,40.755306291324,40.7548227824764,40.7547663301672,40.7547109860182,40.7546569872434,40.754604565796,40.754405942652,40.7543748224688,40.7543479597446,40.7543259728658,40.7543093679749,40.7542985273195,40.7542937004537,40.7542400026781,40.7541701124326,40.7541615224451,40.7541536704362,40.754106218947,40.7540635323673,40.7539913147834,40.7539022110865,40.7538010119785,40.753763037953,40.7537083825432,40.7536113241357,40.753505277894,40.7534038487453,40.7533788762879,40.7533079423502,40.753284848735,40.753222284605,40.7531624245448,40.7529765234734,40.7529950763249,40.7526768150166,40.7516386798306,40.7510645887011,40.7509670521758,40.7508456259457,40.7502344982949,40.7499439122082,40.7498108010836,40.7497508278526,40.7504680069492,40.7509726094671,40.7513715516221,40.7515764796352,40.7516433456615,40.7515130743283,40.751152455671,40.750269645274,40.7494119331534,40.7484714113581,40.7483945519164,40.7489164399634,40.7490147471783,40.7491983147121,40.7492460641682,40.7493937359716,40.7494677129278,40.7495204983681,40.7496337966918,40.7496922815123,40.7497510932775,40.7498974782205,40.7499720872667,40.7502587994197,40.7506060198224,40.7508606171018,40.750967100744,40.7510225312797,40.7510793920614,40.7513278799854,40.7516279845761,40.751670283674,40.7518912083212,40.7519592388872,40.7520369517853,40.7525301225546,40.7526266199747,40.7537146046939,40.7544853006744,40.7548904187012,40.7546785623059,40.7546006186048,40.7545564576391,40.7545236203242,40.7552636801144,40.755307969156,40.7553522593585,40.7554363228332,40.7573289458975,40.7589891928021,40.7612926066103,40.7614495671211,40.7614881570567,40.7628565470092,40.7628788404266,40.7629300855996,40.7644990407438,40.7666160876577,40.7669180047697,40.7675304693006,40.7676533754849,40.7679880059393,40.7680587443543,40.7681597018796,40.7679581867197,40.7686997443567,40.7687154003242,40.7685575534322,40.7686190518226,40.768722323496,40.7687849340179,40.7689515585891,40.7689039474785,40.7691330546909,40.7692526090742,40.7694748845173,40.7695161146545,40.7693672298666,40.769679325463,40.7700418628895,40.7704253380226,40.7705419560584,40.7711623948666,40.7711640209328,40.7711640531773,40.7712706411867,40.7711767751034,40.7713065232185,40.7713829129692,40.7713542785531,40.7713729435195,40.7714402360901,40.7714201353098,40.7713957931923,40.7713230682004,40.7714623623334,40.7715769580733,40.7716995868986,40.7717341388899,40.7718336971222,40.7719536868249,40.7719187775339,40.7719312776845,40.7719659736767,40.7721058016265,40.7725314951252,40.773562894648,40.7740875689731,40.7750856853833,40.7758664865388,40.7758932049977,40.7769214560605,40.7771843220771,40.7772116846242,40.7775391032864,40.7779442337282,40.778076335377,40.7780859221373,40.778100454236,40.7779426059905,40.7779223882754,40.7779939503176,40.778034767118,40.7780219742329,40.7778808250306,40.7778706066023,40.7774418968095,40.7772605943982,40.7769737061773,40.7765909027496,40.7762216313997,40.7764674170589,40.776592675101,40.7767905290651,40.7768989753244,40.778241775185,40.7783859062631,40.7784053708384,40.7784308118335,40.7784588513262,40.7786256045095,40.7791011937655,40.7802483931253,40.7804410076197,40.780564785728,40.780851874637,40.7817676915065,40.7826350685365,40.7833676460045,40.7837541576979,40.7839329661142,40.784075951913,40.7841420011984,40.7841934843715,40.7845520631794,40.7851913924874,40.7861075785781,40.786063929411,40.7861163480868,40.7861922171446,40.7864296311664,40.7878562095634,40.7893763296344,40.789274302943,40.7890039750443,40.7891792794636,40.7893386543155,40.789401797221,40.7895218149901,40.7896808844584,40.7895726381073,40.7897439358006,40.7897550432539,40.7900406844603,40.7904652072798,40.7909454937819,40.7903751086532,40.7901811752081]}],[{"lng":[-73.8888514849633,-73.8886002186996,-73.8885856250733,-73.8882134885128,-73.888214152828,-73.888252307444,-73.8883725138001,-73.8883925051978,-73.8882335331365,-73.8879442060369,-73.8876694070563,-73.8875596758065,-73.8874545116094,-73.88744413439,-73.8873438076439,-73.8872856801372,-73.8872316184664,-73.8871867416842,-73.8871326442625,-73.8870765596119,-73.8870335290872,-73.8869905746845,-73.8869375685869,-73.8868262842497,-73.8867799273808,-73.8867307113903,-73.8867212364683,-73.8867012234745,-73.8866822442603,-73.8866510852459,-73.8866044094481,-73.8865364521879,-73.8864857106123,-73.8864619351758,-73.8864476279963,-73.8863934444025,-73.886318371255,-73.8862868005625,-73.8861860564581,-73.8860911272631,-73.8859892188933,-73.8858667545629,-73.885708795864,-73.8855721856571,-73.8854196281805,-73.8853600288644,-73.8853135820616,-73.8852689737819,-73.8852237547495,-73.8851103826709,-73.8850048675163,-73.8848710637576,-73.8847928832058,-73.8847036686671,-73.8846581267036,-73.884575921461,-73.8845045096316,-73.8844628893859,-73.884369382495,-73.8842857665439,-73.8842449870843,-73.88422937028,-73.8842161947253,-73.8841566572552,-73.8840803683776,-73.884032207768,-73.8840098560474,-73.8839800130903,-73.8839509319806,-73.8839171820604,-73.883880383168,-73.8838416029745,-73.8837574159016,-73.8837160236464,-73.8836860650272,-73.883659169528,-73.8836472632472,-73.8836360203243,-73.8836349187715,-73.8836337101802,-73.8836311371671,-73.8836286604531,-73.8836265145038,-73.883625660596,-73.883624936715,-73.8836243435039,-73.883623891814,-73.8836235824943,-73.8836234751105,-73.8836234160023,-73.883623391077,-73.8836233906049,-73.8836234384093,-73.8836235203805,-73.8836308254807,-73.8836411830521,-73.8836612081003,-73.8836857071501,-73.8836917781396,-73.8837213644677,-73.8837292349441,-73.8837313642581,-73.88373228479,-73.8837317928876,-73.8837290864998,-73.8837255258266,-73.8837231954967,-73.883720416197,-73.8837143389532,-73.8837068400431,-73.8836979918817,-73.8836879120701,-73.8836812489722,-73.8836744801572,-73.8836679266944,-73.8836647867828,-73.8836617526162,-73.8836551675666,-73.883648285868,-73.8836329499512,-73.8836256806789,-73.8836181881654,-73.8836004480683,-73.8835774570534,-73.8835487025507,-73.8835213233842,-73.8834905944925,-73.8834377822944,-73.8834103032276,-73.883386374229,-73.8833475098466,-73.8833262262476,-73.8832660048737,-73.8832462436026,-73.8832205255059,-73.8832039430375,-73.8831890372567,-73.8831747335755,-73.8831640628853,-73.8831607945317,-73.8831435822139,-73.88309890771,-73.8829831164623,-73.8829456522901,-73.8828915622347,-73.8828337519772,-73.8828168534381,-73.8828026938237,-73.8827338115199,-73.8826473633497,-73.8825658921806,-73.882515481785,-73.8824564733353,-73.8824118949776,-73.8823775052785,-73.8822824615299,-73.8821854641587,-73.8820963368747,-73.8820730731555,-73.8820244782196,-73.8820040562147,-73.8818964024407,-73.8817971970085,-73.8817083528726,-73.8816605441722,-73.8815938115787,-73.8815390308783,-73.8814862004522,-73.8813813795306,-73.8813650271248,-73.8813087004394,-73.8812896725965,-73.8812727694314,-73.8811967614241,-73.8811036978254,-73.8810641428739,-73.8809770547894,-73.8808768580412,-73.8808401956072,-73.8807589295205,-73.8807225522405,-73.8806622449004,-73.8806128208904,-73.8805007720726,-73.8803803154631,-73.8803118847249,-73.8802354287385,-73.8800988143836,-73.8799870012922,-73.8799150846438,-73.8799144915531,-73.8798539645331,-73.8798049337702,-73.8797574582117,-73.8796747829879,-73.8795627221195,-73.8794600109614,-73.8793489373913,-73.8792044653217,-73.8790765980677,-73.8789935276618,-73.8788725271316,-73.8787466223479,-73.8786466372611,-73.878526859206,-73.8784723387384,-73.8784128119519,-73.8783743781276,-73.8783437027596,-73.8782496060608,-73.8782078718625,-73.8781898904401,-73.8781774587459,-73.8781630235292,-73.8781183147596,-73.8780418488098,-73.8780107168279,-73.8779752321678,-73.8779324351778,-73.8778942239403,-73.8777807252501,-73.8776219539544,-73.8775398020265,-73.8774471559982,-73.877334990618,-73.877265712066,-73.87715743689,-73.8770547451278,-73.8769590242371,-73.8769034141704,-73.8768533497297,-73.8768323927182,-73.8767854325192,-73.8767632583534,-73.876671493771,-73.8765777105675,-73.8765338290845,-73.8764934794008,-73.8764025505538,-73.8763654184664,-73.8763314732659,-73.8763175576235,-73.8762875190691,-73.8762793669934,-73.8762714716073,-73.8762450970565,-73.8762061907145,-73.8761438592494,-73.8761220260555,-73.8760961849141,-73.8760623501444,-73.8760478671672,-73.8760153225427,-73.8759974417483,-73.8759660259803,-73.8759174880815,-73.8758640771574,-73.8758448384829,-73.8758307548566,-73.8758168156148,-73.8758027271105,-73.8757870333305,-73.8757583087014,-73.8757483643047,-73.8757250017996,-73.8756960498014,-73.8756127945004,-73.8755789686585,-73.8755527591729,-73.8755304232711,-73.8755123273792,-73.8754712314494,-73.8754496981089,-73.8754320366553,-73.8753857640649,-73.8753065953437,-73.8752235410315,-73.8751279512566,-73.8750739587247,-73.8749835645341,-73.8749177175302,-73.8748526790569,-73.8748108133885,-73.8747106405434,-73.8746675914925,-73.8746326900661,-73.8745444688067,-73.8744931852396,-73.8744099810372,-73.8742932600669,-73.8742000330936,-73.874175268897,-73.8741531405489,-73.8741321335034,-73.8741119395682,-73.8740706443469,-73.8740175592282,-73.8739274261848,-73.8738851008292,-73.8738685193682,-73.8736197824648,-73.8735108138788,-73.8734378359468,-73.8733713411227,-73.8733590410694,-73.8733444877876,-73.8732952422044,-73.873278401106,-73.8732001761461,-73.8731460894712,-73.8730973477861,-73.8730353749121,-73.8729728485607,-73.8729272419176,-73.8728845744567,-73.8728426936107,-73.8727389679844,-73.8726470660465,-73.8725699039412,-73.8724612160387,-73.8723560250365,-73.8722629891167,-73.8722238667179,-73.8722187897106,-73.8721639987197,-73.8720839064242,-73.8719736724586,-73.8718453860336,-73.8717502050608,-73.8717109479833,-73.871682106399,-73.871607735689,-73.8715342242941,-73.8714377374737,-73.8713615151798,-73.8713436634688,-73.8713252263044,-73.8712678245551,-73.8712309216777,-73.871211541435,-73.8712039443943,-73.8711972404663,-73.8711833651614,-73.8711550062931,-73.871146074844,-73.8711340950593,-73.8711029163764,-73.8710721594182,-73.8710515800514,-73.8710284267798,-73.8710183958015,-73.8710158705442,-73.8710149184942,-73.8710141149966,-73.8710137812168,-73.8710136470027,-73.8710112791872,-73.8710034438594,-73.870984741466,-73.8709833394094,-73.8709726372719,-73.8709474632621,-73.870961397417,-73.8709561378078,-73.8709425834217,-73.8709207647752,-73.8708907309606,-73.8708525495345,-73.8708013219701,-73.8707904502522,-73.8707857397777,-73.8707872827458,-73.8707950489431,-73.8708088863356,-73.8710731674445,-73.8712253879116,-73.8713739875909,-73.8714875214704,-73.8716306537346,-73.87187562145,-73.8721057232918,-73.8722480611034,-73.872265189976,-73.872472986793,-73.8726845432793,-73.8727884706952,-73.8728719590387,-73.8728283978369,-73.8728226286446,-73.8727740600667,-73.8728092001611,-73.8728535000933,-73.8728404791595,-73.8728849698365,-73.872981211824,-73.8730876168893,-73.8732023438031,-73.8732857634665,-73.8733546108221,-73.8734276328681,-73.8735145252486,-73.8736894273373,-73.8738639956842,-73.8740379995199,-73.8742112088209,-73.8743566226382,-73.8745968436572,-73.874838013158,-73.8750798879855,-73.8753222242727,-73.8755647776872,-73.8758073036773,-73.8760495577191,-73.8762912955629,-73.8765322734802,-73.876772248509,-73.8783068005765,-73.8852218678352,-73.8853744221112,-73.8857442214316,-73.885962001819,-73.8861295553837,-73.8863172617217,-73.8865928277027,-73.8869219978638,-73.8871531641876,-73.8872778341865,-73.8877012637253,-73.8883072573235,-73.8885654196711,-73.8890521244328,-73.8894046080708,-73.8895225482992,-73.8896109710906,-73.8897972402007,-73.8898704974421,-73.8898848219704,-73.8901268497077,-73.8903013549902,-73.8905697157506,-73.8907999990983,-73.8909195296391,-73.8911564956423,-73.8914045286984,-73.8916058711545,-73.8917701660342,-73.8919744892707,-73.8921043384419,-73.8921818298494,-73.8928228361094,-73.8926180516649,-73.8917928968658,-73.8914641257184,-73.8913856650629,-73.8913115886879,-73.891268610532,-73.8907313902833,-73.890746678608,-73.8907276326388,-73.8908090315657,-73.8908253533698,-73.89087421679,-73.8908034689184,-73.8907573272039,-73.8907872598436,-73.8907140171138,-73.8906895264545,-73.8906732290771,-73.8906214826654,-73.8906757267916,-73.8906893262691,-73.8908304216948,-73.8907950512707,-73.8906512320207,-73.8906593963295,-73.8906078582426,-73.8901691636863,-73.8901189440267,-73.8900834406639,-73.8900464771062,-73.8900036226347,-73.8897656404153,-73.8896119235331,-73.8893651005021,-73.889212838981,-73.8891492529363,-73.8890633951894,-73.8888616219392,-73.8887110536349,-73.8885622460055,-73.8884600438522,-73.8883524809828,-73.8883109722438,-73.8885138927113,-73.8884606409117,-73.8885620458757,-73.8885087325003,-73.8883928254521,-73.8885128537161,-73.8886128899704,-73.888614059014,-73.8889965422284,-73.8889770898015,-73.8888369162904,-73.8888514849633],"lat":[40.7987063289588,40.7986509854162,40.7987060722971,40.7986653046386,40.798663795715,40.7985771803983,40.7985874557538,40.7985662967674,40.798242884286,40.7983433366838,40.7983810501545,40.7983687324371,40.7983536545766,40.7983519333435,40.7983353290942,40.7983243586845,40.798312265785,40.7982996504603,40.7982811019025,40.798259920727,40.7982414818036,40.7982208091599,40.7981938231771,40.7981342087445,40.79810681476,40.7980748803643,40.7980718902804,40.7980643247813,40.7980553999917,40.7980381967,40.7980103346008,40.7979686372546,40.7979348271491,40.7979169020079,40.7979061182327,40.7978612554141,40.797796075306,40.7977700285322,40.7976931523773,40.7976185699367,40.7975435655545,40.7974539710757,40.7973392977896,40.7972410974449,40.7971354883719,40.7970924932774,40.7970565256805,40.7970191556996,40.7969788219097,40.7968741078222,40.7967753526203,40.79664615908,40.7965763104586,40.7964950320703,40.7964571295255,40.7963924445407,40.7963355702796,40.7963039569595,40.7962385858731,40.796181769927,40.7961510127544,40.7961368507492,40.796122879995,40.7960515186488,40.7959583928208,40.7959003163648,40.7958753947875,40.7958454861496,40.7958198831633,40.7957950219595,40.795771625529,40.795750019441,40.7957085654198,40.7956898392594,40.7956783091039,40.7956707356247,40.7956687424547,40.7956678484153,40.795667865396,40.7956679548069,40.7956683753777,40.7956690662636,40.7956699467867,40.7956704141573,40.7956708992492,40.7956714124498,40.7956719252906,40.7956724563679,40.79567272631,40.7956729963008,40.7956732576148,40.7956735276647,40.7956737972609,40.7956740673941,40.7956913199708,40.7957106730427,40.7957445423725,40.7957885124484,40.7957994053605,40.7958541128894,40.7958731846821,40.7958823367156,40.7958911806238,40.7959081541052,40.7959242255754,40.7959346678433,40.7959388797538,40.7959425511104,40.7959484790533,40.7959540636428,40.7959592411247,40.7959639496331,40.7959663023326,40.7959678446063,40.7959685126158,40.7959685094468,40.7959682912822,40.7959672300652,40.7959655038088,40.7959598599867,40.7959563942596,40.7959521367507,40.7959399893504,40.7959209649321,40.7958924537712,40.7958623037546,40.795824460776,40.7957496930304,40.7957168603062,40.7956927652556,40.7956583092379,40.7956394314056,40.795587276491,40.7955719480321,40.7955548481551,40.7955449974623,40.7955375090625,40.7955318568436,40.7955288558722,40.7955279440706,40.7955250446874,40.7955201368033,40.7955005597605,40.7954923627452,40.7954784853057,40.7954639376443,40.7954579945999,40.7954512989673,40.7954123624136,40.7953638370584,40.7953217541962,40.7952972994424,40.7952700988732,40.7952509439822,40.795239463913,40.7952139819717,40.7951876152651,40.795159861043,40.7951553073649,40.7951495842311,40.7951462312521,40.7951227891024,40.7950981764744,40.7950787063593,40.795070831516,40.7950628383747,40.7950578751088,40.7950553439417,40.7950572985187,40.7950576055152,40.7950560346076,40.7950542508052,40.7950515313826,40.7950358926616,40.7950171287075,40.7950115325983,40.7950037975257,40.7949913113974,40.7949851330353,40.7949685152684,40.7949620302579,40.7949531610384,40.7949472295571,40.7949361624945,40.7949231428036,40.7949177233587,40.7949144562739,40.7949115936349,40.794908020052,40.7949043160522,40.7949042616588,40.7948988490034,40.7948922511704,40.7948836836707,40.7948664965961,40.7948423901276,40.7948185725925,40.7947926213238,40.7947582777922,40.7947282744867,40.7947065296568,40.794673606334,40.7946394442373,40.7946088390497,40.7945740792345,40.7945567145733,40.7945357781626,40.7945208067673,40.7945066374499,40.7944568573403,40.7944325618064,40.7944231959068,40.7944179869757,40.794413145486,40.7944015532226,40.7943843722102,40.7943742989806,40.7943597900945,40.7943397169793,40.7943192448031,40.7942533331939,40.7941604762444,40.7941113664394,40.7940596955175,40.7939972977185,40.7939634917727,40.79390651001,40.7938531444355,40.7938053701594,40.7937754584675,40.7937449592997,40.7937301955297,40.7936932248014,40.7936772537038,40.793617100794,40.7935531914097,40.7935239854831,40.7935007009835,40.793456910602,40.7934365285307,40.7934163215802,40.7934064365676,40.7933816320468,40.7933759049921,40.7933711870491,40.793358479758,40.7933427869377,40.7933212424085,40.7933127822093,40.7932995259746,40.7932775081157,40.793266686497,40.7932394918081,40.7932272085562,40.7932104247476,40.7931880315134,40.7931673159684,40.7931585072103,40.7931501172873,40.7931398364938,40.7931274485734,40.7931116993712,40.7930755225069,40.7930645350341,40.7930435011827,40.7930211102078,40.792967801154,40.7929411819143,40.7929161556767,40.7928907823158,40.7928672589876,40.7928063677674,40.7927771503866,40.7927554386297,40.792706833777,40.7926289898254,40.7925507266519,40.7924651839338,40.7924207754718,40.7923515552186,40.7923034784236,40.7922607239069,40.7922374009807,40.7921897357453,40.7921666540568,40.7921449683235,40.7920870781408,40.7920574505892,40.7920153600434,40.7919530618448,40.7919043783161,40.791892455653,40.7918835622058,40.7918771181925,40.7918730262799,40.7918680373316,40.7918637831472,40.7918586590027,40.7918533812202,40.7918499140662,40.7917728182097,40.7917253607344,40.7916830386319,40.7916462070417,40.7916409796396,40.7916364793325,40.7916259880492,40.7916216289553,40.7915974189541,40.7915783587258,40.791558187299,40.7915296270255,40.7914995900437,40.7914762611335,40.7914521082072,40.7914255868233,40.7913535855846,40.7912941407695,40.7912478067888,40.7911806617287,40.7911198872352,40.7910656827201,40.7910401731709,40.7910368617665,40.7909957211358,40.7909328305738,40.790845017753,40.7907369770191,40.7906585095297,40.7906240759187,40.7905947047772,40.7905079938006,40.7904246339027,40.7903236874941,40.7902454307972,40.7902248885223,40.7902012835638,40.7901199214569,40.7900687327546,40.7900361217372,40.790019084973,40.7899998966741,40.7899453196899,40.7898195237432,40.7897881578825,40.7897460731927,40.7896636425212,40.7895649404125,40.7895036828738,40.7894316889372,40.7893925784799,40.7893752590663,40.78935891373,40.7892721489647,40.7892305455251,40.7892140391068,40.7891944148881,40.7891658598069,40.7891081533766,40.7891038288166,40.7890571349039,40.7889537543245,40.7888652884176,40.7887321814071,40.7885994134662,40.7884672830271,40.7883360870877,40.7882061205436,40.788063241919,40.7880302688341,40.7879964652033,40.7879624927414,40.7879290164667,40.7878966916838,40.7875748407528,40.7874454171815,40.7872709148275,40.7870525659711,40.7867979053405,40.7866235089541,40.7864688171369,40.786428740437,40.7864239182748,40.7863030072831,40.7861539269909,40.7860779763532,40.7859750278048,40.7859544617384,40.7859639746669,40.7859419214596,40.7859031091,40.7859256511131,40.7859431228791,40.785962633216,40.7858944524644,40.7858549527834,40.7858249698961,40.7858123836602,40.7857886888255,40.7857618294568,40.7857500911973,40.7857546522742,40.7857640431733,40.7857782514804,40.7857972584129,40.7858069961376,40.7858326013978,40.7858523970728,40.7858663632041,40.7858744857105,40.7858767564026,40.785873172991,40.7858637390887,40.7858484642072,40.7858273637472,40.7858004589829,40.7853566205085,40.7866304871955,40.786669126296,40.7866772918074,40.7867525194849,40.7867079937548,40.7867328701192,40.7867381754127,40.7867331142543,40.7868261820293,40.7868066737514,40.7868722745733,40.7870063442837,40.7871609498357,40.7873725597555,40.7877912800746,40.7880588246978,40.7881999910089,40.7886523921892,40.7888954979849,40.7890099659352,40.7896362794905,40.7898767268322,40.7901076362129,40.7902075761985,40.7902255542779,40.7901738557051,40.7901939193001,40.7901607004506,40.790222043772,40.7902362742416,40.7903233369396,40.790394269609,40.7928170819515,40.7938409953088,40.7967752457587,40.7970697097071,40.7971359216079,40.7972324711805,40.7972975933644,40.7976608998066,40.7976746555388,40.7976829030025,40.797786294499,40.7977821769492,40.7978297482264,40.7978627409502,40.7978131071417,40.797798670725,40.7976952874491,40.7977076622516,40.7976973150242,40.7977489234486,40.797831626396,40.7978295730397,40.7980074060771,40.7980218373531,40.7978460667698,40.7978419415047,40.7977675071378,40.7979646584326,40.7978874567533,40.7979009049827,40.797903116575,40.7978918409576,40.7978691429793,40.7978476501687,40.7978080913859,40.7978012041041,40.7978101308577,40.7978338780236,40.7978730573985,40.7979382487302,40.7980224993815,40.7980850155215,40.7981393591984,40.7981841853702,40.7982431557863,40.7982908587843,40.7983534038245,40.7984378399946,40.7983752808679,40.7985905410197,40.7985984239576,40.7986194942053,40.7986807544879,40.798750530357,40.7987467222767,40.7987063289588]}]],[[{"lng":[-73.7883334983453,-73.7893122360662,-73.7895101987231,-73.7884570001521,-73.7883334983453],"lat":[40.8346671297594,40.8344648865535,40.8353640425258,40.8353099143154,40.8346671297594]}],[{"lng":[-73.8022229535526,-73.802638111563,-73.8052949591067,-73.8069460864175,-73.8068080137239,-73.8039307330726,-73.8036756002653,-73.8022229535526],"lat":[40.8416348131441,40.8410811527646,40.8411349248503,40.8414624466838,40.8424891399876,40.8425940730525,40.842258492916,40.8416348131441]}],[{"lng":[-73.7806894529126,-73.7807724867361,-73.7810100272568,-73.7810925091386,-73.781136171642,-73.7811739603252,-73.7812052577197,-73.7812295524205,-73.7812464474426,-73.7812556667087,-73.781257059561,-73.7812332263653,-73.781195826902,-73.7811517350907,-73.7811019533516,-73.7810476134695,-73.7809899508628,-73.7809302764952,-73.7808699470695,-73.7806795960922,-73.7806310748522,-73.7806165355589,-73.7806400886633,-73.780646671331,-73.7806894529126],"lat":[40.8549288079359,40.8548435771809,40.8548762501905,40.8549585723049,40.8549914107186,40.8550282099413,40.8550683686822,40.8551112307558,40.8551560958035,40.8552022307367,40.8552488817158,40.8553986681466,40.8554346113947,40.8554658765691,40.8554917528553,40.8555116519543,40.8555251214584,40.8555318551373,40.8555316998999,40.8553444508074,40.8552589706626,40.8551638881587,40.855099489379,40.8550334470845,40.8549288079359]}],[{"lng":[-73.782852131004,-73.7825971159191,-73.7827065741142,-73.7828189878568,-73.7829337361102,-73.7830501849382,-73.7831676910083,-73.7832856051462,-73.7834032759229,-73.7835200532537,-73.7836352919912,-73.783748355489,-73.7838586191203,-73.7837047004291,-73.7835566673902,-73.7835585079552,-73.7835040175149,-73.7833037904222,-73.7830597035215,-73.782852131004],"lat":[40.8554858053077,40.8548225609715,40.854855864458,40.8548829029048,40.8549035269356,40.8549176226111,40.8549251120581,40.8549259539007,40.8549201434879,40.8549077129198,40.8548887308706,40.8548633022082,40.8548315674156,40.8549930900288,40.8550743105525,40.8552843424528,40.8554779305575,40.8558485823202,40.8557084662186,40.8554858053077]}],[{"lng":[-73.7892220296188,-73.7891859759923,-73.7891530081815,-73.7891577905111,-73.7890983184814,-73.7890653689233,-73.7890591869176,-73.7890592662649,-73.7890420676761,-73.7890279951059,-73.7890280744632,-73.7889827087882,-73.7889435664698,-73.7889185983406,-73.7888793951408,-73.7888087665613,-73.7887665199659,-73.7887541531556,-73.7887720716614,-73.7887854976523,-73.7887986210277,-73.7888076195024,-73.7888053997816,-73.7887868143248,-73.7888182058396,-73.7888146251878,-73.7887983109091,-73.7887661651014,-73.7887840285458,-73.7882649805069,-73.788261953108,-73.7881764099842,-73.7881824508761,-73.788043429758,-73.7880283070183,-73.7881658003299,-73.7881718624853,-73.7882558718205,-73.7882543669076,-73.7887789854402,-73.7887638907388,-73.7887504705821,-73.7887316477806,-73.7887209347677,-73.7887048588444,-73.7887104768803,-73.7887187967798,-73.7887514851534,-73.7887624726088,-73.7887746336232,-73.7887925125067,-73.788806266789,-73.7887955603384,-73.7887794059048,-73.7888066725075,-73.7888393340608,-73.7888692625544,-73.7888883077091,-73.7888965495719,-73.7888831222679,-73.788856162376,-73.7888183796671,-73.7887824727151,-73.7887700306417,-73.7887589426025,-73.788731833668,-73.7887251941566,-73.7886884128908,-73.7886531283991,-73.788623338175,-73.7886044489371,-73.7885964318945,-73.7885821237344,-73.7885368773532,-73.7885099251264,-73.7885208608292,-73.7884671015993,-73.7884740222327,-73.7884376714831,-73.7884078081227,-73.7883594322237,-73.7884255157724,-73.7884151118413,-73.7885325000331,-73.7885536572481,-73.7885367952694,-73.7884969618678,-73.7884480874701,-73.7884318753239,-73.7883911431649,-73.7883585543343,-73.7883396144435,-73.7883315963814,-73.788320942807,-73.7883129319888,-73.7883076349547,-73.7882941364667,-73.7882941955018,-73.7883213888005,-73.7883540175145,-73.7883975159523,-73.7884247225351,-73.7884276004137,-73.7884169212399,-73.7884170654634,-73.788427286849,-73.7884416373081,-73.7884580597342,-73.7884826037547,-73.7884826692924,-73.7884773265336,-73.7884313698025,-73.788409768566,-73.7883963289378,-73.7883470068363,-73.7878684947466,-73.7878715115159,-73.7876514907694,-73.7876469359479,-73.7875567694506,-73.7875628281522,-73.7873626907491,-73.7873475314642,-73.7875491913949,-73.7875537496875,-73.7876439087689,-73.7876393517904,-73.788345147841,-73.7883239944992,-73.7882722122409,-73.7881987249002,-73.7881681369218,-73.7877787383167,-73.7876901428156,-73.787658075005,-73.7876275709708,-73.7875634501659,-73.787430572486,-73.7873145006624,-73.7872655583483,-73.7872244857847,-73.7871970601856,-73.7871727188946,-73.7871453985217,-73.7871254596767,-73.7869133906974,-73.786907347027,-73.7871328723602,-73.7871545889612,-73.7872084560679,-73.7872925121059,-73.787323506653,-73.7874193524405,-73.7876241156934,-73.7878120671719,-73.7878777845756,-73.7879282170731,-73.7879679994745,-73.7879940304699,-73.788005081086,-73.7880110443899,-73.7880142495819,-73.7880006494967,-73.7879626428807,-73.7876050231902,-73.7871649642187,-73.787126720309,-73.7871221582337,-73.787076276551,-73.7870610658209,-73.7871099900442,-73.7871039056218,-73.7871366702803,-73.7869380573583,-73.7869167221416,-73.7868847033757,-73.7868495898726,-73.7867823255809,-73.7867595922327,-73.7867657472106,-73.7867764893382,-73.7867765376468,-73.7867689971708,-73.7865939016329,-73.7864173351077,-73.786376220321,-73.786324423421,-73.7862476209336,-73.7858818650649,-73.7856640412241,-73.7854527717418,-73.7854019443248,-73.7852921071903,-73.785218814344,-73.7851006646113,-73.7850354290599,-73.7849559146067,-73.7848988857296,-73.7848072279519,-73.7846830719541,-73.7843347420856,-73.7842745733006,-73.7842779846804,-73.7841318916798,-73.7841233822644,-73.7842643285858,-73.7842668846525,-73.7843141516601,-73.784026370805,-73.783979328986,-73.7838711535815,-73.7838609335567,-73.7839717345159,-73.7839611248831,-73.7838130635293,-73.783577671034,-73.7835624200106,-73.7835426733775,-73.7834795676694,-73.7834752847721,-73.7834100177229,-73.7833815861039,-73.7833764657885,-73.7834133904306,-73.7835341691676,-73.7834449593595,-73.7834960988998,-73.783602105416,-73.7837950127628,-73.7839879199498,-73.7841427509189,-73.7843518870609,-73.7844795319985,-73.7846007769761,-73.7845193630009,-73.7844475052949,-73.784434075491,-73.7845049499061,-73.7844880793576,-73.7844744185389,-73.7844546328855,-73.7844210810376,-73.7843920760886,-73.7843457510766,-73.7843370879414,-73.7843126535271,-73.7842699363078,-73.7842257472773,-73.7841632949915,-73.7841191361484,-73.7840797521446,-73.7840413366318,-73.7840474123545,-73.7840214262709,-73.7840168723634,-73.7838518191188,-73.78384119308,-73.7839542862914,-73.7839588388658,-73.7840107966463,-73.7840031977975,-73.7840307070052,-73.7840352602505,-73.7840658083733,-73.7840171057382,-73.7840087904979,-73.7840036231614,-73.7840128804184,-73.7840142130141,-73.7840419839755,-73.7841261342707,-73.7842011263803,-73.7842394305134,-73.784257858262,-73.784253383755,-73.7842124705257,-73.7842049427147,-73.7842004713439,-73.784153339008,-73.7840970180123,-73.7840737834583,-73.7835782526039,-73.7835349780858,-73.7834997778467,-73.7834536807775,-73.783393955832,-73.7833369305493,-73.7832907462259,-73.78323644139,-73.7832235730049,-73.7831794489828,-73.7831469169356,-73.7831171580348,-73.7830353553791,-73.7824495270921,-73.782218064743,-73.782094563045,-73.7820702066158,-73.7821932862789,-73.7821581415205,-73.7820336745884,-73.7820199553272,-73.7819633800486,-73.7819740249896,-73.7817920623667,-73.7817829373724,-73.7817431778402,-73.7817553556915,-73.7815749238,-73.7815444908843,-73.7817188326843,-73.7817310114097,-73.781769243623,-73.7817616370129,-73.781939024334,-73.7819496759876,-73.7820108213888,-73.7821410869785,-73.7819378271346,-73.7818660849462,-73.7818484791591,-73.7818286909822,-73.7816958156092,-73.7816159406907,-73.7816073854626,-73.7816860428451,-73.781613675352,-73.7815301976367,-73.7815062032531,-73.7815949197541,-73.7815744044064,-73.7815395695513,-73.7814556364994,-73.7814324952229,-73.7815075637581,-73.7814933788413,-73.7814938658749,-73.7817851404006,-73.7820361671336,-73.7820021277274,-73.7820218930651,-73.782061891326,-73.7817892023564,-73.7817970940136,-73.7820704123829,-73.7820765769581,-73.7820964063967,-73.7822038418136,-73.7825140851031,-73.7825587775869,-73.7826190091209,-73.7826191050102,-73.7826746707888,-73.7818945773308,-73.7817621938619,-73.7815544212033,-73.7815261131841,-73.7813814878289,-73.7813915175119,-73.7813365258043,-73.7811225896796,-73.7811082716297,-73.7810879169419,-73.7810757507967,-73.7810758016637,-73.7810941554888,-73.7813019497226,-73.7813182634965,-73.7813183346333,-73.7810657467474,-73.7810189021386,-73.7809924418394,-73.7809782093896,-73.7809843811735,-73.7810109069507,-73.7810903601091,-73.7811412906281,-73.7813062751738,-73.781302280028,-73.7811455793434,-73.7811252006112,-73.7811007856731,-73.7810987812789,-73.7811069777533,-73.7811273330339,-73.7811537830963,-73.7811538186934,-73.7812942097643,-73.7813512415836,-73.781371458819,-73.7817259427401,-73.7818317436821,-73.7826374039789,-73.7825040863354,-73.7815841808155,-73.7814843195056,-73.7815030716316,-73.7814292034792,-73.7815223719534,-73.7818440990062,-73.7818252391238,-73.7820526192897,-73.7820953997107,-73.7822149781743,-73.7821854656223,-73.7821639343558,-73.7811254829111,-73.7811362632227,-73.7810683698102,-73.7810575836193,-73.7806366841116,-73.7806769370407,-73.7804624159847,-73.7804032695859,-73.7810604397285,-73.7811518257857,-73.7811897982452,-73.781106757608,-73.7816878693785,-73.78171847815,-73.7817428890326,-73.7817149462276,-73.7810985345694,-73.7810930188519,-73.7821566739683,-73.7821423278314,-73.7823282774844,-73.78229152991,-73.7825134511686,-73.7823570281052,-73.7825793286569,-73.782519907553,-73.7824959725895,-73.7830944204865,-73.7830955689245,-73.7831464422737,-73.7831107073708,-73.7830745583066,-73.7825750937902,-73.7825784911733,-73.782538397715,-73.7825417786994,-73.7824214884136,-73.7824248715552,-73.7818204764895,-73.7818164610431,-73.7823805745747,-73.7823765539331,-73.7825069011428,-73.7825008810226,-73.783050749408,-73.7830818133074,-73.7830594398958,-73.7830945588723,-73.7830602312658,-73.7819073592775,-73.7818397577268,-73.7818153590045,-73.7818870767267,-73.7830745744669,-73.7831331895294,-73.7831084132483,-73.7831524550574,-73.7832220761393,-73.7830971431072,-73.7829757924433,-73.7833653613535,-73.7833570099665,-73.7833354347671,-73.7833210065621,-73.7832848508252,-73.7832381891781,-73.7832341679832,-73.7831545114778,-73.7831001747465,-73.7830604095184,-73.7830460889106,-73.7830112982939,-73.7832698713884,-73.7830949470612,-73.7834959317382,-73.7834842874882,-73.782985670546,-73.7828930760384,-73.7829065094976,-73.7805736781046,-73.7805465399533,-73.7805762897134,-73.7805273604855,-73.7799270374444,-73.7799786859016,-73.7805330271439,-73.7805601766803,-73.7803690621756,-73.7803962328201,-73.7805846472888,-73.781062613643,-73.7808769019871,-73.7809122002328,-73.7810897779785,-73.7815460252334,-73.7813522918001,-73.7813767409837,-73.781575903027,-73.7820077053668,-73.7818004747547,-73.7818330659936,-73.7820375758626,-73.7824367989546,-73.7822161188231,-73.7822487166873,-73.7824693970624,-73.7828224397139,-73.7825721072394,-73.7826074117645,-73.7827849863566,-73.7830918611238,-73.7828738824319,-73.782901038888,-73.7831325256867,-73.7828066150656,-73.7828415161768,-73.7828686660038,-73.7829422581217,-73.7829830443999,-73.7834748124925,-73.7831919451864,-73.7830453981545,-73.7832450126047,-73.7832103885086,-73.7830087430839,-73.7829109867874,-73.7828948763537,-73.7831392596868,-73.7831170396102,-73.7829174708512,-73.7828992550774,-73.7831238302032,-73.7830165334468,-73.7828877830149,-73.7827331937678,-73.7828158452606,-73.7827791904621,-73.7827066998257,-73.7822994127092,-73.7824445240459,-73.7824078688453,-73.7822668287474,-73.7818004836245,-73.7819697250266,-73.7819330659367,-73.7817719692773,-73.781246566345,-73.781427851886,-73.7813891631934,-73.7812160111929,-73.7806742992502,-73.7808595850378,-73.780829036813,-73.7806437599331,-73.780295525319,-73.7802928657742,-73.7802277387268,-73.7802266241825,-73.780291756783,-73.7802915219649,-73.7828649930492,-73.7827155202259,-73.7823078366579,-73.7822957269889,-73.7824348109359,-73.7824108248819,-73.7805973582243,-73.7805852537408,-73.782368559535,-73.7823400055882,-73.7821597519027,-73.7821516613939,-73.7823305166084,-73.7823111091055,-73.7822171628095,-73.782221151523,-73.7821600555802,-73.7821560453186,-73.7816286101604,-73.7816205502192,-73.7822457473109,-73.7822497921256,-73.7823064331776,-73.7823211854318,-73.7823253683476,-73.782331609939,-73.782372409911,-73.7823705774475,-73.7823325721589,-73.7822934819796,-73.7823116314881,-73.7822770131197,-73.7822669585178,-73.7814541800844,-73.7814400310785,-73.7823235128595,-73.7822677147174,-73.7820753351817,-73.7820810307652,-73.7820649929176,-73.7820615835413,-73.7820375253394,-73.7820341082999,-73.7822634532624,-73.7822402454025,-73.7820159343561,-73.7820125230193,-73.7820365890861,-73.7820354696485,-73.7820515083582,-73.7820537783548,-73.7822359267938,-73.7822154223334,-73.7821662441896,-73.7820723560851,-73.7820209311362,-73.7818833312786,-73.7818660122127,-73.7814069659546,-73.7814183019978,-73.781366764135,-73.7813519733253,-73.7812992811557,-73.7813208230327,-73.7812749882927,-73.7813386857139,-73.7813077534055,-73.7812486350251,-73.7811329010127,-73.7811977223889,-73.7811713719038,-73.7810996706452,-73.7809793566091,-73.7810544845537,-73.7810235442485,-73.7809552932129,-73.7808464399695,-73.7809249903879,-73.7808871744866,-73.7808143539402,-73.7806963280213,-73.7807645283577,-73.7807209883044,-73.7806550828425,-73.7806058110588,-73.7805840273881,-73.7805313141507,-73.7805915762219,-73.7805629270685,-73.7805038114454,-73.7804396356497,-73.7804555257668,-73.7803948047966,-73.7803766260916,-73.7803698059373,-73.7803480515823,-73.7804257718153,-73.7802986397616,-73.7801959995529,-73.7803322792483,-73.7803446604973,-73.780377868103,-73.7803767581232,-73.7812613540187,-73.7812375471225,-73.7818504819778,-73.7818386359831,-73.7818388488652,-73.7818390921631,-73.7818230032176,-73.7818048644,-73.781762344107,-73.7817176560302,-73.7816851699632,-73.7816605121361,-73.7808422380231,-73.7809288650499,-73.7808922061015,-73.7807975292346,-73.7816485529559,-73.781613565438,-73.7813959061904,-73.7813914356879,-73.7816106965153,-73.7815970260399,-73.7813787188564,-73.7813748819495,-73.7815939693726,-73.7815682170103,-73.781543089493,-73.7815134501493,-73.7814808892744,-73.7814483351499,-73.7814266697652,-73.7814180507189,-73.7814202876527,-73.7814420716122,-73.7814660242275,-73.7814769406928,-73.781485705628,-73.7814857706619,-73.7814771845751,-73.7814620370762,-73.7814534280018,-73.781453498466,-73.7814644257484,-73.7814883769658,-73.7815134773707,-73.7815232174989,-73.7815428414099,-73.7815429606054,-73.7815344104607,-73.7815150432261,-73.7814917200694,-73.7812536183457,-73.781249072339,-73.7814887808925,-73.7814655978731,-73.7814536653196,-73.7813626724532,-73.7811843144477,-73.781179478024,-73.7813593201067,-73.7813412514577,-73.7811399435274,-73.7811387572596,-73.7813398884942,-73.7813252257703,-73.7813424000093,-73.7815678098351,-73.7815969841916,-73.7817215486651,-73.7820042098904,-73.7818845572028,-73.7823814255608,-73.7827276073866,-73.7827455904672,-73.7828145265285,-73.7829062919088,-73.7828873348317,-73.7827968044343,-73.7827036458365,-73.7826813143559,-73.7828226013974,-73.7830292186273,-73.7833816805934,-73.7836639360844,-73.7841016459131,-73.7842180749409,-73.7843134711294,-73.7844845614001,-73.7849151225641,-73.7848848705203,-73.7849806032809,-73.7850822664278,-73.7849843560093,-73.7849432573329,-73.7845033396536,-73.7848500922266,-73.7851258217548,-73.7856399784545,-73.7858306796412,-73.7857936743976,-73.7856527957232,-73.7851658442866,-73.7852771294842,-73.7855779685095,-73.7854986418295,-73.7855477281023,-73.7855301151153,-73.7855603115974,-73.78568113678,-73.7857350929869,-73.7859299854499,-73.786078984903,-73.7861463776701,-73.7862727227483,-73.7865259849643,-73.7869001582141,-73.7873035313252,-73.7873298569899,-73.7874075874601,-73.7874137451261,-73.7873362787646,-73.7873885448256,-73.7874710857183,-73.787491621614,-73.787490952802,-73.7874813406311,-73.7874501432673,-73.7874706242269,-73.7876393121901,-73.7873977472516,-73.7873572424446,-73.7873867213582,-73.787491664126,-73.7877166524671,-73.7877134692207,-73.787918891785,-73.7879253690903,-73.7881813214456,-73.7881635562784,-73.7881391077853,-73.7880940024932,-73.7881592116652,-73.7882108349558,-73.7881880045508,-73.7882057896501,-73.7882400094522,-73.7882545328346,-73.7879659654652,-73.787957861961,-73.7877752695698,-73.7877849634727,-73.7875237973354,-73.7875793752362,-73.787786567951,-73.787864040497,-73.7876064058961,-73.7876123778259,-73.7878009807393,-73.7878448749932,-73.7878969868387,-73.7879523907587,-73.7880436914531,-73.7881219015148,-73.788123916089,-73.788196801177,-73.7882390823525,-73.788251975876,-73.7883661747498,-73.7883710120257,-73.7882606446572,-73.7882600684834,-73.7882600054669,-73.7882533774651,-73.7882337021841,-73.7882042790781,-73.7881602030337,-73.7881194130807,-73.7880525055161,-73.7880200355036,-73.7880484708972,-73.7882935884386,-73.7883016763818,-73.7880559907079,-73.7882319926238,-73.7883845661367,-73.7884390903702,-73.7885099380112,-73.7885202708226,-73.7888386489515,-73.7888427325721,-73.7885278086737,-73.788716196135,-73.7887638472453,-73.7887905351073,-73.78876233408,-73.7888430888371,-73.7888908617257,-73.7890582550137,-73.7896166032845,-73.7896575565687,-73.789786204613,-73.7897789783243,-73.7898352223619,-73.7898545655628,-73.7899242492442,-73.7899170567334,-73.7899292872876,-73.789919621512,-73.7899061737935,-73.7898820276732,-73.7899309338809,-73.789957515008,-73.7899440695604,-73.7899500681991,-73.7899659607602,-73.7899997530904,-73.7899520755298,-73.7899315290239,-73.7898618385828,-73.7898895360384,-73.7897346932676,-73.7897457997273,-73.7898991988991,-73.7899064514336,-73.789756268399,-73.7897742122375,-73.7898044950204,-73.7897408470778,-73.7893370872572,-73.7893194914458,-73.7893302133706,-73.7893604725716,-73.7894213262537,-73.7894644334527,-73.789347020263,-73.7893404709632,-73.7893469053209,-73.7894703335672,-73.7894718221409,-73.7895973762959,-73.7899080455866,-73.7899289549435,-73.7900196915212,-73.7901992019094,-73.7904964276808,-73.7906658900102,-73.7908515606674,-73.790988583759,-73.7910188599295,-73.7906978536486,-73.7909606959618,-73.790908485346,-73.7909407344361,-73.7909467367696,-73.7909733331068,-73.7910634908902,-73.7910642712527,-73.7914907651356,-73.7914993735155,-73.7911275924665,-73.7911447882513,-73.7911247657017,-73.7911812878534,-73.7912605744137,-73.7913117056192,-73.7913290103074,-73.7914137911444,-73.7914310833175,-73.7913245194714,-73.7913807040327,-73.7914198266744,-73.7914803472569,-73.7917934362546,-73.7918041859146,-73.7914336300719,-73.7913670985845,-73.7913765853053,-73.7913842828298,-73.791486374168,-73.7914404968817,-73.7916983779534,-73.7916940836624,-73.7917723270085,-73.7919200710007,-73.7919199781009,-73.7917461359944,-73.7917156975866,-73.7917156252611,-73.791429627565,-73.7914173847846,-73.7915173918598,-73.7915410488227,-73.7913057004828,-73.7912670856721,-73.791277200668,-73.791279329539,-73.7913297597005,-73.7916068733174,-73.7916176543145,-73.7913358806323,-73.791362881068,-73.7913102069988,-73.7912308631245,-73.7912447526426,-73.7910600060852,-73.7911119540788,-73.7910972646855,-73.7910443232118,-73.7910178352214,-73.790919717279,-73.7910136233883,-73.7909805783553,-73.7908871020721,-73.79024725581,-73.7897571107061,-73.7898338332935,-73.7898583695219,-73.7901606379887,-73.7901563393647,-73.7902259107128,-73.7902258638802,-73.7906497649306,-73.7906476282183,-73.7909259053448,-73.7909129772108,-73.7909477685763,-73.790988771248,-73.7906756981974,-73.7906605659552,-73.7904410269941,-73.7904453198223,-73.7903670582256,-73.7903627595556,-73.7902345125324,-73.7902409842452,-73.7901714089751,-73.7901671051414,-73.7898663031381,-73.7900175878901,-73.7901681643942,-73.7902008337725,-73.790207295104,-73.7902464258045,-73.7902378700931,-73.7902813729271,-73.790257670317,-73.7903576698173,-73.7904050605431,-73.7901419866557,-73.7901549079707,-73.7902201342953,-73.7902265904322,-73.790054845378,-73.7900527191663,-73.7901244688739,-73.7901158858777,-73.7900241182949,-73.7900388848641,-73.7899187248287,-73.7910173706937,-73.7910238113042,-73.7899295362666,-73.7900317422327,-73.7900709317075,-73.7902476483752,-73.7902500640095,-73.790074059205,-73.7900864002191,-73.7902646047155,-73.7902682450727,-73.7900909438575,-73.7901243917183,-73.7895137151617,-73.789562724642,-73.7896605179442,-73.7896627621722,-73.7897851070265,-73.7897766303241,-73.7897105921199,-73.7897021309969,-73.789683796745,-73.7896657191385,-73.7897684322878,-73.7897793532319,-73.7897952542796,-73.7898085511542,-73.7897950988327,-73.7898108047848,-73.7900578142692,-73.7900179705354,-73.7900497534374,-73.7900896156999,-73.7903451879795,-73.7903028518772,-73.7903370951808,-73.7903794365331,-73.7908245419897,-73.7907846352445,-73.7908176535296,-73.7908575632574,-73.790987179843,-73.790990766491,-73.7908660390276,-73.7908901843567,-73.7908596129088,-73.7908330226529,-73.7903854595429,-73.790410804879,-73.7903875683458,-73.7903548889487,-73.7900944249189,-73.7901161821689,-73.7900733807411,-73.7900516242002,-73.7896649034452,-73.7897257371208,-73.7901477843448,-73.7901731070039,-73.7908921793007,-73.7909163342198,-73.7901958866728,-73.7902164027295,-73.7902483826228,-73.7902327361208,-73.7904552874168,-73.790463705281,-73.790384219464,-73.7903866032003,-73.7902655528271,-73.7902667330034,-73.7902948451225,-73.7903068510807,-73.7902787303728,-73.7902992895896,-73.7902556639458,-73.7900839690412,-73.7901550926101,-73.7902434632529,-73.7901609515002,-73.790195203133,-73.7902740423579,-73.7905321242068,-73.790452003361,-73.7905070423819,-73.7905749341031,-73.7908061058777,-73.7907430949937,-73.7905803755946,-73.7905609252433,-73.7907946335484,-73.7908189678088,-73.7907626752107,-73.7907944671663,-73.7908538071772,-73.79099692237,-73.7909871999905,-73.7911119615058,-73.7910659478956,-73.7910206904042,-73.7910109711846,-73.7911736673112,-73.7911833836593,-73.791102653217,-73.7911669291689,-73.7911877076455,-73.7914629333888,-73.7913962176819,-73.7913289417421,-73.7913204511751,-73.7915173867795,-73.7915234335679,-73.7914267964551,-73.7914959681422,-73.7917699488301,-73.7917275018874,-73.7922718766822,-73.7922621707585,-73.7924835935719,-73.7924945097807,-73.79229143994,-73.7922987241293,-73.7917678060595,-73.7918017523138,-73.7920488276035,-73.7920573145789,-73.79016350155,-73.790170071263,-73.7911379517093,-73.7912055906845,-73.7913345675326,-73.7913418457984,-73.7912125116928,-73.7912265338512,-73.791361879799,-73.7913646086994,-73.7912308400785,-73.7912365597178,-73.7931828407586,-73.7930890196572,-73.7931183718384,-73.7932202604837,-73.7931533961262,-73.7932525807952,-73.7932378678763,-73.7931435368942,-73.7931289407392,-73.7912455678377,-73.7913805269552,-73.7934096030039,-73.7933837673931,-73.7934098763116,-73.7935076283191,-73.7934786291432,-73.7934240066904,-73.7913910646867,-73.7914464002779,-73.7904205378017,-73.7904987936289,-73.7907712759549,-73.7907915075772,-73.7910058674022,-73.7909898272444,-73.7910077775555,-73.7910303311474,-73.7914543630372,-73.7913897249529,-73.7914370271664,-73.7915032725157,-73.7917022389609,-73.7916310769195,-73.7916555443624,-73.7917299552462,-73.7919631831115,-73.7918936538657,-73.7919164994622,-73.7919892816457,-73.7922241306373,-73.7921529705741,-73.792175808378,-73.792251860974,-73.7924866988149,-73.7924171758284,-73.7924367547335,-73.7925095404806,-73.7928308388489,-73.7927645580239,-73.7928151196693,-73.7929008668706,-73.7928389021841,-73.7908075872993,-73.7908620198684,-73.7911143142938,-73.7912657316588,-73.7925240872891,-73.7923861058939,-73.7924093103693,-73.7925559839258,-73.7929792831105,-73.7928471009267,-73.7928761004859,-73.7930399117027,-73.7930138163249,-73.7929994805541,-73.7912736812813,-73.7912904100619,-73.7910572125483,-73.7912841784201,-73.7912902349519,-73.7924581684481,-73.7924883675252,-73.7924622663867,-73.7924406924877,-73.7910700276595,-73.7910828174584,-73.7913847725381,-73.791583609897,-73.7917183529375,-73.791786111757,-73.7918178199532,-73.7918171618838,-73.792514183689,-73.7925061657828,-73.7925371460487,-73.7925675894463,-73.7925300985486,-73.7925173617578,-73.7918261216321,-73.7918214004225,-73.7917936680942,-73.7919181173639,-73.7913381179158,-73.7912928216065,-73.791868434644,-73.7920767566755,-73.7925030668545,-73.7924929783846,-73.7924879115737,-73.792418215414,-73.7923072079674,-73.7921161694851,-73.7920332293373,-73.7920171222853,-73.7925707419965,-73.7925681412599,-73.7920105000906,-73.7919871987402,-73.7919370027975,-73.7920700092792,-73.7920589256043,-73.7920974020608,-73.7920881481997,-73.7920698199593,-73.7920577847071,-73.7920174638365,-73.7920091122996,-73.7919083225176,-73.7919018334026,-73.7930513380813,-73.7930688668018,-73.7930949215237,-73.7930568529535,-73.7930307836123,-73.7930483589582,-73.7918942295888,-73.7918593771358,-73.7918421311268,-73.7918284550688,-73.7919618059141,-73.7919562821119,-73.7918229997617,-73.7917926453528,-73.7919295571427,-73.7919221926292,-73.7917850281768,-73.7917070425736,-73.7918603255296,-73.7918822302672,-73.7918363346284,-73.7918326974459,-73.7917354647656,-73.7918214377102,-73.7918717258124,-73.7922026595025,-73.79222842637,-73.7922146991403,-73.792374840124,-73.7924279413065,-73.7922668728028,-73.7922449012639,-73.7922218918639,-73.7927371986778,-73.7928271323798,-73.7928975388877,-73.7929540078477,-73.79301264383,-73.7929962847809,-73.792884038889,-73.792810745865,-73.7927173038383,-73.7918597871521,-73.7918543264201,-73.7926833857548,-73.7926092302063,-73.792576696214,-73.7926355732807,-73.7921126678363,-73.7918945191309,-73.7924651606529,-73.7925415008948,-73.792551628031,-73.792569704406,-73.7923952172328,-73.7923872563999,-73.7923735381333,-73.7924433640356,-73.7917425408236,-73.7917578139994,-73.7918728196395,-73.792093325041,-73.791843032174,-73.7917397997258,-73.7916039346131,-73.7912937885215,-73.7909420226037,-73.7912330740583,-73.7912445209505,-73.7913161346032,-73.7913063009644,-73.7916366458797,-73.7917560035164,-73.7917852942325,-73.7915989091515,-73.7914369590811,-73.7914092915086,-73.7916186607583,-73.7912932164252,-73.7912785095481,-73.7912117964989,-73.7912216178454,-73.7909322280059,-73.7907906704719,-73.7906806170101,-73.7904419014554,-73.7902359273876,-73.7900613356324,-73.7901253879809,-73.7901364046846,-73.7901601646944,-73.7901463778868,-73.7902012297575,-73.79018745195,-73.7901335115889,-73.790120653197,-73.7900914153764,-73.7900987715655,-73.7900459983775,-73.7899890995976,-73.7899530134158,-73.7898669871437,-73.7897989670505,-73.7897469344117,-73.7896768671681,-73.789607802583,-73.7895345390721,-73.7894994187577,-73.7894389203076,-73.7893879675828,-73.7893412102467,-73.7893071908461,-73.7892828535458,-73.789258045506,-73.7892220296188],"lat":[40.8587425155314,40.8587317283117,40.8587376240369,40.8587138082297,40.8586660480923,40.8586659878566,40.8586361948649,40.8586111775266,40.8585920857393,40.8585765732807,40.8585515564447,40.8585085874184,40.8584823077462,40.8584393760059,40.858432157045,40.8584391750121,40.8584021675785,40.8583437726476,40.8583141329887,40.8580224093624,40.85788507233,40.8578183770111,40.8577268823898,40.8576506064853,40.8576468521152,40.8575887109811,40.8575877280748,40.8574332793712,40.8574206903366,40.8575070008607,40.8574988814611,40.8575126351025,40.8575335114395,40.8575599176872,40.8575146812838,40.857488272249,40.8575021935437,40.8574907557865,40.8574837979425,40.8574009251997,40.8573212192636,40.8572737956984,40.8572181188983,40.857172762168,40.857106786176,40.8570470332136,40.8569914066171,40.8569543716961,40.8569131756158,40.8568898382048,40.8568555268966,40.8567978495311,40.8567504316043,40.8567091858305,40.8566700802565,40.8566412887678,40.8566186743967,40.856604283109,40.8565733867098,40.8565280240177,40.856470271463,40.8564021955432,40.8563629419866,40.85634934057,40.8563155329067,40.8563051785468,40.856304851276,40.8563030388187,40.8563029741864,40.8562823118434,40.8562472426571,40.8562080724732,40.8561628887191,40.856158504288,40.8560986909522,40.8560739818118,40.8559090172621,40.8558732472108,40.8557750111295,40.8557770170726,40.8556264891483,40.8553298528819,40.8551876376071,40.8551546769294,40.8551487361143,40.8551018908548,40.8550538348356,40.8550599268521,40.855037229144,40.8550433365703,40.8550494595914,40.8550308771138,40.8549917063982,40.8549278026595,40.854886571245,40.8548453453119,40.8548226513901,40.8548041044367,40.854787667983,40.8547691801143,40.8547465914232,40.854726032879,40.8546745172184,40.8546188557766,40.8545735189077,40.8545546781589,40.8545282251609,40.8544849783486,40.8544479292254,40.8544273209022,40.8544005205322,40.8543427336927,40.8543076594878,40.8542664186202,40.8541535189498,40.8542732414709,40.8542848401683,40.8543400772606,40.8543319538559,40.8543607681323,40.8543758488933,40.8544195305716,40.8543858854595,40.854343365876,40.8543503300262,40.8543238344355,40.8543168709613,40.8541320123502,40.8541025156497,40.8541129630684,40.8541277890582,40.8540857789036,40.8541733853198,40.8541882912456,40.8541905515937,40.854181220991,40.8541811029365,40.8541982464804,40.8542119427257,40.8542076278716,40.8541932296783,40.8541757907907,40.8541490843056,40.8540991883622,40.8540443786544,40.8540836904621,40.8540639722992,40.8540242708784,40.8539796896362,40.853954403786,40.8539267377792,40.853917164312,40.853887558075,40.8538288158775,40.8537758373808,40.8537539342112,40.8537377973892,40.8537100501656,40.8536857546154,40.8536648684512,40.8536162333371,40.8535687112083,40.8535246363281,40.8534747209356,40.8531147085349,40.8527574122819,40.8527799740252,40.8527741704542,40.8527995874355,40.8527821722268,40.8527602373213,40.8527532703349,40.8527338752442,40.8525790829289,40.8525674520447,40.8525546409831,40.8525545761115,40.8525557072356,40.8525312263328,40.8525161675975,40.852498799145,40.8524837296247,40.8524547353984,40.8523083519206,40.8521445764697,40.8521120419205,40.8520783293114,40.8520228146925,40.8517886729435,40.851795995821,40.8516642258365,40.8516455842245,40.8516206499736,40.8516251504342,40.8516527519344,40.8516835424064,40.8517235806835,40.8517342928891,40.8517526690238,40.8517493468799,40.8517761575724,40.8517919935165,40.8517991729341,40.8518328061573,40.8518086642795,40.8517737171013,40.8517795900761,40.8517675457069,40.8516099318629,40.8515326174405,40.8515589616701,40.851532860725,40.8515076818598,40.851486933923,40.8515188832949,40.8515696774448,40.8515650124407,40.8515379707042,40.8515601838872,40.8515569156658,40.8515790182088,40.8515867339144,40.8515769432487,40.8515634196886,40.8515207805307,40.851400909727,40.8513687799758,40.8513195197827,40.8512539353562,40.8511883506069,40.8511474241763,40.8510983550454,40.8510718029924,40.8510956921952,40.8508927350214,40.8509048174594,40.8508615149039,40.8508535004637,40.8508158268241,40.8507914578981,40.8507728738545,40.8507623791096,40.8507623249032,40.8507700507913,40.8507714954049,40.8507737684217,40.8507655735195,40.8507399887073,40.850696980725,40.850662121468,40.8506306154111,40.8506445887091,40.8506538733703,40.8506642579451,40.8506561348948,40.8507114676586,40.8506928994983,40.8506548577655,40.8506629813183,40.8506468497294,40.8506364022786,40.8506271804952,40.8506353035437,40.8506252332364,40.850584263375,40.8505259320535,40.8505054127577,40.8504752898531,40.8504739134585,40.8504452057775,40.8503874026758,40.8503295823808,40.8502867628729,40.8502531806424,40.8502207138395,40.8501267418182,40.8500942704739,40.8500606442406,40.850001437194,40.8499514850463,40.8499024253895,40.8492663868022,40.8492209679229,40.8491961719756,40.8491837205077,40.8491897900132,40.8491999876585,40.8492143265642,40.8492224680554,40.8492224438743,40.8492223609495,40.8492119955669,40.8491830883062,40.8490719081279,40.8493411540157,40.8491668045962,40.8492473000097,40.8492263887191,40.8491427909954,40.8491161739239,40.8491938617585,40.8491880390028,40.8492157536305,40.8492285251732,40.8493197589455,40.8493093079558,40.8493300991903,40.8493405542836,40.8494306318454,40.8494004351459,40.849305709714,40.8493161648116,40.8492953723672,40.8492872429476,40.8491948423134,40.8492052945014,40.8491799078862,40.8491006626677,40.8489339814074,40.8489448410394,40.8489475052179,40.8489592053636,40.8488483623479,40.8488962046112,40.8488864085314,40.8488378831522,40.8487723863499,40.8488575718797,40.8488425281791,40.8487529478766,40.8487318082124,40.8487263752818,40.8488130908978,40.8488000058133,40.8487192898814,40.8487153062641,40.8485804758258,40.8485098018392,40.8484380492835,40.8483440889264,40.8483395624201,40.8484491832847,40.8485272077288,40.8485471432713,40.8484694124946,40.8484224763747,40.8483983878631,40.8483679444144,40.8482896312976,40.8482773264788,40.8482396199435,40.8482102781259,40.848139672444,40.8483271615401,40.8483516415627,40.8484007080889,40.8483434661372,40.8483771958293,40.8484220377292,40.8484327525387,40.8484988084487,40.8485204200223,40.848520381397,40.8485064469473,40.8484909916135,40.8484802067382,40.8484249589428,40.8484157160757,40.8483940779714,40.8484538776887,40.8484630620649,40.8484630118323,40.8484583479136,40.8484382673038,40.8484182246648,40.8483967372295,40.8483829231765,40.8483476864727,40.8483244954176,40.8483164696778,40.8483241595664,40.8483210215836,40.8483117444882,40.8482947581966,40.8482947968197,40.8482979381552,40.8482871185166,40.8483028413752,40.848290584541,40.8483323545995,40.848234105806,40.848246670899,40.8480726492458,40.8479132737633,40.8480370520398,40.8478821938487,40.8476816429631,40.8474563453573,40.8473134799415,40.847136107937,40.8470655176721,40.8469908379278,40.8469133909624,40.8468614095895,40.8467197156277,40.8466363377809,40.8468294664049,40.8468521553773,40.8468664522056,40.8468458239292,40.8469233347524,40.8470614857935,40.8471002332896,40.8469311341661,40.8468025523569,40.8462463046271,40.8462525588036,40.8467469971412,40.8466388752119,40.8464081213262,40.846412290116,40.8466574742147,40.8467717114391,40.8467984915874,40.8466075781137,40.8465777066086,40.8465486112713,40.8464577901167,40.8464087715512,40.8459815883327,40.8459358930278,40.8457581947647,40.8456615619491,40.8455182855647,40.8455136908632,40.8453099420261,40.8453081297424,40.8455097642919,40.8456018505661,40.8456131591499,40.84562003867,40.8456365644266,40.8456606810231,40.845676336667,40.8457819874981,40.845764978051,40.8456655783036,40.845650115281,40.8456240848009,40.8455977983018,40.8454968231759,40.8453330473897,40.8453283684148,40.8451692354712,40.8450857085671,40.8453555622494,40.8454883575841,40.8454805828803,40.8453338856494,40.8450563687339,40.8451816730595,40.8452898199034,40.8452959833278,40.8450634446582,40.8449916743321,40.8446809480204,40.8444447229817,40.8444028465376,40.8443615897198,40.8443478248024,40.8443395128501,40.8443470148544,40.844347661647,40.8443639978093,40.8443831306009,40.8443720643955,40.8443253250352,40.8441726908498,40.8440693920916,40.8438660944023,40.843732342936,40.8436785459985,40.843794078804,40.8438948842585,40.8439361258401,40.8444695859865,40.8444695343591,40.8445005030096,40.8445251403382,40.8438830813559,40.8438563892544,40.8444530222652,40.8444489518187,40.8439766611937,40.8439664081798,40.8444345726982,40.8443283178767,40.8438622204878,40.8438561053936,40.8443201270777,40.8442158897477,40.8437126825538,40.8437044865401,40.8442077034705,40.8441096006697,40.8435837006888,40.8435755183049,40.8441034749735,40.8440094310999,40.8434464111184,40.8434361684175,40.8439991878351,40.8439194811995,40.8432945819433,40.8432864049577,40.8437545454809,40.8436850548112,40.8431241023624,40.8431179713337,40.8436974967318,40.8437793161221,40.8438947872019,40.843890716883,40.8437919364061,40.8437672832354,40.8436547381098,40.8428678644865,40.8428963320667,40.8434716758789,40.8434793388665,40.8429024464337,40.8429223555082,40.8428697736933,40.8428223194901,40.8427712726345,40.8428064456792,40.8427754998361,40.8427362029937,40.8426053872973,40.8424948288497,40.8425217054985,40.8427645225967,40.8427706368912,40.8425324758104,40.8426058964134,40.8430420344168,40.8430481469174,40.8426120182283,40.8426961457937,40.8432204288159,40.8432280880765,40.842702273492,40.8427971072895,40.843370873779,40.8433769826053,40.8428047773957,40.8429073045377,40.8435011718693,40.8435072971457,40.8429103376209,40.8429730453966,40.8437783053654,40.8437781812978,40.8428832684329,40.8428818466004,40.842952944754,40.8424781018827,40.8424465010931,40.8425193582654,40.8424884238486,40.8424661214351,40.8424500503246,40.8427866004436,40.8427541194415,40.8424284931497,40.8423409256436,40.8423706998426,40.8423552286139,40.8423224512629,40.8422241789572,40.8422409771774,40.8422657146288,40.8422779630478,40.8422594083687,40.8423542395653,40.842329494888,40.8422132095645,40.8422209452587,40.84221111581,40.8421716201721,40.8421376243411,40.8420959055089,40.8420666156722,40.842004786909,40.8419228441114,40.8419304528299,40.841981492171,40.8419876089767,40.8419504946124,40.8421715271261,40.8421421334934,40.8418983304546,40.8417861749048,40.8418324250376,40.8418411299692,40.8418445778055,40.8418367461409,40.8418419167151,40.8418366942245,40.8417781159825,40.8417358661234,40.8417931890252,40.841786227476,40.8417784489051,40.8417706215667,40.8417671749088,40.8417732641796,40.8417278829806,40.8417040173003,40.8416891441101,40.8416933138454,40.8417043339149,40.8417338193934,40.8416873646797,40.8417720402016,40.8418059694208,40.841812826846,40.8417849772272,40.8417944416236,40.8418579485082,40.8418709028589,40.8419962189868,40.842003115446,40.8418778079854,40.8419106260536,40.842042029373,40.842048065539,40.8419201261133,40.8419529353356,40.8420834893569,40.8420929949142,40.8419598459157,40.8419891986258,40.8421232361984,40.8421344670587,40.8419987007775,40.8420323830007,40.8421803128825,40.8421915323058,40.8420418688663,40.8420556858658,40.8420652070461,40.8420807560333,40.8422060665376,40.8422147057062,40.8420893983739,40.8421092725915,40.8421510346229,40.8421648292371,40.8421230635098,40.8421082707012,40.8421090982245,40.8424943942069,40.8425115404673,40.8420462109762,40.8420316902674,40.8420960511805,40.8420935052244,40.842083071044,40.8418395784571,40.8417682420421,40.8416539463943,40.8415347846261,40.8414698697323,40.8413956799173,40.8413369170039,40.84128278594,40.8412162444515,40.8411898835489,40.8411666385568,40.8411241750856,40.8412763240282,40.8415454252676,40.8415530841983,40.8412561460484,40.8410977635288,40.8410072720697,40.841047865835,40.8410366101208,40.8409962400257,40.8409486695933,40.8409871920024,40.8409788710051,40.8409397967481,40.8408351605958,40.8407847820275,40.8407726825704,40.8407643713246,40.8407544106388,40.8407362203448,40.8407147557162,40.8406949612711,40.84067685331,40.8406603990647,40.8406439212901,40.8406208394861,40.8406010402547,40.8405696755126,40.8405514987455,40.8405267339102,40.840505284575,40.8404855070968,40.8404690528438,40.8404512712903,40.8404443703187,40.8404229596941,40.8403866616045,40.8403437476446,40.8402876144613,40.8402062245253,40.8402555004389,40.8402443548052,40.8401973239221,40.8401751597634,40.8401362867731,40.8397301898163,40.8397616492014,40.8397458622558,40.8397117082158,40.8394785634429,40.8395054168936,40.8394942788018,40.8394696998303,40.8392917813566,40.8392383748445,40.8385374057364,40.838477850143,40.8382235666123,40.8380155723072,40.8376502766048,40.8373241061674,40.8374879598489,40.837474393597,40.8374223913663,40.8373200060728,40.8371647356467,40.836920523452,40.8368428019656,40.8364836771536,40.8363381558879,40.8363458523448,40.8369092716807,40.8368116102466,40.836725529358,40.8367549016713,40.8368128267512,40.8370242225386,40.8368419985753,40.8367924444121,40.8367464260806,40.8368819077105,40.8369295721806,40.8368750491436,40.8370577651712,40.8374704891785,40.8374460415695,40.8370644345854,40.8372099800046,40.8372330103735,40.837132104726,40.8374713340618,40.837756718087,40.8379271132254,40.8384803667951,40.8387257139474,40.8387982773384,40.8388659797836,40.8391011043691,40.8392342317759,40.8394292819689,40.8395381333907,40.8395873662531,40.8395883085652,40.839723115607,40.8397148618948,40.8396747245011,40.8397031007226,40.8396776231969,40.8396866388065,40.8397100215976,40.839766356006,40.8399451563011,40.8399896393215,40.8400490260976,40.8400545455657,40.8400724615865,40.8401222034289,40.8405318952367,40.840582316948,40.8405907717767,40.8406519252141,40.8408423416741,40.8408042706383,40.840780754098,40.8407427717964,40.8407551585514,40.8407110805014,40.8406615518444,40.8406639816078,40.840501796296,40.8404907785671,40.8406529763243,40.8406591215729,40.840702464264,40.84070128976,40.8407458631185,40.8407985420459,40.8407849161426,40.8408167533506,40.840842757038,40.8408796126878,40.8409327104988,40.8408922220128,40.8410817258349,40.8411418857565,40.8411980052959,40.8414404634061,40.8414714798359,40.8414802368422,40.8414791013758,40.8414619456777,40.8414620893698,40.8414625256178,40.8414783131045,40.8415043772548,40.8415287453716,40.841504610514,40.8415207055636,40.8415419628608,40.8415662871515,40.8415860857132,40.8416207212313,40.8416590458013,40.8416886896265,40.8417145945332,40.8417318431193,40.8417638932128,40.8417838414588,40.8418507231265,40.8417853731367,40.8418039488218,40.8418670301776,40.8421960847721,40.8423819783706,40.842402498578,40.842391035327,40.8424117659532,40.8423503959612,40.8423634545736,40.8424255768948,40.8426567538168,40.8426596253424,40.8427218551548,40.8427515013552,40.8430002463251,40.8430700643497,40.8432353317701,40.843112654365,40.8432313545617,40.8432081256582,40.8431747021471,40.843165524137,40.8432323800615,40.8432241542407,40.8431795932937,40.8431768313177,40.843141548043,40.8431433795498,40.8430496007927,40.8430422648663,40.8431388328007,40.8431397360649,40.8431750138325,40.8431731867723,40.8433078172436,40.8433132989344,40.8432408730043,40.8432509541467,40.8433809344673,40.8434132474787,40.8434478225887,40.8434171466591,40.8434422174564,40.8434703406619,40.8435135746531,40.8435866562824,40.843599570474,40.8436814980556,40.8437491116523,40.8437936779063,40.8438432308453,40.8438367425103,40.8439457145475,40.8439751985221,40.8439850850581,40.8440114960947,40.8442896248183,40.8442929783521,40.8445019731112,40.8448976109035,40.8449242375681,40.8449284171573,40.8451877778844,40.8454927547125,40.8457415588344,40.8456987816413,40.8456528320625,40.8456974347446,40.8457860125509,40.8462302462746,40.8462516010898,40.8463008206403,40.8463099813459,40.846357311525,40.8463461666545,40.8463460704014,40.8462510049653,40.8462774191292,40.8463575909496,40.8464170189012,40.8464274723316,40.8465556759298,40.846549170068,40.8465377639008,40.8465625431943,40.8465478470329,40.8465759271816,40.8466087324992,40.8467061774723,40.8467012995604,40.8468020527137,40.8467316723293,40.8467679894942,40.8468647979688,40.8468876426859,40.8469278210445,40.8469503696252,40.8469588037629,40.8473060439862,40.847252868927,40.8472363620689,40.8472282532791,40.8472285198791,40.8472582180308,40.8472661538696,40.8472726988569,40.8472957971026,40.8473599891744,40.8474800465622,40.8474604291969,40.8475380172983,40.8475928674716,40.8476018678567,40.8476464250922,40.8476630915501,40.8480579230643,40.8480265056664,40.8480529244079,40.8480862386525,40.8482323023903,40.8484004969992,40.848501039356,40.8485522204472,40.8487250888286,40.8488081270342,40.848815524928,40.84874079645,40.8488116690644,40.8488668730158,40.8489852102194,40.8489999991694,40.8488865637991,40.8491788469899,40.8495314692877,40.8498589736448,40.8499725593619,40.8499225399765,40.8499076826687,40.8498946093209,40.8499094592268,40.8498442332376,40.8498326795902,40.8497820377064,40.8497473661384,40.8497391796438,40.8498283490296,40.8498888275902,40.8498640509837,40.8498917012487,40.8499082079759,40.8499212651616,40.8499064078614,40.8499226743314,40.8499375344149,40.8499522573728,40.8499390501666,40.8499893902006,40.8503163319626,40.8502921302027,40.8502674416482,40.8502856014325,40.8502790731516,40.8502361610853,40.8502213901894,40.8501586512698,40.850142334616,40.850272762714,40.8503250806076,40.8503614023573,40.8503483211092,40.8503681321659,40.850397518037,40.8503826646802,40.8503679464202,40.8503332831735,40.8503478195829,40.850451288624,40.8506117271378,40.850407515282,40.8504322754241,40.850626122555,40.850768547814,40.8509320201068,40.8509035105228,40.8509127959065,40.8509397153125,40.8509844738535,40.850952729384,40.8509610880739,40.8509947644029,40.8511899121946,40.8513007717132,40.8514873368221,40.8514768613213,40.851488703321,40.8514622938808,40.8514372197087,40.8514491645863,40.8514194513656,40.8514194179419,40.8513386433274,40.8513239810696,40.8513490585242,40.8513453750023,40.8513918035146,40.8513945627478,40.8514521319669,40.8514145302111,40.8512594709595,40.8512576728095,40.8514071635898,40.851366793055,40.8512265788572,40.8512201438511,40.851358503724,40.8512897063184,40.8511541357738,40.8511486271558,40.8512832694447,40.8512640152991,40.8512890793499,40.8513083423629,40.8514039779403,40.851408562095,40.8513138509981,40.8513863564677,40.8514884898967,40.8514930879222,40.8513909411603,40.8514322298931,40.851509299306,40.8515166464207,40.851439577001,40.8515003821321,40.851692670565,40.8516074071841,40.8516625791549,40.8515469035489,40.8516388259674,40.8517529045629,40.8518398267893,40.8518334354379,40.8517563771663,40.8517233720031,40.851767006154,40.8517798547381,40.8517993481266,40.8518149058481,40.8518279003075,40.851827951413,40.8518966503176,40.8518993839488,40.8519690261494,40.8519760649297,40.8520345273822,40.8522512852358,40.8522306399868,40.8520402359284,40.8520310177381,40.8522232710926,40.8521634151478,40.8519897209503,40.8519777563453,40.8521532841344,40.8520998759678,40.8519262124944,40.8519778894914,40.8519444438914,40.8518613413858,40.8518966523021,40.8519188235191,40.8519142404308,40.8520888249684,40.8520528898037,40.8520352396326,40.8520057673111,40.8518683298277,40.8518793848393,40.851860805253,40.8518165532695,40.851836059914,40.8518563310627,40.8520160748948,40.8520161125067,40.8519451496967,40.8517835456201,40.8518001282564,40.8517796960942,40.8517299358909,40.8517503647952,40.8517761759172,40.8519340724214,40.8518705309513,40.8517646539592,40.8516106482581,40.8515874297298,40.8515237914069,40.8515507250927,40.8516078992365,40.8516236900845,40.8517740077061,40.85186223511,40.8518032846613,40.8518255732624,40.8522718315855,40.8522806611534,40.8520558525737,40.8521977497844,40.8521660676736,40.8521834828813,40.8522151764154,40.8522580105032,40.8522259775339,40.8522329430854,40.8522648060277,40.8522802898866,40.8518085718713,40.8515844297581,40.8515782952408,40.851828437087,40.8518444045337,40.8519163527338,40.8519311746745,40.8518703721512,40.8518480726759,40.8523046814108,40.8526020383048,40.852109878159,40.8520328360855,40.8520218837304,40.8522640439249,40.8522727910371,40.8521363025276,40.8526280749859,40.8527715719242,40.8530229782125,40.8531887220161,40.8531185269907,40.8531633995922,40.853117691262,40.8530359928268,40.8530286003553,40.8531115490902,40.8530108477136,40.8528362539371,40.8528227279835,40.8530047489597,40.8529580859457,40.8527847185254,40.8527773382266,40.8529544234902,40.8528954482288,40.852720846583,40.8527109881385,40.8528880702981,40.8528315720943,40.8526569681694,40.8526495843216,40.8528229608848,40.8527701739522,40.8525930979695,40.8525857082061,40.8527615527144,40.8526804607679,40.8525083394697,40.8524948193089,40.8526954359823,40.8527076983734,40.8531990600643,40.8533197811035,40.8532644519247,40.8537068642332,40.8534099207049,40.8530620938816,40.8530533361148,40.8534011785408,40.8533029449095,40.8529529294536,40.8529441813285,40.8533712492852,40.853377802404,40.8533293797221,40.8537322078817,40.8538445742532,40.8539184124267,40.853861078984,40.8538787229945,40.853600708755,40.8536717089094,40.8536799115,40.8536303750979,40.8539449566647,40.8539631965326,40.8538954786739,40.8538908882321,40.8539173287806,40.8539935399008,40.85398943667,40.8539800387375,40.8538963082708,40.8538542219227,40.8538493278129,40.8540164349431,40.8540188421887,40.8539223004459,40.8540014872304,40.8539969548983,40.8540048299004,40.8542223547429,40.8544390115384,40.8545840259769,40.8554167523696,40.8556451677071,40.8557886661371,40.8558940634807,40.8559469932098,40.8559953443406,40.8560723554083,40.8560126152917,40.8561405234718,40.8561769486063,40.8562060072138,40.85625611877,40.8562251277185,40.8563655121425,40.8564051579222,40.8564149651615,40.8564413948365,40.8564498169122,40.8564776420094,40.8564755219677,40.8565130862345,40.8565081411262,40.85654014421,40.8565239542295,40.8565469113681,40.8567259611497,40.8566797947431,40.8566864414041,40.8568161654745,40.8568139179516,40.8567523538577,40.8565688893296,40.8566659243807,40.8566611833364,40.8566681433947,40.8567168565852,40.8567245027936,40.8566761075128,40.8567198528192,40.8567690016685,40.8567787332412,40.8567308579452,40.8568518428551,40.856792803532,40.8568241651252,40.8568428753032,40.8568331250586,40.8568664295283,40.8569002425518,40.8569842889639,40.8571460004104,40.8571147242388,40.8571070428457,40.8569061725314,40.8569285420342,40.8571328903861,40.8571231059691,40.8571522984247,40.8573936662167,40.8574357899179,40.8571893964906,40.8569917833512,40.8570030260432,40.8570635965505,40.8574792024937,40.8574642214273,40.8574190113197,40.8570041072594,40.8570137971982,40.8574203935927,40.8575077045023,40.857487846725,40.8574219566026,40.8571669318704,40.8574371218653,40.8577153317841,40.8576247251838,40.8576300758402,40.8576396253623,40.8578455477522,40.857839475268,40.8578290103377,40.8577367419719,40.8573939500042,40.857374179454,40.8574271830768,40.8571579899472,40.8570287020114,40.8571783542773,40.8573753129925,40.8572632386981,40.8575527481889,40.8576865703025,40.8576742173799,40.8577052825311,40.8577225882014,40.8578828125709,40.8577605235232,40.8577754258556,40.8579631775601,40.8581546851231,40.8581422602978,40.8579013420481,40.8577374140003,40.85774976103,40.8577149922319,40.8577013990398,40.8575677879731,40.8577503508179,40.8578027903299,40.8579165340986,40.8581540848113,40.8584595485613,40.8585221023423,40.8585172499559,40.8585416546329,40.8585527670335,40.8586015897105,40.8586099173862,40.8585624873098,40.8585701205891,40.8585387453294,40.8585317981041,40.8584754049121,40.8585227941505,40.8585243395339,40.8585459375095,40.8585788472619,40.858589226702,40.8585979616658,40.8586252302195,40.8586379878776,40.858670152178,40.8586732646033,40.8586780061678,40.8586980636836,40.8587173384862,40.8587401152872,40.8587652164518,40.8587425155314]}],[{"lng":[-73.7678320563717,-73.7682312652446,-73.7685566032705,-73.7690443898713,-73.769385291397,-73.768608176871,-73.7695967431147,-73.7695032156276,-73.7680563608623,-73.7678949267283,-73.7690138918112,-73.7699804265778,-73.7711837801058,-73.7715721883324,-73.7713077293794,-73.7708892022118,-73.7720496366845,-73.7724689293817,-73.7724665195014,-73.7727111749614,-73.7727091206161,-73.772465941265,-73.7724605229543,-73.7726441700332,-73.7726713053291,-73.7727207282958,-73.772718452112,-73.7729173932318,-73.7729208116276,-73.7729635661129,-73.7729679374417,-73.7729453916279,-73.7728768161762,-73.7728768395073,-73.7727060149172,-73.7726483774692,-73.772904294762,-73.772890757313,-73.7726393580299,-73.7726325831005,-73.7725842958313,-73.7726147950971,-73.7724594016302,-73.7724514941548,-73.7717306041191,-73.7717171593655,-73.7722968053138,-73.7722757705761,-73.7722753631336,-73.7722929360788,-73.7723126687318,-73.7723373540152,-73.7723620067985,-73.77234917455,-73.7728075180892,-73.7728112268767,-73.7729628533487,-73.7729581751704,-73.7727959772195,-73.7728000806578,-73.7726943063983,-73.7726944802606,-73.7723327221974,-73.7723111695654,-73.7722877176083,-73.7722291318758,-73.7721972470162,-73.7721403684182,-73.7721272258974,-73.7721454793762,-73.7721822637827,-73.7722002403415,-73.7722060690112,-73.7721864456302,-73.7721726996846,-73.7721469049092,-73.7721397063995,-73.7721693406469,-73.7721681828941,-73.7721538020581,-73.7721658510538,-73.7721655249182,-73.7721961888176,-73.7722080266953,-73.7722075538852,-73.7721882402391,-73.7721815292515,-73.772193645262,-73.7722368970486,-73.7723543271065,-73.7721922305542,-73.7708456236057,-73.7694730542401,-73.7683627729079,-73.7683608591898,-73.7653324399529,-73.7678320563717],"lat":[40.8544422057421,40.8538878888074,40.8532383229595,40.8532909246936,40.8525361339968,40.8507883953781,40.8475945190982,40.8472178342352,40.8455982181375,40.8452894330171,40.8450973427219,40.8459514128695,40.8469445133121,40.8475000585804,40.8480287743218,40.849751771338,40.8516182897575,40.8517091473893,40.8518095688939,40.8518265809337,40.8518476634615,40.8518336845023,40.8520595421737,40.8521389805788,40.8520988887823,40.85211948523,40.8521271687547,40.8521745379254,40.8521617317528,40.8521592539586,40.8521968453856,40.8522104669469,40.852198373764,40.8521915411783,40.852145935077,40.8522244026296,40.8523871921613,40.8523982689983,40.852230362276,40.8522380369325,40.8522140258679,40.8521765043354,40.8521062670822,40.8524358968935,40.8524768313191,40.8530045392819,40.8530863782524,40.8533181315364,40.8534371353639,40.8534797762391,40.8535276533128,40.8536419468,40.8537657611013,40.8538514202341,40.8538506312757,40.8537970865504,40.8538000622465,40.8541374329234,40.8541317587019,40.8539630762566,40.8539575129971,40.8539066390134,40.8539008446752,40.853965589997,40.8540104493269,40.8541225150438,40.8542795384011,40.8544127126006,40.8545888142139,40.8547506970928,40.8549935399675,40.855236346857,40.855364883841,40.8556028554422,40.8559550833618,40.8561644817747,40.8564357991997,40.8569356787656,40.8572736518997,40.8578115261418,40.8579543560855,40.8580495595389,40.8582495491571,40.8584542614441,40.8585923056182,40.8587398346387,40.8588683467835,40.858992136248,40.8591778687733,40.8596731619806,40.859986638597,40.8601010128568,40.8593301366686,40.8583582888519,40.8576553632034,40.8550435951249,40.8544422057421]}],[{"lng":[-73.7845745165458,-73.7844962551005,-73.7844374723637,-73.7844409500086,-73.7843593820364,-73.7843375393238,-73.7843696069391,-73.7844076439542,-73.7844612005787,-73.7845302689546,-73.7845622058828,-73.784603255387,-73.784587788952,-73.7846412447895,-73.7846445909123,-73.7847139765728,-73.784761086061,-73.784814587228,-73.7848765433705,-73.784869376554,-73.7849786030076,-73.7851161220256,-73.7851087348766,-73.7851401704174,-73.7852533419503,-73.7853097001967,-73.7853281136783,-73.7853750808872,-73.7854833101258,-73.785567841132,-73.7855629729891,-73.7856711103235,-73.7857319917326,-73.7858215200494,-73.7858825858318,-73.7860754048853,-73.7862166429507,-73.7863674423584,-73.7866080797074,-73.7866083663771,-73.7865427528639,-73.7865760130465,-73.7866939308742,-73.786792585247,-73.7868633174421,-73.7870089977849,-73.7872608374216,-73.7872750437945,-73.7873663852163,-73.7874825920349,-73.7875892650431,-73.7877337227347,-73.7875984814814,-73.7874804868488,-73.7874784660849,-73.7873713217297,-73.7873428353812,-73.7871569098527,-73.7871662100835,-73.7871118216244,-73.7871409610493,-73.7871220550955,-73.7870716930954,-73.7870180861387,-73.787008480293,-73.7870365636009,-73.7870301496807,-73.7870519342239,-73.7870454440134,-73.7870013048461,-73.7869195745988,-73.7868191320376,-73.7867092900356,-73.7866560716067,-73.7866151227283,-73.7864864746884,-73.7864362036493,-73.7863105856206,-73.7862164026664,-73.7861034603242,-73.7860251070841,-73.7859184031055,-73.7857990768229,-73.7857016646711,-73.7856074738756,-73.7855070755723,-73.7854755802642,-73.7854284537368,-73.7852089146883,-73.7850925721168,-73.785026533055,-73.7848854386844,-73.784838405796,-73.7848068933503,-73.7847378226123,-73.7846843519889,-73.7846278730437,-73.7845745165458],"lat":[40.8605319977584,40.8604722875709,40.8602124795858,40.8601076536337,40.8601003528093,40.8600621913049,40.8598502039805,40.8597335294959,40.8596693001363,40.8596598983884,40.859488413789,40.8594098667138,40.859340743033,40.8593074870184,40.859243164339,40.8591360785074,40.8591242537933,40.8590767026512,40.8590583270918,40.8590316456333,40.8589476871904,40.8589047834341,40.8588450650704,40.8587926124781,40.8587512957318,40.8587907130671,40.8589194055221,40.8589516564444,40.8589625802468,40.8590234920257,40.8590735167732,40.8591130296515,40.8592096362034,40.8591812125095,40.8592206382994,40.8592746028834,40.8592677174449,40.8592143886903,40.8590361420357,40.8589467968277,40.8588573292112,40.8587608972674,40.858686064557,40.8587470020534,40.8587078214664,40.8587831401016,40.8588308482638,40.8588546365193,40.858827496191,40.858827861741,40.8588040815218,40.8587709915781,40.8588660448925,40.8589968271015,40.8591589800949,40.8592468363081,40.8593230251669,40.8595657037077,40.8596014596913,40.8596993992176,40.8597314561973,40.8597552470325,40.8598028055328,40.8598837133197,40.8599432596258,40.8599933452508,40.8600362194651,40.8600934406873,40.8601601404758,40.8602243884116,40.8602671235515,40.8602740857401,40.8602762650881,40.8602356631635,40.8602832393697,40.8602782354894,40.8602972027857,40.8603255617927,40.8603372999249,40.8603275598429,40.8602964411122,40.8602986260295,40.860322230274,40.8603625525809,40.860376673058,40.8603693387245,40.8604050184899,40.8604216093429,40.8603806966483,40.8604519576497,40.8604947206757,40.8604563358526,40.8604443355468,40.8604847804754,40.8604941823846,40.8605322027834,40.8605297148485,40.8605319977584]}],[{"lng":[-73.7732184546988,-73.7732621995875,-73.7733967851429,-73.7733363459062,-73.7732184546988],"lat":[40.8607944638569,40.8606306116497,40.86073948468,40.860853860361,40.8607944638569]}],[{"lng":[-73.7819018153177,-73.7818329046886,-73.7817977390625,-73.7817602138886,-73.7816686385751,-73.781659998409,-73.781716932169,-73.7817195526908,-73.7817733612875,-73.7817983666979,-73.7817944555886,-73.7818671375583,-73.7819160540749,-73.7819713350504,-73.7820177472321,-73.7820678796389,-73.7821065933884,-73.7821064873704,-73.7821552598106,-73.7821746049979,-73.7822008037985,-73.7821063444281,-73.7819893982384,-73.7819018153177],"lat":[40.8764193662272,40.8764087687933,40.8764286836365,40.8764038736948,40.8764236818104,40.8763827519483,40.876223007187,40.876188758343,40.8762174048833,40.87623743366,40.8762830986128,40.8762908475984,40.8762823765974,40.8762444219607,40.8762349943186,40.8762379429248,40.8762827365062,40.8763150875448,40.8763503847837,40.8764019996749,40.8764342026822,40.8765233698447,40.8764699605432,40.8764193662272]}],[{"lng":[-73.7835283143958,-73.7835001052264,-73.7834607445719,-73.7834173078215,-73.7834589736921,-73.7835070623987,-73.7835291227515,-73.7835838935742,-73.7835602079534,-73.7836655067003,-73.7837499209008,-73.7838403243884,-73.7838946102702,-73.783938063828,-73.7839574965726,-73.7838897920714,-73.7838984560303,-73.7840049394705,-73.7839063502643,-73.7838600170837,-73.7837989827466,-73.7837485782934,-73.7837484221692,-73.783702266977,-73.7836387401242,-73.7835558181648,-73.7834861101629,-73.783447066528,-73.7835283143958],"lat":[40.8772408671584,40.8771977778815,40.8772308089542,40.8771761046808,40.8771050073074,40.8770703381494,40.8769925826172,40.8769148890947,40.876822150596,40.8766303398549,40.8765390084702,40.8765197667584,40.8765910434891,40.8766407824011,40.8767004079417,40.8767317304677,40.876749953946,40.8768643657192,40.8770048766487,40.8771703133061,40.8771619231708,40.8772379700125,40.8772859718011,40.8773967864621,40.8774843950608,40.8775007918633,40.8774774881336,40.8774128606742,40.8772408671584]}],[{"lng":[-73.7852513473661,-73.7852100240063,-73.7851771772515,-73.7851358616876,-73.785096372504,-73.7850498696053,-73.7850103119555,-73.7850121828989,-73.7850363904857,-73.7850760889656,-73.7851415950433,-73.7851604890525,-73.7852276039487,-73.7852759191005,-73.7853499785479,-73.7854378807476,-73.7854638081792,-73.7855050721976,-73.7855722807533,-73.7856617968755,-73.7856754910737,-73.7854267081664,-73.7853630020595,-73.7852960424976,-73.7852547266773,-73.7852513473661],"lat":[40.8799088030628,40.8798969541518,40.8799282863347,40.8799138205339,40.8798679649686,40.8798587220603,40.8798337951606,40.8797880159341,40.8797632078067,40.8797449691259,40.87973985801,40.8797595144888,40.8797897245353,40.8797715018206,40.8797860284755,40.8797835762234,40.8797600787215,40.8797902405498,40.8797916736264,40.8798232337279,40.8798520367723,40.8800412441033,40.8800228125264,40.8799442044345,40.879929738676,40.8799088030628]}],[{"lng":[-73.7848358780956,-73.7846915885461,-73.7845122605728,-73.7844347616777,-73.7844718979463,-73.7843968686715,-73.7842652131064,-73.7841145056354,-73.7839854964609,-73.7838224182345,-73.7837664260995,-73.7838106213151,-73.7836945661896,-73.7836667663307,-73.7837015577875,-73.7838412493374,-73.7839528685016,-73.7839689530702,-73.7840664008734,-73.784147814971,-73.7840960101389,-73.7841630484018,-73.7841218517315,-73.7843285043326,-73.7845167411609,-73.7846331056336,-73.7846928539147,-73.7847555422743,-73.7848085394545,-73.7847988879917,-73.7849180655896,-73.7850911337011,-73.7852665214536,-73.7853477067365,-73.785189017492,-73.7849577347024,-73.7848358780956],"lat":[40.8805582744717,40.8805246495356,40.8806592090909,40.8806269376365,40.8805099440716,40.880414501918,40.880357075088,40.8803663240009,40.8804723858658,40.8804244292621,40.8802670756787,40.8801909173924,40.880151108212,40.8800238695864,40.8799319259382,40.8799048619644,40.8798752151735,40.8797671202015,40.8797134147519,40.8797755132244,40.8798734136291,40.8799294962451,40.8800375449411,40.8801999446864,40.8802336521412,40.8801781590513,40.8801339134421,40.8801626213646,40.8802880842218,40.8803485407045,40.8803821187125,40.8802647846527,40.8803890046162,40.8805225775189,40.8806945257664,40.880745811768,40.8805582744717]}],[{"lng":[-73.8197062207993,-73.8195798802582,-73.8194850560712,-73.8194470446169,-73.8193766517293,-73.8192638550414,-73.8192594614578,-73.8193228079943,-73.8194086791859,-73.8194581273736,-73.8195848511527,-73.8196887404384,-73.8197386462506,-73.8197795991469,-73.8197888219001,-73.8197348382722,-73.8196040966057,-73.8194943264822,-73.8194327853892,-73.8193019318854,-73.8192026694702,-73.8191214804555,-73.8191170976628,-73.8191578450162,-73.8192707626138,-73.8193475107463,-73.8194649607783,-73.8194921653581,-73.819569108644,-73.8196324088344,-73.8196672785267,-73.8197363060031,-73.8198582044236,-73.819966568983,-73.8200568782426,-73.8201021762241,-73.8201249413828,-73.8201521831128,-73.8201705264916,-73.820202448795,-73.8202433537734,-73.8202435112473,-73.8202121063766,-73.820135535419,-73.8201266376503,-73.8201268415707,-73.8201994914825,-73.8202628352733,-73.8202629371549,-73.8202043574191,-73.8201465506315,-73.8201276850546,-73.8200510034735,-73.8200240950467,-73.8200784210019,-73.8201689780259,-73.8202686647429,-73.8203374471862,-73.8203090610513,-73.8202566474496,-73.8202162245982,-73.8202130547455,-73.8202809641484,-73.8204098298042,-73.8206199397437,-73.8207182260944,-73.8208167477716,-73.8208948329476,-73.8209965809566,-73.8210568744567,-73.8210432955499,-73.8210130009026,-73.8209759202981,-73.820945639615,-73.8209595614352,-73.820969980602,-73.820974440213,-73.8209769581023,-73.8210448447496,-73.8211127658279,-73.8211536115873,-73.8211639820306,-73.8211236131053,-73.8210358368736,-73.8209480684618,-73.8208907257989,-73.8208583484955,-73.8206991886792,-73.82065127163,-73.8205712412618,-73.8204428188033,-73.8204025485318,-73.8204343494818,-73.8204822005454,-73.8205139359647,-73.8205615736435,-73.8205932936008,-73.8206410787338,-73.8206969055752,-73.8207731605911,-73.8206802646877,-73.8205680689273,-73.8204640131483,-73.820351901436,-73.8202638450277,-73.8201596260193,-73.8200393736932,-73.8199753431325,-73.8199594592641,-73.8199597066553,-73.819975936823,-73.8199440044945,-73.8198478254212,-73.8197598046825,-73.8197601349025,-73.8198085454582,-73.819916531585,-73.8202170542573,-73.8202095437923,-73.820223408475,-73.8202734026321,-73.8203638978662,-73.8205355924314,-73.8206983240576,-73.8208879531168,-73.8211812115105,-73.8212261728902,-73.821284676073,-73.8213541586184,-73.8216491621716,-73.8216327521403,-73.8215832847989,-73.821430208013,-73.8212498006554,-73.8210467514092,-73.8208120701851,-73.8205954538455,-73.8204780529581,-73.8203921729572,-73.8203047240086,-73.8202406138558,-73.8199051939651,-73.8195541714198,-73.8191842773224,-73.8191972438127,-73.8192019147789,-73.8191976723586,-73.8192069319652,-73.8192296957606,-73.8192930158397,-73.8194826893964,-73.8196135737195,-73.8197489255141,-73.8199052704476,-73.8199480323409,-73.8196956727771,-73.8194866343365,-73.8194335795179,-73.8193070687197,-73.8191761949189,-73.8191221625668,-73.8190635702433,-73.8189462911474,-73.8189464404146,-73.8189736717767,-73.8190459909192,-73.8191364206801,-73.8192268769039,-73.8192901979361,-73.8194120908304,-73.8195384612301,-73.8196151723927,-73.8198272899069,-73.8199536780348,-73.8200709463918,-73.8201295018359,-73.8201563429475,-73.8201787209922,-73.8202281790404,-73.8202415252709,-73.8202052404279,-73.8201508651007,-73.8201641742262,-73.8202406546106,-73.8202766994452,-73.8203397219314,-73.8203530320151,-73.8204294845461,-73.8205286463208,-73.8206188620353,-73.8207274986197,-73.8207587938792,-73.8207634832762,-73.8207320716834,-73.8207005968105,-73.8206737190482,-73.8207460842656,-73.8208092100839,-73.8208496664219,-73.8209126710757,-73.8210615377549,-73.8211562680762,-73.8212825101373,-73.8213997539197,-73.8215255067361,-73.8220981283218,-73.8219017632021,-73.8215615796236,-73.8212740721242,-73.8209630412622,-73.8204899982808,-73.8204678422809,-73.8204769706569,-73.8205583070847,-73.8206847978157,-73.8207841879133,-73.8208701473333,-73.8209154947365,-73.8209833822193,-73.821060325111,-73.8211507972168,-73.8212591961336,-73.8213720336084,-73.8214983383185,-73.8215614084057,-73.8216359790352,-73.821945677017,-73.8218875743182,-73.8217612970964,-73.8215628334963,-73.821481516464,-73.8214587010839,-73.8214584159008,-73.8213768960689,-73.8212008061869,-73.8210880325413,-73.8210204682559,-73.8210342768944,-73.8211068052356,-73.8211296303024,-73.8211840046307,-73.8211842073285,-73.8212295267199,-73.821310924384,-73.8214419444385,-73.8215819344758,-73.8217627664947,-73.8218669708162,-73.8219578361546,-73.8219718442932,-73.8219976214233,-73.8219725414266,-73.8219366725247,-73.821896226232,-73.8218873736461,-73.821887557189,-73.8218967951837,-73.8219376633759,-73.8219705250827,-73.8219652846496,-73.8219564130586,-73.8218935210309,-73.8218350215292,-73.8217856047398,-73.8217316003012,-73.8216775414955,-73.82160540264,-73.8214837882122,-73.821411339389,-73.8213480611455,-73.8212891673429,-73.8212393355369,-73.8211805985341,-73.8210767731067,-73.8210136600409,-73.820986709738,-73.8209417890567,-73.8208877120281,-73.8208743291289,-73.8208609921824,-73.8208566715097,-73.8208659297078,-73.8209022295233,-73.8209114124983,-73.8208708766578,-73.8208077095486,-73.820694942123,-73.8206183544149,-73.8205960657219,-73.8205951209726,-73.8205889937872,-73.8205348546445,-73.8204793477214,-73.8202492104295,-73.8201289368279,-73.8199972280692,-73.8192726034273,-73.8189266931716,-73.8186093142649,-73.817734241695,-73.8172811510872,-73.8171045881923,-73.8171321678563,-73.8173408549066,-73.8177883831226,-73.8181661066203,-73.8186395362808,-73.8188293636467,-73.8183302629129,-73.8181557351667,-73.8177497738369,-73.8172257874502,-73.8165908700741,-73.8162851992739,-73.8161233793286,-73.8158377418283,-73.8156167055334,-73.8153787003307,-73.8155321787834,-73.8154902177778,-73.8152539564126,-73.8148934134285,-73.8145001234624,-73.8143803908254,-73.8157876406608,-73.8164145586361,-73.8169976026643,-73.8168449590812,-73.8166212949545,-73.8157366604115,-73.8151732021925,-73.8150889149056,-73.8151590814641,-73.8152245562199,-73.815018054792,-73.8148810257774,-73.8149298412996,-73.8152439525425,-73.8151031538415,-73.8155082906395,-73.8164139210273,-73.8166488977503,-73.8166734511436,-73.8166998719005,-73.8167274466677,-73.8167554309333,-73.8167830691291,-73.8168096150305,-73.8168343519053,-73.8168566118653,-73.8168757938993,-73.8168913801002,-73.8169029496486,-73.8169101901739,-73.8169000986419,-73.8168930053109,-73.8169071127295,-73.8169292010807,-73.8169587679479,-73.8169951408176,-73.8170374923764,-73.8170848593286,-73.8171361643071,-73.8171902403767,-73.8172458575765,-73.8173017508934,-73.8173566490347,-73.8174228633364,-73.8174946717865,-73.8175714449345,-73.8176525098066,-73.8177371558054,-73.8178246409387,-73.8179141983246,-73.8180050429142,-73.8180789506711,-73.8181522799543,-73.8182239488584,-73.8182928999771,-73.8183581160044,-73.8184186347457,-73.8184735633134,-73.8185220913019,-73.8185635027432,-73.818597186671,-73.8186226461335,-73.8186395055248,-73.8186475161255,-73.8186465597711,-73.8186209447384,-73.8185994984742,-73.8185822400276,-73.8185411093534,-73.8185064968899,-73.8184785179755,-73.8184572658376,-73.8184428112822,-73.8184929640527,-73.8185700330994,-73.818655959713,-73.8187914776309,-73.8189494825675,-73.8190849168927,-73.819197740072,-73.8193710177829,-73.8195449763124,-73.8197192080192,-73.8198933046222,-73.8200668581566,-73.82023946193,-73.8203066356453,-73.8202828485718,-73.8202669679571,-73.8204115515322,-73.8205480130711,-73.8211014236926,-73.821350001623,-73.8215664744306,-73.8217670333523,-73.8219673963981,-73.8219911380911,-73.8218304938352,-73.8217422153374,-73.821613676663,-73.8215973878264,-73.8216852746283,-73.8218135516806,-73.8220141293875,-73.8222388060022,-73.8223512657316,-73.822407243871,-73.8222946538731,-73.822141998094,-73.8220137870752,-73.8219254745029,-73.8219171902999,-73.8219731193582,-73.8221736320141,-73.8223502732815,-73.8224626857813,-73.8226392122034,-73.8227754156684,-73.8227190959282,-73.8225343506467,-73.8224138835691,-73.8223143428656,-73.822293465801,-73.8221491092094,-73.822012580825,-73.8219401161444,-73.8218195509981,-73.8216590187428,-73.8215869467944,-73.8216112750702,-73.8216894717082,-73.8216924637047,-73.8216205401917,-73.8215405117246,-73.8214446022487,-73.8213968605195,-73.8213970568015,-73.8213972857994,-73.8214456488136,-73.8213815513288,-73.8212371325298,-73.8211089048712,-73.8209885368425,-73.8209402707989,-73.8209319865486,-73.8209878810678,-73.8210117522057,-73.8209713609405,-73.8209710986057,-73.8210109325885,-73.8210027950278,-73.8209385653091,-73.8208504007906,-73.8207463886159,-73.8206743676083,-73.82052210579,-73.8203615915905,-73.8202090330985,-73.8200805926542,-73.8199922794837,-73.8199760536281,-73.820064135302,-73.8202164306561,-73.8203524329082,-73.8204644195865,-73.8204720313919,-73.8204316052324,-73.8203671786964,-73.8203268193787,-73.8203426504073,-73.8203183681717,-73.8203119137807,-73.8202615721456,-73.8202279185338,-73.8201723331693,-73.8201069613836,-73.8200839171549,-73.8200060349526,-73.8199153170096,-73.8198375878216,-73.8197677452616,-73.819641048894,-73.8195137193205,-73.8194647167815,-73.8194352851437,-73.8194047988668,-73.8193770926057,-73.8193471316074,-73.8189535430748,-73.8189134807487,-73.8188719643612,-73.8188501222153,-73.8188512599791,-73.8188818473955,-73.8189148782768,-73.8189542559541,-73.8191559672191,-73.8193354978936,-73.8195233299826,-73.81971890258,-73.8199216181894,-73.8201835157532,-73.8204506245922,-73.820722721788,-73.8209995802638,-73.8212809689737,-73.8215666530952,-73.8218563942255,-73.8221499505797,-73.8224470771928,-73.8226058537854,-73.8235912425256,-73.8236530946869,-73.8241806766833,-73.8247082676358,-73.8255543837113,-73.8261532357178,-73.8268940432236,-73.8270544139317,-73.8271455629839,-73.8272176947334,-73.8299990383079,-73.8299055380277,-73.8299162390975,-73.8298439885255,-73.8295762357272,-73.8294352707923,-73.8290831870588,-73.8286019716532,-73.8280141596088,-73.8272302606017,-73.8272175114404,-73.8273783576626,-73.8270757933538,-73.8269355604507,-73.8267594811613,-73.8271313332546,-73.827184237589,-73.8269849071501,-73.826878543486,-73.8271115838104,-73.8271898266553,-73.8272466141637,-73.8272573571223,-73.8272815422716,-73.8272945699846,-73.8272856124752,-73.8272548043598,-73.8272024925577,-73.826979355415,-73.8267260158735,-73.8265546067396,-73.8264582938819,-73.8262506803238,-73.825977351434,-73.8258868041304,-73.8257268144441,-73.8255102231047,-73.8254753845592,-73.8255826701322,-73.8254923666768,-73.8249569766314,-73.8244376041839,-73.8239595539916,-73.8230129698969,-73.8220382684854,-73.8211035563378,-73.8204840561741,-73.8201404361447,-73.8191500914545,-73.8182022683034,-73.8172632266091,-73.8163011915219,-73.8151419191866,-73.8152408668624,-73.8152855060849,-73.815343943124,-73.8153563141705,-73.8153575196122,-73.8153183276322,-73.8153173218819,-73.8153234400271,-73.8154509009702,-73.8155173550394,-73.8155300366682,-73.8156337811069,-73.8157014631626,-73.8157624698265,-73.815800208213,-73.8158073300462,-73.8158666602996,-73.8159028142068,-73.815897116493,-73.8158973251068,-73.8158613631583,-73.8157757623118,-73.815694597525,-73.8156314516196,-73.8156044284405,-73.8156045139199,-73.815645166816,-73.8156947683968,-73.8157534032544,-73.8158029843457,-73.8158796857479,-73.8159573475399,-73.8159744992788,-73.8160558923283,-73.8160967060921,-73.8161286299348,-73.8161470557412,-73.8161702681198,-73.8161662285992,-73.8161487223567,-73.8161300604869,-73.8161179735988,-73.8161053747716,-73.8160724677434,-73.8160268511505,-73.8158443288775,-73.8157758661957,-73.8157190383456,-73.8156848863035,-73.8156877032089,-73.8154586761547,-73.8153364437623,-73.8150396314556,-73.8149346545325,-73.8148616003854,-73.8146272778874,-73.8146236381928,-73.8146674141453,-73.8146459469755,-73.814511067696,-73.8145337002393,-73.8145754088475,-73.8146084736806,-73.8148473509641,-73.8149648954781,-73.8151584633276,-73.8153287782356,-73.8154341339023,-73.8155040927003,-73.8154745677966,-73.8155550808555,-73.8155831397372,-73.8156828841434,-73.8156910465961,-73.8157035318945,-73.8156617115367,-73.8156155918577,-73.8156109402784,-73.8155728508249,-73.815514421317,-73.8151637093423,-73.8151179580038,-73.815072223805,-73.8150392207611,-73.8149986361344,-73.8149656982984,-73.8149226573931,-73.8148468378498,-73.8147021413664,-73.8145897658328,-73.8145657911825,-73.814513013641,-73.8144789059203,-73.8144342346963,-73.8144095316957,-73.814357262886,-73.8143327271204,-73.8142787652346,-73.8142426258526,-73.8142011119943,-73.8141615739446,-73.8141239494042,-73.814097764937,-73.8140471037892,-73.8140201039395,-73.8139672085706,-73.8139277174269,-73.8138903665084,-73.8138653271872,-73.8138121855261,-73.8137869919372,-73.8137335496932,-73.8137080557839,-73.8136574083938,-73.8136565472686,-73.8137054212704,-73.813686347382,-73.813611946397,-73.8135637286167,-73.8135830595808,-73.8136274532093,-73.8136447278294,-73.8136958838012,-73.8137209141691,-73.8137731809535,-73.8138000200813,-73.8138511680663,-73.8138789424858,-73.8139064166057,-73.8139548371744,-73.8140064441796,-73.8140339021105,-73.8140842173095,-73.8141126142839,-73.814122486803,-73.814283259677,-73.8143174907764,-73.814423632916,-73.8144309479949,-73.8145818230496,-73.8148431585233,-73.8149085820319,-73.8146569579343,-73.8144690767417,-73.8144235257983,-73.8146550797038,-73.8146044903403,-73.8146817077029,-73.8147529920287,-73.814805342878,-73.8148629624093,-73.8150859385591,-73.815026276043,-73.8142057312911,-73.813990421324,-73.81390002992,-73.813188650725,-73.8131446020024,-73.8138188057648,-73.8140058901369,-73.8140181269572,-73.8139796439502,-73.8134832683883,-73.8134640968365,-73.8139741915033,-73.8140225597418,-73.8140319821938,-73.8139542446311,-73.8136858909351,-73.8136722010049,-73.8139427912892,-73.813902069407,-73.8138566779882,-73.8137289264877,-73.813711148915,-73.8138425886934,-73.8138054459059,-73.813632582327,-73.8136192153525,-73.8136145615574,-73.813609943948,-73.8136062734688,-73.8135984047366,-73.81351835901,-73.8135169818934,-73.8134852598152,-73.813455136879,-73.8134513738106,-73.8134252544073,-73.8134056557892,-73.813401746625,-73.8133590558502,-73.8133531160534,-73.8133309296415,-73.8133192505085,-73.8132893269288,-73.8132129524425,-73.8132188808007,-73.8132835929606,-73.8133078704928,-73.8133121339401,-73.8133380033891,-73.8133435464092,-73.8133608499427,-73.8133659166321,-73.813439644591,-73.8134621533595,-73.8134714600875,-73.8134876816341,-73.8134988042609,-73.813503540281,-73.81352545669,-73.8135288836731,-73.8135513216049,-73.8135551904574,-73.8135771878049,-73.8135815018606,-73.8135833436442,-73.8135905758611,-73.8135923578021,-73.8136030793585,-73.813605296795,-73.8136087496827,-73.8136185826705,-73.8134616641354,-73.8132599772469,-73.8132385841432,-73.8132330638924,-73.813205322668,-73.8131849686936,-73.8131813263456,-73.8131583633644,-73.8131289406328,-73.8131041484968,-73.813100212144,-73.8130700301097,-73.813065715302,-73.8130559203804,-73.8130321484997,-73.8129722205696,-73.8129652515322,-73.8129610902181,-73.8129326707939,-73.8129279178725,-73.8128995185849,-73.8128947510088,-73.8128663452223,-73.8128616248976,-73.8128347148282,-73.8128291043547,-73.8128003477318,-73.8128550632997,-73.8128493995852,-73.8127245767677,-73.8127311850998,-73.8127863772645,-73.8128130245817,-73.8129127269704,-73.8129169557656,-73.8129434074835,-73.8129486182663,-73.8129805049014,-73.812985560734,-73.8130173533951,-73.813021302914,-73.8130425098637,-73.8130896817521,-73.8131151569259,-73.8131199180935,-73.8131402385515,-73.8131518944978,-73.8131663297347,-73.8131693423064,-73.8131900879081,-73.8132008316033,-73.8132133770398,-73.8132173322465,-73.813218832719,-73.8132432635106,-73.8132073362537,-73.8131860321899,-73.813160725449,-73.8131319970072,-73.8131005063921,-73.8130669765418,-73.8130321772085,-73.8129969072877,-73.8129364742229,-73.8128770359743,-73.8128615095885,-73.812994993924,-73.8131491426959,-73.8131559704426,-73.8129934380875,-73.8128553695764,-73.8128312182496,-73.8127509619538,-73.812693573955,-73.8126365379925,-73.8126084648789,-73.8125892469618,-73.8125852677471,-73.8125157943753,-73.8124888632218,-73.8124698203481,-73.8124666572753,-73.812446578716,-73.8123658932568,-73.8123400385257,-73.8124144532813,-73.8124095770757,-73.812277909005,-73.8122817026538,-73.8123296013301,-73.812392256646,-73.8124016231017,-73.8124046054104,-73.8124274491957,-73.8124437463115,-73.8124515242828,-73.8124551804163,-73.8124653783111,-73.8124794586284,-73.8124976903203,-73.8125012415216,-73.8125193042311,-73.8125224745487,-73.8125449024088,-73.8125481027328,-73.8125679545067,-73.8125709100481,-73.8125890919343,-73.8125930732497,-73.812615865814,-73.8126206686793,-73.8126475317541,-73.8126521176322,-73.8126774039104,-73.8126816651072,-73.8127030530214,-73.8127073748351,-73.8127300363471,-73.8127336955554,-73.8127591373199,-73.8127626091815,-73.8127877924403,-73.8127916089606,-73.8128148070046,-73.8128187370874,-73.8128414355154,-73.8126067542148,-73.8126137878729,-73.8128489654355,-73.8128577433796,-73.8127867706024,-73.8127181552948,-73.8126522859257,-73.8126418703826,-73.8126343178552,-73.812629831571,-73.8126285322483,-73.8125445781561,-73.8124400843135,-73.8125486646436,-73.8125384434407,-73.8124554405323,-73.8121886034577,-73.8121748149628,-73.8119550455182,-73.8119612733902,-73.8120338371347,-73.8120217236312,-73.8120350162966,-73.8120266504,-73.8119156826697,-73.8118845884479,-73.8123023649692,-73.8124362506068,-73.8124235865464,-73.8123025520204,-73.8118776605891,-73.8118414922167,-73.8116997182366,-73.812233869483,-73.8122410762878,-73.8123181679274,-73.8123193698125,-73.8123295612444,-73.8123427710665,-73.8124322321851,-73.8124339819535,-73.8124478650901,-73.8125155335495,-73.8125175368001,-73.8125270477547,-73.8126011278366,-73.812603205657,-73.8126213520924,-73.8126482067927,-73.8126614134905,-73.8127730610859,-73.8127839530399,-73.8127836079504,-73.8127836078717,-73.812713811827,-73.8127124230172,-73.8127159662068,-73.8127238416698,-73.8127238765243,-73.8127269832805,-73.8127281625235,-73.8127761871604,-73.8127769894226,-73.8127779007893,-73.8127784125106,-73.8127788168698,-73.8127809680088,-73.8128212193793,-73.8127999523388,-73.8127612352982,-73.8127686268217,-73.8127760709977,-73.8128055118806,-73.8128055465145,-73.8129912030509,-73.8129832521807,-73.8129718121892,-73.8127595582514,-73.8127613503798,-73.8127618323915,-73.8127440865004,-73.8127149339389,-73.8127124043984,-73.8127033728049,-73.8127026798965,-73.8126978656711,-73.8126488933667,-73.8128973137083,-73.8129107442697,-73.8129022578512,-73.8129117569329,-73.8129622078909,-73.8129721379384,-73.8131131815287,-73.8130928806674,-73.8130451020571,-73.8130361971366,-73.8130704182701,-73.8130647312541,-73.8131179502371,-73.8130933831711,-73.8126574446262,-73.81268023985,-73.8126798460958,-73.8126409580988,-73.8125490912071,-73.8126339711425,-73.8126402547584,-73.8126490403652,-73.8126600771203,-73.812673049908,-73.8126875883367,-73.8127032773139,-73.8127196688978,-73.8128536716306,-73.8129874745305,-73.81312081807,-73.813253443612,-73.8133517176972,-73.8134495813784,-73.8135466887783,-73.8135476194774,-73.813590956465,-73.813632964982,-73.8136558066226,-73.81367848753,-73.8137004384586,-73.8137211084837,-73.8137399788294,-73.8137565758887,-73.8137704831102,-73.8137813514526,-73.8137889081448,-73.8138395778087,-73.8138918509207,-73.8139437772937,-73.813993037978,-73.8140386313179,-73.8140796302314,-73.8141152010613,-73.8141446205272,-73.8141672904315,-73.8141827498229,-73.8141159138815,-73.8138620492568,-73.8138669488305,-73.8137494073526,-73.8137397620452,-73.8136997928781,-73.8136916217812,-73.8138959146429,-73.8138938118501,-73.8139510805004,-73.8139610494715,-73.8140379566188,-73.8141865321259,-73.8141833459243,-73.8141709755544,-73.8141497483516,-73.8141202259988,-73.8140831896637,-73.8140396193277,-73.8139906678556,-73.813937630491,-73.8138819105857,-73.8138330077081,-73.8138152811744,-73.8137298702264,-73.8136615023602,-73.8135997578634,-73.8135668404702,-73.8135498805841,-73.8135465137914,-73.8135052138373,-73.8134659709455,-73.813439498365,-73.8134271652066,-73.8134199487959,-73.8133991233128,-73.8133778195054,-73.8133647955676,-73.8133602709468,-73.8133643218681,-73.8133768800506,-73.8133977338596,-73.813426531874,-73.8134627888089,-73.8134706917192,-73.8134795659818,-73.8134891572699,-73.8134991907076,-73.8135093787479,-73.8135588409846,-73.8136086929264,-73.8136578421933,-73.8137052118032,-73.8137611804303,-73.813816610881,-73.8138707772932,-73.813922970358,-73.8139725066088,-73.8140238704326,-73.8140752545558,-73.8141257140199,-73.8141743208718,-73.8142201812293,-73.8142913037507,-73.8143665233124,-73.8144449484793,-73.8145256498288,-73.8146076709653,-73.8146900398539,-73.8147717803383,-73.8148519237091,-73.814929520183,-73.8149995503978,-73.8151072615887,-73.8152000111292,-73.8152061150469,-73.8152154086516,-73.8152276487061,-73.8152425148562,-73.8152596180147,-73.8153502700967,-73.8154380215341,-73.8155226281984,-73.8155372332858,-73.8155500222679,-73.8155606685274,-73.8155689001696,-73.8155745069658,-73.815577345723,-73.8155773439405,-73.8155755007832,-73.8155772347555,-73.8155824946493,-73.8155911251229,-73.8156028712879,-73.8156173862378,-73.8156342412926,-73.8156529386594,-73.8156729261346,-73.8156936134119,-73.8157143895173,-73.816164178151,-73.8162257100844,-73.8162853775263,-73.8162925777523,-73.8162994264437,-73.8163057192387,-73.8163112683633,-73.8163159082344,-73.8163195004005,-73.8163219376735,-73.8163231473266,-73.8163230932645,-73.8163217771009,-73.8163192381096,-73.8163155520532,-73.8162990229885,-73.8162843363742,-73.8162709582224,-73.8162604434476,-73.8162530648017,-73.8162490136846,-73.81624839518,-73.8162512253293,-73.816253425353,-73.8162621479775,-73.8162771603,-73.8162980614844,-73.8163242934637,-73.8163551558415,-73.8163898245921,-73.81641253249,-73.8164358375462,-73.8164593384328,-73.8164826304492,-73.8164962733558,-73.8165086766274,-73.8165195055772,-73.816528467999,-73.8165353220522,-73.8165398827878,-73.8165403343665,-73.8165413278481,-73.8165428357055,-73.8165448161591,-73.8165472143346,-73.8165499637838,-73.816552988325,-73.8165562041547,-73.8165592794263,-73.8165623693186,-73.8165654001879,-73.8165682997971,-73.8165709990377,-73.8165734335766,-73.8165755453897,-73.8165772841444,-73.816578922803,-73.8165816957347,-73.8165855723879,-73.8165904553037,-73.8165962393766,-73.8166028001038,-73.816609996265,-73.8166311886927,-73.8166556135526,-73.8166826036387,-73.81671142167,-73.8167412804313,-73.8167713642772,-73.8168008514139,-73.8168289363479,-73.8168471978876,-73.8168682698779,-73.8168915669467,-73.8169164419108,-73.8169422037544,-73.8169681368251,-73.8169935207139,-73.8170176502674,-73.8170398551769,-73.8170595185985,-73.8170760942889,-73.8170891217797,-73.8170982391694,-73.8170950774138,-73.8170883528664,-73.8170782285912,-73.8170748905506,-73.8170726400087,-73.8170715385916,-73.8170716164595,-73.8170728714803,-73.8170752692885,-73.8170787442258,-73.8170832011393,-73.8170885179865,-73.817094549178,-73.8171011295632,-73.8171080789531,-73.8171152070546,-73.8171502115056,-73.8171863661518,-73.8172230127439,-73.817318417593,-73.8174111925374,-73.8175007297444,-73.8178327782065,-73.818237227462,-73.8182406589385,-73.8182412446042,-73.8182389684846,-73.8182338926705,-73.8182261556239,-73.8182159684011,-73.81820566336,-73.8181969617752,-73.8181901007568,-73.8181852672606,-73.8181825929942,-73.8181821508281,-73.8181839528096,-73.8181879498357,-73.81819403299,-73.8181998513498,-73.8182012721772,-73.8181982605537,-73.8181908905061,-73.8181688784387,-73.8181467063517,-73.818124900995,-73.8181039804059,-73.8180844416024,-73.8180667487753,-73.8180513222605,-73.8180169560161,-73.8179752922442,-73.8179273261021,-73.8178629648026,-73.8178056429797,-73.8177477623424,-73.8176899451924,-73.8176328131487,-73.8175964382085,-73.817560773828,-73.8175133163231,-73.8174690798156,-73.8174286845478,-73.8173926969016,-73.8173623276441,-73.8173370357932,-73.817317158646,-73.8172802949458,-73.8172367353426,-73.8171870417961,-73.8171687840582,-73.8171497695999,-73.8171305527103,-73.81711169358,-73.8166906816595,-73.8166787769689,-73.8166560019096,-73.8166267732509,-73.8166073293189,-73.8166123479289,-73.8166123614215,-73.8166124449865,-73.8165766843614,-73.8165588516266,-73.8165150336826,-73.8164883009426,-73.8164445195421,-73.816437307343,-73.8164227791619,-73.8163911616508,-73.8163668695046,-73.8163580944543,-73.8163523318216,-73.8163548994837,-73.8163623571412,-73.8163503053,-73.8163090098576,-73.8162726047105,-73.816231304312,-73.8162021785277,-73.8161511234762,-73.8161048455927,-73.8160268382358,-73.8159683757196,-73.8159387775397,-73.8159099453582,-73.8158758983187,-73.8158670454382,-73.81572300132,-73.8151711366487,-73.8151693681791,-73.8157020784641,-73.8156179809096,-73.8155069834491,-73.8154424353357,-73.8154150389641,-73.8154059927484,-73.8154079001159,-73.8154336165864,-73.815468470902,-73.8154696807442,-73.8155051742527,-73.8155235497514,-73.815547439729,-73.8155640603642,-73.8155641952185,-73.8155587940179,-73.8155754062468,-73.8155920683093,-73.8155849216333,-73.8155686985858,-73.8155250681465,-73.8154721739664,-73.8154264944484,-73.8153753573668,-73.815329696999,-73.8153023861439,-73.8152915382386,-73.8152898587315,-73.815280836544,-73.8152626339768,-73.8152321123266,-73.8147974828058,-73.8148029338856,-73.814762631631,-73.8147334581754,-73.8152202617932,-73.8152171393888,-73.8152208963107,-73.8152337864045,-73.8152467125467,-73.8152340488725,-73.8152213556616,-73.8152050368038,-73.8151831980254,-73.8151485803036,-73.8151285472972,-73.8151085263405,-73.8150999866279,-73.8150903351601,-73.8150739887726,-73.8150667815675,-73.8150663842937,-73.8150539910944,-73.8149789055192,-73.8149802577071,-73.8149157299578,-73.8149116325971,-73.8149047708611,-73.8149006993824,-73.8149089431792,-73.8149075878783,-73.8149707522553,-73.814973479379,-73.8150491262821,-73.8150056976559,-73.8149733621314,-73.8148064669615,-73.8143659650249,-73.8143618858795,-73.8147969788075,-73.8147889293363,-73.8147793515544,-73.814767019701,-73.8147587878242,-73.8147450638567,-73.8147326967354,-73.8147203367439,-73.814709358142,-73.8146983896073,-73.8146956741557,-73.8146998384361,-73.8147053767567,-73.8147191417947,-73.8147301844657,-73.8147302657414,-73.814727617052,-73.8147231968448,-73.8144750552295,-73.8144709519398,-73.8143844488858,-73.8143871700994,-73.8143157879995,-73.8143090013369,-73.8143845099534,-73.8143872282593,-73.8144709751941,-73.8144696206151,-73.8147199908371,-73.814696501575,-73.8147827774028,-73.8153884348915,-73.8153996642433,-73.8154258702916,-73.8154524280019,-73.8154778607282,-73.8154791850998,-73.8154882391219,-73.8155239012534,-73.8155505602015,-73.8156032216945,-73.8156738410572,-73.8157448110248,-73.8158071304548,-73.8158557949209,-73.8158953035643,-73.815974622831,-73.8160712447756,-73.816141410551,-73.8162023707931,-73.8162770371852,-73.816311289325,-73.8163406748573,-73.8163414725142,-73.8163088092681,-73.816287212934,-73.8162873039007,-73.81630907304,-73.8163222502615,-73.8163525367423,-73.8164090687099,-73.8164525792931,-73.8164787847787,-73.8164789029115,-73.8164486963231,-73.816440331229,-73.8164276553981,-73.8164236541232,-73.816415252095,-73.8163981838119,-73.8163898006928,-73.8163640764483,-73.816342598245,-73.816299398821,-73.8162344751259,-73.8161954944487,-73.8161609048521,-73.8161696614168,-73.816200140537,-73.8162046689658,-73.8161832652041,-73.8161402371855,-73.8160928011742,-73.8160606823468,-73.8159803691234,-73.8159241026841,-73.8158894855888,-73.8158505060959,-73.8157854008651,-73.8157116310458,-73.8156595654215,-73.8156248030444,-73.8155683816207,-73.8155250092251,-73.8155033860899,-73.8155034683068,-73.8155425777755,-73.8156120011819,-73.8156770514443,-73.8157204791911,-73.8157942671827,-73.815907090596,-73.815993908747,-73.8160524959286,-73.8160633957422,-73.8160765805811,-73.816076735398,-73.8160725620593,-73.8160451953109,-73.8160380101668,-73.816007730707,-73.8159817358456,-73.8159253513383,-73.8158776139851,-73.8157908693572,-73.8157214737434,-73.8156780462313,-73.8156433473114,-73.8155999760879,-73.815573970601,-73.8155783626436,-73.8156088051427,-73.8156955497225,-73.8157562805806,-73.8158517370141,-73.8159602407221,-73.8160253803278,-73.8160399882679,-73.816081883136,-73.8160907677206,-73.8161083345374,-73.8161042242727,-73.8160913869234,-73.8160437774296,-73.8160274400796,-73.816000541868,-73.8160006876349,-73.8160225096873,-73.8160230989378,-73.8160617003037,-73.8160705477507,-73.816092452309,-73.8160840140111,-73.8160408429049,-73.8160105821284,-73.8160103949569,-73.8159715667784,-73.8159195203279,-73.8158327490351,-73.8157720190827,-73.8157112448259,-73.8156808845105,-73.8156635813926,-73.8156636179007,-73.8157027066653,-73.8157721467864,-73.8158893052214,-73.8159934709227,-73.816007033034,-73.8160282952324,-73.8160284045402,-73.8160373254812,-73.8160374712174,-73.816020349623,-73.8160118301665,-73.8160119668146,-73.8159921514914,-73.8158948330424,-73.8158880117102,-73.815986842867,-73.8159392098233,-73.8158947343834,-73.8158712174199,-73.8158473907212,-73.8158304047392,-73.8158109436731,-73.8157841289219,-73.8157596920095,-73.8157328297484,-73.815708460203,-73.8156987722173,-73.815711012309,-73.8157403130773,-73.8157794243231,-73.8158039439408,-73.8158059526157,-73.8158163205059,-73.8158140512653,-73.8158069268924,-73.8157851755373,-73.8157609901928,-73.8157586844308,-73.8157393159134,-73.8157004506566,-73.8156615055311,-73.8156396258708,-73.8156445557613,-73.8156568720886,-73.8156106989206,-73.815588964017,-73.8155262657415,-73.8155244505928,-73.8155141574199,-73.8155014834025,-73.8154869578572,-73.8154541550417,-73.8154194756017,-73.8153847503635,-73.8153677860341,-73.8153617809695,-73.8153501288317,-73.815344736913,-73.8153485148566,-73.815335850277,-73.8153177466556,-73.8152868698753,-73.8152357807792,-73.8151956401506,-73.8151518135254,-73.8151338912924,-73.8151188664175,-73.8150988766933,-73.8150714384771,-73.8150421911749,-73.8150312525412,-73.8150331170411,-73.8150477812449,-73.8150569635502,-73.8150846899563,-73.815088098715,-73.8151100708893,-73.8151174361385,-73.8151101712988,-73.8151011044328,-73.8150847377675,-73.8150701972006,-73.8150483259506,-73.8150227643652,-73.8150063166291,-73.8149898688952,-73.814984511838,-73.8149752588367,-73.8149729760761,-73.8149684567078,-73.8149572833039,-73.8149519676385,-73.8149466146564,-73.8149121065449,-73.8148793738859,-73.8148534691479,-73.8144922101245,-73.8144703368803,-73.8148431343242,-73.8147638769196,-73.8147141889604,-73.814683158638,-73.8146521167262,-73.8146119624998,-73.8145791217014,-73.8145444348586,-73.814520085777,-73.81410298739,-73.8141102792525,-73.8139142538886,-73.8138978336049,-73.8140920523134,-73.8140993510555,-73.8145101652145,-73.8145006325293,-73.8144714671745,-73.8144453576978,-73.8144099091828,-73.8143838372897,-73.8143581843146,-73.8143380501204,-73.8143124359146,-73.8142941626632,-73.8142869104826,-73.8142869880651,-73.8143035052965,-73.8143209286822,-73.8143164480169,-73.8143092068151,-73.8138658529302,-73.8138567197728,-73.8142995929505,-73.8142727119395,-73.8142289401408,-73.8141559330912,-73.8141048006587,-73.8140463568647,-73.8139984413421,-73.8139659353652,-73.8139385175097,-73.8139038412146,-73.8138838073233,-73.8138679378801,-73.8138517939896,-73.8138208738557,-73.8138209499012,-73.8138308107145,-73.8138677501533,-73.8137029600182,-73.813668312847,-73.8137287650805,-73.8137360131045,-73.8138870950396,-73.8138897124657,-73.8138574204293,-73.8138282919232,-73.8137633077989,-73.8137113628734,-73.8136972627912,-73.8135849447628,-73.8135666995527,-73.8136888187084,-73.8136854929935,-73.8136693194785,-73.8136564617829,-73.8136337970831,-73.8136111049434,-73.8135753674372,-73.8135461419287,-73.8135135811422,-73.8135005227725,-73.8134614348019,-73.8134126382602,-73.8133768730721,-73.8133671922626,-73.8133704936298,-73.8133900852403,-73.8134323970129,-73.8134584728562,-73.8134943425402,-73.8135042040958,-73.8134977892983,-73.8134816159596,-73.813452508981,-73.8133876638912,-73.8133422382898,-73.8132902732814,-73.81324478515,-73.8131992751329,-73.8131439886681,-73.8130984034398,-73.8130462988403,-73.8129942089801,-73.8129839301872,-73.812951923809,-73.8129259173973,-73.8129032191877,-73.8129306165897,-73.8129651710785,-73.8129945006207,-73.8130400918921,-73.8130824246847,-73.8131247229838,-73.8131605294834,-73.8131801140892,-73.8131704043748,-73.8131574154038,-73.8131281354097,-73.8130988614717,-73.8130760378923,-73.8130532689485,-73.8130500584292,-73.8130631454475,-73.813118480342,-73.8131478310238,-73.8131316371516,-73.8130861488048,-73.8130373736047,-73.8129787581481,-73.8129397051508,-73.8128812007982,-73.812866082337,-73.8128390283324,-73.8128001500006,-73.8128100389849,-73.8128166495417,-73.8128214135037,-73.8128395008979,-73.812859133722,-73.8128754802889,-73.8128723317002,-73.81283989702,-73.8127977174069,-73.8127546999452,-73.8124174328869,-73.8120796739831,-73.8117415799814,-73.8114033077851,-73.8110650143803,-73.8107268567628,-73.8103889918656,-73.8100515764855,-73.8100336442129,-73.8100156832947,-73.8099981954792,-73.8099816692984,-73.8099665664201,-73.809953308751,-73.8099422666506,-73.8099337485845,-73.8099279925079,-73.8099251592181,-73.8099253278625,-73.8099325433493,-73.8099447664056,-73.8099619500682,-73.8099624358324,-73.809968122924,-73.8099788751916,-73.8099944352269,-73.8100144305278,-73.8100383824158,-73.8100657174957,-73.8100957813825,-73.8101475196664,-73.8101942896023,-73.8102352369114,-73.810269613664,-73.8102967919413,-73.8110544605963,-73.8110488018747,-73.810253570973,-73.8102530402304,-73.8100372492007,-73.8100379206187,-73.8102781872553,-73.8102768273065,-73.8118244055815,-73.8118262315602,-73.8110733071719,-73.8110732679615,-73.8111791164733,-73.8112852338383,-73.8113912069858,-73.8114966234066,-73.8115913931115,-73.8116866942923,-73.811781769628,-73.8118758635928,-73.8119682284601,-73.8120581302453,-73.812144854539,-73.8122351380816,-73.8123282215825,-73.812423356994,-73.8125197797804,-73.8126167150614,-73.8126397526309,-73.8126612868316,-73.8126806763198,-73.8126973436275,-73.8127107923613,-73.8127206219858,-73.8127265397527,-73.8127283694192,-73.8127260564967,-73.8127196698731,-73.8127142181199,-73.8127008776583,-73.8126799843073,-73.8126520640051,-73.8127979333841,-73.8129404977351,-73.8130795869687,-73.8132229790977,-73.8132773160344,-73.8133273326761,-73.8133724554688,-73.8134174681474,-73.8134547046715,-73.8134739710259,-73.8135070682508,-73.8135478091757,-73.8135953259904,-73.8136486065598,-73.8137065159831,-73.8137678207673,-73.8137981805222,-73.8138257449556,-73.8138497484506,-73.8138695242988,-73.8138845232188,-73.8138943286125,-73.8138986681358,-73.8138974212627,-73.8138906226319,-73.8138784610843,-73.8138612744173,-73.8138395400014,-73.8138138615211,-73.8137789642947,-73.8137481693651,-73.8137223181829,-73.813702337665,-73.8136883958316,-73.8136808639474,-73.8136799425784,-73.8136856562516,-73.8136978528027,-73.8137073710427,-73.8137220768661,-73.8132835686148,-73.8132848536817,-73.8129229322513,-73.8129177613123,-73.8132744481454,-73.8132783556246,-73.8137278785022,-73.8137529320312,-73.8137841182382,-73.8138208676619,-73.8138625092606,-73.8138997342262,-73.8139341693493,-73.8139649015671,-73.8139911160033,-73.8140121175749,-73.8140273494223,-73.8140364076743,-73.8140390521563,-73.8140352127576,-73.8140230126381,-73.8140047246136,-73.8139805003555,-73.8139505407615,-73.8134288592628,-73.813421021972,-73.8139416195339,-73.8139102545155,-73.8138789643991,-73.8138511992681,-73.8138277314119,-73.8138092135883,-73.8137961608678,-73.8137889363065,-73.8137877408491,-73.8137926077398,-73.8138034015987,-73.8138290576461,-73.8138415853741,-73.813829275571,-73.8137952351766,-73.813736290188,-73.8136679712903,-73.8136442164446,-73.8135685798207,-73.8134909326114,-73.8134257476033,-73.8133352260609,-73.8130309657201,-73.8130340268444,-73.8129659052157,-73.8129563524864,-73.8121258876149,-73.8121135055644,-73.8128817989562,-73.8128911019115,-73.8129470915405,-73.8129378151285,-73.8130000069775,-73.8130123891882,-73.8132773551531,-73.8132419865788,-73.813208858732,-73.8131785656139,-73.8131486714175,-73.8131236849481,-73.8131041679755,-73.8130905592961,-73.8130831648673,-73.8130821509301,-73.8131129888851,-73.8131491302248,-73.8131901331362,-73.8132354963787,-73.8133594651704,-73.8134870982855,-73.8136181331788,-73.8138271853461,-73.8140374584335,-73.8140408448481,-73.8140357980516,-73.81402237526,-73.8140007286102,-73.813971103435,-73.8139338354817,-73.8138893471068,-73.8138381424887,-73.8137808019139,-73.8132741739903,-73.8131933924457,-73.8130768789268,-73.813042823725,-73.8130035472027,-73.812959717414,-73.8129120798627,-73.8128614448219,-73.8128327712025,-73.8128102869812,-73.8127945278077,-73.8127858691231,-73.8127845172148,-73.8127905043014,-73.8128036877634,-73.8128173443128,-73.8128236566099,-73.8128225586798,-73.8128140619764,-73.8128076985411,-73.8127991150637,-73.8127885598976,-73.8127763384447,-73.81276280432,-73.8127483491194,-73.8127333910894,-73.8127183630255,-73.8126756502515,-73.8126392148461,-73.8126098854335,-73.812588329026,-73.8125479139513,-73.8125003074121,-73.8124460443369,-73.8123857344439,-73.8123200553901,-73.8122497451572,-73.8121755937595,-73.812098434368,-73.8120191339488,-73.8119583961351,-73.8118967959948,-73.8118347927711,-73.8117728487121,-73.8117418282739,-73.8117141696216,-73.8116904818479,-73.8116712866018,-73.8116570066004,-73.8115875271899,-73.8116435561962,-73.8116110045945,-73.8115584476889,-73.8114545011042,-73.8113923576518,-73.8113333076675,-73.8112648967289,-73.8112213626614,-73.8111933302495,-73.8111870694364,-73.8111900957045,-73.81121173987,-73.8112116327237,-73.8112115255787,-73.8112037968404,-73.8111990300533,-73.8111679578843,-73.811165618315,-73.811140032556,-73.8111214561669,-73.8111029139569,-73.8110594541496,-73.811031475256,-73.8110220608272,-73.8109752916904,-73.810917179315,-73.8108472867865,-73.8108749629438,-73.8107848528644,-73.8107619255919,-73.8106860176446,-73.8106424254141,-73.8105273450312,-73.8104682542687,-73.8104091439626,-73.8103686761895,-73.8103312351884,-73.8103187056486,-73.8102968738705,-73.8102502588457,-73.8102067852445,-73.8101601978205,-73.810060786379,-73.8099084122116,-73.8098057667835,-73.8096802803618,-73.8096548114175,-73.8095722864966,-73.8094414449777,-73.8093511936931,-73.8093044631584,-73.809248390892,-73.8092201827142,-73.8091981684224,-73.8091670077784,-73.8090923463355,-73.8089867544216,-73.8088874446278,-73.8087849392144,-73.8087071904249,-73.8085921340646,-73.8085330967543,-73.8084692265089,-73.8084337057101,-73.8083840505431,-73.8082753447704,-73.8081634785856,-73.8080795965591,-73.8079977808527,-73.8079843115868,-73.8079524936244,-73.8079630929977,-73.8078932372404,-73.8078342131929,-73.8077595716811,-73.8077252416483,-73.8077095757198,-73.8076660476525,-73.8076474856112,-73.807638266558,-73.8075731156243,-73.807520395043,-73.8074645951476,-73.8074150086962,-73.8073467725187,-73.8073096909888,-73.8072756765167,-73.8072287509376,-73.807160845786,-73.8071018772567,-73.8070211300518,-73.8069777115221,-73.806977793687,-73.8069965461088,-73.8069719145262,-73.8069192700426,-73.8068667277531,-73.806817273037,-73.8068081100321,-73.8068081786769,-73.8068082607938,-73.8067898298338,-73.806755870361,-73.8067342839933,-73.8066940271137,-73.806664162534,-73.8066505545862,-73.8065977325197,-73.8065636155498,-73.8065730253078,-73.8066330592573,-73.8066383521798,-73.8067160719037,-73.8067534553839,-73.8067753629629,-73.8067786621553,-73.8067540243223,-73.8067075535402,-73.8066547729154,-73.8065926709169,-73.8065398628888,-73.8065397101215,-73.8065212539744,-73.8065181940753,-73.8065297547852,-73.8065880080752,-73.8066999140311,-73.8067310469394,-73.806735342719,-73.8067685314543,-73.8067904943618,-73.8067690180941,-73.8067505806003,-73.8067071497296,-73.8066480936659,-73.8066002188435,-73.8065393085972,-73.8064833936376,-73.8064648061047,-73.8064648678868,-73.806508429719,-73.8065799422166,-73.8066047566365,-73.8066638763996,-73.8066919772899,-73.8067045847851,-73.80668314902,-73.8066616600063,-73.806599757719,-73.8065626290151,-73.8065097749169,-73.8064258275136,-73.8063418940225,-73.8062641747481,-73.806236306937,-73.8063016326953,-73.8063793853489,-73.8064602741805,-73.8065101867103,-73.8065050797659,-73.8064917147143,-73.806445390686,-73.8063835502065,-73.8062998237945,-73.806225183705,-73.8061287548796,-73.8060479275223,-73.8059671442928,-73.8059516912445,-73.8060107945038,-73.806082326132,-73.8061476308591,-73.8062005477241,-73.806222420821,-73.8062226476388,-73.8062113647403,-73.8061182882493,-73.806073806414,-73.806046766092,-73.8058623716859,-73.8058246558085,-73.8058174821957,-73.8058513922027,-73.805907484134,-73.8059582248968,-73.8059914283401,-73.8059915984894,-73.8057280298973,-73.8057100839702,-73.8054738643781,-73.8052355907071,-73.8050720219921,-73.8046193120521,-73.80451800417,-73.8044105711301,-73.8042972573555,-73.8041783206438,-73.8040540315811,-73.8039246729261,-73.8037905389667,-73.803651934851,-73.8035091758928,-73.8034832064931,-73.8033684017512,-73.8032484670737,-73.8031341850176,-73.8030136293461,-73.8028833922421,-73.802760080837,-73.8026740763416,-73.802623235675,-73.8025940094008,-73.8025896612499,-73.8025867881536,-73.8025743402983,-73.8025613548567,-73.8025216340177,-73.8024681188674,-73.8024134171439,-73.8023342207742,-73.8023002425323,-73.8022676565956,-73.8022483224924,-73.8022027900624,-73.8020789287186,-73.8020456072146,-73.8020400944291,-73.801973349582,-73.8019326756342,-73.8018849361756,-73.8018129625523,-73.8017106198057,-73.8016114536859,-73.8014985136908,-73.8013920458055,-73.8012881698646,-73.8011860143385,-73.8011161460993,-73.8010513143208,-73.8010252513584,-73.8009268453128,-73.8008136824253,-73.8007085972132,-73.8006160524236,-73.8005902735804,-73.8005840214995,-73.8005684515212,-73.8005679605196,-73.8005746516598,-73.8005160029977,-73.8004170302871,-73.8003254013056,-73.8002238603039,-73.8001227405154,-73.8000140431831,-73.7999014186753,-73.799805728772,-73.7996912444983,-73.7995719363102,-73.799455107581,-73.7993498978655,-73.7985000773509,-73.7984179385739,-73.798332848887,-73.798245520913,-73.7982054396376,-73.7981666758162,-73.7981302361626,-73.7980970670298,-73.7980680298318,-73.7979860293138,-73.7979489597052,-73.7978689666603,-73.7977554611174,-73.7976536852015,-73.7975903277733,-73.7974058787621,-73.7973296095186,-73.7973811257354,-73.7974408099615,-73.7977146523678,-73.7981194529348,-73.7986422064661,-73.79902816314,-73.7999467818626,-73.8001114686428,-73.8004882479157,-73.8009159323764,-73.8011064751458,-73.8013199185646,-73.8014580051732,-73.8017456121596,-73.8015199255211,-73.801426344477,-73.8013738591895,-73.8013390614121,-73.8013915444651,-73.8013880688277,-73.8014038096885,-73.801551198696,-73.8017593218082,-73.8019565913249,-73.802013108274,-73.8020682496527,-73.8021210992062,-73.802168428493,-73.8022121794471,-73.8022516945694,-73.8022863800206,-73.8023540595906,-73.8024277929201,-73.8025068642782,-73.8025905061224,-73.802677906549,-73.8027682171737,-73.8028605613658,-73.8029540427573,-73.8030477539426,-73.8031407852856,-73.8032322337489,-73.8033212116582,-73.8034068553182,-73.8034338575561,-73.8034632079808,-73.8034704956739,-73.8035124352523,-73.8035268592631,-73.8035492184108,-73.8035555484148,-73.8035786567395,-73.8036139015812,-73.8036278344226,-73.8036452509816,-73.8036539209511,-73.8036503478132,-73.8036401312316,-73.8035502187794,-73.803519979065,-73.8036206332804,-73.8037375716227,-73.8037791201988,-73.8036142926104,-73.8036849282066,-73.8037041566978,-73.8037717135113,-73.8037917388227,-73.8038570501525,-73.8038800682625,-73.8039469302265,-73.8039812059659,-73.8039936054988,-73.8041738900948,-73.8042365320176,-73.8042523834905,-73.8043443365333,-73.8043581034669,-73.8043212786793,-73.8041900498615,-73.8041536530105,-73.8041423746033,-73.8042289959179,-73.8041586682089,-73.8039504012368,-73.8039433872392,-73.8038963670915,-73.8038718966309,-73.8038485009328,-73.8037987113862,-73.803778024134,-73.8037256192977,-73.8037061279856,-73.8036018909318,-73.8035592119364,-73.8036145580595,-73.8035137064307,-73.8034592136554,-73.8033882074123,-73.8033003046774,-73.8032529445498,-73.8032354331692,-73.8033443955357,-73.8033496817058,-73.8034610138013,-73.8034517716016,-73.8033679511692,-73.8033639921698,-73.8032320137872,-73.8032244936663,-73.8032936529357,-73.8033564154196,-73.803358651603,-73.8034551929976,-73.8034503981994,-73.8035193755952,-73.8035256557728,-73.8035592196192,-73.8035838963598,-73.8036336240181,-73.8036399068595,-73.8036969274879,-73.8037019767617,-73.8039670445713,-73.8040439378232,-73.8040543627898,-73.8040714340426,-73.8040907340826,-73.8041842844068,-73.8041737995519,-73.8041908025352,-73.8041770111733,-73.8041919164269,-73.8042112142561,-73.804249138364,-73.8043747213264,-73.8044346589742,-73.8044540717867,-73.8045223146546,-73.8045308160983,-73.8044336759107,-73.8042593736155,-73.8042372967655,-73.8042027198095,-73.8041701518706,-73.8041244131024,-73.8040935021118,-73.8040360200035,-73.803959553454,-73.8039265406066,-73.803870719655,-73.8038426168865,-73.8038389579505,-73.8038036632947,-73.8037965276561,-73.803759324239,-73.803755754556,-73.8037174343429,-73.803709960882,-73.8036743990874,-73.8036701640539,-73.8036327506495,-73.803626755189,-73.803590770803,-73.8035847810641,-73.8035482997435,-73.8035411373468,-73.8035037436554,-73.8034989193517,-73.8034634349493,-73.8034602669293,-73.8034304211,-73.8033548591686,-73.8033574513145,-73.8032925569204,-73.803221762993,-73.8031987053882,-73.8035166733737,-73.8035659553828,-73.8038884250615,-73.8041803313036,-73.8043146690454,-73.8043601711592,-73.804353219718,-73.8043917200653,-73.8044300333359,-73.8043862823674,-73.8043653584376,-73.8043297789274,-73.8043512890419,-73.8043615441542,-73.8044050168217,-73.8044728208037,-73.8046028352337,-73.8046175237479,-73.8046489746849,-73.8046869621925,-73.8047181233282,-73.8047593468929,-73.804807304784,-73.8048611970973,-73.8048852890929,-73.8049161283257,-73.8049531970842,-73.8049958730743,-73.8050154416853,-73.8050324876378,-73.8050466086083,-73.8050574713085,-73.8050648193519,-73.8050859781681,-73.8051146551114,-73.8051501797805,-73.8051917216834,-73.805238309653,-73.8052888545505,-73.8058461181963,-73.8059602641602,-73.8061991950041,-73.8062845174831,-73.8064159359505,-73.8065454653918,-73.8065724726016,-73.8065666421889,-73.806583587257,-73.8065466824767,-73.8065433078088,-73.8063096884121,-73.806234658564,-73.8061506996551,-73.8061176137362,-73.8060883751409,-73.8060233194087,-73.8059940724493,-73.8059788424725,-73.8059410358115,-73.8059290494145,-73.8058889626791,-73.8058737283313,-73.8058341031224,-73.8058199772661,-73.8057992148724,-73.8057850637182,-73.8057357554475,-73.8057194078323,-73.805679469813,-73.8056660585571,-73.8056135268847,-73.8055865371615,-73.8055639454624,-73.8055451996341,-73.8055122758909,-73.8054531096465,-73.8054341214583,-73.8054100539614,-73.8053787878483,-73.8052821809177,-73.8050810346669,-73.8050673958007,-73.8050449671834,-73.8049813853499,-73.8049509122035,-73.8049378884095,-73.8048892723055,-73.8048746512255,-73.8048370203069,-73.8048292272019,-73.8046418502051,-73.8045544051887,-73.8045590258357,-73.8045420926871,-73.8046594281504,-73.8046835844033,-73.8045892457258,-73.8046414204578,-73.8046530975323,-73.8046879044161,-73.804701435686,-73.804739207941,-73.8047541321242,-73.8047962657386,-73.80481419769,-73.8049888031168,-73.8050370393538,-73.8050501852306,-73.8050985180556,-73.8051115026288,-73.8051613084482,-73.8051738486057,-73.8052186625882,-73.805242504565,-73.8052787882508,-73.8052953599511,-73.8053557493389,-73.8053805874624,-73.8053984443055,-73.8054362345985,-73.8055451478983,-73.8055638451162,-73.8056233354343,-73.8056443523487,-73.8056960781261,-73.8057155526625,-73.8057484564445,-73.805882465862,-73.8058947030696,-73.8059181977783,-73.806059278521,-73.8061014179791,-73.806218279618,-73.8063293256617,-73.8063965459748,-73.8064191686211,-73.8064282594364,-73.8064518701059,-73.8064628307186,-73.8064825463445,-73.8064907116267,-73.8065130234107,-73.8065188961154,-73.8065416457691,-73.8065501492494,-73.8065728184074,-73.806581670588,-73.8066121612277,-73.8067073779876,-73.8067196798707,-73.8065868955687,-73.8065846468532,-73.8065792363175,-73.8066060318951,-73.8069293317755,-73.8068860922785,-73.8068519601206,-73.8067966558484,-73.806791744307,-73.8067866890503,-73.8067606877993,-73.8067561666252,-73.8067320831588,-73.8067267244558,-73.8066992873994,-73.8066951100633,-73.8066680491436,-73.8065999981988,-73.8065925726006,-73.8065683949886,-73.8065357249395,-73.8065543556007,-73.80671792149,-73.8068992956903,-73.8069419953575,-73.8069430867008,-73.8069566202681,-73.8070460015351,-73.8069468699786,-73.8067977728852,-73.8067914423533,-73.8067659381314,-73.8066287342316,-73.8065867197421,-73.8065784429848,-73.8064017781146,-73.8064123057871,-73.8065636833562,-73.8066177380261,-73.806631563239,-73.8064125454315,-73.8056844290842,-73.8056344247976,-73.8056392815772,-73.8056362249918,-73.8055249710418,-73.805456122011,-73.8055221625494,-73.805534799617,-73.8055741493278,-73.805566431089,-73.8055243508112,-73.8054490724643,-73.8054255978558,-73.8054414524943,-73.8054462743429,-73.8054182315121,-73.8054214544145,-73.805408230578,-73.8054356586946,-73.8054570410134,-73.8054717508156,-73.8054793569598,-73.8054796365168,-73.8054725813035,-73.8054583981209,-73.8054438173039,-73.8054322117576,-73.805423930683,-73.8054192232497,-73.8054182310981,-73.8054209840788,-73.8054365117822,-73.8054473049184,-73.8054530941775,-73.8054537351093,-73.8054492117265,-73.805439636904,-73.8053220937892,-73.8053547250606,-73.8052701998137,-73.805042092896,-73.8050322658418,-73.8050268852107,-73.8050260815338,-73.805029874304,-73.8050381715032,-73.8050507718353,-73.8050617023352,-73.8050647087732,-73.8050597475692,-73.805046890686,-73.8050263245844,-73.8049983475184,-73.8049633652094,-73.8049218849616,-73.8048745083054,-73.8048219222733,-73.8047648894377,-73.8045752201116,-73.8045449925506,-73.804516655291,-73.8044908648448,-73.8044682187192,-73.8044492415726,-73.8044343730605,-73.8044169979326,-73.8043895892182,-73.8040921379196,-73.8040562246306,-73.8039118606248,-73.8037165780169,-73.8034392088561,-73.8033727645837,-73.8032412011167,-73.8031738356602,-73.8029300186893,-73.8025748716634,-73.80235340279,-73.8023036389753,-73.8022519256302,-73.8021996374699,-73.8021481644893,-73.8021513259833,-73.802152036606,-73.8021502784364,-73.8021460958089,-73.8021395941951,-73.8021309375449,-73.8021203441515,-73.8014783291996,-73.8013555274692,-73.8011570762491,-73.8010117290985,-73.8009951799441,-73.8011360841607,-73.8012403253055,-73.8014667000733,-73.8001094991664,-73.7985376596496,-73.7957575226431,-73.7937634697612,-73.7936756888664,-73.793614647195,-73.7922890733743,-73.7917237698573,-73.7916624065082,-73.7916025320149,-73.7915453262128,-73.7914919163525,-73.7914433548881,-73.7914005987389,-73.7913644904329,-73.7913420778982,-73.7913239189442,-73.7913104991461,-73.7913021773549,-73.7912991761016,-73.7913015756459,-73.7913086602536,-73.7913202557613,-73.7913360904372,-73.7913557932053,-73.7913789023411,-73.7914086337195,-73.791441167895,-73.7914851190949,-73.7915249656567,-73.7915601173053,-73.7915900533116,-73.7915865671031,-73.7915797143225,-73.7915696803923,-73.7915567368112,-73.7915412338092,-73.7915235908701,-73.7915042853815,-73.7914838397176,-73.7914628071037,-73.7914417566478,-73.7913022512197,-73.7911592660142,-73.7910132738249,-73.7908647573856,-73.790822223811,-73.7907870090634,-73.7907592443139,-73.7907390329753,-73.7907264503172,-73.7907215431861,-73.7907243298314,-73.7907347998378,-73.7904283944293,-73.7902526372845,-73.790124632941,-73.7900820425006,-73.7900625632805,-73.7901519260014,-73.7902841087417,-73.7905682380779,-73.7906595825781,-73.7910371751558,-73.7916001293646,-73.7916944800097,-73.7917684066367,-73.79184262943,-73.7919166447657,-73.7919899504279,-73.7920620490164,-73.7921560711532,-73.7922452921917,-73.7923589285199,-73.7924756874155,-73.7925951894609,-73.7927170463226,-73.7928491168353,-73.7929829261473,-73.7931179799723,-73.7932537794255,-73.7933898228673,-73.7935138964352,-73.7935859339412,-73.7936554050298,-73.7937347481011,-73.7940063145168,-73.7940138362599,-73.7945164862626,-73.794800165513,-73.7949212239716,-73.7950490247505,-73.7951833567942,-73.7953231687431,-73.7954689891944,-73.7956205800885,-73.79577769394,-73.7958418739472,-73.7960103756911,-73.7961882392365,-73.796209034732,-73.796502685265,-73.796369459998,-73.7965153563044,-73.7970294554423,-73.7971534991025,-73.7979157898774,-73.7988482204416,-73.8005393787116,-73.8013140511098,-73.8014504092572,-73.8014486409563,-73.8015193536847,-73.8015939316603,-73.801671905973,-73.8017527863559,-73.8018360642679,-73.8019212160917,-73.8020392663167,-73.8022164992958,-73.8024105055527,-73.8025957175565,-73.8027823626552,-73.8029139120601,-73.8030898021445,-73.8032594319771,-73.8033926989181,-73.8035029351608,-73.8035938661507,-73.8036188388721,-73.8036521606129,-73.8036647254091,-73.8036752308859,-73.8036901623908,-73.8037091070561,-73.8037315410494,-73.8037568440577,-73.80378431644,-73.8038131985714,-73.8038426918481,-73.8038719807678,-73.8039002554788,-73.803926734172,-73.8039706343793,-73.8040067010932,-73.8040344845344,-73.8040536382147,-73.8041399442761,-73.8043246055619,-73.8045155689722,-73.804678083685,-73.8048446413428,-73.8050151165244,-73.8050323653641,-73.8050219099684,-73.8050613523255,-73.8051189226571,-73.8050794838971,-73.8050637840642,-73.8050363991894,-73.8052104548957,-73.805361204298,-73.8055144822513,-73.8056702060441,-73.805848897605,-73.8060304781497,-73.8062148227121,-73.8066135976601,-73.8071398788419,-73.8072417566976,-73.8073501973924,-73.8074690741483,-73.8075947036926,-73.8077342127756,-73.8078808805182,-73.8079929341801,-73.8081086644716,-73.8082279921662,-73.8083968970767,-73.8085721637902,-73.8087535677874,-73.8089408766821,-73.8091338505182,-73.8093322420777,-73.8095357971972,-73.8097260988672,-73.809920290818,-73.8099831494506,-73.810064638092,-73.8101647712541,-73.8102681226227,-73.8103469369869,-73.8104248856632,-73.810501592464,-73.8105983220946,-73.8106693128785,-73.8107847786834,-73.8107896710634,-73.810799270144,-73.8108133191131,-73.8108314421037,-73.8108531542503,-73.8108778746606,-73.8109049419569,-73.810933631971,-73.8109631771191,-73.8109902152428,-73.8110187387698,-73.8110480618788,-73.811077479524,-73.8111120357959,-73.8111431120652,-73.8111698743303,-73.8111916043632,-73.8112121283037,-73.8112470376834,-73.8113331862571,-73.8114240109497,-73.8114799048396,-73.8115477260319,-73.8115660735979,-73.8116662539629,-73.8116968791518,-73.8117314975659,-73.8117734731758,-73.8117992080486,-73.8118156073982,-73.81183200305,-73.8118506574744,-73.8118762471533,-73.8118948321903,-73.8119156910602,-73.8119412707778,-73.8119971453955,-73.8120716660256,-73.8121625143996,-73.812258018815,-73.8123442043051,-73.8124117531515,-73.8124815979386,-73.8125514527377,-73.8126073275883,-73.8126888664714,-73.8127657266251,-73.8128331909565,-73.8129029762603,-73.8129704520207,-73.8130425968467,-73.8131338179631,-73.8133383835793,-73.813470052449,-73.8134944155579,-73.8135624560236,-73.8135980634565,-73.8135753028649,-73.8135978981883,-73.8140031906606,-73.8140792568506,-73.8141571236673,-73.8141867391691,-73.8142679716994,-73.814349510771,-73.8144306731243,-73.8144601791936,-73.8143716501328,-73.8143693843687,-73.8144369480874,-73.814469632255,-73.8144696569291,-73.8144999411601,-73.8145022325221,-73.8145254679208,-73.8146186626928,-73.8146186084513,-73.8144974546385,-73.8144772719101,-73.8146947569428,-73.8147056096676,-73.8148570008712,-73.8148900798111,-73.8150177700185,-73.8153323750697,-73.8155141636742,-73.8156632632579,-73.8157616923775,-73.8158791909357,-73.8162005689644,-73.8164801554668,-73.8166783531997,-73.8167485070685,-73.8168607833241,-73.8172475521691,-73.8173548154798,-73.81737201627,-73.8173598845662,-73.8173769224247,-73.8173894209152,-73.8174480681647,-73.8175948872848,-73.8176010180959,-73.8177719528478,-73.8178977931026,-73.8179208412757,-73.8179312503736,-73.8179391272829,-73.8179418581481,-73.8179313811298,-73.8179354630367,-73.8179760888702,-73.8179706890866,-73.8179588932762,-73.8179561601403,-73.8179640125377,-73.8179580711047,-73.818042291612,-73.8180796149764,-73.8180796827217,-73.8180844060124,-73.818117030247,-73.8181496360111,-73.8182008571661,-73.8184543216381,-73.818541138576,-73.8187439158346,-73.8189304302125,-73.8191659091188,-73.8193804214272,-73.819466723382,-73.8195623104062,-73.8196811734559,-73.8198163845496,-73.8199027087929,-73.8200122771646,-73.8200695543679,-73.8200959602511,-73.8201075934031,-73.8203920728012,-73.8204130295436,-73.8204781014593,-73.8205552151732,-73.8204902432634,-73.8204459503246,-73.8204042016295,-73.8204624983142,-73.8204393325657,-73.8204206836663,-73.8202909114852,-73.8202582789071,-73.8202443612206,-73.8210651207096,-73.8210813694438,-73.8203235551589,-73.820420879506,-73.8211296980492,-73.8211366407233,-73.8204417962415,-73.8204626463512,-73.8204811567733,-73.8205347659847,-73.8205625483143,-73.8205275519961,-73.8205870914386,-73.8208416352271,-73.8209628282704,-73.8210583806943,-73.8211306443835,-73.8211796069534,-73.8212379137605,-73.8212542943108,-73.8212525979312,-73.8212450276836,-73.8212287311814,-73.8212171051965,-73.8212171384863,-73.8212241525571,-73.8212451227777,-73.8212660962076,-73.8213010368473,-73.8213313076449,-73.8213662134897,-73.821412534399,-73.8213942636171,-73.8214572351253,-73.8214039410241,-73.8214225991526,-73.8215171857091,-73.8216203008346,-73.8216892526155,-73.8217020588685,-73.8216603319514,-73.821695305499,-73.821755990675,-73.8219723444763,-73.8221099447493,-73.8220914994209,-73.8221264634249,-73.8221775712616,-73.8222829082575,-73.8221341396916,-73.8221714521874,-73.8222711436295,-73.8222524806892,-73.8223086356013,-73.8226391838045,-73.8227255809138,-73.8228518510199,-73.822907388358,-73.8229866642977,-73.8230775600897,-73.8231848103856,-73.8232477614146,-73.8233293758287,-73.8233946802049,-73.823450684028,-73.8234551334144,-73.8234600827023,-73.8234648467501,-73.8234649265763,-73.8234626576892,-73.8234743355035,-73.8234976247344,-73.8235231790612,-73.8235579887495,-73.8235668090611,-73.8236208973293,-73.8237211278865,-73.8238166922684,-73.8238726775373,-73.8240638743251,-73.8242177822103,-73.824357729008,-73.8245355042384,-73.8245654301733,-73.8245911668123,-73.8245843825744,-73.8245961581165,-73.8246381762936,-73.824710511251,-73.8247687552466,-73.824794337885,-73.8248175438109,-73.8248313837324,-73.8248732194992,-73.8249407604494,-73.8250200157252,-73.825057821629,-73.8248090536,-73.8248300413557,-73.8248787652218,-73.8249276238048,-73.8249158809187,-73.825076591718,-73.8251552777404,-73.8252435046784,-73.8249304792372,-73.8249211512136,-73.8248793893808,-73.8249167005344,-73.8249631450302,-73.824946817564,-73.8252666431809,-73.8254048364167,-73.8254907531857,-73.8252080388629,-73.8252313743331,-73.8255130381735,-73.8255937891564,-73.8256507029823,-73.8254085736301,-73.8253969109008,-73.8253250216336,-73.8253576685955,-73.825672290848,-73.8257251505202,-73.8257664503313,-73.8255970927756,-73.8256250897205,-73.825590292848,-73.8255739747615,-73.8254997934938,-73.8255371046155,-73.8256229491065,-73.8256066217491,-73.8256390924955,-73.8256530844499,-73.8257156920331,-73.8256923553028,-73.8258125571891,-73.8259271498466,-73.825767241528,-73.825797559051,-73.8259564109994,-73.8259928665451,-73.8260266553418,-73.8260570269905,-73.8260833069838,-73.8261234363861,-73.8261381779516,-73.826154555008,-73.8261721973775,-73.8261907062823,-73.826209663358,-73.8263078475757,-73.8264930841807,-73.8266798477691,-73.8268684729788,-73.8270591548214,-73.8272514489397,-73.8274449072177,-73.8276390788253,-73.8278335112694,-73.8280277514489,-73.8282213467109,-73.8284138459059,-73.8286048004399,-73.8287937653198,-73.8289803001913,-73.8291639703647,-73.8293443478292,-73.8295210122499,-73.8296935519478,-73.8298615648598,-73.8300246594754,-73.8301824557492,-73.8303345859872,-73.8304806957032,-73.8306454515349,-73.8308042977649,-73.8309570225969,-73.8311034224013,-73.8312433019869,-73.8313764748608,-73.8315027634773,-73.831621999474,-73.831734023897,-73.8318386874116,-73.8321468621191,-73.8321748684242,-73.8321946190627,-73.8322060458426,-73.8322091093285,-73.832203798978,-73.8321901331772,-73.8321681591765,-73.8321379529273,-73.8320996188185,-73.8320532893157,-73.8319991245032,-73.8319373115301,-73.8318680639637,-73.8317916210514,-73.8317082468937,-73.8316182295314,-73.8316493312733,-73.8313954873575,-73.831606510589,-73.8316157445545,-73.8316880450481,-73.8319531968697,-73.8322186614701,-73.832484119813,-73.8327492528695,-73.8330137420016,-73.8332772693444,-73.833539518188,-73.8338001733578,-73.834058921593,-73.8343154519229,-73.8345694560401,-73.8348206286711,-73.8350686679428,-73.8353132757449,-73.8358925664454,-73.8364306125712,-73.8366708032072,-73.8369122565336,-73.8370358527652,-73.8371554916892,-73.8372708093106,-73.8373548725084,-73.8374361212601,-73.8380022303414,-73.8380272750527,-73.8380469597466,-73.8380607652819,-73.8380679531457,-73.8380697068464,-73.8380659873075,-73.838056877388,-73.8380425800367,-73.8380352210119,-73.8380372511195,-73.8380486640743,-73.8380694242907,-73.8380994669936,-73.83813869842,-73.8381869961111,-73.8382442092939,-73.8383101593517,-73.8383846403814,-73.8384825756871,-73.8385237426488,-73.838534006938,-73.8385441841749,-73.8386183582208,-73.8386802353457,-73.8387379561234,-73.8388163326525,-73.838894770433,-73.8389729883199,-73.839084585859,-73.8391878232651,-73.8392950052822,-73.8393857498941,-73.839447576897,-73.8395715038143,-73.8396663598261,-73.8397571137025,-73.8398602941833,-73.8399676087635,-73.8400005030146,-73.8400871170107,-73.8401780528961,-73.8402595289626,-73.8402976298541,-73.8403014698999,-73.8402887119285,-73.8402633904454,-73.8402878962949,-73.8403289937369,-73.8403950488649,-73.8404155048249,-73.8404319954095,-73.8404003131454,-73.8403902796154,-73.840340354138,-73.8402945487182,-73.8402860384377,-73.8403065455088,-73.8403095225284,-73.8403270155432,-73.8402686768039,-73.8401712668612,-73.8401440022323,-73.8400234699202,-73.8399363162736,-73.8398875449557,-73.8398739709088,-73.8398546301952,-73.8397453567506,-73.8396623668359,-73.8396290166981,-73.8396483600337,-73.8396577544876,-73.8396492279761,-73.8395909711373,-73.8395680652887,-73.839530915473,-73.8396174255155,-73.839604460621,-73.8395376666943,-73.8395938555069,-73.8396303401205,-73.8396621586961,-73.8396891063866,-73.8397128064344,-73.8397302857791,-73.8397414097111,-73.8397460924943,-73.8397442980271,-73.8397435594376,-73.8397441704763,-73.8397533671252,-73.8397709573482,-73.8397965738246,-73.8398296816188,-73.8398695893502,-73.8399154636311,-73.8399663464696,-73.8400330873002,-73.8400927231985,-73.8401451317145,-73.8401902052316,-73.8400712993488,-73.8400892587674,-73.8400988758263,-73.8401000505856,-73.8400927708164,-73.8400771121282,-73.840053237185,-73.8400213940161,-73.8399819134397,-73.8399352056269,-73.8398817558404,-73.8398221193936,-73.8392102210089,-73.8389273329529,-73.8387913381084,-73.8386834770087,-73.8388078987612,-73.8390639892386,-73.839054664375,-73.838996929699,-73.8389982098281,-73.8389997777356,-73.8389531459822,-73.8389319712713,-73.8389604985147,-73.8390116806759,-73.8389170176072,-73.8388823164674,-73.8389108283803,-73.8389946271518,-73.8390705947301,-73.8390622301787,-73.8390351924259,-73.8390129001397,-73.8390608661319,-73.8390535878405,-73.8390533845019,-73.8390490448119,-73.8391226306319,-73.8392125505941,-73.8392524342565,-73.8394542738298,-73.8394991378315,-73.8395277771424,-73.8395235808097,-73.8394618941404,-73.8394986496589,-73.8394493487325,-73.8395801256455,-73.8396327892728,-73.8396187426244,-73.8396118663857,-73.8396819965657,-73.8397401387723,-73.8397788690754,-73.8398220474946,-73.8398689179921,-73.839913987687,-73.8399578257571,-73.8399993483081,-73.8400414400055,-73.840078145654,-73.8401083499911,-73.840131135285,-73.8401385908755,-73.8401411901509,-73.8401388886934,-73.8402724778753,-73.8406702715678,-73.8408807423958,-73.8411078091212,-73.8411442239193,-73.8413208854279,-73.8414644848759,-73.8416773211162,-73.8419027099417,-73.8419416083445,-73.8420081997138,-73.842075751037,-73.8422204799933,-73.8422272841093,-73.8422338947382,-73.8422757275785,-73.8422842837592,-73.8422923732289,-73.8423075375749,-73.842314357501,-73.8423307747728,-73.8422301364811,-73.8419189273439,-73.8418864377444,-73.8408458452517,-73.8407504723695,-73.8402439631114,-73.8394341192846,-73.839180951993,-73.8389980914315,-73.8388816469985,-73.8388523238473,-73.8388271728037,-73.8388143833264,-73.8388347355651,-73.8388798954376,-73.8389292667672,-73.8389413081545,-73.8389368446315,-73.8389530462066,-73.8389651567291,-73.8389979777704,-73.839043192067,-73.8390594007588,-73.839046635205,-73.8390918718608,-73.8391130079405,-73.8392086990319,-73.8392339230566,-73.8391864206514,-73.8392631031926,-73.839220694564,-73.8392458503589,-73.8392872277845,-73.8392867188956,-73.8392129581747,-73.8392022387011,-73.8391598429395,-73.8391925523571,-73.8393618040317,-73.839589537657,-73.8397201451554,-73.8403028253719,-73.8402737688759,-73.8402237573545,-73.8401624843119,-73.8401669851166,-73.8401454073211,-73.8401087387093,-73.8400306359839,-73.8400444128228,-73.8400280886903,-73.8400097050477,-73.840098896365,-73.8400687997388,-73.8401074296279,-73.8401353153337,-73.8399559513437,-73.8400026434862,-73.8399334106232,-73.8399202641651,-73.8398513200737,-73.8398557810058,-73.8398417964703,-73.8398283357183,-73.8398469784709,-73.8398490706556,-73.8399158140485,-73.83995029818,-73.8399118754095,-73.8398871418964,-73.8398419203313,-73.8398344108467,-73.8398590937155,-73.8398383799964,-73.8398423555631,-73.8397545811197,-73.8397790955617,-73.8397594290159,-73.8397257314497,-73.8396995054642,-73.8396930249307,-73.8396825363717,-73.8396824715858,-73.8396693637226,-73.8396590285273,-73.8396721387774,-73.8396747369206,-73.8398255656932,-73.8398217229278,-73.8397154910854,-73.8397115908042,-73.8398217564905,-73.8398179294371,-73.8397248281831,-73.8397248545696,-73.8398140319761,-73.8398102282455,-73.8397590724813,-73.8397577901948,-73.8398102666072,-73.8397999282558,-73.8396517348158,-73.83969574806,-73.8396800156725,-73.8396085040031,-73.8396009854543,-73.8396167256136,-73.839625994769,-73.8396557334673,-73.8397960508764,-73.8397896015033,-73.8396610859348,-73.8396584974055,-73.8397922694089,-73.8397792782458,-73.8396861590708,-73.839682260142,-73.8397766962261,-73.839775423535,-73.83979488496,-73.8400027641618,-73.8421823657989,-73.8432267235367,-73.8442277329463,-73.8454272320661,-73.8484861534022,-73.8495589063688,-73.8501653592554,-73.8516845974783,-73.8518586876834,-73.852070059308,-73.8522072094839,-73.852331486691,-73.8524793893949,-73.8526648047364,-73.8528699785798,-73.852920440308,-73.8530351029675,-73.8530946020703,-73.8532680414721,-73.8533352494205,-73.8523115320841,-73.8517988662536,-73.8512089676086,-73.8508886338491,-73.8505227808275,-73.8499919434262,-73.8493915835714,-73.8485453056037,-73.8480634539416,-73.8480185603993,-73.847810234636,-73.8474901056339,-73.8462348007163,-73.845541873879,-73.8449103425533,-73.8442915296691,-73.8437757073376,-73.8432765586038,-73.8428366829414,-73.8423930900538,-73.8418797747322,-73.8414610203742,-73.8414166785508,-73.8412712784026,-73.841240530037,-73.8393679425065,-73.8388081325931,-73.8384942473412,-73.8383905629125,-73.8382477523711,-73.8379841620163,-73.8378427094752,-73.8378036833903,-73.8377540955476,-73.8375362574935,-73.8372258397222,-73.8371518944569,-73.8369114823119,-73.8367117969066,-73.8366380691055,-73.836470550498,-73.8363372576998,-73.8362918071927,-73.8361427900208,-73.8359908775545,-73.835855970139,-73.8357757691666,-73.8357047757733,-73.8355190467477,-73.8353621718488,-73.8349446256621,-73.8347353750812,-73.8345832171623,-73.8339302371213,-73.8337795278909,-73.833518472216,-73.8333827254562,-73.8330423462301,-73.832893121063,-73.8328926220929,-73.8328906609381,-73.8328350225652,-73.8327621992899,-73.8326890334202,-73.8323846854234,-73.8321371233042,-73.8319339376551,-73.8312833848724,-73.8311144922167,-73.8307226672039,-73.8305547123578,-73.8295940915706,-73.8287285688355,-73.8284267967819,-73.8283434749758,-73.8283340964284,-73.8281229894433,-73.828157720886,-73.8282565182698,-73.8285591024814,-73.8289208550473,-73.8294560625628,-73.8303040470699,-73.8305614598895,-73.8307142369563,-73.8308958061731,-73.8310035513046,-73.8316964882701,-73.8318469619019,-73.8326212279966,-73.832647485215,-73.832685248026,-73.8335876489385,-73.8337244292411,-73.8339497934444,-73.8341538152812,-73.8342673880512,-73.8344689223801,-73.8344630602064,-73.8344425309164,-73.8344622011831,-73.8344648917652,-73.834491419495,-73.8343785969423,-73.83425022242,-73.8340610756023,-73.834046665239,-73.8334905591873,-73.8334823130115,-73.8332172165616,-73.8331592126714,-73.8325963975417,-73.8322469220485,-73.8320336386387,-73.8318649853506,-73.8318208923045,-73.8313782619935,-73.8312072611756,-73.8308440323072,-73.8302597400713,-73.830071706276,-73.8297629609239,-73.8289598027908,-73.8283716047521,-73.8262182111356,-73.82586082507,-73.8257851762639,-73.8257158614129,-73.8249966413487,-73.824086809709,-73.823642108131,-73.8234347093132,-73.8228216133271,-73.8225846839014,-73.8219900667134,-73.82162663654,-73.8208354407277,-73.8206557938698,-73.820274329496,-73.8198327530423,-73.819791377942,-73.819685743294,-73.8195788913956,-73.8193449746142,-73.8193731239106,-73.8194094334248,-73.8194594158051,-73.8195906249725,-73.8196586540429,-73.8197494948985,-73.8197769243895,-73.8197725954394,-73.8196914883311,-73.8195653335871,-73.81955647313,-73.8196017911082,-73.8196922223854,-73.8197285501709,-73.8197062207993],"lat":[40.8821420355082,40.8821212808493,40.8821314114457,40.8821397606293,40.8821552239129,40.8821344912757,40.8820899450981,40.8820352261169,40.8819976737357,40.8819852500399,40.8819534099604,40.8819295902437,40.8818371627549,40.8817173131852,40.881645379202,40.8815767725229,40.8815148982233,40.8814805464064,40.8814324042501,40.8814116422214,40.8813943560487,40.881370246264,40.8813222742488,40.8812777987986,40.8812539931001,40.8812506867433,40.8812200360964,40.8811755388404,40.8811002854224,40.8810626964095,40.8810535528875,40.8810354496452,40.8810287876173,40.8810186795125,40.8810085419844,40.8809503685833,40.8808784556719,40.8808202546101,40.8807140733535,40.8805942090375,40.8804914899266,40.8804332461496,40.8803612495017,40.8802994606635,40.880251480469,40.8801761065407,40.880018619898,40.8799638998775,40.8799262132465,40.8798884345421,40.8798702623853,40.8798643324925,40.8798436562209,40.8797785188811,40.8797203600582,40.8796177173474,40.8794774018219,40.8793989398313,40.8783728179983,40.8782872397002,40.8782126581709,40.8781329967369,40.8780585839404,40.8779765584109,40.8778972280087,40.8778562674158,40.8777279411969,40.8776458367722,40.8775766153299,40.877566583074,40.8775151785348,40.8774508925245,40.8773917350813,40.8773223087981,40.8771810026485,40.8770833756946,40.877034110919,40.8770062989727,40.8769395950872,40.8768600432062,40.8767778803634,40.8766982387465,40.8766031015197,40.8765130305437,40.8764203898758,40.8763432133391,40.8762842102297,40.8761889992882,40.8761036526003,40.8760243481086,40.8760363293031,40.876091084863,40.8762007701225,40.8763104793334,40.876444527503,40.8766334181018,40.8767735583585,40.8769076309278,40.8770356255022,40.8772383102338,40.8772548701486,40.8771998792283,40.8771022625756,40.8770168163964,40.8769374987093,40.8769007912084,40.8768579676436,40.8767969590969,40.8767360251329,40.8766446633311,40.8765776889965,40.8765167304951,40.8764739442829,40.8763824434809,40.8762606272908,40.8761632490526,40.8760891543194,40.8757175039796,40.8755968535819,40.8754769615209,40.8753502733659,40.8752681869193,40.8752033586147,40.8751145323568,40.8750942712462,40.875142690722,40.8752078558158,40.8752730435382,40.8753205624844,40.8751450770311,40.8750782935681,40.8750096951489,40.8748655616139,40.8748138906004,40.8747895926432,40.8747789507812,40.87476490934,40.8747818570075,40.8748262632379,40.8748900604354,40.8746445681211,40.8742222570761,40.8742596475247,40.8744788102496,40.8743892814406,40.8743310451728,40.8742316804202,40.8741460422178,40.8740741300639,40.874026264024,40.8739888733763,40.8739925045559,40.8740132721355,40.8740327659749,40.873825146791,40.873677430623,40.8737217490685,40.8737900819958,40.8738378498589,40.8738307918303,40.8737827419412,40.8737518156211,40.873724223059,40.8736694045422,40.8736146301864,40.8735770561045,40.8735189542729,40.8734505735289,40.8734027074876,40.8733926199197,40.8733962429502,40.8734032159197,40.8734103996552,40.8734071698935,40.873438188437,40.8734828184168,40.8735719399875,40.8736325843811,40.8737125217068,40.8737844909842,40.8738495304129,40.8739282465336,40.8740139199853,40.8741065437138,40.8741305836315,40.8741923511971,40.8742780246239,40.8743809265567,40.8744324725364,40.8744531705639,40.8744824634302,40.8744499609696,40.8743848728088,40.8743163020558,40.8742717132958,40.8741962972055,40.8741415913919,40.874165672702,40.874227404946,40.8742960247002,40.8743270912607,40.8743477941932,40.874399381489,40.8744406763425,40.8744922187227,40.874774245106,40.8737270073053,40.874156294929,40.8741800978084,40.87402886703,40.8736182723589,40.8735484424099,40.8735107686046,40.8734766341206,40.8734357178889,40.8734016107943,40.8733263704203,40.8732476394419,40.873179222798,40.8731005412724,40.8730253071811,40.8729980660033,40.8729982407204,40.8730258452851,40.8730704826966,40.8731234751391,40.8726822336533,40.8726255917027,40.8725877092224,40.8725394372957,40.8725667206577,40.8726591904556,40.8727653995038,40.8728680568229,40.8728917672363,40.8728676093388,40.8728161128329,40.8727167766223,40.8726004018771,40.872504505644,40.8724257890439,40.8723504150064,40.8722819632358,40.8722238451973,40.8721760832805,40.8721488906749,40.8720395347704,40.8718923723048,40.8716698153057,40.8714951055809,40.8713128945592,40.8712347218955,40.8711455879546,40.8710804288825,40.8710153197369,40.8709467975159,40.8708680108848,40.8707755693328,40.8706619027906,40.8705734714483,40.8705152129658,40.8704054805318,40.8703402947359,40.8702545656636,40.8701962386213,40.8701584670675,40.8701309464268,40.8701189045789,40.8701272209044,40.870161383962,40.8702435190159,40.8703119643452,40.8703358566298,40.8703425475583,40.8703150410455,40.870267032827,40.8701881634042,40.8701572438202,40.8700989794188,40.8700235843315,40.8699516285862,40.8698659901865,40.8697940986643,40.8697358692846,40.8697049707044,40.8696980207642,40.8696738629723,40.8696223521744,40.8695195344922,40.8695039151688,40.8694026376885,40.869362895394,40.8693287346624,40.869272314754,40.8691130434261,40.8689909804737,40.8691854292133,40.8690424100958,40.8685221816429,40.8679259035013,40.8673219849901,40.8677633442414,40.8680406775116,40.8683447520242,40.8682841467267,40.8684382174912,40.868831407546,40.869484735938,40.8698790058607,40.8692970142679,40.869009351052,40.8690092737918,40.8693919909323,40.8696716847837,40.8701586964823,40.8703888529314,40.8699331668282,40.8696093299175,40.8692380322741,40.8690136078319,40.8681908306235,40.8681162886069,40.8681690200683,40.8679449202575,40.8657580614387,40.865151497606,40.8644590311431,40.8643067933021,40.864178253844,40.8649382042966,40.8656012077668,40.8652435735122,40.8648299747341,40.8644440249751,40.8641746594005,40.8639196581483,40.8636761023,40.8632380618776,40.8630574653678,40.8624826087081,40.8611806277039,40.8612249050664,40.8612350990822,40.8612421027868,40.8612457270821,40.8612458741127,40.8612425399091,40.8612358144938,40.8612258794514,40.8612130030255,40.8611975328759,40.8611798866921,40.8611605409157,40.8611400178761,40.8611081695941,40.861075858427,40.8610347571213,40.8609957339579,40.8609596765251,40.8609274049538,40.8608996532637,40.8608770526687,40.8608601172202,40.8608492321151,40.8608446449353,40.8608464600162,40.8608546360736,40.8609024046818,40.8609452624398,40.860982833664,40.861014789011,40.8610408483647,40.8610607832924,40.861074419047,40.8610816360989,40.8610814278681,40.8610744180864,40.8610607101766,40.8610405063861,40.8610141048027,40.8609818949563,40.8609443520715,40.860902030056,40.8608555533274,40.8608056076005,40.8607529297701,40.8606982970383,40.8606425154476,40.8605864079887,40.8604805445552,40.8603741483542,40.8602673139879,40.8601824609793,40.8600959473055,40.8600080613181,40.8599190959414,40.8598293476961,40.8596409899537,40.8595109187575,40.8594425311957,40.8593913522563,40.8593676181441,40.8593472727744,40.8593440242782,40.8593301576833,40.8593226740585,40.8593215909403,40.8593269108669,40.8593386213718,40.8593566950137,40.8593261512252,40.8592225695596,40.8591616354448,40.8590948612279,40.8590646194551,40.859114205621,40.8591572275405,40.859206288756,40.8592065987554,40.859279999118,40.8594018528211,40.8594746958694,40.8594867404811,40.8595535416713,40.8596448801226,40.8597790151909,40.8598096681401,40.859803886079,40.8597859598321,40.8597313163391,40.8597984018664,40.8599017731082,40.8599868103599,40.859931794267,40.8599560211075,40.8600534629379,40.8601388217242,40.8601574040684,40.8601028573039,40.8600664857544,40.8600545751101,40.8601217837507,40.8601826065903,40.8602675945435,40.8603161359052,40.8603411570759,40.8603464052629,40.8603279102076,40.8603825168751,40.8604798596738,40.8605649460132,40.8605951515792,40.8605463134367,40.8604488976177,40.8602361413712,40.8600896611072,40.8599860053333,40.8599127900684,40.8597786429799,40.8596323877372,40.8595592982031,40.8594740260737,40.8593888284448,40.85935827446,40.8593641424459,40.8593152157978,40.8593272112461,40.8593758630774,40.8594733048492,40.8595708450406,40.8596439730865,40.8597474555276,40.8598449085703,40.8599485154786,40.8599911390931,40.8600093125568,40.8599787204244,40.8598750144391,40.8598079031707,40.8597467575474,40.8597708713564,40.8598193604513,40.8598496138276,40.8598738403615,40.859940815402,40.8600018611671,40.8600508253024,40.8601911268287,40.860313118868,40.86046540253,40.8605810673578,40.86067232952,40.8607636291263,40.8608428357611,40.8609219794277,40.8610311075692,40.86110390103,40.8611391268643,40.8611819438414,40.8612115028033,40.8612193200368,40.8612457404807,40.8613000219368,40.8613470343226,40.8613767536343,40.8614289234893,40.8614709104734,40.8615475087951,40.8616506196653,40.8617367595871,40.8617955851321,40.8618275305144,40.8621524272365,40.8621984430304,40.8622455455974,40.8623039922328,40.8623760709791,40.8624110772859,40.8624339793278,40.8624745616912,40.8622988179254,40.862158378145,40.8620240547851,40.8618962541785,40.8617753733896,40.8616355161428,40.8615014606367,40.8613733187336,40.8612511973607,40.8611351984206,40.8610254187067,40.8609219498226,40.8608248781052,40.8607342845534,40.8606772407796,40.8603390746449,40.8603178483175,40.8601451470708,40.859972442754,40.8597370843229,40.8595471439454,40.8593121731403,40.8592611156032,40.8592323949348,40.8592065770424,40.8582111360458,40.8562563631214,40.8561808182253,40.8561343810312,40.8559730686949,40.8558881400116,40.8556760141988,40.8557178475947,40.8547224869677,40.8533507569479,40.8532505132979,40.8528179596694,40.8529458315274,40.8530050968406,40.8530068192239,40.8518710810244,40.8517112057939,40.8516842794588,40.8516699100256,40.8509463710299,40.8506462456696,40.8503421895008,40.8502477436293,40.8500378392255,40.8497332948133,40.8494288848257,40.8491259836566,40.8488259348462,40.848093411579,40.8475391849537,40.8472874415574,40.8471051994446,40.8467524951107,40.8461502294325,40.8461764414555,40.8462074368627,40.845561537337,40.8455583886229,40.8458630487035,40.845836846077,40.846105444802,40.8463778745736,40.8466412420541,40.8471617388565,40.8476903687039,40.8481989807793,40.8485010256302,40.8480205985507,40.8481701799873,40.8483110319788,40.8484265673581,40.8485721724036,40.8490806127351,40.8490039649213,40.8489632175473,40.8488533201379,40.8487798316465,40.8487726747792,40.848704120081,40.8486523839212,40.8485775706927,40.8485128973766,40.8484259090212,40.8482992769046,40.8481831223942,40.8481593652634,40.848181680065,40.848157073112,40.8481524288281,40.84808851854,40.8480131214818,40.8478989795456,40.8478236051903,40.8477755823539,40.8477309061056,40.847713645631,40.8477066928299,40.8476895188118,40.8476586831621,40.8476416178164,40.8476519755044,40.8476589210659,40.8476761310715,40.8476762535213,40.847656733602,40.8476524220968,40.8475874556508,40.8475121460329,40.8473888561198,40.8472518403909,40.8470154748644,40.8468441621691,40.8466488452828,40.8465279828846,40.846487326504,40.8464545444375,40.8464236573529,40.8464004582675,40.846326933104,40.8463056248063,40.8462934434989,40.8463408049056,40.8463418403487,40.8466030287716,40.8466908895933,40.8468719546974,40.8469350091809,40.8469841139971,40.847142794761,40.8471676899999,40.8472040064818,40.847219613529,40.8471060780268,40.847090899394,40.8471248164931,40.8471271372415,40.8469635716256,40.8468898374621,40.8467713676471,40.8466656638,40.8465907260857,40.8465126098581,40.8464968359893,40.8464089391435,40.8464236276061,40.8463078251248,40.8463108261237,40.8462913404238,40.8462880980173,40.8462932760145,40.8462937982898,40.8463014456766,40.8463225518942,40.8464992927555,40.8465242726389,40.8465434716162,40.8465472722555,40.8465394988957,40.8465201737792,40.8464834886923,40.8465212341264,40.8466033156667,40.8466692278063,40.8466830160229,40.8467133689247,40.846732983728,40.8467586743732,40.8467728806978,40.8468029406772,40.8468170507607,40.8468480839737,40.8468688674331,40.846892741082,40.8469154799091,40.8469371168183,40.8469521760658,40.8469813112502,40.8469968378976,40.8470272573685,40.8470499687169,40.8470714478484,40.8470858485113,40.8471164085685,40.8471308984232,40.8471616313461,40.847176292578,40.8472052771765,40.8472157051536,40.8472649150024,40.8472743255091,40.8472025957164,40.8471514112785,40.8471407107707,40.8471895833906,40.8471902431993,40.8471605188045,40.8471461873514,40.8471162621796,40.8471008949811,40.8470716102546,40.8470557083029,40.8470399782421,40.8470122545804,40.8469827070101,40.846966985604,40.8469381775445,40.8469219192112,40.8469162661107,40.8468242138588,40.8468046152269,40.8467438418379,40.8467396542839,40.8466532687728,40.8465050893012,40.8464687648791,40.8462055453014,40.846234151702,40.8461878250725,40.8459684974252,40.8459086730715,40.8458672153634,40.8458175308588,40.8457779455843,40.845743562822,40.845595002916,40.8454999950584,40.8460101808884,40.8458269191938,40.8458658086554,40.8462295364752,40.8461685621387,40.8458024882244,40.8456686916361,40.8456314568879,40.8456491130056,40.8459651709471,40.8459495061096,40.8456355547081,40.8456179666302,40.8455892978679,40.8455215675536,40.8456590622548,40.8456465324691,40.8455115891113,40.8454761083549,40.845417562889,40.8454850681723,40.8454621084494,40.8453993904392,40.8453514829683,40.8452807690314,40.8453061437316,40.845315742706,40.845325259987,40.8453328562933,40.8453490263926,40.8455177901454,40.8455205859042,40.8455849859396,40.8456461416025,40.8456537811424,40.8457101850886,40.8457525047819,40.845760946691,40.8458454993311,40.8458542436841,40.8458869027612,40.8459040954384,40.8459510227316,40.8459229398419,40.8459136426486,40.8459374381477,40.8458993632322,40.8458921883808,40.845848662293,40.8458393364932,40.8458102233661,40.8458016987316,40.8456501583979,40.8456016984583,40.8455816573729,40.8455467324102,40.8455227874324,40.845512591373,40.8454654512211,40.8454580795086,40.8454098176165,40.8454014980967,40.8453541823325,40.8453449056292,40.8453454641151,40.845330976604,40.8453273839169,40.8453059375701,40.8453014684311,40.8452945293047,40.8452750423886,40.8452108495306,40.8452339904582,40.8452936489669,40.8453087046214,40.8453768592089,40.8454268673287,40.8454358174281,40.8454922329617,40.8455645216417,40.8456254300405,40.845634822594,40.8457068262417,40.8457171218048,40.845740487584,40.8457972014792,40.8459319773567,40.8459476493138,40.8459570086627,40.8460170673213,40.8460271107149,40.8460871261761,40.8460971996987,40.8461572298828,40.8461672064843,40.846224073219,40.8462359311763,40.8462950050495,40.8463100525461,40.8463187994983,40.8462866199471,40.8462763934554,40.8462888896987,40.8462326784056,40.8460223635781,40.846013094971,40.8459551305251,40.8459437121666,40.845873834683,40.8458627564801,40.8457930857252,40.8457844319767,40.8457335206416,40.8456202689756,40.8455591104005,40.8455476802486,40.8454967548932,40.8454675453669,40.8454313686639,40.8454238178777,40.8453718287539,40.8453449041118,40.8453134672802,40.8453035542559,40.8453000401901,40.84523590785,40.8452400304051,40.8452186820928,40.8452000230573,40.8451844816589,40.845172414685,40.8451640991598,40.8451597259844,40.8451593955548,40.8451484225571,40.8451346684485,40.8451749877225,40.8452112972411,40.8451995823124,40.8452121003763,40.8452247711841,40.8451862854614,40.845252970234,40.8454650891569,40.8456032471414,40.8457490124263,40.8458207580407,40.84586987198,40.8458800395793,40.8460617095975,40.8461351225585,40.8461870313944,40.8461956545726,40.8462515223213,40.8464760266304,40.8465445206224,40.8465593807488,40.8465705438173,40.8465434582793,40.8465312236468,40.8465415118325,40.8463594291289,40.8463322069804,40.8463235422993,40.8462571530234,40.8462131269252,40.8461921178299,40.8461822400293,40.8461546937276,40.8461166561836,40.8460674056371,40.8460578092721,40.8460090167926,40.8460003222592,40.8459388145986,40.845930037859,40.84587559468,40.8458674894805,40.8458176245264,40.8458067097733,40.8457441992212,40.8457328812313,40.845669588414,40.8456587843688,40.8455992053343,40.8455891650048,40.8455387689926,40.8455285865327,40.8454696920823,40.8454601821594,40.8453940588665,40.8453850359657,40.8453195836822,40.8453096677669,40.8452493771862,40.8452391615863,40.8451801701749,40.8451295602829,40.8451095078659,40.8451630279378,40.8451295445891,40.8451077641522,40.8450819928905,40.8450523767104,40.8450397288494,40.845025958055,40.8450114348825,40.8449965501325,40.8449795980083,40.8452370738176,40.8452606901033,40.8452837301513,40.8452643279637,40.8459521025033,40.8459460416519,40.846475825338,40.84648442528,40.846501697995,40.8465294279249,40.8465326054015,40.8465509813737,40.8465273891914,40.8465949670613,40.8466894075637,40.8467377120756,40.8467553669325,40.8467127921977,40.8466165566338,40.8467141275735,40.8466817008137,40.8453967835226,40.8453789003436,40.8451873060132,40.8451843173308,40.8451590275739,40.8451261833748,40.8448682819852,40.8448632081838,40.8448232677451,40.844628200082,40.8446224125364,40.8445949265871,40.8443813979244,40.8443754458222,40.8443231331002,40.8442456928533,40.8442076495008,40.8442265179079,40.8442283481961,40.8442294718895,40.8442294998659,40.8444618637945,40.8444665362965,40.8444671096206,40.8444684125093,40.8444684125659,40.844468939112,40.8444691237952,40.8442846834596,40.8442823511525,40.8442795811148,40.8442773317631,40.8442751361798,40.8442554319811,40.844259615547,40.8443548768903,40.8444733044381,40.8444785857355,40.8444800519266,40.8444858642087,40.8444858642649,40.8445225070556,40.8445498270434,40.8445474514327,40.8445033404421,40.844496606709,40.8444948030906,40.8444919126389,40.8444871987614,40.8444867828804,40.8444853124324,40.8444875087195,40.8445028981996,40.8446594676673,40.8447132314598,40.8446837360211,40.8446814440978,40.8446580476934,40.8446725392526,40.8446501853737,40.8446839544537,40.8447310482344,40.844717550293,40.8447432844631,40.8447506903746,40.8447728891421,40.8447876030671,40.8448482762972,40.8447514492065,40.8446901161613,40.8446900320949,40.8446816622603,40.8449522751461,40.8449708663179,40.8449591768177,40.8449484576056,40.8449390147302,40.8449311177987,40.8449249922795,40.8449208130645,40.844918699476,40.8449199046465,40.844925589344,40.8449357425423,40.8449503445479,40.8449533699902,40.844960824861,40.8449726828128,40.8450418692036,40.845048229107,40.8450585166113,40.845059122044,40.8450569805158,40.8450521457748,40.8450447391633,40.8450349465727,40.8450230137772,40.845009240266,40.8449939717264,40.8449775913673,40.8449663131635,40.8449606556508,40.8449492419853,40.8449323356833,40.8449102805144,40.8448835249443,40.8448526130146,40.8448181732812,40.844780906032,40.844741569048,40.8447641245086,40.8448183815554,40.8448423321554,40.8448670676485,40.8448413061525,40.8448484568634,40.8448291045311,40.8447889025593,40.844773144542,40.8447601978641,40.8447770554629,40.8447608577814,40.8447254154432,40.8446821990835,40.8446399467554,40.8445997764497,40.8445627510649,40.844529850284,40.8445019446526,40.844479772545,40.8444639206275,40.8444548083361,40.8444613013861,40.8444633829074,40.8444561828736,40.8444435351233,40.8444077112082,40.8443909010885,40.8443540818902,40.8443467688842,40.8442999305934,40.8442631884319,40.8442111634272,40.8441505869062,40.8440928550086,40.8440405444525,40.8439930562657,40.8439438724875,40.843893821912,40.8438437479384,40.8437944943577,40.8437468911351,40.8437017404239,40.8436598030493,40.8436549201361,40.8436511195513,40.8436485102156,40.8436471669098,40.8436471281313,40.8436519206803,40.843651115677,40.8436447307612,40.8436329058421,40.8436317643803,40.8436257745611,40.8436150148214,40.8435996260599,40.8435798097925,40.8435825746619,40.8435800366212,40.8435722423453,40.8435593351716,40.8435415524638,40.8435099850076,40.8434844757542,40.8434653270153,40.8434527657235,40.8434469407431,40.8434479211062,40.8434556951944,40.8434701708768,40.8434911766014,40.8435044526419,40.8437009514143,40.8440483523273,40.8440637504288,40.844078199572,40.8440913215834,40.8441027730238,40.8441122541774,40.8441522161286,40.844195752298,40.8442427415686,40.8442505102617,40.8442599465616,40.8442708094757,40.8442828215772,40.84429567609,40.8443090447237,40.8443225860574,40.8443383310504,40.8443540831946,40.8443693772707,40.8443837615878,40.8443968113233,40.8444081410693,40.8444174162157,40.8444243628323,40.844428775759,40.8444305246655,40.8444295578997,40.8444263232244,40.8444188185778,40.8444051570128,40.8444040798347,40.8444020777265,40.8443992104303,40.8443955635049,40.8443912457728,40.8443863860731,40.8443811294168,40.8443756326601,40.8443700598235,40.8443645771976,40.8443593483812,40.8443545293994,40.8443460923877,40.8443358771542,40.8443231529133,40.8443089627469,40.8442936747482,40.8442776854883,40.8442614097286,40.844245269662,40.8442147172225,40.8441848447431,40.8441564498191,40.8441302905942,40.8441070655179,40.8440873946977,40.8440718033422,40.8440672062079,40.8440649067477,40.8440649445599,40.8440673189933,40.8440722154403,40.8440787419759,40.8440867224899,40.8440959416383,40.8441061506538,40.8441170740589,40.8441195835759,40.8441220014406,40.844124260659,40.8441262986331,40.8441280588946,40.8441294926705,40.8441305602339,40.8441312320047,40.8441314849498,40.8441313754147,40.8441309060098,40.8441300879229,40.8441289406521,40.844127491541,40.8441257751276,40.8441238323204,40.8441178155819,40.8441120436367,40.8441066044946,40.8441016546502,40.8440973006491,40.8440936362119,40.8440907402156,40.8441069779185,40.8441203430048,40.8441304703837,40.8441370834081,40.8441400014315,40.8441391447428,40.8441345367439,40.8441263033107,40.8441122935848,40.8441007818185,40.8440920878038,40.8440864530566,40.8440840341077,40.8440848981544,40.844089021194,40.8440962886902,40.8441064987551,40.8441193677575,40.8441345382019,40.8441515886594,40.8441700454746,40.8441876604911,40.8442046891655,40.844220718561,40.8442255160256,40.8442306658421,40.8442360269947,40.8442414526805,40.8442467943297,40.8442519056734,40.8442566467491,40.8442608877334,40.8442645124964,40.8442674217822,40.8442695359267,40.8442707970389,40.8442711705859,40.8442794562811,40.8442840878925,40.8442849810946,40.8443067408856,40.844334288986,40.8443674449103,40.8443707468254,40.8443550417127,40.84434212791,40.8443289613184,40.844315901103,40.8443033035266,40.8442915122321,40.8442808488678,40.8442740951441,40.8442661460279,40.8442572181256,40.844247554715,40.8442374191151,40.844227087512,40.8442168414324,40.8442069600724,40.8441977126899,40.844176693246,40.8441552415315,40.8441338848075,40.844113148,40.8441110651307,40.8441115758755,40.8441146681006,40.8441202683427,40.8441282435551,40.8441384042679,40.8441505090891,40.8441884970652,40.8442220099778,40.8442502473485,40.8442630661936,40.8442694242425,40.8442712405373,40.8442684955501,40.8442612187936,40.8442541156799,40.8442451728443,40.8442266167566,40.8442039307699,40.8441774329672,40.8441474948773,40.8441153845712,40.8440808294613,40.8440442903929,40.8439978562725,40.8439548962097,40.8439159644176,40.8439113983174,40.8439092574148,40.8439096041193,40.8439124283239,40.8439749658253,40.843971021484,40.8439634756881,40.8439448985603,40.8439170735757,40.8438670515204,40.843862157161,40.8438318446654,40.8438107682354,40.8438002589059,40.8437631295553,40.8437241747226,40.8436740738521,40.8436351505711,40.8435943613231,40.8435572513402,40.8435183008651,40.84349591641,40.8434812180607,40.8434348974064,40.8433848780681,40.8433311228754,40.8432643502327,40.843193878225,40.8431289586954,40.8430733231307,40.8430065342063,40.8429768132079,40.8429507462142,40.8429154471116,40.8428919331202,40.8428690291259,40.8428282098223,40.8427886097637,40.842536565987,40.8425771616239,40.8425549233252,40.8425197216896,40.8424583592655,40.8424206083181,40.8424108271934,40.8423913277834,40.8423537902676,40.8423259987367,40.8422912967432,40.8422607780313,40.8422595426342,40.8422233143741,40.8421955485102,40.84215945312,40.8421052809785,40.84205664042,40.8420246680278,40.8419732739213,40.841903813763,40.8418412646036,40.8417522956216,40.8416479959002,40.8415853723834,40.8415602846037,40.8415240696658,40.8414920321422,40.8414419588593,40.841394690153,40.8413404875644,40.8412946117271,40.8412598394231,40.8412337733766,40.841384170143,40.8413980753519,40.8414132982118,40.8413757283109,40.8412026764997,40.8411680442718,40.8411333071377,40.8411041432502,40.8410624717364,40.8410096414965,40.840967928943,40.8409137028961,40.8408705857376,40.8408163315324,40.8407815557679,40.8407426106796,40.840724329829,40.8407036696935,40.8406591708675,40.840618857037,40.8405906868893,40.8405380858966,40.8405511412462,40.8405584394245,40.8405666737399,40.8405593711557,40.8405593601446,40.8405426767551,40.8405395626445,40.8405333069627,40.8405219436276,40.8405282015092,40.8405176195513,40.8402937348659,40.8400768852004,40.8398043668865,40.839865363765,40.8398518076819,40.8397879574069,40.8397732789181,40.8397628401876,40.8397555243736,40.8397544693208,40.8397544472789,40.8397596390901,40.8397627454037,40.8397627277676,40.8397585414765,40.8397481137635,40.8397314435954,40.839713733132,40.8396991638939,40.8396762510984,40.8396470666848,40.8396126662106,40.8395888866001,40.8396258097624,40.8396205921569,40.8396350443331,40.8396433877278,40.839649527012,40.8396224163793,40.8396131570699,40.8396225422926,40.8396122536812,40.8396059979944,40.839571879092,40.8394510589777,40.8390764879577,40.8388523153941,40.8388146166474,40.8387805796538,40.8387702081795,40.8387732038283,40.8387733595667,40.8387834258345,40.8387865014961,40.8387828909328,40.8387317219631,40.8386905421522,40.8386730268158,40.838672491773,40.8386517871032,40.8386142557457,40.8385594764572,40.8384707375761,40.8383991305163,40.8383073158855,40.8382390519896,40.8381474669795,40.8380727082088,40.8380317012404,40.8380001903654,40.8379672145202,40.8379342725466,40.8379046587927,40.8378946923229,40.83787178706,40.8378191690994,40.8377698264274,40.8377039838885,40.8376611593709,40.8376051103189,40.8374930950357,40.8373711891299,40.8372492981999,40.8371504591288,40.837048312567,40.8369428846268,40.8368341358845,40.8367583348483,40.8366956766661,40.8366461606388,40.8366263326789,40.8365867470322,40.8365571142317,40.8365143380933,40.8364451675303,40.8363430135121,40.8362177654781,40.8361188641332,40.8360301964569,40.8359968002114,40.8359538857045,40.8359241825161,40.8359043556109,40.8359207221207,40.8359337810557,40.8359402857404,40.8359632902182,40.835976376291,40.835976306926,40.8359532134671,40.8359235656645,40.835897275152,40.8358875029027,40.835890901078,40.835871205799,40.8358515578246,40.8358319732894,40.8358057587649,40.8357780778773,40.8357729274737,40.8357103591047,40.8356543571755,40.8355950553197,40.8355532661435,40.8355422934052,40.8355125978387,40.8355026731065,40.8355025831298,40.8355123901899,40.8355122516757,40.8355121408174,40.835531836098,40.8355317806383,40.835531711303,40.8355250818311,40.8355053236751,40.8354757244131,40.8354758630643,40.8354726659002,40.8354596408945,40.8354334610168,40.8354039170063,40.8353928698032,40.8353611824002,40.835285430884,40.8352063978404,40.8351240372077,40.8350614273357,40.8350251150767,40.8350064172677,40.8349756334914,40.8349229264076,40.8348735486026,40.8348727090734,40.8348176089283,40.8347550336325,40.8346760086748,40.8345903462652,40.8345178042419,40.8344815208084,40.8344814886802,40.8344748701665,40.8344747871073,40.8344845311711,40.8344877283759,40.8345073959608,40.8345073474442,40.834490849307,40.834477672577,40.8344579691937,40.8344416096532,40.8344220308863,40.834395844553,40.8343779064162,40.834349781181,40.8343102508222,40.8342213218958,40.8341686148053,40.8340862334001,40.8340302187903,40.8339808052108,40.8339195801628,40.8339397956371,40.8339251915407,40.8339015904747,40.8336768664156,40.8336064017224,40.8335691424606,40.8335347850575,40.8335014035132,40.8334809902567,40.8334735349817,40.8334883201707,40.8334975423534,40.8334882383165,40.8334622808612,40.8334474766987,40.833438259087,40.8334105262718,40.8333660944366,40.8333555722608,40.8333012598528,40.8332401071805,40.8331696828273,40.8330955291377,40.8330195172281,40.8329713360678,40.8329175690233,40.8328563578697,40.8328247956969,40.8327969654247,40.832778444279,40.8327358451114,40.8326709169414,40.8325912041073,40.8324403160344,40.8324216830864,40.832388877756,40.8323402166267,40.8322998910566,40.8322525871623,40.8322219576365,40.832208003901,40.8322001686022,40.8321821799424,40.8321565283894,40.8321217765507,40.8320787003675,40.8320272600036,40.8319577440987,40.8318757005332,40.8318241986078,40.8317838319566,40.8317531871867,40.8317327119459,40.8317094170541,40.8317086301422,40.8317058074217,40.831696032716,40.8316821170179,40.8316696123057,40.8316599085229,40.8316474150432,40.8316375593168,40.8316363472154,40.8316308238176,40.8316141587441,40.8315946903175,40.8315654911974,40.8315293317973,40.8314945652725,40.8314639556653,40.831444459061,40.831437483601,40.8314305086413,40.8314269324487,40.8314207568959,40.8314026775236,40.8313788719308,40.8313053794973,40.8312428331211,40.8311941831647,40.831102405353,40.8310300864914,40.8310081997295,40.8311711402244,40.8311414582521,40.8309861205137,40.8308167999935,40.8307893508801,40.8307628963329,40.8307406109377,40.8307058026788,40.8306723959466,40.8306445455326,40.8306228757943,40.8308245004488,40.8308342400078,40.8309242570356,40.8309075541583,40.8308091963903,40.8308161567317,40.8306140470511,40.830605562691,40.8305666027104,40.8305275325497,40.830495338637,40.8304969747688,40.8305108311324,40.8305135779496,40.8305135367104,40.8305051694309,40.8304815322919,40.830453736604,40.8304356975395,40.8304145280632,40.8303870775072,40.8303592712075,40.8305670167929,40.8305614429227,40.8303501037027,40.8303244687196,40.8302743673953,40.8302103219597,40.830175496331,40.8301378784881,40.830121651866,40.8301085641935,40.8300987921551,40.8300681616621,40.8300347760629,40.8300031302213,40.8299884682277,40.8299675814625,40.8299404044374,40.8299033606089,40.8298573687827,40.8299330331286,40.8298912848539,40.8298649778188,40.829890004939,40.8298210324666,40.8297774522023,40.8296933989933,40.8296414679901,40.8296166562307,40.8295819839035,40.8295523346018,40.8296076442197,40.8295895478884,40.8295345791202,40.8295275873093,40.8294954435661,40.8294410679879,40.8294039716126,40.8293767584586,40.8293618769601,40.829344534659,40.8293568354282,40.8293741088615,40.8293938103402,40.8293962027202,40.8293912027105,40.8293640098932,40.8293467213554,40.8293195759082,40.8293097617669,40.8292900392507,40.8292579784799,40.8292209346762,40.8291888061855,40.8291566612415,40.8290973188923,40.8290230944736,40.8289834903867,40.8289562291131,40.828938861576,40.8289289052662,40.8289263448814,40.8289435648927,40.8289657171257,40.8289829265508,40.8289829098823,40.8289828579738,40.8289778748241,40.828953131666,40.8289176341288,40.8288988778526,40.8288791595443,40.8288594687658,40.8288422435057,40.8288373704206,40.8288275458369,40.8288028712296,40.8287855604447,40.8287781281201,40.8287805514953,40.8287805040551,40.8288002317631,40.828800194855,40.8287853654134,40.8287582094744,40.8287434760944,40.8287163465001,40.8286916139244,40.8286742451506,40.8286692251197,40.8286938364123,40.8287011848559,40.8286862657055,40.8286720696114,40.8286466666957,40.8285922504552,40.8285453241489,40.8285082751221,40.82850210003,40.8284786642376,40.8284366947056,40.8284070739278,40.8283700090611,40.828337837634,40.8283007094129,40.8282482362514,40.8282683375775,40.8282829161626,40.8282919652411,40.8282954806136,40.8282934606486,40.8282859062835,40.8282728210242,40.8282542109433,40.8282554839016,40.8282544704024,40.8282511987586,40.8282457603654,40.8282383071472,40.8282290473138,40.8282182395438,40.8282061857578,40.8281932226847,40.8281797124542,40.8281660324813,40.8281044593261,40.8280433439441,40.8279829210836,40.8279572804582,40.8279320036633,40.8279076958111,40.827884938817,40.827864277469,40.8278462063867,40.8278311581796,40.8278194930915,40.8278448195465,40.8278752139826,40.8279101212333,40.8279489037029,40.827990853012,40.827984794836,40.8278408051546,40.8278338639129,40.8278000299648,40.8277968158974,40.8277815684232,40.8277810109068,40.827817700717,40.8278288136351,40.8278483534852,40.8278415765479,40.8279844023148,40.8279786180308,40.8279778589431,40.8279821280067,40.8279914086037,40.8279991535486,40.8280004569791,40.8279953085375,40.8279837491363,40.8279658706335,40.8279418151023,40.8279117737019,40.8278849476476,40.8278643710374,40.8278502092309,40.8278425760362,40.8278415327959,40.8278364065619,40.8278283479684,40.8278175970213,40.8278044739116,40.8277893694793,40.8277727335728,40.8277550616515,40.8277368800296,40.8277187302009,40.8277011527119,40.8276629351028,40.8276258534524,40.8275908411805,40.8275587796148,40.8274880048142,40.8274134455472,40.8273351907743,40.8272483500848,40.827219873662,40.8271871469385,40.8271505452046,40.8271043966291,40.827054409337,40.8270211739928,40.8269794449655,40.8269418198126,40.8269090999652,40.8268819823684,40.8268610446362,40.8268467327493,40.8268358761213,40.8268213401981,40.8268035287241,40.8267829364234,40.8267601352591,40.8267357585458,40.8267104833594,40.8266850117305,40.826660051145,40.826636294894,40.8266144028165,40.826594982973,40.8265785747564,40.8265618571331,40.8265410010452,40.8265165763741,40.8264896157199,40.8264605455375,40.8264301399696,40.8263992087195,40.8263685754882,40.8263390560393,40.8263047868735,40.8262715925151,40.8263250915874,40.8263340557263,40.826376287416,40.8263503891207,40.8263051616744,40.8263141300597,40.8262612192206,40.8262253770693,40.8261924279223,40.8261629734232,40.8261375514035,40.8261268035612,40.8261116090391,40.8260923707277,40.8260695987403,40.8260438968867,40.8260159466627,40.82598648918,40.8259563055146,40.8259261959966,40.8258749382034,40.8258247360055,40.8257760057167,40.8257291514436,40.825934987273,40.8259250167683,40.8257170317285,40.8256791237606,40.8256650015078,40.825647125359,40.8256259925429,40.8256021908721,40.8255763823933,40.8255492849723,40.8255216523257,40.8254942530568,40.8254678492764,40.8254255989659,40.82539021439,40.8253477084548,40.8252980860016,40.8252649465927,40.8252506733619,40.8252472508124,40.8252363505296,40.8252244243756,40.8252007153921,40.8251709467076,40.8252590836511,40.8252756107211,40.8252944574964,40.8252731248406,40.8255691776095,40.8255526346593,40.8252659236331,40.8252730189851,40.8252518673732,40.8252353290459,40.825218907808,40.8252354499938,40.8251613217076,40.8251503846279,40.8251359560499,40.8251182946868,40.8250950688957,40.8250687087818,40.825039807005,40.8250090133692,40.8249770202121,40.8249445468398,40.8249067569898,40.8248717841741,40.8248400559133,40.8248119600649,40.8247484331887,40.8246892416128,40.8246345070919,40.8245580101152,40.8244834694939,40.8244233437379,40.8243632852116,40.824303974535,40.8242460838507,40.8241902692075,40.8241371631262,40.8240873674307,40.824041446429,40.8239999205184,40.8239666658196,40.8241379807951,40.8241584311799,40.8241905986623,40.8242191258606,40.8242435275517,40.824263388683,40.8242783714327,40.824307238532,40.8243391136744,40.8243732375002,40.824408797078,40.8244449452711,40.8244808209191,40.8245155693529,40.8245696878689,40.8246245826878,40.8246796802186,40.8247344047507,40.8247447676965,40.8247541614597,40.8247623142416,40.82476899015,40.8247739960243,40.8247771870245,40.8247784708224,40.8247778102724,40.8247485535767,40.8247147504346,40.8246771696158,40.8246366658029,40.8245834273397,40.8245337377011,40.8244881552059,40.8244471920237,40.82441130842,40.8243809075851,40.8243563311041,40.824337855119,40.8243256872264,40.8243352746314,40.8243408462411,40.824342360518,40.8243398061728,40.8243553093243,40.8243741290069,40.8243958507799,40.824419996293,40.8244460338207,40.8244926003676,40.8246016622687,40.8246114917025,40.8245120902351,40.8245507774776,40.8245506758531,40.8245553000984,40.8245740701788,40.8245858006886,40.8246093583342,40.8246258701925,40.824654199027,40.8246920001945,40.8247297657495,40.8247675308017,40.8247821145626,40.8247911138833,40.8247910630059,40.8247898717607,40.8247768544131,40.8247532211183,40.8247177854365,40.8247035525487,40.824708227042,40.8247412570052,40.8247978281083,40.8248403512495,40.8248724909649,40.8251139484466,40.8251138006251,40.8249015707142,40.8249237848494,40.8249365409654,40.824976477584,40.8249952641803,40.825021130469,40.8250470273859,40.8251012536472,40.8251366376759,40.8251649263107,40.8251672100369,40.8251576966428,40.8251505385271,40.8251432945696,40.8251855290552,40.8252231255329,40.8252629727771,40.8252755356217,40.8253761613659,40.825493962245,40.8255433805666,40.8255857888623,40.8256352636188,40.8257201885821,40.8258122052155,40.8258428379491,40.8258733981641,40.825854341283,40.8258116906773,40.825799718983,40.8258231935727,40.825853686951,40.8258535889433,40.8258603386524,40.8258392616871,40.8258179367423,40.825801233283,40.8258034071593,40.8257985472471,40.8257903673626,40.8258275749186,40.8258255769738,40.8257817427324,40.825772272983,40.8257674548031,40.8257909327599,40.825842802938,40.8258876239724,40.8258969920591,40.8258686372225,40.8258332172087,40.825797703205,40.8257622099128,40.8257172707769,40.8256723419904,40.8256297419449,40.8255588693735,40.8255021647755,40.825455623742,40.8254547663976,40.8254310642325,40.8254167674442,40.8253883708975,40.8253600459835,40.825322312813,40.8252443807072,40.8251829233017,40.8250860619043,40.8249962859119,40.8249419827179,40.8249183392532,40.8248900555479,40.8248168547949,40.8247412669251,40.8246845829845,40.8246373090928,40.8246307726419,40.8246277948601,40.8246277062808,40.8246064054318,40.8245757374144,40.8245519777406,40.8245498830099,40.8245358516153,40.8245028695437,40.8244486177369,40.8243825348178,40.8243069625607,40.8242596775867,40.824245426909,40.8242311610759,40.8242263521528,40.8242262552348,40.8242145191593,40.8241979919127,40.8241736458632,40.8241724069054,40.8241560729369,40.824134881495,40.8241270448585,40.8240664947715,40.8239933616892,40.8238989121926,40.8238280706587,40.8238043949906,40.8238113767456,40.823816490059,40.8238229960616,40.8238181818992,40.8237992674992,40.8237780251485,40.8237568546249,40.8237404524844,40.8237363073292,40.8237264315483,40.8236792710643,40.8236179240834,40.8235093129397,40.8234195842372,40.823336868686,40.8233192752928,40.8232942316487,40.8233129732942,40.8233269940584,40.8233410257047,40.8233079346507,40.8232820804315,40.8232562475445,40.8232209775114,40.8231526117204,40.8231362891012,40.8230935730247,40.8229967206601,40.8228927626323,40.8228359742371,40.8228594517125,40.8228970548731,40.8229110811483,40.8229109452443,40.8228825953495,40.8228590912443,40.8228356086801,40.8228168352749,40.8227838799892,40.8227414299895,40.8226635401284,40.8226093529148,40.8224196711434,40.8223290192886,40.822273910805,40.8218981288477,40.821767789793,40.8216715038036,40.8215469718063,40.8214847708487,40.8214280437734,40.8208266279261,40.8208235584901,40.820177338695,40.8201571440119,40.8199066505566,40.8196572828818,40.8194879763808,40.8190271147164,40.8189276879602,40.8188320441333,40.818740400814,40.8186529664789,40.8185699400293,40.818491510338,40.8184178558206,40.8183491440291,40.8182855312712,40.8182769854666,40.818251071676,40.8182441139936,40.8182381281,40.81823305963,40.8182310003159,40.8182314464758,40.8182385750915,40.8182674487506,40.8183379343509,40.8183892559925,40.8184230914111,40.8184516064342,40.8184813732856,40.8185259883059,40.8185409075283,40.8185165274038,40.8184942658315,40.8184847162945,40.8184971418508,40.8185095262992,40.8185386971862,40.8185567369686,40.818545541213,40.8184664314127,40.8184128676903,40.8183879597686,40.8183587160459,40.8183366219872,40.8183052033327,40.818266887697,40.8182420028487,40.8182193346689,40.8181819048886,40.8181285029855,40.8181052615602,40.8181003365608,40.8181014558851,40.8181056951122,40.8180895176473,40.818043275796,40.8179636850993,40.8179334364703,40.8179094240462,40.8178496488985,40.8177651510577,40.8176980513612,40.8176657558313,40.8176123912462,40.8175604451612,40.8175191620379,40.817480990993,40.8174407168444,40.8174017017625,40.817367806718,40.8173302625867,40.817295197867,40.8172573748518,40.8172147782155,40.8169012745332,40.8168738928711,40.8168523306884,40.816836768567,40.8168329990796,40.8168243872603,40.8168111567621,40.8167936511872,40.816772325163,40.8166533611849,40.8166208935774,40.8165915093983,40.8165634288648,40.8165333459424,40.8165075320701,40.8158515361339,40.8157998215259,40.8157635048956,40.8157187296873,40.8155132927434,40.8156987850033,40.8154640159352,40.8155411349387,40.8144495656895,40.8140245255607,40.8138670088642,40.8137614025066,40.81353949953,40.813260900539,40.8129409472032,40.8128650174157,40.812554047116,40.8124244215362,40.8124442463237,40.8123937343924,40.8123739096168,40.8123672641137,40.8123633086586,40.8125698095942,40.8128613969873,40.8128093161225,40.8128039649271,40.8127931345439,40.8127770049356,40.8127569942019,40.8127327338602,40.8127045885026,40.8126729811057,40.8126237038646,40.8125797258441,40.8125414739331,40.8125093194375,40.8124835744758,40.8124644889497,40.8124522481191,40.8124469708034,40.8124487082284,40.8124574435293,40.8124730919142,40.8124955014872,40.8125244547225,40.812539387697,40.8125553923043,40.8125593658539,40.8125594373365,40.8125480070659,40.8125302900374,40.8125277949852,40.8125186844801,40.8125211066214,40.8125370629784,40.8125570078367,40.8125795935697,40.8126061405194,40.8126351448017,40.8128574019012,40.8129218712516,40.8129647408178,40.8127936080226,40.8128099060431,40.8130445149281,40.8131086960771,40.8131275339896,40.8131937211463,40.8132133405634,40.8132773275962,40.813299878414,40.81336538363,40.8133989638084,40.8134111121835,40.8135877388186,40.8136465279933,40.8136504403116,40.8135967646141,40.813608538674,40.8136318892921,40.8137079440965,40.8137306728651,40.813718304107,40.8136633052117,40.8135975220486,40.8133977317214,40.8133910023811,40.813345895743,40.8133224212386,40.8132999773279,40.8132522133482,40.8132323694951,40.8131820961997,40.8131633972243,40.8130564525687,40.8130427121723,40.8129721911916,40.8129352432894,40.813051422078,40.8131299665213,40.8131606848942,40.81319677355,40.8132963663707,40.8133200828242,40.813305156158,40.8133292437576,40.8133521311691,40.8133320723837,40.8133410272087,40.8133158096737,40.8133585805213,40.8133758586136,40.8133920217653,40.8133842152334,40.8134026909906,40.813414227125,40.8134850088732,40.8134916552365,40.8135271720872,40.8135532851906,40.8136059067071,40.8136125547438,40.813672893625,40.8136782368844,40.8139665532554,40.8139408945177,40.8139545068795,40.813966010005,40.8139515247597,40.8140304573973,40.8140381594711,40.8140527956805,40.8140607682201,40.8140744766316,40.8140922243217,40.81412710072,40.8142425907479,40.8142931964872,40.8142921914293,40.8142473012592,40.8142546199244,40.8143188860987,40.8141605587425,40.8141408777959,40.8141100523011,40.8140810165259,40.814040240001,40.8140126825778,40.8139630486228,40.8139880855583,40.8139513032765,40.813891952437,40.8138620716292,40.8138581816747,40.813820655517,40.8138130684015,40.8137735112604,40.8137697157716,40.8137289714772,40.8137210242726,40.8136832133298,40.8136787114255,40.8136389314118,40.8136325567623,40.8135942954363,40.8135879273277,40.8135491376057,40.8135415219491,40.8135017640394,40.8134966330735,40.8134589039478,40.8134529073545,40.8134221198429,40.8134064212266,40.8134011244898,40.813388069644,40.8133741099422,40.8135052405722,40.8139519636486,40.8139992970107,40.8143090077609,40.8145899628115,40.814592160481,40.8145696679122,40.8145563792686,40.8145378562017,40.8145830626131,40.8146042320536,40.8145882639326,40.8146031425859,40.8146187768259,40.8146971281821,40.8147702248521,40.8148898321537,40.8150442281981,40.8150590132019,40.8151251050464,40.8151891842418,40.815230505094,40.8152722303681,40.8153095712531,40.815341904921,40.815382739966,40.8154208656662,40.8154556419756,40.815486485076,40.8154978518456,40.8155113617537,40.8155266959368,40.8155434924742,40.8155613549302,40.8156000538539,40.8156358497425,40.8156679057556,40.815695472483,40.8157179054648,40.8157346802581,40.8160141581474,40.8160424492395,40.8162870707728,40.8162684868912,40.8165136903577,40.8166148528417,40.8166063553924,40.8166004373467,40.8165945881656,40.8165270494408,40.8165278973175,40.8161468071589,40.8160696799882,40.8159858577035,40.8159522093261,40.8159311470157,40.8158868540877,40.8158669412942,40.8158565713442,40.8158308296815,40.8158226698106,40.8157953756932,40.815785003544,40.8157580231207,40.8157484060226,40.8157342691493,40.8157246349167,40.8156910617937,40.8156799318761,40.815652738953,40.8156436076895,40.815607839866,40.8155894639607,40.8155740817633,40.8155613184299,40.8155389021864,40.8154986168471,40.8154990009379,40.8155052753378,40.8154826202827,40.8154111733447,40.8151979640126,40.8151831885492,40.8151588921924,40.8150900133716,40.8150570019809,40.8150428912757,40.8149902266519,40.8149743867253,40.814933621029,40.8149251781545,40.8147237415351,40.8146298422371,40.8146261397291,40.814608369639,40.814544989122,40.8145719404021,40.814621511144,40.8146808472396,40.8146941284599,40.8147337120697,40.8147491010407,40.8147920590849,40.8148090308379,40.814856948283,40.8148773417896,40.8150672556058,40.8151197208599,40.815134020058,40.8151865908221,40.8152007130016,40.8152548847505,40.8152685242028,40.8153172667223,40.8153406442128,40.8153772647763,40.8153902851508,40.8154377375067,40.8154572543647,40.8154706474583,40.8154595336427,40.8155342734689,40.8155471437688,40.8155880933305,40.8156025588462,40.8156381644737,40.8156515684525,40.8156742179657,40.8157664600224,40.8157748833344,40.8157910553581,40.8158901253594,40.8159197169539,40.8160268418303,40.8161379588176,40.8162452828964,40.8162814025412,40.8162937476294,40.8163258061145,40.8163406888215,40.8163674605476,40.8163785486464,40.8164088439178,40.8164168179019,40.8164548781742,40.8164691035705,40.8165070281737,40.8165218376414,40.8165779454316,40.8165529425346,40.816575170747,40.8166168008024,40.8166167970303,40.816618074712,40.8166644945437,40.8165683790768,40.8164878109985,40.8164268796694,40.8163327883424,40.8163244328538,40.8163158311978,40.8162715959199,40.8162639019694,40.8162229284239,40.8162138112851,40.8161671314091,40.8161600253744,40.8161139833855,40.8159982047677,40.8159855704899,40.8159444352562,40.8158919863863,40.8158890901495,40.8161601173919,40.8164840311364,40.8165646142208,40.8165642905474,40.8165602669805,40.8165336938753,40.8162140785768,40.8160219197875,40.8160085742045,40.8159756145133,40.8156838402077,40.8156992312724,40.8157303151882,40.8157020306495,40.8156644493896,40.8156876022544,40.8156685582435,40.8155949914608,40.8153801236381,40.8150334249116,40.814840551022,40.8147881420237,40.8147607373439,40.814735532754,40.8146865740627,40.8146235475352,40.8145914039101,40.8145402448562,40.8144985372486,40.8144740590785,40.81441614019,40.8144006137408,40.8143410760255,40.8143005801677,40.8142385860016,40.8141314609623,40.8137978718246,40.8137727335653,40.8137444091473,40.8137137287737,40.8136815917004,40.8136489398786,40.8136167303457,40.8135859071741,40.813573790725,40.8135599421941,40.8135447782741,40.8135287552368,40.8135123552036,40.8134960716395,40.8134741629448,40.8134506698564,40.8134261785838,40.8134013002431,40.8133766556082,40.8133528596205,40.8132268615705,40.8131302303405,40.8128447709236,40.8126290472348,40.8126078750539,40.8125858002922,40.8125633584899,40.8125410940912,40.8125195472358,40.8124992406554,40.8124496558412,40.8123994322958,40.8123492983373,40.8122999809827,40.8122521954059,40.812206634566,40.812163959159,40.8121247880367,40.8120896892332,40.8120591717274,40.8120336780628,40.8121229413498,40.8121152311171,40.8121041246491,40.8120898792586,40.8120728249806,40.8120533569254,40.8120319261249,40.8120220089944,40.8120118366179,40.8121227170506,40.8120720268032,40.8121104978812,40.8118903765523,40.8115913378643,40.8115397861965,40.8112402847783,40.8108686021019,40.8105418613528,40.810283833341,40.810037058959,40.810024850878,40.8100189493632,40.8100195112967,40.8100265217405,40.8100380942453,40.8100499010858,40.8100616445301,40.8100730284448,40.8100837657624,40.8100935857209,40.8101022406908,40.8106062790887,40.8107108448949,40.8105877656151,40.8107133996473,40.8107070763315,40.8105761778899,40.8104793397404,40.8101417179631,40.8097109540783,40.8095870755297,40.8083433211442,40.8074511678729,40.8074237879761,40.8073920627061,40.8068490055795,40.8068781140536,40.8068829123862,40.8068941924772,40.806911732051,40.8069351854877,40.8069640906339,40.8069978779083,40.8070358815256,40.8070543157568,40.8070752789894,40.807098210666,40.8071224975925,40.8071474903347,40.8071725205841,40.8071953897026,40.8072171692046,40.8072373486961,40.8072554552784,40.8072710646301,40.8072853203337,40.8072954429687,40.8073190795225,40.8073465980933,40.8073775910328,40.8074115992244,40.8074274216148,40.8074425956845,40.8074567108494,40.8074693851775,40.807480275723,40.807489087806,40.8074955829865,40.8074995855156,40.8075009870915,40.8074997497899,40.8074506998063,40.8074078238025,40.8073712635504,40.807341139938,40.8072509773587,40.8071590109762,40.8070655834351,40.8069710428221,40.8068757413699,40.8067800341439,40.8066842777203,40.8065888288566,40.8063266499108,40.8060191970246,40.8057715598858,40.8055227277362,40.8054089418345,40.8050799885924,40.8048171036888,40.8045580112917,40.8044857925821,40.804263031702,40.8041434235867,40.8041219178608,40.8041269678207,40.8041273773242,40.8041231435926,40.8041142953532,40.8041008926437,40.8040510583248,40.8039963643149,40.8040404661378,40.8040795759917,40.8041135667842,40.8041423280579,40.804167128081,40.8041857857219,40.80419823206,40.8042044211188,40.8042043300363,40.8042612003149,40.8043721457288,40.8043866514668,40.8044435154771,40.8046379521653,40.8048268612968,40.8050032186842,40.8053572350723,40.8054851867337,40.805609295079,40.8057293551148,40.805844511252,40.8059552816148,40.8060614853423,40.8061629490292,40.8061687212022,40.805921031867,40.8059968776751,40.8059685904618,40.8061044354875,40.8062772027666,40.8062922737885,40.806345377719,40.8063939866826,40.8067122300219,40.8071771927658,40.8083972111247,40.8087788783898,40.808872707534,40.8089123372251,40.8089515356728,40.808986353888,40.8090165729481,40.8090420028478,40.8090624836941,40.8090778867113,40.8091118611804,40.8091427926307,40.8091549518941,40.8091472490841,40.8091201233998,40.8090750624953,40.8089851228489,40.8089105071559,40.8088421360212,40.8088078595418,40.8087571704779,40.8087163000579,40.8086534153162,40.8086062295024,40.8085852689899,40.8085659209942,40.8085487204978,40.808534143103,40.8085225918817,40.8085143862309,40.8085097530403,40.8085088204199,40.8085116141569,40.8085180570034,40.8085279708117,40.8085794891058,40.8086344052663,40.8086920344774,40.8087516580889,40.8088236458408,40.8089702722828,40.8091121622118,40.8092257987875,40.8093360042858,40.809442695707,40.8094176984862,40.8094077234533,40.8093649724374,40.8093969343631,40.8094386891333,40.8094297005033,40.8094556023107,40.8095578710005,40.8096419044449,40.8097232546052,40.8098018775786,40.8098873321457,40.8099691958211,40.8100474122607,40.8103122126175,40.8106616764538,40.8108152404901,40.8109661878989,40.8111193078891,40.81126928329,40.8114237040177,40.8115742469754,40.8116821206359,40.8117877298143,40.8118910021972,40.8120283550428,40.8121610272716,40.8122888489003,40.8124116561599,40.8125292917049,40.8126416048153,40.8127484515895,40.8128411909253,40.8129291522618,40.812946958901,40.812968335664,40.8129879738392,40.8129994808748,40.8129920887225,40.8129805570245,40.8129649414339,40.8129388246036,40.8127643665376,40.812770951355,40.8127931924938,40.8128145301523,40.8128343934565,40.8128522509774,40.8128676249486,40.8128801040495,40.8128893544095,40.8128951285409,40.8128972719603,40.8128883742969,40.8128827594048,40.8128805622888,40.8128818357763,40.8128958720467,40.8129140065973,40.8129357527484,40.8129605268949,40.8129790714999,40.8129932908748,40.8130146750392,40.813030756249,40.813039699335,40.8130509559756,40.8130540019141,40.8130577057379,40.8130569246693,40.8130560425622,40.813043718613,40.813006586017,40.8129747482139,40.8129446806377,40.8129394000403,40.8129536040153,40.8129731070951,40.8130120866376,40.8130298307173,40.8130458544624,40.8130601381716,40.8130673664884,40.813076373891,40.8130853653769,40.8130925560747,40.8131121424491,40.8131281886618,40.8131442109382,40.8131478847457,40.8131586311684,40.8131959163186,40.8132367443258,40.8132704887755,40.8133007001188,40.8133310542431,40.8133684493168,40.8133925184545,40.8133593660002,40.8133299724045,40.8133263420857,40.8133644141753,40.8133853496017,40.8135514672659,40.8135335632743,40.8135208922586,40.8135175035543,40.8135121288593,40.8135124203941,40.8135183757157,40.8129631022567,40.8129594191175,40.812936401406,40.8129382810731,40.8129153202794,40.8129064691428,40.8129082876045,40.8129224535083,40.8129455037803,40.8129474240682,40.8129668972387,40.812964931467,40.8135185418412,40.8135193186139,40.813519355824,40.8135408426881,40.813540895802,40.8135411007414,40.8135221323178,40.8135047209933,40.8135120397435,40.8135718498211,40.8137670553639,40.8138474759768,40.8138532323814,40.8138004399708,40.8137084982738,40.8136884287824,40.8136078326478,40.8135779082896,40.8135743438044,40.8133757200373,40.8133757470258,40.8135707362507,40.8135585832261,40.8135481935175,40.8135483876616,40.8135537845511,40.8135469026047,40.8135446801007,40.8134005219836,40.8133955560866,40.8133557288553,40.8133527255106,40.8132979642329,40.8132990241464,40.8133567708153,40.8133567521913,40.8133975745169,40.8134015694831,40.8135410900311,40.8135329678563,40.8135170953093,40.8134923116245,40.8134693061903,40.813467586756,40.8134729492281,40.8134871917177,40.8134599005902,40.8134505531773,40.8134260883509,40.8133838952792,40.8133293867348,40.8132730751332,40.8132395753338,40.8132184813111,40.8132062764647,40.8131799331559,40.8131375818902,40.8130921735026,40.813044739123,40.8129730847231,40.8128640696654,40.8128440145098,40.8129716116266,40.8130187663386,40.8130176550769,40.8128364491956,40.8128452313994,40.8127743563026,40.8127567440771,40.8127071415866,40.812710652676,40.8124484524933,40.8124537126645,40.812430677574,40.8122035919649,40.8122266305742,40.8124396521949,40.8126380725052,40.8124497568669,40.8124674711615,40.8126575778362,40.8127018673558,40.8127496928607,40.8127426943752,40.8128082378218,40.8128258857005,40.8130194471107,40.8129980893294,40.8129858851077,40.8129771827763,40.8129649024274,40.8129525870685,40.8129314338298,40.8129049062044,40.8129013376407,40.8128854185827,40.8128800822751,40.8128712135753,40.8128588211443,40.8128499808456,40.8128500133603,40.8128482761436,40.8128518709423,40.8128589981261,40.812874984831,40.8128729524781,40.8128413933204,40.8128184779669,40.8127086398482,40.8127015873064,40.8128473212355,40.8128311216825,40.8127683274551,40.8127533578075,40.8126736313549,40.8126648342725,40.8127685360242,40.8127502341697,40.8127008801465,40.8126282712121,40.8126230146218,40.8126797408117,40.8126614997876,40.8123663390302,40.8123540052765,40.8125400351874,40.8125488575915,40.8126582150786,40.8125760073161,40.8125053294507,40.8124901733994,40.8124790553275,40.8124579339138,40.8124474525252,40.8124210628595,40.8124052267668,40.812380568735,40.8123558854955,40.812324106032,40.8123098650246,40.8122940267629,40.8122550885511,40.8122249938394,40.8122019774767,40.8121913737791,40.8121949495702,40.8122233126174,40.8122764736169,40.8122764871149,40.8122765698735,40.8122607912178,40.8122363784849,40.8122220773254,40.8121692615262,40.8121199286983,40.8120634946292,40.8119869546763,40.8119363517581,40.811895675677,40.8118177738361,40.8117699950674,40.81173996415,40.8116993589087,40.8117012171804,40.8117189590821,40.8117543990484,40.8118075278016,40.811846536865,40.8118572615194,40.8118432196167,40.8118299178868,40.8114392816,40.8114322315438,40.811510197086,40.8115368248172,40.8115722123593,40.8118233133875,40.8117956281417,40.8117613402401,40.8113367907272,40.8113403166978,40.8112729838282,40.8112606491835,40.8113191379726,40.8113261939565,40.8117523478985,40.8116986420627,40.8116593304234,40.8112239161375,40.8112097892963,40.8116491334094,40.8116121853569,40.8115922904135,40.811162261086,40.8111675532923,40.8110382160453,40.8110276439238,40.8115847437304,40.8115662654087,40.8115518285534,40.8112404367688,40.8112263174021,40.8111678459978,40.8111713626193,40.8110278591263,40.8110155242807,40.8111537336799,40.8111607904275,40.8112174874036,40.8112121975226,40.8113273588151,40.8113414852495,40.8115337045204,40.8114865013967,40.8112159102333,40.8112053356398,40.8114744484351,40.811462884125,40.8114473319383,40.8114281372671,40.8114057263972,40.8113054095454,40.8112962765294,40.8112889258953,40.8112835237924,40.8112801923267,40.8112790068006,40.8112841217064,40.8113192703292,40.8113493955589,40.811385233907,40.8114141142902,40.8114359694065,40.8114507483253,40.8114584166063,40.8114589563796,40.8114523663871,40.8114386619862,40.8114178751131,40.811390054209,40.8113552641069,40.8113135858805,40.811265116655,40.8112099693812,40.8111482725716,40.811080170001,40.8110058203716,40.8109253969426,40.8108390871268,40.8107470920531,40.8106496260982,40.810528938705,40.8104037613082,40.8102742608384,40.8101406099904,40.8100029869926,40.8098615753694,40.8097165636963,40.8095681453481,40.8094165182413,40.80926188457,40.8082659233093,40.8081597794439,40.8080525687077,40.8079446614799,40.8078364305442,40.8077282498008,40.8076204929745,40.8075135323241,40.807407737356,40.8073034735479,40.8072011010864,40.8071009736225,40.8070034370504,40.8069088283123,40.8068174742349,40.8067296904001,40.8066457800554,40.8061599985245,40.8051707080598,40.8050324175297,40.8049382559933,40.8049528784565,40.8049425283654,40.804939168418,40.8049428026522,40.8049534267004,40.8049710277946,40.8049955847816,40.8050270681486,40.8050654400585,40.8051106543956,40.8051626568206,40.805221384836,40.8052867678614,40.8053587273178,40.8054371767226,40.8056614484821,40.8058164219051,40.8058743158037,40.8059290937245,40.8059810399039,40.8060380852536,40.8061000562212,40.8061500401486,40.8062026426806,40.8069613283096,40.8069849401814,40.8070113208845,40.8070397746934,40.8070671070544,40.8070949478782,40.8071226769145,40.8071496764024,40.8071753448339,40.8073029062464,40.8074305808342,40.8075579699106,40.8076846756782,40.8078103024713,40.8079344579912,40.8080567545315,40.8081768101888,40.8082942500553,40.8084087073902,40.8084912199821,40.8085951332,40.8086504532387,40.8087053104503,40.8088627700959,40.8089667117372,40.8090769422768,40.8092092301818,40.8093163419756,40.8095147199491,40.8096124365519,40.8097416124363,40.8099526183905,40.8101101006032,40.8102360714232,40.8103747171239,40.8105447943157,40.8106991286075,40.8108534805873,40.8110109858327,40.8111117388657,40.8112660681413,40.8113448724323,40.8114430367828,40.8115716300107,40.8116975206709,40.81183597548,40.8120310618903,40.8121758637284,40.8123112460024,40.812402604631,40.8124792996581,40.8125411282369,40.8126343013684,40.8126638080246,40.8127550060602,40.8128556498011,40.8129500511192,40.8130350524424,40.8130497045963,40.8131357886404,40.8132804750239,40.8134131183095,40.8134502463801,40.8136200231777,40.81368913852,40.8137580040519,40.8137771713074,40.8137899234,40.8138619655196,40.8139216450807,40.8140097175493,40.814081763339,40.8141167600929,40.8142174560654,40.8143275235468,40.8144912486081,40.81518345495,40.8153818438254,40.8156052710738,40.8158191827248,40.8159882326769,40.8160313374992,40.816076525791,40.8161235066449,40.8161766055025,40.8162310788486,40.8162865069168,40.8163424625822,40.8163985146537,40.8164060715028,40.8164513605438,40.8164961097912,40.8165393847485,40.8165802817048,40.8166179466076,40.8166515928979,40.8166805179367,40.8167041176784,40.8168221409532,40.8169423397514,40.8170644673477,40.8171882730564,40.8175489087042,40.8176104723109,40.8176731050248,40.8177361561244,40.8177989705394,40.8178608956568,40.8179212881013,40.8179795204194,40.8180349875991,40.8180871133557,40.8181353561195,40.8181792146624,40.8188883571268,40.8190012101071,40.8195285886899,40.8195913810168,40.8197419356444,40.8198024323417,40.8199840013983,40.8201645927034,40.8204051183965,40.820699606823,40.8211324030374,40.8213289340311,40.8215240950677,40.8219501710322,40.8220397225826,40.8221404898561,40.8222152608711,40.8222349762659,40.8222528489576,40.8223213405709,40.8223370300329,40.8223804336632,40.822401620602,40.8225050420869,40.8225891131399,40.8226887481459,40.8227698097295,40.8228758034271,40.8228835644896,40.8229228465581,40.823016322346,40.8230381591519,40.8230786319201,40.8231626178869,40.8232187173854,40.8232653550835,40.8234274536935,40.8236859704763,40.8238051008793,40.8238634265191,40.8239642273544,40.8241104930367,40.8241380354028,40.8241614520519,40.8241803329648,40.8241836013874,40.8241921961871,40.824205904858,40.8242266695428,40.8242526710245,40.8242831192806,40.8243170891774,40.8243450009413,40.8243734129749,40.8244018398261,40.8247619780237,40.8254760946314,40.8258194209672,40.8261533267488,40.8263491677074,40.8267647352185,40.826964271825,40.8273756732199,40.8278113306656,40.8278851256926,40.827978219593,40.8281232744532,40.8283418879439,40.8283717137366,40.8284036174035,40.8286053318715,40.8286466049828,40.8286998075322,40.8287994687215,40.8289229809969,40.8290739624537,40.8298306912489,40.830629758639,40.8307131765345,40.831748524329,40.8317798636101,40.8322040233211,40.8329833802886,40.8331561187525,40.8333824553581,40.8336011542336,40.8336906678483,40.8338102233676,40.8339581193035,40.834109208661,40.8342823629375,40.8344271980852,40.8345877171315,40.8347198898131,40.8348741204419,40.8350063157579,40.835141687594,40.8352928110848,40.8354438945845,40.8355823498828,40.8357240332211,40.8359179554766,40.8365693466569,40.8367410407608,40.8371074159251,40.8372048854776,40.8373924726175,40.8375925458493,40.8378315863306,40.8380422446326,40.8382477116205,40.838277569568,40.8384598456551,40.8387136280578,40.8388017847159,40.8387984858257,40.8395654059862,40.839524313945,40.8392062733977,40.8391368391273,40.8390660652862,40.8390041534653,40.8389439973403,40.8388521182089,40.8388575921478,40.8389443535297,40.838947871008,40.8388380904559,40.8388274554114,40.8387520405934,40.8386284294053,40.8386141774201,40.8382865171442,40.8382519754739,40.8379024965773,40.8378206632593,40.8378217494323,40.8379049577982,40.8379049383802,40.8376871787613,40.8376889755464,40.8377881114949,40.8377827964741,40.8375838970902,40.8372232771488,40.8369911338249,40.8368852765531,40.836766008228,40.8366782868412,40.8364196971759,40.8361162414639,40.8361319708445,40.8362963056924,40.8362962783705,40.8361339222842,40.8361358768608,40.8361049996907,40.8361049851119,40.8361318706336,40.8361308566494,40.8360671137589,40.8360671319843,40.836077092895,40.8360544000702,40.8360165548862,40.8360313440876,40.8360173983144,40.8360026145801,40.8359587953394,40.8359646412493,40.8359536882233,40.8359438543126,40.8358900773018,40.8358999640414,40.8358880134337,40.8358741448051,40.8358113983537,40.8358291159918,40.8360631817476,40.8360631598801,40.8357080506846,40.8356707186986,40.8356677526273,40.8356997123697,40.8358022359378,40.8357884894034,40.8357446676904,40.8357574336883,40.8357434897363,40.8357257515555,40.8356759448331,40.8356897569619,40.8356758100161,40.8356590141047,40.835643079786,40.8356192074919,40.8356616669108,40.8353741424097,40.8352304476122,40.8350927078166,40.8349364829275,40.8345244953327,40.8344088709594,40.8343554874818,40.8342010523503,40.8347777470676,40.8356253025498,40.8363474952993,40.837010527112,40.8377842871409,40.8387800833759,40.8398513043708,40.8401215059892,40.8407354577473,40.8410469607221,40.8420726882375,40.8424701551548,40.842586993994,40.8426476329337,40.8427151219017,40.8427530068867,40.8427894898016,40.8428516281634,40.8429185710571,40.8430072249536,40.8430679986521,40.8431141511437,40.8432905480027,40.8435616107094,40.8444902173025,40.8449802319183,40.845427460749,40.844682548627,40.8441186282067,40.8435418059451,40.8429055404799,40.842269861547,40.8415280888383,40.8409560956207,40.8408847769986,40.8406509118619,40.8406014543219,40.8408829734818,40.8407670341695,40.8406992201194,40.8406768141352,40.8413020528784,40.842151349938,40.8426071071379,40.8427328434843,40.8428859100594,40.8435067888786,40.844384276379,40.8445926998885,40.8453928184807,40.8460573696679,40.8463833341949,40.8471493727829,40.8486406080874,40.8497088799812,40.8510417585734,40.8517962820193,40.8522468310337,40.8524757490562,40.8526408613189,40.8530195775613,40.8533159222454,40.8539362903303,40.8542471796318,40.8544323368314,40.8551302438827,40.8552611656522,40.8554879389928,40.8556058608904,40.8558730803709,40.8559902301674,40.8559906251353,40.8559921708826,40.8560358452586,40.8560795397618,40.8561323835244,40.8563522109563,40.8565436911331,40.8566935170366,40.8573499624236,40.8575243296239,40.8579945871445,40.8581903960537,40.8593597642993,40.8604133281048,40.8607890375821,40.8608920266758,40.8609038698644,40.8611821133886,40.8612271091474,40.8613845716451,40.8617613254983,40.8622117418838,40.8630367900041,40.8643439533508,40.8647407429326,40.8648106024352,40.8651255536883,40.8653235771756,40.8666481952854,40.8669358338153,40.8684260369843,40.8684823183037,40.8685506930474,40.8704765616004,40.8707684549124,40.8713294335771,40.8720367426448,40.8724304768407,40.8734091394891,40.8742929038762,40.8748791439921,40.875411132268,40.8754714980099,40.8760664072996,40.8765812624481,40.8770231113922,40.8775334518224,40.8775791132627,40.8786128478041,40.8786278015641,40.8789664522598,40.8790318042002,40.8796601253787,40.8800163223535,40.8802258949943,40.8803794149563,40.8804198135102,40.8807976077879,40.880930553889,40.8812152776197,40.881619729846,40.8817471016816,40.8819295991919,40.8823853055582,40.8827009750743,40.8837176435616,40.8838761888749,40.8839036166287,40.883930135035,40.8842067212603,40.8845091937673,40.8846426685227,40.8847049139799,40.884869952143,40.8849337282989,40.8850934469743,40.8851910718095,40.8853992724078,40.8854504751546,40.8855507003278,40.8856692545738,40.8856040216303,40.8848592758615,40.8841495338816,40.8835628208178,40.8834537127159,40.8833818206694,40.8832619860428,40.8831525549056,40.8830361742374,40.8828307495686,40.8827040270491,40.8826354979275,40.8825805530889,40.8824912780185,40.8824295941551,40.882364569646,40.8823098922932,40.8822311483099,40.8821420355082]},{"lng":[-73.8188357467381,-73.8187919449959,-73.818716624615,-73.8186477487054,-73.8185632555056,-73.8183930924158,-73.8182346833081,-73.8181321249584,-73.8181166690972,-73.8180311751456,-73.8179964051348,-73.818029630232,-73.8179237069072,-73.8179329780278,-73.8180113542336,-73.8181619714754,-73.8183186903982,-73.8184348042732,-73.8185728423115,-73.8186074508073,-73.8186639487429,-73.8186894001654,-73.8187367812091,-73.8187933308779,-73.8188155977266,-73.8188190807707,-73.8188600682899,-73.818850743698,-73.81887599359,-73.8188510357522,-73.8188699890384,-73.8188587594598,-73.8188357467381],"lat":[40.8652459008096,40.8651957976618,40.8651956793502,40.8651336248343,40.8652028885557,40.8652976205068,40.8654722311137,40.8654735192576,40.8655689704722,40.8656639643111,40.8657544467928,40.8659029920503,40.8659425527805,40.8659949841209,40.8660260806489,40.866035848841,40.8661099550676,40.8661125196808,40.8661317976088,40.8661008786313,40.8660985855872,40.8659723495114,40.8658604444879,40.8658390894841,40.8657295268301,40.8656032578957,40.8655342277468,40.8655008571999,40.8654484807931,40.8653936430513,40.8653484038081,40.8652758974854,40.8652459008096]}]],[[{"lng":[-73.7751378266796,-73.7751674217127,-73.7751908085067,-73.7752123382729,-73.7752320656786,-73.7752508850565,-73.7752652143695,-73.7752795482925,-73.7752929795513,-73.7753019160418,-73.7753054544282,-73.7753054060717,-73.7753044389242,-73.7753052886273,-73.7753052241461,-73.7753051711828,-73.77530333427,-73.7752952099559,-73.7752915679307,-73.7752771194794,-73.7752770457767,-73.7752734023249,-73.7752527300499,-73.7752311396364,-73.7752248196541,-73.7751978380109,-73.7751869940298,-73.7751752559245,-73.7751626289671,-73.7751572084514,-73.7751526643728,-73.7751386273333,-73.774931889674,-73.774929289754,-73.7749284592463,-73.774929428154,-73.7749285884248,-73.7749286230222,-73.7749268524924,-73.7749205839735,-73.7749179068178,-73.7749179483429,-73.7749278474396,-73.7749287867995,-73.7749350968337,-73.7749432115575,-73.7749594075993,-73.7749720152424,-73.7749854888788,-73.7750043844666,-73.7750133716439,-73.7750232661086,-73.7750394413777,-73.7750547316535,-73.7750610223432,-73.7750709615798,-73.7750817815331,-73.7751000777738,-73.7751043612942,-73.7751071170383,-73.7751080771104,-73.7751153236846,-73.7751225539018,-73.7751378266796],"lat":[40.8611846758508,40.8611762683864,40.8611806895073,40.8611855028639,40.8611923569967,40.8612026176263,40.8612128690046,40.8612217574176,40.8612320082159,40.8612442938805,40.861259977971,40.8612742904286,40.8612947371537,40.8613090513602,40.861328136368,40.8613438122916,40.8613560781473,40.8613690124068,40.8613840001892,40.8614091903908,40.8614310019954,40.8614466709255,40.8614534463599,40.8614663548859,40.8614772478615,40.8614915090183,40.8615126171461,40.8615323605582,40.8615493756218,40.861559588525,40.8615759381873,40.8615942811407,40.8615523028641,40.8615257466328,40.8615059792312,40.8614848518646,40.8614678093848,40.8614575864884,40.8614500856807,40.8614453020434,40.8614405259145,40.8614282565625,40.8614214596705,40.8614091932426,40.8614017087,40.8613914998895,40.8613806261923,40.861369064343,40.8613670458264,40.861354131421,40.8613514235036,40.8613459895669,40.8613412496968,40.8613331008352,40.8613310683056,40.861312003219,40.8612983924086,40.861283784495,40.8612582220322,40.8612398252639,40.8612214233203,40.8612023534836,40.8611880545212,40.8611846758508]}],[{"lng":[-73.7746015635093,-73.7745818738489,-73.7745783378966,-73.7745703272304,-73.7745730783146,-73.7745740357912,-73.7745741074101,-73.7745885546017,-73.7745975950086,-73.774610249902,-73.7746247132312,-73.7746247963846,-73.7746338367722,-73.7746554235571,-73.774668310426,-73.7746895833706,-73.7747147252436,-73.7747398742583,-73.7747565753941,-73.7747736506934,-73.7747906456468,-73.7748071078835,-73.7748225992124,-73.7748367072857,-73.7748490565748,-73.774859318366,-73.7748672195099,-73.7748725496928,-73.7748670959213,-73.7748661403912,-73.7748768599432,-73.7748768022625,-73.774875871895,-73.774868598364,-73.7748613677863,-73.7748568162458,-73.7748370177684,-73.7748091371018,-73.774785745786,-73.7747704345425,-73.7747488507719,-73.7747254931765,-73.7747084242581,-73.7746796809878,-73.774662623614,-73.7746446734507,-73.7746258194959,-73.7746015635093],"lat":[40.8620690474598,40.8620498932058,40.8620335289538,40.8620130651991,40.8619960309065,40.8619783112882,40.8619571826756,40.8619326732098,40.8619142882308,40.8618890934396,40.8618598137646,40.8618352767379,40.8618168905831,40.8618046649885,40.8617971520949,40.8617917811164,40.8617904665674,40.8617871084058,40.8617843236464,40.8617836377323,40.8617850689212,40.8617885791177,40.8617940748875,40.8618014099447,40.8618103890448,40.8618207731825,40.8618322859529,40.8618446209093,40.8618643765507,40.8618814143542,40.8618971119656,40.8619141515209,40.86192369135,40.861950941464,40.8619652410783,40.8619836348369,40.861997909925,40.8620121685656,40.8620271177837,40.8620414009489,40.8620522641007,40.8620569899069,40.8620603650155,40.8620643984751,40.8620643651633,40.862062967133,40.8620629303068,40.8620690474598]}],[{"lng":[-73.8203671786964,-73.8204316052324,-73.8204720313919,-73.8204644195865,-73.8203524329082,-73.8202164306561,-73.820064135302,-73.8199760536281,-73.8199922794837,-73.8200805926542,-73.8202090330985,-73.8203615915905,-73.82052210579,-73.8206743676083,-73.8207463886159,-73.8208504007906,-73.8209385653091,-73.8210027950278,-73.8210109325885,-73.8209710986057,-73.8209713609405,-73.8210117522057,-73.8209878810678,-73.8209319865486,-73.8209402707989,-73.8209885368425,-73.8211089048712,-73.8212371325298,-73.8213815513288,-73.8214456488136,-73.8213972857994,-73.8213970568015,-73.8213968605195,-73.8214446022487,-73.8215405117246,-73.8216205401917,-73.8216924637047,-73.8216894717082,-73.8216112750702,-73.8215869467944,-73.8216590187428,-73.8218195509981,-73.8219401161444,-73.822012580825,-73.8221491092094,-73.822293465801,-73.8223143428656,-73.8224138835691,-73.8225343506467,-73.8227190959282,-73.8227754156684,-73.8226392122034,-73.8224626857813,-73.8223502732815,-73.8221736320141,-73.8219731193582,-73.8219171902999,-73.8219254745029,-73.8220137870752,-73.822141998094,-73.8222946538731,-73.822407243871,-73.8223512657316,-73.8222388060022,-73.8220141293875,-73.8218135516806,-73.8216852746283,-73.8215973878264,-73.821613676663,-73.8217422153374,-73.8218304938352,-73.8219911380911,-73.8219673963981,-73.8217670333523,-73.8215664744306,-73.821350001623,-73.8211014236926,-73.8205480130711,-73.8204115515322,-73.8202669679571,-73.8202828485718,-73.8203066356453,-73.82023946193,-73.8200668581566,-73.8198933046222,-73.8197192080192,-73.8195449763124,-73.8193710177829,-73.819197740072,-73.8190849168927,-73.8189494825675,-73.8187914776309,-73.818655959713,-73.8185700330994,-73.8184929640527,-73.8184428112822,-73.8184572658376,-73.8184785179755,-73.8185064968899,-73.8185411093534,-73.8185822400276,-73.8185994984742,-73.8186209447384,-73.8186465597711,-73.8186475161255,-73.8186395055248,-73.8186226461335,-73.818597186671,-73.8185635027432,-73.8185220913019,-73.8184735633134,-73.8184186347457,-73.8183581160044,-73.8182928999771,-73.8182239488584,-73.8181522799543,-73.8180789506711,-73.8180050429142,-73.8179141983246,-73.8178246409387,-73.8177371558054,-73.8176525098066,-73.8175714449345,-73.8174946717865,-73.8174228633364,-73.8173566490347,-73.8173017508934,-73.8172458575765,-73.8171902403767,-73.8171361643071,-73.8170848593286,-73.8170374923764,-73.8169951408176,-73.8169587679479,-73.8169292010807,-73.8169071127295,-73.8168930053109,-73.8169000986419,-73.8169101901739,-73.8169029496486,-73.8168913801002,-73.8168757938993,-73.8168566118653,-73.8168343519053,-73.8168096150305,-73.8167830691291,-73.8167554309333,-73.8167274466677,-73.8166998719005,-73.8166734511436,-73.8166488977503,-73.8164139210273,-73.8163290827876,-73.815876382575,-73.8154929370792,-73.8152632141528,-73.8147962975735,-73.814852060241,-73.8138180258673,-73.8127314649504,-73.8123060270842,-73.8164087090802,-73.8165771147144,-73.8168498133837,-73.8169625442986,-73.8169698373241,-73.8169857776309,-73.8170102376815,-73.8170430217888,-73.8170838676825,-73.8171116607959,-73.8171332649234,-73.8171484062352,-73.8171568928222,-73.817158617127,-73.8171306932316,-73.8171263313162,-73.8171309946555,-73.8171397621267,-73.8171582563326,-73.8171719135278,-73.8171945972528,-73.8172082835312,-73.8171903962615,-73.8171318989228,-73.8171084861675,-73.8170823418616,-73.8170237324759,-73.8169695309101,-73.8169289122749,-73.8169154231731,-73.8169380409761,-73.8169742213086,-73.8170148870242,-73.817069078867,-73.8170872495111,-73.8170873908365,-73.8170878688155,-73.8171055524649,-73.8171236853719,-73.8171238643446,-73.8171240904221,-73.817088144567,-73.8170576472243,-73.817011798577,-73.8169668381161,-73.8169173186943,-73.8168587387075,-73.8167820523949,-73.8167008280947,-73.8166061127024,-73.8165069437184,-73.8164123324573,-73.816326632894,-73.8162859590691,-73.816239841506,-73.8162271896867,-73.8161775944023,-73.8161579371529,-73.8161101320142,-73.8160470692778,-73.8159613683239,-73.8159021993007,-73.8158456481149,-73.8157953756309,-73.8157137849451,-73.8156984546636,-73.8156997731384,-73.8157843266855,-73.8158613075976,-73.815884209736,-73.8160356813382,-73.8160396317423,-73.8160102881625,-73.8159544918557,-73.8159652855003,-73.8160553634239,-73.8161947241598,-73.8162717760661,-73.8162861909423,-73.8162490170486,-73.8159407672751,-73.8158096383237,-73.8157326602227,-73.8156716689797,-73.8156527905891,-73.8155203459238,-73.8154404039996,-73.8153669755972,-73.8152827517089,-73.815209651323,-73.8152085562397,-73.8151310282062,-73.8151419191866,-73.8163011915219,-73.8172632266091,-73.8182022683034,-73.8191500914545,-73.8201404361447,-73.8204840561741,-73.8211035563378,-73.8220382684854,-73.8230129698969,-73.8239595539916,-73.8244376041839,-73.8249569766314,-73.8254923666768,-73.8255826701322,-73.8254753845592,-73.8255102231047,-73.8257268144441,-73.8258868041304,-73.825977351434,-73.8262506803238,-73.8264582938819,-73.8265546067396,-73.8267260158735,-73.826979355415,-73.8272024925577,-73.8272548043598,-73.8272856124752,-73.8272945699846,-73.8272815422716,-73.8272573571223,-73.8272466141637,-73.8271898266553,-73.8271115838104,-73.826878543486,-73.8269849071501,-73.827184237589,-73.8271313332546,-73.8267594811613,-73.8269355604507,-73.8270757933538,-73.8273783576626,-73.8272175114404,-73.8272302606017,-73.8280141596088,-73.8286019716532,-73.8290831870588,-73.8294352707923,-73.8295762357272,-73.8298439885255,-73.8299162390975,-73.8299055380277,-73.8299990383079,-73.8272176947334,-73.8271455629839,-73.8270544139317,-73.8268940432236,-73.8261532357178,-73.8255543837113,-73.8247082676358,-73.8241806766833,-73.8236530946869,-73.8235912425256,-73.8226058537854,-73.8224470771928,-73.8221499505797,-73.8218563942255,-73.8215666530952,-73.8212809689737,-73.8209995802638,-73.820722721788,-73.8204506245922,-73.8201835157532,-73.8199216181894,-73.81971890258,-73.8195233299826,-73.8193354978936,-73.8191559672191,-73.8189542559541,-73.8189148782768,-73.8188818473955,-73.8188512599791,-73.8188501222153,-73.8188719643612,-73.8189134807487,-73.8189535430748,-73.8193471316074,-73.8193770926057,-73.8194047988668,-73.8194352851437,-73.8194647167815,-73.8195137193205,-73.819641048894,-73.8197677452616,-73.8198375878216,-73.8199153170096,-73.8200060349526,-73.8200839171549,-73.8201069613836,-73.8201723331693,-73.8202279185338,-73.8202615721456,-73.8203119137807,-73.8203183681717,-73.8203426504073,-73.8203268193787,-73.8203671786964],"lat":[40.86067232952,40.8605810673578,40.86046540253,40.860313118868,40.8601911268287,40.8600508253024,40.8600018611671,40.859940815402,40.8598738403615,40.8598496138276,40.8598193604513,40.8597708713564,40.8597467575474,40.8598079031707,40.8598750144391,40.8599787204244,40.8600093125568,40.8599911390931,40.8599485154786,40.8598449085703,40.8597474555276,40.8596439730865,40.8595708450406,40.8594733048492,40.8593758630774,40.8593272112461,40.8593152157978,40.8593641424459,40.85935827446,40.8593888284448,40.8594740260737,40.8595592982031,40.8596323877372,40.8597786429799,40.8599127900684,40.8599860053333,40.8600896611072,40.8602361413712,40.8604488976177,40.8605463134367,40.8605951515792,40.8605649460132,40.8604798596738,40.8603825168751,40.8603279102076,40.8603464052629,40.8603411570759,40.8603161359052,40.8602675945435,40.8601826065903,40.8601217837507,40.8600545751101,40.8600664857544,40.8601028573039,40.8601574040684,40.8601388217242,40.8600534629379,40.8599560211075,40.859931794267,40.8599868103599,40.8599017731082,40.8597984018664,40.8597313163391,40.8597859598321,40.859803886079,40.8598096681401,40.8597790151909,40.8596448801226,40.8595535416713,40.8594867404811,40.8594746958694,40.8594018528211,40.859279999118,40.8592065987554,40.859206288756,40.8591572275405,40.859114205621,40.8590646194551,40.8590948612279,40.8591616354448,40.8592225695596,40.8593261512252,40.8593566950137,40.8593386213718,40.8593269108669,40.8593215909403,40.8593226740585,40.8593301576833,40.8593440242782,40.8593472727744,40.8593676181441,40.8593913522563,40.8594425311957,40.8595109187575,40.8596409899537,40.8598293476961,40.8599190959414,40.8600080613181,40.8600959473055,40.8601824609793,40.8602673139879,40.8603741483542,40.8604805445552,40.8605864079887,40.8606425154476,40.8606982970383,40.8607529297701,40.8608056076005,40.8608555533274,40.860902030056,40.8609443520715,40.8609818949563,40.8610141048027,40.8610405063861,40.8610607101766,40.8610744180864,40.8610814278681,40.8610816360989,40.861074419047,40.8610607832924,40.8610408483647,40.861014789011,40.860982833664,40.8609452624398,40.8609024046818,40.8608546360736,40.8608464600162,40.8608446449353,40.8608492321151,40.8608601172202,40.8608770526687,40.8608996532637,40.8609274049538,40.8609596765251,40.8609957339579,40.8610347571213,40.861075858427,40.8611081695941,40.8611400178761,40.8611605409157,40.8611798866921,40.8611975328759,40.8612130030255,40.8612258794514,40.8612358144938,40.8612425399091,40.8612458741127,40.8612457270821,40.8612421027868,40.8612350990822,40.8612249050664,40.8611806277039,40.8611527305223,40.8610038646114,40.8609552867371,40.861117747125,40.8611289567468,40.8609009903099,40.8605482791733,40.8588775419478,40.8541620264733,40.8540822551148,40.8538224267019,40.8532846825006,40.8527850131781,40.8527112782989,40.8526383331134,40.8525667611239,40.8524971348465,40.8524300112315,40.8523893942209,40.8523466624337,40.8523023575142,40.8522570410456,40.8522112874319,40.8521500981766,40.8520952734712,40.8520404629044,40.8520184400577,40.8519719833728,40.8519274649749,40.8518829613815,40.8518281657774,40.8517698936113,40.8517115565728,40.8516985698707,40.8516840692761,40.8516668455182,40.8516873157069,40.8516906777865,40.8516735255671,40.8516530052895,40.8516222269324,40.8516017352718,40.8515846897345,40.8515401796732,40.8514887879615,40.8514877045055,40.8514477032408,40.8514168962223,40.8513518012922,40.8512695734448,40.8512146991595,40.8511785968358,40.8510843849699,40.8510260698137,40.8509848777161,40.8509573759987,40.8509504018371,40.8509536981657,40.8509398438512,40.8509054250287,40.8508538825588,40.8508434672182,40.8508673851572,40.8508995741062,40.8509084057416,40.8508946217709,40.8508716293008,40.8508157130727,40.8507779260436,40.8507675109317,40.8507843739506,40.8507954228493,40.8508187044495,40.8508162043475,40.8507971178269,40.8507723367984,40.8507190779966,40.8506927401809,40.850684905462,40.8506026691164,40.8505283245014,40.8504653706749,40.8504388385415,40.8503895256971,40.850386080334,40.8503779398436,40.85031203978,40.850194576449,40.8501251776302,40.8497744294363,40.8496276855442,40.8495384494819,40.8494559092091,40.8493498371258,40.8492278739309,40.8491943960846,40.8491921465082,40.8492392091718,40.8492307629787,40.8492299515817,40.8491725040558,40.8490806127351,40.8485721724036,40.8484265673581,40.8483110319788,40.8481701799873,40.8480205985507,40.8485010256302,40.8481989807793,40.8476903687039,40.8471617388565,40.8466412420541,40.8463778745736,40.846105444802,40.845836846077,40.8458630487035,40.8455583886229,40.845561537337,40.8462074368627,40.8461764414555,40.8461502294325,40.8467524951107,40.8471051994446,40.8472874415574,40.8475391849537,40.848093411579,40.8488259348462,40.8491259836566,40.8494288848257,40.8497332948133,40.8500378392255,40.8502477436293,40.8503421895008,40.8506462456696,40.8509463710299,40.8516699100256,40.8516842794588,40.8517112057939,40.8518710810244,40.8530068192239,40.8530050968406,40.8529458315274,40.8528179596694,40.8532505132979,40.8533507569479,40.8547224869677,40.8557178475947,40.8556760141988,40.8558881400116,40.8559730686949,40.8561343810312,40.8561808182253,40.8562563631214,40.8582111360458,40.8592065770424,40.8592323949348,40.8592611156032,40.8593121731403,40.8595471439454,40.8597370843229,40.859972442754,40.8601451470708,40.8603178483175,40.8603390746449,40.8606772407796,40.8607342845534,40.8608248781052,40.8609219498226,40.8610254187067,40.8611351984206,40.8612511973607,40.8613733187336,40.8615014606367,40.8616355161428,40.8617753733896,40.8618962541785,40.8620240547851,40.862158378145,40.8622988179254,40.8624745616912,40.8624339793278,40.8624110772859,40.8623760709791,40.8623039922328,40.8622455455974,40.8621984430304,40.8621524272365,40.8618275305144,40.8617955851321,40.8617367595871,40.8616506196653,40.8615475087951,40.8614709104734,40.8614289234893,40.8613767536343,40.8613470343226,40.8613000219368,40.8612457404807,40.8612193200368,40.8612115028033,40.8611819438414,40.8611391268643,40.86110390103,40.8610311075692,40.8609219794277,40.8608428357611,40.8607636291263,40.86067232952]}],[{"lng":[-73.7831258952828,-73.7831088609243,-73.7830880239059,-73.7830717154283,-73.7830581418707,-73.7830355109755,-73.7830165411918,-73.7830102575906,-73.7830094011577,-73.7829967246609,-73.7829740825711,-73.7829631851179,-73.7829558947179,-73.7829377562434,-73.7829278353194,-73.7829161867459,-73.7829189744151,-73.7829244568125,-73.7829118672329,-73.7829001470589,-73.7828911822455,-73.7828930636722,-73.7829021856518,-73.7829004366952,-73.782905054142,-73.7828996766157,-73.7828988305571,-73.782899797861,-73.7829061936613,-73.7829053662226,-73.7828963497963,-73.7828818862492,-73.7828819266694,-73.7828819783118,-73.7828974421715,-73.7828983982876,-73.7828957507203,-73.7828903208138,-73.7829091372512,-73.782943021284,-73.7829691084348,-73.7829756669508,-73.7829991749967,-73.783029163588,-73.7830539987515,-73.7830527887598,-73.7830489731726,-73.7830158462157,-73.7830372110121,-73.7830432358342,-73.7830804240189,-73.7830869986449,-73.7830883952701,-73.7831061033422,-73.7831450428814,-73.7831576133541,-73.7831797146049,-73.7831965836379,-73.783195192648,-73.7831885989094,-73.7831898347776,-73.783198894029,-73.7832053621406,-73.7832091601167,-73.7832182097036,-73.7832337945159,-73.7832350562121,-73.7832284861614,-73.7832193204026,-73.7832192332803,-73.7832204668199,-73.7832256265365,-73.7832255845897,-73.7832268204757,-73.7832098087036,-73.7831915287775,-73.7831745376776,-73.7831731649346,-73.7831717806055,-73.783159098423,-73.783159423968,-73.7831337918232,-73.7831206877043,-73.7831428317427,-73.7831605626672,-73.783185859161,-73.7832171384209,-73.7832301489424,-73.7832444170654,-73.78325862991,-73.7832585686134,-73.7832311428397,-73.7832115301558,-73.7832362903425,-73.7832493576422,-73.7832624131362,-73.7832715047434,-73.7832805769958,-73.7832805350593,-73.7832687251413,-73.7832530924722,-73.7832413599762,-73.7832230773977,-73.7832086889733,-73.7831890568956,-73.7831671444581,-73.7831258952828],"lat":[40.8628561672994,40.8628394748925,40.8628394357218,40.8628400929133,40.8628352525978,40.8628297080678,40.8628131651242,40.8627952710025,40.8627801383269,40.8627780516009,40.8627759449567,40.8627841778431,40.8627972328116,40.8628033885188,40.8627896144932,40.8627503888763,40.8627290720543,40.8627146398256,40.8626857285397,40.8626685120344,40.8626396082363,40.862618290882,40.8625990495343,40.8625797889044,40.8625529740503,40.8625350816266,40.8625165093745,40.8624979410369,40.8624814469716,40.8624573732796,40.8624442876315,40.8624346319971,40.862422251242,40.8624064330913,40.8623872041795,40.862371386558,40.8623500601781,40.8623171942281,40.8623177280157,40.8623227410812,40.8623198202957,40.8623079535338,40.862296119823,40.8622961762197,40.8622774145422,40.8622487047533,40.8622190010056,40.8621947276988,40.8621738838808,40.86216800508,40.8621705556905,40.8621537391325,40.862123946848,40.8621066709286,40.8620686789057,40.8620905196322,40.8621103587707,40.8621351378934,40.862161862665,40.8621846175697,40.8622054077279,40.8622262120839,40.8622420622533,40.8622767164523,40.8623004904791,40.862319328136,40.8623321993339,40.8623480245037,40.8623598863813,40.8623866136018,40.8624083929814,40.8624252315929,40.8624381003414,40.8624588899957,40.8624776664096,40.8624855510695,40.8624983879681,40.8625191727206,40.8625439168712,40.8625726861545,40.8625843715366,40.8625982906414,40.8626180636131,40.8626250345127,40.8626252170998,40.8626251153739,40.8626291335667,40.8626380674175,40.8626608615154,40.8627004844242,40.8627192921817,40.8627330992158,40.8627498901114,40.8627538967202,40.8627450120294,40.8627400872374,40.8627509925103,40.8627678379649,40.8627807067125,40.8628034518218,40.8627994630368,40.862798450597,40.8628073261587,40.8628211576808,40.8628438875819,40.8628612170923,40.8628561672994]}],[{"lng":[-73.784012491389,-73.783952321433,-73.783895340275,-73.7838708144073,-73.7838611886511,-73.7838512202789,-73.7838361239698,-73.7838132254464,-73.783795680359,-73.7837787415074,-73.7837563327808,-73.7837174674923,-73.7836988587245,-73.783687633285,-73.7836625672639,-73.783634880841,-73.7836082805867,-73.7835912769802,-73.7835648188609,-73.7835516610279,-73.7835410529966,-73.7835384378993,-73.7835398092882,-73.7835425231161,-73.7835439107406,-73.7835639493299,-73.783586592922,-73.7836172020301,-73.7836464781436,-73.7836864419092,-73.7837077989767,-73.7837185262937,-73.7837425675275,-73.7837731785961,-73.7838011734367,-73.7837985878665,-73.783777332747,-73.7837640541046,-73.7837507750274,-73.7837202166093,-73.7836962773421,-73.783676336177,-73.7836724235964,-73.7836804838153,-73.783687224624,-73.7836952841707,-73.7837113019703,-73.7837219987663,-73.7837274177446,-73.7837275065253,-73.7837368887363,-73.7837569170728,-73.7837582949926,-73.7837677034899,-73.7837930764634,-73.7838264109627,-73.7838597152168,-73.7838876912407,-73.7838957415019,-73.783894508841,-73.783914534695,-73.7839398320315,-73.7839717754583,-73.7839891241565,-73.7840131651343,-73.7840331476036,-73.7840757656106,-73.7841036969555,-73.784130305168,-73.7841609042523,-73.7841848303381,-73.7842087695524,-73.7842327448609,-73.7842594023036,-73.7843073332376,-73.7843286100172,-73.7843592178853,-73.784404461453,-73.7844417388422,-73.7844710187814,-73.784497661156,-73.7845269959102,-73.7845523718974,-73.784589680706,-73.7846322817113,-73.7846602426389,-73.7846916585071,-73.7846947667645,-73.7846800522657,-73.7846719734112,-73.784651967343,-73.7846413363095,-73.7846306682255,-73.7846027077061,-73.7845773613974,-73.7845466748544,-73.7845439293976,-73.7845398085793,-73.7845396972058,-73.7845465001319,-73.7845608751644,-73.7845674494815,-73.7845673217425,-73.7845525505725,-73.7845297956564,-73.7845163821167,-73.784495012141,-73.7844722864358,-73.7844482486984,-73.7844162263221,-73.7843935591263,-73.7843581180463,-73.7843295477526,-73.7843030179931,-73.7842937482678,-73.7842724711161,-73.7842537845359,-73.7842244086146,-73.7841910647684,-73.7841670236383,-73.7841682767855,-73.7842068207534,-73.784254702922,-73.7842759656718,-73.7842878476008,-73.7842865050007,-73.7842698189831,-73.7842566494319,-73.7842374796012,-73.7842145889189,-73.7841847875146,-73.7841643404756,-73.7841427690034,-73.7841098076781,-73.7840858928125,-73.7840444168663,-73.784012491389],"lat":[40.8631319940744,40.8631302648224,40.8631301581139,40.8631394112414,40.8631515215817,40.8631560052715,40.8631627948643,40.8631627519626,40.8631538245916,40.8631459599507,40.8631355577955,40.8631326546389,40.8631348890298,40.8631362376582,40.8631479154702,40.8631462452782,40.8631381100367,40.8631267584113,40.8631163129413,40.8631096817994,40.8630955063249,40.8630803346724,40.8630682051881,40.8630530435328,40.8630358577149,40.8630166845397,40.8630157158405,40.8630228512861,40.8630299837215,40.8630270246314,40.8630118990948,40.8629896744183,40.862968487543,40.8629746112761,40.8629665745245,40.8629423037225,40.862926086644,40.862913929032,40.8629017709151,40.8628794688528,40.862869313594,40.8628581546538,40.8628328696856,40.8628116516863,40.8627863878638,40.8627651698621,40.8627540778314,40.8627409534799,40.86271265366,40.8626853538485,40.8626671718398,40.8626510326306,40.8626368796377,40.8626106084644,40.8625894235706,40.8625773533014,40.8625743816744,40.8625714012307,40.862553216714,40.8625228815798,40.8625077528406,40.8625098225593,40.8625159487355,40.8625048596603,40.8624836710516,40.8624816861111,40.8624817658743,40.8624929408701,40.8625010786939,40.8625112474946,40.8625254466524,40.8625356029832,40.862534636648,40.862527608959,40.86253174259,40.8625418939186,40.8625490286633,40.8625602352702,40.8625643489381,40.8625704699998,40.8625684974193,40.8625574301471,40.8625352339199,40.8625292372154,40.8625343719329,40.8625364464654,40.8625427899082,40.8625678548908,40.862588048701,40.8626153336019,40.8626243954751,40.8626228622248,40.8626213228735,40.8626192478321,40.8626323454174,40.8626494760393,40.8626747485454,40.862713162383,40.8627475385155,40.8627737648055,40.8627880224399,40.862814322347,40.8628537548124,40.8628911375909,40.8629264831137,40.8629557792118,40.8629749505679,40.8630011964207,40.8630213727844,40.8630395125501,40.8630475589037,40.8630735179608,40.8630737275733,40.8630413233169,40.8630251292417,40.8630149785771,40.8630280868669,40.8630512878917,40.8630663916069,40.863087579748,40.8631118480484,40.8631361860977,40.863155485734,40.8631696810634,40.8631853305461,40.8632050887806,40.8632140174143,40.863216140275,40.8632161044294,40.8632132313115,40.8632071113883,40.8631994000598,40.8631912649673,40.8631742229425,40.8631592195115,40.8631401403623,40.8631319940744]}],[{"lng":[-73.7696354462226,-73.7699407693014,-73.7697769281753,-73.769447747668,-73.7696354462226],"lat":[40.8655425615823,40.8655234099992,40.8656865584024,40.865761350906,40.8655425615823]}],[{"lng":[-73.8185632555056,-73.8186477487054,-73.818716624615,-73.8187919449959,-73.8188357467381,-73.8188587594598,-73.8188699890384,-73.8188510357522,-73.81887599359,-73.818850743698,-73.8188600682899,-73.8188190807707,-73.8188155977266,-73.8187933308779,-73.8187367812091,-73.8186894001654,-73.8186639487429,-73.8186074508073,-73.8185728423115,-73.8184348042732,-73.8183186903982,-73.8181619714754,-73.8180113542336,-73.8179329780278,-73.8179237069072,-73.818029630232,-73.8179964051348,-73.8180311751456,-73.8181166690972,-73.8181321249584,-73.8182346833081,-73.8183930924158,-73.8185632555056],"lat":[40.8652028885557,40.8651336248343,40.8651956793502,40.8651957976618,40.8652459008096,40.8652758974854,40.8653484038081,40.8653936430513,40.8654484807931,40.8655008571999,40.8655342277468,40.8656032578957,40.8657295268301,40.8658390894841,40.8658604444879,40.8659723495114,40.8660985855872,40.8661008786313,40.8661317976088,40.8661125196808,40.8661099550676,40.866035848841,40.8660260806489,40.8659949841209,40.8659425527805,40.8659029920503,40.8657544467928,40.8656639643111,40.8655689704722,40.8654735192576,40.8654722311137,40.8652976205068,40.8652028885557]}],[{"lng":[-73.7669204662503,-73.7672284592154,-73.7671238058439,-73.7666809894407,-73.7669204662503],"lat":[40.8670495558513,40.8669286678911,40.867238188474,40.86732068414,40.8670495558513]}],[{"lng":[-73.7717176241043,-73.7722356472154,-73.7726348815417,-73.77157057964,-73.7711580678453,-73.7708486453095,-73.7717176241043],"lat":[40.8716211890253,40.8715639930681,40.871880208767,40.8718579498094,40.871804980973,40.8716277634744,40.8716211890253]}],[{"lng":[-73.7748304259469,-73.7749394101601,-73.7750498056392,-73.7750986232066,-73.7750888996918,-73.7750590679846,-73.7751183627788,-73.7751368996219,-73.7747807296371,-73.7746737974314,-73.7746437140013,-73.7747046261216,-73.7745143082242,-73.7745443691994,-73.7747546648108,-73.7748304259469],"lat":[40.8740287364363,40.8739186855422,40.8739377185108,40.8740287834937,40.8741656806505,40.8743082256902,40.8743883438338,40.8745544469437,40.8747672681638,40.8747905574113,40.8747093120375,40.8745797734902,40.8744981849944,40.874286311038,40.8741577257522,40.8740287364363]}],[{"lng":[-73.7819412286893,-73.7819955689649,-73.7819565999782,-73.7819869548308,-73.7820352780007,-73.7820862039681,-73.7821378749646,-73.7821398337383,-73.7820330853969,-73.7820665002638,-73.7821269906337,-73.7821599039993,-73.7822380792241,-73.7823163283618,-73.7824125081098,-73.7825268220777,-73.7825988088072,-73.7826578536091,-73.782623930097,-73.7826398694971,-73.782611385286,-73.7825261377404,-73.7824406498313,-73.7823652774674,-73.7822547504327,-73.7821369592633,-73.782096389027,-73.7820376967246,-73.7820261391335,-73.7819281370283,-73.7819814506338,-73.7819412286893],"lat":[40.8752159512247,40.8751589634861,40.8751155016868,40.8750333491942,40.8749763507382,40.8750426710183,40.8750290867875,40.8747459653505,40.87472743523,40.8746293027541,40.8745312225599,40.8745860909243,40.8745999405259,40.8745909537822,40.8746185382809,40.874621036766,40.8746873971805,40.8747926566941,40.8748582015944,40.8748784518374,40.874949873976,40.8751026739514,40.8752123266317,40.8751753319209,40.875160773056,40.8751615146739,40.8752105078037,40.8753047460394,40.8753833483803,40.8754046058686,40.8752274450981,40.8752159512247]}],[{"lng":[-73.7812945815069,-73.7814224288124,-73.7814389771328,-73.7814627394397,-73.7814732128251,-73.7815135709195,-73.781494442486,-73.7813994979628,-73.7813641559281,-73.7813801788729,-73.7814344596056,-73.7813955193731,-73.7813761030745,-73.7813375033859,-73.7812058137924,-73.7812090288385,-73.7812068417753,-73.7812314000691,-73.7812398408576,-73.7813051492695,-73.7812945815069],"lat":[40.8759449029054,40.875766339404,40.8758043370306,40.8758589011151,40.8759678482141,40.876046023437,40.8760994237681,40.8761526805096,40.8761957728929,40.8762636258465,40.8764031473164,40.8765390569828,40.8765523331015,40.8765787244457,40.8765900788502,40.8764359415093,40.8762776845787,40.8762201840734,40.8761236041937,40.8760250769166,40.8759449029054]}],[{"lng":[-73.8072864712257,-73.8069311323246,-73.8065773016606,-73.8063588494412,-73.8061408738587,-73.805924988776,-73.8057127720977,-73.8055057674358,-73.805201136032,-73.8032868213697,-73.8022038829629,-73.7993752043825,-73.7974482563964,-73.794492544383,-73.7941655582766,-73.7938552720907,-73.7930065264918,-73.7932287088216,-73.7935874186363,-73.7937923742423,-73.7949170558652,-73.7955457984265,-73.7950259623285,-73.7962509753579,-73.7971270117467,-73.7972039970304,-73.7974381545729,-73.7985533078772,-73.7989124546362,-73.7998138958034,-73.7998771379357,-73.8002727437516,-73.800354445589,-73.8003496779097,-73.8004766343745,-73.8005122388969,-73.8004754664885,-73.8005811368065,-73.8005724562113,-73.8006592085239,-73.8006554373432,-73.8006909704475,-73.800735001016,-73.800764438214,-73.800805155649,-73.8008681538326,-73.8009591317371,-73.8011078060407,-73.8011822700543,-73.8013560949612,-73.8014502576208,-73.8015351282492,-73.8017851740437,-73.8019645452857,-73.801912906495,-73.8019931231586,-73.8020918507462,-73.8020826375312,-73.8020545070842,-73.8021392605325,-73.8021960854513,-73.8022127286928,-73.8020788872404,-73.8021167957798,-73.8023308119321,-73.8025305596233,-73.8025668361242,-73.8026729876708,-73.8027590760359,-73.8027028360472,-73.8026843020232,-73.8026893913456,-73.8026047762351,-73.8026849489028,-73.8026428220398,-73.8026949472263,-73.8027608675273,-73.8027754777213,-73.8029784759347,-73.8031475585269,-73.8032501987906,-73.8033504398922,-73.8034411117772,-73.8035166856532,-73.8036171745203,-73.8036948592132,-73.8037649036221,-73.8038550294816,-73.8039252766126,-73.8040358885665,-73.8040612495136,-73.8040717526784,-73.8042413879728,-73.8042976148555,-73.8043722844172,-73.8044264672291,-73.804479366939,-73.8045412816963,-73.8045160459014,-73.8045514147277,-73.8046325055678,-73.8046897291289,-73.8047757114042,-73.8048482018141,-73.8049248477131,-73.8049922831058,-73.805170547675,-73.8052886184337,-73.8053878610035,-73.8054096138633,-73.8055051154449,-73.8056532379127,-73.8057111201859,-73.8059442865908,-73.8058877971247,-73.8058811414503,-73.8059525705198,-73.8059910180723,-73.8059571430529,-73.805871103326,-73.8057933375929,-73.8057056389254,-73.8056569294,-73.8056501944511,-73.8056596726139,-73.8056918674619,-73.80577265785,-73.8059865308911,-73.8060468367243,-73.8061721454968,-73.8063037715512,-73.8064037210311,-73.8064348991785,-73.8066042869457,-73.8067107638263,-73.8067042516656,-73.8067858832074,-73.806842142984,-73.8069425234505,-73.8070491532468,-73.8071119674992,-73.8071052199322,-73.8072434308213,-73.8073940431529,-73.8074629964111,-73.8076385945859,-73.8078579680425,-73.8078638739082,-73.8078259755532,-73.807863488383,-73.8079642953943,-73.8080395273652,-73.8081963223922,-73.8082965942431,-73.8083277467561,-73.8083906986881,-73.8085287710773,-73.8086730676319,-73.8086977647588,-73.8087671044093,-73.8089240358265,-73.8090998425718,-73.8092442345299,-73.8091804845686,-73.8090309563674,-73.808848969542,-73.808817719864,-73.8087486284481,-73.8085543609529,-73.8085796352041,-73.8085294022404,-73.8084102034906,-73.8084606821861,-73.8084797065124,-73.8084171250531,-73.8085303215425,-73.8086310599263,-73.8087254925601,-73.8085978992402,-73.808417715724,-73.8083004857598,-73.8081899847763,-73.8081390541736,-73.8081153896957,-73.80800846629,-73.8078639407575,-73.8077977164232,-73.8077756957317,-73.8076958218296,-73.8075956868824,-73.8075406363618,-73.8075396728931,-73.8075368377559,-73.807568374339,-73.8076532073027,-73.8077412122981,-73.8078041696716,-73.8078734322084,-73.8078861042802,-73.8079538842319,-73.8080190249203,-73.8079869375226,-73.8079964558793,-73.8080924153667,-73.8081180682031,-73.8080939309533,-73.8081537636944,-73.8082254429363,-73.8082664041248,-73.8083455321604,-73.8083738765247,-73.8084899752206,-73.8084085098664,-73.8084022624256,-73.8084326890087,-73.8085255793084,-73.8085934655299,-73.8086187329308,-73.8087494782117,-73.8087094249837,-73.8086113929117,-73.8085081841478,-73.8084277381563,-73.8083776252167,-73.8082894541374,-73.808209517861,-73.808093212704,-73.8080253095233,-73.8080151166521,-73.8079798829098,-73.8079420323054,-73.8078716236652,-73.8078538765329,-73.8077910879829,-73.8077485139458,-73.8076178667462,-73.8075024111839,-73.80741951896,-73.8073618401238,-73.8072915305308,-73.8072546425487,-73.807155899555,-73.807090705327,-73.8070481593777,-73.8070306723736,-73.8069253872038,-73.8068425670653,-73.8067949052105,-73.8067295839271,-73.8067321672959,-73.8067021642797,-73.8067400159924,-73.806750230442,-73.8067454528107,-73.8067783153622,-73.806753422436,-73.8067812921388,-73.8068273998491,-73.8068493062778,-73.8069423564928,-73.8069499770167,-73.8068545490562,-73.8067993153805,-73.8066836841929,-73.8065958435657,-73.8065457325562,-73.8065508426005,-73.8066036431878,-73.8066463773828,-73.8067307490511,-73.8067419409634,-73.8066842355304,-73.806611272173,-73.8065536283932,-73.8065539278135,-73.8064661051063,-73.8063849407163,-73.8063784758118,-73.806308333988,-73.8062607609831,-73.8061427244538,-73.8060563575943,-73.8059317955979,-73.8058568595074,-73.8057558732835,-73.8056735582931,-73.8056258634913,-73.8055504225674,-73.8054977238473,-73.8054853252004,-73.8054102188736,-73.8053573297108,-73.8052868925525,-73.8051940317198,-73.8051253599984,-73.8050409283412,-73.8050120101511,-73.8049429394312,-73.8048726616994,-73.8048024018342,-73.8047737712149,-73.8047198376026,-73.8047036442503,-73.8047577986095,-73.8047012405593,-73.8047393611145,-73.8047356983665,-73.8046460450292,-73.8044851910468,-73.8044546980114,-73.8044304475563,-73.8043355999991,-73.8042802121237,-73.8041589402159,-73.8041047129301,-73.8039955577663,-73.8038528078145,-73.8035991538933,-73.8033724425674,-73.8032401091024,-73.803152526309,-73.8031110227604,-73.8030038810895,-73.8029138708857,-73.8030555244455,-73.8029992653225,-73.8030562018376,-73.8030987400333,-73.8030187624008,-73.8030144890873,-73.803085305175,-73.8030950381953,-73.8030813174626,-73.803044079409,-73.8030069581871,-73.8028375907859,-73.80271535305,-73.802481099602,-73.8023048807285,-73.8022485516512,-73.8020529594041,-73.8019778963436,-73.8017726000069,-73.801725553191,-73.8017153840457,-73.8017523456108,-73.801480820561,-73.8013686244769,-73.801340098687,-73.8008531358764,-73.8007407874141,-73.8007006511376,-73.8005373463078,-73.8003194078996,-73.8000947273553,-73.7999638536766,-73.7999447763956,-73.7997764499821,-73.7997105758753,-73.7996171080765,-73.7995700754848,-73.7995694903761,-73.7994313885824,-73.7993542457367,-73.7993216937252,-73.7991800946584,-73.7990961830057,-73.7990722151717,-73.7989803432348,-73.7989021759509,-73.7986829429237,-73.79854108933,-73.7984123313401,-73.7983928019449,-73.7982963932455,-73.7982447662971,-73.7980685220546,-73.7978037721931,-73.7977404198527,-73.7976740071024,-73.7975432468307,-73.7974419348007,-73.7972707791217,-73.7971983072533,-73.7970865100279,-73.7970349889896,-73.7969706461591,-73.7969337497421,-73.7947904468145,-73.7939736383772,-73.7935721088359,-73.7935960533051,-73.7931670377871,-73.7942216999093,-73.7944029458609,-73.7938470272195,-73.7929988022,-73.7930387958811,-73.7928938952063,-73.7926048506948,-73.7923853100076,-73.7921907040825,-73.7919678215398,-73.7918945748058,-73.7917309548464,-73.7915049567696,-73.7909523900138,-73.7906312452509,-73.7906306750359,-73.790805954191,-73.7907616325509,-73.790440931811,-73.789558729443,-73.7894824554537,-73.7894071839181,-73.7893334077823,-73.7892616101982,-73.7891405072464,-73.7890590419732,-73.7891223537942,-73.7890728832659,-73.78911096048,-73.7893183578045,-73.7891202063692,-73.7892955659684,-73.7894779783655,-73.7897591481785,-73.7900633286077,-73.789523093688,-73.7882731347091,-73.7877541548974,-73.7874116965232,-73.7871264073479,-73.786940878067,-73.7867394646181,-73.7861098520813,-73.7858897216716,-73.7852313910201,-73.7848675599614,-73.7845849112644,-73.7844280994943,-73.7843816810757,-73.7842123058882,-73.7841970551985,-73.7841427218489,-73.7841773836882,-73.7844924540867,-73.7848054540206,-73.7847096402645,-73.7846746539644,-73.7848394454981,-73.7849418822533,-73.7849500756427,-73.7852486623769,-73.7854245913465,-73.7853988757831,-73.7855880723639,-73.7856907556887,-73.7859574222525,-73.7861494623108,-73.7862443857077,-73.7861015526193,-73.7863108074994,-73.7865345143752,-73.786593382665,-73.7866224927706,-73.7869057577694,-73.7870089192417,-73.7870425258862,-73.7871101295568,-73.7871368555428,-73.7867650811048,-73.7862487445261,-73.78602387303,-73.7858036804399,-73.7854898623279,-73.7852774937808,-73.7850813965877,-73.7850022922887,-73.7850622333494,-73.7851048140196,-73.7851050180722,-73.7851948465636,-73.7852411741622,-73.7854720056533,-73.785481257393,-73.7855297170343,-73.7854612490718,-73.7855367632569,-73.785542443543,-73.785214888055,-73.7850552739475,-73.784875293956,-73.7847618609721,-73.7842464617834,-73.7840103706005,-73.7837805168962,-73.7834018864173,-73.7832329753796,-73.7833563063733,-73.7835450276292,-73.7836532899615,-73.783745383473,-73.7838437652668,-73.7839461515596,-73.7839154893066,-73.7837214144294,-73.7837449840737,-73.7833520553102,-73.7831450860451,-73.7830685342603,-73.7830557962405,-73.783142188995,-73.7832426407426,-73.7832433113887,-73.7831866423008,-73.7832812880465,-73.7833757966625,-73.7835055553639,-73.7835256373509,-73.783608180677,-73.7836827125658,-73.783792603563,-73.7838790793923,-73.7839422776424,-73.7840129056006,-73.7840987530388,-73.7841546068584,-73.7842688350842,-73.7842964906167,-73.7843985917781,-73.7845524494721,-73.784561680102,-73.7847351358767,-73.7848845939131,-73.7850461290449,-73.7852551748187,-73.7856024530545,-73.7856131971946,-73.7856244216368,-73.7856357932095,-73.7856469743744,-73.7856576332448,-73.7856674534368,-73.7856761434608,-73.7856834453733,-73.7856891424336,-73.7855607293644,-73.7855223748242,-73.785672150052,-73.7860107692419,-73.7865193540714,-73.7874044959486,-73.7876775055994,-73.7880354832577,-73.7883272333658,-73.7892791902781,-73.7894864026915,-73.7897409866335,-73.7900142645293,-73.7904861710853,-73.7907689301798,-73.7913076348604,-73.7916101173377,-73.7918293399445,-73.7919152507282,-73.7919927722335,-73.7920618114394,-73.7921222855128,-73.7921741219081,-73.7922172584536,-73.7922516434259,-73.7922772356116,-73.7922940043569,-73.7923019296033,-73.7923010019118,-73.7922912224739,-73.7922726031093,-73.7922451662519,-73.7922089449225,-73.7921639826881,-73.7921103336099,-73.792048062178,-73.7919772432332,-73.7918979618772,-73.7918103133699,-73.7917144030147,-73.7916103460322,-73.7914982674207,-73.7918801459775,-73.791890708109,-73.7921625334871,-73.792369898861,-73.792436432938,-73.7930392837637,-73.7931380252795,-73.7932982711146,-73.7935904743795,-73.7936964275786,-73.7937700920561,-73.7938505244937,-73.7938461935845,-73.7937145700042,-73.7938088901346,-73.7939925708458,-73.7941155219756,-73.7941726383858,-73.7941217117788,-73.7942561026918,-73.794397469262,-73.7945456231803,-73.794709514094,-73.7948698386675,-73.7948208254581,-73.7947650750132,-73.7947026317924,-73.7946335455845,-73.7945578714683,-73.7944756697683,-73.7944332478194,-73.7943942479925,-73.7943593155327,-73.794329028389,-73.7943038876521,-73.7942825661197,-73.7942684848494,-73.7942619289942,-73.7942630313056,-73.7942717694463,-73.7942879664436,-73.7942939635339,-73.7943044820343,-73.7943500593428,-73.7944721328225,-73.7945179245012,-73.7945666719895,-73.7946170905673,-73.7946678514748,-73.7947176169308,-73.7947650753878,-73.7948089760966,-73.7948902354297,-73.7955888017295,-73.7968546169358,-73.7970010881026,-73.7971407089785,-73.7972732433886,-73.797398467151,-73.7975161684563,-73.7976261482254,-73.7977282204462,-73.797822212488,-73.7979079653934,-73.7979853341466,-73.7982495022723,-73.7985327412687,-73.7987225560009,-73.7990477683483,-73.7990241939245,-73.7989925339197,-73.7989529244149,-73.7989055356488,-73.7988505712862,-73.7987882675424,-73.7987188921677,-73.7986427432961,-73.7985601481648,-73.7984321621051,-73.7983074626317,-73.7981863287323,-73.7980690314156,-73.797955833104,-73.7978052299075,-73.7981936599685,-73.7993204316006,-73.7994067209257,-73.799486814843,-73.7995604510197,-73.7996273882793,-73.7996874073907,-73.7997403117863,-73.7997859282058,-73.7998241072629,-73.7998547239347,-73.7998776779704,-73.7998833704317,-73.7998965110999,-73.7999161899401,-73.7999426171173,-73.7999737605426,-73.8000106590503,-73.8000531133091,-73.800099127049,-73.8001255447778,-73.8001566949586,-73.8001922202446,-73.8002388864362,-73.8002902679449,-73.800345555,-73.8004038762823,-73.8004643126562,-73.8005889026011,-73.8007094600664,-73.8008254316399,-73.8009362849564,-73.8010415111415,-73.8011406271476,-73.8012331779706,-73.8013187387393,-73.8013969166652,-73.8014673528467,-73.8015297239162,-73.8015837435252,-73.8016291636593,-73.8016657757773,-73.8016934117693,-73.8017119447285,-73.8017212895355,-73.8017214032488,-73.8017122853034,-73.8017217336566,-73.8017383535099,-73.8017620890323,-73.8017928604755,-73.8018305644413,-73.8019706475119,-73.8021184955549,-73.802274026914,-73.8024371556822,-73.8026077917489,-73.8027858408498,-73.8029712046187,-73.8031637806417,-73.8033634625141,-73.8035701398985,-73.8037836985861,-73.8041755793241,-73.8045424727646,-73.8045381811374,-73.8045252671772,-73.804503905247,-73.8044743837895,-73.804437101433,-73.8043925616093,-73.8043413657561,-73.804284205196,-73.8042218518013,-73.8041551475707,-73.8040849932587,-73.8040123362121,-73.8039506693221,-73.8038894256506,-73.8038297578341,-73.8037727888521,-73.8037195908928,-73.8036711651748,-73.8036284231036,-73.8035921691194,-73.8035630855557,-73.8035417197979,-73.8035284739797,-73.8035235974138,-73.8035271818984,-73.8035391599884,-73.8036860341654,-73.803778063095,-73.8038373749065,-73.8038636768573,-73.8038905626781,-73.8039589162871,-73.8040524630202,-73.804137847564,-73.8041735417152,-73.8042014225377,-73.8041785611179,-73.804174850118,-73.8041716787409,-73.8042058572653,-73.804220342829,-73.8043057641598,-73.804397449092,-73.8044981748032,-73.8045662404521,-73.8046429381609,-73.804679688048,-73.8046898389874,-73.8046837176005,-73.8046348742635,-73.8046281963014,-73.8046052776888,-73.8046475642777,-73.8047323428191,-73.8047864302104,-73.8048471818275,-73.8049141182051,-73.8049867110611,-73.8050643874663,-73.8051465343657,-73.8052325034175,-73.8053216161107,-73.8054131691201,-73.8055064398582,-73.805600692179,-73.805695182188,-73.8057891641149,-73.8058818961997,-73.8059487602447,-73.8060108510648,-73.8060672353117,-73.8061170654234,-73.8061595923642,-73.8061941768845,-73.8062202991287,-73.8062375664492,-73.8062457193077,-73.8058204128197,-73.8061305703892,-73.8065562995654,-73.80673711195,-73.8069156738035,-73.8071130435447,-73.8074143248992,-73.8076877135098,-73.8079896967062,-73.8080277656594,-73.808178704471,-73.808303486022,-73.8086673158975,-73.8090025368878,-73.8092447052915,-73.809406281023,-73.8099206907889,-73.8101179018374,-73.8103534741799,-73.8104555657104,-73.8106696297195,-73.8108227009248,-73.8108502279226,-73.8111045714928,-73.8112276766861,-73.8113478651819,-73.8114648217051,-73.8115288380944,-73.8115956524241,-73.8116647025986,-73.811735407711,-73.8118071729308,-73.8120087148275,-73.812025085047,-73.8120415992932,-73.8120578217034,-73.8120733241171,-73.8120876973768,-73.8121005621263,-73.8121115788237,-73.8121204567027,-73.8121269614467,-73.8121372396881,-73.8121487040833,-73.8121611076225,-73.8121741830611,-73.8121876486777,-73.8122012143441,-73.8122100620583,-73.8122192373377,-73.812228527648,-73.8122377177904,-73.8122465948863,-73.8122549533085,-73.8122624998108,-73.8122691834239,-73.8122748535536,-73.8122793824413,-73.8122826680427,-73.8122846363267,-73.8122852429439,-73.81228462393,-73.8122829227726,-73.8122810266711,-73.812282833009,-73.8122882880485,-73.8122972294996,-73.812309391348,-73.8123244117684,-73.8123418438898,-73.8123962856109,-73.8124462152814,-73.8125537326357,-73.8126656384659,-73.8127816457352,-73.8129014568839,-73.8129355792522,-73.8129726868601,-73.813011864048,-73.8130521440866,-73.8130925330319,-73.8131320342526,-73.8131696730234,-73.8131815387918,-73.8131944943081,-73.8132081815751,-73.8132222223756,-73.8132362287234,-73.8132498135843,-73.8132626015708,-73.8132742393152,-73.8132844052337,-73.8132928184132,-73.8132992463732,-73.813360988323,-73.8134276623139,-73.8134991633227,-73.81357537872,-73.8136091891463,-73.8136375844619,-73.8136600364602,-73.8136761274882,-73.8136855582154,-73.8136881532031,-73.8136975075405,-73.8137108593729,-73.8137278052265,-73.8137478330195,-73.8137703375363,-73.8137946387166,-73.8138200022062,-73.8138456615488,-73.8139687718433,-73.8140168157655,-73.8140408968062,-73.8140279180928,-73.8139844799931,-73.8139519087283,-73.813958574208,-73.8140087775453,-73.8140588126282,-73.8141721955232,-73.8142288047771,-73.8142089390406,-73.8141717099469,-73.8141257218665,-73.8143799774744,-73.8144846516426,-73.8145957928,-73.8146656643391,-73.8147530485284,-73.8148229056258,-73.8148862061646,-73.8149320887514,-73.8149583890473,-73.814988574052,-73.8150189720343,-73.8151031538415,-73.8152439525425,-73.8149298412996,-73.8148810257774,-73.815018054792,-73.8152245562199,-73.8151590814641,-73.8150889149056,-73.8151732021925,-73.8157366604115,-73.8166212949545,-73.8168449590812,-73.8169976026643,-73.8164145586361,-73.8157876406608,-73.8143803908254,-73.8145001234624,-73.8148934134285,-73.8152539564126,-73.8154902177778,-73.8155321787834,-73.8153787003307,-73.8156167055334,-73.8158377418283,-73.8161233793286,-73.8162851992739,-73.8165908700741,-73.8172257874502,-73.8177497738369,-73.8181557351667,-73.8183302629129,-73.8188293636467,-73.8186395362808,-73.8181661066203,-73.8177883831226,-73.8173408549066,-73.8171321678563,-73.8171045881923,-73.8172811510872,-73.817734241695,-73.8186093142649,-73.8189266931716,-73.8192726034273,-73.8199972280692,-73.8201289368279,-73.8202492104295,-73.8204793477214,-73.8205348546445,-73.8205889937872,-73.8205951209726,-73.8205960657219,-73.8206183544149,-73.820694942123,-73.8208077095486,-73.8208708766578,-73.8209114124983,-73.8209022295233,-73.8208659297078,-73.8208566715097,-73.8208609921824,-73.8208743291289,-73.8208877120281,-73.8209417890567,-73.820986709738,-73.8210136600409,-73.8210767731067,-73.8211805985341,-73.8212393355369,-73.8212891673429,-73.8213480611455,-73.821411339389,-73.8214837882122,-73.82160540264,-73.8216775414955,-73.8217316003012,-73.8217856047398,-73.8218350215292,-73.8218935210309,-73.8219564130586,-73.8219652846496,-73.8219705250827,-73.8219376633759,-73.8218967951837,-73.821887557189,-73.8218873736461,-73.821896226232,-73.8219366725247,-73.8219725414266,-73.8219976214233,-73.8219718442932,-73.8219578361546,-73.8218669708162,-73.8217627664947,-73.8215819344758,-73.8214419444385,-73.821310924384,-73.8212295267199,-73.8211842073285,-73.8211840046307,-73.8211296303024,-73.8211068052356,-73.8210342768944,-73.8210204682559,-73.8210880325413,-73.8212008061869,-73.8213768960689,-73.8214584159008,-73.8214587010839,-73.821481516464,-73.8215628334963,-73.8217612970964,-73.8218875743182,-73.821945677017,-73.8216359790352,-73.8215614084057,-73.8214983383185,-73.8213720336084,-73.8212591961336,-73.8211507972168,-73.821060325111,-73.8209833822193,-73.8209154947365,-73.8208701473333,-73.8207841879133,-73.8206847978157,-73.8205583070847,-73.8204769706569,-73.8204678422809,-73.8204899982808,-73.8209630412622,-73.8212740721242,-73.8215615796236,-73.8219017632021,-73.8220981283218,-73.8215255067361,-73.8213997539197,-73.8212825101373,-73.8211562680762,-73.8210615377549,-73.8209126710757,-73.8208496664219,-73.8208092100839,-73.8207460842656,-73.8206737190482,-73.8207005968105,-73.8207320716834,-73.8207634832762,-73.8207587938792,-73.8207274986197,-73.8206188620353,-73.8205286463208,-73.8204294845461,-73.8203530320151,-73.8203397219314,-73.8202766994452,-73.8202406546106,-73.8201641742262,-73.8201508651007,-73.8202052404279,-73.8202415252709,-73.8202281790404,-73.8201787209922,-73.8201563429475,-73.8201295018359,-73.8200709463918,-73.8199536780348,-73.8198272899069,-73.8196151723927,-73.8195384612301,-73.8194120908304,-73.8192901979361,-73.8192268769039,-73.8191364206801,-73.8190459909192,-73.8189736717767,-73.8189464404146,-73.8189462911474,-73.8190635702433,-73.8191221625668,-73.8191761949189,-73.8193070687197,-73.8194335795179,-73.8194866343365,-73.8196956727771,-73.8199480323409,-73.8199052704476,-73.8197489255141,-73.8196135737195,-73.8194826893964,-73.8192930158397,-73.8192296957606,-73.8192069319652,-73.8191976723586,-73.8192019147789,-73.8191972438127,-73.8191842773224,-73.8195541714198,-73.8199051939651,-73.8202406138558,-73.8203047240086,-73.8203921729572,-73.8204780529581,-73.8205954538455,-73.8208120701851,-73.8210467514092,-73.8212498006554,-73.821430208013,-73.8215832847989,-73.8216327521403,-73.8216491621716,-73.8213541586184,-73.821284676073,-73.8212261728902,-73.8211812115105,-73.8208879531168,-73.8206983240576,-73.8205355924314,-73.8203638978662,-73.8202734026321,-73.820223408475,-73.8202095437923,-73.8202170542573,-73.819916531585,-73.8198085454582,-73.8197601349025,-73.8197598046825,-73.8198478254212,-73.8199440044945,-73.819975936823,-73.8199597066553,-73.8199594592641,-73.8199753431325,-73.8200393736932,-73.8201596260193,-73.8202638450277,-73.820351901436,-73.8204640131483,-73.8205680689273,-73.8206802646877,-73.8207731605911,-73.8206969055752,-73.8206410787338,-73.8205932936008,-73.8205615736435,-73.8205139359647,-73.8204822005454,-73.8204343494818,-73.8204025485318,-73.8204428188033,-73.8205712412618,-73.82065127163,-73.8206991886792,-73.8208583484955,-73.8208907257989,-73.8209480684618,-73.8210358368736,-73.8211236131053,-73.8211639820306,-73.8211536115873,-73.8211127658279,-73.8210448447496,-73.8209769581023,-73.820974440213,-73.820969980602,-73.8209595614352,-73.820945639615,-73.8209759202981,-73.8210130009026,-73.8210432955499,-73.8210568744567,-73.8209965809566,-73.8208948329476,-73.8208167477716,-73.8207182260944,-73.8206199397437,-73.8204098298042,-73.8202809641484,-73.8202130547455,-73.8202162245982,-73.8202566474496,-73.8203090610513,-73.8203374471862,-73.8202686647429,-73.8201689780259,-73.8200784210019,-73.8200240950467,-73.8200510034735,-73.8201276850546,-73.8201465506315,-73.8202043574191,-73.8202629371549,-73.8202628352733,-73.8201994914825,-73.8201268415707,-73.8201266376503,-73.820135535419,-73.8202121063766,-73.8202435112473,-73.8202433537734,-73.820202448795,-73.8201705264916,-73.8201521831128,-73.8201249413828,-73.8201021762241,-73.8200568782426,-73.819966568983,-73.8198582044236,-73.8197363060031,-73.8196672785267,-73.8196324088344,-73.819569108644,-73.8194921653581,-73.8194649607783,-73.8193475107463,-73.8192707626138,-73.8191578450162,-73.8191170976628,-73.8191214804555,-73.8192026694702,-73.8193019318854,-73.8194327853892,-73.8194943264822,-73.8196040966057,-73.8197348382722,-73.8197888219001,-73.8197795991469,-73.8197386462506,-73.8196887404384,-73.8195848511527,-73.8194581273736,-73.8194086791859,-73.8193228079943,-73.8192594614578,-73.8192638550414,-73.8193766517293,-73.8194470446169,-73.8194850560712,-73.8195798802582,-73.8197062207993,-73.8197285501709,-73.8196922223854,-73.8196017911082,-73.81955647313,-73.8195653335871,-73.8196914883311,-73.8197725954394,-73.8197769243895,-73.8197494948985,-73.8196586540429,-73.8195906249725,-73.8194594158051,-73.8194094334248,-73.8193731239106,-73.8193449746142,-73.8195788913956,-73.819685743294,-73.819791377942,-73.8198327530423,-73.8194079982163,-73.8184170336926,-73.8174263890859,-73.8167077859142,-73.8154787310655,-73.8153646422707,-73.8152834545868,-73.8151831684637,-73.8148566585916,-73.814427621261,-73.8139974836601,-73.8135673473951,-73.8120965924556,-73.8119804368335,-73.8114064522649,-73.8108361190483,-73.8102705322771,-73.8097107918628,-73.8091506811379,-73.808684593605,-73.8083423239039,-73.8079939816159,-73.8076413950187,-73.8072864712257],"lat":[40.8859318138162,40.8859266089178,40.8859375249967,40.8859456596549,40.8859654100595,40.8859967177809,40.8860393678749,40.8860929491813,40.885999956351,40.8854155526692,40.8851211147967,40.8843519698216,40.8838453848377,40.8830682510741,40.8829932163499,40.8836433113335,40.883358737383,40.8828225954071,40.8825175238821,40.8819703267638,40.8805437914875,40.8806910153738,40.8797477972117,40.8770119997786,40.8761904009039,40.8757857929839,40.8751353329532,40.8744014282745,40.8746458931429,40.8741598497163,40.8734846672926,40.8728209518242,40.8727301920951,40.872629219453,40.8725427767602,40.8724445583098,40.8723157298598,40.8721098398584,40.8719889987315,40.8718432172952,40.8717925820773,40.8717181890932,40.8717154078561,40.8715955371755,40.8714940612464,40.871507042628,40.8714084364268,40.8713972633294,40.8714241946963,40.8712857110944,40.8712852769324,40.8712425369779,40.8710678493384,40.870910908421,40.8708607861225,40.8708001693072,40.8708467982303,40.8707788802279,40.8707395189597,40.8707360913754,40.8706253999683,40.8705052786344,40.8704572287992,40.8703750955057,40.8703976976724,40.8702157135356,40.8701586436389,40.870154470944,40.8697007411063,40.8696148730392,40.8695147744942,40.8693861253069,40.8693430946289,40.8692967721757,40.8692145018112,40.8691002279839,40.8690967670722,40.8689323953927,40.8687433297618,40.8688087967934,40.8689118981671,40.8689768747604,40.8688817265772,40.8687979892633,40.8687791000266,40.8688306953703,40.868918492354,40.8690082293424,40.8690274101987,40.8689818526767,40.8688961238115,40.8687398462534,40.8686877174549,40.8687489779335,40.8687912835654,40.8688003620305,40.8687119745764,40.8687315465142,40.8688548819997,40.8689197437785,40.8689588146872,40.8689605896373,40.8689493237843,40.8690062244044,40.8691036882203,40.8691452977221,40.8691475047543,40.8691267378346,40.8690247128597,40.8689649276455,40.8689345923775,40.8689405601841,40.8688949122371,40.8689298028289,40.8689933799031,40.8690548242917,40.8690859518194,40.8691312129108,40.8691721540941,40.8691654253787,40.8691825021821,40.8692733084727,40.8693199319394,40.869408415776,40.8694895525427,40.8695535199055,40.8696101945212,40.8697261232533,40.8698373910619,40.8699186093296,40.8699855407907,40.870152488142,40.8702240162523,40.8702576566543,40.8703388420956,40.8704198372218,40.8704104443721,40.8704915450937,40.8705107738697,40.8705395427349,40.8705253516501,40.8706873546094,40.8706494649766,40.8706640113863,40.8706974816717,40.8707549565685,40.8708696837931,40.8709983514649,40.8710792960551,40.8711317745265,40.8710032844925,40.8710367655489,40.871084676407,40.8711420250691,40.8712230833393,40.8711612416519,40.871171000389,40.8711998312447,40.8713428244384,40.8712428730619,40.8712431330188,40.8712291285634,40.871224601975,40.8711272880478,40.8711718325458,40.8711524709442,40.8711047678667,40.8711189494755,40.8710042649374,40.8709471254936,40.8709518075213,40.870927784024,40.8708373305643,40.8707706510402,40.8707038355544,40.8706325459581,40.870527880877,40.8704327359865,40.870400401506,40.8704478097691,40.8704579296545,40.8704912709508,40.8704821606331,40.8704421495699,40.8704123164237,40.8704636509207,40.8704570933369,40.8704364275101,40.8704504774494,40.8704232329133,40.8703775521735,40.8702824576709,40.8701776202431,40.8701252566549,40.8700944247167,40.8700516854224,40.8699874610336,40.8699137170449,40.8698732357095,40.8698735510686,40.8697941048432,40.8697352149401,40.8696994920352,40.869704595441,40.8696733084024,40.8696377079324,40.8695687139587,40.8695423500227,40.8694923926262,40.8694594350468,40.8694261268966,40.8694358491968,40.8693880626417,40.8693266945249,40.8692751704881,40.8692791364851,40.869246846256,40.8691916131903,40.8691289301623,40.8690869313549,40.8691248893944,40.869216207823,40.8692503830638,40.8692140851776,40.8693149591146,40.8693864893892,40.8694518679836,40.8694898756265,40.8695413218169,40.8695698542204,40.8696345969348,40.8696706944043,40.8697297516498,40.8697353659906,40.8696971733067,40.8697255465966,40.8697101055837,40.8697214039208,40.8696965284424,40.8696983169586,40.8696827083527,40.8697133388446,40.8696827341067,40.8696350116491,40.8696044854662,40.8695452225548,40.8695317413932,40.8695164131312,40.869529646303,40.8695048714246,40.8694609828415,40.8693962405318,40.8693371696651,40.869253296829,40.8691771095018,40.8691027325416,40.8690170072877,40.8689844675313,40.8689408787913,40.8688895713515,40.868859088328,40.8688646463763,40.8688626479997,40.8689081985869,40.868894710007,40.868858411324,40.8688279229449,40.8688032322419,40.8687861494705,40.8687700130784,40.8687338940324,40.8687185489001,40.8687698897992,40.8687335784941,40.8686306526802,40.8686114451198,40.8685977149498,40.8685255261839,40.8684701323102,40.8684243081967,40.8684336395198,40.868433996124,40.8683719320678,40.8683073604655,40.8683489066678,40.8683108637458,40.8683069715894,40.8683468709995,40.8683372526195,40.8682838626444,40.8682093995513,40.8682645865115,40.8683102119284,40.8682967126342,40.8682663791597,40.86827739376,40.8682515431236,40.8683001014605,40.8682333028323,40.8681031800389,40.8679035159984,40.8677925278084,40.8676214011119,40.8674293356069,40.8670334691598,40.866829338779,40.8666550658964,40.8666471164369,40.8666831575356,40.866772401515,40.8668478265093,40.8668503807668,40.8668412353776,40.8669202411956,40.8670015526018,40.8671259158306,40.8671664848001,40.8670903890714,40.8670959540696,40.8671246301256,40.8671023013247,40.8670230184322,40.8670418365688,40.8669782467924,40.866835535768,40.8667568154849,40.8666068108955,40.8665497025692,40.8665316963469,40.8663851625477,40.8663173799938,40.8662101824726,40.8660743533727,40.8659313357373,40.8657490070761,40.8657129795306,40.8656591632747,40.8656255861818,40.8656229124319,40.8657502415837,40.8656720356335,40.8658276473192,40.8658768499148,40.8660183513186,40.8663015004845,40.8664148307465,40.8667824796393,40.866881395064,40.867065403552,40.8677512427452,40.8678997111932,40.8681409384841,40.8683716373267,40.8684794736043,40.8687693291406,40.8688752893456,40.8690168401153,40.8691722897363,40.8693703916795,40.8694410202355,40.8695754431825,40.8697388859398,40.8697803083591,40.8698288811459,40.8699846862034,40.8701305612192,40.8702960189627,40.870447834909,40.8705788107853,40.8707973629893,40.8711525414876,40.8713812156303,40.871522241354,40.8716147502618,40.8716681600785,40.8717654835896,40.8718787131906,40.872256132274,40.8723451774509,40.87239814512,40.8724300464064,40.8724606015923,40.8724811173063,40.8725117087009,40.8725396041441,40.8725367189173,40.8725142551185,40.8726233809984,40.8732004845366,40.8745665945684,40.8761210583034,40.876720732726,40.8770556390665,40.8773823704664,40.8776418435016,40.8785944597896,40.8791468626747,40.8794153565641,40.8795771099961,40.8796575973729,40.879595256484,40.8795901408808,40.8796951044619,40.8799279297627,40.8800515274381,40.8800463540276,40.8800739454643,40.8803783299342,40.8805594020109,40.880721733862,40.8808407804646,40.8810022114383,40.8812612849155,40.881254219786,40.8812424968458,40.8812261928673,40.8812054146237,40.8812619235889,40.8812141234785,40.8810474609838,40.8808091155122,40.8806805274228,40.8805786700919,40.8800802109935,40.879880328184,40.8797710641444,40.8797512653527,40.8795946615149,40.8789981270606,40.8788735731543,40.8789732300554,40.8789942571295,40.8789829029108,40.8790042172665,40.8790317071959,40.8790578836591,40.8788876841383,40.8786196152287,40.8785284004045,40.8785707590914,40.8785275803775,40.8784205316705,40.8782817746779,40.8781447501169,40.8779600005066,40.8777213539285,40.8769143150028,40.8768652644715,40.8763579948478,40.8760609091517,40.876061216506,40.8759303672974,40.875823167396,40.8757000484157,40.8754853020244,40.8753376783379,40.8753789430233,40.875410194398,40.8751386445342,40.8747845274948,40.8744779194407,40.8743537534427,40.8743642311994,40.8743066002668,40.8741816029699,40.8740737401798,40.8739875085039,40.8737886093185,40.8735549754205,40.8731812395339,40.8727604663927,40.8725264847766,40.8723828467722,40.8725942573467,40.8728514016382,40.8731595394729,40.8735556450889,40.8735899627232,40.8735190168666,40.8734250176474,40.8733607683533,40.873297630726,40.8731822437743,40.873177154033,40.8729203566024,40.8727723773797,40.8725440209895,40.8723628191468,40.8723057786215,40.8720240269002,40.8716347448803,40.8720083896811,40.8723404195083,40.872476014261,40.873361226292,40.8737678946372,40.8737939791134,40.8737171624261,40.8735381530717,40.8732560526904,40.8731348966738,40.8731422469029,40.8729962087271,40.8730122782758,40.8728963214357,40.8728269152523,40.8726645385809,40.8724995416601,40.8723541132757,40.8722965436342,40.8721535759228,40.871680678239,40.8714390527097,40.8712551614488,40.8710494269716,40.8709302097454,40.8706989069643,40.8705918698119,40.8705027665919,40.8703598513978,40.8703123548671,40.8703154731726,40.8703037660318,40.8702532992828,40.8701223766712,40.8701195314964,40.8700290735694,40.8699768425871,40.8698370818813,40.8697775696426,40.8697479776462,40.8696843672427,40.8696759478321,40.8696299146419,40.8695140435405,40.869302893206,40.8689578110177,40.8683416522237,40.8683388227954,40.8683374353394,40.8683375310392,40.8683391070541,40.8683421166039,40.868346470357,40.8683520390825,40.8683586574857,40.8683661291147,40.8687247518001,40.8689391104561,40.8692109995947,40.8693188433348,40.8692768993692,40.8692570901871,40.8692718877826,40.869215364986,40.8692587865121,40.8689531797354,40.8689321141158,40.8688182164413,40.868747237035,40.8683907120176,40.86829830538,40.867655991106,40.8672777115748,40.8668615358497,40.8666788572212,40.8664940285855,40.8663072718931,40.8661188114081,40.8659288734386,40.8657376860647,40.8655454788652,40.8653524826414,40.8651589291401,40.8649650507753,40.8647710803489,40.8645772507716,40.8643837947827,40.8641909446711,40.8639989319962,40.8638079873098,40.8636183398795,40.8634302174132,40.863243845786,40.8630594487689,40.8628772477603,40.86269746152,40.862520305907,40.8623459936198,40.8612556322097,40.8610712218611,40.8610436685525,40.8609654175541,40.8609055633176,40.8607933287782,40.8606951860883,40.8606311433836,40.860517304506,40.8603744859755,40.8602781780152,40.8601460900101,40.8600245718673,40.8599671556057,40.8599101426985,40.859878306611,40.8596962600436,40.8594926535577,40.8593176567995,40.8591706397768,40.8590274436636,40.8588882591613,40.8584823154283,40.8580755517606,40.8578937576849,40.8577130861509,40.857533681062,40.8573556853117,40.8571792406696,40.8570044876691,40.8569863214618,40.8569641711275,40.8569384031413,40.8569094438321,40.8568777723279,40.8568401996047,40.8568007094064,40.8567601014666,40.8567191981536,40.8566788278158,40.8566398080067,40.856607534287,40.8565759345281,40.8565270238039,40.8564687308314,40.8564520292561,40.8564411734335,40.8564364494641,40.8564379818461,40.8564457301942,40.8564594903041,40.8564788995338,40.856562024219,40.8565132367667,40.8562643587148,40.8561401699742,40.8560115130052,40.8558786054737,40.8557416722357,40.8556009449563,40.8554566617181,40.8553090666182,40.855158409355,40.8550049448055,40.8548489325946,40.8547959856122,40.8550053331045,40.8549144011726,40.8540515605504,40.8539572676521,40.8538643501083,40.8537732071979,40.8536842305723,40.8535978025729,40.8535142945877,40.853434065456,40.8533574599261,40.8532848071746,40.8532343335521,40.8531793210527,40.8531198927586,40.8530561816311,40.8529883302137,40.8519495980945,40.8505925614067,40.8499127758791,40.8498324206331,40.8497484484675,40.8496611344423,40.8495707645631,40.8494776348441,40.8493820503382,40.8492843241381,40.8491847763501,40.8490837330458,40.848981525194,40.8489108398022,40.848840728886,40.8487739952977,40.8487086197514,40.8486482490509,40.8485897783551,40.8485335235084,40.8482984139,40.8482637373541,40.848231405221,40.8482017883996,40.8481709810139,40.8481448562731,40.8481238258997,40.8481082213292,40.8480982884873,40.8481403038605,40.8481886291547,40.8482430425389,40.848303294235,40.8483691076642,40.8484401807162,40.848516187136,40.8485967780212,40.8486815834235,40.8487702140464,40.8488622630327,40.8489573078311,40.8490549121365,40.8491546278923,40.8492559973473,40.8493585551567,40.8494618305183,40.8495653493338,40.8496686363851,40.8497628146352,40.8498564188436,40.8499491343967,40.8500406496666,40.8501306570585,40.8503826760626,40.8506321245146,40.8508788644982,40.8511227595933,40.8513636749509,40.8516014773683,40.8518360353625,40.8520672192431,40.8522949011837,40.8525189552931,40.8527392576849,40.8533401201892,40.8547393780177,40.8547960016125,40.8548518648754,40.8549062134531,40.8549583134443,40.8550074613099,40.855052993374,40.8550942947856,40.8551308078223,40.8551620394216,40.8551875678396,40.8552070483461,40.8552202178807,40.8552193464372,40.8552248915582,40.8552367488819,40.8552546952473,40.8552783928946,40.8553073958213,40.8553411581762,40.855379044532,40.8554203418443,40.8554642728707,40.8555100107995,40.8555566948099,40.8556034462734,40.8556493852901,40.8561333703575,40.8563014596935,40.8564884565042,40.8566631443152,40.8569002668312,40.8571746292792,40.8575050516894,40.8578417603757,40.8581412751491,40.8584845381594,40.8586782218215,40.8587556910034,40.8588218686689,40.8589590489326,40.8589779829079,40.8590896320368,40.8592202599128,40.859438253348,40.8596813969656,40.8599682015712,40.8603801003661,40.8605860934545,40.8608109057229,40.8610034201532,40.8610297415354,40.8612171814953,40.8613418309678,40.8614796401182,40.8615384733615,40.861593429976,40.8616440762175,40.8616900123606,40.8617308758536,40.8617663441801,40.8617961374046,40.8618200203826,40.861837804616,40.8618493497414,40.8618545646381,40.8618534081471,40.861845889396,40.8618320677272,40.8618055728773,40.8617730649992,40.8617350327549,40.8616920478479,40.8616447564297,40.8615938693859,40.8615401516499,40.8614844107043,40.8614274844425,40.860034611968,40.8598810006453,40.8598179261001,40.8598988751247,40.8600063883289,40.8601210815984,40.8601144376614,40.8599862355848,40.8597365695814,40.8595936798799,40.859486716178,40.859704103296,40.8600442218489,40.8603251917453,40.8604186434966,40.8605479522213,40.8611015472038,40.8613487290418,40.8617000857559,40.861918128703,40.8620218364585,40.8620689917645,40.8623319939721,40.8624644687308,40.8625053244625,40.8625509118437,40.862601111293,40.8626265258745,40.8626473805073,40.8626634997447,40.8626747479784,40.8626810305787,40.8626717999036,40.8626701117281,40.8626704582393,40.8626728302916,40.8626771652792,40.862683348788,40.8626912176157,40.8627005640792,40.8627111414956,40.8627226706932,40.8627293964923,40.862734907534,40.8627390850781,40.862741839116,40.8627431103095,40.8627428712698,40.8627407198917,40.8627396127912,40.8627395756132,40.8627406092188,40.8627426896657,40.862745768763,40.8627497141465,40.8627544726527,40.8627599370639,40.862765984257,40.8627724779776,40.8627792719105,40.8627862129756,40.8627923971568,40.8627984632064,40.8628146958883,40.8628309344694,40.862846695837,40.8628615110756,40.8628749394178,40.8628865813572,40.8628960905345,40.8629230191711,40.8629545878819,40.8630224588358,40.8630861100185,40.8631453781589,40.8632001112283,40.8632166244647,40.8632288771913,40.8632365670617,40.8632395043222,40.8632376164932,40.8632309501586,40.8632196698157,40.8632139242454,40.8632097503469,40.8632072634566,40.8632065322942,40.8632075770637,40.8632103688952,40.8632148306427,40.8632208390157,40.8632282279861,40.8632367933761,40.8632462984998,40.8633415808881,40.8634349280751,40.8635261929942,40.8636152318585,40.8636436902275,40.8636753766088,40.8637097015849,40.8637460266554,40.8637836761137,40.8638219496165,40.8638400935532,40.8638567335004,40.8638713666185,40.8638835507118,40.8638929175907,40.8638991841988,40.8639021611662,40.8639017585323,40.8638522213954,40.8638438479597,40.8638603950325,40.8639052017046,40.8639948456642,40.8640645651422,40.8641027042172,40.8640860336494,40.8640113073839,40.8639315006319,40.8638633985356,40.8637937657641,40.8637639714105,40.8637275563138,40.8632543983459,40.8631862157914,40.8630881658962,40.8630731207966,40.8630696568589,40.8630496348548,40.8630296244026,40.8630295470668,40.8630577015233,40.8630904722802,40.8631225253649,40.8630574653678,40.8632380618776,40.8636761023,40.8639196581483,40.8641746594005,40.8644440249751,40.8648299747341,40.8652435735122,40.8656012077668,40.8649382042966,40.864178253844,40.8643067933021,40.8644590311431,40.865151497606,40.8657580614387,40.8679449202575,40.8681690200683,40.8681162886069,40.8681908306235,40.8690136078319,40.8692380322741,40.8696093299175,40.8699331668282,40.8703888529314,40.8701586964823,40.8696716847837,40.8693919909323,40.8690092737918,40.869009351052,40.8692970142679,40.8698790058607,40.869484735938,40.868831407546,40.8684382174912,40.8682841467267,40.8683447520242,40.8680406775116,40.8677633442414,40.8673219849901,40.8679259035013,40.8685221816429,40.8690424100958,40.8691854292133,40.8689909804737,40.8691130434261,40.869272314754,40.8693287346624,40.869362895394,40.8694026376885,40.8695039151688,40.8695195344922,40.8696223521744,40.8696738629723,40.8696980207642,40.8697049707044,40.8697358692846,40.8697940986643,40.8698659901865,40.8699516285862,40.8700235843315,40.8700989794188,40.8701572438202,40.8701881634042,40.870267032827,40.8703150410455,40.8703425475583,40.8703358566298,40.8703119643452,40.8702435190159,40.870161383962,40.8701272209044,40.8701189045789,40.8701309464268,40.8701584670675,40.8701962386213,40.8702545656636,40.8703402947359,40.8704054805318,40.8705152129658,40.8705734714483,40.8706619027906,40.8707755693328,40.8708680108848,40.8709467975159,40.8710153197369,40.8710804288825,40.8711455879546,40.8712347218955,40.8713128945592,40.8714951055809,40.8716698153057,40.8718923723048,40.8720395347704,40.8721488906749,40.8721760832805,40.8722238451973,40.8722819632358,40.8723504150064,40.8724257890439,40.872504505644,40.8726004018771,40.8727167766223,40.8728161128329,40.8728676093388,40.8728917672363,40.8728680568229,40.8727653995038,40.8726591904556,40.8725667206577,40.8725394372957,40.8725877092224,40.8726255917027,40.8726822336533,40.8731234751391,40.8730704826966,40.8730258452851,40.8729982407204,40.8729980660033,40.8730253071811,40.8731005412724,40.873179222798,40.8732476394419,40.8733263704203,40.8734016107943,40.8734357178889,40.8734766341206,40.8735107686046,40.8735484424099,40.8736182723589,40.87402886703,40.8741800978084,40.874156294929,40.8737270073053,40.874774245106,40.8744922187227,40.8744406763425,40.874399381489,40.8743477941932,40.8743270912607,40.8742960247002,40.874227404946,40.874165672702,40.8741415913919,40.8741962972055,40.8742717132958,40.8743163020558,40.8743848728088,40.8744499609696,40.8744824634302,40.8744531705639,40.8744324725364,40.8743809265567,40.8742780246239,40.8741923511971,40.8741305836315,40.8741065437138,40.8740139199853,40.8739282465336,40.8738495304129,40.8737844909842,40.8737125217068,40.8736325843811,40.8735719399875,40.8734828184168,40.873438188437,40.8734071698935,40.8734103996552,40.8734032159197,40.8733962429502,40.8733926199197,40.8734027074876,40.8734505735289,40.8735189542729,40.8735770561045,40.8736146301864,40.8736694045422,40.873724223059,40.8737518156211,40.8737827419412,40.8738307918303,40.8738378498589,40.8737900819958,40.8737217490685,40.873677430623,40.873825146791,40.8740327659749,40.8740132721355,40.8739925045559,40.8739888733763,40.874026264024,40.8740741300639,40.8741460422178,40.8742316804202,40.8743310451728,40.8743892814406,40.8744788102496,40.8742596475247,40.8742222570761,40.8746445681211,40.8748900604354,40.8748262632379,40.8747818570075,40.87476490934,40.8747789507812,40.8747895926432,40.8748138906004,40.8748655616139,40.8750096951489,40.8750782935681,40.8751450770311,40.8753205624844,40.8752730435382,40.8752078558158,40.875142690722,40.8750942712462,40.8751145323568,40.8752033586147,40.8752681869193,40.8753502733659,40.8754769615209,40.8755968535819,40.8757175039796,40.8760891543194,40.8761632490526,40.8762606272908,40.8763824434809,40.8764739442829,40.8765167304951,40.8765776889965,40.8766446633311,40.8767360251329,40.8767969590969,40.8768579676436,40.8769007912084,40.8769374987093,40.8770168163964,40.8771022625756,40.8771998792283,40.8772548701486,40.8772383102338,40.8770356255022,40.8769076309278,40.8767735583585,40.8766334181018,40.876444527503,40.8763104793334,40.8762007701225,40.876091084863,40.8760363293031,40.8760243481086,40.8761036526003,40.8761889992882,40.8762842102297,40.8763432133391,40.8764203898758,40.8765130305437,40.8766031015197,40.8766982387465,40.8767778803634,40.8768600432062,40.8769395950872,40.8770062989727,40.877034110919,40.8770833756946,40.8771810026485,40.8773223087981,40.8773917350813,40.8774508925245,40.8775151785348,40.877566583074,40.8775766153299,40.8776458367722,40.8777279411969,40.8778562674158,40.8778972280087,40.8779765584109,40.8780585839404,40.8781329967369,40.8782126581709,40.8782872397002,40.8783728179983,40.8793989398313,40.8794774018219,40.8796177173474,40.8797203600582,40.8797785188811,40.8798436562209,40.8798643324925,40.8798702623853,40.8798884345421,40.8799262132465,40.8799638998775,40.880018619898,40.8801761065407,40.880251480469,40.8802994606635,40.8803612495017,40.8804332461496,40.8804914899266,40.8805942090375,40.8807140733535,40.8808202546101,40.8808784556719,40.8809503685833,40.8810085419844,40.8810186795125,40.8810287876173,40.8810354496452,40.8810535528875,40.8810626964095,40.8811002854224,40.8811755388404,40.8812200360964,40.8812506867433,40.8812539931001,40.8812777987986,40.8813222742488,40.881370246264,40.8813943560487,40.8814116422214,40.8814324042501,40.8814805464064,40.8815148982233,40.8815767725229,40.881645379202,40.8817173131852,40.8818371627549,40.8819295902437,40.8819534099604,40.8819852500399,40.8819976737357,40.8820352261169,40.8820899450981,40.8821344912757,40.8821552239129,40.8821397606293,40.8821314114457,40.8821212808493,40.8821420355082,40.8822311483099,40.8823098922932,40.882364569646,40.8824295941551,40.8824912780185,40.8825805530889,40.8826354979275,40.8827040270491,40.8828307495686,40.8830361742374,40.8831525549056,40.8832619860428,40.8833818206694,40.8834537127159,40.8835628208178,40.8841495338816,40.8848592758615,40.8856040216303,40.8856692545738,40.8857795888202,40.8860369947318,40.8862943058646,40.8864809505426,40.886687446138,40.8867012210169,40.8867110242098,40.8867196609628,40.8867482325351,40.8867719646752,40.886782132484,40.8867787092492,40.8867150106628,40.886704339445,40.8866355878137,40.8865511521453,40.8864512425234,40.8863360754263,40.8862144769812,40.8861132918981,40.8860443136392,40.8859908313415,40.885953252398,40.8859318138162]}]],[[{"lng":[-73.8705373858619,-73.8705349472268,-73.8705332008308,-73.8705289732455,-73.8705262166591,-73.8705162978047,-73.8705147333307,-73.8705105705784,-73.8704995802517,-73.8704978339237,-73.8704918698942,-73.8704550899089,-73.8704212750105,-73.8704054090955,-73.8703974597621,-73.8703974292502,-73.8704053172813,-73.8704211215406,-73.8704448372036,-73.8705793765648,-73.8708840924882,-73.870978451588,-73.871032688736,-73.8710826251279,-73.871075981354,-73.871075946214,-73.8710758042858,-73.8710496749069,-73.8710494493611,-73.8710490592804,-73.8710027274176,-73.8710022767302,-73.8710017310579,-73.8709446220235,-73.8709441363487,-73.8709436611869,-73.8708901115479,-73.8708898383245,-73.8708896254351,-73.8708775412073,-73.8708488737839,-73.869548681047,-73.8688962278839,-73.8687254040077,-73.8686027851912,-73.8684993643155,-73.868393769371,-73.8682890763312,-73.8681883055873,-73.8684153962974,-73.8687675298734,-73.8688785903134,-73.8690762464051,-73.8692739124451,-73.8693912567731,-73.8698884222067,-73.8699037951237,-73.8699042156866,-73.8698893954676,-73.8698596035482,-73.8698157618704,-73.8693767539613,-73.8691666873424,-73.8687226323057,-73.8686369587995,-73.8682346608126,-73.8683745379487,-73.8692094456987,-73.8695236295179,-73.8695625908049,-73.8688924327461,-73.8694120846032,-73.8709625407474,-73.8717903848607,-73.8718461029101,-73.8719023725062,-73.873056329373,-73.8740146905165,-73.8742738632541,-73.8745917543696,-73.8760844866913,-73.8767987212558,-73.8768045292585,-73.8768758605487,-73.876978028221,-73.8779813134473,-73.8772445605829,-73.8771605358724,-73.87729884832,-73.8774527610744,-73.8789334114153,-73.8805558967974,-73.8826002220831,-73.8827383578705,-73.8825688771652,-73.882436695103,-73.8820355312086,-73.8818556767412,-73.8805922515002,-73.8806289285238,-73.8806485810509,-73.8806668466648,-73.8807157751575,-73.8806908860829,-73.8807664263229,-73.8807933004684,-73.8808112834161,-73.8808248274317,-73.8808338762021,-73.8808163119302,-73.8808081789906,-73.8807235341719,-73.8803543879808,-73.880562139514,-73.8811936679622,-73.881491065687,-73.8818656867116,-73.8821935638197,-73.8837131635657,-73.8838043043127,-73.883835149305,-73.8837836605134,-73.8837573289644,-73.8837128967282,-73.8836142989056,-73.8835152021354,-73.8834306953468,-73.8826279138773,-73.8826871439014,-73.8827365885678,-73.8826762473331,-73.8827179466861,-73.882975370899,-73.8830938243834,-73.881338555091,-73.8799138038693,-73.8798120630492,-73.8777275301841,-73.8769435202508,-73.8761925755019,-73.875188501627,-73.8738643255213,-73.87325775324,-73.8729365034524,-73.8728288453104,-73.8727260480977,-73.8721053948861,-73.8720324185373,-73.8719739703499,-73.8714516766864,-73.8705619252466,-73.8705373858619],"lat":[40.8696740314123,40.8695817025373,40.8695155802357,40.8693555333497,40.8692511767946,40.8688756652312,40.8688164328463,40.8686588353671,40.8682427761091,40.8681766549638,40.8679508309931,40.8666328687624,40.8653610804321,40.8650126777974,40.8646641192375,40.8643155084168,40.8639669493373,40.8636185453352,40.8632704000244,40.8614045539279,40.858895181263,40.8581994146533,40.8578077973948,40.8573770401352,40.8573416611482,40.8573414634313,40.85734126459,40.8573051530233,40.8573048376597,40.857304603361,40.8572771127395,40.8572768426904,40.8572767427389,40.857266080502,40.8572659893286,40.8572660519534,40.8572727819314,40.8572728178106,40.8572729164112,40.8572782242686,40.857290817248,40.8577260296799,40.8577727729451,40.8579534337859,40.8580831005448,40.8580948420303,40.8580955587413,40.8580850653844,40.8580638343109,40.857780358143,40.8573407804222,40.857202138337,40.8569455606196,40.8566889825649,40.8565518951769,40.8559710676522,40.8558730216152,40.8557732926938,40.8556738616951,40.8555767281417,40.8554837748537,40.8542657231123,40.8536860460276,40.852423852418,40.8520663552566,40.8509137372163,40.8506733360092,40.8492383728725,40.8486869770853,40.8480187132393,40.8481123221258,40.8472454909397,40.8443336600023,40.8438028143358,40.8437607778558,40.8437208520911,40.8432429321613,40.8425376773162,40.8421389483042,40.8415206475394,40.8420647699207,40.8422997872775,40.842376709033,40.8424026366364,40.8424397705924,40.8428044160759,40.8440094946265,40.8440851998036,40.8441226899081,40.8441644089741,40.8452146566745,40.8463202953062,40.847708461682,40.8478890886555,40.848542763224,40.8503437699291,40.8516434322482,40.8522260962678,40.856739973288,40.8569680516326,40.8570470453411,40.8571256774353,40.8573874020777,40.8576222333998,40.8578059491075,40.8578861738329,40.8579508834032,40.8580901230474,40.858183125617,40.8583215854647,40.8583857190752,40.8588275024044,40.8605693625072,40.8611972295258,40.8616838308439,40.8618785164318,40.8621237619579,40.8624566127224,40.8642919844725,40.864497099854,40.8647585975429,40.864988243559,40.8650625061805,40.8651499981173,40.8652948506201,40.865399532326,40.8654695142063,40.8658587386503,40.8660041558514,40.8660485736041,40.8660891414811,40.8661329657048,40.8664497320037,40.8666021850244,40.8675900882594,40.8683612516643,40.8684166479714,40.8695553386596,40.8699546815721,40.8704769567011,40.8715757563096,40.8715478120277,40.8715319988152,40.8715254458446,40.8715233384195,40.8715213252099,40.8715091683756,40.8715081411355,40.8715082470116,40.8715091853078,40.8715107784538,40.8696740314123]}]],[[{"lng":[-73.9939369418221,-73.9936963935409,-73.9936282272451,-73.9934904641407,-73.993410453874,-73.9933251984328,-73.993203471167,-73.9917579375628,-73.9904532545266,-73.987615120763,-73.9849858236627,-73.9847636926324,-73.9843149130714,-73.9832066141372,-73.9822161951483,-73.9820927124339,-73.9820703645754,-73.9820434160202,-73.9819945280543,-73.9819272175715,-73.9818595171329,-73.9817923254865,-73.9817265346255,-73.981679436394,-73.9816314948657,-73.9815872266128,-73.9815472180972,-73.9815120000456,-73.9814820383939,-73.9814577300632,-73.9814425438969,-73.9814328351072,-73.9814287062246,-73.9814302008462,-73.9814373030395,-73.9814499379241,-73.981467972046,-73.9814912149279,-73.9815281846638,-73.9815712096455,-73.9816196288633,-73.9816726983235,-73.9817296028408,-73.981789468181,-73.9818437441389,-73.9818986635917,-73.9819535150924,-73.9820075877987,-73.9820601816504,-73.9821106153311,-73.9823654503953,-73.982877134552,-73.983131667412,-73.9833665790018,-73.9838218570337,-73.9842823014675,-73.984733937796,-73.9851915222547,-73.9856467779071,-73.9861040615106,-73.9865613853334,-73.9870151455532,-73.9874752469956,-73.9879264069384,-73.9883904457516,-73.9888425380256,-73.9892972754388,-73.989790854016,-73.9902762141258,-73.9907263633971,-73.9911773809228,-73.9916327131064,-73.9920790001106,-73.9925285599189,-73.9929793784412,-73.9934641773624,-73.9939482565986,-73.9943794679031,-73.9948436383084,-73.9952982146095,-73.9957485550705,-73.9961965546697,-73.996647044391,-73.9970990285431,-73.9950143313275,-73.9942625862863,-73.9914185849462,-73.9918710243355,-73.9920664716518,-73.992321823447,-73.9928034094901,-73.9932897332994,-73.9937335385751,-73.9939707175459,-73.9941607833721,-73.9945926491055,-73.9950179854245,-73.9954472576705,-73.9958740945895,-73.9963423696591,-73.9968399386042,-73.9996842297327,-74.0025238141675,-74.0031073388422,-74.0051255345225,-74.0053622202936,-74.0054421484491,-74.006970777244,-74.0077911613479,-74.0082040187844,-74.0086990229636,-74.0087908052275,-74.0088933979832,-74.0090243918132,-74.0091660821697,-74.0090915684619,-74.0092401357502,-74.0092407416011,-74.0096201534891,-74.0095684341177,-74.009584643457,-74.0121194002866,-74.0121372693618,-74.0121481318359,-74.0120900828903,-74.0120690348667,-74.012020850064,-74.0119776334287,-74.0095120176737,-74.0094886836423,-74.0094380087086,-74.0093942693211,-74.0090420750423,-74.0089003296284,-74.0088028352389,-74.0087278005887,-74.0087298635942,-74.0089397584428,-74.0095744061291,-74.0096122792441,-74.0095583292975,-74.0099166081346,-74.009934366777,-74.0099379618493,-74.0099434181672,-74.0099504876915,-74.0099585260134,-74.0099675995942,-74.0099735068339,-74.0099813573934,-74.0099891727314,-74.0099982260171,-74.0099868578482,-74.0098694847473,-74.0098721108548,-74.0101679053539,-74.0101646519737,-74.0100537565622,-74.0100384838461,-74.0100236125255,-74.0100140432371,-74.0100081403346,-74.0099993017061,-74.0099925052406,-74.0099832013266,-74.0099774363877,-74.0099739502192,-74.0099909538,-74.0104692001187,-74.0104883559496,-74.0104918741747,-74.010496934412,-74.0105033278119,-74.0105117165533,-74.0105208343633,-74.0105268166528,-74.0105296845585,-74.0105504475589,-74.0105318816876,-74.0104170066026,-74.0104193720939,-74.0107641978069,-74.0107615604614,-74.0106062154019,-74.0105857920093,-74.0105680109191,-74.0105637084973,-74.0105505692883,-74.0105397820533,-74.0105337353474,-74.010531065377,-74.0105452039216,-74.0111035980488,-74.0111162416329,-74.0111246622997,-74.0111301002903,-74.0111388700692,-74.0111454579553,-74.0111562731594,-74.0111611341844,-74.0111718311983,-74.0111532870984,-74.0110428174823,-74.0110445915083,-74.0113876997418,-74.0113856784533,-74.0112303805723,-74.0112108529406,-74.0112059244744,-74.0111881687194,-74.0111810296499,-74.0111667508279,-74.0111541917691,-74.0111670997612,-74.0117395855281,-74.0117952764573,-74.0117827350079,-74.0116690085347,-74.011670675838,-74.0118364287242,-74.0117745878639,-74.0117702576505,-74.0117663544953,-74.0117827582809,-74.0117189753091,-74.0117112349654,-74.011678855056,-74.0116345125173,-74.0105552490224,-74.0105513347573,-74.0101282138865,-74.0101282116208,-74.0099466846228,-74.0099480791384,-74.0094638985597,-74.0094523667658,-74.0094416512616,-74.0094356221182,-74.0094244364691,-74.0094190072741,-74.009407456683,-74.009401558017,-74.0093906773477,-74.0093852364561,-74.0093804226021,-74.0093763759856,-74.0093636273423,-74.0115338276476,-74.011567829226,-74.0115912343402,-74.0115884687917,-74.011533072467,-74.0115118301826,-74.0114837308755,-74.0114449125047,-74.0092431465868,-74.0091373625993,-74.0095604796237,-74.0095610347623,-74.0095676530036,-74.0095682662656,-74.0095503986724,-74.0095515541536,-74.0099638499687,-74.0099583844546,-74.0099066997004,-74.0099015891296,-74.0113567533773,-74.0113947762349,-74.0114067393552,-74.0113469315847,-74.0113317444169,-74.0113035299375,-74.0112661125396,-74.0090584790134,-74.0089460650232,-74.0089791840597,-74.0089791823762,-74.0090710092756,-74.0090739077035,-74.0094151163657,-74.0094160767253,-74.0095233674152,-74.0095188236012,-74.0111668756154,-74.0111947275115,-74.0112156181342,-74.0112156213041,-74.0111491428189,-74.0111328994299,-74.0111089118299,-74.0110779705922,-74.0099481793803,-74.0095600497867,-74.0095424804558,-74.0095180868652,-74.0094700192251,-74.0094755960083,-74.0092534091792,-74.0091045321573,-74.0106773753261,-74.0105646347644,-74.0090009825945,-74.0087061865058,-74.0087313782998,-74.0086672907182,-74.0086208983944,-74.0085325692502,-74.0087600499351,-74.0091408212,-74.0091266112324,-74.0087456771504,-74.0086511593681,-74.0086431823763,-74.0089691252792,-74.008957422948,-74.0090389596997,-74.0090490979625,-74.0091075797516,-74.0091059682001,-74.0090577400966,-74.0089973491165,-74.0090076280833,-74.0089288765048,-74.0089147242261,-74.0086722376839,-74.008590531017,-74.0085809576047,-74.00866456562,-74.0093408924528,-74.0093279520623,-74.008478955728,-74.0084263644723,-74.0088177981943,-74.0088027370308,-74.0088394166214,-74.0088517356531,-74.0098656696152,-74.0098462792262,-74.0098892261996,-74.009906315196,-74.0099905581975,-74.0099201063179,-74.0099705879702,-74.0099191627549,-74.0097891311643,-74.0098877486832,-74.009838546744,-74.0098305691398,-74.0088299450539,-74.00883632715,-74.0087921009085,-74.0086879221957,-74.0083535283884,-74.0080115224053,-74.0079024561303,-74.0077387246899,-74.0076194961185,-74.0077440483021,-74.0075961898915,-74.0074715799092,-74.0072939465031,-74.0072849994432,-74.0074136203691,-74.0072718117477,-74.0071446836097,-74.0069591741668,-74.0068063576368,-74.0067029184064,-74.0065776765852,-74.0062054892597,-74.0061042218159,-74.0059669102922,-74.0059238384743,-74.0058093816825,-74.0054188584101,-74.0052118770577,-74.0048039256018,-74.0049677707866,-74.0052789479789,-74.0050310513664,-74.0069642874931,-74.0069937526847,-74.0070103830496,-74.0070035890402,-74.0065295998784,-74.0065068764018,-74.0064758837196,-74.0064435290131,-74.0063151593525,-74.0045048309391,-74.0042062912539,-74.0039074203277,-74.0038065783501,-74.0040798895684,-74.0042469712806,-74.0042024743225,-74.0041486381469,-74.0042448758826,-74.0042596785672,-74.0043188942508,-74.0042686965067,-74.0042105934565,-74.00422266067,-74.004131716228,-74.0041116200779,-74.0036689145354,-74.0035725104008,-74.0039285493356,-74.003825595952,-74.003588009112,-74.0033848822989,-74.003133389914,-74.0027869155261,-74.0023352813006,-74.0045452098343,-74.0045581436139,-74.0045564156092,-74.0044495152728,-74.0044270965925,-74.0043997620352,-74.0022008207327,-74.0017882402231,-74.0015330906698,-74.0037573503769,-74.0036121479418,-74.001386036986,-74.0009730802202,-74.0031497698899,-74.0029480951572,-74.0030616123407,-74.0031345833622,-74.0031619457704,-74.0032227558536,-74.0031558705818,-74.003146529668,-74.0031360601927,-74.0031247515453,-74.0031129163109,-74.0031008816301,-74.0030889801569,-74.0010636422051,-74.0007310525373,-73.9999271236773,-73.9996385355537,-73.9996226345819,-73.9995176709682,-73.9994464221732,-73.9994333072462,-73.9991509808791,-74.0022743664237,-74.0022880237148,-74.0020571383156,-74.0020245433033,-73.9991999724674,-73.9991083256455,-73.9988847317499,-73.9985763853054,-73.9985997870763,-73.9986348787634,-73.9986653047344,-73.9986863747722,-73.998695730373,-73.9986887069456,-73.9986676471138,-73.9986337155607,-73.9985892410515,-73.9984827646868,-73.9984383037147,-73.9984020251825,-73.9983582973387,-73.9982911984643,-73.9982709030835,-73.9982816070953,-74.001542178712,-74.0015733538527,-74.0015618057548,-74.001394371595,-74.0013643461298,-74.00131469636,-74.0012939101499,-73.9981567843898,-73.9981481864737,-73.9980667590535,-73.997721348257,-73.9973780844797,-74.000628373953,-74.000650167862,-74.0006495053042,-74.0004548933672,-74.0004176539319,-74.0003858648908,-73.9971558894921,-73.996815984635,-73.9964571540504,-73.999728191901,-73.9997359024785,-73.9995551893079,-73.9995155216161,-73.9994725373402,-73.9970717603931,-73.9970262882107,-73.9971503547715,-73.9970107141383,-73.9968931131237,-73.9965712643958,-73.999026828329,-73.9987620691432,-73.9963132702209,-73.9958800435168,-73.996016931962,-73.9959007742503,-73.9957673328362,-73.995424744363,-73.995756482129,-73.9957085906995,-73.9957977402045,-73.9958168757904,-73.9959128360384,-73.9959280367067,-73.9960017574905,-73.9958999010094,-73.9958926089489,-73.9958543725281,-73.9957911774878,-73.9958280588624,-73.9957299331441,-73.9957512341283,-73.9956298224031,-73.9956230690437,-73.9953056636536,-73.9951239555689,-73.9949901448208,-73.994957333537,-73.9949350165901,-73.9949238579442,-73.9949258212064,-73.9950091543872,-73.994978307712,-73.9949768849473,-73.9970732816931,-73.9968729144914,-73.9947740793082,-73.9944450129338,-73.9954551499559,-73.9962297200194,-73.9961208799467,-73.9943419199162,-73.9942497922865,-73.9941632845631,-73.9938310820309,-73.9938875450246,-73.993891252437,-73.9939625855146,-73.9940126248051,-73.9941220580824,-73.9941366525886,-73.9943013423911,-73.9942815351345,-73.994376552751,-73.9943186346871,-73.9942940298238,-73.9950232758607,-73.9950710879696,-73.9950893918929,-73.9950139637168,-73.9950502846992,-73.9962406518988,-73.996195837471,-73.9961084688084,-73.99610778143,-73.9960631680818,-73.9961269777373,-73.9961285048278,-73.9961263614022,-73.9960988073697,-73.9961183510278,-73.9961794599738,-73.9960952452262,-73.9960512527533,-73.9955722651611,-73.9939369418221],"lat":[40.7731795109669,40.7730348322204,40.772993650359,40.7729289052621,40.7728788953456,40.7728314795376,40.7727798103924,40.7721661445151,40.7716122483408,40.7704154431329,40.7693207012287,40.7692264007039,40.7698481832134,40.7693793797666,40.7689604232602,40.7688922989298,40.768531121716,40.7684082108152,40.7684160487471,40.7684215792369,40.7684211865087,40.7684148757762,40.7684027308167,40.7683901309362,40.7683679283408,40.7683416844789,40.7683117470297,40.7682785120951,40.7682424205412,40.7682039505063,40.7681639696596,40.7681230149501,40.7680815189263,40.768039919853,40.7679986570501,40.7679581663392,40.7679188753653,40.767881199101,40.7678422397838,40.7678070569482,40.7677761911146,40.7677501163631,40.7677292333884,40.7677138630184,40.7677072053479,40.76770527993,40.7677081117074,40.7677156630808,40.7677278370948,40.7677444760438,40.7673921532134,40.7667155951407,40.7663669830552,40.7660452418662,40.7654184746975,40.7647918145993,40.7641691048775,40.7635436746478,40.762914874483,40.7622899526043,40.7616601223625,40.7610373674779,40.760404786886,40.7597902771578,40.7591641861778,40.7585334990581,40.7579066376497,40.7572331319189,40.7565675650496,40.7559504055648,40.7553298485813,40.7547068050096,40.7540911158654,40.7534739128927,40.7528534028991,40.7521900552677,40.7515222216601,40.7509303898028,40.7502933089629,40.7496716826001,40.749052196221,40.7484393277447,40.7478227290828,40.7472051020423,40.7463223271801,40.7460039813579,40.7448026824962,40.7441855709463,40.7439162027063,40.7435680934219,40.7429100202034,40.7422342815498,40.7416222018193,40.7412984387316,40.7410288222935,40.7404419809084,40.73986001125,40.7392683845799,40.7386859456654,40.7380452320566,40.7373608893982,40.7385524738161,40.7397526436422,40.739997520559,40.7408502130684,40.740949503518,40.7409821402617,40.7416271271582,40.7419708442441,40.7421475187909,40.7423617239634,40.7423751437236,40.7423841671893,40.7423997433102,40.7424165914635,40.7428861490724,40.74289951841,40.7429131608634,40.7429512483898,40.7432577847264,40.7432635204831,40.7435166121826,40.7435319270593,40.7435593015476,40.7438976376489,40.7439224935484,40.7439397702089,40.743935560421,40.7436760937603,40.7436956816821,40.7439712554731,40.7439687168382,40.7439338712551,40.743917927096,40.7444393476242,40.74485823291,40.7448815378297,40.7449092173325,40.7449929086628,40.7449979031506,40.7452888252987,40.7453272550071,40.7453170781019,40.7452967014105,40.7452657697364,40.7452256903209,40.7451801196466,40.7451286811085,40.7450951941158,40.7450506823885,40.7450063842595,40.7449550593021,40.7449441642152,40.7449339177072,40.7449165021258,40.7449423297096,40.7449639246298,40.7449542349299,40.7449634580782,40.745046345318,40.7450996766156,40.7451325767656,40.7451818397911,40.7452197190643,40.7452715730887,40.745303703609,40.7453231351093,40.7453366861714,40.745386766029,40.7453757150947,40.7453551670138,40.7453256154308,40.7452882709089,40.7452392752584,40.7451860213588,40.7451510807061,40.7451343325126,40.7450130572075,40.7450029823718,40.7449935827034,40.7449768241711,40.7450050320208,40.7450237261835,40.7450110164743,40.7450204465616,40.7451379328264,40.7451663622532,40.7452531820779,40.7453244554194,40.745364407457,40.7453820503895,40.7453921350116,40.745447670244,40.7454361246255,40.7453777622025,40.7453432283256,40.7452875486319,40.7452457207186,40.7451770471562,40.745146176461,40.7450782582834,40.7450686430703,40.7450609634236,40.7450462124021,40.7450731126826,40.7450880081415,40.7450758306627,40.7451708041852,40.7451947706308,40.7452811260917,40.7453158494414,40.7453852979819,40.745446378084,40.74546035254,40.7455199181902,40.745154666985,40.7451349561284,40.7451273311914,40.7451139773398,40.7451259636788,40.7455248464214,40.7455527840376,40.7455779800435,40.7456015722554,40.7459398449978,40.7459612591517,40.745979461816,40.7459783948062,40.7458711044229,40.7459028839997,40.745857238929,40.7458423354631,40.7458195144457,40.745800170912,40.7457501436595,40.7458174733884,40.7458800352528,40.7459152427185,40.7459805483631,40.7460122472772,40.7460796956091,40.7461141366291,40.7461776559118,40.7462094268606,40.7462375368081,40.7462611638593,40.7463356019773,40.7465677547123,40.746579452169,40.746601505476,40.7466280744022,40.746966826948,40.7469846036005,40.7469905887653,40.7469862850285,40.7467627907537,40.747359762803,40.7474027996046,40.7473877335953,40.7473878774532,40.7473710834066,40.7473707061128,40.7473393417679,40.7473778030126,40.7474116720829,40.7474068496085,40.7474384843489,40.7475924183468,40.7476109021087,40.7476305500681,40.7479762059952,40.748000575342,40.7480145719089,40.7480137191812,40.7477856453329,40.7484118931688,40.748412709627,40.7484002193805,40.7484097672064,40.7483950617009,40.7484295869173,40.748436935038,40.7484479568083,40.748473540436,40.7486450467662,40.7486568141139,40.7486779922436,40.7486968211758,40.7490257472649,40.749041633831,40.7490498759196,40.7490516431173,40.7489319880057,40.749935041289,40.7500009490234,40.7501070047815,40.7500811641566,40.7500751577196,40.749985205722,40.7503710697304,40.7510226744769,40.7513214621013,40.7506481837826,40.7514268050034,40.7514658949698,40.7516281972208,40.7516525779225,40.7518836093044,40.7519480142071,40.7520975940991,40.752116895735,40.7519643953271,40.7519395126157,40.751956502032,40.7520767914788,40.752090225131,40.7521251556499,40.7521183494431,40.7521397121119,40.7521421249495,40.7522143512432,40.7521891059472,40.7521768422368,40.7521440018702,40.7521636284759,40.7520622500008,40.7520281054344,40.7520438824116,40.7520728678769,40.7523556095456,40.7523735030462,40.7520185719199,40.7521578502393,40.7523243458542,40.7523448540372,40.7523588165347,40.752342281773,40.7527634131393,40.7527854419594,40.7528036810282,40.7527804111984,40.7528161871491,40.7529121255144,40.7529335641532,40.7530035914592,40.7529483700877,40.7528140776533,40.7527949679831,40.7528034642446,40.7523800160072,40.7523715211096,40.7523521383795,40.7524939986284,40.7523507393423,40.7532564521095,40.7535426115119,40.7539721578186,40.7542818417741,40.7543368019317,40.7545305507342,40.7544770199213,40.7547231844509,40.7547355682032,40.7547893026695,40.7549855945353,40.7549324811735,40.7551807948494,40.7553917756404,40.755532367491,40.755706871434,40.7562208434685,40.7563605196206,40.7565581424329,40.7566202356342,40.756789341981,40.7573231403492,40.7572319985399,40.7578098431647,40.757884164448,40.7580285549283,40.7583570164732,40.7591600575616,40.7591761476427,40.7592037203867,40.7592318703411,40.7598747512412,40.7598920323172,40.7598936012681,40.7598904604646,40.7598428220447,40.7590849965527,40.7595017076884,40.7593756921835,40.759510731466,40.7596260447428,40.7596992141714,40.7597610718818,40.7598359141708,40.7598865731666,40.7598753076786,40.7599106857635,40.7599592795159,40.75992456661,40.7599131030437,40.759861642396,40.7598930073072,40.7597059695766,40.7598465589732,40.7600030197205,40.7601331366669,40.7604517069513,40.7607288707064,40.7610783450963,40.7609289697034,40.7615437270017,40.7624928019449,40.7625078760754,40.7625242650251,40.7626645672,40.7626757073564,40.7626713590988,40.7617284322265,40.7622945201417,40.7626445981276,40.7635822416406,40.7637770439098,40.7628500950019,40.7634202717257,40.7643328886872,40.7646168359314,40.7646657826534,40.7646495982067,40.7646126104546,40.7646380376703,40.76473050988,40.7647362813837,40.7647407964326,40.764743930225,40.764745596139,40.7647457481267,40.7647443819868,40.7638882082629,40.7637552863614,40.7634065284794,40.7635690709908,40.7635590812105,40.7637062791803,40.7638061945785,40.763823910197,40.7642052595827,40.7655251810996,40.7655615437953,40.7658773904186,40.7658932665704,40.7647019149825,40.7646624998576,40.7645693770485,40.7649986072708,40.765073340286,40.7650857947378,40.7651044807472,40.7651373942678,40.7651747656796,40.7652085704499,40.765237035343,40.7652601687412,40.7652761788068,40.7652975369844,40.7653162138339,40.7653509090876,40.7654180487638,40.7655210727588,40.7655522334133,40.7655677749348,40.7669447025327,40.7669771922107,40.7669964993683,40.7672300477331,40.7672493639711,40.76725112005,40.7672414582416,40.7658940353741,40.765905607075,40.7658718811357,40.7663491205558,40.766823385877,40.7682031110587,40.7682203737867,40.7682452361056,40.7685041956801,40.7685124799644,40.7685041959319,40.7671286961728,40.7676006218592,40.7680988157957,40.7694735066337,40.7695061773316,40.7697508077401,40.7697675658379,40.7697642154718,40.7687326435769,40.7687955156239,40.7688473877134,40.7690287906537,40.768979629322,40.7694245682739,40.7704632729821,40.7708250567093,40.7697988363364,40.7704005795149,40.7704548488862,40.770613123501,40.7705545959539,40.771031615168,40.7711606684658,40.771225812533,40.7712825627641,40.7712565164156,40.7712978556238,40.7712751028377,40.7713074653306,40.7714502985821,40.7714470870246,40.7714991807485,40.7714755188204,40.7714216672224,40.7713788187937,40.7713542822772,40.7713252926281,40.7713369575129,40.7711960049096,40.7714507382671,40.7714407098065,40.7714491906977,40.7714681460754,40.7714856059375,40.7715160424055,40.7716073399442,40.7716452494733,40.7716587749234,40.772542868902,40.7728174812286,40.7719295475302,40.7723771265884,40.7728026750291,40.7731289750453,40.773275391093,40.7725247819435,40.7725264851382,40.7724871910213,40.7729317878507,40.7729557441639,40.7729551948768,40.772944653909,40.7728828461294,40.7729240585235,40.7729018701743,40.772970028664,40.7729938015668,40.7730395511014,40.7731214402703,40.7731562439918,40.7734811965762,40.7734141386659,40.7733884750392,40.7733580349244,40.7732971531899,40.7737897913977,40.7738523561841,40.7738163160151,40.7738173776011,40.7738868866101,40.7739133546209,40.7739139849032,40.7739167136542,40.7739518052991,40.7739603239614,40.7739869543515,40.7740861864377,40.7740688958032,40.7738707313943,40.7731795109669]}]],[[{"lng":[-73.9582921680775,-73.955958623714,-73.9552936159939,-73.9543316200652,-73.9541276615553,-73.9529867271405,-73.9520634525867,-73.9496756738763,-73.9486972516062,-73.948617780266,-73.9481927600092,-73.9477679288616,-73.9473433076129,-73.9469189146633,-73.9441512012041,-73.9431895075241,-73.9418326671478,-73.9417385886041,-73.9413766379648,-73.9405720421218,-73.9398351826436,-73.9386249249757,-73.9379107701372,-73.9371448242304,-73.9369658361889,-73.9361031306121,-73.9360224075648,-73.9358583708006,-73.9330808422055,-73.9327806834982,-73.9326755251739,-73.9311558184399,-73.931058761596,-73.9303176269034,-73.9300709182586,-73.9299300776955,-73.9282261392396,-73.9278423987194,-73.927722291609,-73.9275399130746,-73.9271490150459,-73.9270268374548,-73.9266041949648,-73.9251205069533,-73.9250569711535,-73.9247828359688,-73.9237887342265,-73.9228218505646,-73.9226854032338,-73.9218236101579,-73.9218323249591,-73.9219009052173,-73.9219749528721,-73.9220484332064,-73.9221315337918,-73.9222144438704,-73.9222995036711,-73.922384017885,-73.9224535544231,-73.9224669682933,-73.9225443223555,-73.9226135432244,-73.9226321076668,-73.9226553004528,-73.9227271424125,-73.9227525722044,-73.9228110659905,-73.9230343938023,-73.9231197845566,-73.9232322460333,-73.9233103976441,-73.9242446727456,-73.9243909938475,-73.925462701954,-73.9259220154963,-73.9263797054922,-73.9273935002171,-73.927711889418,-73.9282287237976,-73.928722045946,-73.9286920062813,-73.9286840449078,-73.9285985544817,-73.9285246975042,-73.92844239741,-73.9283698750737,-73.9283599500501,-73.928349671659,-73.9311193782087,-73.9338877367781,-73.9366570204557,-73.939426956198,-73.9421962844687,-73.9449646848674,-73.945226455804,-73.9463846338309,-73.9477299632891,-73.9505022756118,-73.950874696308,-73.951604648875,-73.9516049595336,-73.9532701974491,-73.9552696365476,-73.957973172018,-73.9590472528542,-73.9613369555931,-73.9625712308473,-73.9627450864405,-73.9629930792292,-73.9632395478874,-73.9634843452673,-73.9637273252179,-73.9639683427011,-73.9642072537957,-73.9644439158614,-73.9646781875988,-73.9650133153311,-73.9653520574662,-73.9656941903139,-73.9660394879417,-73.9663877221241,-73.9667386630812,-73.9670920790557,-73.9674477366532,-73.9675970682695,-73.9677475223481,-73.9678989080235,-73.9680510332478,-73.9682037051064,-73.9683567298466,-73.9685099133405,-73.9686630612583,-73.9687744411689,-73.9689420641728,-73.9688810410428,-73.9688287645491,-73.9688040865352,-73.9687718168702,-73.9687466164817,-73.968728537666,-73.9687176178786,-73.9687138798545,-73.9687173313841,-73.9687414350502,-73.9687820209156,-73.968838901863,-73.9689115461731,-73.9689991853133,-73.9690595480464,-73.9691281508859,-73.9692046860833,-73.9692888102982,-73.9693801461669,-73.9694782839282,-73.9695827833093,-73.9696931754916,-73.9698094747164,-73.9699425635073,-73.9700894257936,-73.9702454870791,-73.9704048696478,-73.9705611137667,-73.9707080104976,-73.9708404133681,-73.9709547358534,-73.9710491910434,-73.9714229284868,-73.9718859677281,-73.9724449244621,-73.9727161502031,-73.9730525161378,-73.9735088335376,-73.9743104817796,-73.9746911837325,-73.9751431678887,-73.9745039588365,-73.9741044872183,-73.9739775765495,-73.974391442015,-73.9742267139578,-73.9739560163829,-73.9708260260517,-73.967678283782,-73.9674779632189,-73.9675069776285,-73.9675319676566,-73.9665724714336,-73.9655104335493,-73.9644217717163,-73.9643588344663,-73.9641038822544,-73.963292055495,-73.9613465588579,-73.9582921680775],"lat":[40.6798311339974,40.679346246648,40.679203151044,40.6790008660091,40.6789579768564,40.6787219954922,40.6785863307184,40.6784566816829,40.6784171310243,40.6784141778994,40.6783940706042,40.6783717684003,40.6783472717036,40.6783205817603,40.6781563587821,40.6781070809375,40.6780331010679,40.6780279745302,40.6780082308145,40.6779701955117,40.6779239034292,40.6778625695826,40.6778251934446,40.6777850557325,40.6777752500837,40.6777280021484,40.6777235804611,40.6777146016177,40.6775632812163,40.6775469609287,40.6775412435403,40.6774586230558,40.6774533415934,40.6774130382625,40.6773983719681,40.6773900020347,40.6772886878607,40.6772670523661,40.6772603038453,40.6772500493469,40.6772297124079,40.6772233582208,40.6772013782941,40.6771197269922,40.6771162276846,40.6771011446901,40.6770460726329,40.6769915503554,40.676984280015,40.676938358473,40.6768490422612,40.6761316215471,40.6753485477724,40.6745743971981,40.6736838895097,40.6727916335527,40.6719002621009,40.6710087634733,40.6702611488539,40.6701169302558,40.6692758106947,40.6685641072422,40.6683732110646,40.668127115014,40.6673650564269,40.6670973329621,40.6670717607138,40.6669741259334,40.666936793632,40.66688762807,40.6668534604254,40.6664450003867,40.6663814232779,40.6659167519916,40.6657150352015,40.6655148926442,40.6650747161542,40.6649343279918,40.6647098651863,40.6644955696853,40.6649622973766,40.6650860232743,40.6659705388988,40.666866560048,40.6676722095451,40.6684348201971,40.6685152024712,40.6686471946908,40.6687985425918,40.66895044556,40.669100570778,40.669248684167,40.6694033043445,40.6695558745457,40.6695705836165,40.6696366798575,40.66971344241,40.6698653518951,40.6698870998396,40.6699237033007,40.669923718844,40.670007205105,40.6701249048541,40.6706572740763,40.6708822675465,40.6713567714725,40.6716222448873,40.6717889828106,40.6718341763298,40.6718839698781,40.6719383337282,40.6719972354242,40.6720606396264,40.6721285086583,40.6722008020009,40.6722774764937,40.6723878435016,40.6724916178564,40.6725887310254,40.6726791188748,40.6727627213398,40.6728394835842,40.6729093549135,40.6729722891836,40.672998311997,40.6730202693967,40.6730381335276,40.6730518817272,40.6730614965438,40.6730669657887,40.6730682825236,40.673065445078,40.6729423672122,40.6728874912704,40.6729803530394,40.6731421769533,40.6732106748991,40.6733283421157,40.6734470058822,40.6735664201242,40.673686336847,40.67380650774,40.6739266835992,40.6740891068388,40.6742503536401,40.6744089769976,40.6745635626416,40.6747127763116,40.6748080325343,40.6748999985297,40.674988261699,40.675072426054,40.6751521142118,40.6752269684347,40.6752966528895,40.675360854936,40.6754206342893,40.6754689008809,40.675502122886,40.6755173738668,40.675512939303,40.6754885756179,40.6754456760798,40.6753869692849,40.6753161182099,40.6752371128027,40.6757546336564,40.6763946529768,40.6771620086036,40.6775228106869,40.6779986773799,40.6786391209694,40.6797348230713,40.6802666168047,40.6808719053068,40.6807332033245,40.6806496724439,40.6809832759687,40.6810461702467,40.681504639034,40.6822697328902,40.6816159417546,40.6809554553115,40.6815862903941,40.6816870214012,40.6817687836176,40.681564814365,40.6813440199768,40.6811190793324,40.6811058760987,40.681052391877,40.680881585896,40.680463524301,40.6798311339974]}]],[[{"lng":[-73.9625712308473,-73.9625410816496,-73.962523265969,-73.9621944718203,-73.9621102108679,-73.9619965757854,-73.9618065873623,-73.9616162763689,-73.9612579166136,-73.9611088685433,-73.9609559545363,-73.962131463956,-73.9622497383514,-73.9623882227418,-73.9628071076408,-73.9628656957107,-73.9629176798521,-73.962962766,-73.9630006991152,-73.9630312649951,-73.9630542903218,-73.9630696448626,-73.9630772417813,-73.9628129850858,-73.9624553663317,-73.961880864398,-73.9641466633954,-73.9662132202526,-73.9714562030853,-73.9717057070882,-73.9722222860573,-73.972328462881,-73.9723690104418,-73.9724290563281,-73.9726828851762,-73.9730510359984,-73.9732662806725,-73.9735549395919,-73.9737918996636,-73.9740445824795,-73.9740727874031,-73.9740728117791,-73.9740728354952,-73.9741195339228,-73.9741845515246,-73.9741845752545,-73.9742673549582,-73.9743670129249,-73.9744823403471,-73.9751573810001,-73.9775117140598,-73.9795787009564,-73.9796198663508,-73.9796200437267,-73.9796202571621,-73.9796801993435,-73.9796803298229,-73.979680495715,-73.9797565750851,-73.9797568353644,-73.9797570839648,-73.9798419793285,-73.9798422756669,-73.9798426188445,-73.9799265629445,-73.9799267048356,-73.9799268238399,-73.9800008903387,-73.9800011389069,-73.9800013861361,-73.9800602537324,-73.9801196428517,-73.9801199153776,-73.9801201271727,-73.9801718613518,-73.9801720148655,-73.9801720977647,-73.9802099218457,-73.9802100522445,-73.9802101227924,-73.9802289430904,-73.980229025947,-73.9802290135527,-73.9802271619049,-73.9802271618675,-73.9802271035243,-73.9802065458748,-73.9802064507635,-73.9802062856975,-73.9801716110372,-73.9801344146106,-73.9800911597291,-73.9800427586837,-73.9799902323078,-73.9799346884464,-73.9798772987375,-73.9798192734448,-73.9797618363971,-73.9797061990158,-73.9796535347633,-73.9793505994626,-73.9788547591815,-73.9783494522871,-73.9778427509164,-73.9773425303496,-73.9768451680885,-73.9763338616919,-73.9758313228491,-73.9753371462465,-73.9748332761671,-73.9743309359185,-73.9738252853462,-73.9733228431905,-73.972819906653,-73.9723172091348,-73.9718159465479,-73.9713252639015,-73.9708544070116,-73.9705026252364,-73.970407345277,-73.9708789450566,-73.9709110838728,-73.9709834176223,-73.9710512914015,-73.9711145821566,-73.9711731751398,-73.9712269643708,-73.9712758520266,-73.9713197494639,-73.9713585770846,-73.971381345661,-73.9713814371047,-73.9713815054419,-73.9714391947519,-73.9714696602279,-73.9714782916489,-73.9714648996102,-73.9714297341057,-73.9714123329649,-73.9713859555711,-73.9713507283514,-73.9713068201652,-73.9712544419753,-73.9711938443834,-73.9711253178971,-73.9710491910434,-73.9709547358534,-73.9708404133681,-73.9707080104976,-73.9705611137667,-73.9704048696478,-73.9702454870791,-73.9700894257936,-73.9699425635073,-73.9698094747164,-73.9696931754916,-73.9695827833093,-73.9694782839282,-73.9693801461669,-73.9692888102982,-73.9692046860833,-73.9691281508859,-73.9690595480464,-73.9689991853133,-73.9689115461731,-73.968838901863,-73.9687820209156,-73.9687414350502,-73.9687173313841,-73.9687138798545,-73.9687176178786,-73.968728537666,-73.9687466164817,-73.9687718168702,-73.9688040865352,-73.9688287645491,-73.9688810410428,-73.9689420641728,-73.9687744411689,-73.9686630612583,-73.9685099133405,-73.9683567298466,-73.9682037051064,-73.9680510332478,-73.9678989080235,-73.9677475223481,-73.9675970682695,-73.9674477366532,-73.9670920790557,-73.9667386630812,-73.9663877221241,-73.9660394879417,-73.9656941903139,-73.9653520574662,-73.9650133153311,-73.9646781875988,-73.9644439158614,-73.9642072537957,-73.9639683427011,-73.9637273252179,-73.9634843452673,-73.9632395478874,-73.9629930792292,-73.9627450864405,-73.9625712308473],"lat":[40.6716222448873,40.6714601187114,40.6713797387427,40.6696410297926,40.6691956971909,40.668662869889,40.667681226904,40.6666952157605,40.6648018234093,40.6640623236647,40.6632850548343,40.6632081631204,40.663198678195,40.6630896130645,40.6627181111361,40.6626528824221,40.6625844849145,40.6625133055532,40.6624397470141,40.6623642251591,40.6622871674729,40.6622090098859,40.6621301945495,40.6605093928109,40.6582869780274,40.6548811920523,40.6539949723505,40.6531894045468,40.6511403124624,40.6511099064229,40.6510469517658,40.6513979285803,40.6515399489964,40.6517502587451,40.6526392779873,40.6539125067717,40.6546492613319,40.6556439390754,40.6563923239465,40.6573472525429,40.6575209783584,40.6575210859169,40.6575211934753,40.6576937524214,40.6578635053414,40.6578635778864,40.6580287871908,40.6581879035122,40.6583394497787,40.658722794115,40.6598627564165,40.660853242154,40.6608072145897,40.6608070082266,40.6608068638552,40.6607667380894,40.6607666568613,40.6607665944027,40.6607386016499,40.6607385023516,40.6607384667118,40.6607274504009,40.6607274147694,40.6607274411314,40.6607346866567,40.6607346965656,40.6607347322698,40.6607574922972,40.66075756421,40.6607576992805,40.660790758261,40.6608227913596,40.6608229358159,40.6608231246566,40.6608676188163,40.6608677538704,40.6608678802009,40.6609231336114,40.6609233224379,40.6609235563192,40.6609850557508,40.6609853264904,40.6609855784504,40.6610478483065,40.6610479746226,40.6610481277332,40.6611054605032,40.661105712449,40.6611059550012,40.6611546584779,40.6611885728972,40.6612180268403,40.6612423990874,40.6612611755975,40.6612739603501,40.6612804837651,40.6612806082055,40.6612743310468,40.6612617846824,40.6612432337311,40.6615948211,40.6622018328287,40.6627990154146,40.6634017694639,40.6640118972666,40.6646063820106,40.6652136035386,40.6658150797262,40.6664190955295,40.6670220980278,40.6676212350908,40.6682230881444,40.668824923261,40.6694271775256,40.6700290975678,40.6706294753052,40.6712482248942,40.6718643647745,40.672445493491,40.6726472194284,40.6727131748473,40.6727714935476,40.6728500965096,40.6729309725521,40.6730139750677,40.6730989535934,40.6731857540558,40.6732742191573,40.6733641885281,40.6734554990708,40.6735092803237,40.6735094900912,40.6735097068892,40.6737045069705,40.6739028980975,40.6741032381801,40.6743034195093,40.6745013617793,40.6746005795177,40.6746986425955,40.6747950808498,40.6748894319058,40.6749812435676,40.6750700754908,40.675155501764,40.6752371128027,40.6753161182099,40.6753869692849,40.6754456760798,40.6754885756179,40.675512939303,40.6755173738668,40.675502122886,40.6754689008809,40.6754206342893,40.675360854936,40.6752966528895,40.6752269684347,40.6751521142118,40.675072426054,40.674988261699,40.6748999985297,40.6748080325343,40.6747127763116,40.6745635626416,40.6744089769976,40.6742503536401,40.6740891068388,40.6739266835992,40.67380650774,40.673686336847,40.6735664201242,40.6734470058822,40.6733283421157,40.6732106748991,40.6731421769533,40.6729803530394,40.6728874912704,40.6729423672122,40.673065445078,40.6730682825236,40.6730669657887,40.6730614965438,40.6730518817272,40.6730381335276,40.6730202693967,40.672998311997,40.6729722891836,40.6729093549135,40.6728394835842,40.6727627213398,40.6726791188748,40.6725887310254,40.6724916178564,40.6723878435016,40.6722774764937,40.6722008020009,40.6721285086583,40.6720606396264,40.6719972354242,40.6719383337282,40.6718839698781,40.6718341763298,40.6717889828106,40.6716222448873]}]],[[{"lng":[-73.9040463980889,-73.9034905003708,-73.9035765725715,-73.9035464012338,-73.9034678007585,-73.9033899477951,-73.9033645784494,-73.9033159957102,-73.9033541752533,-73.9034593367302,-73.9034637968846,-73.9034655362001,-73.9034663061998,-73.9034687813497,-73.9034715727059,-73.9034735546669,-73.9034742227648,-73.9034622888674,-73.9034427236995,-73.9032213189808,-73.902967689961,-73.9026600835474,-73.9022882256012,-73.9019821814221,-73.9016676789062,-73.9012657039877,-73.9008513567251,-73.9004165405497,-73.9000252300403,-73.899652332798,-73.8992176089417,-73.8993165289739,-73.8995655897609,-73.8995540452846,-73.8995612019019,-73.8995872163133,-73.8996320551593,-73.8996954800287,-73.8997770418753,-73.8998250823794,-73.8998535044498,-73.8998898683659,-73.8999175377391,-73.8999442811324,-73.8999926378766,-73.9001171585725,-73.9002631093379,-73.900429882757,-73.9006166251606,-73.9008222483241,-73.9010454603378,-73.9012847816899,-73.9015385661799,-73.9062337671228,-73.9075520957351,-73.9080471149841,-73.9085579052277,-73.90933499313,-73.9101441423353,-73.9106731684801,-73.9108433063198,-73.910934871825,-73.9109775782781,-73.9110577934274,-73.9118947707755,-73.9121886028902,-73.9123645889657,-73.9131435625853,-73.9137794374175,-73.9140287814533,-73.914412476905,-73.9155662961218,-73.9157280376987,-73.9170736350247,-73.9174181928351,-73.9181849310437,-73.9186016816377,-73.9189360736859,-73.9192045104331,-73.9194572779273,-73.9195947982405,-73.919731288154,-73.9201132617165,-73.9207783419004,-73.9210508174915,-73.9216557165979,-73.9220990255853,-73.9228786020059,-73.9231821624421,-73.9240255324197,-73.9240967925411,-73.9241641129001,-73.9242273360784,-73.9242863141597,-73.9243409093055,-73.9243909938475,-73.9242446727456,-73.9233103976441,-73.9232322460333,-73.9231197845566,-73.9230343938023,-73.9228110659905,-73.9227525722044,-73.9227271424125,-73.9226553004528,-73.9226321076668,-73.9226135432244,-73.9225443223555,-73.9224669682933,-73.9224535544231,-73.922384017885,-73.9222995036711,-73.9222144438704,-73.9221315337918,-73.9220484332064,-73.9219749528721,-73.9219009052173,-73.9218323249591,-73.9218236101579,-73.9209453994001,-73.9201223330722,-73.9192356231401,-73.9183055032112,-73.9173958691575,-73.9164648603233,-73.9164574753002,-73.9163549218404,-73.9163011986149,-73.916393000754,-73.916539986558,-73.9166863837081,-73.9167620744217,-73.9168301141706,-73.916976328249,-73.9171213852814,-73.9172663265664,-73.9174129427007,-73.917557632914,-73.9176263055923,-73.91763742515,-73.9176477650869,-73.9176563872246,-73.9176643517633,-73.9177010938695,-73.9177654758854,-73.9177842681265,-73.9178353117744,-73.9178493747616,-73.9178920031827,-73.9179154841195,-73.9179989063342,-73.9180460695848,-73.9176811391874,-73.9175522613358,-73.9167983288489,-73.9166103203224,-73.9160459932908,-73.9155003395401,-73.915289635161,-73.9147008338055,-73.9146891547908,-73.9145397242182,-73.9137970017106,-73.9133072811088,-73.9130372137234,-73.9122730121486,-73.911511928854,-73.9107695442353,-73.9100246099535,-73.9092746294856,-73.9090552702809,-73.9088602555343,-73.9085164231406,-73.9077715879164,-73.9070182028394,-73.9067194118451,-73.9062828712672,-73.9056593420266,-73.9055483682493,-73.9054930354526,-73.9054141661056,-73.90478936068,-73.9045689133247,-73.9040463980889],"lat":[40.6792205980192,40.6788980485348,40.6788833043726,40.6787425374827,40.6783758875856,40.6780382329525,40.6779817489148,40.6778692233986,40.677111534876,40.6760350028628,40.6759278906414,40.6758860089664,40.6758526638646,40.6757441809375,40.6756224600559,40.6755357608614,40.6755066832772,40.6754579194757,40.6753779190606,40.674472913689,40.6734393952624,40.6721971791508,40.6709360069667,40.6696700711987,40.6684135291928,40.6668806501649,40.6653458945236,40.6638065279357,40.6622816314516,40.6607354163782,40.6591114041932,40.6590673908684,40.6589565756107,40.6587177706758,40.6584778011579,40.6582379457657,40.6579994798497,40.6577637018589,40.6575318475627,40.6574219175225,40.6573568607414,40.6572745209475,40.6572040535054,40.6571359524246,40.6570127948912,40.6567546437481,40.6565016437778,40.6562553167027,40.6560171284051,40.6557884673294,40.65557059861,40.6553646491783,40.6551715977333,40.652048896178,40.6511859257308,40.6516122768854,40.6520959377946,40.6528085921442,40.6535211591742,40.6540068324645,40.6541025004812,40.6541732804104,40.6542277852862,40.6543159005311,40.655073286226,40.6553396593528,40.6555135652494,40.6562208640478,40.6567836797114,40.657003709085,40.6573624192911,40.6583925717183,40.6585501282768,40.6597453539634,40.6600511921013,40.6607262089156,40.661118048607,40.6614160111762,40.6616552001489,40.6618807852925,40.6619956797906,40.6621233507708,40.6624591040656,40.6630752390815,40.6633138560385,40.6638435751677,40.6642513320836,40.6649520989224,40.6652260197061,40.6659816997474,40.6660424472593,40.66610574682,40.6661714504239,40.6662394044448,40.6663094499895,40.6663814232779,40.6664450003867,40.6668534604254,40.66688762807,40.666936793632,40.6669741259334,40.6670717607138,40.6670973329621,40.6673650564269,40.668127115014,40.6683732110646,40.6685641072422,40.6692758106947,40.6701169302558,40.6702611488539,40.6710087634733,40.6719002621009,40.6727916335527,40.6736838895097,40.6745743971981,40.6753485477724,40.6761316215471,40.6768490422612,40.676938358473,40.6768878336249,40.676856899742,40.6768132004563,40.6767531813271,40.6766935840179,40.6766470400465,40.6767260282328,40.6778235366874,40.6785771124341,40.678905848881,40.6796374973525,40.6803713787895,40.6807555999409,40.6811009812295,40.681834159418,40.6825684716866,40.6833032245533,40.6840340515225,40.6847671919212,40.6851181493407,40.6851749763059,40.6852278227578,40.6852718836681,40.6853125866859,40.6855003586647,40.6858185408124,40.6859114121165,40.6861636696005,40.6862331679145,40.6864491591785,40.6865659363019,40.6869657796104,40.687213247771,40.6870040948014,40.6869302230498,40.6864971998719,40.6863913526917,40.6860720694707,40.6857615240279,40.6856455369953,40.6853169452405,40.6853104194227,40.6852269184801,40.6847998717835,40.6845208578216,40.6843678096827,40.683934965192,40.6835049900879,40.6830927012723,40.6826573710899,40.6822343235831,40.6821055747453,40.6819940364655,40.6818039438251,40.6813778465741,40.6809482797905,40.6807674219426,40.6805067560749,40.6801406914279,40.6800716022369,40.6800371581605,40.6799926433812,40.6796504568711,40.6795155370216,40.6792205980192]}]],[[{"lng":[-73.9075520957351,-73.9084908428466,-73.9091489002397,-73.9092216277097,-73.9100695676753,-73.9108196941893,-73.91136110205,-73.9114921263236,-73.9122336906649,-73.9127882761001,-73.9129369754959,-73.9137267068675,-73.9145894931745,-73.9152525951674,-73.9159308624383,-73.9177670150513,-73.9185942316251,-73.9197373704819,-73.9202580235395,-73.9215494808753,-73.9233265458737,-73.9237527784941,-73.9238584223179,-73.9241931459387,-73.9246469500312,-73.9251134440834,-73.9255918603648,-73.9260813465546,-73.9267551566779,-73.9276401540758,-73.9287811084919,-73.9295845672209,-73.9310277683218,-73.9315481248931,-73.932235548344,-73.9333791512903,-73.9343051029594,-73.9352099304649,-73.9361041162562,-73.9364119713421,-73.9370366905544,-73.9375927357049,-73.9380145373732,-73.9385171651273,-73.9388318881106,-73.9390277231562,-73.9395451882993,-73.9396696980432,-73.9397372201333,-73.9400170267874,-73.9404774223896,-73.9405807579267,-73.9407095754807,-73.9410288926998,-73.9416715693295,-73.942623913925,-73.9435730877707,-73.9445364292418,-73.9455109552195,-73.9456175464572,-73.945867735272,-73.9468051587991,-73.9477733032834,-73.9480146601131,-73.9482649965689,-73.9492329569703,-73.9501709009553,-73.9511598853806,-73.9521366111647,-73.9530788527286,-73.9536000471938,-73.9537485377843,-73.9539417253589,-73.9540435859013,-73.9541264117089,-73.9541771797979,-73.9542806129959,-73.9545248417564,-73.9546656395126,-73.9547302470444,-73.9556519624085,-73.9557365123291,-73.9557623285312,-73.9557908301855,-73.9558251843973,-73.9559067073484,-73.9560105568092,-73.9560378310877,-73.9561082560446,-73.9561640963249,-73.9563003512271,-73.9529591999551,-73.9500666492729,-73.9471589632305,-73.9450790938835,-73.9448728440442,-73.9442878880342,-73.9436519320497,-73.9433548889922,-73.9424014792862,-73.9414626098894,-73.9405321468608,-73.9395592537714,-73.9385934899821,-73.9382040380815,-73.9376358398768,-73.9371206387431,-73.9366846950613,-73.9361792781603,-73.9357181332727,-73.9347843737798,-73.9338101207478,-73.9328465735883,-73.9319074382884,-73.9309035493227,-73.9310832309891,-73.9313256978005,-73.9314067937854,-73.9314799142061,-73.9315563885424,-73.9316021867279,-73.9306846549314,-73.9298736482734,-73.9294035290939,-73.9291675220372,-73.9290523546547,-73.928722045946,-73.9282287237976,-73.927711889418,-73.9273935002171,-73.9263797054922,-73.9259220154963,-73.925462701954,-73.9243909938475,-73.9243409093055,-73.9242863141597,-73.9242273360784,-73.9241641129001,-73.9240967925411,-73.9240255324197,-73.9231821624421,-73.9228786020059,-73.9220990255853,-73.9216557165979,-73.9210508174915,-73.9207783419004,-73.9201132617165,-73.919731288154,-73.9195947982405,-73.9194572779273,-73.9192045104331,-73.9189360736859,-73.9186016816377,-73.9181849310437,-73.9174181928351,-73.9170736350247,-73.9157280376987,-73.9155662961218,-73.914412476905,-73.9140287814533,-73.9137794374175,-73.9131435625853,-73.9123645889657,-73.9121886028902,-73.9118947707755,-73.9110577934274,-73.9109775782781,-73.910934871825,-73.9108433063198,-73.9106731684801,-73.9101441423353,-73.90933499313,-73.9085579052277,-73.9080471149841,-73.9075520957351],"lat":[40.6511859257308,40.6505864186227,40.6501760427395,40.6501310385613,40.6495572103232,40.6490778277107,40.6487290613685,40.6486387495646,40.6481547584833,40.6478078679181,40.6477058443952,40.6471962866268,40.6466387171483,40.6462178282136,40.645774695238,40.644327494557,40.6436754767375,40.642778147843,40.6423662985682,40.6413446923951,40.6399002155921,40.639582363369,40.6395086650372,40.6392751549271,40.6389791287543,40.6386947792532,40.6384225741831,40.6381629464124,40.6378121710962,40.6373514434135,40.6367574447959,40.636341774394,40.6355951033264,40.635325877722,40.6349633387563,40.6343675942147,40.6338855739312,40.6334140627752,40.6329589540274,40.632810290765,40.632509250074,40.6322678569992,40.6320904666279,40.6319232137334,40.6318283466246,40.6317691192041,40.6316284442441,40.6315983109317,40.6315816487626,40.6315126060848,40.6314124732462,40.6313929601883,40.6313686382038,40.6313095874154,40.6312087906018,40.631101784416,40.6309941556314,40.6308947957303,40.6307914829014,40.6317774303119,40.6341175481595,40.6340588398669,40.6339981566971,40.6362669523824,40.6386071897069,40.638547673901,40.6384850857478,40.6384178994072,40.6384258411824,40.6384279736585,40.6384223474501,40.6385863380881,40.6384947249419,40.6388775491903,40.6391612992827,40.6396323001962,40.6405893852227,40.6428875874788,40.644196744303,40.6447725783615,40.6466304101446,40.647868996887,40.648643289987,40.6495229898266,40.6505298080789,40.6513688344374,40.6523142734144,40.652701220771,40.6532447502487,40.6537765193077,40.6550482818312,40.6552493004003,40.6554229972006,40.6555937877736,40.655722046541,40.6557347616017,40.6557700543637,40.6558097809555,40.6558283358869,40.6558848110926,40.6559442485324,40.6560015389652,40.6560627532482,40.6561223787949,40.6561480151249,40.6561675762891,40.6562159030899,40.6562418233009,40.6562739725723,40.6563032967297,40.6563603950873,40.656422992675,40.6564784820519,40.6565376525426,40.6566103559842,40.6582959160363,40.6605933070246,40.6613305083395,40.6620511099541,40.6627554039298,40.6632304444006,40.6636204762702,40.6639907725283,40.6641998457684,40.664299532152,40.6643510070426,40.6644955696853,40.6647098651863,40.6649343279918,40.6650747161542,40.6655148926442,40.6657150352015,40.6659167519916,40.6663814232779,40.6663094499895,40.6662394044448,40.6661714504239,40.66610574682,40.6660424472593,40.6659816997474,40.6652260197061,40.6649520989224,40.6642513320836,40.6638435751677,40.6633138560385,40.6630752390815,40.6624591040656,40.6621233507708,40.6619956797906,40.6618807852925,40.6616552001489,40.6614160111762,40.661118048607,40.6607262089156,40.6600511921013,40.6597453539634,40.6585501282768,40.6583925717183,40.6573624192911,40.657003709085,40.6567836797114,40.6562208640478,40.6555135652494,40.6553396593528,40.655073286226,40.6543159005311,40.6542277852862,40.6541732804104,40.6541025004812,40.6540068324645,40.6535211591742,40.6528085921442,40.6520959377946,40.6516122768854,40.6511859257308]}]],[[{"lng":[-73.972994339389,-73.9729594808647,-73.9725898234115,-73.972397355419,-73.9721774273492,-73.9723515208722,-73.9724526158844,-73.9725653370985,-73.9729111684125,-73.9729671326161,-73.9730210800516,-73.9731228463365,-73.9732398353256,-73.9740839048974,-73.9749269555482,-73.9750394042932,-73.9755881930256,-73.9765093450658,-73.9775067424922,-73.9785016917869,-73.9789057139549,-73.9794258684296,-73.9803578547385,-73.981283846727,-73.9822111583866,-73.9831403468563,-73.9837215268118,-73.984063802494,-73.9850613649743,-73.9852002737078,-73.9864672684189,-73.9867631492432,-73.9874913607019,-73.9887312972833,-73.990049946831,-73.99036425111,-73.9906631198364,-73.9914734213569,-73.9915393444445,-73.9916141237686,-73.9925574782609,-73.9928606773962,-73.9929159153588,-73.9929783595407,-73.9933085496695,-73.9942155460831,-73.9949748484748,-73.9953314079744,-73.995345668855,-73.9954829431665,-73.9954900735167,-73.9955524716798,-73.9955631668591,-73.9951335133543,-73.9951549040411,-73.9950568493018,-73.9950994949081,-73.9955221225181,-73.9955277563283,-73.9977770813554,-73.9979563973929,-73.9979605510624,-73.9979789350664,-73.9955502945396,-73.9955502936809,-73.9951558419544,-73.9948767769537,-73.9949022605075,-73.9953473766122,-74.000114495384,-74.0001032257227,-74.000108860195,-74.0001652065632,-74.0002384564419,-74.0003173430327,-74.0003736889093,-74.0004327749314,-74.000425294387,-74.0004694808749,-74.0004891200193,-74.0003820711572,-73.9978831125104,-73.9979338241239,-73.9980186702297,-73.9986729337556,-73.9992369039696,-73.9994644681107,-73.9983783488211,-73.9984206169527,-73.9988361801457,-73.9988658617369,-73.9984438707949,-73.9985105961198,-73.9985534416792,-73.9985851536428,-73.9986248512674,-73.9986819791189,-73.9987431883265,-73.9987799135824,-73.9987941943793,-73.9987780058959,-73.9987329830786,-73.9986880961937,-73.998653412126,-73.9985942438703,-73.9985330340609,-73.9984901869193,-73.9984432593687,-73.9983963311173,-73.998355523042,-73.9977597270136,-73.9971116857154,-73.9971056233943,-73.9971073038004,-73.997116708592,-73.997133735026,-73.9971581970789,-73.9971898274793,-73.9972282806273,-73.9980643826768,-73.9981286946127,-73.9974051864242,-73.9972826970379,-73.997548510584,-73.9985640480066,-73.9991676186208,-73.9992642520107,-73.9993628309341,-73.9994627124436,-73.9995632450973,-73.9996637732068,-73.9997636411134,-73.9998621974638,-73.9999266913903,-73.9999873500127,-74.0000431494055,-74.0000931476637,-74.0001365008017,-74.0001724770002,-74.0002004689598,-74.0002200041532,-74.0002307528021,-74.0002325334459,-74.000058121709,-73.9996722321959,-73.9993061293423,-73.9990313144166,-73.9993002958716,-73.9993477536014,-73.9993886947503,-73.9994228766908,-73.9994500968473,-73.9994701938964,-73.9994830487237,-73.9991972767638,-73.9989746432054,-73.9983883108362,-73.998534109787,-74.0001789486995,-74.0008813363674,-74.0010959678416,-74.0016783014122,-74.0019663579194,-74.0019434924068,-74.0020377295676,-74.0022764846723,-74.002406589084,-74.0025444448795,-74.0026899407225,-74.0028429590989,-74.0030033764119,-74.0031710630821,-74.0033458836514,-74.0035276968928,-74.0037163559242,-74.0039117083271,-74.0041135962697,-74.0041305607206,-74.0043572469525,-74.0051183817076,-74.0055730371091,-74.007745857171,-74.0084840914257,-74.0092172390491,-74.0096156325537,-74.0097747960799,-74.0099354510272,-74.0101723998282,-74.0104123888951,-74.0106553381652,-74.0109474159977,-74.011242784576,-74.0115413451252,-74.0117063282543,-74.0118728222616,-74.0120634313686,-74.012369816027,-74.0129988703337,-74.0130216004984,-74.013941377296,-74.0147283701198,-74.0152576991997,-74.0157889982228,-74.0160864858223,-74.0163852849855,-74.0166852552227,-74.0169862554925,-74.0172881442686,-74.0175907796065,-74.0179922793689,-74.0182928630149,-74.0183234721685,-74.0191356390289,-74.0191340840976,-74.0193282664782,-74.0194276088975,-74.0193934357128,-74.0192315039128,-74.0191808901352,-74.0191768511388,-74.0187138228914,-74.0186913577419,-74.0186602176847,-74.0182314505144,-74.018214586302,-74.0181764666061,-74.018119049733,-74.0180470260697,-74.0175086859712,-74.0174671144685,-74.017283667568,-74.0167128387583,-74.0164055306887,-74.0154985500964,-74.0162363672972,-74.0170191015474,-74.0152237943311,-74.0134825591615,-74.0117120155573,-74.0110864810412,-74.0105040358741,-74.0099237199307,-74.0093416449816,-74.0087603999488,-74.0081768755106,-74.0075980688957,-74.0070153162091,-74.0064339499209,-74.0058531993418,-74.005226659917,-74.0045990697737,-74.0040190690737,-74.0034355710265,-74.0028570164015,-74.0022758628599,-74.0016938015666,-74.0012022236823,-74.0005298749299,-73.9999466498922,-73.9993209028495,-73.9986969523364,-73.9981161432841,-73.9975357378005,-73.9974878569875,-73.9971817527544,-73.9968777841972,-73.9965527313994,-73.9962125404841,-73.995858841457,-73.9954933816905,-73.9951180672689,-73.9947348567926,-73.9939819708341,-73.9925497361658,-73.9900935605129,-73.9878509553418,-73.9856935782417,-73.9834887256461,-73.9827363580095,-73.9812863830633,-73.9790579579084,-73.9768267894513,-73.9749726459846,-73.9748929575664,-73.974265609942,-73.9742562563154,-73.9742285162174,-73.9741824018726,-73.9741225370718,-73.9740567930897,-73.9739931946138,-73.9739470935797,-73.9737060382879,-73.9734837349883,-73.9732177484846,-73.9730265604729,-73.972994339389],"lat":[40.6088141418023,40.6086295077702,40.6066715333735,40.6056518901444,40.6041947115372,40.6033481188611,40.6026170545397,40.6017943730231,40.5993158037006,40.5989099600676,40.5985187857771,40.5977905214336,40.5969788180569,40.596882943568,40.5967935381629,40.5967800269532,40.5967192064316,40.5966161089621,40.5965064534207,40.5963948531317,40.5963527300793,40.5962975233277,40.5961915417464,40.5960879017296,40.595987010813,40.595884931775,40.5958210782172,40.5957827199541,40.5956709188194,40.5963981261166,40.5951788221258,40.5948940656273,40.5941939819159,40.5930018990679,40.591734112288,40.5914319316764,40.5911671666083,40.5904493057884,40.5903909030813,40.5903564459446,40.589921674724,40.5897826984193,40.5897573787788,40.589730033453,40.5895838985805,40.5888685304828,40.5885053720159,40.5883300667816,40.5883450171745,40.5882852227254,40.5882974549916,40.5882648392966,40.5882770721988,40.5884809155436,40.5885148937395,40.5885610983382,40.5885925050438,40.5883906229882,40.5884035100657,40.5873532375516,40.5872695063657,40.5872774235411,40.5873124639678,40.5884206939209,40.5884335812816,40.5886268728902,40.5887717466752,40.588802987503,40.58933138044,40.5869516409026,40.5865907989454,40.5865607290968,40.5865048849626,40.5864705188675,40.5864533350233,40.58647481463,40.5865445949216,40.5866924315609,40.5869430487606,40.587042855124,40.5871330573495,40.5883434379228,40.5883992829033,40.5884254000413,40.5891955499397,40.5889353282691,40.5892332693807,40.5897704450886,40.5898140545597,40.5896254895423,40.5896669752881,40.5898603991775,40.5899601329343,40.5900176831463,40.5900473849778,40.5900845670795,40.5901296741744,40.5901903360454,40.5902323318472,40.5902805499443,40.5903143558445,40.5903349879296,40.5903256557092,40.5902914364446,40.5902276635323,40.5902089981609,40.5902167741483,40.5902401054945,40.5902821002549,40.5903349831475,40.5909524696138,40.5912779774438,40.5913342792045,40.5913907557918,40.5914467901091,40.5915017698906,40.5915550943918,40.5916061809533,40.5916544713677,40.5912094647315,40.591288664258,40.5916450849804,40.5917148148681,40.591917578673,40.5914923253096,40.5911491353131,40.5911277784835,40.5911124357323,40.5911032071272,40.5911001528585,40.5911032928466,40.5911126066121,40.5911280334092,40.5911473840901,40.5911729456765,40.5912042866876,40.591240878085,40.5912821022022,40.5913272631709,40.591375598667,40.5914262927777,40.591478489775,40.5915313085593,40.5917148474845,40.5919637586688,40.5921787264061,40.5923128034476,40.5925591221624,40.5926223090534,40.5926880915661,40.5927560798885,40.5928258711364,40.5928970517406,40.5929691998976,40.5931781439191,40.5933063698711,40.5935313916063,40.5935923479004,40.5928506404697,40.5925997289996,40.592518708999,40.5934410039356,40.5938847444513,40.5939024273836,40.5940596060347,40.5943345805146,40.5945438565055,40.5947502289132,40.5949535309587,40.5951535983423,40.5953502693774,40.5955433851207,40.5957327895006,40.5959183294438,40.5960998549989,40.5962772194577,40.5964502794739,40.5964633561943,40.5966380926658,40.5972247915537,40.5975686123182,40.5989357224187,40.5993914586422,40.5998440451524,40.600039964139,40.6001314904761,40.6002214904369,40.6003499961619,40.6004751817125,40.6005970053171,40.6007361813907,40.6008712631935,40.6010022055438,40.6010715720604,40.601138808863,40.6012195223009,40.6013492571162,40.6015592075466,40.6015658671037,40.6018353443733,40.6020659113426,40.6021786875421,40.6022859498374,40.6023345091173,40.6023781409862,40.6024168249286,40.6024505427559,40.6024792786142,40.6025030189923,40.6024919523539,40.6024473552304,40.6024176511305,40.602612754505,40.6026485535541,40.6028108081714,40.602871578348,40.6029117612817,40.6031021742476,40.6031495946108,40.6031544223004,40.6035820759073,40.6036079239394,40.6036410675919,40.6041084725031,40.6041819577837,40.6042526088174,40.6043152228267,40.6043657351264,40.6048504972353,40.6049651043263,40.6051378246966,40.6056826353559,40.605975924814,40.6068415242769,40.6072332661004,40.6076544169712,40.6093563841185,40.6110373979196,40.6127350291876,40.6133390442023,40.6138966114925,40.6144566426455,40.6150150960399,40.6155758234432,40.6161331807064,40.6166944608693,40.6172539464371,40.6178147169019,40.6183704772606,40.6189731540266,40.6195768539982,40.6201361890691,40.6206954038477,40.6212536433395,40.621814274427,40.6223724273197,40.622842712352,40.6234899390831,40.6240506226048,40.6246552468466,40.6252565916406,40.6258157066096,40.6263767110243,40.6264250051576,40.6267101558363,40.6265307825624,40.626339908347,40.6261631253919,40.6260014341036,40.6258557065811,40.6257266289914,40.625614741106,40.6251413990506,40.6242742687793,40.6227889533431,40.6214350324407,40.6201315149502,40.6188000242624,40.618345979472,40.617470905421,40.6161258365951,40.6147764019036,40.6136681101717,40.6131863689167,40.6138455646908,40.6138935328248,40.6139414611534,40.6139832177728,40.6140131730554,40.6140284945025,40.6140298942426,40.6137959280038,40.6125723708565,40.6113710612012,40.6099813857914,40.6089824766405,40.6088141418023]}]],[[{"lng":[-74.0505080640328,-74.0504713719441,-74.0503032127172,-74.0501258737545,-74.0499835256257,-74.0493164036208,-74.0492362984208,-74.0500262015868,-74.0507440997721,-74.050747689433,-74.0507322395424,-74.0507357103709,-74.0508032689558,-74.0508733304563,-74.0509060170505,-74.0509129258488,-74.0508820037162,-74.050852502094,-74.0508338628733,-74.0507650735713,-74.0507083160663,-74.0506876961959,-74.0506825519483,-74.050682576825,-74.0506791674861,-74.0506964038199,-74.0507342649788,-74.0507841675243,-74.0508392303146,-74.0508839591318,-74.0509338641698,-74.0509700033223,-74.0509912930413,-74.0510130265969,-74.0510388419626,-74.0510560689641,-74.0510750042746,-74.0510733020021,-74.0510715980381,-74.0510491317553,-74.0509166482114,-74.0508506650391,-74.050758897382,-74.0506671482292,-74.0506151397822,-74.0505386530106,-74.0505080640328],"lat":[40.5664220346634,40.5664173874353,40.5664174612006,40.5664058803351,40.5663959249283,40.5658877477805,40.5653627368707,40.5653181811238,40.5658871259351,40.5659540767539,40.5659921190177,40.5660327750984,40.5660522004612,40.5660812402099,40.5660943416281,40.5661336842543,40.5661782900042,40.5661895562056,40.5661966735784,40.5661993263429,40.5661941060585,40.5662177227733,40.5662373975521,40.566270186452,40.5663108457364,40.5663606755322,40.566394758646,40.5664314604417,40.5664694708516,40.5664878116295,40.5665284477935,40.5665585971581,40.5665767594865,40.5665953009011,40.5666188968788,40.5666569234872,40.5666792110922,40.5667028199646,40.5667224939004,40.5667381184913,40.566695575668,40.5666433877378,40.5665851368753,40.5665502030478,40.5665082567752,40.5664406737967,40.5664220346634]}],[{"lng":[-74.0531403682107,-74.0540604493991,-74.054897782108,-74.054693169734,-74.0548513462535,-74.0548456005217,-74.0536862915042,-74.0529319063982,-74.0531403682107],"lat":[40.5777027150432,40.5771164457415,40.5777824409199,40.5796916322292,40.5797075925751,40.5799457914276,40.5805487596145,40.5799024746659,40.5777027150432]}],[{"lng":[-74.0555212612237,-74.0554319800416,-74.0553793243408,-74.0552871969713,-74.0551725101646,-74.055182181695,-74.0551795585468,-74.0551685568999,-74.0551525106076,-74.0551202304094,-74.0550597416175,-74.0538106987138,-74.0537176946205,-74.0536072974086,-74.0536725642038,-74.0540203995901,-74.0538509949876,-74.0537815283146,-74.0537547431988,-74.0536960798506,-74.0536712685174,-74.0535913355606,-74.0535675357033,-74.0535396454605,-74.0532048611941,-74.0531579919433,-74.0531186180772,-74.0530869175891,-74.0530630337763,-74.0530470745933,-74.0530391121636,-74.0530333074381,-74.0530361267984,-74.0530475416789,-74.0530674365022,-74.05309560985,-74.0533185734229,-74.0533878948207,-74.053427085934,-74.0534219996675,-74.0531903352764,-74.0528001784733,-74.0524031963273,-74.0522541191052,-74.0522298309426,-74.0522282695419,-74.0522453179922,-74.0522677927034,-74.0522909929142,-74.0523249485185,-74.0523724584625,-74.0524282733076,-74.0524917895084,-74.0526066050153,-74.0527173663353,-74.0527941648545,-74.0528715384339,-74.0529103829463,-74.0530228833831,-74.0530972472875,-74.0543411861936,-74.0543115048126,-74.0543364457311,-74.0544742233395,-74.0568113991338,-74.057193699047,-74.0597269064316,-74.0597473475941,-74.0596412066208,-74.0596625576619,-74.0597666068769,-74.0598450591735,-74.0605535370299,-74.0613377810323,-74.0621527443259,-74.0638870919133,-74.0650333235623,-74.0650330963393,-74.0645418613377,-74.0645875231509,-74.0647061559093,-74.0647783303304,-74.0659379710003,-74.0672227681694,-74.0693350335563,-74.0695143523075,-74.0698079102669,-74.0702115428941,-74.0709631018205,-74.0714483766154,-74.0714918058715,-74.070595337333,-74.0706578160373,-74.0714667093301,-74.0717763843113,-74.0733538959079,-74.0738332107328,-74.0748926415476,-74.0749941307351,-74.0750828819262,-74.0753841695345,-74.0757981960669,-74.0752345361796,-74.0753462264826,-74.0760159704387,-74.0761100804478,-74.0762049932403,-74.0762467639061,-74.0762603708992,-74.0762894240906,-74.0763384548357,-74.0763666041997,-74.0763992839858,-74.0764083478006,-74.07639844893,-74.0763047043055,-74.0762901524249,-74.0762974108436,-74.0763146736372,-74.0764274802261,-74.0764646711526,-74.076492830773,-74.0765164306115,-74.076539113168,-74.0765545262062,-74.0765835626775,-74.0766218356954,-74.0767227386614,-74.0768822647208,-74.0769155296231,-74.0767374768266,-74.076748373651,-74.0768978744567,-74.076938815287,-74.0773747252249,-74.0783016922284,-74.078774128947,-74.0792632125691,-74.0786793393897,-74.0787518531636,-74.0793364053826,-74.0801786750796,-74.0805028914757,-74.0809068328306,-74.0813377078457,-74.0817372535144,-74.0823068274826,-74.0825918520404,-74.0830062080614,-74.08359916127,-74.0846907599149,-74.0859529738592,-74.0865485876068,-74.0869126371913,-74.0861924436644,-74.0862163222426,-74.0872507831611,-74.0873467227257,-74.0875636244047,-74.0879298186953,-74.0883569984764,-74.0885230098563,-74.0892029510326,-74.089140459541,-74.0892490614104,-74.0899825993291,-74.0905496010633,-74.0909990546711,-74.0912380776219,-74.094049684098,-74.0939964366199,-74.0940707110943,-74.0951106336129,-74.0952414529292,-74.0954237186223,-74.0956830428006,-74.0956633199685,-74.0956719806137,-74.0957119199914,-74.0957614107352,-74.0958232182742,-74.0958868775111,-74.0961184720136,-74.0962920220187,-74.0966136227229,-74.0968703678043,-74.0969819949764,-74.0970248329552,-74.0970884436629,-74.0971549591162,-74.0972342082292,-74.0973073289338,-74.0974196957031,-74.0975982484042,-74.0978880797072,-74.0979639297641,-74.09797864218,-74.097993486968,-74.0980443164458,-74.0981203427894,-74.09819767262,-74.0982726569842,-74.0982903082378,-74.0982215482987,-74.0980868632023,-74.0979990225766,-74.0978323030348,-74.0977966531796,-74.0978212708991,-74.0978481605417,-74.097931727151,-74.0986220479275,-74.0986587046811,-74.0987061708381,-74.098764154809,-74.0988326287909,-74.0989258121879,-74.0990954789976,-74.0993277036147,-74.0992959381379,-74.0993803143274,-74.0998692475434,-74.1000954923222,-74.100212259153,-74.1007996399401,-74.1012435413987,-74.1016020305263,-74.1018463767478,-74.101840329649,-74.1013747759571,-74.1013459379665,-74.1013542327051,-74.1014051691083,-74.1014744070096,-74.1026507642614,-74.1030983917743,-74.1038579545435,-74.1046594355729,-74.1050890794746,-74.1048624956166,-74.1048444770231,-74.1049146375917,-74.1050947056397,-74.1060364393664,-74.1064282206517,-74.1064335898292,-74.1064087668843,-74.1064007672846,-74.1064125639783,-74.1064815087813,-74.1065636103537,-74.1066768189853,-74.1070473851548,-74.1073483128373,-74.1076862346398,-74.1085392252843,-74.1087579352307,-74.1089361327878,-74.1090075387378,-74.1092262778655,-74.1098480743019,-74.1102845738754,-74.1109767821218,-74.1112032620188,-74.1116674263359,-74.1127884695798,-74.1129161990336,-74.1130104610455,-74.1133834061628,-74.1134079119562,-74.1134384239258,-74.1135950656281,-74.1137484150788,-74.1138735453275,-74.1147378116536,-74.1149717566118,-74.1152305895161,-74.1152678421862,-74.1153109032001,-74.1153585189978,-74.1154093034278,-74.1154617780993,-74.115514415418,-74.1155656830549,-74.1156140885528,-74.1156528043083,-74.115698152341,-74.115749710695,-74.1158069996233,-74.1158694860522,-74.1159365885406,-74.1160076826915,-74.1160800474892,-74.1161554988765,-74.1162330925448,-74.1163118573723,-74.1163908075783,-74.1164689550621,-74.1165453217698,-74.1167636189857,-74.1169770666739,-74.117079649248,-74.1171874298839,-74.117299889457,-74.1174164863107,-74.117536658865,-74.1176598283213,-74.1177854014493,-74.117912773444,-74.118041330838,-74.1181708779647,-74.1182950050444,-74.118413494035,-74.1185261368023,-74.1186327354855,-74.1187331028451,-74.1188270625911,-74.1189144496929,-74.1189928785093,-74.1190770699964,-74.1191669180862,-74.1192623095882,-74.1193444208015,-74.1194300952744,-74.1194869084314,-74.1195505610797,-74.1196206288041,-74.1196966444211,-74.1197781010942,-74.1198644557132,-74.1199551325148,-74.1200495269217,-74.1201470095731,-74.1202469305204,-74.1203486235601,-74.1204073778078,-74.1204675482712,-74.1205284404594,-74.1205959505124,-74.1206625259271,-74.1207954278591,-74.1209298147348,-74.1210650408826,-74.1212004565978,-74.1213354112649,-74.1214692564836,-74.1216013491856,-74.1217310547238,-74.121857749923,-74.121980826074,-74.1220996918588,-74.1222137761916,-74.1224996009537,-74.1242444971278,-74.1257509454355,-74.1263818513108,-74.1276243414018,-74.1307118427267,-74.1335644349814,-74.1352754862327,-74.1361884899335,-74.1369079907635,-74.1372850425187,-74.1374379727972,-74.1379337688175,-74.1380402897971,-74.1381463548002,-74.1382514070966,-74.1383548952711,-74.1384562761173,-74.1385550174882,-74.1386506010897,-74.1387425252003,-74.1388303073045,-74.1388833730034,-74.138928919264,-74.1389666636111,-74.1389963719493,-74.1390178600161,-74.1390309945242,-74.13903569399,-74.1390319292386,-74.1390197235863,-74.1389991526961,-74.1389966666598,-74.1390022872488,-74.1390160000653,-74.1390377699172,-74.1390675409092,-74.1391052365849,-74.1391507601238,-74.1392039945887,-74.1402701526959,-74.1406109270312,-74.1406238382893,-74.1406278066378,-74.1406228178536,-74.1406088897137,-74.1405860719319,-74.1405544459818,-74.1405141248066,-74.1405021832715,-74.1404815886567,-74.1404524818392,-74.1404150619378,-74.1403695849519,-74.1403163620103,-74.140255757243,-74.1402053605615,-74.1401522533198,-74.1400972809172,-74.1400413184454,-74.1399852567577,-74.1394815427789,-74.1392756315129,-74.1390678845277,-74.1388585879603,-74.1386480300806,-74.1384365008948,-74.1382242917461,-74.1380116949138,-74.1357676137532,-74.1352964320491,-74.1348260325008,-74.1344635867357,-74.1341001749099,-74.1339531324463,-74.1338100515441,-74.1336711693828,-74.1335367161845,-74.1334069148327,-74.1332738365539,-74.1331468311923,-74.1330261157129,-74.133012076688,-74.1329712040365,-74.1329426645362,-74.1311954575527,-74.1311646637856,-74.1308662528681,-74.1288160460006,-74.1287873750151,-74.1286137155024,-74.1284466730707,-74.1282864556917,-74.1281332628455,-74.1279872852722,-74.1278870267627,-74.1277943422538,-74.1277093796158,-74.1276322744064,-74.1275631496541,-74.1275021156617,-74.1274610552823,-74.1274290323374,-74.1274061294096,-74.1273924055795,-74.1273878962725,-74.1273926131672,-74.1274065441646,-74.1274432181896,-74.1274879728643,-74.1275407450563,-74.127601460311,-74.1276700329568,-74.1277000134189,-74.1277314342736,-74.1275576058033,-74.1275666076284,-74.1276299410406,-74.1276389685455,-74.1278189344656,-74.1279480805328,-74.1280850507657,-74.128229721227,-74.1283819610043,-74.1285416323289,-74.1287085907003,-74.1288601030668,-74.1290186463994,-74.129184067473,-74.1293562064094,-74.129448145884,-74.1295459161038,-74.1296492957185,-74.1297580506741,-74.1298719347429,-74.1299906900807,-74.1301140478106,-74.1302605297997,-74.1304116641799,-74.130567116047,-74.130726540926,-74.1308895855342,-74.1311069007707,-74.1313271958808,-74.1315502618896,-74.1317758871917,-74.1320038577519,-74.1325781604283,-74.1327457180815,-74.132915370908,-74.1330866436588,-74.1332590565453,-74.1334321265843,-74.1334699331887,-74.1336426228829,-74.1338217709399,-74.1340003735723,-74.1341782033031,-74.13435503364,-74.1345306393643,-74.1347563447711,-74.1349804552258,-74.1352027784352,-74.1354231236407,-74.1356413017825,-74.1358571256614,-74.1369599246983,-74.1371118563389,-74.1374574353012,-74.1382019389324,-74.138607417331,-74.1386526590918,-74.1384119372381,-74.1376973159297,-74.1373898816613,-74.1360734337128,-74.1352807604433,-74.1345586822585,-74.1331682599924,-74.1317782811874,-74.1310866524171,-74.1304245963892,-74.1297560235694,-74.1289614164244,-74.128116971999,-74.1273005782192,-74.1272522789842,-74.1257267505036,-74.124020471276,-74.1238003156366,-74.1226989576037,-74.1207628817176,-74.1194585929116,-74.1196085410251,-74.1195748044552,-74.1183416929299,-74.1167626888337,-74.1167163144766,-74.1165629005628,-74.1149690458863,-74.1144180206408,-74.1142159849182,-74.113684352106,-74.1125256900003,-74.1120559474584,-74.1116526818833,-74.1099579851235,-74.109846583999,-74.1095362958096,-74.108910797,-74.1064492029203,-74.105726964432,-74.1027890436984,-74.1018921804773,-74.1017373268587,-74.1015227350791,-74.1012385736843,-74.1008081517748,-74.1007127169145,-74.1002705391573,-74.0999637517971,-74.099643467734,-74.0993511497426,-74.0990498808949,-74.0988854901243,-74.0988205963189,-74.0985353612661,-74.0982572108537,-74.0979713491121,-74.0976300813006,-74.0989520165496,-74.1000228097541,-74.1007865099782,-74.1015496156722,-74.1020893826292,-74.1030703666264,-74.1038698555966,-74.1046693161401,-74.1054729455723,-74.1066043939317,-74.1066215258488,-74.1062441446606,-74.1061612134433,-74.1060714918527,-74.1059752618094,-74.1058728256901,-74.1057645053775,-74.105650641249,-74.105531591107,-74.1054077290547,-74.1052727266234,-74.1051336365711,-74.1049908778003,-74.1048448802657,-74.1046960836793,-74.1045449361854,-74.1043918930113,-74.1042374150949,-74.1040819676967,-74.1039260189981,-74.1039162653103,-74.1030623502508,-74.1048925340597,-74.1052429037728,-74.1047097914178,-74.1042693696863,-74.1035224424516,-74.1027719714833,-74.1020293093996,-74.1012715078008,-74.100540513185,-74.0997875664952,-74.0990495449778,-74.0983201493462,-74.0975663500422,-74.0968216684653,-74.0960885193106,-74.0953463096093,-74.094605968253,-74.0938729485011,-74.0927705822398,-74.0927507430531,-74.0920445158073,-74.0910709118548,-74.0902776030581,-74.089706213169,-74.0894625259192,-74.0894603771765,-74.0894176459207,-74.0891785702706,-74.0888140769824,-74.088766266508,-74.0887195034333,-74.0885344761313,-74.0883388800727,-74.0881335529947,-74.0879193916578,-74.0877817102823,-74.087697375959,-74.0858020348512,-74.0854585227023,-74.0848880868417,-74.0842588883333,-74.0837683881891,-74.0833421756386,-74.0829075260775,-74.0824393056807,-74.0817159143092,-74.0807895390109,-74.0803630521683,-74.079947275494,-74.0795429885944,-74.0791509238097,-74.0778714792686,-74.0778023740842,-74.077726921944,-74.0767304009693,-74.0752516172839,-74.0747511641769,-74.0746968511872,-74.0741241000606,-74.0736450889696,-74.0735337984666,-74.0729264086931,-74.0727527782497,-74.0725659217358,-74.0723667002151,-74.0721560935358,-74.0719351994526,-74.0717574744879,-74.0715929326755,-74.0714436987433,-74.0713115058186,-74.0711977234038,-74.0702116931775,-74.0699757532453,-74.0697632175143,-74.0695335598975,-74.0692873830133,-74.0690253902049,-74.0687483925866,-74.0666737077574,-74.0666255950235,-74.0665617301802,-74.0657763656931,-74.0653380118304,-74.0644478548609,-74.0641789596957,-74.0633605055731,-74.0631641537116,-74.0631008501731,-74.0630452578556,-74.063044997929,-74.0630447619832,-74.0629141293707,-74.0629139874503,-74.0629138457672,-74.0627937886333,-74.0627936469587,-74.0627935288087,-74.0626884036215,-74.0626882494532,-74.0626881084882,-74.0626009358209,-74.0618181575796,-74.0615077639733,-74.0605601754054,-74.0617388295381,-74.0620555868396,-74.0624820031818,-74.0628960002703,-74.0632995364789,-74.0635794712449,-74.0636262262527,-74.0637593335814,-74.0628407291809,-74.0620634236495,-74.0619200267061,-74.0612897002948,-74.0610841405996,-74.0619561793393,-74.062067039671,-74.0620926651399,-74.0621249908936,-74.0626077283667,-74.0635056566019,-74.0640480244343,-74.0641494698955,-74.0643006056805,-74.0646841079542,-74.0651709125078,-74.0604642972133,-74.0578935087154,-74.0567718170307,-74.0567493483024,-74.0566599991888,-74.0564956593677,-74.0564069328712,-74.0560104141092,-74.0555212612237],"lat":[40.6064828925687,40.6064824910407,40.6064942235224,40.6065388900787,40.6064907673493,40.6064745668341,40.606402335425,40.6063655468005,40.6063290458977,40.6063053617165,40.6062654204526,40.6059127188527,40.6056045815722,40.6052388099204,40.6051883438246,40.6049347204137,40.6045302744549,40.6043614229124,40.6042769314214,40.604148103838,40.6040047859051,40.6037616885517,40.6036964668285,40.603633557567,40.6020597931997,40.601975984476,40.6018899644888,40.6018021221635,40.6017128546629,40.6016225655922,40.6015316631736,40.6014664706998,40.60140116361,40.6013364030086,40.6012728444661,40.6012111313827,40.6010105882417,40.6008686176556,40.6006987925616,40.6005160710412,40.6002811561914,40.6000607130959,40.5998694989236,40.5998511674101,40.5998238835937,40.5997761023036,40.5997480141526,40.5997349403435,40.5997204405266,40.5997149053204,40.5997187829206,40.5997281540149,40.5997368430716,40.5998145753707,40.5998544724489,40.5998734646549,40.5998672554671,40.5998454653314,40.5997786835973,40.5997310676282,40.5988191753366,40.5987775057602,40.5987604455301,40.5987555400511,40.5967269235442,40.5963950793146,40.5939082167124,40.5938486110647,40.5937093883927,40.5937031757104,40.5938352580128,40.5937805324438,40.5933797554232,40.5927154190646,40.5920250410446,40.590207466209,40.5889909983679,40.5889093141956,40.5884339923943,40.5884031574157,40.5884725468392,40.5884883112283,40.5876060982982,40.5867344497601,40.5847765206549,40.5845855173721,40.584304042217,40.583981357209,40.5831819904026,40.5824340679641,40.5821687826521,40.5816905434251,40.5816256250374,40.5820272438981,40.5818765346615,40.580678939139,40.5802772282298,40.5793174361778,40.5792365574164,40.5791601587556,40.5788038528111,40.5783092511528,40.5779988032532,40.5778879690688,40.5782449127924,40.5781738621852,40.5781266133983,40.5781044158286,40.5780850087185,40.5780655925234,40.5780364627521,40.5780212027085,40.5779948555551,40.5779754514483,40.5779697740889,40.5779200966997,40.5779076368044,40.577898625093,40.5778986136271,40.5779501196462,40.5779670999859,40.5779608461254,40.5779400473639,40.5779116279543,40.5778825204823,40.5778492483568,40.5778185359467,40.5777305454108,40.577636789409,40.5775795000122,40.5773725093251,40.577366959163,40.5775163082902,40.5775343450888,40.5772821589056,40.5764647186576,40.5760108222456,40.5756712922057,40.575081825726,40.5750421261398,40.5756272040169,40.575180418259,40.5749804592133,40.5746898047516,40.5743199893063,40.5739385785235,40.5734225036062,40.5731495159021,40.5727855700491,40.5723714758727,40.5714779144424,40.5702982271043,40.5696323191351,40.5689858426831,40.5685646205922,40.5685326981471,40.5690816781929,40.5690218919986,40.5688504481773,40.5685932869362,40.5682667075909,40.568070329934,40.5671740367102,40.5671334741721,40.5670155705342,40.5673800120357,40.5670835972113,40.5667371296002,40.5665066132282,40.5629816481137,40.5628060596506,40.5627316194612,40.5631732734346,40.5631483870408,40.5631546355681,40.5629193977932,40.5628193176725,40.5627755982454,40.5627508694013,40.5627321195933,40.5627222734153,40.5627249168487,40.5625875744896,40.5624208307733,40.56208714604,40.5617179721501,40.5614762166698,40.561336438997,40.5612545680281,40.561188308012,40.5611195867187,40.56101581109,40.5608836477063,40.5606129255359,40.5601694267306,40.5600365500867,40.5599930136152,40.559967105358,40.5599131654458,40.559892952543,40.5598364773072,40.5595488092975,40.5593326146595,40.5592835820384,40.5592027433582,40.5591857066741,40.5591204543609,40.5590872427753,40.5590534662172,40.5590336690911,40.559041463394,40.5593879818598,40.5594075609212,40.5594236014976,40.5594235516509,40.5593873089778,40.5593500568923,40.5592587906303,40.5590974137302,40.5590049724136,40.5589641933612,40.5590935010381,40.5589534456225,40.558871151631,40.5583218211153,40.5576608313156,40.5568034587189,40.5562169892826,40.5559446392413,40.5556923721067,40.5556256772573,40.5555832999435,40.5555385261645,40.5555336109971,40.5561344047847,40.5559046414506,40.5551181601014,40.5541204673107,40.5532354680107,40.5530800185093,40.5530258150583,40.5530162671125,40.553129028392,40.5536405673812,40.5538533736213,40.5539696706259,40.5540238981148,40.554061346965,40.5541082755844,40.5541568278698,40.5541869275486,40.5541878611327,40.554195451044,40.5541481525338,40.553976670975,40.5532580256727,40.5530464128464,40.5528871558056,40.5528249044379,40.5526061793686,40.5519452845806,40.5514963574176,40.5505123776852,40.5501904287459,40.5495151789242,40.5478842627243,40.5478176517204,40.5477800659327,40.5480733751507,40.5480697091834,40.5480651435049,40.548041704494,40.5480187580534,40.5480914774486,40.5479966111792,40.54789475161,40.5475994973531,40.5475710006699,40.5475477496438,40.5475304211385,40.5475195196059,40.5475153624014,40.5475180705458,40.547527565202,40.5475435699703,40.5475975045646,40.5476483426737,40.5476956112412,40.5477388704249,40.5477777176897,40.5478117915537,40.547840774952,40.5478649468367,40.5478828016376,40.5478941158932,40.547898748,40.547896639985,40.547887818231,40.5478723931466,40.5477520317731,40.5476267117366,40.5475668244565,40.5475125089045,40.547464026685,40.5474216113066,40.5473854670569,40.5473557680196,40.5473326572355,40.5473162460141,40.5473066133972,40.5472100216936,40.5471093737562,40.5470048464037,40.5468966232694,40.5467848944784,40.5466698563135,40.5465517108705,40.5464306657025,40.546305714034,40.5461829640001,40.5460625702009,40.5459446842679,40.5458501751459,40.5457575250083,40.5456918032889,40.5456298365897,40.5455720380667,40.5455187930841,40.5454704566452,40.5454273510252,40.5453897636235,40.545357945047,40.5453321074397,40.5453124230686,40.5452990231752,40.5452865414492,40.5452789400787,40.5452763067991,40.5452792308395,40.5452882574662,40.5453081255108,40.5453209226774,40.5453265874811,40.5453250927048,40.5453164455302,40.5453006875036,40.5452778943354,40.545248175537,40.5452116738943,40.5451685647817,40.5451190553189,40.5450633833761,40.5448581072105,40.5431103809108,40.5413054249478,40.5405207554593,40.5387179535597,40.5345350754362,40.5315111753082,40.5302857284368,40.5296207966873,40.5292819188827,40.5297404679849,40.5296758640466,40.5296681604375,40.5296700196492,40.5296777587688,40.5296913371738,40.529710683592,40.5297356964748,40.5297662445304,40.5298021674132,40.5298432765647,40.5298893562035,40.5299606760228,40.5300349608169,40.5301117499173,40.5301905671236,40.5302709236567,40.5303523211898,40.5304342549382,40.5305162167904,40.5305976984586,40.5306781946312,40.5308002101061,40.5309221649419,40.5310437457708,40.5311646401843,40.531284537536,40.53140312974,40.5315201120622,40.531635183904,40.5333000171959,40.5341306001902,40.5342445137056,40.5343588122774,40.5344730875703,40.5345869313297,40.534699936841,40.534811700382,40.5349218226655,40.5350020835476,40.5350813168788,40.5351589805483,40.5352345431831,40.5353074877836,40.5353773152612,40.5354435478532,40.53546240211,40.5354762646581,40.5354849148231,40.5354882149053,40.5354861123713,40.535363543072,40.5353228803694,40.5352880752985,40.535259175797,40.535236221669,40.5352192445294,40.5352082677613,40.5352033064831,40.5352322483374,40.535262799037,40.5352997067848,40.5353981449349,40.5354944886022,40.5355664606021,40.5356429396112,40.5357237988606,40.5358089043206,40.5358981149225,40.5360081524927,40.5361222914878,40.5362403369511,40.5362560650429,40.5362946885775,40.536322033082,40.5378724087738,40.5379001358684,40.5381644150861,40.5399857428992,40.5399630804139,40.5401038550403,40.5402492157188,40.5403989815102,40.5405529659905,40.5407109774831,40.5408541681175,40.5410002985792,40.5411491358085,40.5413004424272,40.5414539771167,40.5416094950037,40.5417445566482,40.5418810339517,40.5420185751953,40.5421568259161,40.5422954298203,40.5424340297022,40.5425722683638,40.5427368780823,40.5429003204873,40.5430623648054,40.5432227822358,40.543381346273,40.5433741215352,40.5434230848037,40.5434803547261,40.5434993339345,40.5436088936174,40.5436281905961,40.5435643996446,40.5437642710654,40.5439610880129,40.5441546722988,40.5443448486603,40.5445314449184,40.5447142921338,40.5448886058213,40.5450592419686,40.5452260356062,40.5453888254781,40.5454839964805,40.5455757233917,40.5456637985214,40.545748022447,40.545828204465,40.5459041630234,40.5459757261324,40.5460537679618,40.5461264646265,40.5461936550282,40.5462551902705,40.5463109339884,40.5463872962171,40.5464585170965,40.5465245290628,40.5465852694934,40.5466406807661,40.5467540260768,40.5467876170829,40.5468143984293,40.5468342950929,40.5468472513368,40.5468532308665,40.5468551637852,40.5468549629364,40.5468457419316,40.5468316505634,40.5468127067794,40.5467889347073,40.5467603646244,40.5467213480946,40.5466773056303,40.5466282750217,40.5465742983391,40.5465154218966,40.5464516962123,40.5469804431863,40.5470234823076,40.5473096046666,40.5480317959159,40.5484414795959,40.5484858167766,40.5486918314848,40.5493835464295,40.5495923695195,40.5504333007767,40.5508632389527,40.5512550782035,40.5523561791593,40.5534899710139,40.5539737593305,40.5544370425603,40.5550326257449,40.5557698719063,40.5565344367978,40.5572951724478,40.5572654909115,40.5563280570063,40.5552308277777,40.5550846581718,40.5543585024633,40.5530819500847,40.5522219060446,40.5517865892298,40.5516307519132,40.5504596952959,40.5489913911023,40.5490230404453,40.549127741725,40.550215477254,40.5505305226699,40.5506455113435,40.550948085111,40.5498584511809,40.550148394863,40.550376512558,40.5525130226466,40.5524646516058,40.5528108407792,40.5534236290893,40.5552880458486,40.5561875166401,40.5586914631006,40.5597200764875,40.5599055783561,40.5601514945116,40.5604680011701,40.5609420476326,40.5610493425846,40.5615464656662,40.5618845559932,40.562249060569,40.5625714143414,40.5629033648193,40.5630870199658,40.5631595190582,40.5634779466084,40.5637901625775,40.5641118321154,40.5644821710468,40.5651239930237,40.5656434882968,40.5660148190989,40.5663858570257,40.5666484041572,40.5671228251282,40.5675006495187,40.567877127458,40.5682553426664,40.5687782687683,40.5689150672086,40.5693419105715,40.5694360911413,40.5695265800072,40.5696130928106,40.5696953576866,40.5697731161182,40.5698461237492,40.5699141511519,40.5699769845483,40.5700366292767,40.5700905366114,40.5701385441942,40.5701805074356,40.57021629995,40.570245813937,40.5702689605055,40.5702856699422,40.570295891921,40.570299595655,40.5708942937548,40.571924855219,40.5729151645648,40.573094039891,40.5740059394047,40.5738112682864,40.5734282841132,40.573046622403,40.5726616791725,40.5722784655153,40.5718819128259,40.5715038446983,40.5711107821095,40.5707315307686,40.5703424444386,40.5699477987303,40.5695603057981,40.569181388867,40.5687896237727,40.5684089429083,40.5679434106031,40.5680960483853,40.5688923387405,40.5699291958546,40.5707810161172,40.5713629872354,40.5716093452059,40.5716802983745,40.5717207835254,40.5719472890497,40.5723249465657,40.5723744850151,40.5724122347462,40.5725585065765,40.5726972199249,40.5728277202268,40.5729494451845,40.5730191736173,40.5730618845432,40.5741347150593,40.5743291781514,40.5746781759357,40.5750445770901,40.5753317975795,40.5755796615393,40.5758353027021,40.5761079397351,40.5765203918729,40.5770485655325,40.5772823169445,40.5775274330632,40.5777834800652,40.5780499732385,40.579189758485,40.5792502129355,40.5793173431667,40.5802039500301,40.5815195671638,40.582066980334,40.5821263867667,40.582723652505,40.5831951509086,40.5833109123411,40.5838877063468,40.5840615278771,40.5842279009276,40.5843859602722,40.584534930743,40.5846741280705,40.5847904069636,40.5849189520807,40.5850583827193,40.5852070513839,40.5853631101048,40.5865666142673,40.5868494771359,40.5871461449712,40.5874358677838,40.5877177928864,40.5879911110863,40.588255067406,40.5902947235609,40.590342019704,40.5903962231406,40.5910628098845,40.5914348591443,40.5921394185354,40.5923414485486,40.5929065569067,40.5933138094327,40.5932926098742,40.5933057973005,40.5933058606016,40.5933059513644,40.5933545794811,40.5933546328331,40.5933547047808,40.5934184640786,40.5934185454077,40.5934186366082,40.5934952202106,40.5934953372301,40.5934954723356,40.5935819063333,40.5941894178399,40.5943675906145,40.5949115147772,40.5964112311185,40.5968490112399,40.5973476524014,40.5978622277705,40.5983636065895,40.5986967716816,40.5987524157589,40.5989348595219,40.5992375997249,40.5994947946257,40.5995422411895,40.5997489746976,40.5998163931775,40.6012364554469,40.6015601477326,40.6016907451458,40.601855487904,40.601945577091,40.6021500548305,40.6024493024955,40.6027192027059,40.6030952955355,40.6035880441716,40.6042135088463,40.6064058245662,40.6074527233981,40.6078995395851,40.6077987573359,40.6075559308757,40.6072476482562,40.6071887375237,40.6067805666346,40.6064828925687]}]],[[{"lng":[-73.8678979862884,-73.8679553251872,-73.8679962677433,-73.8680426074236,-73.8680942581114,-73.8681511222353,-73.8682027030534,-73.8683086756137,-73.8684768566971,-73.8686500222093,-73.8688280912266,-73.8690109812061,-73.8691598803034,-73.8693127051372,-73.8694693710232,-73.8696297911571,-73.8697938766479,-73.8699615365774,-73.8702485562774,-73.8705411987981,-73.8708392961776,-73.8711426773445,-73.8714435298809,-73.8717491024744,-73.8720592092481,-73.8723736614543,-73.8726922679372,-73.8730148349032,-73.8731948906925,-73.8733732478293,-73.873549843678,-73.873724615943,-73.8739296431274,-73.8741305471525,-73.8743271367095,-73.8745192248422,-73.8747066283928,-73.8748891689179,-73.8750570396693,-73.8752197967313,-73.8753772774422,-73.8755293241256,-73.8756757851077,-73.8758165140247,-73.8759299292354,-73.876039459094,-73.8761450371111,-73.8762465989224,-73.8763440831593,-73.8764374306502,-73.876546875531,-73.8766495902652,-73.8767454811955,-73.8768344608922,-73.8769164481618,-73.8769913683885,-73.8770591532808,-73.877119741058,-73.8795724553702,-73.8800421305908,-73.8801439537609,-73.8801587112667,-73.8801779396049,-73.8802022690034,-73.8802501798871,-73.8803540727151,-73.8803974787197,-73.8804183333439,-73.8804159341632,-73.8803900369338,-73.880340936251,-73.8802693992656,-73.8801766806027,-73.8791894189227,-73.8781889161654,-73.8781545932278,-73.8780512821261,-73.8780012488109,-73.878004801122,-73.8780162797768,-73.8780356242649,-73.8781312919031,-73.8781494463452,-73.8787604168712,-73.8793628325953,-73.8799579875278,-73.8812442254155,-73.8820862367445,-73.8827483336087,-73.8831908876937,-73.8833421350919,-73.8833423486773,-73.8833425867325,-73.8835076415373,-73.8835078795922,-73.8835081045761,-73.8836832738419,-73.8836833685652,-73.8836834756176,-73.8838635811526,-73.8838637475968,-73.8838639140083,-73.8840432857114,-73.8840434159229,-73.8840435344224,-73.8842167148987,-73.8842168342661,-73.8842169644318,-73.8843788790354,-73.88437905751,-73.8843792231517,-73.884526151592,-73.8851649583431,-73.8866241303956,-73.886834866747,-73.8869288973406,-73.8870514260234,-73.8875861260884,-73.8877477344924,-73.8884015720717,-73.8888964224737,-73.889847018932,-73.8908054398087,-73.8917661791393,-73.8928864458674,-73.8929164370079,-73.8945343134316,-73.8946794895308,-73.8950827065964,-73.8959567495941,-73.8965206906546,-73.8966154655592,-73.896682430808,-73.8968817842862,-73.8971564543338,-73.8973833610236,-73.8989257182505,-73.8997258855994,-73.8997825214195,-73.8997112766292,-73.8996206531463,-73.8993642685063,-73.8992249910406,-73.8982721693128,-73.8978788753162,-73.8977666909259,-73.8976960116153,-73.8975635771188,-73.89731936279,-73.8972811252072,-73.897057634523,-73.8967579007494,-73.896431707833,-73.8967074708932,-73.896994928605,-73.8970914908083,-73.8971571716543,-73.8971394732915,-73.8970732920871,-73.8970465142028,-73.8970336369263,-73.8970289508559,-73.8969705424814,-73.8968784456836,-73.8966100226111,-73.896408958026,-73.8963578603773,-73.8964113354937,-73.8964350345664,-73.896492293823,-73.8965465329252,-73.8965646453232,-73.8965958378131,-73.896606136735,-73.8966306858501,-73.8966306864356,-73.8966333386324,-73.8924690662955,-73.886107039908,-73.8860557544588,-73.8859985505397,-73.8856152304181,-73.88480028067,-73.8846959725276,-73.8840540727674,-73.8830325744197,-73.8814809442779,-73.8783616012599,-73.8781677762139,-73.8781119783927,-73.8780718941028,-73.8780367219856,-73.8778655044271,-73.8773681711788,-73.876467149982,-73.875632921197,-73.874830452885,-73.8741605488436,-73.87294860419,-73.8709525195244,-73.8678979862884],"lat":[40.9029401764028,40.902812085638,40.9027168010062,40.9026229502025,40.9025307089621,40.9024402503484,40.9023553827737,40.9022491643954,40.902072434259,40.9018984975693,40.9017274346719,40.9015593257222,40.9014314305281,40.9013062297911,40.9011837928705,40.9010641874455,40.9009474799236,40.9008337349579,40.9006529914398,40.9004775162956,40.900307410286,40.9001427709335,40.8999947124401,40.8998523285878,40.8997157059739,40.8995849277594,40.8994600734117,40.8993412188655,40.8992738044374,40.8992038388346,40.8991313468961,40.8990563539274,40.8989573673885,40.8988536278528,40.8987452341152,40.8986322891719,40.8985149008079,40.8983931808146,40.8982724558971,40.89814776472,40.8980192319232,40.8978869856172,40.8977511583684,40.8976118859462,40.8974933010188,40.8973726316343,40.8972499510673,40.8971253339417,40.8969988558056,40.8968705934597,40.8967027578709,40.8965324907558,40.8963599474535,40.8961852853786,40.8960086642264,40.8958302447916,40.8956501898439,40.8954686636436,40.8952714848418,40.8952222845866,40.8950615902807,40.8949134673607,40.8947204234618,40.8945542272723,40.8942270051642,40.8935174312458,40.8933138145226,40.8931062907469,40.892897043861,40.8926883287953,40.8924824176093,40.8922814994133,40.8920876014835,40.8903070319999,40.8880491810487,40.8879434463563,40.8876252311799,40.887447196229,40.8873371754051,40.8872273922942,40.8871183217562,40.8869127973194,40.8868738073648,40.8860401998614,40.8852182399748,40.8843906289661,40.8827096330056,40.8831322219112,40.8833973868017,40.8832848345123,40.8832265189146,40.883226437882,40.883226374464,40.8831832469685,40.8831831835502,40.8831831475924,40.8831576333284,40.8831576153315,40.8831576154394,40.8831513945959,40.8831513853821,40.8831513949309,40.8831649742397,40.8831649842544,40.8831650019633,40.8831976653223,40.8831976917431,40.8831977280585,40.883247597844,40.8832476517975,40.8832477233281,40.8833121478351,40.8836316116553,40.8842673032099,40.8843420260654,40.884355714854,40.8843495758467,40.884255619663,40.8842876181292,40.8844170751705,40.8845039191596,40.8846857465929,40.8848678434673,40.885049846262,40.8852643063068,40.8853114345968,40.8855940638741,40.8855199415863,40.8856415115047,40.8858283245211,40.8859369891962,40.885955255508,40.8859645908544,40.8859993472759,40.8860448242452,40.8860867717957,40.8863835018048,40.8865148870103,40.886529123508,40.8866387310399,40.8867794872161,40.8872490897004,40.887530803064,40.8894579429989,40.8902761012422,40.8905093897077,40.890681823998,40.8910102454727,40.8916158607094,40.891710684183,40.8921404575288,40.8926454435717,40.8936552799275,40.8958050299172,40.8978787238792,40.8985933177028,40.8993718266773,40.8996194349772,40.9000838913376,40.9002247030685,40.9002786212819,40.900315204249,40.9006111675785,40.9010405801358,40.9022035130852,40.9029611087199,40.9032001315844,40.9045045208209,40.9050929990697,40.9063396529452,40.9075066550445,40.9082858241623,40.9096276596512,40.9102022486224,40.9112988776876,40.9112989271071,40.9114173753489,40.9101676642102,40.9083292712536,40.9083144531044,40.9082971244703,40.9081810248174,40.9079307360831,40.9078987002954,40.907702697388,40.9073336316598,40.9068918567017,40.9060036360062,40.9059555079838,40.9059437605864,40.9059324442065,40.9059286073262,40.905869210358,40.9057116573731,40.9054441177172,40.9052082128174,40.9049437833683,40.9047812832401,40.9044410231716,40.9038502527149,40.9029401764028]}]],[[{"lng":[-73.8572233098447,-73.8590215495895,-73.8599126509161,-73.8600132282501,-73.8604959572286,-73.8605407788258,-73.8605783620238,-73.8606132315635,-73.8608685382499,-73.8609891735391,-73.8609450096383,-73.8608992000733,-73.8608527740765,-73.8608067747311,-73.8607622355334,-73.8607201571733,-73.8604546317086,-73.8603040271179,-73.8602574891922,-73.8602513031117,-73.8602448637658,-73.8602122190236,-73.8601587036747,-73.8597924275074,-73.8597553367327,-73.8594869191347,-73.859410229427,-73.859409890647,-73.8594447402716,-73.8593424080217,-73.8592495587374,-73.8591261328236,-73.8590452922978,-73.8590071538149,-73.8589800291315,-73.858688599342,-73.8585482227649,-73.8583738561172,-73.8580507644599,-73.8579397894111,-73.8578339260733,-73.8577488337395,-73.8575274515629,-73.8573194151551,-73.8573022453536,-73.8571875776634,-73.8570260178516,-73.856958703578,-73.8571116306092,-73.8571471445684,-73.857176020626,-73.8571975333018,-73.8572111421181,-73.8572165051783,-73.8572134877547,-73.8572112957968,-73.8572096947068,-73.8572087304163,-73.8572084305878,-73.8572088038234,-73.8572098394151,-73.8572115076545,-73.8572137606839,-73.8572165338691,-73.8572197476546,-73.8572233098447],"lat":[40.6502786700389,40.6526601758646,40.6538402372784,40.6539734258613,40.654558824478,40.654623996108,40.654675329646,40.6547194707377,40.6550778057373,40.6552097671052,40.655220680013,40.6552264429499,40.6552269264364,40.6552221196096,40.6552121304677,40.655197183443,40.6550671073662,40.6549250027221,40.6548840505041,40.6548786061898,40.6548722545688,40.6548400521315,40.6547936633059,40.6544761573771,40.6541041761898,40.6539323489336,40.6538647374224,40.6538578618105,40.6536375476018,40.6535610669102,40.6532542954285,40.6531729947319,40.653107976084,40.6530040583722,40.6526754578347,40.6524875560957,40.652360790181,40.65218529245,40.6518018686935,40.6516757415765,40.6515581525573,40.6514898816955,40.6513792431127,40.6512370990079,40.6510641045785,40.6508756946087,40.6506937193045,40.6505873739752,40.6505259809426,40.6504961349802,40.6504623900148,40.650425593865,40.6503866710065,40.6503465993456,40.6503063856496,40.650303860942,40.650301090696,40.6502981543831,40.650295136239,40.6502921228468,40.6502892006533,40.6502864534891,40.6502839601636,40.6502817922042,40.6502800118041,40.6502786700389]}],[{"lng":[-73.8303272533706,-73.8303778971818,-73.8304132505903,-73.8304120390573,-73.830400115163,-73.8303580810034,-73.8303305833368,-73.8302660185149,-73.8301902035727,-73.8301257067886,-73.8300032131889,-73.8299259406877,-73.8298891985601,-73.8299455643583,-73.8300430662559,-73.8303272533706],"lat":[40.6551328058033,40.655128335118,40.6551578223363,40.6552158557617,40.6552571439989,40.6553220828877,40.655369872375,40.6554286467848,40.6554788188834,40.6555106108453,40.6555521287071,40.6555422030022,40.6555228225841,40.655424494353,40.6553494225413,40.6551328058033]}],[{"lng":[-73.8011553859722,-73.8011423813821,-73.8011369726162,-73.801134301319,-73.8011323614824,-73.8011600086592,-73.8011790910815,-73.8011995636295,-73.8012155284598,-73.8012340123842,-73.8012616037583,-73.8013428673729,-73.801418975859,-73.8014539825104,-73.8015305266934,-73.8015556533534,-73.801667766912,-73.8016826655336,-73.8017029793769,-73.8018364641517,-73.8020320768996,-73.8021486650281,-73.802995272073,-73.8037752445164,-73.8043205057094,-73.8041369962541,-73.8061016318443,-73.8064743428576,-73.8073717986702,-73.8076878255337,-73.807890716094,-73.808457543926,-73.8096014878295,-73.8114955695234,-73.811557239658,-73.8116204419967,-73.8116838024453,-73.8117346486836,-73.8117859560971,-73.8118364680822,-73.8118849475157,-73.8119302070536,-73.81197113821,-73.8120067385057,-73.8120130283955,-73.8120145889871,-73.8120114016539,-73.8120035042888,-73.8116557422019,-73.8115869511678,-73.81150249147,-73.8114032795879,-73.8112906073771,-73.8111660877966,-73.8117669494147,-73.8122867278519,-73.8128161638551,-73.8133501116201,-73.8138875902702,-73.8144276302692,-73.8149692248572,-73.817917595908,-73.8230521056645,-73.8242605229863,-73.8258439379527,-73.8294871604183,-73.8320321880745,-73.8321184686962,-73.8324776821402,-73.8318573801723,-73.8310777106597,-73.8302937520802,-73.830031319839,-73.8299133575328,-73.8293142021881,-73.8285994240469,-73.8282792561476,-73.8280718116246,-73.8278250750219,-73.827706836014,-73.8275964175787,-73.827478070959,-73.827360789807,-73.8272419261337,-73.8271250997571,-73.827013244635,-73.8268962339085,-73.8272431490016,-73.8289555302084,-73.829271963309,-73.8295969736259,-73.8297565352645,-73.8300103981827,-73.8298694883252,-73.8300117228862,-73.8303814083701,-73.8305312551552,-73.8306991637812,-73.8308197291445,-73.8309365135348,-73.8309944186789,-73.831103562768,-73.8313315140327,-73.8312988663128,-73.831287744717,-73.8313960977567,-73.8315603934254,-73.8315606872412,-73.831592163422,-73.8316131479368,-73.8315832205966,-73.8311820184312,-73.8312016021555,-73.8311318184897,-73.830425167031,-73.8304204789363,-73.8301571958236,-73.8301349868151,-73.8301478542749,-73.8301688540962,-73.8302090599967,-73.8301832066552,-73.8301301265928,-73.8301122668115,-73.8300815506942,-73.8299008001946,-73.8293448924298,-73.8291730685906,-73.8290406635642,-73.8290242898552,-73.8290141755797,-73.8290395009157,-73.829070298979,-73.8291083631228,-73.8291527996165,-73.8291881885571,-73.8292136426253,-73.8293489022466,-73.8293897294641,-73.8294560217537,-73.8294334142134,-73.8296667765213,-73.8298505445562,-73.8300226740885,-73.830023560827,-73.8300651924216,-73.8300860160231,-73.8301503268674,-73.8302001706487,-73.830308055358,-73.8303697749091,-73.8304432807192,-73.8305341162677,-73.8305541099798,-73.830582370173,-73.8305715784614,-73.8305565858942,-73.8305562020811,-73.8305514511539,-73.8305306915187,-73.8305354014107,-73.8305375909055,-73.8305502806031,-73.8305577778013,-73.830569306876,-73.8305583178113,-73.8305560975602,-73.8305688675813,-73.8306024597477,-73.8309784538409,-73.8313573446368,-73.8313435328766,-73.8314475217394,-73.8314691331061,-73.8317081441153,-73.8319529731,-73.8319968847036,-73.8320544513054,-73.8321233098165,-73.8320005287074,-73.832052014315,-73.8321605022974,-73.8321977562753,-73.8322169851857,-73.8321659471106,-73.8320464777308,-73.8319047430317,-73.8318583575191,-73.8316022021337,-73.8315496635671,-73.8314933010301,-73.8314121146682,-73.8313810634856,-73.8313576493811,-73.8313084475245,-73.8311610080975,-73.8311034100904,-73.8309285600347,-73.8308886896376,-73.8308332160637,-73.8307500547715,-73.8306032491923,-73.8304719168043,-73.8304693198169,-73.8304050753494,-73.8303813278389,-73.8303800488346,-73.8303495941264,-73.8302838946952,-73.8302455038411,-73.8302121316101,-73.8300785630865,-73.830087249523,-73.8300878041388,-73.8300718843366,-73.8300551408046,-73.8300330145656,-73.8299852603229,-73.8299273906643,-73.8298889077211,-73.8298448654121,-73.8297995641651,-73.8297117707927,-73.8296582856937,-73.8296089716734,-73.8296056279346,-73.8295528696972,-73.8295541371534,-73.829532333938,-73.8294789300125,-73.8293760341059,-73.8293077520442,-73.8292581972262,-73.829241631575,-73.8292365379905,-73.8292464637477,-73.829258470225,-73.8292606922069,-73.8292595935166,-73.8292672032149,-73.829282046746,-73.8293028747796,-73.8293097469534,-73.8292852571423,-73.8292662361284,-73.829238450417,-73.829205437432,-73.8291580155682,-73.8291348260746,-73.8291153688096,-73.8290999080115,-73.8290859160264,-73.8290592101385,-73.8290302127876,-73.8290043505544,-73.8289828548771,-73.828967787403,-73.8289608408767,-73.8289650827701,-73.828980799956,-73.8290132530184,-73.8290774848865,-73.8291322556383,-73.8291791973457,-73.8292082830465,-73.829257953569,-73.8293238942211,-73.8293876196137,-73.829417622329,-73.8294558972416,-73.8295137509692,-73.8295276562391,-73.8295324144858,-73.8295396402182,-73.8295541464757,-73.8296549949645,-73.8296890823881,-73.8297282031721,-73.8297531466852,-73.8297763896963,-73.829791927876,-73.8298001961994,-73.829822432478,-73.8298640541821,-73.8299171026136,-73.8299303958594,-73.8299313954848,-73.829935716332,-73.829954619396,-73.8299774969859,-73.8300093301949,-73.8300530205078,-73.830094403057,-73.8301180788116,-73.8301302874052,-73.8301306219772,-73.8301234547345,-73.8301136277782,-73.8300758453689,-73.8300506135045,-73.8300229029023,-73.8299889488317,-73.8299550068527,-73.8299167073472,-73.8298827923807,-73.8298530054975,-73.8298131848936,-73.829771694163,-73.8297320793274,-73.8297070683891,-73.8296682515982,-73.8296266773849,-73.8296065278313,-73.8295998690315,-73.8296134315801,-73.8296710398506,-73.8296925320881,-73.8297231849838,-73.8297548637584,-73.8298139921881,-73.8298239376121,-73.8298734791491,-73.8299153679765,-73.8299281928743,-73.8299425594842,-73.8299597282835,-73.8299619242574,-73.829965808183,-73.8299717621831,-73.82999639204,-73.830009970711,-73.8300142688902,-73.8300129082758,-73.830023447344,-73.8300501303299,-73.8300815175368,-73.8301011528758,-73.8301166593848,-73.8301313834006,-73.8301495010476,-73.8301624328173,-73.8301724849563,-73.8301773206411,-73.8301759252158,-73.830166419441,-73.8301537671067,-73.8301406846884,-73.8301336572392,-73.8301243738043,-73.8301155025875,-73.8301093735125,-73.8300978635156,-73.8300733850235,-73.8300689875143,-73.8300341461414,-73.8300278002772,-73.8300216692621,-73.8300121418499,-73.8299472921571,-73.829897165483,-73.8298815258655,-73.8298258946859,-73.8297855130339,-73.8297638699683,-73.8297248146432,-73.8297137337066,-73.8296952008339,-73.8297065289459,-73.8297924026003,-73.8298707219273,-73.8299452754599,-73.8300012075771,-73.8300572136032,-73.8301334698056,-73.8301580575766,-73.8301991065492,-73.8302440680071,-73.8302442703937,-73.8301697604382,-73.830102767811,-73.8300060027402,-73.8299141586122,-73.8298904789936,-73.8298271228172,-73.8297714070234,-73.8297007946754,-73.8296301319762,-73.8295146301451,-73.8294586694703,-73.8293729058294,-73.8292239390286,-73.8291049999112,-73.829064234363,-73.829094348252,-73.8291729074473,-73.82924393205,-73.8293471523731,-73.8294271194847,-73.8294982617395,-73.8294946556542,-73.8294613126142,-73.8294615159303,-73.8295026511984,-73.8295846847763,-73.8296815704028,-73.8297784923666,-73.829891865403,-73.8299015239209,-73.8300096724431,-73.8300917256968,-73.8301850780881,-73.8302411836491,-73.8303272854543,-73.8303908715652,-73.8305053205737,-73.8310667080647,-73.8311054723839,-73.8311423012404,-73.8312098630255,-73.831271125642,-73.8313254491098,-73.8313722659439,-73.8314110870829,-73.8314415069975,-73.8314632079265,-73.8314759631946,-73.8314699336738,-73.8315163883261,-73.8315472294415,-73.831559302535,-73.8315530917718,-73.831614185982,-73.8316872832863,-73.8317531295931,-73.8318523847929,-73.8319167052065,-73.8320072528844,-73.8320641148232,-73.8321285726655,-73.8321818606789,-73.8322411799696,-73.8324846557933,-73.8327535238129,-73.8327673589517,-73.8329030952459,-73.8327819436147,-73.8320849710086,-73.8319439457826,-73.832600363706,-73.8320149170802,-73.8311037371605,-73.8311266442182,-73.8312696749141,-73.8319457671701,-73.8328442835857,-73.8333843947254,-73.8330606995693,-73.832804397168,-73.8325688862534,-73.8323819280704,-73.8321710696902,-73.831974282252,-73.8318330050205,-73.8317056513666,-73.8315668141263,-73.8311871917955,-73.8310888527372,-73.8317960415922,-73.8327190986577,-73.8336384528618,-73.8345606990977,-73.8354713658254,-73.835972234305,-73.8363858007114,-73.8368107681604,-73.8372019248578,-73.8376239181884,-73.8380499820657,-73.8384530672249,-73.8388069039889,-73.8386227280471,-73.838627242939,-73.838734815859,-73.8388370570906,-73.8388507078595,-73.8388946374825,-73.838929251738,-73.8389025881868,-73.8388810542054,-73.8388563211552,-73.8388923948893,-73.8384754191343,-73.8380755563974,-73.8380931086526,-73.8381408144728,-73.8382216766254,-73.8384389733077,-73.838723543631,-73.8396959651554,-73.8396239579199,-73.8399794997561,-73.839725403531,-73.839635114992,-73.8392926818833,-73.8389646298412,-73.8384973955962,-73.8383980383054,-73.8380605840761,-73.8376358235636,-73.8372391352009,-73.8368133457516,-73.8372940791441,-73.8373877877964,-73.836589550425,-73.8363307472129,-73.8364073545599,-73.8376159580897,-73.8381096064441,-73.8386089610291,-73.8390347340008,-73.839312898798,-73.8397046917057,-73.8398022285466,-73.8398979773776,-73.8399911355591,-73.8400809221711,-73.8401665845587,-73.8402474046438,-73.840322704943,-73.8403918542486,-73.8412600544651,-73.8457948406022,-73.8495069901807,-73.8520762847404,-73.8521486157404,-73.8522131572783,-73.8522696911297,-73.8523180261374,-73.8523579988589,-73.8523894741193,-73.8524123454688,-73.8524265355429,-73.8524319963247,-73.8524287093083,-73.8524166855609,-73.8523992616149,-73.8523745309815,-73.8523425750199,-73.8523034988707,-73.8522574311094,-73.8522045233227,-73.8521449496121,-73.8520789060195,-73.8520384660271,-73.8520020581973,-73.8519870498002,-73.8519649517128,-73.8519358943809,-73.8519000493405,-73.8518576282036,-73.8518088814108,-73.8517540967519,-73.851748465221,-73.8517461604044,-73.8517258739812,-73.851697757682,-73.8516730393373,-73.851658390011,-73.8516303084915,-73.8516111941109,-73.8515887121938,-73.8515864377017,-73.8515908913235,-73.8515717997111,-73.8515549863926,-73.8515449128941,-73.8515404206103,-73.8515336867929,-73.8515213251905,-73.8515089638776,-73.8515033532725,-73.8514988656687,-73.8514563036159,-73.8514372318764,-73.8513979282923,-73.8513855669577,-73.8513765735141,-73.8513877343658,-73.8513720216508,-73.8513372511478,-73.8513271986014,-73.8513250249307,-73.8513239446076,-73.8513082877649,-73.8512948518187,-73.8512429702339,-73.8511895581057,-73.8511358605975,-73.851083129526,-73.851032594178,-73.8509854326553,-73.8509427444099,-73.850905524614,-73.8508976017595,-73.850898688717,-73.8509154173802,-73.8509321191295,-73.8509342375028,-73.850927408209,-73.8509115872663,-73.8509036968295,-73.8508879900208,-73.8508823818691,-73.8508790136439,-73.8508621464434,-73.8508307297314,-73.850827317579,-73.8508093154364,-73.8508058631627,-73.8508047027566,-73.8507956292303,-73.8507921397711,-73.8507909668698,-73.8507707816691,-73.8507696594625,-73.8507696556401,-73.8507718539128,-73.8507864083101,-73.8507818599591,-73.8507089708108,-73.8507033666768,-73.850682066897,-73.8506607735166,-73.8506103016636,-73.850596808884,-73.8505809929476,-73.8505853849706,-73.8505853734943,-73.8505999240647,-73.8505886734791,-73.8505762946302,-73.8505750499885,-73.8505872608012,-73.8505938665977,-73.8506060908352,-73.850607086531,-73.8506024787783,-73.8505866563354,-73.8505765359857,-73.8505552079327,-73.8505383729429,-73.8505271491249,-73.8505203896003,-73.8504979903988,-73.8504700272946,-73.8504275107985,-73.8503961526706,-73.8503770834964,-73.8503770490145,-73.8503982732645,-73.8504218051368,-73.8504363098151,-73.8504361891814,-73.8504450863127,-73.8504226101272,-73.8503979092982,-73.8503698265418,-73.8503384037804,-73.8503148248562,-73.8502688342385,-73.8502419023433,-73.8502183121708,-73.8501969246121,-73.8501755472211,-73.8501721729457,-73.8501552962456,-73.8501103731421,-73.8500609679669,-73.8500531136257,-73.8500463815095,-73.8500373928249,-73.8500205333353,-73.8499700059189,-73.8499149744726,-73.8498543445889,-73.8497881217674,-73.8497286297767,-73.8496893831687,-73.8496859879013,-73.8496836744421,-73.8496107867044,-73.8495715205987,-73.849545709434,-73.8495199072339,-73.8494896237204,-73.8494683262287,-73.8494526399356,-73.8494257215643,-73.8493740426053,-73.8493021780029,-73.8492572684081,-73.8492235113803,-73.8492144839441,-73.8492054573344,-73.8492165835728,-73.8492389718614,-73.8492512811913,-73.8492826107579,-73.8492959831814,-73.8493149601344,-73.8493150198728,-73.8493340565691,-73.8493418380898,-73.8493473943191,-73.8493540686591,-73.8493607475185,-73.8493976640632,-73.8494265354144,-73.8494607418717,-73.8494993834858,-73.8495433848653,-73.8495898530683,-73.8496374540811,-73.8499225331628,-73.8499716568271,-73.8500216521742,-73.8500710658326,-73.8501184613399,-73.85024113552,-73.8502900896044,-73.8503426227238,-73.8503960262267,-73.8504491946124,-73.8505010272473,-73.850550451151,-73.8505964432065,-73.8506380513428,-73.8506507064278,-73.8506650641061,-73.8506806922315,-73.8506971204193,-73.850713854204,-73.8507303899229,-73.8507462298741,-73.8507608972973,-73.8507739507234,-73.8507849972619,-73.8508968231504,-73.8510057044508,-73.8511112043475,-73.8512128995933,-73.8513103822068,-73.8514032611105,-73.8514911636992,-73.8517659617138,-73.8517860655937,-73.8518083734584,-73.8518323416379,-73.851857385998,-73.8518828961775,-73.8519083205576,-73.8519329651355,-73.8519562259433,-73.8519775329258,-73.8520213133259,-73.8520630899217,-73.8521016034167,-73.8521356928783,-73.8521643307332,-73.8521866537415,-73.8521970427276,-73.8522276747309,-73.852264451124,-73.8523065884473,-73.8523531890402,-73.8524032601637,-73.852455735148,-73.8525094961157,-73.8525633977956,-73.8526162919181,-73.8526670516778,-73.8528487636856,-73.8530321270977,-73.8532167710734,-73.853402322182,-73.8535884051559,-73.8536101603515,-73.853680489395,-73.8537495605632,-73.8538210536444,-73.8538926809409,-73.8539636799562,-73.8540332948804,-73.8541007846379,-73.8541924891632,-73.8542881458401,-73.8543873486234,-73.854489676413,-73.8545946948411,-73.8547019581168,-73.854788287095,-73.8549108527671,-73.854936004745,-73.8549593954376,-73.8549804001243,-73.8549984578101,-73.8550130862076,-73.855023531767,-73.8550428034632,-73.85507048271,-73.855105968296,-73.8551484894434,-73.8551971225484,-73.8552508112443,-73.8553083893459,-73.8553686061817,-73.8554301537611,-73.8554916951866,-73.8555518936946,-73.8555815862181,-73.8556139177396,-73.8556481446741,-73.8556834798457,-73.8557191105908,-73.8557542174482,-73.8557879930053,-73.8558342102684,-73.8558782271422,-73.8559193294256,-73.8559568502062,-73.8559901806816,-73.8560527795483,-73.8561100599069,-73.8561614859039,-73.8562065764491,-73.8562449097161,-73.8562761270878,-73.8562999365133,-73.8563161152393,-73.8563245118951,-73.8563250479093,-73.8563177182454,-73.8563155754016,-73.8563105368259,-73.8563145811664,-73.8563276393953,-73.8563494885868,-73.8563797557232,-73.8564179240622,-73.8564633419576,-73.8565152339852,-73.8565177643771,-73.8565291786058,-73.8565493691023,-73.8565781455663,-73.8566152367607,-73.8566602930642,-73.85671288977,-73.8567725310861,-73.85683865481,-73.8569106376273,-73.8569567132228,-73.857004896427,-73.8570538834579,-73.8571023487832,-73.8571489809871,-73.8571925182574,-73.8572317825299,-73.857265711365,-73.8572656368121,-73.8572669122461,-73.8572695102135,-73.8572733747954,-73.8572784228099,-73.8572845456027,-73.8572928643504,-73.8573022208871,-73.8573123416295,-73.8573229306489,-73.857333678324,-73.857333821715,-73.85739480831,-73.8574556192318,-73.857515262577,-73.857572765488,-73.857627190022,-73.8576776484503,-73.8577233177397,-73.8578960147709,-73.8581470689611,-73.8582813238382,-73.8583979157458,-73.8585202665814,-73.8585606941667,-73.8585719869021,-73.8586885326703,-73.8587641975346,-73.8587633804155,-73.858758079917,-73.8588572908893,-73.8589249980263,-73.8590032771037,-73.8591549844603,-73.8592655290226,-73.8592777247158,-73.8592944217652,-73.8592775234689,-73.8592977192605,-73.8593083014002,-73.8593273590094,-73.8593581958246,-73.8594178012395,-73.8594848224981,-73.8595081855009,-73.8595731025021,-73.859608185786,-73.8596122371346,-73.8596701793772,-73.8597149870548,-73.8597583811017,-73.8599590652877,-73.8607295220206,-73.8608403069991,-73.8610622300147,-73.8612548660546,-73.8613519324433,-73.8613638195039,-73.8613687513908,-73.861358502096,-73.8613529424475,-73.8613632240649,-73.8613886383943,-73.8614013099616,-73.861401251066,-73.8613922592211,-73.8613603836126,-73.8613045307785,-73.8612370016934,-73.8611742031605,-73.8610877335765,-73.8610156157425,-73.8609888824967,-73.8609597077648,-73.8609308792144,-73.8609086986063,-73.8608648885113,-73.8608311189217,-73.8607879936244,-73.860723044558,-73.8606741458594,-73.8606478405359,-73.860637222368,-73.8606240457877,-73.8606166932969,-73.8606142924694,-73.8606074278591,-73.8606230206867,-73.860615570409,-73.8606030661496,-73.8605812355495,-73.8604949922559,-73.8604576850531,-73.8604428867467,-73.8604400321146,-73.86044847474,-73.8604814321669,-73.8605097108919,-73.8605143464823,-73.8605150388841,-73.8604771130627,-73.8604474248759,-73.860350888227,-73.8603057625893,-73.8602807794779,-73.8602444847006,-73.8602264327206,-73.8602083950094,-73.8601928097566,-73.8601594829451,-73.8601502557075,-73.8601427223578,-73.8601186009138,-73.8601102783192,-73.8600998986866,-73.8600798101341,-73.8600677781952,-73.8600416887145,-73.8600329829865,-73.8600687031598,-73.8600623451106,-73.8600556957444,-73.8600487031046,-73.8600075860233,-73.8599614249595,-73.859930913349,-73.8598814517549,-73.8598457280558,-73.8598336352148,-73.8598459195313,-73.8598858170924,-73.8599341705408,-73.8599624329555,-73.8600001001494,-73.8600081921851,-73.8600233871927,-73.8600544693938,-73.8600692430244,-73.8600749979822,-73.860070689259,-73.8600519436706,-73.8600427563908,-73.8600273065142,-73.8599910170616,-73.8599612824394,-73.8599439747917,-73.8599388282361,-73.859915202642,-73.8598823795487,-73.8598102760968,-73.8598000897788,-73.8597909424718,-73.8598067137594,-73.8599233637409,-73.8599371302826,-73.8599389727953,-73.8599221833128,-73.8598778154744,-73.8598011565704,-73.8597322018688,-73.8597057182864,-73.8596662217731,-73.8596527582745,-73.8596194595523,-73.859592448186,-73.8595720481326,-73.8595585040612,-73.8595519784199,-73.8595551525131,-73.8595651832258,-73.8595820086352,-73.8596055248588,-73.8596355866937,-73.8596791956427,-73.8597275040775,-73.8597799309069,-73.8598358454971,-73.8598945752586,-73.8599652036247,-73.8600352653629,-73.8601039861342,-73.8601358343232,-73.8601681408823,-73.8601999628406,-73.8602303713707,-73.8602584789008,-73.8602873567847,-73.8603105184225,-73.8602702573438,-73.8602334317889,-73.8602005299183,-73.8601976119449,-73.8601955340443,-73.8601943551591,-73.8601941087292,-73.8601948017452,-73.8601964145492,-73.8601989013927,-73.8602021917336,-73.8602061922386,-73.8602107894292,-73.8602158529014,-73.8602212390249,-73.8602267950167,-73.8602323632754,-73.8602952605345,-73.8603544076974,-73.8604087789184,-73.8604195559543,-73.860429523244,-73.860438390331,-73.8604458988195,-73.8604518299056,-73.8604560107522,-73.8604583195259,-73.8604586889478,-73.8604571082532,-73.8604536235055,-73.8604253659693,-73.8604049001925,-73.8603926003612,-73.8604437800774,-73.86045469175,-73.8604656684248,-73.8604764395867,-73.8604867397861,-73.8604963151795,-73.8605049297862,-73.8605123713037,-73.8605184563402,-73.860523034933,-73.8605178542075,-73.8605130816167,-73.8605088466753,-73.8605052643074,-73.8605024317281,-73.860500425806,-73.8604993009753,-73.8604990877612,-73.860499791949,-73.8605013944291,-73.8605120860003,-73.8605246685867,-73.8605388278256,-73.8605542099625,-73.8605704306908,-73.8605767705207,-73.8605821667271,-73.8605864660507,-73.8605895463841,-73.8605963075421,-73.8606036701431,-73.8606114193702,-73.8606193291259,-73.8606271686287,-73.8606347091474,-73.8606417306737,-73.8606480283423,-73.8606534184075,-73.8607199797675,-73.8608232499638,-73.8609244581051,-73.8609407764581,-73.8609558855766,-73.8609693483565,-73.860980775322,-73.8609898358922,-73.8609962679457,-73.8609998854024,-73.8610005836086,-73.8609983423632,-73.860993520295,-73.86098115494,-73.8609615078936,-73.8609349948081,-73.8609021766015,-73.8608910415401,-73.8608828485938,-73.8608778236548,-73.8608773230655,-73.8608737230406,-73.8608671283417,-73.8608577308782,-73.8608458041223,-73.8608316951513,-73.8607724560542,-73.8607162632191,-73.8606640511126,-73.860616688006,-73.8605749615366,-73.8605395656104,-73.8605110888612,-73.8604900048624,-73.8604766642505,-73.8604712888929,-73.860473968198,-73.8604846576261,-73.8605309321605,-73.8605734561431,-73.8606120731121,-73.8606494405175,-73.8606851614936,-73.8607182106939,-73.8607476394658,-73.86077260308,-73.8607923849785,-73.8608064173429,-73.8608140218288,-73.8608172469568,-73.8608160673804,-73.8608166820033,-73.8608210539622,-73.8608290860784,-73.8608405998195,-73.8608553392679,-73.8608729768085,-73.8609480379989,-73.861024875725,-73.8611683597832,-73.8612122437539,-73.8612494339702,-73.8612794319479,-73.8613018356104,-73.861316344677,-73.8613227646881,-73.8613146395542,-73.861309415312,-73.8613028182352,-73.8613001609361,-73.8612988615203,-73.8612896876275,-73.8612728030805,-73.8612485093795,-73.8611331913723,-73.8610198154337,-73.861001934567,-73.8609814450079,-73.8609589209716,-73.8609349936876,-73.8609037508361,-73.8608157203013,-73.8607275364789,-73.8606630860387,-73.860599528113,-73.8605374769887,-73.8605094923605,-73.860474832402,-73.8604340598832,-73.8603878368279,-73.8602078942498,-73.8601783281768,-73.8601461763785,-73.8601122166708,-73.8600772706072,-73.8600421836044,-73.8598940162848,-73.8598352490529,-73.8598249231718,-73.8598143686693,-73.8598038847979,-73.8597937688072,-73.8597843075162,-73.8597757691809,-73.859768395889,-73.8597748765529,-73.8597777544119,-73.859777271966,-73.8597769474741,-73.8597767893437,-73.8597768016729,-73.8597769841418,-73.8597773320223,-73.8597778363008,-73.8597784839102,-73.8597792580703,-73.8597801387212,-73.8597811030446,-73.8597832769264,-73.8597859515817,-73.8597890470933,-73.8597924709688,-73.8597961209037,-73.85979988784,-73.8598036592231,-73.8598073223658,-73.8598107678149,-73.8598138926217,-73.8598166034187,-73.8598188192082,-73.8598204737836,-73.859821517707,-73.8598388800349,-73.8599568546386,-73.8599720412316,-73.8599868371996,-73.860000806047,-73.8600135356789,-73.8600246505587,-73.8600338227871,-73.8600407817753,-73.8600453222274,-73.860047310197,-73.8600436441338,-73.8600404032224,-73.8600376794429,-73.8600355500989,-73.8600340756232,-73.8600332978628,-73.8600332388909,-73.8600339003815,-73.8600352635603,-73.8600372897393,-73.8600399214133,-73.860043083893,-73.8600466874238,-73.8600506297346,-73.860183216439,-73.860195954035,-73.86020644856,-73.8602144200494,-73.8602196558461,-73.8602220162748,-73.8602181625557,-73.860215452976,-73.8602139358177,-73.8602136381153,-73.8602419895309,-73.8602722330012,-73.8603037398306,-73.8603358550621,-73.8603679110911,-73.8603838781945,-73.860397997526,-73.8604100479077,-73.860449717654,-73.8604873410738,-73.8605252694798,-73.860562675294,-73.8605648080438,-73.860566940374,-73.8605690100163,-73.8605709565334,-73.8605727230831,-73.8605742580789,-73.8605755166961,-73.8605764621806,-73.8605770669226,-73.8605773132624,-73.8605771940063,-73.8605767126371,-73.8605758832117,-73.8605747299507,-73.8605289866598,-73.8604852982044,-73.8604444412232,-73.8604071420188,-73.8604053763126,-73.8603868461704,-73.8603594184527,-73.8603236089518,-73.8603102951679,-73.8603163571442,-73.8603416470487,-73.8603503067247,-73.8603737314803,-73.8603945536261,-73.8604157441815,-73.8604367815342,-73.8604571478434,-73.8604763417867,-73.8605326395304,-73.8605879220579,-73.8606093039251,-73.8606197420973,-73.8606101364379,-73.8606237233749,-73.8606580646268,-73.8606628794075,-73.8606642937998,-73.8606622751865,-73.8606603959841,-73.8606591603024,-73.8606586054516,-73.8606587481851,-73.8606595841932,-73.8606610882328,-73.8606632148906,-73.8606658999538,-73.8606690623484,-73.8606726065884,-73.8606764256579,-73.8606804042427,-73.8606844222127,-73.8607026813273,-73.8607205473053,-73.8607375954282,-73.8607534204203,-73.860842649273,-73.8608442617154,-73.8608467822549,-73.860850146214,-73.8608542672731,-73.8608590396853,-73.8608643409899,-73.8608700351547,-73.8608759760671,-73.8608820112825,-73.8608879859368,-73.8612752011856,-73.8614937584788,-73.8616137116361,-73.8616291765528,-73.8616382338067,-73.861640803145,-73.8616368617909,-73.8616264446453,-73.8616170283211,-73.8616165642583,-73.8616250535642,-73.8616424770979,-73.8616687955133,-73.8616693576065,-73.861672136535,-73.8616770552069,-73.8616839771684,-73.861692710391,-73.8617030125971,-73.8617145979824,-73.8617271451438,-73.8626976213909,-73.8626977829953,-73.863170832744,-73.8617475902521,-73.861188754815,-73.8603049456405,-73.8593869184694,-73.8585143639364,-73.8576153725157,-73.8579364091196,-73.8580250429808,-73.8581177926926,-73.8584295085729,-73.8575356334514,-73.8565907511985,-73.8561171020898,-73.8556846115502,-73.8561174022972,-73.8561880966006,-73.8564631194296,-73.8566799570508,-73.8567050909425,-73.8568467616234,-73.8572269369616,-73.857246757818,-73.8572674460262,-73.8572848668308,-73.8573094773904,-73.8576332310837,-73.8585547003992,-73.8594741645808,-73.8603851992073,-73.8607751279138,-73.8610719249902,-73.8611439603649,-73.8613186364856,-73.8613977586667,-73.8617123871755,-73.8620284308972,-73.8622594308921,-73.8623458053513,-73.8614061863468,-73.8607086187616,-73.8604665875376,-73.859524861962,-73.8585896258018,-73.8581983603456,-73.8577926836297,-73.8572107855002,-73.8568313704324,-73.8565341030587,-73.8543933070023,-73.8539801470207,-73.8533505728647,-73.8526772603694,-73.8522341708392,-73.8516820550598,-73.8509908928286,-73.8501480425854,-73.8493014492528,-73.8484443463383,-73.8478681763193,-73.8475784512997,-73.8467146424159,-73.8458323737204,-73.8452904232548,-73.8452020026905,-73.8451334988005,-73.8450583785572,-73.8449619067906,-73.8445106372462,-73.8440891489368,-73.8432309037522,-73.842370291089,-73.8415139193139,-73.8413409190611,-73.8411960566321,-73.8406300412629,-73.839786002263,-73.8389406932338,-73.8380776900331,-73.8371765168474,-73.83595082775,-73.8351167189827,-73.8346311562003,-73.8342599310853,-73.8334219064044,-73.8325774764411,-73.831722983125,-73.8308855629651,-73.8300393407009,-73.8291824226465,-73.8283562087996,-73.827530213257,-73.8267019729211,-73.825873224027,-73.8250112887268,-73.8239803433813,-73.8229321626814,-73.8218934662346,-73.8208526408424,-73.8199392236372,-73.819060751979,-73.8181871097409,-73.8169264130452,-73.8160748749284,-73.8152282660355,-73.8143843798042,-73.8135401422147,-73.8130986312828,-73.8127176213562,-73.8118631505923,-73.8109881057541,-73.8107258752102,-73.8106329831089,-73.8102442617865,-73.8099560125051,-73.8097232667476,-73.8095478746413,-73.8091842520063,-73.8091446130441,-73.8089241714598,-73.8087435850634,-73.8085765517067,-73.8080734242231,-73.8078746961921,-73.8073362180268,-73.8070906333245,-73.8068607274562,-73.8066060873638,-73.8060620273092,-73.8057684019138,-73.8055181112093,-73.8052268279005,-73.8049297631947,-73.8046451703018,-73.8042828823601,-73.8041022658922,-73.803230276536,-73.8030752042895,-73.8026776954252,-73.8023890644016,-73.8020252177967,-73.8016819475972,-73.8015871663702,-73.8015645058312,-73.8014021065073,-73.8013016646211,-73.8011946161512,-73.801172342509,-73.8011593493158,-73.8011553859722],"lat":[40.6717991208439,40.6714879425965,40.6713585293883,40.6712944621285,40.6705486676171,40.6698004209725,40.669100265712,40.6689388249048,40.6688428294487,40.6686422375113,40.6683901898973,40.6677737973427,40.6673542161349,40.6671756734129,40.6668371594929,40.6667533644458,40.6663729626694,40.666322352571,40.6662640702942,40.6658810937387,40.6652480253325,40.665249953464,40.6652166107817,40.6651601842742,40.6651207333671,40.665074269679,40.6648281914004,40.6638525847163,40.6606729546503,40.6604483248614,40.6605515147998,40.6606423144498,40.6608756638832,40.6612249613082,40.6612363678822,40.6612407446942,40.6612379965869,40.6612327064594,40.6612335221973,40.6612404238217,40.6612532423004,40.6612716636874,40.6612952368116,40.6613233843268,40.6613563170601,40.6613895750707,40.661422765164,40.6614554959733,40.662607339599,40.6627337587977,40.6628555502745,40.6629710683587,40.6630788107268,40.6631774741035,40.662934535878,40.6628228379933,40.6627244361327,40.6626400787067,40.6625699265681,40.6625141022415,40.6624726687372,40.6629560162509,40.6635538781358,40.6635192590203,40.6633884715681,40.6638245399743,40.6648386056275,40.6650328189424,40.6649682133149,40.6636539306297,40.6620562237381,40.6604019915322,40.6598940088322,40.6596656686856,40.6588986567465,40.6571969730161,40.6560335334255,40.6552677027036,40.6542403617249,40.6537480361906,40.6532882664842,40.6527954782837,40.6523071193095,40.6518121627128,40.6513256864725,40.65085989913,40.6503497089878,40.6502871718497,40.6500818827522,40.6500467760495,40.6498276580859,40.6499965462376,40.6503283751602,40.6504296301428,40.6509173537454,40.6511479204325,40.6513295201244,40.6514043120837,40.6515137852804,40.6516261292559,40.651769864547,40.6522566954113,40.6527475574427,40.6532337721073,40.6534788379267,40.6535188680935,40.6536032776479,40.6536036503265,40.6536469965029,40.6537489532362,40.6538137863337,40.6541708301037,40.6541897610851,40.6542480974436,40.6548308452706,40.6548282714875,40.6550013567347,40.6550286350992,40.6550347871516,40.6550090626685,40.6550299714484,40.6550642732669,40.6550396663723,40.6550972821853,40.6551438410547,40.6552968790233,40.6557100220864,40.6558648655424,40.656022380948,40.6560492615126,40.6561078844525,40.6561230996729,40.6561231454452,40.6561156138038,40.6560963631156,40.6560722703018,40.6560371249461,40.6559241872042,40.6558987217946,40.6558339728564,40.6558187617576,40.6555990400164,40.6556448430647,40.6556368198189,40.6556444088284,40.6556589578701,40.6556631277594,40.6556646028445,40.6556557081368,40.6556199934782,40.6555717944395,40.6555194724445,40.6554202647843,40.6553947694364,40.6553237545379,40.6551565164178,40.6551547371259,40.6553058507552,40.655359436782,40.6553576489907,40.6553198772563,40.654912223743,40.6549122424386,40.6551398033839,40.6551424559254,40.6549271897774,40.6548929222431,40.6548613123495,40.6548068897776,40.654494997288,40.654180699086,40.6541683788927,40.6541026376867,40.6541158575325,40.6539311742969,40.6540313343473,40.654001526995,40.6540464180677,40.6542731616761,40.6544408189651,40.6544664266678,40.6545095091754,40.6544540770961,40.6544603862931,40.6545304548293,40.6544810763196,40.6546305199392,40.6546118397256,40.6548419990622,40.6549170348584,40.6549798205398,40.6551937389538,40.6553517959102,40.6554709758398,40.6555993251415,40.6559192332347,40.6559468193461,40.6560305622329,40.6560359514772,40.6560434510677,40.6560712465067,40.6561398943018,40.656215670938,40.6562170351476,40.6562519721452,40.6562652784232,40.656265994564,40.656283061172,40.6563067226316,40.6563245690736,40.6563371925055,40.6564690644688,40.6564866917442,40.6565063627481,40.6565320303869,40.6565542055136,40.6565671683361,40.6565826167573,40.6565715537362,40.6565564031857,40.6565228412312,40.656491972762,40.6564606999503,40.6564469484221,40.6564316182289,40.6564444851562,40.656437956807,40.6564237708685,40.6564268604497,40.6564492781825,40.6565063357185,40.6565536280378,40.6566065112344,40.6566378864989,40.6566645275191,40.6566850133927,40.6567062950988,40.6567258116076,40.6567416732448,40.6567696088513,40.6568134228178,40.6568726373389,40.6569324575352,40.6569655628386,40.6569840850302,40.6570071883392,40.6570358349344,40.6570744451495,40.6570937510243,40.6571176654505,40.6571308010009,40.6571409248953,40.657152925478,40.6571652411202,40.6571743889297,40.6571856078463,40.6572052479201,40.6572260156399,40.6572629859236,40.6572952221631,40.6574252118278,40.6575812853062,40.6577027547627,40.6577997785443,40.6578220473962,40.6578541939517,40.6578806631342,40.6578852355415,40.657883235188,40.657898701208,40.6579145244243,40.6579289891663,40.6579383582088,40.6579566156098,40.6579780613107,40.6580882041683,40.6581092137897,40.6581210342123,40.6581361553921,40.6581609504911,40.658184777932,40.6582030375289,40.6582183121643,40.6582295028155,40.6582494402541,40.6582600959532,40.6582719949639,40.6582875511718,40.6583023427271,40.6583127008189,40.6583237127703,40.6583388719749,40.6583591028597,40.6583792993705,40.6584026432187,40.6584258046825,40.65845006243,40.658460194777,40.6584826440638,40.6584900483982,40.6584917366807,40.6584918265541,40.6584879495302,40.6584796218596,40.658468606804,40.6584679110611,40.6584776659649,40.6584883684368,40.6584985983926,40.6585025138646,40.6585225805726,40.6585570786034,40.6586001863156,40.6586568064128,40.6587096602713,40.6587952840859,40.6588361506219,40.6588939040078,40.6589485408648,40.6590168752438,40.6590309794313,40.6591012330403,40.6591554145322,40.6591809814075,40.6592420861804,40.6592965554408,40.659303518989,40.6593244662816,40.659349384544,40.6594533423253,40.6595014373441,40.6595233378131,40.6595545867149,40.65957888,40.6596323949893,40.6597111441825,40.6597548086335,40.6597881537685,40.6598069031759,40.6598086849573,40.6598041109262,40.6597889021289,40.6597760631921,40.6597584510512,40.6597365402197,40.6597209680359,40.6597092026331,40.6596938005854,40.6596676060428,40.6596431572513,40.6596090375775,40.659564913034,40.6594765029715,40.6594239843672,40.6592597914228,40.6592298864369,40.6591965606708,40.6591631638789,40.6591056949107,40.6590486857659,40.6590308989307,40.6589612692377,40.6588800702918,40.6588245754729,40.6587440262995,40.6587014032347,40.6586559286915,40.6586019763555,40.6585680176267,40.6585709737691,40.6585881270138,40.6585938902441,40.6585712494507,40.6585314925072,40.6585174299599,40.6585089690642,40.6584295019878,40.6583499693482,40.6583157735283,40.6582588652103,40.658176348523,40.6581445977936,40.6581364118489,40.6581164348567,40.6580254571928,40.6579259354434,40.6578462978578,40.6577978388326,40.6578034376019,40.6577947884082,40.657706512384,40.6575444290589,40.6574421126501,40.6573342186634,40.6572434406344,40.6571810561469,40.6571030581588,40.6570137395409,40.6569059079554,40.6568576147155,40.6567695103255,40.6566899771696,40.6566474319834,40.6566560738819,40.6566903032254,40.6567103304848,40.6567288207958,40.6567303957745,40.6567362362119,40.6567363574487,40.6566938879689,40.6566314808369,40.6565066273081,40.6564357091324,40.6563423673162,40.656138454681,40.6561187616685,40.6560970206367,40.6560526563348,40.6560032716246,40.655949382416,40.6558915516745,40.6558303835405,40.6557665170172,40.6557006192954,40.6556333787828,40.6555534516711,40.6554644909179,40.6554157430919,40.6553553436444,40.6552429723722,40.6551944356876,40.6550912597042,40.6549621095052,40.654885038267,40.6548826066209,40.6549005207143,40.654889396264,40.6548754452751,40.6548947524574,40.6550865424842,40.6558737270624,40.6567429858043,40.6567877152372,40.6574837716231,40.6575484603835,40.6561310285113,40.6561714272535,40.6578265916274,40.6580775321342,40.6582317184506,40.6583187864411,40.6583598315585,40.6582743468592,40.6581381286936,40.658051859208,40.656687879278,40.6558227352559,40.6550277524378,40.6542376666548,40.6533465524046,40.6526432389254,40.6521383105746,40.6516831345773,40.6511677144158,40.650751711171,40.6500539328134,40.6499406829504,40.6498085002564,40.6496762240526,40.6495443036767,40.6494129637872,40.6493487634152,40.6510076724735,40.6526977151355,40.6543520510954,40.6560381180953,40.6577129385523,40.659361619701,40.6609418349776,40.6610355339965,40.6610816427851,40.6610991231117,40.6611215238808,40.661183986842,40.6611811833069,40.6612700338525,40.6612727533597,40.6612082559568,40.6612130526605,40.6614035247558,40.6614793355895,40.661587959823,40.6617933321926,40.6620695075934,40.6622171264993,40.6623438479148,40.6624071609841,40.6622383041051,40.6619961291953,40.6619042738623,40.6609506588748,40.6604788885263,40.6592413516654,40.6575730435247,40.6559010243485,40.6558154731085,40.6542363721126,40.6525322105559,40.6508969227628,40.6492494150021,40.6491370624168,40.6491181499693,40.6458924652605,40.6453211492796,40.645317414001,40.6453335440902,40.6453472064473,40.6453479083128,40.6452707045829,40.6452235489629,40.6451563970785,40.6451449110519,40.6451266781611,40.6451018512485,40.6450706384322,40.6450333013617,40.6449901530242,40.6449415551204,40.6448879150327,40.6448847936376,40.6441015092574,40.6441337661806,40.6461761480911,40.6462766341581,40.6463801523422,40.6464863526909,40.6465948761834,40.6467053559431,40.6468174184786,40.6469306849455,40.6470447724274,40.6471592952307,40.6472738661877,40.6473880979664,40.647485529272,40.6475820392087,40.6476773101516,40.6477710285526,40.6478628859715,40.6479525800918,40.6480398157156,40.648124305735,40.6482467673914,40.6483699608275,40.6484407296409,40.6485104118322,40.6485785959941,40.6486448795626,40.6487088711938,40.6487701930744,40.6488284831526,40.6488387254555,40.6488669098271,40.6489121545698,40.6489479932084,40.6489693146834,40.649000900378,40.6490213627753,40.6490435466994,40.6490674335577,40.6490819516588,40.6490964784422,40.6491084123246,40.6491041203226,40.6490955660465,40.6490981222612,40.6491006760847,40.6491117627432,40.6491237058065,40.6491254075207,40.6491262547815,40.6491022839493,40.6491056765614,40.6491286880941,40.6491406294687,40.6491500143536,40.649174799374,40.6491799035988,40.6491824211751,40.6491644715731,40.6491337184026,40.6491149261706,40.6490952603634,40.649085846485,40.6490751635101,40.6490706209163,40.6490723246022,40.6490802348509,40.6490941672557,40.6491137970189,40.6491386665233,40.6491681960004,40.649200643373,40.6492160200462,40.6492578958827,40.6493117285265,40.6493672517274,40.6494125142715,40.6494663059301,40.6494842323082,40.649487628689,40.6494876214178,40.6494893253387,40.6495098037632,40.6495165953344,40.649537944762,40.6495644009664,40.6496036881206,40.6496207701668,40.6496668828458,40.6497223982694,40.6497454583861,40.6497454321969,40.6497454307408,40.649747139694,40.649766788111,40.6497779112864,40.6498060927254,40.6498034361198,40.649801719887,40.6497982761616,40.6497922692547,40.6497947657198,40.6498101232884,40.6498622059478,40.6499040658012,40.6499091903155,40.6499220224675,40.6499373819425,40.6499570119271,40.6500116760312,40.6500680670769,40.6501227413789,40.6501731531798,40.6502286744207,40.6502833358301,40.650337980995,40.650349925193,40.6503584392564,40.6503643966392,40.650368652354,40.6503823110456,40.6503686144544,40.6503361204622,40.6502916490183,40.6502728168967,40.6502744998756,40.6502898755958,40.6503113713115,40.6503352030262,40.6503685342596,40.6504223467665,40.6504556707061,40.6504769948255,40.6504897759471,40.6505102397081,40.6505195936527,40.6505315219886,40.6505365871549,40.6505433844038,40.6505612914619,40.6505971384916,40.6506278599964,40.6506321264045,40.6506560214542,40.650685003812,40.6507114177932,40.6507131165115,40.6507148155195,40.6507224920169,40.6507386993546,40.6507659665636,40.6508009144148,40.650832439863,40.6508571239852,40.6508809621335,40.6508783483325,40.6508920101986,40.6509236122608,40.6509200997301,40.6509260276382,40.6509336809203,40.6509370644099,40.6509387325687,40.6509344338921,40.6509275798734,40.6509292524203,40.6509693311082,40.6510093828231,40.651031532551,40.651081029489,40.6511057882475,40.6511296917735,40.6511689979876,40.6511878186714,40.6511989390962,40.6512314377935,40.6512690391576,40.6512818360581,40.6512818761756,40.6512947143632,40.6513246196781,40.6513476892612,40.651371613866,40.6513938311936,40.6514348789504,40.651461802297,40.6514848165241,40.6515033161395,40.6515172941434,40.6515254137098,40.6515274417414,40.6516579636038,40.6516508543448,40.6516502042707,40.651656032279,40.6516681689488,40.6515769180134,40.6515919056847,40.6515994108775,40.6516010966531,40.6515969281146,40.6515869915545,40.6515714926684,40.6515507522968,40.6515251997835,40.6515168577625,40.6515103071555,40.6515057451265,40.6515033089862,40.6515030720589,40.6515050414757,40.65150915796,40.6515152976116,40.6515232756355,40.6515328519043,40.6515001258222,40.6514620735217,40.6514188476646,40.6513706216685,40.6513175890106,40.651259962451,40.6511979731799,40.6508276238599,40.6508156393822,40.6508061840293,40.6507994882395,40.6507957151976,40.6507949568568,40.6507972420742,40.6508025214005,40.6508106654547,40.6508214746496,40.6508155566236,40.6508039603626,40.6507870354197,40.6507652919737,40.6507393854497,40.6507100967621,40.650690569927,40.6506567138434,40.6506266145328,40.6506009132042,40.6505801573753,40.6505647892091,40.650555136094,40.6505514036711,40.6505536714521,40.6505618911265,40.6505758875903,40.6506069749611,40.6506318085902,40.6506503382532,40.6506625264749,40.6506683486051,40.6506661255527,40.6506561022515,40.6506418831129,40.6506380781907,40.6506399042081,40.6506473417268,40.6506603115716,40.6506786756741,40.6507271770918,40.6507710273786,40.6508100403944,40.650844050533,40.6508729134245,40.6508965065484,40.6509170011119,40.6509520744237,40.6509587397292,40.6509684362496,40.6509809050098,40.6509958129939,40.6510127620388,40.6510590858807,40.6511037372903,40.6511457463873,40.6511842006838,40.651218264905,40.6512471991328,40.6512703748782,40.6512872887333,40.6512975733064,40.6513010052025,40.6512975098764,40.6512871632512,40.6512721516633,40.6512607324348,40.6512531681932,40.6512496329065,40.6512502078817,40.6512548798951,40.6512635414964,40.6512744784252,40.6512898013645,40.6513092616905,40.6513325436477,40.6513592694716,40.651398891474,40.6514429340992,40.6514909853403,40.6515425956903,40.6515972823463,40.6516545337262,40.651713814254,40.6517745693701,40.6518362307188,40.6518982214651,40.6519599616909,40.6519706729602,40.6520234780524,40.6520763327221,40.6521283345714,40.6521785957614,40.6522262581694,40.6522705080405,40.652310589882,40.6523458193619,40.6524156840763,40.6524850326098,40.6525532112482,40.6526195773029,40.6526835051701,40.6527443922279,40.6528016645174,40.652854782153,40.6529032444127,40.6529465944579,40.652959281837,40.6529660446877,40.6529667000152,40.6529612300869,40.6529497829129,40.6529326682404,40.6529103491723,40.6528834296355,40.652876406759,40.6528694511551,40.6528627125368,40.652856335947,40.6528504586357,40.6528452071066,40.6528400241541,40.6528359963875,40.6528332415782,40.6528318402762,40.6528318334553,40.6528318456952,40.652833768093,40.6528297547719,40.6528198711944,40.652804278574,40.652783231246,40.6527570725182,40.6527262290717,40.6528030033963,40.6529190400941,40.6529948721519,40.6531329983536,40.6533111894038,40.6535382411213,40.653725197941,40.6538855779148,40.6540325547237,40.654049771786,40.6541616268325,40.654228513878,40.6542554338195,40.6542865562312,40.6544024688711,40.6546385086072,40.6547042819361,40.6547943290983,40.6548358748957,40.6548545553954,40.6548870127229,40.6549405703951,40.6549641309321,40.6549812367453,40.6550178193895,40.655049482144,40.6550738944129,40.6551039492783,40.6551471708468,40.6551878951609,40.6552300042986,40.6552759472571,40.6554902970434,40.6560468126677,40.6561715747792,40.6562519616497,40.6563634693527,40.6563946211912,40.6564147541654,40.6564351813117,40.6564593779758,40.6564809464115,40.6565108495457,40.6565428563089,40.6565677393173,40.6565780876393,40.6565872169825,40.6565942052071,40.6565889764917,40.6565836805569,40.6565728166244,40.6565595098214,40.6565421047948,40.6565369660577,40.6565457416124,40.656561297115,40.6565682969361,40.6565610526284,40.6565606274643,40.6565699355882,40.6565886318622,40.6565845921682,40.6565129762798,40.656471847102,40.656465298536,40.656464657207,40.6564756059603,40.6565181417986,40.6566278703127,40.6566405421746,40.6566564742112,40.6566687992814,40.6566844492454,40.6566863813281,40.6566969851733,40.6567173754367,40.6567309998704,40.656739987205,40.6567471860197,40.6567533953831,40.6567670097429,40.6568064887049,40.6568365349144,40.6568793462147,40.656897489854,40.6569175233727,40.656953161474,40.6569847045572,40.6570103749491,40.6570177108355,40.6570122636808,40.6569953726426,40.6569613555664,40.6568453854026,40.6568095833547,40.6567929927964,40.6567822636355,40.6567798610496,40.6567942668991,40.6568205239111,40.6569394982502,40.6569637270066,40.6569722551554,40.6569725497063,40.6569700282925,40.6569662946867,40.6569658336883,40.6569651267862,40.6569676621938,40.6569770632205,40.6569966210397,40.6570142093616,40.6570380370053,40.6570526187404,40.6570501119641,40.6570497447068,40.6570487136343,40.6570414497333,40.6570426759215,40.6570486110801,40.6570580479027,40.6570774861926,40.6570872739136,40.6571043002835,40.657136973897,40.6571714659582,40.6572092411189,40.6572228220697,40.6572144492154,40.6572736031928,40.6573224114938,40.6573801581545,40.6574320141092,40.6574565996863,40.6576704489722,40.657705380481,40.6577201771504,40.6577351975651,40.657752189196,40.6577856089869,40.6578234853286,40.6578369847945,40.6578862055193,40.6579011388169,40.6579435367629,40.6579884534017,40.6580353500543,40.6580836642942,40.6581328166929,40.6581994107543,40.6582656093878,40.658331003795,40.6583951901428,40.6584577720565,40.6584922764515,40.6585229364228,40.6585493831647,40.6585712985514,40.6585884189642,40.6585896980387,40.6585966168385,40.6586090988952,40.658604968763,40.6586050274393,40.6586092732112,40.6586175821523,40.6586297117391,40.658706508804,40.6587844209917,40.6588054147441,40.6588297935951,40.6588572343805,40.6588608586362,40.6588648044216,40.6588689598106,40.6588732069316,40.6588774253107,40.6588814952894,40.6588853014187,40.658888735734,40.6588917008173,40.6588941125612,40.6588959025541,40.6588970200209,40.6588974332636,40.6588971305601,40.6588785592313,40.6588538545091,40.6588234448731,40.6588205223524,40.6588162464985,40.6588107419141,40.6588041690082,40.6587967193217,40.6587886099458,40.6587800771954,40.6587713697229,40.6587627412724,40.6587544432847,40.6587119183496,40.6586668789991,40.6586201487465,40.6585754697395,40.65857644032,40.6585760984525,40.6585744525622,40.658571543211,40.6585674420987,40.6585622502951,40.6585560957496,40.6585491301378,40.6585415251239,40.6585399579984,40.6585377644096,40.6585350038851,40.6585317513379,40.6585280950328,40.6585241341918,40.6585199763006,40.6585157341926,40.6585115229866,40.6585074569625,40.6584976719463,40.6584892921135,40.6584825268255,40.6584775451058,40.6584744714176,40.6584783424487,40.6584829692787,40.6584882204994,40.6584939469687,40.6584970796393,40.6584992903197,40.6585005145092,40.6585007164899,40.6584998903688,40.6584980602493,40.6584952795286,40.658491629339,40.6584872161812,40.6584162952874,40.6583862346123,40.658352349877,40.658356723093,40.6583631391143,40.6583714123269,40.6583813033884,40.6583925261527,40.6584047559471,40.6584176389661,40.6584308025057,40.658443865747,40.6584837328294,40.6585226454638,40.658559780393,40.6585943519686,40.6586256287725,40.6586384626645,40.6586525228216,40.6586674215874,40.6586813413498,40.6586949937788,40.6587079815781,40.6587199267925,40.6587304818065,40.6587393394606,40.6587544517911,40.6587752439893,40.6588013702897,40.6588323962225,40.6588678058384,40.658907010288,40.6589493576143,40.6589941435941,40.6590406234486,40.6590880242286,40.6591355576686,40.6591824332955,40.6592284741972,40.6592765669478,40.6593265346052,40.6593215267237,40.6593117868084,40.6592975944371,40.6592793569925,40.6592575979674,40.659232941939,40.6592060966403,40.659168702174,40.6591309417318,40.6590931121621,40.6590738310313,40.659054833769,40.6590365426269,40.6590193641614,40.6590036801973,40.6589898393407,40.658950657192,40.6589135258628,40.6588088220647,40.6587666561164,40.6587209100741,40.6586721971191,40.6586211701995,40.6585685132784,40.6585149321659,40.658488983111,40.6584626048565,40.6584304179133,40.6583979041521,40.6583528596513,40.6583083492395,40.6582651676844,40.6582240860245,40.6581592419191,40.6580924412665,40.6580793883282,40.658068789899,40.6580609429969,40.6580560675287,40.6580566402248,40.6580615439609,40.6580644390392,40.6580689456126,40.6580782499222,40.658092262042,40.6581335987029,40.6581718896318,40.6582065130912,40.6582369068921,40.6582947097634,40.6583091649145,40.658319953726,40.6583268151947,40.6583295833278,40.6583281911585,40.6583095927164,40.6582972727903,40.6582989748794,40.6582993334247,40.6582983382604,40.6582960176024,40.6582924372483,40.6582876987122,40.6582819363458,40.6582638869658,40.6582453037852,40.6582445837391,40.658243814072,40.658243014727,40.6582422064162,40.658241410084,40.6582406463648,40.6582399350474,40.6582392945632,40.6582387415079,40.658238290212,40.6582379523694,40.6582403105228,40.6582423483478,40.6582440049552,40.6582452308462,40.6582459893917,40.6582462579268,40.6582460284276,40.6582453077516,40.6582441174322,40.6582424930357,40.6582404830983,40.6582381476761,40.6582355565504,40.658232787143,40.6582114455934,40.6581301043564,40.658129362871,40.6581266532068,40.6581220553018,40.6581157047985,40.6581077890434,40.6580985415589,40.658088235155,40.6580771738804,40.6580656840534,40.6580639913089,40.6580618539144,40.6580593325312,40.6580564987188,40.6580534329033,40.6580502220958,40.658046957422,40.6580437315365,40.6580406359931,40.6580377586462,40.6580351811577,40.6580329766792,40.6580312077758,40.6580299246508,40.6580002501047,40.6579905513257,40.6579794028265,40.6579671020195,40.6579539770575,40.6579403780793,40.6579340324891,40.6579273525438,40.6579204572751,40.6579134695516,40.6579018890924,40.6578935339131,40.6578885776993,40.6578871234799,40.6578892014848,40.6578786988043,40.6578667594453,40.6578535704378,40.657842199173,40.657845897838,40.6578453353583,40.6578405240073,40.6578406614165,40.6578405202804,40.6578401047205,40.6578394268718,40.6578385065289,40.6578373705675,40.6578360521599,40.657834589806,40.6578330262095,40.6578314070301,40.6578297795511,40.6578281912981,40.6578266886507,40.6578253154894,40.6578158799797,40.6578018939937,40.657783606157,40.6577613415682,40.6576058205421,40.6575553211397,40.6575072271649,40.6574624430167,40.657418070542,40.6573843544522,40.6572479056981,40.6572260671677,40.6572098728323,40.6572129144315,40.6572134383571,40.6572114317125,40.6572069438919,40.6572000853642,40.6571807692061,40.6571598213694,40.6571554567006,40.6571616993932,40.6572054116413,40.6572054560829,40.6571742620335,40.657157439737,40.657140256182,40.6571231076685,40.6571204014022,40.6571174882521,40.6571144561787,40.6571113967334,40.657108402294,40.6571055632754,40.6571029653999,40.6571006871084,40.6570987971923,40.6570973527162,40.6570963972952,40.6570959597774,40.6570960533733,40.6570951809377,40.6570921812584,40.6570871256451,40.6570801342824,40.6569312960132,40.6569268661395,40.6569226891772,40.6569188723076,40.656915513472,40.6569126988584,40.6569105006903,40.6569089753726,40.6569081620454,40.6569080815785,40.6569087360369,40.6570009063593,40.6569999340575,40.6569965102529,40.6570478591025,40.6571000878008,40.6571527336577,40.6572053302867,40.6572574117366,40.6574006466021,40.65754406043,40.6576873288935,40.6578301279927,40.6579721347868,40.6579823418592,40.6579923362984,40.6580018408381,40.6580105918025,40.6580183464217,40.6580248895662,40.6580300397154,40.6580336539932,40.6576183763335,40.6576183090124,40.6582765129481,40.658938356511,40.6592546258883,40.659634655304,40.6597727153821,40.6598989424686,40.6601189331547,40.661374437124,40.6617210500925,40.6620365707923,40.6634533609319,40.6635978625139,40.6637471595992,40.6638084021346,40.6638674928748,40.6655093801063,40.6658465551295,40.6670417638916,40.6679241591767,40.6680264396038,40.6686029353322,40.6700962126365,40.670174051682,40.6702552942948,40.6703219899049,40.6704162333649,40.6716561940381,40.6715129273103,40.6713805315348,40.6712517109906,40.672805622741,40.6740198143972,40.6743301474493,40.6750212688162,40.6753365904825,40.6766105959752,40.6778861145353,40.6788167861564,40.6791647856444,40.6792209927655,40.6792637358096,40.67927856245,40.6793454684152,40.6794027293995,40.6794308490687,40.6794557161414,40.679485864345,40.6795093383044,40.6795277252978,40.6796601136843,40.6796830349626,40.6798670165449,40.6800794150818,40.680207890968,40.6803679773977,40.6805683676605,40.6808081069773,40.6810466724078,40.6812907036365,40.6814868321229,40.6815798682804,40.6818584931911,40.6821064507279,40.6822304448261,40.6822506686509,40.6822665335029,40.6822844518408,40.682307455319,40.6824150883418,40.6825292985645,40.6827751975605,40.6830184222149,40.6832616814559,40.6833105030821,40.683351366844,40.6835139105714,40.6837541585341,40.6839938029679,40.6842389097021,40.6844953924184,40.6848435468849,40.6850849330504,40.6852232175474,40.6853289375,40.6855677822712,40.6858063459228,40.6860507053982,40.6862865479114,40.6865293590858,40.6867708057622,40.6870028099533,40.6872394827356,40.6874732094474,40.6877086497737,40.6879523184279,40.6882452682572,40.6885430011056,40.6888382260043,40.6891343834089,40.6893936929379,40.6896424419733,40.6898920748069,40.6902501473664,40.690492270968,40.6907334771279,40.6909719537659,40.6912113678357,40.6913181019626,40.6914078038223,40.6916300801645,40.6918550447344,40.6919224223034,40.6919473825768,40.6912635868155,40.6907561131604,40.6903463441441,40.690037546626,40.6894004794721,40.6893310307331,40.6889448092041,40.6886258845928,40.6883308903006,40.6874528242587,40.6870983377938,40.6861254469901,40.6856303107838,40.6851799577744,40.6846811457839,40.6835543609625,40.6829323912504,40.6824082109029,40.6817981498803,40.6811769746726,40.6805798897467,40.679817356731,40.6794245501539,40.6776810570058,40.6773456012399,40.6764979669041,40.6758884786801,40.6751142732162,40.6743838489599,40.6741158501575,40.6740479485806,40.6735613198798,40.6731215222321,40.6724224646056,40.6722050322449,40.6718938897181,40.6717991208439]}]],[[{"lng":[-73.9344523939737,-73.9346351059628,-73.9346739306833,-73.9347456942292,-73.9347988641014,-73.9348574034224,-73.9349627411069,-73.9350633634262,-73.9353078807002,-73.9357262433215,-73.936603647337,-73.9370064164481,-73.9372953333144,-73.9379724625285,-73.938081821838,-73.9381880763366,-73.9382911469799,-73.938390956886,-73.9384874320206,-73.9385805006181,-73.9387736026166,-73.9389485978898,-73.9392285623012,-73.9392517598325,-73.9392813082096,-73.9393171103521,-73.9393590486393,-73.939406985297,-73.9394607628966,-73.9395202047197,-73.9395851155046,-73.9396552820282,-73.9397304738065,-73.9397859804583,-73.9398372408485,-73.9398841279558,-73.9399265257122,-73.9399643288933,-73.9399974438304,-73.940069476676,-73.9401413121009,-73.9403464331369,-73.9410754698064,-73.9413679958142,-73.9429796619917,-73.9457193369865,-73.9458239515278,-73.9459255816204,-73.9482259724,-73.9489054328625,-73.9491944889159,-73.9494157055686,-73.949551752833,-73.9495743178091,-73.9496411981455,-73.9497080785182,-73.9497761628448,-73.9498559048211,-73.9499624395775,-73.9502121856002,-73.9498891562042,-73.9497982650522,-73.9497847133827,-73.9497425788605,-73.9497389152804,-73.949712435793,-73.9496931383177,-73.9496834900747,-73.9496895057145,-73.9496911764021,-73.9496863474476,-73.9496562891399,-73.9496454181682,-73.9496213764317,-73.9496014970849,-73.9495833406586,-73.9495460072937,-73.9495099176218,-73.9494570191995,-73.9493885290614,-73.9493284608129,-73.9492903465706,-73.9492869861103,-73.949284462591,-73.9492828508901,-73.94928219883,-73.9492825257585,-73.9492838219754,-73.9492860490197,-73.949289140811,-73.9492930056105,-73.9492975287425,-73.9493025759975,-73.9493771335595,-73.9494399469653,-73.9494423001312,-73.9494973993623,-73.9495421050448,-73.9491805889786,-73.9491523412929,-73.9490045976789,-73.9489289116868,-73.9488396198111,-73.9487576366754,-73.9486577502686,-73.9485605452053,-73.9484964028906,-73.9484286079155,-73.9483341792378,-73.9482744989375,-73.9482335262209,-73.948074842555,-73.9479670101405,-73.9478600345227,-73.9477619608773,-73.9477093480996,-73.9476060040179,-73.9475560981857,-73.9474889692931,-73.9473832215426,-73.9472743043913,-73.9472104755568,-73.9471678822236,-73.9471336797226,-73.9471205331108,-73.9471071517441,-73.9469601238285,-73.9469350286281,-73.946869186453,-73.946787682126,-73.946755100748,-73.946709847566,-73.946616425962,-73.9465480827828,-73.9464585806661,-73.9463691999154,-73.9463134956635,-73.946248919182,-73.946197888994,-73.9461262557861,-73.9461241642177,-73.9461193357755,-73.9460974583389,-73.9460941517218,-73.9461136551073,-73.9461169981883,-73.946093164131,-73.9461053777251,-73.9460842580583,-73.9460912407748,-73.9460788055709,-73.9461092998044,-73.9461227215278,-73.9461283683532,-73.9461469239887,-73.9461601872281,-73.9461608690716,-73.9461913872833,-73.9462057455364,-73.9462227116677,-73.9462106518648,-73.9461770484538,-73.9461717498388,-73.9462068240667,-73.9462306238542,-73.9462766495797,-73.946307748146,-73.9464387825548,-73.9464662099247,-73.9464795051287,-73.9464454448152,-73.9464838768725,-73.9465173020058,-73.9465038958519,-73.9464559791282,-73.9464258195366,-73.9463483945936,-73.9463507804994,-73.9464028826528,-73.9464364381749,-73.9464735305792,-73.9465168320512,-73.9466405821043,-73.9467176787914,-73.9467895684932,-73.9468244534264,-73.9468093526662,-73.9467822054396,-73.9467493384277,-73.9466985870492,-73.9466857685379,-73.9466560643462,-73.9466405820579,-73.9466228573435,-73.9466202774859,-73.9466194999889,-73.9466442257228,-73.9466504076318,-73.946678537654,-73.9466355001267,-73.9466506431052,-73.9466649962484,-73.94670601763,-73.9467205117605,-73.9467331340639,-73.9467565642777,-73.9468116467334,-73.9468387203646,-73.9468552500436,-73.9468547984757,-73.9468824441746,-73.9468950579329,-73.9469006321069,-73.9469665223715,-73.9469592294382,-73.9469510884998,-73.9469522211832,-73.9469957865811,-73.9469581447419,-73.9469670652455,-73.9469851657691,-73.9470278249472,-73.9470253617107,-73.9470052735774,-73.9469744714631,-73.9469534291508,-73.9469640449571,-73.9469864504123,-73.9470178169951,-73.9470289720359,-73.9470192100041,-73.9470498025919,-73.9470439927835,-73.9470040657687,-73.9470045960835,-73.9470111027367,-73.94700167437,-73.9469980830222,-73.9469644175959,-73.9469262640486,-73.9468689961492,-73.9468136739163,-73.9468021962802,-73.9465159021613,-73.9465022945865,-73.9464874344917,-73.9464716344196,-73.946456883783,-73.9464418920296,-73.946426914691,-73.9464121608617,-73.9463979316411,-73.9463844711137,-73.9463720101779,-73.9463387537898,-73.9463207741203,-73.9463288803668,-73.9463517419433,-73.9463521863776,-73.9463379635605,-73.946327297948,-73.9463158982778,-73.9462971730483,-73.9462750149671,-73.9462437464238,-73.9461977691754,-73.9461730448016,-73.9461959781453,-73.9462007832208,-73.946186012492,-73.9461721061942,-73.9461581922763,-73.9461469983796,-73.9461454250123,-73.9461339228464,-73.94611976648,-73.9460967019523,-73.9460819050107,-73.9460874587952,-73.9460974239555,-73.9460981322402,-73.9461415938349,-73.9461365365532,-73.9461174410519,-73.9460478028608,-73.9459647343912,-73.9459302578309,-73.9458957745417,-73.9458409279916,-73.9457672616562,-73.9457249399454,-73.9457280636197,-73.9456826191261,-73.9456528362645,-73.945612080799,-73.9455556397503,-73.9455274302487,-73.9455195790856,-73.9454812644814,-73.945449037344,-73.9454223954055,-73.9453957540048,-73.9453785025399,-73.9453894688811,-73.9453220733816,-73.9453126619556,-73.9452797525913,-73.9452531109531,-73.9452436952284,-73.945272680328,-73.9452664099904,-73.9451958685358,-73.9451535565936,-73.9450657830015,-73.9450438270494,-73.9450062023457,-73.9449779839563,-73.9449325267845,-73.9448773127254,-73.9447770228039,-73.9447657741482,-73.9447144548597,-73.9446938070381,-73.9446876545562,-73.9446926993411,-73.9446897831003,-73.9446832405572,-73.9446672117815,-73.9446323412433,-73.9445884563509,-73.9445774787063,-73.9445038194598,-73.9444865815126,-73.9445031635779,-73.944505155126,-73.9444876191584,-73.9444619785477,-73.9444536813326,-73.9444223265937,-73.9443972527988,-73.9444066712573,-73.9443674978486,-73.9443251848248,-73.944317333427,-73.9442906820886,-73.944245224993,-73.9442107380319,-73.9442216965107,-73.9441966078135,-73.9441339103154,-73.9440712308196,-73.9440132395073,-73.943991281309,-73.9439599164944,-73.9438815357491,-73.9437961059554,-73.9436007298518,-73.9434797854567,-73.943059029443,-73.9430264437118,-73.9427983850535,-73.9426099668357,-73.9424736592578,-73.9420551425848,-73.9418699642667,-73.9418277442505,-73.9417310566149,-73.9415815880045,-73.9415373674243,-73.9415021318989,-73.9414976213216,-73.941409806424,-73.9413131113132,-73.9412659205112,-73.9412336635977,-73.9410327700312,-73.9409992899919,-73.941009143133,-73.9409570447241,-73.9408553985549,-73.9407685484289,-73.9407462171037,-73.940694193801,-73.9406197513461,-73.9404883126927,-73.9404051777662,-73.9403505646138,-73.9402934749712,-73.9401471761871,-73.9400852345242,-73.9400182701591,-73.9399488067714,-73.9397814621112,-73.9396848241026,-73.9396104107323,-73.9394021151439,-73.9393648888822,-73.9392830385064,-73.9392223197617,-73.939110941644,-73.9390412264177,-73.9389147144351,-73.9386568056552,-73.938653061647,-73.9385017472503,-73.9384372879187,-73.9384164339628,-73.9383095743429,-73.9378533658648,-73.9377355637796,-73.9375573431851,-73.9375294417256,-73.9375306630546,-73.9375521865699,-73.9375871631842,-73.937580542065,-73.9373543613443,-73.9371357751147,-73.9370939040756,-73.9370422314218,-73.9369685174811,-73.936810969729,-73.9368027996368,-73.9368185154751,-73.9368104544925,-73.9364756166485,-73.9359681300685,-73.9355946079782,-73.9348508917312,-73.9347554071761,-73.9346187007624,-73.9344344685111,-73.9343556851352,-73.9342316407923,-73.9341923030187,-73.9340817388134,-73.934016644267,-73.9340164852447,-73.9339500171158,-73.9338628312348,-73.9337891643636,-73.9336305556861,-73.9335715800758,-73.9335739612203,-73.9334928542417,-73.933436350697,-73.9334362891443,-73.933401827008,-73.9333231755757,-73.9332568887992,-73.9331315018567,-73.9330750030786,-73.9328334942832,-73.9326633272146,-73.9327564862725,-73.9327626078313,-73.9329017189177,-73.9328395820506,-73.9326456957457,-73.9326603505637,-73.9325979485281,-73.9325483038695,-73.9325188840444,-73.9324253821539,-73.9323866223573,-73.9323643143118,-73.9323507813682,-73.9323543156297,-73.9323674680955,-73.9323734128857,-73.9322739712806,-73.9322812400666,-73.9322676982625,-73.9323228438442,-73.9323159101132,-73.9324464374824,-73.9324921429863,-73.9324937728018,-73.9325307779682,-73.932536906623,-73.9325689181631,-73.9325797050119,-73.9326143189161,-73.9326221151462,-73.9326252507503,-73.9326284435028,-73.9326508351281,-73.9325454652185,-73.9325505066164,-73.9325680426409,-73.9325235456004,-73.93250125163,-73.9325061996572,-73.9324953288405,-73.9323522987469,-73.9323059727891,-73.9322983181865,-73.93225031755,-73.9322542774916,-73.9322775105328,-73.9322873204428,-73.9323138544823,-73.9323603509377,-73.9324567080095,-73.9325372935495,-73.9325689548279,-73.9325679516988,-73.9325046980315,-73.9323901680462,-73.9322932768987,-73.9321890382608,-73.9324688306991,-73.9323537080728,-73.9322658163697,-73.93235934466,-73.9321333660305,-73.932109971067,-73.9320771261943,-73.9320590828635,-73.9320534384771,-73.9320500216975,-73.9320671221183,-73.9320956610291,-73.9321797602456,-73.9321985511514,-73.9322060053187,-73.9321232852716,-73.932047404814,-73.9320315692668,-73.9319137713681,-73.9317844012483,-73.9316014958732,-73.9314682113936,-73.9313765589895,-73.9312210755908,-73.931062541996,-73.9308451143446,-73.9306838181817,-73.9299768674315,-73.9298621506257,-73.929319188194,-73.9291796825597,-73.9290134580979,-73.9285900263284,-73.9283297696849,-73.9281462360357,-73.9280363857674,-73.9279659464347,-73.9275308212749,-73.9268994050239,-73.9266082443429,-73.9265309627843,-73.9264818571844,-73.9264159145477,-73.9264055692112,-73.9263508026825,-73.9262968099259,-73.9263100173927,-73.9263025357111,-73.9262974358818,-73.9262945620142,-73.9262954879739,-73.9263001889477,-73.926308538976,-73.9263203143272,-73.9263351994931,-73.9263527956427,-73.926372631308,-73.926394175017,-73.9264211392751,-73.9264410506886,-73.9264533937799,-73.9264578490102,-73.9264401358563,-73.9264143304097,-73.9263810865184,-73.9263412464951,-73.9262958197752,-73.9262459573401,-73.9261929225557,-73.9261380591628,-73.926082757232,-73.9259756560598,-73.9258683405345,-73.9257615947666,-73.9256561987039,-73.9255529224338,-73.9254525205573,-73.9253557266757,-73.9252632480314,-73.9251757603404,-73.9251688213816,-73.9251575024618,-73.9251380476082,-73.9251127542747,-73.9250821570134,-73.9250732377952,-73.9250268108051,-73.9249623961505,-73.9248956789098,-73.9248271973703,-73.9247420252124,-73.9246560717955,-73.9245703699118,-73.9244859493309,-73.9244038244252,-73.9240050501001,-73.923861477643,-73.9238197355543,-73.923776812069,-73.923733746777,-73.9236915827027,-73.9236513410439,-73.9236139964395,-73.9235482336755,-73.9232947673398,-73.9231865833825,-73.923151775517,-73.9231229144576,-73.9230988966351,-73.9230729776833,-73.9229989883947,-73.9229976135937,-73.9229691498885,-73.9229237520377,-73.9229051169181,-73.9228599285484,-73.92283147429,-73.9228105145321,-73.9228031115373,-73.9227944711255,-73.9228073501517,-73.9228124655996,-73.9227941068454,-73.9227755254017,-73.9227515948516,-73.9227150627939,-73.922671103412,-73.9226437737043,-73.922622223329,-73.9226195590284,-73.922609017739,-73.9225959688097,-73.9225851562651,-73.9225802407225,-73.9225838472557,-73.9225771952866,-73.9225817987269,-73.9225914872041,-73.9225685510051,-73.9225378620706,-73.9224923463621,-73.9224768908113,-73.9224234002415,-73.9224170839378,-73.9223976816932,-73.9223875464169,-73.9223766931572,-73.9223763219681,-73.922375212032,-73.9223811545329,-73.9223941447462,-73.9224141724158,-73.9224412217628,-73.9224395667849,-73.9224446821819,-73.9224565168357,-73.9224749525038,-73.9224998050012,-73.9225508217083,-73.9225932860646,-73.9226270503784,-73.9226519972274,-73.9226680398672,-73.922675122532,-73.9226732206282,-73.9226623408192,-73.9226425210016,-73.9226138301729,-73.9225763681903,-73.9225302654235,-73.9224756822998,-73.922412808746,-73.9223418635268,-73.9222630934835,-73.9221767726749,-73.9220832014235,-73.9219827052703,-73.9218756338426,-73.9217623596368,-73.9216432767233,-73.9215187993751,-73.9213893606269,-73.9212554107687,-73.9211174157797,-73.9210886829408,-73.9210596906005,-73.9210309647829,-73.9209734396525,-73.9209140686841,-73.9208535453861,-73.9207925767264,-73.9207318748748,-73.9207298413247,-73.9207272521547,-73.9207241782984,-73.9207207039679,-73.9207169243471,-73.9207129429834,-73.9207088689513,-73.9207048138642,-73.9206893127476,-73.9206835897847,-73.9206592131712,-73.920637876355,-73.9206038943965,-73.9205697228697,-73.9205560210661,-73.9205255308396,-73.9204901960058,-73.9204578420348,-73.9204255346232,-73.9203872314431,-73.9203569084712,-73.9203284953404,-73.9203019234,-73.9202923057271,-73.9202763405224,-73.9202576798151,-73.9202238301978,-73.9201942708146,-73.9201684671804,-73.9201507881323,-73.9201340570572,-73.9201253607022,-73.9201036874971,-73.9200850047188,-73.9200634350377,-73.9200499671979,-73.9200187755385,-73.919990415263,-73.919981386561,-73.9199717090996,-73.9199579782898,-73.919955604878,-73.9199668568458,-73.9199601469089,-73.9199615269548,-73.9199657961229,-73.9199520088966,-73.9199492463788,-73.9199446246653,-73.9199289092784,-73.9199269916987,-73.9199120983483,-73.919905363251,-73.9198735215599,-73.9198288523102,-73.9197930167242,-73.9197927764907,-73.9198322991474,-73.9198718807938,-73.919899578821,-73.9199252575708,-73.9199419807086,-73.9199577479478,-73.9199536640454,-73.9199485938863,-73.9199544749424,-73.9199593435105,-73.9199622400329,-73.9199670789504,-73.9199738476337,-73.9199816353505,-73.9199746456702,-73.9199854396698,-73.919998787496,-73.9201298717641,-73.9201448168173,-73.9201704420499,-73.9201554947969,-73.9201959154611,-73.920213821777,-73.9202413947935,-73.920222508849,-73.9202915163733,-73.9203516480986,-73.9204058454069,-73.9204413156245,-73.920473775627,-73.9204998534944,-73.9205444449928,-73.9205768727461,-73.920606390378,-73.9206269916569,-73.9207696671416,-73.9207876146162,-73.9208025563036,-73.9208075130692,-73.9206608442927,-73.9206698030134,-73.9206857269421,-73.9206966591882,-73.9207110741238,-73.9207001059899,-73.9207160457197,-73.920724984446,-73.9207429085349,-73.9207578511748,-73.9207548342963,-73.9207667777056,-73.9207807050061,-73.9207816924167,-73.9207926569451,-73.9207886511,-73.9208035946764,-73.920799579598,-73.9208095443194,-73.9208165048275,-73.9208164958184,-73.9208294541542,-73.9208424024009,-73.9208394026656,-73.9208433742822,-73.920852355845,-73.9208687955981,-73.9208827322138,-73.9208867110269,-73.9208916739299,-73.9209056154885,-73.9209195635895,-73.9209225407913,-73.9209145351775,-73.9209155100289,-73.9209234915729,-73.9209274622966,-73.9209384181304,-73.9209473691218,-73.9209723077096,-73.9209872399264,-73.9209872192416,-73.9210001580885,-73.9210161056586,-73.9210320229093,-73.9210549369237,-73.9210813353079,-73.9211142016049,-73.9211400938498,-73.9211560033055,-73.9211669569689,-73.9211749268854,-73.9211749134236,-73.9211818650898,-73.9211698884575,-73.9211698776963,-73.9211728486808,-73.9211688534267,-73.9211698417931,-73.9211578766525,-73.9211598601538,-73.921143895438,-73.9211458849822,-73.9211339103894,-73.9211319044241,-73.921126906187,-73.9211109446203,-73.9211039408442,-73.9211129036417,-73.9211069140851,-73.9211049103776,-73.9210799642235,-73.9210619957655,-73.9210570010965,-73.9210360220979,-73.9210240353177,-73.9210110576887,-73.9209901085767,-73.9209781210944,-73.9209691304401,-73.9209551536472,-73.9209302080564,-73.9209292005764,-73.9209182304665,-73.9209132218316,-73.9209032551543,-73.9208942845129,-73.9208755919967,-73.9208060964406,-73.920761627382,-73.9207209780556,-73.9206521784322,-73.9206083874152,-73.9205677100342,-73.9204832770825,-73.9203863158277,-73.9202956159237,-73.9202612447753,-73.9202174638263,-73.9201267665571,-73.9200517124044,-73.9199766486526,-73.9199516140029,-73.9198796450636,-73.9198170880567,-73.9197420473926,-73.9196982810764,-73.9196638817296,-73.9196263365378,-73.9195950773441,-73.9195606636796,-73.9195168658849,-73.9194042833356,-73.9192572909282,-73.9191790912232,-73.9191321642716,-73.9190977731763,-73.9190008227635,-73.918944549657,-73.9188752589724,-73.9188488092111,-73.9188837788074,-73.9189416629275,-73.9189980756303,-73.9190356498488,-73.9190638540166,-73.9190889244292,-73.9190858242829,-73.9191046383589,-73.9191140975085,-73.9191485607419,-73.9191767696481,-73.9191893066728,-73.9191956364688,-73.9191957346041,-73.919211480104,-73.9192522590831,-73.9192586234016,-73.9192462105032,-73.9192743831804,-73.9192400106065,-73.9192212391896,-73.919183710112,-73.9191524739693,-73.919099362582,-73.9190525010765,-73.9189993718673,-73.918928512305,-73.9189158131918,-73.918897129935,-73.9188824798226,-73.9188714911105,-73.918864157249,-73.9188601206762,-73.9188483962036,-73.9188385043048,-73.9188293485031,-73.9188212902824,-73.918811397262,-73.9187996761804,-73.9187875919043,-73.9187758746761,-73.9187659925241,-73.9187583127834,-73.9187477018359,-73.9187374494981,-73.9187253689674,-73.9187198811279,-73.9187132918374,-73.9187132972757,-73.9187135598064,-73.9187136757615,-73.9187048926786,-73.9186975744079,-73.9186994140037,-73.9187089454237,-73.9187170111132,-73.9187225109606,-73.9187228821898,-73.9187203217887,-73.9187133628724,-73.9187075009716,-73.9186957749442,-73.9186715993101,-73.9186598697412,-73.9186528993969,-73.9186488600856,-73.9186411650426,-73.9186320045074,-73.9186174577788,-73.9186034886986,-73.9185868115471,-73.9185703476012,-73.9185652119137,-73.9185657132393,-73.9185662578638,-73.918550825426,-73.9185312632154,-73.9185266692982,-73.9185164289358,-73.918507990951,-73.9185038805398,-73.918499956622,-73.9184811580041,-73.9184403784965,-73.9184089214903,-73.9183914313134,-73.9183972280834,-73.9184169875845,-73.9184472591926,-73.918494997155,-73.9185322631801,-73.91859397285,-73.9186125966822,-73.91862886554,-73.9186276589475,-73.9186124721955,-73.9185972986632,-73.9185728304931,-73.9185611637771,-73.9185273531111,-73.9184958727611,-73.9184690462814,-73.9184539052142,-73.9184387762835,-73.9184119825546,-73.9184014816919,-73.9184247555451,-73.9184247360163,-73.918417720767,-73.9184107122455,-73.9183874047286,-73.9183734080716,-73.9183524161042,-73.9183279207093,-73.9182952725402,-73.9182463125657,-73.9181985232556,-73.9181786973527,-73.9181623589765,-73.918147176506,-73.9181226907861,-73.9181040362078,-73.9180589342757,-73.9180516579744,-73.9180371567266,-73.9179410836636,-73.9179290291799,-73.9177546809532,-73.9177699032563,-73.9175772988473,-73.9174992100054,-73.9176906605858,-73.9177093110948,-73.9178903209832,-73.9178850663064,-73.9178714491751,-73.9177301627013,-73.9176868311414,-73.9176208626149,-73.9175680835195,-73.9175058717097,-73.9174041319876,-73.9173005073949,-73.9172458830367,-73.9171592091786,-73.9170895003867,-73.9170555460038,-73.9169670054334,-73.9168973268623,-73.9167899449282,-73.916693855044,-73.9166090544487,-73.9164866173023,-73.9164357393214,-73.9163434866757,-73.9162121632286,-73.916098527203,-73.9160167512421,-73.9158903312502,-73.9157660498781,-73.9156846308447,-73.9155775103736,-73.915401837362,-73.9152240214606,-73.9150698014154,-73.9149819860697,-73.9146328327852,-73.9142216790583,-73.9141978490461,-73.9139970622633,-73.9139027384917,-73.9135851370558,-73.913497431898,-73.9133451051018,-73.9132937338413,-73.9132489069351,-73.9131941925364,-73.9131425642534,-73.913095589203,-73.9130399794851,-73.91298019757,-73.9128898671973,-73.9127315413304,-73.9126107330855,-73.9125027925933,-73.9122891862131,-73.9120781847149,-73.9116381573252,-73.9115779140944,-73.9115151612332,-73.9114259618443,-73.9113587827129,-73.9113050346001,-73.911274316958,-73.911224414078,-73.911190844095,-73.9111841125018,-73.9111745070815,-73.9111802852213,-73.9111668550319,-73.9111534281913,-73.9111035404607,-73.9110997170905,-73.9111045435437,-73.9110843923963,-73.9110556063183,-73.9110364351832,-73.9110393459936,-73.9110124714732,-73.9109923425105,-73.9109808474126,-73.9109674252256,-73.9109616926925,-73.9109444054977,-73.9109146688595,-73.910832116359,-73.9107630311513,-73.9106966318179,-73.9106688625046,-73.9106487727774,-73.9106440262089,-73.9106000469293,-73.9105646933813,-73.9105408206228,-73.910537972124,-73.9105533301621,-73.910544749547,-73.9105180237903,-73.9104951419257,-73.9104846815837,-73.9104792010068,-73.9104728424446,-73.9104607595298,-73.9104532583538,-73.9104475430646,-73.910442654861,-73.9104264404851,-73.9104290375281,-73.9104442043008,-73.9104495563106,-73.9104510707769,-73.9104461518659,-73.9104336357045,-73.9104477053661,-73.9104646861784,-73.9104729204696,-73.9104936731184,-73.9105116504589,-73.9105209406515,-73.9105435776205,-73.9105594216908,-73.910550649178,-73.9105580894439,-73.9105782849544,-73.9105895707351,-73.9106015951629,-73.9106184554237,-73.9106500006567,-73.9106517779721,-73.9106611016346,-73.9106819282989,-73.9106940639599,-73.9107032613541,-73.9107162572217,-73.910723558799,-73.9107141200385,-73.9106998335503,-73.910677936501,-73.910679070694,-73.9106907232939,-73.9106918236907,-73.9107159481226,-73.9107189879324,-73.9107268069749,-73.9107376520868,-73.9107456109542,-73.9107255729735,-73.9107499177199,-73.9107528703789,-73.9107568063354,-73.9107521234364,-73.9107609030462,-73.9107640087742,-73.9107489270498,-73.9107557348127,-73.9107722269282,-73.9107588776987,-73.9107630768279,-73.9107681122628,-73.9107645322483,-73.9107483141362,-73.9107696662573,-73.9107727265008,-73.9107796756165,-73.9107807730844,-73.9108041995759,-73.9108016053432,-73.9108017662899,-73.9108095372899,-73.9108048771484,-73.910812803668,-73.9108158335099,-73.9108091403541,-73.9108266257386,-73.91083344969,-73.9108335617768,-73.9108500345866,-73.9108501910031,-73.9108415844009,-73.9108406897731,-73.9108542633135,-73.9108602040685,-73.9108767745142,-73.9108623829233,-73.910873077424,-73.910882891482,-73.910884008707,-73.9108533419753,-73.9108764398726,-73.9108967454211,-73.9109094229351,-73.9109239562781,-73.9109153802726,-73.9109164799314,-73.9109251965825,-73.9109185565617,-73.9109408974881,-73.9109469167145,-73.9109249122423,-73.9109558266559,-73.9109866222138,-73.9110086359316,-73.9110393651462,-73.9110577159244,-73.9111324541512,-73.9111890357751,-73.9112561168321,-73.9113040204297,-73.9113462137163,-73.9113817739029,-73.911439622141,-73.9114637661276,-73.9114744889911,-73.9114718867,-73.9114634760692,-73.911424157791,-73.9114165348974,-73.9114002186208,-73.9113935452734,-73.9113580346658,-73.9113553083027,-73.9111224450976,-73.9111169087127,-73.911096730675,-73.9110612575129,-73.9110305795026,-73.9110548931391,-73.9110752967634,-73.9110792521463,-73.9110755316097,-73.9110929071396,-73.9110920271011,-73.9111187176876,-73.9111336600876,-73.9111203524456,-73.9111393222259,-73.9111289088176,-73.9111425919621,-73.9111486989594,-73.9111652354321,-73.9111998585109,-73.9112509470194,-73.91128256772,-73.9113037428697,-73.9113281775882,-73.9113348313459,-73.9113374209974,-73.9113297074864,-73.9113340264439,-73.911325479081,-73.911331498918,-73.9113255355442,-73.9113350016029,-73.9113504607765,-73.9113470512368,-73.9113590915022,-73.9113642705532,-73.911390049729,-73.9114098549045,-73.9114193268045,-73.9114416590703,-73.9114820814421,-73.9114924213864,-73.9114924482575,-73.9115053875513,-73.9115148587101,-73.911524323373,-73.9115354748478,-73.911540659413,-73.9115801924497,-73.9116016621044,-73.9116248556219,-73.9116531981748,-73.9116678135412,-73.9117116303806,-73.9117283316877,-73.911731920643,-73.9117300618978,-73.9117338348192,-73.9117256975957,-73.9117257108521,-73.9117251038061,-73.9117364014255,-73.9117351623112,-73.9117552250195,-73.9117527627056,-73.9117690776385,-73.9117803828235,-73.9117966804086,-73.91180859604,-73.9117942026244,-73.9117967655827,-73.9118055603456,-73.9118237604906,-73.9118457109202,-73.9118710108949,-73.9118896022712,-73.9118922526095,-73.9119115986588,-73.9118477464682,-73.911992967857,-73.9120975526719,-73.9122296295346,-73.9124521529893,-73.9126175467602,-73.9127317391952,-73.912552193527,-73.9125477513028,-73.9128285969364,-73.9131201510073,-73.9135199770815,-73.9138448505673,-73.9139186313324,-73.9139352695202,-73.9140386683301,-73.9141682169297,-73.914252578196,-73.9143120071251,-73.9143892269675,-73.9149238792787,-73.9149286371918,-73.9145403762602,-73.9144739760624,-73.9144111339268,-73.9150440759955,-73.9150740494131,-73.9150858385433,-73.9151683337169,-73.9152551192883,-73.9154318971828,-73.9154286973113,-73.9154340839883,-73.9154587239743,-73.9154534272654,-73.9156323634767,-73.9156387430054,-73.9156644439217,-73.9157115910557,-73.9157587290516,-73.915816585666,-73.9158605206304,-73.9158991164586,-73.915922708197,-73.9159356143907,-73.9159313804988,-73.9159260581022,-73.915898242309,-73.9158714806572,-73.915854349065,-73.9158326451179,-73.915790097378,-73.9157418999245,-73.9157259602557,-73.9156672828416,-73.915615690799,-73.9155837769082,-73.9155387298528,-73.9154934082792,-73.9154398263046,-73.9154055421182,-73.9153844408084,-73.9153745421641,-73.915359819686,-73.915345791037,-73.9153328144197,-73.9153212211744,-73.9153113073186,-73.9153057121835,-73.9152982825845,-73.9152892391494,-73.9152788504299,-73.9152674249267,-73.915240671774,-73.9152158469832,-73.9151957480016,-73.915188031063,-73.9151850595429,-73.9151819299481,-73.9151811948699,-73.9151788001804,-73.9151769384685,-73.9151765655714,-73.9151753977913,-73.9151755642971,-73.9152007107961,-73.9152181857278,-73.9152544391968,-73.915296763934,-73.9153081024622,-73.915344558139,-73.9153619001513,-73.9153740428823,-73.9154165736364,-73.915427025482,-73.9154686342927,-73.9154768244425,-73.915485164641,-73.9154730685431,-73.9154598747822,-73.9154506153671,-73.9154549655414,-73.9154229570089,-73.9154108333567,-73.9153450668942,-73.9154109612745,-73.9153867305114,-73.9154497053343,-73.9154996593965,-73.9155201532824,-73.9155657804495,-73.9155759526675,-73.9155629969495,-73.9155799152005,-73.9155889237252,-73.9155996450579,-73.9155940154285,-73.9156036101675,-73.9156182725241,-73.9156719977999,-73.9156820490604,-73.9156932336194,-73.9157190745788,-73.9157801479673,-73.915818689298,-73.9158388384917,-73.9158576884208,-73.9158645057258,-73.9158696233993,-73.9159336316873,-73.9159518546962,-73.9159526003021,-73.9161051792777,-73.916169354391,-73.916204849469,-73.9162252214126,-73.9162763501275,-73.9163917500321,-73.9164001918305,-73.9164260548227,-73.9164919667945,-73.9165251204384,-73.9165343852264,-73.916568927461,-73.9165963902928,-73.916601917786,-73.9166172045856,-73.9166382302499,-73.9166469633485,-73.9166617397902,-73.9167248371416,-73.9167320678522,-73.9167468904528,-73.9167543144542,-73.9167615341138,-73.9167811300425,-73.9167858494834,-73.9167953482249,-73.9168510078067,-73.9168788936747,-73.9169203986594,-73.9169581550374,-73.9169843735389,-73.9170096707588,-73.9170154616345,-73.9170512980185,-73.917069094196,-73.9170913596197,-73.9171527875946,-73.9172305691993,-73.9172703439263,-73.9172946774168,-73.9173427791736,-73.9173784192024,-73.9174081070895,-73.9174099446934,-73.9174601982095,-73.9174806139373,-73.9175040118264,-73.9175156044248,-73.9175329272892,-73.9175474961808,-73.9175641334226,-73.9175717660054,-73.9175925656434,-73.9176140530771,-73.9176563633175,-73.9176882562444,-73.9177291765482,-73.91778534144,-73.9178082344227,-73.9178270238015,-73.9178222194557,-73.91783553765,-73.9178246813906,-73.9178213642032,-73.9178410378002,-73.9178611574681,-73.9178653636892,-73.9178770705497,-73.9178821133228,-73.9179047245443,-73.9179021167353,-73.9179219058387,-73.9179223464631,-73.9178838738761,-73.9179282856633,-73.9179506177165,-73.9180522105659,-73.9182626496834,-73.9184343925179,-73.9183607452798,-73.9183764802734,-73.9183873872012,-73.9183990354325,-73.9183931121764,-73.9184107171477,-73.918428283844,-73.9184310024095,-73.9184350811156,-73.9184513377764,-73.9184675509689,-73.9184919029045,-73.9185000296487,-73.918528450777,-73.9185595395527,-73.9185879382569,-73.9186109492842,-73.918604223591,-73.91860966059,-73.9186205143219,-73.9186421524151,-73.9186665028499,-73.9186786605747,-73.9186948899459,-73.9186935455488,-73.9187030255635,-73.9186868141633,-73.9187383939309,-73.9187207993234,-73.9188014004671,-73.918777966001,-73.9188857796498,-73.9189033820166,-73.9190035057638,-73.9191361113191,-73.9192321799137,-73.9193377208542,-73.9194013115771,-73.9194385354145,-73.9194809629505,-73.9195021366093,-73.9195234232406,-73.9195456419021,-73.9195462733529,-73.9198077160953,-73.9200835336932,-73.9202757085523,-73.9202665242277,-73.920344957478,-73.9203980513715,-73.9204129916345,-73.9204346715059,-73.9204446658872,-73.9204613430747,-73.9203255179472,-73.9202695892376,-73.9202422842815,-73.9202083343909,-73.9201983463336,-73.9200964799356,-73.9200691729343,-73.9199566565892,-73.9199353497549,-73.9199087158952,-73.9198467968921,-73.919772234095,-73.9197742461086,-73.9198414912715,-73.9199153917475,-73.9199620037515,-73.9200731723363,-73.9204786827316,-73.9204308949874,-73.9204405543496,-73.920433507429,-73.9205090668941,-73.9205081803775,-73.9206197676956,-73.9206531620978,-73.9206707068003,-73.9206979225747,-73.9206934889054,-73.9207479327707,-73.9208154712133,-73.9208248103988,-73.9209663898829,-73.921071666769,-73.9212024520102,-73.9212709129631,-73.9213218707345,-73.9213403221303,-73.9213456057134,-73.9213640618382,-73.9213939762687,-73.9214309172988,-73.9214590637499,-73.9215162352229,-73.9215162438841,-73.9215426504243,-73.9215567174098,-73.9215901484823,-73.9216333546269,-73.9216606844962,-73.9216879995089,-73.9217065432762,-73.9217180392708,-73.9217013602332,-73.921710175143,-73.9217365409028,-73.9217383262247,-73.9217225201101,-73.9217040673148,-73.921686484502,-73.9216970573757,-73.9216812384696,-73.921664557898,-73.9216707277948,-73.9216689701736,-73.9216478841654,-73.9216487848248,-73.9216900992031,-73.9217305218131,-73.9217199644337,-73.921754251406,-73.9217401725026,-73.9217586285425,-73.9217692081425,-73.921803484984,-73.9218034983237,-73.9218166934147,-73.9218157942612,-73.921833378049,-73.9218360285277,-73.9218395729169,-73.9218264000163,-73.9218009271,-73.921784213729,-73.9217842341367,-73.9217895154286,-73.9217912811125,-73.9217833791678,-73.9217781399936,-73.9217553152321,-73.9217447590962,-73.9217280785568,-73.9217386270276,-73.9217421651519,-73.92178084463,-73.9218010581484,-73.9218142212325,-73.9218458912521,-73.9218274385752,-73.9217931831409,-73.921806387584,-73.9218362834467,-73.9218415890083,-73.9218565440059,-73.9218556898008,-73.9218636361759,-73.9218715946483,-73.9218663378371,-73.9218487832654,-73.921810131376,-73.9218286005297,-73.9218180732654,-73.921795231341,-73.9217539205986,-73.9217134856952,-73.9217003121197,-73.921683623464,-73.9216713330465,-73.9216563779765,-73.9216414419963,-73.9216229910233,-73.9215764035827,-73.9215632347676,-73.9215368812828,-73.9215166780508,-73.9214964754598,-73.9214824181689,-73.9214569384195,-73.9214367468757,-73.9214147843838,-73.9214068883123,-73.9213954545154,-73.9213849188486,-73.9213620792983,-73.9213409867892,-73.9213225389184,-73.9213067267439,-73.9212961943727,-73.9213137878253,-73.9213454201629,-73.9213700173977,-73.9213884715815,-73.9213700387011,-73.9213331315342,-73.9213094017866,-73.9212777512901,-73.921255801368,-73.9212391392653,-73.9212391637707,-73.9212497192712,-73.9212550224095,-73.9212638415485,-73.9212568347568,-73.9212392823221,-73.9212102776103,-73.9211883273274,-73.9211725300235,-73.9211329828573,-73.9211040004343,-73.9211093004329,-73.9211207323223,-73.9211031742926,-73.9210891142833,-73.9210856169333,-73.921071552431,-73.9211023676908,-73.9211138364303,-73.9211217794422,-73.921091896552,-73.9210822401778,-73.9210681923046,-73.9210655835521,-73.9210585763393,-73.9210735549948,-73.9210788512476,-73.9210586444682,-73.9210788726283,-73.9210876764655,-73.921063950884,-73.9209971288288,-73.9209874801556,-73.9209416573558,-73.9209295008289,-73.9209145985773,-73.9209386901695,-73.9211439658906,-73.9212232365865,-73.9213047520937,-73.9213637802687,-73.9214016978275,-73.9214596350665,-73.9215196726863,-73.9215555046349,-73.9215839706,-73.9215924259899,-73.9215861444796,-73.921579852046,-73.9215584962263,-73.9215585715575,-73.9215916070457,-73.9216179420979,-73.9216463840934,-73.9216632398164,-73.921703268055,-73.9217443405415,-73.9218012150449,-73.9218370216017,-73.9218633459786,-73.9218865189657,-73.9219002180637,-73.9219181423116,-73.9219413289672,-73.9219697849263,-73.9220449221585,-73.9220746494814,-73.9221574720228,-73.9221686514731,-73.9221463715993,-73.9221097526092,-73.9221671472886,-73.9222197224955,-73.9222468258278,-73.9222929912717,-73.9223328252373,-73.9223769574235,-73.9223714262498,-73.9223446518775,-73.9223746864714,-73.9223758086544,-73.9223445937413,-73.9223421789856,-73.9223363626243,-73.9223297127633,-73.9223288808107,-73.9223278533008,-73.9221957219213,-73.9221787422939,-73.9221811759476,-73.9221829564415,-73.9221840412878,-73.9221844030083,-73.9221840322178,-73.922182937403,-73.9221811462436,-73.9221787036248,-73.9221756733967,-73.9221721288896,-73.922168159748,-73.9221638672952,-73.9221593579167,-73.922154744381,-73.9221501429705,-73.9220633513252,-73.9220770456546,-73.9219520146898,-73.9218732215312,-73.9218876011372,-73.9218175009566,-73.921835493306,-73.9217650845441,-73.921770197447,-73.921698419047,-73.9215189405909,-73.9215907870523,-73.9215969651288,-73.9216718169157,-73.9216897037403,-73.9217596562976,-73.9218232504461,-73.922029567318,-73.9220417170053,-73.922129095313,-73.922127017599,-73.9221256357995,-73.9221249855579,-73.9221250837518,-73.9221259252049,-73.9221274921577,-73.9221297421469,-73.922132619479,-73.9221360483901,-73.9221399440835,-73.9221442056686,-73.9221487254294,-73.922153388387,-73.9221580751638,-73.9221850575136,-73.922218950847,-73.9222355710661,-73.9222593171054,-73.9222721991391,-73.9222811377407,-73.9222883228323,-73.922288370576,-73.9222961101451,-73.9222787306448,-73.9224003587528,-73.9226692969529,-73.9228198567377,-73.9229011413959,-73.9231329851651,-73.9234158418362,-73.9236059522068,-73.9240093922051,-73.9244406513995,-73.9246702118401,-73.9249739691404,-73.9250219122972,-73.925033268598,-73.9250729486687,-73.9251098027102,-73.9251466652887,-73.9251551810145,-73.9251721772904,-73.9252175403106,-73.9252770793833,-73.9252969415281,-73.9253479660684,-73.9254245160487,-73.9254897303231,-73.9255322454736,-73.9255435930326,-73.9256399903463,-73.9256626741845,-73.9257363868127,-73.9257554427499,-73.9258536330909,-73.9258797041968,-73.9258946157337,-73.9260287750863,-73.926238172494,-73.9262560777891,-73.9264945575954,-73.9267143909259,-73.9269230351983,-73.9271167964547,-73.9272546636921,-73.9274036912767,-73.9275229333255,-73.9276533485824,-73.9279737783045,-73.9281379897654,-73.9282169326215,-73.9283915103659,-73.9284220094767,-73.92845501929,-73.9284899482772,-73.9292854401953,-73.9293252284206,-73.9293807879704,-73.9294284591942,-73.9296177884118,-73.9296763121654,-73.9297185047759,-73.9297655896516,-73.9298142904901,-73.929869492199,-73.9299230671316,-73.9299896381694,-73.9300464807203,-73.9300984461563,-73.9301520363543,-73.9302235221325,-73.9302738909538,-73.9303193952958,-73.9303990207569,-73.9304526659845,-73.9304997882218,-73.9305453004993,-73.9305696689228,-73.9305794278086,-73.9306281815354,-73.9306752990735,-73.930698058286,-73.9307273630006,-73.9307728292194,-73.9307858076327,-73.9308020456186,-73.9308101941584,-73.9308946520142,-73.9309748803967,-73.9312222988686,-73.9313588895499,-73.9315292968668,-73.9318346149095,-73.9321620165716,-73.9327955579716,-73.9329597324678,-73.9330991815074,-73.9331680637908,-73.9332666973026,-73.9333568436148,-73.933418072186,-73.9334665418099,-73.9335311701697,-73.9336383069462,-73.9337751779351,-73.933909528764,-73.9340149800834,-73.934102580685,-73.9341982323781,-73.934284477939,-73.9343124535887,-73.9343613270564,-73.9344523939737],"lat":[40.8359809601499,40.8360501920772,40.8360649032392,40.8360920946286,40.8361101162622,40.8359850255776,40.8357599347499,40.83567765881,40.8354777249337,40.8351563465998,40.834513016174,40.834193110683,40.8339759182039,40.8334428170631,40.8333574897971,40.8332699288509,40.8331801993726,40.8330883682452,40.8329945036773,40.8328986755061,40.8326632126625,40.8324173363284,40.831907802484,40.8318230954371,40.8317395369171,40.8316574013863,40.8315769586316,40.831498472879,40.8314222020974,40.8313483966379,40.8312772989227,40.8312091424794,40.8311441511741,40.8310803925658,40.8310146147957,40.8309469808753,40.830877657591,40.8308068175587,40.8307346363336,40.8304899742724,40.8303719888808,40.8304578428499,40.8307668513735,40.8308908380831,40.8315679803621,40.832721413266,40.8327654612874,40.8328064897023,40.8338493081219,40.8340652988768,40.8342106585955,40.8343585898328,40.8344107166949,40.8344193619186,40.8344343300863,40.8344492900065,40.8344559645116,40.8344592868663,40.8344370306769,40.8343031199584,40.8352847212616,40.8354898412104,40.8355204338844,40.8356280878249,40.8357056544778,40.8357749902843,40.8358625809435,40.8359218833707,40.8360411393738,40.8360742774975,40.836109863325,40.8361909399708,40.8362202547503,40.836232103601,40.8363050988022,40.8364839378369,40.8366043715018,40.8366654896875,40.8367056194738,40.836715621438,40.8367192509365,40.836729292485,40.8367327757908,40.8367366454232,40.8367407865633,40.836745076336,40.8367493874559,40.8367535920044,40.8367575652248,40.8367611892245,40.8367643564728,40.8367669729917,40.8367689611441,40.83678033442,40.8367916993169,40.8367921570185,40.8368149814895,40.8368796319257,40.8378640101217,40.8379335525577,40.8384255885336,40.8386434262861,40.8388756358441,40.8390202374826,40.8393013452182,40.8395648851617,40.8396675931725,40.8398608541507,40.8399973353835,40.8400635406622,40.84011759627,40.8404662589754,40.8406541081988,40.8408960125876,40.8411257563313,40.8412636068662,40.8414095476823,40.8415286673707,40.8416974638817,40.8419408258019,40.8420517829701,40.8421011266968,40.8421590990434,40.8422586241128,40.8422855969407,40.8423067875789,40.8425395701268,40.8426191980068,40.8427048228943,40.8428151274789,40.8428884615156,40.8429441246516,40.843020098338,40.8431199811594,40.8432543837634,40.8434547799548,40.843559770439,40.8436712045786,40.843754098968,40.8438885687693,40.8438924965572,40.8440047374941,40.8440550520473,40.844097355249,40.8441962775262,40.8442249656692,40.8442911486529,40.8443497226354,40.8444681819652,40.844498801346,40.8445976703284,40.8448585749908,40.8448795547159,40.8449118071587,40.8449397574234,40.8450298449195,40.8451258270579,40.8451979727793,40.8452317931129,40.8452591663413,40.8453336251319,40.8453659152132,40.8453928915807,40.845461745739,40.8455769807446,40.8456906599184,40.8457409343261,40.8458859229234,40.8458812609095,40.8459197780731,40.845921488093,40.8459646873136,40.8459951844038,40.8460281997677,40.8460581650962,40.8460633386284,40.8461564486068,40.8462403312893,40.8463612916224,40.8464399199942,40.8465286181635,40.8465931398507,40.8466848945391,40.8468247587498,40.8469967493454,40.8471342620698,40.8472884466375,40.8473533891968,40.8474059593372,40.8474973938724,40.8477283950443,40.8478833204836,40.8479392921505,40.8481455194915,40.8482140178312,40.848278425912,40.8483993338854,40.8486676042168,40.8488374590931,40.8489124250597,40.8490050104117,40.8490456941009,40.8490943772971,40.8492317834168,40.8492674972145,40.8493026676951,40.8493519342913,40.849382821351,40.8494276801997,40.849539471265,40.8495928415692,40.8496394530808,40.8496741487555,40.8498151745353,40.8498489584905,40.8498591644656,40.8498900978619,40.8499559242922,40.8499852594493,40.8499956659208,40.8499945330706,40.8500418318125,40.8500621145911,40.8500818672712,40.8500898950813,40.8500977352221,40.8501116557755,40.8501188303829,40.8501269959827,40.8501447599336,40.8501950927356,40.8502233492284,40.8502547459878,40.8503293287003,40.8503440679935,40.8503562926568,40.8503865201127,40.8503980308427,40.8504655258182,40.8505280556684,40.8505895968588,40.8506490391781,40.8506613719885,40.8509683390805,40.8509756656088,40.8509814205397,40.8509854828334,40.8509876209119,40.8509882815855,40.8509874535933,40.8509851407828,40.8509813836728,40.8509762467119,40.850969818018,40.8509478263247,40.850923256677,40.8509043768703,40.8508930733055,40.8508699646573,40.8508528959462,40.8508460330769,40.8508386961086,40.8508331353309,40.850840977173,40.8508845429949,40.8509056662035,40.8509579544857,40.8509741720725,40.8510314881054,40.8510314696569,40.8510521198151,40.851047286469,40.8510312906284,40.851007465882,40.8509839318436,40.8509687541416,40.8509663412482,40.8509807148811,40.8510080629992,40.8510326024698,40.8510335756094,40.8510936994676,40.8511547260646,40.8511725825172,40.8511885509714,40.8511718748365,40.8511897217072,40.8511873391037,40.8511694766442,40.8511694656572,40.8511968323184,40.8512277731899,40.8512265766246,40.8512110978387,40.8512396531049,40.851320567777,40.851320563339,40.8513622126592,40.851371858148,40.8514276592095,40.8514264664057,40.8514157510614,40.851426458196,40.8514526364118,40.8514692889846,40.8514847630188,40.8514942774866,40.8514918868513,40.8515192592296,40.8515460437308,40.8515710290538,40.8515924459341,40.8515864846071,40.851638831106,40.851670957841,40.8517019012563,40.851731648003,40.8517304422577,40.8517538227642,40.8517962897328,40.8518010529019,40.8518153941233,40.8518240937692,40.8518357343676,40.8518625058569,40.8518771540471,40.8519100099595,40.8519212260068,40.8519094970436,40.851927342346,40.8519428155667,40.8519570794526,40.8519237581213,40.8518993981424,40.8518898985121,40.851888798325,40.8518993908867,40.8518975677551,40.8519047047313,40.8518928026739,40.8518547205951,40.8518249617797,40.8518225764386,40.8518558933936,40.8518820743217,40.8519201493655,40.8519296557293,40.8519760733924,40.8520153418159,40.8520272295895,40.8520153196308,40.8519998436644,40.8520414905522,40.8521188413205,40.8521723777101,40.8521979529642,40.8522310207162,40.8522818824446,40.852601430147,40.852626177871,40.8528512338899,40.8530679147468,40.8531712778092,40.8536541074557,40.8538677394428,40.8539899601301,40.8541083885494,40.8543471438085,40.8544356435961,40.8545001267486,40.8545083843677,40.8546846304862,40.8547955397552,40.8549440787885,40.8550098879769,40.8553050386426,40.8553586189386,40.8554150396348,40.8555203343945,40.8556218307785,40.8558079714676,40.8558474469204,40.8558530660602,40.8560110007425,40.8562046288227,40.856372905782,40.8565158035758,40.8566417706576,40.8568335170572,40.8568560512977,40.8569500456452,40.8570666142561,40.857234836996,40.857289321036,40.8573964763968,40.8576652979722,40.8577405057384,40.8578608227914,40.8578936942311,40.8580409112258,40.8582020163639,40.8584069374233,40.8587340304193,40.858768813622,40.8590113350078,40.8590733621212,40.8591662459671,40.8593805236081,40.859830271233,40.8599335122394,40.8600813563253,40.8600966412821,40.8601118788476,40.860123674583,40.8601495403266,40.8602032066512,40.8605151212902,40.8607836372022,40.8609252429913,40.8610575329789,40.8611432190252,40.8612580237499,40.8612790816266,40.8613158186805,40.86136346606,40.8619265916733,40.8625440923962,40.8629650518521,40.8639655769349,40.8640963392407,40.864269871045,40.8645037317338,40.8647329070684,40.8648138978227,40.8648791075311,40.8649778101482,40.8650355482916,40.8651958176667,40.8653467462099,40.8654100461119,40.8654286342686,40.8657090194233,40.8657667509443,40.8658412955388,40.8659456148249,40.8659865819954,40.8660480758076,40.8661356468399,40.8662380950142,40.866241784581,40.8664262137896,40.8665574187251,40.8669820482055,40.867237066437,40.867264360168,40.8672522975572,40.8672930438997,40.8674152769114,40.8673584776424,40.8673296613538,40.8673113496704,40.8674138335016,40.8674105033659,40.8675682479211,40.8676938932448,40.8678633010079,40.8679791202954,40.8680071956979,40.868037214476,40.8680634885758,40.8684771519779,40.8685325381576,40.8685623189724,40.868578111887,40.8686041428961,40.8686597654689,40.8686775191597,40.8686748094245,40.8686132719139,40.8686030783756,40.8685498472381,40.8685319098233,40.8684743473795,40.8684613849858,40.8684561679742,40.8684572743171,40.8684650334819,40.868640259233,40.8686420055912,40.8686480838561,40.868722078359,40.8687143527316,40.8687061253913,40.8687019503915,40.8686470281624,40.8686292390398,40.8686473709179,40.8686395088701,40.8686833988555,40.8687111569726,40.8688751423904,40.8689237203438,40.8689496097985,40.8689622731782,40.8689680023623,40.868979403214,40.8690443914739,40.8691295586652,40.8691873031101,40.8691995019423,40.8693669763891,40.869476099387,40.8697552552966,40.8697347716401,40.8695073632194,40.869415975441,40.8694772491017,40.86954268416,40.8695828168867,40.8696007507444,40.8696417467827,40.8696994277864,40.8697596511453,40.8698223664003,40.8698448707435,40.8700964451045,40.8703789431052,40.8705829039667,40.8707572025348,40.8711294937228,40.8713344229238,40.87158387547,40.8717977162066,40.8721086273607,40.872335322856,40.8726668065288,40.8728871703079,40.8731568769005,40.8743389623304,40.8744184415252,40.875294438561,40.8755555489664,40.8757386600902,40.876096010295,40.8763534690848,40.876522528944,40.8765824425059,40.8766176853765,40.876710534813,40.8772166344347,40.8775076312118,40.87758369128,40.8776182030179,40.8776100477008,40.8776214765374,40.8775923204627,40.8775650278757,40.8775506338821,40.8775374308973,40.8775235895297,40.8775060895173,40.8774884680905,40.8774711973945,40.877454740177,40.8774395373892,40.8774259963709,40.8774144799369,40.8774052966554,40.8773986925807,40.8773669656259,40.8773323669498,40.8772957922817,40.8772581885062,40.8772184044071,40.8771812576164,40.8771476893259,40.8771185500571,40.8770945781122,40.8770763808683,40.8770644193883,40.8770589967396,40.8770602503155,40.8770548675552,40.8770564469608,40.8770649769924,40.8770803953243,40.8771025893011,40.8771313967601,40.8771666072165,40.8772079634007,40.8772551631383,40.8772833622691,40.8773107323133,40.8773423726156,40.8773715375105,40.8773976106156,40.8773934774013,40.8773719622974,40.8773936372497,40.877410837546,40.8774234244108,40.8774323908053,40.8774342275695,40.8774289126333,40.8774165098596,40.8773971682764,40.8773174426567,40.8772700640755,40.8772618117109,40.8772585751075,40.8772604326544,40.8772673393627,40.8772791279546,40.8772955129148,40.8773013797371,40.8772644349572,40.8772167453458,40.877201401217,40.8771886779114,40.8771667680331,40.8771421666355,40.8771005790338,40.8770962119724,40.8770594793718,40.877034386157,40.8770263778511,40.8770125221739,40.8770059690955,40.8770049576484,40.8770133728904,40.8770047976539,40.8769904164038,40.8769790825587,40.8769760056179,40.8769715972223,40.8769537621515,40.876931817514,40.8769198661462,40.8769163528043,40.8769320637138,40.8769170265969,40.8769144949612,40.8769212336896,40.8769137800527,40.8769061772551,40.8768963422384,40.8768956774015,40.8768780897677,40.8768658324316,40.8768569187412,40.8768713104603,40.8768489288533,40.8768320445797,40.8768014652248,40.8767858914179,40.8767802231412,40.8767632317003,40.8767589349818,40.8767479378711,40.8765568556489,40.8763658248065,40.8761749952763,40.875984516831,40.8757945389668,40.8757431215487,40.8756918355591,40.8756411933424,40.8755917008109,40.8755438523901,40.8754348887644,40.8753238316046,40.8752110672823,40.8750969881063,40.8749819909582,40.8748664759106,40.8747508448364,40.8746355000096,40.8745208427066,40.8744072718099,40.8742951824202,40.8741849644826,40.8740770014294,40.873971668847,40.8738693331689,40.8737703504013,40.8736750648845,40.8735838080958,40.8734968974959,40.8734146354248,40.8733373080507,40.873265184374,40.8731985152924,40.8731375327275,40.873082448819,40.8730334551863,40.8730363931522,40.8730363733233,40.8730333960596,40.8730180498903,40.8730075058083,40.8730018869784,40.8730012590336,40.8730056293089,40.8730083143718,40.8730107080339,40.8730127447178,40.8730143686258,40.8730155352691,40.8730162126858,40.8730163823172,40.8730160395162,40.873011840458,40.8730043956631,40.8730056485616,40.8729987902473,40.8729910856156,40.8729952054424,40.8729987739631,40.8730169898392,40.8730321958372,40.8730444713919,40.873054529805,40.8730726662116,40.8730797857813,40.8730898803593,40.8731059058398,40.8730984166226,40.8731059782961,40.8731212258949,40.8731498055146,40.8731659007723,40.8731683959346,40.8731821269408,40.8731928344783,40.873208748321,40.8732217607303,40.8732347460574,40.8732537875096,40.8732833292058,40.8733235772303,40.8733539934522,40.8733808489737,40.8733982782056,40.8734097135067,40.8734504651365,40.8734714911908,40.8734873876354,40.8735130212587,40.8735326011033,40.8735410117399,40.8735553760776,40.8735780385408,40.8735902442389,40.873594792493,40.8735956758922,40.8736108191332,40.8736080814841,40.8736107319979,40.8736065121579,40.8736463110556,40.8736524504206,40.8736488362998,40.873648932924,40.8736542737823,40.8736693460208,40.8736791632408,40.8737009241341,40.8737219231193,40.8737302051708,40.8737444858466,40.8737557592927,40.8737730409511,40.8737978411985,40.8738196444988,40.8738293811032,40.8738444333085,40.8738456051708,40.8739233912036,40.8739054265169,40.8739197803451,40.8739377421856,40.8739611593436,40.8739439559092,40.8739628184367,40.8739785165083,40.8740162960233,40.8740510437418,40.8740842699144,40.8741069096158,40.8741370592891,40.8741600503281,40.8741451823987,40.8741805831901,40.8742069630454,40.8742348111288,40.8741773858655,40.8741789110844,40.8741940588667,40.8742152601,40.8742787429689,40.8742969117812,40.8743234151158,40.8743484014494,40.8743873937397,40.8743919336095,40.8744063250527,40.8744305548209,40.8744517555819,40.8744661470045,40.8744896115246,40.8745108168859,40.8745312585311,40.8745395887767,40.8745471695053,40.8745630601448,40.8745766945263,40.8745910734341,40.8746009227384,40.8746137946044,40.8746213595919,40.8746289410148,40.8746433310577,40.8746524144305,40.8746645283816,40.8746637786791,40.8746762799488,40.8746883920199,40.8747042968473,40.8747209506734,40.874739123049,40.8747512443371,40.8747618447056,40.8747800107502,40.8747981752427,40.8747996931078,40.8748133204558,40.8748277084521,40.8748428516068,40.8748413557892,40.8748640767411,40.8748814835157,40.8748951247069,40.8749027006161,40.8749345076661,40.8749602591966,40.8749780618044,40.8750136625935,40.875048492861,40.8750772747616,40.8750946885301,40.8751060493373,40.8751174046912,40.8751378408507,40.8751438929738,40.8751529696849,40.87516811862,40.8751756797112,40.8751832529178,40.8751885398035,40.8751961148627,40.8752036672727,40.8752067043121,40.8752097212554,40.8752218311102,40.8752346959552,40.8752384672065,40.8752528429074,40.8752672301934,40.8752763115283,40.8752853967606,40.8752929435237,40.8753088340025,40.8753194202021,40.8753436288027,40.8753678442235,40.8753769207709,40.8753852354942,40.8754003648103,40.8754185219736,40.8754291107283,40.8754374232059,40.8754464992335,40.8754533083851,40.8754646603152,40.8754661663826,40.87545783117,40.8754639500233,40.8754774924702,40.8754579959689,40.8754342171775,40.8754009179667,40.8753866373584,40.8753866093674,40.8753437987434,40.8753104811385,40.8752747912985,40.8752343908834,40.8752129843848,40.875174919778,40.8751392410755,40.8751106882332,40.8751130455062,40.8751129955633,40.8750939511804,40.8750463965961,40.8750131147231,40.8749964651518,40.8749940637038,40.8749679157474,40.8749631418246,40.8749559860418,40.8749036551076,40.8748441742439,40.8748227437655,40.8748155851425,40.8747918101611,40.8747513654788,40.8747109487898,40.8746789963927,40.8746179763849,40.8745568992121,40.8745114371774,40.8744378493496,40.8744164989716,40.8743808920188,40.8743500329707,40.8743262804207,40.874293042179,40.8742336700197,40.8741980681022,40.8741577106799,40.8741410943297,40.8740817199708,40.8740009668459,40.8739178493691,40.8738347482353,40.8737468735733,40.8736613605749,40.8736518804021,40.8736138549749,40.8736114660283,40.8735971892567,40.873552040249,40.8734854996524,40.8734260891654,40.8733737995076,40.8733165102158,40.8733244137316,40.8733269020534,40.8733268917565,40.8733277179604,40.8733343862435,40.8733407774165,40.8733441050542,40.8733460440427,40.873345203842,40.8733457541819,40.8733482493431,40.8733487971045,40.8733471204087,40.8733443329585,40.8733379308188,40.8733281943468,40.8733204024256,40.8733167809016,40.8733120460727,40.8733070381333,40.8733045308686,40.8733000823038,40.873292939148,40.8732897959989,40.8732833951306,40.8732783859006,40.8732714365071,40.8732650487079,40.8732583814526,40.8732533817546,40.8732492112002,40.8732464290205,40.873246424119,40.8732480881821,40.8732519724816,40.8732539013915,40.8732613998223,40.8732700132883,40.8732786293227,40.8732819597799,40.8732844559447,40.8732863559497,40.8732860167478,40.8732778730905,40.8732626921149,40.8732512716428,40.8732446786331,40.8732375098781,40.8732221731611,40.8732130886615,40.8732132309956,40.873213547587,40.8732065048323,40.8731982123975,40.8731917156039,40.8731956113037,40.8731973511958,40.8731973289591,40.873208814186,40.8732318116309,40.8732698532834,40.8732866788948,40.8733114746724,40.8733247666165,40.8733566475419,40.8733708106609,40.8734053130723,40.8734398031601,40.8734725146829,40.8734954973251,40.8734963644158,40.8735096218126,40.8735281696945,40.8735476040677,40.8735714628151,40.8735679147051,40.8735537540312,40.8735510827025,40.8735625716988,40.87358558267,40.8736015006742,40.8736218366703,40.8736368660505,40.8736412713342,40.8736545270639,40.8736713152546,40.8736942917676,40.8737146096121,40.8737366845985,40.8737534537738,40.8737693584062,40.873791456314,40.8738215142154,40.8738365311799,40.8738471306805,40.8738498679841,40.8738625454665,40.8738972582906,40.8739831478103,40.8739788932051,40.8742485345662,40.8742543038425,40.8745486785472,40.8745200785402,40.8742252221832,40.8742324940793,40.8739624782543,40.8739602501476,40.8739049952887,40.8740231597222,40.8740359947418,40.874078833507,40.8741173929048,40.8741688114545,40.8742030473512,40.874238711782,40.8742458198168,40.8742800663,40.8743014593244,40.8743457502328,40.8743671298139,40.8743642202119,40.8743927337827,40.8744255431514,40.8744683677399,40.8744868635092,40.8745096987334,40.8745238498897,40.8745035833653,40.8745001588918,40.8745148499584,40.8745196373244,40.8745276775628,40.8745276181051,40.8745194089048,40.8745030163073,40.8744866218682,40.8744491021407,40.8744246421399,40.8743266210968,40.8741996036456,40.8741893553126,40.8741262854577,40.8740957001749,40.8740253797859,40.8739883205172,40.8739442154148,40.8739355864263,40.8739205024874,40.8738853808933,40.8738608527235,40.8738457490155,40.873833821548,40.8738353552193,40.8738258952373,40.873795081751,40.8737573161231,40.8737194123703,40.8736289043189,40.8735246341791,40.8733023648453,40.8732715874743,40.8732366296253,40.8731817666524,40.8731277571354,40.8730919848904,40.8730635217613,40.873027751932,40.8729847074077,40.8729883510421,40.872984695839,40.8729744879261,40.8729562506,40.8729431101575,40.8728847349208,40.8728679641107,40.8728511987912,40.8728263828483,40.8728008393959,40.8727716567113,40.8727483246968,40.8727220536473,40.8726899521357,40.8726600447944,40.8726439954662,40.8726170101466,40.8726082445753,40.8725739469484,40.8725177377356,40.8724520631146,40.8723632735469,40.8723180825276,40.8722962489632,40.8722620528649,40.8721849286295,40.8721165358204,40.872058327575,40.8720335978173,40.8720183383369,40.8719863279473,40.8719062988014,40.8718255524487,40.8717615375259,40.8717297250338,40.8716956848108,40.8716424058376,40.8715768318925,40.871501871014,40.8714903712969,40.8714854380621,40.8714659533122,40.8714636710251,40.8714362282272,40.8714066530675,40.8713937069338,40.8713808163843,40.8713662831332,40.8713567821817,40.8713322020721,40.8713205126754,40.8713153335756,40.8712986744288,40.8712862475407,40.8712616125126,40.8712443629158,40.8712320483785,40.8711770927294,40.8711683480675,40.8711430166964,40.8711241407117,40.8710654934261,40.8710553817793,40.8710423384609,40.8710364080222,40.8710197361536,40.8709958633831,40.8709719721078,40.8709488361421,40.8709225428194,40.8709042432883,40.8708727903315,40.8708472605499,40.8708290695444,40.8708086525357,40.8707934179073,40.8707693591104,40.8707496895931,40.8707096105862,40.8706687893969,40.8706475579564,40.8705995017302,40.8705885664423,40.8705747268998,40.8705579262572,40.8705368065638,40.8705047186094,40.8704594276769,40.8704485156405,40.8704252319858,40.8704091294106,40.8703558916938,40.8703216264272,40.8702822142246,40.8702646466189,40.8702333609693,40.8702063752237,40.8701743023004,40.8701524213032,40.8700992575824,40.8700547465755,40.8700306761666,40.8700197588401,40.8699978569745,40.8699621376616,40.86993953295,40.869935135828,40.8699074832628,40.8698921819647,40.8698754103244,40.8698550425457,40.8698317040401,40.8698251045252,40.8698148854369,40.8697974247883,40.8697719223339,40.8697369694086,40.869732533844,40.8697150704664,40.8696851937949,40.8696603952304,40.8696486077466,40.8696428524125,40.8696239631286,40.8695962932675,40.8695795667665,40.8695685967741,40.8695481693717,40.8695379970709,40.8695241071403,40.8694891750761,40.8694519956564,40.8694365913542,40.8694111773553,40.8694054602706,40.8694194005851,40.8694217046019,40.8694086517895,40.8694417626559,40.8694587623879,40.8694874713105,40.8695102726675,40.8695242899073,40.8695229733526,40.8694947447472,40.8694766016084,40.8694547576384,40.8694131635453,40.8693773822302,40.869364097975,40.869354585028,40.8693516043297,40.8693442813003,40.8693361236358,40.8693134965608,40.869214114197,40.8691790755204,40.8691789979928,40.8691671909452,40.869155402996,40.8691117185161,40.8690782428826,40.8690614758765,40.8690432262404,40.8690316229164,40.8690192190053,40.86900617043,40.8689726922542,40.8689522098604,40.8689337669567,40.868920043664,40.8688950132028,40.8688802152404,40.8688768552322,40.868864452347,40.868861225958,40.868847673374,40.868824947571,40.8688024395358,40.8687853490966,40.8687742739647,40.8687586364689,40.8687403958655,40.8687182373993,40.8687052112504,40.8686758955076,40.8686576593617,40.8686465952899,40.868623792458,40.8686062153127,40.8685834091945,40.8685632401288,40.8685130894059,40.8684915930923,40.8684766253026,40.8684082551757,40.8683750352578,40.8683548464132,40.8683033850666,40.8682812392571,40.8682649661278,40.8682643169823,40.8682454287192,40.8682037670693,40.8681861971224,40.86817448074,40.8681543048662,40.8681354243198,40.868100284558,40.8680744889102,40.8680606237671,40.8680401639344,40.868030179937,40.8680301737123,40.8680201875091,40.8680035371016,40.8679911726627,40.8679773850747,40.8679659830569,40.8679350577684,40.8679131878876,40.8678956019256,40.8678956143845,40.8678823045758,40.8678680211171,40.8678314000352,40.8678104796165,40.867789089279,40.8677762558634,40.8677594897189,40.8677477528478,40.8677259174102,40.8677002056725,40.8676725204725,40.8675058345256,40.8673731911212,40.8672154621941,40.8669405587706,40.8667395598418,40.8666052127114,40.8665286242922,40.8665149430044,40.8661571113571,40.8657812423226,40.8652674711696,40.8648483385921,40.8647455844036,40.864739284545,40.8647105005771,40.8646664014103,40.8646457251095,40.8646250226958,40.8646241797464,40.8645803789192,40.8645695666337,40.8644123516234,40.864311285995,40.864173626873,40.8644367216078,40.8644465049087,40.8644481434173,40.8644392536738,40.8644336260168,40.8644183035537,40.8644077291607,40.8643874009978,40.8643841682682,40.8643337365839,40.8643094726769,40.8643485140767,40.8643501533155,40.8643428676768,40.864342090787,40.8643348122537,40.8643259020843,40.8643080375825,40.8642804014023,40.864242184212,40.8642039645844,40.8641730558767,40.8641461925409,40.8641290905331,40.8641225769717,40.8641143089535,40.8641030076246,40.8640964701971,40.8640956252963,40.86408664892,40.8640753568306,40.8640706510481,40.8640668185245,40.8640661939499,40.864078356575,40.8640815822304,40.8640803014559,40.8640797008296,40.8640772897231,40.8640731291084,40.8640673252212,40.8640600262559,40.8640514185819,40.8640429392834,40.8640353151468,40.8640287725766,40.8640235058589,40.8640196713926,40.8639960681748,40.8639759521886,40.8639452242333,40.8638977435162,40.8638794605397,40.863860203635,40.8638431150668,40.8637874519083,40.8637441870244,40.8637355194392,40.8637083856987,40.863680433751,40.8636521862261,40.8636410813958,40.8636180437802,40.8635986440193,40.863590473696,40.8635642056844,40.8635472325672,40.8635287306711,40.8634479063176,40.863429170989,40.8633624976231,40.8633461072968,40.8633007178207,40.8632803306087,40.8632570739249,40.8632329845173,40.8632084572924,40.8631941806309,40.863195486465,40.8631645422749,40.8630949190699,40.8630843842007,40.8630065104948,40.862938127791,40.8629100749655,40.8629310718745,40.8629161042567,40.862909251121,40.862895998348,40.8629011386855,40.862892159247,40.8628891567996,40.8628797533731,40.8628789082212,40.8629024278781,40.8628939057829,40.8628798188935,40.8628528645355,40.8627891573601,40.8627512515447,40.8627314341833,40.8627149402002,40.8627089749816,40.8627044959614,40.8626484876943,40.862631455322,40.8626307569586,40.8624881448087,40.8624412603439,40.8624212860406,40.8624054177958,40.8623655914322,40.8622757022763,40.8622691265757,40.8622489805492,40.8621976386999,40.862180503963,40.86217571565,40.8621578639007,40.8621463796049,40.8621419552931,40.8621297200632,40.8621128904668,40.8621059005062,40.8620936347474,40.8620412576156,40.8620347304357,40.8620213486599,40.8620146453838,40.8620081280779,40.8619904378624,40.8619861759588,40.8619776012673,40.8619636088136,40.861953580029,40.8619317270406,40.8619332555635,40.8619250408344,40.8619127869555,40.8619099815896,40.8618926229765,40.8618782689821,40.8618603082395,40.861810761149,40.8617365437312,40.8616946996722,40.8616794182307,40.8616173280705,40.8615709779882,40.8615327376193,40.8614863727063,40.8614294698831,40.8613986345894,40.8613633248697,40.8613499247695,40.8613357360443,40.8613231312905,40.861306835299,40.8612921169717,40.8612763647144,40.8612611255655,40.8612211917724,40.861192821694,40.8611449992203,40.8610935042629,40.8610635528519,40.8610427828053,40.8610244365989,40.8609969359274,40.8609804221354,40.8609489017911,40.8609314463155,40.8609006558049,40.8608844678497,40.8608838360767,40.8608736738556,40.8608498720005,40.860839613202,40.8608254261721,40.8608139992255,40.8608022212707,40.8607498976819,40.860731985232,40.8606210984389,40.8604048243112,40.8602215333953,40.8601958090441,40.8601701380299,40.8601352968953,40.8600961970058,40.8600804694219,40.8600486774215,40.8600568926171,40.8600456121851,40.8600179156063,40.8599912458413,40.8599922832119,40.8599707606168,40.8599502447626,40.8599184592107,40.8599071983025,40.8598938731094,40.8598631108042,40.859835407099,40.8598118080843,40.8597820642849,40.8597677166058,40.8597390082306,40.8597482466603,40.8597349215738,40.859728770346,40.8597164582054,40.8597051639241,40.8596483075315,40.8596422249336,40.8595580957327,40.859546750814,40.8594391634973,40.8594180416418,40.8593134659011,40.85917299234,40.8590766175033,40.8589638331018,40.8588992490814,40.858855421344,40.8588139373585,40.8587911337905,40.8587836337146,40.8587916154439,40.8587985779833,40.8589108124499,40.8590245658312,40.8591014028212,40.8591103309918,40.8591432567476,40.8591615018279,40.8591465513039,40.8591209465917,40.8591244925797,40.8591032611252,40.8590434921099,40.859018671592,40.8590110614035,40.8589958646785,40.8589872586345,40.858945216186,40.8589386149475,40.8588864435765,40.8588808636701,40.8588671935468,40.8588438820696,40.8588018582986,40.8587947722912,40.8588271917271,40.8588585985421,40.8588783602685,40.8589263439596,40.8591040920989,40.8591550007931,40.8591610128276,40.859172355155,40.8592051037551,40.8592124507138,40.8592592450833,40.8592632659965,40.8592899779153,40.8593240353371,40.8593513980484,40.8593981524968,40.8595229988217,40.8595376239784,40.8597593633276,40.8599363005511,40.8600985688388,40.8601880428167,40.8602141105169,40.8602167893972,40.8602127856764,40.8602114654421,40.8601908017355,40.8601748066524,40.8601628138991,40.860130812816,40.8601234734623,40.8600988006779,40.86009947665,40.8600728000269,40.8599640409767,40.8598906508614,40.8598399452158,40.8597652081007,40.8597118259141,40.8596937956305,40.8596724424008,40.8596724602885,40.8596471031735,40.8596337378341,40.8596310601862,40.8596357219835,40.8596116954394,40.8596090190728,40.8595923215973,40.8595809797729,40.8595723064046,40.8595709498909,40.8595509334866,40.8595476206198,40.8595556620253,40.8595676672836,40.8595690233562,40.8595796940834,40.8595790401933,40.8595590197975,40.8595590430338,40.859547697532,40.8595423658337,40.8595603935719,40.8595550653481,40.8595403802146,40.859521697242,40.8595083430817,40.8594949717051,40.8594969689795,40.8594796164343,40.8594756121886,40.8594669330016,40.8594602553621,40.8594368927054,40.8594108536667,40.8594115117421,40.8593948154479,40.8593914811851,40.8593781388515,40.8593761658585,40.8593835177483,40.8593948738556,40.8593828817189,40.8593715232041,40.8593528146151,40.8593287992249,40.8593234793441,40.8593001245031,40.8592907871714,40.8592707601947,40.8592407341879,40.859200028582,40.8591813396473,40.8591626423828,40.8591412563114,40.8591285904998,40.8591152381301,40.8591038754625,40.8590938342541,40.8590964724544,40.8590837846856,40.8590744347753,40.8590670788624,40.8590757490929,40.8590684007617,40.8590557000184,40.8590550019536,40.8590383068487,40.8590282844412,40.8590115840442,40.8590055649264,40.8589968738034,40.8589801709775,40.858964812603,40.858952109435,40.8589394252268,40.8589400838451,40.8589320720708,40.8589193770062,40.8589126903443,40.858907337627,40.8588993128659,40.8588799538982,40.8588752916645,40.8588853276061,40.8588966903869,40.8588967029622,40.8588786714329,40.8588666338519,40.8588639431609,40.8588692617083,40.8588465535271,40.8588145120428,40.8587938192521,40.8587844883761,40.858763131608,40.8587371046804,40.858715082987,40.8586937117908,40.8586890177532,40.8586663112333,40.8586456158418,40.85863890715,40.858616194634,40.8585975128812,40.858588183286,40.8585721515337,40.8585668017792,40.8585561197791,40.8585534445282,40.8585127539342,40.858472717183,40.8584453568508,40.8584413290928,40.8584326514839,40.8584172880317,40.8583972685568,40.8583745717309,40.8583452163224,40.8583298661028,40.8583171734476,40.8583118483198,40.858299841248,40.8582938191413,40.8583037772235,40.8582897589699,40.8582844149141,40.858255014123,40.8582189671403,40.8581206744615,40.8575512240577,40.8575223303538,40.8574206514332,40.8573999648614,40.8573895975539,40.8573672528818,40.8573489063801,40.8573217505963,40.8572897919277,40.8572634156027,40.8572322337398,40.8572114438419,40.8571527025229,40.8570888306292,40.8570651542334,40.8570547796524,40.8570436065724,40.8570356238064,40.8570212610615,40.8570132947157,40.8569989433622,40.8569925719215,40.8569917904993,40.8569846112326,40.8569750272847,40.856954253125,40.8569342836194,40.856911118313,40.8568541600868,40.8567794912411,40.8567662474765,40.8567384468189,40.8567263402886,40.8567202706607,40.8566634824712,40.8566417541365,40.8566139642052,40.8566272949848,40.8566079765501,40.8565835696249,40.8562803416538,40.8562531225375,40.8562150534732,40.8559783494555,40.8556823358149,40.8556854610127,40.8556929874393,40.8557015931599,40.8557026712826,40.8557040017314,40.8558749905505,40.8558969651964,40.855899953109,40.8559031947138,40.8559066087336,40.8559101085401,40.8559136066799,40.8559170153764,40.8559202490439,40.8559232254587,40.8559258709535,40.8559281180658,40.8559299104007,40.8559312041355,40.8559319663397,40.8559321773216,40.8559318311289,40.8560539117845,40.856059135366,40.8562369904473,40.8563496620561,40.8563551337233,40.8564542243657,40.8564621413125,40.8565658685902,40.8565678943987,40.856672301855,40.8566011706232,40.8564966611342,40.8564991103357,40.8563940160026,40.8564006434736,40.8563046818085,40.8563291258636,40.8560400550478,40.856045054281,40.8559226292745,40.8559194089111,40.8559159771004,40.8559124189684,40.8559088295121,40.8559052955052,40.855901909576,40.8558987579704,40.8558959202243,40.8558934693268,40.8558914672042,40.8558899648829,40.8558890013233,40.8558885999009,40.8558887720943,40.8558474155497,40.8557954657965,40.855771186451,40.8557256156674,40.8557008918708,40.855686931639,40.85567571342,40.8556756394069,40.8556638352292,40.8556549888438,40.8555100559744,40.8551797749608,40.8549886765113,40.8548855053088,40.8545894703178,40.8542258063622,40.8539771980347,40.853436953918,40.8528404727044,40.8525066395779,40.8520709093696,40.8520217104241,40.8519937849446,40.8519422207045,40.851892817511,40.8518369559468,40.851815475919,40.8518025923293,40.8517381371085,40.8516479112024,40.8516070867049,40.8515383483389,40.8514223342444,40.8513267343892,40.8512730303642,40.8512429513113,40.85109901651,40.8510689370451,40.8509550715729,40.8509263172095,40.8507781470425,40.8507527429455,40.8507160211588,40.8505141272094,40.8502071754799,40.8501809282889,40.8498392626862,40.8495328924865,40.8492505321107,40.8489681607699,40.8487634400509,40.8485573121181,40.848379413767,40.8481874030753,40.8477271362688,40.8474916337005,40.847380136944,40.8471322292998,40.8470826810153,40.8470314732832,40.8469819578816,40.8458542212013,40.8457950120815,40.8457130880242,40.8456441614596,40.8453719768564,40.8452895999682,40.8452317777612,40.8451554985848,40.8450773836422,40.8449838830711,40.8448940737051,40.8447691969373,40.8446609297276,40.8445551176073,40.844449305943,40.8442844415958,40.844163491488,40.8440441406138,40.843828808693,40.8436811598807,40.843555650223,40.8434285460887,40.8433719473012,40.8433374999177,40.8432058408848,40.8430852580147,40.8430231193936,40.8429397055029,40.8428102512157,40.8427930332116,40.8427659647572,40.8427179729305,40.8425383401419,40.842400432568,40.8419311978196,40.8416883401195,40.84138537504,40.8408369730494,40.8402550680509,40.8391237495382,40.8387857813553,40.8385434752912,40.8384216813445,40.8382502714485,40.8380878701799,40.8379718800389,40.8378913250208,40.8377663055668,40.8375794217014,40.8373712849736,40.8371328548001,40.8369343628763,40.8367661687363,40.8365727930764,40.8363838431464,40.8363185036597,40.8362007755935,40.8359809601499]}]],[[{"lng":[-73.9730148717612,-73.9714114162373,-73.9699048927902,-73.9698002889176,-73.969688011648,-73.9681868780361,-73.9686422611989,-73.9691324742657,-73.9696250012669,-73.970081008278,-73.9705341753114,-73.9709937066437,-73.9714504804381,-73.9719067600844,-73.9723627592047,-73.9728196744526,-73.9732755973791,-73.9737341050976,-73.9741893717431,-73.9746479807628,-73.9751026616537,-73.9755580087778,-73.9760482492897,-73.9765348538745,-73.9769857072833,-73.9784850338427,-73.9786072413417,-73.9787064217339,-73.9802208997001,-73.9806734524911,-73.9811232286508,-73.98157269673,-73.9820246450754,-73.9824721204708,-73.9829569102128,-73.9814328194381,-73.981340686616,-73.9812591988635,-73.9797234650314,-73.9802097127826,-73.9806584262387,-73.9811085987999,-73.981559970852,-73.9820087537404,-73.982455207304,-73.9829118010137,-73.9832796584488,-73.9833596221309,-73.9838113565054,-73.9842577192636,-73.9847423100253,-73.9852322461129,-73.9864719497867,-73.9866496967712,-73.986960482836,-73.9870359272105,-73.9873015486895,-73.9872282000595,-73.9868534526938,-73.9872886374606,-73.9871753728691,-73.9876064539275,-73.9865350000197,-73.9869611550926,-73.9873871843564,-73.987816450892,-73.9882860036744,-73.9887793168407,-73.9888393515615,-73.9899029597006,-73.9907539681664,-73.9911989933494,-73.9917149877339,-73.993616883955,-73.9968399386042,-73.9963423696591,-73.9958740945895,-73.9954472576705,-73.9950179854245,-73.9945926491055,-73.9941607833721,-73.9939707175459,-73.9937335385751,-73.9932897332994,-73.9928034094901,-73.992321823447,-73.9920664716518,-73.9918710243355,-73.9914185849462,-73.9942625862863,-73.9950143313275,-73.9970990285431,-73.996647044391,-73.9961965546697,-73.9957485550705,-73.9952982146095,-73.9948436383084,-73.9943794679031,-73.9939482565986,-73.9934641773624,-73.9929793784412,-73.9925285599189,-73.9920790001106,-73.9916327131064,-73.9911773809228,-73.9907263633971,-73.9902762141258,-73.989790854016,-73.9892972754388,-73.9888425380256,-73.9883904457516,-73.9879264069384,-73.9874752469956,-73.9870151455532,-73.9865613853334,-73.9861040615106,-73.9856467779071,-73.9851915222547,-73.984733937796,-73.9842823014675,-73.9838218570337,-73.9833665790018,-73.983131667412,-73.982877134552,-73.9823654503953,-73.9821106153311,-73.9820601816504,-73.9820075877987,-73.9819535150924,-73.9818986635917,-73.9818437441389,-73.981789468181,-73.9817296028408,-73.9816726983235,-73.9816196288633,-73.9815712096455,-73.9815281846638,-73.9814912149279,-73.9790765877813,-73.9783611297531,-73.9762338879695,-73.9741922902141,-73.9736358469904,-73.9730148717612],"lat":[40.7642788794452,40.7635874736972,40.7629580422263,40.7629135121279,40.7628659629433,40.7622268213259,40.7615999606762,40.7609291906075,40.7602514400397,40.7596249069017,40.7590006498643,40.7583733305535,40.7577492320373,40.7571246738538,40.7564977256586,40.7558705520048,40.7552435380833,40.7546187736035,40.753993511311,40.7533671226279,40.7527413795409,40.7521161830587,40.7514413933756,40.7507755069916,40.7501569592558,40.7507882418086,40.7508424848914,40.7508846466341,40.7515219796268,40.7509051014574,40.750282458774,40.7496680890156,40.749049540406,40.7484315019191,40.7477643531884,40.7471197779358,40.7470786636824,40.7470457052569,40.7464028758359,40.7457333623706,40.7451158253887,40.7444982793065,40.7438818838497,40.7432646208938,40.7426469600848,40.7420259399277,40.7415217628685,40.7414121661736,40.7407898806718,40.7401685929103,40.7395103601641,40.738840230795,40.7393628214297,40.7391009115229,40.7392355272563,40.7392663785494,40.7389030260365,40.7388709785074,40.7387147516696,40.7381307864771,40.7380841334007,40.7374978246478,40.7370500104712,40.736464342419,40.7358789328976,40.7352922810599,40.7346590025307,40.7339653997385,40.7339904794289,40.7344347896343,40.7348391545737,40.7350123685835,40.7352153006666,40.736004491616,40.7373608893982,40.7380452320566,40.7386859456654,40.7392683845799,40.73986001125,40.7404419809084,40.7410288222935,40.7412984387316,40.7416222018193,40.7422342815498,40.7429100202034,40.7435680934219,40.7439162027063,40.7441855709463,40.7448026824962,40.7460039813579,40.7463223271801,40.7472051020423,40.7478227290828,40.7484393277447,40.749052196221,40.7496716826001,40.7502933089629,40.7509303898028,40.7515222216601,40.7521900552677,40.7528534028991,40.7534739128927,40.7540911158654,40.7547068050096,40.7553298485813,40.7559504055648,40.7565675650496,40.7572331319189,40.7579066376497,40.7585334990581,40.7591641861778,40.7597902771578,40.760404786886,40.7610373674779,40.7616601223625,40.7622899526043,40.762914874483,40.7635436746478,40.7641691048775,40.7647918145993,40.7654184746975,40.7660452418662,40.7663669830552,40.7667155951407,40.7673921532134,40.7677444760438,40.7677278370948,40.7677156630808,40.7677081117074,40.76770527993,40.7677072053479,40.7677138630184,40.7677292333884,40.7677501163631,40.7677761911146,40.7678070569482,40.7678422397838,40.767881199101,40.766876086135,40.7665737113197,40.7656746314446,40.7648065283319,40.7645699137759,40.7642788794452]}]],[[{"lng":[-73.935567971159,-73.9356563528377,-73.9355216306533,-73.9355662175141,-73.9358519529475,-73.9358098764252,-73.9356983388849,-73.9356085344977,-73.935567971159],"lat":[40.7719187775339,40.7717563964351,40.7717162935583,40.7716291158891,40.7717160019927,40.7717993686218,40.771766903124,40.7719312776845,40.7719187775339]}],[{"lng":[-73.9418003272943,-73.9425680614214,-73.942855286207,-73.9432192352011,-73.9438142732276,-73.9442234308923,-73.9448402665221,-73.9462378795983,-73.9465716508005,-73.9466214140868,-73.9468246022838,-73.9470887692952,-73.947882683892,-73.9479297966422,-73.9483245959115,-73.9487778940647,-73.9491473854193,-73.949431755632,-73.9497122670002,-73.9500826263769,-73.9503335881448,-73.9512600590877,-73.9514862628306,-73.9517119041102,-73.95177822026,-73.9520923302263,-73.952176634237,-73.9522114634206,-73.9525407933688,-73.9531215654617,-73.9532200996317,-73.9532688861099,-73.9533069603585,-73.9533455646288,-73.9534058305199,-73.9540952773631,-73.9550732692816,-73.9551950311748,-73.9557941523772,-73.9569240430461,-73.9572100353129,-73.9579145255927,-73.9586075575642,-73.9586849544351,-73.9590324860946,-73.9590275744249,-73.959558759308,-73.9599018708187,-73.9603917057254,-73.9608128692842,-73.9608301144032,-73.9608443596393,-73.960855224895,-73.9608776206171,-73.960905862976,-73.9609392003413,-73.9609599478155,-73.9609834163596,-73.9610089580296,-73.9610358676456,-73.9610634022606,-73.9610908016722,-73.961117309411,-73.9611421936251,-73.9611647672859,-73.9613284548105,-73.9615385553056,-73.9613865617142,-73.9614090988969,-73.96142702683,-73.9614398278911,-73.9614471324804,-73.9614442702823,-73.9614379778049,-73.9614283919083,-73.9614157210855,-73.961400240928,-73.9613804474666,-73.961363401328,-73.9613495196993,-73.9611106020796,-73.9606855795818,-73.9600113232981,-73.9598906175869,-73.9595715660582,-73.9595007999513,-73.9590161662748,-73.9589267112095,-73.9584583680568,-73.9576807286007,-73.9568947695998,-73.9564634877301,-73.9559856341006,-73.9556551316413,-73.9555928627347,-73.9555672470045,-73.9555346437704,-73.9555042552447,-73.9554645538082,-73.9554458901496,-73.9553419381823,-73.9549940606845,-73.9539079511914,-73.9538429487645,-73.9537814567638,-73.9537476058547,-73.9536624181071,-73.9536127225653,-73.9533232161792,-73.9533914073396,-73.9531245150495,-73.9529778821611,-73.9524845791203,-73.9520863226651,-73.9518766729838,-73.9516250497398,-73.9509719159441,-73.9509373492809,-73.950730687827,-73.9503754807445,-73.9499719175026,-73.9492037602278,-73.9490862879156,-73.9488131531641,-73.947701090128,-73.9465527389312,-73.9459145890561,-73.9458511233309,-73.9458445142382,-73.9457536133356,-73.9457035726866,-73.9455965853588,-73.9454811428929,-73.9456272109345,-73.9455630204875,-73.9454049185002,-73.9453820817897,-73.9452451034135,-73.9451570422152,-73.9450906579417,-73.9447235322071,-73.9447247849746,-73.9446729328337,-73.9445616151757,-73.9442700706356,-73.9440042395634,-73.9432041411423,-73.9428171096028,-73.9425783030101,-73.9421267464683,-73.9413699074241,-73.9408870721163,-73.9405695742063,-73.9402746092122,-73.940179598041,-73.9400766575165,-73.9400115725835,-73.9401845122451,-73.940282079242,-73.9402776672236,-73.9402002177965,-73.9402287038908,-73.9402798582933,-73.9403553347751,-73.940826053003,-73.9411177871803,-73.94121934173,-73.941259753826,-73.9418003272943],"lat":[40.7690469266247,40.7685059057316,40.7683034944094,40.7678926438532,40.7672209120499,40.7666649778899,40.7658236283908,40.7642850145498,40.7639175582609,40.763862772081,40.7636176332345,40.7632989210868,40.762365697592,40.7623103162598,40.7618462300015,40.7613145708652,40.7608812159892,40.7605486173615,40.7603289173848,40.7600474704633,40.7598567555536,40.7588101163718,40.758666455352,40.7584624942014,40.758402549877,40.7579931403449,40.75783133644,40.757583639833,40.7570953145373,40.7565238048271,40.7564268418177,40.7563810441033,40.7563443271275,40.7563113756674,40.7562585318773,40.7556549289454,40.7547986825548,40.754774523476,40.7541615474087,40.7529611603938,40.7527153568317,40.7521098545256,40.751613323987,40.7515737774218,40.7513864227712,40.751297369851,40.750814597762,40.7505585153536,40.7502561861173,40.7499006169389,40.7498876783699,40.7498727772904,40.7498563113,40.7498275707736,40.7498019819458,40.7497802258211,40.7497664130919,40.7497554037121,40.7497475016397,40.7497429250427,40.7497418002764,40.7497441583943,40.7497499342913,40.7497589685008,40.7497710115974,40.7496009576245,40.7497231198408,40.7498805028359,40.74989974574,40.7499216126241,40.7499454721447,40.749970635426,40.7499885332942,40.7500059163785,40.7500224065932,40.7500376452722,40.7500513009708,40.7500635162894,40.7500779297977,40.7500941887413,40.750600469901,40.751201936968,40.7518315173349,40.7520974776227,40.7528047159002,40.7529563816932,40.7535950599574,40.7535624923614,40.7539492365049,40.7548219611657,40.7557039958265,40.7561879825457,40.7567242253051,40.7570951057258,40.7572228001736,40.757257666686,40.7572960344684,40.7573334560726,40.7573773682119,40.7573992514428,40.7575211355683,40.7579290196575,40.7592008748508,40.7592389453878,40.7593230822284,40.759363937926,40.7594797341135,40.7595021490142,40.7597459646874,40.7597967623577,40.7600527584296,40.7599621073743,40.7604601105153,40.7608621549074,40.7612455827981,40.7616788636058,40.7624945075076,40.7625704952379,40.7627582254338,40.7631738450779,40.7636460303171,40.7642696438328,40.764264027275,40.7646107544687,40.7660223973252,40.7673682050641,40.7682139390187,40.7682477502356,40.7683212282514,40.7683016714271,40.7683279343115,40.7684708650051,40.7686247794379,40.7686929531789,40.7688017760271,40.7687321730386,40.7687632030479,40.7687732683104,40.7691183177517,40.7692137208155,40.7697340583815,40.7697862715349,40.7698199680534,40.7698863959274,40.7701405352547,40.7702939821508,40.7709923997487,40.7714108607023,40.7717018567185,40.7720347005095,40.7723091508277,40.7723725162786,40.7726147589642,40.7729474373956,40.7729593155944,40.772926186358,40.7728423605526,40.7725649068042,40.7723014069913,40.7717131417395,40.7711283056628,40.7708522616644,40.7706707110098,40.7704965743711,40.7699121567656,40.7694144085747,40.7693343431224,40.7693088793927,40.7690469266247]}],[{"lng":[-73.9380464060344,-73.9379013362394,-73.9377944872642,-73.9377994417956,-73.9376463182148,-73.9376536596381,-73.9375989462262,-73.9377926903634,-73.938237735094,-73.9383962259174,-73.9386120082195,-73.9392374617823,-73.939318219876,-73.9395301579325,-73.9395837897248,-73.9394323810077,-73.9394932975206,-73.9393751537968,-73.9393052849678,-73.9392178962528,-73.9387280292659,-73.9388395184504,-73.9388286341011,-73.9387442308928,-73.9383009795165,-73.9380821326871,-73.9379675772165,-73.9380494892176,-73.9380672308993,-73.9380464060344],"lat":[40.7808295442756,40.7807499961726,40.7807812587555,40.7810313397967,40.7810012158929,40.7807900075528,40.7804678408615,40.7803579042124,40.7802590794654,40.7802624333912,40.780338955869,40.7797333940584,40.7797180018269,40.7795276202605,40.7795764740072,40.7798122002746,40.7798736913155,40.7799787718493,40.7799512245521,40.7800135202215,40.7805107437046,40.7805992497999,40.7807634512302,40.7810438760423,40.781362084365,40.7814184377772,40.7812893340603,40.7810558060425,40.7809447026981,40.7808295442756]}],[{"lng":[-73.943832566099,-73.9437600534063,-73.9436320172783,-73.9435697971989,-73.9435442071252,-73.9436482353901,-73.9438806810246,-73.9438707598871,-73.9437146885057,-73.9436004747541,-73.9434387673599,-73.9424642534703,-73.9424516407923,-73.9424388123453,-73.9424260871596,-73.9424137816975,-73.9424022019831,-73.9423916359918,-73.9423823464885,-73.9423745644931,-73.9423684835349,-73.9423642548404,-73.9421202220567,-73.9421158521175,-73.9421132094469,-73.9421123584726,-73.9421133199406,-73.9421160704098,-73.9421205428228,-73.9421266281418,-73.942134178006,-73.9421430083496,-73.9427297339572,-73.942718846166,-73.9427171925761,-73.9427248067431,-73.9427415340418,-73.9427670348071,-73.9428007913825,-73.9428421182346,-73.9428901762189,-73.9429439895218,-73.9430024654733,-73.9426553074297,-73.9424574105696,-73.9422950619864,-73.9422805004479,-73.94231968904,-73.9423633371575,-73.9424554569813,-73.9424285395392,-73.9424249119559,-73.9423899917322,-73.9423594348603,-73.9423623347101,-73.9423354182118,-73.9422411139339,-73.9422854938064,-73.9422405053421,-73.9422557960449,-73.9421198245403,-73.9421853701392,-73.9423097071322,-73.942293683332,-73.9424340389556,-73.9424296453569,-73.9423378939154,-73.9423846714195,-73.9423288292182,-73.9422762272684,-73.9422277831706,-73.9421843419916,-73.9421466615231,-73.9421153990621,-73.9420910999458,-73.9420741880388,-73.9420026672227,-73.9420816045738,-73.9424010094905,-73.9425876964068,-73.942930437814,-73.9433389475049,-73.943664318148,-73.9439608437088,-73.9443639344074,-73.9448788959671,-73.9456151401251,-73.9464041891907,-73.9469076413377,-73.9474897545637,-73.9480863340655,-73.9486641647792,-73.9490853676865,-73.949373321315,-73.949579120714,-73.950069793031,-73.9506634515425,-73.9512249766656,-73.951764809004,-73.9523096318113,-73.9533655996358,-73.9544182607861,-73.9557362164032,-73.9558722233907,-73.9563091763419,-73.9563331896777,-73.9569784172763,-73.9573173758794,-73.9575986944528,-73.957637727421,-73.9580049661682,-73.9582566084192,-73.9583612533256,-73.9583852867399,-73.958426201896,-73.9584550180999,-73.9584911954165,-73.9585432967906,-73.958777908227,-73.9588635886981,-73.958934485137,-73.9590368100845,-73.9597218041865,-73.9619657361163,-73.963080735288,-73.9635561893216,-73.9643135356523,-73.9665833842226,-73.9681868780361,-73.969688011648,-73.9698002889176,-73.9699048927902,-73.9714114162373,-73.9730148717612,-73.9725535229576,-73.9720985244436,-73.9716477426822,-73.9711852091349,-73.9707277741458,-73.9702816550227,-73.9698245528782,-73.9695160517743,-73.9693648454656,-73.9689045471034,-73.9684415586728,-73.9679932771091,-73.9675339844437,-73.9670394751384,-73.966536169471,-73.9660744904101,-73.9656096862152,-73.9651474537478,-73.9646873584175,-73.9642282017404,-73.963761238512,-73.9637260260806,-73.9632299191105,-73.9631345980356,-73.9627671549355,-73.9623036147985,-73.9618383683974,-73.9613687269495,-73.9609101613834,-73.9604143058784,-73.9599209422009,-73.9594690599152,-73.9590117668133,-73.9585681001153,-73.9581035344421,-73.9576359938983,-73.9571624332454,-73.9567186299825,-73.9562613091965,-73.9557773591232,-73.9541647699251,-73.953713450606,-73.9534164669039,-73.9526613672815,-73.9525514546904,-73.9524643016674,-73.9522294753702,-73.9512967085309,-73.9509281278826,-73.9503380413039,-73.9493317062711,-73.9487762622345,-73.9478434603698,-73.9470895191672,-73.946444972832,-73.9459218599374,-73.9447226452693,-73.9446466599195,-73.9440543944633,-73.9439546016314,-73.9438932460593,-73.943832566099],"lat":[40.782859089475,40.7828289317175,40.7829623236854,40.7829230780709,40.7828805238227,40.7826561613333,40.7815320433644,40.7812730265716,40.7806298155289,40.7801590994662,40.7797632419659,40.7800325000442,40.7800343016842,40.7800345736886,40.7800333092929,40.7800305399415,40.7800263345051,40.7800207975688,40.7800140668302,40.7800063096758,40.779997719018,40.7799885084971,40.7794725563725,40.7794643817475,40.7794557896798,40.7794469896443,40.7794381961863,40.7794296236904,40.7794214811542,40.7794139670926,40.7794072646985,40.7794015373762,40.7792572476555,40.7792084524819,40.7791589763413,40.7791098238455,40.7790619930324,40.7790164551013,40.7789741344228,40.7789358905933,40.778902500145,40.778874641062,40.7788528790149,40.7781249655742,40.777407473348,40.7773319624832,40.7773474382287,40.7774525192671,40.7774470109242,40.7777478643337,40.7777528275672,40.7777423200661,40.7777472787893,40.7777538991917,40.7777649591649,40.7777688163741,40.7774701741157,40.7774602428268,40.777334146821,40.7773164602774,40.7772555664118,40.7771638087623,40.7772197198808,40.7772429362478,40.7773004614862,40.7772889489517,40.7772489011777,40.777171097102,40.7771552162206,40.7771338794108,40.7771074588783,40.7770764155101,40.7770412908347,40.7770026975747,40.7769613089589,40.7769178469771,40.7761853173828,40.7759570163171,40.7757269275262,40.7752189565281,40.7746762680359,40.7742111925907,40.7738407641769,40.773530420092,40.7731085387924,40.7725695620073,40.7719430265877,40.7712690456193,40.7707339117236,40.7701151540191,40.7694747932189,40.7688576238969,40.7682782707957,40.7678821910544,40.7676289301796,40.7670250878808,40.7663807113494,40.7657711989735,40.7651637118432,40.764554288606,40.7633681709117,40.7621841049511,40.7610243928476,40.7609047121156,40.7605083675543,40.7604865855639,40.759896754446,40.7595922122566,40.7593423182578,40.7593067398983,40.7589719996293,40.7587492611931,40.7586602419549,40.7586397974006,40.7586038730069,40.7585809021978,40.7585459038305,40.7584956229358,40.7582709208488,40.7583060704377,40.7583351554485,40.7583837826046,40.7586630636816,40.7596194607855,40.7600831637403,40.7602808185822,40.7605992313504,40.7615509355766,40.7622268213259,40.7628659629433,40.7629135121279,40.7629580422263,40.7635874736972,40.7642788794452,40.7648977317234,40.7655172512275,40.7661424684726,40.7667702901723,40.7673937229188,40.7680250324297,40.7686460088209,40.7690652004245,40.769270656823,40.7699008317911,40.7705163268729,40.7711472309525,40.771776183984,40.7724612188163,40.77314036859,40.7737729891002,40.7744072014455,40.7750442320898,40.7756770817154,40.7763103091826,40.7769509699349,40.7770057178997,40.7776770473619,40.7778080512782,40.7783130408885,40.7789470412049,40.7795841921961,40.7802297490476,40.7808570355244,40.7815242678047,40.7822129435021,40.7828333216645,40.7834612846351,40.7840834440397,40.7847130047313,40.7853434578213,40.7859796382595,40.7866007938244,40.7872228762799,40.7879139244711,40.7872275635765,40.7870375855268,40.7869125711392,40.786595020127,40.7865485806622,40.7865104314209,40.7864115502316,40.7860200748652,40.7858653801727,40.7856171500132,40.7851931260554,40.7849582359268,40.7845637555659,40.7842449057949,40.7839731785782,40.7837527983547,40.7832475726415,40.7832178738028,40.7829643580463,40.7829155196513,40.7828877273326,40.782859089475]}]],[[{"lng":[-73.949233270825,-73.9494228781563,-73.9496868299651,-73.9501582122699,-73.9506288547574,-73.9511110237241,-73.9516026543104,-73.9520712707866,-73.9525222263876,-73.9529774055357,-73.9530982760681,-73.9531604499487,-73.9534368386116,-73.9538891708097,-73.9538948958825,-73.954399191913,-73.9548172381665,-73.9551041694841,-73.9552823348086,-73.9557773591232,-73.9562613091965,-73.9567186299825,-73.9571624332454,-73.9576359938983,-73.9581035344421,-73.9585681001153,-73.9590117668133,-73.9594690599152,-73.9599209422009,-73.9604143058784,-73.9609101613834,-73.9613687269495,-73.9618383683974,-73.9623036147985,-73.9627671549355,-73.9631345980356,-73.9632299191105,-73.9637260260806,-73.963761238512,-73.9642282017404,-73.9646873584175,-73.9651474537478,-73.9656096862152,-73.9660744904101,-73.966536169471,-73.9670394751384,-73.9675339844437,-73.9679932771091,-73.9684415586728,-73.9689045471034,-73.9693648454656,-73.9695160517743,-73.9698245528782,-73.9702816550227,-73.9707277741458,-73.9711852091349,-73.9716477426822,-73.9720985244436,-73.9725535229576,-73.9730148717612,-73.9736358469904,-73.9741922902141,-73.9762338879695,-73.9783611297531,-73.9790765877813,-73.9814912149279,-73.981467972046,-73.9814499379241,-73.9814373030395,-73.9814302008462,-73.9814287062246,-73.9814328351072,-73.9814425438969,-73.9814577300632,-73.9814820383939,-73.9815120000456,-73.9815472180972,-73.9815872266128,-73.9816314948657,-73.981679436394,-73.9810229005033,-73.9805637066685,-73.9801118156174,-73.9796523340224,-73.9791921451197,-73.9787224679214,-73.9782822010231,-73.9778263936496,-73.9773708499307,-73.9769116822629,-73.9764577739989,-73.9759551729502,-73.9754593243374,-73.9750011189794,-73.9747542408034,-73.9745323148841,-73.9742929486252,-73.9740666825764,-73.9735711742329,-73.9717230555584,-73.9712229222095,-73.9707601311674,-73.9703006816215,-73.9698322562294,-73.9693357331895,-73.9691095043752,-73.9690860867996,-73.9688503681786,-73.9683847931366,-73.9679269635447,-73.9674490837313,-73.967009770734,-73.9665522667892,-73.9660950057244,-73.9656279953866,-73.9651770549901,-73.9646854073948,-73.9641759852132,-73.9638060104351,-73.9637110065635,-73.9632183274493,-73.9630793102664,-73.9629757948463,-73.9628214973773,-73.9623598015067,-73.9618998546095,-73.9614406065574,-73.9609797180793,-73.9607478509035,-73.9605227166957,-73.9600301850322,-73.959536588682,-73.9590766907229,-73.958618792567,-73.9583330495665,-73.9581729710387,-73.9578649929525,-73.9553665162024,-73.9553036398665,-73.9552576358306,-73.9552229647798,-73.9527672697835,-73.9525318675435,-73.9524609278529,-73.9523741906278,-73.9509422828337,-73.9497477308443,-73.949233270825],"lat":[40.7968719999055,40.7966063841608,40.7962169853809,40.7955877315044,40.7949595913764,40.7942850353219,40.7936078056141,40.7929811719834,40.7923476222252,40.7917196931681,40.7915527529126,40.7914668813839,40.7910851413718,40.7904704985544,40.7904626909915,40.7897749086677,40.7892047443701,40.7888220717528,40.7885844554883,40.7879139244711,40.7872228762799,40.7866007938244,40.7859796382595,40.7853434578213,40.7847130047313,40.7840834440397,40.7834612846351,40.7828333216645,40.7822129435021,40.7815242678047,40.7808570355244,40.7802297490476,40.7795841921961,40.7789470412049,40.7783130408885,40.7778080512782,40.7776770473619,40.7770057178997,40.7769509699349,40.7763103091826,40.7756770817154,40.7750442320898,40.7744072014455,40.7737729891002,40.77314036859,40.7724612188163,40.771776183984,40.7711472309525,40.7705163268729,40.7699008317911,40.769270656823,40.7690652004245,40.7686460088209,40.7680250324297,40.7673937229188,40.7667702901723,40.7661424684726,40.7655172512275,40.7648977317234,40.7642788794452,40.7645699137759,40.7648065283319,40.7656746314446,40.7665737113197,40.766876086135,40.767881199101,40.7679188753653,40.7679581663392,40.7679986570501,40.768039919853,40.7680815189263,40.7681230149501,40.7681639696596,40.7682039505063,40.7682424205412,40.7682785120951,40.7683117470297,40.7683416844789,40.7683679283408,40.7683901309362,40.7692728335597,40.769905324566,40.7705283686784,40.7711553275426,40.7717812660014,40.7724188982852,40.7730318787382,40.7736561919219,40.7742810072139,40.774909124027,40.775532537252,40.7762197546262,40.7768987227267,40.7775277799166,40.7778646924296,40.7781677850257,40.7784979889537,40.7788054167216,40.7794778616212,40.7820214764623,40.7827062555875,40.7833401370511,40.7839754134459,40.7846109105864,40.7852932795571,40.7856032806995,40.7856396959121,40.7859740529881,40.786595696524,40.7872215711261,40.7878607210931,40.7884767907422,40.7891071528256,40.7897343897667,40.7903661171291,40.7909903410994,40.7916640267989,40.7923620450278,40.7928799013058,40.7930090280449,40.7936785732783,40.7938678763279,40.7940161814964,40.7942372356913,40.7948520605607,40.7954792700612,40.796110827184,40.7967386440453,40.7970559756554,40.7973684689598,40.7980381078972,40.7987185255206,40.7993522339277,40.7999770261545,40.8003650535111,40.8005825409548,40.8005152724391,40.7994664264164,40.7994405006974,40.7994211988942,40.7994066466177,40.7983720915692,40.7982697426927,40.7982424940104,40.7982097712479,40.7976031176705,40.7970970016013,40.7968719999055]}]],[[{"lng":[-73.9401413121009,-73.9396256993014,-73.93966773022,-73.9397061205912,-73.9397399122403,-73.9397682615681,-73.9397904612159,-73.9398059571174,-73.9398074739128,-73.9398059136575,-73.9398012960173,-73.939793679653,-73.9397575536381,-73.9397274631895,-73.9397036051036,-73.9396861354115,-73.9396751683588,-73.9396707756499,-73.9396729859966,-73.9396817849236,-73.9396971148626,-73.9397188755294,-73.9398949532679,-73.9402010365408,-73.9415361978508,-73.9424433497653,-73.9438427568083,-73.9429236691258,-73.9432358197176,-73.9435059452953,-73.9440498636813,-73.9446036460381,-73.9451600489582,-73.9460782874042,-73.9464028991384,-73.9467183203377,-73.9470362320686,-73.9473495397973,-73.947666413187,-73.9480073293346,-73.9483560158538,-73.9486768180755,-73.9488393948718,-73.949018597281,-73.9492141043905,-73.9494255284926,-73.9496367491157,-73.9496368844227,-73.9496370210479,-73.9498621898559,-73.9503501927523,-73.9509286573892,-73.9509820339399,-73.9515053733073,-73.9521012521537,-73.9525912577644,-73.9530786999544,-73.9532765494936,-73.9535757781037,-73.9549665717247,-73.9554297485646,-73.9558841761641,-73.9563449367975,-73.9568054387732,-73.9572658155452,-73.9577217601593,-73.9581896226123,-73.9582272503924,-73.9582564604776,-73.9582770255324,-73.9582887854434,-73.9582916487569,-73.9582855932167,-73.9582548258013,-73.9582427245238,-73.9582347744944,-73.9582030080716,-73.9582487832981,-73.9586883936751,-73.9591474113735,-73.9596468542315,-73.9610779400213,-73.9638612629117,-73.9643427774881,-73.9654264056685,-73.9655649870462,-73.9660350151679,-73.9661749517758,-73.9665975037666,-73.9667010682416,-73.9668032725715,-73.9680484926094,-73.9684950672613,-73.9685591341792,-73.9686070740611,-73.9697872200334,-73.9706932647336,-73.9707636230071,-73.9708414835481,-73.9709876800351,-73.971107658523,-73.970465121444,-73.9702140079922,-73.969882906147,-73.9697728894336,-73.9695593479735,-73.9691117356584,-73.9690910324439,-73.9689167848403,-73.9688521864532,-73.9686626476494,-73.9685574777122,-73.9685442063378,-73.9684634861166,-73.9684247350704,-73.9682395273212,-73.9681533751206,-73.9681167501867,-73.9681318659272,-73.9679606531177,-73.9678831249756,-73.9678809917402,-73.9677948483447,-73.9677216009522,-73.967704390523,-73.967667789409,-73.9676203882461,-73.9676204142262,-73.9675439727051,-73.9674018531237,-73.9671304875859,-73.9670411118029,-73.9670023214405,-73.9669226550844,-73.9668817501495,-73.9667493078798,-73.9666330076011,-73.9665296232187,-73.9663917772088,-73.9662776271681,-73.9661580922395,-73.9661063953949,-73.9658824094512,-73.9657919497465,-73.9656584016126,-73.9654897501296,-73.9654893242488,-73.965347065517,-73.9651078426746,-73.9650951190635,-73.9643248339137,-73.964140828883,-73.9634039510231,-73.9631270240379,-73.963085296941,-73.9627191339208,-73.9620310579599,-73.9618791703533,-73.9613183318057,-73.9609488984397,-73.9604472849203,-73.9599989222935,-73.9598146267456,-73.9593906879793,-73.9593256626521,-73.9592830064729,-73.9591306158063,-73.9592076770925,-73.9592625540374,-73.9593026359868,-73.9594262434965,-73.9591468571519,-73.9590329415577,-73.95923467194,-73.9591771279426,-73.9590896024009,-73.95881892234,-73.9589417294171,-73.958854039854,-73.958745236605,-73.9589636009464,-73.9590001828989,-73.9591130402411,-73.9592297621347,-73.959909994444,-73.9596033246028,-73.958926147183,-73.9590495333171,-73.9589172176045,-73.9588674543331,-73.9588384986324,-73.9586512601192,-73.9586458514766,-73.9585273152426,-73.9582001935401,-73.9581680536359,-73.9581306330556,-73.9580746794387,-73.9579390490912,-73.9582283818304,-73.958206395391,-73.958143127692,-73.9591645863233,-73.9591819603764,-73.9594384674442,-73.9594645418917,-73.9594826976696,-73.9594974741095,-73.9595036116449,-73.9595089793919,-73.9595310141184,-73.959538002253,-73.9595428443909,-73.9595447255249,-73.9595452218032,-73.9595335110508,-73.9595557549386,-73.9591403826995,-73.959016129419,-73.9589958280338,-73.9574370851175,-73.9572589697715,-73.9569486642047,-73.9563178451031,-73.9562005452838,-73.9562037377957,-73.9562239436024,-73.955039129784,-73.954697366195,-73.9545418806213,-73.9544646997723,-73.954464580347,-73.9544412004407,-73.9543606801021,-73.9542722090605,-73.9542165362576,-73.954169506442,-73.9541364913583,-73.9540611180425,-73.9540327171764,-73.9540210667868,-73.9539861491178,-73.9539540640746,-73.9535912862679,-73.9529761936262,-73.9521859729655,-73.9519140405714,-73.9518089234596,-73.9516565636901,-73.9515529347538,-73.9513174203759,-73.9511918301221,-73.951147921668,-73.9510522457128,-73.9510410955593,-73.9510083856706,-73.9509530708301,-73.950865127052,-73.9508073499324,-73.9507269874008,-73.9506817724416,-73.9505687424802,-73.9505134612838,-73.9504833022592,-73.950448097408,-73.9504179493977,-73.9503400935556,-73.9502848174077,-73.9502121856002,-73.9499624395775,-73.9498559048211,-73.9497761628448,-73.9497080785182,-73.9496411981455,-73.9495743178091,-73.949551752833,-73.9494157055686,-73.9491944889159,-73.9489054328625,-73.9482259724,-73.9459255816204,-73.9458239515278,-73.9457193369865,-73.9429796619917,-73.9413679958142,-73.9410754698064,-73.9403464331369,-73.9401413121009],"lat":[40.8303719888808,40.830155837388,40.8301408088839,40.8301209399942,40.8300967266229,40.8300687730826,40.8300377771075,40.8300045123177,40.8299837956854,40.8299630809152,40.8299426303878,40.8299227040787,40.8298670822961,40.829809425007,40.8297501093298,40.8296895232286,40.8296280629762,40.8295661306538,40.8295041312445,40.8294424702619,40.8293815510044,40.8293217719184,40.829073508872,40.8286533023111,40.8268202536772,40.8255725938732,40.8236478015425,40.8232605872505,40.8229213350338,40.8226277527772,40.8220515921051,40.8214619811882,40.8208790434763,40.8212632155597,40.8205720426877,40.8198942680339,40.8192083715056,40.818534997721,40.8178555099919,40.8171165088996,40.8163743056192,40.8156922860175,40.8153568260673,40.8150257543226,40.8146997709849,40.8143795835932,40.8140866660151,40.8140864784467,40.8140862972449,40.8137999804368,40.8131593892901,40.8125750715315,40.8125216292872,40.8120076851397,40.8114428535016,40.8107653330668,40.8100940849071,40.809879604283,40.8094766976597,40.8100645547038,40.8094291534067,40.8088022490491,40.8081733540405,40.8075457092798,40.806916171387,40.8062909886274,40.8056088036908,40.8055374971112,40.8054639479951,40.8053887288287,40.8053124249316,40.8052356303971,40.805158942967,40.8047138784415,40.8045224810712,40.8043967319451,40.8038942709989,40.8031064864712,40.802469794366,40.8018437601372,40.8011564232565,40.8018003577204,40.8029720383534,40.8031745614049,40.8036303177756,40.8036886012456,40.8038864986314,40.8039455048015,40.8041236771614,40.804168476937,40.804207561121,40.8046837001335,40.8048322703844,40.8048535841203,40.8048709498982,40.8053004973846,40.8056302684492,40.8056573728797,40.8056853437599,40.8057429029292,40.8057901396768,40.8066243176124,40.8069357061534,40.8073647884813,40.8075252821412,40.807795500999,40.808406370069,40.8084301645759,40.8086307805598,40.8087519861146,40.8089632926782,40.8090728938211,40.8091451098902,40.80931871402,40.809394060333,40.809662684397,40.8097658814087,40.8098068362405,40.809844489225,40.8101000095667,40.8102015646796,40.8102441473245,40.8103669968715,40.8104341611109,40.8104881998844,40.8105504459429,40.8105848503944,40.8106307010374,40.8107731997242,40.8110221553972,40.8113874200739,40.8115200996269,40.8115479480297,40.8116904465337,40.8117739764283,40.8119819850119,40.8121539702855,40.8122850155248,40.8124733731619,40.8126388120003,40.8128157027913,40.8128632069363,40.8132006263486,40.8133283817001,40.8134987314925,40.8137470723679,40.8137476942588,40.8139396518968,40.8142754760298,40.8143195721566,40.8155127370107,40.8157716574539,40.8166841974377,40.8169550953364,40.8170061134332,40.8173684907574,40.8180863309792,40.8182585640901,40.8188945235574,40.8193112888728,40.819877156791,40.8203829448023,40.8202978747014,40.8208551783559,40.8209462762535,40.8209949744137,40.8211689537748,40.8212079093495,40.8212356553586,40.8211898975231,40.821252381738,40.821571328551,40.8215137462285,40.8212778252705,40.8212494299851,40.821206247056,40.8215185248468,40.8215693640096,40.8216747502473,40.8218055119737,40.8223737941422,40.8224097283744,40.8224549646456,40.8222869101324,40.822571119822,40.8229946867834,40.8227117554414,40.8225413353683,40.8224860513715,40.8224502392281,40.8224050420779,40.8219184365734,40.8219043696318,40.8218437566522,40.8222831369181,40.8224581009913,40.8225310909584,40.8226113584649,40.8227743535473,40.8228878671009,40.8229221319123,40.8230207222715,40.8234517954834,40.8234591229456,40.823562392293,40.8235711356718,40.8235786526657,40.8235868162859,40.8235911857978,40.8235957889028,40.8236191821806,40.8236293340874,40.8236391684525,40.8236449418293,40.8236473375997,40.8236850183973,40.8236937977688,40.8243175902052,40.8245041884993,40.8244964274251,40.8268485479497,40.8271173098731,40.827000553935,40.8279442153886,40.8279012265975,40.8278969860999,40.8278700873914,40.8274134319119,40.8279183855142,40.8278614763655,40.8279741696988,40.82797433215,40.8280066352987,40.8281178830152,40.8282365431425,40.8283074708555,40.8283608692402,40.8283934095627,40.8284621324515,40.8284904234907,40.8285029803045,40.8285435162517,40.8285853581641,40.8290977206488,40.8300902032711,40.8312771179192,40.8316197174183,40.831824320518,40.8319769945715,40.8321341999871,40.832479572948,40.8326391512799,40.8327835929616,40.8329224381364,40.8330224885963,40.8331406499581,40.8332835798298,40.8334341206276,40.8335141493259,40.8335922635999,40.8336513313083,40.8337885185296,40.8338857037694,40.8339447790291,40.8340419716803,40.8340857983956,40.83416772531,40.8342572855851,40.8343031199584,40.8344370306769,40.8344592868663,40.8344559645116,40.8344492900065,40.8344343300863,40.8344193619186,40.8344107166949,40.8343585898328,40.8342106585955,40.8340652988768,40.8338493081219,40.8328064897023,40.8327654612874,40.832721413266,40.8315679803621,40.8308908380831,40.8307668513735,40.8304578428499,40.8303719888808]}]],[[{"lng":[-73.9344523939737,-73.9344669791022,-73.9344537723424,-73.9344487756432,-73.9344663722597,-73.9345027734122,-73.9345256263579,-73.9345466975778,-73.9345705455849,-73.9345642918786,-73.9345561913577,-73.9345455079479,-73.9345505539768,-73.9345631232394,-73.9346088164462,-73.9346334112486,-73.9346522438861,-73.9346510058626,-73.9346416390713,-73.9346736361382,-73.9346751091449,-73.9347075726068,-73.9347339324972,-73.9347527825099,-73.9347565729576,-73.9347804623171,-73.9347742431493,-73.9347730086192,-73.9347868403004,-73.934820729846,-73.9348481357196,-73.9348698506781,-73.9348946004199,-73.9349153357865,-73.9349362082846,-73.9349422585534,-73.9349585956692,-73.9349794120863,-73.9349883314069,-73.9349508717846,-73.9349577598409,-73.9349652301556,-73.9349662416419,-73.9349731606118,-73.9349721907353,-73.9349938973666,-73.9350306032399,-73.9350361242771,-73.935031241186,-73.9350421249086,-73.935076445029,-73.9350695809819,-73.9350834136337,-73.9350968747191,-73.9350969046914,-73.9351038425559,-73.9351124510008,-73.9351174304804,-73.9351204170423,-73.9351322584874,-73.9351263604187,-73.9351293550089,-73.9351244355286,-73.9351382681903,-73.9351372912785,-73.9351304030063,-73.9351215497367,-73.9351235294981,-73.9351156589231,-73.9351324360264,-73.9351393584774,-73.9351275237941,-73.9351246598458,-73.9351217185335,-73.9351158094604,-73.935111878823,-73.9351197936552,-73.9351178302057,-73.9351237677008,-73.9351208554731,-73.9351317051837,-73.935144551144,-73.9351672529464,-73.9351648084094,-73.9351565917338,-73.9351287813163,-73.9351139834151,-73.9350778924617,-73.9350956518488,-73.9350878372859,-73.9350682497411,-73.9350227546552,-73.9349850562145,-73.93493515655,-73.9348935333238,-73.9348308720848,-73.9347988190573,-73.9348008067693,-73.9347899627879,-73.934792938279,-73.9347811108582,-73.9347702822969,-73.9347594429443,-73.9347634328832,-73.9347437259128,-73.9347393083095,-73.9347491949278,-73.9347373734992,-73.9347226012782,-73.9347255769993,-73.9347147602576,-73.9347010025242,-73.9346941270737,-73.9347128856067,-73.9347050490228,-73.9346932166962,-73.9346759710182,-73.9346622898783,-73.9346830270246,-73.9347076940248,-73.9347008078072,-73.9346810792481,-73.934677148802,-73.9346702522203,-73.9346544761815,-73.9346495924325,-73.9346619319835,-73.9346629522556,-73.9346649597136,-73.9346561102258,-73.9346551553651,-73.9346364185213,-73.934616403439,-73.9346117126479,-73.9346026032382,-73.9346088357669,-73.9346105250687,-73.9346080499331,-73.9346006584532,-73.9345987364063,-73.9346019211835,-73.934611595532,-73.9346091744548,-73.9346101771651,-73.93461219001,-73.9346043348989,-73.9346073136309,-73.9346004318559,-73.9346083455533,-73.9345975056548,-73.9346004848812,-73.9345936004084,-73.934586741478,-73.9345956291445,-73.9345867621054,-73.9345917047489,-73.9345976397154,-73.9345887726725,-73.9345868424075,-73.9345651301025,-73.9345581017987,-73.9345458626602,-73.9345423063814,-73.9345325888057,-73.9345217563805,-73.9345389813406,-73.9345318309277,-73.9345207652812,-73.9345159067242,-73.9344239633905,-73.9344829105876,-73.9344642654949,-73.9344284440052,-73.9343671795538,-73.9343564345215,-73.9343257428912,-73.9342953073278,-73.9342937167056,-73.9342728544085,-73.9342464289509,-73.934218348033,-73.9341659453066,-73.9341465766699,-73.9341460438214,-73.9341337362534,-73.9341212616502,-73.9341175261266,-73.9341023336635,-73.9340998673827,-73.9340984379996,-73.9340911251737,-73.9340794472348,-73.9340743435485,-73.9340773409516,-73.934070055227,-73.9340444747647,-73.9340459977903,-73.9340356044318,-73.9340266233459,-73.9340038961569,-73.9340006920745,-73.9339829570548,-73.9339866464062,-73.9339724153109,-73.9338300916368,-73.9338307684021,-73.9338300069596,-73.933827774217,-73.9338261413771,-73.9338001947305,-73.9339200430821,-73.9340091796638,-73.9340746397773,-73.9341281676116,-73.9342351954951,-73.9344540007277,-73.9346379027272,-73.9348734383498,-73.9357554821078,-73.9359937141727,-73.9360507657812,-73.936135543971,-73.9362095781427,-73.9366885488281,-73.9370816369499,-73.9371439842421,-73.937617149518,-73.9381355240751,-73.9382064268832,-73.9383092504302,-73.9383874852984,-73.9386375332666,-73.9387439450372,-73.939017533146,-73.9394939753992,-73.9399487597705,-73.940403449022,-73.940860631756,-73.9413174236948,-73.9417714017003,-73.94226311155,-73.9427536722819,-73.9428555022079,-73.943157703856,-73.9437747678022,-73.9443019458712,-73.9447820817178,-73.9452396521392,-73.9456926125162,-73.9461313104867,-73.9456183646418,-73.9447092611273,-73.9445991529627,-73.9447597648013,-73.9450512798452,-73.945508639182,-73.9459678974937,-73.9464613385203,-73.9469736680703,-73.9472801829742,-73.9473277151459,-73.9473759984473,-73.9474199623519,-73.9477105597932,-73.9477571646885,-73.9478166305282,-73.9478467911888,-73.9480513020299,-73.9481010902656,-73.9481538432484,-73.9482064153801,-73.9483112545438,-73.9487870281116,-73.9490651785891,-73.949233270825,-73.9497477308443,-73.9509422828337,-73.9523741906278,-73.9524609278529,-73.9525318675435,-73.9527672697835,-73.9552229647798,-73.9552576358306,-73.9553036398665,-73.9553665162024,-73.9578649929525,-73.9581729710387,-73.9584811140998,-73.9588338138987,-73.9596468542315,-73.9591474113735,-73.9586883936751,-73.9582487832981,-73.9582030080716,-73.9582347744944,-73.9582427245238,-73.9582548258013,-73.9582855932167,-73.9582916487569,-73.9582887854434,-73.9582770255324,-73.9582564604776,-73.9582272503924,-73.9581896226123,-73.9577217601593,-73.9572658155452,-73.9568054387732,-73.9563449367975,-73.9558841761641,-73.9554297485646,-73.9549665717247,-73.9535757781037,-73.9532765494936,-73.9530786999544,-73.9525912577644,-73.9521012521537,-73.9515053733073,-73.9509820339399,-73.9509286573892,-73.9503501927523,-73.9498621898559,-73.9496370210479,-73.9496368844227,-73.9496367491157,-73.9494255284926,-73.9492141043905,-73.949018597281,-73.9488393948718,-73.9486768180755,-73.9483560158538,-73.9480073293346,-73.947666413187,-73.9473495397973,-73.9470362320686,-73.9467183203377,-73.9464028991384,-73.9460782874042,-73.9451600489582,-73.9446036460381,-73.9440498636813,-73.9435059452953,-73.9432358197176,-73.9429236691258,-73.9438427568083,-73.9424433497653,-73.9415361978508,-73.9402010365408,-73.9398949532679,-73.9397188755294,-73.9396971148626,-73.9396817849236,-73.9396729859966,-73.9396707756499,-73.9396751683588,-73.9396861354115,-73.9397036051036,-73.9397274631895,-73.9397575536381,-73.939793679653,-73.9398012960173,-73.9398059136575,-73.9398074739128,-73.9398059571174,-73.9397904612159,-73.9397682615681,-73.9397399122403,-73.9397061205912,-73.93966773022,-73.9396256993014,-73.9401413121009,-73.940069476676,-73.9399974438304,-73.9399643288933,-73.9399265257122,-73.9398841279558,-73.9398372408485,-73.9397859804583,-73.9397304738065,-73.9396552820282,-73.9395851155046,-73.9395202047197,-73.9394607628966,-73.939406985297,-73.9393590486393,-73.9393171103521,-73.9392813082096,-73.9392517598325,-73.9392285623012,-73.9389485978898,-73.9387736026166,-73.9385805006181,-73.9384874320206,-73.938390956886,-73.9382911469799,-73.9381880763366,-73.938081821838,-73.9379724625285,-73.9372953333144,-73.9370064164481,-73.936603647337,-73.9357262433215,-73.9353078807002,-73.9350633634262,-73.9349627411069,-73.9348574034224,-73.9347988641014,-73.9347456942292,-73.9346739306833,-73.9346351059628,-73.9344523939737],"lat":[40.8359809601499,40.8359577569972,40.8359352630948,40.8359114345038,40.8358819009942,40.8358695321068,40.8358644650877,40.8358638397868,40.8358562284681,40.8358352581315,40.835815845054,40.8357971272419,40.8357694925149,40.8357485321879,40.8357321310449,40.8357285593052,40.8357171332879,40.8357009316848,40.8356799193823,40.8356561512936,40.835626677302,40.8355980370351,40.8355875676387,40.8355599407126,40.8355323052652,40.8354837143951,40.8354274826505,40.8354074680382,40.835377932348,40.8353674683613,40.8353514322074,40.8353327151311,40.8352540431224,40.8352308219388,40.8350802176516,40.8350268754173,40.8348827790447,40.8347891214536,40.8347486578937,40.8347066733677,40.8346827603634,40.8346568479537,40.8346291231457,40.8346216350416,40.8346081447976,40.8345976661831,40.8343923653413,40.8342983203434,40.8342488628495,40.8342113992345,40.8339240432871,40.8338873180048,40.8338655969297,40.8337153567923,40.8336846319099,40.8336576569179,40.8334257390735,40.833377034784,40.8333538035701,40.833344822905,40.8333260803563,40.83329460948,40.8332811181852,40.8332601442583,40.8332414131886,40.8332286672735,40.8332016927766,40.8331896995089,40.8331762053808,40.8331627256204,40.8331514910004,40.8331424888092,40.8330510690293,40.8330285903476,40.8330218421729,40.8330031007293,40.8329836281742,40.8329671390245,40.8329454129968,40.8329041962711,40.8329026976737,40.8328847220365,40.8328749922759,40.8328528832643,40.8326824062373,40.8323635344769,40.8323657768372,40.8319416236114,40.8319423812671,40.8318591983501,40.8317040676258,40.8313199995499,40.831027353358,40.8306024452159,40.8302865638378,40.8298084370518,40.8297923091497,40.829772833255,40.8297683240768,40.8297563407522,40.8297405931673,40.8297203616943,40.8297001210002,40.8296574039486,40.8296371681202,40.8296090614466,40.8295970813634,40.8295745894253,40.8295506004956,40.8295273692709,40.8294951440797,40.8294404308,40.8294164557186,40.8294007259447,40.8293407746905,40.8293287736013,40.8293134022105,40.829180759946,40.8291657878361,40.8291583097922,40.8291320741339,40.8291335582814,40.8291163285479,40.8291125704264,40.8290975769611,40.829048119407,40.8290387602945,40.8290140338141,40.8289735668265,40.8289428363862,40.8289128585811,40.8289068601491,40.8286936557933,40.8286898352595,40.8286824012378,40.8286611886821,40.8286554361922,40.8286533630182,40.8286471822131,40.828600724009,40.8285925492987,40.8285677551862,40.8285216749682,40.8285029362902,40.8284572291491,40.8284280027947,40.8284010255637,40.8283822824144,40.828363557539,40.8283448203536,40.8283283339851,40.8283013511601,40.8282593849925,40.8282511498574,40.8282384027765,40.8282271675599,40.8282084316785,40.8281956939791,40.8281567195714,40.8281627044494,40.8281174027778,40.8280481614642,40.8280268703131,40.8279685583618,40.8279078000914,40.8279034726707,40.8278494020435,40.827765689651,40.8277289307585,40.8270428939722,40.8270370927788,40.8268422051935,40.8264678505915,40.8258275981585,40.8258209371444,40.8252325902945,40.8246492312228,40.8244963869173,40.8244389527514,40.8241668830372,40.8237990457902,40.823078580871,40.8230290320505,40.8230206191804,40.8228006559768,40.8226472532443,40.8225243326885,40.8222012169168,40.8221399123411,40.8221042273439,40.8219960379902,40.8218055757963,40.8217170991103,40.8216945617701,40.8215593209342,40.8211767035744,40.8211338770228,40.8209525472825,40.8208168097529,40.8203978401842,40.8203381971747,40.8199999202018,40.8199680347252,40.8197295747657,40.8197197434297,40.8195966579799,40.8194910950851,40.8194154949189,40.8193564297504,40.818349758874,40.8181159933882,40.8179438380677,40.8178265139486,40.8177339630165,40.8175548812153,40.8171885285585,40.8169080484752,40.8165278475177,40.8153255842971,40.8149886935705,40.8149080151166,40.8147881271423,40.8146738499206,40.8140416302207,40.8135061410526,40.8134210414446,40.8127403643289,40.8120656192324,40.811967604798,40.8118254640113,40.8117184435789,40.8113763885697,40.8112308205668,40.8108565568745,40.8102088095336,40.8095814180327,40.8089580956456,40.8083342675993,40.8077133463811,40.8070890003497,40.8064157377451,40.8057440127946,40.8057865544534,40.8059128052393,40.8061705933247,40.8063908245811,40.805761256464,40.8051360144618,40.8045149486583,40.8038773575842,40.8036589775521,40.8032719273995,40.8032250478403,40.8030030414928,40.8025985987175,40.8019702312397,40.8013423951725,40.8006653058823,40.7999617029103,40.7995417892866,40.7994766714787,40.799410524218,40.7993502952957,40.7989521806135,40.7988883320409,40.798806862972,40.7987655427009,40.7984853598543,40.7984171483815,40.7983448765784,40.7982728510984,40.7981292175668,40.7974828390052,40.7971004941062,40.7968719999055,40.7970970016013,40.7976031176705,40.7982097712479,40.7982424940104,40.7982697426927,40.7983720915692,40.7994066466177,40.7994211988942,40.7994405006974,40.7994664264164,40.8005152724391,40.8005825409548,40.8006704780884,40.8008175046001,40.8011564232565,40.8018437601372,40.802469794366,40.8031064864712,40.8038942709989,40.8043967319451,40.8045224810712,40.8047138784415,40.805158942967,40.8052356303971,40.8053124249316,40.8053887288287,40.8054639479951,40.8055374971112,40.8056088036908,40.8062909886274,40.806916171387,40.8075457092798,40.8081733540405,40.8088022490491,40.8094291534067,40.8100645547038,40.8094766976597,40.809879604283,40.8100940849071,40.8107653330668,40.8114428535016,40.8120076851397,40.8125216292872,40.8125750715315,40.8131593892901,40.8137999804368,40.8140862972449,40.8140864784467,40.8140866660151,40.8143795835932,40.8146997709849,40.8150257543226,40.8153568260673,40.8156922860175,40.8163743056192,40.8171165088996,40.8178555099919,40.818534997721,40.8192083715056,40.8198942680339,40.8205720426877,40.8212632155597,40.8208790434763,40.8214619811882,40.8220515921051,40.8226277527772,40.8229213350338,40.8232605872505,40.8236478015425,40.8255725938732,40.8268202536772,40.8286533023111,40.829073508872,40.8293217719184,40.8293815510044,40.8294424702619,40.8295041312445,40.8295661306538,40.8296280629762,40.8296895232286,40.8297501093298,40.829809425007,40.8298670822961,40.8299227040787,40.8299426303878,40.8299630809152,40.8299837956854,40.8300045123177,40.8300377771075,40.8300687730826,40.8300967266229,40.8301209399942,40.8301408088839,40.830155837388,40.8303719888808,40.8304899742724,40.8307346363336,40.8308068175587,40.830877657591,40.8309469808753,40.8310146147957,40.8310803925658,40.8311441511741,40.8312091424794,40.8312772989227,40.8313483966379,40.8314222020974,40.831498472879,40.8315769586316,40.8316574013863,40.8317395369171,40.8318230954371,40.831907802484,40.8324173363284,40.8326632126625,40.8328986755061,40.8329945036773,40.8330883682452,40.8331801993726,40.8332699288509,40.8333574897971,40.8334428170631,40.8339759182039,40.834193110683,40.834513016174,40.8351563465998,40.8354777249337,40.83567765881,40.8357599347499,40.8359850255776,40.8361101162622,40.8360920946286,40.8360649032392,40.8360501920772,40.8359809601499]}]],[[{"lng":[-73.8684051894918,-73.8686845430455,-73.8685947803896,-73.8680588528607,-73.8679768804403,-73.8679094844676,-73.8677683216845,-73.8676234034652,-73.8675274988967,-73.8674569407755,-73.8672805740703,-73.8670180292609,-73.8668705856634,-73.8665984828325,-73.8665979084489,-73.8665040782449,-73.8663149694295,-73.866302638535,-73.8662900301626,-73.8660199322073,-73.8649940445724,-73.8645649429913,-73.8641009667913,-73.8639900878039,-73.863786744035,-73.8633494352703,-73.8633096418202,-73.8632829703043,-73.8628674241378,-73.8623458053523,-73.8622594308922,-73.8620284308973,-73.8617123871756,-73.8613977586668,-73.8613186364857,-73.861143960365,-73.8610719249902,-73.8607751279137,-73.8603851992073,-73.8594741645808,-73.8585547003992,-73.8576332310836,-73.8573094773904,-73.8572848668308,-73.8572674460264,-73.857246757818,-73.8572269369615,-73.8568467616235,-73.8567050909425,-73.8566799570509,-73.8564631194297,-73.8561880966006,-73.8561174022973,-73.8556846115504,-73.8561171020898,-73.8565907511986,-73.8575356334515,-73.858429508573,-73.8581177926926,-73.8580250429809,-73.8579364091196,-73.8576153725158,-73.8585143639364,-73.8593869184695,-73.8603049456405,-73.861188754815,-73.8617475902521,-73.8631708327441,-73.8626977829953,-73.8630020220129,-73.8630099421013,-73.8630153216374,-73.8630180308236,-73.8630180042936,-73.863015242689,-73.8630098126441,-73.863001845178,-73.8630129753606,-73.8630026713913,-73.862994891143,-73.8629897550625,-73.8629945183242,-73.8630032158504,-73.8630156273031,-73.86303143826,-73.8630502481797,-73.8630715805491,-73.8630777580685,-73.8630848545675,-73.8630926834548,-73.8631010388821,-73.8631097011566,-73.8631184425171,-73.8631234318754,-73.8631277753476,-73.8631313611032,-73.8631340968203,-73.8631359120629,-73.8631367600946,-73.8631366190814,-73.8631354926541,-73.8631334098149,-73.8631304241904,-73.8631266126511,-73.8631220733322,-73.8631208631444,-73.863120965205,-73.863122376788,-73.8631250601965,-73.8631289437694,-73.863133923795,-73.8631398672809,-73.8631466155051,-73.8631539882555,-73.8631581097421,-73.8632186820399,-73.8632160622111,-73.8632143949638,-73.8632137298295,-73.8632140865682,-73.8632154545815,-73.8632177932273,-73.8632210330276,-73.8632250777323,-73.8632298071785,-73.8632350808609,-73.8632407421057,-73.8632466227252,-73.8632605695935,-73.863270517155,-73.8632762306861,-73.8632498848914,-73.8632176741554,-73.8631800080592,-73.8631373655485,-73.8630902888434,-73.8630393765439,-73.8630017171527,-73.863031173415,-73.8630382008606,-73.8630441941585,-73.863048995318,-73.8630524777747,-73.8630545497269,-73.863055156556,-73.8630542822654,-73.8630519499031,-73.8630482209535,-73.8630431937166,-73.8630370007169,-73.8630298052097,-73.8630130787,-73.8629999260079,-73.862990578352,-73.8629939813938,-73.8629992094927,-73.8630061181126,-73.8630145162579,-73.863024171754,-73.8630348176659,-73.8630461596779,-73.8630578842299,-73.8630696671866,-73.8631237892544,-73.8631305962589,-73.8631384969758,-73.8631472572018,-73.8631566172549,-73.8631662996722,-73.8631760174347,-73.8631848795857,-73.8631920617609,-73.8631973868762,-73.8632007236354,-73.8632019897679,-73.8632011540567,-73.8631982371082,-73.8631933108438,-73.8631864967268,-73.8631226425887,-73.8630513221345,-73.8629727346688,-73.8628870997973,-73.862794656813,-73.8626956640271,-73.8626411734317,-73.8617335554759,-73.8615829711944,-73.861432942853,-73.8612837693698,-73.8611357479592,-73.8609891735391,-73.86086853825,-73.8606132315635,-73.8605783620238,-73.862415662489,-73.8630437576723,-73.8657814362307,-73.865781613718,-73.8665377371266,-73.8669524199474,-73.8670922526893,-73.8672402628091,-73.8673016789663,-73.8675581768578,-73.8679313096204,-73.8683003031427,-73.8684816771708,-73.8688236145514,-73.8688921986943,-73.8691753364724,-73.8693844004147,-73.8696177059267,-73.8699327052746,-73.8701856522754,-73.8711645285202,-73.8713166100128,-73.8721847326651,-73.8728165793136,-73.8734002412763,-73.8734655825853,-73.8735203686159,-73.8762333965815,-73.8762945252789,-73.8792151390953,-73.879216582309,-73.8792686378595,-73.8793321168056,-73.8796386550232,-73.879719790343,-73.8792412462232,-73.8791083739292,-73.8767619395631,-73.8767224338222,-73.876721924919,-73.8765602494519,-73.8739542531331,-73.873901277361,-73.8745808100912,-73.8749535774166,-73.8753064636552,-73.8754586187918,-73.8759630900538,-73.8761608741758,-73.8761776706062,-73.8761993303292,-73.8762191253342,-73.876548599704,-73.8768334902356,-73.877096271282,-73.8773424827109,-73.8775289455008,-73.8779734133435,-73.8780368114511,-73.8786849317358,-73.8786470531725,-73.8791915645211,-73.8802966914578,-73.8817902790232,-73.8849483577282,-73.887675444841,-73.8881581183427,-73.888628250132,-73.889085352959,-73.8895289317097,-73.8899585373793,-73.8900058919058,-73.8900378251875,-73.8913654358725,-73.8924573741515,-73.8935467713984,-73.8944111404313,-73.8952054035487,-73.8954642725973,-73.8955888446442,-73.8959444275682,-73.896677454942,-73.8967821330709,-73.8974134466262,-73.8976101330835,-73.8978033326603,-73.8980025574774,-73.8981364616514,-73.8985970379314,-73.898872111499,-73.8990033229351,-73.8990244634611,-73.8990418038891,-73.8988860174521,-73.8988069843351,-73.8988183473785,-73.8988357145382,-73.8992176089417,-73.899652332798,-73.9000252300403,-73.9004165405497,-73.9008513567251,-73.9012657039877,-73.9016676789062,-73.9019821814221,-73.9022882256012,-73.9026600835474,-73.902967689961,-73.9032213189808,-73.9034427236995,-73.9034622888674,-73.9034742227648,-73.9034735546669,-73.9034715727059,-73.9034687813497,-73.9034663061998,-73.9034655362001,-73.9034637968846,-73.9034593367302,-73.9033541752533,-73.9033159957102,-73.9033645784494,-73.9033899477951,-73.9034678007585,-73.9035464012338,-73.9035765725715,-73.9034905003708,-73.9040463980889,-73.9035258449234,-73.9026226228038,-73.9007523595447,-73.9004700109828,-73.900245376395,-73.8997455060752,-73.8996983025444,-73.8988992828747,-73.8987094468792,-73.8984899774004,-73.898274189501,-73.8980644469557,-73.8978629987368,-73.8976719417578,-73.8974931200785,-73.8974375614847,-73.8973838123863,-73.8972831772595,-73.8971901003899,-73.8971048866469,-73.8970278151516,-73.896959138362,-73.8968990812467,-73.8968693782032,-73.8967496595112,-73.8966353676674,-73.8965815876399,-73.8965263330149,-73.8964662506299,-73.8964301047751,-73.8964190907378,-73.8963679902941,-73.8963589890351,-73.8962863475366,-73.8962016955736,-73.8959972738213,-73.8957794543699,-73.8956147649848,-73.8955485950465,-73.8953050494877,-73.8950492683729,-73.8949106745415,-73.8941746326718,-73.8941425555181,-73.8940409878327,-73.893985686658,-73.8934403131568,-73.8927414244319,-73.8925830316834,-73.8916601065927,-73.8906308685609,-73.890154186729,-73.8896278757877,-73.8890889528668,-73.8882981117232,-73.888092663383,-73.8880834184255,-73.887283929256,-73.884522508914,-73.8837769864928,-73.8822666544277,-73.8811746909754,-73.8795613942397,-73.879506412209,-73.8793931510817,-73.8740205324067,-73.8710755255059,-73.8700429289989,-73.8689176275678,-73.8684051894918],"lat":[40.6947311862439,40.6940346919049,40.6938843746911,40.6911839582394,40.6907955842833,40.6904762612661,40.689803288876,40.6891453418447,40.6887161827396,40.6884004416592,40.6877492851037,40.6868303490357,40.686330590624,40.6852695590692,40.6852647166839,40.6844740517614,40.6832489428232,40.683186694603,40.6831150072076,40.681919587028,40.682128969899,40.6822461495736,40.6823728502927,40.6819285755629,40.6811137470236,40.679351640889,40.6791679691603,40.6790793706735,40.6791221206402,40.6791647851417,40.6788167861564,40.6778861145353,40.6766105959752,40.6753365904825,40.6750212688162,40.6743301474492,40.6740198143971,40.672805622741,40.6712517109905,40.6713805315348,40.6715129273103,40.6716561940381,40.6704162333648,40.6703219899049,40.6702552942948,40.670174051682,40.6700962126364,40.6686029353322,40.6680264396037,40.6679241591767,40.6670417638915,40.6658465551295,40.6655093801063,40.6638674928747,40.6638084021346,40.6637471595992,40.6635978625139,40.6634533609319,40.6620365707923,40.6617210500925,40.6613744371239,40.6601189331547,40.6598989424686,40.6597727153821,40.659634655304,40.6592546258883,40.6589383565109,40.6582765129481,40.6576183090124,40.6574881166273,40.657476093037,40.6574632804216,40.6574499879275,40.6574365362798,40.6574232500435,40.657410449792,40.6573984443731,40.6573490240437,40.6573340362566,40.6573181900077,40.6573017306177,40.6572825565294,40.6572642008487,40.657247128581,40.6572317722185,40.657218520784,40.657207709976,40.6572124229881,40.6572163136927,40.6572192797899,40.6572212432908,40.6572221525682,40.657221983714,40.6572192141448,40.6572158724994,40.657212044815,40.6572078296421,40.6572033355084,40.6571986781235,40.6571939774003,40.6571893543677,40.6571849280539,40.6571808124227,40.6571771134383,40.6571739263378,40.6571678659808,40.6571617364378,40.6571557013992,40.6571499220318,40.6571445526744,40.6571397367165,40.657135602769,40.6571322612295,40.6571298013342,40.6570877841037,40.6570418793427,40.65703782732,40.6570334928752,40.6570290047788,40.657024496366,40.6570201015757,40.6570159509711,40.6570121678609,40.6570088646362,40.6570061394312,40.657004073208,40.6570027273512,40.6570021418443,40.6569830737892,40.656962603945,40.6569412153282,40.6569004089046,40.6568621207965,40.6568268378514,40.6567950087041,40.6567670380727,40.6567432816125,40.6566537573703,40.6565081811807,40.6565037502665,40.6564985116793,40.6564926035149,40.6564861815201,40.6564794149869,40.6564724822897,40.656465566183,40.6564588489841,40.6564525077666,40.656446709693,40.6564416076074,40.6564373360072,40.6564176096086,40.6563963713411,40.6563739945704,40.6563653899706,40.656357333738,40.6563500485944,40.6563437359443,40.6563385703065,40.6563346944896,40.6563322156439,40.6563312022994,40.6563316824709,40.6563899390294,40.6563952428283,40.6563995787833,40.6564028183623,40.6564048655336,40.6564056596121,40.6564051770587,40.6563975353458,40.656388931338,40.6563795771769,40.6563697035002,40.6563595537546,40.6563493781935,40.6563394277067,40.6563299476344,40.6563211717183,40.6562122741798,40.6561060983797,40.6560029409736,40.6559030901821,40.6558068249862,40.6557144143476,40.6556675370077,40.6552952217741,40.6552882942718,40.655276256008,40.6552591309677,40.6552369532711,40.6552097671052,40.6550778057373,40.6547194707377,40.654675329646,40.6535648293056,40.6532094155741,40.6517060219567,40.6517059233221,40.6513027581793,40.6510793881619,40.6510100211849,40.6509254890873,40.6508927806821,40.6507561620547,40.6505611782635,40.6503651351014,40.6502673752048,40.6500856936291,40.6500492524762,40.6498963066432,40.6497848796895,40.6496539930983,40.64947579544,40.6493231823679,40.6486871358636,40.6485883154056,40.6479450700283,40.6474157972005,40.6468810876709,40.6468166334718,40.6468762094049,40.6505542748243,40.6506371403334,40.6545891318927,40.654591083773,40.6545691307326,40.6546220168498,40.6544990918043,40.6543759297764,40.653737186432,40.6537062355396,40.6505609544952,40.6503754030904,40.6503232219679,40.6500966543428,40.6464444346184,40.6463683678613,40.6456101054833,40.6451415836971,40.6446556691015,40.6444269313803,40.6436444842541,40.6433205280068,40.6432896590227,40.6432571730929,40.6432221341946,40.6426389282807,40.6421185898394,40.6416029545283,40.6410826809833,40.6407168001053,40.6398071177214,40.6398722842505,40.6405385525687,40.6410658560679,40.6416523796818,40.6426378289533,40.6439490289227,40.6468021729202,40.6491940977459,40.6495575484092,40.6499307837856,40.6503134324823,40.6507050708338,40.6511053045391,40.6511486971311,40.6511781774775,40.652364719447,40.6537109390806,40.6552027140843,40.6548329486657,40.6544879295266,40.6543775766565,40.6543244722693,40.6541728884023,40.6538549566563,40.6538095558218,40.6535383207189,40.6534538161212,40.6536248534122,40.6538012239551,40.6540430147487,40.6558281670742,40.6567123638255,40.657240805857,40.6573127030726,40.6573716575709,40.6573948832092,40.6574066618045,40.6574538129022,40.6575259418736,40.6591114041932,40.6607354163782,40.6622816314516,40.6638065279357,40.6653458945236,40.6668806501649,40.6684135291928,40.6696700711987,40.6709360069667,40.6721971791508,40.6734393952624,40.674472913689,40.6753779190606,40.6754579194757,40.6755066832772,40.6755357608614,40.6756224600559,40.6757441809375,40.6758526638646,40.6758860089664,40.6759278906414,40.6760350028628,40.677111534876,40.6778692233986,40.6779817489148,40.6780382329525,40.6783758875856,40.6787425374827,40.6788833043726,40.6788980485348,40.6792205980192,40.6797392425141,40.6806645034182,40.6796766435087,40.6795352440653,40.6794227910109,40.6795079600669,40.6795440916942,40.6795609349016,40.6796301706819,40.6796705087743,40.6797250434942,40.6797934311789,40.6798750111177,40.6799688549371,40.6800737767268,40.6801206915437,40.6801688126217,40.6802672079914,40.6803698249256,40.6804763273461,40.6805863664477,40.6806995818402,40.6808156027293,40.6808814490309,40.6814920260621,40.6815564953434,40.6815747184331,40.6820029184158,40.6823364219728,40.6824463593363,40.6824798757412,40.6825997571336,40.6826208667338,40.6827583825879,40.682891482754,40.6831968787779,40.6834971833575,40.6837074215681,40.6837918923162,40.6840805200677,40.6843625985359,40.6845084863337,40.6852832481706,40.6852471462724,40.6851328346005,40.6850705947104,40.6844567900322,40.6836701856633,40.6834919108878,40.6840441779094,40.6847001780487,40.6850039898045,40.6842364542529,40.6846405530012,40.6851541932134,40.6852876279233,40.6852936321711,40.6856224754499,40.6866847490949,40.687863411185,40.6890385511502,40.6898725878353,40.691104780826,40.6911467688432,40.6912096316943,40.6941912952175,40.694746747868,40.6949414841501,40.6951465615148,40.6947311862439]}]],[[{"lng":[-73.9968399386042,-73.993616883955,-73.9917149877339,-73.9911989933494,-73.9907539681664,-73.9899029597006,-73.9898685213956,-73.9900345573586,-73.9901022574384,-73.9901135029676,-73.9902119097244,-73.9903901000267,-73.9905055860359,-73.9907253040987,-73.990757284933,-73.9909305352938,-73.9910699383004,-73.9911225669304,-73.9912294360479,-73.9912979062873,-73.9912343955904,-73.991352889619,-73.9913889833731,-73.9915520757907,-73.9915676292787,-73.9916385340918,-73.9917939621946,-73.9920610854351,-73.9922151661297,-73.9923276795879,-73.992579873967,-73.9926032219844,-73.9926325495429,-73.9930919022704,-73.9932601619493,-73.9933391724292,-73.9933618150688,-73.9935273136781,-73.9937959386914,-73.9938379218417,-73.9940415520236,-73.9940726322125,-73.9941680598259,-73.9942347091631,-73.9943986625863,-73.9948077902131,-73.9954287587875,-73.9958091234924,-73.9960587274438,-73.9969837521549,-73.9977628592577,-73.9985892556803,-73.9993124170014,-73.9999562086466,-74.0005319552123,-74.0012727334021,-74.0014005568262,-74.0018840630948,-74.0026000190985,-74.0032595504915,-74.003511864393,-74.0039292829342,-74.0046351624464,-74.0052271617457,-74.0053098612998,-74.0059128987708,-74.006298417107,-74.0076290415272,-74.0079120604296,-74.0080783528947,-74.0083021626477,-74.0085709097978,-74.0086438056641,-74.0093176044508,-74.0097315228011,-74.010053385917,-74.0108123826073,-74.0109227725817,-74.0110245795111,-74.0111435335985,-74.0112946411488,-74.0114712324908,-74.0115819399768,-74.0117574747775,-74.015170840198,-74.0151432552331,-74.0151235654947,-74.0143067159663,-74.0134167752072,-74.0123445476603,-74.011542018976,-74.0113832360476,-74.0143906993239,-74.0143446147417,-74.0142192854302,-74.0140774139114,-74.0140869355992,-74.014037969248,-74.0140155229543,-74.0111619569648,-74.0110897139191,-74.0110717022351,-74.0109935087915,-74.0109411822675,-74.0114608355918,-74.0140022021461,-74.0139995724097,-74.0109038988329,-74.0108984071244,-74.0108711957776,-74.0108445982394,-74.0108192559447,-74.0107957800571,-74.01077473673,-74.0107566334533,-74.0107433001391,-74.0107342444294,-74.0107297240402,-74.0107298676192,-74.0107346710848,-74.0107439977416,-74.0107575821696,-74.0107750377783,-74.0108021659265,-74.0108329687799,-74.0108665468693,-74.0108328456321,-74.0120179201047,-74.0120012422239,-74.0108135947911,-74.0107879833172,-74.0107092291038,-74.0106429201788,-74.0106772465934,-74.0106698675122,-74.0106875260377,-74.0107040434535,-74.0107170297584,-74.0107261323198,-74.0107311039634,-74.0107318096853,-74.0107282303187,-74.0107204630542,-74.0107087188013,-74.0106937789917,-74.0106757602816,-74.0106551258418,-74.0106542103389,-74.0106191007743,-74.0105681057344,-74.0105158157676,-74.0104765981442,-74.0110870663595,-74.0110679193433,-74.0110887458719,-74.0111066571464,-74.0111212396193,-74.0111321565993,-74.0111391560256,-74.0111155367853,-74.0110917377806,-74.011068088912,-74.0110542671545,-74.0110512619664,-74.010454328646,-74.0104286788463,-74.0103930313456,-74.010498589883,-74.0105547399681,-74.010746761353,-74.0113879840656,-74.0114845673462,-74.0115804550232,-74.0115881872491,-74.0115871581663,-74.0116335189519,-74.0116279231177,-74.0115551815629,-74.0115274502041,-74.0115149173653,-74.0114607395534,-74.0121574191309,-74.0121537262405,-74.0126574248999,-74.0126592820849,-74.0125737299691,-74.0125737287473,-74.0114748691886,-74.0113743882049,-74.0107184060963,-74.0096314557175,-74.0094968552036,-74.0094915462128,-74.009516273582,-74.0095184419593,-74.0095013790586,-74.0094629386021,-74.0094114026613,-74.0095813182218,-74.0095769279162,-74.0121623290922,-74.0121174587214,-74.00951947145,-74.0094478407252,-74.0092779275607,-74.0091660821697,-74.0090243918132,-74.0088933979832,-74.0087908052275,-74.0086990229636,-74.0082040187844,-74.0077911613479,-74.006970777244,-74.0054421484491,-74.0053622202936,-74.0051255345225,-74.0031073388422,-74.0025238141675,-73.9996842297327,-73.9968399386042],"lat":[40.7373608893982,40.736004491616,40.7352153006666,40.7350123685835,40.7348391545737,40.7344347896343,40.7335271145549,40.732754151374,40.7324453723405,40.7324005043438,40.7319963344049,40.7312885238275,40.7305649567378,40.7298786874765,40.7297408314207,40.7291422958175,40.7287253700306,40.7285679662687,40.7280726173606,40.7277552485622,40.7277268052624,40.7275573980602,40.7274977011422,40.7270943367239,40.7270346471162,40.7268332557749,40.7263917953616,40.7256446143343,40.7252325956682,40.7249060973921,40.7242015549233,40.7241364496834,40.7240568651524,40.722820084364,40.722354426278,40.7221411401718,40.7220800178355,40.7216332613659,40.7209375374658,40.7208321486218,40.7203209798232,40.720243490903,40.7200118462521,40.7198515145635,40.7194571089279,40.7184574263504,40.7172792430479,40.716644659708,40.716231640211,40.7165405431721,40.7168139281215,40.7170995115372,40.7175502417774,40.7180170950872,40.7184302390141,40.718961426446,40.7190526207015,40.7193975702879,40.7199034258279,40.7203770957584,40.7205563523918,40.7208544345578,40.7213536332407,40.7217441025603,40.7218241918131,40.7222529491649,40.7225495031654,40.7234977035754,40.7236997672675,40.7238268627638,40.723977808516,40.7241693552824,40.7242213174553,40.724701551389,40.7249903710288,40.7252444513723,40.7257898025558,40.7257941513483,40.7257938617085,40.7258144754712,40.725954942917,40.7260619796901,40.7261710343295,40.7261899048353,40.7265793906577,40.726710526782,40.7267939430672,40.7267081211967,40.7266210312135,40.7265194304825,40.7264473464245,40.7282292723672,40.7284630475202,40.7286221837815,40.7295234277555,40.7306404091879,40.7306631730403,40.7306942188439,40.7306828396561,40.7304506763491,40.7312525684535,40.7314524921763,40.7323204179406,40.7330077632694,40.7330284136384,40.7330680017955,40.7333322775177,40.7332976171396,40.733351207376,40.7333526110263,40.733357202535,40.733364871172,40.7333754319978,40.733388630324,40.7334041478552,40.7334226468679,40.7334425875549,40.7334634024343,40.7334844991451,40.7335052773059,40.7335251455996,40.7335435386025,40.7335599328751,40.7335781204809,40.7335925291098,40.7336027380169,40.734007094011,40.7340637444564,40.7343384011662,40.7342834436476,40.7345482938444,40.7353628721402,40.7360486977049,40.7360562799568,40.7361019319292,40.7361138677228,40.7361291844309,40.7361463565088,40.7361649176664,40.7361843638938,40.7362041671477,40.7362237896898,40.736242698688,40.7362603806857,40.7362759491663,40.736289501447,40.7363006891653,40.7363477447433,40.7363453907218,40.7369722201425,40.7375960649536,40.7380639405951,40.7380927500813,40.7383040961741,40.7383175246911,40.738333198299,40.7383507551168,40.7383697897827,40.7383898628131,40.738392085617,40.7383921814886,40.738390149099,40.7383879479573,40.7383964257507,40.7383645057256,40.7387033646588,40.7391742965618,40.7391734327704,40.739186239049,40.7391759366796,40.7392160560887,40.7392604620915,40.739264536112,40.7392715953977,40.7394788698322,40.7395064860661,40.7395624736036,40.7395567262273,40.7398737709473,40.7399728636988,40.7405842147525,40.7406059981313,40.7406742566207,40.7406966522318,40.7407476384975,40.7407417318449,40.7407352576227,40.7406870602711,40.7407239476413,40.7406855939256,40.7406453673743,40.7407270117855,40.7407427094398,40.7407735836735,40.7408057229169,40.7408292237458,40.7409023372403,40.7411540933129,40.7411749602848,40.7412106566544,40.7414918896827,40.7417585162116,40.741490301696,40.7418915912202,40.7418786108562,40.7424165914635,40.7423997433102,40.7423841671893,40.7423751437236,40.7423617239634,40.7421475187909,40.7419708442441,40.7416271271582,40.7409821402617,40.740949503518,40.7408502130684,40.739997520559,40.7397526436422,40.7385524738161,40.7373608893982]}]],[[{"lng":[-73.9887793168407,-73.9875719527018,-73.9871804967054,-73.984945506,-73.9835605212129,-73.9834664420825,-73.9832146714656,-73.9829644066345,-73.9825562923175,-73.9824687621402,-73.9819091150614,-73.9816665703113,-73.9803400750025,-73.9799210997628,-73.9791080389467,-73.9780269795085,-73.9775384383504,-73.9769043637167,-73.9761963235918,-73.9758124489941,-73.9756678261324,-73.9732979683815,-73.9720501541323,-73.9719768505994,-73.9719124415182,-73.9718567123771,-73.9717960198696,-73.9716269727173,-73.9716697270118,-73.971695874516,-73.9717189436151,-73.9717384337936,-73.9717675541024,-73.9717741096531,-73.9717914296149,-73.9718165058775,-73.971859358309,-73.9718743769522,-73.9718849095148,-73.9719112073207,-73.9719337450108,-73.9719397545632,-73.9719615477859,-73.9720051184119,-73.9720366696688,-73.9720659586741,-73.9720719696035,-73.9720809815193,-73.9720840005729,-73.9720975129091,-73.9721560900173,-73.9721658599662,-73.972216923762,-73.9722334467696,-73.9722649986824,-73.9723250773159,-73.9723611574465,-73.9723994574828,-73.9725101118038,-73.972889713967,-73.972996376171,-73.9731121076904,-73.9732368828268,-73.9733706738902,-73.9735134512052,-73.9736887753742,-73.9738717527949,-73.9740623607051,-73.9742605754032,-73.9744663722499,-73.9746797256724,-73.974900609167,-73.9751289953027,-73.9751497793712,-73.9751636080619,-73.9751885098631,-73.9752138702366,-73.9752254962796,-73.9752466638863,-73.9752467042073,-73.9758031128397,-73.9757953279243,-73.9759684451969,-73.9760498145551,-73.9761236883879,-73.9761653123832,-73.976311278672,-73.9764287251453,-73.9765054011539,-73.9765500881422,-73.9767122153967,-73.9768188354005,-73.9769907657463,-73.9770565940175,-73.9772221356257,-73.9775266843264,-73.9777211949307,-73.9778209163825,-73.9778994961945,-73.9779967479038,-73.9780797490662,-73.9781819069428,-73.9782555774921,-73.9783714816526,-73.97861560124,-73.9787761334208,-73.9791889437701,-73.9792072643461,-73.9792901523712,-73.9800364229283,-73.9802834433218,-73.9803365249047,-73.9803309012443,-73.9805104602636,-73.9812864755256,-73.9812457956995,-73.983060194774,-73.9836423447263,-73.9844964707676,-73.9865503533998,-73.9881649172669,-73.9881734096788,-73.9883906402327,-73.9884465343738,-73.9884796726877,-73.9884972717388,-73.9886365807185,-73.9886453349368,-73.9886675058094,-73.9886961027133,-73.9887177111125,-73.9887368170752,-73.988797177858,-73.9888984598088,-73.9893576569668,-73.9894606701943,-73.9895744960872,-73.9897451515574,-73.9901582537338,-73.990514203767,-73.9907891301856,-73.9910678346301,-73.9913510923706,-73.9917026029252,-73.9917677958013,-73.9919054436645,-73.9920392696835,-73.9920913163597,-73.9921486897015,-73.9923611613991,-73.9928484674865,-73.9937401286223,-73.9940082016405,-73.9941406320035,-73.9943782354394,-73.9945789996372,-73.9951757736984,-73.9958038565357,-73.9960189839576,-73.9966640099659,-73.9972828719558,-73.99808351187,-73.9982860232059,-73.9985275858531,-73.9985611462062,-73.9987219795506,-73.9987539657086,-73.9988084627664,-73.9988215842098,-73.9988813086388,-73.9989834096324,-73.9990527673855,-73.9991343491895,-73.999194511749,-73.9992873111686,-73.9993619558227,-73.9993995507368,-73.9994428144047,-73.9995627336694,-73.9998119392456,-73.9999293642363,-74.0000076558933,-74.0001235912308,-74.000191031389,-74.0002656668273,-74.0005500495307,-74.0013443991373,-74.0014714023208,-74.0014193471629,-74.0012825853251,-74.0012347662873,-74.0011364675746,-74.0010032544294,-74.0009063363727,-74.0007528938798,-74.0006636699085,-74.0005098609723,-74.0006202506202,-74.0007140956851,-74.0007880129429,-74.0008396236891,-74.0008678146431,-74.0008727630724,-74.0008906642112,-74.0008911124527,-74.0008516037919,-74.0002562874538,-74.0004590571478,-74.0004546306596,-74.0005273494269,-74.0007895518617,-74.0005783921612,-74.0001382090783,-73.9999309777797,-73.9994483818033,-73.9993124170014,-73.9985892556803,-73.9977628592577,-73.9969837521549,-73.9960587274438,-73.9958091234924,-73.9954287587875,-73.9948077902131,-73.9943986625863,-73.9942347091631,-73.9941680598259,-73.9940726322125,-73.9940415520236,-73.9938379218417,-73.9937959386914,-73.9935273136781,-73.9933618150688,-73.9933391724292,-73.9932601619493,-73.9930919022704,-73.9926325495429,-73.9926032219844,-73.992579873967,-73.9923276795879,-73.9922151661297,-73.9920610854351,-73.9917939621946,-73.9916385340918,-73.9915676292787,-73.9915520757907,-73.9913889833731,-73.991352889619,-73.9912343955904,-73.9912979062873,-73.9912294360479,-73.9911225669304,-73.9910699383004,-73.9909305352938,-73.990757284933,-73.9907253040987,-73.9905055860359,-73.9903901000267,-73.9902119097244,-73.9901135029676,-73.9901022574384,-73.9900345573586,-73.9898685213956,-73.9899029597006,-73.9888393515615,-73.9887793168407],"lat":[40.7339653997385,40.7334569906786,40.7332921477617,40.732349672818,40.7317702249338,40.731731080616,40.7316241682911,40.7315208425476,40.7313501340519,40.7313148847332,40.7310951283115,40.7309985475813,40.7304424608738,40.7302622052087,40.7299105584781,40.7294330591074,40.7292262479172,40.728957824278,40.7286619765265,40.7285197676225,40.7284625320068,40.72742800886,40.7268809467975,40.7268303562017,40.7267910087674,40.7267586854661,40.7267136796566,40.7266284529969,40.7263923271544,40.7262418298049,40.7261219932596,40.7259996675555,40.7258333029521,40.7258212813371,40.7258142211491,40.72581496625,40.7255829695329,40.7255031160798,40.7254244050658,40.7252903707,40.7251762903512,40.7251580386101,40.7250399788108,40.7248414902108,40.7246840700201,40.7245591583287,40.7245363508581,40.7244975679304,40.7244679055457,40.7244234152347,40.7241701782781,40.7241319637758,40.7239300546468,40.7238467799263,40.7237144573337,40.7234634993273,40.7233120604765,40.7231488163666,40.7226968860068,40.7210882972193,40.7206228901928,40.7201587392745,40.7196959467712,40.7192346146881,40.7187748447066,40.7182498827723,40.7177264352491,40.7172045667377,40.7166843416427,40.716165824164,40.7156490782896,40.7151341677872,40.7146211561967,40.7145794238635,40.7145519056912,40.7145031607239,40.7144484987985,40.714423439942,40.7143778063055,40.714377724561,40.7131781245892,40.7131700231916,40.7127895733909,40.7126041937779,40.7124603253984,40.7124201979109,40.7121186473102,40.7119090325037,40.7117987894525,40.7117345387283,40.7115357651784,40.7114195675238,40.7112566602306,40.7111976264668,40.7110687312283,40.7108430727332,40.7107100746607,40.710645444907,40.7105998662024,40.7105610173916,40.7105322505773,40.7105068655177,40.7104979090553,40.7104897074916,40.7104737819109,40.7104633150473,40.7104349233883,40.7104336663931,40.710428144567,40.7103784012667,40.7103618156111,40.7103592007147,40.7102869383136,40.7102747519457,40.7102183478817,40.7098262146013,40.7096479117481,40.7095918792448,40.7095096639395,40.7093119441395,40.7091567815065,40.7091475183013,40.7091269491627,40.709133820547,40.7091558468059,40.7091763052932,40.7099120615163,40.7099169338986,40.7099200348308,40.7099284498446,40.7099470900163,40.7099707418451,40.7099666074723,40.709954735765,40.7099009867079,40.7098892870513,40.7098740816066,40.7098487616557,40.7097903726638,40.7097338841188,40.7096895065887,40.7096572298426,40.7096203327034,40.7095652624535,40.7095550555237,40.7095253965823,40.7095169196653,40.7095082229038,40.7094986091041,40.7094643688115,40.7093818776388,40.7092461204354,40.7092374799191,40.7092332674,40.709192639199,40.7091309729101,40.7090342933078,40.7089460139075,40.7089162238475,40.7088269045177,40.7087316198429,40.7085096153672,40.7084299314676,40.7083315279083,40.7083152832336,40.7082374528962,40.7082236510272,40.7082001349927,40.7081754816775,40.7081366339198,40.7080926533162,40.7080325458664,40.707982396946,40.7079473763515,40.7080166031688,40.7080722865883,40.7081003383602,40.7081365567566,40.7082364831476,40.7084426144807,40.7085368170874,40.7085996194838,40.7086845192807,40.7087339123622,40.7087929499197,40.7090179172995,40.709646292959,40.7097465543233,40.7098147957719,40.7099940534729,40.7100553330356,40.7101759642254,40.7103540297637,40.7104778313564,40.710673832197,40.7107878023748,40.7109842704534,40.7110819840558,40.711192133519,40.7113121083329,40.7114386568541,40.7115681588622,40.7116969678131,40.7129829725656,40.7130150995419,40.7130567180603,40.713683831927,40.7141114129813,40.7143650475989,40.7151700588628,40.7152909684015,40.7155709024217,40.7161997305624,40.7165439142706,40.7173297970984,40.7175502417774,40.7170995115372,40.7168139281215,40.7165405431721,40.716231640211,40.716644659708,40.7172792430479,40.7184574263504,40.7194571089279,40.7198515145635,40.7200118462521,40.720243490903,40.7203209798232,40.7208321486218,40.7209375374658,40.7216332613659,40.7220800178355,40.7221411401718,40.722354426278,40.722820084364,40.7240568651524,40.7241364496834,40.7242015549233,40.7249060973921,40.7252325956682,40.7256446143343,40.7263917953616,40.7268332557749,40.7270346471162,40.7270943367239,40.7274977011422,40.7275573980602,40.7277268052624,40.7277552485622,40.7280726173606,40.7285679662687,40.7287253700306,40.7291422958175,40.7297408314207,40.7298786874765,40.7305649567378,40.7312885238275,40.7319963344049,40.7324005043438,40.7324453723405,40.732754151374,40.7335271145549,40.7344347896343,40.7339904794289,40.7339653997385]}]],[[{"lng":[-73.8202625598923,-73.8197062687684,-73.8195442616116,-73.8192154306295,-73.819161362818,-73.8191072958394,-73.8190501695227,-73.8189930568016,-73.8189210252737,-73.8186127527825,-73.8182856634571,-73.8182167099208,-73.8180990519696,-73.8174001053499,-73.8173552907551,-73.8170973875645,-73.8169667032834,-73.8166996124735,-73.8165897680259,-73.8163782449298,-73.8161385390022,-73.815937029704,-73.8155177755766,-73.8154625225467,-73.8154072811482,-73.8153719073105,-73.8151394016928,-73.8150331183611,-73.8149234326723,-73.8146694585273,-73.8144154871931,-73.8143092274701,-73.8141519173061,-73.8140705039223,-73.8136941977681,-73.8136563428962,-73.8136185078703,-73.8133890045906,-73.8131538158261,-73.8129980176373,-73.8124520793489,-73.8122418859606,-73.8120913555942,-73.8120295219687,-73.811769901511,-73.8117266323241,-73.8113979127617,-73.8110215873342,-73.810754331847,-73.8106329831089,-73.8107258752103,-73.8109881057541,-73.8118631505925,-73.8127176213562,-73.8130986312828,-73.8135401422149,-73.8143843798043,-73.8152282660355,-73.8160748749285,-73.8169264130452,-73.8181871097409,-73.819060751979,-73.8199392236373,-73.8208526408424,-73.8218934662347,-73.8229321626815,-73.8239803433813,-73.8250112887268,-73.8258732240272,-73.8267019729213,-73.8275302132571,-73.8283562087996,-73.8291824226466,-73.8300393407009,-73.8308855629651,-73.8317229831251,-73.8325774764411,-73.8334219064043,-73.8342599310853,-73.8346311562002,-73.8351167189827,-73.8359508277501,-73.8371765168474,-73.8380776900331,-73.8389406932338,-73.8397860022631,-73.8406300412629,-73.8411960566323,-73.8413409190611,-73.841513919314,-73.8423702910891,-73.8432309037523,-73.8440891489368,-73.8445106372463,-73.8449619067907,-73.8450583785572,-73.8451334988005,-73.8452020026906,-73.8452904232549,-73.8458323737205,-73.8467146424159,-73.8475784512998,-73.8478681763194,-73.8484443463383,-73.8493014492528,-73.8501480425854,-73.8509908928288,-73.8516820550599,-73.8522341708392,-73.8526772603694,-73.8533505728648,-73.8539801470208,-73.8543933070023,-73.8565341030587,-73.8568313704324,-73.8572107855002,-73.8577926836297,-73.8581983603457,-73.8585896258019,-73.859524861962,-73.8604665875376,-73.8607086187618,-73.8614061863469,-73.8623458053523,-73.8628674241378,-73.8632829703043,-73.8633096418202,-73.8633494352703,-73.863786744035,-73.8639900878039,-73.8641009667913,-73.8645649429913,-73.8649940445724,-73.8660199322073,-73.8662900301626,-73.866302638535,-73.8663149694295,-73.8665040782449,-73.8665979084489,-73.8665984828325,-73.8668705856634,-73.8670180292609,-73.8672805740703,-73.8674569407755,-73.8675274988967,-73.8676234034652,-73.8677683216845,-73.8679094844676,-73.8679768804403,-73.8680588528607,-73.8685947803896,-73.8686845430455,-73.8684051894918,-73.8668143382809,-73.8645570888365,-73.8636865642969,-73.8623683420772,-73.8601636430352,-73.8592849835958,-73.8583307891721,-73.8574444773962,-73.8565718515049,-73.8556742185687,-73.8547879606038,-73.852835443863,-73.8527451168608,-73.8527121632538,-73.8527011098125,-73.8527076981109,-73.8527320843455,-73.8527739700244,-73.8528326227881,-73.8533848640604,-73.8538625040373,-73.8543747078542,-73.8544996463028,-73.8544142783975,-73.8541011646925,-73.8510378068372,-73.8507084225627,-73.849138372429,-73.8482091285539,-73.8478966979251,-73.8470040531641,-73.8450247287711,-73.8442735217034,-73.8435939812998,-73.8429378956652,-73.8427567833131,-73.8427566424662,-73.8427564879882,-73.8425654377089,-73.8425652600801,-73.8425650701426,-73.8423654433828,-73.8423652895894,-73.8423651228293,-73.8421584479979,-73.8415637809442,-73.8394781524145,-73.83856418283,-73.83696237745,-73.8373309565426,-73.8378459516089,-73.8380686049643,-73.8380994175054,-73.8381220533075,-73.8381363534196,-73.8381422174135,-73.8381396038401,-73.8381285312553,-73.8381090773705,-73.838081378743,-73.837843159085,-73.8371470292285,-73.8382842883624,-73.8382490770014,-73.8381154639458,-73.8375010765286,-73.8374668178907,-73.8374571648824,-73.8374520301377,-73.8374402849152,-73.8374296234805,-73.8374093620758,-73.8374029131513,-73.8373827978206,-73.8373661358879,-73.8369679679288,-73.8369509368217,-73.8369448968254,-73.8369232207586,-73.8366260416097,-73.8365856505032,-73.8365763662954,-73.836573390022,-73.8365310312022,-73.836391679472,-73.8363696429638,-73.8363117940522,-73.8348123068994,-73.8344103057214,-73.834047919776,-73.8343772846659,-73.8348761972718,-73.8353995615279,-73.8357035139729,-73.835900721417,-73.8349471756521,-73.8341630764937,-73.8336425620393,-73.8335689574767,-73.8334783794503,-73.8333952937598,-73.8332165272826,-73.8315008443802,-73.8311564582916,-73.8308991069618,-73.8307132655342,-73.8305930643839,-73.8299041641565,-73.8289485211392,-73.8272072076456,-73.8263823750347,-73.8260600322682,-73.8260033749814,-73.8258552754084,-73.8255971632927,-73.8254606073229,-73.8248322241324,-73.8246934397495,-73.8245608126472,-73.8242894051795,-73.8242644916465,-73.8239440598338,-73.8238388906146,-73.8236575144419,-73.8234685822679,-73.8232722406517,-73.8230686423718,-73.8228579448663,-73.8226403115577,-73.821747155236,-73.8210335440499,-73.8207781897381,-73.8206415970137,-73.8204870313979,-73.8203905504066,-73.8203231300878,-73.8202625598923],"lat":[40.7095380732723,40.7086918535547,40.7084383738074,40.7078521164746,40.707760332058,40.7076685389046,40.707570220915,40.7074719035871,40.7073499060442,40.7068533995611,40.7063028504821,40.7061812339367,40.7059737147274,40.7046360531532,40.7045501397848,40.7040298015877,40.7037412846819,40.7031560939081,40.7029154363234,40.7024519644687,40.7019375695571,40.701505117148,40.7006053915253,40.700492864456,40.7003803378794,40.7003103108916,40.6998500093964,40.6996395966719,40.6994224400754,40.6989707122899,40.6985189733626,40.6983353320566,40.6980399706405,40.6978871298107,40.6972667958838,40.6972010516875,40.6971367385317,40.6967577542373,40.6963693587456,40.6961120625901,40.6951981245524,40.6948322361498,40.6945596210236,40.6944476309482,40.6939939048375,40.6939192986157,40.6933223136246,40.6926228874858,40.6921587015632,40.6919473825768,40.6919224223034,40.6918550447344,40.6916300801645,40.6914078038223,40.6913181019626,40.6912113678357,40.6909719537659,40.6907334771279,40.690492270968,40.6902501473664,40.6898920748069,40.6896424419732,40.6893936929379,40.6891343834089,40.6888382260043,40.6885430011056,40.6882452682572,40.6879523184278,40.6877086497737,40.6874732094474,40.6872394827356,40.6870028099533,40.6867708057622,40.6865293590858,40.6862865479113,40.6860507053982,40.6858063459228,40.6855677822712,40.6853289374999,40.6852232175474,40.6850849330504,40.6848435468849,40.6844953924184,40.6842389097021,40.6839938029679,40.6837541585341,40.6835139105714,40.6833513668439,40.683310503082,40.6832616814559,40.6830184222149,40.6827751975605,40.6825292985645,40.6824150883418,40.682307455319,40.6822844518408,40.6822665335029,40.6822506686508,40.682230444826,40.6821064507279,40.6818584931911,40.6815798682803,40.6814868321229,40.6812907036365,40.6810466724078,40.6808081069773,40.6805683676605,40.6803679773977,40.6802078909679,40.6800794150817,40.6798670165449,40.6796830349626,40.6796601136843,40.6795277252978,40.6795093383044,40.679485864345,40.6794557161414,40.6794308490686,40.6794027293995,40.6793454684152,40.6792785624499,40.6792637358096,40.6792209927654,40.6791647851417,40.6791221206402,40.6790793706735,40.6791679691603,40.679351640889,40.6811137470236,40.6819285755629,40.6823728502927,40.6822461495736,40.682128969899,40.681919587028,40.6831150072076,40.683186694603,40.6832489428232,40.6844740517614,40.6852647166839,40.6852695590692,40.686330590624,40.6868303490357,40.6877492851037,40.6884004416592,40.6887161827396,40.6891453418447,40.689803288876,40.6904762612661,40.6907955842833,40.6911839582394,40.6938843746911,40.6940346919049,40.6947311862439,40.6950653508091,40.6955204565116,40.6956914183774,40.695950143246,40.6963846579409,40.6965537112189,40.6967437106509,40.6969129847168,40.697064691022,40.697179357049,40.6972966237558,40.6975489621307,40.697560750099,40.6976690012452,40.6978182549633,40.6979685615504,40.6981181201147,40.6982650980146,40.6984077665833,40.6992542988145,40.6998648552405,40.700420652783,40.7005518549602,40.7005436911184,40.7005137488268,40.7002332854879,40.7002031251044,40.6982827412019,40.6985184085461,40.6986003293224,40.6988252110124,40.6993593770162,40.6997805061122,40.7001723519251,40.7005544292202,40.700657615421,40.7006576953068,40.7006577681377,40.7007505661518,40.7007506548659,40.700750735857,40.7008324281366,40.7008324904137,40.7008325439617,40.700902563635,40.7011005987176,40.7026901943316,40.7032969693934,40.7042124523322,40.7048549764566,40.7056295408818,40.7059574045712,40.7060307493963,40.7061057997818,40.7061820288086,40.7062589012806,40.7063358775998,40.7064124171869,40.7064879826599,40.7065620434741,40.7069519253094,40.7079570462625,40.7084093586259,40.7084640364838,40.7086650885321,40.7095493352663,40.7095923462805,40.709602451971,40.7096071091837,40.7096159923195,40.709620460462,40.7096208660767,40.7096201427989,40.7096118388699,40.709604945203,40.7094357214998,40.709428224989,40.7094245879593,40.7094076351508,40.7091343750677,40.7090945108954,40.7090853554134,40.7090832229207,40.7090415917049,40.7089120393388,40.7088915572839,40.7088372559869,40.7096433509599,40.7098464286569,40.7100293917755,40.7103027602552,40.7107231935459,40.7111922371615,40.7114646345007,40.7116413707688,40.7121627281736,40.7125916402772,40.7128670594696,40.7129169758843,40.7129629515836,40.7130079305458,40.713070986944,40.7139877114039,40.7140976747921,40.7141656017704,40.7142082424194,40.7142370635617,40.7144186894738,40.7146487412239,40.715073713355,40.7153106753392,40.7153993486023,40.715413630791,40.7154533969516,40.7155143369393,40.7155496455943,40.7146399929159,40.714443144363,40.7142550301751,40.7138700661059,40.713816425045,40.7132332993445,40.7129408783816,40.7127324472787,40.7125279397826,40.7123275144605,40.71213132661,40.711939528439,40.7117522686562,40.7110403038144,40.7104270358934,40.7101568997868,40.709971226871,40.7097944308467,40.7096802769619,40.7096109608246,40.7095380732723]}]],[[{"lng":[-74.0438776163994,-74.0435059607857,-74.0427353389298,-74.0427843338001,-74.0427042842677,-74.0425537203731,-74.0426392937116,-74.0426938081921,-74.043467523103,-74.0435163724582,-74.0436407862745,-74.0439745855618,-74.0443852177725,-74.0447839910639,-74.0462753900363,-74.0468028489857,-74.0474765152837,-74.047729627631,-74.0475857192479,-74.0474312612351,-74.0468920550059,-74.0472002936622,-74.0471105069861,-74.0471158204236,-74.0471832141206,-74.0471949251373,-74.0472132456783,-74.0472256842528,-74.0472319282725,-74.0472318208172,-74.0472253645786,-74.0472127217936,-74.0471942101681,-74.0471702948939,-74.0471409105325,-74.0471081405363,-74.0470726965651,-74.0470353483505,-74.0469969069794,-74.0461716706545,-74.0461470720867,-74.0460955106326,-74.0460444245365,-74.0459941839553,-74.0459259276921,-74.0458602742741,-74.0446061648289,-74.0438776163994],"lat":[40.6901876758739,40.6896873596361,40.6900501909177,40.6901209766912,40.6901552046443,40.6899627592896,40.6899281759108,40.6899972596098,40.6896369906061,40.6891910332398,40.6887665600728,40.688582407056,40.6885161779001,40.6885956601157,40.6893274253942,40.6899532562661,40.689611369998,40.6899153189686,40.6899825068262,40.6898038904709,40.6900590983227,40.6904248151212,40.6904704128501,40.6906558061182,40.6907473550491,40.6907632638482,40.6907904873262,40.6908195724355,40.6908497882698,40.6908803755068,40.6909105654899,40.6909395995445,40.6909667480433,40.6909913287425,40.6910105163445,40.6910262084724,40.6910380643421,40.6910458264812,40.6910493263199,40.6910979814864,40.6911226460332,40.6911200633818,40.6911141523256,40.6911049556948,40.6910826035467,40.6910561165834,40.6905734844483,40.6901876758739]}],[{"lng":[-74.0167475609607,-74.0154035914165,-74.0153546638998,-74.0154091666595,-74.0153891976824,-74.0151748220262,-74.0151893420934,-74.0152547432226,-74.0153091598503,-74.0152595103565,-74.0151263756415,-74.0151653814954,-74.0151287829433,-74.0150478986297,-74.0149431503348,-74.0149841798006,-74.0150397387253,-74.015156121595,-74.014221230849,-74.013478097856,-74.0134718371085,-74.0134642424601,-74.0134555172519,-74.0134458950948,-74.0134356336145,-74.0134250075543,-74.0134143014184,-74.0134038018552,-74.0125025867518,-74.0125228982705,-74.0124088889432,-74.0124009890298,-74.0123916159385,-74.0123726014913,-74.0123501259174,-74.0123248007178,-74.0122973149255,-74.0121181561438,-74.0121172676508,-74.0121035918566,-74.0120436917983,-74.0118492003855,-74.0118488930743,-74.0118118564724,-74.0117988123054,-74.0117837450172,-74.0117509703223,-74.0117503308665,-74.0117503425204,-74.0117574905125,-74.011834467264,-74.0118383347108,-74.0118390082567,-74.0118646870669,-74.0119030972256,-74.0119111886801,-74.0119689325871,-74.0121363077087,-74.0121373251626,-74.0121429331618,-74.0121488598439,-74.0122011411637,-74.0123243068946,-74.0123595184464,-74.0123900102967,-74.0124085861358,-74.0124292705936,-74.0124614016514,-74.0125398248163,-74.0125589901549,-74.0128282602698,-74.013223380517,-74.013241954393,-74.0132478456347,-74.013285157929,-74.0133031402166,-74.0133112315667,-74.0133180447417,-74.0133236765739,-74.0133260654666,-74.0133281831765,-74.0133306424727,-74.0133326414961,-74.0133350530328,-74.0133353949411,-74.0133351582511,-74.01333432977,-74.0133329328366,-74.013325465205,-74.01331621036,-74.0132748195948,-74.0132662046015,-74.0132647611729,-74.0132552869935,-74.0131865653706,-74.0129122875168,-74.0129280039382,-74.0128598710889,-74.0128968843035,-74.0128951835567,-74.0128751983543,-74.0128654726673,-74.0128159518588,-74.0127543683678,-74.0126507176099,-74.012625116948,-74.0126085685939,-74.01258434696,-74.0125843493594,-74.0125450515152,-74.0125548821136,-74.0125322859477,-74.0125195075271,-74.0120341761658,-74.0120174665936,-74.0125975315257,-74.0125278320997,-74.0121835507106,-74.0121868207526,-74.0118257535497,-74.0118284795756,-74.0121950009008,-74.0121955295861,-74.0122101741068,-74.0120841439639,-74.0120823242436,-74.0120532549877,-74.0119987596657,-74.0119878628144,-74.0119715131882,-74.0119860327698,-74.0119932916737,-74.0119805676125,-74.0120495985062,-74.0120568542849,-74.0120986343193,-74.0121077136943,-74.0121276971237,-74.0121422160092,-74.012231311469,-74.0123068830449,-74.0127032092405,-74.0127545120307,-74.0131692640275,-74.0132648670562,-74.0133301997795,-74.0134185895131,-74.0134724391663,-74.0148809797502,-74.0160473053953,-74.016097892284,-74.0165192757865,-74.0169814686412,-74.0170498660922,-74.0167158267198,-74.0166466408476,-74.0151516167432,-74.015148311897,-74.0151471464411,-74.0151439102199,-74.0166197123322,-74.0166735152999,-74.0172729123865,-74.017530324341,-74.0176225750659,-74.0173613207693,-74.0167811395715,-74.0167734646322,-74.0171209910106,-74.0201565665238,-74.0205436729308,-74.0202068671052,-74.0201627894175,-74.0194595738943,-74.0193984239193,-74.020952550103,-74.021008778993,-74.0202889999226,-74.0202781984649,-74.0206126723581,-74.0210622632964,-74.021839095257,-74.0222407889852,-74.0221823698076,-74.0221886915917,-74.0221185438341,-74.022136931921,-74.0222076545161,-74.0222547765965,-74.0221840541003,-74.0221984190984,-74.0222708648953,-74.0222794849969,-74.0222973095268,-74.0223271913025,-74.0223381152258,-74.0223082337383,-74.0223355290356,-74.0223973258052,-74.0225935958104,-74.0221325018687,-74.0230557474959,-74.0231946283466,-74.0223682355767,-74.0227589902996,-74.0230170445637,-74.0231350971031,-74.0232567831563,-74.0233977685457,-74.0234147937386,-74.0235416037012,-74.0237826733675,-74.0239473535509,-74.0242153726968,-74.0244317302371,-74.0246480924123,-74.0248418563728,-74.0249930605751,-74.025216469359,-74.0254683676858,-74.0256718375821,-74.0258850182353,-74.0260465318478,-74.0261257819296,-74.0262323829033,-74.0263340424241,-74.0264406662461,-74.026518229121,-74.0265764094311,-74.0266087555928,-74.0266281908387,-74.0266217834019,-74.026608909598,-74.0265702154533,-74.0264960014405,-74.026425772432,-74.0263762161382,-74.0263127037026,-74.0262202538429,-74.0261748809759,-74.0260658498755,-74.0257838705966,-74.0255797186632,-74.02538699247,-74.0251879424652,-74.0251542677043,-74.0249845267697,-74.0249599648895,-74.0247490351457,-74.0245639021156,-74.0244568522129,-74.0243392280889,-74.0243230857736,-74.0241951143645,-74.0241199762105,-74.0239719227775,-74.023969248803,-74.023811441694,-74.0236743648252,-74.0235364445218,-74.0233903409694,-74.0231339475036,-74.0226846593961,-74.0225653790493,-74.0224397395196,-74.0222511405758,-74.0218994219376,-74.0214963976845,-74.0214763606046,-74.0212129206163,-74.0209799620246,-74.0207196970176,-74.0207161915116,-74.020463884629,-74.0202052743428,-74.0198562397694,-74.0197970661688,-74.0197942453812,-74.0197676419043,-74.0197330819635,-74.0196927182827,-74.0196473380963,-74.0195978264823,-74.0195451490996,-74.0195262578606,-74.0194356527756,-74.0193436678775,-74.0192511249204,-74.0191588506442,-74.0190123842788,-74.0188658064592,-74.0188507475579,-74.0187971061621,-74.0181916221425,-74.0179603944227,-74.0173589862861,-74.0167475609607],"lat":[40.6933433682176,40.6930664973092,40.6932248534172,40.6932386731731,40.6932981346656,40.6932566803355,40.693198603543,40.693206891184,40.6930470428916,40.6930368142319,40.693177431516,40.6931972880948,40.6932437958344,40.6931997464005,40.6931410219309,40.6931065176805,40.6931382997609,40.6930155153942,40.6928229058415,40.6921384700918,40.6921318530237,40.6921261016862,40.6921213700671,40.6921177848518,40.6921154420315,40.6921144043335,40.6921146995412,40.6921163197508,40.692303580463,40.6923390324147,40.6924935274802,40.6925053579968,40.6925165481091,40.6925337719919,40.6925483824289,40.6925599819074,40.6925682548351,40.6926063657175,40.6926065546145,40.6926094649994,40.6926018166216,40.6925181977505,40.6925178732815,40.6924793350644,40.692444594737,40.6924047664728,40.692318113593,40.6923164119148,40.6923163487558,40.6922637395616,40.6921590560232,40.692153797275,40.6921528776478,40.692117962626,40.6920905835079,40.6920888440713,40.6920764745573,40.6920406438556,40.6920404180889,40.6920392196763,40.6920379493605,40.6920449050961,40.6920911875024,40.6921077702802,40.6921230850378,40.6921342405295,40.6921542388924,40.6922126249185,40.6921969738632,40.6921931538237,40.6921394359442,40.6920591906568,40.6920554161389,40.6920542176399,40.6920473690061,40.6920426486868,40.6920394962255,40.6920359024768,40.6920318225324,40.6920295792313,40.692027201437,40.692023725796,40.6920199701024,40.6920120995526,40.6920082090239,40.6920044629708,40.6920009245528,40.6919976369891,40.6919852024616,40.6919724974161,40.6919353467952,40.6919271804921,40.6919258027455,40.6919168169964,40.6919579289153,40.6916907308338,40.6916761044282,40.691602990363,40.6915768955003,40.691575283407,40.6915563302518,40.6915471012485,40.6915001267235,40.691476467636,40.6913994591805,40.6914087371478,40.6913641041272,40.6913706497296,40.6913833623806,40.6913915932729,40.6914230017505,40.6914289866178,40.6913968314542,40.6915030766857,40.6914582075514,40.6913343355445,40.691146337338,40.6911362159407,40.6910780242707,40.6910648162162,40.6910113577644,40.6910288475688,40.6910205736679,40.6907916968013,40.6907806223006,40.6907598819245,40.6907391439031,40.6907502116022,40.6907723360765,40.6907709555095,40.6906976681143,40.6906506537971,40.6906064072718,40.6906105485467,40.6905538544896,40.6905469365822,40.6905289595975,40.6905289574933,40.6904542878072,40.6904613307751,40.6892801829376,40.688790539817,40.6887205562379,40.6881547707006,40.6881224300967,40.688093166048,40.6880521978153,40.6880120579662,40.6872545709912,40.6873380068003,40.6873145922882,40.6871195511475,40.6869073844815,40.6868759874165,40.6864455937096,40.6864163472334,40.6865248020418,40.6864871672498,40.6864738915166,40.686437034043,40.686319804841,40.6863051685535,40.6856906976812,40.6853629879325,40.6854097837207,40.685746272027,40.6863490379192,40.6863987749472,40.686843337134,40.6854497872951,40.685272067926,40.6848338325745,40.6848330174109,40.6851549579224,40.6850874040472,40.6843844316472,40.6844535390844,40.684784447916,40.6848091351745,40.6852403901981,40.6850410247005,40.6846965405469,40.6845184075993,40.6844481899764,40.6844451266885,40.6843519508015,40.6843440719616,40.6844372477266,40.6844188635282,40.6843261247038,40.6843182466297,40.6844087975366,40.6844061707108,40.6844293550852,40.6844179738336,40.6844302216649,40.6844437904943,40.6844763936042,40.6844489893264,40.68435969595,40.6837676718827,40.6829169454452,40.6830004980622,40.683779916794,40.6842844483323,40.6841670442691,40.6841241561502,40.6840854143208,40.6840409698217,40.6840356031305,40.6840029835926,40.6839689158691,40.6839492159867,40.6839442434644,40.6839540305945,40.6839785666131,40.6840129411425,40.6840521120331,40.6840939808714,40.6841529225783,40.6842364562051,40.6843765268401,40.684514151155,40.6845935114398,40.6847002610538,40.6848016977242,40.68495162452,40.6851089331485,40.6852416635407,40.6853768580099,40.6855268047497,40.6856546341114,40.6857627980695,40.6859053846814,40.6860553525164,40.6861753398296,40.6862313188001,40.6862951162681,40.686384567591,40.6864290722291,40.6865305662279,40.6867947064173,40.6869974566,40.6871669042823,40.6873562274818,40.6873874944769,40.687545099961,40.6875682036495,40.6877870294122,40.6879646584538,40.688060559422,40.6881658095555,40.688180257022,40.68829476559,40.6883682435102,40.6885130254044,40.688515550098,40.6886645163053,40.6887923092574,40.688915770961,40.6890492476134,40.6892954542647,40.6897174708539,40.6898257584261,40.6899398194394,40.6901222185782,40.6904434723606,40.6908270503348,40.6908466226212,40.6911039656509,40.6913243908622,40.6915809849955,40.6915842321406,40.6918179911041,40.6920339238542,40.6929062333015,40.6930415627445,40.6930459455788,40.6930805572903,40.6931141074869,40.6931436657949,40.6931686557175,40.6931885898582,40.6932030794264,40.6932067903494,40.6932211771182,40.693228988633,40.6932301551088,40.693224666125,40.6932198290028,40.6932177137343,40.6932176503636,40.6932176591375,40.6932548004308,40.6932689832641,40.6933058702595,40.6933433682176]}],[{"lng":[-74.0403713480116,-74.0402998307913,-74.0402213162827,-74.0401217686172,-74.040062869259,-74.0400039635295,-74.0399352369473,-74.0398763281201,-74.0398244276532,-74.0397739487065,-74.0397038392806,-74.0396533436312,-74.0396210756969,-74.0395467484794,-74.0394878362359,-74.0394303306438,-74.0393672215053,-74.0393181348399,-74.039250820562,-74.039166684644,-74.0390965753385,-74.0390320779959,-74.0389717871358,-74.0389142920967,-74.0388539769994,-74.0388062726642,-74.0387627688549,-74.0387431075228,-74.0387416712619,-74.0387135933486,-74.0386827215315,-74.0386238167206,-74.0385312542336,-74.0384933607574,-74.0384807229866,-74.0384666680838,-74.0384526169438,-74.0384525837081,-74.0384441333066,-74.0384469222078,-74.0384398936978,-74.0384062192017,-74.0383879728089,-74.0383641141923,-74.038362694246,-74.0383879138229,-74.0384173590704,-74.0384496071002,-74.0384748494118,-74.0385071044475,-74.0385435696128,-74.0385884333871,-74.0386248658599,-74.0386921534173,-74.0388029062662,-74.0388772083666,-74.0389627293633,-74.0390482490852,-74.0391548059866,-74.0392164998595,-74.0392613798839,-74.0393216911619,-74.0393764021459,-74.039422688826,-74.0394759921562,-74.0395110546549,-74.0395671389096,-74.0396330286387,-74.0396708702862,-74.0397269284693,-74.0399327213296,-74.0402555508328,-74.0401000994505,-74.0400136805696,-74.039974796096,-74.0399315872412,-74.0398797486622,-74.0398279174942,-74.0397933763783,-74.0397933940411,-74.0398150202987,-74.0398539185806,-74.039914422906,-74.0399662859447,-74.0400138266,-74.0400570316896,-74.0400959182989,-74.0401564129788,-74.0401953154804,-74.0401996537943,-74.0401996656897,-74.0402515321239,-74.0402990710751,-74.0403336419898,-74.0403682109316,-74.0404114175359,-74.0404330343545,-74.0404452362883,-74.0404662947079,-74.0404747344223,-74.0404817587988,-74.0404873855592,-74.0405014203071,-74.0405308833366,-74.0405715619176,-74.0405968133284,-74.0406066462156,-74.0406263033208,-74.0406277301934,-74.040631960743,-74.0406516146495,-74.0406698664149,-74.0406951388009,-74.0407147999637,-74.0407344618005,-74.0407429056793,-74.0407471363103,-74.0407331372184,-74.0407037012129,-74.0406546278607,-74.0405985391033,-74.0405368332498,-74.0404849441414,-74.0404386598317,-74.0403713480116],"lat":[40.7001226430609,40.7001066612296,40.7001130910828,40.700116327273,40.7000982071006,40.700069415749,40.7000299567913,40.6999968972833,40.6999584994095,40.6999531816239,40.6999457356221,40.6999126737672,40.6998806709227,40.6998540196115,40.699813489697,40.699780428976,40.6997559080023,40.6997335148266,40.6997111290202,40.6996940841406,40.6996866382713,40.6996855925107,40.6996845462949,40.6996685588533,40.6996258952931,40.6995693550195,40.6995032098104,40.6994477265405,40.6993890361902,40.6993271545301,40.6992823466737,40.6992524869615,40.6992109006934,40.6991468872962,40.6991138115862,40.6990551254481,40.699001775218,40.6989441515408,40.6988790616386,40.6988523826575,40.6988203717141,40.6987787663307,40.6987446253315,40.6987040831398,40.6986731374703,40.6986421834211,40.6986443073914,40.6986453637717,40.6986538921918,40.6986666873581,40.6986858824907,40.6986815993651,40.6986431707922,40.6986228737041,40.6986036285771,40.6985897309034,40.6985800979796,40.698568330695,40.6985672273452,40.6985714756061,40.6985938690905,40.6986311977049,40.6986823996306,40.6987133299286,40.6987538611356,40.6987719892939,40.6987741043246,40.6987602102276,40.6987356529355,40.6986929496575,40.6985444222911,40.6988048233073,40.6989232434725,40.6988936821999,40.6988871204335,40.6988739830332,40.698877289232,40.6988937466318,40.6989266381538,40.6989562299992,40.6989989657656,40.6990285436516,40.6990679775371,40.6991041268364,40.699136989892,40.6991435501415,40.6991534007748,40.6991763950843,40.699212548801,40.6992421386337,40.6992618663064,40.6993045919258,40.6993341666382,40.6993505934773,40.6993637337567,40.6993735820978,40.6993998776279,40.6994247322101,40.6994695423739,40.6995132909958,40.6995367651268,40.6995677092874,40.699590113132,40.6996210483974,40.6996509130562,40.6996733129345,40.6997021218103,40.6997480002565,40.6997885498947,40.6998280307243,40.6998685739258,40.6999091169492,40.6999656645496,40.7000168787209,40.7000702273531,40.7001203778372,40.700160926312,40.7001972121424,40.7002100280044,40.7002111124971,40.7002047304085,40.7001834100228,40.7001642197786,40.7001407596175,40.7001226430609]}],[{"lng":[-74.0111435335985,-74.0110245795111,-74.0109227725817,-74.0108123826073,-74.010053385917,-74.0097315228011,-74.0093176044508,-74.0086438056641,-74.0085709097978,-74.0083021626477,-74.0080783528947,-74.0079120604296,-74.0076290415272,-74.006298417107,-74.0059128987708,-74.0053098612998,-74.0052271617457,-74.0046351624464,-74.0039292829342,-74.003511864393,-74.0032595504915,-74.0026000190985,-74.0018840630948,-74.0014005568262,-74.0012727334021,-74.0005319552123,-73.9999562086466,-73.9993124170014,-73.9994483818033,-73.9999309777797,-74.0001382090783,-74.0005783921612,-74.0007895518617,-74.0005273494269,-74.0004546306596,-74.0004590571478,-74.0002562874538,-74.0008516037919,-74.0008911124527,-74.0008906642112,-74.0008727630724,-74.0008678146431,-74.0008396236891,-74.0007880129429,-74.0007140956851,-74.0006202506202,-74.0005098609723,-74.0006636699085,-74.0007528938798,-74.0009063363727,-74.0010032544294,-74.0011364675746,-74.0012347662873,-74.0012825853251,-74.0014193471629,-74.0014714023208,-74.0013443991373,-74.0005500495307,-74.0002656668273,-74.000191031389,-74.0001235912308,-74.0000076558933,-73.9999293642363,-73.9998119392456,-73.9995627336694,-73.9994428144047,-73.9993995507368,-73.9993619558227,-73.9992873111686,-73.999194511749,-73.9992594547077,-73.9993263267543,-73.9993822517736,-73.9994212913861,-73.9994603307519,-73.9995232494107,-73.9995121136475,-73.9994906247462,-73.9995383965945,-73.999551213255,-73.9995714951379,-73.9996094803925,-73.9998829708522,-73.9999485594979,-73.9999450565511,-73.9999485595232,-73.9999567126231,-73.999972226488,-73.9999964501603,-74.0001386885914,-74.0002338052576,-74.0004002783203,-74.0005524793206,-74.000771752191,-74.0008497336769,-74.0008825909762,-74.0011868526283,-74.001131305772,-74.0012236753882,-74.0012321369197,-74.0012270129996,-74.0011603902258,-74.0011752161098,-74.0011691334154,-74.0011764356769,-74.0011760207968,-74.0009827669173,-74.0014053302406,-74.0014066669195,-74.0014058149584,-74.0005924020935,-74.000845235038,-74.0014543741885,-74.0020551772798,-74.0020614256381,-74.0020628208456,-74.0021227868642,-74.0021581834855,-74.0025696505947,-74.0026851276879,-74.0023628531175,-74.0024157347692,-74.0023838545834,-74.0019707039795,-74.001970148378,-74.0020320137903,-74.002171849419,-74.0021856233157,-74.0023334462116,-74.0023339307576,-74.0024205931867,-74.0024307107586,-74.0024883982926,-74.0024879014864,-74.0023983274895,-74.0023867074068,-74.0033230727079,-74.0035826233776,-74.0036318716933,-74.0036444618386,-74.0038332753226,-74.0036621783769,-74.0035839095211,-74.0035525995076,-74.0036308690132,-74.0026289640783,-74.002866897815,-74.0040566643926,-74.004340507828,-74.0045862295246,-74.0048406282478,-74.0049203782648,-74.0051880506733,-74.005211609004,-74.0052603582918,-74.0053502722476,-74.0056633064066,-74.0058912988893,-74.006020486211,-74.0061410675355,-74.0063421556028,-74.0064325927195,-74.0065959191387,-74.006320807539,-74.0063148451942,-74.0063003077744,-74.0059114573594,-74.0058994174579,-74.0058874726644,-74.0055584330446,-74.0054838408244,-74.0055268261524,-74.0055053127207,-74.0054713086128,-74.0054359976336,-74.0054272882625,-74.0053041259608,-74.005494278051,-74.0055016606746,-74.0056136179763,-74.0056016319641,-74.0056090526452,-74.0055947948584,-74.0055993510048,-74.0055902297777,-74.0055919461143,-74.005585095478,-74.005589095949,-74.0055354613818,-74.0055577199882,-74.0056752224985,-74.005984303395,-74.0060897609384,-74.0062387050853,-74.0063637273041,-74.0064602883175,-74.0064942519111,-74.0065488081265,-74.0065572087851,-74.0067554158403,-74.0067850219105,-74.0069946600246,-74.0072204666368,-74.0075190528379,-74.0075271497926,-74.0076049817952,-74.007645551613,-74.0076979869418,-74.0079559488799,-74.0083614839123,-74.0091103736175,-74.0091420219538,-74.0092907260061,-74.0086996431357,-74.0077554915064,-74.0075913620422,-74.0085361151077,-74.008349275591,-74.0086203616387,-74.0095848301761,-74.011056038415,-74.0111808830354,-74.0111077537304,-74.0112898390553,-74.0112097577877,-74.0111286853961,-74.0110783797455,-74.0110670856896,-74.0111088635154,-74.0110938631078,-74.0110933738937,-74.0110787243713,-74.0110558431283,-74.0110594329577,-74.0110374892875,-74.0110153838857,-74.0110294584325,-74.0110199968731,-74.0110066808234,-74.0109927275579,-74.0110085466105,-74.0110036190302,-74.0109913441062,-74.0109699717893,-74.0109884177341,-74.0109582729442,-74.0109361768365,-74.0109248271703,-74.0109255733494,-74.0109471284869,-74.0109191808652,-74.0109049693404,-74.0108846266534,-74.0109036642329,-74.0107853798049,-74.0107995931101,-74.0108153066737,-74.0108515738467,-74.0109309320508,-74.0110036442997,-74.0110437724954,-74.0110742747597,-74.0111043640435,-74.0111336222292,-74.0111503355684,-74.0113583629135,-74.0113031892116,-74.0112981643225,-74.0113098641095,-74.0113340941042,-74.0113608226743,-74.0113817187564,-74.0113950812339,-74.0114326991225,-74.011469474374,-74.0115029114371,-74.0117292681748,-74.0117000924834,-74.0116827539771,-74.0116653983307,-74.0116314961404,-74.0116101983588,-74.0116141358711,-74.0116314791865,-74.011677980343,-74.0117032101199,-74.0117260583568,-74.0117512926493,-74.0117773082774,-74.0118261923343,-74.0118340760152,-74.0118482702612,-74.0118537854959,-74.0119915978112,-74.0120866821469,-74.0120850937795,-74.0120693217167,-74.0120385679701,-74.0119767064249,-74.0119048809849,-74.0118567255699,-74.0119309631658,-74.0119619611692,-74.0120402793021,-74.0120884209169,-74.0121275950614,-74.0121577915852,-74.01217247961,-74.0122369454994,-74.012254902849,-74.0123185597424,-74.0123622244026,-74.0123916003228,-74.0125939232751,-74.0125906468422,-74.0125547187094,-74.0125289995523,-74.0125159356419,-74.0125151128012,-74.0125420278017,-74.0126138208737,-74.0126480885809,-74.0126807272845,-74.0127349915856,-74.0127961913925,-74.0128345493341,-74.0128663775656,-74.0128818840338,-74.0129047424937,-74.0129088179396,-74.0130020533556,-74.0131074784737,-74.0131115538951,-74.0131115319146,-74.0130939583163,-74.0130784348595,-74.0130249570557,-74.0130118926586,-74.0130208570277,-74.0130437009244,-74.013113038263,-74.0131407896509,-74.0131538489773,-74.013166916268,-74.0131775356333,-74.0131857168463,-74.0132008419732,-74.013207367872,-74.013222880169,-74.0132734948309,-74.0134856083274,-74.013480684937,-74.0134831153611,-74.0135034966087,-74.013532850181,-74.013586693151,-74.0136102983072,-74.0136747931479,-74.013662749699,-74.013642651867,-74.0136118226915,-74.0135704900994,-74.0135613093191,-74.0135331020564,-74.0135304779647,-74.0135613123654,-74.0135603414428,-74.0135295088917,-74.0135314747603,-74.0135629711161,-74.0135597054893,-74.0135236175674,-74.013522959189,-74.0135807001883,-74.0135854179851,-74.0135528322951,-74.0135771282257,-74.0135103959265,-74.0135582695949,-74.0139515275651,-74.0140919838548,-74.0141049030009,-74.0140914494948,-74.0141282119082,-74.014137263886,-74.0141486063779,-74.0141746727945,-74.0142206319549,-74.014309813113,-74.0143098158616,-74.0141778793178,-74.0141649576329,-74.0141523878731,-74.0142892074113,-74.0143015702324,-74.0142965168929,-74.0143153026476,-74.0143179646809,-74.0143678358322,-74.0144481315072,-74.0145599997369,-74.0145751333203,-74.0145842544043,-74.0145823440944,-74.0146329433346,-74.0146711999201,-74.014667172137,-74.0146538612469,-74.0146086300375,-74.0146082544851,-74.01455219326,-74.0144934254997,-74.0144924689342,-74.0144849212638,-74.0144785793136,-74.0144094739467,-74.0143968998894,-74.0143948069374,-74.0143238436303,-74.0146432323491,-74.0147242483441,-74.0147714243914,-74.0148123651405,-74.0148592665941,-74.0149303261123,-74.0149988305358,-74.015068182693,-74.0150983227013,-74.0150357973508,-74.0150227106005,-74.0150085051726,-74.0149931457591,-74.014967570717,-74.0149749555559,-74.0149488118272,-74.0149425550582,-74.0149232228936,-74.0149175465081,-74.0149237946395,-74.0149368794706,-74.0149419915596,-74.0148859896548,-74.0148200428468,-74.014726817822,-74.0147026503388,-74.0146736562849,-74.0148107256014,-74.0148283422528,-74.0150211366168,-74.015142318121,-74.0156777818474,-74.0157935171115,-74.0159103423342,-74.0161160906048,-74.01613890636,-74.0162444906066,-74.0163920537019,-74.0165151526078,-74.0165325870375,-74.0168185959992,-74.0168965704124,-74.0170039678951,-74.0171370588938,-74.0171450806266,-74.0172518213395,-74.0172457159113,-74.017253284,-74.0172934622105,-74.0173183776341,-74.0173983933228,-74.0174400354604,-74.0174938116276,-74.0175403829795,-74.017575485615,-74.0175964796705,-74.0176168121712,-74.0176260190494,-74.0176479750686,-74.0176604507462,-74.0176688130727,-74.0177712802033,-74.017767301143,-74.0178783934064,-74.0178846288097,-74.0178908849536,-74.017776393884,-74.017771283998,-74.0176713202027,-74.0176831056811,-74.0176726458143,-74.0176768962942,-74.0176742874819,-74.0176657844225,-74.0176579248343,-74.0176430653269,-74.017653788982,-74.0176546198974,-74.017643902936,-74.0176339989055,-74.0176265796304,-74.0175703564002,-74.0177945452029,-74.0178558568293,-74.0177505498687,-74.0177913930344,-74.0178175869795,-74.0178378282597,-74.0178082174696,-74.0179122932622,-74.0179426936393,-74.0179547398264,-74.0178444110672,-74.0184474268677,-74.018667846767,-74.0186556057802,-74.0175164637147,-74.017480904833,-74.0175317040947,-74.0175479625262,-74.0175581267376,-74.0175703146188,-74.0175736990254,-74.017566930139,-74.0175980853969,-74.0176343306109,-74.0176757094025,-74.0176867022586,-74.017718379389,-74.0177332539423,-74.017749416039,-74.0177655688175,-74.0177668704934,-74.0177836734917,-74.0177978958546,-74.0178063090113,-74.0178289331509,-74.0178399261186,-74.0179019884637,-74.0179103910473,-74.017941428159,-74.0179440193729,-74.017969224205,-74.0179789273837,-74.0179892694116,-74.017998321529,-74.0180080233745,-74.0180241870724,-74.0180429299157,-74.0180539241076,-74.0180650937425,-74.0181130290589,-74.0188628904543,-74.01888747948,-74.0189257238241,-74.0193415570455,-74.0193425462447,-74.0192224228399,-74.0191227596341,-74.0191025548842,-74.0190915508471,-74.0190661714014,-74.019033380197,-74.0189535946337,-74.0189457916734,-74.0189374055716,-74.0189266044381,-74.0189092157067,-74.0188846202889,-74.0188594300692,-74.0188294377503,-74.0187964493679,-74.0187610576787,-74.0187262698743,-74.0186896687048,-74.0186554807563,-74.0186305837271,-74.0185807840372,-74.0185471847534,-74.0185711739944,-74.0186071760113,-74.018634170231,-74.0186443710117,-74.0186479626221,-74.0186869537992,-74.0187211524911,-74.0187505462297,-74.0187619403742,-74.0187499332399,-74.0187739308764,-74.0187943275789,-74.0188201191435,-74.0188387043294,-74.0188482972443,-74.0188488981451,-74.0188111003502,-74.0187985148563,-74.0187757159848,-74.0187421241638,-74.018722929817,-74.0186947319077,-74.018678533722,-74.0186479447412,-74.0186281448806,-74.0186125449897,-74.0186047441127,-74.0186029418132,-74.0185915305335,-74.0185795285099,-74.0185717260917,-74.0185693319175,-74.0185645235698,-74.0185489275958,-74.0185351326967,-74.0185303375208,-74.0184064908863,-74.0182172638975,-74.0182169938448,-74.0181902925965,-74.0186555704965,-74.0186468907908,-74.0188006306843,-74.0188319588391,-74.0188339595149,-74.0188534776038,-74.0188550091197,-74.0187468983046,-74.0186314246896,-74.0184688213453,-74.0183413660979,-74.0182640918068,-74.0181448036177,-74.0181105778918,-74.0180460968757,-74.0179785323149,-74.0179222425703,-74.0178733342264,-74.017770142545,-74.017752927059,-74.017731838367,-74.0177202156355,-74.0177214894612,-74.0178003788839,-74.0166242442529,-74.0165446381253,-74.0165922758278,-74.0166181765532,-74.016618400783,-74.016591495205,-74.0165554889346,-74.0165411217173,-74.0164772420414,-74.0163916948582,-74.0163200662758,-74.0165411468663,-74.0169106869547,-74.0175444333466,-74.0175681104147,-74.0175788932214,-74.0176481071909,-74.0176550944719,-74.0176704166405,-74.0176727084408,-74.0176756542503,-74.0176791761199,-74.0176831808571,-74.0176875624925,-74.0176922050834,-74.0176969857822,-74.0177017780866,-74.0177061082747,-74.0177102420671,-74.0177140859701,-74.0177175530466,-74.0177205648821,-74.0177230533581,-74.017724962193,-74.0177068725834,-74.0176183331001,-74.0175372179073,-74.0174087136049,-74.0173828138784,-74.0173822318786,-74.0173257095844,-74.0172642150952,-74.0171212229362,-74.0169827429463,-74.0168629737727,-74.0167101860582,-74.0166941909594,-74.0166594696961,-74.0166299633819,-74.0159469520427,-74.0159438298421,-74.0156688366686,-74.0156706206075,-74.0155508775451,-74.0150006068241,-74.0149961973162,-74.0149898133956,-74.0149833323072,-74.01497036258,-74.0149451554934,-74.0147027002181,-74.0132132271919,-74.0130680549232,-74.0130723776922,-74.0130306812644,-74.0130117279954,-74.0129552430876,-74.012957495678,-74.0129089276402,-74.0134550563318,-74.0134137651287,-74.0139945221956,-74.0139999996444,-74.0142646199906,-74.0142669667171,-74.015573640966,-74.0155736434712,-74.0157137847,-74.0157130096578,-74.0163784829148,-74.0163057334284,-74.0144972031296,-74.0135191913237,-74.0129998067908,-74.0128973027087,-74.0156947197329,-74.0156224578195,-74.0131606667329,-74.01311663312,-74.0132538007587,-74.0132619393908,-74.013635236405,-74.01361558335,-74.0135612803112,-74.0135610909336,-74.0132556511851,-74.0132579965484,-74.0131123731524,-74.0131037691494,-74.0125387580726,-74.0124917103153,-74.0123707171539,-74.0122308084015,-74.0120946382959,-74.0119643204912,-74.0118133958526,-74.0116541510403,-74.0116532656994,-74.0119583307484,-74.0123158841747,-74.0141159544427,-74.0147782154846,-74.0151632411842,-74.0152042653114,-74.01518864982,-74.015170840198,-74.0117574747775,-74.0115819399768,-74.0114712324908,-74.0112946411488,-74.0111435335985],"lat":[40.7258144754712,40.7257938617085,40.7257941513483,40.7257898025558,40.7252444513723,40.7249903710288,40.724701551389,40.7242213174553,40.7241693552824,40.723977808516,40.7238268627638,40.7236997672675,40.7234977035754,40.7225495031654,40.7222529491649,40.7218241918131,40.7217441025603,40.7213536332407,40.7208544345578,40.7205563523918,40.7203770957584,40.7199034258279,40.7193975702879,40.7190526207015,40.718961426446,40.7184302390141,40.7180170950872,40.7175502417774,40.7173297970984,40.7165439142706,40.7161997305624,40.7155709024217,40.7152909684015,40.7151700588628,40.7143650475989,40.7141114129813,40.713683831927,40.7130567180603,40.7130150995419,40.7129829725656,40.7116969678131,40.7115681588622,40.7114386568541,40.7113121083329,40.711192133519,40.7110819840558,40.7109842704534,40.7107878023748,40.710673832197,40.7104778313564,40.7103540297637,40.7101759642254,40.7100553330356,40.7099940534729,40.7098147957719,40.7097465543233,40.709646292959,40.7090179172995,40.7087929499197,40.7087339123622,40.7086845192807,40.7085996194838,40.7085368170874,40.7084426144807,40.7082364831476,40.7081365567566,40.7081003383602,40.7080722865883,40.7080166031688,40.7079473763515,40.7079140213105,40.707879676494,40.7078415493216,40.7078189370554,40.7077963264511,40.7077626286582,40.7077487066091,40.707721845225,40.7076934700257,40.7076943527765,40.7077171986885,40.7077599731763,40.7076240860353,40.707591496371,40.7075826269833,40.7075586915538,40.7075311988559,40.7075063988221,40.7074916478985,40.7074050544075,40.7073471424869,40.7072602795707,40.707184275923,40.7070801482008,40.7070431186366,40.7070252538031,40.7068598257718,40.7067990506846,40.7067452616478,40.7067403364284,40.7067348699065,40.7066637208343,40.7066487452692,40.7066394976678,40.7066350582928,40.706627574359,40.706416712993,40.7061801352079,40.7061793880207,40.7061786128832,40.705410078911,40.7052545188463,40.7048733034321,40.7054113493667,40.7054170051382,40.705416077348,40.7053790026725,40.7053571191186,40.7055235795236,40.7054492481187,40.7051589666926,40.7051293117851,40.7051012702508,40.7047378679847,40.7047311592024,40.7046929537301,40.7046065964637,40.704607018874,40.704748135307,40.7047426069016,40.7046803346038,40.7046778580044,40.7047267723513,40.7047337605891,40.7047949251409,40.7047956636745,40.7056285952201,40.7054611288312,40.7054298067518,40.7054216841363,40.7053032430264,40.7051497597392,40.705192649148,40.7051664408342,40.7051235514465,40.7042229527815,40.7040752255116,40.705147363439,40.7049627293066,40.7047994506793,40.7046397795265,40.7045910049734,40.7044205356906,40.7044055322354,40.7043744884102,40.7043100799616,40.7041042444783,40.703959853442,40.7038749001019,40.7039809734355,40.7038498226075,40.7037911899517,40.7036859019493,40.7034667610289,40.703461324597,40.7034482349883,40.7030981114305,40.703087270192,40.7030765152238,40.7027812568899,40.7027143221341,40.7026852876171,40.7026668465856,40.7026898290835,40.7026595554114,40.7026654361941,40.7025598656331,40.702431381453,40.7024308677971,40.7025302420324,40.7025380597699,40.7025528185537,40.7025680203295,40.7025801678393,40.7025858142839,40.7025988359212,40.7026040502024,40.7026127305969,40.7026455211069,40.7026643946521,40.7025840721976,40.7028600185437,40.7029511204912,40.7030797893016,40.7031877922526,40.7032712080341,40.7033005481718,40.7033676150859,40.7033631483333,40.7035414894768,40.7035681274027,40.7034411885666,40.7033019778059,40.7031218197346,40.7031149809136,40.7029931411559,40.7029281742764,40.7028492785468,40.7026925299446,40.7024445390164,40.7019838705111,40.7019728494027,40.7019300713194,40.7011398675423,40.7015480021744,40.7013280810482,40.7009196957451,40.7006693483883,40.7005521637133,40.7018373855633,40.7014541814121,40.7014513922537,40.7012757644737,40.7012499822443,40.7010445832738,40.7010648974505,40.7009571203151,40.7009149408949,40.7009014201038,40.7008664103711,40.7008512565756,40.7008519490364,40.7008115312728,40.7008026214951,40.7007571312482,40.7007411242965,40.7007311709937,40.7007123949458,40.700711387706,40.7006905930471,40.7006835572344,40.7006680667978,40.700673352282,40.7006455360896,40.7006342445026,40.7005745916001,40.7005758419471,40.7005667930364,40.7005558319939,40.7005377430358,40.7004864630919,40.700491783764,40.7004614274096,40.7004513815124,40.7002325144708,40.700207213007,40.7002004441012,40.7002385110849,40.7004151523344,40.7005811099441,40.7006828452197,40.7007483373936,40.7008106494294,40.7008678744055,40.700898400101,40.7008519586364,40.7006478440364,40.7005988845293,40.7005798011911,40.7005683536823,40.7005658109993,40.7005702571179,40.7005906076738,40.7006745411163,40.7007489282581,40.7008150589742,40.7007701180597,40.7007215386359,40.7006933450621,40.7006375605903,40.7005553917474,40.7004930064215,40.7004726184626,40.7004582182481,40.7004618152075,40.7004810023868,40.7004786044219,40.7005307875863,40.700570974375,40.7006663427821,40.7006861344762,40.700729925806,40.7007389214502,40.7007048309639,40.7006813087392,40.7006645148039,40.7005997333441,40.7005289568123,40.7003784242992,40.700226930002,40.7001071034084,40.7000512101569,40.7000375455955,40.7000480916456,40.7000865841921,40.7001430865068,40.7002113786482,40.7002331155977,40.7003212778443,40.7003647343415,40.7004882870901,40.700575829962,40.7006205280941,40.7005708334725,40.7005118505081,40.7003597306578,40.700252320357,40.7001846484802,40.7001504921108,40.7001349741483,40.7001082658111,40.700115088283,40.7001467553815,40.700218772701,40.7003000998847,40.7003528747345,40.7004075133718,40.7004416598862,40.7004969121628,40.7005236116935,40.7005160284655,40.7005074521807,40.7004720530446,40.7003602906032,40.7002236932399,40.7001032425843,40.6998828302061,40.6998182566313,40.699793419368,40.6997747847359,40.6997741653827,40.6998033379255,40.6998449404854,40.6999312443376,40.7000175479651,40.7001032303439,40.7002398279762,40.7002752165189,40.7003335860855,40.7004968702278,40.7004782229084,40.7003577710684,40.7002633881163,40.7001764595283,40.7001081614233,40.7000795908476,40.7000842980872,40.7001258214509,40.7001366565327,40.7001617828094,40.700245174148,40.7002322028714,40.7002951221583,40.7002971242458,40.7003111003465,40.7003100975851,40.7003665334373,40.7003735241241,40.7003820161837,40.7003800132065,40.7004389344275,40.7004419375783,40.700460415407,40.700456914493,40.7005019127563,40.7005033576671,40.7006436814761,40.7006503711521,40.7009398708306,40.70099098246,40.7005516178246,40.7005108283869,40.7005083362244,40.7003932820546,40.7003949552103,40.7003205717238,40.7002608912939,40.7001114913658,40.7001212960687,40.7001341015157,40.7005414735537,40.7005390520308,40.7005778662861,40.7006441447651,40.7006322117728,40.7006291865237,40.7006110379742,40.7006124973079,40.7005461226676,40.7004473724,40.7003097867797,40.7003169163312,40.7003084689551,40.7002838755286,40.7001974299099,40.7002104011971,40.7002393804048,40.7002426411752,40.7003097087484,40.7003236571139,40.7003829807516,40.7004451692506,40.7004546690029,40.700461153592,40.7004620821558,40.7005513314123,40.7005634813906,40.7005704790973,40.7006613046297,40.7008173043251,40.7007142938943,40.7006636519069,40.7006108499362,40.700555444143,40.7004792698635,40.7004061205765,40.700318257555,40.7003342655235,40.7004208310106,40.7004195360587,40.7004377099261,40.7004368473199,40.7004654148796,40.7004701777235,40.7004944136013,40.7005061032914,40.7005151914715,40.7005255757127,40.7005303387072,40.7005229793813,40.7005238433258,40.7005801144357,40.7006606197803,40.7007740158497,40.7007991160257,40.7008346090284,40.7009038314796,40.7008947428697,40.7009925040134,40.7008428923543,40.7012560210275,40.7013469058075,40.7014609484439,40.7016308016254,40.7016460171027,40.7017527214368,40.7018977010082,40.7020172986715,40.7020365396831,40.7023385750805,40.702421879457,40.7025545356276,40.7027113402677,40.7027053499762,40.7028355572638,40.7028384577392,40.7028462221601,40.7028874392095,40.7029188717716,40.7030191408049,40.7030775145419,40.7031548429576,40.7032361604299,40.7033075030561,40.7033613868065,40.7034232484654,40.7034227607245,40.7034945998795,40.7035499790976,40.7035913134677,40.7035838159297,40.7035451812609,40.7035385080372,40.7035817831893,40.7036252077717,40.703632558342,40.7035980508801,40.7036064273838,40.7037111312253,40.703711791046,40.7037705036386,40.7038343675716,40.7038992337186,40.7039326617864,40.7039889729588,40.7039983808126,40.7040096825698,40.704022245902,40.7040247517832,40.7040235013242,40.7041838809866,40.7042348975988,40.7040788471131,40.7040548828935,40.7039509125836,40.7039379224966,40.7039626661385,40.7040319644796,40.704054497151,40.7039731765763,40.7039757861112,40.704242039938,40.7041623049779,40.7044352780547,40.7044410017616,40.7045806241499,40.7046672608579,40.7046708723883,40.704663659375,40.7046657214244,40.704662623998,40.7046677836524,40.7046713858492,40.7046842721363,40.7046787078711,40.7046806793498,40.7046737911229,40.7046796984516,40.7046713328709,40.7046752679378,40.7046723154604,40.7046649301604,40.7046708375882,40.7046669021877,40.7046619854725,40.7046649299456,40.7046609955427,40.7046516481115,40.7046590330762,40.7046555835495,40.7046482084331,40.7046472181013,40.7046408245879,40.704646731822,40.7046496854182,40.7046383655994,40.7046457498439,40.7046280371103,40.7046295049346,40.7046358259916,40.7045536023338,40.7047196071708,40.7047291428043,40.7047737625703,40.7060705387066,40.7060936725271,40.7065730887261,40.7069758143375,40.7070004376415,40.7070044731845,40.7070137706215,40.7070131908761,40.7069967694655,40.7070177709414,40.7070342068967,40.7070442577859,40.7070643424513,40.7070858055368,40.7071004156837,40.7071154866401,40.7071278198476,40.7071378665251,40.7071433556864,40.707142443754,40.7071415391251,40.7071397157719,40.7071237481028,40.7071077702643,40.7070799223887,40.7070954409752,40.7071031988088,40.7071054758605,40.70708173803,40.7070840092376,40.7070817261499,40.7070798933099,40.7070757853643,40.7070497624896,40.7070442827876,40.7070324111698,40.707015972883,40.7069949696516,40.7069830904102,40.7069703123503,40.7069662117742,40.7069821883763,40.7069972586465,40.7070077633788,40.7070068575004,40.7070109676699,40.7070187330024,40.7070178195785,40.707010978465,40.7069972851459,40.7069890641773,40.7069749179782,40.7069593949184,40.706949814809,40.7069383979239,40.7069205952058,40.7069064401093,40.7069082706792,40.7069183220141,40.7069507324104,40.7072578721585,40.7077422059691,40.7077513097683,40.70782162611,40.7079239488833,40.707946813547,40.7079806216374,40.7079991667892,40.7080022191402,40.7080220122841,40.7080475344474,40.7084805802537,40.7089411000542,40.7095895710088,40.710106476441,40.7104089966268,40.710888650189,40.7110296282144,40.7113445014871,40.7117563192081,40.7120392427008,40.7123151439539,40.7128345747892,40.712848327556,40.7128493123467,40.7128447309337,40.7127841446105,40.7123451241586,40.7121573189953,40.712456037931,40.7125481710769,40.7126497635691,40.7127561500297,40.7128615632173,40.7129290955044,40.7129555648194,40.713029493074,40.7130999979507,40.7134079824783,40.7134410527424,40.7134963280103,40.7136112226643,40.7135237029755,40.713442743428,40.7132061859517,40.7131610626671,40.7130692079651,40.7130659962026,40.7130631096676,40.7130606247408,40.7130586071758,40.7130571103596,40.7130561738995,40.7130558225751,40.7130560656828,40.7130568137398,40.7130580474563,40.7130597389294,40.7130618499033,40.7130643326342,40.7130671309706,40.7130701816227,40.7131692824661,40.713654323433,40.7140975422478,40.7148067999054,40.7149414343151,40.7149444612793,40.7152549132549,40.71559268237,40.7163717930772,40.7171306436682,40.7177869542878,40.718624176058,40.7186488433544,40.7186660212247,40.7186653684503,40.7185755489063,40.7185892550442,40.7185544887632,40.7185377482337,40.7185219331838,40.718449236055,40.7184730013167,40.7185073473277,40.718523791433,40.7185358508643,40.7185435350772,40.7185161548842,40.7183157198958,40.7189221938255,40.7189386191727,40.7191314558191,40.7192189691163,40.7194894533972,40.7195001638031,40.7197348517065,40.7198017074262,40.7200194820142,40.7200856494666,40.7200671836615,40.7200951465836,40.7200868071437,40.7202432944648,40.7202540155095,40.7202706752682,40.7203034357419,40.7203766088309,40.7207270200381,40.7205137212632,40.7203951865582,40.7203330907501,40.7208680459758,40.7212064248753,40.7215434536738,40.7212539631946,40.7214737345308,40.7214899200012,40.7214718119331,40.7215165611344,40.7215861825595,40.7215806138451,40.7215718937641,40.7215438565393,40.7215277730294,40.7215099202957,40.7215545954712,40.7215031765764,40.7217797578275,40.722387580579,40.7230562570727,40.7237070524812,40.7243298642398,40.7250780063059,40.7258673740708,40.7258717618514,40.7259775992184,40.7260338432854,40.726215863303,40.7262817064734,40.7263197119368,40.7263619493796,40.7264511830076,40.7265793906577,40.7261899048353,40.7261710343295,40.7260619796901,40.725954942917,40.7258144754712]}]],[[{"lng":[-73.8283434749758,-73.8284267967819,-73.8287285688355,-73.8295940915706,-73.8305547123578,-73.8307226672039,-73.8311144922167,-73.8312833848724,-73.8319339376551,-73.8321371233042,-73.8323846854234,-73.8326890334202,-73.8327621992899,-73.8328350225652,-73.8328906609381,-73.8328926220929,-73.832893121063,-73.8330423462301,-73.8333827254562,-73.833518472216,-73.8337795278909,-73.8339302371213,-73.8345832171623,-73.8347353750812,-73.8349446256621,-73.8353621718488,-73.8355190467477,-73.8357047757733,-73.8357757691666,-73.835855970139,-73.8359908775545,-73.8361427900208,-73.8362918071927,-73.8363372576998,-73.836470550498,-73.8366380691055,-73.8367117969066,-73.8369114823119,-73.8371518944569,-73.8372258397222,-73.8375362574935,-73.8377540955476,-73.8378036833903,-73.8378427094752,-73.8379841620163,-73.8382477523711,-73.8383905629125,-73.8384942473412,-73.8388081325931,-73.8393679425065,-73.841240530037,-73.8412712784026,-73.8414166785508,-73.8414610203742,-73.8418797747322,-73.8423930900538,-73.8428366829414,-73.8432765586038,-73.8437757073376,-73.8442915296691,-73.8449103425533,-73.845541873879,-73.8462348007163,-73.8474901056339,-73.847810234636,-73.8480185603993,-73.8480634539416,-73.8485453056037,-73.8493915835714,-73.8499919434262,-73.8505227808275,-73.8508886338491,-73.8512089676086,-73.8517988662536,-73.8523115320841,-73.8533352494205,-73.853497466347,-73.8542074576561,-73.8551967533145,-73.8555357982924,-73.856184021551,-73.8571924801879,-73.8575394249403,-73.8583566909684,-73.8591959368475,-73.859724523661,-73.8601849194853,-73.8604562735985,-73.8616283336918,-73.8617616650535,-73.8634723231289,-73.8635801404726,-73.8636393815755,-73.8643692214372,-73.8644801171779,-73.8654645019086,-73.866361307901,-73.8672481888945,-73.8674020711092,-73.8678225811518,-73.8683084692482,-73.868740735508,-73.8692076681603,-73.8695586208914,-73.8700652511302,-73.8701817822227,-73.8702763856525,-73.8703478696004,-73.8712060585942,-73.8727271842559,-73.8727720465853,-73.8726780587469,-73.872527839146,-73.8723955806089,-73.8723636524935,-73.8723405632703,-73.8723174854618,-73.8721335784673,-73.8719643215682,-73.8719169151728,-73.8718461029101,-73.8717903848607,-73.8709625407474,-73.8694120846032,-73.8688924327461,-73.8695625908049,-73.8695236295179,-73.8692094456987,-73.8683745379487,-73.8682346608126,-73.8686369587995,-73.8687226323057,-73.8691666873424,-73.8693767539613,-73.8698157618704,-73.8698596035482,-73.8698893954676,-73.8699042156866,-73.8699037951237,-73.8698884222067,-73.8693912567731,-73.8692739124451,-73.8690762464051,-73.8688785903134,-73.8687675298734,-73.8684153962974,-73.8681883055873,-73.8682890763312,-73.868393769371,-73.8684993643155,-73.8686027851912,-73.8687254040077,-73.8688962278839,-73.869548681047,-73.8708488737839,-73.8708775412073,-73.8708896254351,-73.8708898383245,-73.8708901115479,-73.8709436611869,-73.8709441363487,-73.8709446220235,-73.8710017310579,-73.8710022767302,-73.8710027274176,-73.8710490592804,-73.8710494493611,-73.8710496749069,-73.8710758042858,-73.871075946214,-73.871075981354,-73.8710826251279,-73.871032688736,-73.870978451588,-73.8708840924882,-73.8705793765648,-73.8704448372036,-73.8704211215406,-73.8704053172813,-73.8703974292502,-73.8703974597621,-73.8704054090955,-73.8704212750105,-73.8704550899089,-73.8704918698942,-73.8704978339237,-73.8704995802517,-73.8705105705784,-73.8705147333307,-73.8705162978047,-73.8705262166591,-73.8705289732455,-73.8705332008308,-73.8705349472268,-73.8705373858619,-73.8699057097023,-73.8698507154024,-73.8696211371525,-73.8692775128076,-73.8691176689694,-73.8690397861754,-73.8686229317931,-73.8685450134633,-73.8683847295567,-73.8682292102352,-73.867848622814,-73.8677752593662,-73.8675284080566,-73.8672206463434,-73.8665381887574,-73.8662052329964,-73.8652648332035,-73.864326164937,-73.8633862119727,-73.862447452331,-73.8617955491394,-73.8617944766638,-73.8614338378629,-73.8604220182369,-73.8594836130853,-73.8585412426463,-73.857607877091,-73.8574501352669,-73.8566624526441,-73.856501878474,-73.8560303732627,-73.8555490916087,-73.8545435102471,-73.8536363872702,-73.8535762849665,-73.8526575185201,-73.8517098726112,-73.8510846336729,-73.8507898324263,-73.8498764519222,-73.8489375486445,-73.8485967600268,-73.8479261406924,-73.8472514483993,-73.8469927362359,-73.8464076634316,-73.8460895713345,-73.8457814738794,-73.8451725669668,-73.8448773743104,-73.8444213367985,-73.8442314689986,-73.8435858138452,-73.8431571542739,-73.842804435339,-73.842406293729,-73.841851864839,-73.8415882668867,-73.8412236259795,-73.8406436476823,-73.8397423340175,-73.8395447573561,-73.8392208540751,-73.838752234548,-73.8378438016918,-73.8369702106376,-73.8367882426342,-73.8361860131034,-73.8357843665769,-73.8315962003194,-73.8315196428682,-73.8308932966159,-73.8301201610068,-73.8297261483776,-73.8295089269199,-73.8292408964243,-73.8291192906947,-73.8284196344166,-73.8283434749758],"lat":[40.8608920266758,40.8607890375821,40.8604133281048,40.8593597642993,40.8581903960537,40.8579945871445,40.8575243296239,40.8573499624236,40.8566935170366,40.8565436911331,40.8563522109563,40.8561323835244,40.8560795397618,40.8560358452586,40.8559921708826,40.8559906251353,40.8559902301674,40.8558730803709,40.8556058608904,40.8554879389928,40.8552611656522,40.8551302438827,40.8544323368314,40.8542471796318,40.8539362903303,40.8533159222454,40.8530195775613,40.8526408613189,40.8524757490562,40.8522468310337,40.8517962820193,40.8510417585734,40.8497088799812,40.8486406080874,40.8471493727829,40.8463833341949,40.8460573696679,40.8453928184807,40.8445926998885,40.844384276379,40.8435067888786,40.8428859100594,40.8427328434843,40.8426071071379,40.842151349938,40.8413020528784,40.8406768141352,40.8406992201194,40.8407670341695,40.8408829734818,40.8406014543219,40.8406509118619,40.8408847769986,40.8409560956207,40.8415280888383,40.842269861547,40.8429055404799,40.8435418059451,40.8441186282067,40.844682548627,40.845427460749,40.8449802319183,40.8444902173025,40.8435616107094,40.8432905480027,40.8431141511437,40.8430679986521,40.8430072249536,40.8429185710571,40.8428516281634,40.8427894898016,40.8427530068867,40.8427151219017,40.8426476329337,40.842586993994,40.8424701551548,40.8424516676459,40.842370739177,40.8422579925553,40.8422194899931,40.8421459172477,40.8420276484458,40.8419893968736,40.8418992866161,40.8418040334786,40.841744019969,40.8416890901825,40.8416616659383,40.8415278596844,40.8415127206042,40.8413059327065,40.8412779566327,40.8412652747639,40.8411090181287,40.8410877973869,40.8408568919647,40.840592685023,40.8403438043703,40.8402902760565,40.8401664990161,40.8399952139561,40.8398245766416,40.8396000467111,40.8395956534619,40.8396138826638,40.8396180754978,40.8396214788075,40.8396255665228,40.8396746224424,40.8397489448,40.8397512823361,40.8401371971068,40.8407539830068,40.8413363754319,40.8414769609834,40.8415836261895,40.8416902820204,40.842497794549,40.8432382537739,40.8434537426466,40.8437607778558,40.8438028143358,40.8443336600023,40.8472454909397,40.8481123221258,40.8480187132393,40.8486869770853,40.8492383728725,40.8506733360092,40.8509137372163,40.8520663552566,40.852423852418,40.8536860460276,40.8542657231123,40.8554837748537,40.8555767281417,40.8556738616951,40.8557732926938,40.8558730216152,40.8559710676522,40.8565518951769,40.8566889825649,40.8569455606196,40.857202138337,40.8573407804222,40.857780358143,40.8580638343109,40.8580850653844,40.8580955587413,40.8580948420303,40.8580831005448,40.8579534337859,40.8577727729451,40.8577260296799,40.857290817248,40.8572782242686,40.8572729164112,40.8572728178106,40.8572727819314,40.8572660519534,40.8572659893286,40.857266080502,40.8572767427389,40.8572768426904,40.8572771127395,40.857304603361,40.8573048376597,40.8573051530233,40.85734126459,40.8573414634313,40.8573416611482,40.8573770401352,40.8578077973948,40.8581994146533,40.858895181263,40.8614045539279,40.8632704000244,40.8636185453352,40.8639669493373,40.8643155084168,40.8646641192375,40.8650126777974,40.8653610804321,40.8666328687624,40.8679508309931,40.8681766549638,40.8682427761091,40.8686588353671,40.8688164328463,40.8688756652312,40.8692511767946,40.8693555333497,40.8695155802357,40.8695817025373,40.8696740314123,40.8696756649764,40.8696758071737,40.8696763988606,40.8696772852873,40.8696782502923,40.8696787212891,40.8696812363957,40.8696817065155,40.869682673857,40.8696836112369,40.8696877431894,40.86968853965,40.8696912175001,40.8696942623212,40.8696981557872,40.8696932953425,40.869674425282,40.8696563237169,40.8696407710719,40.8696214305266,40.8696098791953,40.8696098603209,40.8696034680244,40.8695850047635,40.869567116579,40.869550945745,40.8695343812969,40.8695325205235,40.8703611857399,40.8705663647562,40.8712335201549,40.8718131675638,40.8726043527937,40.873300599209,40.8732760205502,40.8729921874044,40.8726974590117,40.8724927914307,40.8723962924543,40.8721018813922,40.8717855901893,40.8716707851355,40.8713422330779,40.8709870524543,40.8708528887558,40.8705543006853,40.8703897719082,40.8702276962491,40.8699146982046,40.869760506992,40.86952229868,40.8694203509684,40.8690876373726,40.8688632665463,40.8686807525724,40.86847474402,40.8681919253787,40.8680518806315,40.8678581508499,40.8675541750672,40.86708793062,40.8669867383835,40.8668208402431,40.8665727774641,40.8660991880232,40.8656431364009,40.8655459061294,40.8652240993816,40.8650160114971,40.8626447044244,40.8625976691933,40.862212849092,40.8620492818338,40.861952745138,40.8618412139492,40.8616318676345,40.8615099769718,40.8609319398436,40.8608920266758]}]],[[{"lng":[-73.7938552720907,-73.7941655582765,-73.7944925443829,-73.7974482563964,-73.7993752043825,-73.8022038829628,-73.8032868213697,-73.8052011360319,-73.8055057674358,-73.8057127720978,-73.8059249887761,-73.8061408738586,-73.8063588494412,-73.8065773016606,-73.8069311323245,-73.8072864712256,-73.8076413950186,-73.8079939816159,-73.8083423239038,-73.8086845936049,-73.8091506811379,-73.8097107918628,-73.8102705322771,-73.8108361190483,-73.8114064522649,-73.8119804368333,-73.8120965924556,-73.813567347395,-73.81399748366,-73.814427621261,-73.8148566585915,-73.8151831684636,-73.8152834545869,-73.8153646422706,-73.8154787310654,-73.8167077859141,-73.8174263890859,-73.8184170336926,-73.8194079982162,-73.8198327530422,-73.8202743294959,-73.8206557938698,-73.8208354407275,-73.8216266365399,-73.8219900667133,-73.8225846839013,-73.8228216133271,-73.8234347093131,-73.823642108131,-73.8240868097089,-73.8249966413486,-73.8257158614128,-73.8257851762638,-73.8258608250698,-73.8262182111356,-73.8283716047521,-73.8289598027908,-73.8297629609238,-73.8300717062759,-73.8302597400712,-73.830844032307,-73.8312072611756,-73.8313782619935,-73.8318208923044,-73.8318649853505,-73.8320336386386,-73.8322469220484,-73.8325963975418,-73.8331592126715,-73.8332172165615,-73.8334823130115,-73.8334905591873,-73.834046665239,-73.8340610756022,-73.8342502224199,-73.8343785969423,-73.834491419495,-73.8344648917651,-73.8344622011831,-73.8344425309163,-73.8344630602063,-73.8344689223801,-73.8342673880511,-73.8341538152811,-73.8339497934443,-73.8337244292412,-73.8335876489384,-73.832685248026,-73.8326474852148,-73.8326212279966,-73.8318469619019,-73.8316964882701,-73.8310035513045,-73.8308958061731,-73.8307142369562,-73.8305614598893,-73.8303040470699,-73.8294560625628,-73.8289208550472,-73.8285591024813,-73.8282565182697,-73.828157720886,-73.8281229894433,-73.8283340964283,-73.8283434749757,-73.8284196344165,-73.8291192906946,-73.8292408964243,-73.8295089269198,-73.8297261483775,-73.8301201610067,-73.8308932966158,-73.8315196428681,-73.8315962003193,-73.8357843665769,-73.8361860131034,-73.8367882426341,-73.8369702106376,-73.8378438016918,-73.8387522345479,-73.8392208540751,-73.8395447573561,-73.8397423340175,-73.8406436476823,-73.8412236259796,-73.8415882668866,-73.841851864839,-73.8424062937289,-73.842804435339,-73.8431571542738,-73.8435858138451,-73.8442314689985,-73.8444213367985,-73.8448773743104,-73.8451725669669,-73.8457814738793,-73.8460895713345,-73.8464076634316,-73.8469927362359,-73.8472514483993,-73.8479261406924,-73.8485967600268,-73.8489375486446,-73.8498764519221,-73.8507898324262,-73.8510846336728,-73.8517098726112,-73.8526575185201,-73.8535762849664,-73.8536363872701,-73.8545435102471,-73.8555490916087,-73.8560303732627,-73.8565018784739,-73.8566624526441,-73.8574501352669,-73.8576078770908,-73.8585412426464,-73.8594836130851,-73.8604220182369,-73.8614338378629,-73.8617944766638,-73.8617955491394,-73.8624474523309,-73.8633862119727,-73.864326164937,-73.8652648332034,-73.8662052329964,-73.8665381887574,-73.8672206463433,-73.8675284080565,-73.8677752593663,-73.8678486228139,-73.8682292102352,-73.8683847295566,-73.8685450134632,-73.8686229317931,-73.8690397861753,-73.8691176689694,-73.8692775128076,-73.8696211371524,-73.8698507154024,-73.8699057097023,-73.8705373858619,-73.8705619252466,-73.8714516766863,-73.8719739703499,-73.8720324185372,-73.8721053948861,-73.8727260480976,-73.8728288453104,-73.8729365034523,-73.8732577532399,-73.8738643255213,-73.875188501627,-73.8743675076245,-73.8725525090033,-73.8716071869503,-73.8709441474806,-73.8701531859726,-73.8706826459966,-73.8708356784023,-73.871871006937,-73.8719166182427,-73.8730733460092,-73.8740675120517,-73.8749458975558,-73.8747924073199,-73.8747025549028,-73.8753369943113,-73.8762589013991,-73.8771700595187,-73.8781257522779,-73.877728176615,-73.8776067654627,-73.8778312590419,-73.8778385700107,-73.8778706811214,-73.877921238972,-73.8780012488109,-73.878051282126,-73.8781545932278,-73.8781889161654,-73.8791894189226,-73.8801766806026,-73.8802693992655,-73.8803409362508,-73.8803900369338,-73.8804159341632,-73.8804183333439,-73.8803974787196,-73.880354072715,-73.8802501798871,-73.8802022690033,-73.8801779396049,-73.8801587112665,-73.8801439537609,-73.8800421305907,-73.8795724553701,-73.8771197410579,-73.8770591532808,-73.8769913683886,-73.8769164481618,-73.8768344608922,-73.8767454811955,-73.8766495902651,-73.8765468755308,-73.8764374306502,-73.8763440831592,-73.8762465989223,-73.876145037111,-73.876039459094,-73.8759299292354,-73.8758165140245,-73.8756757851076,-73.8755293241256,-73.8753772774422,-73.8752197967313,-73.8750570396693,-73.8748891689179,-73.8747066283927,-73.8745192248421,-73.8743271367094,-73.8741305471524,-73.8739296431273,-73.8737246159429,-73.8735498436779,-73.8733732478293,-73.8731948906924,-73.8730148349031,-73.8726922679371,-73.8723736614543,-73.8720592092481,-73.8717491024744,-73.871443529881,-73.8711426773445,-73.8708392961775,-73.8705411987981,-73.8702485562774,-73.8699615365774,-73.8697938766479,-73.869629791157,-73.8694693710232,-73.8693127051371,-73.8691598803034,-73.8690109812061,-73.8688280912267,-73.8686500222092,-73.868476856697,-73.8683086756136,-73.8682027030534,-73.8681511222352,-73.8680942581115,-73.8680426074236,-73.8679962677432,-73.867955325187,-73.8678979862884,-73.8665212451291,-73.8656579432583,-73.8647725828352,-73.8630508566479,-73.8627985057923,-73.8626620860068,-73.8624577262726,-73.8622443959521,-73.86202342452,-73.8617962600684,-73.8615643838505,-73.8613410083432,-73.8610932999277,-73.8608813850757,-73.8607838003149,-73.8606862277895,-73.8605035462826,-73.86027030901,-73.8601931726778,-73.8601070691112,-73.85946778767,-73.8593969864738,-73.859324184964,-73.8590769227481,-73.8592357623462,-73.8594198409143,-73.8593831534815,-73.8593769645891,-73.8592809961688,-73.859205520239,-73.8590270408598,-73.8588640131634,-73.8592890319391,-73.8593857688913,-73.8594638989188,-73.8594985109914,-73.859532014426,-73.859578830145,-73.8592643247563,-73.8591789950162,-73.8591049877186,-73.8590360482632,-73.8589614807183,-73.8587282476721,-73.8584007535218,-73.8581600000485,-73.8581646029956,-73.8579693226212,-73.8577474745885,-73.8575596765764,-73.8571109054622,-73.8571717623632,-73.8569915741298,-73.8570414411814,-73.8571015144452,-73.8571862132476,-73.8573593530021,-73.8574345761825,-73.8571776607595,-73.8570502266738,-73.8568003828243,-73.8567314667085,-73.8566543688902,-73.8563608136679,-73.8560102332302,-73.8560116083934,-73.8563554520587,-73.8564238694302,-73.8565025169435,-73.8569239818007,-73.8568101363853,-73.8565573254491,-73.8559562264415,-73.8558804426122,-73.8558046379595,-73.8555269767283,-73.8551379214933,-73.8542377668688,-73.8537410356452,-73.8538336099959,-73.8542290536686,-73.854710782734,-73.8547558188669,-73.8547937280357,-73.8549110967363,-73.85458940522,-73.8539164602896,-73.8537750782683,-73.8536006165404,-73.8533535186496,-73.8529561848767,-73.8527699151414,-73.852584747504,-73.8526603582585,-73.8524565331729,-73.8522745168273,-73.8517831695014,-73.8514924250258,-73.851447539028,-73.8510711618394,-73.8516438065431,-73.8520728793833,-73.8523474489439,-73.8530497084913,-73.8534752239983,-73.8525776725087,-73.8522805971137,-73.8514250778235,-73.8509205929659,-73.8504014886026,-73.850173175521,-73.8493364139069,-73.8486391326434,-73.8470803291424,-73.8462327036082,-73.8453806105087,-73.8448188698501,-73.8448770721415,-73.844929219197,-73.8448926497548,-73.8444131946661,-73.8433955986826,-73.8423754377947,-73.8413868930467,-73.8411315278941,-73.8410627295322,-73.8410204734272,-73.8408654618152,-73.8408408750865,-73.8408119003378,-73.8407785894581,-73.8407410020537,-73.840699205479,-73.8406532745756,-73.8400447470177,-73.8392460467563,-73.8392182946635,-73.8391972049588,-73.8391828552173,-73.8391752982126,-73.8391745617249,-73.8391806484881,-73.839193536038,-73.8392131769298,-73.8392394988701,-73.8392724049848,-73.8396643321183,-73.83964812813,-73.8389662594575,-73.8383919918973,-73.838042772197,-73.8373795618846,-73.836305418251,-73.8352579057,-73.8335684976889,-73.8326780861135,-73.8318450099647,-73.8309577397887,-73.8300796531272,-73.8289056422736,-73.8286634108476,-73.8279693354161,-73.8272242978431,-73.8252082280862,-73.8239157102835,-73.8236684812067,-73.8225237766688,-73.8224180593248,-73.8224190239942,-73.8224167408367,-73.8224060555625,-73.8224059322864,-73.822416374771,-73.8224266256654,-73.8224370673189,-73.8224673768218,-73.8224913664282,-73.822506384473,-73.8225529011104,-73.8225951241745,-73.8226055152407,-73.8226587263005,-73.8227144441239,-73.8227469282072,-73.8227497237261,-73.8228238391386,-73.8228432579017,-73.8229248353265,-73.8229530768104,-73.8230388860436,-73.8230605918842,-73.8230894059049,-73.8231346117765,-73.8231690844194,-73.8231714249178,-73.8231733717007,-73.8231963678716,-73.8232596774653,-73.8233001785961,-73.8233337280592,-73.8233554269897,-73.8233703003777,-73.8233731814146,-73.823374431024,-73.8233743068037,-73.8233818029973,-73.8233720090933,-73.8233706888178,-73.8233557978707,-73.823337994666,-73.823310704503,-73.8232974557727,-73.8232947153793,-73.8232946538122,-73.8233062618837,-73.8233069378397,-73.8233273319153,-73.8233326238687,-73.8233341336464,-73.8233701037516,-73.8234170320996,-73.8234361167169,-73.823451985957,-73.8234642832399,-73.8234727322461,-73.8234771431253,-73.8234774167623,-73.8234735470044,-73.8233700399608,-73.8228533507268,-73.8206122361334,-73.8195746411005,-73.8194872444408,-73.8194065172857,-73.8182773810029,-73.8176062684771,-73.8166140094754,-73.8160169942589,-73.8157426143845,-73.8153304756216,-73.8152419714368,-73.8151685479307,-73.8136510836387,-73.8124290405474,-73.8122814098687,-73.812281112953,-73.8112683483296,-73.8098982238487,-73.8094327324855,-73.8087210608029,-73.8075594419275,-73.8063796862917,-73.8048387076826,-73.8045261501558,-73.8042376172505,-73.8029094648742,-73.8019244994992,-73.799302062783,-73.7977278308141,-73.7973275925205,-73.7962818154783,-73.7948690105643,-73.794055173961,-73.7938552720907],"lat":[40.8836433113335,40.8829932163499,40.8830682510741,40.8838453848377,40.8843519698216,40.8851211147967,40.8854155526692,40.885999956351,40.8860929491813,40.8860393678749,40.8859967177809,40.8859654100595,40.885945659655,40.8859375249967,40.8859266089178,40.8859318138162,40.885953252398,40.8859908313415,40.8860443136392,40.8861132918981,40.8862144769812,40.8863360754263,40.8864512425234,40.8865511521454,40.8866355878137,40.886704339445,40.8867150106628,40.8867787092493,40.886782132484,40.8867719646752,40.8867482325352,40.8867196609628,40.8867110242098,40.8867012210169,40.8866874461381,40.8864809505426,40.8862943058646,40.8860369947318,40.8857795888202,40.8856692545739,40.8855507003278,40.8854504751546,40.8853992724078,40.8851910718095,40.8850934469744,40.8849337282989,40.884869952143,40.8847049139799,40.8846426685227,40.8845091937673,40.8842067212603,40.883930135035,40.8839036166287,40.883876188875,40.8837176435616,40.8827009750744,40.8823853055582,40.8819295991919,40.8817471016816,40.8816197298461,40.8812152776198,40.880930553889,40.8807976077879,40.8804198135102,40.8803794149563,40.8802258949943,40.8800163223536,40.8796601253787,40.8790318042002,40.8789664522598,40.8786278015641,40.8786128478041,40.8775791132627,40.8775334518225,40.8770231113922,40.8765812624481,40.8760664072997,40.8754714980099,40.875411132268,40.8748791439922,40.8742929038763,40.8734091394891,40.8724304768408,40.8720367426448,40.8713294335771,40.8707684549124,40.8704765616004,40.8685506930474,40.8684823183037,40.8684260369844,40.8669358338153,40.8666481952854,40.8653235771757,40.8651255536883,40.8648106024352,40.8647407429326,40.8643439533508,40.8630367900042,40.8622117418838,40.8617613254983,40.8613845716451,40.8612271091474,40.8611821133886,40.8609038698644,40.8608920266759,40.8609319398436,40.8615099769719,40.8616318676345,40.8618412139493,40.861952745138,40.8620492818338,40.862212849092,40.8625976691933,40.8626447044245,40.8650160114971,40.8652240993816,40.8655459061295,40.8656431364009,40.8660991880232,40.8665727774642,40.8668208402431,40.8669867383835,40.86708793062,40.8675541750672,40.8678581508499,40.8680518806315,40.8681919253787,40.86847474402,40.8686807525724,40.8688632665463,40.8690876373726,40.8694203509685,40.8695222986801,40.8697605069921,40.8699146982047,40.8702276962491,40.8703897719082,40.8705543006854,40.8708528887558,40.8709870524543,40.8713422330779,40.8716707851355,40.8717855901893,40.8721018813922,40.8723962924543,40.8724927914307,40.8726974590117,40.8729921874044,40.8732760205502,40.873300599209,40.8726043527938,40.8718131675638,40.8712335201549,40.8705663647563,40.8703611857399,40.8695325205235,40.8695343812969,40.869550945745,40.8695671165791,40.8695850047635,40.8696034680244,40.8696098603209,40.8696098791953,40.8696214305266,40.869640771072,40.869656323717,40.869674425282,40.8696932953426,40.8696981557872,40.8696942623212,40.8696912175001,40.86968853965,40.8696877431894,40.8696836112369,40.869682673857,40.8696817065155,40.8696812363957,40.8696787212891,40.8696782502923,40.8696772852874,40.8696763988606,40.8696758071737,40.8696756649764,40.8696740314123,40.8715107784538,40.8715091853078,40.8715082470116,40.8715081411355,40.8715091683756,40.8715213252099,40.8715233384195,40.8715254458447,40.8715319988152,40.8715478120278,40.8715757563096,40.8727010091991,40.875175183326,40.87692157251,40.878509695414,40.880350827058,40.8804587560067,40.8804541142793,40.8803281204254,40.8802381780163,40.8801343853582,40.8800389062915,40.8799476687928,40.8800751283879,40.881553823556,40.8816718323973,40.8818320397059,40.8819939128099,40.8821536849745,40.8834541950846,40.8845230436198,40.8867727601815,40.8870945211764,40.8872540583453,40.8874101571805,40.887447196229,40.8876252311799,40.8879434463563,40.8880491810487,40.8903070319999,40.8920876014835,40.8922814994133,40.8924824176093,40.8926883287953,40.892897043861,40.8931062907469,40.8933138145226,40.8935174312458,40.8942270051642,40.8945542272723,40.8947204234618,40.8949134673608,40.8950615902807,40.8952222845866,40.8952714848418,40.8954686636436,40.8956501898439,40.8958302447916,40.8960086642264,40.8961852853786,40.8963599474536,40.8965324907559,40.8967027578708,40.8968705934597,40.8969988558056,40.8971253339417,40.8972499510674,40.8973726316343,40.8974933010188,40.8976118859462,40.8977511583684,40.8978869856172,40.8980192319232,40.89814776472,40.8982724558972,40.8983931808146,40.8985149008079,40.8986322891719,40.8987452341152,40.8988536278528,40.8989573673885,40.8990563539274,40.8991313468961,40.8992038388346,40.8992738044375,40.8993412188655,40.8994600734117,40.8995849277594,40.8997157059739,40.8998523285879,40.8999947124401,40.9001427709335,40.900307410286,40.9004775162956,40.9006529914399,40.9008337349579,40.9009474799236,40.9010641874455,40.9011837928705,40.9013062297911,40.9014314305281,40.9015593257222,40.9017274346719,40.9018984975693,40.902072434259,40.9022491643954,40.9023553827737,40.9024402503484,40.9025307089621,40.9026229502025,40.9027168010062,40.902812085638,40.9029401764028,40.9025159296287,40.9022432075405,40.9020124418739,40.9015080840389,40.9015355222228,40.9014591873937,40.9013583965145,40.901267706536,40.9011877766896,40.9011191222883,40.9010621228347,40.9011115703015,40.9010320752821,40.9009640758508,40.9009330448608,40.9009020133003,40.900846092615,40.9007746959148,40.9007502577133,40.9007219820543,40.9005172092678,40.9006061094728,40.9006975273986,40.9010079930999,40.9010986126319,40.90139312451,40.9015403907192,40.901565217661,40.9015555013765,40.9015478636586,40.9014449097527,40.9017116950496,40.9018691120143,40.9019049408937,40.9019338776329,40.9021016045005,40.9022431111243,40.9024408427722,40.9026694798958,40.9026560789517,40.902644455435,40.9025834959438,40.9025178652185,40.9022889705694,40.9022132557991,40.9023057102028,40.902595860559,40.9028509076869,40.90278754692,40.9029177959587,40.9036495326968,40.9040820654355,40.9045842095667,40.9046405674271,40.9047084578832,40.9046920172057,40.9047309614909,40.9048415437005,40.9052865416615,40.9052915357558,40.9051422481779,40.9051010693704,40.9050550002806,40.9051021540583,40.9053059836261,40.9054820834407,40.9055281179251,40.9055447407948,40.9055638487958,40.9059741701111,40.906155828326,40.9062620328462,40.9062185037384,40.9062414303687,40.9062643641266,40.9063802514584,40.9068668891419,40.9070328682545,40.9077879167348,40.9079743498197,40.9080185890469,40.9080063099422,40.9080839927338,40.9081583316855,40.9083548698343,40.9089394992976,40.9094656034419,40.9095315552404,40.90960674145,40.9100431402495,40.9103530441801,40.9104060080653,40.9103106170642,40.91001519366,40.9098605095732,40.9098540996441,40.9101606306521,40.9102716404998,40.910449671202,40.9103715197194,40.909699085114,40.909197082764,40.9088628420952,40.9080359269022,40.9075302935267,40.9072001912095,40.907081266626,40.9067801749592,40.9066164944888,40.9072181705057,40.9075078656515,40.9071253147679,40.9068065221673,40.906156733033,40.9058986722635,40.9056558080872,40.9055299496747,40.9050726937815,40.9046630037689,40.9041908667972,40.9041713300481,40.9041711245578,40.9041664047764,40.904172741534,40.9035037283972,40.9032141163291,40.9028141354767,40.901862433763,40.901783334753,40.9017050957055,40.9016278566925,40.901551756033,40.901476929933,40.9014035123527,40.9005749571893,40.8995011540483,40.8994184166921,40.899334554814,40.8992498769862,40.8991646947818,40.8990793216291,40.8989940715522,40.8989092583337,40.8988251940402,40.8987421879819,40.8986605455737,40.8978855151058,40.8973305353407,40.8955932069691,40.8940670080491,40.8941423313869,40.8939247416097,40.8935991658837,40.8933916440558,40.8928064263453,40.8926018263349,40.8923542795198,40.8920301594027,40.8917882328256,40.8914394503379,40.8913674848872,40.8911452751048,40.8909102335518,40.8903443498499,40.8899746254419,40.8899037402954,40.8894288239167,40.8895144328945,40.889514763728,40.8895208627287,40.8895662901443,40.8896124342212,40.8896578946439,40.8896793876482,40.8897012843394,40.8897412876111,40.8897630597236,40.8897766871596,40.8898064046482,40.8898249699062,40.8898295376322,40.8898445664313,40.8898528422,40.8898540322457,40.8898541347067,40.8898481322431,40.8898444512551,40.889828986609,40.8898236321844,40.8897964393262,40.8897862359655,40.8897726912007,40.8897663971304,40.889771870139,40.889772241604,40.8897729071382,40.8897762025209,40.8897986027624,40.8898195156351,40.8898466027878,40.8898732983882,40.8899025625503,40.8899208279255,40.8899217624358,40.8899279702975,40.8899755049085,40.8900432596742,40.8901094634141,40.8901500087316,40.8902175041395,40.8902900813942,40.8903651678473,40.890388748317,40.8903923107577,40.8904321419404,40.890434461655,40.8904650434588,40.8904729804014,40.8904742875453,40.8905054542124,40.8905298544761,40.8905450899162,40.8905623190402,40.890581154715,40.8906011737082,40.8906219261985,40.8906429458822,40.8906637604517,40.8909672958784,40.8912068290963,40.8906132883958,40.8903150964607,40.8902899803603,40.8902604342747,40.8898471305285,40.8896770237937,40.8894334275054,40.889323833842,40.8891973369043,40.8890825057322,40.8890601485909,40.8890377622584,40.888678450576,40.8883792117794,40.8883435603364,40.8883434873161,40.8880989064755,40.8877405420071,40.8876384069332,40.887480598377,40.887108891601,40.8868293791823,40.8864739640991,40.8864092483435,40.8863416823861,40.8860306803368,40.8857129680244,40.8850690548588,40.8846481295645,40.8845410611669,40.884290883524,40.8839153173342,40.8836999667811,40.8836433113335]}]],[[{"lng":[-74.032310843001,-74.0320095332724,-74.0260978906359,-74.0257237706746,-74.0246637088286,-74.0246145327845,-74.0245735491043,-74.0235493908876,-74.0235178724573,-74.0234820367263,-74.0234682183412,-74.0234008536295,-74.0233168302438,-74.0232178021328,-74.0231059320848,-74.0229700932488,-74.0226109861283,-74.0219243974276,-74.0217543256647,-74.0216494666172,-74.0215981079466,-74.0215603682944,-74.0215164548883,-74.0214664593663,-74.0214104860531,-74.0213486517288,-74.021281085446,-74.0212079281793,-74.0211293325644,-74.0210873117535,-74.021052986947,-74.0209074004978,-74.0207733057556,-74.0205426995401,-74.0202929162027,-74.0200572173502,-74.0197129379459,-74.0195531816618,-74.0193110334044,-74.0187832339203,-74.016067907324,-74.0132448956053,-74.011069092807,-74.0105038368618,-74.0102948249559,-74.0100893858062,-74.0098877214696,-74.0096900302874,-74.0094965066905,-74.0093073410079,-74.0091227192795,-74.0066191489383,-74.0060056409891,-74.0037731632313,-74.0016269681283,-73.9993952679115,-73.9983141752881,-73.9971817527544,-73.9974878569875,-73.9975357378005,-73.9981161432841,-73.9986969523364,-73.9993209028495,-73.9999466498922,-74.0005298749299,-74.0012022236823,-74.0016938015666,-74.0022758628599,-74.0028570164015,-74.0034355710265,-74.0040190690737,-74.0045990697737,-74.005226659917,-74.0058531993418,-74.0064339499209,-74.0070153162091,-74.0075980688957,-74.0081768755106,-74.0087603999488,-74.0093416449816,-74.0099237199307,-74.0105040358741,-74.0110864810412,-74.0117120155573,-74.0134825591615,-74.0152237943311,-74.0170191015474,-74.0162363672972,-74.0154985500964,-74.0164055306887,-74.0167128387583,-74.017283667568,-74.0174671144685,-74.0175086859712,-74.0180470260697,-74.018119049733,-74.0181764666061,-74.018214586302,-74.0182314505144,-74.0186602176847,-74.0186913577419,-74.0187138228914,-74.0191768511388,-74.0191808901352,-74.0192315039128,-74.0193934357128,-74.0194276088975,-74.019747728448,-74.0201043756255,-74.0202469222392,-74.0203938499672,-74.0205447299712,-74.0206991218734,-74.0208565750431,-74.0210166299113,-74.0211788193131,-74.0213426698512,-74.0215077032786,-74.025146682482,-74.0293088286275,-74.0300514654768,-74.0308851121658,-74.0310161227128,-74.0314347165998,-74.0317963379444,-74.0318603999744,-74.0321315955129,-74.0327068147989,-74.0335922408201,-74.0337835067925,-74.0342728053947,-74.0343553603929,-74.0344300462957,-74.0344966293679,-74.0345392968579,-74.0345901403734,-74.0346489446757,-74.0347154608169,-74.0347894071938,-74.0348704707392,-74.0349583082476,-74.0350525478283,-74.0351527904791,-74.0352586117765,-74.0353037125144,-74.0353517024384,-74.0354021721903,-74.0354771543369,-74.0355494097886,-74.0356180767648,-74.035682336281,-74.0357414219166,-74.0357946289556,-74.0360397777792,-74.0360805816691,-74.0361133550141,-74.0362101028571,-74.03629809448,-74.0363772387649,-74.0364474537446,-74.0365086666884,-74.0365629009538,-74.0366254102351,-74.0366960674766,-74.0367747290519,-74.0368612350558,-74.0369554096287,-74.0370570613142,-74.0371659834482,-74.0372819545788,-74.0374047389161,-74.0375340868122,-74.0388202256032,-74.0390250218435,-74.0392919574696,-74.0395091473236,-74.0398606911968,-74.0402342727845,-74.0403813233868,-74.0404761202149,-74.0407276051782,-74.0408614076925,-74.0410175065469,-74.041127772883,-74.0413752289159,-74.0414338599224,-74.0414854001621,-74.0415296679683,-74.0415665073013,-74.0415957882992,-74.0416174077357,-74.0416221976546,-74.0416233689153,-74.0416178557304,-74.0416033381146,-74.041579840425,-74.0415996813114,-74.0416711974167,-74.0417493234625,-74.0416949017986,-74.0417083251721,-74.0417101581247,-74.0417579401213,-74.0417987681907,-74.0418325674458,-74.041859275884,-74.0418788445011,-74.0418912373814,-74.0418964317639,-74.0418966070505,-74.0418943598296,-74.0418876636111,-74.0418765259563,-74.0417566930148,-74.041683215349,-74.0416420772686,-74.0415662473388,-74.0414291871028,-74.0414165035367,-74.0413007668797,-74.0412729956255,-74.0410906211761,-74.0411031727376,-74.0411068494917,-74.041101632208,-74.0410875480839,-74.0410646706034,-74.0410331191542,-74.040993058405,-74.0409446974472,-74.0408882887033,-74.0408241266104,-74.0407525460831,-74.0406588539327,-74.0402891153532,-74.0401548100985,-74.0399179062505,-74.039293886904,-74.0384323056844,-74.0381605859819,-74.0378337608468,-74.0374542493744,-74.0371680252796,-74.0368066204885,-74.0387629792076,-74.0386880469073,-74.0367248437488,-74.036606414452,-74.0364794917536,-74.0363441848625,-74.0362006102107,-74.0360856095201,-74.0359659274961,-74.0358416240743,-74.0357127615073,-74.0359803944726,-74.0363505536881,-74.0367398662957,-74.0367572887095,-74.0367703428426,-74.0367786854673,-74.0367820972313,-74.0367804884261,-74.0367739013457,-74.0367625091755,-74.0367466114392,-74.0367266261241,-74.0367030786911,-74.0344519318136,-74.0345382973941,-74.0340732929426,-74.0328750723012,-74.032641289603,-74.0322971135638,-74.0322352443678,-74.0324696878725,-74.0325417379564,-74.032310843001],"lat":[40.6440392144804,40.6438578080477,40.6402700203256,40.640630519108,40.6399833864462,40.6399533646609,40.6399239349924,40.6393203336925,40.6394447739147,40.6395332128084,40.6395673354794,40.6396857318486,40.6397977817249,40.6399015146036,40.6399953259269,40.6399346044787,40.6397085283277,40.6392848596933,40.6391813932466,40.6391176950941,40.6390864953723,40.6389828433429,40.6388806121901,40.6387800151832,40.6386812621815,40.6385845594067,40.6384901083802,40.6383981061366,40.6383087446018,40.6382635879785,40.6382266915978,40.6380803058091,40.6379594688674,40.6377745918535,40.6375973527029,40.637437238496,40.6372314829131,40.6372013433337,40.6370978064117,40.6369602855955,40.6361384510949,40.6353974741061,40.6347410636714,40.6345790963294,40.6344948005997,40.634405553255,40.6343114420795,40.6342125596412,40.6341090032007,40.6340008746154,40.6338882802393,40.6323754580869,40.6320168033571,40.6307116464701,40.6293467864133,40.6280287270261,40.6273882283809,40.6267101558363,40.6264250051576,40.6263767110243,40.6258157066096,40.6252565916406,40.6246552468466,40.6240506226048,40.6234899390831,40.622842712352,40.6223724273197,40.621814274427,40.6212536433395,40.6206954038477,40.6201361890691,40.6195768539982,40.6189731540266,40.6183704772606,40.6178147169019,40.6172539464371,40.6166944608693,40.6161331807064,40.6155758234432,40.6150150960399,40.6144566426455,40.6138966114925,40.6133390442023,40.6127350291876,40.6110373979196,40.6093563841185,40.6076544169712,40.6072332661004,40.6068415242769,40.605975924814,40.6056826353559,40.6051378246966,40.6049651043263,40.6048504972353,40.6043657351264,40.6043152228267,40.6042526088174,40.6041819577837,40.6041084725031,40.6036410675919,40.6036079239394,40.6035820759073,40.6031544223004,40.6031495946108,40.6031021742476,40.6029117612817,40.602871578348,40.6030848092639,40.603259552474,40.6033243178239,40.6033831211798,40.6034357909078,40.6034821732763,40.6035221329049,40.6035555531597,40.6035823364936,40.6036024047313,40.6036156992975,40.60408312423,40.6045990640619,40.604759173812,40.6051845642557,40.6052514141152,40.6055294663082,40.605780274596,40.6058111847287,40.6059018357617,40.6063310660381,40.6070826074389,40.6072543503886,40.607717478733,40.6078229744082,40.607931823169,40.6080436844216,40.6081405553546,40.6082351064089,40.6083269372528,40.6084156590702,40.6085008962076,40.6085822877641,40.6086594891201,40.6087321733968,40.6088000328398,40.608862780123,40.6088882352687,40.6089104106755,40.6089291171841,40.6089450487606,40.6089671168761,40.6089950583281,40.6090285398638,40.6090671621539,40.6091104645554,40.6092956390019,40.6093468863875,40.6093947289095,40.6096010411228,40.6098096179503,40.6100202435996,40.6102327001566,40.6104467678108,40.6105875865767,40.6107263988675,40.6108629224212,40.6109968796283,40.6111279980958,40.6112560112018,40.6113806586373,40.6115016869359,40.6116188499891,40.6117319095473,40.6118406357038,40.612957940882,40.6131589759483,40.6134558235079,40.6137892029902,40.6143355465455,40.6150282566493,40.6153417823284,40.6156252631615,40.6170504163953,40.6176307657876,40.6183078055248,40.618786056113,40.6199935529653,40.6200832821062,40.6201755041769,40.62026989417,40.6203661194366,40.6204638408585,40.6205627140432,40.620668758078,40.6207748611502,40.6209422590323,40.621109343823,40.6212758344175,40.6214663151838,40.6220918059191,40.6224569956695,40.6228024562284,40.6232449341951,40.6233053206118,40.6234283208546,40.6235527668442,40.6236784304404,40.6238050812695,40.6239324871463,40.6240604145004,40.624188628804,40.6242174302818,40.6243182189414,40.6244188929392,40.6245193382939,40.6250550601989,40.6253835421746,40.6260093584274,40.6267435941552,40.6280706656596,40.6281499605455,40.6290060532216,40.6291410646544,40.6297257009313,40.6298190015033,40.6299127490165,40.6300064541015,40.6300996276081,40.630191783159,40.630282439689,40.6303711239559,40.6304573730111,40.6305407366167,40.6306207795958,40.6306970841042,40.6308887529338,40.6317163045763,40.6320169015631,40.6325344437072,40.6338863542965,40.6356851891421,40.6362439805844,40.6369160833307,40.6376965153073,40.6382850965695,40.6389842215455,40.6395882589806,40.6397382560296,40.6391411902067,40.6393630185794,40.6395821044715,40.6397982592301,40.6400112967246,40.6401715914976,40.6403298853458,40.6404860989534,40.6406401540465,40.6409459495711,40.6411543836094,40.6414763654588,40.6414958750387,40.6415172730086,40.6415399967658,40.6415634488493,40.6415870126479,40.6416100686124,40.6416320105453,40.6416522615392,40.6416702891449,40.6416856193715,40.6438267866824,40.6438763815101,40.6443139329639,40.6435833153871,40.6437873129417,40.643581313015,40.6436433701554,40.6437861263341,40.643825484352,40.6440392144804]}]],[[{"lng":[-73.9097168486006,-73.9097303218179,-73.909748234711,-73.9099505152206,-73.9099683724985,-73.9100230764213,-73.9100323390824,-73.9100376297162,-73.9100029708461,-73.909983872491,-73.9097683869871,-73.9097851795935,-73.9097717067779,-73.9097168486006],"lat":[40.5652874254607,40.565263518328,40.5652695117089,40.5648999443351,40.5648706997616,40.5647802095385,40.5647888042025,40.5647937111051,40.5648448175586,40.5648798823218,40.5652755073489,40.5652806451071,40.5653054053081,40.5652874254607]}],[{"lng":[-73.9119255184388,-73.9119249780236,-73.9119129970696,-73.9118955622332,-73.9118923943234,-73.9118751880938,-73.9118580902939,-73.9114511965002,-73.9113379662561,-73.9111700100362,-73.9110738230738,-73.91079817683,-73.9107982674948,-73.9105608869093,-73.9103319353975,-73.9103067522018,-73.9103190147384,-73.9101749642071,-73.9101740613076,-73.9103921070443,-73.9103724216721,-73.9105513242827,-73.9106016875131,-73.9106472927737,-73.9106880765446,-73.910697665914,-73.9102645150204,-73.90958244807,-73.909478379881,-73.909381011384,-73.9092904720366,-73.9092068804637,-73.9084593012586,-73.9083539581391,-73.9091819173441,-73.9095063011081,-73.9095035521169,-73.9094791811542,-73.9092829979288,-73.9090849517405,-73.9087973049183,-73.9117395760218,-73.9162568481325,-73.9170143918727,-73.9178065311057,-73.9186664376506,-73.9194812234374,-73.9264190946264,-73.9285424483302,-73.9288400241461,-73.9290987825575,-73.9295011378781,-73.929653742719,-73.9298294383554,-73.9304248548829,-73.9311865092941,-73.9322220409448,-73.9317759997137,-73.9313670120434,-73.928785000305,-73.9282838813482,-73.9281018253143,-73.9279240530811,-73.9277507710773,-73.9275821805212,-73.9274184771864,-73.9272598511749,-73.9270731982572,-73.9268913825356,-73.9261572320952,-73.9258652370387,-73.9256842660726,-73.9255872177415,-73.9254500300139,-73.9252989680378,-73.9251005278679,-73.9246627109143,-73.9242146123668,-73.9232948420831,-73.9227870295444,-73.9220824879531,-73.9210782281548,-73.9203681028045,-73.920201488048,-73.9202059671435,-73.9201969854857,-73.920240673625,-73.920259631071,-73.9201173594527,-73.9200984008251,-73.9201443328769,-73.9201690188257,-73.9201757395464,-73.9203312014267,-73.9201787725894,-73.9196239733509,-73.9190976194402,-73.9176608190009,-73.917225769588,-73.9168009798367,-73.91649706703,-73.9161048943738,-73.9156798655151,-73.915524404278,-73.915191311702,-73.9148338659629,-73.9145533689538,-73.913867496264,-73.9132438842566,-73.9131318012794,-73.9122020070342,-73.9121594295398,-73.9118831959703,-73.9119025883587,-73.9119211284959,-73.911926920704,-73.9119421181112,-73.9119552267277,-73.9119546436619,-73.9119815277005,-73.9121450951884,-73.912161819591,-73.9119702481841,-73.9117361534007,-73.9117351104733,-73.9119255184388],"lat":[40.5658138623767,40.5657367218824,40.5654796093025,40.5651114502878,40.5651015945948,40.5650480554683,40.5649954380033,40.5651030371663,40.565068125911,40.5650585144619,40.5650530092225,40.5651109963341,40.5650430970932,40.5650073501188,40.5650168707514,40.5650049363722,40.5649656474842,40.5649227235295,40.5649234019891,40.5645112691349,40.5644010327536,40.5641210305939,40.5640245197434,40.5639266427128,40.5638275358726,40.5634150375821,40.5623964513697,40.5613848048471,40.5612456215229,40.5611036463112,40.5609590664902,40.5608120732341,40.5608085329923,40.5607544805896,40.5607571956874,40.5607619785479,40.5607179770173,40.5604436355842,40.5569972416293,40.5561133452459,40.5548295083884,40.5537082477529,40.5519710661188,40.5516238123081,40.5512792955979,40.5510038380795,40.5506248153475,40.548155780823,40.5520049120728,40.5524975322778,40.5530934450985,40.5538409491934,40.5541249241834,40.5544572271851,40.5555833186755,40.5570158313271,40.5576763419598,40.5578999999187,40.5581764796731,40.5599260000763,40.560149121598,40.5602426545397,40.5603408639174,40.5604436357011,40.5605508505628,40.5606623840153,40.560778106556,40.5609103340846,40.5610464257207,40.5615526097227,40.5616517408228,40.5617005759089,40.5617252284096,40.5617600754396,40.5618071555221,40.5618292784331,40.5619224583034,40.5620013188244,40.5620905804516,40.5620671964763,40.5620744473305,40.5620798528844,40.5622188324676,40.5625319610129,40.562532817689,40.5625507493656,40.5625439461716,40.5626122930581,40.5626395263476,40.5625711806096,40.5625618176502,40.5625225428773,40.5625225475482,40.5622260548866,40.5622558861274,40.5623658432259,40.5624701612084,40.5628261496865,40.5629865531698,40.5631854967995,40.5633372024824,40.5635585818893,40.5638166471417,40.5639038435663,40.5640906667103,40.5642420555416,40.5643534324333,40.5646080961419,40.5646561583481,40.5646382444486,40.5650545698495,40.5649714827409,40.5649904057408,40.5650444796229,40.5650961752655,40.5651123285709,40.5654796316312,40.5657316205047,40.5658113226729,40.5658096349759,40.5657790089394,40.5658362520712,40.565869417533,40.5658726534857,40.56581371622,40.5658138623767]}],[{"lng":[-73.8905023530036,-73.8902853709935,-73.890164958552,-73.8900867519944,-73.8900607421668,-73.8900201856575,-73.8899339515348,-73.8896291503377,-73.8895949238329,-73.8894412417433,-73.8894082306153,-73.8891110313813,-73.8889112469059,-73.8887900084631,-73.8886612893331,-73.8884018070009,-73.888399354335,-73.8883943149822,-73.8883907733278,-73.8883830456706,-73.8883680303089,-73.8883595070434,-73.8883473569274,-73.8883446776343,-73.888343773765,-73.8883431199295,-73.888340978466,-73.888188674625,-73.8880566091741,-73.8879664227046,-73.8878622257412,-73.887473784751,-73.8868763825338,-73.8868610567602,-73.8865468400235,-73.8858879004769,-73.8854913682334,-73.8854058149184,-73.8853686026088,-73.8858303730299,-73.8866055656849,-73.8869064451001,-73.8878212259585,-73.8881241945653,-73.8890262404147,-73.889125659432,-73.8895703529338,-73.890570511465,-73.8909195104634,-73.891048940677,-73.8912701145646,-73.8914974334037,-73.8943470682738,-73.8945535639848,-73.8945658095034,-73.895265425395,-73.8954479581841,-73.8953795134035,-73.8953135264294,-73.895265977316,-73.8952436289779,-73.8951870485933,-73.895148792278,-73.895116856669,-73.8950463220106,-73.8948540376939,-73.8947957203479,-73.8945970958608,-73.8943825749535,-73.8943641990722,-73.8941302815936,-73.893963288209,-73.8936594640261,-73.8934546778162,-73.8932625507133,-73.893141192271,-73.8928058167791,-73.8926101337963,-73.8925692981124,-73.8924941323068,-73.89235367291,-73.8922838107672,-73.892144688497,-73.8919476841919,-73.8918459414204,-73.8917327234491,-73.8914645256912,-73.891208364166,-73.8910600526065,-73.8907572912292,-73.8905023530036],"lat":[40.5681832359058,40.5681723756464,40.5682285252773,40.568169502443,40.5681452622973,40.5680909838695,40.568072954144,40.5679825995205,40.5679418902334,40.5679368972911,40.5679262134683,40.5679162366916,40.5679256345658,40.5679313340535,40.5679681039404,40.5680790674466,40.5680908264912,40.5681034367543,40.5681245331852,40.5681412206882,40.5681449259279,40.5681436747411,40.5681356211677,40.5681205078807,40.5680957159468,40.568077740037,40.5680660225985,40.5680335180839,40.568016918935,40.5680187683238,40.5680380449872,40.5681302387245,40.5683498398471,40.5683832977038,40.5684709781101,40.5675683645135,40.5670251824339,40.5669072318635,40.5668570118532,40.566722113205,40.5665087635952,40.5664265363888,40.5661741689034,40.5660903826884,40.5658404168571,40.5658130120109,40.5656904269484,40.5654095554544,40.5653133321118,40.5652776506503,40.5652166696303,40.565153036464,40.5643488998972,40.5642906252657,40.5643299855738,40.5663164316821,40.566858506537,40.5668950154642,40.5669199792661,40.5669138413556,40.566910957055,40.5669136013296,40.5669583995599,40.5670308640542,40.5671909146972,40.5673270295054,40.5673683107278,40.5674821167302,40.5676418074104,40.5676499673055,40.5678201496535,40.567928148645,40.5681037138815,40.56823501906,40.5683333123386,40.5683953984464,40.5685149106194,40.5685872477887,40.5685588057726,40.5685308109202,40.5685261141927,40.5685118378231,40.5685056098667,40.5684891798645,40.5684729902008,40.5684549737768,40.5684151240162,40.5683448297941,40.5683041297756,40.5682210478606,40.5681832359058]}],[{"lng":[-73.7666913977135,-73.7666477018893,-73.7665986674209,-73.7665602979091,-73.7665232418954,-73.7664914318716,-73.7664464576801,-73.7664094440771,-73.7663657306391,-73.7663101310163,-73.7662651847383,-73.7662374781758,-73.7662044835291,-73.7661953290391,-73.7661742245558,-73.7661279329225,-73.7661121090666,-73.7660750815448,-73.7660526530638,-73.7660076778543,-73.7659759528507,-73.7659243122233,-73.7658938299061,-73.765844850688,-73.7658197721987,-73.7657747736255,-73.765719156196,-73.765672818082,-73.7656106179882,-73.7655497419896,-73.7655401979789,-73.7655326188811,-73.7655192439421,-73.7655034074654,-73.7654623457203,-73.7654200037884,-73.7654092152309,-73.7653989138705,-73.7653711122996,-73.7653663229943,-73.7653617624717,-73.7653405135711,-73.7653007978494,-73.7652862732978,-73.7652558983956,-73.7652096838289,-73.7652003132122,-73.765164008292,-73.7651489819561,-73.7651244912456,-73.7651136919524,-73.7650837827247,-73.7650603169688,-73.7650410483942,-73.7650255433501,-73.7650205004747,-73.7650172452292,-73.765015802201,-73.7650161460726,-73.7650182993051,-73.7650222420731,-73.7650279821982,-73.7650355466587,-73.7650381399819,-73.7650418547915,-73.765046739584,-73.7650528760445,-73.7650659481678,-73.7650987474004,-73.7651121765244,-73.7651171900261,-73.7651210801833,-73.7651238968659,-73.7651256864326,-73.7651373334552,-73.7651459281289,-73.7651515583102,-73.7651522387342,-73.7651542947895,-73.7651570765323,-73.7651556119947,-73.7651520685323,-73.7651457337866,-73.7651292425045,-73.7651237245843,-73.7651121841273,-73.7651083781552,-73.7651084347684,-73.7651113058518,-73.7651175619946,-73.7651187061249,-73.7651173731579,-73.7651129101092,-73.7651112450397,-73.7651094871159,-73.7651052819416,-73.7651002941461,-73.7650945113865,-73.7650442537034,-73.764995416925,-73.7649901655348,-73.7649856141369,-73.764981866706,-73.7649790064601,-73.7649777241999,-73.7649773764182,-73.7649779522445,-73.7649794611303,-73.7649850532324,-73.7649889944852,-73.7649935240493,-73.7650064757232,-73.7650393215519,-73.7650533511493,-73.7650867769187,-73.7650920546499,-73.7650963161965,-73.7650995138344,-73.7651016127529,-73.7651038576635,-73.7651035556139,-73.7650936512162,-73.7650919126018,-73.7650894825733,-73.7650868738951,-73.765083303937,-73.7650787143525,-73.7650760288008,-73.7650730701541,-73.7650596167917,-73.7650436710001,-73.7649867680617,-73.7648851174193,-73.7648108217639,-73.764737825289,-73.7646658821167,-73.7645948390174,-73.7645526582224,-73.7645047305972,-73.7644550119138,-73.764353727133,-73.7641892443344,-73.7641399905812,-73.7640954648178,-73.7639982263801,-73.7638417149627,-73.7637222993265,-73.7636707130079,-73.7636633777051,-73.7636559011754,-73.7636402708839,-73.7636235607262,-73.7635748550324,-73.7635588366432,-73.7635438981197,-73.7635366099538,-73.7635285855172,-73.7634931119177,-73.7634847202602,-73.7634772180944,-73.7634254550879,-73.7633741106811,-73.7633233744208,-73.7632734247828,-73.7632367879683,-73.7632225585992,-73.7631985527308,-73.7631892622387,-73.7631581383879,-73.7631138926215,-73.763026155521,-73.7629480917049,-73.7628969845188,-73.7627584898812,-73.7627139744242,-73.7626677312548,-73.7626197487923,-73.7625699784138,-73.7625187378768,-73.7624610850704,-73.7623961501984,-73.7623044835185,-73.7622994409043,-73.7617241378888,-73.7610151274559,-73.7602363575698,-73.7607673039872,-73.76087049521,-73.7610310763763,-73.7610671269154,-73.7611734484292,-73.761782429606,-73.7615505190589,-73.7615442281979,-73.7614683859222,-73.7614205228462,-73.7614045713529,-73.761261309996,-73.7611066075837,-73.7608468611397,-73.760668143153,-73.760569138445,-73.7603213354934,-73.7599844697484,-73.7594911983339,-73.7597357109902,-73.7597209903911,-73.7597057873169,-73.7596824361514,-73.7596591369825,-73.7596365808956,-73.7596154369353,-73.7595963322614,-73.7595798335462,-73.7595664301666,-73.7595565196879,-73.7595090291909,-73.7595011327068,-73.7594903676904,-73.7594770529798,-73.7594615829308,-73.7594444157369,-73.7593629284582,-73.7592801215763,-73.7591967293208,-73.7591134911122,-73.7591044220478,-73.7590702252238,-73.7590451147308,-73.759008128299,-73.7589872166545,-73.7589569701422,-73.7589203023739,-73.7588892467426,-73.7588511420089,-73.7588313612004,-73.7588003973069,-73.7587807106553,-73.7587456244265,-73.7587131086047,-73.7586833311999,-73.7586488378751,-73.7586119326827,-73.758582660223,-73.7585466548193,-73.7585090305671,-73.7584802284604,-73.7584467751967,-73.758417026303,-73.7583833893642,-73.7583492965338,-73.758321477724,-73.7582992606989,-73.7582955003337,-73.7582912547755,-73.7582577507584,-73.7582269006986,-73.7581949143401,-73.7581588990949,-73.7581210525278,-73.7580882548818,-73.7580543726852,-73.7580288046063,-73.758001900818,-73.7579740245019,-73.7579443471631,-73.7579102259766,-73.7578855949994,-73.7578490881041,-73.7578182051052,-73.7577894051914,-73.7577540874121,-73.7577243390536,-73.7576878695922,-73.7576599890832,-73.7576207438533,-73.7575877699895,-73.7575575344091,-73.7575277924032,-73.7574948356595,-73.757475345603,-73.7574384823873,-73.7574062363816,-73.7573830080019,-73.7573738042192,-73.7573697504805,-73.7573590559356,-73.7573383590768,-73.7573166656676,-73.7572997607122,-73.7572970359315,-73.7572957334404,-73.7572750037202,-73.7572437358534,-73.7572132104499,-73.7571818402145,-73.7571488683707,-73.7571185169416,-73.7570863402528,-73.7570510386322,-73.7570156646704,-73.7569814148009,-73.7569543997968,-73.7569350479991,-73.756894675878,-73.7568732373591,-73.7568405593607,-73.7568151155203,-73.7567834420213,-73.7567518741128,-73.7567259437505,-73.7566887908651,-73.7566587303668,-73.756630566574,-73.7566070879791,-73.7565891619184,-73.756578949253,-73.7565605340319,-73.7565349349472,-73.756506179424,-73.7564824532646,-73.756442672371,-73.7564142113711,-73.7563872009586,-73.7563612625333,-73.7563383711574,-73.7563043092811,-73.7562758393677,-73.7562514657054,-73.7562195967062,-73.7562013112423,-73.7561929480639,-73.756155102311,-73.7561262228225,-73.7560929451583,-73.7560742404356,-73.7560504209596,-73.756034944986,-73.7560151393083,-73.7559977524841,-73.7559884095663,-73.7559819898068,-73.7559813832174,-73.7559786925961,-73.7559682129282,-73.7559632628383,-73.7559297420021,-73.7558960638692,-73.7558709128561,-73.7558399967387,-73.7558179839118,-73.7557930946159,-73.7557745440193,-73.7557557543616,-73.7557368120963,-73.755718096898,-73.7557028589204,-73.7556838651025,-73.7556719830031,-73.7556621033869,-73.7556486346495,-73.7556289047755,-73.7556068472615,-73.7555975529572,-73.7555949635375,-73.7555978966168,-73.7556018295172,-73.7556137466023,-73.7556225904002,-73.7558089283855,-73.7558725146728,-73.7558763762554,-73.755875612163,-73.7558741291214,-73.7556992596434,-73.755697464001,-73.7556997446915,-73.755701731513,-73.7557163433209,-73.7557572725982,-73.7557116739463,-73.7555636908416,-73.7555021896631,-73.7554509484917,-73.7553991550046,-73.7553482567732,-73.755299676348,-73.7552734733896,-73.75524482136,-73.7552145695948,-73.7551836148515,-73.7551528747266,-73.7551232604544,-73.7550956498949,-73.7550708615107,-73.7550519351809,-73.7550327012424,-73.7550135854277,-73.7549950108548,-73.7549773886616,-73.754961108906,-73.7549458357652,-73.7548942103441,-73.7548479687316,-73.7548076524533,-73.7547737336485,-73.7547466095408,-73.7547344981683,-73.7547321957257,-73.7534583619682,-73.7500877107679,-73.7491200068025,-73.7482158588267,-73.7479930731725,-73.7476141892919,-73.7472156788501,-73.7469209647418,-73.7468553902455,-73.7457615017868,-73.7456211251228,-73.7453675171237,-73.7445665806748,-73.7438698184871,-73.7433707107956,-73.7431089457377,-73.7433249333374,-73.7433973152214,-73.7431465521456,-73.7412136685223,-73.7402913897614,-73.7392073980312,-73.7384039445363,-73.7383943842241,-73.7382259779417,-73.7382621923208,-73.7383645985682,-73.7383696113806,-73.7383660305963,-73.7383650460103,-73.7383615469628,-73.7383551712838,-73.7383561770227,-73.7386528027747,-73.7386274447949,-73.7385771682641,-73.7385738210247,-73.7385588463223,-73.7385035556856,-73.7384890040081,-73.7385085497771,-73.7385242380761,-73.7385429505286,-73.738560378395,-73.7385661122164,-73.7385880917945,-73.7386138969057,-73.7386248616551,-73.7386440737476,-73.7386553784339,-73.7386595499101,-73.7386842310519,-73.738690785487,-73.7387154873914,-73.738719680769,-73.7387382318955,-73.7385746161792,-73.7385880505228,-73.7385846673763,-73.7386264125461,-73.7386278141483,-73.73863304587,-73.7387600455039,-73.7387626305711,-73.7387662111787,-73.7387706803131,-73.7387759044052,-73.7387817273228,-73.7387879750365,-73.7387944608211,-73.7388009908363,-73.7388073699198,-73.7388134074202,-73.738818922895,-73.7388237515033,-73.7388277489326,-73.7388307957117,-73.7388328007814,-73.7388826858174,-73.7389394379819,-73.7390023579786,-73.7390706705059,-73.7391435338104,-73.7392200500596,-73.739299276405,-73.7393802366018,-73.7394619330383,-73.7395433590301,-73.7396289716528,-73.7397109987354,-73.7397886075914,-73.7398610103888,-73.7399274721486,-73.7399873182058,-73.7400399410583,-73.7400848065331,-73.7401054361675,-73.7401179793492,-73.7401221145523,-73.7401177357879,-73.740104955319,-73.7400841007809,-73.7400627513083,-73.7400342775386,-73.7399992661043,-73.7399584383248,-73.7399126353454,-73.7398628008077,-73.739809961409,-73.7398054369596,-73.73980187245,-73.7397993679075,-73.739797993614,-73.7397977881349,-73.739798757236,-73.739904078141,-73.7400370304209,-73.7400695477712,-73.7400971426267,-73.7401181821894,-73.7401537610051,-73.7402507506906,-73.7403090535136,-73.7403915383498,-73.7403929448337,-73.7403475207994,-73.7403490082914,-73.7403327952407,-73.7402839300583,-73.7402820405415,-73.7403601274953,-73.7403823249003,-73.7404096033572,-73.7404411814553,-73.7404761546151,-73.7405135210003,-73.7405522102172,-73.7405595562073,-73.7405671573938,-73.7405748242826,-73.7405823657417,-73.7405895937659,-73.7405963281638,-73.7406024010499,-73.7406076610296,-73.740611976974,-73.7406183407659,-73.7406210251857,-73.7406199604062,-73.7406151741204,-73.7406067908214,-73.740609214101,-73.7406133485253,-73.7406190703894,-73.7406262084907,-73.7406345492511,-73.7406438431082,-73.740685301377,-73.7407257793269,-73.740764118855,-73.7407992230416,-73.7408030758657,-73.7408076996294,-73.7408129972653,-73.7408188575598,-73.7408251574871,-73.7408579579208,-73.7408916351949,-73.7409252451211,-73.7409578453994,-73.7409885220371,-73.7409930685405,-73.7409973317634,-73.7410011967164,-73.7410045591522,-73.7410073283778,-73.7410094297005,-73.7410108064426,-73.7410114214702,-73.7410112581946,-73.7410103210199,-73.7410086352239,-73.741006246277,-73.7410032186147,-73.7410017981389,-73.7409998522408,-73.7409974344513,-73.740994611283,-73.7409914604,-73.7409880684822,-73.74098452884,-73.7409809388477,-73.7409773972647,-73.7409740015188,-73.7409708450258,-73.7409683621983,-73.7409657470704,-73.7409630671784,-73.7409603917312,-73.7409577898232,-73.7409553286493,-73.74095307177,-73.7409510774698,-73.7409493972522,-73.7409480745091,-73.7409471434008,-73.7409466279734,-73.740956196002,-73.7409693807286,-73.7409858217838,-73.7410050697972,-73.7410433797584,-73.7410831534284,-73.7411235170081,-73.7411635837387,-73.7411855306349,-73.7412076864951,-73.7412296241686,-73.7412509207111,-73.7412518896054,-73.7412535158919,-73.7412557560826,-73.7412585502726,-73.7412618237431,-73.7412654889587,-73.7412694479084,-73.7412735947267,-73.7412778185244,-73.7412820063536,-73.7412860462282,-73.7412898301188,-73.741293256841,-73.7412962347615,-73.7413031074448,-73.7413110980514,-73.7413199874781,-73.7413295319763,-73.7413394698348,-73.7413495285566,-73.7413577654794,-73.7413649505534,-73.7413709084442,-73.7413754937637,-73.7413785946179,-73.7413801353374,-73.7413800783241,-73.7413784249688,-73.7413984711753,-73.7414219257656,-73.7414217559189,-73.7414220701026,-73.7414228588891,-73.7414240986099,-73.741425752065,-73.7414277696403,-73.7414300907951,-73.7414326458796,-73.7414353582247,-73.7414381464422,-73.7414409268673,-73.7414436160691,-73.7414461333538,-73.7414660740348,-73.7414882777692,-73.7415121863709,-73.7415371987952,-73.7415626862489,-73.741565381164,-73.7415681865853,-73.7415710213159,-73.7415738033102,-73.7415764520494,-73.7415788908711,-73.7415810491888,-73.7415828645345,-73.7415842843668,-73.7415852675917,-73.7415857857519,-73.7415858238504,-73.7415853807844,-73.741597367067,-73.7416138813321,-73.741634506348,-73.7416587210272,-73.7416859135921,-73.7417153970309,-73.7417464264551,-73.7417782179177,-73.7417962923106,-73.7418109665087,-73.7418218077845,-73.7418284964411,-73.7418308352394,-73.7418287552142,-73.7418245143533,-73.7418168674444,-73.7418060003625,-73.7417918706979,-73.7417750222456,-73.7417558811879,-73.741734931698,-73.7417127036924,-73.7417037086443,-73.7416941850988,-73.7416843795402,-73.7416745457516,-73.7416649382468,-73.741655805683,-73.7416473844251,-73.7416398924282,-73.7416335235966,-73.7415957404517,-73.7415550609638,-73.7415123916912,-73.741153473001,-73.7409431357655,-73.7409414631759,-73.7409387973318,-73.7409352110898,-73.7409308024607,-73.7409256919307,-73.740920019169,-73.7409139392105,-73.7408748714649,-73.740833157289,-73.7407899463293,-73.7407464294828,-73.7407038060767,-73.7406611119079,-73.7406167457699,-73.7405714160901,-73.7405258466823,-73.740520598182,-73.7405157412708,-73.7405114232607,-73.7405077751186,-73.740504907494,-73.7405029073628,-73.7405018353897,-73.7405017240878,-73.7405025768327,-73.7405043677603,-73.7405070425509,-73.740510520077,-73.740514694864,-73.7405456370422,-73.7405709758138,-73.7405904358176,-73.740603805582,-73.7406109398226,-73.7406152597219,-73.7406107934655,-73.7405976600892,-73.7405762095955,-73.740547013624,-73.7405308245967,-73.7405114202689,-73.7405017613249,-73.7404938294606,-73.7404793008963,-73.7404591762314,-73.7404437182442,-73.7404145265139,-73.740301437487,-73.7402902294696,-73.7402223263084,-73.7401867050776,-73.73992792985,-73.7399149276756,-73.7398122932899,-73.739579049975,-73.7395315359668,-73.7396098805516,-73.7394637030306,-73.739482209896,-73.7394878180858,-73.7394966087367,-73.7395787016432,-73.739586315604,-73.7396975766965,-73.7397054367772,-73.7397511124264,-73.7397601084977,-73.7398110577149,-73.7398337462708,-73.7398465094775,-73.7398504168597,-73.739883060073,-73.7397948669749,-73.7397915823695,-73.7397336932096,-73.7397095010199,-73.7396551872421,-73.7396485337227,-73.7396962138201,-73.7397472402286,-73.7397539004343,-73.7397760233305,-73.7397798429376,-73.7398056637179,-73.7398110275669,-73.7398335157583,-73.7398378424684,-73.7398642497534,-73.7398682886114,-73.7398842055665,-73.7398966257443,-73.7399099469019,-73.7397963402894,-73.7396986631097,-73.7396933389029,-73.7396873668863,-73.7396357105085,-73.7395850473889,-73.7395740169378,-73.7395467196584,-73.7395174599581,-73.7395088586728,-73.739496522098,-73.7394552865932,-73.7394403349946,-73.7394309585005,-73.7394064975082,-73.7393981082489,-73.7393663946224,-73.7392417205815,-73.7392166950833,-73.7392084173552,-73.7391443475868,-73.7391385634967,-73.739081848153,-73.7390731939712,-73.7390157192885,-73.738928507263,-73.7389470451158,-73.7389726645639,-73.739046067227,-73.7390548498901,-73.7391094693468,-73.7391183037991,-73.7391675142764,-73.7391752880372,-73.7392231749774,-73.7392355386212,-73.739288082365,-73.7392961042102,-73.7393428322753,-73.7393979636385,-73.739447490424,-73.7394449744967,-73.739455832885,-73.7394395712474,-73.739332787064,-73.7391068300239,-73.7391230771092,-73.738946906941,-73.7388930801942,-73.7388552026586,-73.7383836040119,-73.7384106531874,-73.7384123110008,-73.7380516362654,-73.7380323102608,-73.7379898178098,-73.7380612247594,-73.7381702454363,-73.738261225563,-73.7382939615529,-73.7383669401855,-73.7384019028317,-73.7384283324355,-73.738448422413,-73.7384609175789,-73.7384600986037,-73.7384715971063,-73.7384874397197,-73.7385073171875,-73.7385204199478,-73.7385214043477,-73.7385341655638,-73.7385668195085,-73.7386568578937,-73.7386772728309,-73.7387488964859,-73.7387715307992,-73.7387781550138,-73.7387841880634,-73.73877005027,-73.7387775351491,-73.7388166251648,-73.7388111276207,-73.7387933849302,-73.7387913253896,-73.7387864497873,-73.7388343255079,-73.7388934919143,-73.7390019677829,-73.7390721241753,-73.7391072931772,-73.7391676497133,-73.7391954400391,-73.7392558939158,-73.7392769220234,-73.7392872963178,-73.7392851279439,-73.7392778049533,-73.7392810987523,-73.7392943062812,-73.7393040614292,-73.7393194110554,-73.7393266291088,-73.7393338592542,-73.7393485604136,-73.7393647240569,-73.7393965917047,-73.7394274948999,-73.7394588745489,-73.7394946578488,-73.7395276572986,-73.7395646533139,-73.7395650257312,-73.7395522688196,-73.7395524947196,-73.7395876329776,-73.7395874090206,-73.7395751975891,-73.7395749312188,-73.7395886488495,-73.7396196522245,-73.7396410602331,-73.7396745366049,-73.739695394656,-73.7396812312462,-73.7399580159236,-73.7399527501691,-73.7399867874933,-73.7400174641402,-73.7400474263918,-73.7400609815585,-73.7400729504349,-73.7400890894508,-73.7401080313917,-73.7401358036458,-73.7401413912174,-73.74013382011,-73.7401428669949,-73.74018445146,-73.7402112286486,-73.7402741209832,-73.7403296252842,-73.7403640876095,-73.7403919369295,-73.7404190326721,-73.7405061595839,-73.7406283206412,-73.7406515880709,-73.7406816322753,-73.7406975897843,-73.7407077349857,-73.7407393540938,-73.7407679033801,-73.7407927582371,-73.7408315167314,-73.7408386224034,-73.74083755554,-73.7408405427884,-73.7408533186527,-73.7408664322078,-73.7409017059618,-73.7409174097076,-73.7409156959837,-73.7409053346813,-73.7408887491255,-73.7408952027494,-73.7409401621547,-73.7409671798522,-73.7410299055339,-73.7410899703498,-73.7411263340129,-73.7411523383162,-73.7411810418561,-73.7412611561602,-73.7412949827084,-73.7413182062533,-73.7413728777919,-73.7414657806754,-73.7415005811382,-73.7415611899847,-73.7415916774987,-73.7416209169234,-73.7416408809994,-73.7416549849405,-73.7416577455779,-73.7416619727451,-73.7416763840125,-73.7416976630028,-73.7417173010716,-73.7417321898157,-73.7417401459872,-73.7417376616593,-73.7417497722409,-73.7417758878265,-73.7418015199148,-73.7418488883716,-73.7419149057843,-73.7419683684427,-73.7420222993206,-73.7420847378623,-73.742146604135,-73.7422260309707,-73.7422598820867,-73.7423222936312,-73.7424292633438,-73.7423874258488,-73.7426183753406,-73.7427604397498,-73.742774591011,-73.7427956338553,-73.7428096683661,-73.7428399399711,-73.7428748814147,-73.7429142453084,-73.7429744598867,-73.7430096921162,-73.7430410432954,-73.7430671734546,-73.7430994470636,-73.7431320293356,-73.7431661814968,-73.7431906932675,-73.7432206092645,-73.7432864969817,-73.7433196601969,-73.7433495160322,-73.743374408598,-73.7434020111233,-73.7434284540106,-73.7434529260186,-73.7434686761583,-73.7434702101365,-73.7434536853233,-73.7434557162718,-73.7434664263827,-73.7434844228224,-73.743502729374,-73.7435157298737,-73.7435345191668,-73.7435914535387,-73.7439938230992,-73.7441528113984,-73.7445247361909,-73.7446249979318,-73.7447255144534,-73.7450753615092,-73.7451531438331,-73.7452518587278,-73.7453976826242,-73.7457728613277,-73.7458874270436,-73.745980818178,-73.7460697802647,-73.7463441143408,-73.746430952744,-73.74658189443,-73.74662917813,-73.7466551146475,-73.7467602247804,-73.7468430289712,-73.7468796171076,-73.7469244048254,-73.7469887765248,-73.7470549169793,-73.7471202305351,-73.7471289151914,-73.7471531455304,-73.7471920982158,-73.7472252253302,-73.7472958360232,-73.7473690085107,-73.7474520466475,-73.7475836949817,-73.7476488596553,-73.7477082486333,-73.7478133146639,-73.7479374339949,-73.7480052388263,-73.7481792909626,-73.7482356509745,-73.7484115035692,-73.7486427305113,-73.7491252475753,-73.7493782467932,-73.7494324308571,-73.7495333267301,-73.7495922240713,-73.7497212168937,-73.7498653957973,-73.7499500876097,-73.7500495158626,-73.7502436192121,-73.7504993610352,-73.7506576904048,-73.7509408586591,-73.7510498732506,-73.7511480968751,-73.7512284827897,-73.7513212284759,-73.7514266873623,-73.7515681879929,-73.7516005680158,-73.7516936949566,-73.751752703735,-73.7518207622913,-73.751903131566,-73.7519461234433,-73.7519909556692,-73.7521369040945,-73.7522451183051,-73.7523289009096,-73.7524904950323,-73.7525509695599,-73.7525879142063,-73.7526296141386,-73.7526638778546,-73.7526976313684,-73.7527546476937,-73.752780986616,-73.752845799607,-73.7529076354062,-73.7529669924522,-73.753027794334,-73.7530506404061,-73.7530878451759,-73.7531841652795,-73.7532158643339,-73.7532979266633,-73.7533495446751,-73.7533726256097,-73.7534093039575,-73.7534478017782,-73.7534761216802,-73.7535096482518,-73.7535728695853,-73.7536416988834,-73.7536685947132,-73.7537020707026,-73.7537349479359,-73.7537715525036,-73.7538236317265,-73.7538680481762,-73.7539055518399,-73.7539865893047,-73.7541866590037,-73.7542599069499,-73.7543100035587,-73.7543300032088,-73.7544007991898,-73.7544633674703,-73.7545004779169,-73.7545170678507,-73.7545407182493,-73.7545700192771,-73.7546061805103,-73.7546653161473,-73.7547003070945,-73.754733625594,-73.7547625541292,-73.7547964695811,-73.7548915446743,-73.7549219234696,-73.7549510610879,-73.7549872525134,-73.7550156960268,-73.7551455854891,-73.7552157883921,-73.7552709556114,-73.7553212007629,-73.7553629738859,-73.7554604309609,-73.755489500361,-73.7555324690533,-73.7556957125513,-73.7557526725645,-73.7557859743641,-73.7558248968662,-73.7558548084831,-73.7559179084112,-73.7559546362307,-73.7560203659541,-73.7560502459825,-73.7560772338772,-73.756104797244,-73.756131800095,-73.7561627833196,-73.7561947863888,-73.756231544015,-73.7562599980219,-73.7562917989764,-73.7563250288547,-73.7563578301109,-73.7563887888308,-73.7564219951325,-73.7564523134088,-73.7564821055078,-73.7565122844903,-73.7565446269331,-73.7565782747532,-73.7566122470615,-73.7566401205727,-73.7566705429374,-73.7566986632362,-73.7567552578205,-73.7568249426793,-73.7569180670109,-73.7569473416197,-73.7570024510165,-73.7570341941707,-73.7570629735927,-73.7571132833222,-73.7571455457802,-73.7571765504006,-73.7572010810555,-73.7572211627072,-73.7572407067868,-73.7573025728899,-73.7573363936922,-73.7573966376476,-73.7574518605696,-73.7574835055543,-73.7575146637452,-73.7575576526476,-73.7576233155973,-73.7576758748623,-73.7577333429522,-73.7577894312456,-73.757852857213,-73.7578918986187,-73.7579563751517,-73.7579880115994,-73.7580128027423,-73.7580409764196,-73.7581118140114,-73.7581377746055,-73.758166435227,-73.7582978144265,-73.7585620020177,-73.7587153707653,-73.7587894526425,-73.7588598162934,-73.758927855118,-73.7590452190125,-73.7590624957915,-73.7591446261356,-73.7592283619631,-73.7592871448224,-73.7593801075517,-73.7594748651791,-73.7596005418234,-73.7596717559462,-73.7596957062161,-73.7597673492067,-73.7597929480672,-73.759896586545,-73.759948092556,-73.7600703156496,-73.7601656007759,-73.7602359571861,-73.7603092441357,-73.7603820592078,-73.7604182481032,-73.7605495401333,-73.7606527996974,-73.7607857300814,-73.760843822574,-73.7609554874374,-73.7610830583577,-73.7612089514511,-73.7612787298498,-73.7613431167833,-73.7614122929294,-73.7615703049741,-73.7617209878914,-73.7622997805491,-73.7623641622963,-73.7624396704495,-73.7627614686995,-73.7629527557214,-73.7630382243593,-73.7630843059676,-73.763476521516,-73.7635405786842,-73.7637622344744,-73.7640987935915,-73.764282068166,-73.7646392316699,-73.7649902320435,-73.7651713998932,-73.7654199496351,-73.7655172350702,-73.7656728520302,-73.7660473654207,-73.7662277217002,-73.7663250125615,-73.766425974719,-73.7666506848434,-73.7667497184508,-73.7670483246079,-73.7671948161463,-73.7673542988743,-73.7674534552508,-73.7674668729755,-73.7676217203533,-73.7677627986511,-73.767969730065,-73.7680714748103,-73.7681334550013,-73.7682199338214,-73.7682863640962,-73.7684439384153,-73.7685869548803,-73.7687270852515,-73.7688338763409,-73.768858473005,-73.7691002392612,-73.7693599793007,-73.7696446912666,-73.7698264315575,-73.7698621754479,-73.7699007081697,-73.7700635097177,-73.7701024390404,-73.7701380031976,-73.7704956266261,-73.7706275158935,-73.7706542191612,-73.7706817780951,-73.7707644429887,-73.7707967349992,-73.7708261107154,-73.7708321600447,-73.7708615482898,-73.7709040440118,-73.770936949671,-73.7709737424731,-73.7710797588535,-73.7713208373601,-73.7714197694658,-73.7715338568424,-73.7716369311775,-73.7716874519498,-73.7717899790754,-73.7720906007931,-73.7722411142496,-73.7722808174547,-73.772422179357,-73.7724707070397,-73.7725245319042,-73.7727407212681,-73.7727899352468,-73.7728339578406,-73.7728623290645,-73.7728931511805,-73.7730345212223,-73.7730687134217,-73.7730996386625,-73.7731567894857,-73.7734850390846,-73.7735399291297,-73.7736085328067,-73.7736431373905,-73.7736811306431,-73.7737060326093,-73.7737413597798,-73.7737617470266,-73.7737984301096,-73.7738388101865,-73.7738817424924,-73.7739680190848,-73.774004596367,-73.7740430347892,-73.7740776316473,-73.7740963939505,-73.7741155049582,-73.7741554752311,-73.7742007143777,-73.7742952613308,-73.7743486862128,-73.7743824652318,-73.7744143500631,-73.7744248191391,-73.7746758736449,-73.774786035275,-73.7752111763412,-73.775292997832,-73.7754764851908,-73.7755990554106,-73.7757967608383,-73.7758602960536,-73.7759175977054,-73.7759259477778,-73.7759304282186,-73.7759299368923,-73.7759203982951,-73.77590847859,-73.7758487632679,-73.7758246648792,-73.775823731068,-73.7758242405556,-73.7758265854894,-73.7758298087243,-73.7758368859527,-73.7759241781331,-73.7760871070941,-73.7763506460392,-73.7764548908938,-73.7764684492854,-73.7764811199317,-73.7765162533722,-73.7765395142324,-73.776578092444,-73.7766254384115,-73.7766624348081,-73.7766988290516,-73.776752374737,-73.7768626714429,-73.776911142187,-73.777013156498,-73.7771092607016,-73.7772008021456,-73.7772884402808,-73.777353199261,-73.7774555913147,-73.7775002672504,-73.7776135207686,-73.7777588232144,-73.7778350904398,-73.7779158791074,-73.7781014446016,-73.7781494669255,-73.7782495663136,-73.7782735086315,-73.778386800104,-73.7785445021911,-73.7786550405375,-73.7787030555576,-73.7788453933175,-73.7789746580202,-73.7791283407998,-73.7791849535611,-73.7792490976238,-73.7792811613131,-73.7793605954026,-73.7793939859842,-73.779423257967,-73.7795158643185,-73.779803757318,-73.7798595971842,-73.7799294545596,-73.7800882602327,-73.7801490325092,-73.780222860699,-73.7803102103622,-73.7803723678392,-73.780430361019,-73.7804844957085,-73.780552843795,-73.7805745281378,-73.7806436790899,-73.7806760403791,-73.7807538436898,-73.7808460279726,-73.7808693602992,-73.7809744729335,-73.7810298398042,-73.7810878441754,-73.7811486577806,-73.7812120801139,-73.7813575552339,-73.7814224355464,-73.7814852544962,-73.7816108106415,-73.7816837036495,-73.7817862234493,-73.7819089013723,-73.7820622614738,-73.7821135175353,-73.7821445463118,-73.7821835138885,-73.7822239170207,-73.782280547659,-73.7823401597319,-73.7824060179701,-73.782435146331,-73.7824633144626,-73.7825273784381,-73.7825569715206,-73.7827088491648,-73.7827734160816,-73.7828896186919,-73.782976023243,-73.7831056626425,-73.7833072213585,-73.7835006341401,-73.7837005396172,-73.7838100709539,-73.783936364383,-73.7840617124232,-73.7843854309992,-73.7845331104849,-73.7846525807335,-73.7847462481341,-73.7848477643946,-73.7849135108061,-73.784977187227,-73.7850591964947,-73.7851338231642,-73.7851713614314,-73.7852423673775,-73.7853758781869,-73.7855107314078,-73.7856309549134,-73.7857754579471,-73.7860206318108,-73.7861075182459,-73.786305552171,-73.7863918267206,-73.7864590557343,-73.7865341968225,-73.7866094161771,-73.7867059439455,-73.7868420628936,-73.7869250441059,-73.7870888125184,-73.7872068784151,-73.787379868144,-73.7875018580917,-73.7876837071575,-73.7881827053927,-73.7884229506115,-73.7884468737857,-73.7884747250358,-73.7884974260264,-73.7885370655059,-73.7885747750771,-73.7885889478971,-73.7886029845987,-73.7887840687313,-73.7888753880713,-73.7889828399614,-73.7890132588202,-73.789033888718,-73.7890759082711,-73.7891046960101,-73.7891269092375,-73.7891773570223,-73.7892302471116,-73.7892622845117,-73.7892958256229,-73.7893257053347,-73.7893439307521,-73.789362568615,-73.7894147079357,-73.7894506559179,-73.7894798745313,-73.7895379175189,-73.789574374153,-73.789597540443,-73.7896353589655,-73.7896837943696,-73.7897171820514,-73.7897582480165,-73.7898370482927,-73.7898946942647,-73.7898973453772,-73.7899629857301,-73.7900968573425,-73.7901522964178,-73.7903045519528,-73.7904000181013,-73.7905036026947,-73.7905760397098,-73.7906377095661,-73.7908504407698,-73.7908897973144,-73.7909227572484,-73.7910062424917,-73.7910444711486,-73.7910683611977,-73.7910981537638,-73.791125078394,-73.7911566803919,-73.7912973635828,-73.7913129180354,-73.7913416079647,-73.7913636989535,-73.7914000875515,-73.7914367698291,-73.79149786042,-73.7915620434272,-73.7916899036627,-73.7917473801005,-73.7919010532294,-73.7920076246444,-73.792035648733,-73.7921324254116,-73.7922231385969,-73.7923499485337,-73.7923844341414,-73.7924361215058,-73.7924847681318,-73.7925652381903,-73.7926626301392,-73.7927987495687,-73.7928648371179,-73.7929913885341,-73.7930756194957,-73.7931398158928,-73.7932002357979,-73.7932635837203,-73.7933297029792,-73.7933904964615,-73.7934516292134,-73.7935482656398,-73.793570727759,-73.7935935705154,-73.7936577315187,-73.7938439968573,-73.793872977428,-73.7939325270546,-73.7939651190306,-73.793991479355,-73.7940230372449,-73.7940523988242,-73.7940909861896,-73.7941151928484,-73.794138868673,-73.7941961492664,-73.7942292413025,-73.794287964405,-73.7944372928238,-73.7944949080757,-73.7945452753695,-73.7946074805166,-73.7946349620627,-73.7947904419421,-73.7948223804684,-73.7948447307448,-73.7948987541468,-73.7949288977165,-73.7949614463643,-73.7949916076328,-73.79505176112,-73.7950855165588,-73.7951152309989,-73.7951447968193,-73.7951733882475,-73.7953414089138,-73.7953728468819,-73.7954074287576,-73.795461110873,-73.7955013913427,-73.795548781146,-73.7955628148623,-73.7956593036498,-73.7957028017023,-73.7958285165154,-73.7958573004336,-73.7959194716695,-73.7959653530456,-73.7959881443897,-73.7960314370951,-73.7960556458447,-73.7960898079884,-73.7962065767829,-73.7962747899976,-73.7963024188204,-73.7963791097559,-73.7964669488896,-73.7964860089067,-73.7965521461359,-73.7966197337288,-73.7966536584246,-73.7967152789521,-73.7967459289054,-73.7967683564383,-73.7968256422762,-73.7968584115798,-73.7988154278793,-73.7989335956124,-73.7990820019513,-73.7992838155623,-73.7994917499321,-73.799636422621,-73.7996884641193,-73.7997408464199,-73.8000758959528,-73.8001457731877,-73.8001786234689,-73.8002199783446,-73.8002427421712,-73.8002604834812,-73.8002832014546,-73.8003589338419,-73.8004151898698,-73.8004901074986,-73.8006127394599,-73.8010307495096,-73.8010864980952,-73.8011438173505,-73.8012192305872,-73.8013378598142,-73.8014298135063,-73.8015584265056,-73.8016831456915,-73.8017620375705,-73.8018290732302,-73.8018892078897,-73.8019436671182,-73.8020170223033,-73.8022078128539,-73.802395208754,-73.8025125330306,-73.8026254505703,-73.8028306065251,-73.803003800609,-73.8031945745431,-73.8032577124328,-73.8033420660217,-73.8034500614328,-73.8034659098168,-73.8034951700862,-73.803522420111,-73.8035604372237,-73.8036110593587,-73.8036656026521,-73.80372119406,-73.8040618147755,-73.804219960799,-73.8043391501074,-73.8044483389779,-73.8046143179246,-73.8047686092367,-73.8048589283969,-73.8049447918958,-73.8050679254237,-73.8053499679569,-73.8054111404047,-73.8055911843674,-73.805842873413,-73.8059533578926,-73.8061163776582,-73.8061330857886,-73.8061897844841,-73.8062405242,-73.8063423784615,-73.8065000606491,-73.8066264314693,-73.8067135572971,-73.8067919334671,-73.8068624556928,-73.8069011318664,-73.8069418477372,-73.8069821201509,-73.8071253610337,-73.8071574045431,-73.8073975350409,-73.8076235015205,-73.8076563296824,-73.8077685992577,-73.8079918289513,-73.8080744350623,-73.8084070543619,-73.8084563040846,-73.8085988348496,-73.8086410181414,-73.8087208996346,-73.8087484757663,-73.8088307340771,-73.8088866328773,-73.808937059005,-73.8089824305324,-73.8090342132292,-73.809085210797,-73.8091350984664,-73.8091835555701,-73.8092311400266,-73.8093367953087,-73.8093850292278,-73.8094260992189,-73.8095242320035,-73.8096214309178,-73.8113248181527,-73.8121675037541,-73.8126959584454,-73.8132037635681,-73.8134180922384,-73.8135244872756,-73.8136458227654,-73.8139880142518,-73.814172599328,-73.8142538945914,-73.8147648592321,-73.8150806139137,-73.8153380974139,-73.8156344990164,-73.8157674640157,-73.8158590610476,-73.8158884067921,-73.8161552532741,-73.8165273466956,-73.8165543899187,-73.8168458293745,-73.8170259565131,-73.8173079593227,-73.8176010349307,-73.8182086104205,-73.8183818984172,-73.8188697177708,-73.8189563226585,-73.8191796746251,-73.8192881203056,-73.8194032518933,-73.8196443060656,-73.8203660882111,-73.8204826006866,-73.8205019869832,-73.8213416508988,-73.8219491633867,-73.8221413670357,-73.8222275124401,-73.8222899149419,-73.8224218594525,-73.8226489797346,-73.8232023358939,-73.8232113022061,-73.8237248749445,-73.8239755669983,-73.8241917004781,-73.8243611823079,-73.8245996868573,-73.8247370190074,-73.8249590583429,-73.825169768084,-73.8256246940647,-73.8262248546286,-73.826702994793,-73.8268713901215,-73.8271737888498,-73.8275561640453,-73.8279881906269,-73.8283754442816,-73.8286859709955,-73.8287828989676,-73.8291106634537,-73.8292744991743,-73.829566375492,-73.8296197413151,-73.8296794193301,-73.8297337397023,-73.8299028492068,-73.8300269998087,-73.8301726281433,-73.8303228220148,-73.8304817879112,-73.8306608340285,-73.8309007727715,-73.8310650223513,-73.8312479629121,-73.8314609333145,-73.8316260137541,-73.8318035587194,-73.8320353896951,-73.8321972446242,-73.8322688248143,-73.83269598986,-73.832927886451,-73.83304274012,-73.8333885590582,-73.8336543297874,-73.8338692317218,-73.8340874013797,-73.8345027419369,-73.8345585968093,-73.8346778103372,-73.8351513108083,-73.8355666504531,-73.8358494901401,-73.8359869560413,-73.8360537805542,-73.8362462605398,-73.8363228487878,-73.8364104564329,-73.8370385268039,-73.8371082947657,-73.8376569816259,-73.8377849130498,-73.8380093591484,-73.8382587796084,-73.838430490748,-73.8386147788838,-73.8388827526752,-73.8396176277056,-73.8404382143134,-73.8413829783017,-73.8420693890224,-73.8428890667108,-73.8437835907519,-73.8445146032435,-73.8452690026788,-73.8461575520935,-73.8462251592388,-73.8469948732578,-73.8477692494442,-73.8487785018451,-73.8488682478324,-73.848972805261,-73.8490205802636,-73.849071393455,-73.8491372324166,-73.8492518652192,-73.8493536535546,-73.8494048377902,-73.8494932823789,-73.8495788121833,-73.8496952947906,-73.8497869345559,-73.8499533063608,-73.8502482143468,-73.8503876633552,-73.8505346292565,-73.8507129196377,-73.8508548297974,-73.851102174303,-73.8511958562786,-73.8512814136079,-73.851538384838,-73.8516807185696,-73.851769220989,-73.8518407838807,-73.8522020239955,-73.852741626957,-73.8531210285016,-73.8533220785222,-73.8535752547943,-73.853811604805,-73.8538460536592,-73.8539655657709,-73.8540958517921,-73.8542330612708,-73.8544210818527,-73.8547170129156,-73.8548782791352,-73.8549337132964,-73.8549907600988,-73.8550557024824,-73.8552407924824,-73.8555103843256,-73.8557459904333,-73.8558507224794,-73.8559676296702,-73.8561220243743,-73.8562449554623,-73.8564986702892,-73.8567072094262,-73.8569010507821,-73.8569802438667,-73.857203306723,-73.8573299488912,-73.8573928819669,-73.8576797555545,-73.8577508747852,-73.8577792908101,-73.8579171148118,-73.8582711741329,-73.8585268428976,-73.8590931899924,-73.8592271825486,-73.8594265760655,-73.8595035986372,-73.8595781385289,-73.8596885630464,-73.8597721614938,-73.859858291967,-73.8600415300239,-73.8602227671123,-73.8611623268848,-73.8620296557441,-73.8621459219614,-73.8622638852911,-73.8623900679746,-73.8625528602915,-73.862659276752,-73.8628329077533,-73.8628689221141,-73.8630876752875,-73.8631693027943,-73.8643096948521,-73.8653428508825,-73.8644663293313,-73.8645417611105,-73.8652255543476,-73.8663383636396,-73.8666835996215,-73.8645724530018,-73.8644930291127,-73.8636113295238,-73.863347400685,-73.8639426787596,-73.863966420578,-73.8639920973905,-73.8628036192697,-73.8628830195682,-73.8606003068899,-73.8598447069816,-73.8590886206757,-73.8583384434615,-73.8575846505752,-73.8568386972949,-73.8560729980588,-73.8553224461964,-73.8545602042591,-73.8538168195638,-73.8530554958512,-73.8521897684036,-73.8513471682044,-73.8504438514919,-73.8493066719294,-73.848610535383,-73.8481963055694,-73.8472584177387,-73.8462064241177,-73.845205663448,-73.8450567062853,-73.8441571217811,-73.8432082793878,-73.8423397955226,-73.8422501040417,-73.8412996912381,-73.8403332529745,-73.8393538589904,-73.839297372671,-73.8392635074896,-73.8392228477812,-73.8391754977889,-73.8391215789155,-73.8390612294114,-73.8390451016021,-73.8390249136953,-73.8389915656087,-73.8389516141697,-73.8389056328709,-73.8388542817674,-73.8388176228653,-73.8387791566487,-73.838678890979,-73.8387065246959,-73.8386806185434,-73.8386100993355,-73.8385389160848,-73.8385530645124,-73.8384821624093,-73.8384688321752,-73.8383021878468,-73.8382892920665,-73.8381910924731,-73.838192191301,-73.8374901884451,-73.8364970217597,-73.8364949295982,-73.8358408009742,-73.8312278529533,-73.8312292409178,-73.8311587238917,-73.8303593489067,-73.8299592711194,-73.8296454626666,-73.8292334489553,-73.8292234822476,-73.8292169926744,-73.8285247126134,-73.8285047385715,-73.8284669830419,-73.8284487596066,-73.828360206096,-73.8282763680679,-73.8282624181623,-73.8282444250125,-73.8282222177512,-73.8281953619332,-73.8281790456803,-73.8281722606212,-73.8281343961027,-73.8280889160727,-73.8280365364045,-73.8279780815809,-73.8279144717167,-73.8278467080748,-73.8266883898116,-73.8252488270677,-73.8249565289294,-73.824764278751,-73.8247762097872,-73.8247709930178,-73.8248133390712,-73.8248011662345,-73.824757080911,-73.824754474264,-73.8247435228989,-73.8232615725833,-73.8232074342624,-73.8231555877069,-73.8231070458407,-73.8230692648603,-73.8230200267494,-73.8229800138885,-73.8229368863152,-73.8228937850445,-73.8228631130527,-73.822786689047,-73.8227107489774,-73.8226430351847,-73.822567334678,-73.8224621233094,-73.8219942197646,-73.8214597199177,-73.8211617779836,-73.8203976503682,-73.8200329907414,-73.8196865863467,-73.8193468654137,-73.8192974302651,-73.8192343077767,-73.819188294669,-73.8191291636316,-73.8188372236462,-73.8187683998721,-73.8186974637358,-73.8186248236584,-73.8185504807194,-73.818474640706,-73.8183750322358,-73.8182786497709,-73.8181858720216,-73.8180970635371,-73.8180125732726,-73.8180018490604,-73.8179129262765,-73.8174158614744,-73.8174659356762,-73.8175896298833,-73.8176380045065,-73.8176233043948,-73.8176076196293,-73.8175326558044,-73.8175020858069,-73.8175122091399,-73.8175102165584,-73.8174204510318,-73.8173679813753,-73.8172188618417,-73.8172070656516,-73.8171659084728,-73.8171296961493,-73.8170817895315,-73.8170029878008,-73.8169155826916,-73.8168295109653,-73.8167888816139,-73.8167419758236,-73.8166919117708,-73.8166264962132,-73.8165927177596,-73.8165790238481,-73.8165385947025,-73.8165043381431,-73.8164729403146,-73.8164436434684,-73.8164191611934,-73.8163966008142,-73.8163602721315,-73.8163180949921,-73.8162965440299,-73.8162760181166,-73.8162594080286,-73.8162442386483,-73.8161570622004,-73.8160561876223,-73.8160022608795,-73.8159662667934,-73.8159410310229,-73.8158930711572,-73.8158452300022,-73.8158245545225,-73.8152695546929,-73.8152483237509,-73.8152132029782,-73.8151896591905,-73.8151660850608,-73.8151326830001,-73.8150834910298,-73.8150441897244,-73.8150034353037,-73.8149690845178,-73.8149239291514,-73.8148817258155,-73.8148440346032,-73.8148439398328,-73.8147478467246,-73.8147006746172,-73.8145941810194,-73.8145502492725,-73.8145187951351,-73.8144810726057,-73.8144475463125,-73.8144171703352,-73.8143826220818,-73.8143512145648,-73.8143261088947,-73.8142969662041,-73.8142606969067,-73.8142198680356,-73.8141821591738,-73.814143401544,-73.8140931002458,-73.8140580316417,-73.8140218278381,-73.8139050466203,-73.813815761945,-73.8137648345344,-73.8137014404197,-73.8136322141083,-73.8132567156643,-73.8135885661264,-73.8135540503611,-73.8132347443274,-73.8131299166972,-73.81305738293,-73.8129855091913,-73.8129022555729,-73.8128145263996,-73.812743211537,-73.8126240479293,-73.8125870576233,-73.8125462283178,-73.81249376357,-73.8124432708426,-73.8123889387478,-73.8123384959686,-73.812285022248,-73.8122433822537,-73.8121986762638,-73.8121436008147,-73.8120411019058,-73.8120099856872,-73.8119428948392,-73.8118339786603,-73.8117034483635,-73.8115734824099,-73.8115130318271,-73.811512540257,-73.811534730991,-73.8115671565894,-73.8115043696877,-73.811531746912,-73.8115165521837,-73.8115285843874,-73.8115605130938,-73.8115742035826,-73.8115619165812,-73.8115268934752,-73.8114942358587,-73.8114802571172,-73.8114732723097,-73.8114791622641,-73.8114662890849,-73.8114355727511,-73.8114296825845,-73.8113986824522,-73.811361371914,-73.8113346362317,-73.8111701953094,-73.8110076658511,-73.8109453471328,-73.8109341676148,-73.81089019539,-73.8108799583513,-73.8109089030711,-73.8108211633678,-73.8108247654627,-73.810817918745,-73.8108302359726,-73.8108380702301,-73.8108604007184,-73.8108838661633,-73.8108923594219,-73.8109501895273,-73.810957477226,-73.8109542267109,-73.8110976969202,-73.8111001194159,-73.8111074220722,-73.8111163673838,-73.8112592980945,-73.8113859315203,-73.8113870702491,-73.8113796839661,-73.8113924992214,-73.8114017970392,-73.8114075122716,-73.8113765804719,-73.8113792293374,-73.8110728702105,-73.8110606009221,-73.8110474038037,-73.8110282125315,-73.8110962413686,-73.8110999785652,-73.8111653984806,-73.811172868368,-73.8112192932798,-73.8112267315564,-73.8113738393581,-73.8113733128964,-73.8112937793125,-73.8112820253955,-73.811216827485,-73.8112055726808,-73.8111116956165,-73.8110895808892,-73.8110174352588,-73.811004389328,-73.8109224362891,-73.8109101676165,-73.8107572930819,-73.8107497491333,-73.8107891995388,-73.8108252396764,-73.81083602322,-73.8108598323715,-73.8113734725556,-73.8113582931579,-73.811239589383,-73.8112428839083,-73.8111754936314,-73.8111776446745,-73.8109789214421,-73.8109756520525,-73.8109532105481,-73.8109636902661,-73.810939658946,-73.8109150217089,-73.8109087864633,-73.810895853667,-73.8108930338688,-73.8108763285783,-73.8108740898203,-73.8108581422785,-73.8108551338251,-73.8108383617101,-73.8108356597853,-73.810816376923,-73.8108198408849,-73.8108053790442,-73.8107946476628,-73.8107922582464,-73.8101949249412,-73.8101761082247,-73.8101578941834,-73.8101390994171,-73.8101219805962,-73.8100678962784,-73.810014907832,-73.8099640966475,-73.8099414286419,-73.8098992991335,-73.8100392058451,-73.8099979237101,-73.8099835757124,-73.8099034030014,-73.8097783184952,-73.8097313839371,-73.8097638049883,-73.8098026628822,-73.8098074971652,-73.8097874359227,-73.8097859880762,-73.8097431944498,-73.8097098243639,-73.8096309557386,-73.8094866574489,-73.8094858102198,-73.8095145350583,-73.8097012886361,-73.8096167937437,-73.8096119637886,-73.8095917049308,-73.8095898385533,-73.8095721006429,-73.8095581604757,-73.8095538021073,-73.8095374918283,-73.8095233376035,-73.8095171653244,-73.8095116207863,-73.8095067153687,-73.8095024721709,-73.8094884480668,-73.8094760391201,-73.8094663948579,-73.8094462888367,-73.8094405771248,-73.8094348784064,-73.8094220756306,-73.8094074210146,-73.8093761543141,-73.8093619281383,-73.8093537655731,-73.8093456591739,-73.8093415865927,-73.8093374765284,-73.8093333320529,-73.8093291377375,-73.8093179701062,-73.8093061602151,-73.8092538289376,-73.8092408596565,-73.8092288034227,-73.8091972679537,-73.8091740764194,-73.8091536556731,-73.8091444221856,-73.8091357345838,-73.8091019425454,-73.8090714359296,-73.8090436597833,-73.8090184143208,-73.8089578698147,-73.8089361547233,-73.8086203099057,-73.8085176824943,-73.8084403865846,-73.8083211112164,-73.8083043238702,-73.8082752105754,-73.8082641747994,-73.8082083398358,-73.8080442864003,-73.8080010094564,-73.8079628467709,-73.8079377517549,-73.8079118946978,-73.8078847693022,-73.8078548153492,-73.8078075543128,-73.8077016007437,-73.8076726584841,-73.8076392750054,-73.8075126476875,-73.8074620891305,-73.8074476664377,-73.8074326337307,-73.8073713829503,-73.8073551585958,-73.8073392344806,-73.8073105486676,-73.8072407707133,-73.8072239206979,-73.8072094453461,-73.8071904947152,-73.8071445318128,-73.8071181939623,-73.8070439215281,-73.806935265059,-73.8069276464443,-73.806919805812,-73.8068952243259,-73.8068854411235,-73.8068745674638,-73.8068691055078,-73.8068635462754,-73.8068566755333,-73.8068494128863,-73.8068332882184,-73.8068175348623,-73.8067978804537,-73.8067951303792,-73.806782892937,-73.8067782254105,-73.8067674014694,-73.8067576888595,-73.8067296310454,-73.8067030747429,-73.8066791187746,-73.8066558684716,-73.8066457174899,-73.8066363829002,-73.8066116663649,-73.80653538284,-73.8064807915795,-73.8064583813962,-73.8064068640558,-73.8063847506684,-73.8062985938723,-73.8062313542192,-73.8062069425962,-73.8061677979958,-73.8061477452574,-73.8060992120514,-73.8060778488096,-73.8060616359398,-73.8060451469741,-73.8060280745985,-73.8060056788432,-73.8059907250284,-73.8059775708135,-73.8059669094546,-73.8059664847337,-73.8059577052284,-73.8059467693256,-73.8059384130959,-73.8059327059409,-73.8059297171214,-73.8059295278248,-73.8059315506507,-73.8059308668098,-73.805920459081,-73.8059225448708,-73.8059221663672,-73.8059180687328,-73.8059115670643,-73.8059055108292,-73.8058985417752,-73.805885365269,-73.8058798126856,-73.8058708561291,-73.8058589305565,-73.8058447658739,-73.8058235929902,-73.8057962565507,-73.8057916393013,-73.8057886198244,-73.805787164011,-73.8057872479926,-73.8057919964335,-73.8057944217929,-73.8057957869246,-73.8057975470499,-73.8058010784831,-73.8058020445565,-73.8058006675253,-73.8057959201392,-73.8057924686732,-73.8057874034244,-73.8057866993956,-73.8057857228517,-73.8057844629664,-73.8057829320769,-73.8057811156266,-73.8057790283904,-73.805774082933,-73.8057680280221,-73.8057658317025,-73.8057611205177,-73.8057582490905,-73.8057494764338,-73.8057462699809,-73.8057411784421,-73.8057319238076,-73.8057277039301,-73.8057239902314,-73.8057207123187,-73.8057179076314,-73.8057155739989,-73.8057118049866,-73.8057085772221,-73.8057037371199,-73.8057010641304,-73.8057005600859,-73.8057074836612,-73.8057072285902,-73.8057089537327,-73.8057176172876,-73.8057172583089,-73.8057125726178,-73.8057126872344,-73.8057244849798,-73.8057325340218,-73.805735769157,-73.8057524326577,-73.805796627857,-73.8058091059092,-73.805819383108,-73.8058278727264,-73.8058298721608,-73.8058295575768,-73.8058254830985,-73.8058258987926,-73.8058297920273,-73.8058296759713,-73.8058294472539,-73.8058290062943,-73.8058283530706,-73.805827498184,-73.8058251525943,-73.8058220153474,-73.8058180508081,-73.8058134261236,-73.8058083061022,-73.8058030209249,-73.8057893724461,-73.805774473459,-73.8057582806731,-73.8057405542968,-73.8057136358894,-73.8056865089,-73.805659377144,-73.8056324863024,-73.8055281962189,-73.8054088970474,-73.8053539429433,-73.8053356177451,-73.8052793589079,-73.8052548137537,-73.8052337200615,-73.805226303595,-73.805170273113,-73.8050996235615,-73.8050354593906,-73.8048838352251,-73.8048057500453,-73.8047640005419,-73.8047198345267,-73.8047099440855,-73.8046985518073,-73.8046504640141,-73.8046323226646,-73.8045569465275,-73.804486692137,-73.8043618478531,-73.8043598772317,-73.8043582605543,-73.8043544708549,-73.8043491339722,-73.8043395424288,-73.8043349630686,-73.8043287434159,-73.8043197954531,-73.8043112128626,-73.8043033350806,-73.8042964725334,-73.8042826319766,-73.8042754408589,-73.8042704176469,-73.8042601839782,-73.8042522990738,-73.8042302179291,-73.8042232077471,-73.8042183860353,-73.8042035855463,-73.8041900343423,-73.8041721853263,-73.8041674172753,-73.8041644553091,-73.8041633132051,-73.8041631404541,-73.8041628266146,-73.8041638930988,-73.8041641010062,-73.8041644050227,-73.8041656910304,-73.8041759660216,-73.8041781344897,-73.8041826989722,-73.8041875828177,-73.804214580921,-73.8042795701326,-73.8043084328775,-73.804384213697,-73.8043997140324,-73.8044200993903,-73.8045001695339,-73.8045379209857,-73.8046248357911,-73.8046427733935,-73.8048157370953,-73.8049176489052,-73.8049622709197,-73.8050855195805,-73.8051145098672,-73.8051456189249,-73.8052717469567,-73.8053289395636,-73.8053506291013,-73.805384624982,-73.8055111407731,-73.8055632480704,-73.8056217394383,-73.8057471099598,-73.8057986894484,-73.8060005116205,-73.8060695215005,-73.8062101515529,-73.8062578030197,-73.8063070618051,-73.8063457467224,-73.8065032406336,-73.8066925594288,-73.8068854113191,-73.8070123817497,-73.8070393480081,-73.8070641006151,-73.8070873148306,-73.8071091778122,-73.8071106788903,-73.8071121679707,-73.8071136459387,-73.807115099629,-73.8071180212119,-73.8071209793608,-73.8071248033486,-73.8071367067789,-73.8071398203772,-73.807142731447,-73.8071454169848,-73.8071480889948,-73.8071494372201,-73.807150783622,-73.8071521549827,-73.8071535361947,-73.8072010271591,-73.807249149261,-73.8072955829944,-73.8073083788579,-73.8073138652304,-73.8073188559165,-73.8073424062987,-73.8073742767043,-73.8074259544479,-73.8074711916921,-73.8075572303775,-73.8076132403634,-73.8076563667241,-73.8077299740505,-73.8077389278919,-73.8077494426448,-73.8077926642891,-73.8078100225382,-73.807818704742,-73.8078261114324,-73.8078324056671,-73.8078376351767,-73.807872573458,-73.8079206176391,-73.8079317441324,-73.8079550762015,-73.8079698341611,-73.8080228385053,-73.8080233209092,-73.8080468868397,-73.8080298569269,-73.8080032432997,-73.8080017115997,-73.8079806519221,-73.8079500072572,-73.8079360095193,-73.807930518742,-73.8079131605389,-73.8078992259711,-73.8078935856535,-73.8078888447485,-73.8078578695703,-73.8078523654731,-73.8078293982909,-73.8078178254229,-73.8078154016989,-73.8078135430893,-73.8078114283107,-73.8078123432358,-73.8078117766477,-73.8078097264279,-73.8078019702853,-73.8078008377103,-73.8078008364147,-73.8078009000118,-73.8078013175028,-73.807802065519,-73.807803158096,-73.8078045682064,-73.8078084406312,-73.8078137442954,-73.8078259480735,-73.807860982239,-73.8078695303084,-73.8078729592569,-73.8078758819428,-73.8078802606058,-73.8078843403118,-73.8079005997489,-73.8079067677401,-73.8079101839036,-73.8079138844162,-73.8079165032094,-73.8079195590629,-73.807923075636,-73.807927124301,-73.8079558547774,-73.8079609549831,-73.807965158055,-73.8079692635874,-73.80797095039,-73.8079724243866,-73.8079736847035,-73.807974732409,-73.8079755668743,-73.8079761891423,-73.8079772167454,-73.8079776888493,-73.8079775709935,-73.807976875983,-73.8079756502689,-73.8079748443761,-73.8079739069839,-73.8079728640739,-73.8079716804627,-73.8079703913589,-73.8079689953969,-73.8079518380457,-73.8079434099204,-73.80793410536,-73.8079279595898,-73.8079078718621,-73.8079029086525,-73.8078985583725,-73.8078967490705,-73.8078950812499,-73.8078935309296,-73.8078921097546,-73.8078908184093,-73.8078896562396,-73.8078877096955,-73.8078862798637,-73.807885344917,-73.8078848952586,-73.8078867136453,-73.8078945980635,-73.8078968800484,-73.8078991925387,-73.8078991894356,-73.8078983733737,-73.8078969444498,-73.8078948917658,-73.8078936234557,-73.8078921897236,-73.8078505328061,-73.807793194557,-73.8077811482982,-73.807769735337,-73.8077586688829,-73.807745389028,-73.8077433924723,-73.8077419489601,-73.8077396192272,-73.8077381603167,-73.807736946683,-73.8077354266016,-73.8077335651411,-73.807731362488,-73.8077271593775,-73.8077218826639,-73.8077002280937,-73.8076957091585,-73.8076919223534,-73.8076233989075,-73.807617069061,-73.8076094758698,-73.8075760811617,-73.8075693266216,-73.8075635997752,-73.8075524122248,-73.8075422604232,-73.8075333816046,-73.8075260013777,-73.8075207697932,-73.8075118723957,-73.8075084494049,-73.8075043788189,-73.8074714995829,-73.8074431545673,-73.8074409350218,-73.8074392216072,-73.8074372573181,-73.8074372269084,-73.8074391152413,-73.8074492911166,-73.8074539012208,-73.80745487381,-73.8074548417072,-73.8074538319263,-73.807452021434,-73.8074518182131,-73.8074467372451,-73.80743943495,-73.8074299835035,-73.807418560294,-73.8074044327884,-73.8073697400663,-73.8073618002792,-73.8073551262956,-73.8073377315496,-73.8073231033996,-73.8073111085183,-73.8073017121054,-73.8072748256239,-73.8072350228185,-73.8072075022499,-73.8072008117164,-73.8071915799664,-73.8071526100705,-73.8071386534145,-73.8071360094415,-73.8071337534931,-73.807130300019,-73.8071251204731,-73.807123624807,-73.807121694728,-73.8071186667323,-73.8071168523098,-73.8071148013988,-73.8071125395203,-73.8071100296756,-73.8071072851061,-73.807104280916,-73.8070903758527,-73.8070851030105,-73.8070549471339,-73.8070394235704,-73.8069884135475,-73.8069661988633,-73.8069331300076,-73.8069296389983,-73.8069263358728,-73.8069201389114,-73.8069046800572,-73.8068988944607,-73.8068925570574,-73.8068891372887,-73.8068854937296,-73.8068676245046,-73.8068465712728,-73.8067738800473,-73.8067386987996,-73.8066664881076,-73.8066537510151,-73.8066110043121,-73.8065507210964,-73.8064869686682,-73.8064184116768,-73.8064094377694,-73.8063864892023,-73.8063750569061,-73.806340581036,-73.8062655672259,-73.8062371798229,-73.8061825899357,-73.8061359053204,-73.8060932797368,-73.8060707485363,-73.8060600346756,-73.8060503394423,-73.8060414980739,-73.8060334728027,-73.8059985508769,-73.8059373439847,-73.8059138139574,-73.8058658810606,-73.8058464787959,-73.8058365222658,-73.8058263210968,-73.8057872076558,-73.8057782673558,-73.8057694539029,-73.8057100234558,-73.8056496334049,-73.8055497007919,-73.8054762836834,-73.8054677536999,-73.8054590623744,-73.8054261393057,-73.8054186734747,-73.805411263936,-73.8054098235536,-73.8054083249751,-73.8054067541915,-73.8054051241401,-73.8054016385437,-73.8053977974455,-73.8053904898673,-73.805373600516,-73.8053695561165,-73.8053660093875,-73.8053626310233,-73.8053610705089,-73.8053595824727,-73.8053581783465,-73.8053568321417,-73.8053555584185,-73.8053543433257,-73.8053532710783,-73.8053522809923,-73.8053505733875,-73.8053491979305,-73.8053481180436,-73.8053469403968,-73.8053454530823,-73.805343897395,-73.8053427577652,-73.8053413568612,-73.8053396727592,-73.805337680215,-73.8053116685343,-73.805280246086,-73.8052182297303,-73.8051781968835,-73.8051716208852,-73.8051532833495,-73.8051450197632,-73.8051096501325,-73.8050581169697,-73.8050152839805,-73.8049656481798,-73.8049061943788,-73.8048529847726,-73.8048366440257,-73.8048029493544,-73.8047884602155,-73.8047320298805,-73.80470909685,-73.8046720500015,-73.8046404689901,-73.8046390783568,-73.8046379488596,-73.804637055003,-73.8046363974447,-73.8046359887683,-73.8046358166099,-73.8046361698617,-73.8046371246011,-73.8046387318362,-73.804647727226,-73.8046492393239,-73.8046499239592,-73.804651670683,-73.8046508646082,-73.8046493902595,-73.8046447447299,-73.8046440840434,-73.8046422699629,-73.8046402292846,-73.8046286347278,-73.804615019518,-73.8045662681747,-73.8045479793407,-73.8045174924761,-73.8045088825894,-73.8045017005284,-73.8044922971972,-73.8044832994395,-73.8044613670889,-73.8044384837417,-73.8044280122767,-73.8043701215671,-73.8043181642543,-73.8043085496715,-73.8042860016215,-73.8042607906553,-73.8042366284674,-73.8042150584782,-73.8041764670525,-73.8041305412957,-73.8041145995467,-73.8041029811837,-73.8040922448784,-73.8040648136579,-73.8040421517149,-73.804037359591,-73.8040350912004,-73.8040272236804,-73.8040146236064,-73.8040119133164,-73.8040095680511,-73.8040088328599,-73.8040101581872,-73.804011029603,-73.8040128584826,-73.8040262523603,-73.8040285923953,-73.8040295097963,-73.8040297259894,-73.8040297893551,-73.8040260826685,-73.8040270202503,-73.8040292918989,-73.8040378938237,-73.8040390333897,-73.8040404794084,-73.8040422325956,-73.8040442922591,-73.8040493568505,-73.8040557666853,-73.804069739706,-73.80410356479,-73.8041107408925,-73.8041163335099,-73.8041188892231,-73.8041210309394,-73.804122771481,-73.8041241233457,-73.8041246456697,-73.8041250852489,-73.8041256686378,-73.8041258636516,-73.8041256801527,-73.8040594464771,-73.8040526559568,-73.8040305590591,-73.8040050565269,-73.8039497457627,-73.8039274447978,-73.8039054527673,-73.8038976576568,-73.8038881252933,-73.8038457614602,-73.8038374819496,-73.8038305837226,-73.8037856886147,-73.8037827885688,-73.8037792143373,-73.8037660594503,-73.8037613521424,-73.803757202167,-73.8037555643536,-73.8037541986329,-73.8037525980292,-73.8037513067392,-73.8037503456633,-73.8037496908454,-73.80374931853,-73.8037501874515,-73.8037544643681,-73.803768275084,-73.8037694632817,-73.803771159512,-73.8037761261888,-73.80379981216,-73.8038039236563,-73.8038067687813,-73.8038079904051,-73.8038087764684,-73.8038091120762,-73.8038091265698,-73.803809022312,-73.80380873854,-73.8038081147173,-73.8038072989343,-73.8038062726808,-73.8038050334719,-73.8038031795577,-73.8037992719999,-73.8037932984863,-73.8037881636288,-73.8037811633883,-73.8037706664657,-73.8037420406955,-73.8037093167072,-73.8036977265247,-73.8036916381217,-73.8036863541989,-73.8036817751246,-73.8036797285224,-73.8036778584029,-73.8036392644939,-73.8036173945544,-73.8032849675575,-73.8030752367355,-73.803058378551,-73.8030519011422,-73.8030401917982,-73.8030315399936,-73.8030213018703,-73.8029817877793,-73.8029750456643,-73.8029548781226,-73.8029477319339,-73.8027636457429,-73.8024384629031,-73.8024922804006,-73.8024928535665,-73.8023773535742,-73.802496439409,-73.8025096508728,-73.8026241357364,-73.8026339447477,-73.802707141008,-73.8027174182248,-73.8027942917372,-73.8028072764099,-73.802883221117,-73.8028967158741,-73.802971829839,-73.8029847575388,-73.8030596018978,-73.8030702500824,-73.8031419734312,-73.8031167250184,-73.8031350344072,-73.8031654946492,-73.8031574006414,-73.8031808219089,-73.8031661682019,-73.8031427534747,-73.8030545898815,-73.8030419110999,-73.8029452783461,-73.8029340017686,-73.8028496327875,-73.8028385380615,-73.8027617005865,-73.8027494141389,-73.8026700892783,-73.8026587768739,-73.8025130428299,-73.8025683760107,-73.8027275047449,-73.8027372309565,-73.8027947332231,-73.8028986136941,-73.8029404434122,-73.8032396774976,-73.8032202745917,-73.80324253171,-73.8032879389302,-73.8032577544878,-73.8032402429578,-73.8028197246812,-73.8028282488544,-73.8027220186608,-73.8027163447746,-73.8026044285099,-73.8026072763416,-73.8027064061843,-73.8027098385907,-73.802577409159,-73.8025887550429,-73.8023366308645,-73.8023451384566,-73.802773703339,-73.8027768156754,-73.803042157154,-73.8030977681141,-73.8030954378941,-73.8031185189868,-73.8031857440442,-73.8032276900642,-73.8034328702208,-73.8034714992942,-73.8034177410977,-73.8034401704145,-73.8035089697621,-73.8034862093512,-73.8034839799894,-73.8034819069426,-73.8031967536496,-73.8033503136884,-73.8033775430383,-73.8036551931336,-73.8037245426739,-73.8037100833306,-73.8036516708072,-73.8035939706668,-73.8035844496438,-73.8035231503071,-73.8035166544639,-73.803454489603,-73.8034462656881,-73.803384680362,-73.8033610256466,-73.8033448974511,-73.803200106232,-73.8032030344505,-73.8033835099471,-73.8033847234932,-73.8032037365532,-73.8032070440724,-73.803390973279,-73.8033906168834,-73.8032080174898,-73.8032149425126,-73.8033130680304,-73.8033138483864,-73.8033513711173,-73.80335292789,-73.8033666530119,-73.8033776892123,-73.8033941019406,-73.8034511252999,-73.8035142189567,-73.8035262195315,-73.8035936244204,-73.8036053845055,-73.8036398118251,-73.8036718113493,-73.803683189993,-73.8037544068126,-73.8037652168307,-73.8038351219794,-73.8038606987119,-73.8038950700674,-73.8039084226472,-73.8036772320261,-73.8036515862444,-73.8033144341284,-73.8033145372922,-73.8033288308293,-73.8034268388653,-73.8034979216473,-73.8035400150352,-73.8035713534222,-73.8035853412165,-73.8035984043636,-73.8036229402663,-73.803646332867,-73.8036672269746,-73.8036846869572,-73.8042790905691,-73.8042810356017,-73.80429363816,-73.8042997353915,-73.8043289484842,-73.8043980426707,-73.8044951992737,-73.8045703785287,-73.8045935361572,-73.8046780050839,-73.8046929794539,-73.8047062309421,-73.8047180211976,-73.8047313730931,-73.8047336704688,-73.8047346019019,-73.8047352339766,-73.8047509769877,-73.8047727031318,-73.8047786380937,-73.8048620246606,-73.8048646264693,-73.8048756521491,-73.8049411714637,-73.8050845877184,-73.8051118547991,-73.8050845720959,-73.8050548122763,-73.8050209804731,-73.8050089049317,-73.8049695753335,-73.8049331456871,-73.8048457887006,-73.8047651550102,-73.8047507602645,-73.8047298146243,-73.8047295994338,-73.8047276131902,-73.8047238899268,-73.8047184934407,-73.8047111222788,-73.8047021456855,-73.8046917334407,-73.8046801857531,-73.8046680129044,-73.8046666771496,-73.8046446977662,-73.8046218826123,-73.8045988652576,-73.8045813826406,-73.8045629843407,-73.8045447587701,-73.8045136349039,-73.8044956172173,-73.8044850959095,-73.8044775652443,-73.8044641439562,-73.804456363208,-73.8044443126962,-73.8044391036016,-73.8044358272786,-73.8044294025663,-73.8044241688907,-73.8044208568388,-73.8044185705422,-73.8044058013584,-73.8043898349654,-73.8043786608781,-73.8043626712017,-73.8043582202066,-73.8043511808183,-73.8043484398127,-73.804339144611,-73.8043240410534,-73.8043128269554,-73.8043079185093,-73.8042995249811,-73.8042945239897,-73.8042900591187,-73.8042792490305,-73.8042729430723,-73.8042623830588,-73.8042467054019,-73.8042403595177,-73.8042336086575,-73.8042319004906,-73.804232071142,-73.8042326047063,-73.8042280644481,-73.80421769771,-73.8042096695066,-73.8042031128831,-73.8041946397759,-73.8041847304748,-73.8041708939004,-73.8041571879698,-73.8041443434791,-73.8041254397978,-73.8041112370033,-73.8040995661049,-73.8040864946157,-73.8040748242987,-73.804065864218,-73.8040572241792,-73.8040474877828,-73.8040355441548,-73.8039803724711,-73.8039558191452,-73.803933389224,-73.8039207554161,-73.8039188096421,-73.8039144548259,-73.8039063758998,-73.8038984136394,-73.8038885977693,-73.8038868501403,-73.803889644632,-73.8038827364594,-73.8038764705576,-73.803867620225,-73.8038612609307,-73.8038565878293,-73.8038524106045,-73.8038486884557,-73.8038496424974,-73.8038518221497,-73.8038559380057,-73.8038574653963,-73.8038574800898,-73.8038533160152,-73.803845703724,-73.8038406287842,-73.8038196698298,-73.803811548787,-73.8038059751034,-73.8038009355491,-73.8037928278715,-73.8037825924671,-73.8037699011112,-73.8037115119719,-73.8037071492459,-73.8036929430565,-73.8036922136416,-73.803687515903,-73.8036833262452,-73.8036848304803,-73.8036859928002,-73.8036813879555,-73.803678969971,-73.8036717091367,-73.803663626871,-73.8036569822586,-73.8036522706829,-73.8036495681198,-73.8036472836056,-73.803646108043,-73.803644569707,-73.8036402368263,-73.8036313822986,-73.803624543705,-73.8036153244924,-73.8036036134328,-73.8035935508251,-73.8035807586773,-73.8035750381026,-73.803574534761,-73.803577822687,-73.8035806711834,-73.8035755308634,-73.8035706363435,-73.8035657807396,-73.8035585485595,-73.8035491366611,-73.803542007747,-73.8035320458803,-73.8035270441308,-73.8035228300447,-73.8035191472182,-73.8035166526327,-73.8035141738963,-73.8035109099911,-73.8034961580369,-73.8034941773744,-73.8034852992407,-73.8034546343587,-73.8034480956327,-73.8034457717393,-73.8034474712559,-73.8034467924196,-73.8034403331465,-73.8034310351829,-73.803424156912,-73.8034140762217,-73.803408423074,-73.803399662623,-73.803395578385,-73.8033940241133,-73.8033968594041,-73.8034038301535,-73.8034148257163,-73.803430453415,-73.8034332099969,-73.8034309246571,-73.8034235253518,-73.8034162397086,-73.8033997274699,-73.8033935514456,-73.8033890618124,-73.8033894019296,-73.8033861010748,-73.8033792722391,-73.8033723521624,-73.8033583074262,-73.803346463504,-73.8033378983732,-73.803326306063,-73.8033139433168,-73.8032981861802,-73.8032848447032,-73.8032637333819,-73.8032437358512,-73.8032035817504,-73.8031923426801,-73.8031661048614,-73.8031321779268,-73.8031240841912,-73.8031138631919,-73.8031016684857,-73.8030862005719,-73.8030700782973,-73.8030566575119,-73.8030434844951,-73.8030272996374,-73.8030172458892,-73.8030114906755,-73.8030061519271,-73.8030019122912,-73.8029943552855,-73.8029794332575,-73.8029572142476,-73.8029215526802,-73.8028920730259,-73.8028644300694,-73.8028347431551,-73.8028005997593,-73.8027053205335,-73.8026711679349,-73.8026566290449,-73.8026299053836,-73.8025709047583,-73.8024237167254,-73.8023584177934,-73.8023353424498,-73.8022786652259,-73.8022009589097,-73.8021928925362,-73.8021825643873,-73.8021606627623,-73.8021505817731,-73.8020943658779,-73.8020758667759,-73.8020276932853,-73.8020081995983,-73.8019868089979,-73.8019634990348,-73.8019382565773,-73.8018888492348,-73.8017657381599,-73.8017459668847,-73.8016880898675,-73.8016709268018,-73.8016564394445,-73.8016258342872,-73.8015461702358,-73.8014952442383,-73.8014721360703,-73.8013636035114,-73.8012541249121,-73.8012457249838,-73.8012349066239,-73.8010228888697,-73.8009486786282,-73.8009515525456,-73.8009108345036,-73.8008907853468,-73.800903273469,-73.8008930699797,-73.8008959696432,-73.800909005672,-73.8009150062396,-73.8008828551433,-73.8008768544129,-73.8008864632642,-73.800883415491,-73.8008705531318,-73.8008591679292,-73.8008229985189,-73.800779844078,-73.8007765470762,-73.8005651750557,-73.8005680203956,-73.8004952637198,-73.8005098546784,-73.800473792278,-73.8004672985563,-73.8004623404319,-73.8004513186147,-73.7999735317719,-73.7991845737638,-73.7991747811967,-73.7991604000904,-73.799167248752,-73.7991914897089,-73.7991969082538,-73.7991884260765,-73.7991385330341,-73.7991287764231,-73.7991226568794,-73.799145662173,-73.7991402419668,-73.7987884785068,-73.7986882098963,-73.7986541239533,-73.7986153163312,-73.7985726259757,-73.7985269757667,-73.7984793525683,-73.7984307858949,-73.7983823256563,-73.7983103379164,-73.798239957451,-73.7981719578763,-73.79810708664,-73.798112292869,-73.7978224823471,-73.797692351605,-73.797691327587,-73.7967910721176,-73.7967695166345,-73.7966082635941,-73.795673528029,-73.7956175698666,-73.7956183311845,-73.7955431570437,-73.7955463762113,-73.7954650486308,-73.7954635354575,-73.7953136029396,-73.7951933365679,-73.7950706855062,-73.7949463231563,-73.7948209323137,-73.7946965786432,-73.7945726155057,-73.7944497074562,-73.7943285133949,-73.7942096830347,-73.7940938534191,-73.7939816455075,-73.7938736608467,-73.7937704783464,-73.7936726511759,-73.7935807037988,-73.7935507760372,-73.7935146064042,-73.7934810987182,-73.7934683867041,-73.7934556766613,-73.7934305472589,-73.7934111560434,-73.7933850952171,-73.7933771789457,-73.7933589884056,-73.7933467509403,-73.7933364278478,-73.793318700187,-73.7933090173635,-73.793288720303,-73.7932575043313,-73.7931880396646,-73.7931646655147,-73.7931429340669,-73.7931225829606,-73.793099378261,-73.7930382805068,-73.7930249515367,-73.7929807564197,-73.7929117056841,-73.7928935997975,-73.7928735976404,-73.7928527225943,-73.7928429975396,-73.7928116886489,-73.7928032076438,-73.7927810968592,-73.7927699088344,-73.7927533213037,-73.7927405671694,-73.7927337029168,-73.792700953607,-73.7926648576839,-73.7926316641495,-73.7926222969637,-73.7926168585718,-73.7926107654925,-73.7925944145181,-73.7925834746533,-73.7925569931663,-73.7925360671186,-73.7925226651951,-73.7925059866605,-73.7924852612345,-73.7924555036574,-73.7924271518793,-73.79237327688,-73.7923539600404,-73.7923312154815,-73.7922853503261,-73.7922827714383,-73.7922657716274,-73.7922592636278,-73.7922405718276,-73.7922106548691,-73.7921933396592,-73.7921944799588,-73.7921914181468,-73.7921585715851,-73.7921386295015,-73.7921277147092,-73.7921047376719,-73.7920897214341,-73.7920797111125,-73.7920573871568,-73.7920509391275,-73.7920444880444,-73.79203842626,-73.7920287313629,-73.7919295519147,-73.7919121295448,-73.7918851237614,-73.7918529428479,-73.7918217197696,-73.7917972572013,-73.7917657054879,-73.7917454240327,-73.7917164527138,-73.7916903680145,-73.7916613854426,-73.7915883001475,-73.7915731719632,-73.7915397141203,-73.7915088581264,-73.7914722359877,-73.7914369098574,-73.7914160390717,-73.7913810225653,-73.7913466386936,-73.7913103431702,-73.7911864029795,-73.7911572061776,-73.7911138651035,-73.7910772577322,-73.7910441947503,-73.7910137128061,-73.7909819561306,-73.7909543765338,-73.790935468952,-73.790915603707,-73.7908995881797,-73.7908835948385,-73.7908685492465,-73.7908438381044,-73.7908207176112,-73.7907882651043,-73.7907586811506,-73.7907352280725,-73.790716966453,-73.7907035318837,-73.7906965034167,-73.7906836880164,-73.7906692427191,-73.7906473796139,-73.790619071618,-73.790587533814,-73.7905621049419,-73.790533774302,-73.7905083331263,-73.7904783747976,-73.7904513119695,-73.7904313508711,-73.7904023906965,-73.7903753719711,-73.7903512679409,-73.7903258777467,-73.7902979275357,-73.7902731941662,-73.7902535354717,-73.7900856055522,-73.7899967100026,-73.7899745412193,-73.7899563722886,-73.7899380759102,-73.7899063146254,-73.7898484642283,-73.7897954822662,-73.7897448728765,-73.7896960621875,-73.7896069544902,-73.7894838818015,-73.7893978251341,-73.7893319475014,-73.7892425201111,-73.7890704438684,-73.789009458113,-73.7889563064054,-73.78888814041,-73.7888504259262,-73.7888110804187,-73.7887485465497,-73.7886516879372,-73.7885725312445,-73.7885138732602,-73.7884615894142,-73.7884166111997,-73.7883637129931,-73.7883209790586,-73.7882753009593,-73.7882449333417,-73.7882060757601,-73.7881659468652,-73.7881387977423,-73.7881071188405,-73.7880772395231,-73.7880391201626,-73.7879775151098,-73.7879414299902,-73.7878951385265,-73.7878557488172,-73.78782163298,-73.7877898051664,-73.7877675696257,-73.7877455020878,-73.7877317168954,-73.7876963929195,-73.7876675503317,-73.7876185479178,-73.7875744781259,-73.7875258350769,-73.7874744175514,-73.7874307935248,-73.7873799470256,-73.7873419561138,-73.7873011909474,-73.7872738515927,-73.7866389736401,-73.7865033564862,-73.7863533281182,-73.7863048594403,-73.7863035495189,-73.7863143879221,-73.7863147341152,-73.786288106149,-73.7862564906196,-73.786222019579,-73.7861688184279,-73.7861663259701,-73.7861685512481,-73.7861788404122,-73.7862012062298,-73.7862438955323,-73.7862680434144,-73.7862878110694,-73.7863401978098,-73.7863887825273,-73.786433052821,-73.7864725417949,-73.786506832982,-73.7864669327872,-73.7865898380064,-73.7866255384318,-73.7867663078374,-73.7869028449409,-73.7870349471747,-73.7871624185536,-73.7871653344155,-73.7871783373919,-73.7871946425311,-73.7872105628667,-73.7872196023105,-73.7872315131196,-73.7872404000163,-73.7872499848116,-73.7872642149558,-73.7872707028803,-73.7872801037317,-73.7872917208995,-73.7873046490466,-73.7873185051615,-73.7873331555073,-73.7873433950961,-73.7873523026375,-73.787369421518,-73.7873806111207,-73.7873949512222,-73.787411557863,-73.787419305299,-73.7874305807554,-73.7874425385077,-73.7874551094421,-73.7874670875912,-73.7874757442994,-73.7874882483236,-73.7875001640694,-73.7875120146221,-73.7875218531503,-73.7875350645556,-73.7875462616966,-73.7875533365676,-73.7875656642408,-73.7875745143792,-73.7875871421951,-73.7875967182246,-73.787608738241,-73.787619759469,-73.7876304315415,-73.7876409470177,-73.7876496402184,-73.7876635101433,-73.787674487666,-73.7876890281427,-73.7878897161628,-73.7879299419281,-73.7880022705269,-73.7880715504991,-73.7883548397444,-73.7885000751371,-73.7886253668246,-73.7887606156777,-73.788867634427,-73.7889851576997,-73.7890885296823,-73.7891327861542,-73.7891882823172,-73.7892185045605,-73.7892363084508,-73.7892492449865,-73.7892640497442,-73.7892707943896,-73.7892835779178,-73.7893041864962,-73.7893596539239,-73.7893949388122,-73.7894626969611,-73.7895163751022,-73.7895346213068,-73.7895411493868,-73.7895472142273,-73.7895598347106,-73.7895775107852,-73.7896023117367,-73.7896263534454,-73.7896548567956,-73.7896761591639,-73.7897009861483,-73.7897507006724,-73.7897654061276,-73.7897729885864,-73.7897809614911,-73.7898007583233,-73.7898060265517,-73.789834827163,-73.7898751129413,-73.7898888938198,-73.7899094388818,-73.7899264353794,-73.7899485203325,-73.7899803860388,-73.7899962291786,-73.7900135066705,-73.790031717236,-73.7900513483697,-73.7901327142548,-73.7901696602697,-73.7902020808062,-73.7902361037268,-73.79027662468,-73.7902948023629,-73.7902994278082,-73.7903216472611,-73.7903337897945,-73.7903331460656,-73.7903316801715,-73.7903286861662,-73.790324031546,-73.7903193947578,-73.7903188560546,-73.7903225617514,-73.7903318742783,-73.7903468528613,-73.790366016532,-73.7903763055393,-73.7903822598154,-73.7903863152123,-73.7903915766893,-73.7903991652915,-73.790404266575,-73.7904104026113,-73.7904280266431,-73.7906703956822,-73.7906700708712,-73.7906855465806,-73.7907050891696,-73.7907248095526,-73.790748366004,-73.790769130237,-73.7908028575046,-73.7908157361601,-73.7908262552015,-73.7908491687664,-73.7908683006209,-73.7908921856888,-73.7909050151035,-73.7909172441526,-73.7909235331473,-73.7909341538619,-73.7909410097242,-73.7909458655937,-73.7909554625929,-73.7909751427851,-73.7909880828085,-73.7910219604496,-73.7910539033581,-73.7910884876079,-73.7911151854087,-73.7911356674641,-73.7911464705988,-73.7911475859171,-73.7911551320733,-73.7911863897345,-73.7911978807079,-73.7912017846163,-73.7911858287903,-73.7911851804753,-73.7911907436826,-73.7912079055316,-73.7912346532275,-73.7912407100585,-73.7912362994862,-73.7912336473191,-73.791234462734,-73.7912427216696,-73.7911979613538,-73.7911864750222,-73.7911689483703,-73.7911487218813,-73.7911291996959,-73.7911168945722,-73.7911020403909,-73.7910884796504,-73.7910731432714,-73.7910499107331,-73.7910363039858,-73.7910243296004,-73.7910113624891,-73.7909842485782,-73.7909692473285,-73.790966707189,-73.7909572578378,-73.7909463476073,-73.7909374325161,-73.7909314225108,-73.7909335690196,-73.7909344978793,-73.7909512824529,-73.7909708474101,-73.7909953727564,-73.7910189277161,-73.7910329684625,-73.7910361749239,-73.7910251567506,-73.7910179542064,-73.7909986060776,-73.790989544224,-73.7909693173788,-73.7909584162255,-73.7909468894716,-73.7909366075871,-73.7909187092029,-73.7909114925756,-73.7909026737873,-73.7908867246645,-73.7908752071509,-73.7908629237989,-73.7908450723663,-73.7908313582243,-73.7908005846623,-73.790776405498,-73.7907540710101,-73.7907277927604,-73.790706785304,-73.790690262347,-73.7906824848061,-73.7906764068957,-73.7906662242759,-73.7906508004343,-73.790595370995,-73.790537973698,-73.7904794061721,-73.7904204823075,-73.7904211709725,-73.7904226974689,-73.7904326101785,-73.7904370931087,-73.7904568408438,-73.7905700419604,-73.7905755240916,-73.7905771347877,-73.7905840345527,-73.7906030136446,-73.7906087854566,-73.7906101249093,-73.7906117467737,-73.7906136229564,-73.790669593295,-73.7906707197992,-73.7907067310185,-73.7907143995217,-73.7908040584739,-73.7908062614169,-73.7905944297404,-73.7905933432614,-73.7906818927781,-73.7906742249609,-73.7906727089734,-73.7906654446477,-73.7906638296013,-73.7906568850775,-73.7906464545827,-73.7906413709643,-73.7906377740856,-73.7906334960354,-73.7906290957677,-73.7906278616241,-73.7906204146483,-73.7906177587278,-73.7906029478242,-73.7906006398132,-73.7905768004642,-73.7905753632351,-73.7905698597283,-73.7905681203157,-73.7905678335643,-73.7905577786379,-73.790552393756,-73.7905506534905,-73.7905385766652,-73.7904253754972,-73.7904067442169,-73.7903193247474,-73.790317123294,-73.7904045494298,-73.7904023510796,-73.7904124362441,-73.7904047210201,-73.790383423134,-73.7903812382011,-73.790380361023,-73.7903789633477,-73.7902957114852,-73.7902128317094,-73.7901526364882,-73.7901608207458,-73.7901496115924,-73.7901577735789,-73.7901656270879,-73.7901696464953,-73.7901714140182,-73.7901809999018,-73.7901827807717,-73.7901922469611,-73.7901994322676,-73.7902038447662,-73.7902056256192,-73.7902152109528,-73.7902169782591,-73.7902205542704,-73.7902245871923,-73.7902273268837,-73.7902358922463,-73.7902374656808,-73.7902461251572,-73.7902483193384,-73.7902559543658,-73.7902576175574,-73.7902660910703,-73.7902676638745,-73.7902761253786,-73.790277686167,-73.7902860465556,-73.7902876193827,-73.7902962872884,-73.7902977561485,-73.790306218388,-73.7903077798403,-73.7903162547623,-73.7904238115948,-73.7904248147227,-73.7902504239903,-73.7902500104928,-73.7901783000132,-73.7901761694431,-73.7902505477276,-73.7902815117736,-73.7902743442816,-73.7901874489295,-73.7901826376013,-73.7901816194572,-73.7901554610442,-73.7901479384387,-73.7901343095825,-73.7901299201232,-73.790138885819,-73.7901311949162,-73.7901199866647,-73.7901134405471,-73.7900656436186,-73.7899470552338,-73.7899064370479,-73.7899006918675,-73.7898665049067,-73.7898580733859,-73.7898614477066,-73.7898685513478,-73.7898958891096,-73.789882432428,-73.7898546191522,-73.789848689118,-73.7898456956044,-73.7897851316378,-73.78978687942,-73.7897897129199,-73.7898230113407,-73.7898106723668,-73.7897798417371,-73.7897768799594,-73.7897751268896,-73.7897550344794,-73.7897390188982,-73.7897220699886,-73.7897062183409,-73.7896931691464,-73.7896832287685,-73.7896766305842,-73.7896735295047,-73.7896873761161,-73.789712057399,-73.7897131719807,-73.7897263182001,-73.7897161994223,-73.7897205263478,-73.7897317337508,-73.7897382529751,-73.7897397518765,-73.7897495934449,-73.7897540268943,-73.7897609444913,-73.7897625399515,-73.7897648496644,-73.7897721865835,-73.7897736974835,-73.7897834381253,-73.7897861123857,-73.7897947695449,-73.7897961927412,-73.7898060323172,-73.7898075338197,-73.7898121644619,-73.7898186767265,-73.7898286167521,-73.7898638656099,-73.789873606484,-73.7899968915851,-73.7899990943909,-73.7896987236082,-73.7896976345842,-73.7898411023289,-73.7898312804325,-73.7898298410845,-73.7898248549577,-73.789817190859,-73.7898081972891,-73.7898027832543,-73.7897966602605,-73.789795118298,-73.7897850116735,-73.789783673211,-73.7897734747287,-73.7897720351663,-73.7897619279267,-73.7897604890378,-73.7897503824781,-73.7897487521083,-73.7897388456272,-73.7897372947137,-73.7897295793705,-73.7897270948089,-73.7897256568068,-73.7897170605382,-73.7897141101677,-73.7896958667114,-73.789705953713,-73.7896982658032,-73.7896859348711,-73.7896750018978,-73.7896743600627,-73.7896738967583,-73.7894603524432,-73.7894247225453,-73.7894137054955,-73.7894024270997,-73.789395143082,-73.7894012876079,-73.789412196829,-73.789424550995,-73.7894248796351,-73.7893838254404,-73.789378105849,-73.7893793632538,-73.7893761707196,-73.7893531151333,-73.7893312441389,-73.789303878552,-73.7892732974538,-73.789243332059,-73.7892099783502,-73.789179593688,-73.7891725602875,-73.7891794570947,-73.7891878799052,-73.7891887719647,-73.7891861188097,-73.7891824428435,-73.7891422717672,-73.7891290465876,-73.7891208484846,-73.7891130666732,-73.789111556091,-73.7891153756189,-73.7891234320429,-73.7891419217049,-73.7891642640376,-73.7891854489019,-73.7892027508169,-73.7892128317459,-73.7892154914681,-73.7892099430009,-73.7891899647149,-73.7891666427371,-73.7891519908476,-73.7891499118313,-73.7891301148115,-73.7891166356462,-73.7891067586143,-73.789111801044,-73.7891242907872,-73.7891381937532,-73.7891208586042,-73.78910870574,-73.7891069625366,-73.7891204101836,-73.789131437422,-73.7891496917163,-73.7891626177448,-73.7891699943219,-73.7891720390863,-73.7891737634738,-73.789176051945,-73.789180286323,-73.7891914011452,-73.7892003477182,-73.7892122341179,-73.7892060925493,-73.7892055857194,-73.7892117672762,-73.7892284112724,-73.7892455441222,-73.7892624984735,-73.7892685809627,-73.7892678668431,-73.7892624390966,-73.7892536247427,-73.789242448287,-73.7892330513694,-73.7892287730828,-73.7892371208607,-73.7892375753388,-73.7892295648954,-73.7892319135429,-73.7892292819758,-73.7892239473968,-73.7892008120086,-73.7891987448845,-73.7892031525298,-73.7892225736615,-73.7892363961816,-73.7892434785241,-73.7892497082822,-73.7892548556676,-73.78925996091,-73.789256389901,-73.7892478733231,-73.7892398755406,-73.7892354817733,-73.7892227264953,-73.7892167419103,-73.789221133766,-73.789220651933,-73.7892201723234,-73.7892122232344,-73.7891979985426,-73.7891863750341,-73.7891708121684,-73.7891588059019,-73.7891597863339,-73.7891561649938,-73.7891494766589,-73.7891427997799,-73.789121077026,-73.7891344157257,-73.7891339679722,-73.7891181658513,-73.7891019586131,-73.7891006666848,-73.7890993875034,-73.7891038727292,-73.7891106751913,-73.7891174789781,-73.7891318136952,-73.7891476540793,-73.7891566416011,-73.7891855414937,-73.7891919992271,-73.7891920747924,-73.7891908024912,-73.789181546432,-73.789165588559,-73.7891392645183,-73.789068291215,-73.7889770366264,-73.7888957602654,-73.7888599973601,-73.7888443043442,-73.7888319992508,-73.7888140832798,-73.7887971601477,-73.7887724106701,-73.7887641558448,-73.7887440656206,-73.788725395427,-73.7887047635189,-73.788675539242,-73.788641326112,-73.7886065203392,-73.7885839443651,-73.788553672118,-73.788536279031,-73.7885237656104,-73.7885112521853,-73.7885033934661,-73.7884923259623,-73.7884676080429,-73.7884287861272,-73.7884162777442,-73.7883667765859,-73.7883404569392,-73.7882884717325,-73.7882618681033,-73.7882207305037,-73.7882101727133,-73.7882037285846,-73.7881912245939,-73.7881752184712,-73.788152404992,-73.7881069308385,-73.788092046576,-73.7880719963165,-73.7880581860509,-73.7880381573555,-73.7880180848383,-73.7880028438394,-73.7879820116462,-73.7879665671928,-73.7879281171125,-73.7879156694131,-73.7878922376782,-73.7878741405196,-73.7878575011757,-73.7878355942092,-73.787823144044,-73.7878055121184,-73.7877821099852,-73.7877505175673,-73.7877420402307,-73.7877234972214,-73.787688750027,-73.7876558291996,-73.7876508593211,-73.7876416287736,-73.7876226435098,-73.7875927894574,-73.7875940545289,-73.7875829233518,-73.7875622124781,-73.7875402762315,-73.7875341081999,-73.7875145728328,-73.7875015625371,-73.7874749475544,-73.7874499362079,-73.7874315790633,-73.7874017448272,-73.7873804101434,-73.7873513612673,-73.7873249254411,-73.7872835079853,-73.7872438594406,-73.7872155073376,-73.7871908785645,-73.7871691922136,-73.7871498336376,-73.7871248229709,-73.7871023122659,-73.7870969554153,-73.78709826804,-73.7870916341217,-73.7870655646415,-73.7870379055408,-73.7870083276577,-73.786976276019,-73.7869689502503,-73.7869763105809,-73.7869836812457,-73.7869925578446,-73.7870014351054,-73.7870244940072,-73.7870231292598,-73.7870000816038,-73.7869489890716,-73.7869325702592,-73.7869214698311,-73.7869087905168,-73.7868933405339,-73.7868726736499,-73.7868579474411,-73.7868453071895,-73.7868197067482,-73.7867957173194,-73.786755568717,-73.7866909007611,-73.7866680027709,-73.7866436747178,-73.7866240946364,-73.7866054013709,-73.7865848097756,-73.7865600366651,-73.7865308681775,-73.7865005057333,-73.7864708424682,-73.7864668747899,-73.7864443347303,-73.7864240087787,-73.7864024409634,-73.7863951501853,-73.7863370006981,-73.7862915727927,-73.7862387337743,-73.7862089397216,-73.7861654642579,-73.7861273913565,-73.7860780055875,-73.7860571543552,-73.7860237486715,-73.7859938159804,-73.7859710976622,-73.785952916435,-73.7859251043757,-73.7858840052671,-73.7858512619777,-73.7858237106097,-73.7857937881344,-73.7860650818484,-73.7860887345345,-73.7861435869864,-73.786105282421,-73.7857800655194,-73.7857780949851,-73.7857532354442,-73.7857381085642,-73.7857236290053,-73.7857045075324,-73.7856889160771,-73.785667785006,-73.7856420527327,-73.7859835911779,-73.7859430373042,-73.7858859624751,-73.7859185896004,-73.7856327637329,-73.7856195462069,-73.7856019073333,-73.7855877434277,-73.7855823694157,-73.7855674227919,-73.7855645516737,-73.7855634439396,-73.7855645941978,-73.7855656827182,-73.7855749330086,-73.7855785274998,-73.7855819807166,-73.7855792154547,-73.7855719756877,-73.7855613555706,-73.7855495634764,-73.7855460940746,-73.7855428191514,-73.7855343231045,-73.7855170322148,-73.7854971608163,-73.7854613810112,-73.7854472113969,-73.7854156187335,-73.7853935808703,-73.7853681979549,-73.7853154869272,-73.7852836875124,-73.7852530155861,-73.7852205056039,-73.7851941978982,-73.78517278166,-73.7851434486737,-73.785083077605,-73.7850542903208,-73.7850259143327,-73.7849977914499,-73.7849630953365,-73.7849423319791,-73.7849161254917,-73.7848895164179,-73.7848794271856,-73.784870586205,-73.7848596458618,-73.7848137197045,-73.7847958299783,-73.7847680111651,-73.7847344434565,-73.7846953711013,-73.7846477296779,-73.7846251666291,-73.7845954585572,-73.7845665117044,-73.7845373715338,-73.7845100311294,-73.784482331704,-73.7844286514026,-73.7843841986464,-73.7843325051658,-73.7842814123419,-73.7842226803892,-73.7841695299335,-73.7841009961771,-73.7840391048712,-73.783988611299,-73.7839415299821,-73.7838926225543,-73.7838511934909,-73.7838288841489,-73.7838034338003,-73.7837618943173,-73.7837361507594,-73.7836449148863,-73.7835952739753,-73.7835567842201,-73.7835207328793,-73.7835056090531,-73.783496099955,-73.7834694517241,-73.7834707910351,-73.7834683209107,-73.7834642786232,-73.78345786484,-73.7834457634087,-73.7834293278847,-73.7834063732484,-73.7833959860442,-73.783373176938,-73.7833712591384,-73.7833643125109,-73.7833576278076,-73.7833419740553,-73.7833245613077,-73.7832898962296,-73.7832485946515,-73.7832283674284,-73.7832098706909,-73.7831727864431,-73.7831510926538,-73.7831366383313,-73.7831321166963,-73.7831333340295,-73.7831398017008,-73.7831363378543,-73.7831280240591,-73.7831343246511,-73.7831474349527,-73.7831644438236,-73.7831847587034,-73.7832043169042,-73.7832266271089,-73.7832554876234,-73.7832755672557,-73.7832931232547,-73.7833257508644,-73.7833504408152,-73.7833734142587,-73.7833911948417,-73.7834554663972,-73.783464517724,-73.7834813827143,-73.7834841772495,-73.7834889069767,-73.7834984466352,-73.7835038373124,-73.7835142760072,-73.7835298312738,-73.7835596861121,-73.7835789038438,-73.7835954136683,-73.7836074928552,-73.7836172851156,-73.7836285544023,-73.7836358804457,-73.7836379238286,-73.7836050067449,-73.7836061735608,-73.78362666255,-73.7836272101498,-73.7836277707412,-73.7836367561347,-73.7836399857607,-73.7836512761346,-73.7836808597858,-73.7837091850993,-73.7837449298421,-73.7837644056854,-73.7837770230479,-73.7838061610844,-73.7838707783725,-73.7838808920015,-73.7838910179407,-73.7838900188497,-73.7838869072532,-73.7839015362119,-73.7839239960653,-73.7839364583798,-73.783947649712,-73.7839567448506,-73.7839498079909,-73.7839304996253,-73.7839324474276,-73.7839173477141,-73.7838997853996,-73.7838741320928,-73.7838537195558,-73.7838278682438,-73.7838091795515,-73.783817659506,-73.7838206219652,-73.7837950718664,-73.7837837951175,-73.783763013599,-73.7837319449242,-73.7837177517298,-73.7837089290262,-73.7836936991152,-73.7836806473876,-73.7836744426421,-73.7836682493245,-73.7836647474121,-73.7836699316424,-73.7836669629241,-73.7836294544504,-73.783600010822,-73.7835707210696,-73.7835581114659,-73.7835540305274,-73.7835161059125,-73.7834908424499,-73.7834718473775,-73.7834436837136,-73.7834011987203,-73.7833842445563,-73.7833796243207,-73.783390776892,-73.783404565302,-73.7834038894106,-73.7833879282281,-73.7833588075524,-73.7833379030228,-73.7833167748501,-73.7833023730231,-73.7832948499736,-73.7832873260464,-73.7832697712842,-73.7832520521986,-73.7832398438957,-73.7832328529062,-73.783251489663,-73.7832529818628,-73.7832415871083,-73.7831973334153,-73.7831920176963,-73.7831765582719,-73.7831555333099,-73.7831108907336,-73.7830700370222,-73.7830364107295,-73.78298147505,-73.782936294463,-73.7829056493192,-73.7828931300396,-73.7828850408962,-73.7828436949065,-73.7828280684702,-73.7828046065296,-73.7827997094917,-73.7827933518074,-73.7827745192135,-73.782746802345,-73.7827395189192,-73.7827382789618,-73.7827129263491,-73.7826813076207,-73.7826512293443,-73.782658215877,-73.7826301268029,-73.7826017357238,-73.7826028332436,-73.7825973507228,-73.7825863267077,-73.7825596690038,-73.7825361714402,-73.7825092276018,-73.7824862661088,-73.782462754185,-73.782378728476,-73.7823312457979,-73.782289479509,-73.7822537477645,-73.7822083011731,-73.7821224360095,-73.7820356078126,-73.7819856188624,-73.7819527253146,-73.7818807560742,-73.7818330655919,-73.7818069998387,-73.7817862029057,-73.7817477411389,-73.78173055396,-73.7816923823054,-73.7816560378077,-73.7816366753603,-73.7816166366388,-73.7815790765107,-73.7815588543154,-73.7815385290055,-73.7815065217414,-73.7814658668752,-73.7814195085451,-73.7813675028103,-73.7813043672219,-73.7812701068719,-73.7810218241902,-73.7809873307123,-73.7804083226788,-73.7802456487958,-73.7794014392239,-73.7792701544495,-73.7788148768506,-73.7786932213697,-73.7785680693995,-73.7782892124283,-73.7779808300086,-73.7776875942565,-73.7773904169832,-73.7772789827485,-73.7771309348388,-73.7770311396954,-73.7769279804783,-73.7768033156276,-73.7766672635363,-73.7765808225963,-73.7764749300841,-73.7763584369479,-73.7762653833009,-73.7761407621011,-73.7759517189499,-73.7758355701068,-73.7754792405511,-73.775458628752,-73.7754380169872,-73.7753952925399,-73.7753516474572,-73.7752644619335,-73.7752225507699,-73.7751464839224,-73.7750522666411,-73.7749233665847,-73.774804178814,-73.7747364041888,-73.7746524564662,-73.7745335984846,-73.7744136021342,-73.7742695710831,-73.774222344114,-73.774202397581,-73.7741722192056,-73.7741289739422,-73.7741294628374,-73.7741336102761,-73.7741657713945,-73.7742226936343,-73.7742705282427,-73.7743300451988,-73.7744255270604,-73.7744590472243,-73.7744908031617,-73.7745119430876,-73.774536482472,-73.7745603378389,-73.7745879556987,-73.774615572462,-73.7746408599633,-73.7746616693476,-73.7746799841397,-73.7747705623471,-73.7747972510297,-73.7748032719371,-73.7748102662827,-73.7748144100892,-73.774813794092,-73.7748068540612,-73.7747976620205,-73.7747533901269,-73.7747078481186,-73.7746963915616,-73.7746808240789,-73.7746621724381,-73.7743970542338,-73.7743766195285,-73.7743499661213,-73.7743274580315,-73.7743090477536,-73.7742943786518,-73.7742808838334,-73.7742628713388,-73.7742470208807,-73.7742332242909,-73.7742173775335,-73.7742162034629,-73.7742224517175,-73.7742301788163,-73.7742466501226,-73.7742553958968,-73.774275482551,-73.7742983432084,-73.7743254148134,-73.7743530758229,-73.7743808559245,-73.7744085040147,-73.7744354815394,-73.7744624597164,-73.7744829412183,-73.7745034345916,-73.7745510986733,-73.7745738638951,-73.7745887960433,-73.7746029459907,-73.7746211805567,-73.7746305995161,-73.7746365753831,-73.7746394828631,-73.7746414676725,-73.7746428084315,-73.7746413131611,-73.7746341578389,-73.7746461190791,-73.7746671127304,-73.7747077747192,-73.774731816024,-73.7747450428037,-73.7747638620594,-73.7747864592519,-73.7748129932109,-73.7748241424827,-73.7748266105824,-73.7748267763498,-73.7748268913157,-73.7748280247368,-73.7748348850182,-73.7748444173143,-73.7748488654648,-73.774888549431,-73.7749387783054,-73.7749733078393,-73.7749945501279,-73.7750448443823,-73.7750548578985,-73.7750648720794,-73.7752385198618,-73.7752604081286,-73.775273855438,-73.7752873148487,-73.7753197220776,-73.7753648170795,-73.7754478651901,-73.7755040744157,-73.7755212729318,-73.7755355553276,-73.7755429767608,-73.7755486543444,-73.7755599152568,-73.7755665331228,-73.7755866554816,-73.7756042828523,-73.7756196532498,-73.7756578534311,-73.7756732624129,-73.7757418841933,-73.7758312167412,-73.7758451335812,-73.7758738665951,-73.7759042150091,-73.7759197459348,-73.7759518582596,-73.7759557535048,-73.7759601473623,-73.7759625339713,-73.7759676184065,-73.7759757557212,-73.7759813765442,-73.7759921865152,-73.7759969268969,-73.7760009693188,-73.7760041734712,-73.7760064560193,-73.7760077215282,-73.7760079876462,-73.7760079934167,-73.7760077496699,-73.7760072470852,-73.7760065079189,-73.7760055083406,-73.77596856303,-73.7759309258108,-73.7757849079212,-73.7757259626911,-73.7757061698236,-73.7756862609702,-73.7756241808282,-73.7755980859069,-73.7755703276481,-73.775537279188,-73.775497508147,-73.7753747121141,-73.7753380915166,-73.7753077039689,-73.7751284973814,-73.7750735213425,-73.7750481477032,-73.7750034302605,-73.7749744561874,-73.7749459848426,-73.7749317720569,-73.7749269655385,-73.7749251969612,-73.7749305572665,-73.7749297739873,-73.7749267509852,-73.7749085545262,-73.7748999578101,-73.7748901347523,-73.7748726840939,-73.7748253320815,-73.7748063126374,-73.7747602813147,-73.774746697421,-73.7747373853523,-73.7747310501998,-73.7747276159847,-73.774727236319,-73.7747299843844,-73.7747366070564,-73.7747373966933,-73.7747344392551,-73.7747275870203,-73.7747173329728,-73.7747019761045,-73.7746890379971,-73.7746774672501,-73.7746353808712,-73.7746213564081,-73.7745900946967,-73.7745455161387,-73.774581662776,-73.7746248915921,-73.7746280384372,-73.7746264711951,-73.774601490718,-73.7745844767564,-73.7746044318293,-73.7746884508707,-73.7747159717678,-73.7747369164851,-73.7747454183045,-73.774761614426,-73.7747766635732,-73.7748136238156,-73.7748276036699,-73.7748326235325,-73.7748341970078,-73.7748393486754,-73.7748487185613,-73.7748809781407,-73.7748923469089,-73.7748978294844,-73.7749033245856,-73.7749099428762,-73.7749128298293,-73.7749119870954,-73.7749072865333,-73.7748935318407,-73.7748793478914,-73.7748757705119,-73.7748780089714,-73.7748854772529,-73.7748982523166,-73.7749081979198,-73.774959228631,-73.7751594209371,-73.7751708454886,-73.7751799020557,-73.7751863599239,-73.7751871126134,-73.7751796890912,-73.775167238019,-73.7751490207891,-73.7751316822032,-73.7751112811993,-73.7750838495279,-73.7750535825599,-73.7750229279642,-73.7749266749063,-73.7748909224301,-73.7748335972117,-73.7747906845147,-73.7747540331857,-73.774723186144,-73.7747034044968,-73.7746942473413,-73.774686620493,-73.7746879896464,-73.7746936385406,-73.7747088967981,-73.7747313243791,-73.7747717855254,-73.7748195950672,-73.7748784844787,-73.7749137389966,-73.7749688835917,-73.7749996977694,-73.7750324888993,-73.7750671424741,-73.7751034085461,-73.7751287159189,-73.7751572923177,-73.7751866276491,-73.7752624903682,-73.7752842172751,-73.7753032105219,-73.7753342615122,-73.7753606262421,-73.7753760831685,-73.7754069631899,-73.7754436715797,-73.775464302981,-73.7754857592531,-73.7755570489848,-73.7755906116768,-73.7756724279463,-73.775701864387,-73.7757776320493,-73.7758547544727,-73.7758814058217,-73.7758950323549,-73.7759050111013,-73.7759111492324,-73.7759224536322,-73.7759330789449,-73.7759499895041,-73.7759888761183,-73.7760034647615,-73.776015579303,-73.7760224377881,-73.7760260132656,-73.7760317130469,-73.7760539176107,-73.7760457410148,-73.7760291118865,-73.7760040156322,-73.7759507985527,-73.7759101547337,-73.775873045942,-73.775845909816,-73.7758341309426,-73.775815341371,-73.7758080456107,-73.7757985266769,-73.7757826511175,-73.7757709527732,-73.7757550251349,-73.7757254638193,-73.7756891989244,-73.7756593617534,-73.7756328573123,-73.775617581733,-73.7756064218183,-73.7755968361678,-73.775588954346,-73.7755829301849,-73.775580610237,-73.775577400486,-73.7755761648485,-73.7755806087654,-73.7755984381216,-73.7756115853643,-73.7756454519545,-73.775688143627,-73.7757259356811,-73.7757748696854,-73.7758674827302,-73.7759005211664,-73.7759384382709,-73.7759763667972,-73.776009330495,-73.7760169963519,-73.7760360741398,-73.7760579355511,-73.7760819764521,-73.7761075111881,-73.7761337708002,-73.7761600683867,-73.7761729009806,-73.7761857439048,-73.776210253479,-73.7762249256439,-73.7762320383498,-73.7762356567533,-73.7762559218365,-73.7762782576726,-73.7763020163646,-73.7763265087415,-73.7763510243501,-73.7763748520634,-73.7763973007084,-73.7764161736535,-73.7764328643378,-73.7764469628807,-73.7764792425499,-73.7765200130459,-73.7765550769751,-73.7765840617402,-73.7766089315068,-73.7766254580248,-73.7766183345058,-73.7766100691768,-73.7766008792761,-73.7765910063424,-73.7765807098661,-73.7765702604701,-73.7765685261341,-73.7765657166576,-73.7765619081382,-73.7765572037342,-73.7765517308695,-73.7765456377832,-73.7765390895136,-73.7765322634285,-73.7765253444203,-73.7765185198988,-73.7765119747142,-73.7765056466178,-73.7764999994705,-73.7764951991214,-73.7764913865499,-73.7764886737259,-73.776487140321,-73.776486831369,-73.776487755943,-73.7764898868892,-73.7764988395903,-73.7765128916559,-73.7765298276125,-73.7765455725766,-73.7765597666235,-73.7766049662665,-73.776635296455,-73.7766545866936,-73.7766704292988,-73.7767055614496,-73.7767285076359,-73.776760028719,-73.776788104551,-73.7768468092238,-73.7768757540789,-73.7769243811837,-73.7769601449935,-73.7769950520968,-73.7770296835684,-73.7773363202505,-73.7773665790593,-73.7774027282068,-73.7774256372645,-73.7774543929934,-73.7774636216476,-73.7774758324206,-73.7774908200474,-73.7775144606171,-73.7775418152792,-73.7775720812795,-73.7776043704285,-73.7776221564483,-73.7776368932982,-73.7776482253428,-73.7776558791139,-73.7776596141803,-73.7776714226793,-73.7776910159334,-73.777705148948,-73.7777214434702,-73.7777598135098,-73.7778030236581,-73.7778506393829,-73.7779072029443,-73.7779666727661,-73.7780288237906,-73.7780398057842,-73.7780527667265,-73.7780673800409,-73.7780832775167,-73.7781000585864,-73.7781173004188,-73.7781345685734,-73.7781514279461,-73.778167453733,-73.7783571476973,-73.7783599726631,-73.7783626180888,-73.7783650051173,-73.7783670625939,-73.7783687291876,-73.7783699552191,-73.7783707041417,-73.7783709536311,-73.7783706962502,-73.7783699396714,-73.7783687064474,-73.7783670333393,-73.7783649702206,-73.7783625785906,-73.778359929741,-73.7781534119905,-73.7781338191578,-73.7781158466103,-73.7780999195865,-73.7780864149263,-73.7780756521549,-73.7780785486613,-73.7780801655535,-73.7780804139131,-73.7780747116826,-73.7780764026766,-73.7780907793121,-73.7781214515369,-73.7781382332651,-73.7781582130951,-73.7781808697831,-73.7782056211708,-73.778218092269,-73.778232035246,-73.778264313816,-73.7783024356024,-73.7783471540577,-73.77836673971,-73.778387748998,-73.778470443297,-73.7785075620664,-73.7787148631821,-73.7788669679823,-73.7789872865962,-73.7791089017109,-73.7791341716549,-73.7791898922575,-73.7792472575935,-73.7793068691868,-73.7793698843602,-73.7794245218081,-73.7794547259279,-73.7795242981462,-73.7795848650449,-73.779684801446,-73.7798346039733,-73.7798687662048,-73.7799029420759,-73.7799342222836,-73.7799675332509,-73.7800023794585,-73.7800740054352,-73.7801090008511,-73.7801721054757,-73.7802566534263,-73.7803490030637,-73.7804206218155,-73.7806940132634,-73.7807226652832,-73.7807398198615,-73.7807327045797,-73.7807552715094,-73.7808108323142,-73.7808707385144,-73.7810107337272,-73.7811035633284,-73.7811662833747,-73.7812121247587,-73.7813164993497,-73.781373089266,-73.7814336708032,-73.7814777422332,-73.7815200374221,-73.7815406375559,-73.7815656000013,-73.7815895719552,-73.7816080155217,-73.7816348873633,-73.7816562208508,-73.7816588472545,-73.7817165759258,-73.7817709603691,-73.7818212474205,-73.7818667406635,-73.7819068100732,-73.7819409007421,-73.781970678528,-73.7819923161412,-73.782002183292,-73.7820080539196,-73.7820096791919,-73.7820113068644,-73.7819913320746,-73.7819360135701,-73.7819055918766,-73.7818940569096,-73.7818778837808,-73.7818572569845,-73.7818322654304,-73.7818086980763,-73.7817826204328,-73.7815901331061,-73.7815169588828,-73.7814955737047,-73.781452291845,-73.7814425498353,-73.7814192749892,-73.7814109233841,-73.7813879004422,-73.7813770762338,-73.781358744408,-73.7813404529393,-73.7813419779861,-73.7813297399813,-73.7811052355601,-73.7809305400691,-73.7806177374446,-73.7805956870741,-73.7805710995562,-73.780544710382,-73.780517308935,-73.7804974998274,-73.7804775376231,-73.7804502641998,-73.780423425436,-73.7803936198751,-73.7803655337064,-73.780236747555,-73.7801833442591,-73.7801674222315,-73.7801521861507,-73.7801472024238,-73.7801441021438,-73.7801503707875,-73.7801598376676,-73.7801711536594,-73.7801706514563,-73.7801684557319,-73.78016314495,-73.7801559413034,-73.7801453745188,-73.780101369887,-73.7800571989178,-73.7800704574468,-73.7800653162024,-73.7797546050558,-73.7797388090499,-73.779726393466,-73.7796936099086,-73.7796758709688,-73.7796746659364,-73.7796707033373,-73.7796438298508,-73.7795796710093,-73.7795467449914,-73.7794434330666,-73.7793717424039,-73.7793174654793,-73.7791549505702,-73.7790664355121,-73.7790436440524,-73.7790241372345,-73.7790133842286,-73.7790039844596,-73.7789826316323,-73.7789814240838,-73.7789828491809,-73.7789868651689,-73.7789933543786,-73.7789955992175,-73.778997480543,-73.7789989475664,-73.7789999606838,-73.7790005083461,-73.7790004994684,-73.7789999343196,-73.7789988300167,-73.7789972200068,-73.7789954518617,-73.7789933799272,-73.7787682530116,-73.7787645216781,-73.7787606800496,-73.7787567977789,-73.7787520538816,-73.7787474862433,-73.7787432209429,-73.7787393757136,-73.7787249640625,-73.7787115417398,-73.7786853537618,-73.778635864188,-73.7786159338297,-73.7786019834655,-73.7785881663149,-73.778581153745,-73.7785575726627,-73.7785490382499,-73.7785367020448,-73.7785327839876,-73.7785281947317,-73.778511792275,-73.7784913626621,-73.7784665661827,-73.7784346674444,-73.7784057432047,-73.7783412281701,-73.7783158865123,-73.7782884472351,-73.7782659814659,-73.7782465406749,-73.7782297316043,-73.7782086178483,-73.7781889408425,-73.7781709394524,-73.7781547647768,-73.7781483232693,-73.7781100087146,-73.7780908391463,-73.7780774758955,-73.7780637666965,-73.7780496400929,-73.7780356746466,-73.7780191579167,-73.7779610831584,-73.7779399558411,-73.7778631025669,-73.7778415644714,-73.7778141444862,-73.7778048908919,-73.777731882595,-73.777677960858,-73.7776240511341,-73.7775206532431,-73.7774733792735,-73.7774217481077,-73.7774017544398,-73.7773860641275,-73.7773723010921,-73.7773694370919,-73.7773692598684,-73.7773518831981,-73.7773147879462,-73.7773095791335,-73.7773027762506,-73.7772951694435,-73.7771985062932,-73.7771861105555,-73.7771499239539,-73.7771302938324,-73.7770644074665,-73.7770366488225,-73.7770194242739,-73.7770096803672,-73.776988133778,-73.776948487075,-73.7769461210137,-73.776934960797,-73.7767847248324,-73.7766202968601,-73.7765703050483,-73.7765223419082,-73.7763539470025,-73.7763535605312,-73.7763498238602,-73.7763177038621,-73.7763000184168,-73.7762764752334,-73.77625982654,-73.7762168976505,-73.776194725683,-73.7761927882602,-73.776180801268,-73.7761805610816,-73.7761791514488,-73.7761739097137,-73.7761173531282,-73.7760881078679,-73.7760444513513,-73.7760194941171,-73.776010275563,-73.7760090075017,-73.7760142074615,-73.776018765608,-73.7760154391343,-73.7760016385097,-73.7759842385834,-73.7759630898688,-73.7759391793611,-73.7759098507734,-73.7758079787677,-73.7757480567016,-73.7756800832039,-73.7756004963302,-73.775564005191,-73.775518829094,-73.7754550132792,-73.775414201013,-73.77538820339,-73.7753614780291,-73.7752933629883,-73.7752703535474,-73.7752479336173,-73.7752271320921,-73.7751114272762,-73.7749720735378,-73.7749703323768,-73.774962827457,-73.7749479605569,-73.7749269236358,-73.7749002070587,-73.7748684335779,-73.7748573876123,-73.7748513303599,-73.7748502038221,-73.774850567165,-73.7748553541094,-73.774874217366,-73.7748855683491,-73.774889149695,-73.7748848802127,-73.7748728567237,-73.7748533518653,-73.7748268079075,-73.7748145402507,-73.7747826966579,-73.7747552020396,-73.7747322207443,-73.7747124274679,-73.774710380376,-73.7747100968006,-73.774710547823,-73.7747117674098,-73.7747161104775,-73.7747324443185,-73.7747421272579,-73.7746165788419,-73.7746198002118,-73.7746039850794,-73.774602113341,-73.7744813396476,-73.7744795424716,-73.7745250442246,-73.7745234216942,-73.7746009641035,-73.7745990882522,-73.7746175548555,-73.7746206296033,-73.7747472472181,-73.7747638109976,-73.7746411337564,-73.7746403362973,-73.7747631317229,-73.7747564130838,-73.774742850219,-73.7747226332927,-73.7746960457577,-73.7746634603805,-73.7746369039563,-73.7746155355151,-73.7745993150756,-73.7745929922277,-73.7745885955269,-73.7745891413379,-73.7745892915135,-73.7745880532147,-73.7745854577044,-73.7745815705105,-73.7745823492838,-73.774580986496,-73.7745775168605,-73.7745720287558,-73.7745646619737,-73.7745556041591,-73.77454508603,-73.7745333755007,-73.7744936815783,-73.7744841416667,-73.7744753467855,-73.7744642715364,-73.7744550908053,-73.7744479822848,-73.7744430835592,-73.7744433360815,-73.7744404207511,-73.7744350246895,-73.7744271660832,-73.7744270542207,-73.7744164398301,-73.7744036670907,-73.774383170801,-73.7743701819589,-73.774358422769,-73.7743125982292,-73.774264382926,-73.77426028244,-73.7742517333228,-73.7742446205755,-73.7742391429198,-73.7742354533944,-73.7742336550798,-73.774233798218,-73.7742358788091,-73.7742398387231,-73.774240773377,-73.7742382063464,-73.7742322025115,-73.7742229136118,-73.774210574411,-73.7741839640219,-73.7741585099613,-73.7741411142352,-73.7741281796942,-73.7741199509688,-73.7741096794315,-73.7741059476383,-73.774108810312,-73.7741182254532,-73.7741340549568,-73.7741521976781,-73.774174539503,-73.7741748866066,-73.7741749494071,-73.7741748800541,-73.7741747284072,-73.7741745061508,-73.7741742123663,-73.7741738473148,-73.7741734116164,-73.7741723160709,-73.7741709121109,-73.7741692254477,-73.7741649638532,-73.7741593427366,-73.7741309482794,-73.7741196706856,-73.7741170975482,-73.7741149036641,-73.7741130859809,-73.774111613702,-73.7741110119897,-73.7741104952388,-73.7741100717373,-73.7741097303399,-73.7741093214268,-73.7741092416664,-73.7741092441625,-73.7741141216439,-73.7741348041224,-73.7741408296947,-73.774141689022,-73.7741409725346,-73.7741432837177,-73.7741478548113,-73.7741524659581,-73.7741645598181,-73.7741690978377,-73.7741776235941,-73.7741842630436,-73.7741844685055,-73.77418439064,-73.7741840179877,-73.774183361402,-73.7741824199523,-73.7741811840228,-73.7741796516043,-73.7741778117704,-73.7741733892158,-73.774167618427,-73.7741399362503,-73.7741338933768,-73.7741290093167,-73.7741242679361,-73.7741223933866,-73.7741208394749,-73.7741196034273,-73.774118687416,-73.7741180661632,-73.7741177643485,-73.7741181516037,-73.7741221367553,-73.7741296941194,-73.7741420534984,-73.7741848215241,-73.7742051864619,-73.774216438465,-73.7742228395082,-73.7742241174657,-73.774224117809,-73.7742238871068,-73.7742233845767,-73.7742226337914,-73.7742216105759,-73.7742203149604,-73.7742187473226,-73.7742147613397,-73.7742102064765,-73.774204492755,-73.7741788709967,-73.7741683752704,-73.7741634428544,-73.7741594217081,-73.7741577364582,-73.7741562635421,-73.7741549909379,-73.7741539210302,-73.7741511855916,-73.7741491015079,-73.7741452223444,-73.7741433073918,-73.7741404090904,-73.7741385878848,-73.7741364808251,-73.7741207006658,-73.7741025824082,-73.7740572556112,-73.7740085544747,-73.773955005461,-73.7739446592211,-73.7739324708674,-73.7738791452571,-73.7738680182633,-73.7738584640533,-73.7738362050705,-73.7738274845809,-73.773814546468,-73.7737933788753,-73.7737724568435,-73.7737443283908,-73.7737253885386,-73.7737122502363,-73.7737101129921,-73.7737014135145,-73.773701499381,-73.7737032456759,-73.7737164894213,-73.7737185847037,-73.7737194943664,-73.7737190124497,-73.7737181027182,-73.773716718878,-73.7737148616424,-73.7737125312387,-73.7737097154169,-73.7736740549994,-73.7736324408321,-73.7735854526163,-73.7735337449119,-73.7734861752828,-73.7734366071366,-73.7733859470436,-73.773335121544,-73.7732994741423,-73.7732644759934,-73.7732309037799,-73.7731995025393,-73.7731709691296,-73.7731459367643,-73.7731266043433,-73.7731110156293,-73.7730994593453,-73.7730685923341,-73.7730657054463,-73.7730624211477,-73.7730546820468,-73.7730455555901,-73.7730352831345,-73.7730240995246,-73.7730125147374,-73.7730010131493,-73.7729900745517,-73.7729637599637,-73.7729089900539,-73.772884735931,-73.7728126360421,-73.7727546987148,-73.7727349407484,-73.7727110926981,-73.7726847399076,-73.7726582898216,-73.7726027468022,-73.7725753381614,-73.7725509940707,-73.7725285984877,-73.7724858575746,-73.7724664120313,-73.772354259212,-73.7722412163707,-73.7721564733628,-73.7721144406273,-73.7720374091887,-73.7720074931362,-73.7719772569679,-73.7719504032425,-73.7719064467118,-73.7717967024464,-73.7717146395753,-73.7716790667001,-73.7716497935027,-73.7716191038552,-73.7715888645479,-73.7715310798177,-73.771457257478,-73.7714139185675,-73.7713070194024,-73.7712040353662,-73.7711982479904,-73.7711865626526,-73.7711735061239,-73.7711593018545,-73.771144195379,-73.7711284962987,-73.7711125298481,-73.7710966632499,-73.7710606579699,-73.7710246126099,-73.770989317324,-73.7709555458236,-73.7709240384159,-73.7708870065648,-73.7708438950676,-73.7707958298513,-73.7707440662131,-73.7706899560367,-73.7706349124871,-73.7706137634609,-73.7705946719453,-73.7705781945336,-73.7705648116065,-73.7705488005553,-73.7705304520297,-73.7705103128427,-73.7704889831711,-73.7704670986693,-73.7704453115262,-73.7703727705842,-73.7702998680936,-73.7702276399188,-73.7701571123436,-73.7700053633165,-73.7698810317214,-73.7698520360133,-73.7698261676794,-73.769814536229,-73.7698027473596,-73.7697781326017,-73.7697565612089,-73.7696987210488,-73.7696670413474,-73.7696127508819,-73.7695961928534,-73.7695624077455,-73.7695477270817,-73.7695316219494,-73.7695142925684,-73.769496069963,-73.7694772510935,-73.7694583652661,-73.7694399101713,-73.7694223815148,-73.7693757367894,-73.7693397084541,-73.7692876349053,-73.7692503863634,-73.7691855550195,-73.7691076923228,-73.76902982862,-73.7689521265002,-73.7688975494072,-73.7687775389514,-73.7687229413012,-73.7686400307123,-73.7685850103498,-73.7685340197086,-73.7684868567326,-73.7684637525859,-73.7684047651013,-73.7683784246502,-73.7683448847491,-73.7682732794675,-73.7682408166579,-73.7681898031738,-73.7681711483723,-73.7681549573632,-73.7681404594938,-73.7681340424152,-73.7681281772844,-73.7681228537632,-73.7681180619348,-73.7681138101507,-73.7681100893987,-73.7680992580518,-73.7680894811585,-73.7680667809275,-73.7680368859177,-73.7680283915836,-73.7680081292507,-73.7680067159131,-73.7680049943448,-73.7680004903718,-73.767979671423,-73.7679754782097,-73.7679721933939,-73.7679503097038,-73.7679398704013,-73.7679366906248,-73.7679351652138,-73.7679350123446,-73.7679352608935,-73.767935922888,-73.7679369873996,-73.7679383588175,-73.7679400618258,-73.7679445341425,-73.7679504365526,-73.767957886713,-73.7679735866159,-73.7680172540108,-73.7680435625351,-73.7681062491693,-73.7681355168275,-73.7681410828387,-73.7681464462807,-73.768156717574,-73.7681667225244,-73.7681943912842,-73.7682047665676,-73.7682101048102,-73.7682156340394,-73.7682399516417,-73.7682654948314,-73.7682916830248,-73.7683180569374,-73.7683969370248,-73.7684315302242,-73.7684641662521,-73.7684852549811,-73.768532806082,-73.7685541300836,-73.7685661520723,-73.7685791509613,-73.7686328786048,-73.7686455934203,-73.7686571889455,-73.7687011962767,-73.7687851600614,-73.7687971144412,-73.7688390328965,-73.7688846983052,-73.768904725491,-73.7688917638077,-73.7689314606459,-73.7689799009703,-73.7690072861183,-73.769016421235,-73.7690229725278,-73.7690308024205,-73.7690398994508,-73.769050274444,-73.7690747424771,-73.7691041118577,-73.7691891784688,-73.769220769943,-73.7692324467041,-73.769251140991,-73.7692560185019,-73.7692609071398,-73.7692658644641,-73.7692709962845,-73.7693026437811,-73.7693092149817,-73.7693153972631,-73.7694155363363,-73.7695869087764,-73.7696131133313,-73.7696740111103,-73.7697007198686,-73.7697177925864,-73.7697357437995,-73.7698000253883,-73.7698282841543,-73.7699323841222,-73.7699761691586,-73.7700155717014,-73.7700517546641,-73.7700731691921,-73.7701176593302,-73.77017682425,-73.7702740886928,-73.7702805383322,-73.7702923541345,-73.770313390883,-73.7703363481647,-73.7703602477494,-73.7703839066796,-73.7704066291054,-73.7704276476877,-73.7704373673667,-73.770446476072,-73.7704683455719,-73.7704900496415,-73.7705120960162,-73.7705552476916,-73.7705745008754,-73.7705963393645,-73.7706179534415,-73.7706448264614,-73.7706645870806,-73.7706956755421,-73.7707250359,-73.7707389480334,-73.7707525239889,-73.7707872052214,-73.7708235249686,-73.7708613191173,-73.7709002697019,-73.7709308647414,-73.770958345169,-73.7709816837218,-73.7710002428972,-73.7710107069038,-73.771020232801,-73.7710367211596,-73.7710501442542,-73.771062452222,-73.7710647110477,-73.7710649791953,-73.7710591233429,-73.7710582818911,-73.7710599715045,-73.7710645532676,-73.7710704277217,-73.7710790878299,-73.7710905684283,-73.7711272010144,-73.7711369003756,-73.7711437557009,-73.77115249541,-73.7711580733787,-73.7711605243634,-73.7711598618174,-73.7711557024036,-73.7711467245463,-73.771135342743,-73.7711058159883,-73.7710939261194,-73.7710867482204,-73.7710843741066,-73.7710871200451,-73.7710955061141,-73.7711062422284,-73.7711141974222,-73.7711191444761,-73.7711349315703,-73.771139054263,-73.7711393089279,-73.7711389131171,-73.7711362158622,-73.771116242608,-73.7711129243112,-73.7711112638116,-73.7711105407235,-73.7711118787778,-73.7711281731824,-73.7711302849931,-73.7711302089683,-73.771125901278,-73.7711195384298,-73.7711110344586,-73.7711003046957,-73.7710528236859,-73.7709351261395,-73.7709123968636,-73.7708673092232,-73.7707373338483,-73.7707424465438,-73.7707528359568,-73.7707790890397,-73.7708264393771,-73.7708473791312,-73.7708419899009,-73.7708391752866,-73.7708047126414,-73.7707808064803,-73.7707438331868,-73.7707122342882,-73.7706886589747,-73.7706518991445,-73.7706175881474,-73.7706016789518,-73.7705831114775,-73.7705459655242,-73.7705035614735,-73.7704453306685,-73.7703974139011,-73.7703444395099,-73.7702754652311,-73.7702646936335,-73.7702328460693,-73.770222117424,-73.7701858827409,-73.7702523641613,-73.7703138937263,-73.7703700294626,-73.7704203681375,-73.7704142933553,-73.7704033885725,-73.770384241361,-73.7703561356167,-73.7703250673407,-73.7702953251842,-73.7702625417431,-73.7702279335524,-73.770183875779,-73.7701706004355,-73.7701643502722,-73.7701612222252,-73.7701627402662,-73.7701637970145,-73.7701654341669,-73.7701690851557,-73.7701742947421,-73.770207126837,-73.7702145953684,-73.7702171841477,-73.7702190307509,-73.770245990085,-73.7702718933096,-73.7702974655561,-73.7703263389662,-73.7703395276677,-73.7703520552946,-73.7703775043774,-73.7704086211374,-73.7704872310977,-73.7704681186036,-73.7704578663427,-73.7704566582725,-73.7704645160881,-73.7704812988314,-73.7705067054186,-73.770540280041,-73.7705601137256,-73.7705710414293,-73.7705727575488,-73.7705652140766,-73.7705486219448,-73.7705234451287,-73.7704903876736,-73.7704439091608,-73.7703928841061,-73.7703377798828,-73.7702791012304,-73.7702173856322,-73.7702052123949,-73.7701935102429,-73.7701826224276,-73.770172868314,-73.7701645340135,-73.770157863991,-73.7701530538945,-73.7701502448164,-73.7701495191543,-73.7701508981946,-73.7701363985747,-73.7701169632823,-73.7700929129469,-73.7700646443358,-73.7700462904006,-73.7700307011422,-73.7700182736651,-73.7700093245348,-73.770004081714,-73.7700026787558,-73.7700051514006,-73.7700114366662,-73.7700213744511,-73.7700347116132,-73.7700534544598,-73.7700645608251,-73.7700678971611,-73.7700634233369,-73.7700511931217,-73.7700313535393,-73.7699802477477,-73.7699364883434,-73.7699003650525,-73.7698721170496,-73.7698519313741,-73.7698399416915,-73.7698362274069,-73.7698408131397,-73.7698536685589,-73.7698747085835,-73.7699037939453,-73.7699417222759,-73.7699721244564,-73.7699948811229,-73.7700099029198,-73.7700171308512,-73.770016536513,-73.7700192048632,-73.7700124964803,-73.769996603896,-73.7699719832565,-73.7699393412306,-73.7698684467777,-73.7698049398178,-73.7697925448899,-73.7697833492917,-73.7697775826455,-73.7697753889509,-73.7697768229888,-73.769781848953,-73.7697903413442,-73.7698020881038,-73.7698221434336,-73.7698347838403,-73.7698397996308,-73.769837107588,-73.7698267523518,-73.7698089056797,-73.7697838635988,-73.7697520414961,-73.7697139672287,-73.7696702723683,-73.7695572036169,-73.7695462775559,-73.7695289067008,-73.7695055801432,-73.7694769546677,-73.7694438362592,-73.7694071574103,-73.7693679508644,-73.769327320538,-73.7692996997087,-73.7692750332574,-73.7692539581123,-73.7692370184699,-73.7692246517427,-73.7692171772643,-73.7692147880433,-73.769217545779,-73.7692253792674,-73.7691968812579,-73.7691745311841,-73.7691589747482,-73.769150661386,-73.7691498312821,-73.7690161421487,-73.7690145502718,-73.7690077725659,-73.7689959692666,-73.7689794194283,-73.7689676857025,-73.7689517238015,-73.7689408198736,-73.768935241167,-73.7689351244157,-73.7689404724877,-73.7689511543139,-73.768968074904,-73.7689880837897,-73.7690007803495,-73.7690369349354,-73.769067345198,-73.7690877634328,-73.769108513693,-73.7691296332793,-73.7691396434007,-73.7691512844112,-73.7691797656083,-73.7692155600952,-73.7692635931377,-73.7693092309743,-73.769417241362,-73.769467226608,-73.7695013422237,-73.7695725764671,-73.7696019995386,-73.7696609094773,-73.7697153102116,-73.769767455525,-73.769818184544,-73.7698283860992,-73.7699543582363,-73.7700832272164,-73.7702147580464,-73.7702279120988,-73.7702419643945,-73.7702565650714,-73.770271350614,-73.7702859529039,-73.7703000083855,-73.7703131671172,-73.7703251014842,-73.7703355143551,-73.7703441685594,-73.7703552824938,-73.7703685468421,-73.77038359244,-73.7704000005493,-73.7704173145114,-73.7704350524574,-73.7704527207183,-73.7704654717885,-73.7704783145403,-73.7704908763245,-73.7705027926446,-73.7705137177332,-73.7705280053082,-73.7705430707806,-73.7705586208209,-73.7705743526655,-73.7705899600105,-73.7706092184396,-73.7706278046754,-73.7706449770005,-73.7706679847179,-73.7707137198034,-73.7707262128041,-73.7707389035453,-73.7707621282576,-73.7707897874985,-73.7708224454607,-73.7708644356954,-73.7709185729139,-73.7709549325996,-73.7709886840332,-73.7710044773681,-73.7710197564061,-73.7710258554322,-73.7710321206811,-73.7710454386448,-73.7710862987222,-73.7711003405786,-73.7711135729814,-73.7711198484272,-73.7711260047928,-73.7711689452322,-73.7711996962333,-73.7712289122568,-73.7712407576605,-73.7712510187967,-73.7712912175345,-73.771361350079,-73.7713897690596,-73.7714934010842,-73.7714937072192,-73.7715855971799,-73.7717273497864,-73.7718187697134,-73.7718465474094,-73.7718466227929,-73.7718616147112,-73.7718746376626,-73.7718864830016,-73.7718914102445,-73.7719008356735,-73.7719074595342,-73.771915720172,-73.7719403210666,-73.7719456365011,-73.7719489116512,-73.7719636565871,-73.77197744828,-73.7719830896072,-73.7719900735787,-73.7720090965038,-73.7720532149167,-73.7721119078782,-73.7721178953008,-73.7721252314717,-73.7721438888505,-73.7721676556579,-73.7721940888671,-73.7721959659049,-73.7722143805513,-73.7722345023452,-73.7722563068642,-73.7722798402918,-73.7723588562621,-73.7725272670121,-73.7726928856985,-73.7728552680339,-73.7730139784155,-73.7730809628462,-73.7731451800079,-73.7732059967312,-73.7732628133769,-73.773315069748,-73.7733622506139,-73.7734038907899,-73.7734056378988,-73.7734052051865,-73.7734033898882,-73.7733955931147,-73.7733822262269,-73.7733613190281,-73.7733244987483,-73.7732362818338,-73.7731987388422,-73.7731621070199,-73.7731307266894,-73.7730494627963,-73.7730196903468,-73.7729567654066,-73.7729327200278,-73.7729113931563,-73.7728959008683,-73.7728849979041,-73.7728785434566,-73.7728784087938,-73.7728786513161,-73.7728792361723,-73.7728801874142,-73.7728815051346,-73.7728831663198,-73.7728875131376,-73.7728932068367,-73.7729000704975,-73.7729078884504,-73.7729163781357,-73.7729341192849,-73.77294255493,-73.7729502808852,-73.7729570214591,-73.7729626868655,-73.7729650810402,-73.7729671797825,-73.7729689586623,-73.7729704298314,-73.7729999267002,-73.7730660145716,-73.773390194967,-73.7734097120092,-73.7734276137358,-73.7734922286161,-73.7735189070819,-73.7735483979781,-73.7735775169173,-73.7736046044434,-73.7736776071414,-73.7737091583369,-73.7737449292238,-73.7737676775313,-73.7737810417912,-73.7737913895167,-73.7737990075748,-73.7738072092963,-73.7738097849536,-73.7738108133512,-73.773808630144,-73.7738088425268,-73.7738110207291,-73.7738153614019,-73.7738241541382,-73.7738472739775,-73.7738549776988,-73.7738859101927,-73.7739108113025,-73.7739170348874,-73.7739207677506,-73.7739239440799,-73.7739278681188,-73.7739326342091,-73.7739382775391,-73.7739422974548,-73.7739443032786,-73.773946309958,-73.7739483166074,-73.7739503249932,-73.7739523458515,-73.7739543558842,-73.7739563775417,-73.7739584015895,-73.773962474421,-73.7739665981219,-73.7739707837436,-73.7739853925256,-73.7740093072807,-73.774017640334,-73.7740527693593,-73.7740809475436,-73.7740928435592,-73.7741180604719,-73.7741312788372,-73.7741318240865,-73.7741325006772,-73.7741333297462,-73.7741343002687,-73.7741354124956,-73.7741366424368,-73.7741380140212,-73.7741394916667,-73.7741428231495,-73.774146520342,-73.7741504518245,-73.7741544656219,-73.7741620523295,-73.7741652598085,-73.7741678993512,-73.7741698891093,-73.7741706310784,-73.7741711939148,-73.7741715932891,-73.7741718023234,-73.774171846797,-73.7741717130818,-73.7741621061536,-73.774148710208,-73.7741315530967,-73.7741041494618,-73.7740920718836,-73.7740568624256,-73.7740487208103,-73.7740432574984,-73.7740393319131,-73.7740369203471,-73.7740348822998,-73.7740325715227,-73.7740142408178,-73.7739930624686,-73.7739849167802,-73.7739773224592,-73.7739579375357,-73.7739345674392,-73.7739013074259,-73.7738578222754,-73.7738373812835,-73.7738168667037,-73.773787622586,-73.7737264630054,-73.7737028302578,-73.7736633960735,-73.7735954581159,-73.7735671661519,-73.7735355781114,-73.7735040805645,-73.7734886203661,-73.7734735653331,-73.7734480434867,-73.7734185874336,-73.7733859797136,-73.7733510865964,-73.7733148350681,-73.7732781882037,-73.7732421195811,-73.7732075874161,-73.7731755091052,-73.7731467368536,-73.7731313094908,-73.7731113261431,-73.7730873833538,-73.7730601958609,-73.7730305752613,-73.7729994057834,-73.7729676178912,-73.7729361605095,-73.7729059726968,-73.7726632282815,-73.7724163451187,-73.7721655972425,-73.7719112629804,-73.7718276217388,-73.7717415670277,-73.7716539380542,-73.7715655893792,-73.7714773825827,-73.7713901778611,-73.7713048256376,-73.7712740381915,-73.7712429610477,-73.771212512495,-73.7711835922482,-73.7711570548636,-73.7711336844883,-73.7711078502824,-73.7710801423635,-73.771051385637,-73.7710224362336,-73.7709941560202,-73.7709673869409,-73.77094292595,-73.7709167839499,-73.770891226052,-73.7708667870581,-73.7708439783572,-73.7708066335683,-73.7707668014505,-73.7707252861052,-73.7706829256141,-73.7706405751209,-73.770389687482,-73.7701981469448,-73.7701060927564,-73.7700690743281,-73.7700278890932,-73.7698588689227,-73.7696506822438,-73.769638491473,-73.7696259961294,-73.7695993851945,-73.7695748126446,-73.769519171471,-73.7694926601112,-73.769469470062,-73.769447594984,-73.7694099738552,-73.7693710945689,-73.7693308513122,-73.7692890181251,-73.7692456321569,-73.7692000070755,-73.7691515868237,-73.7690989290565,-73.7690206896526,-73.7689649625555,-73.7689151321967,-73.7688703711833,-73.7685826847262,-73.7684604444133,-73.768414160334,-73.7683714053908,-73.7683546501778,-73.7683370607492,-73.7683184731142,-73.7682985424985,-73.7682592124146,-73.7681828504966,-73.7681513197119,-73.7681186466552,-73.7680893764376,-73.7680314557676,-73.7678995259225,-73.7678669716792,-73.767837294613,-73.7677876546539,-73.7676654919582,-73.7676317075786,-73.7676013209394,-73.7675607760042,-73.7675453008217,-73.7675186061644,-73.7674275279153,-73.7673763830733,-73.7672634252232,-73.7672137357689,-73.7671592195634,-73.7671025363521,-73.7670437923495,-73.7669830845767,-73.766941573983,-73.7669001998525,-73.7668592577793,-73.7668190315112,-73.7667244910131,-73.7666913977135],"lat":[40.6142546549475,40.614250528622,40.6142574952948,40.6142453039918,40.6142361439421,40.6142421360205,40.614224885274,40.6142036130588,40.6142045337514,40.6141953354384,40.6141700094208,40.6141386617523,40.6141042752257,40.6140709462133,40.6140456693216,40.6140263960341,40.6140061758632,40.6139889404694,40.6139636601905,40.6139464092692,40.6139281757745,40.6139230234654,40.6139280085493,40.6139198330264,40.6138945473034,40.6138843612972,40.6138802103251,40.6138740603499,40.6138587920504,40.6138435270879,40.6138283188937,40.6138162384619,40.6138254551222,40.6138363668487,40.613836283074,40.6138240844563,40.6138090873115,40.6137947686493,40.6137906742758,40.6138020400884,40.6138128617293,40.613828968197,40.6138228315909,40.613809679515,40.6137902463859,40.6137836263883,40.6137711464029,40.6137542026866,40.6137327850024,40.6136875561069,40.6136702620824,40.6136266057618,40.6135891236684,40.6135542522178,40.6135211527106,40.6135066800815,40.6134913551984,40.6134751874932,40.6134581869661,40.6134403424384,40.6134216649265,40.6134021177572,40.6133816554173,40.613376743057,40.6133720504423,40.6133675398106,40.6133631128213,40.6133557911925,40.6133402342546,40.6133319761899,40.61332774576,40.6133233862147,40.6133188443815,40.6133140654055,40.6132617869914,40.6132066746086,40.6131483146396,40.6131326826777,40.6130858957161,40.6129871130944,40.6129566192268,40.6129293621377,40.612899496104,40.6128342651111,40.6128072378575,40.6127387829878,40.6126952986178,40.6126454097806,40.6125785417133,40.6125232714282,40.6125039311417,40.6124829729867,40.6124651067265,40.6124613121306,40.6124572918503,40.6124502317715,40.6124439266565,40.6124383856941,40.6124018566937,40.6123608104617,40.6123555138333,40.6123496421667,40.6123433219919,40.6123367060985,40.612331642577,40.6123262747223,40.612320692978,40.6123150225079,40.6123039657679,40.6122989404012,40.6122944652315,40.6122842705664,40.6122618874141,40.6122511642134,40.6122218307625,40.6122163924828,40.6122108638382,40.6122053132508,40.6121998252518,40.6121866459352,40.6121717772392,40.612118643937,40.6120820889571,40.6120672872795,40.6120599615775,40.6120536236753,40.6120481746112,40.6120457652411,40.6120435617093,40.6120352306105,40.6120268960907,40.6120016362586,40.6119556730472,40.6119236879278,40.6118948471007,40.611869052898,40.6118462420167,40.6118349442105,40.6118248411627,40.6118163281331,40.6118009828992,40.6117733595355,40.6117673604341,40.6117641344149,40.6117608557811,40.6117576885018,40.611756857913,40.6117553920235,40.6117547736676,40.6117536236172,40.6117496290686,40.6117434792075,40.6117227211348,40.6117178886317,40.6117152739261,40.6117148169901,40.6117149355106,40.6117183660715,40.6117187001141,40.6117184590146,40.6117138236624,40.6117075036337,40.6116995468979,40.6116899618647,40.6116813944997,40.6116774269042,40.6116707338989,40.6116677707618,40.6116578269148,40.6116421392387,40.6116086205096,40.6115763920399,40.6115534580457,40.6114885239617,40.6114692958422,40.6114507761387,40.6114329450567,40.6114158140531,40.6114006513107,40.6113871232825,40.6113748404974,40.6113601435825,40.611359206046,40.6118472427577,40.6113597125881,40.6108208649503,40.610184642971,40.6101981228625,40.6100126516049,40.6099710131896,40.6098393441379,40.6091516700545,40.6090313658008,40.6090391864342,40.6091335579802,40.6092153070721,40.6092448025611,40.6093809246084,40.6095575931736,40.6098587915843,40.6100673936647,40.6101829512594,40.6104770050961,40.6108793778468,40.6108157959109,40.6101554576521,40.6101515978711,40.6101490458937,40.6101477386662,40.6101495043606,40.6101542906041,40.6101619554302,40.6101722714894,40.610184932793,40.610199563789,40.6102157305011,40.6102965595015,40.6103098292151,40.6103218705774,40.6103323269459,40.6103408886225,40.610347302026,40.6103609209791,40.6103686383578,40.6103703857339,40.6103661476138,40.6103643636827,40.6103578707655,40.6103516676142,40.6103422610193,40.610338020389,40.6103338957106,40.6103341970906,40.6103382744542,40.6103373484916,40.6103309664967,40.6103192042727,40.6103130486315,40.6103074815299,40.6103033789964,40.610299993031,40.6102973997898,40.610294791589,40.6102926220852,40.6102896386441,40.6102867318697,40.6102848883354,40.6102820985289,40.6102808024862,40.6102827848585,40.6102869456551,40.6102911097495,40.6102950979837,40.6102957746022,40.6102967653235,40.6103045922088,40.6103105340953,40.6103136277577,40.6103133625097,40.6103096268742,40.6103054153466,40.6103033090491,40.6103025707008,40.6103022708074,40.6103024009189,40.6103045903579,40.6103064365432,40.6103048536096,40.6103001384803,40.6102955176137,40.6102929525284,40.6102896727554,40.6102879895411,40.6102860483946,40.6102843679286,40.6102819526632,40.6102774886566,40.6102734718568,40.6102702850268,40.6102704306067,40.6102720374733,40.6102776156534,40.6102805916128,40.610279830584,40.6102762988981,40.6102701128543,40.6102700639765,40.6102880481446,40.6102910550684,40.6102832389644,40.6102819815973,40.6102808398132,40.6102626929575,40.6102595257832,40.610261586925,40.6102649890238,40.610256595991,40.6102450969585,40.6102414684548,40.610241497042,40.6102429198145,40.6102466627248,40.6102470902673,40.6102458004126,40.6102454087868,40.610245123539,40.6102422524801,40.6102369274988,40.6102314313496,40.6102295359615,40.6102254340697,40.6102183798311,40.6102127892246,40.6102056776042,40.610189987995,40.61016610923,40.6101500826605,40.6101394251298,40.6101589035221,40.6101707759113,40.610177346082,40.6101796454054,40.6101712195024,40.6101790704935,40.6101895973557,40.6101914345443,40.6101960054153,40.6101994770773,40.6102033010222,40.6102051866629,40.6102069841715,40.6102078079336,40.6102147280434,40.6102207338575,40.6102326107886,40.6102373674682,40.6102339638112,40.6102218889354,40.6102036280499,40.6101958628329,40.6101971616245,40.6102031118825,40.6102206976863,40.6102412543917,40.6102687197319,40.6102776368755,40.6102913743295,40.6103038186138,40.6103067976506,40.6103020120028,40.6102915398727,40.6102753755043,40.6102586637098,40.6102403625534,40.610222618273,40.6101973708205,40.6101755435013,40.6101544153392,40.6101336663333,40.6101089283469,40.6100854051932,40.6100768023169,40.6100773652269,40.6100814797605,40.6100991611942,40.6101048771754,40.6101085959841,40.6101198409489,40.6101281814509,40.6103652889503,40.6103742578574,40.6103748249378,40.6103802893037,40.6103851850548,40.6103656866573,40.6103558042895,40.6103526207133,40.6103521298861,40.6103535119002,40.6103606771734,40.6103022256842,40.6101184279463,40.6101208015401,40.6101149991597,40.6101157835709,40.61012313285,40.6101368415929,40.6101494480789,40.6101584423157,40.610163557686,40.6101646425539,40.6101616647606,40.6101547125772,40.6101439920885,40.6101298210833,40.6101271650374,40.6101266783721,40.6101283718594,40.6101322080149,40.6101381019275,40.6101459231386,40.6101559629607,40.6101918021048,40.6102316827926,40.6102751379985,40.6103216588367,40.6103707005195,40.6103990823391,40.6104052416785,40.6105198629088,40.6116405538272,40.6117943265438,40.6120110775895,40.6123101579678,40.6119980108849,40.6121788391533,40.611726499417,40.6115740995571,40.6119916547488,40.6117424929569,40.6112035526029,40.6101174529375,40.6088924844812,40.6081623428489,40.6077159965038,40.6075368704248,40.6074721710666,40.6072598660959,40.6055189208322,40.604598232281,40.6040401433012,40.6031211357847,40.6028025717903,40.6025660272114,40.6015994988107,40.5984528538427,40.5983393459828,40.5982263311987,40.5981914292931,40.5981409639973,40.5980187280319,40.5976004783072,40.5973193595632,40.5972808113883,40.5972634442931,40.5972683712726,40.5972632148108,40.5973631983613,40.5973588942403,40.5973241477774,40.5972962594185,40.5972629936936,40.5972320136694,40.5972218192827,40.5971827453488,40.5971368706904,40.5971173795656,40.5970832267165,40.5970631302385,40.5970557144636,40.597011837708,40.5970001866654,40.5969562730935,40.5969488173265,40.596955440414,40.5972446310752,40.5972480777386,40.5972531946157,40.5972659146248,40.5972414428984,40.5972172746649,40.5969944663454,40.5969898893497,40.5969857201294,40.5969820832898,40.596979087525,40.5969768223694,40.5969753555215,40.5969747308209,40.5969749669381,40.5969760568162,40.5969779678821,40.5969806430199,40.5969840022777,40.5969879452577,40.596992354116,40.5969970970853,40.5970464390018,40.5970912624507,40.5971310151103,40.5971652071409,40.5971934172215,40.5972152977412,40.597230579083,40.5972390729466,40.5972406746684,40.5972353645116,40.5972114955819,40.5971811811061,40.5971447288194,40.597102508764,40.5970549495324,40.5970025339162,40.5969457940047,40.5968853057834,40.5968479460785,40.5968085555892,40.5967681440771,40.5967277474753,40.5966884013332,40.59665111427,40.5966120109143,40.5965756402063,40.5965427514612,40.5965140222576,40.5964900444776,40.5964713121136,40.5964582110908,40.5964541175107,40.5964495056619,40.5964445049621,40.596439255741,40.596433905302,40.5964286037892,40.5963733767386,40.5962812340572,40.5962357014411,40.5962086472918,40.5962037646358,40.5962026127408,40.596210227619,40.5961869395404,40.5961821956732,40.5962364324785,40.596274540415,40.5963078234296,40.59631887912,40.5964099798625,40.5964802322842,40.5967749955401,40.5967993985565,40.5968205985755,40.5968379883044,40.596851069599,40.5968594677337,40.5968629421363,40.5968612628131,40.5968604857789,40.5968606304048,40.5968616930854,40.5968636473284,40.5968664444155,40.5968700146166,40.5968742689281,40.596879101292,40.5968961555747,40.5969137678503,40.5969314800073,40.5969488313358,40.596965370511,40.5969730997394,40.5969803950175,40.5969870380644,40.5969928301143,40.596997597864,40.5970011986583,40.5969994472864,40.5969923947747,40.5969802429006,40.596963339338,40.5969590594706,40.5969552489275,40.5969519877036,40.596949344262,40.5969473740967,40.5969534804573,40.5969553295127,40.5969528694223,40.596946169158,40.5969354165708,40.5969343828693,40.5969327958651,40.5969306983634,40.596928146939,40.5969252104101,40.5969219679819,40.5969185071108,40.5969149211448,40.5969113068061,40.5969077615821,40.5969043810962,40.5969012565283,40.5968984721553,40.5969009853296,40.5969032849662,40.5969053078027,40.5969069981918,40.5969083096314,40.5969092060443,40.5969096627705,40.5969096672455,40.5969092193463,40.5969083313944,40.5969070278171,40.5969078099533,40.5969082788356,40.596908422355,40.5969082368051,40.5969077269778,40.5969069060396,40.5969057951913,40.596904423121,40.5969028252628,40.5969010428817,40.5968991220084,40.5968971122499,40.5968797746031,40.5968638755276,40.5968498495789,40.596838080116,40.5968283617439,40.5968230665697,40.5968223109247,40.5968261114096,40.5968284255849,40.5968284002084,40.5968260357695,40.5968213778529,40.5968182426142,40.5968152696625,40.5968125384969,40.5968101221511,40.5968080852402,40.5968064822327,40.5968053559946,40.5968047366422,40.5968046407376,40.5968050708453,40.596806015464,40.5968074493337,40.5968093341116,40.5968116193972,40.5968172184773,40.596821876286,40.5968254651058,40.5968278865308,40.5968290741654,40.5968289954445,40.5968336518678,40.5968392292896,40.5968455916066,40.5968525835619,40.5968600345339,40.5968677626998,40.5968755794723,40.596883294102,40.5969047368742,40.5969240667479,40.5969261934594,40.5969283106056,40.5969303546586,40.5969322642831,40.5969339821782,40.5969354567956,40.5969366438872,40.5969375078325,40.5969380227074,40.5969381730624,40.5969379543858,40.5969373732393,40.5969364470612,40.5969243241242,40.5969147559868,40.5969079831848,40.5969041759814,40.5969034300867,40.5969041023889,40.5969044167524,40.5969043640787,40.5969039458923,40.5969031742966,40.596902071624,40.5969006697889,40.5968990093646,40.5968971384086,40.5968951110718,40.5968929860312,40.5968908247916,40.5968886899055,40.5968661780893,40.5968453983135,40.5968268755727,40.5968110778377,40.596798404233,40.5967891749525,40.5967836231704,40.5967818891504,40.5967679275838,40.5967518147079,40.5967340256783,40.5967150850784,40.5966955514501,40.5966760008225,40.5966590443658,40.596642796445,40.5966276519967,40.5966137208704,40.5966016734934,40.596591814604,40.5965843935821,40.5965795981421,40.5965826637052,40.5965845901045,40.596585327482,40.5965848567531,40.5965831901011,40.5965803706614,40.5965764714057,40.5965715932526,40.5965658624564,40.596548876159,40.5965363665849,40.5965286125145,40.5965402391987,40.5965470521118,40.5965517533885,40.5965561803737,40.596560212079,40.5965637383193,40.5965666627236,40.5965689053687,40.5965704049638,40.5965557310661,40.5965461861358,40.596542033232,40.596543386809,40.5965502095621,40.5965623758291,40.5965703407978,40.5965739772854,40.5965732272254,40.5965718564564,40.5965698123709,40.5965671569667,40.5965639707833,40.5965603504588,40.5965564057992,40.5965522564473,40.5965480282547,40.5965438494639,40.5965398468191,40.5965361417221,40.5965328465497,40.5965300612457,40.5964902644393,40.596448228433,40.5964044100578,40.5963592855138,40.5963133451953,40.5962724508818,40.5962315657048,40.5961917792024,40.5961541516323,40.596119685718,40.5961245794045,40.59612453559,40.596113420952,40.5960739606301,40.5960677640591,40.5960691129606,40.5960701490663,40.5960922694532,40.5960661303974,40.5960377549819,40.5960351366335,40.596047381951,40.5960615873134,40.5960788139732,40.596274562182,40.5963763378487,40.5965352326581,40.5967634375403,40.5968784200921,40.5969776298814,40.5969759347949,40.5970203712617,40.596980082263,40.5969763468467,40.5969217422505,40.5969163774852,40.5968851950549,40.5968790538443,40.596844270047,40.5968211749773,40.5968081819379,40.5968042042413,40.5967709741896,40.5966512479565,40.5966467884113,40.5965681991978,40.5965734083625,40.5965851055696,40.5965671520608,40.59655529542,40.5965426048351,40.5965520258863,40.5965833167987,40.5965887195767,40.5966252422724,40.5966328296178,40.5966646368355,40.5966707576201,40.5967081095628,40.5967138212567,40.5967363351114,40.5967539026021,40.5967727445203,40.596882675628,40.5969467653058,40.5969502599823,40.5969541782144,40.5969822481007,40.5970053313409,40.5970103573716,40.5970227937427,40.5970361259649,40.5970400440916,40.5970425781621,40.597045568738,40.5970466525981,40.5970465802413,40.5970463914213,40.5970463256563,40.5970411385431,40.5970025035919,40.5969947493067,40.5969921832292,40.5969671715136,40.5969648895262,40.5969425107846,40.5969390958061,40.5969140276249,40.5968754894665,40.5968631903196,40.5968737655416,40.5969060805704,40.5969097422793,40.5969325181805,40.5969362019485,40.5969567213117,40.5969599630692,40.5969799315816,40.5969840850615,40.5970017376255,40.5970044319472,40.5970201301232,40.597029543018,40.5970286320473,40.5969775690849,40.5969782825868,40.5968974023075,40.5969131843773,40.5968042043652,40.5967845197931,40.596763166427,40.5967951924628,40.5967831154392,40.5971174085638,40.5968382191848,40.5959235049483,40.5947334535043,40.5946779767966,40.5945560432435,40.5945461162055,40.5945396277767,40.5945276924653,40.5945188772128,40.5944954456226,40.594483896629,40.5944699060534,40.5944525008541,40.5944279374009,40.5943761168406,40.5943590658423,40.5943522629883,40.5943786161244,40.5944009265887,40.5944248822644,40.5944382763397,40.5944454564172,40.5944754753593,40.59448469556,40.5945170742613,40.5945252075305,40.5944489123519,40.5944133375066,40.594412157453,40.5943550082153,40.5943597644535,40.5944164355568,40.5944144574086,40.5944490768166,40.5945295655602,40.5945430493005,40.594557204839,40.5945862322445,40.5945964765347,40.5945965563853,40.5945930022111,40.5945859325305,40.5945577844615,40.5945455304477,40.5945330096761,40.5945074209202,40.5944828020272,40.5944653393076,40.5944530055607,40.5944539455886,40.5944619414342,40.5944739800936,40.5944860182775,40.5945120680229,40.5945231717144,40.5945307092916,40.5945372006263,40.5945424583371,40.5945453397255,40.594550187793,40.5945615785775,40.5945194553518,40.594519437999,40.594426474457,40.5944265251086,40.594518270377,40.5945182525876,40.5945647430572,40.5945689665816,40.5945800418789,40.5945824498767,40.5945863437267,40.5945893942863,40.5945035588826,40.5945007687871,40.594636709614,40.5946328598997,40.5946248612315,40.5946146359736,40.5946012121379,40.594579590822,40.5945306571454,40.5945112661757,40.5945115727389,40.5945175465931,40.5945660319092,40.5945815319684,40.5946119293187,40.5946251644138,40.5946470717361,40.5946612182571,40.5946696985913,40.5946745072992,40.5946788009862,40.5946994751196,40.5947216522721,40.5947200299895,40.5947071932945,40.5946958377691,40.5946720142795,40.5946705458527,40.5946625147099,40.5946502427498,40.5946111660211,40.5945976474688,40.5945743387975,40.5945474201197,40.5945033682814,40.5944910517333,40.5944882492532,40.5945056823109,40.59451789892,40.5945547344952,40.5945971840363,40.5946115791919,40.5946366078412,40.5946517338775,40.5946772977564,40.5946973346561,40.5947062229599,40.5947147377804,40.5947306333429,40.5947687530906,40.5947827158066,40.5947925928812,40.5948081417613,40.5948080269764,40.5948055750604,40.594801181374,40.5947956850931,40.5947864931352,40.594771445416,40.5947473250019,40.5946752261497,40.5946543701324,40.5946424340221,40.5946417440528,40.5946498837433,40.5946641632835,40.5946809492374,40.5947277712909,40.5947425666082,40.594759042058,40.5947719952709,40.5947944977661,40.5948181498347,40.594837865704,40.5948588154524,40.5948792716287,40.5948948367904,40.5949058833243,40.5949045550175,40.5948954741344,40.5948685178065,40.5947292560602,40.5947368068089,40.5947443114451,40.5947908105678,40.5948052206806,40.5948083773633,40.5948193134479,40.5948260110791,40.5948321590436,40.5948319699041,40.5948278167278,40.5948191067595,40.5948041263581,40.5947920318185,40.5947857927963,40.5947890838636,40.5947925426857,40.5947945808627,40.594796871785,40.5947959824007,40.5947951482763,40.5947918815827,40.594784288443,40.5947737475313,40.5947567828012,40.594734584394,40.5947107414391,40.5946362038159,40.5946120024512,40.5945975633334,40.594590516488,40.5946033760723,40.594626721237,40.5946513989531,40.5946645797708,40.5946789219917,40.594679617,40.5946676761655,40.5946617747979,40.5946483789546,40.5945848167201,40.5945628236953,40.5945341897321,40.5944966290322,40.5944141217312,40.5943904091371,40.594374444289,40.5943685133326,40.5943427300678,40.5943252089468,40.5943117469999,40.5943014940618,40.5942956949022,40.5942581903019,40.5942232958372,40.5941773316723,40.5941244280361,40.59410460072,40.5940957208189,40.5940950493671,40.5940940259396,40.5940899581881,40.594085068754,40.5940802547806,40.5940669269377,40.5940546604572,40.594025919778,40.5939074038402,40.5938734437314,40.5938365274044,40.593786667418,40.5937284890523,40.5936910437116,40.5935158617683,40.5934951872593,40.5934639889924,40.5934016267206,40.5932163672704,40.5930579838589,40.5929986329154,40.5929240683522,40.5928890549636,40.59280435609,40.5927269249096,40.5926789289635,40.5926083116121,40.5924771425759,40.5923469034994,40.592229252646,40.5919866139372,40.5918939888227,40.5917830834924,40.591703680492,40.5916119449973,40.5915131497428,40.5913972842885,40.5913742743585,40.5913122513258,40.5912843482146,40.5912637784743,40.5912478734711,40.5912368349263,40.5912314579915,40.5912320342496,40.5912311515381,40.5912273451071,40.5912113413627,40.5912007185304,40.5911943944183,40.5911875766014,40.5911831598854,40.5911778285204,40.591170992524,40.5911667327848,40.59116121623,40.5911516770413,40.591139058316,40.5911206972259,40.5911133825481,40.5911046159127,40.5910548942286,40.5910414205315,40.591013495942,40.590991276518,40.590983540775,40.5909712567873,40.5909641299131,40.590961013804,40.5909591869429,40.5909509579399,40.5909459184662,40.5909458404276,40.5909462246297,40.5909449742893,40.5909372393037,40.5909239809945,40.5909164746394,40.5909160520412,40.5909189380456,40.5909359520136,40.5909428065312,40.5909468239727,40.5909484334733,40.5909501795292,40.590949307561,40.5909418523617,40.5909369773347,40.5909300197453,40.5909248227303,40.5909203677735,40.5909141545464,40.5909096514933,40.5909051041499,40.5909007369043,40.5908948487344,40.5908799780714,40.5908762489851,40.5908749645213,40.5908746047785,40.5908731068929,40.5908655917605,40.5908629268303,40.5908611718561,40.5908615944832,40.5908639380433,40.5908718880508,40.5908691848294,40.5908671308656,40.5908657938743,40.5908676463845,40.5908721466574,40.5908742216392,40.5908739541574,40.5908710002974,40.5908741980498,40.5908863049638,40.5908978137133,40.5909118113389,40.5909269180551,40.590937187656,40.5909441961829,40.5909531517203,40.5909641534941,40.5909714635439,40.5909809500304,40.5909907915187,40.5910012616659,40.5910118091496,40.5910214347812,40.5910293520104,40.5910360240392,40.5910430312698,40.591050187487,40.5910554190286,40.5910587501181,40.5910603221167,40.5910590454662,40.5910608605566,40.5910710214475,40.5910870625041,40.5911119073821,40.5911212451042,40.5911368144508,40.5911493721027,40.5911581317752,40.5911748798808,40.5911843046172,40.5911918354412,40.5911996045426,40.5912032399873,40.5912050110249,40.59121411947,40.5912205309003,40.5912372904786,40.5912511855547,40.5912614641329,40.5912691483119,40.5912784687471,40.5912926925147,40.5913050139519,40.5913217681694,40.5913345657436,40.5913504584558,40.5913569882777,40.5913599523496,40.591362737995,40.5913670139699,40.5913738545737,40.5913783981896,40.5913794975516,40.5913789539283,40.5913899554484,40.5914285676106,40.5914509794128,40.5914664708013,40.5914750472486,40.5914791705213,40.5914919346869,40.5914936205807,40.5915016346677,40.591509806355,40.5914932070093,40.5915045769618,40.5915256319818,40.591552496046,40.5915676025827,40.5915726778985,40.5915866055272,40.5915916452348,40.5916120450005,40.5916180511717,40.5916231691615,40.5916192255655,40.5916200575872,40.5916232813044,40.5916301326885,40.5916319911678,40.5916380015593,40.5916472762025,40.5916607813385,40.5916649365467,40.5916827109522,40.5916920352781,40.5917080477897,40.5917183233068,40.5917266338504,40.5917232932163,40.591699964295,40.5916812218376,40.5916408701559,40.591637683713,40.5916339461123,40.591624209178,40.5916111774311,40.591597477046,40.5915876929952,40.5914843195107,40.5914722578506,40.5914397090337,40.5913938710503,40.5913649791845,40.5912987703787,40.5912337011348,40.5912054711496,40.5911736048457,40.5911556064807,40.5911268162828,40.5910468293308,40.5909939026278,40.5909736506488,40.5909609333352,40.5909387857498,40.5909270826497,40.5908829765193,40.5908729902564,40.5908633710332,40.5908434182369,40.5908387545541,40.5907849357218,40.5907585836891,40.5907294829644,40.5907228263471,40.5907368999683,40.5907988150592,40.5908343477634,40.5908576746301,40.590868597202,40.5908700689556,40.5908637796635,40.5908623563883,40.5908371366746,40.5908037325102,40.5907687127439,40.5907457971533,40.5907398708429,40.5907309900209,40.5906819071668,40.5906720708104,40.5906651591467,40.5906144510288,40.5905930249549,40.5905875358652,40.5905813651227,40.5905621517192,40.5905564586374,40.5905530269117,40.5905530949315,40.5905624063808,40.5905679153964,40.5905712302391,40.5905737069617,40.5905786420582,40.5905862777899,40.5905857911126,40.5905806349362,40.5905716727632,40.5905655505941,40.590550661163,40.5905029716914,40.5904821784513,40.5904766928042,40.590459952836,40.5904561315863,40.5904543475789,40.5904570540962,40.5904563311934,40.5904541850597,40.5904515397261,40.5904473050154,40.5904209289984,40.590415826894,40.590412601364,40.5904090218445,40.5904032493107,40.5904009893001,40.5903953691643,40.5903869097332,40.5903756024249,40.5903681767895,40.590359250506,40.5903563548549,40.5903548866369,40.5903572530707,40.5903629479699,40.5903781302337,40.5903836407002,40.5903873361109,40.5903879630178,40.5903867663833,40.5903841563117,40.5903746258691,40.5903584880023,40.5903172759561,40.5902976951208,40.5902888463495,40.5902844426048,40.5902835447586,40.5902740319491,40.5902713664026,40.5902682183731,40.5902629222973,40.5902454226257,40.5902273997978,40.5901937181982,40.5901846844655,40.5901782942247,40.590178589948,40.590181408328,40.5901904300247,40.590205937252,40.5902204658164,40.5902842782289,40.5903162269039,40.5903196467115,40.590322763593,40.5903246324399,40.5903252151983,40.5903245987577,40.5903083066968,40.5902743141927,40.5902122501826,40.5901812325074,40.5901749552385,40.5901658297416,40.5901261306828,40.5901044469655,40.5900874382948,40.5900731046842,40.5900663321666,40.5900632419455,40.5900671376931,40.5900915935002,40.5900976850164,40.5901012158691,40.5901024195698,40.5901012910393,40.590097841116,40.590093815392,40.5900833781134,40.5900762968667,40.5900534712087,40.5900195960134,40.59000049901,40.5899789701202,40.58992581088,40.5899067311578,40.5898537936301,40.5898439607656,40.5898164522955,40.5897872633822,40.5897636042033,40.5897505578231,40.589705679222,40.5896595873448,40.5896059407627,40.5895931088954,40.5895855867523,40.5895845141701,40.589593284963,40.5895910158862,40.5895802032484,40.58958863903,40.5896437622558,40.5896471020728,40.589644354374,40.5896237210381,40.5896142562999,40.5896110202994,40.5896087735683,40.5896053538265,40.5895966214291,40.5895831363488,40.5895687233012,40.5895625592396,40.5895374681471,40.5895284709128,40.5895049355329,40.5894693695699,40.5894580220399,40.5894207870693,40.5894025314912,40.5893795790191,40.5893571907479,40.5893425702415,40.5892911657003,40.5892713063464,40.5892605844686,40.5892495391987,40.5892539914424,40.5892509984242,40.5892242777952,40.5891855128788,40.589170626216,40.5891602745786,40.5891467143731,40.5891343279088,40.5891122011692,40.5890959248302,40.5890913570539,40.5890916284914,40.5890895749675,40.5890738559549,40.5890658427184,40.5890392051369,40.5890246934882,40.5889986710705,40.5889670548951,40.588924372001,40.5888474513452,40.5887578713443,40.5887024419664,40.5886789104637,40.5886476381658,40.5886093317205,40.5885183195756,40.5884780552179,40.5884525065651,40.5884360215682,40.5884177693449,40.5884071311552,40.5884009647813,40.5883915360154,40.5883818245007,40.5883748438623,40.5883635038188,40.5883394830634,40.5883348815334,40.5883101797984,40.5882801997791,40.588218925898,40.5881947730615,40.5881471078831,40.5881330222365,40.588128149448,40.5881162942688,40.588105726485,40.5880918028819,40.5880755311747,40.5880645905894,40.5880382750151,40.588023040441,40.5879936613259,40.5879665201617,40.5879229377121,40.5877483551036,40.5876459035973,40.5876336196291,40.5876156331357,40.5875977008169,40.5875648047435,40.5875262240014,40.5875081677475,40.5874844460529,40.5874502888673,40.5874731502872,40.5874932398293,40.5875037606075,40.5875166391454,40.5875494053771,40.5875674959873,40.5875767587703,40.5876003189207,40.58762075826,40.5876235552981,40.5876290828052,40.5876308931389,40.5876313234322,40.587631762185,40.5876281473041,40.5876232429071,40.5876173441098,40.5876033124309,40.5875983534745,40.5875937588398,40.5875876505904,40.5875748166765,40.5875689160682,40.5875632276877,40.5875556907709,40.5875462744698,40.587545841227,40.5875347854877,40.5875073932314,40.587498354235,40.5874771897255,40.5874586695941,40.5874352284223,40.5874149906885,40.5874042962278,40.5873563223137,40.587349855257,40.5873423067021,40.5873115722836,40.5873030977906,40.5872956588494,40.5872845505073,40.587272521226,40.5872685690111,40.5872741044988,40.5872850972417,40.5872968811235,40.5873027155919,40.5873058635385,40.5873041273398,40.5873029294692,40.5872940242708,40.587271379782,40.5872612003192,40.58723236675,40.5872174649418,40.5872122724865,40.5871893269836,40.5871611904129,40.5871271924758,40.5871161053491,40.5870994883029,40.5870791388735,40.5870430473107,40.5870247142331,40.5870033576465,40.5869961508922,40.5869818973483,40.5869720195629,40.5869629476535,40.5869543334714,40.5869488792799,40.5869490020798,40.5869471928606,40.5869387110041,40.586910591072,40.5869018805096,40.5868893179435,40.5868380986986,40.5867859451211,40.5867852296607,40.5868004856933,40.5868058037389,40.5868092846952,40.5868118116665,40.5868127491903,40.586809161172,40.5868037790964,40.5867958045459,40.5867774708375,40.586774475702,40.5867742201602,40.5867579669635,40.5867436004759,40.5867340188857,40.5867212009855,40.5867125112498,40.5866612645754,40.5866496055827,40.586637804987,40.5865971432734,40.5865802643362,40.5865656881921,40.5865504787046,40.586532669541,40.5865263321174,40.5865225232095,40.5865213867996,40.5865186133866,40.5864819072934,40.5864786431803,40.5864776764645,40.5864782650793,40.5864758950304,40.5864711989017,40.5864696819279,40.5864696927376,40.5864667991136,40.5864472813612,40.5864406807341,40.5864210977128,40.5864054749519,40.5863942167087,40.5863613339222,40.5863417065496,40.5863263968241,40.5863409368372,40.5863510214721,40.5863558112151,40.586376459164,40.5863788747726,40.5863781965321,40.586375841755,40.5863753492555,40.5863738266453,40.5863651990036,40.5863570583385,40.5863517154447,40.5863376502681,40.5863272230206,40.585894019513,40.5858856438084,40.585869892424,40.5858441475228,40.5858141809784,40.5857907051023,40.5857799126032,40.5857690483018,40.5856848742621,40.5856673527615,40.5856618917998,40.5856530298513,40.585644400265,40.5856388706261,40.5856328584377,40.58559175259,40.5855553333498,40.5855340874962,40.5854815144088,40.5854206059953,40.5854322833543,40.5854330639157,40.5854248792357,40.5854071712861,40.5854006866781,40.5853886522309,40.5853745923526,40.5853637350217,40.5853518267125,40.5853379746793,40.5853218610638,40.5852960128291,40.585224665141,40.5851582530922,40.5851191409271,40.5850880216255,40.5850351580243,40.5849823277174,40.5849074545417,40.5848932129069,40.5848925096165,40.584930090245,40.5849501160573,40.5849789009825,40.5849946390951,40.5850080811859,40.5850180281919,40.5850213745009,40.5850179374502,40.5849541004362,40.5849280532658,40.5849026577445,40.5848684522782,40.5848094533935,40.5847508214042,40.5847207819476,40.5846963491146,40.5846633826636,40.5845901001371,40.5845720051606,40.5845133305741,40.5844575172494,40.5844525084637,40.5844774474057,40.5844877527142,40.5844988770228,40.5844985174738,40.5844887205009,40.5844679620138,40.5844492774077,40.5844349274889,40.5844198992057,40.5844038712516,40.5843922520607,40.5843759663911,40.5843566403015,40.5842846550672,40.5842726323009,40.5841929751112,40.5841143690789,40.5841048929351,40.5840770574484,40.584004409504,40.5839950773973,40.5840116297864,40.5840147180562,40.5840291466957,40.5840287410076,40.58402056555,40.584018788899,40.5840163950889,40.5840134226224,40.5840087876766,40.5840022904208,40.5839921509836,40.5839797780515,40.5839652454693,40.5839486528888,40.5839299980549,40.5838857250989,40.5838672996222,40.5838534949442,40.5838233066352,40.5838174401778,40.5837215247149,40.5836261410754,40.5835663221546,40.5835088381157,40.583489123005,40.5834731490467,40.5834280582561,40.5833310946861,40.5832734543754,40.5832454334571,40.5830588927394,40.5829552722322,40.5828981645049,40.5828045165836,40.5827549385115,40.5827258202438,40.5827164921386,40.5826592355834,40.5825756965884,40.5825686850913,40.582463428205,40.582410179392,40.58233475894,40.5822605438318,40.5821173906327,40.5820765600863,40.581932715121,40.5819006758529,40.5818041484645,40.5817669743542,40.5817379879475,40.5816860824015,40.5814980837822,40.5814645421461,40.5814586760572,40.5812621274562,40.5811711184754,40.5811355755287,40.581115032162,40.5810960731939,40.5810418054005,40.5809375142691,40.5807479877891,40.5807449614234,40.5805713141759,40.5804807635388,40.5804252536169,40.5803783696227,40.5803015005832,40.5802572377077,40.5801381392026,40.5800697327872,40.5799687097926,40.5797870279171,40.5796597949051,40.5795973090506,40.5794445129552,40.5793398789875,40.5792439182393,40.579139550197,40.5790558594243,40.5790384799665,40.5789260059823,40.5788652429208,40.5787803560459,40.5787735825628,40.578769546133,40.5787682493882,40.5787758564582,40.5787683591308,40.5787486724569,40.5787037159496,40.5786501529496,40.5785679107544,40.5784959072129,40.5784731215472,40.5784616656676,40.5784194376228,40.5783665665372,40.5782789351169,40.5782088710694,40.578153612509,40.5781291740905,40.5780257143779,40.5779428336021,40.5779037196932,40.5777859473781,40.5777155148127,40.577649897609,40.5775524977874,40.5773490373614,40.5773229295525,40.5772784591672,40.5770928598457,40.5769228981812,40.5767923895186,40.5767495873209,40.576728784869,40.5766503756697,40.5766110880026,40.5765684107656,40.5762842934972,40.5762527333306,40.5760123758161,40.5759236834755,40.5758487079283,40.5757945764864,40.5757005340107,40.5756362609003,40.5755519602698,40.5753070268271,40.5750335179511,40.5747186084141,40.5744809616699,40.5741971689912,40.5738874520418,40.5736105357737,40.5733247520325,40.5730342656066,40.5730088212309,40.5727191281362,40.572405332878,40.5720531905229,40.5720140485174,40.5719835046154,40.5719556279641,40.571944273558,40.5719099901253,40.5718498218341,40.5718186058427,40.5717954978831,40.5717627255128,40.5717323762623,40.571682657781,40.5716519523275,40.5715883852906,40.5714922072629,40.5714510350657,40.5714076426579,40.5713425859454,40.5713012924077,40.5712131809827,40.5711870615066,40.5711721872626,40.5710662670458,40.5709721381476,40.5709275554248,40.5708915051954,40.5707451035041,40.5706053056492,40.5705063552281,40.5704324357731,40.5703413643759,40.570335991837,40.5703307464202,40.5703125488727,40.5702551255456,40.5701371692595,40.5700635464707,40.5699360647024,40.5699138445135,40.5698968769154,40.5698653771078,40.5698149836704,40.5697514243856,40.5696588470664,40.5695973586782,40.5695551652461,40.5695232530462,40.5695054900142,40.5694276490651,40.5693242070255,40.5692726371382,40.5692134772201,40.5691836141402,40.5691005004877,40.5690075841319,40.5689792446938,40.5688981603699,40.5688702651152,40.5688592381376,40.5687921032458,40.5686181454211,40.5685201497186,40.5683107982568,40.5682620461742,40.5682050078845,40.5681860558162,40.5681677128154,40.5681342947062,40.5681042735841,40.5680718433955,40.5679984389428,40.5679210973245,40.5675042315488,40.5671084414283,40.5670459488113,40.5669740489646,40.5668898928101,40.5668100123009,40.5668002967062,40.5668186682684,40.5668305715456,40.5675977288694,40.5677392722517,40.5673916164731,40.5687875343785,40.5691417855225,40.569242922454,40.5704584729965,40.572381674513,40.572988329032,40.5736900119722,40.5735427757593,40.5738230570186,40.574021231946,40.5749881084912,40.5750267867217,40.5750607221259,40.5759330347646,40.5760597612556,40.5772715872538,40.5776726943298,40.578074048806,40.578468346055,40.5788645343772,40.5792565927193,40.5796615165746,40.5800584215184,40.5804614973145,40.5808536550377,40.581255267855,40.5815455323126,40.5818277256432,40.5821302435814,40.5821661606911,40.5821881421437,40.5821149493557,40.5819492204964,40.5817627447372,40.5815798570505,40.5815865566433,40.5816260064314,40.5816676086032,40.5817056806939,40.5817102353441,40.5817584904656,40.5818075527706,40.5818572628055,40.5818640129915,40.581966993962,40.582068535757,40.5821683779671,40.5822662645401,40.5823619444384,40.5823973400485,40.5824315034934,40.5824751251249,40.582515392867,40.5825517286752,40.5825836109469,40.5826020719111,40.5826182547317,40.5826618343859,40.5826987865088,40.582710041639,40.5827186491214,40.5827273424076,40.5827917137967,40.5828007817042,40.5827402026538,40.5827632821797,40.5827136472618,40.5827182536142,40.5827318837027,40.5827724751199,40.5828225015279,40.5828303382705,40.5828789393622,40.5841243723825,40.5841620727924,40.5841808209705,40.5843888648095,40.5844980772365,40.584583729021,40.5846950522022,40.5846789545374,40.5846684602127,40.5848542198798,40.5849293521006,40.5850632357345,40.5851253466317,40.585427098031,40.5857113637902,40.5857523382925,40.5857947384577,40.5858389515247,40.5858858315778,40.5859106828248,40.5859210173012,40.5859691994377,40.5860133877647,40.5860528867268,40.5860870745815,40.5861154131862,40.586137456469,40.586489799,40.5869008694234,40.5869843267138,40.5870392157723,40.5870638335233,40.5870651502248,40.587151322036,40.58715461537,40.5870691034816,40.587069099506,40.5870451419737,40.5874682407781,40.5874783148159,40.5874879703482,40.5874901200866,40.5874917899847,40.5874939665917,40.5874911129044,40.5874916497275,40.5874820198688,40.587475623883,40.5874528662459,40.5874258061371,40.5874016845819,40.5873600980814,40.5873022842441,40.5870533304064,40.5867699249213,40.5869246902342,40.5873216062137,40.5875110201712,40.5876936868871,40.5878728283577,40.5878949658979,40.5879332928949,40.5879737167787,40.5880388929453,40.5882514349589,40.5882833500887,40.5883124533213,40.5883385932937,40.5883617845536,40.5883819629051,40.5884188361383,40.5884603946014,40.5885064750038,40.5885568962869,40.5886114603353,40.588616141887,40.5886617992653,40.5889170141097,40.5890419428144,40.589217246455,40.5892857989826,40.5892918268233,40.5892695859851,40.5893003279442,40.5893128605387,40.5893301304977,40.5893330450299,40.5893593332524,40.5892552030516,40.5893188940923,40.5893390112214,40.5893657987367,40.5893679742814,40.5893574617675,40.5893401537818,40.5893116936562,40.5893048470851,40.5893114917065,40.589319169846,40.5893545979043,40.5894008878561,40.5894247885108,40.5894344744943,40.5894237205525,40.5894281409049,40.5894321888713,40.5894414716346,40.5894526164685,40.5894734640014,40.5895181616672,40.5895546375004,40.5895650491934,40.5895590464561,40.5895508163037,40.5895515385582,40.5895901854158,40.5896265672249,40.589666013197,40.5896923501892,40.5896979920401,40.5897023909294,40.5897067723983,40.5897119713798,40.5899788516837,40.5899890562929,40.5900153043223,40.5900368960461,40.5900696827189,40.5901188522173,40.5902187224372,40.5902783273879,40.5903342026178,40.5903721859248,40.5904258114873,40.5904712469067,40.5905128528169,40.5905129515067,40.5905881261723,40.5906105898882,40.5906537158137,40.5906664136961,40.5906735499503,40.5906790813608,40.5906798188051,40.5906773752484,40.5906717353468,40.5906620948748,40.5906508779038,40.5906378544645,40.5906268100857,40.5906195570589,40.5906163088337,40.5906162461518,40.5906209556268,40.5906242392584,40.5906360141259,40.5906739893184,40.5907131437941,40.590735474724,40.5907632701736,40.5907936318978,40.591046302491,40.5916976858236,40.5917088961941,40.5910707395151,40.5912466263417,40.5912560811728,40.5912618897441,40.591268606851,40.5912838178996,40.5912961840057,40.5913323704938,40.5913634055171,40.5913811061088,40.5913869371545,40.591383891988,40.5913689983617,40.5913481862076,40.5913261255072,40.5913258231023,40.5913405549768,40.5913587008894,40.5914291346301,40.5914505163004,40.5914733969509,40.5915235572917,40.591593746638,40.5916861165155,40.5917834903168,40.591957641949,40.5920893171174,40.5921486158157,40.5921905582578,40.5922594127843,40.5923148153815,40.5924925711731,40.5927277056568,40.5928285327022,40.5928499545051,40.5928824422123,40.5929013266969,40.5929024835083,40.5928535733302,40.5927421153035,40.5926278806814,40.5925077004684,40.5922550034887,40.5921010886896,40.5919814834781,40.5917446231799,40.591758172594,40.5917682972598,40.5918242612277,40.5918510782374,40.591956619424,40.5919969551095,40.5920584457527,40.592079948515,40.5920878100782,40.5920902691986,40.5921293501883,40.5921290947026,40.592206091903,40.5922858704508,40.5923133522551,40.5925030591446,40.5925018096358,40.5924885171767,40.5924686068404,40.5924780809387,40.5924761254751,40.5924745932105,40.5924544896292,40.5924423184546,40.5924598601752,40.5924610820745,40.5926408890566,40.5927660394114,40.5928712572387,40.5928721665815,40.5928772219482,40.5930223305721,40.5930066649739,40.5930127368297,40.5929874255512,40.5929577293583,40.5929601229667,40.5929364873522,40.5929433353392,40.5929266122475,40.592931427877,40.5928611016076,40.5927030542842,40.5927169968621,40.5927190564346,40.5927304857679,40.5927324583671,40.5927489139861,40.5927527912923,40.5927654375854,40.5927677245202,40.5927820905651,40.5927842408913,40.5928110382307,40.5927921135526,40.592785307122,40.5927790891237,40.5927772288686,40.5927731206964,40.5926844996331,40.592462584045,40.5924716940463,40.5924910503051,40.592498350596,40.5925021699534,40.5925289619312,40.5925136399876,40.592516760166,40.5925413164791,40.5925468478067,40.5924606484459,40.5924414134883,40.5924015211544,40.5923928220601,40.5923412937746,40.5923343885384,40.5922851995409,40.5922759171319,40.5922241823336,40.5922158484789,40.5921332256196,40.592132675124,40.5920920957351,40.5920935794666,40.592087032494,40.5922382546131,40.5922361655423,40.5922320022148,40.5922251695133,40.5922161327678,40.5922190430667,40.5922277984819,40.5922422203327,40.5922508107874,40.5922709538865,40.5930779100416,40.5930816021608,40.5930815938487,40.5930807760518,40.5923990277862,40.5924041860533,40.5926463184047,40.5926492461447,40.5927104095048,40.5927113397621,40.5926929849948,40.5926949580115,40.5924396083395,40.5924921780128,40.5927660351366,40.5928685697512,40.593002894394,40.5935340425957,40.5935757269146,40.5935769842637,40.5935806886181,40.5935808743314,40.59358266364,40.5935827936602,40.5935828315025,40.5935812283512,40.5935778919917,40.5935755936407,40.5935728830344,40.5935697771121,40.5935662677034,40.5935506023791,40.5935315263147,40.5935123827953,40.5934668460608,40.5934563366691,40.5934458184195,40.5934282183021,40.5934137222841,40.593383575899,40.5933723584707,40.5933677785734,40.5933646948083,40.5933637064951,40.5933630689267,40.5933627837833,40.5933628667873,40.5933642700806,40.5933671681792,40.5933874071935,40.5933910324498,40.5933929211005,40.5933953369568,40.5933956941516,40.5933940749056,40.593392492833,40.5933903802623,40.5933801029791,40.5933693365973,40.5933578627439,40.593345609721,40.5933132076906,40.5933015807135,40.5931343592729,40.5930743038279,40.5930338762454,40.592966840222,40.5929591581237,40.5929487357819,40.5929451057643,40.5929267590586,40.5928784329338,40.5928638532347,40.5928492644757,40.5928381731162,40.5928251354581,40.5928099068987,40.5927916032871,40.5927616086479,40.5926966567158,40.592680182833,40.5926633138448,40.5926065752829,40.592581681951,40.5925731658732,40.5925626494723,40.5925136750586,40.5925031928363,40.5924949080991,40.5924839099265,40.592462558512,40.5924559652603,40.5924489620245,40.5924378350739,40.5924084193103,40.5923944084909,40.5923626300721,40.5923094788732,40.5923051429695,40.5922996100279,40.5922786400778,40.5922712302175,40.5922649538723,40.5922626389816,40.5922608285265,40.5922593040178,40.5922584090965,40.5922584907184,40.5922604273482,40.5922638795915,40.5922670441264,40.5922664383691,40.5922673226162,40.5922684747775,40.5922687998698,40.592269365338,40.5922699058503,40.5922692090013,40.592266008431,40.5922633524234,40.592259950774,40.5922486170099,40.5922104593676,40.5921867829515,40.5921787578963,40.5921626589635,40.5921543735502,40.5921151187148,40.5920823432624,40.5920722335618,40.59205854235,40.5920526560412,40.5920418572822,40.5920359144701,40.5920294571516,40.5920206041929,40.5920093090046,40.5919924230729,40.5919796102861,40.591965683448,40.5919515093558,40.5919509509323,40.591935716706,40.5919102220003,40.5918834180499,40.5918555458803,40.5918268949325,40.5918067324158,40.5917609436042,40.5917400506604,40.5916551856644,40.5916040659966,40.5915881356298,40.591550756522,40.5914913912808,40.5914089030037,40.5913558044245,40.5912925923132,40.5912766625867,40.5912612122752,40.5912469817564,40.5912350792987,40.5911878021595,40.5911273487761,40.5911146710369,40.5911008249655,40.5910856749727,40.5910688889745,40.5910079682934,40.5909419005239,40.5909313303671,40.5909233009631,40.5909072503828,40.5908959142759,40.5908697704474,40.5908246185317,40.5907886909808,40.5907673754903,40.5907658350375,40.5907643742033,40.5907630129054,40.5907617406103,40.5907605753866,40.5907594996686,40.5907576726071,40.5907562581385,40.5907559662749,40.5907553456551,40.5907552057723,40.5907580097972,40.5907557169262,40.590755833966,40.5907577457492,40.5907587382645,40.5907602355648,40.5907619592643,40.5907638819514,40.5907659942408,40.5907704898938,40.5907754464982,40.5907867309886,40.5907998103707,40.5908146595183,40.5908753846575,40.5909261922974,40.5909423506054,40.5909933708421,40.5910073819162,40.5910384787294,40.5910518065804,40.5911302714685,40.5911730145299,40.5911901569464,40.5912889641401,40.5915197173371,40.5915992548823,40.5916927559912,40.5917350315424,40.5917500643438,40.5917609070034,40.591788888297,40.5918041891502,40.5918387659811,40.591854417748,40.5918557584366,40.5918570818461,40.5918583955152,40.5918596813687,40.5918621905178,40.5918645710066,40.5918668343343,40.5918688615021,40.591870582091,40.5918718879321,40.5918738547828,40.5918744779407,40.5918737566617,40.5918717010945,40.5918667560115,40.5918598575085,40.5918510496552,40.5918404141192,40.591793032493,40.5917359257222,40.5917119956867,40.5917046700664,40.5916821880893,40.5916734295888,40.5916679640331,40.5916632507468,40.5916432718291,40.5916138758723,40.5915839951553,40.5915085087569,40.5914689595879,40.5914497167305,40.5914325854837,40.5914295065673,40.5914267956733,40.5914180508041,40.5914129139916,40.5913838066936,40.59136051665,40.5913136742832,40.5913130775379,40.5913125877766,40.5913117260851,40.5913110329746,40.5913105840813,40.5913133408587,40.5913113671548,40.5913130536841,40.5913155967441,40.5913188793073,40.5913227849665,40.5913333244758,40.5913404618921,40.5913454428728,40.5913587800705,40.5913728863765,40.5914257455897,40.5914479951595,40.5914688705258,40.591552999493,40.5916220011477,40.5916861595642,40.5917090338161,40.5917402779136,40.5917829878288,40.5917895877015,40.591820241749,40.5918433328432,40.5918448280649,40.5918459989454,40.5918547098328,40.5918594632402,40.5918609442124,40.5918635007875,40.5918657422807,40.5918760725963,40.5918983360937,40.5919091465201,40.5919416126329,40.5919488523444,40.5919583879862,40.5919984891167,40.5920156008239,40.592049563495,40.5920559696691,40.5921177685976,40.5921561148037,40.5921729053209,40.5922204090793,40.5922324898964,40.592246905642,40.5923117590998,40.5923381968632,40.5923463559469,40.5923591566731,40.5924007399817,40.5924210190066,40.592447925894,40.5925095090421,40.59253299124,40.5926159282937,40.5926455191118,40.5927126747464,40.5927341876703,40.5927549741945,40.5927712924528,40.5928377289634,40.5929151777511,40.5929925147249,40.5930486956729,40.5930584219944,40.5930650823182,40.5930688580414,40.5930697774566,40.5930696806312,40.5930694767342,40.5930691635892,40.5930687339703,40.5930675229441,40.5930658261431,40.5930630048286,40.5930522360652,40.5930498286964,40.5930479961168,40.5930467133261,40.5930458531899,40.5930455673016,40.5930453800851,40.5930453018048,40.5930453128344,40.5930487697551,40.5930548297855,40.5930606256181,40.5930639524359,40.593066059107,40.5930685082149,40.5930825236952,40.5931035419522,40.5931382718573,40.5931691179978,40.5932259687283,40.5932698641469,40.593295583288,40.5933331955858,40.5933373167186,40.5933413236941,40.5933547417437,40.5933612364159,40.5933654378374,40.593369935328,40.5933748090722,40.5933801213035,40.5934272498587,40.5934890883048,40.5935057486273,40.5935469416152,40.5935665169876,40.5936244644262,40.5936249966362,40.5936503128762,40.5936690874521,40.5936727891192,40.5937001176808,40.5937233342659,40.5937322256192,40.5937441070482,40.5937472494384,40.5937569726593,40.5937675943665,40.5937732134307,40.5937790228042,40.5938239430074,40.593831939878,40.5938653194468,40.5938843907652,40.593889537578,40.5938950373156,40.5939073798755,40.5939465454794,40.5939585398214,40.5939689914146,40.5939958582376,40.5940037548631,40.5940042050131,40.594010895248,40.5940135172825,40.5940160668269,40.5940185542915,40.5940209781233,40.5940256946958,40.594030304935,40.5940379888202,40.5940561121247,40.5940618993208,40.5940647771819,40.5940676997646,40.5940731467725,40.5940796105203,40.5941111381321,40.5941189739197,40.594122248636,40.5941251539221,40.5941267612231,40.5941281623555,40.594129383661,40.5941304438546,40.5941345991969,40.594135606867,40.5941367760441,40.5941384665777,40.5941394415709,40.5941405162237,40.5941416886918,40.5941429695314,40.5941443481869,40.5941458440937,40.5941498356966,40.5941539508458,40.5941578686644,40.5941614159482,40.5941644123454,40.5941657076781,40.5941668764737,40.5941679018551,40.5941687907998,40.5941695276188,40.5941701285603,40.5941756196538,40.5941777130908,40.5941800300547,40.594181045734,40.5941827688723,40.5941834901671,40.5941844456876,40.5941850285141,40.5941857821223,40.5941867155186,40.5941878297278,40.5941891160393,40.5941905726094,40.5941940179527,40.5941981409796,40.5942029659453,40.5942151131023,40.5942281018668,40.5942551129507,40.5942669227463,40.5942841716099,40.5942935006599,40.5942977949229,40.594301601823,40.5943049662396,40.5943064951727,40.5943079244841,40.5943414259316,40.5943854111076,40.5943962785414,40.5944092362953,40.594424508547,40.5944456037752,40.5944496973719,40.594454521318,40.5944715912024,40.594477793724,40.5944808631817,40.5944835801469,40.5944860165989,40.5944881840975,40.5944912199057,40.5944940306003,40.5945023862593,40.5945044329454,40.5945065329583,40.5945535795301,40.5945569900557,40.5945602019537,40.5945716188031,40.5945746783105,40.594577954814,40.5945861859077,40.594595651083,40.5946061636068,40.5946174527943,40.5946293037891,40.5946584567992,40.5946657813243,40.5946720875246,40.5947137798211,40.5947521585987,40.594755909721,40.5947599686056,40.5947690961813,40.5947796411152,40.5947925849379,40.5948157900996,40.5948311435379,40.5948382772388,40.594844913536,40.5948511348995,40.5948563909559,40.594856976299,40.5948658192131,40.5948745327575,40.5948830093312,40.594891085722,40.5948986179665,40.5949135535505,40.5949178177747,40.5949221916745,40.594935914014,40.5949495322629,40.5949631730187,40.594976863196,40.5950255636994,40.5950918113619,40.5951435360354,40.5951530976206,40.5951628712225,40.5951947559075,40.5952084658932,40.5952119918075,40.5952159323386,40.5952252643085,40.595259916991,40.5952664164727,40.5952718978179,40.5952775026324,40.5952799215627,40.5952821156063,40.5952840754243,40.5952858274245,40.5952873526981,40.595288672312,40.595293034058,40.5952941692661,40.5953006375503,40.5953052502125,40.5953248140966,40.5953349885506,40.5953523399947,40.5953544228887,40.5953568942645,40.5953631057351,40.5953859170628,40.5953930581753,40.5953985853849,40.5954007315562,40.5954025178326,40.5954087108574,40.5954134212514,40.5954222498193,40.5954261711617,40.5954321459327,40.5954331960226,40.5954389683637,40.5954505477337,40.5954647134159,40.5954817616929,40.5954841873146,40.5954903886281,40.5954934852494,40.5955028017772,40.5955261884543,40.5955340555298,40.5955460312998,40.5955527333131,40.5955576234552,40.5955586564511,40.5955581168504,40.5955567577378,40.5955545552136,40.5955514976548,40.59553549089,40.5955073630214,40.5954981738201,40.5954834685233,40.5954766549828,40.5954720455034,40.5954658589886,40.5954368682322,40.5954317384429,40.5954278055315,40.595405939953,40.5953854680749,40.5953533214686,40.5953273971499,40.5953235647102,40.5953183084975,40.5952934166575,40.5952891346912,40.5952858987071,40.5952854367343,40.5952851103619,40.5952849001328,40.5952848161207,40.5952850264989,40.5952857319952,40.595288006567,40.5952946511712,40.5952958872236,40.5952966371102,40.5952969289208,40.5952968900912,40.5952967168582,40.5952964080682,40.5952959826082,40.5952954215719,40.5952947267788,40.5952939596872,40.5952931290736,40.5952912262277,40.5952889989369,40.5952864044192,40.5952812327952,40.5952687496536,40.5952633611085,40.5952612067574,40.5952593406172,40.5952577442227,40.5952564073115,40.5952434143782,40.5952309161998,40.5952086484365,40.5951954966771,40.5951938732231,40.5951909068453,40.5951888841533,40.5951767124515,40.5951571462046,40.5951397209831,40.5951176009092,40.5950878906338,40.5950563360434,40.5950446192475,40.5950174377975,40.595007228891,40.594973812712,40.5949584017243,40.5949302611275,40.5949070731079,40.594905837223,40.5949045111486,40.5949030955113,40.5949015908149,40.5948999778149,40.5948982757562,40.5948944945427,40.5948911008427,40.5948871862296,40.594869299305,40.5948649249962,40.5948610806848,40.5948417135424,40.5948305007538,40.5948256531228,40.5948226286868,40.5948180618784,40.5948165815181,40.5948152550673,40.5948091473284,40.5948032075356,40.594785618793,40.5947781498746,40.5947647971688,40.5947602250458,40.5947555938678,40.5947478155517,40.5947382807064,40.5947080401397,40.5946678381456,40.5946532497693,40.5945864585179,40.5945263949443,40.5945138523801,40.594479954061,40.5944482130039,40.5944213451549,40.5944007124798,40.5943672825237,40.5943334436783,40.5943191704534,40.5943049670852,40.5942881807397,40.5942319681483,40.5941888755586,40.5941754683652,40.5941631540831,40.5940708641614,40.5939239938846,40.5938816374303,40.593815102043,40.5937677249099,40.5937268795867,40.5937199822016,40.5937125118228,40.5936771798768,40.5936685207413,40.5936621285364,40.5936606516286,40.5936434786063,40.5935900259677,40.5935807259849,40.5935710302268,40.5935504687357,40.5935486514744,40.593546952174,40.5935453515698,40.593543860885,40.5935411674355,40.5935388376411,40.5935356011718,40.5935301834681,40.5935284758419,40.5935265579466,40.5935253562572,40.5935240627258,40.5935226515748,40.5935211327098,40.5935203321383,40.5935194945692,40.5935177306386,40.5935158310171,40.5935138051032,40.5933552806597,40.5932581737456,40.5932118948606,40.5931790624596,40.5931270446325,40.5931060692274,40.5930885615391,40.5930838205494,40.5930793736243,40.5930637942682,40.5930596646008,40.5930552226703,40.5930166116824,40.593014661711,40.5930127650354,40.593007231013,40.5930049442356,40.5930022087602,40.5930007474499,40.5929992046822,40.5929968974105,40.5929944814377,40.5929919490932,40.5929893008385,40.592983627313,40.5929773601717,40.592965093247,40.5929367327825,40.5929342947419,40.5929317312515,40.5929260743818,40.5929057906287,40.592901799553,40.5928983553097,40.5928963580964,40.5928945038798,40.5928927758816,40.5928919568538,40.5928911639254,40.5928911815341,40.5928905497198,40.5928907009465,40.5928902309489,40.5928897610903,40.5928895954212,40.5928886522586,40.592887382236,40.5928858055581,40.5928842268674,40.5928826334937,40.5928832773422,40.5928836178231,40.5928844631474,40.5928855693317,40.5928871545172,40.5928892448358,40.5928904830693,40.59289186769,40.5929236436093,40.5929413377438,40.5927619164764,40.5926133837814,40.5925935165278,40.5925866615038,40.5925797888002,40.5925771894901,40.5925757221385,40.5925756543971,40.592578596218,40.5925992195545,40.5926032509641,40.5926155244929,40.5926400638351,40.5931923224386,40.5932863110879,40.5932867157861,40.5938752066461,40.5939481280416,40.5939307135187,40.5939282732088,40.5939159578144,40.5939142281245,40.5939012930969,40.5939021344321,40.5938893553966,40.593887666391,40.5938750274346,40.5938743957313,40.5938618024935,40.5938602923691,40.5938482244631,40.5937610237336,40.5937579430712,40.5938631328448,40.5938644952364,40.593945378131,40.5939478436951,40.5938669844304,40.5938818188915,40.5938827018212,40.5938963501473,40.5938987737269,40.5939117772405,40.5939130481836,40.5939247184538,40.5939279636902,40.5939403712833,40.5939419723713,40.5939668517924,40.5942722669942,40.594250579154,40.5942493996889,40.5942424249469,40.5942298271924,40.5942247540961,40.5941884622592,40.5940890132522,40.5940872398654,40.5942821158917,40.5942858520627,40.5942040548772,40.594260864599,40.5942883004791,40.5943032145896,40.5942736157612,40.5942877515425,40.5942985989536,40.5942859777994,40.5943064330322,40.594322123256,40.5943847474068,40.5944048638614,40.5944959752569,40.5944818254182,40.5945558180521,40.594536398598,40.5945630141778,40.5946013096405,40.5945895179087,40.5946630028417,40.5946395791449,40.5945242443782,40.5945026726548,40.5944467343604,40.5944342091769,40.5945058005138,40.5945185105997,40.5945161896847,40.5945163886829,40.5946781998833,40.5948402987507,40.5948690406591,40.5947306425327,40.5948171119799,40.5948239767712,40.5947531427816,40.5947829636318,40.5947875860868,40.5948173710968,40.5948222183498,40.5948517016301,40.5948567653874,40.5948852603587,40.5948868876414,40.5948710846133,40.5948728464242,40.5949372933911,40.5949344864387,40.5949495800877,40.5949527555691,40.5950096836171,40.5950065124942,40.5950204434817,40.5950264504778,40.5951456484506,40.5951490668528,40.5951652800315,40.5951636957568,40.5951557499772,40.5951546525226,40.5951537689241,40.5951524559308,40.5951478928023,40.595142843132,40.5951418832669,40.5951364896143,40.5951355479258,40.595132792763,40.5951149167405,40.5951085611747,40.5950687765874,40.5950627378461,40.5950236865915,40.5950093979213,40.5949908753673,40.5950048138348,40.5951343033169,40.5951495474173,40.595177427938,40.5951795614369,40.5951881402988,40.5951913245313,40.5951751380982,40.5951668350951,40.5951637096249,40.5951636435705,40.5951645667044,40.5951689124725,40.5951761845323,40.5951859543738,40.5951977901839,40.5958787999856,40.595896345325,40.5959416895819,40.5959533352327,40.595990387078,40.5960362518511,40.5961692899479,40.5962635223917,40.5962869666638,40.5963552071995,40.5963695068432,40.5963866750146,40.5964069741751,40.5964385874198,40.5964688676098,40.5964817917565,40.5964875826538,40.5965296817839,40.5965622194395,40.5965725845271,40.59673011,40.5967336283515,40.5967485359317,40.5968565372316,40.5971010781004,40.5971510479981,40.5971790355557,40.5972055158041,40.5972288808881,40.5972378550633,40.5972697432501,40.5973035738324,40.5974150648248,40.5975294610487,40.5975512754154,40.5976253297888,40.5976356757702,40.5976459116876,40.59765586215,40.5976653566573,40.5976746631942,40.5976831108329,40.5976905397974,40.5976958563167,40.5977002890729,40.5977007089771,40.5977059460663,40.5977083282668,40.5977077894254,40.5977065618612,40.5977081346696,40.5977093388686,40.597713869706,40.5977180112122,40.5977200519161,40.597722151987,40.5977304739679,40.5977318874107,40.5977275307368,40.5977231032796,40.5977234808443,40.5977283562465,40.5977325463013,40.5977359673149,40.5977383294443,40.597745745523,40.5977501644147,40.5977542351266,40.5977672743776,40.5977746771366,40.5977804286729,40.5977821812242,40.5977835652759,40.5977888919627,40.5977940873937,40.5977978405773,40.5977990328321,40.5977975421813,40.5977974533258,40.5977999321116,40.5978014030034,40.5978045695875,40.597809675655,40.5978122449685,40.5978175583966,40.5978231823031,40.5978261470299,40.5978286451349,40.5978296804396,40.5978283183539,40.5978279198609,40.5978286778185,40.5978321223654,40.5978344100181,40.5978379546534,40.5978455887395,40.5978541597773,40.5978660126103,40.5978711474753,40.5978726921396,40.597871957353,40.597873528318,40.5978780688414,40.5978824469035,40.5978876734757,40.5978960235582,40.5979218141265,40.5979330808255,40.597943498584,40.5979538804485,40.5979663116773,40.5980025362062,40.5980194023673,40.5980328383911,40.5980403428816,40.5980471184814,40.5980517076974,40.5980615496638,40.5980618678311,40.598059410983,40.5980544863191,40.5980514311476,40.5980520277945,40.5980562490506,40.5980623990149,40.5980679198196,40.5980770664212,40.5980834649728,40.5980909577587,40.598099047859,40.5981034001845,40.5981030616564,40.5980910310958,40.5980854172205,40.5980825536711,40.5980822157042,40.5980840962865,40.5980867956381,40.5980919879913,40.5981109673821,40.5981123856071,40.5981186463809,40.5981198248783,40.598127393044,40.5981441018217,40.598159118393,40.5981682056756,40.5981790123467,40.5981803263388,40.5981756202583,40.5981688536677,40.5981632704489,40.5981613410022,40.5981619676362,40.598167371588,40.5981754947644,40.5981841096904,40.5981880822875,40.5981867502077,40.5981856954829,40.5981859536396,40.5981886509562,40.5981943155249,40.598209252881,40.598219563596,40.5982320515638,40.5982402915979,40.5982512482106,40.5982606540849,40.5982719000215,40.5982820200581,40.5982923007136,40.5982970880331,40.5982964725724,40.5982923926145,40.5982909287339,40.5982914979985,40.5982945938473,40.5982981852698,40.5983081167089,40.5983159887046,40.5983236599577,40.5983246897259,40.5983308503552,40.5983626359065,40.5983697618187,40.5983762904927,40.5983856531098,40.5983963018045,40.5984011491147,40.5984036595573,40.5984037575239,40.5984030810511,40.5984024949113,40.5984063769979,40.5984110641897,40.5984132848158,40.5984167756219,40.5984219208211,40.5984298721566,40.5984420308784,40.5984477711363,40.5984531476074,40.5984593387389,40.5984632788017,40.5984824362101,40.5984879702034,40.5984964993274,40.5985035535749,40.5985114260063,40.598518989508,40.5985213381599,40.5985219174028,40.5985205247336,40.5985187528588,40.5985180468193,40.5985216225214,40.5985290058881,40.598535049633,40.5985500281652,40.5985665994614,40.5986043260505,40.5986181412289,40.5986500183842,40.5986885522168,40.598697897559,40.5987081181163,40.5987158101177,40.5987227285538,40.5987316764925,40.5987399976395,40.5987501571767,40.5987677242315,40.5987820359717,40.5987923454263,40.5988074327004,40.598816649109,40.5988273952392,40.598844304553,40.5988567552863,40.5988729714773,40.598880414182,40.5988914938718,40.5988988883349,40.5989072397365,40.5989221781567,40.598933187696,40.59893569293,40.5989356557485,40.5989313938066,40.5989294390858,40.5989259495747,40.5989228489546,40.5989122053013,40.5989013558875,40.598900225419,40.5988974430681,40.598888841589,40.5988857978121,40.5988751022578,40.5988705134269,40.5988564363686,40.5988527560017,40.5988510530653,40.598851337404,40.5988535895604,40.5988616630893,40.5988874133565,40.5988897293552,40.598893177437,40.5988963092695,40.5989011375986,40.598915250237,40.598954969994,40.5989771698413,40.5989887382165,40.5990504158316,40.599112345348,40.5991164996269,40.5991229021577,40.5991423022463,40.5991516646199,40.5991812410819,40.5991838994392,40.5992005712572,40.5993117393886,40.5993124045617,40.5993382057902,40.5993373550428,40.5993907611358,40.5993928602,40.5993394435507,40.5993388162156,40.5993116801896,40.5993125203456,40.599211164654,40.5991887295697,40.5991915461616,40.5991623604783,40.5991754938956,40.5991994230632,40.5992043680686,40.5993291074451,40.5993315591238,40.5992760489842,40.5992763856541,40.5991825683778,40.5992122522724,40.5992581446571,40.5992578842922,40.5992581380972,40.5993210384954,40.5993195085901,40.5993693949668,40.5993699308154,40.5993733706235,40.5993733535704,40.5993223455272,40.5993205269961,40.5992584942159,40.5992647013439,40.5992628992,40.5992364395867,40.5992140756913,40.5991962909753,40.5991834699076,40.5991758896531,40.5991737140811,40.5991769902228,40.5991858112782,40.5992003287923,40.59922038319,40.599245754035,40.5993010402406,40.59932182829,40.5993283658035,40.5993205385259,40.5993760075915,40.5993773385264,40.5993869542501,40.5994433257097,40.5994448297986,40.5994622167045,40.5994673042155,40.5994967621491,40.5994985311247,40.5994726762686,40.5994827857728,40.5994548390531,40.5994337569543,40.5994196552252,40.5994126112894,40.5994132072575,40.5994207370939,40.5994351604318,40.5994563999489,40.599484341782,40.5995188361371,40.5995596980923,40.5996067085891,40.5996596156068,40.5997181355126,40.599781954583,40.5997941026755,40.599827864602,40.599859960863,40.5998696151986,40.5998792705416,40.5998910796026,40.5999128681575,40.599932396136,40.5999385933986,40.5999614512669,40.5999641279968,40.599962120522,40.5999782978007,40.5999811833394,40.5999802602665,40.5999788090955,40.5999714582235,40.5999747977429,40.599989634923,40.5999992029299,40.6000008387974,40.5999925262003,40.5999945656579,40.6000013470622,40.600003331686,40.599993739484,40.5999736345618,40.5999635542071,40.5999649563234,40.5999716389286,40.5999678599183,40.5999580194029,40.5999571681148,40.5999640018909,40.6000077892222,40.6000133664679,40.6000221318537,40.6000227063662,40.6000239743161,40.6000272671284,40.6000351519799,40.6000583686293,40.6000673629361,40.6000664308259,40.6000594677414,40.6000630492765,40.6000517054417,40.6000352580986,40.6000337648448,40.6000256391968,40.6000107951275,40.5999772820162,40.5999682512784,40.5999692811976,40.6000074345967,40.600033316778,40.6000353796681,40.6000289434788,40.6000248018632,40.6000271499822,40.6000352147097,40.6000498965534,40.6000643402781,40.6000691539803,40.6000783893365,40.6000931964672,40.6001047802864,40.6001271786343,40.600149664106,40.6001718698041,40.6001839358487,40.6001959936785,40.600219679102,40.6002359377294,40.6002664868222,40.6002790731048,40.6002921608699,40.6003008421061,40.6003080466196,40.6003135133583,40.600318755322,40.600322738612,40.6003289540618,40.6003319700629,40.6003357311697,40.6003479584863,40.6003514372779,40.6003633137481,40.6003798495715,40.6004040147766,40.6004298951447,40.6004459133041,40.6004688456959,40.6004895674999,40.6005144671936,40.6006098403205,40.600637423118,40.6006719217894,40.6006997698662,40.6007271177662,40.6007554403466,40.6007869609185,40.6008157680639,40.6008386587554,40.6008630256476,40.600883942065,40.6009097718285,40.6009316693844,40.6009535922356,40.6009706003128,40.6009908237136,40.6010041633435,40.6010192066809,40.6010423400902,40.6010642340244,40.6010775136926,40.6010935118778,40.6011058299857,40.6011159563595,40.6011261001377,40.6011350242719,40.6011407392764,40.6011459730349,40.6011492318537,40.6011507846868,40.601151592259,40.6011550828619,40.6011637553253,40.6011743860579,40.6011879568848,40.6012022696941,40.6012205172851,40.6012375271675,40.6012513025983,40.6013791152565,40.6014398398085,40.6014662306091,40.6014867467518,40.6015136058316,40.6015479214958,40.6016102747792,40.6016511117308,40.6016843630704,40.6017108670742,40.601782163896,40.6018869041887,40.6019721944871,40.6020196494707,40.6020790977308,40.6021921535019,40.6022447401658,40.6022940358246,40.6023448471624,40.6023714804183,40.6023964028683,40.6024430516456,40.6025134107248,40.6025865129177,40.6026336294036,40.6026672821826,40.6026963684642,40.6027329778023,40.6027608209214,40.6027970890243,40.6028170404637,40.6028453523936,40.6028816854612,40.6029071714483,40.6029372598266,40.6029605992349,40.6029796135727,40.6030187418998,40.6030470856595,40.6030863085387,40.6031133446354,40.6031264841601,40.6031362660834,40.6031381222969,40.6031315197454,40.6031271306428,40.6031174146867,40.6031166554337,40.6031249683418,40.6031363003501,40.6031543470163,40.6031723598839,40.6031891950029,40.6032063690586,40.6032190395605,40.6032316786135,40.6032389741853,40.6032555155772,40.603250206179,40.6031946590385,40.6031587278162,40.6031505941647,40.6031383757783,40.6031225098626,40.6031140947608,40.6031137290527,40.6031048041314,40.603074726411,40.6030671489338,40.603047449752,40.6030320628744,40.6030097754698,40.602975672139,40.6029517499315,40.6029304420821,40.6029042403112,40.6028740815928,40.6028402840002,40.6028032039845,40.6027632326146,40.6027230415177,40.6026461172369,40.602677115852,40.6025954230434,40.6025096588348,40.6024199504769,40.6023264310723,40.6023227050856,40.6023060529344,40.6022830843294,40.6022597472821,40.6022421605113,40.6022159082264,40.6021983199987,40.6021775453092,40.6021482434173,40.6021344040796,40.602113270031,40.6020898288454,40.6020649727843,40.6020402578237,40.6020121957495,40.6019907085874,40.6019743490511,40.6019473174909,40.6019298806033,40.6019060477344,40.6018795235049,40.6018646082679,40.6018402865703,40.6018130484379,40.6017874807032,40.6017643933193,40.6017512051472,40.601728282745,40.6016988289497,40.6016764581842,40.6016607858868,40.6016396253557,40.6016177864578,40.6016021574648,40.6015735765831,40.6015570555919,40.6015307803024,40.6015124896957,40.6014888543846,40.6014670238658,40.601441980823,40.6014182110499,40.6013962192511,40.6013704645845,40.6013530349823,40.6013309519575,40.6010410521853,40.6009953025485,40.6009373915059,40.6008544686558,40.6006428178045,40.6005388578011,40.6004795826302,40.6003801151666,40.6003234713718,40.6002398575764,40.6001855107473,40.6001520208667,40.6001282681377,40.6001132298236,40.6000985749871,40.6000834523584,40.600060669679,40.6000424548237,40.6000198847163,40.6000074681815,40.6000041921276,40.5999942887825,40.5999974926311,40.5999810929738,40.5999718149267,40.5999436948052,40.5999272623767,40.5999116164417,40.5998924944759,40.5998729079246,40.5998540413607,40.5998370197528,40.5998178236597,40.5998013980837,40.599760263189,40.5997466736187,40.5997286234402,40.5997216403123,40.5997156072601,40.5997007131254,40.5996567396831,40.5995896249225,40.5995691453302,40.5995428871054,40.5995181095509,40.5994941328719,40.5994594928768,40.5994370452165,40.5994142426666,40.5993942104134,40.5993755503073,40.5993485204247,40.5993363146678,40.5993237615576,40.5993078076636,40.5992832509096,40.5992709225722,40.5992651180694,40.5992179792524,40.5991982843415,40.5991528489639,40.5991242618813,40.5990960705636,40.5990818445016,40.5990566216593,40.5990380756488,40.5990136976343,40.5989606097415,40.5989042499439,40.5988627566519,40.5988464158162,40.5988263192676,40.5988017842431,40.5987805046762,40.598754667354,40.5987358258881,40.5987149545097,40.5986662988522,40.5981208447462,40.5981036589635,40.5980590039796,40.5980123147165,40.597968144917,40.5979015406648,40.5978566197123,40.5977910823662,40.5977572075249,40.5977181416692,40.5976512025058,40.5975849178627,40.5975483187382,40.5975228395453,40.5974971907238,40.59748030613,40.5974604668219,40.597436895977,40.5974128224227,40.5973972494033,40.5973910819129,40.5973801684426,40.5973386287542,40.5972947540277,40.5972492508473,40.5972002925976,40.5971507191,40.5970817974312,40.5970422616206,40.5970111469834,40.5969704873758,40.5969449985134,40.5969231614139,40.5968910225142,40.5968687318495,40.5968420603462,40.5968236337802,40.5968039746874,40.5967873488219,40.5967357560803,40.5966956419797,40.5966744035473,40.5966265216513,40.5965083384491,40.5964890754553,40.596475894873,40.5964594343439,40.5964340125889,40.5964206977485,40.5963905420436,40.5963430976156,40.596298763664,40.5962367887184,40.5962068059852,40.5961861460623,40.5961609196515,40.59612119194,40.5960724838805,40.5960552649155,40.5960292846473,40.5960052065332,40.5959834493181,40.5959611834065,40.5959111555779,40.5958812981177,40.5958105604294,40.5957612302152,40.595695454924,40.5956320043472,40.5955690563093,40.5955222401058,40.5954729090466,40.5954476393404,40.5953998610397,40.5953722812336,40.5953227077565,40.5952778641855,40.595234116292,40.5951900027668,40.5951376004212,40.5951150277422,40.5950935796223,40.595055555871,40.5950337263986,40.595013137764,40.5949908948573,40.594975521495,40.5949448789097,40.5949234842349,40.5949106861821,40.5948977212873,40.5948819734336,40.5948621614325,40.5948441957886,40.5948328546839,40.594808610503,40.5947827015795,40.5947674596719,40.5947572959525,40.5947523516625,40.5947526955109,40.5947627426854,40.594771302719,40.5948259869111,40.5948259950865,40.5949601362763,40.5949518002998,40.5949902479694,40.5950030121444,40.5950576930089,40.5952080973895,40.595253841335,40.5952644497454,40.5952773010553,40.5952921730691,40.5957357172439,40.5957446442724,40.5960300067138,40.5960855415233,40.5960814332706,40.5960933958843,40.5961083847728,40.5960972784233,40.5960888990854,40.5960333642749,40.5960214325626,40.595964226875,40.5959515055822,40.5958968202901,40.5958146854418,40.5957746431196,40.5957463255578,40.5957126379309,40.5956779772361,40.595668264967,40.5956096168461,40.595588704302,40.5954720630821,40.5954538860934,40.5952661544472,40.5952548393854,40.5952114981355,40.5951977989104,40.5951955389148,40.5951163554375,40.5950739493855,40.5950602441273,40.5949807840561,40.594989119499,40.5948558355794,40.5948616554038,40.594848839218,40.594841310437,40.5948276406946,40.594827659089,40.594786644636,40.5947891689927,40.5947712270994,40.5947650853682,40.5947519659131,40.5947538213939,40.5947600953514,40.5947682022728,40.5948178274536,40.594819577941,40.5948691580156,40.5948691294688,40.5948981687001,40.594910936853,40.5949801866744,40.5949930449825,40.5950614364966,40.5951133439491,40.5951452181636,40.5951580846799,40.595227322266,40.5952400949407,40.5952658950107,40.5952989025394,40.595321299727,40.5953913183145,40.5954041728919,40.5954749520671,40.5954928840944,40.5955552968085,40.595568895381,40.5956381590756,40.5956510081226,40.5957201833382,40.5957329407243,40.5958012884926,40.5958141326807,40.5958849909386,40.5958970004714,40.5959661713287,40.5959789308931,40.5960481989394,40.5960419772493,40.5960539321539,40.5960665732409,40.5960666033116,40.5960713197045,40.5960602114444,40.5960537690057,40.5960514161062,40.5959822388991,40.5953115948049,40.5952744537338,40.5952665957373,40.5950647130535,40.5950066465902,40.5949014638112,40.5948724140186,40.5948715756559,40.5948228747985,40.5948237085622,40.5947734814208,40.5947799173832,40.5948073107434,40.5948086231333,40.5948024264277,40.5947155439945,40.5947171864502,40.5947264327216,40.5947458833454,40.5948207365171,40.5948241280109,40.5947449949227,40.594728124894,40.5947195968483,40.5947313897291,40.5947361623295,40.5947438562886,40.5948342701533,40.594838517917,40.5947472873326,40.5947385242991,40.5947333372204,40.5947372503093,40.5947436685546,40.5947649344202,40.5947779891733,40.594792736702,40.5948088307724,40.5948258935368,40.5948435244051,40.5948425638353,40.594840900033,40.5948426110431,40.5949383009254,40.594948532044,40.59499808151,40.5949972489564,40.5950527219272,40.5950654830616,40.595149228056,40.5951869449245,40.5952458057373,40.5952593827499,40.5952790387114,40.5953414690076,40.5953543323562,40.5954372125399,40.5954599636085,40.5955336330362,40.595545735304,40.5956294600147,40.5956422409207,40.5956816374634,40.5957370598191,40.5958216367659,40.5961215662952,40.5962044437846,40.5961969820469,40.5962089435033,40.5962280399114,40.596217788285,40.5962069468799,40.5961232200315,40.5961112857676,40.596069954112,40.5960064131736,40.5959318565687,40.5958869730019,40.5958362135418,40.595823438593,40.5957396453774,40.5957285516259,40.5956439968179,40.5956320674107,40.595548278546,40.5955363459567,40.5954525597719,40.5954390408283,40.5953569128816,40.5953440561605,40.5952800912677,40.5952595018451,40.5952475707644,40.5951763059943,40.595151844275,40.5950005995878,40.5949997638135,40.5949502081962,40.5949518934268,40.5948656029916,40.5948626325204,40.5948604759002,40.5949974662479,40.594956139403,40.5949467896526,40.5949497855237,40.5949628934359,40.5949776459705,40.5950022325183,40.5950216884352,40.5950449408198,40.5951130163302,40.5951360601118,40.5951604939427,40.5951765434675,40.5951937649754,40.5951987221258,40.5951875840012,40.5951851464922,40.5951858770857,40.5951843909018,40.5951858667194,40.5951923167766,40.5951969703373,40.5952091100812,40.5952335470971,40.5952822131255,40.5952982223885,40.595339913672,40.5953855476131,40.5954262622216,40.5954747563321,40.5955225812777,40.5955456748842,40.5955700788089,40.595590519864,40.5956079075522,40.5956259644041,40.595645882253,40.5956677499671,40.5956921237147,40.5957154378587,40.5957376752885,40.5957591424773,40.5957931050238,40.595809088065,40.5958299343152,40.5958505976542,40.5958777372638,40.5959015142895,40.5959134179123,40.5959286474133,40.5959527780753,40.5959744952633,40.5959917283561,40.5960156410924,40.5960298107174,40.5960518889409,40.5960772987654,40.596101960104,40.5961242516696,40.5961506313769,40.5961780836388,40.5961950301658,40.5962181579251,40.5962395888185,40.5962839068103,40.5963096155393,40.5963351714301,40.5963605683739,40.5963835806238,40.5964053228876,40.5964306320309,40.5964537237488,40.5964780452358,40.5965060603172,40.5965284395203,40.5965775253224,40.5966016864738,40.5966207786855,40.5966447034963,40.5966615623385,40.596688194247,40.59671100839,40.5967329137645,40.5967571636174,40.5967735104419,40.5967806387234,40.5967878969902,40.5968069782243,40.5968295170513,40.5968461893585,40.5968673363271,40.5968909758272,40.5969167577866,40.5969404350752,40.596969767472,40.5969919600349,40.5970179683293,40.59704311476,40.5970676698314,40.5970911459456,40.597101194329,40.5971112345076,40.5971403422797,40.5971632354187,40.5971853399071,40.5972089677184,40.597258249002,40.597280944872,40.5972977144812,40.5973095894447,40.5973214550472,40.5973389572188,40.59735375044,40.5973612149078,40.5973816644024,40.5974038686947,40.5974125113571,40.5974211540428,40.5974371908422,40.5974491718124,40.5974611516119,40.5974820889685,40.59750882712,40.5975249271276,40.5975987330701,40.5976489760046,40.5977185327826,40.5977882765636,40.5978353565264,40.5978827580797,40.5979284921189,40.5980199273827,40.5980916759766,40.5981613540683,40.5982067736736,40.598226339946,40.5982470379058,40.5982639717166,40.5982767819315,40.5982911175242,40.5983051870716,40.5983146499108,40.5983307808594,40.5983323634413,40.5983269512693,40.5983270052862,40.5983348660898,40.5983455595246,40.5983618123386,40.5983739909014,40.598385827634,40.5983976643653,40.5984132919785,40.5984272931713,40.5984430066878,40.5984658901352,40.5984724496814,40.5984908283417,40.5985013704239,40.5985208516789,40.5985386692001,40.5985536864793,40.5985674448285,40.5985912062473,40.5986152815045,40.5986330647602,40.598651852035,40.5986821257432,40.598696343847,40.5987188384387,40.5987339149302,40.5987496095273,40.5987647738088,40.5987795407402,40.5987955588528,40.5988043472761,40.5988247717376,40.5988457492777,40.5988655262976,40.5988723274342,40.5988849497311,40.5989157521672,40.5989298139013,40.5989465844025,40.5989680906955,40.5989722016619,40.5989889002699,40.5990097578042,40.5990325046199,40.5990566491491,40.59908126029,40.5990974617785,40.5991194181438,40.5991339866318,40.5991413198996,40.5991568606517,40.5991790284228,40.5991931263674,40.5991970954685,40.5992029310966,40.5992148480508,40.5992288291074,40.5992474146604,40.5992541614694,40.5992586088085,40.5992656476338,40.599283325391,40.599296451003,40.5993323861851,40.5993693961466,40.5994059324634,40.5994269131695,40.599439859237,40.5994457752097,40.5994419646608,40.5994433008924,40.5994520990069,40.5994704899946,40.5994833821777,40.5995041993594,40.5995191857358,40.5995326579347,40.5995805776758,40.5995954415659,40.5996067384981,40.5996180349464,40.5996279755201,40.5996379160943,40.5996573289412,40.5996665840998,40.5996806430249,40.5996899680067,40.5997112619122,40.5997357535978,40.5997588374512,40.5997834297956,40.5998068320494,40.5998271470243,40.5998489980924,40.5998703644124,40.5998834143613,40.5999178387461,40.5999609527717,40.5999799833498,40.5999989037143,40.6000186331783,40.6000303950686,40.6000409830685,40.6000515632987,40.6000623429286,40.6000732722824,40.6000833669544,40.6000975243803,40.6001079649943,40.6001132044054,40.6001115163324,40.6001155908396,40.6001372485292,40.6001634861503,40.6001908634102,40.6002046395701,40.6002337892553,40.6002468490456,40.6002618760075,40.6002725721564,40.6002817314644,40.6002949852881,40.6003164918147,40.6003380887093,40.6003680337563,40.6004221412999,40.6004603445611,40.6005046431701,40.6005689284959,40.6006672657775,40.6006297257064,40.6006486187517,40.6007117570642,40.6005932618931,40.6005966458366,40.6006414545477,40.60066461563,40.6006850934225,40.6007090210393,40.6007296855599,40.6007612811071,40.6007971945209,40.600918237942,40.6009839328683,40.6009599105217,40.6009198246729,40.6008163836285,40.6008460216011,40.6008679794724,40.6008928703992,40.6009181384152,40.6009882699238,40.6010177476023,40.6010464808862,40.6010782811597,40.6010923491452,40.6011368344618,40.6011617585187,40.6011865296924,40.6012161700719,40.6012411276914,40.6012627661049,40.6012885166904,40.6013170297884,40.6013360429796,40.6013583693775,40.6013822459309,40.6014038933746,40.6014425036478,40.6014581730453,40.60149511683,40.6015180217085,40.6015377675959,40.6015691784475,40.6015819328787,40.6015896477717,40.60159910488,40.6016051261475,40.6016114524097,40.6016180170051,40.6016356887332,40.6016375529427,40.6016366002337,40.6016377266988,40.601643694861,40.6016489606668,40.6016676240123,40.6016792989381,40.6016793350031,40.6016729509885,40.6016727323213,40.6016992748362,40.6017071210938,40.6017019362262,40.6017137605876,40.6017250514319,40.6017370382072,40.601743579672,40.6017525285438,40.6017637037956,40.6017762741994,40.6017873904628,40.601800098583,40.6018311014538,40.6018585473675,40.6018853489276,40.6019164390098,40.601949368442,40.6019810036057,40.6020271259529,40.6020690276031,40.6021044225169,40.6021407872861,40.6021754461664,40.6022027087537,40.6022181200596,40.6022368120484,40.6022765637282,40.6022979565654,40.6023932497515,40.6024536446978,40.6024963648066,40.6025409812399,40.6025634387428,40.6025846913936,40.6026518291057,40.6026834583703,40.6027164671002,40.6027351537777,40.6027600958978,40.6028046487028,40.602852264827,40.6029028664376,40.6029285663408,40.6029779259868,40.6030373472988,40.6030590999854,40.6030764049194,40.6031270484233,40.603166349703,40.6032281511808,40.6032925772154,40.603336016849,40.603385275868,40.6034715843361,40.6035411269899,40.6035896020462,40.6036175010959,40.6036431958984,40.6036705479262,40.6037149281874,40.6037609923505,40.6038147468935,40.603837725865,40.6038576237823,40.6038778155822,40.6038985197643,40.6039156905739,40.6039314671539,40.6039371335113,40.6039303590508,40.6039320953604,40.6039475413919,40.6039609755029,40.6039722385232,40.6040203300584,40.6040272448074,40.6040478363137,40.6040642576344,40.6040702996199,40.6040943895812,40.6041189387986,40.6041424797822,40.6041663098412,40.6041997934129,40.6042160843275,40.6042331628901,40.6042501149999,40.6042724487112,40.6042952797496,40.6043134120328,40.6043279051775,40.6043608934398,40.6043689367213,40.6043903634623,40.6044036371913,40.6044169039086,40.6044224137841,40.6044357024462,40.6044518335114,40.604459715173,40.6044729430081,40.6045117965503,40.6045362548179,40.6045549740185,40.6045870601519,40.6046750192797,40.6046859883657,40.604696958144,40.6047134805444,40.6047293055676,40.6047509906269,40.6047768066083,40.6047994510521,40.6048244251169,40.6048652629705,40.6048803974514,40.6049028915348,40.6049253454986,40.6049396176019,40.6049596216203,40.6049712981071,40.6049806963254,40.6050135354341,40.6050450901588,40.6050499150456,40.6050583674584,40.6050744034084,40.6050868721936,40.605111705373,40.6051539449467,40.6051767280584,40.6051974325167,40.6052193591061,40.6052364351216,40.6052478962025,40.6052593573047,40.6052861954824,40.6053087724773,40.6053244364318,40.6053628451868,40.6053807457386,40.605395180386,40.6054071239467,40.6054339610303,40.6054766821805,40.6054957626145,40.6054980050647,40.6055109908277,40.6055062462443,40.6055170300001,40.6055318168325,40.6055464896518,40.6055577451436,40.6055767088858,40.6055908435967,40.605596687258,40.6055904435629,40.605587278468,40.6055978775476,40.6056078506377,40.605617822553,40.6056349806641,40.6056556952827,40.6056782575884,40.6057026759086,40.6057196223274,40.6057367801679,40.6057527614366,40.6057836107923,40.6058122560251,40.6058355856748,40.6058553042771,40.6058852525618,40.6059241225631,40.6059528219044,40.6060126932646,40.6060520232931,40.60606160188,40.6060818573492,40.6060876962213,40.6061034127956,40.6061089661922,40.6061258343008,40.6061563971791,40.6061751344013,40.6061856081054,40.6061917332018,40.6062154307288,40.6062331948936,40.6062536435365,40.6062540789733,40.6062782103483,40.606298863368,40.6063106612881,40.6063247460785,40.606332104712,40.6063541670297,40.6063687435289,40.6063798683252,40.6063860281578,40.6063872106951,40.6063959479689,40.6064137967985,40.6064839870741,40.6065189274195,40.606550772073,40.6065838797573,40.6066394099396,40.6067409701343,40.6068404391771,40.6069049844676,40.606944058645,40.6070237442174,40.6070747224023,40.6071004548806,40.6071187595474,40.6071590026694,40.6071756305088,40.6072172783957,40.6072533843457,40.6072702593328,40.6072844135248,40.6073272972285,40.6073433686048,40.6073691838019,40.6074049553502,40.6074434837317,40.6074884119375,40.6075436235694,40.6075991110306,40.6076368131918,40.607866524163,40.6079070540288,40.608425974828,40.6085633537548,40.6092262606824,40.6093073618075,40.6095502680002,40.6096025973846,40.609643663429,40.6097061806309,40.6097605626938,40.6098045808687,40.6098397385704,40.6098491130919,40.6098532205897,40.6098482718862,40.6098352029453,40.6098082243946,40.6097729122764,40.6097459626824,40.6096952195112,40.6096558382424,40.6096490383917,40.6096582603254,40.6096781173232,40.6096911285405,40.6097405201889,40.6097417771056,40.609743023632,40.6097419766898,40.6097374069644,40.6097180190495,40.6097035471469,40.6096665576169,40.6096090014369,40.609520785203,40.6094185674732,40.6093581994216,40.6092900269216,40.6091916818316,40.609080924632,40.6089496521835,40.6088932316353,40.6088586567388,40.6088095550174,40.6087465958681,40.6087068289997,40.6086962109182,40.6086514009889,40.6086011286403,40.6085652194881,40.608523300347,40.6084650167804,40.6084479275353,40.6084355712145,40.608431821663,40.6084324456014,40.6084361765362,40.6084421017758,40.6084480276766,40.6084512370355,40.6084509183162,40.6084471724092,40.6084166322238,40.6084108315393,40.6084089884489,40.6084056880831,40.6083995631124,40.6083931956151,40.6083801338114,40.6083660848664,40.6082670303663,40.6081843006212,40.6081687523628,40.6081528459077,40.6081371041164,40.6079357407257,40.607919878452,40.607897600316,40.6078763673209,40.6078559252336,40.6078366251677,40.6078160213455,40.6077823517299,40.6077457867562,40.6077025613209,40.6076366389715,40.607616824116,40.6075826437729,40.6075654501468,40.6075337838957,40.6075193030647,40.6074949016261,40.6074748742998,40.6074569434933,40.6074425622813,40.6074319642817,40.6074252377921,40.6074210845743,40.6074169325241,40.6074153878831,40.6074138425916,40.6074140086355,40.6074153767711,40.6074162706769,40.6074176488826,40.607424105881,40.6074306618567,40.6074382294927,40.6074449440826,40.607452080043,40.6074680041793,40.6074837872236,40.6075454143574,40.6076004590428,40.6076501909792,40.6077157568232,40.6077484122341,40.6077646473122,40.6077865849974,40.6078026144459,40.6078214964224,40.6078368989871,40.6078584082518,40.6078792559549,40.6078941148793,40.6079189982548,40.6079904957192,40.6080159443745,40.6080248331597,40.6080825165979,40.6081598444125,40.6082077654969,40.608233031338,40.608287764522,40.6082999951814,40.6083122253386,40.6085509430003,40.6085775330351,40.6085912932325,40.6086050517767,40.6086341573823,40.6086713107661,40.6087366896154,40.6087822846916,40.6087980415996,40.6088129457808,40.6088232532889,40.6088355923724,40.6088811813915,40.6088983944042,40.6089372462673,40.6089589114264,40.608970332939,40.6089915512412,40.6090020274527,40.6090601289262,40.6091434482637,40.6091551193779,40.6091772743977,40.6091969018586,40.6092060454095,40.6092214706352,40.6092226485893,40.6092230892126,40.609223022497,40.6092222490392,40.6092199049112,40.6092174213517,40.6092107342025,40.6092068254279,40.6092027276598,40.6091985908988,40.6091945528595,40.6091907542482,40.6091889454479,40.6091872256009,40.6091855771379,40.6091840263428,40.6091825570085,40.6091811958935,40.609141401631,40.6091069644397,40.6089823444638,40.6089245056527,40.6089033676901,40.6088788078745,40.608790362784,40.608756632539,40.6087259056928,40.6086936210383,40.6086582879432,40.6085541539102,40.608519592191,40.6084872408003,40.6082607777074,40.6081931391406,40.6081665236516,40.6081260929965,40.6080985250736,40.6080654202707,40.6080405826534,40.6080258413622,40.6080000641467,40.6079379114609,40.607921566246,40.6079071780813,40.6078509052871,40.6078320948175,40.6078157576972,40.6077941916136,40.607746911809,40.6077244961148,40.6076572987677,40.6076314007238,40.6076070953776,40.6075796168242,40.6075505046794,40.6075300623127,40.6075103462859,40.6074806242756,40.6074639296591,40.6074506499926,40.607436553022,40.6074218536481,40.6074033175605,40.6073891098153,40.6073794962322,40.6073510472761,40.6073405010973,40.6072976565928,40.6071221020348,40.6069321171644,40.6068113514632,40.606778731751,40.6067421936597,40.606596151858,40.6065259673208,40.6064772608756,40.6063762345607,40.6063300012563,40.6062720484239,40.6062349998356,40.6061694735633,40.6061249180699,40.6060265710452,40.6059838596258,40.6059562150156,40.6058858062484,40.6058539463488,40.6058294343513,40.6057690180187,40.6057404124939,40.6057192701076,40.6056981277456,40.605662327068,40.6056296074905,40.6055992856636,40.6055672533428,40.6055045679887,40.6053974231215,40.6053266259788,40.6052935982167,40.6052579880099,40.6052190022554,40.6051950326675,40.6050796844298,40.6046293726735,40.6045980120356,40.604564431688,40.6045205790364,40.6045002563185,40.6044488217653,40.6044236088284,40.604405509644,40.604396721964,40.6043920712965,40.6043908016869,40.604393191902,40.604398418967,40.604417996996,40.6044210428585,40.6044205341894,40.6044170092184,40.6044097790206,40.6043986152009,40.6043857170191,40.6043749828686,40.6043557767291,40.6043246483892,40.6043069648173,40.6042775835631,40.6042453524403,40.6042015582439,40.6041613707685,40.6041259425468,40.6041125132324,40.6041008608055,40.6040976152728,40.6040961221082,40.6040963787406,40.6040983947308,40.6041023352926,40.6041105586053,40.6041217374452,40.6041539627101,40.6041615874162,40.6041666497693,40.604169915816,40.6041650865427,40.6041573088679,40.6041338385089,40.6040957821712,40.6040704012004,40.604039149589,40.6039309283259,40.6038761614191,40.6037259958061,40.6036823878344,40.6035847833146,40.6035056066301,40.6034716817535,40.6034457276629,40.6034155619671,40.6033854606521,40.6033090459592,40.6032690736664,40.6032296193976,40.6031547712569,40.6031237949821,40.6030909846274,40.6030608403143,40.6030270411423,40.6029339649109,40.6027528944023,40.602739073692,40.6027339354857,40.6027342285036,40.6027455256652,40.6027596293158,40.6027765506581,40.6027933733311,40.6028038415657,40.6028295418237,40.6028451609553,40.6028756694694,40.6029485817401,40.6029807428678,40.6030056653307,40.60303001236,40.6030422064307,40.6030469839354,40.603048067544,40.6030474250657,40.6030458365398,40.6030434496249,40.603040299588,40.6030364604429,40.6030342859014,40.6030294443934,40.6030210489132,40.6029925462246,40.6029360562036,40.6029088313348,40.6028583063488,40.6028147406705,40.6027840621819,40.6027467498019,40.6026742309655,40.6026447486921,40.6026087119417,40.6025726653168,40.6025445969841,40.6025380749177,40.602524955659,40.6025133174222,40.6025034594095,40.6024956737955,40.6024901875921,40.6024871410232,40.6024868684833,40.6024865959621,40.6024885805005,40.602492615876,40.6024961600771,40.6024985024854,40.6025091234249,40.6025169692179,40.6025218122809,40.6025235121304,40.6025220194588,40.6025173775641,40.6025097210944,40.6025002049594,40.6024885583801,40.6024750673677,40.6024481766434,40.6024075310622,40.6023639023322,40.6023177540765,40.6022636784055,40.6022077782881,40.6022019508665,40.6021970773654,40.6021932858754,40.6021906760481,40.602189316478,40.6021892428985,40.6021943481754,40.6021991674916,40.6022035703104,40.6022074373762,40.602210663945,40.6022131626213,40.6022148657256,40.6022157271273,40.6022157234942,40.6022148549247,40.6022131449451,40.6022105199965,40.6022071100598,40.6022030152802,40.6021983559159,40.602193268806,40.6021879033519,40.6021824171297,40.602176971262,40.6021717256865,40.6021621791649,40.6021502560992,40.6021381597176,40.6021287257445,40.602120215863,40.6020931257313,40.6020715095299,40.6020548597264,40.6020411939595,40.6020108788796,40.6019892746089,40.6019577628689,40.6019249038566,40.6018446093228,40.6018096352392,40.601757264878,40.6017218813313,40.6016916007395,40.6016661829881,40.6014726697611,40.6014506838252,40.6014166863571,40.6013918490551,40.6013570852112,40.6013390600153,40.6013220964025,40.6013064795309,40.6012883441457,40.6012735503007,40.6012625321375,40.6012556129957,40.6012416631145,40.6012257819441,40.6012083527378,40.6011897961065,40.6011521490318,40.6011137956823,40.6010773407749,40.6010581769076,40.6010400373323,40.6010017339175,40.6009665522041,40.6009348459824,40.600897492658,40.600862860972,40.6008310819821,40.6008208829795,40.600812136989,40.6008050643829,40.6007998433687,40.6007966055001,40.6007954323612,40.6007963535114,40.6007993457408,40.6008043336543,40.6008451004354,40.6008444914237,40.6008435211177,40.6008422184412,40.6008406222254,40.6008387800518,40.6008367468336,40.6008345831786,40.6008323535831,40.6008301245088,40.6008279624019,40.6008259317124,40.6008240929728,40.6008225009939,40.6008212032308,40.6008202383683,40.6007549801213,40.6007480793574,40.6007389699081,40.6007278673074,40.6007150342482,40.6007007743667,40.6006791311068,40.6006547027081,40.6005762770234,40.6005326076139,40.6005141866368,40.6004828494938,40.6004398899449,40.6004203453291,40.6004020853031,40.6003855410858,40.600371153998,40.6003657745637,40.6003617397134,40.6003576869653,40.600358985321,40.6003656365628,40.60037015877,40.6003764580257,40.6004074058929,40.6004186169877,40.6004676093149,40.6004987443011,40.6005201382652,40.600539580194,40.6005398807261,40.6005459407975,40.6005550555538,40.6005673092426,40.6005829372832,40.6005983329294,40.6006076129015,40.6006299348582,40.6006499887406,40.6006830862063,40.6007284166494,40.6007369120148,40.6007454062235,40.6007505988987,40.6007524994752,40.6007510713187,40.6007383940652,40.6007274290338,40.6006978328453,40.600650374904,40.6005804617295,40.6005074836227,40.6002168327437,40.600165792378,40.6001154491071,40.6000550020549,40.600004182769,40.599947754527,40.5999169084492,40.5998609731182,40.5998165825567,40.5997709466373,40.5997236300598,40.5996314077965,40.5995919737743,40.5995462699792,40.5994873607295,40.5994079784734,40.59935143784,40.5993194271469,40.5992972562638,40.5992825500439,40.5992625908603,40.5992563726535,40.599256395234,40.5992372905877,40.5992131489283,40.5991843045926,40.599151157044,40.5991141653402,40.5990738417756,40.5990267866877,40.5989772150616,40.598942525587,40.598907313339,40.5988621594686,40.5988169429464,40.5986821322895,40.5985311442433,40.5984700288139,40.5984364095949,40.5984039198478,40.5983729301851,40.5983436412748,40.5983211795595,40.5983003920404,40.5981326985602,40.5980415608577,40.5980168104071,40.5979899727753,40.5979919354542,40.5979995464564,40.5979994131328,40.5979912376149,40.5979850038498,40.5979693712896,40.5979126930234,40.5977788783992,40.597753037447,40.5975984842237,40.5974873336222,40.5973260740733,40.5973133912108,40.597303794157,40.5972975699899,40.5972949048939,40.5972968808771,40.5972974864517,40.5972960872293,40.5972921345335,40.597284508767,40.597273739042,40.5972328164508,40.5972125702059,40.5972008594102,40.5971778673011,40.5971632334282,40.597146756981,40.5970583724239,40.5969890144701,40.5969287014635,40.5969123469222,40.5968976272469,40.5968852078265,40.5968805657023,40.5968784748198,40.5968780925888,40.5968774991027,40.596895243928,40.596918168069,40.597274655881,40.5972893876543,40.5972980040343,40.5973158993706,40.5973297085101,40.5973624681423,40.597372167384,40.5973871496385,40.5974156669729,40.5974328796455,40.5974845429139,40.5975176168925,40.5975400700483,40.5976010395486,40.597638006057,40.5976493993236,40.5976641848445,40.5976757000955,40.5976886665771,40.5977187311035,40.5977304185367,40.5977420917252,40.5977534086386,40.5977640376856,40.5977655887762,40.5977673991255,40.597769419861,40.5977715964309,40.5977740068198,40.5977764530816,40.5977788611241,40.5977811580127,40.5977832741794,40.5977849140382,40.597786332253,40.597965525772,40.5979663434797,40.5979667716691,40.5979668025768,40.5979662925281,40.59796519083,40.5979635278922,40.5979613496162,40.5979552132238,40.5979478882855,40.5979573644318,40.5979715520258,40.5979786632985,40.5979854808494,40.5979944775467,40.5980001463081,40.5980213984203,40.5980333767665,40.598062701015,40.5980685833062,40.5980734639839,40.5980858235392,40.5980971312848,40.5981076284765,40.5981184907547,40.5981262597951,40.5981402113894,40.598147221539,40.5981565432318,40.59816546993,40.5981747701888,40.5981846613742,40.598199569973,40.5982155967538,40.5982325557178,40.5982502828109,40.5982591558163,40.5983119270785,40.5983355563149,40.5983501186613,40.5983623664178,40.5983721094676,40.598379520981,40.5983866030596,40.5984066361466,40.5984149433295,40.5984473756421,40.598458184739,40.598475917017,40.5984840852972,40.5985681612953,40.5986146769899,40.5986611926825,40.5987248406387,40.598761885753,40.5988124043614,40.5988383913745,40.5988669706983,40.5989127630739,40.598928237102,40.5989306324333,40.5991650865629,40.5992462054408,40.5992741572256,40.5993511830732,40.5993757980447,40.5995769592531,40.5995951436871,40.5996375960745,40.5996535964618,40.5996913992329,40.599718252659,40.5997391840722,40.5997541029503,40.5997870943084,40.5998782761448,40.5998828191457,40.599905877546,40.6001671345175,40.6004945855035,40.6005710048204,40.6006416836353,40.6009280048512,40.6009481054813,40.6009850964664,40.6010408886804,40.6010624997603,40.6010837085876,40.6010903641284,40.6010975987434,40.601104920507,40.6011055551897,40.601119792138,40.601124432577,40.6011511439445,40.6011609963748,40.6012115274146,40.6012376613566,40.6012821123771,40.6013116916962,40.6013234495571,40.6013342775433,40.6013536616457,40.6013706252012,40.6013789705743,40.6013943239049,40.6014093244368,40.6014241100889,40.6014398916776,40.60145668312,40.6015126449037,40.6015612900155,40.6016068517456,40.6016484531431,40.6016580738123,40.6016579219191,40.6016507963554,40.6016488210103,40.6016506009676,40.6016577999187,40.6016821575847,40.6016903848733,40.6016967776877,40.6017010029813,40.6017186677901,40.601744487092,40.6017324011085,40.6017044096301,40.6016726490291,40.6016429835801,40.6016161047659,40.6015926391139,40.6015707641263,40.6015477840523,40.6015352593102,40.6015227082246,40.6014991133429,40.6014620652281,40.6014232782895,40.6013836319982,40.601344025309,40.6013053562772,40.6012685016958,40.6012342972151,40.6012217173323,40.6011797507654,40.601136034464,40.6010908297549,40.6010400438725,40.6010337025471,40.6010298060886,40.601025701323,40.6010213531357,40.6010123214131,40.6009858681618,40.6009634259351,40.6009706511074,40.6009967434706,40.6009977275166,40.6009802037598,40.6009877038508,40.6009708900614,40.6009680638228,40.6009529010466,40.6009480855645,40.6009305437062,40.6009293980012,40.6009581651908,40.6009497903433,40.6008457853707,40.6008507967633,40.6008376563496,40.600831744885,40.6007873055887,40.6007437831095,40.600701787632,40.6006619079312,40.600624703118,40.6005973177397,40.6005679435823,40.6005367143761,40.6005198692626,40.600496272424,40.6004724424328,40.6004657697985,40.6004591632641,40.6004527896213,40.6004468097816,40.6004365968381,40.6004264195305,40.600416537092,40.6004072012449,40.6003986497888,40.6003911005434,40.6003847458004,40.6003797474256,40.6003606880958,40.6003552258849,40.6003490800043,40.6003392638513,40.6003283711035,40.6003166125903,40.6003042158983,40.600290272912,40.6002765067902,40.6002643734056,40.6002530483973,40.6002529148241,40.6002423043204,40.6002331798232,40.6002234910496,40.6002153670482,40.6002062194048,40.6001755099674,40.6001470064796,40.6001447454859,40.6001387189898,40.6001316912957,40.6001238587495,40.6001154401835,40.6001066708027,40.6000977956133,40.6000890625778,40.6000807156866,40.6000639301605,40.6000472438499,40.6000310784743,40.6000158425869,40.6000019212498,40.5999824966693,40.599957291565,40.5999334212332,40.5999079574402,40.5998813817926,40.5998406216842,40.5997992140534,40.599757766234,40.5997168861479,40.5996771733891,40.5996450565034,40.5996145159248,40.5996132649924,40.5996121128466,40.5996115632129,40.5996110408924,40.5996105353536,40.5996100583218,40.5996095975679,40.5996091646527,40.5996083528288,40.5996076204781,40.5996069688238,40.5996058889295,40.5996050395646,40.5996029581601,40.599601252321,40.5996005538581,40.5995997562928,40.5995988524155,40.5995978498719,40.5995973085734,40.599596731088,40.5995961363628,40.599595505445,40.599594171775,40.5995934502353,40.5995927124394,40.599565390896,40.5995037903333,40.5994758407982,40.5994594170374,40.5994089238522,40.5993931062191,40.5993792918241,40.5993711147147,40.5993548837441,40.5993476617447,40.599327867608,40.5993036104585,40.5993020628878,40.5993005859604,40.5992991887006,40.5992978463351,40.5992965741075,40.5992953557483,40.5992942004678,40.5992930896488,40.5992910628955,40.5992891154147,40.5992822170899,40.5992803958927,40.5992785494978,40.5992761076476,40.5992747990743,40.5992734356789,40.599271992829,40.5992704780679,40.5992688920157,40.5992672159579,40.5992504580525,40.5992322848915,40.5992123613647,40.5991874776738,40.5991176180657,40.5990799888576,40.5990541390167,40.5990303057488,40.5990191588223,40.5990083975521,40.5990067502818,40.5990052182405,40.5990037850566,40.59900245018,40.5990012047317,40.5990000669731,40.5989980241586,40.5989964566807,40.5989950593138,40.5989907584061,40.5989882789479,40.5989865043297,40.5989844614441,40.5989833316626,40.5989821314332,40.5989808411314,40.5989794704786,40.5989745842922,40.5989688171744,40.5989492313587,40.5989424562119,40.5989363361839,40.598933684965,40.5989312670558,40.5989161434567,40.5989008257834,40.5988679489345,40.598837405487,40.5988080509908,40.5988033661099,40.5987990284116,40.5987838764833,40.5987796040252,40.5987749469972,40.5987612604115,40.5987547682259,40.5987451342628,40.5987264795452,40.5987050865313,40.5986701539815,40.5986284944356,40.5984093259551,40.5983845657121,40.5983230611528,40.5983149108333,40.5983054144991,40.5982669243212,40.598258733563,40.5982517383076,40.5982441288288,40.598240767899,40.598237675591,40.5982348359908,40.598232246921,40.5982298912694,40.5981897663935,40.5981531235774,40.5981204732615,40.5980922702695,40.5980785226842,40.5980697932888,40.5980662417382,40.5980679329881,40.5980666312178,40.5980613073236,40.598052079454,40.5980391523948,40.5980228130246,40.5980034239481,40.5979834122978,40.597961585137,40.5979383467383,40.5979013620689,40.5978985221001,40.5978958234117,40.5978909234642,40.5978867575721,40.5978834451578,40.5978810816743,40.5978797736721,40.5978795939785,40.5978805418657,40.5978857176467,40.5979005988177,40.5979059686311,40.5979166307805,40.597920675154,40.597922222589,40.5979208973403,40.597917399465,40.597912010148,40.597900700893,40.597895982627,40.5978933022206,40.5978925876066,40.5978938375394,40.5978947728905,40.5979074338172,40.5979163785688,40.5979230808129,40.5979239915913,40.5979209705357,40.5979206059491,40.5979220111739,40.5979255519033,40.5979343809342,40.5979588427041,40.5979735917071,40.5979815770396,40.5979911064357,40.598004663105,40.5980208500403,40.5980547586218,40.5980968363644,40.5981243525349,40.598198664117,40.5982692893636,40.5982732595206,40.5982802470394,40.5982863847963,40.5982915655144,40.5982957152988,40.598298728552,40.5983005554951,40.5983011437525,40.5983033879495,40.5983015553037,40.5982956859889,40.5982859086668,40.598272437667,40.5982413795643,40.5982152738032,40.5981948021743,40.5981804993243,40.5981727387926,40.5981717232565,40.5981638857711,40.5981534200499,40.5981406312107,40.5981258920992,40.5981144750637,40.5981053271297,40.5980987209186,40.5980948533049,40.5980938395489,40.5980957098619,40.5980900923544,40.5980910941489,40.598098701011,40.5981128048555,40.5981187605,40.5981184935092,40.5981195426479,40.5981217246807,40.5981235024957,40.5981262516668,40.598134829805,40.5981448727169,40.5981749875617,40.5981906112212,40.59821925586,40.5982279940189,40.5982441359537,40.5982496356668,40.5982538083663,40.5982565919645,40.5982579152545,40.5982577699525,40.5982561383568,40.5982530568145,40.5982486271733,40.5982323518771,40.5982173302197,40.5981956317751,40.5981814997358,40.5981597288867,40.5981346194214,40.5981095000169,40.5980826072469,40.5980608404326,40.5980069270213,40.5979844668442,40.5979530876552,40.59793333602,40.5979166453696,40.5979030975595,40.5978984578491,40.59789191774,40.5978869575395,40.5978766051154,40.5978491038118,40.5978384022191,40.5978247915716,40.5978214222762,40.5978198860332,40.5978202080933,40.5978211048328,40.5978224878517,40.5978243594748,40.5978267273884,40.5978295916095,40.597832952455,40.5978459701097,40.5978614118691,40.5979105167755,40.5979832459386,40.5980038955986,40.5980450542841,40.5980472395371,40.5980493879814,40.5980536658078,40.598067905521,40.5980713017622,40.5980746272969,40.5980996437194,40.5981152478049,40.5981227510727,40.5981297994872,40.5981331851224,40.5981364816047,40.5981397063815,40.5981428420077,40.5981456999867,40.598148450411,40.5981536635862,40.5981585119211,40.5981631013644,40.5981702564291,40.5981864549175,40.5981972786773,40.5982206109065,40.5982333586645,40.5982363507513,40.5982398282654,40.5982483589962,40.5982591585469,40.5982932368053,40.5983027756006,40.5983066769111,40.598310074007,40.5983222798472,40.5983324442907,40.5983403505552,40.5983458516285,40.5983568801229,40.598360182656,40.5983621483689,40.5983619476023,40.5983587293137,40.598359006133,40.5983603632109,40.5983628125384,40.5983772562402,40.5983799926368,40.5983817546037,40.5983853723666,40.5983885496602,40.5983889963888,40.598391864054,40.5983945309999,40.5983970564108,40.5984430970046,40.598467764332,40.5984530095378,40.5984856042229,40.5984950960563,40.5985000180128,40.5985042119415,40.5985076875358,40.5985104285667,40.5985137110602,40.5985140396275,40.5985092759211,40.5985057101693,40.5985043913693,40.5985035286021,40.5985038441373,40.5985046922717,40.5985060801571,40.5985080446949,40.5985257941773,40.5985289051608,40.5985311594539,40.5985615467694,40.5986143728705,40.5986209903948,40.598632684077,40.5986401310263,40.598646855371,40.598655554471,40.5986930911348,40.5987072237528,40.598747036401,40.5987637845456,40.5987837736449,40.5988054674373,40.5988206660288,40.5988554976841,40.5988969863136,40.5989597854721,40.5989633106254,40.5989697636997,40.5989780187239,40.5989842233328,40.598988107858,40.5989894967096,40.5989883893352,40.5989848021283,40.5989821201274,40.598978851724,40.598968259781,40.5989541926018,40.5989365139936,40.5988972923201,40.5988811117025,40.5988656487463,40.5988538321252,40.5988414128369,40.5988322758317,40.5988204518004,40.5988130801013,40.598811217283,40.5988105422483,40.5988124395103,40.5988184999601,40.5988287058459,40.5988429757828,40.5988575991251,40.5988748533372,40.598894090547,40.5989147678632,40.598929791336,40.5989458574866,40.59898153279,40.5990224977664,40.5990746620595,40.5990911826447,40.5991097704341,40.5991704810894,40.5991919838633,40.5992123394099,40.5992304670443,40.5992435626503,40.5992572858428,40.5992718616829,40.5993140789233,40.5993280385551,40.5993411548739,40.5993661615132,40.5993932424076,40.5994224520738,40.5994539682878,40.5994817687655,40.5995123230506,40.5995410456359,40.5996075182415,40.5996398591226,40.5996693454677,40.5996965730287,40.5997918090883,40.5998958094734,40.6000002559782,40.6000643531084,40.6000860294105,40.6001335097871,40.6001540765726,40.6001592279481,40.6001645400294,40.6001759442686,40.600219057798,40.6002288309032,40.6002377339777,40.6002558059772,40.6002756294165,40.6003645980266,40.6003858091471,40.6004048458983,40.6004550426204,40.6005018662269,40.6005460285474,40.6005878632996,40.6007493055454,40.6011523082857,40.6012104189019,40.6012926913032,40.6015355022549,40.6015817158007,40.6016259306884,40.6016561154448,40.6016823250725,40.601724552308,40.6017586924878,40.6018109160963,40.6018691043117,40.6019232950375,40.6019453186211,40.6019372198546,40.6018949880068,40.6018547371841,40.6018687309816,40.6018968224347,40.6019309357944,40.6020031795091,40.6020713955177,40.6021435977633,40.6022821125802,40.6023583419665,40.6024887789217,40.6025550488811,40.6026192680247,40.6026734861485,40.6027488233251,40.6027912471702,40.6028378093233,40.6028881753317,40.6029419834188,40.6029676555915,40.6029918177192,40.6030186900913,40.6030447518098,40.6030643672582,40.6030774444882,40.6030870368777,40.6030925901552,40.6030895475108,40.6030865422867,40.6030859342198,40.6030865235322,40.6030916050622,40.6030932819696,40.6030951133272,40.6030982815781,40.6031020292477,40.6031232656214,40.6031296205465,40.6031325077352,40.6031352398153,40.6031872357815,40.6032444706279,40.6033084136993,40.6033881679418,40.6034284573696,40.6034721753094,40.6035786235713,40.6037190238181,40.6043290684803,40.6043786207127,40.6044296752213,40.6044813160308,40.6045326166448,40.6045826566684,40.6046305383211,40.6046754025447,40.6047148678091,40.6047563002899,40.6047985413537,40.6048404097535,40.6048807346613,40.6049183884102,40.6049523180291,40.6049902630591,40.6050246478547,40.6050551574579,40.6050815124061,40.6051034712922,40.6051047779861,40.6051076486908,40.6051119992016,40.6051177019081,40.6051245895366,40.6051324600567,40.6051410826076,40.6051502042696,40.6051595574826,40.6051688678946,40.6051989272118,40.6052273220786,40.6052535840484,40.6052772798617,40.605289404609,40.6053036004284,40.6053195057121,40.6053367153074,40.6053547908362,40.6053732718628,40.6053916876216,40.6054095690092,40.6054264605339,40.6054419319185,40.6054943082093,40.60554793362,40.605602163424,40.6056563456266,40.6057098288038,40.6057619699345,40.6058292552377,40.6058994844263,40.6059721925587,40.6060468982802,40.60612310701,40.6062003142149,40.6062780087496,40.6063556762408,40.6064328024924,40.6065088768898,40.6065833957807,40.6066740904189,40.6067664172174,40.6068600137819,40.6069545127322,40.6070495431448,40.6071447320084,40.6071868929535,40.6072287921319,40.6072692269211,40.6073070367285,40.6073411363039,40.6074123838324,40.6074875698503,40.6075022998891,40.6075183341151,40.6075352721433,40.6075526910201,40.6075701557844,40.6075872303289,40.6076034882899,40.6076185236944,40.6076615061503,40.6077060966221,40.607751555447,40.6077971285566,40.6078420599851,40.6078856044095,40.607927039513,40.6079656779671,40.6080008788331,40.6080320581943,40.6082037237727,40.6082338001608,40.6082620607915,40.6082877099493,40.6083100254474,40.608328378962,40.608342253724,40.6083512590696,40.6083551414403,40.6083675021363,40.6083830749403,40.608401457738,40.6084221758571,40.6084446943225,40.6084684316712,40.6084927749659,40.608517095622,40.6085407656389,40.6085665796937,40.6085956990998,40.6086272825974,40.6086604177379,40.6086941472444,40.6089686276572,40.6089945011106,40.6090198827175,40.6090441723943,40.6090667958723,40.6090799111291,40.6091036545422,40.6091290055909,40.6091553429507,40.6091820211234,40.6092083862569,40.6092337921707,40.6092590663547,40.6093247854488,40.6093915529849,40.6094711145646,40.6095371399296,40.6095783250385,40.6096155500766,40.6096484527523,40.609661665476,40.6096747464454,40.6097008737563,40.609727394026,40.6097579644211,40.6097842874701,40.6098430207667,40.6098728297173,40.6098962480708,40.60994953965,40.6099695276125,40.6100058737796,40.61003699686,40.6100641886718,40.6100878759208,40.6100921671808,40.6101459271957,40.6101955395373,40.6102409137347,40.6102460590994,40.6102495635538,40.6102513398472,40.6102513437547,40.6102495751791,40.610246078153,40.6102409397423,40.610234287879,40.6102262881755,40.6102144602025,40.6102038932812,40.6101948815023,40.6101876756752,40.6101824763469,40.6101794282213,40.6101786161315,40.6101800626789,40.6101813050339,40.6101808800597,40.6101788000874,40.6101751254701,40.6101699628316,40.6101649422716,40.6101614862413,40.6101596620308,40.6101595051578,40.6101610186769,40.6101688205996,40.6101793658141,40.610192215086,40.6102155209626,40.6102724082369,40.6102851131331,40.6102958008642,40.6103113086544,40.610325926152,40.6103400029402,40.6103554229794,40.6103739638291,40.610384059749,40.610389935585,40.6103911643844,40.6103912760754,40.6103908380735,40.6103898772077,40.6103863382058,40.6103694171837,40.6103645918175,40.6103618979913,40.6103614241494,40.6103615082784,40.6103649897657,40.6103703006878,40.6103790581472,40.6103841607157,40.6103898365992,40.610417525963,40.6104716969478,40.6104925283093,40.6105642277739,40.6105644446632,40.6106294732955,40.6107305468637,40.6107990015256,40.6108241748703,40.6108242442096,40.6108454270821,40.6108702077619,40.6109000728021,40.6109167254659,40.6109565816859,40.6109760708075,40.6109919110331,40.6110302663094,40.6110413988056,40.6110517778939,40.6111286211074,40.6112118654054,40.6112342999198,40.6112540522691,40.6112855723171,40.6113490109366,40.6114389099016,40.611446720271,40.6114542451632,40.6114684025424,40.6114812277997,40.611491645074,40.6114923783851,40.611497664584,40.6115016767503,40.6115044208657,40.6115058909897,40.6115063175627,40.6114685473993,40.6114241827805,40.6113733427201,40.6113161636028,40.611297436594,40.6112737392448,40.6112453052078,40.6112124148386,40.6111753924309,40.6111346030192,40.6110904487791,40.6110630135697,40.6110515124857,40.6110396491578,40.6110145638331,40.6109873146042,40.6109538547621,40.6109018845272,40.6107855246141,40.6107308695916,40.6106719662981,40.610618368631,40.6104631195924,40.610416279021,40.6103305865243,40.6102954911778,40.6102601656504,40.6102293741069,40.6102006435311,40.610173425322,40.6101715251035,40.610169635012,40.6101677899922,40.610165963287,40.6101641922557,40.6101624569166,40.6101591613207,40.6101561198476,40.6101534500885,40.6101512229847,40.6101495281085,40.6101479870397,40.6101482199846,40.6101491273411,40.6101506536152,40.6101527629458,40.6101540373812,40.6101554375502,40.6101569721162,40.6101586230101,40.6101993839074,40.6102967359804,40.6107531480085,40.6107826991548,40.6108098020204,40.6109170832587,40.6109594606527,40.6110021851739,40.611039478988,40.6110695824474,40.6111427050835,40.6111773566863,40.6112217864047,40.6112562224755,40.6112843094683,40.6113163705215,40.611352342874,40.6114078409331,40.6114325832407,40.6114602758811,40.6115499635302,40.6115816813036,40.6116116819147,40.6116386970495,40.6116730243931,40.6117479388171,40.6117792831629,40.6119371976796,40.6120410496114,40.6120802707903,40.6120949024519,40.6121025008008,40.6121091718367,40.6121150353611,40.6121201517537,40.6121227897051,40.6121237390188,40.6121244356997,40.6121248815888,40.6121250743443,40.6121250245415,40.612124730962,40.612124185441,40.6121233884629,40.6121210463684,40.6121177042228,40.6121133442896,40.6120913646664,40.6120431888256,40.6120284721626,40.6119733218252,40.6119256939623,40.6119022141275,40.6118428557159,40.6118161632496,40.6118153628599,40.6118146620733,40.611814051047,40.6118135396437,40.6118131186498,40.611812796562,40.6118125829765,40.6118124689445,40.6118125473608,40.6118130416338,40.6118139402805,40.6118151997799,40.611818601295,40.6118205700375,40.6118226376791,40.6118246953324,40.6118257227408,40.6118267415883,40.6118277333099,40.6118287152759,40.6118296699464,40.6118305969594,40.6118650725751,40.6119024743539,40.6119431444445,40.6120024491399,40.6120244255441,40.6120788555258,40.6120949471474,40.6121099043302,40.6121270670459,40.6121463603623,40.6122128602025,40.6122383554909,40.6123494757717,40.6124480269106,40.6124788740137,40.612507698109,40.612572515344,40.6126438897157,40.6127398654317,40.6128576209622,40.6129076403964,40.6129541305059,40.6130119416599,40.6131197112704,40.6131637692263,40.6132465682482,40.6134028207041,40.6134650407057,40.6135284339488,40.6135844465155,40.6136079648309,40.6136256473834,40.613645693345,40.6136623134987,40.6136750663063,40.6136836129709,40.6136877264379,40.6136872974271,40.6136823373357,40.6136729779358,40.6136594678736,40.6136421660634,40.6136209761698,40.6136021262392,40.6135861789766,40.6135736104366,40.6135647958127,40.613559998237,40.6135593609257,40.6135629029036,40.6135705184364,40.6136682749388,40.6137598150438,40.6138450371385,40.6139238466224,40.6139456448036,40.6139610499548,40.6139699118447,40.6139721440516,40.6139677248071,40.6139566972077,40.6139391687951,40.6139358557142,40.613936609702,40.6139414084791,40.6139501102479,40.6139624578825,40.6139780865263,40.6139880977648,40.6139945757305,40.6139973275647,40.6139962713411,40.6139914385051,40.6139829729375,40.6139711266706,40.6139727671951,40.6139772647998,40.6139845253719,40.6139943969832,40.6140097984814,40.6140210112379,40.6140278088977,40.6140300542345,40.614027701921,40.6140446820724,40.6140633065312,40.6140631762379,40.6140620130865,40.6140592555852,40.6140430326652,40.6140311703792,40.6140299293498,40.6140278249318,40.6140208908252,40.6140122240205,40.6139901480129,40.6139813784606,40.6139759829058,40.6139734170439,40.613972180601,40.6139725433709,40.6139745250759,40.6139781153769,40.6139833141791,40.6139901839315,40.6139988124728,40.6140094498718,40.6140263126721,40.6140393388436,40.6140524131967,40.6140658321102,40.6141617621662,40.6142006168815,40.61421360803,40.6142241657018,40.6142271484735,40.6142286534593,40.6142286784853,40.6142272434622,40.6142211393147,40.6142043617243,40.6141984890465,40.6141947676473,40.6141944747264,40.6141997606812,40.6142181886473,40.6142211406185,40.614222404166,40.6142214030904,40.6142140422662,40.6142138114722,40.6142153085681,40.614219207089,40.614221131702,40.6142244527644,40.6142391903748,40.6142498206648,40.6142765086412,40.6142864133874,40.6142945424067,40.6143004155808,40.6143040250803,40.6143053518329,40.6143045380864,40.6143018521245,40.6142973203464,40.614290961924,40.6142607781354,40.6142546549475]}],[{"lng":[-73.8201734801783,-73.8174981097033,-73.8165268124436,-73.8165551962293,-73.8165752774288,-73.8165868764074,-73.8165898894192,-73.8165842895348,-73.8165701268807,-73.8165475281902,-73.8165166956687,-73.8164779051836,-73.8164315037957,-73.8162336668465,-73.8161412617741,-73.8159841242866,-73.8158269667421,-73.815697634774,-73.8155499467557,-73.8153834930926,-73.8152355516727,-73.8150691571859,-73.8149583754392,-73.8147181262786,-73.8145884428529,-73.8144403234523,-73.8142092675447,-73.8140806243293,-73.814090115668,-73.8141326807543,-73.814164498977,-73.8144144148853,-73.8146826267649,-73.8148672597213,-73.8148668107361,-73.814857222891,-73.8150419346298,-73.8153563487286,-73.8154952663758,-73.8153570301601,-73.8153665393461,-73.815191435543,-73.8149977606887,-73.814875191593,-73.8147956325532,-73.8148512269952,-73.8148721310775,-73.8150363849463,-73.8152395649453,-73.8152855135111,-73.8152759071431,-73.8153219532688,-73.8154694831705,-73.815608068999,-73.8157190614926,-73.8157842022238,-73.8158860167964,-73.8159876362269,-73.816156266325,-73.8160437533197,-73.8160263669113,-73.8159530191791,-73.8158610634639,-73.8158891422888,-73.8158525845638,-73.8158160289696,-73.8157332911965,-73.8156352254609,-73.8155940547347,-73.8155985877934,-73.8154036618983,-73.8152644549375,-73.8150387432528,-73.8148469963902,-73.8146136462951,-73.8145026156671,-73.8144987682779,-73.8152072079899,-73.8150261538041,-73.8149179451195,-73.8147707379247,-73.814752871105,-73.8147625763954,-73.8148278509591,-73.8148653992228,-73.8149997118507,-73.8149632880443,-73.8150612987873,-73.8152060710554,-73.815227716652,-73.8153414691471,-73.8156155774171,-73.8157417406382,-73.815710058652,-73.815699262256,-73.8155212646286,-73.8155168973556,-73.8154606648321,-73.8155281672229,-73.8155838176452,-73.8155253672366,-73.815708158548,-73.8157272639208,-73.815767515787,-73.8158070389098,-73.8158541676901,-73.8159596200255,-73.8160076436125,-73.8160087598857,-73.8159609357312,-73.8159703204825,-73.8159435785884,-73.8159191721878,-73.8159191394359,-73.8158902628443,-73.8158882977846,-73.8159419972973,-73.8159854852757,-73.8160928425469,-73.8164252992309,-73.8173919210665,-73.8173024484803,-73.8172537059339,-73.8175579235687,-73.817720326387,-73.8183112105431,-73.8184267544185,-73.8184906612075,-73.8189934642394,-73.8192814220164,-73.8197359176564,-73.8201569539572,-73.8202231043504,-73.8202831613501,-73.8203368857146,-73.8203840634335,-73.8204245065798,-73.8204580540579,-73.8204845722455,-73.820509133645,-73.8205256209246,-73.8205338573616,-73.8205337546837,-73.8205253140147,-73.820508625861,-73.8204838691406,-73.8204513092645,-73.8204507977208,-73.8204424432616,-73.8204408472568,-73.8204460563461,-73.8204579182662,-73.8204760863018,-73.8205000294204,-73.8205954478592,-73.8206138122379,-73.8206179603423,-73.820658434813,-73.8206726599183,-73.8207120677811,-73.8207977868963,-73.8209309527333,-73.8210215206314,-73.8210888344679,-73.8212003542905,-73.8214708930779,-73.8219605043601,-73.8223089073945,-73.8226131015319,-73.8231657310365,-73.8233979991554,-73.8241350690591,-73.8254779349812,-73.8257295717259,-73.8261186078163,-73.8267810099318,-73.8272522387304,-73.827702185304,-73.8283688983407,-73.8288784131568,-73.8292113972271,-73.8304818247775,-73.8313131857726,-73.8319880604785,-73.8326268830346,-73.833217441063,-73.8337351613081,-73.8342524733578,-73.8347213708108,-73.8348469993175,-73.834455000193,-73.8343960000693,-73.8342009997734,-73.8334899989838,-73.8333609992995,-73.8325081184181,-73.8323936445369,-73.8315410594015,-73.8312607091214,-73.8310800060544,-73.8309569926471,-73.8307600944867,-73.8306285217902,-73.8304967590327,-73.8305046651861,-73.8303892248227,-73.8302656864047,-73.8300517968242,-73.829854229455,-73.8297552219399,-73.8296151518607,-73.8294834182312,-73.8293519572508,-73.8292699442463,-73.8292127677906,-73.8290977742234,-73.8289168177293,-73.8287440863918,-73.8285715645375,-73.8283249018501,-73.8280615967543,-73.827946103696,-73.8278471090353,-73.827846915053,-73.8276327319441,-73.8274268880005,-73.8272209299851,-73.8271301912551,-73.8270970627869,-73.8271708479069,-73.8271031449313,-73.8270781007883,-73.8270513387313,-73.8270235696169,-73.8269955310509,-73.8269679677962,-73.8269416119906,-73.8269171637001,-73.8268952723238,-73.8268765193449,-73.826861402885,-73.826850324473,-73.8268435783794,-73.8268413437993,-73.8267628710567,-73.8266785732675,-73.8265887389712,-73.826493675662,-73.8263937087364,-73.8262891803794,-73.826271385298,-73.8262463954872,-73.8262145722122,-73.8261763755322,-73.8261323576501,-73.8261080108119,-73.8260797191137,-73.8260483082057,-73.8260146947694,-73.8259798597652,-73.8259448198041,-73.8259105974784,-73.8258781915185,-73.8258485476457,-73.8258772397746,-73.825898537817,-73.8259122021743,-73.8259180791333,-73.8259161025944,-73.8259062948145,-73.825888766156,-73.8258637138438,-73.8258314197458,-73.8257922472013,-73.8257618664088,-73.8257240013218,-73.8256788716729,-73.8256267393438,-73.825567906846,-73.8255027155645,-73.8254315437771,-73.8253548044591,-73.8252729428871,-73.8251864340553,-73.8251336039631,-73.8250761076771,-73.8250145832148,-73.82494971329,-73.824882217737,-73.824812845524,-73.824742366442,-73.8246542059728,-73.8245680497674,-73.8244845126566,-73.8244232449058,-73.8243672913632,-73.82431733671,-73.8242739922261,-73.8242377883096,-73.8242091679865,-73.8241884814887,-73.8240341420486,-73.823958710583,-73.8240594485754,-73.8241007139487,-73.8241847190072,-73.8242702601019,-73.8243464084565,-73.8245227127641,-73.8245370242063,-73.8246136348815,-73.824617199115,-73.8246190135313,-73.8246368464132,-73.8246388130141,-73.8246517839903,-73.8246632500265,-73.8246844380112,-73.8246973900064,-73.8247046036449,-73.8247065871479,-73.8247177746559,-73.8247277308939,-73.8247429240798,-73.8247476101533,-73.8247490756407,-73.8247708899249,-73.8247690885738,-73.8247480693571,-73.8247464666553,-73.8247324778651,-73.8247145596044,-73.8247043075619,-73.8247021648593,-73.8246832374592,-73.8246817915681,-73.8246801991926,-73.8246606878445,-73.8246583674264,-73.8246410901693,-73.824638945229,-73.8246221269015,-73.8246202842304,-73.8246030301602,-73.8246017460211,-73.8245838769644,-73.8245820068512,-73.8245650238147,-73.8245631747242,-73.824545805942,-73.8245440402754,-73.8245056312336,-73.8245033964212,-73.8244880556901,-73.8245308425857,-73.8245262485854,-73.8244769096061,-73.8244562947674,-73.8243900431506,-73.8243943163887,-73.8244671334376,-73.8245021227419,-73.8245173365546,-73.8243625589612,-73.8243547208029,-73.8243382407657,-73.824225851978,-73.8241734059545,-73.8241274901203,-73.8240779135502,-73.8240698418146,-73.8241085473059,-73.8242187037736,-73.8241859569915,-73.8241656988867,-73.824113882606,-73.8240711620784,-73.8240135817074,-73.8237932359373,-73.8237661228125,-73.8236175934878,-73.8231735613632,-73.8231669276735,-73.8231733730621,-73.8231737671854,-73.8231840819635,-73.8231801596429,-73.8231174097478,-73.8231178997717,-73.8231329439959,-73.8231338437416,-73.8231476032341,-73.8231529315943,-73.8230319516688,-73.8230040388377,-73.8230401256699,-73.8230400784937,-73.8229275781121,-73.8229361266005,-73.822978576463,-73.8230043648485,-73.8225763895636,-73.8225581324748,-73.822358922475,-73.8222883413144,-73.8221598125493,-73.8221417494074,-73.8221272696694,-73.8221128243731,-73.8219444175979,-73.8219063676653,-73.821802961751,-73.8217194912701,-73.821688592813,-73.821588900132,-73.821469298337,-73.8214692171152,-73.8214763936771,-73.8215900159069,-73.8217315475342,-73.821720742398,-73.8223455555714,-73.8223436228187,-73.8224848917291,-73.8224940410853,-73.8226063190182,-73.822610015198,-73.8231478828971,-73.823153269908,-73.8233090238451,-73.8233192047833,-73.8244364376235,-73.8244070658681,-73.8244521800895,-73.8243038852104,-73.8242976551575,-73.8241386296896,-73.8239890012412,-73.823924147647,-73.8238815004375,-73.8237903313483,-73.8237054426258,-73.8236043123054,-73.8235113029426,-73.8234666688423,-73.8234542357978,-73.8235185703405,-73.8235849835638,-73.8236230301977,-73.8235779976056,-73.8232348581057,-73.8230490629182,-73.8229963974538,-73.8229448474048,-73.8229248115599,-73.8228982402094,-73.8228859757218,-73.8229020152676,-73.8228796737161,-73.8228062773857,-73.8227656347778,-73.8227808979095,-73.822813065482,-73.8229028300363,-73.8228447444166,-73.8228161465416,-73.8227697835931,-73.8227152139278,-73.8226707160534,-73.8225937475773,-73.8225450585255,-73.822532809663,-73.822554726474,-73.82253633148,-73.8224674670248,-73.8224834571986,-73.8226002432249,-73.8226945672187,-73.8227816108923,-73.8229046337765,-73.8226672713203,-73.8223600087623,-73.8222471202005,-73.8222389445715,-73.8221137778033,-73.8217377242458,-73.8216769159647,-73.8215192464308,-73.8212647034285,-73.8211998726974,-73.8212602881281,-73.8211712051778,-73.8211913052347,-73.8210755024073,-73.8208916319941,-73.8208874221989,-73.8209045612608,-73.8208599009043,-73.8202997848072,-73.8200324356358,-73.8200281254085,-73.8199831836803,-73.8199425188838,-73.8199745876944,-73.8199808486382,-73.8199822794736,-73.8198083170342,-73.8196179536215,-73.8199515024194,-73.8204540531979,-73.8205188787713,-73.8204320253512,-73.820434036151,-73.8205028157397,-73.8205759543651,-73.8206893333314,-73.8207604386338,-73.8208227425594,-73.8208784179014,-73.8209522206181,-73.8209814379867,-73.8210438454831,-73.8210840360541,-73.8210286562814,-73.821013912225,-73.8209889300499,-73.8211062794904,-73.8211499519637,-73.8212096026824,-73.8212611978967,-73.8212830585657,-73.821284210529,-73.8212054362442,-73.8210622846741,-73.8207864552559,-73.8206269821821,-73.8205487261035,-73.8204870062156,-73.8205252563745,-73.820558136737,-73.8206342043217,-73.820751279887,-73.8207977738915,-73.8208587850587,-73.8211463708444,-73.8211990301142,-73.8213301025863,-73.8213826812563,-73.8216146008913,-73.8217609852129,-73.8217528051501,-73.8216824113534,-73.8217733991909,-73.8218253133993,-73.8216943459945,-73.82166797839,-73.8217980419999,-73.8218494508058,-73.8218620524135,-73.8220962122128,-73.8223307978119,-73.8225397843014,-73.822735296455,-73.8228923334858,-73.8231948971962,-73.8234483920221,-73.8236954549719,-73.8238249998633,-73.8240041278942,-73.8240192622484,-73.8239480380605,-73.8241032709013,-73.8239953676249,-73.8223496103741,-73.8217647149712,-73.8217020804839,-73.8216392193983,-73.8215706029162,-73.8214160164138,-73.8207589250475,-73.8201734801783],"lat":[40.6151806191388,40.6142141315642,40.6149470096586,40.6148810682363,40.6148133781806,40.614744545093,40.6146751847996,40.614605917841,40.6145373639212,40.6144701363629,40.6144048366205,40.6143420488995,40.6142823349301,40.6142310461986,40.6142449765889,40.6142869582643,40.6143359784349,40.6143428098854,40.6143073781113,40.6143774996556,40.6144335725619,40.614482576347,40.6144612823424,40.614496088552,40.6146296182281,40.6147490386707,40.61470344327,40.6145584092363,40.6144669200998,40.614366290439,40.6142910696408,40.6141014240082,40.6139751578551,40.6140106497528,40.6141725422843,40.6142992262149,40.6143065618144,40.6141733296829,40.6140398151332,40.6139269712749,40.6138284438188,40.6136873855628,40.6135814908631,40.613369848954,40.6131940299813,40.6131307701847,40.6131133204971,40.6129762137494,40.6129835792573,40.6130681188599,40.6132018410488,40.6132511869091,40.613342929511,40.6133290737516,40.6132729416364,40.6130970752989,40.6130198109109,40.6130129348912,40.6129421155098,40.6127596264421,40.612365424464,40.6121682188736,40.6120202569755,40.6118865638109,40.6117457281924,40.6116048932336,40.6114639842352,40.6111956001471,40.6108633572951,40.6106725163296,40.6103848020155,40.6104996381818,40.6107245311143,40.6108190569023,40.6109340738067,40.6110584735055,40.6107354536593,40.6098167335934,40.6093520133115,40.609055392403,40.6088510287802,40.6086327965047,40.6084638800539,40.6082387424955,40.6080205989857,40.607825413339,40.6076405944247,40.6073170302799,40.6070925440703,40.6070495688818,40.6069389908103,40.6066987194458,40.6064652452356,40.6064586277901,40.606457067365,40.6064196423778,40.6064358852173,40.60642813751,40.6061630699451,40.606172902762,40.606407380282,40.606439294196,40.606354262278,40.6063715922188,40.6063664063662,40.6063415563578,40.6062624833535,40.6061948520611,40.6061442589629,40.6061397170653,40.6060743624535,40.606061564613,40.6060615255257,40.606022940603,40.6060253394416,40.6059290343592,40.6059268883734,40.6057335049299,40.6057440932406,40.6052241235739,40.6051581237843,40.6042059210925,40.6039403246919,40.6027857600089,40.6022249997411,40.6013397122124,40.6000840688403,40.5993895594792,40.5982624632439,40.5975296108766,40.5975168432681,40.5968739074053,40.5968018755247,40.5967268060723,40.5966489981189,40.5965687616441,40.5964864163015,40.596402290145,40.5963167183218,40.5962581659621,40.5961979915829,40.5961368402576,40.5960753675303,40.5960142323892,40.5959540902014,40.5958955856883,40.5958393460133,40.5958385739079,40.595808875965,40.5957785272652,40.5957484148598,40.5957194188928,40.5956923868748,40.5956681089122,40.5956026302228,40.5955060752519,40.5953519297354,40.5952714515629,40.595195706171,40.5951705149244,40.5951530065934,40.5951080616107,40.5949411512667,40.5948043391963,40.5947122944406,40.5947253806346,40.5947460164546,40.5947354612374,40.5946801386686,40.5946155131488,40.5946084747445,40.594633056748,40.5950806575843,40.5949521747366,40.595023805634,40.5949212231788,40.5947690025126,40.594814155946,40.5947005508801,40.5948052098815,40.5946621113275,40.5944982903221,40.5944811454442,40.5944086612128,40.5942993846386,40.5942175873874,40.5943560981663,40.5946599196307,40.5950555096457,40.5955429999386,40.5962270003178,40.596464000371,40.5966569999827,40.5969160003652,40.5972360002592,40.5975733114885,40.5978033533824,40.5979510260551,40.5978920461112,40.5977914646544,40.5976470800861,40.5974461583099,40.5974334257242,40.597495928192,40.5976213351738,40.5977340195843,40.5977965350973,40.5978087577316,40.5978711633014,40.5979901416968,40.5980839792985,40.5981339424052,40.5980773196542,40.5979831509758,40.5978263229147,40.5977634552207,40.5977631859695,40.597762928691,40.597681164513,40.5976431782166,40.5976804026488,40.5978118947437,40.5979246012261,40.5979998382635,40.5981249118647,40.5982061087161,40.5983311945707,40.5984313729277,40.598519099662,40.5986132570136,40.5986886855088,40.5986790633816,40.5986726698959,40.5986696748761,40.5986701578761,40.5986741060666,40.5986814145752,40.5986918892727,40.598705251929,40.5987211476035,40.5987391540733,40.5987587930474,40.5987795428719,40.5988008523858,40.5988785239209,40.5989525644663,40.5990227205752,40.5990887520968,40.5991504329984,40.5992075521393,40.5992540617348,40.5992986071926,40.5993405445169,40.5993792674162,40.5994142160696,40.5994334729676,40.5994492901905,40.5994612061354,40.5994688730522,40.5994720671928,40.5994706953407,40.5994647975313,40.5994545458841,40.5994402395789,40.5993881912673,40.5993341192856,40.5992786319782,40.5992223536116,40.5991659173506,40.5991099581345,40.5990551055346,40.59900197667,40.5989511692659,40.5989032549286,40.5988274256747,40.598753579113,40.59868214373,40.5986135340206,40.5985481480826,40.5984863653073,40.5984285441783,40.5983750201912,40.598326103908,40.5982820791545,40.598246143636,40.5982146436001,40.5981879285889,40.5981662950471,40.598149983032,40.5981391735504,40.59813398655,40.5981492467017,40.5981701241343,40.5981964698621,40.5982305579617,40.5982695955786,40.598313105032,40.5983605539206,40.5984113616373,40.5984649064735,40.5985205332262,40.5987579794804,40.5988768966773,40.5988894223304,40.5988973268842,40.598912821907,40.5989259324245,40.5989343375288,40.5989512639906,40.5989122179652,40.5987237900155,40.5987150236107,40.5987105600434,40.5986666967072,40.598661862294,40.5986299595084,40.5986017581672,40.5985533282297,40.5985206859345,40.5985025065854,40.5984975091905,40.5984693129473,40.5984442219945,40.5983989904223,40.5984001553649,40.5983894539726,40.5983918438742,40.5983962773086,40.5984480259439,40.5984519699922,40.598486409141,40.5985305209761,40.5985557619178,40.5985610380064,40.5986070976703,40.5986108322099,40.5986149421271,40.5986653327064,40.5986713243765,40.5987159444568,40.598721482892,40.5987649162205,40.5987696767745,40.5988142359035,40.5988175530379,40.5988637004099,40.5988685306136,40.5989123875315,40.5989171623148,40.5989620204672,40.5989665795994,40.5990657692747,40.5990715419436,40.5991111606835,40.5991194982919,40.5991290272233,40.5991200098234,40.5991158381798,40.5990981130265,40.5990878732852,40.5991074648586,40.5990086626634,40.5989658087331,40.5989504363327,40.5989494680949,40.5989474320493,40.5989335455699,40.5989257315096,40.5989162224715,40.5989092038331,40.5989224812561,40.5989947266152,40.5990744879184,40.5992134253144,40.5992993796671,40.5992853501948,40.5992922598941,40.5994297214814,40.5998512239159,40.6000400708209,40.6000357011257,40.5999780053117,40.6000481138974,40.6000491063751,40.6000628688579,40.6000632119133,40.6000838490282,40.6000794925254,40.6000568848416,40.6000572363534,40.6000421654461,40.6000408757028,40.5999766626497,40.5999305168843,40.6000486009444,40.6000502748515,40.6000680747858,40.6000614281631,40.6000404051602,40.6000437072248,40.5999256193963,40.5998877394415,40.5999415604228,40.5999219221127,40.5998969593224,40.5998650031084,40.5998456445978,40.5998345633988,40.5998235085535,40.5998011559785,40.5998116299336,40.5998616896203,40.5999154088302,40.5999540220076,40.5999773391704,40.5999937227703,40.6000240987552,40.6000503441831,40.6000624297974,40.6000764809963,40.6001252833312,40.6001801000632,40.6002256614078,40.6002355446462,40.6002010401671,40.6002136403655,40.6001860316845,40.6002393292047,40.6002572869374,40.6002699526721,40.6002340888722,40.6003449838522,40.600591124701,40.6007969626885,40.6007851996586,40.6008521012328,40.6008914666527,40.6010019871271,40.6011064839631,40.6012492163682,40.6013431591506,40.60139225096,40.6014782342343,40.6015457711607,40.6016349168996,40.6017579528721,40.6018503423145,40.6019400329957,40.6020320087663,40.6022718957505,40.6022959800764,40.6023449161547,40.6024186674568,40.6025829094679,40.6027980562531,40.6029045822899,40.6029630145758,40.6030030320859,40.6032827830248,40.6039751790459,40.6042026050691,40.604534876444,40.6045810710097,40.6046872685414,40.6048118473668,40.6049410110016,40.6049451785135,40.6049500838798,40.6049869323456,40.6050914097061,40.6051867014867,40.6052389815651,40.6053620659111,40.605432797401,40.6055249828227,40.6055834580221,40.6056851581341,40.6057381027482,40.6057869582263,40.605851276927,40.6061187321218,40.6064692606601,40.606419864154,40.6064230580218,40.6064719561702,40.606720559235,40.6068189088507,40.6069109547069,40.6070028504105,40.6070950401635,40.607144356104,40.6072488143266,40.6072796086807,40.6073827252285,40.6076421535843,40.6077067508682,40.6077812462183,40.6078399697072,40.6085764454725,40.6089236562609,40.6090251697797,40.6092250630896,40.6093357481794,40.6094188599585,40.6095340585779,40.6095603857079,40.6098349587208,40.6104790410643,40.6110058657384,40.6118545573261,40.6119499487245,40.6119871082759,40.6120667870062,40.612133008358,40.6122331408812,40.6122587455675,40.6122876758601,40.6122809922494,40.6122573458201,40.6121099760661,40.6119981364708,40.6119524624709,40.6118965826518,40.6118100390948,40.6117666054449,40.6116930064398,40.6114320680975,40.6113933510174,40.6113624912725,40.6113068569677,40.6112326051185,40.6110969287836,40.6108961349875,40.6107638483698,40.6106334177369,40.6105299952171,40.6104308242089,40.6102243792936,40.6100965022457,40.6099521089638,40.6098573064163,40.6096160596957,40.6094427991465,40.6092310582713,40.6090624110714,40.6088933979355,40.6086847184734,40.6085455449468,40.6084803192278,40.6086157595912,40.608626103067,40.6087151065872,40.6088545024521,40.608963997186,40.6091328903249,40.6092323166074,40.6094016133887,40.6097000968157,40.6098692125685,40.6101580317354,40.6102877032547,40.610228344792,40.61032811416,40.6103370221941,40.610937835616,40.6110930829761,40.6113057648626,40.6114990002824,40.6116317684097,40.6117615321191,40.6118546321536,40.6123260974856,40.6125162775592,40.6142600261963,40.6147644579723,40.6148241913903,40.6148706148947,40.614908690831,40.6150547639347,40.6152326795177,40.6151806191388]}]],[[{"lng":[-73.9322220409448,-73.9311865092941,-73.9304248548829,-73.9298294383552,-73.929653742719,-73.929501137878,-73.9290987825575,-73.928840024146,-73.9285424483301,-73.9264190946264,-73.927740607388,-73.9288720624816,-73.9305463182744,-73.9325673631225,-73.9340816717479,-73.934428914061,-73.9347732805166,-73.9351145970114,-73.9354526909869,-73.9357873915167,-73.9361185293922,-73.9364459372092,-73.9367694494521,-73.9370889025781,-73.9374041350995,-73.9377149876656,-73.9380213031432,-73.938187673069,-73.9383587509563,-73.9385342732395,-73.9387139695089,-73.9388975629274,-73.9390847706579,-73.9392753042979,-73.9394688703237,-73.9396651705429,-73.9398639025531,-73.940064760208,-73.9402674340879,-73.9404716119772,-73.9405577742616,-73.9407354551324,-73.9401297030218,-73.9401280893473,-73.9400847187798,-73.9401421955907,-73.9401906412672,-73.9402300006841,-73.9402602290379,-73.9402812918991,-73.9402931652501,-73.9402958355147,-73.940289299573,-73.9402735647651,-73.9402486488838,-73.9402145801542,-73.9401713972022,-73.9401191490113,-73.9400578948672,-73.9399877042903,-73.9399086569573,-73.9398208426117,-73.9397243609613,-73.9396193215654,-73.9395058437111,-73.9393840562769,-73.9392540975884,-73.9391161152595,-73.9389702660255,-73.938816715566,-73.9386556383159,-73.9368377709958,-73.9366575414854,-73.9364731596412,-73.9362849484168,-73.9360932374764,-73.935898362617,-73.9357006651803,-73.9355004914548,-73.9352981920684,-73.9350941213741,-73.93488863683,-73.9346820983707,-73.9344748677788,-73.9343082755452,-73.9341406541585,-73.9339724824065,-73.9338042406475,-73.9336364094407,-73.9334694681723,-73.9333038936879,-73.9331401589297,-73.9329787315873,-73.9328200727611,-73.932664635646,-73.9325128642372,-73.9323651920627,-73.9322220409448],"lat":[40.5576763419598,40.5570158313271,40.5555833186755,40.5544572271852,40.5541249241835,40.5538409491935,40.5530934450985,40.5524975322778,40.5520049120728,40.548155780823,40.547629297936,40.5470962362139,40.5464259208047,40.5456945539297,40.5451718389553,40.5450772536444,40.5449767367568,40.5448703391151,40.544758114515,40.544640119698,40.5445164143231,40.5443870609358,40.5442521249373,40.5441116745506,40.5439657807865,40.5438145174075,40.5436579608903,40.5435639436714,40.5434749795103,40.5433912054578,40.5433127505685,40.5432397357024,40.5431722733387,40.543110467403,40.5430544131064,40.5430041967997,40.5429598958404,40.542921578473,40.5428893037244,40.5428631213131,40.5418605102404,40.5418339604531,40.5480052923383,40.5495162890124,40.5505459430503,40.5507496094051,40.5509546376585,40.5511607948654,40.551367846796,40.5515755582016,40.5517836930822,40.5519920149544,40.5522002871201,40.5524082729355,40.55261573608,40.5528224408246,40.5530281522999,40.553232636763,40.5534356618632,40.5536369969055,40.5538364131138,40.55403368389,40.5542285850718,40.5544208951878,40.554610395709,40.554796871297,40.5549801100494,40.5551599037397,40.5553360480551,40.555508342828,40.555676592264,40.556781364702,40.5568599287321,40.5569326721707,40.5569994675993,40.5570601980174,40.5571147570482,40.5571630491243,40.5572049896556,40.5572405051776,40.5572695334798,40.5572920237148,40.5573079364878,40.5573172439251,40.5572991547116,40.5572878798398,40.5572834515152,40.5572858823865,40.5572951655103,40.5573112743706,40.5573341629547,40.5573637658846,40.5573999986031,40.5574427576163,40.5574919207881,40.5575473476899,40.5576088800008,40.5576763419598]}],[{"lng":[-73.8636113295238,-73.8644930291127,-73.8645724530018,-73.8666835996215,-73.8663383636396,-73.8652255543476,-73.8645417611104,-73.8644663293313,-73.8653428508824,-73.8643096948521,-73.8631693027943,-73.8630876752873,-73.862868922114,-73.8626737282957,-73.8626760798278,-73.8626839125124,-73.8626935669121,-73.8627042426979,-73.8627141083374,-73.8627735330123,-73.8629592059013,-73.8630048294378,-73.863198836654,-73.8633548259163,-73.8634236098639,-73.863493063602,-73.8635586267797,-73.8637303990016,-73.863876398297,-73.864027918788,-73.8644998105449,-73.864599490949,-73.8647532374843,-73.86482648734,-73.8648457640144,-73.8649546750932,-73.8650892685746,-73.8652553467216,-73.8653782480632,-73.8655375725741,-73.865576083572,-73.8656514519138,-73.8657243816347,-73.8657945321696,-73.8658616070943,-73.8663598437849,-73.8664427551592,-73.8665338659245,-73.8666108929557,-73.8665383219141,-73.8663010507296,-73.8663094123243,-73.8665495589555,-73.8666300571505,-73.8666858040465,-73.8667419788776,-73.866792162326,-73.8668611196514,-73.8668840105985,-73.8669635707924,-73.8670297222431,-73.867091810783,-73.8671429879067,-73.8673262202151,-73.8673813933508,-73.8674257709774,-73.8674742990935,-73.8676523668321,-73.8676877093092,-73.8677087811788,-73.8677506350579,-73.8678531739867,-73.8678815584405,-73.8679236704756,-73.8679724519841,-73.8680745547832,-73.868097824395,-73.8681796931619,-73.8682353121071,-73.8683267709937,-73.8683648423974,-73.8683769037809,-73.8683950442179,-73.8684327244352,-73.868451401221,-73.8684670518855,-73.8684824121516,-73.8684869484588,-73.8684895369912,-73.8683861025469,-73.8682318187936,-73.8682511755017,-73.8684055523222,-73.8685275320511,-73.868549863565,-73.868623218271,-73.8686901563823,-73.8689360528216,-73.8690517579423,-73.8691282463429,-73.8692499643221,-73.8694848895482,-73.8695487239752,-73.8696809502264,-73.8698863945634,-73.8700302879703,-73.8703197307059,-73.8703948097212,-73.8704872406495,-73.8706221481524,-73.8705161185081,-73.8702528539713,-73.8702758846469,-73.8705352486937,-73.870640941506,-73.8706456539157,-73.8706586695132,-73.8706663074306,-73.8707907428892,-73.8709131620648,-73.8709997007495,-73.8711121195577,-73.8711624983262,-73.8712415182737,-73.8712898277122,-73.871362894894,-73.8714454347018,-73.8716022504034,-73.8717026448745,-73.8718730410604,-73.8723261708997,-73.8725083117448,-73.8725776351144,-73.8726397128045,-73.8726467126448,-73.8725874901474,-73.8723787804738,-73.8723986982237,-73.8725687931846,-73.8726088308715,-73.8726625102607,-73.8726667706931,-73.872685834534,-73.8727061484115,-73.8727216588162,-73.8727326631845,-73.8727464978413,-73.8727576187202,-73.8727734264097,-73.8728299825045,-73.8728807659337,-73.8729349313741,-73.8729760045507,-73.8730163007437,-73.8730664610891,-73.8731291017865,-73.8732062803706,-73.8732838499305,-73.8733179928008,-73.8734017852769,-73.8734284915006,-73.8734579941904,-73.873500183962,-73.8735444658861,-73.8735882385913,-73.8736497574944,-73.873727501358,-73.8737735366131,-73.8738206562612,-73.8738909048484,-73.8739526901536,-73.8739320736625,-73.8739467145849,-73.8739681745212,-73.8739945233407,-73.8740390002515,-73.8740898973152,-73.8741155883481,-73.87415824033,-73.8742326006635,-73.8742742014696,-73.8743375801887,-73.8743939610555,-73.8744293747284,-73.8744774075448,-73.8745089757562,-73.8745488906863,-73.874594959928,-73.874606147382,-73.8746204284669,-73.8746232205979,-73.8746046592085,-73.8745989432893,-73.8746190677548,-73.8746380095013,-73.8746887466617,-73.874724852141,-73.8747925621882,-73.8748481345684,-73.874903386451,-73.8749528753117,-73.8749878606346,-73.8750273730929,-73.8750730964324,-73.8751207134788,-73.8751683304187,-73.8751904661137,-73.8752118606167,-73.8752314656925,-73.8752487045967,-73.8752796832832,-73.8752940700634,-73.8753238827349,-73.8752837447079,-73.8752987558433,-73.8753383732131,-73.8753554849568,-73.8753909901523,-73.8754098908836,-73.8754447377146,-73.8754618731102,-73.8754930940936,-73.8755278253067,-73.8755610079745,-73.8755878654712,-73.8756142947204,-73.8756436101384,-73.8756747513537,-73.875703189268,-73.8757337043466,-73.875762559057,-73.8758116871438,-73.8758354497339,-73.8758775351533,-73.8758987918399,-73.8759208219515,-73.8759606213908,-73.8759896264525,-73.8759533805188,-73.8759684141703,-73.8760043473053,-73.876021723435,-73.8760500121257,-73.8760854259758,-73.8761110475568,-73.876150039594,-73.876176641681,-73.876229604878,-73.8762464269039,-73.8762918266537,-73.8763061204558,-73.8763318091073,-73.8763421210658,-73.8763615064249,-73.8763730522169,-73.8763921254408,-73.8764140857242,-73.8764424192696,-73.8764570593083,-73.8764725765806,-73.8764881643388,-73.8765044202692,-73.8765161733708,-73.8765296584527,-73.8765420822694,-73.8765711075602,-73.8765852970514,-73.8766008155932,-73.8766204078742,-73.8766421267241,-73.876649977718,-73.8766332524719,-73.8766500991351,-73.8766654259648,-73.8766789006246,-73.8766951235687,-73.8767144514224,-73.8767336987019,-73.8767771235201,-73.8768009884024,-73.8768270603516,-73.8768530726646,-73.8768668706868,-73.8768950892157,-73.8769087132656,-73.8769479124587,-73.8769633265072,-73.8770081942973,-73.8770238967986,-73.8770383985299,-73.8770531420265,-73.8770684865418,-73.8770851938756,-73.8771011388166,-73.8771163440668,-73.8771314453634,-73.8771470669348,-73.8771635318878,-73.8771783916156,-73.8771921778956,-73.8772225551789,-73.8772488454847,-73.8772355636698,-73.8772531832779,-73.8772661198348,-73.8772755180184,-73.87729857586,-73.8774107679178,-73.8775038056453,-73.8775844299736,-73.877684592334,-73.8777769697276,-73.8778539334365,-73.8779333930285,-73.8779802675992,-73.8780643081606,-73.8781478196826,-73.8782406253741,-73.8783568562458,-73.8784966073044,-73.8786090398963,-73.878720179335,-73.8787917848763,-73.8788923710382,-73.8790539954178,-73.8792251339631,-73.8793827492325,-73.8793881144645,-73.8794076999255,-73.8794279601802,-73.8794489006676,-73.8794707963034,-73.8794954463661,-73.8795226329305,-73.8795499232578,-73.879578777394,-73.8796068754013,-73.8796253672907,-73.879641345249,-73.8796553898528,-73.8796729072942,-73.8796990791223,-73.8797156978585,-73.8797322226706,-73.8797484851916,-73.8797638741584,-73.8797806170285,-73.8797984622318,-73.8798165261773,-73.8798337985224,-73.8798504697368,-73.8798672233611,-73.8798845342442,-73.8799134879176,-73.879925480793,-73.8799497438309,-73.8799743319984,-73.8799988232499,-73.8800265598875,-73.8800564530407,-73.8800853501523,-73.8801144917984,-73.8801388582061,-73.8801608405444,-73.8801862432182,-73.8802143217964,-73.8802410558386,-73.8802664442321,-73.8802816599137,-73.8802852482995,-73.8802887314462,-73.8802913349074,-73.880287319713,-73.88027840928,-73.8802701130248,-73.8802675494022,-73.8802645271851,-73.8802650873212,-73.8802720619761,-73.8802902225468,-73.8803202015873,-73.8803342751083,-73.8803553504257,-73.8803709770919,-73.8803865238183,-73.8803981355584,-73.8804149029379,-73.8804406158269,-73.8804574880567,-73.8804783315629,-73.8805050813086,-73.8805204471406,-73.880535067378,-73.8805518013572,-73.880567898024,-73.8805846655495,-73.8805987405071,-73.8806247182728,-73.8806550328625,-73.8806712254117,-73.880687500168,-73.8807038828735,-73.8807208433217,-73.8807391628092,-73.8807579545786,-73.8807759545183,-73.8807925485915,-73.8808087518941,-73.8808257009109,-73.8808417646691,-73.8808558789195,-73.8808798549296,-73.8809059096621,-73.8809211803021,-73.8809392487336,-73.88095900626,-73.8809780194721,-73.8809968788297,-73.8810128228147,-73.881047698884,-73.8810658172375,-73.8810827662343,-73.881099358105,-73.8811143662928,-73.8811299537612,-73.8811492519276,-73.8811696234928,-73.8811857560227,-73.8812000825893,-73.8812189779924,-73.8812368359078,-73.8812538575203,-73.8812670754167,-73.8812824922131,-73.8813042410815,-73.8813265586235,-73.8813487107849,-73.8813689489703,-73.8813898367189,-73.8814120452841,-73.8814329314113,-73.881451833468,-73.8814729360648,-73.8814958133455,-73.8815191542814,-73.8815320118978,-73.8815547039271,-73.8815754938479,-73.8815965680315,-73.881619259613,-73.8816401884444,-73.8816634567865,-73.8816889926377,-73.8817025356876,-73.8817173773788,-73.8817326092093,-73.8817465881272,-73.8817586184783,-73.8817819212203,-73.8818053790233,-73.881829476463,-73.8818423348379,-73.8818562332559,-73.8818702503476,-73.8818826829409,-73.8818945598807,-73.881906957149,-73.8819210786526,-73.8819349052522,-73.8819483061399,-73.8819612697965,-73.8819745651355,-73.8819875296367,-73.8820005040657,-73.8820360491699,-73.8820588059176,-73.8820819996501,-73.8821070736858,-73.8821216897349,-73.8821362009455,-73.8821491394014,-73.8821604122492,-73.8821830640957,-73.8822061509316,-73.8822294874467,-73.8822556351734,-73.8822820641386,-73.8823092830407,-73.8823345270263,-73.8823526704722,-73.8823707414756,-73.8823851748646,-73.8824158672829,-73.8824162120251,-73.88241602369,-73.8823527124969,-73.882356357125,-73.8823592303983,-73.8823744167974,-73.8823854904356,-73.8823980883645,-73.8824195896144,-73.8824258445805,-73.8824378051493,-73.8824390871065,-73.88245337703,-73.882473283226,-73.8824866815976,-73.8825075025293,-73.8825205700058,-73.8825388835077,-73.8825554023756,-73.8825739413358,-73.8825957505849,-73.882617523669,-73.8826386124801,-73.8826559960189,-73.8826701801523,-73.8826879649602,-73.8827067865281,-73.8827232354037,-73.8827418790111,-73.8827612416815,-73.8827776183866,-73.8828004661791,-73.882826527758,-73.8828490225591,-73.8828762604977,-73.8828964477117,-73.8829164574741,-73.8829396297221,-73.8829583785698,-73.8829787454126,-73.8830090026561,-73.8830277150227,-73.8830503248985,-73.883074475417,-73.8830982621813,-73.8831098264082,-73.8831376495745,-73.8831443819454,-73.8831633133861,-73.8831843371579,-73.8832035325496,-73.8832184047981,-73.8832328032012,-73.8832474156215,-73.8832655270563,-73.8832868896189,-73.8833094351043,-73.8833304664062,-73.8833522544527,-73.8833739347156,-73.8833920132912,-73.8834085789114,-73.8834259028192,-73.8834353998252,-73.8834431569507,-73.8834590395883,-73.8834755738798,-73.8834933725867,-73.883512859152,-73.8835328176367,-73.8835551042597,-73.8835765415392,-73.8835990543216,-73.8836214608744,-73.8836406196835,-73.8836593548208,-73.8836801441924,-73.8837024428477,-73.8837275769731,-73.8837403622964,-73.8837524963408,-73.8837756926996,-73.8838000116076,-73.8838232817823,-73.8838466939579,-73.8838610980943,-73.8838756198105,-73.8838907094268,-73.8839075224937,-73.8839279409055,-73.8839494086169,-73.8839690701959,-73.8839908203671,-73.8840147324752,-73.8840359745521,-73.8840572629733,-73.8841056884477,-73.8841324117759,-73.8841587684461,-73.8841840883877,-73.8842050830723,-73.8842217179733,-73.8842369128128,-73.8842516820894,-73.8842667714668,-73.8842815400791,-73.8842971729714,-73.8843137017091,-73.8843310946315,-73.8843484869369,-73.8843642243774,-73.8843791356449,-73.884393254304,-73.8844074077149,-73.884432064304,-73.8844540744506,-73.8844760727287,-73.884497208574,-73.8845149996423,-73.8845339020197,-73.8845543911888,-73.8845742068728,-73.8845979797353,-73.8846109772309,-73.8846249896923,-73.8846385650166,-73.8846533235087,-73.884670043243,-73.8846861728719,-73.8847019129205,-73.8847169328813,-73.8847314804796,-73.8847440539328,-73.8847553264898,-73.8847749144084,-73.8847911250262,-73.8848041665422,-73.8848168532933,-73.8848360187817,-73.8848580084243,-73.8848843688667,-73.8848567487085,-73.8848294233947,-73.8848263976224,-73.8848273858012,-73.8848380904247,-73.8848594947987,-73.8848824392988,-73.8848970100832,-73.8849071562974,-73.8849203051875,-73.8849443679718,-73.8849511180102,-73.8849770114872,-73.8849938495859,-73.8850127096121,-73.8850292330992,-73.885052271757,-73.8850818267642,-73.8851127779889,-73.8851308835123,-73.8851488156457,-73.8851658160037,-73.8851812879553,-73.8851987482443,-73.8852174405885,-73.885234191288,-73.8852485866231,-73.885273868947,-73.8852964895182,-73.8853141363416,-73.8853301523258,-73.8853466783229,-73.8853632401859,-73.8853837426773,-73.8854083777507,-73.8854327762529,-73.8854530907159,-73.8854753112317,-73.8855030253378,-73.8855166632546,-73.885544272022,-73.8855582775894,-73.8855824162641,-73.8855987165488,-73.8856121055156,-73.8856334022087,-73.8856508311301,-73.8856703865086,-73.8856904900269,-73.8857087077934,-73.885725269898,-73.8857448979587,-73.885760878809,-73.8857769069595,-73.8857941946982,-73.885808948384,-73.8858277852816,-73.8858469176142,-73.8858676248084,-73.88589285466,-73.8859060922695,-73.8859335968961,-73.8859454024234,-73.8859747062489,-73.8859897214488,-73.8860086295033,-73.8860289513432,-73.8860489416346,-73.886071109524,-73.8860849281564,-73.8861110968447,-73.8861485309128,-73.8861686390254,-73.8861858568533,-73.8862028139775,-73.8862211084262,-73.8862390146779,-73.886258910141,-73.8862802386738,-73.8863112404774,-73.8863321055742,-73.8863488510919,-73.8863668606566,-73.8863864258304,-73.8864055634253,-73.8864200715227,-73.8864367477369,-73.8864462444221,-73.8864699178598,-73.8864867816284,-73.8865078600896,-73.8865279565181,-73.8865440262623,-73.8865647027499,-73.8865848475004,-73.8866015938659,-73.8866100866124,-73.8866347787031,-73.8866482329217,-73.8866626455494,-73.8866774017688,-73.8866918027641,-73.8867102525096,-73.8867255881532,-73.8867427356908,-73.8867600242327,-73.8867774205654,-73.8868056866638,-73.8868251081218,-73.886846185617,-73.886865455317,-73.8868821421944,-73.8868951709223,-73.8869077738954,-73.8869215976938,-73.8869350660175,-73.886941273518,-73.8869617068307,-73.8869734857866,-73.8869831680338,-73.8869889206047,-73.886992389675,-73.8869951820822,-73.8869954720765,-73.88695260038,-73.8869503889954,-73.886948337714,-73.8869751080115,-73.8870058914959,-73.8870110333348,-73.8870179748427,-73.8870298901837,-73.8870656347993,-73.8870662133412,-73.8870718299723,-73.8870892452764,-73.887106957488,-73.8871221422342,-73.8871402444857,-73.8871584170819,-73.8871816311594,-73.8871956339974,-73.8872120089976,-73.8872291763723,-73.8872469451602,-73.8872650100889,-73.8872913275863,-73.8873100301024,-73.8873315194377,-73.8873545562877,-73.8873755375107,-73.8873959420781,-73.8874147285442,-73.8874315422127,-73.8874478371795,-73.8874687126093,-73.88750700362,-73.8875304292464,-73.8875517401487,-73.8875717520427,-73.8875931219592,-73.8876117994421,-73.8876286359486,-73.8876464522692,-73.8876609625663,-73.8876688394054,-73.887694250743,-73.887715340571,-73.8877322980817,-73.8877467994364,-73.8877668156752,-73.8877839521201,-73.8878015857729,-73.8878195494186,-73.8878328013095,-73.8878534247632,-73.8878752435507,-73.8878925610638,-73.8879114384691,-73.887924612014,-73.8879417212941,-73.887956019609,-73.8879666430407,-73.8879804093226,-73.8879963271807,-73.8880075300954,-73.8880237288677,-73.8880476087853,-73.8880629579635,-73.8880777536488,-73.8880938236922,-73.8881118307228,-73.8881272377495,-73.8881441672807,-73.8881623105665,-73.8881751281128,-73.8881884555166,-73.888211647912,-73.8882340822326,-73.8882524789828,-73.8882699048499,-73.8882870467544,-73.8883044874913,-73.8883178045346,-73.8883347745588,-73.8883464040058,-73.8883512012762,-73.8883742544533,-73.8883934805102,-73.8884119606611,-73.8884346089272,-73.88845783243,-73.8884743234939,-73.8884859962259,-73.8885001015592,-73.8885149772188,-73.8885450129405,-73.8885604316523,-73.8885751894861,-73.8885881983002,-73.8886016310847,-73.8886153128972,-73.8886414248369,-73.8886634605054,-73.8886823662913,-73.8887056346912,-73.8887209520704,-73.8887338823092,-73.8887475668122,-73.8887635644898,-73.8887786148414,-73.8887944573452,-73.8888118462847,-73.8888287632054,-73.8888431745663,-73.8888687023635,-73.8888852295012,-73.8888989814032,-73.8889137134724,-73.8889297681178,-73.8889482799551,-73.8889653864726,-73.8889816895705,-73.8889987960814,-73.889013421802,-73.8890323617647,-73.8890480627826,-73.8890645955248,-73.8890786000221,-73.8890897309991,-73.8891049044481,-73.8891246028719,-73.8891430729845,-73.8891584235231,-73.8891750585277,-73.8892004497328,-73.8892171555851,-73.8892343340056,-73.8892499294803,-73.8892651940847,-73.8892818246389,-73.8892986791705,-73.8893152723213,-73.8893351879128,-73.8893357193388,-73.8893479348072,-73.8893690002114,-73.8893859216667,-73.8893995335843,-73.8894163621374,-73.8894280985923,-73.8894400605295,-73.8894525648784,-73.8894657189563,-73.8894790396637,-73.8894942887611,-73.8895032919375,-73.8895241314313,-73.8895382113087,-73.8895560022638,-73.8895720265046,-73.8895834926073,-73.8895940851253,-73.8896051399749,-73.8896188399402,-73.8895926256344,-73.8896394754289,-73.8896611473774,-73.8897125166058,-73.8897318305541,-73.8897466592472,-73.8897668465181,-73.8897884365622,-73.8898101675598,-73.8898263876075,-73.8898427264074,-73.889865478567,-73.8898829269558,-73.8899054527058,-73.889925271436,-73.8899436251793,-73.8899607198016,-73.8899782776807,-73.8899949742274,-73.8900149513571,-73.8900308556968,-73.8900474796024,-73.8900652253863,-73.890081670511,-73.8901004563939,-73.8901185943874,-73.8901360577103,-73.8901518210717,-73.8901698816206,-73.8901773299972,-73.8901841301177,-73.8901910691231,-73.8901991642258,-73.8902026414446,-73.8902165355359,-73.8902346475846,-73.8902521813761,-73.8902662296028,-73.8902820358395,-73.8902961529898,-73.8903116045611,-73.8903262178215,-73.8903450480544,-73.8903745457453,-73.8903910013933,-73.8904068778248,-73.8904233318436,-73.8904425142591,-73.8904563463809,-73.8904710289626,-73.8904887144677,-73.8905023585841,-73.8905186377465,-73.8905491641335,-73.8905731470376,-73.8905942578775,-73.8906109979651,-73.890623922959,-73.8906385010502,-73.8906524433935,-73.8906680755493,-73.8906851487941,-73.8907032615922,-73.8907175195228,-73.8907373874058,-73.8907589230427,-73.8907796300435,-73.8907958963037,-73.890810771714,-73.8908220810734,-73.8908394030616,-73.8908549649827,-73.8908764351628,-73.890895160977,-73.8909130138337,-73.8909297671221,-73.8909458232364,-73.8909602596397,-73.8909793874437,-73.8909933173852,-73.8910121648075,-73.8910283640108,-73.8910414440566,-73.8910549491734,-73.8910680882565,-73.891081166934,-73.891095203827,-73.8911128550402,-73.891127766212,-73.8911433968183,-73.8911590875941,-73.8911772826575,-73.8911839104862,-73.8912080377105,-73.8912252541496,-73.8912413125525,-73.8912568743287,-73.8912700469697,-73.8912842374989,-73.8913029974393,-73.891317187949,-73.8913335739666,-73.8913487313569,-73.8913702324131,-73.8913892383485,-73.8914048310546,-73.8914188761831,-73.89143378339,-73.8914519279084,-73.8914656405205,-73.8914818484358,-73.8914949872161,-73.8915086821131,-73.8915194555626,-73.891528464146,-73.8915482632456,-73.8915673155099,-73.8915829777034,-73.8915979927195,-73.891611274634,-73.8916265561547,-73.8916405593407,-73.891654468208,-73.8916682591017,-73.8916861960403,-73.8917023365416,-73.8917141761112,-73.8917278339071,-73.8917436087502,-73.8917559248699,-73.8917676013771,-73.8917822927393,-73.8917923863957,-73.8918033305939,-73.8918173438662,-73.8918248683843,-73.8918516839,-73.8918680976514,-73.8918817012714,-73.8918989829858,-73.8919118009201,-73.8919235482839,-73.8919365147703,-73.8919479345298,-73.8919576292187,-73.8919720052427,-73.8919847962727,-73.8919971957187,-73.8920088620753,-73.8920211869688,-73.8920300739881,-73.8920445263988,-73.8920613433801,-73.8920739176222,-73.8920869968554,-73.8921137369647,-73.8921386439618,-73.8921647132066,-73.8921993963759,-73.8922036773825,-73.8922663713837,-73.8922784885256,-73.8922972985661,-73.8923172563169,-73.8923389548432,-73.8923581722535,-73.8923723831729,-73.8923883154821,-73.8924044341479,-73.8924084923351,-73.8924254928589,-73.8924381085829,-73.8924492860879,-73.8924622591761,-73.8924773962248,-73.8924938408947,-73.8925094594325,-73.892527450993,-73.8925451950121,-73.8925590438621,-73.8925678277281,-73.8925967660423,-73.8926153302368,-73.8926331142013,-73.8926531657461,-73.8926688238802,-73.8926876103423,-73.8927093842571,-73.8927252203909,-73.8927400539467,-73.8927582285079,-73.8927839978274,-73.8928003448394,-73.8928155345823,-73.8928317400362,-73.8928494918879,-73.8928669467291,-73.8928834325399,-73.8929010997339,-73.8929185314161,-73.8929368475022,-73.8929565712635,-73.8929716670592,-73.8929880734527,-73.8930050697284,-73.8930230319097,-73.8930405225727,-73.8930593123053,-73.8930739339635,-73.893089842962,-73.8931056815176,-73.8931259485519,-73.8931518031743,-73.8931680328501,-73.8931848192112,-73.893195304034,-73.893208617608,-73.8932276638708,-73.8932487907422,-73.8932628014221,-73.893278278686,-73.8932950656039,-73.8933127024746,-73.8933274687079,-73.893344027972,-73.8933599024965,-73.8933763219616,-73.8933921620817,-73.8934084728107,-73.8934242426321,-73.8934359490259,-73.8934561458079,-73.8934706505056,-73.8934863536199,-73.8934997967821,-73.8935147869029,-73.8935324277669,-73.8935451768537,-73.8935495519015,-73.8935545879222,-73.8935595172113,-73.8935666552342,-73.8935863145931,-73.893605326364,-73.8936186536995,-73.8936355454666,-73.8936529711883,-73.8936676264106,-73.8936799554251,-73.8936913732919,-73.8937039832919,-73.8937191808248,-73.8937348837495,-73.893747491994,-73.8937616438375,-73.8937800330014,-73.893790294279,-73.8938100857548,-73.8938275574881,-73.8938424217052,-73.8938623446109,-73.893874278906,-73.8938779770227,-73.8938941053767,-73.8939115427708,-73.8939247149953,-73.893940993596,-73.893955253216,-73.893970851267,-73.893985763907,-73.8939977921127,-73.8940138143366,-73.8940258456039,-73.8940413725927,-73.8940541575227,-73.8940704988849,-73.8940831766383,-73.8940999301583,-73.8941148759661,-73.8941270824512,-73.8941434010887,-73.8941543432201,-73.8941671649348,-73.8941843126643,-73.894196672808,-73.8942127656715,-73.8942232836113,-73.8942364721489,-73.8942527089062,-73.8942683052763,-73.8942758664445,-73.8943040279781,-73.8943238969556,-73.8943430567223,-73.8943606231462,-73.8943777294342,-73.8943943294632,-73.8944106466766,-73.894428581734,-73.8944404691671,-73.8944564558038,-73.8944722648734,-73.8944918150637,-73.8945070786952,-73.8945210539847,-73.8945342727724,-73.8945501135455,-73.8945655184921,-73.8945784905098,-73.8945938246094,-73.8946075790644,-73.8946321076485,-73.894647266847,-73.8946646598369,-73.8946797966905,-73.8946951332959,-73.8947109060071,-73.894727835053,-73.8947463352354,-73.8947661476704,-73.8947750431635,-73.8948011434227,-73.8948165296447,-73.894828595949,-73.8948412411335,-73.8948571950491,-73.8948763610932,-73.8948940000281,-73.8949082243786,-73.8949250789311,-73.8949414083753,-73.8949484836621,-73.8949514249942,-73.8949527601394,-73.8949541911714,-73.8949551734091,-73.8949559942491,-73.8949564947503,-73.8949562617203,-73.8948975640329,-73.8948819661663,-73.8948901040065,-73.8948901401568,-73.8949181726639,-73.8949421816391,-73.894955641369,-73.8949663169489,-73.8950173488561,-73.895017937896,-73.8950187996601,-73.8950200025571,-73.8950457120953,-73.8950640624076,-73.8950770760282,-73.8950911347205,-73.8951079724782,-73.8951222108766,-73.8951343949402,-73.8951434505136,-73.8951475330495,-73.8951485267189,-73.8951469283566,-73.8951515915655,-73.8951616465734,-73.8951734041618,-73.8951845869694,-73.8951998276188,-73.8952172056299,-73.8952306441212,-73.8952437064054,-73.8952680546952,-73.8952865163084,-73.8953016634738,-73.895318936584,-73.8953390899614,-73.8953571923589,-73.8953723060128,-73.8953878912956,-73.8954059576507,-73.8954203637431,-73.8954362697205,-73.8954435433923,-73.8954708187832,-73.8954944585395,-73.8955118877109,-73.8955279008104,-73.8955448250694,-73.895565659529,-73.8955839186681,-73.8956023780589,-73.8956169990622,-73.8956323282864,-73.8956543655359,-73.8956735795029,-73.8956908596372,-73.8957069240623,-73.8957210742432,-73.8957387792503,-73.8957539335624,-73.8957665011288,-73.8957874891693,-73.8958042376849,-73.8958264404445,-73.8958337632165,-73.8958391336006,-73.8958518520311,-73.8958669424309,-73.8958796583669,-73.8958951518649,-73.8959058494862,-73.8959189238513,-73.8959350681013,-73.8959455135812,-73.8959612816688,-73.8959883541575,-73.8960040165087,-73.8960210845181,-73.8960417790568,-73.8960648951546,-73.8960871833128,-73.8961088236106,-73.8961295532763,-73.8961757148673,-73.8961937163428,-73.8962131611484,-73.896233752489,-73.896254779314,-73.8962775333992,-73.8963028574274,-73.8963325749897,-73.8963537486009,-73.8963688745841,-73.8963807290363,-73.8963918931438,-73.8964088890203,-73.8964263485628,-73.8964459336594,-73.8964707044747,-73.8964948976914,-73.8965207913381,-73.8965351208919,-73.8965486947657,-73.8965730308227,-73.8965988198401,-73.8966241363034,-73.8966502984294,-73.8966738122563,-73.8966912688659,-73.896706861711,-73.8967201877132,-73.8967319909397,-73.8967460392351,-73.8967623238846,-73.8967799305114,-73.8967928679052,-73.8968082734379,-73.8968250981738,-73.8968426313344,-73.8968467423028,-73.8968625731448,-73.8968878200112,-73.8969013940518,-73.8969146139116,-73.8969431659874,-73.8969582505035,-73.8969723675976,-73.8969952294265,-73.8970085611632,-73.8970195965619,-73.8970219405276,-73.8970272086246,-73.8970357200894,-73.8970481215989,-73.8970618102129,-73.8970734555977,-73.8970835856682,-73.897083963115,-73.8970794853591,-73.8970763764495,-73.8970744919834,-73.8970696143954,-73.8970682502089,-73.8970658664873,-73.8970638000344,-73.897064591606,-73.8970795611668,-73.8970968467929,-73.8971185913381,-73.8971255262877,-73.8971289970519,-73.8971296536063,-73.8971331754792,-73.897136923637,-73.8971390967053,-73.8971421344785,-73.8971462464826,-73.897151740008,-73.8971556027239,-73.8971597251632,-73.8971637679964,-73.8971685651108,-73.8971714654906,-73.8971742583602,-73.8971768633552,-73.8971854425313,-73.8971859619495,-73.8971949117037,-73.8972064104602,-73.8972231209831,-73.897238331912,-73.8972558640443,-73.8972684676474,-73.8972724995262,-73.8972856912195,-73.8972963931953,-73.8973064624851,-73.8973170257423,-73.8973310799625,-73.8973424711099,-73.8973568861931,-73.8973831757135,-73.8973967006846,-73.8974107679729,-73.8974249425597,-73.8974521682449,-73.897478864431,-73.8974949749068,-73.8975108376365,-73.8975303360197,-73.8975496942272,-73.897570278356,-73.8975903559965,-73.8976088058294,-73.8976290262806,-73.8976488936645,-73.8976674504284,-73.8976837528675,-73.8976995462549,-73.8977164616661,-73.8977324691634,-73.8977478752496,-73.8977646743382,-73.8977800086008,-73.8978073153412,-73.8978294010431,-73.8978403770865,-73.8978904923303,-73.8979081999625,-73.8979289554443,-73.8979510936345,-73.8979720400911,-73.8979951479681,-73.8980162729331,-73.898032758131,-73.8980485922053,-73.8980659371215,-73.8980844780186,-73.8981087705836,-73.8981304071463,-73.8981496664705,-73.8981742019625,-73.8981908738412,-73.8982076786758,-73.8982343213399,-73.8982482825628,-73.8982608131258,-73.8982860889416,-73.8983110353072,-73.8983327826384,-73.8983356999338,-73.898351753959,-73.8983762067774,-73.8983985342539,-73.8984209542545,-73.8984437541306,-73.8984653939166,-73.898485191672,-73.8985028356767,-73.8985041596106,-73.8985145041391,-73.8985194637294,-73.8985414548581,-73.8985682083693,-73.8985822185029,-73.8985964293353,-73.8986124239452,-73.8986317952826,-73.8986521365945,-73.8986621310926,-73.8986737784478,-73.898696317933,-73.8987216928349,-73.8987457903566,-73.8987674201223,-73.898790609688,-73.898812724255,-73.8988343662659,-73.8988527229342,-73.8988729226896,-73.8988938071751,-73.898914290617,-73.8989344897011,-73.8989571697072,-73.898980512792,-73.8990017514762,-73.8990196466884,-73.8990374256058,-73.8990551074595,-73.8990719164587,-73.8990853472157,-73.8990952588455,-73.8991171842639,-73.8991319889622,-73.8991144647642,-73.8991000406908,-73.8991026135143,-73.8991063311197,-73.8991110807585,-73.8991167183829,-73.8991230730139,-73.8991299519273,-73.8991371464984,-73.8991444385294,-73.8991516068665,-73.8991584341071,-73.8991647131942,-73.8991702536941,-73.8991748875738,-73.8991969286806,-73.8992134631296,-73.8992999961605,-73.8993872916842,-73.8994744002641,-73.899560374496,-73.8996442793144,-73.8997252021632,-73.8998022629208,-73.8997952094684,-73.8997927491468,-73.899794915274,-73.8997975615876,-73.8998010235963,-73.8998052081389,-73.8998100026115,-73.8998152779973,-73.8998208923378,-73.8998266945543,-73.8998325285119,-73.8998382372222,-73.8998436670661,-73.8998486719295,-73.8998531171341,-73.8998568830614,-73.8998773143845,-73.8998924803396,-73.8999020563856,-73.89999588547,-73.9000899828481,-73.9001835917141,-73.9002759591905,-73.9003663423857,-73.900454014369,-73.9005382700172,-73.9005398464212,-73.9005377817857,-73.900532119198,-73.9005347416163,-73.9005393475988,-73.9005458060813,-73.9005539332867,-73.9005634979546,-73.9005742279221,-73.9005858178673,-73.9005943684698,-73.9006023202462,-73.9006094790761,-73.9006156701964,-73.9006207424679,-73.9006245720645,-73.9006270654971,-73.9006281618952,-73.9006422262519,-73.9006521142797,-73.9006577817328,-73.9007011551582,-73.9007379790246,-73.9008513058857,-73.9009667361983,-73.9011023862968,-73.9012400164108,-73.9013790712455,-73.9015975687609,-73.9018164661936,-73.9020354455625,-73.9021147552507,-73.9023421019478,-73.902568711181,-73.9027942267971,-73.9030182943618,-73.9032405617191,-73.9034606795431,-73.9036783018887,-73.9040586929179,-73.9044365125221,-73.9048116128226,-73.9051838470074,-73.9055530693881,-73.9059191354582,-73.9062540843084,-73.9065857490928,-73.9069139101127,-73.9072383499937,-73.9075588538296,-73.9078752093252,-73.908187206936,-73.908494640009,-73.9087973049183,-73.9090849517405,-73.9092829979287,-73.9094791811541,-73.9095035521168,-73.9095063011081,-73.9091819173441,-73.9083539581389,-73.9084593012585,-73.9092068804636,-73.9092904720365,-73.9093810113839,-73.9094783798809,-73.90958244807,-73.9102645150203,-73.910697665914,-73.9106880765446,-73.9106472927737,-73.910601687513,-73.9105513242827,-73.910372421672,-73.9103921070442,-73.9101740613075,-73.9101479998986,-73.9101179993435,-73.9101009990952,-73.9100809993512,-73.9100789904178,-73.9100959998537,-73.9100989999712,-73.9100376297161,-73.9100323390823,-73.9100230764212,-73.9099723034905,-73.9098771456683,-73.9098755490563,-73.9098765383495,-73.9098110357142,-73.9097625843697,-73.9096907336255,-73.9096682386098,-73.9096535512362,-73.9095315534645,-73.9093913415669,-73.9092770814904,-73.9091835645525,-73.9090493410539,-73.9089211721263,-73.9087254513681,-73.9085158357453,-73.9083832812099,-73.9082119510577,-73.9080904469522,-73.9080730435863,-73.9079952845688,-73.9079717552091,-73.9079482148672,-73.9079331648651,-73.9079191596907,-73.9079065611063,-73.9078956945403,-73.9078868406824,-73.907880228232,-73.9078760279913,-73.9078743484541,-73.907875233002,-73.9078786587854,-73.9078845373133,-73.9079384277087,-73.9079852337301,-73.9080243801874,-73.9080553860238,-73.9080778702269,-73.90809155651,-73.9080962767057,-73.9080919728332,-73.9080648390424,-73.9080292631881,-73.9079857599726,-73.9079349587814,-73.9078775945765,-73.9078144972631,-73.9077465796845,-73.9076748244147,-73.9076002695447,-73.9075239936652,-73.9074471002631,-73.9073666762316,-73.9072798288399,-73.9071869440714,-73.9070884347374,-73.9069847386423,-73.9068763166365,-73.9067636505706,-73.906647241152,-73.9065276057219,-73.9064052759551,-73.9062807954982,-73.9061547175535,-73.9059438287517,-73.9057331496544,-73.9055230144353,-73.9053137564059,-73.9051057074866,-73.9048991976812,-73.9046945545537,-73.9044921027084,-73.9042921632762,-73.9040950534045,-73.9039010857546,-73.9037105680066,-73.903523802371,-73.9033410851092,-73.9031627060648,-73.9029889482024,-73.9029622187842,-73.9029727831142,-73.9028714333007,-73.90270957807,-73.9026546277041,-73.9025922976606,-73.9025231344804,-73.902447744615,-73.9023667891079,-73.9022809777987,-73.9021910630995,-73.9020978333986,-73.9020021061469,-73.9019047206924,-73.9018065309204,-73.901708397768,-73.9016111816762,-73.9015157350454,-73.9014228947631,-73.901235632564,-73.9010504156515,-73.9008676416955,-73.900687703123,-73.9005109862759,-73.9003378705816,-73.9001687277386,-73.9000039209185,-73.899843803987,-73.8996887207439,-73.896132624453,-73.8958166316655,-73.8956663077634,-73.895433323929,-73.8953372502706,-73.895454565432,-73.8956808438876,-73.8956831575407,-73.8956839233353,-73.8956831188288,-73.895680767597,-73.8956769385436,-73.8956717438795,-73.8956653358368,-73.8956579022051,-73.8956496608304,-73.8956408532291,-73.8956317375118,-73.8956225808188,-73.8956136514907,-73.8956052112053,-73.8955975073087,-73.8955907655667,-73.8955851835487,-73.8954860721863,-73.895447958184,-73.895265425395,-73.8945658095033,-73.8945535639847,-73.8943470682738,-73.8914974334036,-73.8912701145644,-73.8910489406769,-73.8909195104632,-73.890570511465,-73.8895703529338,-73.8891256594321,-73.8890262404147,-73.8881241945652,-73.8878212259583,-73.8869064451,-73.8866055656848,-73.8858303730298,-73.8853686026088,-73.8854058149184,-73.8854913682334,-73.8858879004768,-73.8865468400234,-73.8864424199488,-73.8862956965174,-73.8860133221726,-73.8859297674962,-73.8857220272244,-73.8855253744356,-73.8854210473079,-73.8853418301968,-73.8852892970495,-73.8851467629828,-73.8850621899404,-73.8850284088772,-73.8850000254086,-73.8848967822019,-73.8843097310527,-73.8843046669392,-73.8848870712472,-73.8847559483283,-73.8846397935349,-73.8847079107735,-73.8846773897261,-73.8846276452297,-73.8843368477482,-73.8842987608294,-73.8845872263366,-73.8845973421432,-73.8847368979913,-73.8847176876168,-73.8844597533558,-73.8841664662606,-73.8841809023689,-73.8841857256822,-73.884255637072,-73.8842560545,-73.8842262381348,-73.8841423383729,-73.8841561193721,-73.8841480672704,-73.8839890745021,-73.8839961004786,-73.884007526758,-73.8840717193515,-73.8840363832393,-73.8839701016892,-73.88398465406,-73.883974125313,-73.8837910370301,-73.8838069030385,-73.8838193709807,-73.884023400924,-73.883993260792,-73.8837881934638,-73.8837965106266,-73.8837808675611,-73.8837601597834,-73.8837694847298,-73.8835767067272,-73.8836919497781,-73.8834785008156,-73.8836976811031,-73.8839084517025,-73.8839042788441,-73.8836872809632,-73.8834653474965,-73.8833692731619,-73.8831309477431,-73.8831138564798,-73.8831109152025,-73.8830912985409,-73.8830733379197,-73.8830520232543,-73.8830289160619,-73.8830076886766,-73.8829928724059,-73.8829895562916,-73.8829708772637,-73.8829605109284,-73.8829539927881,-73.8829386322967,-73.8829232730061,-73.8829025076279,-73.8828881181202,-73.8828730774773,-73.882856195404,-73.8828383792699,-73.8828214702486,-73.8827999740372,-73.8827855060586,-73.8827640842769,-73.8827461612176,-73.8827312615787,-73.882714894745,-73.8826953376474,-73.882678706603,-73.8826628663012,-73.882647356467,-73.8826297064068,-73.8826121362228,-73.8825940821128,-73.882579393401,-73.8825624207648,-73.8825451641957,-73.8825292072079,-73.88251696222,-73.8825032279551,-73.882488713527,-73.8824798246325,-73.8824715626351,-73.8824508571581,-73.8824309313821,-73.8824097890766,-73.8823900889821,-73.8823728347231,-73.8823576600031,-73.8823432548687,-73.8823296410062,-73.8823125284216,-73.8822981933936,-73.8822863742942,-73.8822686225277,-73.8822549694179,-73.8822422175139,-73.8822224668608,-73.8822094323028,-73.8821968589678,-73.8821812940916,-73.882164554129,-73.8821492544641,-73.8821313939324,-73.8821095387251,-73.8820977215195,-73.8820866043097,-73.8820695586143,-73.8820178499041,-73.8819702188563,-73.8819225891014,-73.8819226001215,-73.8819072788426,-73.881892616846,-73.8818743776716,-73.8818434971748,-73.8818255990701,-73.8818082819819,-73.8817884102399,-73.8817705831497,-73.8817545281002,-73.8817400446436,-73.881733571167,-73.8817255382139,-73.8817063390418,-73.881689197652,-73.881670330497,-73.881654891261,-73.881633934213,-73.8816126471153,-73.8815942921179,-73.8815731962863,-73.8815504019912,-73.8815292375217,-73.8815083580284,-73.8814884562626,-73.8814673627766,-73.8814469424009,-73.8814248438588,-73.8814022366995,-73.8813818984351,-73.8813582760967,-73.8813348787342,-73.8813120151503,-73.8812899899062,-73.8812667373388,-73.8812459284977,-73.8812440990778,-73.8812198791834,-73.881199623999,-73.8811856563286,-73.8811716549246,-73.8811485478543,-73.881133977698,-73.8811178500327,-73.8811025250152,-73.8810843924999,-73.8810605336752,-73.881047513156,-73.8810325436917,-73.8810172452177,-73.8810024997093,-73.8809753235468,-73.8809525859164,-73.8809338020415,-73.8809167052046,-73.8808963389219,-73.8808747431561,-73.8808512493675,-73.8808300924381,-73.8808080248636,-73.880806407641,-73.880787942383,-73.8807627948612,-73.8807390428937,-73.8807191166047,-73.8807032726479,-73.8806856796717,-73.8806688655307,-73.8806537174327,-73.880636017406,-73.8806144240391,-73.8805921472235,-73.8805743327898,-73.8805534731679,-73.8805432606638,-73.8805326701731,-73.8805129538612,-73.8804926122529,-73.8804710279827,-73.8804558326657,-73.8804336685183,-73.8804168862766,-73.8804017686917,-73.8803811842881,-73.8803670004922,-73.880349038085,-73.8803288442766,-73.8803211799181,-73.8803089344671,-73.8802891429506,-73.8802700354299,-73.880253763002,-73.880233676534,-73.8802150317033,-73.8801974043537,-73.8801781832691,-73.8801645097377,-73.8801465488391,-73.8801255513685,-73.8801234024926,-73.8800980962713,-73.8800740206283,-73.8800491891564,-73.8800250074984,-73.8800022565668,-73.8799797291329,-73.8799575300854,-73.8799375873509,-73.8799266417823,-73.8798930346689,-73.8798718977874,-73.8798526866435,-73.879838610246,-73.8798219848695,-73.8798031265408,-73.8797862389313,-73.8797696124805,-73.8797581820166,-73.8797530566217,-73.8797336555665,-73.879715481371,-73.8796975180857,-73.8796813149436,-73.8796646509882,-73.8796454594403,-73.8796263871944,-73.879607090859,-73.8795885627288,-73.8795692998785,-73.8795453985284,-73.8795179303687,-73.8794927062651,-73.8794682966321,-73.879441302633,-73.879414485104,-73.8793889679826,-73.8793634823873,-73.8793357984612,-73.8793151423803,-73.8793019289567,-73.87928170143,-73.879259030653,-73.8792383318162,-73.8792187881528,-73.8791993153899,-73.8791744093102,-73.8791558674187,-73.8791342806749,-73.8791169678952,-73.8790980624541,-73.8790834195094,-73.8790684803536,-73.8790528944075,-73.8790357238126,-73.8790332791487,-73.8790190619414,-73.8790031905854,-73.878986776099,-73.8789661931276,-73.8789468977914,-73.878928604412,-73.8789084909184,-73.8788877180913,-73.8788706904323,-73.8788513603807,-73.8788351013405,-73.8788205884211,-73.8788040660362,-73.8787856422797,-73.8787701594239,-73.8787547597571,-73.8787319323622,-73.8787145494516,-73.8786968741593,-73.878687266263,-73.8786813484624,-73.8786797390724,-73.8786746736169,-73.8785169999532,-73.878303220537,-73.8781912454564,-73.8779725416071,-73.8778870198155,-73.8778080899573,-73.8776378530969,-73.8776057756234,-73.8774528179506,-73.8774001796679,-73.8773129940171,-73.8770689967848,-73.8768548587813,-73.8766212500724,-73.8765603879109,-73.8764337012452,-73.8763407507257,-73.8761145168805,-73.8760840841443,-73.8759845403442,-73.8758586734124,-73.8754300620292,-73.8751873602752,-73.8751059087809,-73.8748475856539,-73.8744304758418,-73.8739228738502,-73.8731651580676,-73.872600776491,-73.8671807548113,-73.8666395622718,-73.8655431746864,-73.8646422160799,-73.8634866193508,-73.8628830195682,-73.8628036192697,-73.8639920973905,-73.863966420578,-73.8639426787595,-73.8633474006849,-73.8636113295238],"lat":[40.5738230570186,40.5735427757593,40.5736900119723,40.572988329032,40.572381674513,40.5704584729966,40.569242922454,40.5691417855225,40.5687875343785,40.5673916164731,40.5677392722517,40.5675977288694,40.5668305715456,40.5665195661027,40.5665130138054,40.5665056560436,40.5665021921775,40.566501997369,40.5665050987465,40.5665718620529,40.5668159825696,40.5668759577309,40.5669722210839,40.5670196300701,40.567031743534,40.5670343117341,40.5670271943907,40.5669790128282,40.5669342852579,40.5668856115059,40.5667240744526,40.5666929977696,40.5666525743526,40.566640845868,40.5666377613749,40.5666314776009,40.5666321847562,40.5666247436854,40.5666081378207,40.5665716104374,40.5665600147002,40.5665339119296,40.566504036502,40.5664705232209,40.5664335153182,40.5661829279414,40.5661406889099,40.5661097939137,40.5660938651888,40.5659572765569,40.5655522142982,40.5655460641249,40.5659535253843,40.5660901116541,40.5660847373441,40.5660834333064,40.566084806289,40.56608647107,40.5660839762761,40.5660687419813,40.5660562292127,40.5660385965158,40.5660213656342,40.5659555954522,40.5659353981054,40.5659168714451,40.5658958461578,40.5658137334928,40.5657961246035,40.565787422579,40.565772837042,40.5657399059368,40.5657287722208,40.5657095761609,40.5656851194403,40.5656337452791,40.565623947214,40.5655937209732,40.5655689662455,40.5655311581122,40.5655189099153,40.5655160154187,40.5655143882133,40.5655149259272,40.5655169203177,40.5655206212171,40.5655276628299,40.5655270103016,40.5655193854632,40.5653418545428,40.5650770407786,40.5650694894597,40.5653353754958,40.5655454634338,40.565544696911,40.5655380087751,40.5655280893125,40.565474132193,40.5654408630604,40.5654196258607,40.5653847604534,40.5652706519785,40.5652411150982,40.5651879275377,40.5651134258735,40.5650602236515,40.5649336571445,40.5648959195044,40.5648554285948,40.5648133094942,40.5646323822351,40.5641831019156,40.5641746535974,40.5646260106916,40.5648099452174,40.5648094097381,40.5648143683689,40.5648152596842,40.5647909418769,40.5647645855108,40.564736415587,40.5646908934176,40.5646762624261,40.5646457788429,40.564626210381,40.5645965928744,40.5645592679901,40.5645028729121,40.5644590126915,40.5643764803295,40.5641895402501,40.5641212848329,40.5640975060073,40.5640841840268,40.5640417955064,40.5639386374732,40.563575116059,40.5635707700138,40.5638614777691,40.5639310333413,40.5640238905079,40.5640319039965,40.5640352490889,40.5640546829544,40.5640838654177,40.5640958147845,40.5641054473323,40.564109744899,40.5641107659134,40.5641094940011,40.5641061971049,40.564100047711,40.5640943477039,40.5640880666671,40.5640804113806,40.5640742081021,40.5640602717444,40.5640375386052,40.5640255869918,40.5639947959158,40.5639849489595,40.5639734549086,40.5639593370657,40.5639448651747,40.5639310894628,40.5639134822478,40.5638920346251,40.5638765149986,40.5638586092443,40.5638312009405,40.5638086443534,40.5637629333158,40.5637588459076,40.5638065911781,40.5638016668983,40.5637891065464,40.5637743084824,40.563767438432,40.5637557319439,40.563732778367,40.5637200237907,40.5637027596691,40.5636876974116,40.5636781138871,40.5636620302465,40.5636502724806,40.5636355369325,40.5636140031942,40.5636035664025,40.5635832946274,40.5635646246282,40.5635183153595,40.5635086463311,40.5635049117782,40.5635372372388,40.5635445076126,40.563536350431,40.5635231091538,40.5635137089719,40.5635098127757,40.5635058905103,40.5635005515542,40.563491953864,40.5634785826181,40.563463713518,40.5634488901336,40.5634416415496,40.5634346380899,40.5634276271539,40.5634213733926,40.5634099144855,40.5634050263395,40.5633960331995,40.5633099305334,40.5633067677848,40.5633914875915,40.5633870919176,40.5633762138602,40.5633705229352,40.5633597599103,40.5633543344399,40.5633443711097,40.5633328064713,40.5633216375256,40.5633132867755,40.5633040478146,40.5632935482945,40.5632832159278,40.5632726643461,40.5632610642573,40.5632496315698,40.5632307295307,40.5632213844373,40.5632042617978,40.5631969868303,40.5631894903823,40.5631766563531,40.5631669057708,40.5630895299828,40.5630859093118,40.5631618672871,40.5631565210674,40.5631503280311,40.5631442750234,40.563139314795,40.563129351459,40.5631212390259,40.5631060706601,40.5631009965479,40.5630836801449,40.5630775587521,40.5630655361574,40.5630605418021,40.5630499906979,40.5630433585557,40.5630326754319,40.5630220178605,40.5630082688434,40.562999735039,40.5629913856214,40.562983167956,40.5629739118191,40.5629665831286,40.5629587183603,40.5629517078573,40.5629355462841,40.5629271173555,40.5629192520833,40.5629104441385,40.5629017768541,40.5628991436746,40.562863868044,40.5628614619799,40.5628942459424,40.5628908195144,40.5628865550353,40.5628794914467,40.5628719255139,40.5628546347772,40.5628451835472,40.5628352215352,40.5628250745003,40.5628200804848,40.5628111922796,40.5628067882804,40.5627935493513,40.5627877534148,40.5627698201514,40.562763645228,40.562757144679,40.5627510493068,40.5627442328571,40.5627371779611,40.5627296022341,40.5627225391926,40.5627152629399,40.5627080497304,40.5627013909394,40.5626955070981,40.5626905395007,40.5626827520165,40.5626760651837,40.5626556361327,40.5626516717732,40.5626719510167,40.5626697312362,40.562663424079,40.5626266130878,40.5625913876695,40.5625611309499,40.5625251219023,40.562487105852,40.5624545947866,40.5624240735615,40.5623991828599,40.5623603924451,40.5623297825616,40.5622934304995,40.5622474150882,40.5621945195311,40.5621544933956,40.5621074834742,40.5620775440721,40.5620340741452,40.5619540706793,40.5618755455576,40.5618359888441,40.5618340940192,40.5618311178097,40.5618274204189,40.5618226652847,40.5618161797276,40.561809180059,40.5618025276547,40.5617974114343,40.5617916764839,40.561784499139,40.5617771641262,40.5617664591254,40.56175494343,40.5617430959764,40.5617307431006,40.5617239210982,40.561716801797,40.5617104190153,40.5617046151377,40.5616980170758,40.5616911424005,40.5616847785824,40.5616792279611,40.5616736246065,40.5616682441504,40.561662757223,40.5616536582925,40.5616494696838,40.5616417843159,40.5616334702079,40.5616249325085,40.5616145223618,40.5616037023369,40.5615943913786,40.5615844371861,40.5615756760092,40.5615681644581,40.5615590907364,40.5615494270791,40.5615418254787,40.5615327413375,40.561523563158,40.5615181975654,40.5615129652167,40.5614992350027,40.5614869495369,40.5614701425301,40.5614527268567,40.5614377309295,40.5614039478899,40.5614026035438,40.5613858745786,40.5613745508969,40.5613674488836,40.5613686186658,40.5613696588683,40.5613797162167,40.5614019121929,40.561425544994,40.5614715703482,40.5614737215632,40.5614740636304,40.5614725817416,40.5614690616267,40.5614671595623,40.5614657787435,40.5614644456892,40.5614629038977,40.561462588115,40.5614621075293,40.5614619457258,40.5614592039392,40.5614568612724,40.5614547344672,40.5614518161931,40.5614490055684,40.5614458373356,40.5614425427702,40.5614397062441,40.5614372477112,40.5614349050363,40.5614320943841,40.5614295364513,40.5614272185746,40.5614234522418,40.561419660752,40.5614175427568,40.5614158322445,40.5614143122862,40.5614123507821,40.5614110555492,40.5614092627449,40.5614044356448,40.5614018248587,40.5613990146712,40.5613974113318,40.5613967423403,40.5613961815006,40.5613938156784,40.5613915042379,40.5613900354399,40.5613881322096,40.5613859542626,40.5613829193295,40.5613792896356,40.5613762867573,40.5613721338797,40.561365482637,40.5613587254288,40.5613515800461,40.5613448288905,40.5613383129441,40.5613323016173,40.5613266946784,40.561321248192,40.5613132282012,40.5613027161878,40.561291240011,40.5612847700345,40.5612730505979,40.5612615987512,40.5612497607023,40.5612380330436,40.5612277615764,40.5612170599536,40.5612057759826,40.5611996119325,40.5611929545025,40.561186161438,40.5611798370028,40.561174715435,40.5611640418011,40.5611527551627,40.561140731376,40.5611342958767,40.5611268998242,40.5611197190005,40.5611134455627,40.5611071177751,40.5611008186664,40.5610947094649,40.5610881673965,40.5610817512063,40.561075515665,40.5610689105571,40.5610626914318,40.561056446683,40.5610410573782,40.5610322737022,40.5610233192548,40.5610129970083,40.5610069432397,40.5610006725779,40.5609952555405,40.5609906563492,40.5609816738505,40.5609725304621,40.5609638011239,40.5609535886728,40.5609448274804,40.5609365435464,40.5609303376338,40.5609263487372,40.5609232057894,40.560920564719,40.5609108970016,40.5609100958915,40.5609095198985,40.5607880992609,40.5607768734654,40.5607679618077,40.5607604308098,40.5607610273319,40.5607617160473,40.5607684018973,40.5607703444434,40.5607909509685,40.5607938162042,40.5608257546558,40.5608729621658,40.5608752903004,40.5608795177741,40.5608813954135,40.5608814942231,40.5608812147552,40.5608807654644,40.5608805895717,40.5608803685725,40.5608797868482,40.5608782103952,40.5608765231171,40.560875226509,40.5608748312626,40.5608743798133,40.5608741287902,40.5608751926024,40.5608755612981,40.560875395138,40.5608744039844,40.5608736078773,40.5608747066749,40.5608763120917,40.5608790257018,40.5608822365773,40.560883102213,40.5608841144075,40.5608869454933,40.5608881985772,40.5608894276491,40.5608869309125,40.5608832996233,40.5608803486268,40.5608776567566,40.5608770603313,40.5608745044888,40.5608710404139,40.560866142933,40.5608628620726,40.5608597256419,40.5608559219878,40.5608500961167,40.5608415540338,40.5608323554265,40.5608241901087,40.5608155134168,40.5608075481108,40.5608006499951,40.5607938322629,40.5607856192714,40.5607810039124,40.5607772343208,40.560769181863,40.5607604190673,40.5607511256445,40.5607420941046,40.5607328841181,40.5607223166484,40.5607120728187,40.5607009198852,40.5606895867449,40.5606790336799,40.5606676886038,40.5606562363755,40.5606456688894,40.5606345460598,40.5606289041981,40.5606240086918,40.560614089938,40.5606024792582,40.5605907780515,40.5605785093924,40.5605720226259,40.560565751755,40.5605595620382,40.5605527444842,40.5605446333873,40.5605367845262,40.5605289783993,40.5605216437975,40.5605132748673,40.5605067043503,40.560500133876,40.5604844868743,40.5604762283104,40.5604673578864,40.5604581893805,40.5604511235318,40.5604449177389,40.5604389438612,40.5604331414383,40.5604269253696,40.5604211229423,40.5604149874965,40.5604085565907,40.5604018471128,40.5603951113296,40.5603892286151,40.560383615125,40.5603785503331,40.5603734580996,40.5603652523359,40.5603579167352,40.560350582291,40.5603435257451,40.5603379963853,40.5603316753886,40.5603234654088,40.560315002281,40.5603051382203,40.560299937246,40.5602946565406,40.5602895094182,40.5602836799605,40.5602766365384,40.5602695206509,40.5602617104613,40.5602544314543,40.5602473320658,40.5602412841224,40.5602366759645,40.5602296985637,40.5602236267891,40.5602128785874,40.5602032828015,40.5601950357602,40.5601924014529,40.5601823680412,40.5601356660237,40.5600894605185,40.560084341624,40.5600730417182,40.5600547171425,40.560042807458,40.5600411643726,40.5600475990565,40.560066385975,40.560089425297,40.5601446788174,40.5601601745554,40.5601605693906,40.560160397446,40.5601576968166,40.560155516371,40.560153810187,40.5601534252933,40.5601509617373,40.560148367888,40.5601453077942,40.5601424900195,40.5601398072511,40.5601368812045,40.5601333244636,40.5601300644854,40.5601281832679,40.5601247693036,40.5601222008793,40.5601210354055,40.5601187677968,40.5601156250163,40.5601124454126,40.560108919099,40.5601042938881,40.5600992809394,40.5600953657564,40.5600911537648,40.5600854579046,40.560082303509,40.5600764180576,40.5600729115405,40.5600674833295,40.5600647822318,40.5600625650741,40.5600580463897,40.5600536588797,40.5600493086652,40.5600450330411,40.5600420257486,40.5600386842592,40.5600338295042,40.5600315343257,40.5600285529895,40.560023479115,40.5600189543943,40.5600134208452,40.5600084037462,40.5600034408133,40.559996235459,40.5599923394672,40.5599844952268,40.5599807976714,40.5599719357883,40.5599669408802,40.559960496177,40.5599527270418,40.5599443598276,40.5599361782151,40.5599313528206,40.5599219190292,40.5599067104195,40.5598985347879,40.5598917821356,40.5598855247757,40.5598788544368,40.5598714430609,40.5598628792035,40.5598540450282,40.5598424042469,40.559834698252,40.5598280811421,40.5598208685389,40.559812628168,40.5598045867314,40.559797560133,40.5597897055659,40.5597855900344,40.5597757924998,40.5597693731719,40.5597610799963,40.5597528774854,40.5597469448766,40.5597378662483,40.5597287514073,40.5597210868645,40.5597168890761,40.5597060993961,40.5597000571394,40.5596938603592,40.5596873757649,40.559681170258,40.5596732730054,40.5596669327171,40.5596599817241,40.5596534270757,40.5596470362077,40.5596361144824,40.5596286232562,40.5596203305201,40.5596115216826,40.5596036677314,40.5595968294273,40.5595901533741,40.5595818084159,40.5595737613092,40.5595702749241,40.5595581541445,40.5595493104414,40.5595408989114,40.5595327453632,40.5595248145605,40.559517731966,40.5595147178859,40.5594321616924,40.5594284524141,40.5594250188801,40.5594004829985,40.5594059074156,40.5594166281891,40.5594311072557,40.559458242067,40.5595396037716,40.559540145127,40.5595421048858,40.559541870043,40.5595418062022,40.5595412716287,40.5595404703644,40.5595397668364,40.5595393845542,40.5595395882869,40.55954039645,40.5595407734966,40.5595412866628,40.5595413844752,40.5595419872772,40.559542392623,40.5595421342656,40.5595418605015,40.5595416279397,40.5595412971389,40.5595407660578,40.5595403955441,40.5595400782968,40.5595396661899,40.5595395055124,40.5595400241751,40.5595404595107,40.5595413887891,40.5595423905933,40.5595431840322,40.5595434700617,40.5595440644646,40.5595442399894,40.5595440314124,40.5595428502152,40.559541384845,40.5595402491513,40.5595389485507,40.5595372926455,40.5595350306481,40.5595317793672,40.5595286178668,40.5595262982908,40.5595218427013,40.5595155789522,40.5595106513796,40.5595047442717,40.5595002820687,40.5594928602679,40.5594855714216,40.5594806460189,40.5594742844312,40.5594660687088,40.5594607305711,40.5594541001192,40.5594438308641,40.5594365155539,40.5594291722274,40.5594212273681,40.5594136445828,40.5594074546187,40.5594020144913,40.5593976651579,40.5593935346238,40.559388333566,40.5593797385714,40.559372213183,40.559364847036,40.5593586596871,40.5593528320811,40.559345104304,40.5593383364816,40.5593302024847,40.5593236767741,40.5593214658548,40.5593105830713,40.559301821681,40.5592935541111,40.5592854718545,40.5592789919054,40.5592739300887,40.5592700146893,40.5592648411555,40.5592591458419,40.5592463343287,40.5592396760718,40.5592337648576,40.5592284465084,40.5592229754467,40.5592179360144,40.5592075069666,40.5591981893755,40.5591897883182,40.5591778153923,40.5591684112005,40.5591609309529,40.559153866406,40.5591473443818,40.5591425044434,40.5591372244988,40.5591319103653,40.5591267127081,40.5591226653968,40.5591151435484,40.5591096122888,40.5591047985533,40.5590998150512,40.5590944183573,40.5590888176401,40.5590829262374,40.5590775116831,40.5590716207779,40.559065988317,40.5590586500449,40.5590525689682,40.5590445701402,40.5590367032272,40.5590312035832,40.5590235002998,40.5590136407496,40.5590044365603,40.5589970948027,40.5589903300828,40.5589799533194,40.5589733769653,40.558966612761,40.5589608379671,40.558955367924,40.5589516735049,40.558948286214,40.5589455552185,40.558940612844,40.5589404327589,40.5589363388729,40.5589281285895,40.558920400148,40.558913721945,40.5589047873617,40.5588974677203,40.5588895456898,40.5588822361669,40.5588746665913,40.5588659542856,40.5588558910298,40.5588518121298,40.5588447000942,40.5588410031844,40.5588354455688,40.5588275098402,40.5588196136202,40.5588110605121,40.558802398618,40.5587923894766,40.5586981409389,40.5586643517941,40.5586941922693,40.5587723978265,40.5587735329579,40.5587743387726,40.5587765556395,40.5587795391255,40.5587828296576,40.5587849339808,40.5587861557006,40.5587863938016,40.5587878159403,40.5587896205558,40.5587931518163,40.5587963484525,40.5587975802615,40.5587972094181,40.5587971441592,40.558797460322,40.5587973405221,40.5587976363805,40.5587981392046,40.5587990914365,40.5587986411678,40.5587978664408,40.5587967571786,40.5587968798104,40.5587989870181,40.5588001382023,40.5588011882482,40.5588035367831,40.5588062553238,40.558809283903,40.5588115491217,40.5588046412495,40.5587971382582,40.558791550654,40.5587861629154,40.5587815381678,40.5587765013966,40.558771795867,40.5587662665966,40.5587569119085,40.5587518481075,40.5587475775082,40.5587435039702,40.5587387227058,40.55873497167,40.5587309788604,40.5587252315235,40.5587206612493,40.5587152464541,40.5587048930509,40.5586963877937,40.5586892664408,40.5586836538837,40.5586791904644,40.5586739365362,40.5586679167243,40.5586606825874,40.558653755562,40.5586463338024,40.5586419528929,40.5586365151792,40.5586301869516,40.5586248569128,40.5586193789072,40.5586132249343,40.5586075808811,40.5585996368277,40.5585922126196,40.5585822375168,40.5585745462512,40.558567152189,40.5585605493288,40.5585546115679,40.5585496012204,40.5585421540786,40.5585361605159,40.5585275596591,40.5585199390171,40.5585142416726,40.5585083839011,40.5585028491135,40.558497178568,40.5584913207934,40.5584840347333,40.5584778701988,40.5584716631214,40.5584650592207,40.5584577729959,40.5584550860649,40.558444852741,40.5584366553917,40.5584287375557,40.558421890266,40.5584163648688,40.5584108310519,40.5584037073433,40.5583981822339,40.5583919396591,40.5583862985247,40.558379403061,40.5583737650587,40.5583694935505,40.5583656975347,40.5583611283439,40.5583562547935,40.5583528367403,40.5583477730515,40.558342248099,40.5583356685671,40.5583254669581,40.5583183433835,40.5583117426395,40.5583071773454,40.5583035185355,40.5582981467894,40.5582918467979,40.5582823696442,40.5582750262835,40.5582678704657,40.5582605893899,40.5582517637439,40.5582439523024,40.5582389213181,40.5582333869441,40.5582259365141,40.558217708164,40.5582102801702,40.5582011537498,40.5581946894019,40.5581883322359,40.5581819253553,40.5581795724489,40.5581786074333,40.5581779651655,40.5581764387077,40.5581719249663,40.5581667229969,40.5581604215251,40.5581515092403,40.5581425511036,40.5581347610367,40.5581235187278,40.5581132107484,40.5581046311404,40.5580972031126,40.5580905783385,40.5580852282493,40.5580782184787,40.5580682113055,40.558061009787,40.5580482251374,40.5579165461191,40.5578715414941,40.5578682529024,40.5579113575691,40.5579511212929,40.5580254211651,40.5580308722269,40.5580370936677,40.5580419394208,40.5580436352296,40.5580465077844,40.5580496188979,40.5580537037986,40.5580597794621,40.5580618995016,40.5580776932253,40.5580889070958,40.5580985798507,40.5581078952692,40.5581142482704,40.5581162185711,40.5581177905477,40.5581192940452,40.5581202471401,40.5581206921558,40.5581212761729,40.558121475124,40.5581195650512,40.5581180780968,40.5581159806022,40.5581143735467,40.5581138416035,40.5581126558983,40.5581108601952,40.5581087045371,40.5581064965443,40.5581024863158,40.5580986560934,40.5580946364852,40.5580910043142,40.5580874823105,40.5580848058856,40.5580823537144,40.5580801189236,40.5580779107152,40.5580755140199,40.5580717956501,40.5580680004237,40.558063837013,40.5580602868064,40.5580576383052,40.5580550783206,40.5580520792742,40.558049454627,40.5580463084829,40.5580429828465,40.5580387960369,40.5580329215325,40.5580289561196,40.5580234249851,40.5580161939258,40.5580115323891,40.5580110099808,40.5580085263878,40.558003631621,40.5579971084843,40.5579916306087,40.5579858027126,40.5579814846075,40.5579775737556,40.5579738512392,40.5579691749762,40.5579648484781,40.5579610005449,40.5579565401208,40.5579532275248,40.5579494007811,40.5579455786387,40.55793790224,40.5579268838674,40.5579147937309,40.557906435098,40.5579006301099,40.5578967623814,40.5578923182923,40.5578893781876,40.5578851154706,40.5578766786206,40.5578679962386,40.5578627945507,40.5578575067013,40.5578512635858,40.5578421368908,40.5578329274587,40.5578249775093,40.5578173888515,40.5578092261163,40.5578016309355,40.5577955545638,40.557790930595,40.5577876779226,40.5577865626165,40.5577845184566,40.5577792931013,40.557772148456,40.5577621701921,40.5577562563577,40.5577544223068,40.5577471069372,40.5577403960497,40.5577358782076,40.5577304909044,40.5577250650456,40.5577172264822,40.557709585472,40.5577038605176,40.5576958610086,40.5576891720871,40.5576807026985,40.5576744019659,40.5576670961497,40.5576616148714,40.5576545245395,40.5576479738277,40.5576415907992,40.5576336453224,40.5576278386013,40.5576206277001,40.5576107924064,40.557604185022,40.5575969045887,40.5575909800317,40.5575829241047,40.5575743747592,40.5575675538981,40.5575647063166,40.5575557901605,40.5575492709245,40.5575434167964,40.5575374174589,40.5575315339614,40.5575249304547,40.5575172918535,40.5575090228143,40.5575035139652,40.5574960089101,40.5574885581367,40.5574824798524,40.5574770004003,40.5574721324197,40.5574676958024,40.5574624150624,40.5574572969266,40.5574523643568,40.5574460659039,40.5574397122225,40.5574281801907,40.5574214945763,40.5574131712258,40.5574054683449,40.5573981246618,40.5573916915664,40.5573854758099,40.5573782975237,40.5573706603998,40.5573674000416,40.5573559243634,40.5573471851854,40.5573400547704,40.5573324397177,40.557323340362,40.5573134255608,40.5573060839584,40.5573006309767,40.5572967833258,40.5572965183218,40.5572950393059,40.5572939254094,40.5572930169433,40.5572918929537,40.5572898220097,40.5572864647909,40.5572830243518,40.5572814754922,40.5571497285371,40.5571053905375,40.5570883335559,40.557088252337,40.5570787957957,40.5570900017224,40.5571052059815,40.5571334648068,40.5572601081249,40.5572608464651,40.5572612173264,40.5572615779451,40.5572655462692,40.5572717943121,40.5572779480157,40.5572867766175,40.5572941772177,40.5573021507395,40.5573099510007,40.5573174790163,40.5573270642817,40.5573405191809,40.5573514140345,40.5573592343997,40.5573688520892,40.557378147999,40.5573850371509,40.5573933184925,40.5574023400864,40.557408196627,40.557413179322,40.557419621609,40.5574220254089,40.5574229757104,40.5574235409536,40.5574236943499,40.5574223692654,40.5574217166008,40.5574214600696,40.5574205675068,40.557419535909,40.5574184338047,40.55741805293,40.5574164840456,40.5574154603395,40.5574142701497,40.5574123666671,40.5574091673294,40.5574045755182,40.5574010523805,40.5573978539275,40.5573952113653,40.5573929470572,40.5573892028516,40.5573859512955,40.5573820132852,40.5573776153038,40.5573740533993,40.5573699269613,40.5573662934238,40.557363171351,40.5573583908327,40.5573543442661,40.5573506539547,40.5573410339929,40.557335302807,40.5573261383929,40.5573178402473,40.557310412778,40.5573010977525,40.5572927869083,40.557282559497,40.5572717315906,40.5572672115486,40.5572628038816,40.5572563540416,40.5572522794899,40.5572478466895,40.5572420744171,40.5572356477826,40.5572294098707,40.5572236652466,40.5572178941628,40.5572052202146,40.5571996711429,40.5571931242244,40.5571853262199,40.5571782850027,40.5571694447301,40.5571549146096,40.5571401726708,40.557129961902,40.557121736263,40.5571141184845,40.5571094640211,40.5571054725393,40.5571003555046,40.5570943839709,40.557086419482,40.5570783995172,40.5570695878254,40.5570648730413,40.5570596449333,40.5570508593016,40.5570408057662,40.5570319397543,40.5570257594998,40.5570214131521,40.5570173133161,40.5570125271065,40.5570073525324,40.5570022841416,40.5569954880218,40.5569859216255,40.5569765541004,40.5569705495604,40.5569644403526,40.5569570169727,40.5569499818909,40.5569482657212,40.5569416785902,40.5569316064098,40.5569263770875,40.5569214999286,40.5569118902372,40.5569066885658,40.5569015421471,40.5568917916388,40.5568825820784,40.5568703177273,40.5568662679506,40.5568571231954,40.5568423977432,40.556832332104,40.556821718119,40.556811137985,40.5567959649997,40.5567807914835,40.5567673872557,40.5567549845755,40.5567443566317,40.5567297185223,40.5567182802,40.5567023752864,40.5566949624135,40.5566636244744,40.5566574335873,40.5566563137261,40.5566588634112,40.5566638591668,40.5566722097887,40.5566749035877,40.5566878650137,40.556699655608,40.5567145794438,40.5567273971977,40.5567412599601,40.556754169374,40.5567683113525,40.5567823904048,40.5567945332424,40.5568072431738,40.5568181427539,40.5568286808756,40.5568396964568,40.5568497452102,40.5568503496205,40.5568575253994,40.556866288292,40.5568792357189,40.5568916487213,40.5569076671992,40.5569197188485,40.5569235761454,40.5569365736901,40.5569487130965,40.5569579166446,40.5569681378751,40.5569808842206,40.5569900889473,40.5569984230418,40.5570083514052,40.5570123176974,40.5570162832996,40.5570204647744,40.5570286757714,40.5570356966593,40.5570396635724,40.5570431899937,40.5570477105959,40.5570509694021,40.5570556248225,40.5570592637187,40.5570617472141,40.5570646467539,40.5570668894256,40.5570695442225,40.5570718095114,40.5570741560992,40.5570766119083,40.5570782741551,40.5570798001648,40.5570810498156,40.5570824320164,40.5570846538069,40.5570877163024,40.5570906350555,40.5571011433731,40.5571032133668,40.5571041403296,40.5571039085401,40.5571031888458,40.5571021371803,40.5571000216097,40.5570985507593,40.5570978528142,40.5570970947243,40.5570946161558,40.557090603925,40.5570865888306,40.5570845697533,40.5570845915091,40.5570842829565,40.5570819115561,40.5570777026912,40.5570743378257,40.557071169879,40.5570652042454,40.5570586425781,40.5570518272813,40.5570508757809,40.5570456391008,40.5570370431695,40.5570293186862,40.5570218457428,40.5570140136117,40.5570069807409,40.5570014240191,40.5569976584633,40.5569974433521,40.5569957594363,40.5569949524713,40.5569907218343,40.5569836314754,40.5569792763433,40.5569743811026,40.5569689017504,40.5569632365702,40.5569566982391,40.5569532102065,40.5569491444804,40.5569416364073,40.5569325537037,40.5569245606555,40.5569169974868,40.5569089486791,40.5569006300341,40.5568930931658,40.5568871838011,40.5568803933412,40.5568731089323,40.556866814436,40.5568600239647,40.5568528031104,40.5568450251278,40.556838514999,40.5568327139287,40.556826686588,40.5568215155721,40.5568166138448,40.5568121762199,40.5568088445498,40.5568003537942,40.5567935585497,40.5567287439562,40.5566634863985,40.5566582819911,40.5566534969472,40.5566492763885,40.5566457483165,40.5566430197314,40.5566411733859,40.5566402652763,40.5566403229438,40.5566413446397,40.5566432993775,40.5566461278739,40.5566497443458,40.5566540391122,40.5566820053585,40.5567120999711,40.5567211302737,40.5567232377786,40.5567183995643,40.5567066682518,40.5566881714323,40.5566631102793,40.5566317573605,40.5566019184018,40.5565716564721,40.5565413814629,40.5565374099018,40.5565338217619,40.5565307135982,40.5565281690498,40.5565262565893,40.55652502768,40.5565245153913,40.5565247335085,40.5565256761623,40.5565273179864,40.5565296147999,40.5565325047969,40.556535910209,40.5565622946514,40.5565906702832,40.5566204298975,40.5566259262105,40.5566249888222,40.556617625272,40.5566038947833,40.5565839077875,40.5565578250359,40.5565258563063,40.5565066686925,40.5564875080459,40.5564687742091,40.5564596040706,40.5564509006003,40.5564429114557,40.5564358639685,40.5564299586748,40.5564253636101,40.5564222095269,40.556424630667,40.5564280381224,40.5564323487096,40.5564374571974,40.5564432388764,40.5564495526027,40.5564562442444,40.5564631504433,40.5565104417452,40.5565583443637,40.5566066439916,40.5566335685432,40.5566503744751,40.5566835591392,40.5567122176037,40.5567392922283,40.5567597437462,40.5567734896414,40.5567846701758,40.5567894922434,40.5567879488392,40.5567858184697,40.5567750657928,40.5567574487717,40.5567329950943,40.5567017431937,40.5566637421873,40.5566190517996,40.5565677422687,40.5564714868533,40.5563695110123,40.5562618546622,40.5561485599427,40.5560296712004,40.5559052349715,40.5558112018276,40.5557106253669,40.555603572217,40.5554901132957,40.5553703237638,40.5552442829754,40.5551120744254,40.5549737856941,40.5548295083884,40.5561133452459,40.5569972416294,40.5604436355842,40.5607179770173,40.5607619785479,40.5607571956874,40.5607544805896,40.5608085329923,40.5608120732341,40.5609590664902,40.5611036463112,40.5612456215229,40.5613848048471,40.5623964513697,40.5634150375821,40.5638275358726,40.5639266427129,40.5640245197434,40.5641210305939,40.5644010327537,40.5645112691349,40.5649234019891,40.5649430003466,40.5649560004712,40.5649560009045,40.5649420003672,40.564917358181,40.5648720009159,40.5648239997863,40.5647937111051,40.5647888042025,40.5647802095385,40.5647446036866,40.5644858357853,40.5644534094092,40.5644209689521,40.5643271554776,40.5642848369282,40.5642577017826,40.5642405109511,40.5642127549601,40.5641228318125,40.5640460955145,40.5639971241531,40.563977896403,40.5639612747779,40.5639473047675,40.5639312915376,40.5639390484314,40.563962725977,40.5639933245409,40.5640265641324,40.5640853374123,40.5641647373781,40.5641615301018,40.5641583234818,40.5641542748851,40.5641484398698,40.5641409691578,40.5641320557223,40.564121929803,40.5641108529584,40.5640991113099,40.564087008151,40.5640748561133,40.5640629690906,40.5640516541311,40.5640051239821,40.5639543306988,40.5638998984878,40.5638424962737,40.5637828294782,40.5637216313506,40.5636596539568,40.5635976589372,40.5635427877151,40.5634907978962,40.563442441628,40.5633984184896,40.56335936537,40.5633258472557,40.5632983490564,40.563277268591,40.5632629108315,40.5632554834928,40.5632550940262,40.5631795237119,40.5631082079468,40.5630414636694,40.5629795875017,40.5629228544298,40.5628715165826,40.5628258021114,40.5627859141762,40.5627520300427,40.5627243002952,40.562702848167,40.562687768993,40.5626885820937,40.5626957989851,40.56270940822,40.5627293882117,40.5627557072686,40.5627883236438,40.5628271856019,40.5628722315009,40.5629233898894,40.5629805796208,40.5630437099809,40.5631126808328,40.5631873827747,40.5632676973138,40.5633534970544,40.5634446458993,40.5634583430064,40.5634844044909,40.5635148642061,40.5631209026751,40.5630587680735,40.5630008257683,40.5629475838098,40.5628995090334,40.5628570229666,40.5628204981339,40.5627902547897,40.5627665581115,40.5627496158742,40.5627395766291,40.5627365284015,40.5627404979182,40.5627514503744,40.5627692897377,40.5627938595909,40.5628242232173,40.5628611701132,40.5629046209524,40.5629544824446,40.5630106475348,40.5630729956344,40.5631413928788,40.563215692415,40.5632957347173,40.5633813479292,40.5653584275669,40.565624318586,40.5658306373084,40.5661504359843,40.5663321003709,40.5666401669763,40.5669920511987,40.5669988203443,40.5670057912384,40.5670127595963,40.5670195212076,40.5670258779206,40.5670316434494,40.5670366488327,40.5670407473858,40.5670438189988,40.5670457736568,40.5670465540776,40.5670461373908,40.5670445358076,40.5670417962629,40.5670379990404,40.5670332554191,40.5670277044131,40.5668717888066,40.566858506537,40.5663164316821,40.5643299855739,40.5642906252657,40.5643488998972,40.565153036464,40.5652166696303,40.5652776506503,40.5653133321118,40.5654095554544,40.5656904269484,40.5658130120109,40.5658404168571,40.5660903826885,40.5661741689034,40.5664265363888,40.5665087635953,40.566722113205,40.5668570118532,40.5669072318636,40.5670251824339,40.5675683645136,40.5684709781101,40.5684459932407,40.568465965911,40.5684802291445,40.5684844512137,40.5685244615918,40.5685797926874,40.5685909094802,40.5685993486547,40.568569111027,40.5685490313856,40.5685270635517,40.5685311271886,40.568521733527,40.5684995848769,40.5686961195387,40.5686635719477,40.5684702056688,40.5682891391875,40.5683371852272,40.5684296740966,40.5684413423982,40.5683729686108,40.568487934478,40.5684368020531,40.5683194570265,40.5683260025263,40.5682685132407,40.5682451548869,40.5678928367589,40.568001951564,40.5680277256674,40.5680263926377,40.5681451025008,40.5681571334024,40.5681664603957,40.5680276867777,40.5680224256663,40.5680089773012,40.5680601606942,40.5680729459565,40.5680729574952,40.5681950141335,40.5682052770241,40.5680895549024,40.5680840245328,40.5680649731336,40.5681239118272,40.5681535541788,40.5681519824607,40.5685031156109,40.5685117989024,40.5681598730711,40.568155920076,40.5681271859599,40.5681338512879,40.5681475254579,40.5682097697543,40.5683953597227,40.568473114105,40.5688362854632,40.5688959110918,40.5689062042593,40.5688434048324,40.5684780199385,40.568331859751,40.5683806260142,40.5683831750127,40.5683838654255,40.5683852140129,40.5683847817658,40.5683840217636,40.5683828184911,40.5683802661684,40.5683773420903,40.5683766816605,40.5683750146413,40.5683742470125,40.5683737639163,40.5683723785402,40.5683700578444,40.568366002896,40.5683631336865,40.5683605063943,40.5683582647187,40.568356247248,40.568355843509,40.568358018564,40.5683591835462,40.5683596299307,40.5683578286175,40.5683559759409,40.5683555722372,40.5683570295446,40.56835946151,40.5683619666536,40.5683645627663,40.5683689298251,40.568374846781,40.5683808619146,40.5683863666718,40.5683947780791,40.5684041169736,40.5684125031124,40.5684186674124,40.5684258403923,40.5684335423016,40.5684379913429,40.5684421160171,40.5684518383624,40.5684610399817,40.5684699334378,40.5684785939923,40.5684860960668,40.5684926093297,40.5684986100677,40.568504133987,40.5685113924417,40.5685179971907,40.5685239374126,40.5685323754529,40.5685397180264,40.5685459099225,40.5685554350178,40.5685610776253,40.5685664137898,40.5685731511192,40.5685772588664,40.5685807279576,40.5685843031458,40.5685890528036,40.5685939033943,40.5685980904468,40.5686802980709,40.5686987784568,40.5687151094141,40.5687314415257,40.5687312971263,40.5687076963665,40.5686850964353,40.5686887162598,40.5686948432295,40.5686992648595,40.5687028487655,40.5687074940216,40.5687120045069,40.5687159959636,40.568719024567,40.5687203507691,40.5687219992004,40.5687269508766,40.5687313007243,40.5687353425472,40.5687385676729,40.5687431035599,40.5687470621304,40.5687496990614,40.5687520905806,40.5687542645662,40.5687555931977,40.5687565269165,40.56875826193,40.5687596993502,40.5687615155758,40.5687639323351,40.5687664941484,40.5687683374197,40.5687708975059,40.5687729533875,40.5687740550637,40.5687747799895,40.5687752154914,40.5687756984129,40.5687757415872,40.5687755815162,40.5687704815694,40.5687688191325,40.5687671017092,40.5687654035108,40.5687640461861,40.5687622739516,40.5687600606022,40.568757412285,40.568752992607,40.5687506745848,40.5687476688432,40.5687449872641,40.5687424236942,40.5687376673452,40.5687342940249,40.5687323839827,40.5687306907947,40.5687287791058,40.5687265597264,40.5687236796472,40.5687212719086,40.5687191327765,40.5687189422923,40.5687167519446,40.5687137093024,40.5687095064521,40.5687055327295,40.5687033544717,40.5687017156838,40.5687005459479,40.5686995387692,40.56869867385,40.5686954911279,40.5686920637679,40.5686890831542,40.5686852965685,40.5686839981472,40.5686826460573,40.568680428062,40.5686776329427,40.5686758812426,40.5686743799433,40.568673924313,40.5686746995943,40.5686756741239,40.5686770761908,40.5686778628821,40.5686783931685,40.5686786959674,40.5686786342053,40.5686785401946,40.5686785733477,40.5686789141248,40.568678752752,40.5686782459746,40.5686771012359,40.5686754073875,40.5686736580969,40.568673013586,40.5686725803785,40.5686731530312,40.5686732139474,40.5686726923172,40.568671621966,40.5686701199338,40.5686678971917,40.568665486463,40.5686634016411,40.5686619549439,40.5686608088038,40.5686603559219,40.5686594655478,40.5686590113858,40.5686582161333,40.5686577963222,40.5686569779698,40.5686567957345,40.5686569130914,40.568657058194,40.5686568750141,40.5686567971085,40.5686566692434,40.5686568390199,40.5686573692035,40.5686582624222,40.5686592265235,40.5686603591895,40.5686607536736,40.5686607867255,40.5686612092485,40.5686622875474,40.5686623975155,40.5686627282273,40.5686633325176,40.5686635226857,40.5686628378086,40.5686624846519,40.5686616031252,40.5686627286327,40.5686645363521,40.5686658388075,40.5686655191825,40.5686650290109,40.568663744857,40.5686623270725,40.5686622158911,40.5686622585732,40.5686626649403,40.5686635276473,40.5686638931022,40.5686641712446,40.5686642863768,40.5686642171869,40.5686640664313,40.5686636893301,40.5686636987246,40.5686636867685,40.5686636274004,40.5686637550941,40.5686636746441,40.5686635442316,40.5686633888701,40.5686642248301,40.5686655458775,40.5686660460004,40.5686658573332,40.5686650986443,40.5686643425215,40.5686640477726,40.5686648324739,40.5686659658065,40.5686667685204,40.5686672479877,40.5686677733886,40.5686678357855,40.5686663128716,40.5686634481851,40.568658164747,40.5686465289411,40.568639939838,40.5686597834547,40.5686938672682,40.568714919825,40.5687616315576,40.5687822173686,40.5688006300631,40.5688518421286,40.5688608944349,40.5689102509828,40.5689261788313,40.5689583608613,40.5690484404373,40.569134625281,40.5692318389113,40.5692571591455,40.5693143685505,40.569353135603,40.5694594414489,40.5694728894103,40.5695197901716,40.5695804484277,40.5697899600541,40.5699103490379,40.5699506854438,40.5700754511973,40.5702818287635,40.5705294840445,40.5709018998861,40.5711764307631,40.5738357944239,40.5740992189345,40.5746421286126,40.5751192138439,40.5757403158872,40.5760597612556,40.5759330347646,40.5750607221259,40.5750267867217,40.5749881084912,40.574021231946,40.5738230570186]}],[{"lng":[-73.8264466151699,-73.8264240388846,-73.826409148944,-73.8264023882524,-73.8264039579007,-73.8264138111846,-73.8264316549954,-73.8264569585418,-73.8264889691382,-73.8267745715186,-73.8268109736292,-73.8268542600488,-73.826903554368,-73.8269578585428,-73.8270160730999,-73.827138818998,-73.8272582568873,-73.8273738576671,-73.8273754342406,-73.8273726567287,-73.8273655957191,-73.8273544306685,-73.8273394453404,-73.8273210205944,-73.8273183991794,-73.8273183780765,-73.82732095789,-73.8273260648978,-73.8273335531577,-73.8273432086781,-73.8273547555332,-73.8273678637479,-73.8273821587272,-73.8273972319621,-73.827412652703,-73.8274279802693,-73.8274427766428,-73.8274566189861,-73.8274721768597,-73.8274889988386,-73.8275066175252,-73.8275245433863,-73.8275422783537,-73.8275593296631,-73.8275752235457,-73.8275895183906,-73.8276018170165,-73.8276117777059,-73.8276191237002,-73.8276324661377,-73.8276384901483,-73.8276371662341,-73.8276285008458,-73.8276125363513,-73.8275893508288,-73.8275650983102,-73.8275837736592,-73.8276590590332,-73.8276856320368,-73.8276910846794,-73.8276890592571,-73.8276595866904,-73.8276057568093,-73.8275645924924,-73.8275385388044,-73.8275063197856,-73.827487546321,-73.8274044686059,-73.8273167163783,-73.8272245326945,-73.827128172889,-73.8270954250752,-73.8270705876396,-73.8270542620837,-73.8270468437804,-73.8270485123964,-73.827059227541,-73.8270787297415,-73.8271065467253,-73.827142004856,-73.8271842454459,-73.8272132846494,-73.8272398299138,-73.8272631859841,-73.8272827411338,-73.8272979831854,-73.8273085129256,-73.8273140545621,-73.8273144629463,-73.8273097273768,-73.8272999718794,-73.827285451959,-73.8271634843302,-73.8270377253784,-73.8269085061516,-73.8267761668089,-73.8266410557258,-73.8265805854527,-73.8265235546353,-73.8264710021977,-73.8264238854856,-73.8262794035911,-73.8261325699972,-73.8259835640645,-73.825832567809,-73.8257733905231,-73.8257127961049,-73.8256521472104,-73.8255928077208,-73.8255361120694,-73.825483335233,-73.8254778068992,-73.8254810161954,-73.8254928832813,-73.8255131129744,-73.8255412020934,-73.8255764519756,-73.8256179858545,-73.8257717806162,-73.825923765129,-73.8260737939732,-73.8261539972392,-73.8262388708766,-73.8263277408655,-73.8263721615108,-73.8264100891568,-73.8264413295603,-73.8264657227315,-73.8264831437534,-73.82649350342,-73.8264967486946,-73.826481081676,-73.8264690122262,-73.8264608629555,-73.8264568516882,-73.8264570856405,-73.8264615585555,-73.8264734770454,-73.8264779479213,-73.8264749345779,-73.8264644617222,-73.8264466151699],"lat":[40.5905274419383,40.5904948305249,40.5904597468813,40.5904232346086,40.5903863798021,40.5903502787441,40.5903160052946,40.5902845789477,40.590256934507,40.5900320080855,40.5899930515317,40.5899584279949,40.5899288384811,40.5899048820744,40.5898870438075,40.5898522499394,40.5898113085554,40.5897644010249,40.5897851920489,40.5898059098625,40.5898260279097,40.5898450348777,40.5898624476918,40.5898778237937,40.5898894227734,40.5899011926368,40.589912797036,40.5899239043515,40.5899341971687,40.5899433813487,40.5899511944346,40.5899574131507,40.5899618597842,40.589964407263,40.5899649827875,40.5899635699108,40.5899602090091,40.5899549961269,40.589948202698,40.5899434737459,40.5899409406642,40.5899406738343,40.5899426806702,40.589946905412,40.5899532306756,40.5899614807143,40.5899714263014,40.5899827910996,40.5899952593385,40.5900747164178,40.5901546901369,40.5902347892405,40.590314621858,40.5903937974217,40.5904719285769,40.5905029272137,40.5905154633333,40.5905340998551,40.5905499134577,40.5905599797773,40.5905685405189,40.5905682405013,40.5905457181564,40.590539580594,40.5905412997168,40.5905780559365,40.5906020520022,40.590671450305,40.5907374204632,40.590799779742,40.5908583554083,40.5908952755087,40.5909356217134,40.5909784169605,40.5910226248772,40.5910671748786,40.5911109880931,40.5911530034899,40.5911922035743,40.5912276390289,40.5912584517036,40.5912684406835,40.5912818697264,40.5912983871094,40.5913175602218,40.5913388868954,40.5913618085577,40.5913857248602,40.5914100094031,40.5914340261412,40.5914571460426,40.5914787635646,40.5915374981126,40.5915913865029,40.5916402868759,40.5916840705026,40.5917226221235,40.5917389747956,40.5917613861133,40.5917894478133,40.5918226486999,40.5918758734356,40.591925216839,40.5919706186343,40.5920120233606,40.592022639587,40.5920263905439,40.5920231918791,40.5920131155247,40.5919963880791,40.5919733857111,40.5919313528604,40.5918891801707,40.5918479165941,40.5918085884684,40.59177217399,40.5917395788835,40.5917116138742,40.5916688109091,40.5916224023878,40.5915724327159,40.5915297136688,40.5914926073555,40.5914614084508,40.5913934154052,40.5913231745608,40.5912510456884,40.5911773982283,40.5911026093976,40.5910270622581,40.5909511437545,40.5909352924386,40.5909177068605,40.5908988570783,40.5908792469409,40.5908594006217,40.5908398486061,40.5907774683789,40.590714522148,40.5906515255814,40.5905889947575,40.5905274419383]}],[{"lng":[-73.831932772558,-73.8311688264468,-73.8335737606269,-73.8336682241384,-73.8338245825864,-73.8339174071754,-73.8339660025802,-73.8340730885172,-73.8342548865104,-73.8344717827975,-73.8345867378274,-73.8347010349452,-73.8348388970334,-73.8349085013809,-73.8349889242451,-73.835095355346,-73.835094333903,-73.8351907839241,-73.8353435459553,-73.8354647651059,-73.8355986592411,-73.8356843282124,-73.835758633,-73.8358352907319,-73.8359470545489,-73.8359939282658,-73.8360443392151,-73.8360821890045,-73.8361404776635,-73.8361855895902,-73.8362324354899,-73.8362988522651,-73.8363419996488,-73.8363914851874,-73.836434748037,-73.836468843554,-73.8365018394166,-73.8365607440234,-73.8366262943397,-73.8366687671486,-73.8366983168281,-73.8367781405654,-73.8367965366244,-73.8368794996991,-73.8369219739223,-73.8369281952527,-73.8369343590982,-73.8369339352202,-73.8369192957425,-73.8369460694565,-73.8369961146231,-73.8370035687303,-73.8370334255378,-73.837082486858,-73.8371076630753,-73.8371948261411,-73.8372807565615,-73.8373860066472,-73.8376239778754,-73.8376250384774,-73.8376765084418,-73.8377596072059,-73.8377882930504,-73.8379162520189,-73.8380141263411,-73.8380675611283,-73.838093065978,-73.838134635535,-73.8381559622236,-73.838152790122,-73.8381470057435,-73.838800851447,-73.8388324144641,-73.838823432179,-73.8387819068649,-73.8387582837066,-73.8386083939724,-73.8383872250273,-73.838395273036,-73.8384159762752,-73.8386152608046,-73.8386858739932,-73.8387970929377,-73.8388467809664,-73.838875451339,-73.838923194169,-73.8390887815876,-73.8393269282162,-73.8395559412879,-73.8396364380357,-73.8396540288728,-73.8396673695604,-73.8396886757134,-73.839771968374,-73.8398963540131,-73.8399568578053,-73.8401774083174,-73.8405762419087,-73.8406261366941,-73.8406237108017,-73.8405868557223,-73.8404907300312,-73.8405045146487,-73.8410132277108,-73.8413649663431,-73.8417983529499,-73.8417576104164,-73.8421530904042,-73.8423793311594,-73.8424148693954,-73.8424367857282,-73.8424370930035,-73.8425648631712,-73.8426447135369,-73.842728949355,-73.8427511780047,-73.8427900062687,-73.8429663145242,-73.8431269638554,-73.8431936661326,-73.8433647041955,-73.8435006569797,-73.8407376339097,-73.8405697216373,-73.8374583348024,-73.8365869890018,-73.8362742528854,-73.8359859742979,-73.8356978802487,-73.8353490065424,-73.8349280277956,-73.8347598570629,-73.8347602661448,-73.8343993050648,-73.8340000196425,-73.831932772558],"lat":[40.5934477969242,40.5914881443093,40.5890351718492,40.5890483777829,40.5890702369472,40.589083212968,40.5891287036585,40.5891420345488,40.5891303899289,40.5891607093191,40.5891221649679,40.5891531557356,40.5892120280403,40.589279557561,40.5893147120665,40.58931399203,40.5893529772162,40.5893817467402,40.5893700307698,40.5893515940492,40.5893766420646,40.5893873064044,40.5893825861093,40.5893513054665,40.5893669272337,40.5893957531159,40.5894066796352,40.5894031555388,40.5894152998017,40.589409147771,40.589445786259,40.5894766979694,40.5894902517631,40.5894954067573,40.5894777122221,40.5894667287597,40.5894968467744,40.5895128388499,40.5895223544359,40.5895476856509,40.5895722678881,40.5895589789368,40.5895299326507,40.589520256508,40.5895455871286,40.5895684371106,40.5896069104855,40.5896362352694,40.589672740803,40.5896800102135,40.589704636198,40.589735180548,40.5897616862062,40.5897961656855,40.589809441242,40.5898579441353,40.5898987525928,40.5899162861355,40.5900268903025,40.5900814585326,40.5901469513887,40.5901860703058,40.5901894774792,40.5902046760674,40.5902560858425,40.5903018721065,40.5903971159437,40.5904967214212,40.5906138311803,40.5906563003178,40.5907337598552,40.5911977653703,40.5911841454304,40.5911249427941,40.5910673210475,40.5909869975142,40.5907537405576,40.5904161700562,40.5903917525474,40.5903872434538,40.5904862289287,40.5905497324972,40.5906271240685,40.590646691694,40.590615994579,40.5906146556066,40.5907051702981,40.5908664148532,40.591042334815,40.5910884303621,40.5910924530032,40.5911078084471,40.5911413923346,40.591206584528,40.59124597071,40.5912518592241,40.5913119233156,40.5915269031144,40.5915345550497,40.5914940098688,40.5914555035096,40.5912281047137,40.5912066517522,40.5915473237824,40.5918457978923,40.5920075961524,40.5920972358706,40.5923096435194,40.592478318069,40.5925708628792,40.5927164839653,40.5928728453879,40.5928601962943,40.5929535383583,40.5930760038358,40.5931979908871,40.593327379146,40.593341467201,40.5933672511261,40.5934632181329,40.5934701438688,40.5950841097559,40.5971737199489,40.5973007027942,40.596862867843,40.5958112711257,40.595599593064,40.5952410032274,40.5948089411707,40.5945972077124,40.5943118973807,40.5941096068619,40.5939442945016,40.5937509090235,40.5936197131525,40.5934477969242]}],[{"lng":[-73.8099705940606,-73.8100013294844,-73.8100693044022,-73.8101441752304,-73.8101443079841,-73.8101069792286,-73.8100492795985,-73.8099881323256,-73.8099746525173,-73.8100529543002,-73.8101005362172,-73.8101311091979,-73.8101889643458,-73.8102231105826,-73.8102402580587,-73.8102438004538,-73.8102404865728,-73.8102269559029,-73.810267782702,-73.8102949385732,-73.8103018397034,-73.8103019870831,-73.8102851056618,-73.8102546285999,-73.8102547907584,-73.8102550339963,-73.8103300132373,-73.8103574053884,-73.8103474029703,-73.8103305658313,-73.81030695227,-73.8102901158607,-73.8103310668464,-73.8103889881454,-73.8104163272101,-73.8104096471615,-73.8104880810819,-73.8105868483028,-73.8106856684497,-73.8107844156081,-73.8108593790579,-73.8109003668611,-73.8109616972454,-73.8110433560139,-73.8111181504355,-73.8111797413363,-73.8112202255586,-73.8113156054143,-73.8113871961231,-73.811417982163,-73.8114896519202,-73.8115237959287,-73.8115341737503,-73.8115086199738,-73.8115755034552,-73.8117281147511,-73.8117892258254,-73.811938748309,-73.8120576696929,-73.8122207328776,-73.812224046748,-73.8122103489912,-73.8122238643905,-73.812244171764,-73.8122678748163,-73.8122881895316,-73.8123967142286,-73.8125324601858,-73.8126104408961,-73.8127292041678,-73.8129736235998,-73.8130536962747,-73.8130706166164,-73.8131989936139,-73.8132938509618,-73.8134670293962,-73.8135788337239,-73.8135953012102,-73.8137352480731,-73.8137798346891,-73.8139139273092,-73.8140089309657,-73.8141038635366,-73.8142100772522,-73.8142937779244,-73.8145120609477,-73.8146071255904,-73.814707498835,-73.8147742443317,-73.8148410149893,-73.8148967064153,-73.8150147156856,-73.8149782940831,-73.8149854217502,-73.8150130073835,-73.8150183991994,-73.8150181388147,-73.8149954122192,-73.8149671753706,-73.8149669385913,-73.8149162234836,-73.8149159511106,-73.814926852392,-73.8149432292706,-73.8149484189157,-73.8149312494922,-73.8148692172275,-73.8148406371023,-73.8148011774958,-73.8147057650676,-73.814548734198,-73.8144422299799,-73.8144308425367,-73.8144081731411,-73.8142869369858,-73.8133966522334,-73.8132086239475,-73.8130799510939,-73.8129011820515,-73.8126662578459,-73.8123919095857,-73.8120614408769,-73.8117029976751,-73.8114232271991,-73.811098511924,-73.8108536518665,-73.8107234648387,-73.8105164156457,-73.8103263268261,-73.810169588196,-73.810035487525,-73.8100806775802,-73.8100865862214,-73.810075984767,-73.8099082936959,-73.8098633385732,-73.8099214611191,-73.8099965835328,-73.8100342593774,-73.8100345324261,-73.8100244640393,-73.8099498291988,-73.809912581666,-73.8099433702624,-73.809994590248,-73.8100391457443,-73.8100359124071,-73.8100429323148,-73.8100261835713,-73.8099787722712,-73.8099382179838,-73.8099281721657,-73.8098910060967,-73.8098605349629,-73.809850645024,-73.8098814545094,-73.8099394362194,-73.8099905520963,-73.8100008866392,-73.8100147118702,-73.8099705940606],"lat":[40.6000675373802,40.6000286828153,40.6000573257895,40.6000548556422,40.6000081688998,40.5999717952002,40.5999198251643,40.5998834120547,40.5998367028039,40.5998238636205,40.5998446917928,40.5998628986558,40.5998604003661,40.5998189570124,40.5997722983647,40.5997230235586,40.5996918936122,40.5996633401523,40.5996660014225,40.5996893896501,40.5996556822047,40.5996038084351,40.5995570936048,40.599505168773,40.5994481073073,40.5993625148569,40.5993211393835,40.5992615289946,40.5991888882644,40.5991266105198,40.5990539473201,40.5989916700724,40.5989502379169,40.5989243962373,40.5988829420946,40.5988388379677,40.598779311237,40.5987483495902,40.5986992315959,40.5986760508239,40.5986398615255,40.5985854610998,40.598557030881,40.598559759036,40.598583225391,40.5985848923351,40.5985859869742,40.5985498315847,40.5985032621373,40.5984462504205,40.5983711504213,40.598329706674,40.5982700680956,40.5982161835272,40.5981411992596,40.598275573709,40.5983249539675,40.5983952302902,40.5984576736234,40.5985539084778,40.598585037699,40.5986161402956,40.5986498807163,40.5986888197842,40.5987303577529,40.5987667031323,40.5988965668044,40.5990264742773,40.5991277567963,40.5992472615708,40.5994551579924,40.5995037120154,40.5995963267413,40.5997844990842,40.5999341693057,40.6001352296224,40.600237936587,40.600361848356,40.6004218817888,40.6005116640854,40.6006613973496,40.6007598040106,40.6008838426576,40.6009822679515,40.6011148317813,40.6012219818331,40.6012990292526,40.6014828821846,40.6016666813346,40.601841936479,40.6019701832264,40.6020562910611,40.6021763691585,40.6023163496653,40.6024744534352,40.6025513561295,40.6026453372286,40.6027563701697,40.602833218726,40.602918655858,40.6030168277126,40.6031150807893,40.6032261673598,40.6033842542543,40.6035337786268,40.6036619079951,40.6037985086017,40.6039992409065,40.6040803433335,40.6041271800476,40.6041611022749,40.6041652018693,40.6042292619877,40.604318935389,40.6044556662216,40.6043640722455,40.6043554390855,40.6042697918807,40.6040601784778,40.603888919775,40.6037859479234,40.6037085139897,40.6036139452695,40.6034468825287,40.6033181922461,40.6032237130143,40.6031509716553,40.6030352894494,40.6028683718439,40.6027997630425,40.6026542969203,40.6025304865655,40.6024236992953,40.6022100878724,40.6020517505721,40.6018957895053,40.6017870948398,40.6016964385096,40.6016109079579,40.6015149401376,40.6014656433503,40.6013851141657,40.6013202099329,40.6012631991294,40.601201033877,40.6010895779422,40.6010299170134,40.6009547100426,40.600861308442,40.6007808249385,40.6006821964081,40.6006251180666,40.6005316821705,40.6004771638922,40.6003656167586,40.6003008250928,40.6002542340363,40.6002283813038,40.6001843047859,40.6001091095641,40.6000675373802]}],[{"lng":[-73.8003180772991,-73.8002416025982,-73.800161461991,-73.8000922561732,-73.8000304270933,-73.8000158987901,-73.7999868927615,-73.7999467332933,-73.7998957324949,-73.7998520568149,-73.7998157069352,-73.7997721645037,-73.7997467678912,-73.7997174956049,-73.7996301444238,-73.7995391591198,-73.7994882229042,-73.7993790018735,-73.799277023314,-73.7992187947082,-73.7991604740487,-73.7990512023445,-73.7989819969837,-73.7989091482292,-73.7988290071778,-73.7987270279924,-73.7986323336235,-73.798519461301,-73.7984758446317,-73.7983957278909,-73.7983265400201,-73.7983412104687,-73.7983704668227,-73.7983596652858,-73.798319607216,-73.7982757300536,-73.7981820476248,-73.7980644884188,-73.7980136040354,-73.7979518258022,-73.7979273649887,-73.7979426912835,-73.7979698634872,-73.7979943189259,-73.7980160832624,-73.7980215877423,-73.7980257662997,-73.7980340131649,-73.7980517640498,-73.798080341464,-73.7981075597061,-73.7981469787728,-73.7982311269372,-73.7982339114549,-73.7982448318519,-73.798285572923,-73.7983371850514,-73.7983779180054,-73.7984091870797,-73.7983971092265,-73.7983972183874,-73.7983919565085,-73.7983920531955,-73.7983921561207,-73.7983814107201,-73.7983490210242,-73.798334202255,-73.7983180493345,-73.7982951121297,-73.7982843962099,-73.7982655576332,-73.7982439223327,-73.7982358560726,-73.7982521627214,-73.7982657542499,-73.7982955365084,-73.798344268587,-73.7983875612852,-73.7984430237766,-73.7984808653318,-73.7985255261675,-73.7985796254701,-73.7986147940675,-73.7986770784641,-73.7987204561345,-73.7987760543556,-73.7988262411912,-73.7988669559235,-73.7989211767465,-73.7989658968257,-73.7990052652703,-73.7990663096039,-73.7991097797623,-73.7991248194793,-73.7991533843592,-73.7991955174803,-73.7992375928549,-73.7992783122107,-73.7993542250587,-73.7994233623166,-73.7995005965651,-73.7995264345793,-73.7995373248973,-73.7995807928576,-73.7996092568875,-73.7996539488469,-73.7997162787724,-73.7997447472184,-73.7997854543903,-73.7998179890649,-73.7998667351019,-73.799930358677,-73.7999709261181,-73.7999884694486,-73.8000127722431,-73.8000438382688,-73.8000532809991,-73.8000587907299,-73.8000697348277,-73.800098276194,-73.8001132794205,-73.8001092807899,-73.8000700224731,-73.8000429537867,-73.8000103713998,-73.7999737981392,-73.7999318473195,-73.7998953291408,-73.7998655345754,-73.7998303215615,-73.7997991628213,-73.799772035791,-73.7997395184036,-73.7997002442668,-73.7996650498738,-73.7996175864075,-73.7995633985349,-73.7995254356845,-73.799503686087,-73.7994819163236,-73.7994696363223,-73.7994506241726,-73.799376115957,-73.7993245956843,-73.7992798416559,-73.7992188355535,-73.7991808506374,-73.7991360592711,-73.7991075481351,-73.7991074673323,-73.7990924729266,-73.7990720693405,-73.7990475819837,-73.7990122678526,-73.798966105199,-73.7989186475901,-73.798849516071,-73.7988034126759,-73.7987789771603,-73.7987410202471,-73.7987071409265,-73.7986583899861,-73.7986028837387,-73.7985487564328,-73.7985000492051,-73.7984540204107,-73.7983904345842,-73.7983363096876,-73.7982767612478,-73.7982117663163,-73.7981440062972,-73.798099292621,-73.798049183915,-73.7979937255416,-73.7979517904541,-73.7979207130431,-73.7978815163872,-73.7978707382413,-73.797840950779,-73.7978261216346,-73.7978126574357,-73.7978114220631,-73.7978155749749,-73.7978333106925,-73.7978442726542,-73.7978497902558,-73.7978688539869,-73.7978757195449,-73.7978785275678,-73.7979043342041,-73.7979383160978,-73.7979844680148,-73.7980373536493,-73.7981322039886,-73.7981742030707,-73.798222978999,-73.7982513804507,-73.7982567268447,-73.79828516577,-73.798296071922,-73.7983232283787,-73.7983598473948,-73.7983964608225,-73.798433053951,-73.7984750537072,-73.7985157197417,-73.7985414894139,-73.7985537292001,-73.7985808780144,-73.7986242246108,-73.7986621243401,-73.7986756411206,-73.7986850716699,-73.7986619654896,-73.7986618845081,-73.7986740254948,-73.7986875451891,-73.7986983711261,-73.7986982839291,-73.7986914361085,-73.7986791932067,-73.7987035637813,-73.7987225486253,-73.7987375079592,-73.7987578165453,-73.7987685918107,-73.7988011277275,-73.7988255730119,-73.7988270125873,-73.7988121528792,-73.7987878290061,-73.7987634771295,-73.7987649214168,-73.7987961484153,-73.7988422484093,-73.7988801986573,-73.7989507002855,-73.79900356333,-73.7990510235051,-73.7990916872664,-73.7991147613276,-73.7991282446604,-73.7991403538123,-73.799160637542,-73.7991756162552,-73.7992081922297,-73.7992610477268,-73.7993099112903,-73.7993289916174,-73.799323616894,-73.7993493678242,-73.7993832684343,-73.799436196538,-73.7994877347172,-73.7995270421877,-73.7995392848392,-73.7995664067883,-73.7995934567644,-73.7996232634553,-73.7996422970892,-73.7996721788109,-73.799708807691,-73.7997494859259,-73.799805046574,-73.7998551896971,-73.7998931740657,-73.7999379460762,-73.799985381192,-73.8000219671042,-73.8000585059631,-73.8000624877492,-73.8000921559294,-73.8001123927741,-73.8001448511763,-73.8001352477446,-73.8001541489632,-73.8002055914621,-73.8002719498479,-73.8003302241844,-73.800370929601,-73.8003953821237,-73.8004131162409,-73.8004564678451,-73.8004863202351,-73.8004267411482,-73.8003942056775,-73.8003589094874,-73.8003303848085,-73.8002869767112,-73.8002355035257,-73.800196263373,-73.8001787269645,-73.8001707133833,-73.8001491364348,-73.8001357362669,-73.8001480034991,-73.8001196352005,-73.8000465016262,-73.7999651778212,-73.7999041941838,-73.7998513345046,-73.7997672953798,-73.7996670147624,-73.7996195300627,-73.7995774805764,-73.7995313662152,-73.7994689678219,-73.7994133723796,-73.799376756734,-73.7993211743351,-73.7992696607751,-73.7992275987453,-73.7991828482367,-73.7991096365942,-73.7990499788331,-73.7990038929301,-73.7989510330814,-73.7989076436106,-73.7988723918437,-73.7988236221815,-73.7987897501936,-73.7987559220092,-73.7987288435651,-73.7987085724319,-73.7986855637387,-73.798651706694,-73.7986015635264,-73.79855006859,-73.7984836336903,-73.7984199450733,-73.798357599301,-73.798323683892,-73.7982911137698,-73.7982409455934,-73.7982002718239,-73.7981623503839,-73.7981258150616,-73.7981000984867,-73.7980675782977,-73.7980187937692,-73.7979496608389,-73.7979008379109,-73.7978655262092,-73.7978491771974,-73.7978111956846,-73.7977975760533,-73.7977703193682,-73.7977580387325,-73.7977321757373,-73.7977075674547,-73.7976938905336,-73.7976680080044,-73.7976407104088,-73.7976418749967,-73.7976593478982,-73.797663260297,-73.7977105209434,-73.7977510793726,-73.7978092782755,-73.7978552818313,-73.7978890791069,-73.7979351099793,-73.7979716146392,-73.7980162502601,-73.7980582316938,-73.798079852214,-73.7981163661322,-73.7981514908248,-73.7981473313438,-73.7980917861249,-73.7980335766633,-73.7980186111887,-73.7980591592515,-73.7981268327633,-73.7981755058527,-73.7981876053945,-73.7982010199235,-73.798215835326,-73.7982170660229,-73.798215619929,-73.7981803052435,-73.7981517615046,-73.7981151043512,-73.7980825110179,-73.7980485328304,-73.7980172987997,-73.7979833569541,-73.797949399241,-73.7979046006727,-73.7978963794328,-73.7978800421482,-73.7978555711508,-73.7978446393925,-73.7978011605381,-73.7977767426572,-73.7977401290026,-73.7977102590563,-73.7976614342219,-73.7975991190537,-73.7975517765906,-73.7975057788058,-73.7974665786536,-73.7974355229687,-73.7973976728563,-73.7973611745525,-73.7973246471868,-73.7973002976378,-73.7972692922905,-73.7972585016599,-73.7972340681225,-73.7971988267305,-73.7971406249961,-73.797093243738,-73.7970485642183,-73.7970188236234,-73.7969768826645,-73.7969471125288,-73.7969010303918,-73.7968522606569,-73.7967940198831,-73.7967764914865,-73.7967318058182,-73.7966992661949,-73.7966544987561,-73.7966151733854,-73.7965840144819,-73.7965434387201,-73.7965204506326,-73.7964879689897,-73.7964568749261,-73.7963675453999,-73.7963476113365,-73.7963332599561,-73.7963327639753,-73.796332402659,-73.7963315207439,-73.7963258190827,-73.7963143733081,-73.7963144425882,-73.7963337381519,-73.7963444524111,-73.7963454654649,-73.7963743328114,-73.7963937087477,-73.7964053488634,-73.796413109226,-73.7964228074372,-73.7964297135572,-73.7964250017125,-73.7964376190698,-73.7964415456951,-73.7964676560527,-73.7964850582491,-73.7965071899393,-73.7965494728297,-73.7965821029153,-73.7966118138811,-73.7966319341009,-73.7966608168682,-73.7966908053574,-73.7966937599445,-73.7966592491597,-73.7966352925658,-73.7966151679298,-73.7965930987771,-73.7965662510091,-73.7965643933092,-73.7965509983408,-73.7965116836066,-73.796482920613,-73.7964503087602,-73.7964157570726,-73.7963783284707,-73.7963389296226,-73.7963351265723,-73.7963409622322,-73.7963583447274,-73.7963689882222,-73.7963555665453,-73.7963253488531,-73.7962940460296,-73.7962699577963,-73.7962535702298,-73.796236266596,-73.796204554399,-73.796184410718,-73.7961623529085,-73.7961489402129,-73.7961384011068,-73.7961125268627,-73.7961145228829,-73.7961318602634,-73.7961415182277,-73.7961444506183,-73.7961521723028,-73.7961656364128,-73.7961742412475,-73.7962020647379,-73.7962308780367,-73.796249121628,-73.7962750949126,-73.7962924224004,-73.7963078029201,-73.7963202577558,-73.796310590012,-73.7963105408479,-73.7963383829273,-73.7963585614497,-73.7963814128491,-73.7964037297118,-73.7964210913949,-73.7964518747404,-73.7964875128082,-73.7964922218726,-73.7965001543482,-73.7965203971443,-73.7965348755768,-73.7965570204574,-73.7965945292835,-73.7966164717066,-73.7966271957047,-73.7966512658675,-73.7966497007729,-73.7966465533153,-73.7966398580826,-73.7966783657723,-73.7966514532748,-73.7966264676514,-73.7965966780089,-73.7965717214027,-73.7965621430051,-73.7965650529678,-73.7965766303202,-73.7966016516302,-73.7966381721735,-73.7966564328849,-73.7966987242453,-73.7967266086362,-73.7967477971232,-73.7967622642931,-73.79678247039,-73.7967930021973,-73.7967919542625,-73.796796250131,-73.7967995888623,-73.7967822340538,-73.7967600736411,-73.7967657864865,-73.7967965206415,-73.7968177046796,-73.79684278615,-73.7968735693254,-73.7968918855338,-73.796893869679,-73.7968996745739,-73.7969275834486,-73.7969439611791,-73.7969295898624,-73.7969316413976,-73.7969335391727,-73.7969355411295,-73.7969783187023,-73.7970171923834,-73.7970565982615,-73.7970634627531,-73.7970644709744,-73.7970654882381,-73.7970829045887,-73.7971319444586,-73.797143197327,-73.797159748603,-73.7971789143851,-73.797196174915,-73.7972375060371,-73.7972596767014,-73.7972559148533,-73.7972463995811,-73.7972435170829,-73.7972667819291,-73.7973190117819,-73.7973458661577,-73.7973875919342,-73.7974526315979,-73.7975050576428,-73.7975312217275,-73.7975272543143,-73.7975641206447,-73.7975971356108,-73.797678805056,-73.7977321327159,-73.7977796176802,-73.7978562944714,-73.7979281469625,-73.7980048052208,-73.7981127410952,-73.7981535357765,-73.7981798000765,-73.7982254246876,-73.7982827089458,-73.7983370381187,-73.7983739502152,-73.7984167337774,-73.7984701457195,-73.7985186979463,-73.7985681540566,-73.7986117767237,-73.7986719439482,-73.7987457315222,-73.7988205084829,-73.7988788158436,-73.7989098875083,-73.7989147848904,-73.7989049775625,-73.7988993465834,-73.7988896873687,-73.7988994491279,-73.7989295795502,-73.7989655064194,-73.7989858670623,-73.7990178752678,-73.799031405894,-73.7990352030064,-73.7990855738474,-73.7991253005398,-73.7991689165631,-73.7992339786189,-73.7992573262966,-73.7992864798443,-73.7993271813043,-73.7993727378358,-73.7994484368495,-73.7994940292417,-73.7995882249084,-73.7996454696167,-73.7997221840161,-73.7997562150075,-73.7998203322159,-73.7998717980813,-73.799916505322,-73.7999660485046,-73.8000020153994,-73.8000331130668,-73.8000506342304,-73.8000759611594,-73.800136112539,-73.8001981467445,-73.8002467352106,-73.8002699514023,-73.8003252554858,-73.8003747284212,-73.8004796798049,-73.8005409413481,-73.800565766913,-73.8005965508542,-73.8005995519493,-73.8006200516823,-73.8006666901031,-73.8006899124739,-73.8006956428462,-73.8006984263309,-73.8007275588744,-73.8007479732496,-73.8007480395605,-73.8007569573225,-73.8007570766803,-73.8007891909575,-73.8008591518957,-73.8009144959021,-73.8009698531806,-73.8009755843501,-73.8009608952028,-73.8009578611436,-73.8010073681303,-73.8010685626969,-73.8010920176737,-73.8010950516532,-73.8011417093328,-73.801200080769,-73.801229134607,-73.8012554712006,-73.8012584735482,-73.801290627393,-73.8013313949752,-73.8013896876332,-73.801453863901,-73.8015413551828,-73.801602616361,-73.8015852225344,-73.8015969964764,-73.8016465694772,-73.8017136478666,-73.8017193263826,-73.8017279602002,-73.8017336910847,-73.8017773091723,-73.8018473873693,-73.8018882739907,-73.8019291801373,-73.8020020815953,-73.8020778071807,-73.8021506230438,-73.8021972147678,-73.8022467753095,-73.8022466765885,-73.8022669454521,-73.8022638661096,-73.8022880860892,-73.8023133135875,-73.8023178607617,-73.8023280875111,-73.8023603731564,-73.8024246470238,-73.802482874017,-73.8025294139368,-73.8025409501311,-73.8025787966771,-73.8026568454328,-73.8026864649595,-73.8027096299704,-73.8027240811416,-73.8027620197412,-73.8027796430885,-73.8028233852736,-73.8029049739326,-73.8030011333053,-73.8030914945034,-73.8031643634246,-73.8031846729565,-73.8031874626799,-73.8032195123824,-73.8032400701458,-73.8032635885403,-73.8033336938031,-73.8033745987384,-73.8033768366878,-73.8033806262441,-73.803468169643,-73.8035906054811,-73.803663421939,-73.8037275521011,-73.8037704050587,-73.8038118323422,-73.8037951829759,-73.8037605549707,-73.80373125377,-73.803712862494,-73.8036945031717,-73.8036325853219,-73.8036142755804,-73.8035741282081,-73.8035304779365,-73.8035048923853,-73.8034611283748,-73.8034284044359,-73.8034321857777,-73.8033957704352,-73.8033774048802,-73.8033955088417,-73.8034062813903,-73.8034425808512,-73.803507979872,-73.8035916294773,-73.8036644099714,-73.8036934175706,-73.8037151582345,-73.8037332304883,-73.8037730920233,-73.803783888533,-73.8037254806843,-73.8037034800771,-73.8036815443027,-73.8036486077278,-73.803670258691,-73.8037392994009,-73.8038811547481,-73.8039429919467,-73.8039355455406,-73.8038407540922,-73.8037823628387,-73.8037530930866,-73.8037275486829,-73.8036035285557,-73.8034687287852,-73.8033885243588,-73.8033556281629,-73.8033334798629,-73.8033369008845,-73.8033367291587,-73.8033074432242,-73.8032527264108,-73.8032343833167,-73.8031941536431,-73.8031430203319,-73.8030700992604,-73.8028186930947,-73.8027239177625,-73.8026473541773,-73.8025635128728,-73.8024797551829,-73.8023595805474,-73.802264903629,-73.8021702098431,-73.8020063849581,-73.8019153993945,-73.8018170226687,-73.8017258805504,-73.8016929006441,-73.8016235141357,-73.8015503777232,-73.8014663878606,-73.8013824717057,-73.8012730685089,-73.8011708657649,-73.8010650627405,-73.8009519742597,-73.8008680573912,-73.8007733466785,-73.8006860688771,-73.8006971628586,-73.8006462683366,-73.8005807950569,-73.8005810106541,-73.8006576757775,-73.8007815588606,-73.8009054754491,-73.8009674862933,-73.8009676683637,-73.8009969810744,-73.800968049061,-73.8008843659815,-73.8007969321484,-73.8006878092909,-73.8006624704207,-73.8006444488431,-73.8006954678661,-73.8007499704111,-73.8007789766845,-73.8008553927246,-73.8009464275843,-73.8010337365798,-73.8010775031085,-73.8010740095013,-73.8010304250185,-73.8009576438615,-73.8009432148344,-73.8009176446931,-73.8009283974455,-73.8008700777402,-73.8008300868531,-73.8008120568385,-73.8007685222913,-73.800695724773,-73.8006372725142,-73.8006043751687,-73.8004914286139,-73.8004697066514,-73.8004260479354,-73.8003386392456,-73.8002839294357,-73.8003020328182,-73.8003749216603,-73.8004075874144,-73.8004548548232,-73.8005276275714,-73.8005675948138,-73.800640268193,-73.8006911534352,-73.8007493573187,-73.8008257397457,-73.8008547965173,-73.8007927926577,-73.8006652930049,-73.800574157707,-73.800515713896,-73.8004827990051,-73.8004425507947,-73.8004569872222,-73.8004823261215,-73.8004894542014,-73.8005111499822,-73.8005283665261,-73.8004127644353,-73.8003180772991],"lat":[40.6070644018449,40.6070587161934,40.6070613530116,40.6070612326627,40.6070305891776,40.6070166834141,40.6069722160234,40.607002682562,40.6070053699109,40.6069941895076,40.6069691418642,40.6069135452472,40.6068801884382,40.6069245538486,40.6069021933924,40.6068770504007,40.6068575289707,40.6068406822617,40.606837728751,40.6068209704289,40.6068347485169,40.606834557522,40.6068344365049,40.6068343090718,40.6068369454624,40.6068339902898,40.6068310482926,40.6068169704999,40.6067863575984,40.6067806655044,40.606774991359,40.6067417045352,40.6067028910367,40.6066612317997,40.606658384882,40.6067138298277,40.6067374451691,40.6067079061158,40.606671728007,40.6066244263692,40.6065794048856,40.6065627537689,40.6065400790098,40.6065194651078,40.6064926493885,40.6064647717705,40.6064275969517,40.6063893961273,40.6063450152542,40.6063058169925,40.6062676499929,40.6062284707582,40.6061862722538,40.6061614888103,40.6061356871644,40.6061068394003,40.6060687146532,40.6060429646296,40.6060099687605,40.6059706991039,40.6059345496162,40.6058818654314,40.6058498475337,40.6058157638408,40.6057837274266,40.6057392580343,40.6057103115861,40.6056741342326,40.6056410427582,40.6055997101747,40.6055552652103,40.6055397344411,40.6055180302381,40.6055035992254,40.6054901960965,40.6055005765606,40.6055182205045,40.6055420516345,40.6055752008047,40.605609351035,40.6056290523967,40.6056642642467,40.6056860159167,40.6057036829617,40.6056996274914,40.605687331517,40.6056719265809,40.6056523736026,40.6056473038773,40.6056473821076,40.6056247282676,40.6056041787876,40.6055691377488,40.6055247514664,40.6054896855319,40.6054484448732,40.6054268290048,40.6054052095801,40.6053970802471,40.6053889373643,40.6053921710853,40.6053622632247,40.6053457567763,40.6053117487096,40.605309732703,40.6053191061581,40.6053212804309,40.6053182317467,40.6053007447386,40.6052966699653,40.6053101813407,40.6053330146382,40.6053620050263,40.60538682389,40.6054168186092,40.6054509565344,40.6054654331019,40.6054354897556,40.6054014249205,40.605373587943,40.6053415958021,40.6053188663212,40.6053053710508,40.6052939626134,40.6053135301591,40.6053083019146,40.6052886051629,40.6052647859071,40.6052585367782,40.6052512457207,40.6052480936618,40.6052563087928,40.6052541863324,40.6052458550043,40.6052323666777,40.6052436451157,40.6052373540468,40.6052434844159,40.6052661691711,40.6052950509703,40.6053229161686,40.6053363099812,40.6053279170561,40.6053360900013,40.6053473731982,40.6053555295295,40.6053688896489,40.6053925677288,40.6054100758254,40.6054369291532,40.605465822721,40.6054916085402,40.605522551312,40.605549343031,40.6055781820729,40.6055873945942,40.605593470875,40.6056026857188,40.605617102578,40.6056211675627,40.6056211082318,40.6056096621625,40.6055909731601,40.6055650574828,40.6055391506124,40.6055235771137,40.605488349736,40.605461400138,40.6054354741497,40.6054178021277,40.6054187162955,40.6054165714475,40.6054061552182,40.6053719738824,40.6053471125056,40.6053171049349,40.6052829521354,40.6052622762912,40.6052539615136,40.6052281139403,40.6051991704758,40.6051599203296,40.6051310078557,40.6050917910812,40.6050515299052,40.6050195208695,40.6049896019667,40.6049596611066,40.6049276484767,40.6049080696196,40.6048740454911,40.6048483051319,40.6048370373987,40.6048403023248,40.6048434750456,40.6048466589788,40.6048652999212,40.604890097641,40.6048963448084,40.6048746739047,40.6048571631289,40.6048468991866,40.6048387005266,40.6048377320575,40.6048409039994,40.6048368438523,40.6048296597926,40.6048152211053,40.604799775894,40.6048060484323,40.6048205756428,40.6048319599987,40.6048505676012,40.6048732503247,40.6049001036536,40.604918716005,40.6049290683828,40.6049342514415,40.6049631710682,40.6049869142542,40.6050023856023,40.605009658694,40.6050055598282,40.6049880275937,40.6049942609088,40.6050159691492,40.6050118946659,40.6049943795281,40.604966495423,40.6049509766195,40.6049282108396,40.6049147412175,40.604884791315,40.6048652217484,40.6048570400562,40.6048550413356,40.6048438028346,40.6048397638504,40.6048295181445,40.6048264914466,40.6048141372769,40.6048368828689,40.6048658238114,40.6048803200693,40.6048565898904,40.6048390888781,40.6048371148984,40.6048113799166,40.6047752630475,40.6047597608702,40.604758773848,40.604751602622,40.6047258735085,40.6047115037963,40.6047084740757,40.6046930026368,40.6046868526878,40.6047044584573,40.6047065767362,40.6046859525265,40.6046632825891,40.6046499187714,40.6046417267643,40.6046418235568,40.6046408782365,40.6046275173906,40.6046100374054,40.6046080536575,40.6046091504764,40.6046257393244,40.6046536335463,40.604702227998,40.6047322161289,40.6047539621166,40.6047931938915,40.6048169819384,40.6048346298073,40.6048492047818,40.6048482740543,40.604830785663,40.6048112038957,40.6047719867218,40.6047761934416,40.6047628182809,40.6047472220477,40.6047512976618,40.6047718925753,40.604794566221,40.6048089497683,40.6048016305783,40.604781938633,40.6047550546753,40.6047157922677,40.6046806377201,40.6046300057679,40.6046062707471,40.6045762696534,40.604561682803,40.6045667047166,40.6045676317145,40.6045706386341,40.6045777214853,40.6045775467333,40.6045960550381,40.6046094093748,40.6046227559361,40.6046433033007,40.6046545676331,40.6046637992647,40.6046709326329,40.6046770392561,40.6046945243854,40.6047047748988,40.6047160076325,40.6047262320367,40.6047302828944,40.6047332893999,40.6047414758783,40.6047476114452,40.6047423619923,40.6047402363889,40.6047236523862,40.6047153414088,40.6046967148239,40.6046873789822,40.60468009044,40.6046810345651,40.6046809443172,40.6046921892004,40.6046910448619,40.6046940344565,40.6047063687811,40.6047218044173,40.6047310119015,40.6047371377441,40.6047298407486,40.6047122186515,40.6047018447817,40.6047007549971,40.6047006692733,40.6047077781639,40.6047200856528,40.6047458450442,40.6047747360701,40.6047870630917,40.6048097623304,40.6048603230263,40.604888188043,40.6049263578521,40.6049975812563,40.6050388707951,40.6050832373036,40.6051472260552,40.6052102317616,40.6052577728844,40.6053083889252,40.6053642460365,40.6053963354844,40.6054201930627,40.6054440291628,40.6054709427407,40.6054854838178,40.6055134346153,40.6055413996908,40.6055507690028,40.6055714643801,40.6055963163545,40.6056325282299,40.6056635058386,40.6056582441769,40.605637484512,40.6056570824496,40.6056922707295,40.6057202762371,40.6057575445524,40.605789583364,40.6058350526412,40.6058650304118,40.6059063468509,40.6059362967408,40.6059630887057,40.6059909258731,40.6060135835131,40.6060362487835,40.6060692398038,40.6060908749599,40.6061114726963,40.606137233821,40.6061629760415,40.6061929145161,40.606217674119,40.6062434513958,40.6062733850993,40.6063104907798,40.6063187108763,40.6063269088363,40.606345447349,40.6063577564082,40.6063504162826,40.606321413126,40.6062955106089,40.6062623908199,40.6062251539273,40.6061941016297,40.6061640855272,40.6061433637301,40.6061288611521,40.6060750983565,40.6060585538792,40.6060719372592,40.6060739408872,40.6060511161513,40.606034506567,40.6060210006944,40.6059971929956,40.6059743968929,40.6059598834917,40.6059618678755,40.6059566175879,40.6059461859358,40.6059172356682,40.6059057959699,40.6059109025133,40.6059263154396,40.6059345089138,40.6059313548107,40.6059054626752,40.6058888955299,40.605875411536,40.60585056814,40.6057994212997,40.6057880033561,40.6057667353534,40.6057468055009,40.6057323056855,40.6057066665816,40.6056854139053,40.605656826827,40.6056341186617,40.60560998103,40.6055631192313,40.6055462734225,40.6055346048766,40.6054840963911,40.6054489565903,40.6054255302794,40.6053969801603,40.6053383919137,40.6053076181153,40.6052673533038,40.6052402581731,40.6051875641168,40.6051538997238,40.605145148303,40.605146688372,40.6051621285198,40.6051892838566,40.6052098292595,40.6051930332609,40.6051293585927,40.6051059237612,40.6050765624691,40.6050538122953,40.6050347315952,40.6050229733479,40.6050024150247,40.6049811691627,40.6049613685939,40.6049319987528,40.6049092395344,40.6048879392078,40.6048724961207,40.6048548492689,40.6048533149172,40.6048393903291,40.6048166928826,40.6047896209265,40.6047661997257,40.604755188522,40.6047579834803,40.6047587421966,40.6047792091328,40.6047952954164,40.604796729953,40.6047952085126,40.6047827201563,40.6047672986454,40.6047533570073,40.6047423508909,40.6047181326624,40.6046939632024,40.604681541321,40.6046661760597,40.6046500670996,40.6046390921996,40.6046361863233,40.6046508517048,40.6046662834375,40.6046729269798,40.6046780872344,40.6046700756099,40.6046613163845,40.6046598784312,40.6046730854118,40.6046913810969,40.6047074956735,40.6047170678938,40.6047185688619,40.6047189804268,40.6047193811559,40.604698901607,40.6046894339197,40.6046638594869,40.6046418896286,40.6046155365394,40.6045957955209,40.6045753103475,40.6045621651437,40.6045534415945,40.6045554478928,40.6045564286564,40.6045425538998,40.6045323306575,40.604511780777,40.6045015132763,40.6044803393334,40.6044810239916,40.6044802475101,40.6044787295797,40.6044684302574,40.6044581581516,40.6044493733638,40.6044347437348,40.6044238005956,40.6044238652217,40.6044238975312,40.6044225071349,40.6044181614869,40.604403548839,40.6043867268172,40.6043787055498,40.6043919090792,40.6044204745267,40.6044303739023,40.6044380685724,40.604456350036,40.6044746236692,40.6044922136484,40.6044988604457,40.6044857129904,40.6044549925435,40.6044455240729,40.6044272436244,40.6044067374976,40.6043942951195,40.6043818917989,40.6043687358278,40.6043540603152,40.6043361810019,40.6043196403128,40.6042932728614,40.6043037067845,40.604306602005,40.6043059393226,40.60426053704,40.6042437686132,40.6042268454049,40.6041880530332,40.6041800819384,40.6041889966129,40.6042021065299,40.6042204531728,40.6042329355978,40.6042315439793,40.6042096075743,40.6041824981806,40.6041509843379,40.6041192025889,40.6040850944128,40.6040666788765,40.6040782055215,40.6040879008107,40.6040946770952,40.6040977293876,40.6041155383024,40.6041429145151,40.6041540811348,40.6041541392818,40.6041209787148,40.6041469758253,40.6041788842967,40.60419086084,40.6041924671497,40.6042103652269,40.6041609671472,40.6041573389106,40.6041418423162,40.6041471029398,40.6041494246013,40.6041658014659,40.6041614256906,40.6041422581318,40.6041408711758,40.6041409563015,40.6041632468496,40.6041877465857,40.6042004336323,40.6042042639267,40.6042021737375,40.604187473549,40.6041882685662,40.6041742148754,40.6041535123448,40.6041416229746,40.6041245839019,40.6041075788121,40.6040980104768,40.6040988128004,40.6041092099458,40.6041211075797,40.604160432993,40.6041714655872,40.6042122596381,40.6042411922351,40.6042679123511,40.6042672865474,40.604253264568,40.6042459143665,40.6042733698128,40.6043008332173,40.6043150269241,40.6043306486873,40.6043293335273,40.6043449748785,40.6043443686083,40.6043296263387,40.6043201158075,40.6043202054361,40.6043069616648,40.6043003867634,40.604287867724,40.6042797807385,40.6042657491307,40.604239149298,40.6042570167347,40.6042242978591,40.6042831122976,40.6043187039136,40.6043476851106,40.6043766568229,40.6043768390665,40.6043636134027,40.6043309225601,40.6042903852516,40.6042615046869,40.6042304328711,40.6042327358805,40.6042661058134,40.6042994447395,40.6043438891113,40.6043506056251,40.6043484187399,40.6043261997525,40.6042684436701,40.6042284482193,40.604212950784,40.6042152936356,40.6042309432908,40.6042421495574,40.6042754884707,40.6043132370814,40.6043532263114,40.6043710879237,40.6043800821377,40.6043356831887,40.6042956934525,40.604291329801,40.6042692110107,40.6043025909208,40.6042693068081,40.6042404262288,40.6042115972273,40.6042272208087,40.6042317654457,40.6042185453377,40.6042075860594,40.604194359662,40.6041610006465,40.6041232475938,40.6041188892728,40.6041101167433,40.6041612320834,40.6041990203566,40.6042323593987,40.6042702080136,40.6042325554791,40.604208184584,40.6041771482119,40.6041706078281,40.6041951789707,40.6042175241158,40.6042353801969,40.6042354654829,40.6042687949706,40.6043154914985,40.6043710344568,40.6043895782487,40.6044088928962,40.6043883860612,40.6043422596629,40.604268990544,40.6042224393994,40.6042492029731,40.6042848342119,40.6043270712967,40.6043449121975,40.6043748120403,40.6044117569092,40.6044651231554,40.6045073658947,40.6044940983422,40.6044496897132,40.6044453208787,40.6044587923178,40.6044745109534,40.6044791101921,40.6044836782304,40.6045170426675,40.6045592647073,40.6045659855841,40.6045149152411,40.6044482968598,40.604401756363,40.6043707189734,40.6043459778593,40.6043040694698,40.6042753346059,40.604277765012,40.604300109701,40.6043024408453,40.6043302145169,40.6043609974165,40.6044229927655,40.6044580721166,40.6045135428609,40.6045745838227,40.6046245216519,40.6046244158781,40.6046576971605,40.6046853883553,40.6046658816663,40.6046963743623,40.6047157327842,40.6046962435676,40.6046490581528,40.6046462192321,40.6046989324609,40.6047350521295,40.6047878152032,40.604829518751,40.6048851513551,40.6049269346243,40.6049492671864,40.604993733658,40.6050326361197,40.6050798588626,40.605149328188,40.6051937635419,40.6052380802299,40.6052880118391,40.6053157346756,40.6053684237244,40.6054378619709,40.6054935006594,40.6055603679336,40.6055882332341,40.6056437418059,40.6056741171652,40.6057128816475,40.6057572480897,40.605773861087,40.6058347220954,40.6058455955256,40.6058704431929,40.6059092517389,40.6060091515314,40.6060841102326,40.6061424068394,40.6061923252331,40.6062199925516,40.6062643775645,40.6063198299567,40.6063669349328,40.6063917948525,40.6064191236139,40.6064439458189,40.6064687987159,40.6064908629297,40.6064851667577,40.6064766324478,40.6064681413791,40.6064652022969,40.6064371604,40.6064120187856,40.6064229530481,40.6064505561561,40.606517124383,40.6065780776746,40.6066751129749,40.6067471453107,40.6067941933747,40.6068384206791,40.6069104218091,40.6069685349587,40.6070266360641,40.6070736837511,40.6070762957515,40.6070289513862,40.6069734498553,40.6069400490289,40.6069093995188,40.6068372220043,40.6067790580963,40.6067653929079,40.6067406227866,40.6067101937552,40.6066491217092,40.6065908750623,40.6065214237077,40.6064907428336,40.6064961429191,40.6064459852269,40.6063931959716,40.606329315717,40.6063210764768,40.6063655873922,40.6064100545929,40.6064351718644,40.6064436572845,40.6064798971546,40.6064605401641,40.6064105656075,40.6063688498786,40.6063465144789,40.6062992976126,40.6063242369934,40.606382552521,40.6063963319801,40.6063712783479,40.6063101742359,40.6062518018762,40.6062350190459,40.6062932145744,40.6063320228349,40.6063429306855,40.6062984765601,40.6062817441414,40.6062788156968,40.6063037054853,40.6063398256365,40.6063260717709,40.6063649933281,40.6063928357044,40.6064179463659,40.6064513282872,40.6065097512682,40.6065459287166,40.606571013302,40.6066072343868,40.6066350457082,40.6066626980578,40.6066680292638,40.6066928560105,40.6067482753594,40.6067926351446,40.6068536376317,40.6068980796137,40.6069508689116,40.6070036259238,40.6070564082207,40.6070886270431,40.6070701179004,40.6070644018449]}],[{"lng":[-73.8295303585581,-73.8295773134622,-73.829608270395,-73.829595295861,-73.8295715845654,-73.829524149886,-73.8295172333449,-73.8295182681063,-73.8295303585581],"lat":[40.6072406733496,40.6072381700666,40.6072563595585,40.6073277342884,40.6073423909514,40.607339324343,40.607320752169,40.6072614072753,40.6072406733496]}],[{"lng":[-73.7966569965902,-73.7964755603714,-73.7963087395916,-73.7962147086063,-73.796088116852,-73.796008633179,-73.7960961637415,-73.7962524598776,-73.796390749872,-73.7964781783413,-73.7965257597975,-73.7964204956574,-73.7963185705158,-73.79627507921,-73.7962607775151,-73.7962612424815,-73.7963016139075,-73.7964800277672,-73.7965494167646,-73.7964950736061,-73.7963823801074,-73.7963059075842,-73.7962221730515,-73.7961128777754,-73.7960581369517,-73.7960541809613,-73.7960828098688,-73.796115335819,-73.7960787176381,-73.7960096658397,-73.7959075970346,-73.7958745877352,-73.7958198799993,-73.7957765005519,-73.7957151069639,-73.7956935874565,-73.795693850259,-73.795661365792,-73.7955997877335,-73.7955636694612,-73.7955385391368,-73.7955169436739,-73.7955207982458,-73.7955245777669,-73.7955174697304,-73.795510387379,-73.7954778531633,-73.795478056835,-73.7954636707201,-73.795492925995,-73.7954530371734,-73.795409557772,-73.7954024570414,-73.7954352966157,-73.7954208936133,-73.7953628668442,-73.7953339329546,-73.7953051108358,-73.7952872092975,-73.7952732743313,-73.7952847554231,-73.7952781403841,-73.7952968741346,-73.7954500465336,-73.7955777321476,-73.7957269895433,-73.7959304337894,-73.7960320850385,-73.7960245030761,-73.795955174456,-73.7958094072424,-73.7957036725008,-73.7956050205915,-73.795630081726,-73.7955858635244,-73.7956108568974,-73.795701417647,-73.79587219718,-73.796003325185,-73.796130893513,-73.7962582762919,-73.7964044721276,-73.7965163231484,-73.7966006336054,-73.7966681053894,-73.796749377758,-73.7968474312853,-73.7969393532677,-73.7970158964828,-73.7970908444373,-73.7971443845828,-73.7972316488242,-73.7973127582703,-73.7973708414784,-73.7974136496495,-73.7974595588229,-73.7974916779934,-73.7975438028334,-73.7975898567219,-73.7976327704795,-73.7976756058864,-73.7977276313991,-73.7977612602286,-73.7977979548153,-73.7978377310862,-73.7978974694127,-73.7979772062541,-73.7980354742081,-73.7980922129446,-73.7981474754566,-73.7981918940998,-73.798240955385,-73.7982792401851,-73.798334403811,-73.798389662749,-73.7984309996476,-73.7984508749328,-73.7984922301738,-73.7985489619029,-73.7986670328824,-73.7987498401588,-73.7988311159999,-73.7989108661195,-73.7989585284545,-73.7990199169041,-73.799075010318,-73.7992635117901,-73.7994766001105,-73.7995715784554,-73.7996742362551,-73.7997921249175,-73.7999101120901,-73.7999821109959,-73.8000403349951,-73.8001552975269,-73.8002120644518,-73.8002534936646,-73.8003408142684,-73.8003760571578,-73.8004403894206,-73.8004878556238,-73.8005261765421,-73.8005844840869,-73.8006320116363,-73.8006626772389,-73.8007531264261,-73.8008451299733,-73.8009248872769,-73.8009985363598,-73.8010706750478,-73.8011229214359,-73.8011889907404,-73.8012228575209,-73.8012904622462,-73.8014133076452,-73.8015023834127,-73.8015822409902,-73.8015915725708,-73.8016085373451,-73.8016668933477,-73.8017068104105,-73.8017221360347,-73.8017098036788,-73.8016866918647,-73.8016559029806,-73.8016328429755,-73.8016450165327,-73.8017063626357,-73.80174935547,-73.801793904046,-73.8018246657527,-73.8018339867597,-73.8018203152941,-73.8018188781384,-73.8018557738423,-73.8019279227096,-73.8020107280255,-73.8021073491913,-73.8021701870996,-73.802228403591,-73.8022621483108,-73.8023096824435,-73.8023939874724,-73.8024445616446,-73.8024920800445,-73.8025810566201,-73.8026930215714,-73.8027605351275,-73.8028204793558,-73.8029263282158,-73.803067399028,-73.8031701355434,-73.8032652325732,-73.8033419977669,-73.8034281809807,-73.8034606529297,-73.8034883743361,-73.803563591737,-73.803614258593,-73.8036358329625,-73.8036988313436,-73.8037741116569,-73.8038247838781,-73.8038831185918,-73.8038732225642,-73.8039167885041,-73.8039676743751,-73.8040149333745,-73.8040002643394,-73.8039491757269,-73.8038653661719,-73.8038432822193,-73.8038539505914,-73.8038683178044,-73.8038063089382,-73.8037042361841,-73.8036494472883,-73.8036092695655,-73.8036054882775,-73.8035108721482,-73.8034380307322,-73.8033688000081,-73.8033176529244,-73.8032519579391,-73.8031935092971,-73.8030841574779,-73.8028911236851,-73.8027819174216,-73.8027344944674,-73.8026434861591,-73.8025379229363,-73.8021197135946,-73.8018214331974,-73.8016865354915,-73.8014827738456,-73.801402636418,-73.8014860385055,-73.8016239788134,-73.8014892290442,-73.8013144538674,-73.8009942123057,-73.8005761359319,-73.8001978608077,-73.7998197901786,-73.7994379780088,-73.7991942545633,-73.7989725977723,-73.7985290091998,-73.7981762641652,-73.7978672638813,-73.7974746947889,-73.7970784834088,-73.7966569965902],"lat":[40.6089609150713,40.6088608681896,40.6087359146869,40.6085806184226,40.6083754010183,40.608217360286,40.6081205592703,40.6081208364398,40.6080656781697,40.6080021190495,40.6078941667296,40.607846887298,40.6078965698533,40.6078549402744,40.6077773496215,40.6076249907767,40.607497634899,40.6073954550912,40.6072875408662,40.6072292707217,40.6072346118341,40.6072815688656,40.6073257435415,40.6074086552184,40.6074805822007,40.6075858416508,40.6077327114155,40.6077937131524,40.6078822937237,40.6078794005891,40.6079761757265,40.6080730734413,40.6081339196323,40.6080562777644,40.6079259711327,40.6078317466468,40.6077458715112,40.6076710190617,40.6076016554013,40.607526796963,40.6074242552192,40.6073549633007,40.6072829448827,40.6072358584018,40.6071832125189,40.6071222565489,40.6070640247202,40.6069975410099,40.6069476522709,40.6068895315606,40.6068589883066,40.6068145878123,40.6067591718328,40.6067176772788,40.6066733297081,40.6066316734005,40.606584528673,40.6065013730039,40.6064126949027,40.6062159879483,40.6060276363941,40.6058143215337,40.6056315235924,40.6054628151553,40.6053079126908,40.6052306132467,40.6052614474335,40.6053004097837,40.6054028927202,40.6054914147116,40.6056158138638,40.6057236630595,40.6058924681309,40.6060171702199,40.6062137742232,40.6063606376626,40.6064605251218,40.6064774493267,40.6063862664935,40.6062701456259,40.606214968164,40.6061918541859,40.6062200997169,40.6062284295846,40.6062273802841,40.6062263558525,40.6062534079748,40.6062804501856,40.6063214890565,40.6063835600612,40.6064257269186,40.6064714583038,40.60652419239,40.6065850652848,40.6066272119219,40.606657678994,40.6066846143543,40.6066882129101,40.6066707640751,40.6066778509178,40.6067106493599,40.6067469690112,40.6067820880866,40.6068172137183,40.606847668676,40.6068688099084,40.6068689500902,40.6068690524935,40.6068679828252,40.606848213075,40.6068646516685,40.6068670753404,40.6068835043051,40.6068964566496,40.6068778542896,40.6068989629646,40.6069188653061,40.6069341302282,40.6069353985308,40.606935605417,40.606934581588,40.6069323865009,40.606927851651,40.6068858626861,40.6068684401006,40.6069047650071,40.6069401542782,40.6069580561903,40.6069886080143,40.6070156657479,40.6070766421359,40.6071048950451,40.6071283940739,40.6071436877926,40.6071579121344,40.6071474926547,40.6071382153456,40.6071664156853,40.6071746575323,40.6071981417849,40.6072215984009,40.6072263386507,40.6072135854626,40.6072160047821,40.6072172261535,40.6072243954347,40.6072245548904,40.6072176806142,40.6072026157467,40.607179366917,40.6071420605711,40.6070977649946,40.6070534143616,40.6070079531993,40.6069497325859,40.6069031397093,40.6068623739425,40.6068179808417,40.6067852882732,40.6067561716834,40.6067398792961,40.6067422437769,40.6067644268552,40.6068017837418,40.6068426342696,40.6068624612878,40.6068940366373,40.6068906362679,40.6068708429486,40.606844041021,40.6068125398932,40.6067716523083,40.6067283882111,40.6066956638801,40.6066641726502,40.6066374177465,40.6066363922356,40.6066307148741,40.6066413412192,40.6066589713556,40.6066555231922,40.6066556049616,40.6066662686087,40.6066757048651,40.6066816296242,40.6066677582645,40.6066586017139,40.6066435245151,40.6065957119362,40.6065807004008,40.6065809422022,40.6065811181879,40.6065719321921,40.6065393412112,40.6064331396061,40.6063408709971,40.6063000147414,40.6062720947027,40.6062499769334,40.6062137852155,40.6061694841226,40.6061205278825,40.606096072491,40.6060739671883,40.6061174082802,40.6061341028763,40.6061341896788,40.6061315001749,40.6061757977579,40.6062449652896,40.6063168463944,40.6064109944338,40.6064913480378,40.606549545984,40.6066242348462,40.6067265575912,40.6068178791274,40.6068842945423,40.6069341512094,40.6069727718923,40.6070225111407,40.6070805659804,40.6071691234874,40.6072604273409,40.6073600530245,40.6074651321797,40.6075977699163,40.607652985907,40.6077110784507,40.6077580147412,40.6078104666561,40.607881772167,40.607958823036,40.6080970991733,40.6081687715075,40.608226806993,40.6082934351248,40.6083546166372,40.6084430301742,40.6085452240285,40.6086720979106,40.6086963055197,40.6087815234857,40.6087974865792,40.6088494541942,40.6089127426061,40.6088901936804,40.6089365100161,40.6089912944881,40.6090046023238,40.6090066813772,40.609011523764,40.6089609150713]}],[{"lng":[-73.8273019254298,-73.8272710204225,-73.8272042605073,-73.827157513283,-73.8271267123468,-73.8271306999411,-73.8270381669954,-73.8269249707744,-73.8269065659595,-73.8269004082756,-73.8268479756474,-73.8268027813449,-73.8267476467248,-73.826714626882,-73.8266845081988,-73.8266372784242,-73.8266073922421,-73.8265452536132,-73.8265029927284,-73.8264442668549,-73.8264371122888,-73.8264298919988,-73.8264270387868,-73.8264241232899,-73.826419710776,-73.826415299801,-73.8264123834235,-73.8264094692446,-73.8264050754862,-73.8263991668369,-73.826394695861,-73.8263902445161,-73.8263843345476,-73.8263798629113,-73.8263768302678,-73.8263738554274,-73.826369463868,-73.8263620974697,-73.826354709457,-73.826350298262,-73.8263473827661,-73.826344468591,-73.8263415522177,-73.826338643857,-73.8263372439191,-73.826337350322,-73.8263359517003,-73.8263315465386,-73.8263271342479,-73.8263242191954,-73.8263198066855,-73.8263124202163,-73.8263050134523,-73.8263005424746,-73.8262975946233,-73.8262961966626,-73.8262963008754,-73.8262949022569,-73.826290497317,-73.8262845880117,-73.8262801864214,-73.8262787971805,-73.8262774079457,-73.82627450315,-73.8262710954927,-73.8262652071428,-73.8262573285106,-73.8262514388408,-73.8262480305246,-73.8262451141589,-73.8262421999886,-73.8262392842815,-73.8262363679146,-73.8262334725025,-73.826232094844,-73.8262321930287,-73.826230775,-73.8262278795892,-73.8262250035943,-73.8262221081885,-73.826219191821,-73.8262162776533,-73.826213361947,-73.8262104080697,-73.8262088715558,-73.8262058589843,-73.8262010037479,-73.8261904957791,-73.8261738765883,-73.8261538777366,-73.8261383079949,-73.8261370946583,-73.8261341796187,-73.8261297880744,-73.8261239178349,-73.8261224795164,-73.826125492752,-73.8261255721865,-73.8261211799841,-73.8261152706895,-73.82611085885,-73.826107944029,-73.8261035308725,-73.8260976222377,-73.826093170902,-73.8260901764249,-73.8260872218877,-73.8260828296912,-73.8260769601129,-73.8260710898758,-73.8260652203027,-73.8260600912844,-73.8260534617302,-73.8260467946578,-73.8260430611596,-73.8260386091653,-73.8260312231506,-73.8260238554576,-73.8260194632625,-73.8260165482254,-73.8260136334083,-73.8260107183732,-73.8260107567751,-73.8260137519131,-73.826015288432,-73.8260153669946,-73.8260139483184,-73.8260110341617,-73.8260096146079,-73.8260096940483,-73.8260082758124,-73.8260053603387,-73.8260009681472,-73.8259950985775,-73.8259922031854,-73.8259923013907,-73.8259909215587,-73.8259880261661,-73.8259851120133,-73.8259821581374,-73.8259791630007,-73.8259762292084,-73.8259733534583,-73.8259704580683,-73.8259675423766,-73.8259645876232,-73.8259615927079,-73.8259585997701,-73.8259541281346,-73.8259482188428,-73.8259453234573,-73.8259439052235,-73.8259380155788,-73.8259306485555,-73.825929210244,-73.8259322248023,-73.8259323042465,-73.8259294182435,-73.8259280290336,-73.8259266420282,-73.8259237560218,-73.8259223761965,-73.825922474407,-73.8259210570565,-73.8259166452276,-73.8259092587886,-73.8259018520459,-73.825897381074,-73.8258944263227,-73.8258915108539,-73.8258885951699,-73.8258856810216,-73.825882771373,-73.8258813743299,-73.8258814792345,-73.8258830360595,-73.8258860356895,-73.8258890292853,-73.8258920329259,-73.8258935984728,-73.8258937082668,-73.8258937964354,-73.8258909010537,-73.8258850314992,-73.8258806384409,-73.8258777236359,-73.8258740704755,-73.8258674424797,-73.8258608151479,-73.8258571597889,-73.8258542441057,-73.8258513299613,-73.8258484136223,-73.8258454994784,-73.8258410869992,-73.8258346857754,-73.8258273006632,-73.8258194207488,-73.8258135525165,-73.8258146138827,-73.8258220400433,-73.8258294266927,-73.8258338976642,-73.8258339771163,-73.8258310817384,-73.825828165401,-73.8258252503796,-73.8258252909847,-73.8258282845778,-73.8258312781751,-73.8258342711114,-73.8258358076331,-73.8258329122589,-73.8258270442507,-73.8258256059461,-73.8258286055766,-73.8258301608642,-73.8258302673151,-73.8258288687375,-73.8258259606298,-73.8258230449541,-73.8258186318159,-73.8258127225457,-73.8258083116121,-73.8258046591164,-73.8257980289353,-73.8257914016089,-73.8257877484565,-73.82578483212,-73.8257819179818,-73.8257790223926,-73.8257761466647,-73.8257732606794,-73.8257718728061,-73.8257749157296,-73.825780874109,-73.8257838877868,-73.8257839672427,-73.8257840447197,-73.8257841205563,-73.8257841241768,-73.8257871378556,-73.8257930868485,-73.8257975571521,-73.8258005522819,-73.8258035458755,-73.8258065597694,-73.8258095922082,-73.8258126061014,-73.8258126467081,-73.8258082335815,-73.8258038420742,-73.8258009654686,-73.8257985788086,-73.8257980888649,-73.8257952135785,-73.8257908207542,-73.8257760708637,-73.8257732130318,-73.8257747777065,-73.8257777822151,-73.8257807758072,-73.825783770715,-73.8257853074572,-73.8257853860361,-73.8257869212377,-73.825789935792,-73.8257944464768,-73.8258004142275,-73.8258048851848,-73.8258078800924,-73.8258094166142,-73.8258079979564,-73.8258050829461,-73.8258021674946,-73.8257992533624,-73.8257963370351,-73.8257934416684,-73.825790565726,-73.825787681065,-73.8257862918718,-73.8257863996995,-73.8257849924026,-73.825780579282,-73.825776187125,-73.8257733118448,-73.8257704361268,-73.8257675601865,-73.8257646648229,-73.8257647045519,-73.8257676987983,-73.8257706923818,-73.8257736868476,-73.8257752227114,-73.825775264889,-73.8257753209325,-73.8257768971813,-73.8257799110723,-73.8257829046558,-73.8257858988989,-73.8257888933614,-73.8257919072481,-73.8257919571797,-73.8257919858252,-73.8257890904639,-73.8257906060195,-73.825796495183,-73.8258008489322,-73.8258038247449,-73.8258052419653,-73.8258111512135,-73.8258127465213,-73.8258156221634,-73.8258186554712,-73.8258216678185,-73.825823204998,-73.8258232938364,-73.825823402313,-73.8258220131265,-73.8258191083775,-73.825816194253,-73.8258132779275,-73.8258133176535,-73.8258163112354,-73.8258163509611,-73.8258134359581,-73.8258105205124,-73.8258076251507,-73.8258091817511,-73.8258151503683,-73.8258196213141,-73.825822614893,-73.8258256084721,-73.8258286223551,-73.8258316556603,-73.8258346789273,-73.8258362449049,-73.8258392891336,-73.8258467032225,-73.8258555685148,-73.8258629752034,-73.8258674461454,-73.8258703999992,-73.8258733163222,-73.825877726577,-73.8258836364769,-73.8258895457217,-73.8258954540827,-73.825899905601,-73.8259014421126,-73.8259015209019,-73.8259001035623,-73.8258971872371,-73.8258942731117,-73.8258913775298,-73.8258885018107,-73.825885606448,-73.8258826914426,-73.825879786041,-73.8258783983854,-73.8258770083175,-73.8258741029143,-73.825874142638,-73.8258771377536,-73.8258816086917,-73.8258890131758,-73.8258964004355,-73.8259008128855,-73.825905205035,-73.8259111149303,-73.8259155858674,-73.8259185410348,-73.8259214560417,-73.8259243708264,-73.8259272858324,-73.8259301999574,-73.8259301615502,-73.8259271666602,-73.8259241737471,-73.8259211592116,-73.8259195836377,-73.8259194854275,-73.8259209027673,-73.8259238190921,-73.8259267347572,-73.8259296886103,-73.8259341595493,-73.8259400694477,-73.8259444615997,-73.825947376388,-73.8259517694198,-73.8259576786593,-73.8259621493777,-73.8259651438313,-73.825968136744,-73.8259711318577,-73.8259726661671,-73.8259727456111,-73.8259742821179,-73.8259772772295,-73.8259788137377,-73.8259788923003,-73.8259759969336,-73.825970126758,-73.8259686893365,-73.8259717016678,-73.825971781115,-73.8259688857505,-73.82596892547,-73.8259719183805,-73.825974913272,-73.8259779070632,-73.8259809006312,-73.8259838566785,-73.8259882481676,-73.8259941183432,-73.8259992495064,-73.826005876793,-73.8260125460014,-73.826016276383,-73.8260192714903,-73.8260222650613,-73.8260252646665,-73.8260268214693,-73.8260269257036,-73.826025528438,-73.8260226196832,-73.8260197046759,-73.8260167898904,-73.8260123955413,-73.8260065275706,-73.8260021338833,-73.8259977229735,-73.8259918137421,-73.8259874207121,-73.8259845449888,-73.825981649626,-73.8259787346211,-73.8259758198362,-73.8259758595609,-73.825978852469,-73.8259833240585,-73.8259892730092,-73.8259922859967,-73.8259923850802,-73.8259954386659,-73.8260014061596,-73.8260058779666,-73.8260088715346,-73.8260118644398,-73.8260148593237,-73.8260178531077,-73.8260208667519,-73.8260209448737,-73.8260180495114,-73.8260151353886,-73.8260122197256,-73.8260078275816,-73.826001917697,-73.825997446771,-73.8259945072166,-73.8259931340681,-73.8259932719933,-73.825993409259,-73.8259949903941,-73.8259979596245,-73.8260008737453,-73.8260037907257,-73.8260081822086,-73.8260140523711,-73.8260199218771,-73.8260258317603,-73.8260303026858,-73.8260332969076,-73.8260348320886,-73.8260349302893,-73.8260365071709,-73.8260395203707,-73.8260425145929,-73.8260455090329,-73.8260470455333,-73.8260471234333,-73.8260457054304,-73.8260427891124,-73.8260398749896,-73.8260369599879,-73.8260340445486,-73.8260296321098,-73.8260237235454,-73.8260193119848,-73.8260163956669,-73.826013481547,-73.8260105652265,-73.8260076511088,-73.8260076899485,-73.8260106937738,-73.8260122606116,-73.8260108714144,-73.8260079666743,-73.8260050503562,-73.8260020965173,-73.8259991014157,-73.8259961475797,-73.8259927415189,-73.8259868523841,-73.8259789740847,-73.825973045227,-73.8259695575238,-73.8259666023688,-73.8259622102309,-73.8259563407337,-73.8259519485985,-73.8259490329421,-73.825950549148,-73.8259565177277,-73.8259565971724,-73.8259507464375,-73.8259463543049,-73.8259434393107,-73.8259434777143,-73.8259464725923,-73.8259494663738,-73.825952480018,-73.8259525594614,-73.8259496837492,-73.8259483039398,-73.8259484036831,-73.8259469848108,-73.8259425717188,-73.825938160825,-73.8259352451716,-73.8259323498199,-73.8259339066259,-73.8259398743228,-73.8259443458974,-73.8259473394572,-73.8259503323555,-73.8259533272326,-73.8259563210099,-73.8259593346511,-73.825959412775,-73.8259565174234,-73.8259536033112,-73.8259506883197,-73.825947773547,-73.8259433604566,-73.8259369606274,-73.8259295742811,-73.8259216951178,-73.8259158249733,-73.8259154102834,-73.8259184241423,-73.8259214177012,-73.8259244315598,-73.8259289428579,-73.8259363689206,-73.825943754825,-73.8259482257378,-73.8259512603382,-73.8259542728754,-73.8259543125975,-73.8259499001702,-73.8259454486786,-73.8259417176528,-73.8259350491398,-73.8259284415275,-73.8259277819665,-73.8259308052084,-73.8259323698504,-73.8259309828621,-73.8259280968953,-73.8259289153487,-73.8259356010842,-73.8259422702563,-73.8259445435642,-73.8259460800628,-73.8259490742775,-73.8259491126828,-73.8259432237814,-73.825935816921,-73.8259298688754,-73.8259224628964,-73.82591433887,-73.8259062126452,-73.8258995853959,-73.8258959316211,-73.8258930159743,-73.8258901018696,-73.8258871458408,-73.8258841522837,-73.8258811982332,-73.8258782828085,-73.8258753665032,-73.8258724523961,-73.8258695367536,-73.82586514529,-73.8258592751554,-73.8258548830361,-73.825851966732,-73.8258475752727,-73.8258417051424,-73.8258358369866,-73.825829966854,-73.8258255740741,-73.8258226787388,-73.8258227575328,-73.8258257711687,-73.825827307677,-73.8258273858097,-73.8258289229726,-73.8258319267926,-73.8258334929799,-73.825832104461,-73.8258291997395,-73.8258255457514,-73.8258189171921,-73.8258123093772,-73.8258086937984,-73.8258057984628,-73.8258028837039,-73.8257999687222,-73.8257985500803,-73.8257986295368,-73.8257972122157,-73.8257942959172,-73.8257943356451,-73.8257973291988,-73.8257988860074,-73.8257975062158,-73.8257946108813,-73.8257902194288,-73.825784358691,-73.8257814937021,-73.8257801045292,-73.8257772185796,-73.8257728661967,-73.825766957009,-73.8257617095672,-73.8257550209824,-73.8257483546829,-73.8257446221217,-73.8257416660973,-73.8257387520003,-73.8257358363679,-73.8257358754355,-73.8257388890753,-73.8257419225816,-73.8257449558628,-73.825747988486,-73.8257510217695,-73.8257540565887,-73.8257585272733,-73.825764436463,-73.825768887941,-73.825771882152,-73.8257748953477,-73.8257749748045,-73.8257720794749,-73.8257691631829,-73.8257647514331,-73.8257603399021,-73.8257603796308,-73.8257633852564,-73.8257649630271,-73.8257650927457,-73.8257681463282,-73.8257741079676,-73.8257793185322,-73.8257859848232,-73.8257926546327,-73.825796384989,-73.8258008371255,-73.8258052877212,-73.8258090218125,-73.8258156878839,-73.8258223563747,-73.8258260882682,-73.8258290818139,-73.825832076901,-73.8258365274974,-73.8258424366782,-73.8258468482062,-73.8258512411904,-73.8258571503704,-73.8258616210483,-73.8258646154737,-73.8258676096786,-73.8258706032256,-73.8258735976497,-73.8258780489028,-73.8258839580844,-73.8258884095553,-73.8258914024418,-73.8258943973065,-73.8258981307339,-73.8259047970195,-73.8259114262205,-73.8259158192088,-73.8259224455528,-73.8259313085543,-73.8259401724324,-73.8259468400397,-73.8259510660597,-73.825956994664,-73.8259648731289,-73.8259707620085,-73.8259741702416,-73.8259771234052,-73.8259801169448,-73.8259831120245,-73.825986105567,-73.8259890991106,-73.825993570001,-73.8259994698017,-73.8260023361132,-73.8260037239873,-73.8260066287041,-73.8260095450035,-73.8260124591036,-73.8260153754016,-73.8260197869324,-73.8260242384044,-73.8260272326039,-73.8260301873036,-73.8260331027234,-73.8260375151363,-73.8260419853672,-73.826045019284,-73.8260479927453,-73.8260509083849,-73.8260538224864,-73.8260552420158,-73.8260551625811,-73.826055083803,-73.8260565024532,-73.8260594174363,-73.8260638102087,-73.8260696595939,-73.8260740126503,-73.8260769073344,-73.8260798227585,-73.8260827377432,-73.826085654044,-73.82608854939,-73.8260914244364,-73.8260943197846,-73.8260942809449,-73.8260912671061,-73.8260911876722,-73.826094083018,-73.826096998664,-73.8260999127682,-73.8261028281962,-73.8261057244223,-73.8261086001307,-73.8261114954781,-73.826114410466,-73.8261173252344,-73.8261202415383,-73.8261231368883,-73.826126012159,-73.8261289075112,-73.8261325628231,-73.8261391900613,-73.8261458570157,-73.8261510660364,-73.8261569745667,-73.8261613682271,-73.8261642823382,-73.8261679376547,-73.8261745648926,-73.826181174035,-73.826184787435,-73.82618768213,-73.8261891016716,-73.8261890222427,-73.8261904402446,-73.826193355895,-73.8261962700085,-73.8261991854383,-73.8262006036619,-73.826200524234,-73.8262019437755,-73.8262048578883,-73.8262077735418,-73.8262106876556,-73.8262143436341,-73.8262209708809,-73.8262276391578,-73.8262313697275,-73.8262343257529,-73.8262372398672,-73.8262401352261,-73.8262415141795,-73.8262414159956,-73.8262428342205,-73.8262457389615,-73.8262471281696,-73.826248517381,-73.8262514221183,-73.8262543362348,-73.8262572907231,-73.8262602851451,-73.8262632793438,-73.8262648158279,-73.8262648939328,-73.8262674164883,-73.826274822456,-73.8262846715579,-73.8262920391328,-73.826295937345,-73.826300348233,-73.8263062580923,-73.8263106705195,-73.8263150626518,-73.8263209718492,-73.8263254427421,-73.8263284362806,-73.8263314311373,-73.826334434275,-73.8263360010837,-73.8263390430507,-73.8263464590505,-73.8263538456002,-73.8263582578072,-73.826361911813,-73.8263685390604,-73.8263751482154,-73.826378761635,-73.8263831553081,-73.8263890642866,-73.8263935151033,-73.8263965099565,-73.8264009607731,-73.8264078560453,-73.8264167190698,-73.8264265679505,-73.8264339747941,-73.8264379515451,-73.8264408866204,-73.8264437623544,-73.8264466579444,-73.8264480759618,-73.8264494926575,-73.8264524486874,-73.8264539851578,-73.8264555216323,-73.8264585158241,-73.8264600509794,-73.8264601303898,-73.8264587130333,-73.8264557967111,-73.826456822492,-73.8264642284519,-73.8264740775504,-73.826481483514,-73.8264854609207,-73.8264884162882,-73.8264913304131,-73.826495741303,-73.8265016504983,-73.8265060635883,-73.826508978372,-73.8265118933771,-73.8265148096995,-73.8265177238244,-73.8265206394877,-73.8265235536143,-73.8265269631964,-73.8265328529801,-73.8265407312515,-73.8265466203761,-73.826550027761,-73.8265544388736,-73.8265588894681,-73.8265618845388,-73.8265648396876,-73.8265692305084,-73.826576598089,-73.8265844787792,-73.8265918637915,-73.8265997429397,-73.8266056708885,-73.826609157018,-73.8266110032133,-73.8266121117228,-73.8266150271748,-73.8266205474575,-73.82665046141,-73.8266582151406,-73.8266741961241,-73.8266742367017,-73.826677230231,-73.8266792681274,-73.826680223757,-73.8266832179409,-73.8266832563199,-73.8266803421883,-73.8266759485086,-73.8266700805481,-73.826665686207,-73.8266627720763,-73.8266591196007,-73.826652490147,-73.826645864215,-73.8266422075625,-73.8266392934328,-73.8266363784255,-73.8266334629793,-73.8266320447349,-73.8266321228134,-73.8266307054504,-73.8266277904428,-73.8266248749969,-73.8266219606508,-73.8266234770414,-73.8266294252751,-73.8266353726279,-73.8266413215172,-73.8266472704064,-73.8266531802586,-73.8266575723969,-73.826661984827,-73.8266663769658,-73.8266692529372,-73.8266721483166,-73.8266750624465,-73.826679475536,-73.8266853847275,-73.8266898353164,-73.8266928303806,-73.8266958239037,-73.82670029544,-73.8267062046309,-73.8267120741265,-73.8267179833189,-73.8267224539769,-73.8267254477189,-73.8267269841769,-73.8267270823169,-73.8267286584725,-73.8267316325869,-73.8267350421709,-73.8267409319521,-73.8267488088953,-73.826754698457,-73.8267551507023,-73.826752137772,-73.8267520583813,-73.8267549537647,-73.8267578694328,-73.8267607835654,-73.8267636990173,-73.8267666140266,-73.8267702693652,-73.826776896618,-73.8267835635668,-73.8267872954373,-73.8267902996514,-73.8267918651054,-73.8267919732782,-73.8267920620368,-73.8267921414247,-73.8267922194927,-73.8267908021201,-73.8267879067357,-73.8267879852448,-73.8267910186789,-73.8267910971877,-73.8267882214314,-73.8267853461149,-73.8267824507318,-73.8267795344057,-73.8267766196155,-73.8267737046057,-73.8267678150477,-73.8267589520341,-73.8267530225627,-73.826750028384,-73.8267470745591,-73.8267441604296,-73.8267397473434,-73.8267331013493,-73.8267249742679,-73.8267183478994,-73.8267132158756,-73.8267073075694,-73.8267020976908,-73.8266954300884,-73.8266887631481,-73.8266835526104,-73.8266776434232,-73.8266725129392,-73.826665882836,-73.8266592569114,-73.8266556024627,-73.8266526867979,-73.8266497726734,-73.8266453595879,-73.8266409074661,-73.826639371005,-73.8266370977372,-73.8266304299154,-73.8266238035518,-73.8266186702123,-73.8266128007269,-73.8266084085914,-73.8266039955095,-73.8265980863222,-73.8265936357365,-73.8265906406743,-73.8265876868481,-73.8265832947148,-73.82657738553,-73.8265761875304,-73.826572914654,-73.8265699211296,-73.8265669260658,-73.8265639722413,-73.8265610581182,-73.8265581417973,-73.8265552261392,-73.8265523120167,-73.826549397017,-73.8265449839321,-73.8265390756273,-73.8265346234995,-73.8265316299755,-73.8265286155007,-73.8265285367529,-73.8265314327818,-73.8265299166063,-73.8265240074194,-73.8265196152877,-73.8265166989695,-73.8265137848467,-73.8265108691898,-73.8265079550703,-73.82650503875,-73.8265021237533,-73.826499208314,-73.8264948168439,-73.8264889083196,-73.8264836984348,-73.8264770301711,-73.8264703632274,-73.8264666298143,-73.8264636362849,-73.8264599052908,-73.8264532361465,-73.8264466095668,-73.8264429551229,-73.8264400394687,-73.8264371244711,-73.8264342090342,-73.8264298175676,-73.8264239077232,-73.8264194361831,-73.8264164821395,-73.8264135667034,-73.8264106525875,-73.8264077362744,-73.8264047822321,-73.8264017886999,-73.8263988335601,-73.8263959179049,-73.8263930037902,-73.8263900887964,-73.8263856750587,-73.8263797674122,-73.8263753549939,-73.8263724386817,-73.8263695245653,-73.8263651324427,-73.8263592629667,-73.8263541324983,-73.8263475024067,-73.8263386394028,-73.826329776397,-73.8263231491639,-73.8263180180362,-73.8263121485653,-73.8263077542459,-73.8263033433692,-73.8262974341874,-73.8262915250025,-73.8262848783548,-73.82627675216,-73.8262700852169,-73.8262663526798,-73.826263418272,-73.8262605416769,-73.8262576463235,-73.8262547313375,-73.8262503198026,-73.8262458683342,-73.8262428741419,-73.8262399194391,-73.8262355273242,-73.8262296190208,-73.826225146598,-73.826222152405,-73.8262191588695,-73.8262161659932,-73.826213171581,-73.8262101773872,-73.8262071838496,-73.8262042278316,-73.8261998363735,-73.8261939662447,-73.8261895747856,-73.8261866584811,-73.8261852411415,-73.8261838231429,-73.8261809074981,-73.8261794892802,-73.8261795673887,-73.8261774123649,-73.8261707831607,-73.8261641559336,-73.8261619987124,-73.8261605813746,-73.8261576650725,-73.8261532722981,-73.8261474021745,-73.8261430107214,-73.8261400966167,-73.8261371816361,-73.8261342653339,-73.8261313499109,-73.826128435809,-73.826125520168,-73.8261211070998,-73.8261151992433,-73.8261092902852,-73.8261019044182,-73.8260945368741,-73.8260886674138,-73.8260827972956,-73.826078405845,-73.8260754908656,-73.8260725747879,-73.8260696591482,-73.8260662531111,-73.8260603640166,-73.8260524857744,-73.8260465975564,-73.8260431864675,-73.8260387753806,-73.8260328664258,-73.8260284540217,-73.8260255390422,-73.8260226236277,-73.8260189711837,-73.8260123433061,-73.8260056763663,-73.8260019422868,-73.8259989875905,-73.8259945954862,-73.825987229262,-73.8259813000079,-73.8259768284614,-73.8259709192874,-73.825966527184,-73.8259636130889,-73.8259592194459,-73.8259533109335,-73.8259488400458,-73.8259458264239,-73.82594279382,-73.8259383207332,-73.8259338701455,-73.8259308757257,-73.8259279212508,-73.8259235291466,-73.8259176199734,-73.8259131484242,-73.8259101952652,-73.825905802281,-73.8258984347416,-73.8258910497569,-73.8258865982907,-73.825882126081,-73.8258761778425,-73.8258717069481,-73.8258687134071,-73.8258657192035,-73.8258627631875,-73.8258583717462,-73.8258524632307,-73.8258479923382,-73.8258435404276,-73.8258390896189,-73.8258346167475,-73.8258287075687,-73.8258235793258,-73.8258169492485,-73.8258102823036,-73.8258065497552,-73.8258035546715,-73.825800561126,-73.8257975675807,-73.825794081876,-73.8257881526187,-73.8257802756935,-73.8257743462132,-73.8257693814033,-73.8257634722267,-73.8257605769009,-73.8257576815755,-73.8257517724007,-73.8257487585475,-73.8257467301079,-73.8257408021654,-73.8257329243617,-73.825725538058,-73.8257205933273,-73.8257175988995,-73.8257146437622,-73.8257112375148,-73.8257053479861,-73.8256974701814,-73.8256915402609,-73.8256865752245,-73.8256791686121,-73.825671783627,-73.8256673819299,-73.8256659929874,-73.8256646044859,-73.825661718547,-73.8256617980095,-73.8256648118676,-73.825669282766,-73.825675230134,-73.8256782649511,-73.8256768851756,-73.8256724930806,-73.8256680806807,-73.8256651657182,-73.8256622503133,-73.8256593362273,-73.825656420606,-73.8256535056399,-73.8256505902358,-73.8256506299697,-73.8256536235178,-73.8256566186032,-73.8256596121526,-73.8256626057032,-73.8256655999099,-73.8256671350958,-73.8256657177839,-73.8256613047281,-73.8256569132973,-73.8256569921024,-73.8256600066156,-73.825662999503,-73.8256659930493,-73.8256689872565,-73.8256719816815,-73.8256720214136,-73.8256691051328,-73.8256654527061,-73.8256588239601,-73.825652197634,-73.8256485423489,-73.8256456282691,-73.8256456671223,-73.8256486608895,-73.8256501973956,-73.8256502768606,-73.8256488573534,-73.8256444449582,-73.8256399943715,-73.8256362624828,-73.8256295948857,-73.8256229676827,-73.8256237442202,-73.8256296931207,-73.8256341640133,-73.8256371575604,-73.8256386940635,-73.825637276756,-73.8256328637051,-73.8256284622381,-73.8256270730815,-73.8256256839265,-73.8256227798892,-73.8256183878054,-73.8256125177162,-73.825611080104,-73.8256140939551,-73.8256141725444,-73.8256112968805,-73.8256084203393,-73.8256055250289,-73.8256011336052,-73.8255952635191,-73.8255893940945,-73.8255835347142,-73.8255806684352,-73.8255822330974,-73.8255852375621,-73.8255867941547,-73.8255898470816,-73.8255958160593,-73.8256002869468,-73.8256033001397,-73.8256033796074,-73.8256004842997,-73.825597569346,-73.8255946633362,-73.8255932741842,-73.825593392726,-73.8255935110479,-73.8255921227814,-73.8255892368575,-73.8255863609793,-73.825583465674,-73.8255835054071,-73.8255865192577,-73.8255865987267,-73.825583712808,-73.8255823236579,-73.8255838905158,-73.8255868949745,-73.8255884292814,-73.8255899664455,-73.8255929796333,-73.8255945558704,-73.8255946556424,-73.8255932361443,-73.8255903220728,-73.8255859284641,-73.8255800605911,-73.8255741902973,-73.8255683195658,-73.8255639274927,-73.825561013426,-73.8255580971596,-73.8255551897894,-73.8255537912607,-73.8255538955342,-73.8255554523469,-73.8255584519187,-73.8255614467751,-73.8255644405352,-73.8255674340727,-73.8255704289285,-73.8255748998067,-73.8255808473678,-73.8255838609898,-73.8255839404588,-73.8255825231574,-73.8255796171595,-73.8255782280118,-73.8255768401846,-73.8255724374134,-73.8255665282733,-73.8255621362047,-73.825559260994,-73.8255563650395,-73.825553450972,-73.8255505360267,-73.8255476197657,-73.8255447043811,-73.8255403129771,-73.825534442914,-73.8255330046507,-73.825535999508,-73.8255389932629,-73.8255420068845,-73.825545039497,-73.8255480548764,-73.8255510484136,-73.8255540412899,-73.8255570348237,-73.8255600290172,-73.8255630234298,-73.8255660270091,-73.8255675925411,-73.8255662047173,-73.8255633188055,-73.8255604431594,-73.8255575478626,-73.8255546322623,-73.8255517182005,-73.82554880326,-73.8255458878784,-73.8255429729379,-73.8255400676029,-73.8255386784573,-73.8255402446542,-73.825543268537,-73.825543347349,-73.8255404520548,-73.8255375364579,-73.8255346215177,-73.825533202906,-73.8255332823752,-73.825534818879,-73.8255378130707,-73.8255408074792,-73.8255438155286,-73.8255453953547,-73.8255455326709,-73.8255456728448,-73.8255472526776,-73.825550260721,-73.8255517972185,-73.8255518766906,-73.8255489814007,-73.8255431113511,-73.8255387199577,-73.8255358246688,-73.8255329481516,-73.8255300528633,-73.8255315705937,-73.8255375172539,-73.8255405317514,-73.8255376364632,-73.8255317670759,-73.8255288717884,-73.825528949722,-73.8255275324298,-73.825524617716,-73.8255246567927,-73.8255276503212,-73.8255306438477,-73.8255336576836,-73.825533737154,-73.8255308418673,-73.8255279269358,-73.8255250115618,-73.8255206192938,-73.8255147492501,-73.8255133118728,-73.8255163241668,-73.8255164036427,-73.8255135177446,-73.825512129924,-73.8255122384341,-73.8255123467155,-73.8255109678468,-73.8255080725635,-73.8255036805173,-73.8254978312275,-73.8254949743666,-73.825495072609,-73.8254951520837,-73.8254937341362,-73.8254908279335,-73.8254894409962,-73.8254910063137,-73.8254940161374,-73.8254955736048,-73.825495677883,-73.8254942793666,-73.825491381399,-73.8254899916048,-73.8254901005553,-73.8254901894112,-73.8254887708052,-73.8254858661457,-73.8254844770118,-73.8254830900801,-73.8254802041868,-73.8254788244406,-73.8254789226856,-73.8254775054003,-73.8254745913538,-73.8254716751093,-73.8254687695739,-73.8254673813182,-73.8254674902738,-73.8254675791313,-73.8254691158483,-73.8254721093696,-73.8254736452054,-73.8254722277027,-73.8254693217291,-73.825467932596,-73.8254665450081,-73.8254636401288,-73.8254607247662,-73.8254578294953,-73.8254549529927,-73.8254520583794,-73.8254491434573,-73.8254462481853,-73.8254463263439,-73.8254493602617,-73.8254494384203,-73.8254465431472,-73.8254436291072,-73.825440733839,-73.8254408111189,-73.8254438316438,-73.8254453882308,-73.8254454933943,-73.825447049319,-73.8254500497522,-73.8254500894893,-73.8254471739116,-73.8254442598734,-73.8254413449542,-73.8254384287177,-73.82543401726,-73.8254296042653,-73.8254266902294,-73.8254237753112,-73.8254238137303,-73.8254268179529,-73.8254283828245,-73.8254299509976,-73.8254329547766,-73.825435947632,-73.8254389621143,-73.8254390400536,-73.825436144128,-73.8254332300934,-73.8254303339473,-73.825427458329,-73.8254245643829,-73.8254216481467,-73.8254187334539,-73.8254158185383,-73.8254129031833,-73.8254114850274,-73.8254115841589,-73.8254117011791,-73.8254103042095,-73.8254073886371,-73.8254059707008,-73.8254060689533,-73.8254076451904,-73.8254106777836,-73.8254107572617,-73.8254078619989,-73.8254064447236,-73.8254065220058,-73.8254036267436,-73.8253977681068,-73.8253949018792,-73.8253964665351,-73.8253994709699,-73.8254010074652,-73.825402543963,-73.8254055381318,-73.8254070746293,-73.8254071527903,-73.8254057355143,-73.8254028206022,-73.8253999043759,-73.8253954929268,-73.8253910424025,-73.8253880480142,-73.8253850996224,-73.8253837011208,-73.8253838054084,-73.8253839052001,-73.8253839913744,-73.8253825719038,-73.8253796578744,-73.8253767429689,-73.8253738282802,-73.8253709120532,-73.8253679971483,-73.8253680377687,-73.8253710400068,-73.8253726068565,-73.8253741730479,-73.8253771960333,-73.8253772741965,-73.8253743789402,-73.8253714649127,-73.8253685493485,-73.8253656331244,-73.8253627400674,-73.8253598635827,-73.8253569871014,-73.825354111938,-73.8253512166855,-73.8253483020006,-73.825345387096,-73.8253454255206,-73.8253484393386,-73.8253514725893,-73.8253544957963,-73.8253560626458,-73.8253546735334,-73.8253517688931,-73.8253488526721,-73.8253459386479,-73.8253415466438,-73.8253356764382,-73.8253327811904,-73.8253313626022,-73.8253284680111,-73.8253285468356,-73.8253315800853,-73.825331658911,-73.8253287636611,-73.8253258481019,-73.8253229340803,-73.8253200191814,-73.8253171232716,-73.825314246797,-73.8253113658261,-73.8253099861029,-73.8253101180681,-73.8253087398866,-73.8253058479888,-73.8253044588777,-73.8253030697743,-73.8253001651381,-73.825297249584,-73.8252943355658,-73.8252899426901,-73.8252840742527,-73.825282636017,-73.8252856395675,-73.8252872051004,-73.8252858173191,-73.8252829126866,-73.8252799964732,-73.8252771012299,-73.8252742262987,-73.8252713310562,-73.8252709581696,-73.8252699115943,-73.8252700011332,-73.8252701096559,-73.8252687218764,-73.8252658159275,-73.8252628997162,-73.8252584896082,-73.8252511025757,-73.8252437358556,-73.8252408406159,-73.8252409201067,-73.8252395006491,-73.8252365966844,-73.8252352082417,-73.8252338191456,-73.8252309212189,-73.8252295236105,-73.8252296279145,-73.8252282294271,-73.825225340227,-73.8252224659637,-73.8252195691886,-73.8252181519293,-73.8252182307623,-73.8252168126257,-73.8252138972971,-73.8252124784986,-73.8252125573317,-73.8252111400751,-73.825208231888,-73.8252068320853,-73.8252069385883,-73.8252055401048,-73.8252026312547,-73.8251997165892,-73.825196821356,-73.8251939448974,-73.8251910570268,-73.8251896594229,-73.8251897637304,-73.8251883652475,-73.82518546398,-73.8251840646182,-73.8251841698055,-73.8251827726421,-73.8251798633556,-73.8251799031058,-73.8251829166961,-73.8251829961906,-73.8251801206161,-73.8251772441599,-73.8251743677069,-73.8251714925733,-73.8251685973448,-73.8251686370923,-73.8251716502452,-73.8251717297387,-73.825168834514,-73.8251659196322,-73.8251630150213,-73.8251616246079,-73.8251602377162,-73.8251573322253,-73.8251544169021,-73.825151501364,-73.8251500841117,-73.8251501723418,-73.8251502813165,-73.8251488922294,-73.8251459970046,-73.8251446087935,-73.8251447271596,-73.8251448444255,-73.8251434575404,-73.8251405513891,-73.8251405911362,-73.8251436049453,-73.8251451805291,-73.8251452788016,-73.8251438615497,-73.8251409663317,-73.825138090543,-73.8251351953226,-73.8251308011561,-73.8251249528519,-73.8251206006346,-73.8251177054144,-73.8251177429643,-73.8251207379987,-73.8251237314916,-73.8251267249839,-73.8251282621392,-73.8251283612904,-73.8251269829118,-73.8251241073487,-73.8251212309056,-73.8251183356896,-73.8251154201567,-73.8251125155546,-73.8251111264659,-73.8251112363303,-73.8251113236751,-73.8251099064298,-73.8251069917775,-73.8251040755901,-73.8251011609382,-73.8250982454074,-73.8250953501917,-73.8250954296932,-73.8250984622728,-73.8250985417741,-73.8250956465591,-73.8250927310308,-73.8250898358162,-73.8250869606972,-73.8250840654858,-73.8250841039147,-73.8250871083343,-73.8250886751887,-73.8250872861103,-73.8250843806292,-73.8250814653229,-73.8250785707679,-73.8250786496099,-73.8250816631964,-73.8250817016265,-73.8250787876382,-73.8250743956831,-73.8250685264222,-73.8250670882033,-73.8250700816898,-73.8250701207828,-73.8250672052566,-73.8250628146231,-73.8250569440408,-73.8250555064848,-73.8250585196272,-73.8250585991311,-73.8250557039217,-73.8250557436715,-73.8250587480922,-73.8250603127474,-73.8250589236731,-73.8250545229905,-73.8250486133218,-73.8250442213697,-73.8250413449372,-73.825038471367,-73.8250355949369,-73.8250326997329,-73.8250297848686,-73.8250268702243,-73.825025451448,-73.8250255403447,-73.8250256488909,-73.8250242598228,-73.8250213543479,-73.8250184390483,-73.8250155344576,-73.8250141467018,-73.8250142552547,-73.8250143441454,-73.8250129247112,-73.8250085131094,-73.8250041017251,-73.8250011877461,-73.8249982809605,-73.8249968932054,-73.8249955050183,-73.8249926004242,-73.8249882062863,-73.8249823580121,-73.8249780049463,-73.8249751097462,-73.8249721944493,-73.8249692789344,-73.8249663640794,-73.824963448783,-73.8249634885361,-73.824966482022,-73.8249680191768,-73.8249695556752,-73.8249725681553,-73.8249726476636,-73.8249682557242,-73.8249623467271,-73.82495793447,-73.8249535425295,-73.8249476936065,-73.8249433398805,-73.8249404446853,-73.8249375307124,-73.824934614541,-73.8249346542979,-73.8249376477812,-73.824939184279,-73.8249362890834,-73.8249304191825,-73.8249260279063,-73.8249231117361,-73.8249231528091,-73.8249261652926,-73.8249277415427,-73.8249278398341,-73.8249249446404,-73.8249190747434,-73.8249146834694,-73.8249117686183,-73.8249088533296,-73.8249059371614,-73.8249030231903,-73.8249001076824,-73.8248957157487,-73.824889845856,-73.8248884083081,-73.8248914221114,-73.8248929977072,-73.8248930959972,-73.8248931755119,-73.8248917582844,-73.824888842117,-73.8248859281478,-73.8248830126434,-73.8248800977955,-73.8248771825082,-73.8248742685418,-73.8248713523769,-73.8248713927923,-73.8248743869331,-73.8248744253713,-73.8248715105274,-73.8248685959007,-73.8248641829956,-73.8248597910687,-73.8248598697052,-73.8248628843823,-73.8248644200031,-73.8248615248149,-73.8248556564652,-73.8248512623464,-73.8248483483807,-73.8248454328753,-73.8248425283051,-73.8248411405663,-73.824839751735,-73.8248368456183,-73.8248354283962,-73.8248340111744,-73.8248310950124,-73.8248281801707,-73.8248252648902,-73.8248223507071,-73.8248194354252,-73.824816520583,-73.8248136059638,-73.8248136450654,-73.8248166586412,-73.8248167368409,-73.8248138416609,-73.8248109277006,-73.8248080128596,-73.8248050967,-73.824802201521,-73.8247993266619,-73.8247964314821,-73.8247935153235,-73.824790600487,-73.8247906411247,-73.824793634602,-73.8247951704439,-73.8247937532242,-73.8247908377271,-73.8247879215713,-73.8247850076118,-73.8247806156955,-73.8247747464771,-73.8247703545615,-73.8247674593889,-73.8247645836517,-73.8247601917371,-73.8247557989435,-73.8247529234302,-73.8247500273741,-73.8247486094992,-73.824748709341,-73.8247473296879,-73.8247444345138,-73.8247415196818,-73.8247386238487,-73.8247372463962,-73.8247358473016,-73.8247329521301,-73.8247300764007,-73.8247256844908,-73.8247212925795,-73.8247213721042,-73.8247244053447,-73.8247244842086,-73.8247215888178,-73.8247186735473,-73.8247157573981,-73.8247128434453,-73.8247099279558,-73.8247070140051,-73.8247040991738,-73.8247041376165,-73.8247071514167,-73.8247072309407,-73.8247043357717,-73.8247014202834,-73.8246985114977,-73.824697113947,-73.8246972182945,-73.8246958198668,-73.8246929126162,-73.8246899977871,-73.824687081641,-73.824684166374,-73.8246812712076,-73.8246783961417,-73.8246740035829,-73.8246695989391,-73.8246682011715,-73.8246683055233,-73.8246698614661,-73.8246743188353,-73.8246787802138,-73.8246803470853,-73.8246789580519,-73.8246760534936,-73.824673138669,-73.8246702240639,-73.8246673079192,-73.8246643930952,-73.824662975886,-73.8246630540957,-73.8246645899378,-73.8246675847293,-73.8246676231717,-73.8246647092291,-73.8246603173281,-73.8246544472612,-73.8246500562418,-73.8246471407599,-73.8246471798637,-73.8246501733364,-73.8246502131009,-73.8246473179401,-73.8246444415656,-73.8246415470649,-73.8246415861688,-73.8246445878864,-73.8246461431684,-73.8246462475219,-73.8246448504174,-73.8246404451192,-73.8246360396074,-73.8246346420653,-73.8246347464185,-73.8246333479963,-73.8246304385564,-73.8246260479817,-73.8246201774793,-73.8246187392927,-73.8246217343037,-73.8246232708036,-73.8246233503333,-73.8246248861766,-73.8246278796463,-73.8246279194132,-73.8246250045936,-73.824620612044,-73.8246147024336,-73.8246102316712,-73.8246072779683,-73.8246043618325,-73.8246014478933,-73.8246014876581,-73.8246044918439,-73.8246060573974,-73.8246076236159,-73.824610626475,-73.8246106662396,-73.8246077514218,-73.8246048361646,-73.8246019213504,-73.8246005028274,-73.8245990847472,-73.824596178885,-73.8245947920565,-73.8245934030332,-73.8245905179303,-73.8245876431027,-73.8245847573451,-73.8245833689793,-73.8245834773499,-73.824583576547,-73.8245836842551,-73.8245822952349,-73.8245794094733,-73.8245765353064,-73.8245736401598,-73.8245707240266,-73.8245678092138,-73.8245644027073,-73.8245585140908,-73.8245506359474,-73.8245447674367,-73.824542894572,-73.8245429935543,-73.8245415756988,-73.824538660888,-73.8245372423717,-73.8245373355587,-73.8245374593392,-73.82453759677,-73.8245377348576,-73.8245363610295,-73.8245334622863,-73.8245305461602,-73.8245276510163,-73.8245277305525,-73.8245322010869,-73.8245381100186,-73.8245425823113,-73.8245456148823,-73.8245485895624,-73.8245515034903,-73.8245559148102,-73.8245603734814,-73.8245619296436,-73.8245620340057,-73.8245606355933,-73.8245577277039,-73.8245548137781,-73.8245518983112,-73.8245482454116,-73.8245416162917,-73.8245350103545,-73.8245343493786,-73.8245373819531,-73.8245374614881,-73.8245345860123,-73.8245346646712,-73.8245376987806,-73.824539274389,-73.8245393727093,-73.8245379546353,-73.8245350393905,-73.8245350791606,-73.8245380929449,-73.8245411261748,-73.8245441500131,-73.8245457153432,-73.8245472809006,-73.824550187017,-73.8245481424681,-73.8245603885232,-73.8245725318647,-73.8245886872786,-73.8245895226165,-73.8246048422389,-73.8246055819769,-73.8246331418061,-73.8246527352,-73.8247072966206,-73.8247219167293,-73.8247226175067,-73.8247390191883,-73.8247571767429,-73.8247620512668,-73.8247701757711,-73.8247783000542,-73.8247854420489,-73.8247928266992,-73.8248007054648,-73.8248065933972,-73.8248100005544,-73.8248144120822,-73.824820320993,-73.8248247329606,-73.8248276477679,-73.8248305623555,-73.82483347716,-73.8248363932867,-73.8248393072156,-73.8248422226813,-73.8248451366093,-73.8248495494603,-73.8248554583703,-73.8248613670604,-73.8248672759735,-73.8248717272604,-73.8248747200419,-73.8248777148046,-73.8248807084648,-73.8248837019096,-73.8248866968916,-73.8248896505766,-73.824892564504,-73.8248954806326,-73.8248983961034,-73.8249012912542,-73.8249013873501,-73.8249041654294,-73.8249070605806,-73.8249099767106,-73.8249128919616,-73.8249172831757,-73.8249231914275,-73.8249291400965,-73.8249350302291,-73.8249393823488,-73.824942277504,-73.8249466693791,-73.824952538537,-73.824957916443,-73.824965283643,-73.8249751309523,-73.8249825372467,-73.8249865138577,-73.8249894690845,-73.8249923843374,-73.8249952991523,-73.8249982130866,-73.82500112856,-73.8250055204394,-73.8250113896006,-73.8250157827983,-73.8250169789495,-73.8250337670428,-73.8250356469556,-73.8250393787092,-73.8250423714885,-73.8250468428694,-73.8250542485044,-73.8250621285947,-73.8250695141345,-73.8250773926893,-73.825083321258,-73.8250868059515,-73.82508979939,-73.8250927943638,-73.8250957480523,-73.8251001399352,-73.8251060488483,-73.825110520229,-73.8251135143229,-73.8251150507917,-73.8251151492814,-73.8251167246196,-73.8251196992777,-73.8251226140963,-73.8251255092606,-73.8251283849892,-73.8251312801528,-73.825134195412,-73.8251371102318,-73.825140024171,-73.8251444363704,-73.8251503459431,-73.8251547581398,-73.8251576720797,-73.8251605873403,-73.8251635021584,-73.8251679143558,-73.8251753003359,-73.82518270685,-73.8251886539703,-73.8251945628884,-73.8251989547736,-73.8252033669718,-73.8252092756674,-73.8252136878658,-73.8252180784317,-73.8252239873493,-73.8252284600448,-73.8252329106706,-73.8252395592168,-73.8252476821901,-73.8252543110839,-73.8252594406253,-73.8252653111152,-73.8252697030035,-73.825272617829,-73.8252755333123,-73.8252784485765,-73.8252818566377,-73.8252877461229,-73.8252956226999,-73.8253015128449,-73.8253049187077,-73.8253093309093,-73.8253152398283,-73.8253196902305,-73.8253226852025,-73.8253256388913,-73.8253285550368,-73.8253314502137,-73.8253343257401,-73.8253372209166,-73.8253401357424,-73.8253430503517,-73.8253459651823,-73.8253503780451,-73.8253562860839,-73.8253607373716,-73.8253637314596,-73.8253667351579,-73.8253683013054,-73.825369865918,-73.8253743272443,-73.8253802368234,-73.8253846490245,-73.8253875629754,-73.8253904688607,-73.8253918566214,-73.8253932457038,-73.8253961502652,-73.825399065759,-73.8254019797097,-73.8254063729261,-73.8254122811853,-73.8254167518995,-73.8254197562522,-73.8254213221775,-73.8254243656103,-73.8254302839121,-73.8254317221186,-73.8254287286911,-73.8254286880733,-73.8254316029057,-73.8254345190558,-73.8254374330076,-73.8254388502468,-73.82544174609,-73.8254476159298,-73.8254505111143,-73.825453406521,-73.8254592763631,-73.825463668265,-73.8254695562181,-73.8254769040086,-73.8254812555109,-73.8254856496094,-73.8254900602793,-73.825492975776,-73.8254958910521,-73.8254958513162,-73.8254928572276,-73.825489863798,-73.825486869492,-73.8254868306351,-73.8254912426218,-73.8254956939111,-73.825498687997,-73.825501641692,-73.8255045565274,-73.8255074711451,-73.8255103873002,-73.825513302136,-73.8255132624009,-73.825510267434,-73.8255087331833,-73.825510150427,-73.8255145626383,-73.8255204700244,-73.8255249407393,-73.8255294518482,-73.825535380861,-73.8255397729864,-73.8255441849779,-73.8255486362659,-73.8255516303521,-73.8255560816366,-73.8255627295344,-73.8255708531817,-73.8255775205066,-73.825579795266,-73.8255798935001,-73.825581469017,-73.8255844436759,-73.8255873576365,-73.8255917705069,-73.8255976794311,-73.8256020916427,-73.8256050069242,-73.8256079021159,-73.8256107772247,-73.8256136717591,-73.8256165879194,-73.8256195018821,-73.8256224180399,-73.8256253320029,-73.8256282475047,-73.8256311614663,-73.825634077628,-73.8256369929093,-73.825636951859,-73.8256339396674,-73.825630906291,-73.825627893438,-73.8256248991313,-73.8256224809602,-73.8256219043879,-73.8256174336743,-73.8256100280329,-73.8256040996741,-73.8256025638912,-73.8256024844238,-73.8256039029919,-73.8256068178368,-73.8256104720903,-73.8256170999098,-73.8256237665817,-73.8256274983233,-73.8256304917485,-73.8256349631222,-73.8256423687661,-73.8256497547642,-73.82565416764,-73.8256570824865,-73.8256614925053,-73.8256659053802,-73.8256702988328,-73.8256761664933,-73.8256805599438,-73.8256834739111,-73.8256863900768,-73.8256893437737,-73.8256908795571,-73.8256909590161,-73.8256939727436,-73.8256970158313,-73.8257218269682,-73.8257189663486,-73.8257159735841,-73.8257159331957,-73.8257188491429,-73.8257217639911,-73.8257261753279,-73.8257320829428,-73.8257365355495,-73.8257410062616,-73.8257469158513,-73.8257483540716,-73.8257453597689,-73.825742365684,-73.8257393526192,-73.8257392731604,-73.8257436652989,-73.8257510519588,-73.8257535705426,-73.8257584178762,-73.8257642877435,-73.8257701953569,-73.8257746667285,-73.8257776608125,-73.8257813940881,-73.8257880598821,-73.8257947287505,-73.8257984598273,-73.8258014034871,-73.8258027932562,-73.8258041817155,-73.8258070863041,-73.8258107414487,-73.8258173675153,-73.8258240357253,-73.8258277674611,-73.8258307811846,-73.8258323906552,-73.8258338134529,-73.8258368287145,-73.8258398214775,-73.825842814898,-73.8258472869243,-73.8258531951989,-73.8258560904099,-73.825857508331,-73.8258619198938,-73.8258663718396,-73.8258693652611,-73.8258723586806,-73.8258753536389,-73.8258798040453,-73.8258842559933,-73.8258879897042,-73.825894655053,-73.8259012841959,-73.8259034395552,-73.8259048577013,-73.8259092683855,-73.825915179515,-73.8259225648572,-73.8259299307783,-73.8259348168158,-73.8259407047878,-73.8259485835856,-73.8259559695879,-73.8259623691185,-73.8259668217234,-73.8259698151402,-73.8259727703753,-73.8259771614208,-73.8259830315138,-73.8259874234404,-73.8259925752982,-73.8260006989571,-73.8260073281038,-73.8260109801761,-73.826015392403,-73.826021794791,-73.8260291794742,-73.8260370582757,-73.8260429482288,-73.8260463543462,-73.8260492683259,-73.8260536624542,-73.826059530793,-73.8260639236015,-73.8260683336309,-73.8260727855736,-73.8260757789906,-73.8260787348863,-73.8260831261567,-73.8260889960357,-73.8260948659132,-73.8261007748507,-73.8261059851879,-73.8261126503154,-73.8261192810065,-73.8261229317662,-73.8261258472882,-73.8261287612731,-73.8261316774545,-73.8261360693886,-73.826141978324,-73.8261464496854,-73.826149442438,-73.8261524371674,-73.8261553910883,-73.8261590462456,-73.8261656732016,-73.8261737975204,-73.8261819225018,-73.8261892884317,-73.8261951585339,-73.8262010262182,-73.8262054196939,-73.8262083336802,-73.8262119888419,-73.8262186157985,-73.826226742319,-73.8262333880325,-73.8262378002648,-73.8262421922033,-73.8262480614294,-73.8262524533673,-73.8262553673577,-73.8262582835444,-73.826262695781,-73.8262686031799,-73.8262730551247,-73.8262775258224,-73.8262834144685,-73.8262877680145,-73.8262921608368,-73.8262966127786,-73.8263003451614,-73.8263070111733,-73.82631364011,-73.8263172930783,-73.8263202079474,-73.8263245992323,-73.8263319651662,-73.8263393527136,-73.826343764073,-73.8263466802636,-73.8263495951372,-73.8263532494231,-73.8263598750684,-73.8263665445938,-73.8263702763185,-73.826374727382,-73.8263806356617,-73.8263865446007,-73.8263924535429,-73.8263969039465,-73.8264006378651,-73.8264073036566,-73.8264139134045,-73.8264160299684,-73.8264174276263,-73.8264218392047,-73.8264262911472,-73.8264297786715,-73.8264357063632,-73.8264435851694,-73.8264494738202,-73.8264536209075,-73.8264602472115,-73.8264669145407,-73.8264706462624,-73.8264736396658,-73.8264781116787,-73.8264840596628,-73.8264885303559,-73.8264929814191,-73.8264974326989,-73.8265004261009,-73.8265033813395,-73.8265062966591,-73.8265092505791,-73.8265122439825,-73.8265152480812,-73.8265168128278,-73.8265198575081,-73.8265272725187,-73.8265346585308,-73.8265391098085,-73.8265421038679,-73.8265451168983,-73.8265481493421,-73.8265511239885,-73.8265555159361,-73.8265614261943,-73.8265658962223,-73.8265688505819,-73.8265717654587,-73.8265776547681,-73.8265850612836,-73.8265895317535,-73.8265925441228,-73.8265955794189,-73.8265985518666,-73.8266029453539,-73.8266088540711,-73.8266133247577,-73.8266162583888,-73.8266191348889,-73.8266220301411,-73.8266249447998,-73.8266278596817,-73.8266307758826,-73.8266351865846,-73.82663963852,-73.8266426319181,-73.8266470838546,-73.826651534254,-73.8266545291885,-73.8266575413321,-73.8266605759645,-73.8266635484138,-73.8266672049081,-73.8266738305531,-73.8266804994098,-73.8266842295818,-73.8266871848203,-73.826691576772,-73.8266989427116,-73.826707069233,-73.8267151922329,-73.8267218211777,-73.8267254743769,-73.8267306253716,-73.8267387499135,-73.8267454172342,-73.8267491480636,-73.8267521423352,-73.8267551350665,-73.8267595876627,-73.8267654957193,-73.8267714046551,-73.8267758559308,-73.8267803279318,-73.8267862362079,-73.8267906275034,-73.8267957806979,-73.8268039030412,-73.8268105718969,-73.8268143033847,-73.8268172573029,-73.8268206660838,-73.8268265562747,-73.8268344328809,-73.8268403027839,-73.826843670558,-73.8268480625174,-73.8268525135711,-73.8268560010746,-73.8268619296378,-73.8268698075621,-73.8268757361262,-73.8268806985008,-73.8268866083161,-73.8268895013835,-73.8268909208969,-73.8268953331403,-73.8268997438454,-73.8269041371271,-73.8269100460641,-73.826914516082,-73.8269175110076,-73.8269205043949,-73.8269234594141,-73.8269278515943,-73.8269337206263,-73.8269381128089,-73.8269410268208,-73.8269439421519,-73.8269468583639,-73.8269497732554,-73.8269527262955,-73.8269557210024,-73.8269587146101,-73.826961707996,-73.8269646638947,-73.8269690551951,-73.8269749251087,-73.8269778203797,-73.8269807156508,-73.8269866245893,-73.8269910952638,-73.8269955456598,-73.827001454598,-73.8270058675039,-73.8270102588101,-73.8270161287247,-73.8270175669884,-73.8270145539796,-73.8270144746112,-73.8270188665769,-73.8270247755166,-73.8270292267912,-73.8270322195163,-73.8270352351625,-73.8270382669105,-73.827041280579,-73.8270442739612,-73.8270472876262,-73.8270503206963,-73.8270532759345,-73.8270561515859,-73.827059046861,-73.8270619617583,-73.8270648770937,-73.8270677919902,-73.8270707066685,-73.8270736215649,-73.8270765377821,-73.8270794518014,-73.8270823673596,-73.8270852813775,-73.8270882372763,-73.8270919696325,-73.8270986356335,-73.8271052645891,-73.8271089162649,-73.8271118122007,-73.827114687419,-73.8271190815891,-73.8271249889915,-73.827130897934,-73.8271368068766,-73.8271427158206,-73.8271486245422,-73.827153036134,-73.8271559516937,-73.8271603646046,-73.8271662735494,-73.8271706842608,-73.8271735982844,-73.8271765145062,-73.8271801697013,-73.8271867960234,-73.8271934249831,-73.8271985539522,-73.8272044635571,-73.8272089342306,-73.8272119276104,-73.8272149225277,-73.8272193729216,-73.8272252818651,-73.8272296832104,-73.8272310724342,-73.8272324616621,-73.8272353663165,-73.8272382803415,-73.8272412355856,-73.827244230284,-73.8272472238834,-73.8272502172624,-73.827253170966,-73.8272560865304,-73.8272584032311,-73.8272969659224,-73.8273058121028,-73.8273404423355,-73.8274785256435,-73.8274784952578,-73.8274804080428,-73.8274862969369,-73.8274941735559,-73.8275000635495,-73.8275049476749,-73.8275108176154,-73.827515209604,-73.8275181243019,-73.8275225171702,-73.8275283855735,-73.8275335187384,-73.8275401444114,-73.8275468130516,-73.8275505434237,-73.8275534783944,-73.8275563549642,-73.827559250269,-73.8275621658482,-73.8275665765755,-73.8275724855266,-73.8275768984511,-73.8275798124911,-73.8275842247563,-73.8275886354814,-73.8275930296744,-73.8275989386265,-73.8276039025288,-73.8276098317527,-73.827617708377,-73.8276235985942,-73.8276284818483,-73.8276343517948,-73.8276394840859,-73.8276461097644,-73.8276527200104,-73.827656331388,-73.8276607255825,-73.8276673735118,-73.8276754971979,-73.8276821261752,-73.8276857785378,-73.8276901901472,-73.827694642079,-73.827697635448,-73.8277006288164,-73.8277036228428,-73.8277065774317,-73.8277094914784,-73.827712407062,-73.8277153224267,-73.8277182373532,-73.8277211535968,-73.8277240676432,-73.8277284589848,-73.8277343289383,-73.827739462113,-73.827746089115,-73.8277542141208,-73.827759401512,-73.8277638741515,-73.8277697831064,-73.8277741751067,-73.8277770900371,-73.8277807452615,-73.8277873722648,-73.8277940005869,-73.8277976522952,-73.8278005678849,-73.8278049612074,-73.8278108695043,-73.8278153401648,-73.8278183335293,-73.8278197101842,-73.8278316744245,-73.8278728518636,-73.8279621858741,-73.8279621758346,-73.8279650711678,-73.8279679874235,-73.8279723981641,-73.8279783071287,-73.8279827191882,-73.8279856341245,-73.8279885488444,-73.8279914637842,-73.8279943800413,-73.8279980343981,-73.8280046600955,-73.8280112899668,-73.8280164203002,-73.8280222693475,-73.8280266223738,-73.8280310152717,-73.8280369242345,-73.82804283298,-73.828048740624,-73.8280531529064,-73.8280568081469,-73.8280634349449,-73.8280701024918,-73.828073834171,-73.8280767878845,-73.8280804431245,-73.8280870701428,-73.8280936884602,-73.8280958160736,-73.828097203835,-73.8281001091899,-73.8281030241366,-73.8281089128392,-73.8281162601137,-73.8281206124881,-73.8281235078304,-73.8281264234354,-73.8281293396995,-73.8281337317244,-73.8281396398115,-73.8281441104696,-73.8281470650652,-73.8281499804512,-73.8281528953962,-73.8281528557524,-73.8281498630483,-73.8281483267232,-73.8281497441095,-73.8281541563974,-73.8281600653653,-73.8281644774347,-73.8281678865027,-73.8281737752097,-73.8281816540542,-73.8281875421021,-73.8281909494095,-73.8281938643599,-73.8281967790878,-73.8281996940399,-73.8282026081103,-73.8282055243804,-73.8282088324507,-73.8282283390207,-73.8282981176921,-73.8283332431995,-73.8283533153426,-73.8283535034912,-73.8283534054902,-73.8283548235516,-73.828357739171,-73.8283611473684,-73.8283670360878,-73.8283749149444,-73.8283808043219,-73.8283856876267,-73.8283915375862,-73.8283958913073,-73.82839878667,-73.8284024406113,-73.8284090676513,-73.8284156968927,-73.8284193490763,-73.8284222653586,-73.828425180321,-73.8284280950632,-73.8284324871083,-73.8284383947695,-73.8284428674075,-73.8284458213492,-73.8284502133919,-73.8284575807338,-73.828465460258,-73.8284728458798,-73.8284807238611,-73.8284881094841,-73.8284930720612,-73.8284975823543,-73.828503512029,-73.8285093807161,-73.8285152500642,-73.8285196421093,-73.8285240544142,-73.8285307030348,-73.8285388267596,-73.828545456003,-73.8285491084122,-73.8285520225014,-73.8285549394467,-73.8285578541957,-73.8285622462445,-73.8285696122699,-73.8285784758536,-73.8285858231668,-73.8285901755832,-73.8285930709595,-73.8285944896919,-73.8285944113076,-73.8285973066814,-73.8286031766942,-73.8286075680872,-73.8286134568175,-73.8286208228495,-73.8286252155634,-73.8286296272123,-73.8286340978676,-73.8286371330492,-73.8286416037026,-73.828646054102,-73.8286495415761,-73.8286554705943,-73.8286633481402,-73.8286692275149,-73.8286711081201,-73.8286724965879,-73.8286754022026,-73.8286783176152,-73.8286812325902,-73.8286841480049,-73.8286870623178,-73.8286914543758,-73.8286973640223,-73.8287003776267,-73.8287004755997,-73.8287005938236,-73.8287006917949,-73.8287022280981,-73.8287052214515,-73.8287082141422,-73.8287111700625,-73.8287140841574,-73.8287169997902,-73.8287213918478,-73.8287273008343,-73.8287332494455,-73.8287391582121,-73.8287435511465,-73.8287464659046,-73.8287493808801,-73.8287522949763,-73.8287552112723,-73.8287596235831,-73.8287655310291,-73.8287699829677,-73.8287729763164,-73.828775912643,-73.8287787873374,-73.8287816827228,-73.8287845968221,-73.8287875131181,-73.82878747349,-73.8287844741252,-73.8287829175735,-73.8287828135916,-73.8287827149688,-73.8287826296963,-73.828781094053,-73.828778079792,-73.8287780011986,-73.8287808972454,-73.8287838122273,-73.8287867263274,-73.8287896426243,-73.8287925380126,-73.8287924587638,-73.8287894458181,-73.8287864518073,-73.828783458454,-73.828781921274,-73.8287818435616,-73.8287832609871,-73.8287876733042,-73.8287935822997,-73.8287980340206,-73.8288010275919,-73.8288039617276,-73.8288068370842,-73.8288097337934,-73.8288141267387,-73.8288200357318,-73.8288245063871,-73.8288274997398,-73.8288304930923,-73.828833487983,-73.8288364813339,-73.8288394350605,-73.8288423498231,-73.8288452587904,-73.828846657507,-73.8288466059497,-73.8288465535336,-73.8288449976417,-73.8288419773576,-73.8288418989896,-73.8288447943827,-73.8288477084877,-73.8288506038815,-73.8288505246362,-73.8288475123506,-73.8288474736048,-73.8288503877133,-73.8288533033577,-73.8288562174654,-73.8288598740699,-73.8288664998206,-73.828873129751,-73.8288767821801,-73.8288796962886,-73.8288833515756,-73.828889977769,-73.8288966063777,-73.8289009999891,-73.8289076270622,-73.8289081818688,-73.828908771859,-73.8289265588112,-73.8290860263269,-73.8291063065326,-73.8291097786095,-73.8291210559476,-73.8291439878254,-73.8291823457371,-73.8291894336934,-73.8292200263091,-73.8292341581231,-73.8292465538702,-73.8293055134835,-73.8293014613507,-73.8292969906647,-73.8292969114506,-73.8292998068951,-73.8293027210449,-73.8293056373947,-73.8293055977879,-73.8293025848333,-73.8293025056182,-73.8293053817006,-73.8293082569028,-73.8293111523504,-73.8293140687004,-73.8293169837329,-73.8293198978846,-73.8293227939929,-73.8293256707344,-73.8293285661839,-73.8293314812177,-73.829334395371,-73.8293358150388,-73.8293372318498,-73.8293401473224,-73.8293445403376,-73.8293504104511,-73.8293518472877,-73.8293488336745,-73.8293487553416,-73.8293516507937,-73.8293545671483,-73.8293574813035,-73.829360396998,-73.8293632924509,-73.8293661683194,-73.8293690637732,-73.8293719788092,-73.8293748742633,-73.8293777503531,-73.8293806364564,-73.8293820243338,-73.8293834130944,-73.8293863049759,-73.8293876792618,-73.8293875402023,-73.829387402683,-73.8293887769761,-73.8293916782075,-73.829394592369,-73.8293975080661,-73.8293974691205,-73.829394467539,-73.8293929125432,-73.8293928086133,-73.8293942065076,-73.8293971155313,-73.8294000310115,-73.829402946052,-73.8294029064484,-73.8293999130765,-73.8293983767842,-73.8293982975736,-73.8293982190224,-73.8293981398134,-73.8293966048396,-73.8293935972403,-73.8293920222242,-73.8293918904948,-73.8293932705641,-73.8293961720389,-73.8293961333129,-73.8293931290486,-73.829391563818,-73.829389998153,-73.8293869787629,-73.8293853992815,-73.8293852624197,-73.8293851227016,-73.8293835438845,-73.8293805226938,-73.829378946574,-73.8293788159422,-73.8293772407028,-73.8293742264209,-73.8293726698822,-73.8293725659529,-73.8293710109525,-73.8293679906529,-73.8293649561283,-73.8293619338135,-73.8293603681387,-73.8293602606542,-73.8293601720836,-73.8293586344697,-73.8293556323967,-73.8293540658416,-73.8293524999513,-73.8293494845292,-73.8293479084048,-73.8293477784305,-73.8293462016461,-73.8293431882382,-73.8293416316953,-73.8293415277617,-73.8293399727587,-73.8293369724783,-73.8293339784333,-73.8293309748178,-73.8293294091389,-73.8293278432438,-73.8293248336135,-73.8293232772886,-73.8293231724727,-73.8293216168093,-73.8293186058546,-73.8293170406148,-73.8293154749382,-73.8293124646451,-73.8293109087576,-73.8293108048216,-73.8293107068995,-73.8293106016403,-73.8293119795112,-73.8293148562714,-73.8293147770561,-73.8293117634233,-73.8293102271195,-73.8293101492202,-73.8293086137997,-73.8293055992825,-73.8293025662854,-73.8292995339457,-73.8292979589126,-73.8292978594493,-73.8292977815502,-73.8292977023323,-73.8292961660286,-73.8292931659627,-73.8292916109516,-73.8292915048182,-73.8292899498063,-73.8292869495158,-73.8292854125498,-73.8292853239805,-73.8292852167012,-73.8292836507992,-73.8292806378217,-73.8292790721346,-73.8292775062336,-73.8292744825771,-73.8292714495722,-73.8292684359322,-73.8292654425366,-73.8292624288947,-73.8292608536365,-73.8292607361261,-73.8292606181732,-73.8292605202481,-73.8292589837187,-73.8292559890026,-73.8292544526912,-73.8292543741312,-73.8292557938083,-73.829258689278,-73.8292571333852,-73.8292511646338,-73.8292481516465,-73.8292480724252,-73.8292450596602,-73.8292391498848,-73.8292340193763,-73.829227391507,-73.8292207253463,-73.8292169920705,-73.8292139973484,-73.8292110039479,-73.8292079903029,-73.8292049579478,-73.8292019436395,-73.8291989508988,-73.8291959574942,-73.829194421183,-73.8291943419579,-73.8291928056434,-73.8291898013505,-73.8291882360951,-73.8291851930666,-73.8291792349766,-73.8291747635776,-73.8291717708332,-73.8291687765483,-73.8291657824816,-73.8291627890784,-73.8291597754271,-73.8291552644113,-73.8291492969665,-73.8291448255663,-73.8291418119137,-73.8291387795493,-73.8291357665584,-73.8291342289195,-73.8291356485926,-73.829138602385,-73.8291415957934,-73.8291445324165,-73.8291429758514,-73.8291370077436,-73.8291339940895,-73.8291324577702,-73.8291294441155,-73.8291264110926,-73.8291233974371,-73.8291204040256,-73.8291174097391,-73.8291144156708,-73.8291114120301,-73.8291098469846,-73.8291082804059,-73.8291052682859,-73.8291037023605,-73.8291021370986,-73.8290991140851,-73.8290960797379,-73.8290926698372,-73.8290924411716,-73.829048459001,-73.8290449821116,-73.8290496056455,-73.8290397267007,-73.8290142126814,-73.8289954501667,-73.8289801914146,-73.8289680157719,-73.8289740527622,-73.8289660668797,-73.8289389148961,-73.828915566839,-73.8288448011006,-73.8288294223722,-73.8287779862699,-73.8286950744417,-73.8286084613784,-73.8285494693337,-73.828494748762,-73.8284358082812,-73.8283925013183,-73.8283913029705,-73.8283293909265,-73.8283081930532,-73.8282924095787,-73.8282479678496,-73.8282411744699,-73.8282064454813,-73.8281533300299,-73.8281433662934,-73.8280993822918,-73.8280900020959,-73.8280683036307,-73.82802509067,-73.8280178539586,-73.827938901072,-73.8278575100962,-73.8278564569545,-73.8278210716311,-73.8277698430138,-73.8277179763238,-73.82767895588,-73.8276694443778,-73.8276592054215,-73.8275873922223,-73.8276178807309,-73.8276408108247,-73.8276516486183,-73.8276529274154,-73.8276552485459,-73.8276193015333,-73.8274715456467,-73.8274402162694,-73.8274326145074,-73.8273983018031,-73.8273635731324,-73.8273445617149,-73.8273408332956,-73.8273344052269,-73.8273340139081,-73.8273086310885,-73.8272752795539,-73.8272452273046,-73.8272030343498,-73.827146411986,-73.8271425962414,-73.8271152865144,-73.8270796938176,-73.8271179987205,-73.8271082023202,-73.8271121216493,-73.8271165147108,-73.8271194288752,-73.8271238226015,-73.8271296906109,-73.8271355614815,-73.8271414316917,-73.8271472999239,-73.8271531701348,-73.827154608476,-73.8271516149453,-73.8271500682509,-73.8271499601135,-73.8271498526351,-73.8271527378092,-73.8271601050066,-73.8271674900697,-73.8271718835775,-73.8271747589438,-73.8271791517942,-73.8271865377361,-73.8271938837761,-73.8271982378276,-73.8272011332515,-73.8272040474228,-73.8272069544229,-73.8272083428344,-73.8272097308126,-73.827212616867,-73.8272154935546,-73.8272183889869,-73.8272213031567,-73.8272242188674,-73.8272271330365,-73.8272300494069,-73.8272329648984,-73.8272358799504,-73.8272402714874,-73.8272461220885,-73.8272504754875,-73.8272533702601,-73.827257025644,-73.8272610084479,-73.8272834724584,-73.8272867965363,-73.8273119088273,-73.8273189106223,-73.8274379955486,-73.8274558897316,-73.8274874544982,-73.8275339946922,-73.8275357847701,-73.827564691917,-73.827587570103,-73.8276023197398,-73.8275977869096,-73.8275973563646,-73.8275995014461,-73.8276009188879,-73.8276008208182,-73.8276022007939,-73.8276050753462,-73.8276049982108,-73.8276019634466,-73.8276011348585,-73.8276049781909,-73.8275965163336,-73.8275883989785,-73.8275850716295,-73.8275725117443,-73.827556460513,-73.8275530957673,-73.8275405662261,-73.8275127469555,-73.8274383149552,-73.8273796830402,-73.8273446091173,-73.8273019254298],"lat":[40.609485389754,40.6094642210526,40.6094814194489,40.6094720058847,40.6094448782835,40.6094157531125,40.6093665144166,40.6093564271252,40.6093573616984,40.6093525418209,40.6093462887201,40.6093553635398,40.6093605252869,40.6093887919841,40.6093942065203,40.6093765646523,40.6093686337992,40.6093451202832,40.6093294369046,40.6093176114767,40.6093097582912,40.6092944643592,40.6092944359263,40.609292153795,40.6092909828026,40.6092898118125,40.6092875303496,40.60928524889,40.609282951961,40.6092828914379,40.6092850980822,40.6092861799643,40.6092861194385,40.6092883260812,40.6092927993913,40.6092938955651,40.609291598638,40.6092903973817,40.6092903225593,40.6092891520688,40.6092868706057,40.6092845884743,40.6092823065071,40.6092796484487,40.6092751289056,40.6092691256535,40.6092646072852,40.6092630618725,40.6092618908769,40.6092596087438,40.6092584377475,40.6092583624222,40.6092594128627,40.6092616195034,40.6092612138158,40.6092566959505,40.6092506910198,40.6092461726509,40.609244627237,40.609244566707,40.6092428324923,40.609237751909,40.6092326691478,40.6092298256382,40.6092275389059,40.6092263531122,40.6092262725161,40.6092250872223,40.6092228006558,40.6092205180161,40.6092182365523,40.6092159544159,40.609213672446,40.6092102650458,40.6092046212459,40.6091989919068,40.6091955988022,40.6091921914018,40.6091876587364,40.6091842496606,40.6091819686954,40.6091796872309,40.609177405764,40.6091773743255,40.6091807376662,40.609184084535,40.6091858739454,40.6091762748766,40.6091610935346,40.609153730865,40.6091479997585,40.6091451005036,40.609142817863,40.6091405220994,40.6091382103613,40.609135942519,40.6091325946482,40.6091280910778,40.6091257953129,40.6091257347742,40.6091245642735,40.6091222828053,40.6091211117998,40.6091210512612,40.609122131959,40.6091243540603,40.6091243237904,40.6091220263487,40.6091197151118,40.6091174038736,40.6091150909608,40.6091127868747,40.6091115939174,40.6091126514918,40.6091148664424,40.6091159466345,40.6091158717944,40.6091146710169,40.6091123740754,40.6091100926045,40.6091078111338,40.6091055289927,40.6091032772893,40.609101055191,40.6090976930255,40.6090931894539,40.6090897968481,40.6090875153784,40.6090841222687,40.6090796193684,40.6090762267632,40.6090739447888,40.6090716478466,40.6090693361029,40.6090659281939,40.6090602986874,40.6090546543787,40.6090512469722,40.6090489649993,40.6090489352302,40.6090511573277,40.6090500006191,40.6090454672776,40.6090420593681,40.6090397778949,40.6090397476215,40.6090419690487,40.6090441906464,40.6090463977753,40.6090463389032,40.6090429298205,40.6090395378846,40.609038351402,40.6090371506196,40.609034883445,40.6090315360838,40.6090270336861,40.6090230618861,40.609017981466,40.6090128987039,40.609008928579,40.6090032842693,40.6089976549304,40.6089942623255,40.6089930924875,40.6089930169687,40.6089940680534,40.6089962741759,40.6089962439006,40.6089939629284,40.6089916802805,40.6089893988076,40.6089867407355,40.6089822211911,40.6089762179369,40.6089717298395,40.6089691333233,40.608966911896,40.6089641260776,40.6089590747596,40.6089528820372,40.6089478169217,40.6089444090102,40.6089420972609,40.6089398003127,40.6089375188385,40.608935229042,40.6089340365788,40.608932842441,40.6089305531432,40.6089282716671,40.6089259901933,40.6089237075434,40.6089214260695,40.6089202550548,40.6089201904057,40.6089201150512,40.6089200344231,40.6089177231747,40.6089132299715,40.6089110524547,40.6089111279795,40.6089089206869,40.6089044177867,40.6089010103763,40.6088987277258,40.60889644625,40.6088941950526,40.6088919741294,40.6088897515309,40.6088875294339,40.6088841677735,40.6088807591903,40.6088784474404,40.6088761802644,40.6088735827445,40.6088690946454,40.6088630902208,40.6088585713435,40.6088559154501,40.6088536328005,40.6088524634593,40.6088524029051,40.6088512312215,40.6088489420938,40.6088477484506,40.6088465559841,40.6088442661848,40.6088419847059,40.6088397032304,40.6088362946455,40.6088317614664,40.6088277896624,40.6088227085722,40.60881767273,40.6088149181979,40.6088115703367,40.608807067269,40.6088025643657,40.6087982688614,40.6087980607955,40.608794712264,40.6087925211181,40.6087903144961,40.6087880929058,40.608785870308,40.608782522949,40.6087780496535,40.6087747022944,40.6087724505944,40.6087712789073,40.6087689826286,40.6087644492812,40.6087606869761,40.6087599154311,40.6087553822531,40.6087530858043,40.6087512223002,40.6087461505413,40.6087410980508,40.6087383144146,40.6087360918173,40.6087338703947,40.6087305080651,40.6087260039908,40.6087226423289,40.6087192937987,40.6087148359789,40.6087115188965,40.6087093122752,40.6087070901818,40.6087037273489,40.608700334908,40.6086980527615,40.6086957712844,40.6086934898092,40.608691207158,40.6086877997465,40.6086832665673,40.6086792947657,40.6086742148463,40.6086680211155,40.6086640664631,40.6086628954452,40.6086605984942,40.6086560651481,40.6086515312986,40.6086469986214,40.6086435912092,40.6086413395078,40.6086391174145,40.6086368964928,40.6086346743997,40.6086313110636,40.6086289632041,40.6086256822272,40.6086200681959,40.6086167196649,40.6086144982403,40.6086122766491,40.6086100552256,40.608606707867,40.6086038312967,40.6086022042953,40.6085987963811,40.6085965599838,40.6085977464733,40.6086022934517,40.6086038492833,40.608604590403,40.6086046509576,40.6086038628045,40.6086024443358,40.608597971544,40.6085946236796,40.6085912603449,40.6085861930525,40.6085800020032,40.6085749192361,40.6085720762173,40.6085697935698,40.6085675120916,40.6085652608928,40.6085630387972,40.6085607875983,40.6085585049494,40.6085562234725,40.6085528160613,40.6085483279644,40.6085450097098,40.6085428030879,40.6085405816622,40.6085383600689,40.6085350122067,40.6085305389118,40.6085266271599,40.6085215770159,40.6085165393311,40.6085149273735,40.6085150170316,40.6085139666199,40.6085117599961,40.608511789098,40.6085140712448,40.608515242255,40.6085153028069,40.6085153616822,40.6085154222311,40.6085143415412,40.6085109792096,40.6085064756381,40.6085030832003,40.6085008017242,40.6084985195813,40.6084951116693,40.6084905778226,40.6084871704134,40.608484888939,40.6084820437428,40.6084769631567,40.608471880389,40.6084690361978,40.6084667849989,40.6084645624014,40.608462355777,40.6084613053604,40.6084613807143,40.6084625517269,40.6084648481704,40.6084649087209,40.6084627020952,40.6084627323706,40.6084650133415,40.6084672953173,40.6084695767907,40.6084718589328,40.608474111809,40.6084763327329,40.6084785541622,40.6084819021935,40.6084875162279,40.6084931455671,40.6084965381722,40.6084988201503,40.6085011022948,40.6085011313952,40.6084989247687,40.6084989853177,40.6085012822625,40.608503563735,40.6085058606807,40.6085059212278,40.6085037146,40.6085014925019,40.6084992710714,40.6084970484715,40.6084936861356,40.6084891825651,40.6084858204,40.6084835983025,40.6084802354673,40.6084757325654,40.6084723251585,40.6084700134124,40.6084677462395,40.6084643993764,40.6084598946331,40.6084564867233,40.6084542360269,40.6084520145964,40.608449791996,40.6084475698965,40.6084453489693,40.6084453787418,40.6084476761864,40.608449987429,40.6084522915215,40.6084534856514,40.60845242691,40.6084502131283,40.6084479915323,40.6084457689288,40.608443170901,40.6084386828013,40.608432678373,40.6084281605051,40.608425504113,40.608423222642,40.6084209405012,40.6084186442259,40.6084163313123,40.6084140343677,40.6084128633613,40.6084128028163,40.6084105070448,40.6084059737031,40.6084025657937,40.6084002843216,40.6083980028499,40.6083957499756,40.6083935283773,40.6083913217499,40.6083891305939,40.6083857832286,40.608380153723,40.60837455516,40.6083712368941,40.6083690302661,40.6083668076629,40.6083645862313,40.6083623646351,40.6083601432046,40.6083567958395,40.6083522922668,40.6083488843583,40.6083466022184,40.6083443207463,40.6083420238041,40.6083419632586,40.6083441698877,40.6083432959603,40.6083373700444,40.6083294888359,40.6083216076265,40.6083157114801,40.6083148979294,40.6083171800698,40.6083194615443,40.6083217584856,40.6083240707324,40.6083263819727,40.6083264425173,40.6083242353844,40.6083220137867,40.6083186516189,40.6083130221119,40.6083074070727,40.6083040602091,40.6083018381085,40.6082996166783,40.6082962538421,40.6082917502691,40.6082883583345,40.6082860756894,40.6082837942202,40.6082815127497,40.6082792306082,40.6082780590982,40.608278000231,40.6082768292246,40.6082745470814,40.6082722651089,40.6082699841382,40.6082677014955,40.6082654502952,40.6082626639713,40.6082576136585,40.6082525320663,40.6082496878795,40.6082474064061,40.6082473761349,40.6082495987357,40.6082495672917,40.6082472812234,40.6082460942413,40.6082460147992,40.6082470801881,40.608249298189,40.6082492667422,40.6082469704684,40.6082446592251,40.6082423622809,40.608240080807,40.6082378427333,40.608234525644,40.6082300220733,40.6082265855636,40.6082242881165,40.6082220059734,40.6082197542699,40.6082175333455,40.6082153112466,40.6082119627106,40.6082074598101,40.6082029264674,40.6081972816551,40.6081916533232,40.6081882602134,40.6081870892015,40.6081859181929,40.6081836367188,40.6081802293106,40.6081757400394,40.608172422447,40.6081702163237,40.6081679942246,40.6081657727946,40.6081635511999,40.608161329771,40.6081579812348,40.6081534783322,40.6081500709246,40.6081477887831,40.6081455068078,40.6081432253352,40.608142054826,40.608141989682,40.6081419148346,40.6081418342145,40.6081395224655,40.6081350137906,40.6081316664285,40.6081294443301,40.6081260969679,40.6081216379708,40.6081194627919,40.6081195376381,40.6081173310111,40.6081128565421,40.608109509177,40.6081072574755,40.6081060864649,40.6081071676594,40.608109382108,40.6081104396737,40.6081081207775,40.6081036095538,40.6080996977993,40.6080946474842,40.6080895653917,40.6080855952666,40.6080810995163,40.6080789153423,40.6080778566049,40.6080745020896,40.6080711399248,40.6080689178266,40.6080666654529,40.6080654796415,40.6080665312308,40.608068722888,40.6080697734725,40.6080696908057,40.6080696083025,40.608068415172,40.6080661260451,40.6080638445698,40.6080615619242,40.6080615316467,40.6080637537443,40.6080637234696,40.6080614413242,40.6080591598475,40.608056878374,40.6080545957255,40.6080522999515,40.6080499881996,40.6080476912516,40.6080454097743,40.6080431128269,40.6080407999014,40.6080384886539,40.6080361769006,40.6080338811231,40.6080304720368,40.6080259684651,40.6080226222778,40.6080192582717,40.6080147553691,40.6080113930393,40.6080086072225,40.6080035564085,40.607998474815,40.6079956306236,40.6079933414941,40.6079921483569,40.6079898289511,40.6079852879499,40.6079818800359,40.6079795978895,40.6079773169155,40.6079739244742,40.6079694204009,40.6079660272915,40.6079637458127,40.6079614939436,40.6079592725184,40.6079547837516,40.6079491389373,40.6079457315256,40.6079434352461,40.6079405596008,40.6079354637066,40.6079303821115,40.60792641148,40.6079218638323,40.6079218032757,40.6079262539468,40.6079284386088,40.607929496167,40.6079317106069,40.6079316808283,40.6079293993515,40.6079271166995,40.6079248660021,40.6079215181416,40.6079170436765,40.6079125710537,40.6079080977598,40.6079036239642,40.607899151176,40.6078969445559,40.6078970034376,40.6078959232553,40.6078937018319,40.6078903544724,40.6078858509016,40.6078824429868,40.6078801608372,40.6078789898206,40.6078778193067,40.6078755676051,40.6078725939924,40.6078669799632,40.6078594736728,40.6078538746129,40.6078509329557,40.60784873399,40.60784767643,40.6078466182049,40.6078444039276,40.6078433225723,40.6078422418846,40.6078400281152,40.607838969883,40.6078379111516,40.6078356968757,40.6078334759523,40.6078312538585,40.6078301724995,40.6078302325499,40.6078314035633,40.6078337005131,40.6078337610653,40.6078315539386,40.6078293323455,40.6078271109195,40.6078248888224,40.6078226673966,40.6078215865396,40.6078216460853,40.6078205658983,40.6078183437996,40.6078161217038,40.6078139079305,40.6078128503636,40.6078140439995,40.607816339774,40.6078175334049,40.6078176230539,40.6078177138761,40.6078166551361,40.6078144471329,40.6078133800695,40.6078134606862,40.6078146464964,40.6078169337415,40.6078169628397,40.6078147419123,40.6078125204847,40.6078102983845,40.6078080757817,40.6078058691527,40.6078064912419,40.6078115899807,40.6078166693934,40.6078195152556,40.6078217967291,40.6078240787018,40.6078263608452,40.6078275318519,40.6078264504869,40.6078242290568,40.6078242593286,40.6078265413027,40.6078277113049,40.6078255046732,40.6078210318759,40.6078199357084,40.6078222178499,40.6078244998215,40.6078278929311,40.6078323953294,40.6078368989013,40.6078402920096,40.6078425734798,40.607844870421,40.6078483080958,40.6078528562358,40.6078562641421,40.6078585456124,40.6078608270821,40.6078631097263,40.6078665171307,40.6078710509715,40.6078744577056,40.6078767100788,40.6078800574456,40.607884560514,40.6078879684208,40.607890249891,40.6078925325316,40.6078948134987,40.6078982214065,40.6079027552479,40.6079061631543,40.6079084446231,40.6079107260915,40.6079130087348,40.6079164161383,40.6079209499786,40.6079243567118,40.6079266465038,40.6079278401235,40.6079267818736,40.6079245823861,40.6079246424194,40.6079269393583,40.6079292208245,40.6079315094427,40.6079327035629,40.6079350224473,40.6079395646062,40.6079429720071,40.6079463639423,40.6079508675133,40.6079542599488,40.6079565420866,40.607958823552,40.6079611061919,40.607964498125,40.607969001696,40.6079723941337,40.6079746762689,40.6079769577363,40.6079792397039,40.6079815289917,40.6079827219365,40.6079816638514,40.6079794493928,40.6079794796614,40.6079817617958,40.6079851691963,40.6079908128313,40.6079964428411,40.6079998354438,40.6080026789546,40.6080077612142,40.6080128423011,40.6080156874871,40.6080179696211,40.6080179998867,40.6080157777808,40.6080135568472,40.6080101935054,40.6080056899323,40.6080023379652,40.608001286856,40.6080013863445,40.6080025871054,40.6080048799397,40.6080060509346,40.6080061097895,40.6080072807864,40.6080095777171,40.6080096377429,40.6080074311011,40.6080052094946,40.6080029880576,40.6080002027293,40.6079951519094,40.6079901148779,40.6079885017182,40.6079885765391,40.6079897475338,40.6079920368139,40.6079932309229,40.6079955497962,40.6080000907762,40.6080023877067,40.6080024470586,40.6080013663484,40.6079991454123,40.6079980645343,40.607998134254,40.6079982245357,40.6079983245143,40.6079972733961,40.6079950621506,40.6079962178443,40.6080007521798,40.6080041595755,40.6080075515051,40.6080109446055,40.6080109736958,40.6080076120267,40.6080042486824,40.6080020277437,40.6079986643972,40.6079941608261,40.6079907682274,40.6079884867654,40.6079862447614,40.6079851948126,40.6079852947875,40.6079842431623,40.6079820324188,40.6079820621772,40.6079843436351,40.6079855146225,40.607985574639,40.6079867451268,40.6079890270879,40.6079913085465,40.6079935906772,40.607995872637,40.6079981547665,40.6080004362236,40.6080027227841,40.608003909237,40.6080039886412,40.6080051750924,40.6080074616489,40.6080086326344,40.6080075519176,40.6080053298047,40.6080053595609,40.6080076569824,40.6080088577251,40.6080089371299,40.6080090124358,40.60800909301,40.6080080270848,40.6080058095648,40.6080058294379,40.6080058409943,40.6080081212783,40.6080093038188,40.6080096076044,40.6080108357289,40.6080042191342,40.6080019672661,40.6079997446454,40.6079982325832,40.6079975231972,40.6079953022526,40.6079930503813,40.6079907689283,40.607988471004,40.6079861597995,40.607983862879,40.6079815814256,40.6079792916548,40.6079780992345,40.6079769051438,40.6079746158687,40.6079723344147,40.6079700524566,40.6079677703303,40.6079643779,40.6079598748293,40.6079564817302,40.6079542002745,40.6079519183155,40.6079496361906,40.6079474004536,40.6079452080906,40.6079430162286,40.6079408250387,40.6079386336809,40.6079386931881,40.6079409906082,40.6079421610891,40.6079444585089,40.6079489911639,40.6079523985535,40.6079546800068,40.6079558509904,40.6079559115001,40.6079548307782,40.607952608662,40.6079503872135,40.6079481805581,40.6079482410667,40.6079505527744,40.6079506127798,40.6079484054521,40.6079461840031,40.6079428211577,40.6079371923201,40.6079315771026,40.6079304809185,40.6079327681429,40.6079339545851,40.6079340344757,40.6079352209169,40.6079374767109,40.6079408245989,40.6079453281703,40.6079487355579,40.607951018184,40.6079532996351,40.607955581088,40.607957863713,40.607960152312,40.6079613458949,40.6079602871054,40.6079580721282,40.6079552874597,40.6079502366315,40.6079440429001,40.6079389777845,40.6079344742131,40.6079299711423,40.6079265787153,40.6079231713286,40.6079186677558,40.6079141939331,40.6079096903603,40.6079051570386,40.607900623885,40.6078972164982,40.6078949338716,40.6078926524201,40.607890370968,40.6078891845279,40.607889095446,40.607890160204,40.6078923818206,40.6078923520712,40.6078900706198,40.6078888996386,40.6078888319899,40.6078887488731,40.6078875564613,40.6078852523994,40.6078851918925,40.6078873914039,40.6078884501876,40.6078895077993,40.6078917068063,40.607891646799,40.6078893427377,40.6078881498146,40.6078869562272,40.6078846664533,40.6078823849973,40.6078801030409,40.6078789325586,40.6078800127739,40.6078833756182,40.6078867306499,40.607887788927,40.607886595337,40.607884291269,40.6078819790539,40.6078796826372,40.6078785111482,40.6078784516395,40.6078795325254,40.6078817539689,40.6078817248856,40.6078794279653,40.6078793674504,40.607879958529,40.607881574102,40.6078837955473,40.6078860171577,40.6078859874037,40.6078837059476,40.6078814244881,40.6078791418569,40.6078768604006,40.6078745782728,40.6078734084569,40.6078733479413,40.6078744298277,40.6078766507695,40.6078799976442,40.607884501719,40.6078879091132,40.607890146022,40.6078900860069,40.6078877890842,40.6078855071212,40.6078832261665,40.6078809435341,40.6078786615741,40.607876380616,40.6078740979843,40.6078718165247,40.607869519602,40.6078694590835,40.607871658585,40.6078727173551,40.6078737756243,40.6078759899188,40.6078782120315,40.6078804258269,40.6078814845943,40.6078802909937,40.6078780023857,40.6078757197515,40.607873438291,40.6078711568298,40.6078688594021,40.6078687993808,40.6078710060255,40.6078709762672,40.6078686948054,40.607866412843,40.6078641307096,40.6078641004485,40.6078663230621,40.6078662922966,40.607864010834,40.6078617287036,40.6078594467393,40.6078582757435,40.6078582162259,40.6078570452317,40.6078547632649,40.6078524823066,40.6078501848754,40.6078478736526,40.6078455690744,40.6078443754628,40.6078442851759,40.6078441955584,40.6078430019496,40.6078406978715,40.6078383856411,40.607836088707,40.6078349177123,40.6078348576855,40.6078347988312,40.6078347311556,40.6078346480085,40.607835706266,40.6078379200528,40.6078367650258,40.6078322311869,40.6078288237868,40.6078265411489,40.6078253701513,40.6078264515249,40.6078286729607,40.6078286438671,40.6078263457609,40.6078262864021,40.6078284930378,40.6078307144731,40.6078329365794,40.6078351586867,40.6078373796188,40.6078396010538,40.6078418236624,40.6078417928905,40.6078394959566,40.6078371847243,40.6078348884602,40.6078326063212,40.6078292138866,40.6078258212835,40.6078235393128,40.6078201467094,40.6078156438064,40.607812243555,40.6078110494319,40.6078098558141,40.607806455559,40.6078030631241,40.6078007809843,40.6077984847168,40.6077961734821,40.607793876546,40.6077915950793,40.6077893124384,40.6077870309682,40.6077847494993,40.6077824673621,40.60778018539,40.6077790143851,40.6077789538484,40.6077788943148,40.6077788194792,40.607777617701,40.6077753064644,40.6077729947238,40.6077706982878,40.6077684163155,40.607766134174,40.6077638527031,40.6077615661343,40.6077603796584,40.6077603002213,40.6077591149188,40.607756827169,40.6077556561638,40.6077555961238,40.6077544246137,40.6077521436453,40.6077498610008,40.6077475723823,40.6077463787547,40.6077474374995,40.6077496512753,40.6077496210028,40.60774732406,40.6077461239521,40.6077471898434,40.6077493964709,40.6077493364273,40.6077470394834,40.6077447575097,40.6077424610658,40.6077424005197,40.6077446071471,40.6077479551806,40.6077524289824,40.607754635606,40.6077557162989,40.6077579378938,40.6077579069496,40.6077556106742,40.6077555501254,40.6077577567503,40.6077577269804,40.6077554312056,40.6077542299173,40.6077541550695,40.6077552352566,40.6077574418794,40.607759633031,40.6077618408281,40.6077640617526,40.6077662838488,40.6077662535707,40.6077639566237,40.607763896575,40.6077661031985,40.6077671845559,40.6077682647422,40.6077704713621,40.6077704124839,40.6077681067127,40.6077669142432,40.6077679729767,40.6077701867485,40.6077724081716,40.6077746297644,40.6077768511896,40.6077790686858,40.6077801333944,40.6077800539406,40.6077811198209,40.6077833208342,40.60778326078,40.6077798533674,40.6077764459548,40.6077763853974,40.6077797334253,40.6077830909886,40.6077841568695,40.6077840769086,40.6077840008754,40.6077850776276,40.6077872990494,40.607787268769,40.6077849826918,40.6077837956946,40.6077837162338,40.6077847816065,40.6077869841237,40.6077880351942,40.6077879591595,40.6077862244181,40.6077811433245,40.6077760617288,40.6077720920995,40.6077675891989,40.6077642406706,40.6077620340543,40.6077598422419,40.6077553696231,40.6077497241372,40.6077474278521,40.6077462573333,40.6077439746805,40.6077416931997,40.6077394117207,40.6077371290666,40.6077348480888,40.6077325666076,40.6077303142359,40.6077280928145,40.6077258718979,40.6077236498062,40.6077214272119,40.6077192057911,40.6077158434603,40.607712451522,40.6077112804993,40.6077089835446,40.6077044799729,40.6077011321158,40.6076989105256,40.6076966891038,40.6076944670129,40.6076922455923,40.6076899937232,40.6076877117386,40.6076854224386,40.6076842294594,40.6076830358133,40.6076807471787,40.6076784645267,40.6076762128238,40.6076739907327,40.6076706279015,40.6076661243309,40.6076627318862,40.6076615618692,40.6076626427181,40.6076648564854,40.6076659152075,40.6076647215583,40.6076624775083,40.6076602851979,40.607658078583,40.6076558564918,40.6076524948336,40.6076491022247,40.6076479312009,40.6076461964583,40.6076411153637,40.6076360337666,40.6076331895709,40.6076308926137,40.6076285808491,40.6076263141737,40.6076229668195,40.6076184627448,40.6076139293935,40.6076093955381,40.6076059881215,40.6076036918348,40.6076013800694,40.6075990676345,40.6075961921485,40.6075910967497,40.6075860442612,40.6075832606296,40.6075787725352,40.6075731728088,40.6075698557387,40.607567649125,40.6075643005973,40.6075597970265,40.6075563896098,40.6075541076253,40.6075512629233,40.6075461818283,40.6075394270575,40.6075326722864,40.6075275890148,40.6075236193835,40.6075190861987,40.6075156787816,40.6075134275825,40.6075100790562,40.6075055754855,40.6075016043463,40.6074965232511,40.6074914707659,40.6074886878043,40.6074853249707,40.6074819621414,40.6074786142839,40.6074730002545,40.6074673719224,40.607463978807,40.6074616973263,40.6074593998628,40.6074570874298,40.6074547761655,40.6074524643977,40.6074501686111,40.6074478859568,40.6074456039693,40.6074429458919,40.607438426843,40.6074324230846,40.6074279343207,40.6074253384828,40.6074231170658,40.6074208944742,40.6074186728874,40.6074164514701,40.6074142448574,40.6074120525475,40.6074087056962,40.6074042021254,40.6074008101858,40.607397963808,40.6073928827128,40.6073878011169,40.6073860678779,40.607386007311,40.6073837115243,40.6073791781722,40.6073757697482,40.607373488769,40.6073712072859,40.607368924628,40.6073666431441,40.6073643461848,40.6073620344162,40.6073597677388,40.6073575451497,40.6073553237315,40.6073519768812,40.6073475030897,40.607344156242,40.6073419336505,40.6073397115605,40.6073374901414,40.6073352685558,40.607333047138,40.6073302618302,40.6073252110185,40.6073201289199,40.6073161587853,40.60731162493,40.6073082181822,40.6073059360281,40.6073036540437,40.6073013718904,40.6072990904065,40.6072968084205,40.6072939630479,40.6072888831248,40.6072838306391,40.6072799205707,40.6072754169989,40.6072720102507,40.6072697275935,40.6072674461099,40.607264052995,40.6072595505969,40.6072561872646,40.607253965177,40.6072517442623,40.607248677345,40.6072427828774,40.6072349016677,40.6072270204622,40.6072211231465,40.6072180579044,40.6072146962472,40.6072101921737,40.6072067847555,40.6072044729874,40.607202176028,40.6071987686096,40.6071942342496,40.607190826831,40.6071885904401,40.6071863993038,40.6071830507795,40.6071796433612,40.6071773315933,40.6071739241747,40.6071694206015,40.6071660281586,40.607163746005,40.6071614943023,40.607159272214,40.6071570507956,40.6071537027731,40.6071491998723,40.6071457924537,40.6071435097972,40.6071412283127,40.6071389313514,40.6071366200843,40.6071343529053,40.6071310060537,40.6071265014777,40.6071225303366,40.6071174502475,40.6071112565171,40.6071050661369,40.6070994206499,40.6070960132306,40.6070937169391,40.6070902792353,40.6070846189393,40.6070789901023,40.6070744865314,40.6070710939195,40.6070682487118,40.6070631681212,40.6070581151321,40.6070549555751,40.6070504668129,40.6070444630543,40.6070399440045,40.6070367238787,40.6070316432837,40.6070254500565,40.6070203849414,40.607016992496,40.6070141466203,40.6070090660263,40.6070039839278,40.6070000137911,40.606994369475,40.6069887401353,40.6069853475242,40.6069830660404,40.6069807845532,40.6069779381732,40.6069728587529,40.606966664353,40.606961599238,40.6069582370795,40.6069560149925,40.6069526533352,40.6069492602211,40.6069464138404,40.6069413339163,40.6069362516491,40.6069334074478,40.6069311259616,40.606927717536,40.606923184179,40.6069197767594,40.6069174952735,40.6069140878527,40.6069095842798,40.6069051104927,40.6069006069198,40.6068972001691,40.6068949180144,40.6068915095882,40.6068870060139,40.6068832825706,40.6068787939752,40.6068727895477,40.6068683019565,40.6068657049499,40.6068634537507,40.6068611717613,40.6068588896065,40.6068566081206,40.6068543261299,40.6068531556033,40.6068519845717,40.6068497019139,40.6068474204275,40.6068451692263,40.6068423839231,40.606837333112,40.6068322806305,40.6068294964992,40.6068272750822,40.6068239282358,40.6068194246625,40.6068160167378,40.6068137340802,40.6068103266576,40.6068057939714,40.6068023860494,40.6068001050635,40.6067978224045,40.6067955409178,40.6067932594305,40.6067898663145,40.606784236306,40.6067774815326,40.6067729636568,40.6067706816662,40.6067672890532,40.6067616590434,40.6067560445134,40.6067515712279,40.606747068327,40.6067436609051,40.6067402677905,40.6067357642162,40.6067323567942,40.6067294812994,40.6067243858956,40.6067193334092,40.6067165492797,40.6067131869542,40.6067098236234,40.6067076027118,40.6067042393811,40.606699735808,40.6066963433635,40.6066940623791,40.6066917797173,40.6066906103619,40.6066916905312,40.6066939114422,40.60669350573,40.6066889866788,40.6066829829201,40.6066773534151,40.6066724760963,40.606669082978,40.6066668014917,40.6066645188313,40.6066622373438,40.606659955854,40.6066576731934,40.606655421493,40.6066526361881,40.6066475853807,40.6066425340696,40.6066386235014,40.6066341199284,40.6066307125057,40.6066284310192,40.6066261488602,40.6066238668676,40.6066204594479,40.6066159267586,40.6066113928965,40.606606859539,40.606603451613,40.6066011701249,40.6065988886364,40.6065966362626,40.6065932889149,40.6065888151292,40.6065849033893,40.606579852582,40.606574770981,40.6065719272797,40.6065696452867,40.6065673637996,40.6065650668315,40.6065627550523,40.6065593464557,40.6065559540082,40.6065525465853,40.6065480435159,40.6065435697307,40.6065390661587,40.6065356587348,40.6065333767422,40.6065310952544,40.6065288130951,40.60652540634,40.6065208724769,40.6065167130349,40.606511069219,40.6065035629315,40.6064979181129,40.606494322893,40.6064892429667,40.6064841601923,40.6064813171598,40.6064790344963,40.6064767530079,40.6064744560365,40.6064721442572,40.6064698775765,40.606467092946,40.6064620421376,40.6064569588625,40.6064541151594,40.6064518331646,40.6064484257393,40.60644389238,40.6064404849546,40.6064395934667,40.606437092505,40.6064320245428,40.6064258341628,40.6064207508874,40.6064179071819,40.6064156251866,40.6064144551579,40.606414379763,40.6064131784337,40.6064097710075,40.6064052674365,40.6064018743163,40.6063990291053,40.606393948509,40.6063888657337,40.6063856456011,40.6063811277218,40.6063751227903,40.6063706049098,40.6063668225616,40.6063622886994,40.6063588812704,40.6063554888234,40.6063509852513,40.6063475921329,40.6063453106403,40.6063419186936,40.6063374151215,40.6063340220043,40.6063313639164,40.606326845531,40.6063208411055,40.606316322722,40.6063136663082,40.6063113841462,40.6063079767189,40.6063034435228,40.6062996589978,40.6062951411181,40.6062891361867,40.6062846183055,40.6062815852969,40.6062770674144,40.6062710624843,40.6062665446051,40.6062638881901,40.6062616353156,40.6062582884744,40.6062537849033,40.606249251038,40.606244718344,40.6062401844772,40.6062356506123,40.6062322431843,40.6062299914825,40.6062266434682,40.6062221405673,40.6062187319665,40.6062164504734,40.6062136045894,40.6062085246592,40.6062034430589,40.606200597676,40.6061983173546,40.60619603519,40.6061926427421,40.6061875742753,40.6061813832258,40.6061763011196,40.6061728936909,40.6061678130936,40.6061610578195,40.6061543030463,40.6061492197706,40.6061463760614,40.6061441248623,40.6061407770172,40.6061351629922,40.6061295334848,40.6061261415394,40.6061227324353,40.6061181997412,40.6061147918097,40.6061124953328,40.6061090571084,40.60610450843,40.6061011010007,40.6060988497982,40.6060966272198,40.6060944056443,40.6060921842363,40.6060888214126,40.6060831925767,40.6060775482578,40.606073014391,40.6060684810254,40.6060650725909,40.6060627910954,40.60605994521,40.6060548657837,40.606048672055,40.6060436069374,40.6060402138189,40.6060379323245,40.6060356496551,40.6060333681606,40.6060310866647,40.6060276792347,40.606023175161,40.606018702386,40.6060141983122,40.6060107908823,40.6060085088836,40.6060051014535,40.6060005680891,40.6059971596536,40.605994908955,40.6059921231581,40.6059870728568,40.6059819907497,40.6059791465375,40.6059768643714,40.6059734576121,40.6059689540401,40.6059656055261,40.6059633543249,40.6059610728308,40.6059587758524,40.605956462888,40.6059541968746,40.6059519759705,40.6059497235976,40.6059474421009,40.6059451446216,40.6059428333298,40.6059405661445,40.6059372193058,40.6059327152321,40.6059293078011,40.6059270566019,40.6059242696331,40.6059192199988,40.6059141377238,40.6059124046353,40.6059123440407,40.6059100475637,40.6059055148662,40.6059009804976,40.6058964471297,40.605893038693,40.6058907576989,40.6058884767051,40.6058850835831,40.6058800157873,40.6058738247371,40.6058687414565,40.6058658977453,40.605863615745,40.6058607703598,40.6058556899291,40.6058494967009,40.6058444315856,40.6058410384625,40.6058398674165,40.6058386973759,40.6058364153773,40.6058335694856,40.6058284895572,40.6058234067802,40.6058205637397,40.605818265582,40.6058148285229,40.6058102791676,40.6058068717345,40.6058045902357,40.6058023082339,40.6058000260655,40.6057977445665,40.6057954933672,40.6057932712932,40.6057899091417,40.6057865458164,40.6057831989789,40.6057786954078,40.6057763984253,40.6057763378273,40.605775167281,40.6057728709681,40.6057694320635,40.6057648850512,40.6057614771147,40.6057591949469,40.6057569129431,40.6057546605713,40.605752439168,40.6057490763457,40.6057456689117,40.6057433576145,40.6057410606314,40.6057387786273,40.6057365274302,40.6057331794211,40.60572756607,40.6057219360599,40.6057185286256,40.6057162168251,40.6057139198416,40.6057116383419,40.6057093561713,40.6057070741668,40.6057047926683,40.6057025104971,40.605700214182,40.60569790171,40.6056956356953,40.6056922871865,40.6056866726621,40.6056810443274,40.6056765402537,40.6056731476349,40.6056708661326,40.6056685846336,40.6056663019594,40.6056640204589,40.6056617389577,40.6056594567883,40.6056571747829,40.6056549235847,40.6056527020166,40.6056504503128,40.6056481676394,40.6056458861389,40.6056447150853,40.6056424180987,40.6056379145263,40.6056345676949,40.6056312043697,40.6056277976038,40.6056254863051,40.6056231876395,40.6056209061394,40.6056186251396,40.6056157787448,40.6056106988144,40.6056056165369,40.6056027734901,40.605599380368,40.6055959872459,40.6055937057421,40.6055914237377,40.605589141565,40.605586860064,40.6055845785613,40.6055822970591,40.6055800143845,40.6055777620116,40.6055744158499,40.6055699122768,40.605566504337,40.6055642221659,40.6055619406635,40.6055596591591,40.605556251219,40.6055517173448,40.6055483099072,40.6055460284024,40.6055437457269,40.6055414945291,40.6055392736321,40.6055359103082,40.6055325176881,40.6055302356817,40.6055279535067,40.6055256720051,40.6055233750154,40.6055210643812,40.6055187673911,40.6055153582775,40.6055108255738,40.6055085285833,40.6055062315913,40.605501697715,40.6054982909449,40.6054948978207,40.6054892689857,40.60548362466,40.605480217221,40.6054779345442,40.6054745271041,40.605468882279,40.605464364391,40.6054609564491,40.6054564225718,40.60545412558,40.6054518292581,40.605447325687,40.6054428519174,40.6054383488479,40.605434941408,40.6054326594001,40.6054303772232,40.6054280957198,40.6054258137112,40.6054235315375,40.6054212500325,40.6054189988313,40.6054156503273,40.6054111474263,40.6054077399863,40.6054054578101,40.605402799708,40.6053982813193,40.6053922775605,40.6053877585003,40.6053851020758,40.6053828205704,40.6053805383928,40.6053782563839,40.6053748489433,40.6053703162384,40.6053680180709,40.6053664715891,40.6053619531997,40.6053559487707,40.6053514606867,40.6053500044523,40.6053483605908,40.6053433097921,40.6053382275122,40.6053353839611,40.6053331017851,40.6053308197769,40.6053285382689,40.6053262560928,40.6053228636386,40.6053183600655,40.6053149972458,40.6053127758515,40.6053105251528,40.6053082424754,40.6053059466538,40.6053036331641,40.6053013366733,40.6052990546632,40.605296803463,40.6052945818997,40.6052923301978,40.6052889227563,40.6052843883732,40.6052809809326,40.6052787297324,40.6052761305705,40.6052716429884,40.6052656385594,40.6052611201707,40.6052595746919,40.6052580270348,40.6052535081426,40.6052475042162,40.6052429858253,40.6052403293958,40.6052380329047,40.6052357205853,40.605233453896,40.6052312318332,40.6052278696851,40.6052233666165,40.6052200032947,40.6052177818994,40.6052155295276,40.6052132480205,40.6052109510236,40.605210892082,40.6052130986578,40.6052130678482,40.6052107856685,40.6052085041621,40.6052062529629,40.6052034666755,40.6051984163784,40.6051933639044,40.6051905802953,40.605188329096,40.6051860475885,40.6051837660802,40.6051814833998,40.6051780914454,40.605174698319,40.6051718530884,40.6051667719835,40.6051616897024,40.6051577202137,40.6051531863341,40.6051492151689,40.6051441340615,40.6051379413355,40.605132311997,40.6051261204426,40.6051210376589,40.6051170686715,40.6051125352951,40.6051091268465,40.6051068458386,40.60510456433,40.6051022765424,40.6051010911624,40.6051010104493,40.6050986986316,40.605093049697,40.605087419688,40.6050840265611,40.6050817450517,40.6050783525939,40.605073004193,40.6050659678125,40.6050580866022,40.6050502063981,40.6050442794563,40.6050411541259,40.6050388721118,40.6050354646672,40.6050309615986,40.605028754523,40.6050288146406,40.6050266073997,40.6050221348063,40.6050210386793,40.6050233206896,40.6050244917528,40.6050230345196,40.6050185464372,40.6050125415055,40.6050080231137,40.6050053671872,40.6050030845069,40.6050008029969,40.6049985131573,40.6049973206149,40.6049950016399,40.6049904909071,40.6049860164711,40.60498151357,40.604976979688,40.6049724756129,40.6049680023519,40.6049623878319,40.6049567588269,40.6049533663697,40.6049510848596,40.6049488324877,40.6049454851607,40.6049410113957,40.6049371001799,40.6049320505533,40.6049269980789,40.604924304957,40.604889974226,40.604860304031,40.6048365932011,40.6048069636486,40.6048054305218,40.6047773339257,40.6047356333027,40.6047239923605,40.6047212127872,40.6047307068129,40.604747913773,40.6047487382487,40.6047587324326,40.6047697957836,40.6047698461035,40.604769928183,40.6047700107642,40.6047700826331,40.6047701587247,40.6047702387521,40.6047714241189,40.6047737119004,40.604774882954,40.6047749425545,40.6047761136084,40.6047783951105,40.6047806766123,40.6047829592869,40.6047852407909,40.6047875222913,40.6047898044642,40.6047920864671,40.6047932565162,40.60479331712,40.6047933777232,40.6047934371537,40.6047923565032,40.604790135603,40.604787913533,40.6047856926339,40.6047834700593,40.6047812479894,40.6047812782892,40.604783560961,40.6047858424634,40.6047881234622,40.6047915314001,40.6047916836632,40.6047960647685,40.6047994727063,40.6048017542083,40.6048040357089,40.6048063326927,40.604806393292,40.6048042010173,40.6048053875534,40.6048099362394,40.6048133436737,40.6048156406574,40.6048179529582,40.6048202591496,40.6048214599959,40.6048215605999,40.6048205095745,40.604818297876,40.6048183276729,40.6048206096741,40.604822891172,40.6048251733385,40.6048274553399,40.6048297518187,40.6048320641165,40.6048343610996,40.6048352984048,40.604839365945,40.6048390674215,40.6048368525003,40.6048346310931,40.604832425004,40.604831373973,40.6048314546546,40.6048315295571,40.6048316090626,40.6048305437195,40.6048283269131,40.6048261048356,40.604823883933,40.604823913725,40.6048262100326,40.6048262706236,40.6048240635268,40.6048218426224,40.6048184792948,40.6048128509597,40.6048072357613,40.6048061407922,40.6048084222869,40.6048118297166,40.6048163635842,40.6048197715164,40.6048220530114,40.6048243345056,40.6048266166686,40.6048277865379,40.6048278471275,40.6048290181691,40.6048313003317,40.604833581826,40.6048358644923,40.6048370355333,40.6048371104297,40.6048360588892,40.604833868274,40.6048339271851,40.6048362241591,40.6048373951988,40.6048374552815,40.6048386263209,40.6048409237947,40.6048409832069,40.6048387766101,40.604837695442,40.6048377631818,40.6048378457278,40.6048390394019,40.6048413435262,40.6048436558131,40.6048459527844,40.6048482342752,40.6048505164371,40.604852798431,40.6048550845246,40.604856270539,40.6048563510318,40.6048575370466,40.6048598236387,40.6048609946743,40.6048610542493,40.6048599745853,40.6048577520015,40.6048577822901,40.6048600642841,40.6048634717086,40.6048680050682,40.6048714129951,40.6048736956569,40.6048759771456,40.6048782581319,40.6048794291671,40.6048794897437,40.6048784079016,40.6048761869907,40.6048734011852,40.6048683508785,40.6048632990617,40.6048616561784,40.6048617155835,40.6048628872864,40.6048651687729,40.6048680129784,40.6048730945778,40.604878175174,40.6048810215552,40.6048833018711,40.6048855840274,40.6048878803254,40.6048879408995,40.6048857342924,40.6048829496593,40.6048778988489,40.6048728618424,40.6048723596996,40.6048746263789,40.6048768477951,40.6048790996635,40.6048813811503,40.6048836631416,40.604885945297,40.6048893377418,40.6048927451645,40.6048950581111,40.6048984655325,40.6049018722842,40.6049041847276,40.6049064805188,40.6049076670242,40.6049099936057,40.6049145429402,40.6049168399066,40.604918010933,40.6049202919166,40.6049225734024,40.6049248251046,40.6049270471916,40.6049292692796,40.6049314901935,40.604933741897,40.604934914098,40.6049338322507,40.6049316113362,40.6049316404476,40.6049339226026,40.6049362040871,40.6049384860765,40.6049407682313,40.6049430199335,40.604945241517,40.6049486036805,40.6049519962918,40.6049531673196,40.6049532278869,40.6049510212756,40.6049465627954,40.6049454969271,40.6049477933859,40.6049489644122,40.6049478830653,40.6049456616469,40.6049445814725,40.6049446491926,40.6049447312142,40.6049436729979,40.6049403179885,40.6049346884801,40.6049290751184,40.6049279789646,40.6049302604461,40.6049314314719,40.604931491535,40.6049326625593,40.6049349435398,40.6049383519625,40.6049428853144,40.6049462932333,40.6049485747174,40.6049508561981,40.6049531388547,40.6049554203353,40.6049577018181,40.6049599839685,40.6049622654522,40.6049645474369,40.6049667993047,40.6049701466629,40.6049746199537,40.6049779678133,40.6049801899035,40.6049819834898,40.6049824108202,40.6049846174352,40.6049856678324,40.6049867348782,40.6049900960353,40.6049946006124,40.6049979932246,40.6050002742043,40.6050025645149,40.6050037574962,40.6050026987737,40.6050004845036,40.6049982635847,40.6049960569701,40.6049950059013,40.6049950807671,40.6049962517906,40.604998532769,40.6049997037878,40.6050008754809,40.6050031717691,40.6050054841981,40.6050077816586,40.6050100631376,40.6050123446199,40.6050123743966,40.605009011563,40.6050045079911,40.6050011611364,40.6050000392839,40.6050060496668,40.6050081714444,40.6050103928692,40.6050126447379,40.605014926219,40.6050172076984,40.6050183798895,40.6050184392735,40.6050173585915,40.6050151519718,40.6050152125308,40.605017479206,40.6050197006292,40.6050219227227,40.6050252689096,40.6050297736542,40.6050320699376,40.6050321454681,40.6050325560478,40.6050333467641,40.6050356580192,40.605035718574,40.605033511954,40.6050312898596,40.6050290760894,40.6050280168534,40.6050269586269,40.6050247448528,40.6050253361698,40.6050304194425,40.6050354993626,40.6050383447282,40.6050406338609,40.6050418274982,40.6050407692689,40.605038555495,40.6050352081341,40.6050328341688,40.6050307343337,40.605027386975,40.6050251648769,40.60502294345,40.6050207373307,40.6050207967095,40.6050242041207,40.6050275972315,40.6050287682449,40.6050276875569,40.6050254654591,40.6050232440314,40.6050210224384,40.6050199417475,40.6050188598862,40.6050166461132,40.6050155878755,40.6050167815126,40.6050201817708,40.6050235737085,40.6050247447189,40.6050248052715,40.6050248801188,40.6050260809012,40.6050283829512,40.6050295694324,40.6050296493811,40.6050297242273,40.6050297893703,40.6050287081768,40.605026486579,40.6050265168534,40.6050288137963,40.6050311255431,40.6050334219844,40.6050346006473,40.6050346826385,40.6050358762694,40.6050381660613,40.6050393365673,40.6050394022138,40.6050394775559,40.6050395564934,40.6050407429724,40.6050430295429,40.6050453116827,40.6050476079572,40.6050499196976,40.6050522166398,40.605053387643,40.6050523074496,40.6050500848438,40.6050501151165,40.6050524120557,40.6050547237968,40.6050570362077,40.6050570955748,40.6050548960911,40.6050538385106,40.6050550314673,40.605057320751,40.6050596027237,40.6050618841914,40.6050641663325,40.6050664626006,40.6050665231382,40.6050643165038,40.6050620950678,40.6050598741374,40.6050599032323,40.6050621925215,40.6050633854699,40.6050634686226,40.6050635506029,40.6050647513687,40.6050670636073,40.6050693760095,40.6050716722773,40.6050739544131,40.6050762430305,40.605077436646,40.605077519128,40.605077586806,40.605078757806,40.6050810542376,40.6050833664721,40.6050856634059,40.6050879448704,40.6050902270083,40.6050913968346,40.6050914573634,40.6050903761571,40.6050881700191,40.6050893553111,40.6050939051206,40.6050962008814,40.6050951206793,40.605092906891,40.6050918476252,40.6050930417407,40.6050953303515,40.6050976129884,40.6050999087457,40.6051011105075,40.6051011860015,40.6051023558233,40.605104637959,40.6051069194224,40.6051092092067,40.605110402142,40.6051093445533,40.605107129589,40.60510604888,40.6051061094043,40.6051061699294,40.6051062292815,40.6051051485706,40.6051029347813,40.6051018755094,40.6051041948851,40.6051098463349,40.6051143658755,40.6051155368674,40.6051144561578,40.6051122381423,40.6051111732307,40.6051112538156,40.6051124390991,40.6051147334775,40.6051159275805,40.6051148688101,40.6051126538425,40.6051104323992,40.6051082257529,40.6051060338993,40.6051038272505,40.6051027458669,40.605101665656,40.6050994442119,40.6050994744726,40.6051017554302,40.6051017856886,40.6050995635742,40.6050967782419,40.6050917280853,40.6050866903817,40.6050850783815,40.6050851520178,40.6050840718054,40.6050818503612,40.6050785029807,40.6050740284916,40.6050729334855,40.6050752304076,40.605075289753,40.6050730836028,40.6050731133579,40.6050753959884,40.6050765812663,40.6050755308081,40.605073323485,40.6050699755996,40.6050655017837,40.6050644066055,40.6050667035282,40.6050667635389,40.6050645568853,40.6050657124053,40.6050702462366,40.6050736536285,40.6050759362573,40.6050782177137,40.605080499172,40.6050816696518,40.6050805894365,40.6050783673186,40.6050772866004,40.6050762052095,40.6050739837637,40.6050706368814,40.6050661630629,40.6050650668779,40.6050673559853,40.6050685495726,40.6050674919647,40.6050652774905,40.6050653072438,40.6050676041608,40.6050688048939,40.6050688868395,40.6050689704544,40.6050701633737,40.605072452642,40.6050736312705,40.6050737138809,40.6050726550943,40.6050704406189,40.6050682191696,40.6050659982205,40.6050649163262,40.6050649768304,40.6050650373357,40.6050639559414,40.6050617487806,40.6050618092842,40.6050641061963,40.6050652843226,40.6050653667576,40.6050643086397,40.6050620936606,40.6050621239112,40.6050644111328,40.6050655969018,40.605065676284,40.6050679891594,40.6050725275784,40.6050748238192,40.6050737430917,40.6050715267385,40.6050704608012,40.6050705406854,40.6050694742447,40.6050672726771,40.6050673331779,40.6050707405597,40.60507413366,40.6050753046347,40.605076475607,40.6050787713451,40.6050788318432,40.6050766251769,40.6050744037243,40.6050721821017,40.6050722118487,40.6050745087569,40.605076819951,40.6050791161888,40.605081398306,40.6050836802576,40.6050859617079,40.6050882438263,40.605088274072,40.605086051948,40.6050838298222,40.6050816083661,40.6050816381133,40.6050839360239,40.6050862472172,40.6050896546001,40.605093061983,40.6050931224772,40.6050909163115,40.6050898344046,40.6050898948981,40.6050910658697,40.6050933622708,40.6050956739646,40.6050979411265,40.6051012890221,40.6051057920923,40.6051080889967,40.605108149489,40.6051070680849,40.605104846626,40.6051014985664,40.6050970259063,40.6050936773409,40.6050914563853,40.6050881089925,40.6050836344913,40.6050836647378,40.6050881985568,40.6050916059377,40.6050938873831,40.6050961694992,40.605098451447,40.6051007328918,40.605103015007,40.605105296454,40.6051075778976,40.6051098593435,40.605112141457,40.6051121717037,40.6051099583922,40.6051088990805,40.6051100919777,40.6051123812314,40.6051157896172,40.6051203229314,40.6051226191652,40.60512267965,40.6051227396342,40.6051227996181,40.6051228589316,40.6051229194172,40.605124090381,40.6051263724951,40.6051275434607,40.605127602773,40.605128774405,40.6051310558462,40.6051333372906,40.60513562705,40.6051368199385,40.6051380129981,40.60514031804,40.6051403775188,40.6051381701719,40.6051359487094,40.6051337277516,40.6051326463388,40.6051327063181,40.6051344399948,40.6051395220765,40.6051446026503,40.6051474478123,40.605149729922,40.6051497589909,40.6051475375295,40.6051453158988,40.6051430944352,40.6051431241717,40.6051454061157,40.6051472195851,40.6051535054423,40.6051549482629,40.6051605930928,40.6051831036341,40.6051848251204,40.6051882221367,40.6051894080375,40.6051894883796,40.6051906742813,40.6051929762615,40.60519528793,40.6051975848154,40.6051998662489,40.6052021631354,40.6052044748006,40.6052067788287,40.6052079728685,40.6052069140374,40.6052046990328,40.605205855201,40.6052103890087,40.6052137968795,40.6052160783132,40.6052172487573,40.6052173087188,40.6052184796684,40.6052207616019,40.6052219325502,40.6052231041661,40.6052254003818,40.6052254603419,40.6052232582428,40.6052221922679,40.6052222720989,40.6052234584972,40.6052257599683,40.605228072133,40.605230376155,40.6052315696861,40.605233887986,40.6052384294267,40.6052407263099,40.6052407939082,40.605240875781,40.6052420693151,40.6052443583839,40.6052455293271,40.6052444480657,40.605242226423,40.6052400049477,40.6052377839759,40.6052378130319,40.6052400944595,40.6052423765595,40.6052446584915,40.6052469399202,40.605249222021,40.6052515039508,40.6052538003245,40.6052561119815,40.605258416503,40.6052596100303,40.6052596924021,40.605258618774,40.6052564120787,40.60525647203,40.6052587694082,40.6052610503328,40.6052633394028,40.6052645329279,40.6052657264544,40.6052680155186,40.6052702969462,40.6052725938226,40.6052726537708,40.6052704470705,40.6052682260948,40.6052675463126,40.60527212338,40.6052878726741,40.605322042534,40.6053226117837,40.6053260184716,40.6053283005661,40.6053294714971,40.605329530265,40.6053307011978,40.6053329837924,40.6053352652139,40.6053375466356,40.6053398287293,40.6053421177912,40.6053433107991,40.605344504818,40.6053468093227,40.6053502468987,40.6053547949659,40.6053570911628,40.605357151603,40.6053572110374,40.605357271475,40.6053584424053,40.605360730964,40.6053619244727,40.6053608661122,40.6053586522653,40.6053586819806,40.6053609710412,40.6053621645488,40.6053639201042,40.6053690094782,40.605374089369,40.6053769368554,40.6053792177717,40.6053804034728,40.6053827300519,40.6053872786171,40.6053906859711,40.605392967893,40.6053952499833,40.6053975461749,40.6053976066086,40.6053953998955,40.6053954291077,40.6053977110287,40.6053999936191,40.6054022443169,40.6054044669776,40.6054078286702,40.6054112217514,40.6054123926778,40.6054124531117,40.6054136235348,40.605415909544,40.6054170952417,40.6054171757074,40.6054183614034,40.6054206485819,40.6054229299986,40.6054252125875,40.6054274935013,40.605429775419,40.6054320568373,40.6054337866643,40.6054636650294,40.6054971471763,40.6055004823839,40.6055026022913,40.6055033748827,40.6055090043932,40.6055123963002,40.6055146777136,40.6055169648884,40.6055181505761,40.6055182310287,40.6055194173868,40.605521717653,40.6055251557138,40.6055297042706,40.6055331116176,40.6055354008334,40.6055365948251,40.605537787647,40.6055400768596,40.6055423582724,40.6055446401856,40.6055469222661,40.6055492184463,40.6055492788639,40.6055470716395,40.6055471013457,40.6055493986979,40.6055505998228,40.6055506785949,40.6055507537812,40.6055508342251,40.6055509089079,40.6055487072711,40.6055442481712,40.6055431833235,40.6055454949389,40.6055478060525,40.605550103402,40.6055512738116,40.605551341361,40.6055514231728,40.6055526166573,40.6055549056986,40.6055571871048,40.6055594691853,40.6055617505923,40.6055640474376,40.605565249056,40.6055653391722,40.6055676650512,40.6055722142687,40.6055756209407,40.6055790135158,40.6055835170908,40.6055869249354,40.6055892365479,40.6055915333906,40.6055927190657,40.6055939196756,40.6055962160169,40.6055973869241,40.605595180192,40.605590706825,40.6055885005952,40.6055874197973,40.6055852022171,40.6055841366905,40.6055842171213,40.6055859650081,40.6055910516576,40.6055961322126,40.6055989773393,40.6056012594143,40.6056035408185,40.6056058222233,40.6056081047991,40.6056104009694,40.605610460874,40.6056071139407,40.6056014839274,40.6055947291521,40.6055890998089,40.6055857374388,40.6055835147648,40.6055812932624,40.6055813234672,40.6055836053718,40.6055858874462,40.6055881836154,40.6055882430149,40.6055860515487,40.6055861109473,40.6055884082897,40.6055906891893,40.6055929710943,40.6055952531655,40.6055975345698,40.605598705473,40.6055987658735,40.6055976844029,40.6055954628997,40.6055966195412,40.6056011521425,40.6056045594798,40.6056068408801,40.6056091229537,40.6056113758295,40.6056139717522,40.6056184598905,40.605624464323,40.6056300931627,40.6056349733336,40.6056383367108,40.6056416836452,40.6056461877227,40.605649595061,40.6056518759599,40.6056541578628,40.6056564404389,40.6056598477759,40.6056643506796,40.605667698789,40.6056699202915,40.6056721424652,40.6056755046674,40.6056800082435,40.6056834008143,40.6056845717163,40.6056846309449,40.6056835506457,40.6056813291422,40.6056824846069,40.6056870183812,40.6056904257197,40.6056927225567,40.6056927829567,40.6056905762172,40.6056883540426,40.6056861318678,40.6056839098628,40.6056816881905,40.6056817183888,40.6056840004587,40.6056866567804,40.6056911751199,40.6056941377999,40.6056971783798,40.6057016671899,40.6057053917282,40.6057098953034,40.6057133026391,40.6057155845403,40.6057189918759,40.6057234949471,40.6057268428914,40.6057290952661,40.605731376162,40.6057336580654,40.6057359394638,40.6057382291715,40.6057394226323,40.6057406149262,40.6057429046271,40.6057451860249,40.6057474757299,40.6057486685199,40.6057498624857,40.6057521593203,40.6057533522781,40.6057532641459,40.6057531705376,40.6057746459656,40.6058209668566,40.6060029032372,40.6060148614518,40.6060537028121,40.6060837288466,40.6061258290282,40.6061676138442,40.6062066557831,40.6062201828294,40.6062545941842,40.606383482013,40.6063834414839,40.6063856482418,40.6063901506429,40.6063935584695,40.6063958405265,40.6063981219167,40.6064003731173,40.6064037217425,40.6064082246461,40.606412757906,40.6064172916671,40.6064206989908,40.6064229808833,40.6064252622712,40.6064275443278,40.6064309516522,40.6064354859177,40.6064388932409,40.6064411746285,40.6064434565172,40.6064468490841,40.6064502414793,40.6064525235374,40.6064548196839,40.6064571319282,40.6064593978856,40.6064627460084,40.6064672489134,40.6064706562361,40.606472937625,40.6064752196806,40.606477501571,40.6064809088934,40.6064854426539,40.6064888499761,40.6064911318652,40.6064945391873,40.6064990729479,40.606503042987,40.6065081250396,40.6065132055858,40.6065168933464,40.606522821402,40.6065307026137,40.6065385833251,40.6065445087002,40.6065476349161,40.6065499163007,40.6065521988602,40.6065544505643,40.6065570464994,40.6065615353179,40.606567540253,40.6065720580816,40.6065747160645,40.6065769979534,40.6065792800092,40.6065815312098,40.6065837527291,40.6065871156107,40.6065916191845,40.6065961227593,40.6066006256629,40.6066039885465,40.6066069600734,40.6066125734867,40.6066200809512,40.6066257252205,40.6066287576203,40.6066310093247,40.6066337935587,40.6066388460982,40.6066438964592,40.6066475243484,40.6066534222197,40.6066613034345,40.6066691841426,40.6066750798369,40.6066788955237,40.6066845096052,40.6066920170713,40.6066976304839,40.6067009786064,40.6067054672548,40.6067114711846,40.6067159598352,40.6067196838844,40.6067241572711,40.6067280674422,40.6067331199806,40.6067393103653,40.6067443788341,40.6067477405404,40.6067505247767,40.6067555773137,40.6067606276737,40.606764162254,40.606769776335,40.6067772831319,40.6067828972119,40.6067862453348,40.6067907339827,40.6067967384151,40.6068012265626,40.6068038241733,40.6068060463601,40.6068088305934,40.6068138831313,40.6068189339936,40.6068220931485,40.6068265817965,40.60683258673,40.6068370743738,40.6068402352019,40.6068452872377,40.6068503381001,40.6068534977563,40.6068579865723,40.606863990837,40.6068696203475,40.6068756262856,40.60688127005,40.6068858043155,40.6068903073865,40.6068936548381,40.6068970177184,40.6069015217966,40.6069048830029,40.6069082321283,40.6069127048455,40.6069171782337,40.6069227923156,40.6069284223264,40.6069329259019,40.6069374294755,40.6069407916855,40.6069433882902,40.6069478769396,40.6069538801959,40.6069583690128,40.6069609671249,40.6069643300038,40.6069693956245,40.6069755888572,40.6069806397188,40.606983986668,40.6069890392051,40.6069940893965,40.6069980017411,40.6070024751276,40.607005822578,40.6070080442612,40.6070113922141,40.6070170062951,40.607023761071,40.6070305170189,40.6070361458592,40.6070395087384,40.607041730252,40.6070450936341,40.607049596706,40.6070529891062,40.6070563976038,40.6070608852462,40.6070642030092,40.6070675516328,40.6070720552062,40.6070754026573,40.6070753422782,40.6070730378285,40.6070718448887,40.6070729033185,40.6070751171999,40.607077339885,40.6070795613994,40.6070829083456,40.6070873822338,40.6070907303516,40.607092951364,40.6070951740505,40.6070985357565,40.60710303933,40.6071064022086,40.6071091859347,40.607114237801,40.6071192739013,40.6071220296155,40.6071242363675,40.6071264578817,40.6071286800637,40.6071309027486,40.607133123759,40.6071364712065,40.6071409303308,40.6071442480905,40.6071464543387,40.6071498017858,40.6071542763423,40.6071576226175,40.607160985996,40.6071643785652,40.6071644087558,40.6071621865733,40.6071633427029,40.6071678313479,40.6071711492735,40.6071744967204,40.6071778595982,40.6071812070449,40.6071856804274,40.607189027874,40.6071912505586,40.6071934715665,40.6071956930773,40.6071984768023,40.6072035293379,40.6072085796934,40.6072119276444,40.6072169801787,40.6072220310387,40.6072259417043,40.6072304155866,40.6072320985419,40.6072451728612,40.6073013363281,40.6073137261495,40.6073267115239,40.6073552136733,40.6073835580371,40.6073833671173,40.6073617609398,40.6073425687551,40.6073256713481,40.6073183764619,40.6073061831415,40.6072999880011,40.6072983559485,40.6073080524284,40.6073432837949,40.6073901133617,40.6074249881522,40.6074452450987,40.6074446896861,40.6074619686499,40.6074794054524,40.6074840747161,40.6075115384901,40.607525957572,40.6075263983849,40.6075640840485,40.6075950001467,40.6076137160518,40.6076107935086,40.6076440609932,40.6076555332989,40.6076554380177,40.6076666883268,40.6076640990102,40.6076662856643,40.6077101754436,40.6077299391362,40.6077301950515,40.607741753004,40.6077650685387,40.6078090476696,40.6078207539215,40.6078229783553,40.6078324714653,40.607915165135,40.6079601656858,40.6079901936872,40.6080417407874,40.6080478256949,40.6080588655049,40.6081000747412,40.6082253172652,40.608233910391,40.6082279609011,40.6082228451349,40.6082415602829,40.6082556685207,40.6082593547637,40.6082582196452,40.6082805887455,40.6083013051492,40.6083486373531,40.608350239671,40.6083307425095,40.6083135797656,40.6083128680586,40.6083096110908,40.6083330843614,40.6083781649867,40.6083922398023,40.6083937827793,40.6083960808533,40.6083983622952,40.608400658527,40.608402970881,40.6084052820664,40.6084075937529,40.6084099054363,40.6084122171223,40.6084144837791,40.6084167059096,40.6084206303034,40.6084268228622,40.6084330155895,40.6084369861851,40.6084381873922,40.6084382616559,40.6084405590582,40.608445092202,40.6084473891005,40.6084474638669,40.6084497910046,40.6084543391031,40.6084577481545,40.6084600290917,40.6084628725813,40.6084679548278,40.6084730347281,40.6084770069988,40.6084815408136,40.6084849475191,40.6084872296285,40.60848951107,40.6084917936818,40.6084940751241,40.6084963565651,40.6084986380052,40.6085009348994,40.6085043730184,40.6085089211139,40.6085123289903,40.6085146182438,40.6085153362292,40.60858720522,40.6085978381075,40.6086781826941,40.6087005803239,40.609081573239,40.6091489827365,40.6091595400677,40.6091808683746,40.6091827973125,40.6092139530539,40.6092469589846,40.6092977582362,40.6093334651673,40.6093339426501,40.6093356218308,40.6093390149175,40.6093446442577,40.6093502880444,40.6093548223483,40.6093593254203,40.6093637992619,40.6093650216532,40.6093692912061,40.6093780706195,40.6093864927064,40.6093899450176,40.6094374875785,40.6094611593454,40.6094642795564,40.6094758953324,40.6094814634745,40.6095106102425,40.6095100149235,40.6095037008353,40.609485389754]}],[{"lng":[-73.8321287690365,-73.8321221408741,-73.8321155133685,-73.8321118577644,-73.832108952714,-73.8321075630252,-73.832106174657,-73.8321032682842,-73.8320988758532,-73.8320929665206,-73.8320877580127,-73.8320810890191,-73.8320744621757,-73.83207230482,-73.8320723816544,-73.8320709639822,-73.832068047403,-73.8320636556353,-73.8320578038212,-73.832053450908,-73.8320505760501,-73.8320521309331,-73.832058098441,-73.8320611127099,-73.8320589573335,-73.8320523276413,-73.8320442034377,-73.8320375544251,-73.8320331031645,-73.8320301088722,-73.8320271147978,-73.8320243338872,-73.8320118801268,-73.831968309281,-73.8319655148284,-73.8319347012325,-73.8319035549855,-73.8318877896614,-73.8318867446466,-73.8318853263238,-73.831885404492,-73.8318884174492,-73.8318943662927,-73.8318973805665,-73.8318974587326,-73.8318960397532,-73.8318916264802,-73.8318842413127,-73.8318768346266,-73.8318723638272,-73.8318694099338,-73.8318664940298,-73.8318635774638,-73.8318591863714,-73.8318532770526,-73.8318488064697,-73.831845869705,-73.83184352779,-73.8318429939835,-73.8318401178239,-73.8318387388107,-73.8318388367426,-73.8318389157918,-73.8318389939618,-73.8318375749832,-73.8318370041334,-73.8318346606209,-73.8318302679903,-73.8318243588944,-73.8318198858979,-73.8318168924812,-73.8318138990685,-73.8318111126718,-73.8318021516471,-73.8317962119606,-73.8317933149419,-73.8317904392279,-73.8317875630703,-73.831787642123,-73.8317906650756,-73.8317922293032,-73.831790841843,-73.831787935934,-73.8317840363572,-73.8317766698604,-73.831766820564,-73.8317594727353,-73.8317556109286,-73.8317527152341,-73.8317497995546,-73.8317482228489,-73.8317448971984,-73.8317375098442,-73.8317296318606,-73.83172562984,-73.8317174473721,-73.8317000682979,-73.8316811545274,-73.8316505901962,-73.8315948869038,-73.8315702037776,-73.8315488870368,-73.8315483259033,-73.8315439332978,-73.8315380628726,-73.8315336711459,-73.8315307546027,-73.8315278389391,-73.8315249245931,-73.8315220087098,-73.831519094363,-73.8315161778223,-73.8315132625991,-73.8315096098948,-73.8315029804647,-73.8314963530148,-73.8314941941604,-73.8314927765243,-73.8314898613012,-73.8314869456417,-73.8314840297595,-73.8314796386978,-73.8314737676179,-73.8314678972018,-73.8314620289786,-73.8314576350607,-73.8314547300572,-73.8314533417466,-73.8314519508009,-73.8314490457929,-73.8314461314532,-73.8314432155725,-73.8314403012351,-73.8314373846966,-73.8314344694773,-73.8314315538216,-73.8314286386026,-73.8314257236038,-73.8314257624828,-73.8314287758875,-73.8314288536451,-73.8314244619295,-73.8314200113444,-73.831417017051,-73.8314140618532,-73.8314111459776,-73.8314082503125,-73.8314068722202,-73.8314054726013,-73.831402556725,-73.8313996423895,-73.8313952298072,-73.8313893198593,-73.8313849094756,-73.8313819929409,-73.8313790777253,-73.8313761620734,-73.8313732468569,-73.8313703318617,-73.831367416647,-73.8313645009957,-73.8313615844625,-73.8313586701277,-73.8313557744655,-73.8313558535471,-73.8313603241185,-73.831364774921,-73.8313663111689,-73.831366390248,-73.8313649717424,-73.8313605593849,-73.8313561670152,-73.8313532906835,-73.8313488983146,-73.8313445050706,-73.831341629617,-73.8313387339591,-73.8313358187477,-73.8313329022189,-73.8313344184758,-73.8313403686196,-73.8313433815843,-73.8313434591278,-73.8313435382099,-73.8313421199246,-73.8313391653941,-73.8313361704434,-73.8313331583578,-73.8313301251823,-73.8313271109006,-73.8313241181441,-73.8313211234132,-73.8313181306593,-73.8313151945784,-73.8313123184708,-73.8313094334705,-73.8313080438537,-73.8313066551188,-73.8313037687979,-73.8313008918127,-73.831297996154,-73.8312950818278,-73.8312921277378,-73.8312891336636,-73.831286178914,-73.8312832632681,-73.8312803489394,-73.8312774324141,-73.831274516549,-73.8312716022211,-73.8312686856951,-73.8312657713707,-73.8312628757162,-73.8312629548022,-73.8312659775456,-73.8312675420201,-73.8312676504387,-73.8312647650002,-73.8312588952684,-73.8312574567771,-73.8312604508514,-73.8312619857801,-73.8312605681627,-73.8312561562529,-73.8312517445618,-73.8312473513237,-73.8312414802755,-73.8312400439831,-73.831243036737,-73.8312430762829,-73.831237926897,-73.8312298005715,-73.8312231731529,-73.8312224730227,-73.831225475772,-73.8312270422298,-73.8312256532851,-73.8312227469777,-73.8312227865244,-73.8312257799343,-73.8312273161866,-73.8312258979124,-73.8312229820516,-73.8312230215952,-73.8312260258846,-73.8312275901435,-73.831227698783,-73.8312262911613,-73.8312218779376,-73.8312174258269,-73.8312129557034,-73.8312070464348,-73.831205608829,-73.831208621571,-73.831211654528,-73.8312146690323,-73.8312176624417,-73.8312206760619,-73.8312237090173,-73.8312266830947,-73.831229597414,-73.8312340106365,-73.8312384627441,-73.8312414552746,-73.8312444489025,-73.8312444891035,-73.8312415739065,-73.8312386573878,-73.8312357417486,-73.8312357826137,-73.8312387760213,-73.8312417696488,-73.831244763056,-73.8312462993059,-73.831247834895,-73.8312508296193,-73.8312538232471,-73.8312568166533,-73.8312568561986,-73.8312539409996,-73.8312539805423,-73.8312569748289,-73.8312585095376,-73.8312585886254,-73.8312571696906,-73.8312542753637,-73.8312543531326,-73.8312573767488,-73.8312589425398,-73.831257552936,-73.831251672343,-73.8312428085621,-73.8312354228099,-73.831230970706,-73.8312279773009,-73.8312249636803,-73.8312204540209,-73.8312145247654,-73.8312091491919,-73.831201782772,-73.8311919329047,-73.8311845269373,-73.8311805474448,-73.8311776129164,-73.8311776920121,-73.8311807047514,-73.831182241002,-73.831185253962,-73.8311912021093,-73.8311942155082,-73.8311927978963,-73.8311898813846,-73.8311899218098,-73.8311929338894,-73.8311930129813,-73.8311901173409,-73.8311916333774,-73.8311975815234,-73.8312005951391,-73.831200692903,-73.8312022686987,-73.8312052823149,-73.8312082757184,-73.8312112893358,-73.8312158003126,-73.8312217677868,-73.8312262385583,-73.8312292332794,-73.8312322268996,-73.831236678779,-73.8312411302168,-73.8312411691019,-73.8312382532505,-73.8312353389366,-73.8312309257234,-73.831225016471,-73.8312206054576,-73.8312176889492,-73.8312147730976,-73.8312148139605,-73.8312178262569,-73.8312194020483,-73.8312194998105,-73.8312225134232,-73.831228462879,-73.8312314756119,-73.8312344892237,-73.8312404367012,-73.8312434500913,-73.8312449863372,-73.8312479806156,-73.8312495161987,-73.8312495952882,-73.8312481767972,-73.831245261168,-73.8312423459761,-73.8312394310085,-73.83123503779,-73.8312291689661,-73.8312277304873,-73.8312307245449,-73.8312337188207,-73.8312367315542,-73.8312397644933,-73.8312427767865,-73.8312428163305,-73.83123990114,-73.8312399415664,-73.8312429349636,-73.8312474057267,-73.8312533536349,-73.8312578259393,-73.8312622764888,-73.831266747251,-73.8312697808493,-73.8312727542544,-73.8312756707612,-73.8312800833071,-73.8312845538486,-73.8312875861278,-73.8312905990725,-73.8312935940068,-73.8312966060741,-73.8312996405489,-73.8313026734846,-73.8313027516897,-73.8312998756047,-73.8312984966523,-73.8312986139632,-73.8313009280967,-73.8313076150107,-73.8313142834727,-73.8313165571851,-73.831316634948,-73.8313152173354,-73.8313123008297,-73.8313108832175,-73.831309465605,-73.8313065504192,-73.831302156768,-73.8312962475324,-73.8312917767766,-73.8312887638328,-73.8312886856267,-73.8312915812622,-73.8312915423777,-73.8312885481066,-73.8312840753711,-73.8312781287871,-73.8312736580295,-73.8312692052846,-73.831264733867,-73.8312617015893,-73.831258726867,-73.8312543351956,-73.8312469688034,-73.8312395808807,-73.8312351287914,-73.8312321367173,-73.8312291426633,-73.8312261492682,-73.8312231556507,-73.8312186829115,-73.8312127354459,-73.8312082649043,-73.8312052699669,-73.8312022765691,-73.8311992831741,-73.831196289556,-73.8311932955012,-73.8311932559526,-73.8311961717994,-73.8311946548876,-73.8311872489483,-73.8311813203705,-73.8311768489472,-73.8311694436634,-73.8311635142071,-73.831161958629,-73.8311589061297,-73.8311529373419,-73.83114698987,-73.8311410412989,-73.8311380276854,-73.8311394466067,-73.8311423617939,-73.8311423215866,-73.8311393079726,-73.8311362756821,-73.8311332427315,-73.8311302095607,-73.831127176612,-73.8311226662946,-73.8311167370524,-73.8311108666932,-73.8311049574452,-73.8311019453654,-73.8311048409952,-73.8311107113561,-73.8311121491734,-73.8311091555518,-73.8311061608281,-73.8311031680854,-73.831098696653,-73.8310912907002,-73.8310824275967,-73.8310750589956,-73.8310706666637,-73.831067712806,-73.8310647178625,-73.8310617640089,-73.8310588497019,-73.8310559338575,-73.8310530173556,-73.8310501030515,-73.8310457107198,-73.8310398014726,-73.8310353306978,-73.8310323955214,-73.8310295185706,-73.8310266229445,-73.8310237077602,-73.8310207927972,-73.8310178776145,-73.8310149619954,-73.8310105696674,-73.8310046604187,-73.8310001889864,-73.8309972357952,-73.8309943192946,-73.8309914041118,-73.8309884884922,-73.8309855739693,-73.8309826583517,-73.8309782451498,-73.8309723359038,-73.8309678853453,-73.8309648917204,-73.8309619378659,-73.830958283893,-73.8309516549732,-73.8309450471455,-73.8309414311924,-73.8309370388666,-73.8309325680926,-73.8309295342499,-73.8309265797362,-73.8309237041154,-73.830920808495,-73.8309178928774,-73.8309149381443,-73.8309119453957,-73.8309090089032,-73.8309061332797,-73.8309032376649,-73.8309003227075,-73.8308974075324,-73.8308930152092,-73.8308856488171,-73.8308782617676,-73.830873849229,-73.8308694569099,-73.8308635863431,-73.8308591949027,-73.8308547817053,-73.8308473950967,-73.8308385313432,-73.8308311462733,-73.8308267330766,-73.8308238172435,-73.8308209029512,-73.8308165106318,-73.8308106409502,-73.8308062464364,-73.8308033321421,-73.8308004163103,-73.8307975020188,-73.8307945868487,-73.8307916912372,-73.8307888151855,-73.8307859195745,-73.8307815270414,-73.8307741593388,-73.8307667736122,-73.8307623610786,-73.8307594445915,-73.8307550342564,-73.8307491243593,-73.8307447118263,-73.8307417975365,-73.8307389019287,-73.8307360250009,-73.830733129398,-73.8307331680785,-73.8307361623663,-73.8307362019291,-73.8307332867613,-73.8307310203122,-73.830730371157,-73.8307259592856,-73.8307193119127,-73.8307169744218,-73.8307111856426,-73.8307045582767,-73.8306883781319,-73.8306871537069,-73.8306848300271,-73.8306784347855,-73.8306774436504,-73.8306700772725,-73.8306656849665,-73.8306627684832,-73.8306598541971,-73.8306569383748,-73.8306525460686,-73.8306466757391,-73.8306422834335,-73.8306393676111,-73.8306349753061,-73.8306291056377,-73.8306247133333,-73.8306217990505,-73.8306188825716,-73.8306159667505,-73.8306130524696,-73.8306101373101,-73.830607222369,-73.8306043072094,-73.8306013907316,-73.8305984751316,-73.8305955608508,-73.8305911483262,-73.8305852384362,-73.8305807876661,-73.8305763162317,-73.8305704205568,-73.8305675645298,-73.8305676952451,-73.8305663150442,-73.83056343344,-73.8305605574123,-73.8305561651137,-73.8305495168753,-73.8305413919341,-73.8305347258886,-73.8305309912664,-73.8305280380817,-73.8305251229267,-73.8305207106252,-73.8305163183281,-73.8305134420801,-73.8305105525011,-73.8305091536184,-73.8305092587669,-73.8305093565896,-73.8305094404163,-73.8305065448265,-73.8305006356028,-73.8304961654878,-73.8304932103263,-73.830490295832,-73.8304873875696,-73.8304859873691,-73.8304860934001,-73.8304846945186,-73.8304817847144,-73.8304773924223,-73.8304700260643,-73.8304640974958,-73.8304625552096,-73.8304624571657,-73.8304624152797,-73.8304219369713,-73.830369069588,-73.8303476385454,-73.8303293345698,-73.8303138662059,-73.830298564077,-73.8302828026763,-73.8302831790609,-73.8302366909081,-73.830227686714,-73.83022569562,-73.830221304665,-73.830215415024,-73.8302080680365,-73.8302052107284,-73.8302038118723,-73.8302008976156,-73.8302009363139,-73.8302039492986,-73.8302040284549,-73.8302011328893,-73.8301967397402,-73.8301908709903,-73.8301864765218,-73.8301835622667,-73.8301791706564,-73.8301733190627,-73.8301689663736,-73.8301660801571,-73.8301646919654,-73.8301633033385,-73.8301604177794,-73.8301604954004,-73.830163509703,-73.830166502457,-73.8301694967465,-73.8301724901597,-73.8301754842303,-73.8301784778642,-73.8301814712754,-73.8301830075583,-73.8301830867202,-73.8301801911588,-73.8301743208766,-73.8301699292707,-73.8301670337103,-73.8301641568438,-73.830161261284,-73.8301583454944,-73.8301554312437,-73.830151038101,-73.830145167823,-73.8301407762184,-73.8301378606512,-73.8301349455225,-73.8301320306155,-73.8301306124128,-73.8301306906964,-73.8301322256648,-73.8301352190744,-73.8301367560207,-73.8301368351845,-73.8301339383091,-73.8301280686931,-73.8301251731386,-73.8301252616496,-73.8301253703869,-73.8301239808863,-73.8301210759835,-73.8301181601997,-73.8301152459533,-73.8301123295107,-73.8301093756812,-73.8301063820541,-73.8301033873263,-73.8300989165618,-73.8300915106627,-73.8300841249941,-73.8300796729244,-73.8300766795127,-73.830073724147,-73.8300693318902,-73.8300634622785,-73.8300590700237,-73.8300561744725,-73.8300547943203,-73.8300549130721,-73.8300564882847,-73.8300595212794,-73.8300640316238,-73.830069999091,-73.8300730133915,-73.8300730918988,-73.8300716741394,-73.8300687585808,-73.83006584214,-73.8300629278978,-73.8300600114604,-73.8300570972184,-73.830055678143,-73.8300542599465,-73.8300513441681,-73.8300469519151,-73.8300410440466,-73.830036573506,-73.8300336181435,-73.830030703025,-73.8300255524139,-73.8300174277501,-73.8300108191415,-73.8300072032856,-73.8300043077404,-73.8300043473275,-73.8300073609671,-73.8300103939623,-73.8300134073827,-73.8300164010089,-73.830019395737,-73.8300209320264,-73.8300195131732,-73.8300166176284,-73.8300166967989,-73.8300197291327,-73.830022761466,-73.8300257957773,-73.830025873627,-73.8300229772051,-73.830020061649,-73.8300171474136,-73.8300127558261,-73.8300068855698,-73.8300054471467,-73.830008440554,-73.8300099768428,-73.8300100753653,-73.8300101928024,-73.8300102906668,-73.8300118269553,-73.830014821898,-73.830016376878,-73.8300149989309,-73.8300121033929,-73.830007708951,-73.8300018393587,-73.8299974471188,-73.829994532884,-73.8299916171147,-73.8299887006833,-73.8299857864501,-73.8299828909127,-73.8299800153887,-73.8299771198507,-73.8299771581167,-73.829980171756,-73.8299832047425,-73.8299862190404,-73.8299877546662,-73.8299878329635,-73.8299864141134,-73.8299834998821,-73.8299800921766,-73.8299742032373,-73.8299663263215,-73.829960435844,-73.8299555494736,-73.8299497001217,-73.8299483004108,-73.829951313386,-73.8299543074494,-73.8299573017305,-73.8299602951353,-73.8299633087687,-73.8299633879426,-73.8299589957082,-73.8299516085323,-73.8299442609452,-73.8299414049981,-73.8299415041886,-73.8299400853433,-73.8299371702384,-73.8299327766856,-73.8299269071065,-73.8299254700073,-73.829928473639,-73.8299300395059,-73.8299301467276,-73.8299287378885,-73.8299258221253,-73.829922171096,-73.8299155416227,-73.8299088747623,-73.8299051401578,-73.8299021863456,-73.8298992721225,-73.8298963623746,-73.8298949648646,-73.8298950696301,-73.8298951666231,-73.8298952713887,-73.8298968472663,-73.8298998608989,-73.8299013971897,-73.8299014823812,-73.8299015802517,-73.8299016854562,-73.8299002868477,-73.829897378417,-73.8298944619999,-73.8298915471189,-73.8298915867096,-73.8298946003422,-73.8298976326712,-73.8299006073738,-73.8299042619139,-73.8299108891786,-73.8299175575747,-73.8299198322015,-73.8299199091812,-73.8299214448093,-73.8299244590989,-73.8299274920832,-73.8299319628237,-73.8299378719784,-73.8299423238066,-73.8299438603124,-73.8299439394874,-73.8299425197656,-73.8299396055461,-73.8299352117826,-73.8299293437532,-73.8299249499922,-73.8299220348926,-73.8299176435501,-73.8299117343977,-73.8299057856551,-73.8298983791443,-73.829890991987,-73.8298865412615,-73.8298835478634,-73.8298805538087,-73.8298775604103,-73.8298745661342,-73.8298715720771,-73.8298686369643,-73.8298687161427,-73.8298717484703,-73.8298733243477,-73.8298734222261,-73.8298764358554,-73.8298823845993,-73.829886855998,-73.8298898587432,-73.8298914246109,-73.8298900364538,-73.8298871409331,-73.8298857523344,-73.8298843628635,-73.8298814571115,-73.829878542237,-73.8298756373704,-73.8298742472343,-73.8298728584212,-73.8298699535526,-73.8298685351571,-73.829868613018,-73.8298671948394,-73.8298642993218,-73.8298614244776,-73.8298585289607,-73.8298585672306,-73.8298615612848,-73.8298630975722,-73.8298631767507,-73.8298617579154,-73.8298588428238,-73.8298559279525,-73.8298530324339,-73.8298501556147,-73.8298472600998,-73.8298443450097,-73.8298414294784,-73.8298385130697,-73.8298355988564,-73.8298326831078,-73.8298297688964,-73.8298312856098,-73.8298372330211,-73.8298417037554,-73.8298446984686,-73.8298476920782,-73.8298506854692,-73.8298522217572,-73.8298523009382,-73.8298508825441,-73.8298479670143,-73.8298450528047,-73.829842136395,-73.8298421759872,-73.8298451693773,-73.8298467056639,-73.8298467841856,-73.8298453666698,-73.8298424509243,-73.8298395345168,-73.8298366203073,-73.8298337052207,-73.8298308097097,-73.8298279337719,-73.8298250373823,-73.8298221225133,-73.8298192074291,-73.8298177885965,-73.8298178771329,-73.8298179858948,-73.8298195502286,-73.829822554502,-73.8298241001386,-73.8298242086842,-73.8298228200989,-73.8298199152373,-73.8298184955293,-73.8298185934104,-73.8298172154879,-73.8298143293341,-73.8298129411824,-73.8298115519392,-73.8298086537591,-73.8298072540663,-73.829807358835,-73.8298078674842,-73.8298012606721,-73.8298060069209,-73.8298375242001,-73.8298224727733,-73.8297788496926,-73.8297799438019,-73.8297863445253,-73.829784923287,-73.8297820077734,-73.8297820473648,-73.8297850514166,-73.8297866166214,-73.8297852265043,-73.8297823223149,-73.8297838392398,-73.8297897044688,-73.8297858344982,-73.8297846504668,-73.8297848188646,-73.8297901980631,-73.8297910866527,-73.8297924424265,-73.8297903973003,-73.829787421739,-73.8297857388195,-73.8297836858646,-73.829793770928,-73.8297986509736,-73.8298126718101,-73.8298098086305,-73.8298098473414,-73.8298128476042,-73.8298144041158,-73.8298145080064,-73.8298160629791,-73.8298189002915,-73.8298194473,-73.8298169267546,-73.8298147702603,-73.8298148579169,-73.8298149660187,-73.8298150747872,-73.8298151820129,-73.8298138032242,-73.8298094110549,-73.8298066748897,-73.829809110605,-73.8298092218977,-73.8298111828988,-73.8298141856153,-73.8298145087595,-73.8298157514698,-73.8298158587008,-73.8298159681231,-73.829817543985,-73.8298205575863,-73.8298235509509,-73.8298265443136,-73.8298265832435,-73.8298236884204,-73.8298208109705,-73.8298179161464,-73.8298179557361,-73.8298209693364,-73.8298210485187,-73.8298181717292,-73.8298182509118,-73.8298212832061,-73.8298243161583,-73.8298273391061,-73.8298289056155,-73.8298304714725,-73.8298334741799,-73.829835010451,-73.8298335929505,-73.8298306825882,-73.8298292851074,-73.8298293905339,-73.8298309461607,-73.8298339664238,-73.8298369987149,-73.8298400209984,-73.8298415868492,-73.829841695394,-73.8298417908165,-73.8298418886906,-73.8298419938977,-73.8298435497408,-73.829848006858,-73.8298524581819,-73.8298539944493,-73.8298555300567,-73.8298585247327,-73.8298615183076,-73.8298645116655,-73.8298645512525,-73.829861636199,-73.8298587207031,-73.8298543083109,-73.8298483999015,-73.8298439883861,-73.8298410720131,-73.8298366611604,-73.829832190482,-73.8298291559967,-73.8298246846585,-73.8298180387941,-73.829809912749,-73.8298032855843,-73.8298025855249,-73.8298055788814,-73.829807115153,-73.8298071936754,-73.8298094702546,-73.8298161356931,-73.8298228053035,-73.8298265361146,-73.8298295296911,-73.8298325230445,-73.8298355177196,-73.8298385112936,-73.8298429617369,-73.8298474137171,-73.8298518850525,-73.8298578315107,-73.8298608470779,-73.829860924279,-73.8298624605429,-73.8298654538984,-73.829866990823,-73.8298648352129,-73.8298582058547,-73.8298515404224,-73.8298478067591,-73.829844792512,-73.8298402829044,-73.8298343638341,-73.8298314977163,-73.8298301091487,-73.8298272230163,-73.8298287792993,-73.8298347466511,-73.8298377608992,-73.8298378474519,-73.8298379559926,-73.8298402623712,-73.8298469375892,-73.8298536065338,-73.8298573375555,-73.8298603315673,-73.8298633257999,-73.8298663385041,-73.8298693714449,-73.8298723837101,-73.8298753783771,-73.8298783919636,-73.8298784698227,-73.8298755743461,-73.8298756139349,-73.8298786072853,-73.8298816012932,-73.8298845955212,-73.8298890661893,-73.8298950146183,-73.8298980281966,-73.8298951320604,-73.8298892619343,-73.8298848697851,-73.829881955615,-73.829881994323,-73.8298849885513,-73.8298850272594,-73.8298821117712,-73.8298791967223,-73.8298762818924,-73.8298763208192,-73.829879314169,-73.8298808504322,-73.8298809296071,-73.8298795114531,-73.8298765957446,-73.8298766346769,-73.8298796431434,-73.8298812247668,-73.8298813615692,-73.8298814990312,-73.829880124703,-73.829877223454,-73.8298772643634,-73.8298802585868,-73.8298847292493,-73.8298921340938,-73.8298995204596,-73.829903972429,-73.8299084430901,-73.8299143519195,-73.8299194839331,-73.8299261110808,-73.8299327791316,-73.8299365094835,-73.8299395237199,-73.8299396022355,-73.8299367065409,-73.8299367448077,-73.8299397396876,-73.829941275946,-73.8299428122053,-73.8299458048855,-73.8299458444724,-73.8299429294244,-73.8299400145975,-73.8299371191267,-73.8299371976414,-73.8299416689581,-73.8299475771243,-73.8299520284263,-73.8299550224282,-73.8299580166467,-73.8299610099847,-73.8299640235582,-73.8299670558249,-73.8299700900682,-73.8299701679194,-73.8299672724454,-73.8299643560828,-73.8299614419152,-73.8299614821623,-73.8299644748406,-73.8299689454945,-73.8299748941225,-73.8299793645559,-73.8299823587747,-73.8299838943669,-73.829982475991,-73.8299795820564,-73.82997965969,-73.8299826725989,-73.829985666594,-73.8299886668239,-73.8299902230885,-73.8299903278433,-73.8299918827884,-73.8299963414132,-73.8300022504543,-73.8300067024091,-73.830009695746,-73.8300127093086,-73.8300157413504,-73.8300187549153,-73.8300217491276,-73.8300261995452,-73.8300306514998,-73.8300351221468,-73.8300410705469,-73.8300455420727,-73.8300485354072,-73.8300515293981,-73.8300545227279,-73.8300545609921,-73.8300516468269,-73.8300531635043,-73.830059072539,-73.8300619680133,-73.8300633855144,-73.8300677972257,-73.8300737062622,-73.8300796152976,-73.8300855243373,-73.8300899956415,-73.8300915714691,-73.8300916693226,-73.8300932062292,-73.8300962097869,-73.8300977747254,-73.8300993398907,-73.8301023441015,-73.8301053374324,-73.8301097893812,-73.8301156968748,-73.8301201099049,-73.8301230256111,-73.8301274364421,-73.830131888392,-73.8301334246355,-73.8301335029151,-73.830132084094,-73.8301291690472,-73.8301262535641,-73.8301233393968,-73.8301189457201,-73.8301130778061,-73.8301119133003,-73.8301186751782,-73.8301470660322,-73.8301727865511,-73.830223231381,-73.8302771763749,-73.8302776334021,-73.8302716703048,-73.8302659580956,-73.8302756702936,-73.830307312525,-73.8303766409549,-73.8304149518778,-73.830515591433,-73.8305440226175,-73.8305887955253,-73.8306174353765,-73.8306645449982,-73.830689965988,-73.8306928522386,-73.8307086100946,-73.8307151548603,-73.8307159804384,-73.830724950189,-73.8307796422073,-73.8307987354106,-73.8308150348631,-73.8308562223087,-73.8308972858827,-73.8309227150495,-73.8309668638445,-73.8309858721275,-73.8310110952337,-73.8310302304009,-73.8310744189974,-73.8310844558497,-73.8310864726452,-73.8310894661219,-73.8310924593804,-73.8310954539557,-73.8310984474321,-73.8311014406882,-73.8311058925663,-73.8311118013044,-73.8311162518617,-73.8311192464362,-73.8311222585866,-73.8311267693422,-73.8311326982935,-73.8311370912879,-73.8311400054491,-73.8311443982257,-73.8311502669817,-73.831155399616,-73.8311620273382,-73.8311686565995,-73.8311730478376,-73.831179674903,-73.8311863028461,-73.8311899559878,-73.8311928723541,-73.8311957865199,-73.8312001979727,-73.8312061069334,-73.8312120174301,-73.8312164677685,-73.8312209383164,-73.8312268868169,-73.8312313573628,-73.8312343506163,-73.8312373438709,-73.8312403446685,-73.8312419008269,-73.8312420054651,-73.8312435603053,-73.8312465608754,-73.8312495543495,-73.8312525476,-73.8312562813661,-73.8312629477504,-73.831269577011,-73.8312747061307,-73.8312805762043,-73.8312849683252,-73.831287884033,-73.8312915384959,-73.8312981649006,-73.8313048328255,-73.8313085652731,-73.83131157851,-73.8313116556102,-73.8313087807624,-73.831308858525,-73.831311871981,-73.8313148652299,-73.831319316221,-73.8313267031295,-73.8313341073867,-73.8313385799053,-73.8313415338356,-73.8313459259586,-73.8313518355716,-73.8313563061113,-73.8313592993585,-73.8313622941411,-73.8313652967262,-73.8313668624281,-73.8313691677716,-73.8313758437003,-73.831382472741,-73.8313861239088,-73.8313905368991,-73.8313949887685,-73.8313950734317,-73.8314133154212,-73.8314539628582,-73.8314698037837,-73.8314728134361,-73.8314763521246,-73.8314792482893,-73.8314821437965,-73.8314880520893,-73.8314925226236,-73.8314955158638,-73.8314985106441,-73.8315015038839,-73.8315044977846,-73.8315089489893,-73.8315148579417,-73.8315192700569,-73.8315221851081,-73.8315265965627,-73.8315325063936,-73.8315369567216,-73.831539951279,-73.8315429438582,-73.8315474159284,-73.8315533622156,-73.8315578340655,-73.8315608273028,-73.8315638214194,-73.8315668339838,-73.8315698676299,-73.8315728415418,-73.8315772336685,-73.8315830835429,-73.8315874370202,-73.8315903325307,-73.8315947246576,-73.8316020906983,-73.8316102178979,-73.8316183402616,-73.831625009052,-73.8316287412655,-73.8316317531649,-73.8316347865895,-73.8316392571189,-73.8316451654105,-73.8316496172721,-73.8316526105063,-73.8316556179429,-73.8316571929574,-73.8316573233272,-73.8316588992204,-73.8316619051146,-73.8316663756392,-73.8316737812027,-73.831681168103,-73.8316856384071,-73.8316901493355,-73.8316960769478,-73.831700470397,-73.8317048811886,-73.8317107901381,-73.8317152426559,-73.8317182352282,-73.8317212284579,-73.8317242219079,-73.8317272257915,-73.8317287908059,-73.8317318344332,-73.8317377913543,-73.8317430023863,-73.8317496680939,-73.8317563377554,-73.8317615450529,-73.8317674919844,-73.8317705262757,-73.831772101058,-73.8317750758424,-73.8317779900203,-73.8317809055174,-73.8317852985272,-73.8317911670679,-73.8317960541924,-73.8318019429348,-73.8318098210916,-73.8318157005056,-73.8318175797956,-73.8318189693737,-73.8318233714924,-73.8318292819795,-73.8318337322961,-73.8318382028148,-73.8318441512832,-73.8318486217997,-73.831851615023,-73.831854608249,-73.8318576216735,-73.8318606557393,-73.8318636678459,-73.8318666623881,-73.8318696558296,-73.8318726490542,-73.8318771009069,-73.8318837494849,-73.8318918722785,-73.8318985008765,-73.8318991996703,-73.8318962062298,-73.8318932116886,-73.8318902184656,-73.8318886829911,-73.8318885852904,-73.8318870096372,-73.8318839962121,-73.8318824600803,-73.8318823723684,-73.8318822631378,-73.8318836527183,-73.8318865588878,-73.8318894739522,-73.8318923688171,-73.831895245679,-73.8318981412026,-73.8319010567077,-73.8319039717703,-73.8319068859582,-73.8319097821423,-73.8319126576904,-73.8319155532168,-73.8319184695996,-73.8319213837873,-73.8319243001734,-73.8319271950416,-73.8319300710271,-73.8319329665551,-73.8319358816234,-73.8319387771522,-73.8319387003124,-73.8319356853462,-73.8319326927795,-73.8319296995519,-73.8319267056675,-73.8319236928997,-73.8319236138611,-73.8319252060495,-73.8319037607493,-73.8319252733532,-73.831950081732,-73.8319972315804,-73.8320277483345,-73.8320350860737,-73.8320508837636,-73.8320674798225,-73.8320681440928,-73.8320710209706,-73.8320754137784,-73.832082799371,-73.8320902056012,-73.8320946761181,-73.8320976693401,-73.832102139855,-73.8321095454235,-73.8321154752369,-73.8321184684566,-73.8321229200933,-73.8321273706339,-73.8321289267329,-73.8321305017076,-73.8321349715623,-73.8321408805161,-73.8321453516906,-73.8321483850823,-73.8321513978386,-73.8321543917182,-73.8321573454221,-73.8321602618174,-73.8321631768952,-73.832167568384,-73.8321734773403,-73.8321779485119,-73.8321809410702,-73.8321839356081,-73.8321869290453,-73.8321884651652,-73.8321885441846,-73.8321900803026,-73.832193073522,-73.8321968072529,-73.8322034716391,-73.8322101410792,-73.8322138726154,-73.8322168860238,-73.8322213945045,-73.8322288209161,-73.8322347625007,-73.8322363361464,-73.8322364673305,-73.8322387819308,-73.8322454618234,-73.8322535883599,-73.8322602343076,-73.8322646846178,-73.8322676791505,-73.8322721296815,-73.8322780392884,-73.8322824401091,-73.8322838297176,-73.8322852193289,-73.8322896208056,-73.8322955297575,-73.8323014393659,-73.8323088240688,-73.8323162309443,-73.8323207007888,-73.8323236560337,-73.8323275562649,-73.8323349223156,-73.8323447716682,-73.8323521785415,-73.8323561549271,-73.8323591483582,-73.8323621415662,-73.8323650952738,-73.832369488083,-73.8323753976952,-73.8323798681969,-73.8323828622862,-73.8323858561539,-73.8323888098586,-73.8323917249404,-73.8323946413411,-73.8323990328354,-73.8324049029407,-73.8324100334124,-73.8324166611473,-73.8324247870241,-73.832431432752,-73.832435884603,-73.8324388778087,-73.8324418710171,-73.832444865761,-73.8324478194689,-73.8324507358702,-73.8324551460183,-73.8324595985268,-73.8324640690257,-73.8324700174778,-73.8324744877533,-73.8324774423372,-73.8324818338358,-73.8324877039461,-73.8324920967625,-73.8324950118482,-73.8324979282499,-73.8325008238046,-73.832499268174,-73.8324918426495,-73.8324829791114,-73.8324756117382,-73.832471219581,-73.8324668087724,-73.8324623569256,-73.8324593637161,-73.832454911869,-73.8324504413688,-73.8324503623656,-73.8324532579186,-73.8324561736648,-73.8324590692152,-73.8324619461203,-73.8324648416755,-73.8324677558828,-73.8324721688914,-73.8324780778439,-73.8324825288157,-73.8324862618767,-73.8324929275792,-73.8325010543392,-73.8325062414305,-73.8325092361753,-73.8325122293815,-73.8325137856736,-73.8325153590765,-73.8325183336325,-73.832521249378,-73.832524144936,-73.8325270218423,-73.8325299173996,-73.8325343089022,-73.8325401790165,-73.8325460475939,-73.8325519580851,-73.8325564285836,-73.8325594217898,-73.8325624149928,-73.8325654190642,-73.8325669844547,-73.8325692890458,-73.8325759649459,-73.8325825935674,-73.8325862467519,-73.8325891509808,-73.8325905406119,-73.8325919302486,-73.8325948351335,-73.8325977506624,-73.8326006462265,-73.8326035218171,-73.8326064173819,-73.8326108102061,-73.8326167185017,-73.8326211911971,-73.8326242030491,-73.832627236407,-73.8326302491405,-73.8326347196365,-73.8326406285889,-73.8326450207539,-73.832649433767,-73.8326568197939,-73.832664185855,-73.8326685780199,-73.8326714944338,-73.8326744088671,-73.8326773243991,-73.8326817152491,-73.8326876264024,-73.8326928365331,-73.8326995009134,-73.8327061696887,-73.8327070900763,-73.8327142988105,-73.8327201585727,-73.8327354332612,-73.8327539957029,-73.8327763372466,-73.8328348065117,-73.8328353728924,-73.8328572597595,-73.8328695372095,-73.8329198772514,-73.8329238578636,-73.8329601276305,-73.8329762017543,-73.8330540810123,-73.8331290819085,-73.8331639122983,-73.8331638439279,-73.8331682369949,-73.8331726886173,-73.8331764216639,-73.8331830867034,-73.8331897153421,-73.8331941090681,-73.8332007359487,-73.833208860523,-73.8332140491473,-73.8332170423338,-73.8332200556958,-73.8332230896773,-73.8332275601581,-73.8332334684583,-73.8332393774181,-73.8332452863768,-73.8332497380014,-73.8332512929241,-73.8332543464193,-73.8332617706099,-73.8332676995256,-73.8332706935882,-73.8332736472975,-73.8332780401468,-73.833283948446,-73.8332884189235,-73.8332913539968,-73.8332942300787,-73.8332986231489,-73.8333045321081,-73.8333089830705,-73.8333119771303,-73.8333149308427,-73.833317845739,-73.8333222574474,-73.8333267092885,-73.8333311804246,-73.8333370685484,-73.8333414225884,-73.83334431819,-73.8333487112626,-73.8333546202213,-73.8333590907004,-73.8333620444074,-73.8333649608474,-73.8333678750881,-73.8333707908678,-73.8333737064249,-73.8333773605237,-73.8333839876272,-73.8333906561793,-73.8333943863592,-73.8333973810782,-73.8334003742578,-73.833403327968,-73.8334062444082,-73.8334091601893,-73.8334120744304,-73.8334150281407,-73.8334180219811,-73.8334210160411,-73.8334254865154,-73.833431434723,-73.833435906076,-73.8334388992557,-73.8334426329503,-73.8334492993004,-73.833455927284,-73.8334600746223,-73.8334659627492,-73.833473840702,-73.8334797303679,-73.8334831380698,-73.8334860917798,-73.8334890849563,-73.8334920983044,-73.8334951309483,-73.8334981048321,-73.833501019077,-73.8335039355202,-73.8335083277187,-73.833514198532,-73.8335185894123,-73.8335230031042,-73.8335274542795,-73.8335304467981,-73.833534899293,-73.8335408073724,-73.8335452585513,-73.8335482523851,-73.8335527035636,-73.8335571545205,-73.8335616256489,-73.833567533291,-73.8335719276896,-73.8335748419343,-73.8335762602554,-73.8335786639494,-73.8335860315739,-73.8335958794005,-73.8336032858289,-73.8336043084692,-73.8336013920223,-73.833601432143,-73.8336044259778,-73.8336088957859,-73.8336148442066,-73.8336193153328,-73.8336237671687,-73.8336296752471,-73.8336355835454,-73.8336429695797,-73.8336503365415,-73.8336547287474,-73.8336591402418,-73.8336635914165,-73.8336680632006,-73.833675467424,-73.8336828549983,-73.8336872664928,-73.8336901816221,-73.8336945939987,-73.833701979373,-73.8337093849163,-73.8337145950174,-73.8337212615837,-73.8337279303493,-73.8337302031693,-73.8337302814268,-73.8337332954236,-73.833740700965,-73.8337466485013,-73.8337496813456,-73.8337526953397,-73.8337556876269,-73.8337586810124,-73.8337631521321,-73.833769100547,-73.8337735710064,-73.8337780212993,-73.8337854082063,-73.8337942708734,-73.8338002004354,-73.8338041798547,-73.8338115845123,-73.8338214340893,-73.8338302974141,-73.8338386653021,-73.8338460714993,-73.8338505419558,-73.8338534978628,-73.8338569062313,-73.8338627965606,-73.8338706731886,-73.8338766014315,-73.8338800880511,-73.8338830905306,-73.8338846560415,-73.8338876979721,-73.8338936556885,-73.8338981261423,-73.8339011206235,-73.8339026566535,-73.8339041929076,-73.8339072046925,-73.8339102379642,-73.833913212497,-73.8339176033851,-73.8339234742035,-73.833927866631,-73.8339307815467,-73.8339341914594,-73.833940080246,-73.83394795819,-73.8339538857729,-73.833957371726,-73.8339603642237,-73.8339648366527,-73.8339707837384,-73.8339767321413,-73.8339826790037,-73.833988260116,-73.8339960329378,-73.8340063735459,-73.8340167141569,-73.834024491374,-73.8340285907942,-73.8340315451609,-73.8340344602994,-73.8340373767538,-73.8340402910136,-73.8340432068121,-73.8340466151864,-73.8340525039762,-73.8340603828014,-73.8340663103761,-73.8340683383197,-73.8340703684583,-73.834076296035,-73.8340841748591,-73.8340900629895,-73.8340949471202,-73.8341008560728,-73.8341063132127,-73.83411371874,-73.8341235674323,-73.8341309729622,-73.834134950608,-73.8341394017691,-73.8341453107198,-73.834149761003,-73.8341527556915,-73.8341557094003,-73.8341593648359,-73.8341659919413,-73.8341741169439,-73.8341807626749,-73.8341866709674,-73.8341911227857,-73.8341941159359,-73.8341970711804,-73.8342007257382,-73.8342061670721,-73.8342073521879,-73.834215479387,-73.8342221251168,-73.8342265762782,-73.834229570085,-73.8342325237907,-73.834236916889,-73.8342428258409,-73.8342472962811,-73.8342502513047,-73.834254642205,-73.8342605511557,-73.8342650237934,-73.8342694740746,-73.8342739258926,-73.8342769190398,-73.8342798727469,-73.8342827885518,-73.8342857028177,-73.8342886192837,-73.8342915348693,-73.8342944500152,-73.8342974030649,-73.834300397529,-73.8343033908944,-73.8343063840392,-73.8343093399433,-73.8343133626767,-73.8343210975891,-73.8343314382017,-73.834341778813,-73.8343495558038,-73.8343541495501,-73.834360077123,-73.8343679557242,-73.8343712367234,-73.8343738841733,-73.8343773685769,-73.8343803235988,-73.8343832387532,-73.8343861530213,-73.834390547442,-73.8343964160792,-73.8344008091806,-73.8344066986368,-73.834415561296,-73.8344229482018,-73.8344288564952,-73.8344347654468,-73.8344391769493,-73.8344425868788,-73.8344484763349,-73.8344563538401,-73.8344637385472,-73.8344701394197,-73.8344745515827,-73.8344789446884,-73.8344848536408,-73.8344908011493,-73.834496709442,-73.8345011032098,-73.834504017484,-73.8345054373883,-73.8345073483308,-73.8345132380075,-73.8345211159544,-73.8345270444064,-73.8345310235778,-73.8345369524689,-73.8345448299755,-73.8345507187735,-73.8345548654869,-73.8345614917214,-73.8345696182649,-73.8345758615397,-73.8345770038541,-73.8345851275403,-73.8345917568568,-73.8345968858676,-73.8346027553939,-73.8346078887994,-73.8346145159187,-73.8346211450171,-73.8346252910702,-73.8346311805318,-73.8346390580421,-73.8346449869306,-73.8346499486188,-73.8346558970004,-73.8346603674293,-73.8346633211399,-73.8346662376203,-73.8346691534399,-73.8346735447971,-73.8346794152032,-73.8346847925965,-73.834692160232,-73.8347020089325,-73.8347093750301,-73.8347147504454,-73.8347206594009,-73.8347256246055,-73.834731552835,-73.8347394294657,-73.8347468163735,-73.834751759229,-73.8347562289959,-73.8347621379522,-73.8347665317282,-73.8347694460157,-73.8347738382535,-73.8347812043556,-73.8347893309023,-73.8347974545918,-73.8348063172573,-73.834815182121,-73.8348218105652,-73.8348269398045,-73.8348328494226,-73.8348373205065,-73.8348402735544,-73.834844667115,-73.8348520340966,-73.8348594188103,-73.8348638318622,-73.8348667461511,-73.8348711585454,-73.8348778071393,-73.8348859308285,-73.8348940567175,-73.8348992453106,-73.8349022384387,-73.834905194347,-73.8349095859319,-73.8349169520347,-73.8349243396054,-73.8349302476854,-73.8349366501004,-73.8349440361325,-73.8349519136429,-73.8349578039919,-73.8349612102052,-73.8349656232578,-73.8349715322179,-73.834975942415,-73.8349803359814,-73.8349862042056,-73.8349913382891,-73.8349979647575,-73.8350045938663,-73.8350082451608,-73.8350126582168,-73.8350200442493,-73.8350274118961,-73.8350332805654,-73.835039150989,-73.8350435432387,-73.8350464588554,-73.8350498681504,-73.8350557569635,-73.8350636342597,-73.8350695239536,-73.8350729301713,-73.8350758854219,-73.8350788785459,-73.8350818329173,-73.8350847487522,-73.8350876645917,-73.8350890823291,-73.835091978019,-73.8350978482284,-73.8351027345997,-73.8351086249558,-73.8351165015961,-73.835122380454,-73.8351242613182,-73.83512565203,-73.835128557027,-73.8351329492837,-73.8351403167158,-73.8351477023185,-73.8351521145013,-73.83515650698,-73.8351623771931,-73.8351667687921,-73.8351696830933,-73.8351740775533,-73.8351799462303,-73.8351858164434,-73.8351916860017,-73.8351975562197,-73.8352034244575,-73.8352092946751,-73.835215203642,-73.8352196747202,-73.8352226299734,-73.8352255442789,-73.8352284599049,-73.8352313750897,-73.8352342915937,-73.8352372065592,-73.8352401217462,-73.8352430360529,-73.8352459518981,-73.8352503441635,-73.8352562143857,-73.8352606066502,-73.835263522498,-73.8352664368046,-73.8352693526528,-73.835270771059,-73.8352706922489,-73.835272112194,-73.8352750265045,-73.8352794203096,-73.8352853290607,-73.835289799479,-73.8352927531974,-73.8352956697049,-73.8352985848955,-73.8353029765037,-73.8353088467283,-73.8353132383372,-73.8353161539683,-73.8353175725988,-73.8353189925455,-73.8353219068597,-73.8353248227103,-73.8353277764281,-73.8353307708667,-73.8353337248058,-73.8353371338949,-73.8353430233859,-73.8353509009165,-73.8353567912884,-73.8353616746,-73.8353675450495,-73.8353726769606,-73.8353793041125,-73.8353859126627,-73.8353895265557,-73.8353924216104,-73.8353953381252,-73.8353982431413,-73.835399632991,-73.8354010219688,-73.8354039269817,-73.8354073376126,-73.8354132266704,-73.8354211039877,-73.835428488724,-73.8354348909411,-73.8354393020374,-73.8354436956347,-73.8354495452913,-73.8354524022672,-73.8354523048667,-73.8354552005845,-73.8354610701618,-73.8354669397412,-73.8354728099815,-73.8354786802211,-73.8354845489223,-73.8354889420819,-73.8354918564031,-73.8354947722625,-73.8354991844631,-73.8355036349651,-73.8355066294027,-73.8355096420036,-73.8355141518194,-73.8355200607978,-73.8355244150014,-73.8355273107251,-73.8355287284892,-73.8355286505698,-73.8355300683354,-73.8355329841956,-73.8355329454586,-73.8355299322014,-73.8355298534055,-73.8355327497901,-73.8355341690936,-73.8355340716983,-73.8355354500656,-73.8355383457917,-73.8355412616553,-73.8355441759816,-73.8355470925047,-73.835550008149,-73.8355529233552,-73.8355558383403,-73.8355602315081,-73.8355661404927,-73.8355706106941,-73.8355735646379,-73.835576481164,-73.8355793954893,-73.8355823111366,-73.835585206866,-73.8355880826796,-73.8355909799455,-73.8355938942736,-73.8355983051647,-73.835604216349,-73.8356086272379,-73.8356115415669,-73.8356144388374,-73.8356173150905,-73.8356202108228,-73.8356231260319,-73.835626021765,-73.8356288980192,-73.8356317939728,-73.8356347096209,-73.8356376248325,-73.835641280345,-73.8356479075203,-73.8356545167588,-73.8356551760743,-73.8356521630351,-73.8356491683767,-73.8356461752554,-73.8356431821366,-73.8356401874748,-73.8356386515223,-73.8356385547938,-73.8356384379312,-73.8356383392244,-73.8356397591939,-73.8356426735285,-73.8356455894033,-73.8356485037385,-73.8356484650012,-73.8356454718807,-73.835643935925,-73.8356438571367,-73.8356452771086,-73.8356481914429,-73.8356511070978,-73.8356555188737,-73.835661427871,-73.8356658409662,-73.835670232608,-73.8356761028704,-73.8356775414431,-73.8356745474391,-73.8356730114853,-73.8356744308,-73.8356773457955,-73.8356773050839,-73.8356743126191,-73.8356727766654,-73.8356726991978,-73.8356746119741,-73.8356805008388,-73.8356883788454,-73.8356942484535,-73.8356976162016,-73.8357004924682,-73.835703368294,-73.8357062640372,-73.8357091799136,-73.8357120756574,-73.835714951927,-73.8357178485465,-73.8357207628883,-73.8357236586332,-73.8357265357835,-73.8357294122718,-73.83573079132,-73.8357306939396,-73.8357321117202,-73.8357350074669,-73.8357363880546,-73.8357377872391,-73.8357406829869,-73.8357420613742,-73.8357419672401,-73.8357419639977,-73.8357404280433,-73.8357377191237,-73.8357358602331,-73.8357358758743,-73.8344626562024,-73.8343738656812,-73.8343040247909,-73.8342263135761,-73.8341410118183,-73.8340484266342,-73.83394889137,-73.8338427644016,-73.8337304278445,-73.8336122861771,-73.8336103121768,-73.8335985732963,-73.8335435853963,-73.8333572612979,-73.8333379717765,-73.8333265974304,-73.8333096930096,-73.8333048816644,-73.8333004109493,-73.8332937424896,-73.8332870764438,-73.8332818658343,-73.8332759173069,-73.8332729037895,-73.8332728248394,-73.833271288689,-73.8332682953487,-73.8332653026665,-73.8332623091046,-73.8332593144435,-73.8332563210996,-73.8332533275343,-73.8332503328739,-73.8332473401905,-73.8332428874522,-73.8332369794996,-73.8332325276389,-73.8332280569215,-73.8332221081735,-73.8332176367961,-73.8332146434499,-73.8332101727313,-73.8332042239807,-73.833199015563,-73.8331923466539,-73.8331856810407,-73.8331809641285,-73.8331805995391,-73.8331735581814,-73.833163708291,-73.8331563030011,-73.8331523235664,-73.8331493293396,-73.8331463353321,-73.8331433419814,-73.8331388712591,-73.8331329218447,-73.8331284511216,-73.8331254577699,-73.8331224628806,-73.8331194695326,-73.8331194313717,-73.8331223271149,-73.8331237062295,-73.8331251053032,-73.83312802101,-73.8331309362779,-73.8331338320254,-73.8331330162441,-73.8331263275896,-73.8331196615298,-73.83311592828,-73.8331129342707,-73.8331099409195,-73.8331069466885,-73.8331032158574,-73.8330965460593,-73.8330876835691,-73.8330788188797,-73.8330706956249,-73.8330640451292,-73.8330595750586,-73.8330565428811,-73.8330535226901,-73.8330519672297,-73.8330518620881,-73.8330532620372,-73.8330561704291,-73.8330590848172,-73.8330620014039,-73.8330649173311,-73.8330678130807,-73.833069191307,-73.8330705910381,-73.8330734967698,-73.8330748851969,-73.8330756946498,-73.8330762740692,-73.8330791800172,-73.8330820966058,-73.8330865076752,-73.8330924169605,-73.8330948773195,-73.8330880965508,-73.8330889176015,-73.8330873776933,-73.8330844624214,-73.8330800506905,-73.8330741407417,-73.8330696899664,-73.8330652172526,-73.8330593092833,-73.8330534396956,-73.8330460723322,-73.8330386858879,-73.8330342344525,-73.8330312404344,-73.8330282865568,-73.8330253699697,-73.8330224555782,-73.8330195396497,-73.8330151263815,-73.8330092184129,-73.8330047665377,-73.8330017731783,-73.8329987782795,-73.8329952936291,-73.8329893650393,-73.8329814879635,-73.8329755578331,-73.832972070327,-73.832969116452,-73.8329662005246,-73.8329617885758,-73.8329558792851,-73.8329514668967,-73.8329485509689,-73.8329441390207,-73.8329396685012,-73.8329366354306,-73.8329336221061,-73.8329306285223,-73.8329276278466,-73.8329260721525,-73.8329259672206,-73.8329244115248,-73.8329214115047,-73.8329184181409,-73.8329154139189,-73.8329138497756,-73.8329137419558,-73.8329136529968,-73.8329121168239,-73.8329091234587,-73.8329053917342,-73.8328987232357,-73.8328920571564,-73.8328883232328,-73.8328853298648,-73.8328823364982,-73.8328793415911,-73.8328778054173,-73.83287772644,-73.8328791463438,-73.8328820607328,-73.8328834806367,-73.83288340166,-73.832881865483,-73.8328788718965,-73.8328758791878,-73.8328729239869,-73.8328700087198,-73.8328670930104,-73.8328641764218,-73.8328597660093,-73.8328553132457,-73.8328523205348,-73.8328493262879,-73.8328463322593,-73.832843338887,-73.8328403446378,-73.8328373506085,-73.8328328791989,-73.8328269326069,-73.8328239183917,-73.8328238307489,-73.832823721595,-73.832825111331,-73.8328280163964,-73.8328309329838,-73.8328353455985,-73.8328412546788,-73.8328457054668,-73.8328486988377,-73.8328516533805,-73.8328545686498,-73.8328574643942,-73.8328573876121,-73.8328543740563,-73.8328471032982,-73.8328450479487,-73.832842437641,-73.8328403211727,-73.8328395219301,-73.8328366060007,-73.8328336916109,-73.8328307763402,-73.8328278606314,-73.8328249447002,-73.8328220294301,-73.8328191137221,-73.8328147212917,-73.8328088119921,-73.8328028631996,-73.8327971480725,-73.8327969150667,-73.8327924443133,-73.8327894496213,-73.8327849788672,-73.8327790322708,-73.832774559976,-73.8327715659422,-73.8327678348672,-73.8327611665773,-73.8327544996059,-73.832750766332,-73.8327477629753,-73.8327461966196,-73.8327438941098,-73.832737214953,-73.8327305501789,-73.8327298474513,-73.8327282740964,-73.8327311698376,-73.8327370403078,-73.8327384788535,-73.8327354646285,-73.8327353871803,-73.8327382822602,-73.8327411979695,-73.8327441132395,-73.832744073747,-73.8327410595203,-73.8327409827302,-73.8327438784752,-73.8327438389796,-73.8327408380689,-73.8327392832368,-73.8327391787274,-73.8327361451935,-73.8327302292261,-73.832725099091,-73.832718470287,-73.8327118033103,-73.8327080709101,-73.8327051148241,-73.832702200435,-73.8326992845069,-73.8326963701164,-73.8326919568404,-73.8326875047247,-73.8326845113427,-73.8326815177437,-73.832679981555,-73.8326784453674,-73.8326779927349,-73.8326507177147,-73.8326186193822,-73.832605696646,-73.8326051641721,-73.8326032091814,-73.8326002157943,-73.8325972208677,-73.8325942274771,-73.8325912340894,-73.8325882391612,-73.8325852271252,-73.8325851481264,-73.832588043864,-73.8325880043662,-73.8325850116369,-73.8325820173656,-73.8325790233165,-73.8325760299272,-73.8325730356568,-73.8325700416088,-73.8325670482189,-73.8325625774416,-73.832555171425,-73.8325477847189,-73.8325433139422,-73.8325402803917,-73.8325372683473,-73.8325352223963,-73.8325264443197,-73.832507308465,-73.8325092712305,-73.832506931419,-73.8325053752479,-73.8325052707184,-73.8325037152062,-73.8325006949582,-73.8324991192561,-73.8324990216006,-73.8324974860558,-73.8324944824573,-73.8324929169575,-73.8324913512403,-73.8324883485132,-73.8324853535769,-73.8324823415266,-73.8324793070865,-73.8324762941563,-73.8324733000978,-73.8324703066961,-73.8324658352494,-73.8324598877344,-73.8324539375798,-73.8324465315484,-73.8324391457072,-73.8324346935718,-73.8324309631245,-73.8324242941357,-73.8324161705902,-73.832409521575,-73.8324050700994,-73.8324035332326,-73.8324034542212,-73.8324004421639,-73.8323944933256,-73.8323900218746,-73.8323870282518,-73.8323840357251,-73.8323810802903,-73.8323781650193,-73.8323737526092,-73.8323678432723,-73.8323633911354,-73.8323603977285,-73.8323574043257,-73.832354409381,-73.832351455485,-73.8323485410927,-73.8323456245035,-73.832341971749,-73.8323353420491,-73.8323272191593,-73.8323200768727,-73.8323126916905,-73.8323048123587,-73.8322988843695,-73.8322953968155,-73.8322924025296,-73.8322894084638,-73.8322864545652,-73.8322820612486,-73.8322761923052,-73.8322717989891,-73.8322688832851,-73.8322659686774,-73.8322615553874,-73.8322571041283,-73.8322526326729,-73.8322467233377,-73.832242330904,-73.8322394156377,-73.8322350225464,-73.832229114751,-73.8322231650281,-73.8322172170626,-73.832212745604,-73.8322082934637,-73.8322023847896,-73.832197923322,-73.8321963577971,-73.8321940552325,-73.8321873766878,-73.8321807109895,-73.8321769772364,-73.832173983824,-73.8321709888744,-73.8321679954629,-73.8321650020515,-73.8321605499067,-73.8321546405722,-73.8321487318945,-73.832142822557,-73.8321383712941,-73.8321353778816,-73.8321324217853,-73.8321287690365],"lat":[40.6095166423723,40.6095154490972,40.6095142569953,40.609511967394,40.6095091216864,40.6095040406712,40.6094989591552,40.6094961151209,40.6094938190819,40.6094937588506,40.6094959586076,40.609497016529,40.6094958244258,40.60949242378,40.609487920705,40.6094845276734,40.6094822463542,40.6094799496447,40.60947651177,40.6094719650311,40.6094674301684,40.6094629419853,40.6094596240758,40.6094562770566,40.609452876916,40.609451683132,40.6094516015686,40.6094515342225,40.6094526146477,40.6094548362336,40.6094570584899,40.6094584323542,40.6094470566729,40.6094346985127,40.609415601617,40.609389070855,40.609381605604,40.6093735396328,40.6093723101147,40.6093689182526,40.6093644141744,40.6093610659851,40.6093588745236,40.6093555270061,40.6093510234305,40.6093476303949,40.6093464596117,40.6093463851489,40.6093474359485,40.6093496428059,40.6093496138582,40.609347331362,40.6093450500376,40.6093427533212,40.6093426930775,40.609344901107,40.6093437445441,40.6093400526256,40.6093392113502,40.6093346776529,40.6093290334165,40.609323404073,40.6093189004987,40.6093143969232,40.6093110050595,40.6093105579263,40.6093087225648,40.6093064270177,40.6093063667729,40.609308573625,40.6093107963794,40.6093130174584,40.609315086221,40.6093166530769,40.6093105865258,40.6093071792637,40.6093026450632,40.6092981125374,40.6092936089631,40.6092896970549,40.609284646158,40.6092795646395,40.6092767200952,40.6092744284509,40.6092732287143,40.6092731291938,40.6092708023464,40.6092662589953,40.6092628512315,40.6092605699054,40.6092601914942,40.6092593945474,40.6092593194019,40.6092592393494,40.6092584342081,40.60925173915,40.6092375192822,40.6092220432075,40.609181214611,40.6091472813709,40.6091279635868,40.6091217010955,40.6091211507771,40.6091188540464,40.6091165425848,40.6091142463575,40.6091119645219,40.60910968252,40.6091074011901,40.6091051193553,40.6091028385278,40.6091005560218,40.6090982741876,40.6090959850738,40.6090947924311,40.6090935991209,40.609090199467,40.6090868070983,40.6090845257662,40.6090822432607,40.6090799619275,40.6090776651966,40.6090753542333,40.6090730415954,40.6090707313058,40.6090684345699,40.6090655888456,40.6090605078242,40.6090554257936,40.6090525822472,40.6090503004127,40.609048019581,40.6090457370762,40.6090434557408,40.6090411744073,40.6090388919004,40.6090366105667,40.6090343292333,40.6090320773615,40.6090287293523,40.6090242257763,40.6090219290423,40.6090230106175,40.6090252321875,40.6090252032262,40.6090229212211,40.609019512946,40.609013869208,40.6090093509002,40.6090070695649,40.6090047875617,40.6090036167603,40.6090035564918,40.6090023856933,40.6090001043565,40.6089978230215,40.6089955405132,40.6089932596807,40.6089909783459,40.6089886970106,40.608986414502,40.6089841331647,40.6089818518306,40.6089784440567,40.6089739404827,40.6089717336449,40.6089706520723,40.6089672891652,40.6089627862613,40.6089593937221,40.6089582224171,40.6089559261821,40.6089513931422,40.6089490969069,40.6089467991624,40.6089422671287,40.6089388586843,40.6089365773483,40.6089342955077,40.6089320590386,40.6089298669376,40.6089265189299,40.6089220153535,40.6089175117795,40.6089141199105,40.6089140897756,40.6089163113425,40.6089196595188,40.6089241334609,40.6089274804612,40.6089297032037,40.6089319242681,40.6089341458378,40.608932990435,40.608928457227,40.6089244857315,40.6089194052088,40.6089143236822,40.6089103531899,40.6089058199802,40.6089024133776,40.6089001308691,40.6089001007336,40.6089023229707,40.6089022928342,40.608900010826,40.6088977294899,40.6088954476478,40.6088931656391,40.6088908843027,40.608888602963,40.6088863204538,40.6088829131802,40.6088784102763,40.6088744988839,40.6088694491671,40.6088632554329,40.6088592854434,40.6088569734659,40.6088547073631,40.6088524846241,40.6088491228892,40.6088457298474,40.6088445590417,40.6088433887387,40.6088410926657,40.6088387805178,40.6088365145856,40.6088342923477,40.6088320399743,40.6088308615514,40.6088307799272,40.6088295866011,40.6088273271106,40.6088245423245,40.6088194914383,40.6088144092403,40.6088115658537,40.6088093134803,40.6088070924166,40.6088037290087,40.6088003359656,40.6087980546256,40.608795803425,40.6087930174684,40.608787966579,40.6087817738503,40.6087778192646,40.6087766484557,40.6087777300208,40.6087799368537,40.6087798765767,40.6087776094694,40.60877426247,40.6087697885307,40.6087664398585,40.6087642182924,40.608760871294,40.6087563973544,40.608755301054,40.6087575828941,40.6087587537029,40.6087576728072,40.608755450569,40.6087532290026,40.6087509783054,40.6087486957942,40.6087464144537,40.6087441331145,40.608741880743,40.6087396591763,40.6087374374424,40.6087352158756,40.6087318524674,40.6087284895609,40.6087262684985,40.6087240462616,40.6087218246945,40.6087195723211,40.6087172909829,40.6087150397822,40.6087128175462,40.6087094546382,40.6087049510641,40.6087015586904,40.6086981514185,40.6086936478424,40.6086897359489,40.6086846857315,40.6086796035328,40.608677855275,40.6086777653653,40.6086776908598,40.6086787724255,40.608680993992,40.6086843426658,40.6086888001972,40.6086898668609,40.6086875599621,40.6086863595185,40.6086862594451,40.6086873113738,40.6086895227792,40.6086883672076,40.6086838626283,40.6086805156297,40.608677152725,40.6086738052241,40.6086716131277,40.6086682656271,40.6086648732546,40.6086625912427,40.6086603395407,40.6086569920382,40.6086524884641,40.6086490811885,40.6086468442185,40.6086446516192,40.6086413046214,40.6086356757803,40.6086300605019,40.6086267130013,40.6086244914354,40.6086211432645,40.6086166847303,40.6086133666964,40.6086111598641,40.6086089382996,40.608606717236,40.6086056356699,40.6086045547731,40.6086023029013,40.6086000210591,40.6085977397218,40.6085965694157,40.6085965091397,40.6085953383338,40.6085930558201,40.6085907744799,40.6085885232811,40.6085851751081,40.6085795604996,40.6085739316585,40.6085705841574,40.6085683920611,40.6085650445585,40.6085616970571,40.6085595044547,40.6085561574553,40.6085527940472,40.608550572314,40.6085472100774,40.6085427060007,40.6085393134599,40.6085370316183,40.6085347507824,40.6085324682714,40.6085301727005,40.6085278612252,40.6085255934467,40.6085233718812,40.6085211508185,40.6085178021431,40.6085133298781,40.6085099812019,40.6085077294986,40.6085054486626,40.6085031957878,40.6085009740534,40.6084987672203,40.6084965757905,40.6084943677866,40.6084932873903,40.6084910805564,40.6084866071189,40.6084855108164,40.6084877928262,40.6084889636321,40.6084867567973,40.6084822828548,40.6084789358536,40.6084767136176,40.6084733656097,40.6084688921728,40.6084644187335,40.608459915158,40.6084553814468,40.608449738376,40.6084429819236,40.6084373749313,40.6084351906144,40.6084341320669,40.6084307762738,40.6084262733676,40.608422880829,40.6084205989878,40.6084172064491,40.6084138140779,40.6084115320709,40.6084092359993,40.6084091757269,40.608411382562,40.6084147305684,40.608419234144,40.6084226414171,40.6084248937916,40.6084271153584,40.6084293221902,40.6084315142937,40.608433721128,40.6084348020241,40.6084370088571,40.6084414822964,40.6084425785968,40.6084402818561,40.6084390809128,40.6084390059018,40.6084400879703,40.6084423090363,40.6084445306018,40.6084467523358,40.6084489750746,40.6084511819039,40.6084533733325,40.6084555801647,40.6084578029011,40.608460025137,40.6084622462002,40.6084644684357,40.6084666894977,40.6084689423738,40.6084712232119,40.6084734601808,40.6084745104344,40.6084755770974,40.608477783927,40.6084788353531,40.6084799015113,40.6084843891792,40.6084899883829,40.6084933074169,40.6084954990098,40.6084976904331,40.608501037932,40.6085044314799,40.6085067123184,40.6085089641883,40.6085123116872,40.6085167856257,40.6085212595632,40.6085257335003,40.6085302064324,40.6085346649641,40.6085357311202,40.6085334196367,40.6085333598571,40.6085367080275,40.6085401158079,40.6085424267891,40.6085446938981,40.6085469149585,40.60854913719,40.6085513582517,40.6085535655808,40.6085546170008,40.6085545265771,40.6085533261221,40.6085510293735,40.6085510004052,40.6085532219652,40.6085531913215,40.6085509104822,40.608548629138,40.6085463471227,40.6085440652781,40.608541769031,40.6085417087455,40.6085439162407,40.6085427596592,40.6085382264426,40.6085348186603,40.6085325378189,40.6085302564751,40.6085279751309,40.6085256926132,40.6085233958623,40.6085233367477,40.6085255435703,40.6085255122559,40.6085232309091,40.6085209500669,40.6085186682187,40.6085163873772,40.6085141048588,40.6085129340404,40.608512874254,40.6085139558117,40.6085161768685,40.6085161472274,40.6085138582616,40.6085126644149,40.6085103463098,40.6085058042977,40.608503508214,40.608505715035,40.6085101889658,40.6085101593229,40.6085056251003,40.608502217818,40.6084999364706,40.608499906827,40.6085021285538,40.6085009724698,40.6084964399222,40.6084930309641,40.6084907496172,40.6084884675998,40.6084861715145,40.6084849710506,40.6084848965203,40.6084837256988,40.6084814284399,40.6084791174459,40.6084768206905,40.6084756498673,40.6084755753357,40.6084754853948,40.6084754108643,40.6084742400401,40.60847195869,40.608469676672,40.6084673805837,40.6084650684157,40.6084627711511,40.6084604903053,40.6084582089546,40.6084559271036,40.6084536450836,40.6084502377979,40.608445704744,40.6084422974582,40.6084400001956,40.60843879922,40.6084387251871,40.6084375543614,40.6084352723385,40.6084341015157,40.6084340412143,40.6084328703879,40.6084305890379,40.608427181751,40.6084226491971,40.6084192402347,40.6084169890327,40.608414767983,40.6084125156097,40.6084102342583,40.6084084599682,40.6084079517334,40.6084067809073,40.6084067151624,40.6084066907785,40.6084066323288,40.6084054384702,40.608395795774,40.6083934691662,40.6083928530885,40.6083927882153,40.6083927773735,40.6083915768958,40.608389279629,40.6083869982738,40.6083847174244,40.6083824355675,40.6083801388029,40.6083778272955,40.6083755305305,40.6083732491757,40.6083709524104,40.6083686409031,40.6083663441374,40.6083640627844,40.608361780758,40.6083594994026,40.6083572175468,40.6083549355221,40.6083526541678,40.6083503723105,40.6083480902836,40.6083458089281,40.6083435275745,40.6083423567421,40.6083422969349,40.6083433773047,40.6083455841109,40.6083447734575,40.6083391137929,40.6083316086724,40.6083259632455,40.6083218072861,40.6083172730538,40.6083149762854,40.6083149088542,40.6083148265131,40.6083158855219,40.6083181001139,40.6083180699601,40.6083157879332,40.6083146170985,40.6083123203287,40.60830778777,40.6083040038803,40.6082994850596,40.6082934811317,40.6082878517884,40.608282973291,40.6082795659981,40.6082795056848,40.6082817129925,40.6082816828349,40.6082794014782,40.6082767435248,40.6082722252045,40.6082662207752,40.6082617024569,40.6082590461763,40.6082567494049,40.6082555484118,40.6082566145352,40.6082603528548,40.6082659811925,40.608268365743,40.6082582738709,40.6082410529192,40.6082146168254,40.6081882128187,40.608178521699,40.6081592992422,40.6081490147994,40.6081448421999,40.6081205364098,40.6081176037444,40.6081168196142,40.6081145228349,40.6081133372415,40.6081110102955,40.6081053517926,40.6081008322981,40.6080985509344,40.6080962997325,40.6080929515869,40.6080884486834,40.6080850413828,40.6080827440967,40.6080804330709,40.6080781362852,40.608075854921,40.6080735581391,40.6080701201681,40.6080655716818,40.6080616011605,40.608056520123,40.6080514374095,40.6080474680617,40.6080429649883,40.6080396170133,40.6080373948033,40.6080351737682,40.608032951559,40.6080307300209,40.6080285073093,40.6080262856025,40.6080229238836,40.6080184193048,40.6080150120036,40.6080127009746,40.6080104041924,40.6080069968909,40.6080024626472,40.6079990553455,40.6079967739784,40.6079944926135,40.6079921958284,40.6079898842953,40.6079875880146,40.6079853061447,40.607983024778,40.6079807427415,40.6079773503546,40.6079728467796,40.6079694838867,40.6079672623486,40.6079638994587,40.6079593953823,40.607955988078,40.6079536770477,40.6079502692425,40.6079452019465,40.6079390103911,40.6079339276758,40.6079310840953,40.6079288022246,40.6079265208588,40.6079242388193,40.6079242098265,40.607926430861,40.6079286523964,40.6079308598553,40.6079319110434,40.6079318364641,40.6079329168125,40.6079351390193,40.6079351088506,40.6079328120635,40.6079305010299,40.6079282037399,40.6079247964355,40.6079191521748,40.6079123968981,40.6079067828067,40.6079023088974,40.6078978509097,40.6078945329352,40.6078911849625,40.6078866813879,40.6078832895035,40.6078810069618,40.6078787255913,40.6078764442241,40.6078741616808,40.6078718803133,40.6078684877567,40.6078650953689,40.6078628133289,40.6078605172112,40.6078604573788,40.6078626641655,40.6078626339956,40.6078603521237,40.6078591746496,40.6078590917693,40.6078567731064,40.6078522317346,40.6078488244289,40.6078465720557,40.6078432250889,40.6078387511809,40.6078354037109,40.6078331826788,40.6078309604756,40.6078275975861,40.6078242051969,40.6078207978915,40.6078162943178,40.6078118204085,40.6078073464992,40.6078028725926,40.6077983695196,40.6077949617104,40.6077926803401,40.6077903983015,40.6077881021834,40.6077857911459,40.607783524022,40.607781301817,40.6077779389277,40.6077723100882,40.6077655548094,40.6077599252988,40.6077565624094,40.6077543408767,40.6077498527204,40.6077442084625,40.6077407999842,40.6077385038616,40.6077361928248,40.6077338955324,40.607731614666,40.6077293321218,40.6077270507494,40.6077247693802,40.6077213615713,40.6077168278274,40.607713420521,40.6077111693185,40.6077078206771,40.607703348445,40.6076999998044,40.607696638087,40.6076921328366,40.6076887409496,40.6076864595802,40.6076841729576,40.6076829873528,40.6076829070131,40.6076817214053,40.607679419527,40.6076759825529,40.6076714637239,40.6076681167575,40.6076658945549,40.6076636730227,40.6076614503164,40.6076581033506,40.6076535997769,40.6076513029855,40.6076512283954,40.6076489014315,40.6076432429237,40.6076376129123,40.6076342205221,40.6076319384802,40.607629642356,40.6076273308128,40.6076250641924,40.6076222782684,40.607617227901,40.6076110341654,40.6076070795613,40.6076047976857,40.6076025085233,40.6076013157886,40.6076023735871,40.6076045886615,40.6076045584906,40.607602276449,40.6075996184781,40.6075951006569,40.6075890957232,40.6075834668814,40.6075774619477,40.6075718478593,40.6075685008952,40.6075651375047,40.607560258004,40.607554629666,40.607548624733,40.6075441069102,40.6075414506166,40.607539168069,40.6075368866964,40.6075346343231,40.6075312868566,40.6075268129504,40.6075257171877,40.6075280068585,40.6075292007634,40.6075281412917,40.6075247872024,40.6075202831228,40.6075169202336,40.6075135727672,40.6075090993638,40.6075068925816,40.6075069529241,40.6075058709054,40.6075025080172,40.6074980044434,40.6074946120519,40.6074923300112,40.6074900338868,40.6074877228485,40.6074854260536,40.6074831446814,40.6074808478897,40.6074807875462,40.6074829795755,40.6074840302478,40.6074839556537,40.6074850364993,40.6074872587012,40.6074894797292,40.6074917019309,40.6074939234611,40.607496145159,40.6074949895529,40.6074904866494,40.6074860132464,40.6074803991582,40.6074747686424,40.6074714216789,40.6074692291484,40.607467022369,40.6074642369472,40.6074591860776,40.6074541045339,40.6074506967225,40.6074456161832,40.6074405329622,40.6074376900444,40.6074354080012,40.6074325629068,40.6074274823651,40.6074224003175,40.607419556228,40.6074161631673,40.6074116595916,40.607408267704,40.607404859892,40.6074003266486,40.6073969188365,40.607394667634,40.6073924454338,40.6073890825463,40.6073845796426,40.6073811870838,40.6073789052073,40.6073766231636,40.607373216524,40.6073686827748,40.6073652749624,40.6073629929181,40.6073607115431,40.6073584296642,40.6073561487936,40.607353866748,40.6073515853747,40.6073493479207,40.6073471570658,40.607344949617,40.6073427269156,40.6073405058877,40.6073382843569,40.607334920967,40.6073304173932,40.6073270248349,40.6073247434601,40.6073224615845,40.6073201807109,40.6073179283377,40.607315706807,40.6073123439196,40.6073078403449,40.6073044484578,40.6073021659098,40.6072998845335,40.6072976031604,40.6072953211158,40.607291913303,40.6072873807271,40.6072839729128,40.6072816920409,40.6072794094933,40.607276017604,40.6072709491352,40.6072647587524,40.607259706206,40.6072569224636,40.6072529958542,40.6072468037957,40.6072417215803,40.6072388786622,40.6072354855989,40.6072298555855,40.6072242124976,40.6072202397893,40.6072151604223,40.6072100782058,40.6072068570161,40.6072023386877,40.6071963354292,40.6071948704682,40.6071805804846,40.607172299334,40.6071583179309,40.6071247953079,40.6071155718812,40.60705285923,40.6070459814107,40.6070425873395,40.6070403052928,40.6070380540922,40.6070352676699,40.6070302173031,40.6070251352524,40.6070222916642,40.6070200552162,40.6070192218998,40.6069756523425,40.6069623333469,40.6069604286202,40.6068995942867,40.6068895528889,40.6068742207688,40.6068658494821,40.6068536707185,40.6068467837754,40.6068383799764,40.606826648257,40.6068209715482,40.6068046628902,40.606801860073,40.6067996088711,40.6067970107453,40.6067925219235,40.6067865176583,40.6067820288342,40.6067816993169,40.6067753601465,40.6067749074357,40.6067715072502,40.6067664387798,40.6067602483957,40.6067540551645,40.6067478636064,40.6067422193441,40.6067399225468,40.6067398948736,40.6067240717601,40.6067240166961,40.6067230496049,40.6067202636824,40.6067192216258,40.606715213316,40.60670901958,40.6067028285276,40.6066972151099,40.6066938664723,40.6066916442719,40.6066894227416,40.6066871715399,40.6066837630576,40.606679230479,40.6066758226666,40.606673571466,40.6066702228283,40.6066657192542,40.6066611866766,40.6066566831025,40.6066522091979,40.6066477357968,40.6066438239392,40.6066387742437,40.6066337216993,40.6066309374514,40.6066275745641,40.6066241826767,40.6066215247029,40.6066170052051,40.6066110014446,40.6066065126212,40.6066027907377,40.6065983168327,40.6065944056439,40.6065893547745,40.6065831620455,40.6065777193259,40.6065720909874,40.6065660865565,40.6065615984033,40.606560141968,40.6065590611248,40.6065556987397,40.6065523365212,40.6065501143218,40.6065478927908,40.6065456700868,40.6065434193886,40.6065411368419,40.6065388554673,40.6065376846064,40.6065376242607,40.6065364544059,40.6065341725268,40.6065330016677,40.6065352084463,40.6065396818454,40.6065418886228,40.6065418216551,40.6065417399305,40.6065405460197,40.6065382870225,40.6065360654927,40.606532702103,40.6065281990305,40.6065248439409,40.6065237849734,40.6065227276869,40.6065205121068,40.6065182899066,40.6065160688786,40.6065138466798,40.6065116251495,40.6065105436352,40.6065094627931,40.6065072560148,40.6065050644874,40.6065017165217,40.6064972129445,40.6064938512294,40.6064916285254,40.606488266141,40.6064848666277,40.6064836727169,40.6064847310167,40.6064869455882,40.606490293053,40.6064947522064,40.606495253905,40.6064901591148,40.606485075894,40.6064811070389,40.6064766183839,40.6064733004212,40.6064699524542,40.6064648851547,40.6064586941008,40.6064536498563,40.6064520281704,40.6064509703786,40.6064487564731,40.6064465342726,40.6064443115699,40.6064409646049,40.6064364907,40.6064331432317,40.6064309222046,40.6064275735654,40.6064230699891,40.6064196626798,40.6064174109764,40.6064151887745,40.6064129672437,40.6064107455455,40.6064085387648,40.6064063462331,40.6064029999387,40.6063995926288,40.6063972799097,40.6063949831153,40.6063927012405,40.6063904500384,40.6063882278377,40.6063859766357,40.6063836945914,40.6063814127152,40.6063791313419,40.6063768806428,40.6063746579382,40.6063712950501,40.6063667926486,40.606363399588,40.6063611182134,40.6063588653363,40.6063557994791,40.6063499037819,40.6063420225662,40.6063341413516,40.6063282143069,40.6063250897785,40.606322837407,40.6063206158764,40.6063184090958,40.606317357752,40.6063174335178,40.6063163515008,40.6063141447192,40.6063142050626,40.6063165089819,40.6063177017133,40.6063166439156,40.6063144300065,40.6063110818692,40.6063065777913,40.6063031704831,40.6063009192803,40.6062986977492,40.6062953348603,40.6062919714687,40.6062897504368,40.6062874985659,40.606285217194,40.6062829353196,40.606279526839,40.6062750232637,40.6062728164818,40.6062728768226,40.6062717964781,40.6062695737726,40.60626735224,40.6062651312086,40.6062617830697,40.6062573091611,40.6062528357579,40.6062483328518,40.6062449255446,40.6062426429985,40.6062403616283,40.6062381092557,40.6062358877208,40.6062336809368,40.6062314894064,40.6062292826219,40.606227059916,40.6062236981981,40.6062203051385,40.6062168978339,40.6062123937546,40.6062090462843,40.6062068247507,40.6062042264528,40.6061997382981,40.6061937333635,40.6061892452068,40.6061877899408,40.6061878491072,40.6061867687616,40.6061845460537,40.6061811997562,40.6061767251759,40.6061733777056,40.6061711561713,40.6061700746499,40.6061689938007,40.6061667870143,40.6061645954801,40.6061623886945,40.6061601659856,40.6061579444502,40.6061557234164,40.6061534715435,40.606151189673,40.6061489527184,40.6061490130546,40.6061524203595,40.6061558127468,40.6061569835986,40.6061570434316,40.6061571037668,40.6061571624263,40.6061549556387,40.6061493415469,40.6061437127053,40.6061403498153,40.6061375638865,40.6061325141849,40.6061274616355,40.6061246778855,40.606122455175,40.6061213748253,40.6061214351564,40.6061226055057,40.6061248868741,40.6061260577224,40.6061249768693,40.6061216144803,40.6061171115746,40.6061137185161,40.6061114371488,40.606109154608,40.6061068732419,40.6061045764541,40.6061022654249,40.6061004302623,40.6061004983898,40.6060864853077,40.6060462258054,40.60602290201,40.6059781618856,40.6059519468973,40.6059352019092,40.6059041591634,40.605885188242,40.6058640577462,40.6058337734428,40.6057888751503,40.6057565245809,40.6057401278525,40.605683377113,40.6056550649809,40.6056436237919,40.6056349557474,40.6056343764944,40.6056273855869,40.6056107672682,40.6055993347731,40.6055870308909,40.60549939423,40.6054805195,40.6054425488411,40.6054119802378,40.6053885599153,40.6053649822207,40.6053439774944,40.6053298691537,40.6053182068298,40.6052969485151,40.6052735607008,40.6052713181617,40.6052698202303,40.605267598667,40.6052653764333,40.6052631548715,40.6052609331405,40.6052587115767,40.6052576300156,40.6052576897948,40.6052566089016,40.6052543871717,40.6052510391676,40.6052465804679,40.6052455138083,40.6052478110592,40.6052500935725,40.6052523903203,40.6052547006282,40.6052570044935,40.6052581978248,40.6052593911581,40.605261688405,40.6052628810643,40.6052640743946,40.6052663640231,40.605268644863,40.6052709267048,40.605272097513,40.6052721567851,40.6052722170644,40.6052711354967,40.605268928664,40.6052667372361,40.6052645309055,40.6052623086681,40.605260085928,40.6052574877655,40.6052529995935,40.6052469956624,40.6052425069858,40.6052399115034,40.6052376882608,40.6052354665254,40.6052332520758,40.6052321935285,40.6052333868559,40.6052356907107,40.6052380026892,40.6052402994306,40.6052425807697,40.605244870397,40.6052460637186,40.6052450046685,40.6052427895451,40.6052394425429,40.6052349396343,40.6052304059235,40.6052259018432,40.6052225548413,40.6052203326018,40.6052192517013,40.6052193262036,40.6052182759388,40.6052160691043,40.6052160980659,40.6052183943024,40.6052184545731,40.605216247735,40.6052140254943,40.6052118044285,40.6052090179625,40.6052039675743,40.6051989221243,40.6051973026961,40.6051984953467,40.6052007844635,40.6052019552666,40.6052008736943,40.6052006850129,40.6052078679565,40.6052082800541,40.6051965226187,40.6051935466845,40.6051949413618,40.6051983486323,40.6052017552316,40.6052018154934,40.60519960865,40.6051973870759,40.6051951648338,40.6051929432596,40.605190721016,40.6051896406111,40.6051897003699,40.6051908699941,40.6051931524991,40.6051943227921,40.6051943830539,40.6051933014739,40.6051910799005,40.6051888581567,40.6051866513134,40.6051844586927,40.6051822518487,40.6051800302729,40.6051778085307,40.6051744605157,40.6051699875717,40.605168891262,40.6051711879922,40.6051746253879,40.6051791733206,40.6051825805873,40.6051848778195,40.6051860782383,40.6051861603408,40.6051862426031,40.6051851845408,40.6051829695743,40.6051796225617,40.6051751486106,40.6051729410914,40.6051730008425,40.6051719199305,40.6051696981847,40.6051667255931,40.6051611109757,40.6051536046786,40.6051479900624,40.6051450184735,40.6051428116233,40.6051417608359,40.6051418353155,40.6051396284642,40.6051351704128,40.6051341042248,40.6051364002822,40.6051375717401,40.6051376308187,40.6051365499052,40.6051343276542,40.6051321060741,40.6051298843268,40.6051270983558,40.605122047459,40.6051170102865,40.605114256616,40.6051120580507,40.605110998469,40.6051099398979,40.6051077401536,40.6051055480254,40.6051010740719,40.6050954599551,40.6050943636414,40.605096645636,40.6050989274649,40.6051012236859,40.6051035356361,40.6051058374383,40.6051070236201,40.605107102161,40.6051088503895,40.6051139381582,40.6051190180065,40.6051207531836,40.6051208122584,40.6051197313369,40.6051175239775,40.6051153318475,40.6051131249903,40.6051109039095,40.6051086816559,40.605105334137,40.6051008601809,40.6050975119898,40.6050952904079,40.6050930693268,40.6050908470727,40.605089766152,40.6050898335074,40.6050899150809,40.6050911083711,40.6050933683591,40.6050955894408,40.6050978110234,40.6051000327755,40.6051033961945,40.6051090250381,40.6051146396578,40.6051179878475,40.6051213500926,40.6051264163873,40.6051326084477,40.6051376894679,40.6051405351843,40.6051428165073,40.6051462237654,40.6051507574646,40.6051541652261,40.6051564465494,40.6051587290447,40.6051610098633,40.6051644176255,40.6051689501496,40.6051723574081,40.605174639905,40.6051769212258,40.6051792025498,40.605182609807,40.6051871440066,40.6051905512646,40.6051928325864,40.6051962398443,40.6052007434237,40.6052040921151,40.6052063137016,40.6052085359573,40.6052107570392,40.6052141050634,40.6052186086395,40.605220482941,40.6052390486769,40.6052607173927,40.6052728863128,40.6052590622017,40.6052439976678,40.6052403770252,40.6052366814621,40.6052328004356,40.6052335830981,40.6052381167929,40.605240413505,40.6052404879567,40.6052394359708,40.605237229104,40.6052350075143,40.6052328011497,40.6052317496641,40.6052306829552,40.6052284618675,40.6052273814394,40.6052262998368,40.6052218111501,40.6052161970288,40.6052139901595,40.6052140503887,40.6052118428508,40.6052073688861,40.605204020856,40.6052017985956,40.6052018298813,40.6052041111993,40.6052063920127,40.605208689222,40.6052087482769,40.6052065414078,40.6052043198148,40.6052020975546,40.6051998759628,40.6051965130434,40.6051920099696,40.6051886477204,40.6051864249554,40.6051842109778,40.6051831523731,40.6051820944454,40.6051798787887,40.605176531763,40.6051720725145,40.605169895757,40.6051680780249,40.6051624639002,40.6051549576037,40.6051493505916,40.6051475428157,40.6051476248716,40.6051476916988,40.6051466112634,40.6051443890009,40.6051433080628,40.605143368286,40.6051451005955,40.6051501827836,40.605155263799,40.6051569977845,40.6051570568331,40.605157117055,40.6051571921611,40.6051561406641,40.6051539337876,40.6051539633959,40.6051562560292,40.6051574564012,40.6051575547013,40.6051565038722,40.6051542924213,40.6051520701549,40.6051498490607,40.6051498779957,40.6051521758693,40.6051522344122,40.6051500275343,40.6051478052682,40.6051455836718,40.6051456137789,40.6051478950891,40.6051501764011,40.605152473099,40.6051547850201,40.6051570888262,40.6051582820852,40.6051583647982,40.6051584321178,40.6051573500027,40.6051551289065,40.6051529066376,40.6051506855435,40.6051507144764,40.6051529964572,40.6051541672152,40.6051530856027,40.6051508787215,40.6051486860566,40.6051464803474,40.6051465104535,40.6051488064781,40.6051511173898,40.6051534140861,40.6051556953936,40.6051579778758,40.6051613856221,40.6051658733093,40.6051680505881,40.6051679614438,40.6051667610795,40.6051644643835,40.6051632936251,40.6051643740662,40.6051665968382,40.605167677279,40.6051698841598,40.6051743877364,40.6051777954839,40.6051800762908,40.605183485211,40.6051880177232,40.6051914249678,40.6051937062748,40.6051948770365,40.6051949372483,40.6051938558002,40.6051916423149,40.6051905831926,40.6051906659015,40.6051895913888,40.6051873697904,40.6051851480223,40.6051806593308,40.6051750452019,40.6051739488687,40.6051762306791,40.6051796379223,40.6051841716056,40.6051875793513,40.6051898755414,40.6051921869529,40.6051944978595,40.6051945580697,40.605192351185,40.605190128913,40.6051879078137,40.6051851218211,40.6051800714162,40.6051750266113,40.6051734059407,40.6051745980188,40.605176887603,40.6051797309533,40.6051848136403,40.6051898941493,40.6051927391757,40.6051950211514,40.6051984277226,40.6052029625748,40.6052063691458,40.6052086658374,40.6052087255387,40.6052065186546,40.6052031711135,40.6051986976387,40.6051953489259,40.6051931420381,40.6051932022417,40.6051954989311,40.6051966691833,40.6051967441014,40.6051979444522,40.6052002416433,40.6052025224457,40.6052048042504,40.6052070862241,40.60520938224,40.6052094419418,40.6052072426621,40.605206184196,40.6052051260711,40.6052045795898,40.6052067234012,40.6052094849399,40.6052166814478,40.6052254265208,40.6052359535707,40.6052580633763,40.6052580017116,40.6052582228512,40.60525741177,40.6052540886389,40.6052539598994,40.6052527916647,40.605252273738,40.6052697456098,40.605272886977,40.6052632176565,40.6052671799616,40.6052694766323,40.6052683961636,40.6052661809805,40.6052651218173,40.6052663150329,40.6052686122062,40.6052698054187,40.6052698874043,40.6052688130294,40.6052665912429,40.605263244191,40.6052587701989,40.605256563288,40.6052566229575,40.6052566826277,40.6052567428001,40.6052556606532,40.6052511729549,40.6052455735281,40.6052433956955,40.6052423294284,40.6052401076418,40.6052401377262,40.6052424343923,40.6052424940592,40.605240287146,40.6052414424975,40.6052459761604,40.6052482728261,40.6052483324929,40.6052472508452,40.6052450297276,40.6052450586382,40.6052473405947,40.6052485113217,40.6052474296746,40.6052452227607,40.6052464083605,40.60525095673,40.605254364455,40.6052566611188,40.6052567212856,40.605254513197,40.6052545444517,40.6052568252365,40.6052591065206,40.6052613878069,40.6052636702656,40.6052659586532,40.6052671518554,40.6052660931879,40.6052638786637,40.6052616568747,40.605259435251,40.605259465332,40.6052617466184,40.6052640279037,40.6052663098568,40.6052663399375,40.6052641176442,40.6052618953511,40.6052596884325,40.6052574968903,40.6052552899726,40.6052530676778,40.6052508531571,40.6052497949855,40.6052509876823,40.6052532811378,40.6052544667309,40.6052545466651,40.6052557322597,40.6052580186116,40.6052580486905,40.6052558270644,40.6052524800054,40.6052480060042,40.6052469096446,40.6052491909254,40.6052514722093,40.6052537688657,40.6052560802285,40.6052583768826,40.6052595471022,40.6052584671217,40.6052562443209,40.6052551638394,40.6052552239954,40.6052541423389,40.6052519207123,40.6052508390555,40.6052497580683,40.6052475511454,40.6052476101268,40.6052499067839,40.6052521892355,40.6052555810781,40.6052589842318,40.6052601840232,40.6052602838892,40.6052592318061,40.6052569902362,40.6052547089548,40.6052524577535,40.6052502349527,40.6052480280261,40.605245836307,40.6052436293819,40.6052425478909,40.6052426080423,40.6052426681937,40.6052427425459,40.6052439433374,40.6052462388155,40.6052474095292,40.6052463285383,40.6052441216122,40.6052430711965,40.6052431450458,40.6052443157585,40.6052465975383,40.6052477672469,40.6052478420969,40.6052467911784,40.6052445913498,40.6052435326602,40.6052424734707,40.6052391188005,40.6052346152221,40.6052312671524,40.6052302160644,40.6052280240023,40.6052235504973,40.6052202029297,40.6052179811279,40.6052157594951,40.6052135525644,40.6052113598323,40.6052091529002,40.6052080712334,40.6052081467504,40.6052082352904,40.6052071694994,40.6052049575003,40.6052039065739,40.6052040064231,40.6052040954639,40.6052041801021,40.6052031285056,40.6052009215705,40.6052009511405,40.6052032386551,40.6052044235609,40.6052045036335,40.605203437334,40.6052012200967,40.6051984335648,40.6051933831423,40.6051883454079,40.6051855921296,40.6051833851926,40.6051811623851,40.6051778006155,40.6051744371709,40.6051710900987,40.6051666160875,40.6051655197182,40.6051678163571,40.6051701282016,40.6051724248422,40.6051747061131,40.6051769919523,40.6051781780247,40.6051782580938,40.6051771906167,40.6051749745488,40.6051727529095,40.6051705459728,40.6051683532283,40.605166160988,40.6051639694153,40.6051617732933,40.6051607250646,40.6051608306331,40.605160935028,40.6051598868038,40.605157676478,40.6051577060412,40.6051599873097,40.6051622697528,40.6051645510199,40.6051668322891,40.6051691192954,40.6051703046919,40.605170383582,40.6051693184445,40.6051659600634,40.6051626028582,40.6051615365474,40.6051616154358,40.6051628008294,40.6051651025293,40.6051651621552,40.6051629648433,40.6051619138988,40.6051620137208,40.6051609616024,40.6051587500919,40.6051576690825,40.6051577292086,40.6051566475274,40.6051544258863,40.6051544547753,40.6051567443127,40.6051579379724,40.6051580193878,40.6051580861036,40.6051581457241,40.6051570652162,40.6051548429018,40.6051548729646,40.6051571624993,40.605158142019,40.605158354983,40.6051584370688,40.6051585042848,40.6051574226019,40.6051552009576,40.6051552310172,40.605157526977,40.6051575865956,40.605155379645,40.6051554102087,40.6051577063322,40.6051577664524,40.6051555595044,40.6051544778186,40.6051533968049,40.6051511744882,40.6051512040441,40.6051534858098,40.6051557677408,40.6051580490048,40.6051603307701,40.6051626127021,40.6051626415865,40.6051604199412,40.6051581981267,40.6051559764794,40.6051560065403,40.6051582987801,40.6051595039122,40.6051596077761,40.6051597121418,40.6051586643978,40.6051564586261,40.6051553917981,40.6051554718394,40.605154882006,40.6051544060172,40.605152188259,40.6051522194895,40.6051544990739,40.6051567815049,40.6051590781309,40.6051613894454,40.6051636865716,40.6051648714483,40.6051649611132,40.6051650354165,40.6051650950245,40.6051651551358,40.6051663258197,40.6051686116438,40.6051697970209,40.6051698765521,40.6051699513521,40.6051700155208,40.6051711862042,40.6051734828248,40.6051735429335,40.6051713501627,40.6051714102699,40.6051737062205,40.605175988146,40.605179380482,40.6051827780484,40.6051839640926,40.6051840434524,40.6051829766171,40.6051807655977,40.6051796987625,40.60517977812,40.6051809641611,40.6051832570735,40.6051844512118,40.6051845332715,40.6051845960346,40.605184607563,40.60518468945,40.6051858820832,40.6051881857894,40.6051904970948,40.6051928018121,40.6051939944408,40.6051951869044,40.6051974814886,40.605198667024,40.6051987458724,40.6051976800368,40.6051954781332,40.6051932865279,40.6051910795613,40.6051911084373,40.6051933896916,40.6051956716151,40.6051979675556,40.605200280031,40.6052025857658,40.6052037864915,40.6052038857614,40.6052050864837,40.6052073927169,40.6052074528135,40.605205250409,40.6052041840655,40.6052042634084,40.6052043388636,40.6052032617206,40.6052010547493,40.6052011143411,40.6052034114543,40.6052056922003,40.6052079893109,40.6052091888559,40.6052092709001,40.6052093527721,40.6052094424068,40.605209532044,40.6052107244952,40.605213028694,40.6052130877807,40.6052108808081,40.6052109113538,40.6052132079611,40.6052144081729,40.6052144824451,40.6052156531148,40.6052179348635,40.6052191050295,40.6052191722118,40.6052192547476,40.6052193366158,40.6052182621649,40.6052160403345,40.6052160698774,40.6052183664794,40.6052195671884,40.6052196419631,40.6052197010424,40.6052197656898,40.605219840461,40.6052199204607,40.605221105813,40.6052233916163,40.6052245629523,40.6052246218633,40.6052257925246,40.6052280891267,40.6052304004105,40.6052327041064,40.6052338977173,40.6052350903264,40.6052373791606,40.6052385498247,40.605238625261,40.6052398254625,40.6052421355719,40.6052444475263,40.6052467446266,40.6052490258701,40.6052513116752,40.6052524976904,40.605252577012,40.6052537625252,40.6052560488278,40.6052560783655,40.6052538565305,40.6052538860667,40.6052561684822,40.6052584492223,40.605261841548,40.6052652498991,40.6052675611801,40.6052698628403,40.6052710481849,40.6052711269994,40.6052728740527,40.6052779622717,40.6052830422487,40.6052858872111,40.6052881838054,40.6052893850046,40.6052894587569,40.6052906294143,40.6052929255054,40.6052952372856,40.6052975338777,40.6052998162889,40.6053021117121,40.6053044229866,40.6053067354358,40.6053090462084,40.6053113569817,40.605313668757,40.6053159800323,40.6053160396008,40.6053138326135,40.6053138621473,40.6053161438869,40.6053184251257,40.605320707034,40.6053229887766,40.6053252706843,40.6053275519223,40.6053298336614,40.6053321155702,40.6053344114899,40.6053367222602,40.6053390188496,40.6053413000878,40.6053435824965,40.6053458637346,40.6053492567291,40.6053537591348,40.6053571521314,40.6053594333671,40.605361729958,40.6053617895227,40.6053595830342,40.605359611894,40.6053618938025,40.605364175039,40.6053664716258,40.6053687833986,40.605371079985,40.6053733612216,40.6053767537132,40.6053801472118,40.6053824279438,40.6053847096831,40.605384739212,40.6053825180425,40.6053825469015,40.6053848338704,40.6053860192017,40.6053860991741,40.6053872840033,40.6053895856481,40.6053918969156,40.6053942005912,40.6053953936784,40.6053977125359,40.6054022527311,40.605405659901,40.6054079411369,40.6054107850873,40.6054158677401,40.6054209475437,40.6054237931692,40.6054260806408,40.6054272654653,40.6054273447625,40.6054274196681,40.6054274836173,40.6054286549322,40.6054309508464,40.6054343880446,40.6054400475904,40.6054456764369,40.6054490841087,40.6054513960403,40.6054537073014,40.6054560180606,40.605458329322,40.605460640581,40.6054629371629,40.6054652188957,40.6054675007982,40.6054686714423,40.6054675897091,40.6054653680324,40.6054620192443,40.6054575610416,40.6054576210971,40.6054621688812,40.6054655760486,40.6054689683688,40.6054734731213,40.6054768649388,40.6054791473429,40.6054813985467,40.6054847461618,40.6054892497404,40.6054926569086,40.6054960492308,40.6055016787474,40.6055073229406,40.6055107301076,40.6055130118414,40.6055152930703,40.6055175749724,40.6055198567056,40.6055221379355,40.6055244198352,40.6055267157443,40.6055267757974,40.6055245687951,40.6055245983181,40.6055268795494,40.6055291619501,40.6055314431798,40.6055348503458,40.6055393827778,40.6055427911185,40.6055450728487,40.6055462424819,40.6055463025362,40.6055474731742,40.605549754904,40.6055531620714,40.6055576956759,40.6055611028409,40.6055633845716,40.6055667917365,40.6055713253408,40.6055747325059,40.605577014907,40.6055792961348,40.6055815844522,40.6055827775239,40.6055850958642,40.6055896065292,40.6055929553205,40.6055951770006,40.605597399353,40.6055996205325,40.605601843385,40.6056052051777,40.6056108351979,40.6056175899812,40.6056232199985,40.6056266129905,40.6056288942169,40.6056311749428,40.605633456169,40.6056357090481,40.6056379302278,40.6056412931931,40.6056457967716,40.6056491890934,40.6056514709898,40.6056537522178,40.6056549228553,40.6056549824009,40.6056561530398,40.6056584489425,40.6056607608639,40.6056630267446,40.605665249599,40.6056686120622,40.6056720043826,40.6056742862792,40.6056765379828,40.6056787603368,40.6056821226325,40.6056866262129,40.6056900232595,40.6056912085726,40.6056912885225,40.6056935997719,40.6056981379302,40.6057026708625,40.6057072044642,40.605710611627,40.6057128940266,40.6057163011892,40.6057208336186,40.6057242424576,40.605726523682,40.6057299308444,40.6057344632747,40.6057389968766,40.6057446410682,40.6057502710874,40.605753663405,40.6057570705671,40.6057627147607,40.6057672330162,40.6057706401782,40.6057762855413,40.60578175792,40.6057819143878,40.6057852773545,40.6057881280153,40.6057931132094,40.6057931884525,40.6071925329425,40.6078515139207,40.6079531163546,40.6080513433467,40.6081458412101,40.6082362696842,40.6083223031595,40.6084036318508,40.6084799629124,40.6085510214929,40.6085532358856,40.6085601522587,40.6085925523794,40.6087137853568,40.6087263356554,40.6087370733699,40.6087530301449,40.6087537932993,40.6087560013851,40.608757058875,40.6087581180433,40.6087603178515,40.6087625105579,40.6087658576102,40.6087703605155,40.6087737246209,40.6087759457379,40.6087781673583,40.6087803891449,40.6087826107624,40.6087848330518,40.6087870558434,40.608789276958,40.608791498578,40.6087925802207,40.60879252005,40.6087936021961,40.6087958091064,40.6087980001344,40.6088002070433,40.6088024293316,40.6088046362412,40.6088068277709,40.6088090275785,40.6088100862346,40.6088111453977,40.6088133497709,40.6088134008408,40.608814400655,40.6088143012532,40.6088153528072,40.6088175642809,40.6088197858961,40.6088220076791,40.6088242304681,40.6088264373749,40.6088286289,40.6088308358063,40.6088330585949,40.6088352808785,40.6088375019917,40.6088397531949,40.608843162097,40.6088488051457,40.6088533229291,40.6088556048905,40.6088578866837,40.6088612944128,40.6088657908875,40.6088679748053,40.6088690339639,40.6088712491443,40.6088734702563,40.6088756918717,40.6088779136533,40.6088801281667,40.6088811873185,40.6088810970504,40.6088810072809,40.6088809252888,40.6088808579998,40.608883065407,40.6088875388934,40.608891262536,40.6088957502293,40.6089017544941,40.6089062722796,40.6089089301679,40.6089112121291,40.6089134939259,40.6089157758893,40.6089191824474,40.6089248278408,40.6089293456257,40.6089321889647,40.608937271642,40.6089402312173,40.608942352142,40.6089451971564,40.6089474791202,40.6089486498546,40.6089487100349,40.6089493624486,40.6089665806442,40.6089847721669,40.6089835670704,40.6089812852762,40.6089801145407,40.6089800548615,40.6089811365003,40.6089833434013,40.6089832832215,40.6089809723412,40.6089797715119,40.6089796959487,40.6089807775852,40.6089829991976,40.6089829702797,40.6089806878119,40.6089784065199,40.6089761245555,40.6089749538154,40.6089748936331,40.6089759752677,40.6089781968803,40.6089804186581,40.6089826368763,40.6089837019572,40.6089836229969,40.608984688745,40.6089869057856,40.6089868756935,40.6089845938953,40.6089834231551,40.6089833639732,40.608982193232,40.6089799119358,40.6089787411949,40.6089809480942,40.6089854220787,40.6089887691223,40.6089909914028,40.6089935879334,40.6089980767974,40.6090040805596,40.6090085699261,40.6090111676302,40.6090133892406,40.6090161725609,40.6090212261536,40.6090274172093,40.6090324840034,40.6090358474337,40.6090380690439,40.609040283047,40.6090413421892,40.609042400832,40.6090446148313,40.609046837111,40.6090490587205,40.6090512809977,40.609054643925,40.60905914683,40.6090625393523,40.6090648211505,40.6090682136727,40.6090727165777,40.6090760806777,40.6090783017842,40.6090805233945,40.6090804944707,40.6090782120009,40.6090759307031,40.6090736494039,40.6090724779919,40.6090735596195,40.6090757818993,40.609078003004,40.6090802246115,40.6090824473927,40.6090846691674,40.6090868907746,40.6090890976685,40.609091289852,40.609094637394,40.6090997025145,40.6091058962487,40.6091109767529,40.6091138217724,40.6091161037426,40.6091172744888,40.6091173346817,40.6091162530517,40.6091140314433,40.6091140603667,40.6091163423343,40.6091197500704,40.6091242536486,40.6091276011924,40.6091339041277,40.6091342640071,40.6091342365893,40.6091325806673,40.6091319552908,40.6091296734894,40.6091273915225,40.6091251102245,40.609122828423,40.6091205476265,40.6091182663282,40.609115984359,40.6091136883473,40.6091136281527,40.6091158201642,40.6091179259026,40.6091180118413,40.6091202187345,40.6091224403396,40.6091246472325,40.6091268394135,40.6091290468064,40.6091312685795,40.6091334825791,40.6091345417137,40.6091356008497,40.6091378148455,40.6091405986653,40.6091456517498,40.609150693879,40.6091523167324,40.6091533753677,40.6091544118539,40.609156730515,40.6091601377516,40.6091624491523,40.6091647162417,40.6091680644514,40.6091725673584,40.6091759757667,40.6091782570677,40.609180538368,40.6091827895692,40.6091861382817,40.6091906418598,40.6091940484259,40.6091963007998,40.6091988968225,40.6092033856851,40.6092093894476,40.6092138634261,40.6092141798237,40.6092118760338,40.6092106834622,40.6092117414231,40.6092139554187,40.6092139264894,40.6092116445193,40.6092093627143,40.6092070814141,40.6092059099915,40.6092069916135,40.6092092138879,40.6092114349892,40.6092147984164,40.6092181613409,40.6092186079853,40.6092199297872,40.6092672764139,40.6092909802441,40.6092947761849,40.609296225314,40.6092984469161,40.6093006686833,40.609302891458,40.6093051130598,40.6093073353294,40.6093106816956,40.6093151852704,40.6093185936833,40.6093208448843,40.6093230664869,40.6093252892599,40.609327511028,40.6093297326294,40.6093319548996,40.6093341759974,40.6093363975985,40.6093386051529,40.6093396564997,40.6093395820774,40.6093417889609,40.6093462619289,40.6093496099691,40.609351127149,40.6093521506953,40.6093734099206,40.6093926955692,40.6093947211068,40.6093992097966,40.6094052130562,40.6094097019146,40.6094134265477,40.6094190406707,40.6094246695125,40.6094280336082,40.6094308167507,40.6094358688279,40.6094409197319,40.6094437057236,40.6094459273204,40.6094492748565,40.6094537483242,40.6094570958589,40.6094593176242,40.6094615403955,40.609463747275,40.6094659387681,40.609468130927,40.6094691817642,40.6094691073361,40.6094701882782,40.6094724029378,40.6094734620519,40.6094733798456,40.609473312521,40.6094743929604,40.6094777558801,40.6094822594547,40.6094856074913,40.6094877991464,40.609490006023,40.6094922276192,40.6094944503895,40.6094944197775,40.609492138468,40.6094909670345,40.6094909084925,40.6094919889293,40.6094942116978,40.6094964327909,40.6094986550544,40.6094986244439,40.6094963436375,40.6094940623253,40.609491773238,40.6094905789678,40.6094904974263,40.6094904255238,40.6094903504185,40.6094902709061,40.609491337125,40.6094935536423,40.6094957754025,40.6094979969956,40.6094979673885,40.6094956713552,40.6094933592635,40.6094910632298,40.6094887807443,40.6094864994329,40.6094853291664,40.6094864096004,40.6094886164716,40.6094885574209,40.6094862607172,40.6094839794042,40.6094816821968,40.6094816229798,40.6094838146249,40.6094860066072,40.609488214147,40.6094892950803,40.6094892353581,40.6094908785058,40.6094959310813,40.6095009737019,40.6095025960216,40.6095036551263,40.6095058691027,40.6095080913638,40.6095103129524,40.6095125347107,40.6095147563014,40.609515837903,40.6095157776748,40.6095157184525,40.6095156593963,40.6095167398257,40.6095189614156,40.6095189312988,40.6095166423723]}],[{"lng":[-73.7847854748629,-73.7847244609279,-73.7846775292334,-73.7846505400005,-73.784589502599,-73.7845188267875,-73.7845028423138,-73.7844965513595,-73.7845512669908,-73.7845818498871,-73.7845385990048,-73.7844101694645,-73.7843556902111,-73.7843462425229,-73.7843881314287,-73.7844557929835,-73.7844527373456,-73.784401449158,-73.784321206898,-73.7842957519414,-73.7842991928768,-73.7843378863217,-73.7843399851261,-73.7843734604438,-73.7844281373653,-73.7844476809789,-73.7844532624962,-73.7844608706805,-73.7843808978531,-73.7842686751004,-73.78418536377,-73.7841472094808,-73.7841523762496,-73.7841570440552,-73.7841218177159,-73.7840667058982,-73.7840544672971,-73.7839679358515,-73.7839006093885,-73.7839032727818,-73.7839075652966,-73.7838180292134,-73.7837088530103,-73.783664730795,-73.7836607050474,-73.7836600298764,-73.7836449441638,-73.7835543329955,-73.7835326045824,-73.7834459710985,-73.7833339654362,-73.7832782049081,-73.7832671796212,-73.7832255453001,-73.7831002126499,-73.7829884433586,-73.7829811856548,-73.7827563555369,-73.7825669578421,-73.782489931275,-73.7823840963144,-73.7823104265699,-73.7823071385404,-73.7822818171642,-73.7823175208933,-73.7822952747142,-73.7822117597891,-73.7821313541849,-73.7820510914975,-73.781996568771,-73.7819774464429,-73.7818909028362,-73.7818682803373,-73.7818790370823,-73.7818422212802,-73.7818100802742,-73.7817170091247,-73.7816401428138,-73.7815824002244,-73.7814957768698,-73.781476173289,-73.7814414949289,-73.7814159727366,-73.7812778553397,-73.7812202316685,-73.7812039941561,-73.7811526921111,-73.7811399071764,-73.781149685736,-73.7811593498576,-73.7811305028675,-73.7811106789466,-73.7810630097608,-73.7809859774887,-73.7808578917134,-73.7807937650353,-73.7808103408425,-73.7808041576838,-73.780765825415,-73.7807243385718,-73.7807587832983,-73.7807662193605,-73.7807535478932,-73.7807088719528,-73.7808504647604,-73.7809724937758,-73.7811490607304,-73.7811459042271,-73.7811205512035,-73.781040345156,-73.7810019908935,-73.7809218586978,-73.7808836083436,-73.7809062162165,-73.7809898005402,-73.7810572025978,-73.7811599977808,-73.7811922651317,-73.7811957666552,-73.7812216652058,-73.7812795280656,-73.7812605110188,-73.7813795993259,-73.781601368462,-73.7817783661047,-73.7819750677261,-73.7823195430791,-73.7823933773236,-73.7823902365223,-73.7826155746762,-73.7827279659439,-73.7827857060683,-73.7828790134915,-73.7829146271154,-73.7829212197201,-73.7829600531171,-73.7830245049805,-73.7831594202563,-73.7832269661074,-73.7833042980316,-73.7833557578069,-73.7834586135213,-73.7835263575679,-73.783552214374,-73.7837129934768,-73.7837605485183,-73.7838281499225,-73.7839437367008,-73.7842227194624,-73.784369636636,-73.7844743756727,-73.7845896836484,-73.7845878934896,-73.7845799363939,-73.7846408665288,-73.7847276066494,-73.7847598147519,-73.7847728543081,-73.7848563808454,-73.7849752335334,-73.7850106634997,-73.7850718538506,-73.7850912926421,-73.7850593111439,-73.7850679220691,-73.7850725159015,-73.7851628291734,-73.7852111618244,-73.7852242315045,-73.7854497395892,-73.7855108038021,-73.7855398464927,-73.785778093158,-73.7862184317922,-73.7864697280093,-73.7868244526521,-73.7868451869728,-73.7871025375844,-73.7871989741232,-73.7872151286211,-73.7871960260386,-73.787228359488,-73.7872299935147,-73.7872317891488,-73.7871998481037,-73.7872610742468,-73.7874154456816,-73.7875761083308,-73.7875957852785,-73.7876144287936,-73.7877074263747,-73.7878392581516,-73.7879132621436,-73.7879060283867,-73.7878748558184,-73.7878589433008,-73.7882414091299,-73.7882926483522,-73.7883248006772,-73.7883603051875,-73.7883701200715,-73.7885372534959,-73.7885947548343,-73.7886591062755,-73.7887140233627,-73.7887077763631,-73.7887080088047,-73.7887692642939,-73.7887951403092,-73.7887568040912,-73.7887601166097,-73.7888050709401,-73.7888404121762,-73.788866202909,-73.7889370631352,-73.7889752548654,-73.788991653735,-73.7890816016591,-73.7890978712878,-73.7891118434417,-73.7891174686825,-73.7891016246603,-73.7890343548219,-73.7890184023864,-73.7891695734102,-73.7892852802478,-73.7893880580657,-73.7893913031006,-73.7894811886813,-73.7895391374164,-73.7896065737254,-73.7896485269094,-73.7898477625204,-73.7899538936236,-73.7899861225797,-73.7899990709194,-73.7900666091606,-73.7901116708335,-73.7900957887504,-73.7900123655259,-73.7900126427264,-73.790077061333,-73.7901736401271,-73.7902894141494,-73.7902967074235,-73.7903986637015,-73.790472694918,-73.7904812468437,-73.7904825000936,-73.7904699748835,-73.7903802061457,-73.7905444442656,-73.7907159208581,-73.7907210467459,-73.7907757513973,-73.7908562132544,-73.7908659950587,-73.7908565890348,-73.7908398483957,-73.7908922590036,-73.7908891629514,-73.790876591002,-73.7909119158013,-73.7909858461103,-73.7909889207575,-73.7910472314355,-73.7911879834329,-73.7913389960443,-73.7913905875811,-73.791391922156,-73.7913972101207,-73.7914741623095,-73.7914796291137,-73.7915636938065,-73.7915989500812,-73.7915111469059,-73.7915097492739,-73.7914081310552,-73.7912860419162,-73.7911575130445,-73.7911155561006,-73.7910736003925,-73.7911728767263,-73.7912658352144,-73.7913332501362,-73.7914198089476,-73.7914741014063,-73.7914077703632,-73.7914072695204,-73.791471779852,-73.7915198548593,-73.7918041573751,-73.7919276975148,-73.7919059200445,-73.7917711712072,-73.7914478962644,-73.791167766717,-73.7909358021964,-73.7906609263916,-73.7904719121013,-73.7902400892638,-73.7900941938293,-73.7900023182117,-73.7899859970566,-73.7899266476787,-73.7898833599228,-73.7898242188424,-73.7897974341725,-73.7897486126225,-73.7896568014728,-73.7895379076984,-73.789634335072,-73.7897947034957,-73.7898908868335,-73.7900251076149,-73.7900730646336,-73.7901703233882,-73.7900618562502,-73.7899174334123,-73.7897951541918,-73.7897230709714,-73.7897586468253,-73.7895993225955,-73.7893973342634,-73.7888140990727,-73.788418086351,-73.7881589471224,-73.7878930346177,-73.7877063452841,-73.7876054615705,-73.7874184411016,-73.787202394203,-73.7870364925742,-73.7867338364509,-73.7862873019259,-73.7859199386958,-73.7856622169009,-73.7854989828955,-73.7853917032413,-73.7851492436872,-73.7850243354481,-73.7849949340066,-73.7849652270537,-73.7852133765997,-73.7855001412835,-73.7854796268355,-73.7852686051974,-73.7852870070127,-73.7856589949099,-73.7858114312901,-73.7862030532889,-73.7862594634542,-73.7861338467484,-73.7858545935028,-73.7856241513253,-73.7852691917584,-73.7852154307668,-73.7850778490225,-73.7851233143976,-73.7851752444352,-73.7851437246904,-73.7851603236813,-73.7852087026594,-73.7851833013974,-73.7851545601093,-73.7851711510989,-73.785164955724,-73.7851492078539,-73.78515920006,-73.7850632794474,-73.7848836826546,-73.7847811181678,-73.7847685601904,-73.7847753479548,-73.7847829173256,-73.7848109305889,-73.7848110647501,-73.7847854748629],"lat":[40.6179807223381,40.6179732641098,40.6179793925548,40.6179829174091,40.6179828030488,40.6179826705894,40.6179581609033,40.6179165329787,40.617884811164,40.6178550506013,40.6178284828192,40.6178062100777,40.6177644905875,40.6177057209927,40.617666630705,40.6176055572804,40.6175565909316,40.6175222226019,40.6175000401253,40.6174241035781,40.6173531179643,40.6173091254848,40.6173047976159,40.6172357523768,40.617216270744,40.6171330746209,40.6170885413766,40.6170278346271,40.6169224192516,40.6168561128373,40.6167898594225,40.616667386643,40.616635245952,40.6166062042871,40.6165718659855,40.6165437188948,40.6165374680001,40.6164736561468,40.6164319134605,40.6163691075182,40.6162679087487,40.616140444209,40.6161255503631,40.616114250908,40.6161132200621,40.6161092267339,40.6160201646863,40.6159962999243,40.6159905772501,40.6159585903622,40.6158261852177,40.6157012810989,40.6156179781034,40.6155787307233,40.6155931834459,40.6156412464225,40.6156443666929,40.6156317018091,40.6155897275691,40.6155675498869,40.6155134927298,40.6154472573654,40.6154365600827,40.615354177962,40.6152416368429,40.6151681536776,40.6151655477052,40.6151947712826,40.6151799316596,40.6151528995937,40.6151063504633,40.6150474343938,40.6150890081159,40.6151648558532,40.6151991196311,40.6152039536692,40.6151768487967,40.6151057102113,40.6150811207766,40.615046683989,40.6150103977158,40.6149462115804,40.6148923067022,40.6148871484348,40.6148813092698,40.6148796638833,40.6148501891031,40.6148305805736,40.6148047437072,40.6147792096828,40.6147595705718,40.6147624082991,40.6147692344705,40.6147495035372,40.6146244092986,40.6145875670924,40.6144309260274,40.6143574731925,40.6142913030322,40.6142079915964,40.6141778567691,40.6141713515443,40.6141174705192,40.6140268090059,40.6139511902222,40.6139636630104,40.6139982714798,40.6139811290527,40.6138758160096,40.6138134967706,40.6137850133937,40.6137310043416,40.6136403546364,40.6136036766188,40.613584251713,40.6136015170362,40.6136017127872,40.6135577097855,40.6134695879277,40.6134084363757,40.6133963062887,40.6133179335051,40.6132471667858,40.6132108684228,40.6131132842979,40.6128835426437,40.6126516344977,40.6126664622757,40.6126444243653,40.6124979686369,40.6125104213403,40.6125350113775,40.6124886747904,40.6124030607976,40.6123516653306,40.6122636096307,40.6122000831892,40.6122003377834,40.6121735365044,40.6121002424347,40.612080755244,40.6120613648656,40.6119733634341,40.6119244519809,40.6118733462053,40.6119351031009,40.6120228915473,40.6120402452889,40.6119403798368,40.6118877889444,40.6118502959485,40.6119533291071,40.6119596206711,40.6119875830082,40.6120195209082,40.6120172356189,40.6119903677552,40.6119316390938,40.6119293476902,40.6119295700882,40.6119002604086,40.6118514146972,40.6118000419531,40.6117559182239,40.6116841017204,40.6116457819184,40.6115308935416,40.6114844709926,40.6114159517456,40.6112131866441,40.611203508848,40.6111619468807,40.6109934770708,40.6109110645828,40.6106789689817,40.6107883309109,40.6107947235883,40.6106776955546,40.6106558416672,40.6106264949495,40.6105726038908,40.6105065666775,40.6104739240748,40.6104380281816,40.6103816649134,40.6103205778961,40.6102621110971,40.6102452717107,40.6102817618142,40.6103163346403,40.6103654677624,40.6103240938431,40.6102850627005,40.610276750111,40.6102409272248,40.6101943849784,40.6101265465684,40.6101756011049,40.6101658678893,40.6101120764018,40.6100557903357,40.6100242742132,40.6101247485599,40.6100905942268,40.6099927748921,40.6099364587682,40.6098630181337,40.6097921386053,40.6097358815143,40.6096697144931,40.609637895679,40.6096428745045,40.6096404921659,40.609611163085,40.6095500928708,40.6095535879678,40.609555089318,40.6095528059673,40.6094867387469,40.6094134595207,40.6093839576834,40.6093153849369,40.6092565083992,40.6092222069447,40.6091588362024,40.609137015912,40.6091300852883,40.6091298662423,40.6091471666605,40.6091056566201,40.6090710693147,40.6090495527256,40.6090229889924,40.608981566326,40.608947353045,40.6089155518,40.6088887469926,40.6088594533305,40.6088031201852,40.6087735913447,40.608685463307,40.6086292763331,40.6085609078317,40.6085170545179,40.6085162504483,40.6085050142615,40.6084561879144,40.6084092339349,40.6084023500878,40.608299510227,40.608245490173,40.6081111476531,40.6081304766208,40.608131053544,40.6080993294051,40.6080480672454,40.6080015721593,40.6079281151453,40.6078764071977,40.6078204667972,40.6077837407119,40.607695588785,40.6076981013277,40.6076810995388,40.607725169573,40.607747327334,40.6077524595802,40.607738045854,40.6076744908646,40.6076616657218,40.6076108547474,40.6076550583252,40.607661824875,40.6077658724401,40.6078095101193,40.6081545214169,40.6081555158496,40.6082277755759,40.6082373457033,40.6082518013892,40.6083153727763,40.6083789451552,40.6084745986062,40.6085359678203,40.608548330938,40.6086023437486,40.6087028115105,40.6087840471453,40.6089443404381,40.6090102191742,40.609158269911,40.6096478876416,40.6098084062042,40.6098741277825,40.6098492234131,40.6097499951293,40.609650843159,40.6096709729817,40.6096170406708,40.6096988987811,40.6096738149442,40.6097639706133,40.6098254549715,40.6098706358226,40.6098787475345,40.6099238802544,40.6098662301149,40.6098086396249,40.6098989723429,40.6099399055373,40.6100177797429,40.6102234617952,40.6106758670702,40.6109596391078,40.6111530597201,40.6113381019855,40.6115663901528,40.6117579966983,40.6119495379311,40.6119602749894,40.612014944195,40.612135571984,40.6124914898749,40.6126938844995,40.6129339408364,40.613092136666,40.6131738611963,40.6131240494955,40.6130360226386,40.6131015979319,40.6131176930418,40.6132159354358,40.613374552782,40.6135712764554,40.6137841715796,40.6139752930672,40.6139866862725,40.6140594500658,40.6146218782117,40.6154763260769,40.6155564674467,40.6157536972311,40.6160459164245,40.6164044154127,40.6166826111867,40.6170990629427,40.6171205894951,40.6173617496983,40.6179762191384,40.6182833906992,40.6187590651798,40.6191098983966,40.6194092460406,40.6197740678905,40.6198686276696,40.6199191128869,40.6200634937445,40.6199666135807,40.6198149210435,40.6196510003735,40.6194624445238,40.6192960093745,40.6192373479179,40.6191442759481,40.6190903659164,40.6189263796879,40.6188553755496,40.6187574247264,40.6186472824834,40.6185051185543,40.6184093096599,40.6183356766787,40.6182450764224,40.6181324809376,40.6181163518148,40.6180566587726,40.6180150428934,40.6179807223381]}],[{"lng":[-73.7667193111324,-73.7667082778141,-73.7682595905592,-73.7708750037695,-73.7685486812336,-73.7674592695054,-73.7667193111324],"lat":[40.6150042316476,40.614910865683,40.6154010139779,40.615863723217,40.6205596782733,40.6205113220626,40.6150042316476]}],[{"lng":[-73.8125179355306,-73.8125563103183,-73.8125988436589,-73.8126184298911,-73.8126561387765,-73.8126878128169,-73.8126802597159,-73.8126528994868,-73.8126096750109,-73.8125965045985,-73.8125912553826,-73.8125959135656,-73.8125517195803,-73.8125299105605,-73.8125210347757,-73.8125158880653,-73.8125241352705,-73.8125244895588,-73.8125482160698,-73.8125449182551,-73.8125264569317,-73.8125175055886,-73.8125179355306],"lat":[40.6201998225506,40.6201648462332,40.6202290120735,40.6202480500183,40.6203442546287,40.6204632784256,40.6205718893533,40.6206331031496,40.6206474170889,40.6206382438361,40.6206167381031,40.620565671581,40.620517654522,40.6204773873306,40.6204486930341,40.620421468856,40.6203902804997,40.6203613618562,40.6202916613341,40.6202658856135,40.6202485341641,40.6202241303332,40.6201998225506]}],[{"lng":[-73.7734733756138,-73.7736372919772,-73.7741146646997,-73.7745604951998,-73.7750332232726,-73.775118912546,-73.7751804593555,-73.7751579428594,-73.7751187772907,-73.7750646097998,-73.774953281833,-73.7750058817608,-73.7749946157902,-73.7749397682599,-73.7747664059602,-73.7748201277047,-73.7748088545659,-73.7747562573892,-73.7745828859097,-73.7746343752235,-73.7746219889329,-73.7745716255244,-73.7743982501581,-73.7744508590996,-73.7744384762708,-73.7743858730955,-73.7742147332739,-73.7742695879897,-73.7742572092837,-73.7742034742909,-73.7740289787562,-73.7740838322533,-73.7740714399195,-73.7740165901812,-73.7738454652752,-73.7738969463845,-73.7738856814622,-73.7738330834997,-73.7736608298803,-73.7737167944795,-73.7737021591347,-73.7736484359924,-73.7735006729403,-73.7734733756138],"lat":[40.6213440261014,40.6211357243606,40.6205225202132,40.6199519591277,40.6193431786951,40.6192338469849,40.6192647178849,40.6192937155651,40.6192739932893,40.6193432401132,40.6194863558229,40.6195112295071,40.6195282899229,40.6195042665682,40.6197225938911,40.6197474698574,40.6197662380351,40.6197405112075,40.6199605460269,40.619982854,40.6199990597931,40.619975898115,40.62019678671,40.6202190976318,40.6202344480069,40.6202104287941,40.6204330287883,40.6204544911436,40.620468987275,40.6204475277832,40.6206675595504,40.6206898760558,40.6207077889011,40.6206846188353,40.6209020937479,40.6209269657334,40.6209431729818,40.6209174440593,40.6211366254403,40.6211615063329,40.6211802684524,40.6211553924686,40.6213439091744,40.6213440261014]}],[{"lng":[-73.7701681485259,-73.7701882916573,-73.7702465645625,-73.7703933261692,-73.7705258776894,-73.7707109005398,-73.7708758215718,-73.7710931866691,-73.7712405584762,-73.7714053156574,-73.7714807221,-73.7715449897513,-73.7716236008474,-73.7716545462262,-73.7717100301521,-73.7717169944713,-73.7715638278995,-73.7698155809728,-73.7696148745548,-73.7696662398712,-73.7697291658997,-73.7698070996912,-73.7699127019949,-73.769988271782,-73.7701116661843,-73.7701748254663,-73.7701800461835,-73.770165345323,-73.7701234010725,-73.7701681485259],"lat":[40.6198290916268,40.6197910104191,40.619817862911,40.6198161990556,40.619824087653,40.6198492364445,40.6199010302931,40.6199777077808,40.6200409032211,40.6201403485369,40.6201990873302,40.620265993276,40.6203574531415,40.6204164268156,40.6206692634239,40.6209616793006,40.6213605272864,40.6213773515024,40.6211469686728,40.6210213130064,40.6209089786188,40.6207966740805,40.6206405844453,40.6204882465891,40.6202502292911,40.6200692750887,40.6200063839418,40.6199167670452,40.619872697168,40.6198290916268]}],[{"lng":[-73.8319099613493,-73.8319977175148,-73.8320480860324,-73.832099716663,-73.8321565524414,-73.8322794019607,-73.832353086481,-73.8325129938865,-73.83241551492,-73.8324966249311,-73.8325525717088,-73.8326048500616,-73.8326198607137,-73.8326031546145,-73.8326722665085,-73.8327507078643,-73.8327862398614,-73.8327919249027,-73.8328592868516,-73.8329173180429,-73.8329584914346,-73.833003427198,-73.8330390202953,-73.8330970533539,-73.8331140227598,-73.8331365742807,-73.833138546928,-73.8331201227558,-73.8331183776771,-73.8331054574596,-73.8331149295418,-73.8331522138069,-73.8331950762352,-73.833249236902,-73.8332343966491,-73.8331934577424,-73.8331953890101,-73.833148710972,-73.8331169306427,-73.8331000829185,-73.8330516426869,-73.8330461770943,-73.8330630717135,-73.8330818584971,-73.8330856980111,-73.8331082209013,-73.8331437736929,-73.8331979809231,-73.8332671126592,-73.8333231744311,-73.8333960679202,-73.8334614742119,-73.8335343604456,-73.8336821495258,-73.8336224200233,-73.8335279275021,-73.8333578196393,-73.8332880466661,-73.8332182584935,-73.8331373171354,-73.8330842499919,-73.8330562139958,-73.8330728267281,-73.8330281332658,-73.8330308638461,-73.8330754349327,-73.8331366717853,-73.8331393743839,-73.8331922869127,-73.8332285012333,-73.8332089406851,-73.8331475438638,-73.8330498649177,-73.8330079574517,-73.8330134609981,-73.8330413038047,-73.8330328923315,-73.8330012200066,-73.832986188142,-73.8329650019117,-73.8329473307616,-73.8329402499524,-73.8329322960159,-73.8329305094981,-73.8329234308734,-73.8328951897324,-73.832863423345,-73.832827239801,-73.8327954693871,-73.8327592922057,-73.832742538614,-73.8327381438571,-73.8327169754535,-73.8327081302848,-73.8327081055236,-73.8327133664942,-73.8327212818728,-73.8327265613823,-73.8327239014135,-73.8327071278812,-73.8326841653234,-73.832676200486,-73.8326885371397,-73.8327008774643,-73.8327087933657,-73.8327096595851,-73.83272287911,-73.8327263892688,-73.8327228433671,-73.8327228260076,-73.8327378256711,-73.8327545886175,-73.8327713438081,-73.832776649233,-73.8327669922835,-73.8327661524646,-73.8327741114718,-73.8327794273521,-73.8327521336898,-73.8327609880539,-73.8327663308619,-73.8327655011397,-73.8327787758677,-73.8327893998558,-73.8328097223935,-73.8328265010389,-73.8328432834046,-73.8328670811288,-73.8328847088169,-73.8329102603819,-73.8329340635135,-73.8329464344256,-73.832964960819,-73.8329782448908,-73.8329941443045,-73.8330196924975,-73.8330373372008,-73.8330373691255,-73.8330488715584,-73.833048903481,-73.8330471689172,-73.8330330729827,-73.8330375069083,-73.8330445879702,-73.8330631088408,-73.8330842447109,-73.8331044955543,-73.833117673092,-73.8331370840386,-73.8331679211616,-73.833187286775,-73.8331987001974,-73.8332065842354,-73.8332233093081,-73.8332135624468,-73.8332152924438,-73.8332337955417,-73.8332593471339,-73.8332506029965,-73.8332532981401,-73.8332736144731,-73.8332807072438,-73.8332816421668,-73.8332905047653,-73.8333090581644,-73.8333258041579,-73.8333293641698,-73.8333082349857,-73.8332977007447,-73.8332800889885,-73.8332660163281,-73.8332792842789,-73.8333092795984,-73.8333419181617,-73.8333578407993,-73.8333807992775,-73.8334090377053,-73.833431951782,-73.8334451358616,-73.8334706856979,-73.8334944799999,-73.8335279702595,-73.8335482228092,-73.833575506421,-73.8335592388045,-73.8334300831896,-73.8333921984621,-73.8333914777722,-73.8333848986859,-73.8333535905156,-73.8333209801931,-73.8332629080209,-73.8331937280131,-73.8331923569293,-73.8331935790455,-73.833159636043,-73.8331264014071,-73.8330996913291,-73.8329817209417,-73.8328845452644,-73.8328082289796,-73.832699954918,-73.8326626737309,-73.8326372141646,-73.8326046073307,-73.832571956956,-73.832515155977,-73.8324746575443,-73.8324119759325,-73.8323812813335,-73.8323426853898,-73.8323249611111,-73.8322843734816,-73.8322451295608,-73.8321994392546,-73.8321563904725,-73.8321120466581,-73.8320605516525,-73.8320201725087,-73.8319928483232,-73.8319616504478,-73.8319356531636,-73.8318946467137,-73.8318497436505,-73.8318152618187,-73.8317931690803,-73.8317848831953,-73.8317869251037,-73.8317818278285,-73.8318242949613,-73.8318673641987,-73.8319091371748,-73.8319099613493],"lat":[40.624175722088,40.624016898144,40.6239489199358,40.6238978329884,40.6238502300122,40.6237351695935,40.6235007655591,40.6230103043779,40.6229247963854,40.6229201880956,40.6229401809278,40.6229345681094,40.6229033003963,40.6228662982215,40.6228464875034,40.6228281133084,40.6228011418886,40.6227670164475,40.6227002693043,40.6226335085606,40.6225894792686,40.622534077691,40.6224829284876,40.6224147458358,40.6223465030488,40.6222853794672,40.6222427155261,40.6221459764323,40.6220976183097,40.6220392880466,40.6219838344308,40.6220023780619,40.6220294621975,40.6220167407115,40.6219797418342,40.6219299033554,40.6219043065433,40.6219099270877,40.6219297922908,40.6219496796677,40.6219140538006,40.6218600008178,40.621821624506,40.6217732956914,40.6217306344595,40.6216808885753,40.6216453846498,40.6216141737417,40.6215858297684,40.6215588884564,40.6215191716198,40.6214879768167,40.6214511050282,40.6213813056865,40.6226026388295,40.6225704795293,40.6225597271634,40.6226000502627,40.6226509978227,40.6226998124229,40.6227613983082,40.6228740029617,40.6229675158341,40.6230227328365,40.6230673600074,40.6231077689103,40.6231991907918,40.6232650688104,40.6233246088581,40.6233565108468,40.6233862465173,40.6234180755614,40.6234690023022,40.623526345598,40.6235837257548,40.6236198718843,40.6236538660529,40.623688656373,40.6237128496862,40.6237195574266,40.6237363535086,40.6237524848097,40.6237625641953,40.6237793729704,40.6237934862188,40.6237968279192,40.6237954587646,40.6237981201254,40.623800113924,40.6237987421787,40.6237886437821,40.6237745208891,40.6237677818915,40.6237832386521,40.6238020651942,40.6238276191849,40.6238484686341,40.6238605754304,40.6238706586509,40.6238753530342,40.6238907998031,40.6239082752269,40.6239203879401,40.6239318275257,40.623951331383,40.6239647800316,40.6239775641418,40.6239930313413,40.6240044586983,40.6240185790251,40.6240199348827,40.6240226375565,40.6240307178985,40.6240246799955,40.6240085458023,40.6239917513028,40.623981687349,40.6239709480937,40.6239574742377,40.623942038261,40.6239205515553,40.6238997278295,40.6238795954063,40.6238614748356,40.6238426970797,40.6238313025326,40.6238178934518,40.6238199420848,40.6238213116281,40.6238267219264,40.6238260852304,40.6238146842605,40.6238093373506,40.6237851761796,40.6237724359101,40.6237791900971,40.623773842565,40.6237610804168,40.623744303843,40.6237315416949,40.6237201208993,40.6237167413035,40.6237060007552,40.6236945915894,40.6236912605325,40.6237000230024,40.6237101279339,40.6237282830866,40.6237215941851,40.6237283560156,40.6237398035658,40.6237586274382,40.6237787901069,40.6237888899021,40.6238083550332,40.6238217916963,40.623825848449,40.6238312598424,40.6238023636465,40.6237822163256,40.6237661244718,40.6237500141089,40.6237285209867,40.623709727029,40.6236936321099,40.6236949996371,40.6236815718175,40.6236701217341,40.6236526418925,40.6236445565315,40.6236317739281,40.6236136566438,40.6236049678553,40.6235962833935,40.6235748119963,40.6235593959122,40.6235480178882,40.6235507377532,40.6235662062148,40.6235722883451,40.6235756812641,40.6235790883861,40.623588521283,40.6235979172793,40.6239360345,40.6239752703739,40.6240045221686,40.6240323379795,40.6240561708414,40.6240625828698,40.6240684962781,40.6240892746268,40.6241199714691,40.6241467927202,40.6241795777466,40.6241969146553,40.6241914026279,40.6241839128337,40.6241733096453,40.6241890640873,40.6242058412263,40.6242280367781,40.6242766620999,40.6242905322944,40.6242944587781,40.6243162669024,40.6243499622077,40.6243811966188,40.6244203470955,40.6244416606229,40.6244947546031,40.6245434071605,40.6246104059728,40.6246615112425,40.6246837976262,40.6246921794211,40.624697578465,40.6246945224102,40.6246790656582,40.6246561757772,40.6246188762497,40.6245875448314,40.6245616540804,40.6245302949966,40.6245019314821,40.6244735860844,40.6243985680315,40.6243642972601,40.6243171007269,40.6242804051448,40.6242640762618,40.6242437715112,40.624175722088]}],[{"lng":[-73.8122341921654,-73.8122468687948,-73.8122690544799,-73.8123253065864,-73.8123291937485,-73.8123177396165,-73.8123088633672,-73.8122840952387,-73.8122436891669,-73.8122505778737,-73.8122758093185,-73.8123352352649,-73.8124385746238,-73.8124400510686,-73.812437895435,-73.8124198898849,-73.8123829489562,-73.8123353179843,-73.8123179819093,-73.8123146688412,-73.812294798347,-73.8122784542789,-73.8122674219611,-73.8122388682573,-73.8122165228713,-73.8122058150837,-73.8121993891422,-73.8121601773099,-73.8121160632373,-73.8121045238735,-73.8120738859506,-73.8120223813664,-73.812003834514,-73.8119916433773,-73.8119387429676,-73.8119269875686,-73.8118636692195,-73.8117973170439,-73.8117578406179,-73.8117508599302,-73.8117502053064,-73.8117345710745,-73.8117339783489,-73.8117335484606,-73.8117296129317,-73.8117238141483,-73.8117195678984,-73.8117088904763,-73.8117068278298,-73.8116999960766,-73.811695583117,-73.8116913655518,-73.8116807817771,-73.811695838035,-73.811720043672,-73.8118094933803,-73.8119314585368,-73.8119600294984,-73.8120142543803,-73.812039528205,-73.8120834413368,-73.8121428649396,-73.8122025006023,-73.8122526694397,-73.8123120081663,-73.812380224777,-73.8124464561012,-73.8124614014527,-73.8124916110395,-73.8125114825042,-73.8125157998231,-73.8125299114561,-73.8128545365516,-73.8128822197189,-73.8129922808296,-73.81299674151,-73.8130126517747,-73.8130371944915,-73.8130375978332,-73.8130435011207,-73.813250953106,-73.8130124292926,-73.8130124124673,-73.8130124121808,-73.8130125162088,-73.8130319049184,-73.8130367324283,-73.8133072886587,-73.8136944378738,-73.8137304094008,-73.8137402816472,-73.8137476759827,-73.8137453460214,-73.8137336893922,-73.8137315699441,-73.8137290279267,-73.8137285104463,-73.8139968299479,-73.8138619876158,-73.813920723347,-73.8139727020187,-73.8140103707743,-73.8141192086406,-73.814197231454,-73.814275592523,-73.8143417361907,-73.8143949076987,-73.8144291002877,-73.8144614760826,-73.8144670634335,-73.8144682039114,-73.8144690790101,-73.8144710286969,-73.8144716134872,-73.8144741371586,-73.8144749940891,-73.8144756096801,-73.8144761617777,-73.8144787077427,-73.8144748534598,-73.8144691674935,-73.8144469633901,-73.8144418129835,-73.8144377653487,-73.8144356631156,-73.8143846732879,-73.8143748449195,-73.814361966603,-73.8143434894106,-73.8143031740943,-73.8141993999917,-73.8141903080392,-73.8141670398003,-73.8141585664167,-73.8141280694099,-73.8140831192668,-73.8140690389077,-73.8140493608202,-73.8140315096806,-73.8139630793254,-73.8139541539677,-73.8139464173803,-73.8139303521273,-73.8139125994896,-73.8138919125869,-73.8138736663039,-73.8138583383954,-73.8138463302036,-73.8138379561495,-73.8138334354989,-73.8138328866227,-73.8137625849609,-73.8136893561986,-73.8136139486235,-73.8135371327898,-73.8135369237287,-73.8134987505919,-73.8134972893993,-73.8134746424626,-73.8134443384847,-73.8134159758566,-73.8133991379374,-73.8133819504199,-73.8133693089456,-73.8133635602673,-73.8133518463418,-73.813342768497,-73.8133403683551,-73.8133330999199,-73.8133071717734,-73.8132830473069,-73.8132040739386,-73.8131813854487,-73.8131798724314,-73.8131429125829,-73.8131289658863,-73.8131133184131,-73.8130563338969,-73.8130508921345,-73.8130446485341,-73.8130339637076,-73.8129687207595,-73.8129627399254,-73.8129380730635,-73.8129291598846,-73.8129128796617,-73.8129023025672,-73.8128915709941,-73.8128729666731,-73.8128512312955,-73.8128294265957,-73.8128212646962,-73.8127934534126,-73.8127765135138,-73.8127606398957,-73.8127518053459,-73.8127390677736,-73.812701314413,-73.8126311935017,-73.8126179277311,-73.8126149315965,-73.812610459024,-73.812604508036,-73.8126000361224,-73.8125970207729,-73.812591831952,-73.8125727003303,-73.8125606983347,-73.8125555751433,-73.8125453243527,-73.8125460091303,-73.8125463662321,-73.8125473585922,-73.8125491979522,-73.8125499852729,-73.8125498540441,-73.8125500745298,-73.8125506908293,-73.8125543665181,-73.8125563167205,-73.8125667309294,-73.812569282444,-73.8125716443747,-73.8125714515361,-73.8125708150853,-73.8125683174142,-73.8125613912453,-73.8125563686399,-73.8125470510686,-73.8125367346004,-73.8125164005707,-73.812491495812,-73.8124714416557,-73.8124692455921,-73.8124665056738,-73.8124650562193,-73.8124632464048,-73.8124630517856,-73.8124640171069,-73.8124653059255,-73.8124685328079,-73.8124651341084,-73.8124298292708,-73.812423891477,-73.8123958980296,-73.8123874160978,-73.8123811638024,-73.8123598587377,-73.8123173637047,-73.8123045717844,-73.8122559619415,-73.812246828312,-73.8122285626043,-73.8122255676712,-73.8121633850272,-73.8121602818292,-73.8121525219688,-73.8121478668408,-73.8121199336892,-73.8121153689204,-73.8121141675038,-73.8120651593907,-73.8120551067404,-73.8120402161043,-73.8120286889857,-73.8120134597921,-73.8119975179794,-73.8119909788115,-73.8119875201315,-73.8119884942342,-73.8119887368115,-73.8119915918875,-73.8119911109123,-73.8119901813581,-73.8119878182086,-73.8119868596631,-73.8120068938838,-73.8120371114333,-73.81207979907,-73.812093027227,-73.8121466191684,-73.8122194441926,-73.8122341921654],"lat":[40.6253000883674,40.625114303895,40.6249214675631,40.6247480498527,40.6247051868417,40.6246454815455,40.6246167877478,40.6246022322528,40.6245875156833,40.6245518335178,40.6245401753252,40.6245407861563,40.624534698254,40.6244512907701,40.6243964477736,40.6243533592284,40.6243196108561,40.624242833599,40.6242203589113,40.6242166244722,40.6241942213667,40.6241705229847,40.6241545270487,40.6241283339826,40.6241078349778,40.6240866118198,40.6240738769843,40.6240496274156,40.624022346089,40.6240160663319,40.6239993904974,40.6239713587527,40.6239612632763,40.623954628453,40.6239375000307,40.6239336939724,40.6239206552808,40.6239120916515,40.6238880375207,40.6238816591463,40.6238810608331,40.6238667776661,40.6238518741428,40.6238410545759,40.6238271308171,40.6238066105632,40.6237960559757,40.6237695204718,40.6237643947232,40.6237445886281,40.6237317939023,40.623719569933,40.6236496436997,40.6236340345441,40.6236023766738,40.623558630503,40.6234950383496,40.6234714973194,40.6234124669816,40.6233984258076,40.6233917284133,40.6233923393417,40.6233810349094,40.6233743997706,40.6233797776818,40.6234138481891,40.6234752064134,40.6234890529521,40.6235170393846,40.6235354482303,40.6235394483276,40.6231339533592,40.6225438980176,40.6224935792976,40.6222935221981,40.6222854151803,40.6222602279241,40.6222871065113,40.6222876166234,40.6222951008714,40.622558092075,40.62356434768,40.6236624121613,40.6236632992275,40.6236634454821,40.623856768422,40.6238583989598,40.6242337729692,40.6246072350109,40.6246623862464,40.6246775222445,40.6246888591908,40.6246953101446,40.6247275650692,40.6247334295094,40.6247404663035,40.6247446848528,40.6249991726204,40.6250438994207,40.6251005230045,40.6251356071318,40.6251610316456,40.6251979012285,40.6252082374106,40.6251995076012,40.6251739682446,40.6251745146354,40.6251867825342,40.625267066811,40.6253256332728,40.6253375811094,40.6253467572517,40.6253718895926,40.6253794315227,40.6254119598582,40.6254230057631,40.625430936913,40.6254380589625,40.6254708743109,40.6254792924585,40.6254917095847,40.6255401956995,40.6255514431629,40.6255602826677,40.6255648712466,40.6256455397924,40.6256610880452,40.6256685110708,40.6256791595375,40.6257023933657,40.6257204704563,40.6257231072451,40.6257298530567,40.6257323102465,40.6257411518806,40.6257541844967,40.6257582673613,40.6257639727361,40.6257705456804,40.6257957425815,40.6257990289638,40.625801877673,40.6258077935946,40.6258171980886,40.6258274485063,40.6258401068484,40.625854841674,40.6258712671721,40.6258889532635,40.6259074368615,40.6259262339977,40.6259510354226,40.6259703024192,40.6259838381071,40.6259915041714,40.6259918040444,40.6259990038416,40.6259992797371,40.6260035518446,40.6260100435129,40.6260161195012,40.6260197262142,40.6260234087504,40.6260261154357,40.6260281586698,40.6260323200061,40.626035545783,40.6260363982949,40.6260389796763,40.6260481903738,40.6260567593429,40.6260931083352,40.6261016028877,40.6261021680176,40.6261160048248,40.6261212258165,40.6261270836679,40.6261592028427,40.6261622708331,40.6261657900152,40.6261703805268,40.6261984119208,40.6262009823062,40.6262107558597,40.6262142876124,40.6262207382975,40.6262239133515,40.6262271325484,40.6262327153304,40.6262392378767,40.6262457805769,40.6262478340952,40.6262548330752,40.6262590960773,40.6262630897515,40.6262648441351,40.6262673726787,40.6262748665737,40.6263044471795,40.6263100441491,40.6263122652246,40.6263144713288,40.6263166619559,40.6263188680608,40.62632221557,40.6263290789869,40.626354385566,40.6263702633353,40.6263814707188,40.6264038873206,40.6264158376155,40.6264220935657,40.6264237981166,40.6264287021786,40.6264328739309,40.6264398278486,40.6264465008908,40.6264494827404,40.6264567695466,40.6264598649777,40.6264734484603,40.6264777383486,40.6264848643624,40.6264876066664,40.6264892162532,40.6264922171503,40.6264968358594,40.6264991568274,40.6265027587559,40.6265067477224,40.6265178227473,40.6265406753139,40.6265287483762,40.6265277796592,40.6265256710249,40.6265237983661,40.6265194141938,40.6265161371753,40.62651330064,40.6265116179025,40.6265091331815,40.6265089118602,40.6264995406555,40.6264960115174,40.6264793724226,40.6264743318719,40.6264676243594,40.6264447704552,40.6264240635205,40.626416190215,40.626386272243,40.6263734160566,40.6263477031816,40.6263442557353,40.6262727137305,40.6262691426366,40.6262602142283,40.6262548587591,40.6262227187324,40.6262161972396,40.6262144809512,40.6261444567911,40.6261279320429,40.6261034554906,40.6260845051888,40.6260594702074,40.6260364680293,40.6260270333226,40.6260220436765,40.626006962124,40.6260031966345,40.6259590260632,40.6259522725145,40.6259392074119,40.6259060046446,40.6258925382623,40.6257696842538,40.6256532032783,40.6255392333322,40.6254988499532,40.6254755667229,40.6254262617648,40.6253000883674]}],[{"lng":[-73.7988198157662,-73.7987893966972,-73.7987248838813,-73.7987129420507,-73.7987010002177,-73.798677115009,-73.7986726612627,-73.7986667505547,-73.7986623595506,-73.7986594849556,-73.7986565893715,-73.7986566309027,-73.7986596453695,-73.7986612242942,-73.7986613254879,-73.7986628637604,-73.798665879102,-73.7986659597491,-73.798663065705,-73.7986601508962,-73.7986572418394,-73.7986558447587,-73.798655953677,-73.7986545557135,-73.7986516473109,-73.7986487333849,-73.7986458290703,-73.7986024179852,-73.7985937723556,-73.7985678418563,-73.7985591977821,-73.7985520881802,-73.7985443796513,-73.7985408354459,-73.7985375042137,-73.7985279141559,-73.79849077032,-73.7984841160112,-73.7984762665579,-73.7984712684814,-73.7984407518037,-73.7984201278321,-73.7983999681144,-73.7983850547764,-73.7983672758279,-73.7983422760774,-73.7983245236675,-73.7983079082663,-73.7982459203961,-73.7982343234093,-73.7981851860113,-73.7981614451311,-73.7981412218776,-73.7981263185745,-73.7980698451124,-73.7980475422077,-73.7980367585536,-73.7979980685025,-73.7979468898433,-73.797935269544,-73.7978675535371,-73.7978186646067,-73.7978010952924,-73.7978157330801,-73.7978280381095,-73.7978584181345,-73.7978674446949,-73.7979652912656,-73.7979689781353,-73.7980095379033,-73.7980829357629,-73.7980930019126,-73.7981716447902,-73.7981813226561,-73.7982087784823,-73.7982116538885,-73.7982145485313,-73.7982174624077,-73.7982203778212,-73.7985413979685,-73.7985436878421,-73.7985433033587,-73.7985429617349,-73.7985427488386,-73.7985459145846,-73.7985488686378,-73.7985537432857,-73.7985565911701,-73.798567904918,-73.7985679829168,-73.798574914403,-73.798585070447,-73.7985923087302,-73.7985992595657,-73.7986081266989,-73.7986172280406,-73.7986324946242,-73.798662032667,-73.7986965280999,-73.7987137743009,-73.7987256138541,-73.7987296364931,-73.7987548251918,-73.7987595279295,-73.7987753899579,-73.7987830418362,-73.7988576087725,-73.7988673292286,-73.7989515678361,-73.7989580932104,-73.798960994647,-73.7989683646959,-73.7990297316143,-73.7990364176843,-73.7990752790559,-73.7991006711687,-73.7991131069279,-73.7991331428799,-73.7991711429613,-73.7992665180005,-73.7992709992113,-73.799419608464,-73.7994242579251,-73.7995026650745,-73.7995116464149,-73.7997227376964,-73.7999384595531,-73.7999470201592,-73.800128600721,-73.8001344388712,-73.8001569297018,-73.8001599250588,-73.8001818905816,-73.8002003649179,-73.8002527854925,-73.8002917277012,-73.800325762201,-73.8003726525518,-73.8003923305967,-73.8003626914821,-73.8002789905428,-73.8002346046984,-73.8001556913516,-73.8000389882086,-73.7998002232343,-73.7996586692875,-73.7995269251847,-73.7994030701545,-73.7993860973364,-73.7992270150986,-73.7992149342776,-73.7991032241697,-73.7989626576248,-73.7988578604736,-73.7987764112656,-73.7986993181502,-73.7986570926195,-73.798671622946,-73.798677169956,-73.79873436864,-73.7988286188867,-73.7988974422292,-73.7989617840008,-73.7997491410325,-73.7997827834102,-73.7997822127553,-73.7997761059276,-73.7997718514853,-73.7997699191992,-73.7997685056876,-73.79976668411,-73.7997651516107,-73.799762028777,-73.7997598758549,-73.7997589775021,-73.7997584333126,-73.7997578048787,-73.799753127323,-73.7997563650689,-73.7997658033487,-73.7997717130913,-73.7997760495783,-73.799779880058,-73.7997851298372,-73.7997899096246,-73.7997941566007,-73.7998051544892,-73.799823877979,-73.7998363667178,-73.7998851003863,-73.7999145519983,-73.7999301904776,-73.7999335161088,-73.799942682231,-73.799958596133,-73.7999595335745,-73.7999629231813,-73.7999657113381,-73.7999734346375,-73.8000431740878,-73.8000545405403,-73.8001364298768,-73.8001391652877,-73.8001627399737,-73.8002119387542,-73.800227525895,-73.8003355569709,-73.8003986164605,-73.8004526787374,-73.8005564784145,-73.8007408255081,-73.8009019578677,-73.8011217454249,-73.8012738294876,-73.8013009297271,-73.8013100924504,-73.8013248054033,-73.8013277000116,-73.8013290814871,-73.8013306009375,-73.8013319795796,-73.8013378538078,-73.801348105844,-73.8013518564778,-73.8013635995144,-73.8013643520319,-73.8013651777488,-73.8013734236241,-73.8013766742848,-73.8013839505213,-73.8014081499134,-73.8014160418769,-73.8014464672866,-73.8014720841858,-73.8014815018087,-73.8014994080861,-73.8015352401922,-73.8015457324851,-73.8015574278114,-73.8015630599804,-73.8016537681934,-73.8017170701776,-73.8017265961262,-73.8017285145121,-73.80175263132,-73.8018135594461,-73.801866324688,-73.8018951984921,-73.8020641985362,-73.8020636353883,-73.8020649558242,-73.8020661913321,-73.8020679534173,-73.8020702873402,-73.802070716437,-73.8020746740361,-73.8020733134026,-73.8020700725046,-73.8020670565101,-73.8019894537716,-73.801984738033,-73.8019245641137,-73.8019095720896,-73.8018700168048,-73.8018603114492,-73.801837810718,-73.8018355951876,-73.8018283777841,-73.8018231118073,-73.8018168901401,-73.8018070312224,-73.8017896081147,-73.8017869114038,-73.8017698783069,-73.8017584666912,-73.8017531518389,-73.8017372616619,-73.8017349318128,-73.8017160588646,-73.8016808526197,-73.8016526891044,-73.8016099046588,-73.8016078068972,-73.8015875597546,-73.8015847305629,-73.8015826759323,-73.8015804831526,-73.8015196268165,-73.80151779606,-73.8015080968707,-73.8015076997429,-73.8014836699482,-73.801478303427,-73.8014757503995,-73.8014752793191,-73.801457781055,-73.801451143083,-73.801466475473,-73.8014697273449,-73.8014577285232,-73.8014210525689,-73.8013808017219,-73.8013510551647,-73.8013704403518,-73.8013163734467,-73.8013104490546,-73.8013262099852,-73.8013418304725,-73.801462163892,-73.8014930044463,-73.8015013275632,-73.8015071828647,-73.8015081368044,-73.8015064863809,-73.8015022746651,-73.8014965399556,-73.8014888986048,-73.8014881829178,-73.8014879128731,-73.8014926995208,-73.8014956145021,-73.8015040446065,-73.8015072020523,-73.8015073223904,-73.8015074226767,-73.8015109250349,-73.8015110444941,-73.8015341937724,-73.8015357820698,-73.8015510158117,-73.8015528723599,-73.8015596243317,-73.8015945075254,-73.8015984119068,-73.8016288890194,-73.801649823639,-73.801716602535,-73.8017197132417,-73.8018254771108,-73.8018345134178,-73.8018363419295,-73.8018690983381,-73.8018709370706,-73.8018779004215,-73.8018809712489,-73.801891264064,-73.8018983898891,-73.8019057531365,-73.8019060922542,-73.8019336044894,-73.8019471727734,-73.8019557396833,-73.8019672958646,-73.8020688988855,-73.8020804128019,-73.8021322274154,-73.8021554583714,-73.8021635095729,-73.8021669640586,-73.8021826910005,-73.8022109247146,-73.8022867621231,-73.8024033950663,-73.8024226089439,-73.8024889495178,-73.8026730315717,-73.8034741130816,-73.8036209232682,-73.8037988920715,-73.8040801719613,-73.8045178847388,-73.804535171958,-73.8044787116839,-73.8044813392726,-73.8044812583677,-73.8044826770091,-73.8044855907984,-73.80448850591,-73.804491400793,-73.8044942747918,-73.8044971496689,-73.8045000252081,-73.8045029189944,-73.8045403361942,-73.8045454645956,-73.8045579076586,-73.8045666396765,-73.8045738079988,-73.8045755736907,-73.8045748879728,-73.8045740682154,-73.8045742513335,-73.8045715605705,-73.8045693187452,-73.8045579568418,-73.804556407947,-73.8045608312461,-73.8045709621464,-73.8045769898448,-73.8045776207282,-73.8045811003699,-73.8045889902308,-73.8045994601301,-73.8046058936979,-73.8046077534896,-73.8046107936353,-73.804616960244,-73.8046164950264,-73.8046123128912,-73.8046085992465,-73.8046083646046,-73.804609714412,-73.8046150451828,-73.8046197268145,-73.8046207024892,-73.8046203751487,-73.8046167302523,-73.8046163183979,-73.804630010929,-73.8046338309407,-73.8046529281669,-73.8046563341666,-73.8046686364703,-73.804675916544,-73.8047378649808,-73.8047449240722,-73.804762316509,-73.8047786252227,-73.8047913048648,-73.8048010961516,-73.8048052925441,-73.8048076801906,-73.8048105748986,-73.8048178513296,-73.8048188172143,-73.8048244006866,-73.8048248670404,-73.8048188683378,-73.8048115978474,-73.8048110671555,-73.8048058790588,-73.804797946587,-73.8047969552637,-73.8047946362157,-73.8048329292158,-73.8048337432441,-73.8049256253514,-73.8049404925278,-73.8049757154478,-73.804981551342,-73.8050026647463,-73.805016029361,-73.8050395283566,-73.8050490343725,-73.8050822538644,-73.8050950700709,-73.8051191280238,-73.8051282591082,-73.8051436761769,-73.805147637242,-73.8051529707656,-73.8051554812954,-73.8051532228989,-73.80515459099,-73.8051641732507,-73.8051646930397,-73.8051652115282,-73.8051985684995,-73.8052024614326,-73.8052034051539,-73.8052068628751,-73.8052154967045,-73.805200728463,-73.8052565974391,-73.8053065423379,-73.8053134676039,-73.8053138200994,-73.8053140757825,-73.8053143347617,-73.8053360378548,-73.8053418250699,-73.8053663408828,-73.8053762822316,-73.8053862235859,-73.8053890972689,-73.8053919927056,-73.8053956479201,-73.8054022759,-73.8054104025627,-73.8054170496542,-73.8054214631085,-73.8054243778772,-73.8054272924258,-73.8054294947378,-73.8054302071963,-73.8054331210893,-73.805436037178,-73.8054389526085,-73.8054433447545,-73.8054492144937,-73.8054536066403,-73.805456520533,-73.8054594366245,-73.8054623520533,-73.8054667442043,-73.805492893181,-73.8055144581299,-73.8055234037143,-73.8055355009781,-73.8055642321304,-73.805567948856,-73.8055797600861,-73.8055857336324,-73.8056001865143,-73.8056333883365,-73.8056540223689,-73.8056660429603,-73.80567365523,-73.8056787300083,-73.8056842305757,-73.8056989008201,-73.8057088543134,-73.805726983809,-73.8057376810064,-73.8057421830823,-73.8057490916147,-73.8057930460386,-73.8057987593697,-73.8058060971103,-73.8058205395956,-73.8058277421887,-73.8058303572398,-73.8058319600758,-73.8058528815819,-73.8058481490115,-73.8058479322441,-73.8058611047331,-73.805873483192,-73.8058844736813,-73.8058896633606,-73.8058888332899,-73.8058868438707,-73.8058821582536,-73.8058987061726,-73.8059014632438,-73.8059040919861,-73.8059003585435,-73.8058993234687,-73.8058974751224,-73.8058943907889,-73.8058910791679,-73.8058894794617,-73.8058851828986,-73.8058176838534,-73.8057219311672,-73.805661238353,-73.8056429305347,-73.8064092786662,-73.8061672281016,-73.8061693347909,-73.8061800781626,-73.806182602277,-73.8061836023836,-73.8061838908815,-73.8061966469872,-73.8061992797887,-73.8062008990257,-73.8062078653004,-73.8062234581819,-73.8062263730857,-73.8062292871068,-73.8062322026706,-73.8062351166954,-73.8062380329158,-73.8062409482619,-73.8062286054392,-73.8062255899818,-73.8062255113884,-73.8062284063162,-73.8062313203431,-73.8062342359078,-73.8062371512523,-73.8062400661592,-73.8062429801868,-73.8062458957503,-73.8062488097799,-73.8062517047083,-73.8062545805387,-73.8062560074109,-73.8062595653594,-73.8062666518375,-73.80626745864,-73.8062662352512,-73.8062603307578,-73.8062628156183,-73.8062642022733,-73.8062655893718,-73.8062684940648,-73.806268454333,-73.8062654388769,-73.8062653580861,-73.8062682536793,-73.8062711685892,-73.8062740635235,-73.8062769393599,-73.8062791023245,-73.8062837015331,-73.8062881790355,-73.806289829389,-73.8062902420901,-73.8062848380021,-73.8062853236255,-73.8062881981482,-73.8062910930821,-73.8062910526898,-73.8062880578689,-73.8062850615089,-73.8062820666858,-73.8062790718611,-73.8062760768214,-73.8062730826574,-73.8062700865163,-73.8062685487096,-73.8062684679204,-73.8062669307765,-73.8062639359518,-73.8062609395864,-73.8062579352184,-73.8062563665638,-73.8062562577885,-73.8062561474691,-73.8062545701454,-73.8062515333866,-73.8062480067859,-73.8062420553337,-73.8062341767769,-73.8062282472777,-73.8062247582164,-73.806220304832,-73.8062143944329,-73.8062099425867,-73.8062054694447,-73.8061995186466,-73.8061935678499,-73.8061876170509,-73.8061846031221,-73.8061815876553,-73.8061756765952,-73.8061712842449,-73.8061683295928,-73.8061653334432,-73.8061608813773,-73.8061534935403,-73.8061527784739,-73.806409505884,-73.8060420033794,-73.8059717869416,-73.8059498164644,-73.805416493441,-73.8050183412367,-73.8048499133249,-73.8048608171464,-73.8048679127841,-73.8048752603957,-73.8048766587504,-73.8048736218056,-73.8048741218014,-73.8048747474385,-73.8048761151921,-73.8048684879927,-73.8048553340717,-73.8048543060409,-73.8048418837385,-73.8048167782302,-73.804806992715,-73.8047918531946,-73.8047795405569,-73.8047565918652,-73.8047308335699,-73.8047256815149,-73.8046931377865,-73.8046867397724,-73.8046812324832,-73.8046752827724,-73.8046603866242,-73.8046617966583,-73.8046624933521,-73.8046634601467,-73.8046717250279,-73.8046677856425,-73.8046910365829,-73.8047054010912,-73.8046991888925,-73.804684263148,-73.8046753066876,-73.8046612822755,-73.804651262888,-73.8046475309275,-73.8046408598229,-73.8046327338825,-73.804626083446,-73.8046216703404,-73.8046180184008,-73.8046113886291,-73.8046047601762,-73.8045996285583,-73.804593757756,-73.8045893650983,-73.8045864488237,-73.8045820572657,-73.804574689632,-73.8045673006745,-73.804562888233,-73.8045600151929,-73.8045195705295,-73.8044827160522,-73.8044549929951,-73.8044470724022,-73.8044362285158,-73.8044351546345,-73.8044309458361,-73.8044274751909,-73.8044175077855,-73.8044162157764,-73.8044140233184,-73.804405529751,-73.804388543046,-73.8043884523427,-73.8043883414063,-73.804388229599,-73.8043881413112,-73.8043889545158,-73.8043873717348,-73.8043430711846,-73.804292366971,-73.8042815354702,-73.8042017508556,-73.8041268794535,-73.8041269674033,-73.8041254927509,-73.8041217861352,-73.8041172847633,-73.8041139622514,-73.8041068749559,-73.8041046814412,-73.8040839727033,-73.8040800275648,-73.8040622607737,-73.8040575220641,-73.8040543511106,-73.803835342779,-73.8038218286153,-73.8037817721307,-73.8037703436843,-73.8037474859091,-73.8037160347547,-73.8037130397205,-73.8037015828809,-73.803688711472,-73.8036786722709,-73.8036743156094,-73.8036576236202,-73.8036600152697,-73.8036633444765,-73.8036583876887,-73.8036568196491,-73.8036537730174,-73.803647813845,-73.8036433388866,-73.8036403451642,-73.8036366102733,-73.8036299412862,-73.8036232736195,-73.8036195380696,-73.8036165421479,-73.8036135464437,-73.8036105513976,-73.8036075563561,-73.8036045597721,-73.8036000870093,-73.8035941352112,-73.803588186266,-73.8035822344656,-73.8035777617017,-73.8035747666565,-73.8035710330808,-73.8035643632117,-73.8035576950997,-73.8035539586665,-73.8035510041084,-73.8035480884964,-73.8035451874143,-73.8035438106924,-73.803543945143,-73.8035425668844,-73.8035396849417,-73.8035368107011,-73.8035339155568,-73.8035333945611,-73.8035316858988,-73.803523229059,-73.8035091723073,-73.8034996874446,-73.8034938323924,-73.8034839177675,-73.8034810331942,-73.8034730330508,-73.8034519357207,-73.8034325927445,-73.8034258354107,-73.8034207586937,-73.8034127081476,-73.8034055659674,-73.8033951749134,-73.8033867203549,-73.8033674175039,-73.8033621521542,-73.8033530421233,-73.8033507833046,-73.8033466569457,-73.8033362214788,-73.8033209926154,-73.8033141418617,-73.8032741266833,-73.8032429639651,-73.8032347754564,-73.8032112373767,-73.8031973000875,-73.8031690833452,-73.8031335399693,-73.8031051837641,-73.8031007501679,-73.803084529126,-73.8030805765122,-73.8030730538283,-73.8030680712763,-73.8030577297828,-73.8030494100194,-73.8030333531416,-73.8030183289898,-73.8030165132377,-73.803013455384,-73.8030055845666,-73.8030007740564,-73.802994410539,-73.8029906350618,-73.8029832318838,-73.8029701879052,-73.80294573123,-73.8019662963145,-73.8016274197228,-73.7995644190667,-73.7992307740578,-73.799060218574,-73.7988455133661,-73.7983165607971,-73.7975919035937,-73.7989766379127,-73.7988665481387,-73.7988198157662],"lat":[40.625327944831,40.6253258522646,40.6253465756092,40.6253532081219,40.6253598406334,40.6253731044771,40.6253741852824,40.6253741233326,40.6253718253519,40.6253672903296,40.625363882239,40.6253616310551,40.625358283741,40.6253526700915,40.6253470407868,40.6253436783227,40.6253403321828,40.6253358286379,40.6253324205502,40.6253301378868,40.6253274791306,40.6253229592603,40.6253169560441,40.6253124373451,40.6253097807677,40.6253074974355,40.6253046520596,40.6252529649813,40.6252404880124,40.6252030589558,40.6251905808143,40.6251749811097,40.6251580679318,40.6251502917192,40.6251429809407,40.6251219405669,40.6250964060118,40.625091833032,40.6250836622786,40.6250784602813,40.6250466983734,40.6250252335597,40.6250042493598,40.6249887359749,40.6249702405691,40.6249442325499,40.6249257668366,40.6249110733589,40.6248562591201,40.6248460034066,40.6248240964873,40.6248135115295,40.6248044956226,40.6247964578749,40.6247660012408,40.6247539733434,40.6247504833635,40.6247379611042,40.6247213958489,40.6247100755837,40.624644104518,40.6245792402174,40.624512319111,40.6244531544549,40.6244262561677,40.6243804034134,40.624371488807,40.6243544903996,40.6243549048122,40.6243594561464,40.624387245486,40.6243928455719,40.6244365891569,40.6244419727757,40.6244572446805,40.6244617792135,40.624465187314,40.6244674699874,40.6244697533335,40.6246994317097,40.624736615636,40.6247580074306,40.6247771462005,40.6247889666848,40.6248022921404,40.6248147289853,40.624835251137,40.6248412682459,40.6248651777268,40.6248653420421,40.6248799910413,40.6249014512262,40.6249117793472,40.6249216953451,40.624934347435,40.6249416666438,40.6249539451268,40.6249776982142,40.6250321094329,40.6250593141978,40.6250646335382,40.6250664405138,40.6250777581476,40.6250764933254,40.6250722271499,40.6250701687096,40.625032658744,40.6250277503932,40.6249852144917,40.6249825975379,40.6249814344308,40.6249784785343,40.6249538705838,40.6249511890727,40.62494737032,40.6249448762928,40.6249436546217,40.6249416859812,40.6249379519688,40.6248939008902,40.6248912775016,40.6248042814927,40.6248010529412,40.6247465896108,40.6247401555687,40.6245889754488,40.6244493335279,40.6244437923201,40.6242985904774,40.6242939218727,40.6242759375134,40.6242737172628,40.6242574293909,40.6242437331546,40.6242048656738,40.6241759926651,40.6241475404968,40.6241083417001,40.6240079667618,40.6239350985786,40.623968430889,40.6240013385889,40.6240410388704,40.624094646648,40.6241517532554,40.6241955678422,40.6242156507624,40.6242185556219,40.6242189530376,40.6241934643686,40.6240847129886,40.6240311777198,40.6239516451345,40.6238638057088,40.6237448457906,40.6236648228652,40.6236038478772,40.6235353088248,40.6234349544876,40.6233032286062,40.6231777279195,40.6230568279278,40.6229230064046,40.6210540101885,40.6207395812584,40.6207340506274,40.6206749060286,40.6206336974863,40.6206149894828,40.6206012965325,40.6205836486791,40.6205687982296,40.6205288417605,40.620501307095,40.6204898043137,40.6204828550911,40.6204748194622,40.6204149665236,40.6203973412198,40.6203459727594,40.6203138134199,40.6202902114134,40.6202683320662,40.6202383504614,40.6202110578873,40.6201868013548,40.6201531730989,40.6200959256158,40.6200577424873,40.6199939097348,40.6199553322757,40.6199348498944,40.6199268293564,40.6199047265907,40.6198663567504,40.6198640917111,40.6198559230202,40.6198491953743,40.6198305750386,40.6197322069299,40.6197221900234,40.6196500333379,40.619647622657,40.6196268498078,40.6195971444351,40.6195877332611,40.619583358455,40.6195554111709,40.6195059197222,40.6194736288348,40.6194850776527,40.6195701738741,40.6196987813657,40.6198339474555,40.6198886542301,40.619915400026,40.6199583442654,40.6199617516191,40.6199671794407,40.6199731563264,40.6199785759342,40.6200016675928,40.6200419690524,40.620056714085,40.6201028821449,40.6201083675144,40.620114374529,40.6201744746414,40.6201981695606,40.6202134492379,40.6202642616143,40.620280834506,40.62034472072,40.6203624222069,40.6203689298926,40.6203813041985,40.6204060648978,40.6204133155827,40.620428638561,40.6204360158832,40.6205698330984,40.6206662062631,40.6206869690087,40.6206911498258,40.6207437093137,40.6208312368076,40.620852945228,40.6208438937966,40.6207909137965,40.6207891638219,40.620774646171,40.6207610390627,40.6207416440566,40.6207159522768,40.620711230367,40.620667664005,40.6206551822437,40.6206254350348,40.6205977689257,40.6203920196406,40.6203849035881,40.6202940722961,40.6202714440912,40.6202117363592,40.6201958706971,40.6201590816974,40.6201554614249,40.6201436594493,40.6201350521014,40.6201248800582,40.6201087609899,40.6200802777868,40.620073520369,40.6200308347074,40.6200022362182,40.6199889207088,40.6199491014276,40.6199432625339,40.6198959668042,40.6197986342468,40.6197207683289,40.6196160232408,40.6196108846819,40.6195613165364,40.6195543201557,40.6195492436566,40.6195438243217,40.6193933910928,40.6193849700902,40.619340409664,40.6193385847524,40.6192281733192,40.6192035141342,40.619191786699,40.6191896202349,40.619109218363,40.6190910814068,40.6190536106541,40.6190116949245,40.6189829685682,40.6189349168012,40.6188067425056,40.6187379597182,40.6186865067852,40.6186114803648,40.6185428737644,40.6185010867078,40.6184687343187,40.6184548273654,40.618409384538,40.6183637073159,40.6183160979052,40.6182627170243,40.6182150304891,40.6181320149812,40.6180984169695,40.6180536163338,40.6180336070781,40.6180260156934,40.6180044086635,40.6179912551112,40.6179532014909,40.6179389476896,40.6179321929499,40.6179265624646,40.6177306633064,40.6177239080625,40.6176689707892,40.617662724187,40.6176028468782,40.6175955521732,40.6175690156331,40.6174762038161,40.6174658193842,40.6173868382043,40.6173355706663,40.617219311327,40.6172106256088,40.616915277632,40.6168862690972,40.6168804033635,40.6167752641699,40.6167693600891,40.6167564198993,40.6167507121083,40.6167315849359,40.616718343137,40.6167046598046,40.6167040284686,40.6166528997007,40.6166262842469,40.616609479904,40.6165868108192,40.6164284637355,40.616411498771,40.6163852647647,40.6163454617619,40.616315036887,40.6162616812353,40.6162218016508,40.6161820516406,40.6161389811579,40.6159132803466,40.6158181396449,40.6157463683382,40.6156862166278,40.6144009639249,40.6160205656298,40.6163122563968,40.6165688977942,40.6169682648099,40.6169840372666,40.6175534157655,40.6175565091391,40.6175610126906,40.6175644055606,40.6175666880767,40.6175689695898,40.6175723780377,40.6175769119116,40.6175814462894,40.6175859799983,40.6175893879415,40.6176210804227,40.6176213883499,40.6176232535005,40.6176263919291,40.6176337042031,40.6176403594565,40.6176479465284,40.6176496529281,40.6176498087066,40.6176651365772,40.6176779092171,40.6176935560636,40.6177095682218,40.6177233344173,40.6177406016257,40.6177504113292,40.6177588510177,40.6177661828198,40.6177726025508,40.6177795888949,40.6177885659962,40.6177987522556,40.6178130764833,40.6178325163372,40.6178366525139,40.6178423365418,40.6178490000718,40.6178524010194,40.6178554297297,40.6178606643628,40.6178658725955,40.617869034023,40.617872783944,40.6178805960041,40.6178809972067,40.6179206416492,40.6179274382694,40.6179614166732,40.6179668741979,40.6179865868258,40.6179982508552,40.6180876642648,40.6180985204233,40.6181252661878,40.6181431729414,40.618157095213,40.6181880687312,40.6182013436705,40.6182332747781,40.6182366832174,40.6182452499506,40.6182460503701,40.6182520967663,40.6182544860226,40.6182608218454,40.6182680415706,40.6182689337679,40.6182806019145,40.6182942135982,40.6182959471828,40.6183018297199,40.6183919351733,40.6184205368124,40.6185875946118,40.6185976432816,40.6186214499777,40.6186253943024,40.6186396645753,40.6186486979722,40.6186613276501,40.618666437498,40.6186842911302,40.6186911803865,40.6187055961872,40.6187044128273,40.6187067852081,40.618708675956,40.6187137584517,40.6187226355577,40.6187305669196,40.6187347276491,40.6187426460767,40.6187430032924,40.6187435047485,40.618771075778,40.6187814735431,40.6187839966248,40.6187932315019,40.6188162931282,40.6188865196444,40.6189146870096,40.6189315307303,40.6189575022859,40.6189714986098,40.618981601558,40.6189918559581,40.6190178612499,40.6190247962054,40.6190588325794,40.6190814561399,40.6191040802019,40.6191086150572,40.61911202298,40.6191143129262,40.6191155070701,40.6191155916915,40.6191156600704,40.619116831869,40.6191191143624,40.6191213970229,40.6191231206055,40.6191236790136,40.6191259605001,40.6191282429955,40.619130524987,40.6191328227126,40.619135136676,40.6191374344012,40.6191397163897,40.6191419983819,40.6191442815456,40.6191465780976,40.6191717949512,40.6191925881406,40.6192012152819,40.6192103490014,40.6192320415386,40.6192385035636,40.6192590403413,40.6192694241885,40.6192875912075,40.6192997402786,40.6193072905252,40.6193237422803,40.6193444289246,40.619358219127,40.6193811722219,40.6193978717045,40.6194092036186,40.619428534127,40.6194501658191,40.6194592724415,40.6194732419799,40.6194945291291,40.619497569552,40.6194977736012,40.61950216984,40.6195079450111,40.6195126754273,40.6195201269862,40.6195368122131,40.6195536539739,40.6195658197472,40.6195753998704,40.6195832122232,40.6195917885096,40.6196000343492,40.6196045344576,40.6196064052477,40.6196080858626,40.6196191127675,40.6196342067792,40.619648597789,40.6196709253077,40.619677122476,40.6196881665666,40.6197013122346,40.619715425335,40.6197222407378,40.6197318880239,40.6197929154887,40.6198300616252,40.6198656633672,40.6198917596018,40.6211130716888,40.6213737945839,40.6213800112908,40.6214117175494,40.6214348515542,40.6214440286462,40.6214466652042,40.6214772011449,40.6214835016651,40.6214873795123,40.6215110996505,40.6215484201085,40.6215507020784,40.6215529852194,40.6215552671903,40.6215575491585,40.621559832303,40.6215621137707,40.621591263483,40.6215946114969,40.6215991150514,40.6216025229512,40.6216048049195,40.6216070873929,40.6216093700333,40.6216116520029,40.6216139339709,40.6216162171141,40.6216184985794,40.6216219069812,40.6216264413143,40.6216284984645,40.6216313305104,40.6216414493207,40.6216464807438,40.6216514298395,40.6216595641526,40.6216619970108,40.6216670783297,40.6216721584766,40.6216750065094,40.6216772571969,40.6216806040391,40.6216851080924,40.6216885159923,40.6216907984636,40.6216942063622,40.6216987401922,40.6217018613875,40.6217039408034,40.6217074260864,40.621709979834,40.6217157309685,40.6217251529175,40.6217258531701,40.6217303858249,40.6217337947282,40.6217360459173,40.6217382669987,40.6217404879098,40.6217427094937,40.6217449315801,40.6217471519907,40.6217493735754,40.6217515944866,40.6217549570537,40.6217594606044,40.6217628219999,40.6217650435832,40.6217672656665,40.6217700481213,40.621775099833,40.6217812913605,40.6217874845607,40.6217930988207,40.6217975715901,40.6218020396807,40.6218042293083,40.6218041485151,40.621805213388,40.6218074286089,40.6218085090368,40.621808447475,40.6218095280726,40.6218117339276,40.6218139247268,40.6218161148555,40.6218183056541,40.6218216529992,40.6218249998391,40.6218249382742,40.6218226412474,40.6218226109688,40.6218248325474,40.6218259124726,40.6218258358519,40.6218259361688,40.6223395565286,40.623171620843,40.6233305974222,40.6233803389465,40.6237918619331,40.6237538015464,40.6237935810327,40.6238078527535,40.6238079262805,40.623810254842,40.6238147729635,40.6238192461982,40.6238244314038,40.6238309376225,40.6238451712098,40.6238586049912,40.6238571729064,40.6238574462442,40.623857931263,40.6238551889102,40.6238525543183,40.6238484767528,40.6238464235494,40.6238349255846,40.6238290288708,40.6238278497612,40.6238306077961,40.6238321192641,40.6238341453868,40.6238363366114,40.6238429389226,40.6238539793113,40.623858436938,40.6238636113781,40.6238700811563,40.623925218022,40.6239474157667,40.6239706501595,40.6239874772907,40.6239957675782,40.6240007418822,40.6240137343983,40.6240230145712,40.6240252276559,40.6240262856585,40.624026200985,40.6240261320533,40.624024960226,40.6240226704298,40.6240214760716,40.6240202818828,40.6240179756662,40.6240156628322,40.6240133650749,40.6240110830618,40.6240087853062,40.6240075838281,40.6240075076065,40.6240063351079,40.6240048316756,40.6240381516388,40.6240269007012,40.6240344955597,40.6240366658296,40.6240465297606,40.6240542704608,40.6240603616972,40.624062384236,40.6240647162057,40.6240647332736,40.6240667283339,40.6240733957837,40.6240867323575,40.6240917986195,40.6240979918157,40.6241041821624,40.6241092494337,40.624146418163,40.6241714518628,40.6242332129914,40.6242587740594,40.6242860635404,40.6243184997074,40.6243684526606,40.6243689017885,40.6243725641435,40.6243778909509,40.6243810179192,40.6243821529641,40.6243828873979,40.6243827635419,40.6243953197436,40.6243977108651,40.6244126385931,40.6244166203907,40.624432860287,40.6245378442051,40.6245391732729,40.6245477658349,40.624553278141,40.6245643017431,40.6245876233909,40.624589844237,40.6245968573813,40.6246047365801,40.6246108843419,40.6246150336352,40.6246309348049,40.6246469712604,40.62466927943,40.6246709179437,40.6246759694523,40.6246810036931,40.6246837580813,40.6246859638334,40.6246881848474,40.6246903983968,40.6246914558418,40.6246925127861,40.6246947258312,40.6246969466734,40.6246991681859,40.624701390202,40.6247036105428,40.6247058320536,40.6247080378077,40.6247102272974,40.6247124184671,40.6247146084588,40.6247168142121,40.6247190352221,40.6247212487716,40.6247223057088,40.6247233631511,40.6247255761926,40.6247255453446,40.624723263809,40.6247202290873,40.6247145856936,40.6247070789427,40.6247014348763,40.6246972765691,40.6246927426748,40.6246893347079,40.6246889265542,40.6246893111292,40.6246927068999,40.6247013228564,40.6247046833625,40.6247060496067,40.6247075126121,40.6247076839221,40.6247081587616,40.6247080481447,40.6247083888316,40.6247101021578,40.6247131148653,40.6247194295127,40.624721912311,40.6247229886745,40.6247229192664,40.6247211318883,40.6247201818714,40.6247212428315,40.6247181313023,40.6247173881212,40.6247147330268,40.6247096747347,40.6247066030949,40.6246985143394,40.6246784370904,40.6246777715552,40.6246758559461,40.6246764563023,40.6246776711662,40.6246818070802,40.6246972780843,40.6246972326296,40.6246970642901,40.6246992880029,40.6247022564661,40.6247036044147,40.624705022257,40.6247051726857,40.6247042860878,40.6247035538763,40.6247040903765,40.6247075462891,40.624714263621,40.6247171407325,40.6247186927075,40.6247182607138,40.6247158996038,40.6247099529168,40.6247180043329,40.625227814323,40.6255961902316,40.626120235048,40.6263173469786,40.6265805259218,40.6265363687405,40.626181851214,40.6261014226995,40.6253375624135,40.6253311583878,40.625327944831]}],[{"lng":[-73.785363207581,-73.7849799610084,-73.784878887409,-73.7813619589162,-73.7841948329788,-73.7842632690792,-73.7843383029745,-73.7844193633205,-73.7845058328913,-73.7845970532773,-73.7846923298988,-73.7847728622127,-73.7848486090085,-73.7849190031256,-73.7853149276639,-73.78584280107,-73.7864483193084,-73.7867560813542,-73.7869014098451,-73.7867499475051,-73.7864647586121,-73.7864464450241,-73.7860828694664,-73.7860741943184,-73.7860658698523,-73.785894423243,-73.7857517207639,-73.785559997454,-73.7854746395223,-73.7857173544918,-73.7858524578362,-73.786140785236,-73.7865153354535,-73.7871680339463,-73.7876766269252,-73.7880219876485,-73.7882619467143,-73.7884826135045,-73.7886553151572,-73.7887994848893,-73.7892604064447,-73.7897979615201,-73.7899707321737,-73.790200776761,-73.7903546445938,-73.7904321742188,-73.7904909642324,-73.7906737085925,-73.7907428393901,-73.7907442823333,-73.7906309241883,-73.7912629805581,-73.79163665158,-73.7920489018327,-73.7924996611883,-73.7927974263321,-73.7929803167553,-73.7930483602257,-73.7928294998398,-73.792417449561,-73.7927494862633,-73.792920727321,-73.7929260604449,-73.7929336167664,-73.7929965663598,-73.7930574754366,-73.7931140851038,-73.7932116183028,-73.7932724972324,-73.7932854153553,-73.7932948291804,-73.7933075422929,-73.7934005185141,-73.7935193811179,-73.7935579122277,-73.7936510409549,-73.7937279348292,-73.7937278062446,-73.7937758068837,-73.7938143292343,-73.7938527911191,-73.7939489361698,-73.7939423901411,-73.7938813226546,-73.7938799776454,-73.7938394441154,-73.7938456491542,-73.7938968839496,-73.7939771424012,-73.7940635912879,-73.7941544822746,-73.7941855761566,-73.7942466746913,-73.7943365175403,-73.7944327005328,-73.794541665147,-73.7945447865624,-73.7944670069628,-73.7944611650664,-73.7944674687868,-73.7945251063292,-73.7945217821378,-73.7945536921461,-73.7946760057186,-73.794678680564,-73.7947587210392,-73.7948099509313,-73.7947832517034,-73.7947616920489,-73.7947615716317,-73.794806338752,-73.7948737276432,-73.7949475245913,-73.7950565509741,-73.7950855014361,-73.7951400671816,-73.7952396526014,-73.7952973602529,-73.7953744143885,-73.7955574786516,-73.7956602693908,-73.7957917895717,-73.7960323297315,-73.7962442225572,-73.7963789333768,-73.7965520935236,-73.7967991943689,-73.796895560959,-73.7969244192897,-73.7969178822804,-73.79691732271,-73.796914528677,-73.796965819257,-73.7970107765337,-73.797119991983,-73.7971624469129,-73.7972227823352,-73.79731593658,-73.7973673172267,-73.7973704548094,-73.7973638566323,-73.7973573982985,-73.7974567619571,-73.797527504764,-73.7977106464951,-73.7979418447844,-73.798083159448,-73.7982470203558,-73.7983634556353,-73.7983786924035,-73.7983906171319,-73.7985070549989,-73.7984844212728,-73.7984874499731,-73.7985258411968,-73.7986413933354,-73.7987635384671,-73.7988695794995,-73.7989852939449,-73.799039827924,-73.7991294687579,-73.799125969565,-73.7991255423271,-73.7991123901811,-73.7991731805965,-73.7993209441868,-73.7993788393439,-73.7993823595355,-73.7993918417739,-73.7994497292638,-73.7996105031141,-73.799706856492,-73.7997262371791,-73.7997808699546,-73.7998838165807,-73.7998839413328,-73.8000159585107,-73.8000770350037,-73.8001734011713,-73.8002570007024,-73.8003050235409,-73.8003434961505,-73.8003981046409,-73.800436695706,-73.8004947240393,-73.8005266899619,-73.8005395167722,-73.8005714929456,-73.8005714472353,-73.800571383249,-73.8005616295976,-73.8006033005496,-73.8006546021935,-73.8006994711898,-73.8007411201218,-73.8008012591963,-73.800737754748,-73.8007119835992,-73.8006797737325,-73.8006219231277,-73.8005608836139,-73.8004774226873,-73.8004195001909,-73.800351970019,-73.8002394891915,-73.8001994472001,-73.8001943345343,-73.8002134613916,-73.8001908002015,-73.8000713448239,-73.8000712568441,-73.8000583048417,-73.8000454334216,-73.7999906707152,-73.8000162583542,-73.8000605820703,-73.8000707436309,-73.8000899291909,-73.8000897899015,-73.8000767792092,-73.800068488315,-73.8000573663307,-73.8000155029863,-73.8000121376653,-73.8000087203396,-73.7999924386555,-73.7999343527161,-73.799870039477,-73.7997800736902,-73.7997222005773,-73.7996867102728,-73.799603190612,-73.799542126579,-73.799479021908,-73.7994681113871,-73.7993748959442,-73.7993169407748,-73.7993038784767,-73.7993517832537,-73.7993920014626,-73.7994223226329,-73.799471574033,-73.7995379448826,-73.7995925248692,-73.7996502507532,-73.7996595570501,-73.799685101531,-73.7996367993324,-73.7995990326458,-73.7995176703321,-73.7994751083205,-73.799506989338,-73.7994779974583,-73.7994425953046,-73.7995067834673,-73.7995131121903,-73.7995102137435,-73.7995065334814,-73.7995026610984,-73.7994614868959,-73.7994581712256,-73.7994768899999,-73.7994996087411,-73.7994576270069,-73.7994403285964,-73.7993674150581,-73.799376838763,-73.7993915994728,-73.7994022436694,-73.7992958159236,-73.7992852448007,-73.7991703110054,-73.799121895715,-73.7990959459049,-73.7990636461913,-73.7990462009094,-73.7990299158934,-73.7990152254082,-73.7990025211972,-73.7990020509173,-73.7990062323278,-73.7990149819702,-73.7990259291251,-73.7990399167358,-73.7990567414784,-73.7990549295291,-73.7990489771707,-73.7990390350686,-73.7990253548791,-73.7990082828797,-73.7989718744833,-73.7989388123595,-73.7989100123454,-73.7989024492685,-73.7988821565946,-73.7988615312915,-73.7988411335632,-73.7988215174324,-73.7988032156936,-73.7987867254413,-73.7987724945687,-73.798760909602,-73.7987522852032,-73.7987468556221,-73.7987447683342,-73.7987596034448,-73.7987733773527,-73.7987246333844,-73.7986799465238,-73.7986405493917,-73.7986075287031,-73.7985817952926,-73.7985640589902,-73.7985546896173,-73.7985446566274,-73.7985342139979,-73.7985236260775,-73.7985131608913,-73.7985030833588,-73.7984936485851,-73.7984850954053,-73.7984776403369,-73.7984714720989,-73.7984667468357,-73.7984635464294,-73.7984620426427,-73.7984622747704,-73.7984642367459,-73.7984678773013,-73.7984411026855,-73.7984092142302,-73.7983729306479,-73.7983330697082,-73.7982905298045,-73.7982462697079,-73.7982074088251,-73.7981686623893,-73.7981630061175,-73.7981294853532,-73.7981023185961,-73.7980829110916,-73.7980702377123,-73.7980645605952,-73.7980659971733,-73.7980837150869,-73.7981019597317,-73.7981202325046,-73.7981380340335,-73.7981548778247,-73.7981703035578,-73.7981838896666,-73.7981952648578,-73.7982041182605,-73.7982102079204,-73.7982133674123,-73.7982135103895,-73.7982109934522,-73.7981997721981,-73.7981800633439,-73.7981522475437,-73.7981168620377,-73.7980745902768,-73.7980772606589,-73.7980779220855,-73.7980765578981,-73.7980732024523,-73.7980679402536,-73.7980609038284,-73.7980522703868,-73.7980422573597,-73.797996005607,-73.7978958598792,-73.7977991154676,-73.7977062365273,-73.79761766867,-73.7975500607796,-73.7974865779025,-73.7974228477564,-73.7973861607783,-73.7973522035017,-73.7973219532894,-73.7972962808087,-73.7972759249726,-73.7972614716719,-73.7972533369118,-73.7972517548365,-73.797256770991,-73.7972682410066,-73.7972858347583,-73.7973034490624,-73.7973214090535,-73.7973392809023,-73.7973566329083,-73.7973730459283,-73.7973881234997,-73.7974015014187,-73.7974128565358,-73.7974219145633,-73.7974287328036,-73.7974325761392,-73.7974333415385,-73.7974216409284,-73.7974030478434,-73.7973782829107,-73.7973884678413,-73.7973974440677,-73.797405005675,-73.7974109791993,-73.7974156789969,-73.7974179973926,-73.797417865287,-73.7974152866165,-73.7974103382352,-73.7974031676248,-73.7973939884989,-73.7973830744344,-73.7973743778026,-73.7973650912734,-73.7973025665809,-73.7972348170957,-73.7971622569712,-73.79714541725,-73.7971331735342,-73.7971619489449,-73.797195040226,-73.7972323081246,-73.7972385924013,-73.797243335581,-73.797246858221,-73.7972479822611,-73.7972466788611,-73.7972429814604,-73.7972369849204,-73.7972288430903,-73.797220824485,-73.7972087620982,-73.7971953419212,-73.7971809300662,-73.7971659196997,-73.7971507203152,-73.7971357465626,-73.7971115205478,-73.7970829894867,-73.7970507658212,-73.7970155412593,-73.7969780719281,-73.7969518296935,-73.7969250570034,-73.7968984887845,-73.7968728543502,-73.7968488573807,-73.7968271566057,-73.7968152892506,-73.796804886242,-73.7967962433993,-73.7967896064901,-73.7967851642427,-73.7967830429772,-73.7967833030151,-73.7967859369631,-73.7967908699233,-73.7967979616229,-73.7968071180709,-73.7968153609292,-73.7968224659631,-73.7968282398905,-73.7968325256403,-73.796835206624,-73.7968362099093,-73.7968355082026,-73.7968331205922,-73.7968113042191,-73.7967964533369,-73.796789005692,-73.7967891808194,-73.7967943202308,-73.7968036640707,-73.7968150682218,-73.796835512781,-73.7968553018503,-73.796879317585,-73.7969009816489,-73.7969250248242,-73.7969763966506,-73.7969891279853,-73.7970049966818,-73.7970048477886,-73.7969727004397,-73.796898811059,-73.7968570552419,-73.7968217469163,-73.7967889295846,-73.7967607374129,-73.7967093220995,-73.7966546491373,-73.7966095900419,-73.7965581525134,-73.7965131693017,-73.7965002358277,-73.7964552451265,-73.7964103073449,-73.7963556790424,-73.7963362531319,-73.7963295678748,-73.7963519209302,-73.7963421563258,-73.7962938552165,-73.7963130043824,-73.7962872133894,-73.7962325623863,-73.7962260323648,-73.7962837319506,-73.7962836273539,-73.7962191517374,-73.796200077669,-73.7961878406154,-73.796182668224,-73.7961846567244,-73.7961937691392,-73.7962098359701,-73.7962325583496,-73.7962503880361,-73.7962919725533,-73.7962339362778,-73.7961534037414,-73.7961243484337,-73.7961531271284,-73.7961883089091,-73.7961592093666,-73.7960271851914,-73.7959703456468,-73.7959693271902,-73.7959242981344,-73.7959305290349,-73.7955953430841,-73.7955595766074,-73.7955768073314,-73.7955241564327,-73.7954750789817,-73.7954959990951,-73.7955148071642,-73.7955328199416,-73.7955468406825,-73.7955457564101,-73.7955435485394,-73.7955402726017,-73.7955316735389,-73.7955212896427,-73.7955093869275,-73.7954962703178,-73.7954501690334,-73.7954045014509,-73.7953603959942,-73.795318942489,-73.795281165234,-73.7952479976923,-73.7952202594253,-73.7952037246208,-73.7951598925857,-73.7951206161494,-73.7950866674996,-73.7950587140814,-73.795037305475,-73.7950228625906,-73.7950156693915,-73.7950152182058,-73.795019424652,-73.795041213477,-73.7950691725628,-73.7951026724656,-73.7951409589967,-73.7951831702013,-73.7952018935665,-73.7952168000418,-73.7952275494936,-73.7952338966411,-73.7951680194709,-73.7950974175047,-73.7950229389193,-73.7949454784681,-73.7948946713092,-73.7948813347087,-73.7948657680025,-73.7948483673651,-73.7948295756453,-73.7948098710948,-73.7947897551986,-73.7947697399094,-73.7947503346203,-73.7947320331988,-73.7947153014194,-73.7947005651076,-73.7946973381314,-73.7946913345487,-73.7946827246322,-73.7946717525748,-73.7946587295622,-73.7946440249486,-73.7946280557809,-73.7946112749699,-73.7945941584458,-73.7945729161008,-73.794553901725,-73.7945355209769,-73.794518195792,-73.7945023238741,-73.7944882695681,-73.7944763554948,-73.7944668551467,-73.7944605430756,-73.7944496992821,-73.7944362661674,-73.7944446771231,-73.794458961007,-73.7944787248361,-73.7945034248573,-73.7945323815073,-73.7945647981083,-73.794599782788,-73.7946243378347,-73.7946467227992,-73.794666286345,-73.7946824592295,-73.794694770867,-73.7947028630221,-73.7947065002332,-73.7947062719799,-73.7947025845429,-73.7946952145054,-73.7946953719163,-73.7946872070622,-73.7946708446447,-73.794646534587,-73.7946146482169,-73.7945756725959,-73.79453020308,-73.7944789342251,-73.794422649179,-73.7943622077163,-73.7942289526855,-73.794093975279,-73.7939577745772,-73.7938208541836,-73.7936837203645,-73.7935468801746,-73.7934108395829,-73.7928947407442,-73.7926070334482,-73.7922656807014,-73.7918812355272,-73.7916219707411,-73.791428026323,-73.7907581879362,-73.7906127572341,-73.7905017674769,-73.790335055409,-73.790212419652,-73.7901074357171,-73.7900850050578,-73.7899240008694,-73.7898513194859,-73.7897260245712,-73.7895581435555,-73.7894000604213,-73.7892410490038,-73.7891627044642,-73.7890216243097,-73.7889742857903,-73.7888237975357,-73.7884302820751,-73.7882285621159,-73.7859405825424,-73.785363207581],"lat":[40.6267066568383,40.6265449862134,40.626631470708,40.6248427461149,40.6208926699104,40.6208327232292,40.6207775508047,40.6207275727345,40.620683169564,40.6206446793896,40.6206123952836,40.6205728728768,40.620528193475,40.6204786916246,40.6206060416205,40.6204608892352,40.6200236047402,40.6197392092106,40.6192718405877,40.6186577855906,40.6178827294198,40.617612342422,40.6173632334751,40.6170782504161,40.6166836654385,40.6163253105314,40.6159743167282,40.6159593448057,40.6156669114498,40.6147320878222,40.6144619860241,40.6142506245977,40.6140613421616,40.6138433471735,40.6137127645967,40.6136549469795,40.6135750143371,40.6135315795014,40.6134953628571,40.6133860250833,40.6131676656969,40.6129713651808,40.6129132266386,40.6129355672985,40.6127897109659,40.6125268058819,40.6121250356309,40.6119426970137,40.6112998206803,40.6108394914684,40.6102985780806,40.6105335469828,40.6106145998981,40.6106226537735,40.6105796272856,40.6104048001658,40.6101713103913,40.6098718525961,40.6093380581437,40.608703007815,40.6086463663756,40.6086751632376,40.6086760605845,40.6086815840743,40.6087275955094,40.60876687408,40.6087714714751,40.6087793917097,40.6088284618733,40.6088568071342,40.6088774621856,40.6089215489804,40.6089780214493,40.6089733393267,40.6089783042522,40.6089858154717,40.6090496021197,40.6090912180471,40.6091500560877,40.6091574691865,40.6091844663565,40.6092556320388,40.6092947880179,40.6093069192295,40.6093081744611,40.6093460125063,40.6094170157455,40.6094685167183,40.6094833485812,40.6095740803058,40.6095924833882,40.6095987785364,40.6095768559606,40.6096088411472,40.6096677651118,40.6097487449797,40.6097781265106,40.6098098661272,40.6098122496764,40.6098514293303,40.609910285456,40.609946999452,40.610015601327,40.6101068540381,40.6101088487307,40.6101946729311,40.6102486212541,40.6102621170021,40.6102730148281,40.6103121829926,40.6103783599787,40.6104005122237,40.6104275714058,40.6104889661943,40.61048901781,40.6104891150753,40.6104868452531,40.6105236679764,40.6105360453802,40.6105461635652,40.6105463463493,40.6106053324849,40.6107281607596,40.6107652565077,40.6108315922813,40.6109298196763,40.6110085928584,40.6110087631795,40.6110259510864,40.6110626589664,40.6110704268188,40.6111091659043,40.6111435291774,40.6111485042926,40.6111486971155,40.6111487720429,40.6111488785,40.6111490428011,40.6111540289357,40.6111785153703,40.6112131447972,40.6112470371732,40.6113182043963,40.6112938493014,40.6112794826154,40.6113068174434,40.6113144109321,40.6113024584647,40.6113113215346,40.6113124812637,40.611316368591,40.611354322496,40.6114032429464,40.6114644490875,40.6115159242869,40.6115455038856,40.6115187896244,40.6115067345241,40.6114824572167,40.6115070323024,40.6116075581896,40.6117030250592,40.6118450089806,40.6119453551913,40.6120262464293,40.612026504502,40.612002125168,40.6119882129715,40.611950738792,40.6119288078507,40.6118752314094,40.6118802955618,40.6118687907458,40.6118363605969,40.6117851308024,40.6117435148795,40.6116384804078,40.6116238986845,40.6116240662551,40.6115972828882,40.6116512231716,40.6116757697324,40.6116758645741,40.6116612436111,40.6116431814795,40.6116442640803,40.6116516303245,40.6117006459329,40.6117159469816,40.6117373656687,40.6117765176159,40.611805965852,40.6118378792173,40.6118722296805,40.611909021813,40.6119339039791,40.6119604238741,40.6119848595922,40.6120141796827,40.6120238717785,40.6120262141596,40.6120064846307,40.6120406567291,40.6120650198518,40.6120819601693,40.6121361613781,40.6121430825109,40.6121920758801,40.6122507890396,40.6124513190348,40.6124806953234,40.6125149449468,40.6125261038017,40.6125735798283,40.6126103447749,40.612644276885,40.6126520556926,40.6126814649996,40.612727977609,40.6127818113137,40.6128016626921,40.6128282898961,40.6128624897227,40.6129138917587,40.6129824306168,40.6130558428011,40.6131438700305,40.6131657906972,40.6131729780091,40.6131900134304,40.613241360148,40.6132412145707,40.6132508998514,40.613288359582,40.6132948358289,40.6133142573519,40.613358220089,40.6134291898563,40.6135222986828,40.613547492586,40.6135664856972,40.6135696995689,40.6135740313792,40.6135839183065,40.6136158433132,40.613726020465,40.6137774740431,40.6138165575487,40.6138452072465,40.6139069265845,40.6141736865428,40.6142545266434,40.6142814047375,40.6143033749251,40.6143230710796,40.6143549069956,40.6143775564295,40.6144063034051,40.6144084008193,40.6144307045472,40.6144649720811,40.6145136617886,40.6145727563453,40.6146461241159,40.614662993624,40.6147340956659,40.6148051041742,40.6148620197119,40.614903069235,40.6150424203089,40.6150485880389,40.6151156421085,40.6151914462843,40.6152746331858,40.6153333297646,40.615337673281,40.6153441225448,40.6153525055768,40.615362598831,40.6153877264695,40.6154126538314,40.6154368833503,40.6154566395184,40.6154752481398,40.6154924387166,40.6155124434482,40.6155319760103,40.6155505419854,40.6155676714223,40.6155829307318,40.6155698729977,40.6155523944439,40.6155309792369,40.6155239931009,40.6155211711933,40.6155209274844,40.6155232685935,40.6155281309335,40.6155353824384,40.61554482615,40.6155562055673,40.6155692116133,40.6155834910302,40.6155986559735,40.6156142945467,40.6156658091465,40.6157147126174,40.6157302972448,40.6157518147499,40.6157786716065,40.61581012701,40.6158453133113,40.6158832599487,40.6158870182721,40.6158895966468,40.6158909298032,40.6158909839932,40.6158897578452,40.6158872823982,40.6158836203164,40.6158788643029,40.6158731347528,40.6158665767055,40.6158593561735,40.61585152959,40.6158434123161,40.6158352164613,40.6158271561888,40.6158194421186,40.6157918751293,40.6157676732519,40.6157473819528,40.6157314585607,40.6157202619592,40.615714044499,40.6157127929233,40.6157153860376,40.6157160902836,40.615746335047,40.6157800792529,40.6158147877386,40.6158512587211,40.6158887378644,40.6159264499792,40.6159228937534,40.6159216105106,40.6159226353205,40.6159259401761,40.61593143476,40.6159389689119,40.6159483367328,40.6159592822116,40.6159715062216,40.6159846746953,40.6159984277537,40.616012389542,40.6160603661031,40.6161076134253,40.6161532189414,40.616196301794,40.6162360298485,40.6162716357655,40.6162811509419,40.6162908682173,40.6163005428652,40.6163099312317,40.6163187968735,40.6163269165113,40.6163340856539,40.6163401237483,40.616354100869,40.6163888992197,40.6164288968956,40.6164739020009,40.6165236986153,40.6165669237533,40.616571590944,40.6165697156696,40.6165796410232,40.6165941493661,40.6166128231185,40.6166351248108,40.6166604125533,40.6166879585107,40.6167169698503,40.6167466115619,40.6167760304904,40.6168043798919,40.6168308438046,40.6168280975166,40.616827464227,40.616828959233,40.6168325464224,40.6168381391454,40.6168456023078,40.6168547556345,40.6168653780239,40.6168772128882,40.6168906784664,40.6169048113891,40.6169192327881,40.6169673780153,40.6170174852917,40.6170660172321,40.6170715265539,40.6170781448119,40.6170857201833,40.6170940788893,40.6171043194325,40.6171150233448,40.6171258716047,40.6171365408885,40.6171467132061,40.6171560853793,40.6171643780775,40.6171713441427,40.6171753977242,40.6171786026489,40.6172314272305,40.6172803679849,40.6173251257287,40.617352562807,40.6173813796619,40.6174328141228,40.6174827186229,40.6175308831432,40.6175393132112,40.6175483095574,40.6175595416993,40.6175710583363,40.6175825639919,40.6175937634713,40.6176043694348,40.6176141097703,40.6176078276849,40.6176007802417,40.6175953419362,40.6175916611294,40.6175898382365,40.6175899229872,40.6175919130696,40.6176157201371,40.6176365742348,40.6176540277105,40.6176677059093,40.6176773152156,40.6176814256284,40.6176821778587,40.6176795512573,40.617673617926,40.6176645407382,40.6176525688681,40.6176584445439,40.6176657561905,40.617674295895,40.6176838208225,40.6176940601232,40.6177047226327,40.6177155051522,40.6177261010704,40.6177362090819,40.6177455417552,40.6177491996975,40.617753954777,40.6177596776391,40.617766212602,40.6177733818917,40.6177809904785,40.617788831382,40.617796691302,40.6178043564207,40.6178339547967,40.6178659605778,40.6178994303787,40.61793337766,40.6179585498028,40.6179830095206,40.6180388700336,40.6180932134682,40.6181303353699,40.6181659798228,40.6181927112054,40.6182182342201,40.6182281167114,40.6182673075411,40.6183309841249,40.6183799439581,40.6183872311667,40.6183871006438,40.6183845790924,40.6183747249408,40.618369399645,40.6183648246717,40.6183696299693,40.6183891174434,40.6184159658827,40.618428115557,40.618430483207,40.6184573889683,40.6184622055254,40.6184498857563,40.6184546845354,40.6185036113897,40.6185892795458,40.6186333830322,40.6186749830207,40.6187116173434,40.6187532673891,40.6187825981134,40.6187947409423,40.6188290020032,40.6188707203822,40.6189049923299,40.6189783195345,40.619015613356,40.6190545380436,40.6190943695169,40.6191343668258,40.619173785934,40.6192118935599,40.619247980817,40.6192696886962,40.6193285142357,40.6193969561439,40.6194678065736,40.6195142666992,40.6195583822855,40.6196098530292,40.6196710017149,40.6197711366594,40.6197806551556,40.6197808257357,40.6197978827105,40.6198615418216,40.6202110131047,40.6203504862911,40.62052658481,40.6206693974712,40.6207649021858,40.6207946064277,40.6208251197102,40.6208605014846,40.6208969173968,40.6209023986517,40.620907680359,40.6209126296747,40.6209216801306,40.620929569282,40.6209360950241,40.6209410901801,40.6209404295238,40.6209452818628,40.6209555272982,40.6209709126702,40.6209910578134,40.6210154649502,40.6210435309906,40.6211019931963,40.621124463809,40.6211513850595,40.6211822276712,40.6212163852718,40.6212531863154,40.6212919072833,40.6213317869102,40.6213637211182,40.6213954959269,40.6214281681669,40.6214579885326,40.6214842856686,40.6215064675385,40.6215240347538,40.6215422630332,40.6215624322522,40.621584082198,40.6216067188707,40.6216423695317,40.6216723124609,40.6216961879363,40.6217137091273,40.6217928965052,40.6218043954127,40.621814131992,40.6218218584455,40.6218273781337,40.6218305505798,40.6218312950442,40.6218295925802,40.6218254865158,40.6218190813511,40.6218105400988,40.621800080135,40.6217872647551,40.6217750437321,40.6217637636741,40.621753744502,40.6217452703755,40.6217385816344,40.6217338679819,40.6217312631048,40.6217308408815,40.6217305799435,40.6217326750305,40.6217369349023,40.6217432617724,40.621751510406,40.6217614914535,40.6217729757974,40.6217856998111,40.621825547415,40.6218795183375,40.6219331500798,40.6219607556232,40.6219869220363,40.6220109294082,40.6220321172284,40.6220499025598,40.6220637960768,40.6220734155287,40.6220815430557,40.6220927322595,40.6221066575678,40.6221229137958,40.6221410279355,40.622160472919,40.6221806829538,40.6221956340266,40.6222139837877,40.6222316776251,40.6222830761133,40.6223340968342,40.6223839604323,40.6224319052253,40.6224771988401,40.6225191493994,40.6225571160915,40.6225905189587,40.6226188477567,40.6226416697495,40.6226663505686,40.6226848146263,40.6226969936514,40.6227028426119,40.6227023398811,40.6226954873179,40.6226823102598,40.6225070556175,40.6224208673645,40.6223394277511,40.6223449356957,40.622306449479,40.6222776578454,40.6223283683243,40.6224535435625,40.6225284319805,40.6225963741058,40.6225969826666,40.6225874834513,40.6225884498496,40.6225953832988,40.6226078617277,40.6226553230033,40.6227919944187,40.6228745275353,40.6229462849279,40.6229997511309,40.6231156455189,40.6232525603521,40.6233926234205,40.623639389654,40.6237651285535,40.6258470051772,40.6267066568383]}],[{"lng":[-73.8142937322395,-73.8146688684082,-73.8153154921312,-73.8161736161592,-73.8164455189788,-73.8159697587256,-73.8152760546781,-73.8146741430527,-73.8142937322395],"lat":[40.6291424017459,40.6275025618228,40.6277585445179,40.628901435199,40.629836064928,40.6303787183565,40.6302281047302,40.6299852894046,40.6291424017459]}],[{"lng":[-73.8359764679521,-73.8359542973316,-73.8359529636213,-73.835921654089,-73.8359197081448,-73.8358936007712,-73.8358686252286,-73.8358673226963,-73.8358599527261,-73.8358501000523,-73.8358483479572,-73.8358392466916,-73.8358129219505,-73.8357923014171,-73.8357547099801,-73.8357307652751,-73.8356506824867,-73.835611442714,-73.8355107661637,-73.8354249791608,-73.8353617889139,-73.8353476095701,-73.8353149680485,-73.8352758786559,-73.8352386649524,-73.8351862382521,-73.83514902525,-73.8350947970617,-73.8350631402472,-73.8350482413307,-73.835050764569,-73.8350567166304,-73.8350626660514,-73.8350671382484,-73.8350701325622,-73.83507166915,-73.8350717679392,-73.8350703877521,-73.8350674909104,-73.8350645745755,-73.8350616777345,-73.8350588003886,-73.835055922163,-73.8350560010218,-73.8350590154886,-73.8350620098036,-73.835065004116,-73.8350679999671,-73.8350709942774,-73.8350719730547,-73.8350725308638,-73.835071111687,-73.835064211955,-73.8351035585437,-73.8351428320223,-73.835143319023,-73.8352573187343,-73.8352935457262,-73.835344296769,-73.8354653565547,-73.8355221323154,-73.835588517012,-73.8356395621251,-73.8356762157678,-73.8357083989501,-73.8357407716642,-73.8357411522756,-73.8357426486351,-73.8357929989655,-73.8358156204618,-73.8358475254427,-73.8358886914861,-73.8359370894886,-73.8359704502056,-73.8360035609716,-73.836026621075,-73.8360610469431,-73.8361286762583,-73.8361355477649,-73.8361726124846,-73.8361755965921,-73.8361891209395,-73.8361900302787,-73.8361722687065,-73.8361886783311,-73.8361881074611,-73.8361858587566,-73.8361854107605,-73.836186865694,-73.8361902220198,-73.8361974565248,-73.8361840210524,-73.8361648310577,-73.8361466035225,-73.8361460602544,-73.8361393897242,-73.8361327218353,-73.8361304447015,-73.8361289081627,-73.8361259138685,-73.8361229193529,-73.8361184659882,-73.83611255465,-73.8361081023833,-73.8361051067687,-73.836102092338,-73.8361020148687,-73.8361049117782,-73.8361033947134,-73.8360959855632,-73.8360900547475,-73.8360870597912,-73.8360826077426,-73.8360766964024,-73.8360707850592,-73.8360648730593,-73.8360604210103,-73.8360574264926,-73.836054431538,-73.8360528949929,-73.8360528161996,-73.836050542579,-73.8360438711647,-73.8360372019484,-73.8360334683742,-73.8360304725372,-73.8360289173931,-73.8360302985489,-73.8360331954566,-73.8360331551807,-73.8360301602206,-73.8360286236764,-73.8360300433512,-73.8360329411379,-73.8360358185681,-73.8360387156987,-73.8360416312051,-73.8360445480317,-73.8360445073144,-73.8360415136746,-73.8360385193744,-73.8360355182173,-73.8360339617503,-73.8360338575013,-73.8360323016935,-73.8360278414603,-73.8360219307677,-73.8360175174492,-73.8360131225105,-73.8360072120423,-73.8360012612954,-73.8359953112093,-73.8359922967652,-73.835992275032,-73.8359922188487,-73.8359921400543,-73.835992135675,-73.8359827021616,-73.8359782721326,-73.8359764679521],"lat":[40.6322166955384,40.6321679120009,40.6321649741544,40.6321303357713,40.6321299197007,40.6321243330473,40.6321259815655,40.6321253000415,40.632124099898,40.6321240002251,40.6321242508598,40.6321194942857,40.6321220900842,40.6321204510193,40.6321060942139,40.6320969501216,40.6320603891026,40.632049982403,40.6320103540398,40.6319780272038,40.6319416362459,40.6319397615644,40.6319354440025,40.6319164582493,40.6318974915883,40.6318898123144,40.6318708451227,40.6318588582343,40.6318442369764,40.6317949848944,40.6317950116332,40.6317928188424,40.6317906265501,40.6317884195737,40.6317861979126,40.6317828344614,40.6317772061351,40.6317715607772,40.6317681536076,40.631765871869,40.6317624646992,40.6317579315957,40.6317533986583,40.6317488950923,40.6317455474987,40.6317433246651,40.6317411028366,40.6317388811778,40.6317366600192,40.6317345155457,40.631733296568,40.6317299035801,40.6317257495206,40.6316787531227,40.6316593719009,40.6316591321952,40.6315801961572,40.6315650747991,40.6315438912558,40.6314907677537,40.6314641685027,40.6314247944789,40.6314038576608,40.6313470231031,40.6313166974462,40.6313047709116,40.6313046918791,40.6313047895083,40.6313238888568,40.631318397064,40.6313187182039,40.6313262834359,40.6313496535965,40.6313743011367,40.631413248074,40.6314295428248,40.6314538695318,40.6314841164488,40.6314875133412,40.6315390534821,40.6315594230481,40.6316453658723,40.6317011484228,40.6317510241074,40.6318870497791,40.6319199353876,40.631941364656,40.6319671024846,40.631991428913,40.632014343939,40.6320301483658,40.6320471742826,40.6320712923746,40.6320895950649,40.6320898243078,40.6320908836358,40.6320919417945,40.6320952971681,40.6320986594606,40.6321008818194,40.6321031046802,40.6321041852602,40.6321041252357,40.6321052063194,40.6321074286757,40.6321107762966,40.6321152798649,40.6321186870084,40.6321209240369,40.6321219762785,40.6321230415164,40.6321252638733,40.6321263449563,40.6321262849299,40.6321262260759,40.6321261660479,40.6321272471301,40.6321294694868,40.63213169067,40.6321350536316,40.6321395577006,40.6321429129101,40.6321439712261,40.63214502988,40.6321472446484,40.6321494663323,40.6321539545585,40.6321595999059,40.6321630070512,40.6321652587493,40.6321674811046,40.6321708428932,40.6321742358698,40.6321776435189,40.6321821765979,40.6321855830732,40.6321878649533,40.6321901466676,40.6321923990353,40.6321946207226,40.6321968425764,40.6321994386799,40.632203928077,40.6322099318282,40.6322144212262,40.6322158772251,40.6322158188721,40.6322146482523,40.6322123516969,40.6322122916682,40.6322144840074,40.6322166756772,40.6322200244678,40.6322212623077,40.6322245280355,40.6322290309316,40.6322292917679,40.6322316761522,40.6322284469122,40.6322166955384]}],[{"lng":[-73.8233759212934,-73.8227710543868,-73.8226504676488,-73.8225379103756,-73.8224334785434,-73.8223372611933,-73.8222493403534,-73.8221697909692,-73.8220986808411,-73.8220360705655,-73.8219820134843,-73.8219365556389,-73.8218997357321,-73.8218715850944,-73.8218521276578,-73.8218413799368,-73.8218393510129,-73.8218460425281,-73.8210750553346,-73.8208495608084,-73.8206721594249,-73.8203539314199,-73.8202334758526,-73.8201667486734,-73.820100034908,-73.8199384775572,-73.8196953586557,-73.8182563726933,-73.8182370498478,-73.8178886809715,-73.8172614946007,-73.816230961211,-73.8161754898308,-73.8166737311873,-73.8167526471157,-73.8179528472082,-73.8186434511545,-73.8186620428672,-73.8175487805414,-73.8175789028936,-73.8167223836549,-73.8166236989349,-73.816207121148,-73.8153871915868,-73.8153072224518,-73.8154317470428,-73.8163913131518,-73.8168245591878,-73.8171805387845,-73.8174442611113,-73.8174464513896,-73.8176471107445,-73.817774298345,-73.8177572675076,-73.8176029863246,-73.8175171781405,-73.8171684613709,-73.817118936222,-73.8165268124435,-73.8174981097032,-73.8201734801783,-73.8207589250475,-73.8214160164138,-73.8215706029161,-73.8216392193982,-73.8217020804838,-73.8217647149711,-73.8223496103741,-73.8239953676249,-73.8241032709012,-73.8244482123991,-73.8245832033166,-73.8246745163795,-73.8247394370676,-73.8246079747781,-73.8246858434753,-73.824907237176,-73.8252068396124,-73.8252583464622,-73.8254016108567,-73.8255575899788,-73.8257532210527,-73.8259360337329,-73.8260928708576,-73.8261974964758,-73.8261977813484,-73.8263539086596,-73.8266288985761,-73.8267315737102,-73.8270383421776,-73.8271519474536,-73.8272563663299,-73.8273737343204,-73.8274735189522,-73.82747779183,-73.8275819290487,-73.8276720422748,-73.8277256849005,-73.827875254718,-73.827698861069,-73.8275812353864,-73.8273200321807,-73.82724153727,-73.8275022260954,-73.8277370944182,-73.8280765353853,-73.828455031825,-73.829002879519,-73.8293287842879,-73.8296417160514,-73.8300981509802,-73.8305457528592,-73.8309199600142,-73.8314812223769,-73.8317032436122,-73.8320297090665,-73.8324609196554,-73.8333110544017,-73.834018881345,-73.8339526640577,-73.8338077661465,-73.8337015227225,-73.8336081783957,-73.8335912949263,-73.8335483123636,-73.8335072318595,-73.8334586571777,-73.8334194106556,-73.8333857710428,-73.8333353219143,-73.8332662117225,-73.8331952384341,-73.8331578812583,-73.8331130922959,-73.8330514157697,-73.8329953136776,-73.8329578518818,-73.8328737626083,-73.8328251418931,-73.832798960896,-73.8327690216982,-73.8327651501454,-73.8327295929849,-73.8326734939921,-73.8326472707438,-73.8326173463155,-73.8325892806985,-73.8325480893316,-73.8325144670319,-73.8324902204753,-73.8324510411224,-73.8323819508536,-73.8323315701518,-73.8322998638145,-73.8322532186429,-73.8321728876518,-73.8321336367909,-73.8320999866716,-73.8320663736944,-73.8320309249128,-73.8319636581743,-73.8319057748947,-73.8318404263981,-73.8317993015815,-73.8317563035912,-73.8317226380719,-73.8316946042604,-73.8316590931429,-73.8316384980199,-73.8316291215766,-73.8316066741456,-73.8315879871434,-73.8316103493483,-73.8316439423473,-73.8316831146168,-73.8317279291727,-73.8317802024354,-73.8318325325844,-73.8318773578466,-73.8319241043283,-73.8319782799546,-73.832011891694,-73.8320305884786,-73.8320567705584,-73.8320941354636,-73.8321389433815,-73.8321762912584,-73.8322099284132,-73.8322547463684,-73.8323107301797,-73.8323592322511,-73.8323983994221,-73.8324468649433,-73.8324842342156,-73.8325234457836,-73.8325682423085,-73.8325683029577,-73.832603813118,-73.8326374176247,-73.8326765970603,-73.8327119639433,-73.832724933689,-73.8327211048435,-73.8327434129356,-73.8327619719396,-73.8328178918205,-73.8328681853239,-73.8328849198722,-73.8328904236477,-73.8328884708882,-73.8328827903829,-73.832867757971,-73.8328508780279,-73.8328228407241,-73.8327854842174,-73.832742550467,-73.8327313118329,-73.8327312298567,-73.832721812402,-73.832721730421,-73.8327515631703,-73.8327589578337,-73.8327402318547,-73.8326973115872,-73.8326674224341,-73.8326654922636,-73.8326355739008,-73.8326224192804,-73.8326148889102,-73.8325886861861,-73.8325569430297,-73.8325495383924,-73.8325477395335,-73.8325104370176,-73.8324731137552,-73.8324674566832,-73.8324879182545,-73.8325083847799,-73.8324877968933,-73.8324317503431,-73.8323981311015,-73.8323589406791,-73.8323215773942,-73.8322879726416,-73.8322618552976,-73.8322014982464,-73.832114804863,-73.8320375145266,-73.8319585093952,-73.8318980289922,-73.8318139782879,-73.8317450064777,-73.8316827755386,-73.831644146905,-73.8315718569312,-73.8315180409617,-73.831455838636,-73.8314037314766,-73.8313582578548,-73.8313362476453,-73.8312872524811,-73.8312517791989,-73.8311692138363,-73.8311085530908,-73.831091603245,-73.8310841967325,-73.8310763474981,-73.8310157246783,-73.8309013340215,-73.8308223350161,-73.8306812115369,-73.8305956018596,-73.8305586919293,-73.8305184856258,-73.8305220829856,-73.8305237097447,-73.8304706528846,-73.8303872312681,-73.8304240238869,-73.8303799419262,-73.830292041815,-73.8302319697498,-73.8302086677887,-73.8302222747994,-73.8302081841187,-73.8302103379422,-73.8301639448881,-73.8301129666531,-73.8300736566377,-73.8300711362878,-73.8300802123258,-73.8301562876654,-73.830232332472,-73.8302044500376,-73.8301442788854,-73.8300934703574,-73.8300611591003,-73.8300379328586,-73.830049248654,-73.8300398630562,-73.8299866222995,-73.8299564470733,-73.8299287977163,-73.8299220366198,-73.8299453302756,-73.8299316463859,-73.8298694330131,-73.8298530228166,-73.8298551891372,-73.8298134709629,-73.829787888331,-73.8297393282784,-73.8296793226072,-73.829697680926,-73.8295913307002,-73.8295242759038,-73.8294780269887,-73.8294317038665,-73.8294269798487,-73.8294268673707,-73.8293412928432,-73.8293180343957,-73.8292948170917,-73.8292553450875,-73.8292482873694,-73.8291880922351,-73.8291902277972,-73.8292618578733,-73.8293056990631,-73.8293612317956,-73.8293613758258,-73.8294445683259,-73.8295092127359,-73.8295762179029,-73.8296617695621,-73.8297196499088,-73.8297890278127,-73.8298238865449,-73.8298424434401,-73.8298749869597,-73.829914396236,-73.8299722620289,-73.8300462835807,-73.8300786122956,-73.8301132480145,-73.8301086971932,-73.8301273659143,-73.830129824151,-73.8301483839719,-73.8301738265053,-73.8301947109853,-73.8301948095185,-73.830185719662,-73.830222767935,-73.830250551658,-73.8302829885276,-73.8303177574495,-73.830322476199,-73.8303203184423,-73.8303458274858,-73.830369004211,-73.830392086971,-73.8303990715104,-73.830396828034,-73.8304361962001,-73.8304432299114,-73.8304271502536,-73.8304272262889,-73.8304550097559,-73.8304851536161,-73.8304991277064,-73.8305246512436,-73.8305178270499,-73.830478566416,-73.8304438962746,-73.8303930219504,-73.8303329445102,-73.830330750958,-73.8303308404633,-73.830358650702,-73.8303725809676,-73.8303934648328,-73.8304143435429,-73.830476699172,-73.830527529283,-73.8305736663369,-73.8306174443813,-73.8306889668975,-73.8307535790271,-73.8308043693077,-73.8308574340461,-73.8308781662529,-73.830868870671,-73.830831884838,-73.8308317866742,-73.8308663542352,-73.8308755166627,-73.8308776755666,-73.8308314118656,-73.8307874638337,-73.8307296534187,-73.8306972341276,-73.8306532681445,-73.8306300392614,-73.830604529937,-73.8305951805968,-73.8306227898881,-73.8306642540166,-73.8306872118387,-73.8307125421441,-73.8307078450583,-73.8306730763158,-73.8306637314416,-73.8306590204847,-73.83066816504,-73.8307027411718,-73.8307072690305,-73.8306956354429,-73.8306493769701,-73.8305753834365,-73.8305105906999,-73.8305128112323,-73.830533561297,-73.8305565945019,-73.8305541945086,-73.8304986581091,-73.8304708295234,-73.8304615157621,-73.8305216696421,-73.8305910341751,-73.8305980895674,-73.8306074613417,-73.8305751823392,-73.8305544671419,-73.8305868549033,-73.8306492206318,-73.8306955014715,-73.8307210341668,-73.8307373418566,-73.8307674983799,-73.8307537327977,-73.8307237731772,-73.8306960998669,-73.8307239696321,-73.8307425425439,-73.8307311467422,-73.8307011948341,-73.8306528572061,-73.8306390975489,-73.830653035874,-73.8306785594515,-73.8307295194786,-73.830794252523,-73.830854325111,-73.8309259501455,-73.8309768022766,-73.8310115706015,-73.8310394258664,-73.8310672991321,-73.8310951803786,-73.8311900030527,-73.8312708959048,-73.8313402145292,-73.8314187754238,-73.8315319870868,-73.8315850486464,-73.8316057536137,-73.8316380385471,-73.8316425699972,-73.831674828331,-73.8317186870796,-73.8317579688555,-73.8317971898372,-73.8318086440141,-73.8318454752964,-73.8318800834269,-73.8319285903,-73.8319564036935,-73.831944963381,-73.8319150243081,-73.8318803273174,-73.8318226851232,-73.8317881119177,-73.8317488658906,-73.8317004117841,-73.8316658482189,-73.8317051889521,-73.8317422448339,-73.8318137493616,-73.8318898930882,-73.8319498761985,-73.8319982905429,-73.8320287707212,-73.832065208836,-73.8320974674288,-73.8321342717192,-73.8321479968431,-73.8321559345696,-73.83200070338,-73.8319382877551,-73.831868405635,-73.8318426244161,-73.8317691917133,-73.8316590943936,-73.8315928236445,-73.8315486228185,-73.8314349041801,-73.831306491512,-73.8311780644007,-73.8311156187926,-73.8310568135874,-73.8309650089429,-73.8309574555405,-73.8308986371005,-73.8309129378885,-73.8309204100084,-73.8309752129145,-73.8311473069032,-73.8312387948608,-73.8313448655704,-73.8312750366819,-73.8311721917097,-73.8310806674468,-73.8310184048743,-73.8309267666869,-73.8308350731633,-73.8307690273646,-73.8307578963226,-73.830768694767,-73.8308272451585,-73.8308858521623,-73.8309334143977,-73.8309516090878,-73.8309331316114,-73.8308927120929,-73.830855954534,-73.8307972411926,-73.8307348356858,-73.8306798277897,-73.8306539675109,-73.8306428150299,-73.8306316766887,-73.8306276178109,-73.8306529973528,-73.8306820180032,-73.8307403497918,-73.8307511335866,-73.830750914186,-73.8307690168512,-73.8308238141347,-73.830915269841,-73.8310324024004,-73.8311239148599,-73.831193505857,-73.8312666956599,-73.8313471764139,-73.831424030864,-73.8315447633113,-73.8316069785967,-73.8316691655482,-73.8317717809463,-73.8318927875941,-73.8320210363661,-73.8321017296601,-73.8321787436578,-73.8322629307207,-73.832303014962,-73.8323100676466,-73.8322988183626,-73.8322328758855,-73.8321924918405,-73.8321923795654,-73.8322362027886,-73.8322984256453,-73.8323827114867,-73.8324119247542,-73.832463082091,-73.8324739309704,-73.8324554259257,-73.8324223183043,-73.8324074774948,-73.8323962983473,-73.8323668255506,-73.8323299843616,-73.8323041816921,-73.8322893735351,-73.8322160276443,-73.8321281907883,-73.8320476857726,-73.8319414634487,-73.8318498216098,-73.8317764403368,-73.831699325325,-73.8316772413056,-73.8316551218383,-73.8315927359193,-73.8315816543516,-73.831566868123,-73.8315593877206,-73.8315738570228,-73.8315956588619,-73.8316174622842,-73.8316723253089,-73.8317125139066,-73.8317746886713,-73.8318772223345,-73.8317894466856,-73.8317822616801,-73.8317310900439,-73.8317238826696,-73.8317021018117,-73.8316326921047,-73.8316548543252,-73.8316843562244,-73.8317576612715,-73.8318492661057,-73.8318603686112,-73.8318092462955,-73.8318863203082,-73.8319889218761,-73.8320767319349,-73.8321058400589,-73.8321387448847,-73.8321645267494,-73.8322744266119,-73.832362300278,-73.8324575342142,-73.8325417790493,-73.832626050568,-73.8326115451951,-73.832618998135,-73.8326666251942,-73.832714126992,-73.832776448611,-73.8328132130913,-73.8328793937625,-73.8329234764744,-73.8330115448135,-73.8330554458405,-73.8330516010842,-73.8330367532762,-73.833032929,-73.833018157948,-73.833041008418,-73.8328652873168,-73.8328650873443,-73.8328772179744,-73.8328856085721,-73.8328954895678,-73.8326855931439,-73.8326635580099,-73.8323603667122,-73.8321920703231,-73.8319608076813,-73.8318864960235,-73.8318333464554,-73.8318966639819,-73.8317109063511,-73.831663941336,-73.8316080863105,-73.8315434359509,-73.8314700998554,-73.8313882023573,-73.8312978823149,-73.8311992928761,-73.8311726114635,-73.8311539318301,-73.8311433342335,-73.8311408642215,-73.8311465324369,-73.8311603145704,-73.831182151465,-73.8312119493692,-73.8312495803393,-73.8312862588257,-73.8313311286414,-73.8315519507209,-73.8316839754055,-73.8319387847268,-73.8319116731582,-73.8319063136744,-73.8319578778669,-73.8321207636504,-73.8323134547505,-73.8324909443572,-73.8324589578356,-73.8326358069717,-73.8329068393488,-73.8330942385032,-73.8334060797923,-73.8329495625692,-73.832899743612,-73.832812666356,-73.8322165881918,-73.8293800399574,-73.8286678210973,-73.8280856735329,-73.8270637908345,-73.8266549676336,-73.8265099853922,-73.8263630675972,-73.8262147996403,-73.8260657722917,-73.8259165793467,-73.8257678152601,-73.8256200727785,-73.8254739405789,-73.8253300009235,-73.8251888273406,-73.8250509823398,-73.8249170151707,-73.8247874596352,-73.8246628319609,-73.8245436287441,-73.8244303249717,-73.8241357769007,-73.8245737989033,-73.8241933192129,-73.8233759212934],"lat":[40.6389876558977,40.6355769140851,40.6353688441429,40.635158179711,40.634945100565,40.6347297885397,40.6345124273731,40.6342932025507,40.6340723011461,40.6338499116619,40.6336262238686,40.6334014286428,40.6331757178039,40.632949283951,40.6327223202979,40.6324950205089,40.6322675785326,40.6320401884374,40.6297337740637,40.6293836070039,40.6289148614295,40.6284245197344,40.6282389063357,40.6280279747693,40.6278170361434,40.6276820850489,40.6275868906501,40.6269960227519,40.6263871037166,40.6259084501446,40.6253859502227,40.6246898258483,40.624412640035,40.6240119613651,40.6239484978257,40.6240932796148,40.6233749043579,40.6228831561929,40.6220874012559,40.6217561608776,40.6215682928929,40.6219672339799,40.6220878772519,40.6214977796418,40.6206872651089,40.6201165312423,40.6196219555073,40.619461564854,40.6192672744932,40.6189117554092,40.6181108964938,40.6176119454629,40.6175011216957,40.6173071488158,40.6169838325815,40.6163964121645,40.6158431977223,40.6152821923455,40.6149470096586,40.6142141315642,40.6151806191388,40.6152326795177,40.6150547639347,40.6149086908311,40.6148706148947,40.6148241913903,40.6147644579723,40.6142600261963,40.6125162775592,40.6123260974856,40.6123411266579,40.6123998815441,40.6124199141226,40.6125493205895,40.6129072049827,40.6130764187567,40.6132657449525,40.613494977196,40.6137636192897,40.6138831978856,40.6141321047108,40.6141920815401,40.6141625182093,40.614083181727,40.6140037654279,40.6138943510091,40.6137861570237,40.6137458008556,40.6136649561239,40.6133950021527,40.6133785571548,40.6133787141246,40.6134186779709,40.6135523633269,40.6135580893556,40.6136676592836,40.6136241488628,40.6135982481675,40.6136976285985,40.6138767177697,40.6139362215035,40.6139955106903,40.6140650205719,40.6142046667202,40.6142348592424,40.6142055271274,40.6142160391517,40.6143561100772,40.6145157433296,40.6146455161249,40.6148053400601,40.6149330607807,40.6150054870335,40.6150063112282,40.6149569024455,40.6148976998606,40.6147093398113,40.6144933113214,40.6143811664197,40.6157578334979,40.6187701020658,40.6209786013443,40.6210401851634,40.6210742944406,40.6210955658696,40.6211026176559,40.6211210368112,40.6211408906123,40.6211579085527,40.6211791690804,40.6211989807029,40.621217366086,40.621228689613,40.6212257804607,40.6212584023022,40.6213009881268,40.6213535564262,40.6213918343883,40.6214287422207,40.6214486148089,40.6214784385124,40.6215338997476,40.6215708270448,40.6216119897243,40.6216489300785,40.6216730643087,40.621700045379,40.6217511857904,40.6217610927292,40.621753946128,40.6217467784291,40.6217580547805,40.6217522925275,40.6217422908649,40.6217351110348,40.6217634387201,40.6217847150677,40.6218059995819,40.6218116392702,40.621805898697,40.6218342446533,40.6218426936281,40.6218511316542,40.6218752492876,40.6219022094788,40.6219291821421,40.6219433634843,40.6219618005012,40.6219873704591,40.6220044239187,40.6220243023733,40.6220328079252,40.6220470632304,40.6220485347526,40.6220585475269,40.6220515023603,40.6220473118965,40.6220203658509,40.6220090536762,40.6219764106385,40.6219580009879,40.621952361156,40.6219395884165,40.621919715335,40.6219055475335,40.6219013458355,40.6218942892564,40.6218786946586,40.6218702264673,40.621874574605,40.6218860230796,40.6218974579248,40.6219231286895,40.6219075389484,40.621901906624,40.6219019718751,40.6218777941679,40.6218593575392,40.6218565611523,40.6218637294577,40.6219021811039,40.6219406008222,40.6219789960968,40.6220145840867,40.6220572783947,40.6220872258063,40.6221285439201,40.6221541683641,40.6221925767068,40.6222267075801,40.6222594107126,40.6222992120255,40.6223318982038,40.6223475023046,40.6223574033896,40.6223587632554,40.6223743916053,40.6224071028756,40.6224412223816,40.6224739336516,40.622486778287,40.6225152327985,40.622539383852,40.6225350544338,40.6225449668498,40.6225705641558,40.622591854257,40.6226273906354,40.6226529804568,40.6226813865589,40.6226856074621,40.6226614182134,40.6226343931561,40.62262296108,40.6226200625567,40.6226428097849,40.6226712838575,40.6226969144628,40.6227196404405,40.6227394700925,40.6227479540097,40.6227450527274,40.6227577982951,40.6227605940871,40.6227548665289,40.6227370619154,40.6227162642706,40.6226674240396,40.622631403924,40.6225902824432,40.622552973085,40.6225426131839,40.6225284171462,40.6224975853267,40.6224679866179,40.622453802819,40.6224280659577,40.6224036256329,40.6224176638775,40.6224702058945,40.622545789458,40.6225983116998,40.6226392235374,40.6226699096934,40.6227173296918,40.6227384844313,40.622760905542,40.6227762038252,40.622758083546,40.6227194984584,40.6226256838317,40.6225396427763,40.6224947088519,40.622422840763,40.6223751574089,40.6223536043441,40.6223419140058,40.6223908476578,40.6224595607087,40.6225316755761,40.6225720371246,40.6225719484304,40.6226493754375,40.6227497430982,40.6228395073121,40.6229011273474,40.6229732387162,40.6230312597922,40.6230435253004,40.62312626401,40.6231914152357,40.6232584260253,40.6233377603234,40.6233993364996,40.6234379778185,40.6234291000928,40.6234149688377,40.6234624671858,40.6235557905603,40.6236121120142,40.6236507639983,40.6237052941359,40.6236753250095,40.6236084166369,40.6235345113107,40.623464071069,40.6233970801443,40.6234903618351,40.6235467003709,40.6235976929323,40.6236627928664,40.6236785661926,40.6236520690351,40.6237013906495,40.6237276401604,40.6237469057654,40.6237626812357,40.6238066254142,40.6238471090036,40.6238911210631,40.6239244432492,40.6239842656769,40.6240282429284,40.624103885159,40.6241531684227,40.624200612353,40.6242692749586,40.6242676202952,40.6242905715388,40.6242589658591,40.6242026295741,40.6241974726755,40.6242169330741,40.6242170324215,40.6241925131757,40.6241468261321,40.6241222816622,40.6240431112953,40.6240149705966,40.6239375578521,40.623886561854,40.6238461568517,40.6238128171179,40.6238199063186,40.6238287601523,40.6238005852609,40.62372843346,40.6236703406987,40.6236404405641,40.6236299144391,40.6235947357075,40.6235560056495,40.623496135936,40.6234645013613,40.6234416557421,40.6234064945535,40.6233625329784,40.6233238092361,40.623263949763,40.6232270172654,40.6231988838001,40.6232077203359,40.623186604556,40.6231601941437,40.6231250424664,40.6230845615698,40.6230475677081,40.6230176395915,40.6229947939218,40.6229525867067,40.6229085955837,40.6228663820483,40.6228241196508,40.6228170196808,40.6228222500731,40.6228397801551,40.6228414515665,40.6227956760386,40.6227604659172,40.6227270577697,40.6227006712207,40.6226654922818,40.6226320738942,40.6226427295731,40.6226428045156,40.6226710395162,40.6227186373822,40.6227592340109,40.6227910177747,40.622806936597,40.622836943414,40.6228616204553,40.6228827330324,40.6228897200276,40.6229284505914,40.6229637112022,40.6229954133055,40.6230552734411,40.623076330955,40.6230956312959,40.6231149118802,40.6231430318075,40.623169374657,40.6232186336842,40.6232555669142,40.6232978043004,40.6233436177712,40.6233929726015,40.6234511028094,40.6234845892969,40.6235145099372,40.6235584709595,40.6235989484638,40.6236341512722,40.6236728954471,40.623704634991,40.6237416124711,40.6237732834582,40.6237925815158,40.6238153579673,40.6238539931682,40.6238892061886,40.6239068419021,40.6239350435156,40.6239702502272,40.6240036175428,40.6240440671064,40.6240722210346,40.6240406211069,40.6240213576541,40.6239720748079,40.6239210343088,40.623894579643,40.6238628604918,40.6238470641638,40.6238541974629,40.623826098635,40.6237803634452,40.6237275725844,40.6236800842988,40.6236413333292,40.6236113604906,40.6235901941599,40.6235338993685,40.6234987169664,40.623437082836,40.6234035895466,40.623331338461,40.623290826922,40.6232609198969,40.6232187051562,40.623167725888,40.6231519771212,40.6231520655215,40.6231521708809,40.6231434431775,40.6230994825641,40.6230484691937,40.6229904137589,40.6229288378731,40.6228920070031,40.6228815627142,40.6228799043705,40.6228782585331,40.6228784244903,40.6229101915288,40.6229454321105,40.6229701254329,40.6230053418181,40.6230405993057,40.623056507574,40.6230548045044,40.6230777480392,40.6231164955039,40.6231711246512,40.6231905409546,40.6231958928979,40.6231607238082,40.6231166948579,40.6230779203821,40.6230937142101,40.623046097218,40.6230125974504,40.6230002164151,40.6229737383889,40.62293671697,40.6229121273579,40.6228769725188,40.6229246098333,40.6229652124731,40.6230005104219,40.6230428323447,40.6230581133152,40.623076379302,40.623111636168,40.6231768282248,40.6232314230307,40.623305451969,40.623483603459,40.6235421224369,40.6236564474531,40.6237122290828,40.6237818943128,40.6238654609834,40.6239993280187,40.6240969455907,40.6241637618767,40.6242473006817,40.6243364223944,40.6244061033381,40.6244841635357,40.6245761285139,40.6246654269657,40.6247490682911,40.6248022489655,40.6248300372725,40.624885936518,40.6249113075322,40.6249449327595,40.6250064889723,40.6250984870995,40.6252099734362,40.6251903020986,40.625187420237,40.6252124043069,40.6252597143121,40.6253042721394,40.6253600739098,40.6254354448595,40.6254578582922,40.6254579445164,40.6254803429038,40.6255278145455,40.6255919787965,40.6256421567774,40.6256923384564,40.6257341162202,40.6257870521488,40.6258120899457,40.625898570538,40.625962744357,40.6260213376366,40.6261776241559,40.6262809250788,40.6263926052942,40.6265015371212,40.6265824897728,40.6266690081237,40.6267527625791,40.626811452908,40.6268590328298,40.6268926964255,40.6269179496756,40.6269208422374,40.6269488586651,40.6269908404034,40.6270188627763,40.6270776499202,40.6271000683192,40.6271336502717,40.6271142635726,40.6270642041561,40.6270476455776,40.6270059004676,40.6269697299856,40.6269949721377,40.6270787584138,40.6271876146242,40.6272908617378,40.6272935563977,40.6273297798822,40.6273744342319,40.6274275259654,40.6274471531345,40.6274333220555,40.6274696458894,40.6275199578633,40.6275757918122,40.6276511198804,40.6277068897686,40.6277822231688,40.6278575619046,40.6279245012047,40.6280081752765,40.6280723285445,40.6281337074821,40.6281670918536,40.628136263116,40.6281026546594,40.6280997085748,40.6281246927027,40.6281720307322,40.6282472729044,40.6282891047221,40.6283448916462,40.628389454792,40.6284257203064,40.6284787259171,40.6285401154939,40.6286127013561,40.6286825059188,40.6287523111492,40.6287858823654,40.6288278053418,40.6288669689403,40.6288810740798,40.6288251263882,40.6287692977422,40.6287245678515,40.6286771112604,40.6285989339908,40.6285234773403,40.6284509462999,40.6283728429298,40.6283562053677,40.6283451757516,40.6283005363068,40.6282362701305,40.6281777738524,40.6281639693392,40.6282059617714,40.6282841496731,40.6283093158388,40.6282535353413,40.6282509048543,40.6282677783708,40.628270708724,40.6282736218203,40.6282653717692,40.6282067416507,40.6281565150894,40.6281537940545,40.6282013085539,40.628181862826,40.6281288885188,40.6280313024525,40.6279811296118,40.627919857691,40.6279422487007,40.6280148077852,40.6280929316154,40.6281571169604,40.6282045413847,40.6282612710596,40.6284083502626,40.6284882026479,40.6285920739921,40.6286639075247,40.628903478733,40.6290149678854,40.6290235918699,40.6291422577473,40.6293815690751,40.6296527298793,40.6300279279385,40.6303233042284,40.6305723940522,40.6312614980979,40.6314267205643,40.6315903295952,40.6317520476757,40.6319116004961,40.6320687174176,40.6322231319317,40.6323745821114,40.6324669885278,40.6325605279219,40.63265479857,40.6327493956057,40.6328439127594,40.6329379441026,40.633031085792,40.633122937803,40.6332131056486,40.6334158776627,40.6336176914277,40.6338443831601,40.6339781177747,40.6342362254285,40.6345762184361,40.6346434256874,40.6349788805658,40.6351254373473,40.6352988089747,40.6355785518356,40.635794106455,40.6363293744819,40.6369286608493,40.6374399891538,40.6385013558991,40.6388234942368,40.6388626850669,40.638881937219,40.6389284902208,40.6370749273681,40.636614718448,40.6358797268366,40.6358114565237,40.6358108409342,40.6357839816398,40.6357641443094,40.6357514079843,40.635745823412,40.6357474128442,40.6357561699478,40.6357720598304,40.6357950191791,40.6358249565128,40.6358617525467,40.6359052606675,40.635955307517,40.6360116936835,40.6360741944953,40.6361425609163,40.6362165205382,40.6387879967046,40.6393538732393,40.6399540721631,40.6389876558977]}],[{"lng":[-73.8362610972438,-73.8363307472129,-73.836589550425,-73.8373877877964,-73.8372940791441,-73.8368133457516,-73.8359232007328,-73.8362610972438],"lat":[40.6453516770483,40.6453211492796,40.6458924652605,40.6491181499693,40.6491370624168,40.6492494150021,40.645499790675,40.6453516770483]}],[{"lng":[-73.830798778959,-73.8314872351721,-73.8345349730474,-73.8346528817715,-73.834768948913,-73.8348827314799,-73.8349937951982,-73.8351017161689,-73.8352060824859,-73.8353064958075,-73.8354025728767,-73.8354622853076,-73.8355170245918,-73.8355658711894,-73.8356080045444,-73.8356427168687,-73.8356694250324,-73.8356876803601,-73.8356971761692,-73.8356977529232,-73.835732481736,-73.8357605262252,-73.8357817029928,-73.8357958735459,-73.8358029452041,-73.835802871705,-73.835972234305,-73.8354713658254,-73.8345606990977,-73.8336384528618,-73.8327190986577,-73.8317960415922,-73.8310888527372,-73.830798778959],"lat":[40.6489765592065,40.6478872785163,40.6480251307883,40.6480450710976,40.6480705189918,40.6481013773446,40.64813752838,40.648178834121,40.6482251369168,40.6482762600439,40.6483320083805,40.6483583419314,40.6483903366385,40.6484274550422,40.6484690736118,40.6485144932202,40.6485629508866,40.6486136325943,40.648665686964,40.6487182395553,40.6487801814213,40.648844057984,40.6489094515642,40.6489759345618,40.6490430722521,40.6491104256279,40.6493487634152,40.6494129637872,40.6495443036767,40.6496762240526,40.6498085002564,40.6499406829504,40.6500539328134,40.6489765592065]}],[{"lng":[-73.8267194354685,-73.8263924291048,-73.8265028981986,-73.8266446165348,-73.8268003393198,-73.8270150257283,-73.827422970595,-73.8276941936826,-73.8280113905908,-73.8282148522688,-73.8284604110572,-73.8289147559749,-73.829062796234,-73.8292814682135,-73.8294167422872,-73.8295969736259,-73.829271963309,-73.8289555302084,-73.8272431490016,-73.8268962339085,-73.8267194354685],"lat":[40.6495788193193,40.6483243486167,40.6483290266986,40.6484647462561,40.6486287580172,40.6487597127323,40.6488948564302,40.6489410825038,40.6490283200157,40.6490461715483,40.6491186777248,40.6493791558207,40.649501261032,40.6495776252135,40.6497338045871,40.6498276580859,40.6500467760495,40.6500818827522,40.6502871718497,40.6503497089878,40.6495788193193]}]],[[{"lng":[-74.1331958010138,-74.133012076688,-74.1330261157129,-74.133206962516,-74.1332156758573,-74.1333831291903,-74.1333690539633,-74.1332065670927,-74.1331958010138],"lat":[40.5363067420506,40.5362560650429,40.5362403369511,40.536290635641,40.5362786938578,40.5363244208309,40.5363561952254,40.5363113688086,40.5363067420506]}],[{"lng":[-74.1330758570279,-74.1329426645362,-74.1329712040365,-74.1331723597519,-74.1331612014116,-74.1330906261181,-74.1330758570279],"lat":[40.5363974880403,40.536322033082,40.5362946885775,40.5363551977209,40.536374002701,40.536352730957,40.5363974880403]}],[{"lng":[-74.1299384318979,-74.1300492851493,-74.1300583613018,-74.1300639275467,-74.130056678687,-74.1302086936159,-74.1301246813823,-74.1299291682386,-74.1298477133491,-74.1297640561907,-74.1296942741141,-74.129683755087,-74.129845555035,-74.1298581995889,-74.1297838485732,-74.1301198429037,-74.1301288370855,-74.1301405145484,-74.1302275429785,-74.1305216428305,-74.1304304813732,-74.130156229619,-74.1300844001854,-74.1300114871368,-74.1300027281495,-74.1301693579847,-74.1301780432739,-74.1301050558659,-74.130448398878,-74.1305417652116,-74.130839068519,-74.1307518766589,-74.1307392231043,-74.1306632732578,-74.130652542691,-74.1305787886114,-74.1305630482493,-74.1305024944502,-74.1304773330467,-74.1304074352643,-74.1303336609828,-74.130322448993,-74.1303431377212,-74.1303512139389,-74.1303993064345,-74.1304478491413,-74.1304629234235,-74.1304727724267,-74.1304852836062,-74.1304960178829,-74.1304253151432,-74.1306550137505,-74.1306730762554,-74.1307244736057,-74.1307595935483,-74.1307714868165,-74.130859188541,-74.1311532871527,-74.1310729489018,-74.1310333259679,-74.1309849719329,-74.1309722667295,-74.1308937147626,-74.1308810405841,-74.1308038106651,-74.1307192580885,-74.1306477472194,-74.1306376580377,-74.1306542804183,-74.1306632570622,-74.1307123044281,-74.1307213485793,-74.130724857721,-74.1307773681137,-74.1307997189629,-74.1308109301528,-74.1307378245925,-74.1308096571595,-74.1310905454396,-74.1311743698497,-74.1314742421533,-74.1313905948432,-74.1313815435178,-74.1313032651567,-74.1312929345616,-74.1312129025488,-74.131201984445,-74.131125475331,-74.1311151749001,-74.13103945369,-74.1309666880344,-74.1309567806802,-74.1309750911599,-74.1309848364327,-74.1310326382864,-74.1310430653383,-74.1310648833717,-74.1311021331362,-74.1311196228259,-74.1311306476128,-74.131059066661,-74.1311352951375,-74.131144777607,-74.1312251352698,-74.1314155635083,-74.1314974007248,-74.1317935081566,-74.1317117623692,-74.1317008480922,-74.1316216880518,-74.1316110719538,-74.1315333870204,-74.1315233806709,-74.1314446149421,-74.131433398168,-74.1313886951315,-74.131345587368,-74.13128102023,-74.1312554660054,-74.1311646637856,-74.1311954575527,-74.1312833709033,-74.1313327919193,-74.1313210134975,-74.1315130781355,-74.1315256488318,-74.1313541233686,-74.1313595632135,-74.1313765677607,-74.1312926979978,-74.1313615393585,-74.1317335677133,-74.1318138720177,-74.1321124449556,-74.1320291207995,-74.1320160616864,-74.1319400120769,-74.1319277612658,-74.1318502874135,-74.1318390526834,-74.1317657174954,-74.1316953037346,-74.1316840932061,-74.1316976760207,-74.1317211833283,-74.1317570017448,-74.1317653008701,-74.1318165419999,-74.1318266564925,-74.131846271476,-74.1318566132485,-74.1317852073063,-74.1318574037158,-74.1320320939242,-74.1320375804802,-74.1320494137472,-74.1321356051246,-74.1322158158141,-74.1324243851322,-74.1323510639316,-74.1319981705119,-74.1319219095146,-74.1319118212463,-74.1319349951574,-74.1319776807087,-74.1319894662691,-74.1319993425555,-74.1320484676798,-74.1320583272896,-74.1320795227956,-74.1320926020664,-74.1320182117625,-74.1320867758648,-74.1321320095263,-74.132175696402,-74.1322787327083,-74.1323581122609,-74.1323689455815,-74.1324530276407,-74.1327548049012,-74.1326690965781,-74.1325706919733,-74.1325423684931,-74.1324810728003,-74.1324340036424,-74.1323938063227,-74.1323220559062,-74.1322471738396,-74.1322359626934,-74.1322592520323,-74.1322652804669,-74.1323146229853,-74.1323980158417,-74.13240922529,-74.1323376970766,-74.1324105649482,-74.1326908356858,-74.1327760371171,-74.1330744557155,-74.1329948579623,-74.1329806082851,-74.1329126291606,-74.1328978564072,-74.1328652860073,-74.1328091729315,-74.132729246377,-74.1327179495538,-74.1326469400417,-74.1325668307093,-74.1325578613907,-74.1325813345097,-74.1326149153789,-74.1326419729534,-74.1326509029038,-74.1326683069897,-74.1327087688678,-74.132735602333,-74.132743451717,-74.1326672694533,-74.1327409674243,-74.132751514058,-74.1328316896652,-74.1328400770757,-74.1329184484724,-74.1329273713109,-74.13300283995,-74.1330172192023,-74.1330945751147,-74.1333918737734,-74.1333073206761,-74.1332965672141,-74.1332180691644,-74.1332084439259,-74.1331285324121,-74.1331193805895,-74.1330434052739,-74.1330308822823,-74.1329557718341,-74.1328863404222,-74.13287438281,-74.1328920362654,-74.1328992555211,-74.1329485062369,-74.1330138544643,-74.1330350883953,-74.1330440563831,-74.1329725293473,-74.1330465188757,-74.1332928568643,-74.133316868147,-74.1333278648839,-74.1334100436547,-74.1336813422143,-74.1336895773249,-74.1336657647278,-74.1338082326314,-74.1338605414038,-74.1335954379034,-74.1332106058526,-74.132775131134,-74.132465128574,-74.1322025929126,-74.1319373146341,-74.1311770640338,-74.131047864237,-74.1306287248031,-74.1300813626206,-74.130076208929,-74.1300717233712,-74.1300832539011,-74.1299693420299,-74.1299384318979],"lat":[40.5399471355583,40.539838507603,40.5398434374536,40.5398381341781,40.5398326703497,40.5397026638173,40.5396465870144,40.5395211535548,40.5394688955219,40.5394152229496,40.5394782403846,40.5394717195925,40.5393268569616,40.5393352417892,40.5393986762358,40.5396158083173,40.539621620972,40.5396291663654,40.5396837175563,40.5394255581197,40.539362920806,40.5391687766731,40.5391179263737,40.539180041715,40.5391723936585,40.5390328780234,40.5390400052993,40.5391017359679,40.5393451134319,40.5394093062557,40.5391475928925,40.5390899944717,40.5390810833725,40.5390275948343,40.5390200373593,40.5389680944134,40.5389570095824,40.5389143630738,40.5388966436845,40.5388474157642,40.5389090003818,40.5389004712445,40.5388824868442,40.5388754656979,40.5388336580322,40.5387914579815,40.5387783552353,40.5387697922956,40.5387589162553,40.5387659307763,40.5388303122301,40.5389909511321,40.5390035836325,40.539039527205,40.5390640878557,40.5390724054213,40.5391313398024,40.5388735741037,40.538818056361,40.5387915406734,40.5387591822643,40.5387506801908,40.5386981109949,40.5386896291471,40.5386379461253,40.5385813619149,40.5386421426947,40.5386353212863,40.538617311133,40.5386097061022,40.5385681458324,40.5385604830897,40.5385575091184,40.538513015779,40.5384924903141,40.5385001658394,40.5385644327865,40.5386122215632,40.5388015673798,40.538855160896,40.5385983148828,40.5385438431884,40.5385376519115,40.5384841126816,40.538477046175,40.5384223066917,40.5384148389432,40.5383625086463,40.5383554640357,40.5383049794674,40.5383676717246,40.538360738059,40.5383417499021,40.5383335460537,40.5382933063672,40.5382845286147,40.538266162333,40.5382348052208,40.5382188923252,40.5382269220237,40.5382889810629,40.538338357329,40.5383447330862,40.5383987657699,40.5385268082834,40.5385813808756,40.5383259919918,40.5382685275976,40.538261123051,40.5382074203662,40.5382002180133,40.5381475160776,40.5381407269852,40.5380872916074,40.5380796814869,40.5380493542243,40.5380201097101,40.5379763060431,40.5379589694089,40.5379001358684,40.5378724087738,40.5379334908337,40.5378913294398,40.5378846180804,40.5377107057328,40.5377185426384,40.5378715148574,40.5378752147379,40.5378874914995,40.5379567018708,40.538001720429,40.5382518403588,40.5383073586857,40.5380522966777,40.5379964806442,40.5379876716748,40.5379363722039,40.5379281091143,40.5378758484241,40.5378682691893,40.5378174462926,40.5378790286063,40.5378713531662,40.5378571233157,40.5378373567632,40.537807236782,40.53780025934,40.5377571700436,40.5377486648149,40.5377346437995,40.5377426182579,40.5378022907491,40.5378518889548,40.5379679843511,40.5379716303687,40.5379794938646,40.5380331271827,40.5379649260929,40.5377749602324,40.5377193985969,40.5374809844387,40.5375396629451,40.537532840977,40.5375137983262,40.5374787215402,40.5374690369734,40.5374609206732,40.537420553223,40.5374124501718,40.5373950336378,40.5374046522509,40.5374646022346,40.5375148908452,40.537545070135,40.5375742170234,40.5376429608344,40.5376959206564,40.5377031489924,40.5377602808614,40.53750453648,40.5374426083084,40.5373751270326,40.5373557044439,40.5373136708129,40.5372813927803,40.5372538274721,40.5372052220395,40.5372702254523,40.5372625512392,40.5372419009366,40.5372365553053,40.5371928058915,40.5371188644301,40.5371256843926,40.5371881207843,40.537236724416,40.5374268800733,40.5374840109159,40.5372291233041,40.5371745487339,40.5371648513319,40.5371185881608,40.537108534012,40.5370863689221,40.5370481798159,40.5369937872119,40.536986097732,40.5369370388106,40.5369973767242,40.5369914077574,40.5369717348832,40.5369458108326,40.5369249245722,40.5369180295992,40.5369045945043,40.5368733589693,40.5368545352432,40.5368613597278,40.536920189085,40.5369705140949,40.5369777152516,40.5370324622135,40.537038189751,40.5370917053819,40.5370977978442,40.5371493305393,40.5371591485777,40.5372120174252,40.5369579843476,40.536898641975,40.536891364213,40.5368382366512,40.5368317228501,40.5367776389289,40.5367714445542,40.5367200239293,40.5367115481735,40.5366612387219,40.5367260424113,40.5367196323024,40.5367014587936,40.5366950708849,40.5366515013971,40.536593692433,40.5365748756259,40.5365808445572,40.5366432820171,40.5366927380174,40.5368579800738,40.5368740867004,40.5368814630208,40.5369397223736,40.5367090843605,40.5367034248136,40.5366876435447,40.5365621761787,40.5365979624939,40.536817170339,40.5371460895409,40.5375198346231,40.5377851947322,40.5380100868674,40.5382371143753,40.5388894125571,40.5389976502628,40.5393660435279,40.539848874055,40.5398451195104,40.539851135241,40.5398594400534,40.5399677691115,40.5399471355583]}],[{"lng":[-74.1278675677062,-74.1278862637558,-74.1279283050762,-74.127691754505,-74.1275666076284,-74.1275576058033,-74.1277314342736,-74.1278982496164,-74.1278675677062],"lat":[40.543315180066,40.5433080770748,40.543373247056,40.5434557081918,40.5434993339345,40.5434803547261,40.5434230848037,40.5433661720648,40.543315180066]}],[{"lng":[-74.1277537560856,-74.1279896839074,-74.128030684975,-74.1280105487933,-74.127980052533,-74.1278189344656,-74.1276389685455,-74.1276299410406,-74.1277537560856],"lat":[40.5435660251842,40.5434843436311,40.5435505582789,40.5435572506073,40.5435090302188,40.5435643996446,40.5436281905961,40.5436088936174,40.5435660251842]}],[{"lng":[-74.1974980000875,-74.1936329911255,-74.1917684424512,-74.1906405300715,-74.1904620703501,-74.1903770210933,-74.1900602667698,-74.189980916187,-74.1899221412573,-74.1898963711543,-74.1899205888627,-74.1899751756534,-74.1900695778584,-74.190108808563,-74.1902518234609,-74.1901329419416,-74.1891953797036,-74.1892512669193,-74.1891966091692,-74.1890943144194,-74.1890398957837,-74.1890096735266,-74.1890353667766,-74.1891250824619,-74.1892227173139,-74.1891802498931,-74.1889207766972,-74.188666890252,-74.1884187174249,-74.1881763822238,-74.1879400057353,-74.1877097060639,-74.1874855982733,-74.1872677943703,-74.1870564031241,-74.186851530137,-74.18665327775,-74.1864617449917,-74.186277027529,-74.186099217619,-74.1860271449661,-74.185919772638,-74.1857085213456,-74.1847420761179,-74.1838252136254,-74.1834662119469,-74.1831259388962,-74.1793691998134,-74.1790769996092,-74.1783981394257,-74.1775803674472,-74.1765936607424,-74.1764087227188,-74.1762207053066,-74.1760299334002,-74.175836736932,-74.1756414494582,-74.1754444084295,-74.1753308557817,-74.1752187756933,-74.1751085148576,-74.1750004144386,-74.1748948087025,-74.1747920243117,-74.1742166231723,-74.1734645182208,-74.1722550766378,-74.1719192139948,-74.1718516652276,-74.171777239006,-74.1715081866497,-74.1712509821698,-74.1711033637115,-74.1707862269769,-74.1704674823617,-74.1701472932972,-74.1698258238223,-74.166889720225,-74.1659198171382,-74.1655501357253,-74.1649961655394,-74.1648521499664,-74.1647661213767,-74.1644273761467,-74.1643866512156,-74.1625647565192,-74.1526287023336,-74.1516371359177,-74.1501459479379,-74.1480214873466,-74.1472356836284,-74.1469905773909,-74.1458047420613,-74.1441858820751,-74.1418476464932,-74.1411063134086,-74.1402400878657,-74.1384659707023,-74.1381387369323,-74.137042581878,-74.1363534324276,-74.1357919339248,-74.1346185566227,-74.1342774930893,-74.133786066999,-74.1336031137798,-74.133421074384,-74.1332400720371,-74.133060229789,-74.1329214536417,-74.1327843625368,-74.1326491995887,-74.1325162036901,-74.1319538353831,-74.1309404878287,-74.1292832020009,-74.1291446441952,-74.1281479757139,-74.1278471150735,-74.1277349354834,-74.1276733110061,-74.1276175241908,-74.1275683879978,-74.1275266186025,-74.1274928245819,-74.127467498419,-74.12706747024,-74.1266568893801,-74.125672678039,-74.1253527570123,-74.1251589568915,-74.1240583616202,-74.1234975648371,-74.1233397304328,-74.1233395532961,-74.1233393647001,-74.1231838072792,-74.1231836648387,-74.1231835234829,-74.1230333613109,-74.123033196429,-74.1230330420598,-74.1228913599735,-74.1228912772967,-74.122891205807,-74.1227608403022,-74.1227606984399,-74.1227605800866,-74.1226437541449,-74.1220960212705,-74.1217262391975,-74.1218533359744,-74.1218307982974,-74.1217007550939,-74.1216043917063,-74.1213929926679,-74.1213604469873,-74.1213435208248,-74.121343520693,-74.1213425480553,-74.1213575078366,-74.1213575197575,-74.1213575435243,-74.1213881541003,-74.1213873134497,-74.1214453570591,-74.1216256400038,-74.1221685656974,-74.1225964492859,-74.1227896727344,-74.1231160913419,-74.123170037416,-74.1232219633198,-74.1234164888568,-74.1234515303664,-74.1235840138025,-74.1241856038726,-74.124899043723,-74.1239506369465,-74.1235966318533,-74.1232920615201,-74.1230928113978,-74.1216663634852,-74.1202400898627,-74.1194800974205,-74.1187603887196,-74.1180405535346,-74.1172129034508,-74.116410527291,-74.1163633640869,-74.1163000392628,-74.1161742246439,-74.1150993995063,-74.1147179679246,-74.1142986670062,-74.1135152232929,-74.1121123978743,-74.1101394717195,-74.1093621450181,-74.1086159408723,-74.1078679586248,-74.1071040086103,-74.106906924319,-74.1061723704817,-74.1055764550874,-74.104846271245,-74.1041315213253,-74.1039083073734,-74.1036812220584,-74.1034503639065,-74.1032158330786,-74.1029777313271,-74.102736162177,-74.1024912301959,-74.1022430416423,-74.1019917041854,-74.1017373268587,-74.1018921804773,-74.1027890436984,-74.105726964432,-74.1064492029203,-74.108910797,-74.1095362958096,-74.109846583999,-74.1099579851235,-74.1116526818833,-74.1120559474584,-74.1125256900003,-74.113684352106,-74.1142159849182,-74.1144180206408,-74.1149690458863,-74.1165629005628,-74.1167163144766,-74.1167626888337,-74.1183416929299,-74.1195748044552,-74.1196085410251,-74.1194585929116,-74.1207628817176,-74.1226989576037,-74.1238003156366,-74.124020471276,-74.1257267505036,-74.1272522789842,-74.1273005782192,-74.128116971999,-74.1289614164244,-74.1297560235694,-74.1304245963892,-74.1310866524171,-74.1317782811874,-74.1331682599924,-74.1345586822585,-74.1352807604433,-74.1360734337128,-74.1373898816613,-74.1376973159297,-74.1384119372381,-74.1386526590918,-74.138607417331,-74.1382019389324,-74.1374574353012,-74.1371118563389,-74.1369599246983,-74.1358571256614,-74.1364115311903,-74.1364906305002,-74.1364591218192,-74.1365161343927,-74.1365851134253,-74.1368062212155,-74.1369712915121,-74.1370644605967,-74.1370089477201,-74.1370234291123,-74.1370962780885,-74.1371325901367,-74.13706316638,-74.1371798712987,-74.1371561953731,-74.1371427044082,-74.1371277742088,-74.137078213445,-74.1370625904048,-74.1370106897443,-74.1369949419771,-74.1369447844645,-74.1369268016948,-74.1368768940086,-74.1368587469149,-74.136810493692,-74.1367926984513,-74.1367436503657,-74.1367253237981,-74.1366792756241,-74.1366605805461,-74.1366151533632,-74.1365882155452,-74.1365281077823,-74.1365012248162,-74.1364428921273,-74.1362608528093,-74.1361344825825,-74.1361154072406,-74.1362395396177,-74.1363837980196,-74.1364028731746,-74.1362843324106,-74.1363651085338,-74.136435225192,-74.1364391717441,-74.1366079566773,-74.1366125961063,-74.1371703182408,-74.1371728196847,-74.1371928751972,-74.1375083350885,-74.1374894199194,-74.1374795860377,-74.1374665685691,-74.1374500543941,-74.1374297615573,-74.1374154359189,-74.1373563462388,-74.1373418106858,-74.1373181132333,-74.1373065226544,-74.137245360787,-74.1372407714819,-74.1368443601136,-74.1368411843495,-74.1368158856208,-74.1368067000907,-74.1367446104737,-74.1367337016138,-74.1367145113051,-74.136611871107,-74.1365890707116,-74.1366338868159,-74.1368330007153,-74.1368734863086,-74.1368909529476,-74.1367488875703,-74.1374243461791,-74.13743335928,-74.1374155880228,-74.1374716610331,-74.1374878628649,-74.1375028996037,-74.1375299444234,-74.1374472348423,-74.1375029313671,-74.1375002251057,-74.1375179942879,-74.1375287784891,-74.1375493297227,-74.1378845693202,-74.1379496605065,-74.1380660822677,-74.1382249378188,-74.1382929754464,-74.1384106088553,-74.138487683166,-74.1385597655046,-74.1386260998263,-74.13868599038,-74.138738809006,-74.1387840017239,-74.138821094543,-74.1388496984331,-74.1388695134042,-74.1386948824643,-74.1387431508701,-74.1387215872574,-74.1387078443273,-74.1386878159363,-74.1386502624752,-74.1386275264903,-74.138585032909,-74.1385617721914,-74.1385207049438,-74.1384965123955,-74.1384582025146,-74.1384337707142,-74.1384212676957,-74.138368939089,-74.1383429695579,-74.1381781226809,-74.1381604783656,-74.1381219813778,-74.138104041929,-74.1380928465482,-74.1380414391879,-74.1376243074514,-74.1377562075567,-74.1377797569523,-74.1376791549426,-74.1376791831007,-74.1377049727256,-74.1377398788633,-74.137810487583,-74.1378440051603,-74.1378625017347,-74.1380279169009,-74.1380469476643,-74.1381006405007,-74.1381174254527,-74.1381708505838,-74.1381935223513,-74.1382488081468,-74.1382707348388,-74.1383276860086,-74.1383481216329,-74.1384066939789,-74.1384253020398,-74.1384846101395,-74.1385025718634,-74.1385626841155,-74.138580529965,-74.1386419764041,-74.1386572401004,-74.1387181944371,-74.1387350968491,-74.1387348404019,-74.1387553470346,-74.1390196507931,-74.1389909520359,-74.1389695667455,-74.1389175565917,-74.1388945440295,-74.1388407458788,-74.1388159437414,-74.1387626853579,-74.1387400277797,-74.1386884970684,-74.1385405135774,-74.1385335231334,-74.1384801032705,-74.1384569251964,-74.138433507414,-74.1383777036408,-74.1383567367762,-74.1382821167182,-74.1382582657618,-74.1381866993306,-74.1381626091427,-74.1380856119781,-74.1380616643531,-74.1380482078875,-74.1380019498981,-74.1379899016442,-74.1379799708294,-74.1378937755026,-74.1378679852454,-74.1379321825399,-74.1380434689781,-74.1380658961542,-74.1380100182888,-74.1380496762585,-74.1380750508895,-74.1380995242209,-74.1381081262648,-74.1390330717863,-74.1395393791575,-74.1394325300265,-74.1394223199802,-74.1394143618905,-74.1394209124511,-74.1393709360766,-74.1393646364857,-74.1393199694616,-74.1393128114546,-74.1392930274949,-74.1392859361402,-74.1392447370994,-74.1392361306353,-74.1391965238308,-74.1391880796118,-74.1391518746155,-74.1391452511424,-74.1391083881035,-74.1391510849762,-74.1391454134623,-74.1391027172494,-74.1391002975316,-74.1390326599032,-74.1390413466357,-74.139093349263,-74.1391126417672,-74.1392266068724,-74.1392695268101,-74.13927673845,-74.1393251494984,-74.1393317886663,-74.1393777453498,-74.1393835741522,-74.1394049744142,-74.1394100796816,-74.1394206933788,-74.1393389503218,-74.1392876729529,-74.1389745422676,-74.1389074304837,-74.138918176049,-74.1389598382897,-74.1389719318678,-74.1390105180371,-74.1391567587631,-74.1391556516464,-74.1391639630939,-74.1392059245196,-74.1392139823334,-74.139222498242,-74.1392459198726,-74.1391955356248,-74.1392203285981,-74.1392094720653,-74.1391221455991,-74.1390826685501,-74.1390591908738,-74.1390666913549,-74.139007249952,-74.1389663107242,-74.1389553685813,-74.1389149140473,-74.1389029151456,-74.1388922503264,-74.13883900359,-74.138839021337,-74.1388973366776,-74.1388757038836,-74.1388630956039,-74.1388135720421,-74.1387537487529,-74.1387481673031,-74.1387281244596,-74.1387459500122,-74.1388074727915,-74.1388283941223,-74.1390416557894,-74.1390505864382,-74.1390775065864,-74.1389511644535,-74.1388346058562,-74.1388032572411,-74.1388101931831,-74.1387890406868,-74.1387288051017,-74.138724315108,-74.1386543774743,-74.1386286421722,-74.1385438169607,-74.1385375337886,-74.1385386754694,-74.138598110509,-74.1385858115911,-74.1384415152368,-74.1384153583871,-74.1384231779986,-74.1384610259313,-74.1384960696307,-74.1385117433714,-74.1385228670692,-74.1385856815562,-74.1386034038477,-74.1386297991656,-74.1386857614533,-74.1387080850497,-74.1387263623944,-74.1387489078357,-74.1387662448573,-74.1387854116191,-74.1387971330171,-74.1388232546166,-74.1385399626833,-74.1385207723835,-74.1385234727591,-74.1384611529644,-74.1384480911765,-74.1384487663985,-74.1384743101221,-74.1384618395166,-74.1383777302258,-74.1383564588628,-74.1382983348389,-74.1382659207828,-74.1382066726707,-74.1382055862372,-74.1382930544063,-74.1382796445606,-74.138150686211,-74.1383653128652,-74.1384180179557,-74.1384392933049,-74.1384560524148,-74.1384659577477,-74.1385264974458,-74.1385074375195,-74.1385074357489,-74.1384481932546,-74.1384414872676,-74.1384112119993,-74.1384827478185,-74.1384467162899,-74.1383749174478,-74.1383415128872,-74.1385228283524,-74.1385559775708,-74.1384597196787,-74.1384928086554,-74.1385900530628,-74.1386203303137,-74.1385331454255,-74.1387295920718,-74.1388170234484,-74.1390334816122,-74.1390816750737,-74.1391016603784,-74.1391557062022,-74.1391857860319,-74.1392274114775,-74.1392807657693,-74.1393037714436,-74.1393113600942,-74.1393171794194,-74.1394234983264,-74.1394530007924,-74.1394582610717,-74.1394706125482,-74.1395334575353,-74.1395697169857,-74.139836977862,-74.138946327733,-74.1389104138615,-74.1387063239728,-74.1389063653945,-74.1389303781806,-74.1387714022684,-74.1388606107824,-74.1390367192296,-74.1390607329629,-74.1389444737817,-74.1389959210228,-74.138983556086,-74.1390255321564,-74.1396764048069,-74.1398649649508,-74.1398889740626,-74.1397035069418,-74.1398652726445,-74.1400411597063,-74.1399938355915,-74.1400128383593,-74.1400531071707,-74.1403107801387,-74.1403590481794,-74.1403857307362,-74.140417653353,-74.1403954453647,-74.1404605465627,-74.1403086580595,-74.1403294518924,-74.140328486945,-74.1403143311892,-74.1402968135332,-74.1402481747275,-74.1402349117956,-74.1402849149242,-74.1402845810487,-74.1402435066555,-74.1402146168789,-74.1401994549969,-74.1401481306896,-74.1401237224228,-74.1400820974482,-74.1400597053837,-74.1400123251471,-74.140002816377,-74.1399456670363,-74.1398928355638,-74.1398640229818,-74.1398230015271,-74.1397835972965,-74.1397475759366,-74.1397018303631,-74.1396943683802,-74.1394343803689,-74.1393499484191,-74.1392418163462,-74.1392199348589,-74.1392398700021,-74.1392662024225,-74.1392976032395,-74.1394081007749,-74.1394335677836,-74.1393844546519,-74.1393850803355,-74.1394248599056,-74.1394517752989,-74.1394779108185,-74.1394889321991,-74.1395469031382,-74.1395574303407,-74.1396172103362,-74.1396265230697,-74.1396822673311,-74.1396938075877,-74.1397485048107,-74.1397617742256,-74.1398181529452,-74.1398531321059,-74.1398843928231,-74.139914123457,-74.1399522746247,-74.1399655641107,-74.140020807982,-74.1400346596462,-74.1402264153127,-74.1402957194717,-74.1402093756951,-74.1402138440382,-74.140126382196,-74.1402873453912,-74.1402099773015,-74.1401968563254,-74.1401234502256,-74.1401109294879,-74.140036949704,-74.1400260673189,-74.1399503890821,-74.1399395295931,-74.139865047743,-74.1398541018355,-74.1397790278328,-74.1397692726916,-74.1396925037659,-74.1396821805463,-74.1396070989075,-74.1395962056269,-74.1395510241322,-74.1395102374656,-74.1394575344069,-74.1393871175655,-74.1393613280403,-74.1395368154802,-74.1395637247472,-74.1394787720568,-74.1395325973095,-74.1395604458975,-74.1396165251469,-74.1396291817578,-74.1397004841452,-74.1398717306776,-74.1398769801203,-74.1398943278236,-74.1399648500681,-74.1399847618294,-74.1400511078222,-74.1401472042111,-74.1402218880646,-74.1402334508699,-74.1403063425824,-74.1406271556695,-74.1405364876761,-74.1405232836345,-74.1404331722908,-74.1404217145911,-74.1403531925726,-74.1403189574444,-74.1402305954427,-74.1402202471597,-74.1401388731898,-74.1401169217058,-74.1400580003808,-74.1400158651296,-74.1399967396663,-74.1397558489045,-74.1396586048651,-74.1396316907417,-74.1398585989168,-74.1398855083912,-74.1397748477659,-74.1406461486982,-74.1408452030384,-74.1408723827923,-74.1410444264414,-74.141090698972,-74.1409666136991,-74.1409842195068,-74.1411054211201,-74.1412567340974,-74.1413242679425,-74.1412880791593,-74.1412833162767,-74.1403850059005,-74.1404050835934,-74.1404089750761,-74.1404377831108,-74.1404068533478,-74.1402867336948,-74.1401651003757,-74.1402809629197,-74.1403268363326,-74.1403352822975,-74.1403587418791,-74.1402072360658,-74.1402407304093,-74.1402863024433,-74.1404065630069,-74.1404811921024,-74.140430953861,-74.1404271920767,-74.1412093428835,-74.1413046198024,-74.1412971876655,-74.1413338750065,-74.1414107356041,-74.1410789211906,-74.1411614790294,-74.1410666361407,-74.1410843680481,-74.1411787955051,-74.141186931837,-74.1412951184685,-74.1413265310582,-74.1412282081443,-74.1411237594645,-74.1411431129907,-74.1412494936626,-74.1413354719298,-74.1413155442272,-74.1412861937638,-74.1412195802226,-74.1412501120361,-74.1411981178077,-74.1411865365783,-74.1411269185524,-74.1411143566795,-74.1410439934951,-74.1410303146288,-74.140953507469,-74.1409427941321,-74.1408591544129,-74.1408480146602,-74.1407599655757,-74.1407479289836,-74.1406579755258,-74.1406454973486,-74.1405689769331,-74.1405408621766,-74.1404637825669,-74.140412617325,-74.1404051034956,-74.140262904007,-74.1402951165258,-74.1404750371843,-74.1404958101131,-74.1405372971381,-74.1405784498144,-74.1405974111504,-74.1406282146711,-74.1406586485687,-74.1406799809315,-74.1407035302887,-74.1405947234336,-74.1406341728333,-74.1406191991196,-74.1407910422767,-74.1408209855653,-74.1408971857562,-74.1409910926802,-74.1410037561309,-74.1410154329907,-74.141110381509,-74.1412192420469,-74.1413432013884,-74.1413375849731,-74.141349013796,-74.1414615158544,-74.1412765750322,-74.1412944212369,-74.1414809747445,-74.1415310943973,-74.1413485469455,-74.1413633083768,-74.1415495790598,-74.1416491130329,-74.1417971995705,-74.1417725253279,-74.1408945109062,-74.1408870279018,-74.1408463314218,-74.1406609522099,-74.1406398417213,-74.14095816833,-74.1409804858693,-74.1408957868829,-74.1408947758341,-74.1418126777277,-74.141851928913,-74.1418730797193,-74.1416722624308,-74.1416923709882,-74.1417256964483,-74.1417603771746,-74.141811459477,-74.1418620810854,-74.1419107125197,-74.1419558844323,-74.1420382920603,-74.1420772433622,-74.1421052671333,-74.1421198139798,-74.142134677456,-74.142152671742,-74.1421683426095,-74.1421798108254,-74.1422071446211,-74.1422335491381,-74.1422449401418,-74.1422557582954,-74.1422573033014,-74.1422638016156,-74.1422709609045,-74.1422775702886,-74.1422835843889,-74.1422889674903,-74.1422929736676,-74.1422963224616,-74.1422989863035,-74.1423009433418,-74.1423021723809,-74.1423026676015,-74.1423024207737,-74.1423014350807,-74.142299720518,-74.1422974331687,-74.1422942338295,-74.1422901533955,-74.142285234167,-74.1422795263458,-74.1422730893579,-74.1422628937245,-74.1422532871972,-74.1422443058514,-74.1422359842281,-74.1422283505018,-74.1421892720889,-74.1421862311809,-74.1421840057632,-74.1421826077949,-74.1421820474816,-74.1421823260244,-74.1421834428668,-74.1421853913058,-74.1421881587051,-74.1421894647174,-74.1421915168819,-74.1421943086864,-74.1421978294436,-74.1422020653937,-74.1422069996969,-74.1422126130997,-74.1422188826151,-74.1422374015423,-74.1422420473591,-74.142247424173,-74.1422535208409,-74.1422603211703,-74.1422678113811,-74.1422759715399,-74.1423143853146,-74.1423176270807,-74.1423217499556,-74.1423267423735,-74.1423325923288,-74.142339285394,-74.142343506224,-74.1423470276568,-74.1423498146734,-74.1423518377538,-74.1423530783546,-74.1423535214562,-74.1423531667456,-74.1423520126031,-74.1423500765002,-74.1423244729782,-74.1423240877764,-74.1423244768684,-74.142325642308,-74.142327577351,-74.1423302781133,-74.1423337382978,-74.1423379443544,-74.1423428866883,-74.1423518133823,-74.1423615091497,-74.1423719525286,-74.142383120511,-74.1423949883431,-74.1424075332345,-74.1424166286494,-74.1424252486312,-74.1424333442687,-74.1424408664404,-74.1424477721831,-74.142454021165,-74.142459576142,-74.1424644068979,-74.1424684827766,-74.1424717825796,-74.142474282463,-74.1424759733085,-74.1424769228071,-74.1424771396287,-74.1424766223596,-74.1424753766066,-74.142473414127,-74.1424707550166,-74.1424674248611,-74.1424634578086,-74.1424588912874,-74.1424537721654,-74.1424465453577,-74.1424402279978,-74.1424348540059,-74.1424304509485,-74.1424270404606,-74.1424239201753,-74.1424199956322,-74.1424152809657,-74.1424097931572,-74.1424035531522,-74.1423965842932,-74.1423889092743,-74.1423805582456,-74.1423715637779,-74.1423605126077,-74.1423500904051,-74.1423403211545,-74.1423312292868,-74.142322834615,-74.1423151567419,-74.1423038948644,-74.1422918550031,-74.1422790563085,-74.1422655170535,-74.142251990225,-74.1422390501061,-74.142226712763,-74.142214993161,-74.142209330651,-74.1422044753351,-74.1422004448579,-74.1421972493989,-74.1421949013318,-74.1421934073192,-74.1421963826621,-74.1422002584717,-74.1422050205657,-74.142210651021,-74.1422171268755,-74.1422244236183,-74.1422403126868,-74.142260540763,-74.14227115485,-74.1422679383822,-74.1422640596368,-74.1422595439468,-74.1422544199476,-74.1422487191163,-74.1422424799543,-74.1422357400829,-74.1422261946584,-74.1422161018874,-74.1422054910173,-74.142194384483,-74.1421828053818,-74.1421707822984,-74.1421583438163,-74.1421367387072,-74.1421155289057,-74.1420947383713,-74.1420743908393,-74.1420666586712,-74.1420594666685,-74.1420528559647,-74.1420468626468,-74.1420415247836,-74.1420368705712,-74.142032925565,-74.1420297153256,-74.1420272588336,-74.1420255671603,-74.1420246509445,-74.1420250107977,-74.1420261167223,-74.1420279628964,-74.1420305338338,-74.1420338094375,-74.1420377630136,-74.1420423654518,-74.1420475773192,-74.1420533199621,-74.1420585082227,-74.1420630796289,-74.1420669739073,-74.1420701422171,-74.142072543628,-74.1420741501806,-74.1420749378643,-74.1420748993622,-74.1420674056883,-74.142059238979,-74.1420504128864,-74.1420409375537,-74.1420308266335,-74.1420200926767,-74.1420087497775,-74.1420014600035,-74.1419933905226,-74.1419845888643,-74.1419751056213,-74.1419649979698,-74.1419530996405,-74.14194144745,-74.1419300800708,-74.1419190381606,-74.1419083628128,-74.141905178021,-74.1419028165796,-74.1419012902253,-74.1419006087309,-74.1419007796708,-74.1419017978841,-74.1419036601825,-74.1419063545986,-74.1419087088378,-74.1419103404395,-74.1419112488061,-74.1419114274114,-74.1419108785163,-74.1419096017471,-74.1419076017762,-74.1419048824009,-74.1418992661718,-74.1418927602908,-74.1418853852731,-74.1418771699633,-74.1418681407949,-74.1418560509222,-74.1418432286935,-74.141829705789,-74.1418155075133,-74.1418097456629,-74.1418041589966,-74.1417988338566,-74.1417938552907,-74.1417893002303,-74.1417852379461,-74.1417817339772,-74.141778845324,-74.1417766138326,-74.141775074119,-74.14177425312,-74.1417741608571,-74.1417745828461,-74.1417757347006,-74.141777599875,-74.1417801484221,-74.141783344899,-74.1417871389231,-74.1417914761493,-74.1417962927772,-74.1418015148865,-74.1418070639425,-74.1418128587465,-74.1418188152345,-74.1418248412064,-74.1418308468454,-74.1418367449663,-74.1418424463789,-74.141849574525,-74.1418562281915,-74.141862348381,-74.1418678848933,-74.14187278885,-74.1418770170853,-74.1418805367691,-74.1418833124347,-74.1418853246515,-74.1418865535556,-74.1418869900384,-74.1418866300506,-74.1418866778648,-74.1418859580124,-74.1418844690196,-74.1418822195245,-74.1418792126679,-74.1418754605931,-74.1418709734659,-74.1418657658507,-74.1418589827459,-74.1418528874453,-74.1418474874538,-74.1418427922617,-74.1418388084981,-74.141835543235,-74.1418329998135,-74.1418323787521,-74.141832518549,-74.1418334217093,-74.1418350813001,-74.1418374901552,-74.1418406347515,-74.14184449782,-74.1418490636366,-74.1418543050503,-74.141860195569,-74.1418667047398,-74.1418738012359,-74.1418814475652,-74.1418896792612,-74.1419588983603,-74.1419842894971,-74.1420066635637,-74.1420045928259,-74.141981813544,-74.1419293290513,-74.141874586726,-74.1418258931128,-74.1417672134245,-74.1417415875669,-74.141728926513,-74.141736984962,-74.1417643319954,-74.1418878357749,-74.1420304581729,-74.1420989413994,-74.1421719510024,-74.1422193470573,-74.1422729651163,-74.1423035127585,-74.1422370026981,-74.1422563863939,-74.1423383157749,-74.1421518306091,-74.1417658779377,-74.14226513008,-74.1422492838908,-74.142208249259,-74.142213223178,-74.1418676229157,-74.1418378938827,-74.1422005257148,-74.142206652117,-74.1422299229476,-74.1421979471238,-74.1420789364411,-74.1421671801914,-74.1421475252518,-74.1421393773751,-74.1412186533555,-74.1411977050378,-74.1410673688248,-74.1410415791645,-74.1412032253678,-74.1412982547183,-74.1413207359166,-74.1412374249006,-74.1412411305159,-74.1421757693925,-74.1421624077917,-74.1421857484178,-74.1423896368971,-74.1415828769089,-74.1417341057238,-74.143051626138,-74.1438338568534,-74.1439151265721,-74.1439909709676,-74.1440610657712,-74.1441251113002,-74.1441828337391,-74.1442339863104,-74.1442783503291,-74.1442810860083,-74.1442965012326,-74.1443739905695,-74.1443887449075,-74.1445550732394,-74.1447406981358,-74.1447885097663,-74.1448892910995,-74.1450977156786,-74.1454337438297,-74.1455865445807,-74.1457353409081,-74.1458027725311,-74.1458547637556,-74.1460200828477,-74.1459498106447,-74.1459966961509,-74.146192474232,-74.1466964768539,-74.1470185317634,-74.1479432004613,-74.1485105181235,-74.148701589091,-74.1492173326397,-74.1497771748935,-74.1497782491362,-74.149718302903,-74.1497584648982,-74.1498063382385,-74.1498615444959,-74.1499236472845,-74.1499921557098,-74.1500165372708,-74.1501287989923,-74.1503004530457,-74.1502625151295,-74.1502424780305,-74.1502150610648,-74.1502678863653,-74.1502934762355,-74.1502789130223,-74.150315444394,-74.1504652407391,-74.1506955361828,-74.1510243472269,-74.1511039228103,-74.1511202569053,-74.1512500770393,-74.1514503586113,-74.1517579883162,-74.1517616998489,-74.1517644226165,-74.1517660749064,-74.1517666071321,-74.1517660033212,-74.1517642815949,-74.1517614936241,-74.1517577230783,-74.1517336092612,-74.15171021697,-74.1517023907076,-74.1516955352866,-74.1516898270363,-74.1516854127791,-74.1516824060544,-74.1516808841982,-74.1516808863538,-74.1516824124653,-74.1516854232789,-74.1516898413528,-74.1516955530488,-74.1517719199291,-74.1518533774449,-74.1518850288432,-74.151917979421,-74.1519513001553,-74.1519840515869,-74.1520153103075,-74.1520441949941,-74.1520685032794,-74.1520925680253,-74.1521158866009,-74.1521491673471,-74.1521806163944,-74.1522249361209,-74.1522729493926,-74.152323461553,-74.1523519720638,-74.1523885251543,-74.152423652256,-74.1524566093669,-74.1527708160401,-74.153289681867,-74.1534143069551,-74.1535087770206,-74.1536428715169,-74.1538317430854,-74.1540010766683,-74.1540081009582,-74.1539913543887,-74.1539025493866,-74.1538902523837,-74.1538983168261,-74.1539140261925,-74.1539424526646,-74.154095269167,-74.1541038153475,-74.1541182739415,-74.1541396143106,-74.15421587091,-74.1542925426001,-74.1543106878642,-74.1542860193601,-74.154267605261,-74.1542641335083,-74.1544981889385,-74.1545435689491,-74.154587002738,-74.1546149415534,-74.1546280787068,-74.1546449027018,-74.154697948992,-74.1544965236643,-74.1545435737446,-74.154928948494,-74.155046498919,-74.1551594972906,-74.1552676930732,-74.1553708463825,-74.1554687285176,-74.1555611224676,-74.1556478233932,-74.1554708552025,-74.1555035725126,-74.1557315343504,-74.1558637078412,-74.1559900032041,-74.1561101114859,-74.1562237388739,-74.1563306074144,-74.1564304556928,-74.1564486815002,-74.1561343743413,-74.1561873185234,-74.1566710520816,-74.156769179131,-74.1570186194639,-74.1572094846264,-74.1576097571092,-74.1578975357057,-74.158261031073,-74.1579488662245,-74.1579723945791,-74.1583264512699,-74.1584868712747,-74.1586405629104,-74.1586769630403,-74.1589018064882,-74.1591709240627,-74.1592831615918,-74.1593946054225,-74.1597013452021,-74.1598827705104,-74.159943678737,-74.1599934162541,-74.160011461602,-74.1600402239584,-74.1600555468368,-74.1600841922727,-74.1601306592996,-74.1601683936671,-74.1601935940524,-74.1602075174051,-74.1602258248754,-74.1602323185639,-74.1602571671364,-74.1602645075876,-74.1603042631384,-74.1603409737604,-74.1614641213904,-74.1615266651522,-74.1615462537772,-74.1615821742364,-74.1616474346922,-74.1616914131532,-74.161758815513,-74.1618274907331,-74.161897175874,-74.1619669783145,-74.162031175121,-74.1620663617327,-74.1620979686216,-74.1621439048381,-74.1622024479696,-74.1622257796204,-74.1622719610877,-74.1623303919198,-74.1623851256374,-74.1624403983034,-74.162506987289,-74.1625653612058,-74.1626319894437,-74.1626985531513,-74.1627628075159,-74.1628275785467,-74.1628952014166,-74.1629575060758,-74.1630173201183,-74.1630784953536,-74.1631260853713,-74.1631718120642,-74.1632265451311,-74.163285897986,-74.1633490917514,-74.1634086582535,-74.1634684903538,-74.163515959225,-74.1635640401489,-74.1636173829083,-74.1636730582785,-74.1637200159474,-74.1637890486374,-74.1638400880735,-74.1638862937316,-74.1639346428997,-74.1640126284717,-74.1640812281049,-74.1641591907777,-74.1642465201276,-74.1645396785121,-74.1649949200173,-74.1653067215738,-74.1655417511386,-74.1656435384182,-74.1660596182414,-74.1662403892162,-74.1665789678752,-74.1669046254078,-74.1675586747795,-74.1682956077942,-74.1683909100364,-74.1688443181989,-74.1689855713685,-74.169200668004,-74.1693513613477,-74.1694477174347,-74.1695529927632,-74.1696371449395,-74.1696796034277,-74.1698324896499,-74.1699971116147,-74.170072694894,-74.1701458605859,-74.1702249873314,-74.1703319375672,-74.1704077231625,-74.1705079166037,-74.1706048569997,-74.1706369257331,-74.1706604380607,-74.1708469488819,-74.1708994109652,-74.1709765805536,-74.1710880310484,-74.1711491599993,-74.1712868206729,-74.1713583289623,-74.171963361618,-74.1726966726301,-74.1727827109066,-74.1734263592897,-74.1750681074511,-74.1760124547907,-74.1776199213664,-74.1775997471967,-74.1775996944692,-74.1775805755356,-74.1775704157284,-74.1775501786415,-74.1775688185343,-74.1775829552211,-74.1775865413838,-74.1775902825326,-74.1775940836053,-74.1775978480174,-74.1776014801158,-74.1776048876094,-74.1776079839143,-74.1777192357539,-74.1777871892956,-74.178270812738,-74.1783187669066,-74.1783708290041,-74.1784255844891,-74.1784936298496,-74.1785603594698,-74.1786252593936,-74.1787024096099,-74.1787812820957,-74.1788611417559,-74.1789412442945,-74.1790208431516,-74.1790991964618,-74.1791755739694,-74.1791799693001,-74.1791856464765,-74.1791924374071,-74.1792001410245,-74.1792085292384,-74.1792173536889,-74.1792263530999,-74.1792352610151,-74.1792438136874,-74.1792517578875,-74.1792588584019,-74.179264904997,-74.1792697186436,-74.1792731568179,-74.1792977324759,-74.1793230341673,-74.17935437769,-74.1793913755334,-74.1794335702766,-74.1794371660199,-74.1794651674372,-74.1797077029207,-74.1798101694893,-74.1799933878635,-74.1801035094662,-74.1802422811957,-74.1803392618544,-74.1805045748491,-74.1806538541483,-74.1808915887945,-74.1810519274683,-74.1811654866347,-74.1814789842872,-74.1818200684788,-74.1818943444168,-74.181921553696,-74.1819566713462,-74.1820408128408,-74.1821336206489,-74.182434614175,-74.1828826819165,-74.1831685505845,-74.1833234677978,-74.1833677961302,-74.1834237058341,-74.1838130349663,-74.184036962428,-74.1841732275698,-74.1842854831701,-74.1848311647976,-74.18516290371,-74.1854614088712,-74.1858873016409,-74.1865673319121,-74.1876196413375,-74.1878073273764,-74.1879892297976,-74.188165194138,-74.1883350709814,-74.1884987160854,-74.1886559905034,-74.1888067607031,-74.1889508986794,-74.1890614099309,-74.1891673811421,-74.1892687555733,-74.1888461438681,-74.1888440421474,-74.1888423047587,-74.1888409826161,-74.1888401144651,-74.1888397257468,-74.1888398278525,-74.18884041779,-74.1888414782712,-74.1888429782185,-74.1888448736759,-74.1888471090971,-74.1888496189729,-74.1888523297514,-74.1888551619932,-74.1888580326995,-74.1894093308204,-74.189450739747,-74.1894948529025,-74.1895404387342,-74.1895862245739,-74.1896309321696,-74.1896733133725,-74.189712184984,-74.1915809030147,-74.1916204737185,-74.1916686351526,-74.1917250268369,-74.1917892266977,-74.1918607542278,-74.1919390740823,-74.1920236000862,-74.1921136996209,-74.1922086983595,-74.192799963814,-74.1928156738428,-74.1931659556441,-74.1933080731872,-74.1934431834744,-74.1935710900063,-74.1936916067663,-74.1938045584914,-74.1939097809266,-74.1940071210637,-74.1940964373637,-74.1952133999907,-74.1959348560981,-74.1960308768679,-74.1961269306449,-74.1962224082411,-74.1963167041221,-74.1964092202473,-74.1964993698621,-74.1965865812193,-74.1967023697331,-74.1968133887229,-74.1969191830281,-74.1970193189038,-74.1972539980279,-74.1974831421117,-74.1977065735328,-74.1977915453048,-74.1978824520969,-74.1979789235048,-74.1980805664466,-74.1981814404798,-74.1982866801963,-74.1983958922196,-74.1984996773164,-74.1986083170499,-74.1987213206051,-74.1988381774482,-74.1989583596335,-74.1990813241889,-74.1992065155691,-74.1993333681666,-74.1994613088668,-74.1994923997767,-74.1995244739947,-74.1995567375451,-74.1995883917653,-74.1996186530759,-74.1996467723775,-74.1996720535937,-74.199693870902,-74.1997116842251,-74.1997710447361,-74.1998237174284,-74.1998690772684,-74.1999065859931,-74.1999357984984,-74.1999563681213,-74.1999680507544,-74.1999707077438,-74.1999643075351,-74.1999489260498,-74.1999426916604,-74.1999442106262,-74.1999534483213,-74.1999701940979,-74.1999940660883,-74.2000245199122,-74.2000501593101,-74.20006802266,-74.2000779248485,-74.2000797632515,-74.2000735187982,-74.2000592561698,-74.20003712313,-74.1999296094449,-74.1999024792595,-74.1989257279387,-74.198957974612,-74.1990730709549,-74.1991872469476,-74.1992544893992,-74.1992860307516,-74.1993612740788,-74.199438223551,-74.1995157502401,-74.1995927167488,-74.1996679938991,-74.1997075319591,-74.1997459515191,-74.1998140831403,-74.1998846562205,-74.1999565998814,-74.2000288224486,-74.2001002280157,-74.2001852001867,-74.2002730485091,-74.2003632241255,-74.2004551636361,-74.2005482926195,-74.2006420292218,-74.2007357877921,-74.2008289825424,-74.2009773805587,-74.2012423234314,-74.2026808110234,-74.2032300331207,-74.2039166855279,-74.2041974636685,-74.2044774626474,-74.2046446630922,-74.2046701067149,-74.2047020342323,-74.2047426293845,-74.2047973790682,-74.2048531733814,-74.2049096658699,-74.2051961350977,-74.2052509043924,-74.2053053218315,-74.2053586899099,-74.2075686699832,-74.2077840491888,-74.2079958384085,-74.2082037057757,-74.2084073255726,-74.2086063787409,-74.2088005533821,-74.2089895452463,-74.2091730582089,-74.2093508047349,-74.2095225063295,-74.2096878939744,-74.209277766522,-74.2092212241766,-74.209189968252,-74.209322004642,-74.2093583773562,-74.2093018345794,-74.2097137420588,-74.2098533812855,-74.2099930965332,-74.210134660336,-74.2102697002434,-74.210398036021,-74.2105194963871,-74.2106339192421,-74.2107411518841,-74.2108410512128,-74.2109334839203,-74.2110183266687,-74.211095466255,-74.2111064976277,-74.2111198592798,-74.2111408668886,-74.2111652490544,-74.2111925033261,-74.2112220680678,-74.2112471378024,-74.2112702601689,-74.2112909292144,-74.2113086926695,-74.2113231618443,-74.2113394556123,-74.2113566629597,-74.2113715574167,-74.2113883208903,-74.2114965088055,-74.2115985998612,-74.2116944383744,-74.2117838782008,-74.2117883227622,-74.2117948024028,-74.2118034799095,-74.2118146692043,-74.211819320854,-74.2118169404581,-74.2118131463351,-74.2117947880251,-74.2117844061872,-74.2117847784607,-74.21179183198,-74.2118044751174,-74.2118293511967,-74.2118495249945,-74.2118620610049,-74.2118724325809,-74.2118827557614,-74.211892724218,-74.2119020421485,-74.2119104330541,-74.2119868247556,-74.2120572830471,-74.2121214688054,-74.2121790731023,-74.2122298186913,-74.2122734613416,-74.2122664549997,-74.2122612179734,-74.2122579031508,-74.2122566073031,-74.2122573682604,-74.2122601638064,-74.2122649123281,-74.2122714751975,-74.2122796608196,-74.2122892302252,-74.2122999040476,-74.2123113706781,-74.2123232953635,-74.2123353299782,-74.2123471231873,-74.2123593518628,-74.2123714471938,-74.212383097428,-74.2123940022854,-74.2124038806978,-74.2124124780536,-74.2124195727599,-74.2124249819541,-74.2124691096852,-74.2125214504811,-74.2125815581687,-74.2126042925506,-74.2126319137639,-74.2126639360668,-74.2128140336436,-74.2129603391751,-74.2129976722794,-74.2130397063935,-74.2130860894128,-74.2131364328057,-74.2132229856602,-74.2133048157586,-74.2133816997362,-74.2134534277324,-74.2135198039636,-74.2135269208752,-74.2135320636739,-74.2135350941804,-74.2135359309698,-74.2135345515597,-74.213530993014,-74.2135179402934,-74.2135135996397,-74.2135181001989,-74.2135313080367,-74.2135586929415,-74.2135845459427,-74.2136082860393,-74.2136293797135,-74.2136473529202,-74.213751712362,-74.2138077855147,-74.2138309431717,-74.2138553384754,-74.213880317884,-74.2139052122079,-74.2139293545365,-74.2143425012972,-74.2145052736095,-74.2146634888394,-74.2148168795194,-74.2149651863416,-74.2151081585963,-74.2152455545961,-74.2153771420838,-74.2155210259931,-74.2156583741019,-74.2157889225522,-74.2159124205547,-74.2160286308701,-74.2161373302652,-74.2162383099411,-74.2163313759347,-74.2164163494906,-74.2173545344275,-74.2174097577808,-74.2175185365031,-74.2175264844758,-74.2175362057039,-74.2175475509568,-74.2175640128425,-74.2175824016435,-74.2176022630016,-74.2176231061741,-74.2176447374611,-74.2176662990698,-74.2176872421387,-74.2177070335513,-74.2177251695065,-74.2177411883435,-74.2177920071116,-74.2178438051409,-74.2178954222846,-74.2179457024478,-74.217993519481,-74.2180378024052,-74.2180775593984,-74.2181119000112,-74.2181431786796,-74.2181764843791,-74.2182299748596,-74.2182869203572,-74.2183465805589,-74.218408179861,-74.2186133212829,-74.2188160935154,-74.2190162409393,-74.2192135112463,-74.2194076557571,-74.2195984297351,-74.2196832114636,-74.2197701641712,-74.2198587726487,-74.2199485118778,-74.2200388501409,-74.2201292521715,-74.2202191823253,-74.2203227695365,-74.2204276251281,-74.2205330717296,-74.2206384281524,-74.2207430137902,-74.220846153017,-74.2209471795517,-74.2210454407631,-74.2211213338563,-74.2211968090267,-74.2212711050549,-74.2213434726154,-74.2214131818338,-74.2214795296489,-74.2215404818999,-74.2216040753143,-74.2216627154293,-74.2217222375347,-74.2217820215153,-74.2218414445281,-74.221939076959,-74.2219950025788,-74.2220532290661,-74.2221126269591,-74.2221720440724,-74.2222303278478,-74.2222863477123,-74.2223390170093,-74.2223676625078,-74.2223998766726,-74.2224348308833,-74.2224716260416,-74.2225093156969,-74.2225469303908,-74.2225782450258,-74.2226103663468,-74.2226481858619,-74.2226865132473,-74.2227210401842,-74.2227555011132,-74.2228336896027,-74.2229106203597,-74.2229855590458,-74.2230465785226,-74.223105070806,-74.2231597129541,-74.2232092691086,-74.2232526184467,-74.2232743418426,-74.2233000725146,-74.2233291655852,-74.2233608919084,-74.2233944563438,-74.2234290176843,-74.2235120988358,-74.2235953298102,-74.2236781218466,-74.2237598892896,-74.2238400537323,-74.2239180481081,-74.2239933207026,-74.2241009857825,-74.2242121725971,-74.2243267067723,-74.2244444086865,-74.224756315054,-74.2248115505803,-74.2248716718424,-74.2249356331322,-74.2250023219543,-74.2250705783751,-74.2251392151967,-74.2252070386055,-74.2252728689349,-74.225487896769,-74.2257006466115,-74.2259109267258,-74.2261185475994,-74.2262369002877,-74.2263595604079,-74.2264860167511,-74.2266157422837,-74.226748196344,-74.2268828268962,-74.2270190728311,-74.227156366306,-74.2272941351108,-74.2274318050542,-74.227568802357,-74.2276942517113,-74.2278211025843,-74.2279487799773,-74.2280767051459,-74.2282042982228,-74.2282213834966,-74.2282366809369,-74.2282520673362,-74.2282675027534,-74.2282829459344,-74.2282983580354,-74.2283136951541,-74.2283289215001,-74.2283443424342,-74.2283599010297,-74.2283755669847,-74.2283913014476,-74.228407070604,-74.2284228362744,-74.2284385657472,-74.2284938457048,-74.2285494278077,-74.2286052868356,-74.2287364062092,-74.2287777092498,-74.228818937087,-74.2288600651486,-74.2289010679784,-74.2289520575636,-74.2290032537433,-74.2290546330555,-74.2290759103973,-74.2290971179797,-74.2291182279393,-74.2291392181128,-74.2291600617395,-74.2291807309597,-74.2292012018696,-74.2292214494668,-74.229241446339,-74.2292703849778,-74.229299523384,-74.2293288334679,-74.2293582930866,-74.2293878728434,-74.2294175516761,-74.2294213819878,-74.2294384115576,-74.2294552871692,-74.2294974050212,-74.2295393637853,-74.229581143268,-74.2296102216364,-74.2296393921326,-74.2296686178942,-74.229684458175,-74.2297002119538,-74.2297158423707,-74.2297313134496,-74.2297465881203,-74.2297954659519,-74.2298440671971,-74.2298923852785,-74.2299153620445,-74.2299387087545,-74.2299623909907,-74.2299863756456,-74.2301602913138,-74.2301787340639,-74.2301969411927,-74.2302148848441,-74.2302325360823,-74.2302498690442,-74.2302668572034,-74.2302834709696,-74.2302996869051,-74.2303068645294,-74.2303144167313,-74.2303222817067,-74.2303303993764,-74.2303326562515,-74.2303366315678,-74.2303360734208,-74.2303328539762,-74.2303274394503,-74.2303298941554,-74.2303335822622,-74.2303389250018,-74.2303430464309,-74.2303471844981,-74.2303542283421,-74.2303628392934,-74.2303658228657,-74.2303805628857,-74.2303842677215,-74.2303894844166,-74.2303939032026,-74.2304017685484,-74.2304102463541,-74.230419290636,-74.2304288508023,-74.2304388699183,-74.2304492921526,-74.2304600572945,-74.2304752718761,-74.2304907181546,-74.2305063557174,-74.2305221446015,-74.2305380448389,-74.2305540178014,-74.2305700202341,-74.2305860097911,-74.2306160641473,-74.2306460493301,-74.2306759449317,-74.2307057331863,-74.2307353934625,-74.2307649077854,-74.2307942574984,-74.2308234208933,-74.2308485121185,-74.2308523804172,-74.2308811202911,-74.2309533108145,-74.2311449495875,-74.2311805719308,-74.2312035396864,-74.2312232711202,-74.2312246922924,-74.2312335769277,-74.2312444324419,-74.2315487998119,-74.2318493571725,-74.2321458762227,-74.2324381317325,-74.2327259017144,-74.233008967592,-74.2330474416912,-74.2331442461824,-74.2332104963622,-74.2335990411974,-74.2344137827854,-74.2349457770194,-74.2350136083593,-74.2350809179298,-74.2351739594293,-74.2352649594805,-74.235353341166,-74.2354385441698,-74.2355200283308,-74.2355972770666,-74.2356626910522,-74.235731575408,-74.2358034265234,-74.2358777191002,-74.2359539099924,-74.2361053655781,-74.236252451358,-74.2363513066114,-74.2364278402264,-74.2364725698873,-74.2365298183211,-74.2366196366983,-74.2367060628852,-74.2367884562405,-74.2368662060195,-74.2369387359019,-74.237005508264,-74.237066028164,-74.2371840759894,-74.2372966753226,-74.2374036202323,-74.2375047151324,-74.2375997751396,-74.2376886264117,-74.2376677035993,-74.2377480524737,-74.2377714600998,-74.2378198277798,-74.2378684094721,-74.2379286357946,-74.2379873737906,-74.2380436396549,-74.2380964909903,-74.238441049034,-74.2385132163553,-74.2389515070693,-74.2394402430258,-74.239668450413,-74.2397123757566,-74.2397628957089,-74.2398191372131,-74.2398485123682,-74.2398801727993,-74.2399133551013,-74.2399472591742,-74.2399810675151,-74.2400139649291,-74.2400451581855,-74.2400738951437,-74.2401302307609,-74.2401897211127,-74.2402511280145,-74.2403131733902,-74.2403745658747,-74.2404607227861,-74.2405481496858,-74.2406361400522,-74.2407239828109,-74.2408109680801,-74.2408590548483,-74.2409086640414,-74.2409589539855,-74.2410090714564,-74.2410581661563,-74.2411054051405,-74.2412351082125,-74.2413652297601,-74.2414951169444,-74.2416241181027,-74.2417515860185,-74.241876881169,-74.2419993749348,-74.2420664185161,-74.2421337409193,-74.2422007032813,-74.2422666701553,-74.2423310155406,-74.2424166830076,-74.2425056345687,-74.2425970696254,-74.2426901652246,-74.2427840834661,-74.2428779790449,-74.2429710068598,-74.2431168553781,-74.2432637817685,-74.2434114690993,-74.2435595987979,-74.2437078513377,-74.2438559069275,-74.243974815743,-74.2440936150123,-74.2442115778588,-74.2443279825243,-74.2444421167859,-74.2445532823144,-74.2446607989474,-74.2447640088514,-74.2449516297375,-74.2451352257519,-74.2453145571668,-74.2454893898262,-74.2456594954518,-74.2458246519407,-74.2459070323559,-74.246033007977,-74.2461658925644,-74.246305421237,-74.2464513158762,-74.2466032856798,-74.246761027742,-74.2469662671495,-74.2471712538789,-74.2473756040992,-74.2475789351704,-74.24778086636,-74.2479810195556,-74.2481790199721,-74.248374496854,-74.2485670841685,-74.2487564212912,-74.2489421536807,-74.2491239335425,-74.2493014204802,-74.2494742821321,-74.2496421947941,-74.2497171770668,-74.249925535982,-74.2499909309134,-74.2501192957722,-74.2502067630047,-74.2503270675016,-74.2505071514244,-74.2506831179459,-74.2508548942225,-74.2508610850957,-74.2509006651923,-74.2509333388545,-74.2509588814226,-74.2509771172632,-74.2509879209774,-74.2509912182631,-74.2509869864273,-74.2509881338782,-74.2510034623457,-74.2510279779859,-74.2510615764837,-74.251104114858,-74.2511677324562,-74.2512365220158,-74.2513101556005,-74.2513882821775,-74.251470529292,-74.2515565048421,-74.2517294986342,-74.2519121054223,-74.2520003455448,-74.252074841391,-74.2520838090742,-74.2522536098982,-74.2524256499883,-74.2525998273998,-74.2527076123073,-74.2528101183997,-74.2529070268642,-74.2529980362936,-74.2530828636237,-74.2531612450135,-74.2532329366664,-74.2532977155883,-74.2533553802815,-74.2534057513717,-74.253448672166,-74.2535774576177,-74.253703417368,-74.2537429142345,-74.253790457716,-74.2538459062065,-74.2539090945462,-74.2539798345135,-74.2540579153851,-74.2541431045636,-74.2542351482701,-74.2542740765672,-74.254720276116,-74.2552340893497,-74.255279472083,-74.2553157308447,-74.2553427472319,-74.2553604330081,-74.2553687303919,-74.255358505049,-74.255330046082,-74.2553071037762,-74.2553253287078,-74.2553525261439,-74.2553795022521,-74.2554117241756,-74.255449158497,-74.2554917663877,-74.2555275063789,-74.2555570546528,-74.2555776815867,-74.2555891599136,-74.2555913631521,-74.2555718022384,-74.2555318585476,-74.2555291316082,-74.2554527293791,-74.2552481775317,-74.2550429371597,-74.2548988820703,-74.2546285670991,-74.2547027248385,-74.2547310475766,-74.2549018717664,-74.2549041226039,-74.2549813000949,-74.2549729037077,-74.2548963650734,-74.2548996177544,-74.2547152381856,-74.2546841498808,-74.2546185072802,-74.2544871166484,-74.2543454321541,-74.2541200083633,-74.254100106239,-74.2540499811001,-74.2540379191157,-74.2540282148799,-74.2540116272635,-74.2539975307934,-74.2539859254997,-74.2539768114079,-74.2541112131857,-74.2540380456785,-74.2543071301246,-74.2543487444013,-74.2543887773702,-74.2543145416931,-74.2542817708006,-74.2542908355701,-74.2540206950553,-74.2538916993927,-74.2537335511525,-74.2536891188106,-74.2537053550855,-74.2536760469523,-74.253693398375,-74.2541332493149,-74.2543325654762,-74.2543493712604,-74.2545681551288,-74.2546233620281,-74.2546465126291,-74.2545262173243,-74.2545003878926,-74.254553336373,-74.2541246246756,-74.2536681037926,-74.2536639382743,-74.2536481251826,-74.2536071125547,-74.2535029786814,-74.2534783588696,-74.2533157980513,-74.2532441155391,-74.253192615033,-74.2531498424314,-74.2531273084317,-74.2530639455309,-74.2532600826831,-74.2532580688567,-74.2530627481103,-74.2530377993435,-74.2530084727755,-74.2530203792397,-74.2530819503437,-74.2531802039699,-74.2534335044842,-74.2534860296363,-74.253493005716,-74.2534590765935,-74.2534874070102,-74.2535239695037,-74.2535319502287,-74.2534951778508,-74.2535268507671,-74.253502112522,-74.2531715192468,-74.2530928696424,-74.2530619950523,-74.2530363538155,-74.2530320796236,-74.2530000872132,-74.2529971390104,-74.2529994082116,-74.2530068453473,-74.2530192882703,-74.2530364656908,-74.2530580030906,-74.2530764161371,-74.2530903675943,-74.2530998452821,-74.2531045661135,-74.2531043890805,-74.2530993194659,-74.2530895086866,-74.2530752497713,-74.2524327066728,-74.252165701871,-74.2519519748847,-74.2519293126906,-74.2519946799881,-74.2520895529462,-74.25214378895,-74.2521259139706,-74.2517918647828,-74.2517859200256,-74.2517558319888,-74.251723467407,-74.2516804893075,-74.2516345376171,-74.251585923665,-74.2515354692339,-74.2514897816228,-74.2514493247613,-74.2514145094673,-74.2513856892752,-74.2513838388142,-74.251379512511,-74.2513728394958,-74.2513640189434,-74.2513533141287,-74.251341044568,-74.2513275764828,-74.2513133118681,-74.2512986764943,-74.2512841071978,-74.2512700388432,-74.2511852835102,-74.2511033407768,-74.2510247540684,-74.2509500445562,-74.2508797077018,-74.2507566808428,-74.2506826658665,-74.2506119306635,-74.2505450049674,-74.2504823899852,-74.2504245546436,-74.2503719320777,-74.2503675748727,-74.2503606500959,-74.2503513152432,-74.2503397826254,-74.2503263145402,-74.2503112173058,-74.2502948342942,-74.250255030142,-74.2502207310143,-74.2501926244717,-74.25011171057,-74.2500615339114,-74.2500756883247,-74.2501788058399,-74.2501708666371,-74.2502808361239,-74.2502741615749,-74.250285675205,-74.2502933063894,-74.2505552641356,-74.2504550992383,-74.2501960157145,-74.2502751830964,-74.250261753471,-74.2502522096782,-74.2501562651677,-74.24988824875,-74.2504762730612,-74.2505350704566,-74.2505600727201,-74.2504153592139,-74.2503948747817,-74.2504513932562,-74.2498437459406,-74.249356609239,-74.2492773432396,-74.2493572627288,-74.2493377524369,-74.2492561503189,-74.249215286761,-74.2495248092737,-74.2496322010924,-74.2496227030045,-74.2495004712373,-74.2495330306043,-74.2495139367868,-74.2499415880804,-74.2498986190374,-74.2494822975976,-74.2494642033826,-74.2494309689909,-74.2490558650878,-74.2490305596249,-74.2486476463211,-74.248715836413,-74.2487067981853,-74.2488432366461,-74.248829666094,-74.2486818927435,-74.2486246694039,-74.2487595831515,-74.2487369563467,-74.2485458929168,-74.248550133631,-74.248512456013,-74.2485749638382,-74.2486008082305,-74.2482842208389,-74.2489462466561,-74.2493781403809,-74.249407707891,-74.2485144905604,-74.248487203267,-74.2489191065305,-74.2482217169458,-74.2475181183553,-74.2469304800848,-74.2468714783545,-74.246594999352,-74.2464403965114,-74.246125608767,-74.2461246219707,-74.2461285767929,-74.2461366705125,-74.2461474809529,-74.2461599320057,-74.2461746405067,-74.2461829824629,-74.2462354960649,-74.2462528628355,-74.2463008510686,-74.2465299241723,-74.2465987343713,-74.2467499719407,-74.246593392362,-74.2465104026768,-74.2466976942679,-74.2466932357773,-74.2467070672106,-74.2467103390456,-74.2469955699659,-74.2469689277689,-74.2466825860255,-74.246695276209,-74.24668162674,-74.2466652168927,-74.2464789970533,-74.2464439138661,-74.2464237395008,-74.2463773643563,-74.2465643992026,-74.2465368283426,-74.2463496980177,-74.2459817688652,-74.2459527699214,-74.2452086152836,-74.2456698900138,-74.2455993874938,-74.2457127669422,-74.24566427146,-74.2456347316995,-74.2455687984226,-74.2455658738584,-74.2455266715401,-74.2454905567098,-74.2453707849363,-74.2453056843134,-74.2452456049424,-74.2451979221515,-74.2450880446054,-74.2449277566778,-74.2448608805258,-74.2447739994527,-74.2446920008419,-74.2446005452964,-74.2445129261746,-74.2444081239548,-74.2443175109761,-74.2442983521761,-74.244193186438,-74.2439995737616,-74.2438212660942,-74.243652285116,-74.2430194647866,-74.2428233742268,-74.2426371194286,-74.2423247783328,-74.2420912312278,-74.2418696458423,-74.2412596867522,-74.241090759216,-74.2410312291872,-74.2408696198014,-74.2407592863767,-74.2405964580786,-74.240490696877,-74.2403956006752,-74.240244337913,-74.2401880289655,-74.2400965083314,-74.239916123958,-74.2398497761881,-74.2398351231082,-74.2398225831696,-74.2399182071525,-74.239919182413,-74.2400314206172,-74.240333808136,-74.2405558430752,-74.2407328454876,-74.2408465963771,-74.2409397790787,-74.2409219219437,-74.2409737789022,-74.241172935522,-74.2412192461465,-74.2412395676566,-74.2413321957552,-74.2413837903956,-74.2415721732834,-74.2418906572721,-74.2429323503633,-74.2429053428242,-74.2428989451509,-74.2428110550662,-74.2425954289643,-74.2425837563927,-74.2425908252118,-74.2426426604603,-74.2427080622872,-74.242714698633,-74.2427321595413,-74.2427624678372,-74.2427484903932,-74.242692273727,-74.2426548781215,-74.2426234553968,-74.2426212927106,-74.2426139783843,-74.2426166693986,-74.2426579383822,-74.2426938333162,-74.2427106539166,-74.2427288635407,-74.242739576131,-74.2427535591874,-74.2427512240465,-74.2427402365314,-74.242744234157,-74.2427534582012,-74.2427623745006,-74.2427657586154,-74.2427651787903,-74.2427575681128,-74.2427589030104,-74.242764711474,-74.2427978436625,-74.242816736939,-74.242818346593,-74.2428164123671,-74.2428144907602,-74.2428088271665,-74.2428067828124,-74.2428065825145,-74.2428025219365,-74.2428015700958,-74.242813048835,-74.2428622700346,-74.2429056493349,-74.2429400141673,-74.2429898509025,-74.2430243234192,-74.2430399030754,-74.2430807255026,-74.2431129397074,-74.2431752459305,-74.2432643670938,-74.2433009533232,-74.2433268788749,-74.2433579268568,-74.2433850451045,-74.2434076892373,-74.2434888239248,-74.2436079354575,-74.2439650075886,-74.2439676170694,-74.2439683583908,-74.2433388388386,-74.2430738951392,-74.2430510131855,-74.2430599177191,-74.243060193601,-74.2430518379124,-74.2430349382765,-74.24300967194,-74.2429763039152,-74.2429351842008,-74.2428867441113,-74.2428758456771,-74.2428794017542,-74.2428951506731,-74.2429286256467,-74.2429456376025,-74.2429479983287,-74.2429397117687,-74.2429098368302,-74.2428726178986,-74.2428574567957,-74.2428507654261,-74.2428422671204,-74.2428585620702,-74.2428872377435,-74.2428867138121,-74.2427612055676,-74.2427567585976,-74.2427021858181,-74.2426634595534,-74.2426421851728,-74.2426264072631,-74.2426125770198,-74.2426126787257,-74.2425936214811,-74.2425673230953,-74.2425506216696,-74.2425102899755,-74.2425091986698,-74.2425241625684,-74.2425350955649,-74.2425333215477,-74.2424993130418,-74.2424902351684,-74.2424840574474,-74.2424592642565,-74.242427813883,-74.2424200283784,-74.2424129392698,-74.2424198762823,-74.2424340210846,-74.242449565412,-74.2424558174114,-74.2424568439242,-74.2424554102524,-74.2424448920478,-74.2424205427977,-74.2423948955005,-74.2423754322075,-74.2423646431012,-74.242360583125,-74.2423369565593,-74.2423089235807,-74.2422836580587,-74.2422549073463,-74.2422111306344,-74.242197645364,-74.2421880176231,-74.2421804099388,-74.2421726016683,-74.2421725440045,-74.2421665692659,-74.2421676987588,-74.2421764118526,-74.2421893930521,-74.2422013157834,-74.2422283014056,-74.2422381043392,-74.2422456550831,-74.2422463725044,-74.2422452813732,-74.242234216558,-74.2420246491306,-74.2419910818515,-74.241940420909,-74.2419063466737,-74.2418671379308,-74.2418432069507,-74.2418292001307,-74.2418177216543,-74.2418070887561,-74.2417870231277,-74.2417670305463,-74.2417475434775,-74.2417285451407,-74.2417116046185,-74.241689360719,-74.2416811012402,-74.2416721867006,-74.2416572991303,-74.2416409703834,-74.2416241753438,-74.2416071574775,-74.2415960535109,-74.2415884124059,-74.241569160089,-74.2415492890359,-74.24153508696,-74.2415242727567,-74.241507333229,-74.2415024755319,-74.2415003265563,-74.2414996447622,-74.2415033943973,-74.2415059401506,-74.2415079178329,-74.2415079114565,-74.2415309233201,-74.2417192406669,-74.2416678421322,-74.2418106162153,-74.2421779966323,-74.2422820033816,-74.2422637891136,-74.2422460277608,-74.2422297257609,-74.2422053380652,-74.2421812723467,-74.2421597127004,-74.2421369184625,-74.2421194761951,-74.2420958972059,-74.2420704435515,-74.242052527956,-74.2420207437613,-74.242020060732,-74.2419977733681,-74.2419875715102,-74.2419767477285,-74.2419705278007,-74.2419645887046,-74.2419628595331,-74.2419650645094,-74.2419706166489,-74.2419864190501,-74.2419983514787,-74.2420132919138,-74.2420153829306,-74.2420117836351,-74.2420086716507,-74.2420031641497,-74.2420025400726,-74.2420003069947,-74.241996898444,-74.2419892099715,-74.2419908584443,-74.241993075881,-74.2419915502287,-74.2419899521689,-74.2419874913321,-74.2419901739893,-74.2419935494477,-74.241999603385,-74.242018011135,-74.2420235789525,-74.2420275948896,-74.242035086739,-74.242040562708,-74.2420457028601,-74.2420531820557,-74.2420650025183,-74.2420846657795,-74.2420975354873,-74.2421132321489,-74.2421245558554,-74.2421364386929,-74.2421464585447,-74.2421551372007,-74.2421658989142,-74.2421832546157,-74.2422115281905,-74.2422249409136,-74.2422449163343,-74.2422691365065,-74.2422870247734,-74.242306516928,-74.2423289138408,-74.242349300283,-74.2423585392059,-74.2423748617443,-74.2423880475389,-74.2424002687923,-74.2424182732257,-74.2424424252232,-74.2424742241645,-74.2425049423469,-74.2425312930964,-74.2425572374163,-74.2425803102056,-74.2425902260343,-74.2425955168685,-74.2426118404504,-74.2426328967562,-74.2426394849947,-74.2426411209488,-74.2426410794858,-74.2426402907303,-74.2426383836097,-74.242636364647,-74.2426336754027,-74.2426306493315,-74.2426289661799,-74.2426301545667,-74.2426360055353,-74.2426461402434,-74.2426543005016,-74.2426654034641,-74.2426793010274,-74.2426917073319,-74.2427042612402,-74.2427461488747,-74.2427543108195,-74.2427679882174,-74.2427788652709,-74.2427874713551,-74.2427968230464,-74.2428106811463,-74.2428234621743,-74.2428379963647,-74.2428506652579,-74.2428660920976,-74.2428758904254,-74.2428809552207,-74.2428838921917,-74.2428922317054,-74.2429001254382,-74.2429125730392,-74.2429260275361,-74.2429399256747,-74.2429557602023,-74.2429602652575,-74.2429592522849,-74.2429541420741,-74.2429473889565,-74.2429457804533,-74.2429487592942,-74.2429564118979,-74.2429684290388,-74.242981931381,-74.2429957104401,-74.2430255015692,-74.2430546734529,-74.2430726338237,-74.2430800374972,-74.2430866688536,-74.2430874458234,-74.2430881629084,-74.2430924736146,-74.243101516515,-74.2431152687786,-74.243134439671,-74.2431510113658,-74.2431724445371,-74.2431797234909,-74.2431930456904,-74.2432062415269,-74.2432176678038,-74.2432387884949,-74.2432533746218,-74.2432657306843,-74.2432887965426,-74.2433079959678,-74.2433167269081,-74.2433245938664,-74.2433296455406,-74.2433315674803,-74.243332873353,-74.2433338374263,-74.2433368466732,-74.2433554390665,-74.2433702175335,-74.2433877305729,-74.2434006491671,-74.2434088076486,-74.2434228734857,-74.24343286487,-74.2434519523223,-74.2434745312867,-74.2434914748865,-74.243509979365,-74.2435261639004,-74.2435445241721,-74.2435552260323,-74.2435706428835,-74.2435867016199,-74.2436060426295,-74.2436277699824,-74.2436366301592,-74.2436518912927,-74.2436652907174,-74.2436708768866,-74.2436790415025,-74.2436844430017,-74.2436967058746,-74.2437135918848,-74.2437336610108,-74.2437791545938,-74.2438114132269,-74.2438462434818,-74.2438668914013,-74.2438848724942,-74.2439101680879,-74.2439703025988,-74.2440008019766,-74.2440179491223,-74.2440372361235,-74.2440574707854,-74.2440743071522,-74.2440912992845,-74.244105232958,-74.2441065700621,-74.2441164373789,-74.2441249598849,-74.2441291704222,-74.2441274256644,-74.2441215439361,-74.2441085602413,-74.2440544742024,-74.2440347898134,-74.2440166727705,-74.2439974217068,-74.2439856689694,-74.2439810016812,-74.2439781094153,-74.2439765510658,-74.2439785395895,-74.2439790272007,-74.2439846719106,-74.2439978112266,-74.244010498483,-74.2440267636125,-74.2440454174463,-74.2440647284455,-74.244081739201,-74.244089369495,-74.244101769706,-74.2441114292603,-74.2441234626605,-74.244130494315,-74.244147825387,-74.2441639165067,-74.2442013532868,-74.2442213094155,-74.2442565192626,-74.2442870672058,-74.244324941055,-74.2443440001688,-74.2443854947255,-74.2444201876918,-74.244451681701,-74.2444820775425,-74.2445004747937,-74.2445180947902,-74.244554225154,-74.2445659943732,-74.2445875391072,-74.2446742323204,-74.2447035632394,-74.2447287561833,-74.2447501862577,-74.2447585949594,-74.2447709286853,-74.2447813434745,-74.2447863495393,-74.2447924245903,-74.2448009435216,-74.2448163601389,-74.2448285534017,-74.2448392777946,-74.24485718067,-74.2448864243409,-74.2449055505107,-74.2449198103863,-74.2449369311447,-74.2449556476098,-74.2449837012121,-74.2450042406165,-74.2450631106776,-74.2450866278506,-74.2451085251394,-74.2451371605196,-74.2451678287288,-74.2451719678184,-74.2451886282462,-74.2452139308518,-74.2452330138516,-74.2452471064904,-74.2452550633074,-74.2452983554065,-74.245320463995,-74.2453365117606,-74.2453423785573,-74.2453480746893,-74.2453523977035,-74.2453534215194,-74.2453588575299,-74.2453601430708,-74.2453595704844,-74.2453524512177,-74.2453410933465,-74.2452923119924,-74.245258711065,-74.2452394900789,-74.2452196022401,-74.2452053047094,-74.2451701810958,-74.2450843692602,-74.2449995566853,-74.2449807560409,-74.2449619248464,-74.244943004618,-74.2449240237111,-74.244906101693,-74.2448869697577,-74.2448418170095,-74.2448010457436,-74.2447872950513,-74.2447757799697,-74.2446810086538,-74.2445910098009,-74.2445864459826,-74.2445818819481,-74.2445684032992,-74.2445193481976,-74.2445048086586,-74.2444935368203,-74.2444890028919,-74.2444855276317,-74.2444668213694,-74.2444513491577,-74.2444391123205,-74.244431227809,-74.2444276960781,-74.2444274892203,-74.2444316646172,-74.2444402552428,-74.2444509610368,-74.2444600010806,-74.2444702508516,-74.2444765092851,-74.2444827661829,-74.244541839624,-74.2445651460675,-74.2446214966826,-74.2446448346039,-74.2446669641377,-74.2446742204043,-74.2446814760063,-74.2446824144433,-74.2446833513353,-74.2446842592107,-74.2446840780636,-74.2446804511073,-74.2446731699251,-74.2446611136106,-74.2446609632329,-74.2446597249355,-74.2446605116753,-74.2446671961374,-74.2446742090531,-74.2446844897087,-74.2446991231873,-74.2447181677526,-74.2447361857289,-74.2447585558708,-74.2447900465837,-74.2448560662819,-74.2449037764419,-74.2449329679343,-74.2449663401177,-74.2450167723644,-74.2451141989974,-74.2451591620807,-74.2452134465138,-74.2452566073174,-74.2453227668903,-74.2452971171052,-74.2452969950917,-74.2453077381704,-74.2453233614296,-74.2453481686853,-74.2453680983046,-74.2453850986478,-74.2453937621991,-74.2453974561007,-74.2454004798434,-74.2453847027209,-74.2453648427296,-74.245362950303,-74.2453790638141,-74.2454023234798,-74.2454048810826,-74.2454172398465,-74.2454232990037,-74.2454294717718,-74.2454325476109,-74.2454290807348,-74.2454256685194,-74.2454218831117,-74.245412767019,-74.2454296977673,-74.2454537872224,-74.2454764785426,-74.2455191032127,-74.2455925099258,-74.2456020569832,-74.2456077070552,-74.2456204793982,-74.2456385647627,-74.245680776278,-74.2457058938208,-74.2457307294372,-74.2457571498966,-74.2457838487959,-74.2458074166718,-74.2458236379357,-74.2458316931469,-74.2458450812153,-74.2459928479056,-74.2460474987923,-74.2460613718713,-74.246081527459,-74.246103138322,-74.2461476496422,-74.2461979748304,-74.2462141402734,-74.2462602701774,-74.2463209455191,-74.246356763494,-74.2464067714964,-74.2464666069475,-74.2464861481579,-74.2465138936479,-74.2465339196642,-74.2465748653085,-74.2465928758198,-74.2466222013665,-74.2466483706023,-74.2467619348106,-74.2467781542564,-74.2468625313222,-74.2476777803961,-74.2479224470968,-74.2480346373569,-74.2477055007221,-74.2476193746375,-74.2467107668221,-74.2461374376871,-74.2436380714494,-74.2436020272568,-74.2433664876997,-74.243402085638,-74.2433634655277,-74.2432987867762,-74.2433406330886,-74.2433503331024,-74.2435844765135,-74.242935859292,-74.2426654607375,-74.2423172680375,-74.2422980077531,-74.2422296126203,-74.2422031846325,-74.2421183077613,-74.2420496763575,-74.2419645976758,-74.2419029027681,-74.2418544332214,-74.241798505443,-74.2417211760694,-74.241693354481,-74.2416069188521,-74.2415096496595,-74.2414510754695,-74.2414025350411,-74.2413394483685,-74.2412802950916,-74.2412293679671,-74.241172751756,-74.241121134047,-74.2410726698807,-74.2410166706548,-74.2409742253416,-74.2409364265183,-74.2408673905927,-74.240827039079,-74.2407697713206,-74.2407236357914,-74.2406334137084,-74.2405763307283,-74.2404584755949,-74.2403918281006,-74.2403534157227,-74.2403130059052,-74.2402764411718,-74.2402373021857,-74.2402039240967,-74.2401253987944,-74.2400349130996,-74.2399828187916,-74.2399616716266,-74.2399407299478,-74.2399125332328,-74.239877537873,-74.2398437282875,-74.2398186419272,-74.2397913136389,-74.2397576447181,-74.2397006544121,-74.2396249662085,-74.2395931308525,-74.2395420884637,-74.2394995130994,-74.2394574635706,-74.2394274566773,-74.2393919575044,-74.2393408534097,-74.2393141463748,-74.239302732516,-74.239289072888,-74.2392675122024,-74.2392444806732,-74.2392227085428,-74.2391863343971,-74.2391500321938,-74.2391256369584,-74.2391019311523,-74.2390695043964,-74.2390229998338,-74.2388802047475,-74.2387688286098,-74.238706726485,-74.2386541448786,-74.2385872314847,-74.2385252684764,-74.2384724157821,-74.2384192245846,-74.2383719130423,-74.2383301218049,-74.2382810798592,-74.2382256235756,-74.2381488617792,-74.238100870985,-74.2380104531594,-74.2379484587302,-74.2379031000523,-74.2378119443384,-74.2378098017333,-74.237764720133,-74.2377115782049,-74.2376652976361,-74.2376196346733,-74.2375608091403,-74.2375171583826,-74.2374649628326,-74.2374067248125,-74.2373651746587,-74.2373191816265,-74.2372628389899,-74.2372261612756,-74.2371981195924,-74.2371711791323,-74.2371331359663,-74.237087557679,-74.2370364339828,-74.2369846741355,-74.2369319989532,-74.2368827811418,-74.2368179273547,-74.2367549307669,-74.236692554971,-74.2366297834716,-74.2366031556606,-74.2365457880099,-74.2365010401947,-74.2364583494724,-74.236414597268,-74.23639375851,-74.2363783743206,-74.236349703765,-74.2363192567089,-74.2362882513389,-74.2362780546759,-74.2362804765915,-74.2362845563475,-74.2362623847167,-74.2362394474028,-74.2362348629263,-74.2362131235959,-74.2362016897619,-74.2361890942824,-74.2361776128584,-74.2361706804036,-74.2361671357436,-74.2361647313612,-74.236165752554,-74.236170169762,-74.2361790470889,-74.2362117622877,-74.2362496289907,-74.2362925658643,-74.2363404806807,-74.2363877330321,-74.236428852992,-74.2364630279391,-74.2364895824954,-74.236507991874,-74.2365178922508,-74.2365190879553,-74.2365115553396,-74.2364954432463,-74.2364710700693,-74.2364389174623,-74.2363996208214,-74.2363539567293,-74.2348986580081,-74.2348845511625,-74.2348688701524,-74.234836374079,-74.2347870569584,-74.2347747234872,-74.2347601443951,-74.2347107919558,-74.2346906068464,-74.2346681857736,-74.2346581018198,-74.2346480208642,-74.2346043413092,-74.2345685074076,-74.2345606707498,-74.2345382833365,-74.2345304436817,-74.2345270841435,-74.2345237222681,-74.2345203597315,-74.2345169948563,-74.23451362932,-74.2345102637879,-74.2344911722998,-74.2344844388981,-74.2344260814209,-74.2343711045133,-74.2343509156733,-74.2343273711033,-74.2343015942301,-74.2342265094612,-74.2342052111753,-74.2341861506116,-74.2341502629073,-74.2341390404516,-74.2341345483756,-74.234131177532,-74.2341266824594,-74.2341233086257,-74.234112031649,-74.2341086548245,-74.2341052803304,-74.234079437684,-74.234027781708,-74.23398398868,-74.2339402089833,-74.2338953202698,-74.2338493210905,-74.2338268869672,-74.2338033357937,-74.2337775501176,-74.233749525506,-74.2336867633761,-74.233600480673,-74.2335646261153,-74.233535498012,-74.2335097394781,-74.2334862256431,-74.2334571193138,-74.2334291388676,-74.2334045209112,-74.2333810262875,-74.2333597754711,-74.233341884825,-74.2333240008032,-74.2333094786135,-74.2331855182814,-74.2329900763466,-74.2329554547687,-74.232915236113,-74.2328157969089,-74.2328102073451,-74.2328035001738,-74.2327889597489,-74.2327363721512,-74.232718473056,-74.2327028225037,-74.2326961146645,-74.2326916537147,-74.2326414342372,-74.232555531031,-74.2323959870613,-74.2322911293316,-74.2322665927849,-74.2322443060731,-74.2322231481769,-74.2322031167834,-74.2321842149747,-74.2321653263281,-74.2321464541539,-74.2321231550848,-74.2320998330062,-74.2320603723539,-74.2320026353048,-74.2319664823074,-74.231955448719,-74.2319553730415,-74.2319333144494,-74.2318870713614,-74.2318159763954,-74.2316830032451,-74.2315623258065,-74.2315006311882,-74.2313562024378,-74.2312179321108,-74.2311445614961,-74.2310694379242,-74.2309896185452,-74.230874727915,-74.2308400791119,-74.2307878104018,-74.2307551124586,-74.2307103619812,-74.2306557610154,-74.2306087628246,-74.2305551438645,-74.2305080463149,-74.2304597965684,-74.2304246984795,-74.2303447353474,-74.2302495215351,-74.2301751939204,-74.2300430646574,-74.2299262674491,-74.2297886241267,-74.2296804086392,-74.2296049689339,-74.2294714942974,-74.2293796342545,-74.2293195418571,-74.2292737490792,-74.2292487391849,-74.2292477939141,-74.2292522614386,-74.2292698646023,-74.2292835640624,-74.22929656578,-74.2293086435881,-74.2293195873909,-74.2293309992085,-74.229340201224,-74.2293469611662,-74.2293511084044,-74.2293525382555,-74.2293365613314,-74.2293132809132,-74.2292833387291,-74.2292475601453,-74.2292355876615,-74.2292225554966,-74.2292087843102,-74.2291946129461,-74.2291803900943,-74.2291664657122,-74.2291531824126,-74.2291408670347,-74.2291054163109,-74.2290903971221,-74.2290729956389,-74.2290763976549,-74.229083060942,-74.2290744340807,-74.2290516218764,-74.2289992681535,-74.228949058748,-74.2289010475268,-74.2288159888286,-74.2287242997478,-74.2286281403802,-74.2285450583171,-74.2284827455627,-74.228465250963,-74.228441220978,-74.2284128783488,-74.2283954556654,-74.2283692767811,-74.2283321437201,-74.228267637297,-74.2282129640223,-74.2281615499231,-74.2281079299899,-74.2280728553878,-74.2280453846809,-74.2280136069691,-74.227973125647,-74.2278330723504,-74.2277017305229,-74.2276327283441,-74.2275592821066,-74.2274368273053,-74.2272412433907,-74.2270825621751,-74.2269249779245,-74.2269023090319,-74.2268700682655,-74.2268383534212,-74.2267957140918,-74.2267694919016,-74.2267373147939,-74.2266734121505,-74.2266100107087,-74.2265794285045,-74.2265729934221,-74.2265370073045,-74.2264766116768,-74.2264049454295,-74.2263702081348,-74.2263320167536,-74.2261869214748,-74.226114204926,-74.2260685451071,-74.2239033413449,-74.2238642149809,-74.2234426510631,-74.2234721093353,-74.2237191044499,-74.2237574121032,-74.2237743837533,-74.2237860670896,-74.2231947052734,-74.2231612894274,-74.2231298673657,-74.2231129667092,-74.2231035372131,-74.2230967257303,-74.2230422836596,-74.2230015599764,-74.2229711957524,-74.2229721969876,-74.2228831003073,-74.2228187658904,-74.222739601243,-74.2226556883406,-74.2225748680138,-74.2225183304901,-74.2224748211386,-74.2224222599362,-74.222370770987,-74.2223203663616,-74.2222475290559,-74.2222245233586,-74.2222172756694,-74.2221969976091,-74.2221224448783,-74.2220111270966,-74.2219018415173,-74.2217986388705,-74.2217487267106,-74.2216967575853,-74.2216672422115,-74.2216539687517,-74.2216029861863,-74.2215884454116,-74.221570066132,-74.2215445018061,-74.2214987669607,-74.221493773087,-74.2214728095629,-74.2214526081937,-74.2214546937205,-74.2214624302176,-74.2214544643975,-74.221431953254,-74.2214005495371,-74.2213467762411,-74.2212986460446,-74.221255042479,-74.2212137505748,-74.2212071393661,-74.2212028442142,-74.221197424942,-74.2211931265043,-74.2211832282347,-74.2211597670403,-74.2210936928059,-74.2210533827537,-74.2210399857697,-74.2210244895006,-74.2210101085919,-74.2209901341243,-74.220979045272,-74.2209432973212,-74.220867150934,-74.2208223165641,-74.2207696226611,-74.2206956786855,-74.2206217594913,-74.2205534015106,-74.2205287038639,-74.2204994179498,-74.2204690155966,-74.2204571404394,-74.2204453822721,-74.2204229060158,-74.220418238229,-74.2204058715872,-74.2203330147874,-74.2202971180895,-74.2202858530571,-74.220277828543,-74.2202665585135,-74.2202665556956,-74.2202194369726,-74.2201845618246,-74.2201788089621,-74.2201831028015,-74.220181790769,-74.2201793685452,-74.2201623873266,-74.2201431677601,-74.2201352263147,-74.2201436988322,-74.2201447431832,-74.2201062716494,-74.2200514315675,-74.2199933460683,-74.2199207243151,-74.2198651840271,-74.2198022919714,-74.2197435693072,-74.2196721472014,-74.219600267411,-74.2195611261846,-74.2195298716999,-74.2194844686722,-74.2194088361905,-74.2193232128561,-74.2192555290343,-74.2191758631708,-74.2191101491143,-74.2190806089935,-74.2190900512675,-74.2191283505424,-74.2191733979614,-74.2192345849937,-74.2192582450444,-74.219233301271,-74.2191955465313,-74.2192097819695,-74.219252237166,-74.2192951087831,-74.2193101550094,-74.2193205266263,-74.2193370127899,-74.2193053958899,-74.2192863963964,-74.2192171637093,-74.2191944345817,-74.2191823263441,-74.2191796802852,-74.2191813621982,-74.219189054418,-74.219178494691,-74.219169392286,-74.2191363295125,-74.2190920208725,-74.2190754688576,-74.2190706851673,-74.2190678720263,-74.2190440724613,-74.2189901474795,-74.2189583263323,-74.2189139092068,-74.2188697347666,-74.2187807748567,-74.2185932578281,-74.2185398175648,-74.2185327233396,-74.2185650173142,-74.2185508708539,-74.2185363814707,-74.2185676824066,-74.2186388956635,-74.2187007098445,-74.2187591863369,-74.2187974474673,-74.2188190596518,-74.2187539992374,-74.2188020251887,-74.2187503688056,-74.2187076756,-74.2186704432801,-74.2186567937259,-74.2184151987498,-74.2182699919592,-74.218173601934,-74.2181215645929,-74.2181285554603,-74.2180714638306,-74.2179149889179,-74.2177534239174,-74.2174127277268,-74.217190725648,-74.2169722657385,-74.2167576873947,-74.2165473239862,-74.2162418355111,-74.2160424606064,-74.2158515638771,-74.2155682464113,-74.2147405319882,-74.214912175889,-74.2149705299989,-74.2150181720181,-74.2149925696477,-74.2146234047829,-74.2145835975558,-74.214493575094,-74.2144753323965,-74.2144356260735,-74.214344476313,-74.2142821281772,-74.2142269885425,-74.2141661398686,-74.2141227760576,-74.2140577137868,-74.2140102780821,-74.2139693406919,-74.2139553744972,-74.2138687441303,-74.213863593664,-74.2139008816072,-74.2138875548331,-74.2138685860586,-74.2138468660943,-74.2138369925401,-74.2138163455419,-74.213790344588,-74.2137771979085,-74.2137646731759,-74.2137350361449,-74.2137115694009,-74.2136620747585,-74.2136290446142,-74.2135959459592,-74.2135643962424,-74.2135207218246,-74.2134739230008,-74.2133956062077,-74.2133333235227,-74.2132745729138,-74.2132403140867,-74.2132469734043,-74.2132439733105,-74.2132387154599,-74.2132292959265,-74.2132191690179,-74.2132083377696,-74.2131968076357,-74.2131891269533,-74.2131822272608,-74.2131761234,-74.2131708251728,-74.2131663478646,-74.2131626957845,-74.2131598789405,-74.2131579009795,-74.2131579261457,-74.2131571400776,-74.2131555441653,-74.2131531475014,-74.2131499622381,-74.2131460060339,-74.2131412972026,-74.2131358632894,-74.2131297309678,-74.2131229346012,-74.2131155057056,-74.2131074874477,-74.2130975646827,-74.2130869253811,-74.2130755973581,-74.2130636018386,-74.2130509642282,-74.213037711915,-74.21302387294,-74.213009478215,-74.2129966159449,-74.212983216339,-74.2129693063621,-74.2129549138571,-74.2129400631547,-74.2129247836458,-74.2129091018612,-74.2128930485152,-74.2128766565132,-74.2128515267461,-74.2128263108875,-74.2128010262941,-74.2127934512715,-74.2127860265831,-74.2127788312555,-74.2127719361686,-74.2127654135101,-74.2127593299413,-74.2127537486182,-74.2127487258524,-74.2127443139989,-74.2127405601281,-74.2127272159464,-74.2127135888021,-74.2126997485021,-74.2126857655263,-74.212671709701,-74.2126650895761,-74.212658904433,-74.212653204027,-74.2126480348263,-74.2126434379907,-74.2126394487659,-74.2126361017159,-74.2126334210855,-74.2126314289053,-74.2126301412834,-74.2126295690501,-74.2126297168736,-74.2126305819701,-74.2126321586891,-74.2126344345807,-74.212637390819,-74.2126410048619,-74.2126452464761,-74.2126500821384,-74.2126723151641,-74.2126761343476,-74.2126790530317,-74.2126810680636,-74.2126821736473,-74.2126823736697,-74.2126816632101,-74.2126836825679,-74.2126848169119,-74.2126850630667,-74.2126844218057,-74.2126828914874,-74.2126804785941,-74.2126771872046,-74.2126730266548,-74.2126622112392,-74.2126506339365,-74.2126383078657,-74.212625251629,-74.2126114814137,-74.2125970169269,-74.2125818783117,-74.2125660852828,-74.2125522599428,-74.2125378511429,-74.2125228759539,-74.2125073527919,-74.2124912976429,-74.2124747330814,-74.2124576733534,-74.2124515690885,-74.2124401414777,-74.2124097325393,-74.2123798416544,-74.2123216809138,-74.2123101277296,-74.212299104267,-74.2122886385641,-74.2122787628428,-74.2122695040373,-74.212260888203,-74.2122529392056,-74.212245680014,-74.2122391314085,-74.2122336948165,-74.2122333141621,-74.2122282409203,-74.2122239265175,-74.2122203862407,-74.2122176272267,-74.2122156588287,-74.2121984490164,-74.2121818859828,-74.2121659841867,-74.2121507591754,-74.2121362229735,-74.2121223913527,-74.2121092750196,-74.2120968864473,-74.212085237213,-74.2120743395769,-74.2120641998454,-74.2120496360293,-74.2120357687576,-74.2120226061117,-74.2120101581541,-74.2119984316425,-74.2119874370783,-74.2119771823254,-74.211967671726,-74.2119589146791,-74.2119509159709,-74.2119436792857,-74.2119372138045,-74.2119315210077,-74.2119266061279,-74.211922470871,-74.2119191211143,-74.2119165568148,-74.2118986761295,-74.2118801739018,-74.211861052304,-74.2118413119796,-74.2118209551066,-74.2117999832014,-74.211778400422,-74.2117562045513,-74.2117557355902,-74.2117560257779,-74.2117570773848,-74.2117588808004,-74.2117614202853,-74.211764683166,-74.2117686427183,-74.2117732715689,-74.2117785364115,-74.2117844002197,-74.2117908187227,-74.2117977489803,-74.2118131007146,-74.2118282773711,-74.2118432400286,-74.2118579447356,-74.2118723497269,-74.2118864132158,-74.2119001006777,-74.2119133672482,-74.2119261792656,-74.211933493293,-74.2119402780977,-74.2119464953551,-74.2119521128957,-74.2119571035868,-74.2119614365707,-74.2119650913001,-74.2119680487559,-74.2119702916881,-74.2119718109616,-74.2119725970017,-74.2119726446295,-74.2119719543672,-74.2119705304811,-74.2119683800942,-74.2119655129617,-74.2119571680197,-74.2119479986395,-74.2119380150909,-74.2119272186446,-74.2119156180329,-74.2119076805553,-74.2119005612493,-74.2118942710298,-74.2118888118123,-74.2118841951628,-74.2118804232168,-74.2118739842734,-74.2118668321391,-74.211858982563,-74.2118504427377,-74.2118412262157,-74.2118313450163,-74.2118208124835,-74.2118096454639,-74.2117978584115,-74.2117865057193,-74.2117744574968,-74.2117617264333,-74.2117483258635,-74.2117342739682,-74.2117195862903,-74.2117042768412,-74.2116883679669,-74.2116718761034,-74.2116570688627,-74.2116429073887,-74.2116294166529,-74.2116166233805,-74.2116045490308,-74.2115932172453,-74.2115826481558,-74.2115605971606,-74.2115392574803,-74.2115186385339,-74.2114987451194,-74.2114795848924,-74.2114706758209,-74.2114610765041,-74.2114507954528,-74.2114398440373,-74.2114282347239,-74.2114159782246,-74.2114030914068,-74.2113895825611,-74.2113754700936,-74.2113371348124,-74.2112994457548,-74.2112624114704,-74.2112260429112,-74.2112170869814,-74.2112088164436,-74.2112012470388,-74.2111943934066,-74.2111882715095,-74.2111828911493,-74.2111782660818,-74.2111744025993,-74.211171310284,-74.2111689954197,-74.2111674627595,-74.2111667139709,-74.2111667511696,-74.2111652129818,-74.2111646385031,-74.2111650301013,-74.2111663870647,-74.2111687082446,-74.2111719931474,-74.2111720908169,-74.211173035604,-74.2111748207353,-74.2111774339365,-74.2111808482327,-74.2111850368657,-74.2111899645226,-74.2111955862306,-74.211201855051,-74.21120871725,-74.2112185734891,-74.2112280701041,-74.2112371523306,-74.2112457726394,-74.2112538848202,-74.2112614448448,-74.2112684108739,-74.2112747474338,-74.2112804188239,-74.2112866930577,-74.2112921561914,-74.2112967876847,-74.2113005735879,-74.2113035061059,-74.211305575238,-74.2113067742805,-74.2113115501129,-74.2113154561792,-74.2113184831428,-74.2113206214492,-74.2113218659333,-74.2113222123118,-74.2113242577885,-74.2113255094852,-74.2113259686844,-74.2113256316022,-74.211326378096,-74.2113281579796,-74.2113309669828,-74.2113347984142,-74.2113396479999,-74.2113402624883,-74.2113400528133,-74.2113390182396,-74.211337162206,-74.2113344830916,-74.2113309869674,-74.2113266818899,-74.2113215719452,-74.2113156658441,-74.2113089725234,-74.2112792614834,-74.2112500720887,-74.2112214109095,-74.2111932829551,-74.211193237312,-74.2111924221417,-74.2111908417665,-74.2111884967697,-74.2111853906034,-74.2111815304391,-74.211176917965,-74.2111715656315,-74.2111610526318,-74.2111513036203,-74.2111423231712,-74.2111341160886,-74.2111262660106,-74.2111192450137,-74.2111130550165,-74.2111077047475,-74.2111031954716,-74.2110995337209,-74.2110967214153,-74.2110947587227,-74.2110936484364,-74.2110933920394,-74.2110939905707,-74.211093919191,-74.2110945907058,-74.2110960035523,-74.2110981598844,-74.2111010559432,-74.2111046912448,-74.2111090646681,-74.2111599476683,-74.2111665601608,-74.2111739458856,-74.2111820940349,-74.2111910045573,-74.2112006684055,-74.2112110793738,-74.2112222325942,-74.2112737238345,-74.2112834846032,-74.2112925564301,-74.2113009348778,-74.2113086155006,-74.2113155914547,-74.2113218571922,-74.2113274098245,-74.2113337013013,-74.211339209844,-74.2113439248554,-74.2113478478115,-74.2113509725126,-74.2113532984646,-74.2113552934058,-74.2113529246125,-74.211351297588,-74.2113504168928,-74.2113502800428,-74.2113508880727,-74.2113522418014,-74.2113543380946,-74.2113571755675,-74.2113607499855,-74.2113650562325,-74.2113668553601,-74.2113693778171,-74.2113729660878,-74.2113758216734,-74.2113779423426,-74.2113793282843,-74.2113799785878,-74.2113700861941,-74.2113593678171,-74.2113478306639,-74.2113354847811,-74.2113223371415,-74.2113083982404,-74.2112936757136,-74.2112763977053,-74.211259819303,-74.2112439507953,-74.2112287985121,-74.2112143674767,-74.2112006670956,-74.2111876993125,-74.2111754728744,-74.2111490865083,-74.2111233811435,-74.2110983600475,-74.2110740251871,-74.2110503824717,-74.2110274327639,-74.2110051797808,-74.2109836250382,-74.2109627740123,-74.2109347587435,-74.2109216553023,-74.2109075560058,-74.2108924590527,-74.210876373178,-74.2108677408998,-74.2108599377639,-74.2108529700861,-74.2108468408946,-74.2108415569357,-74.2108371218981,-74.2108132147265,-74.2107881955909,-74.2107797307137,-74.2107597610058,-74.2107531682425,-74.2107433054226,-74.21072667691,-74.2107179266924,-74.2107085089516,-74.2106974351864,-74.210677331985,-74.2106399339168,-74.2106234374394,-74.2105846227725,-74.2105623268847,-74.2104755960659,-74.210451761209,-74.210396395501,-74.2103755852281,-74.2103607965636,-74.2103339682664,-74.2103085149873,-74.2102847312101,-74.2102575093867,-74.2102356775115,-74.2102093503541,-74.210114587757,-74.2100369420817,-74.2099764118817,-74.2099219893646,-74.2098834898241,-74.2098558616214,-74.2097973714863,-74.2097769134287,-74.2097613438043,-74.2097385637958,-74.2097151907235,-74.2096997128649,-74.2096779547163,-74.2096465523344,-74.2096282498897,-74.2096095952877,-74.2095963852099,-74.2095792922388,-74.2095564385293,-74.209541258574,-74.2095289203796,-74.2095246132284,-74.2095239073365,-74.2095299121373,-74.209540693739,-74.2095508790996,-74.2095720711381,-74.2095617405607,-74.2095512247081,-74.2095384978262,-74.2095346723291,-74.2095275511693,-74.2095139351494,-74.2094848888728,-74.2094476662524,-74.2094237327747,-74.2093851536311,-74.2093478026957,-74.2093217526834,-74.209310883544,-74.2093030250985,-74.2093022276102,-74.2093033834499,-74.2092688612379,-74.2092652588303,-74.2092704269466,-74.2092579431796,-74.2092416854709,-74.2092194802886,-74.2091858841011,-74.2091623580789,-74.2091250068416,-74.2090903132898,-74.2090581658526,-74.2090448997466,-74.2090342903803,-74.2090181063204,-74.2089929848336,-74.2089698884802,-74.2089423684784,-74.2089114296085,-74.2088842631788,-74.2088666111219,-74.2088556676376,-74.2088457271546,-74.2088429976674,-74.2088431863838,-74.2088430955048,-74.2088453824513,-74.2088530589109,-74.2088719055218,-74.2088864018067,-74.2088924805896,-74.2088915346961,-74.208891593364,-74.2088908511529,-74.2088957966369,-74.208900313545,-74.2088799705518,-74.2088901389141,-74.2089114173387,-74.2089248946428,-74.2089263632867,-74.2088830288257,-74.208853075435,-74.2088470544806,-74.2088274127123,-74.2088049636777,-74.2087781874855,-74.2087583030141,-74.2087271211846,-74.2087013089674,-74.2086822793365,-74.2086518771391,-74.208618818326,-74.2085869104527,-74.2085566234875,-74.2084688231757,-74.2084402231042,-74.2083752241598,-74.208333391512,-74.2082908180197,-74.2082556763688,-74.2082198108416,-74.2081792633823,-74.2081116395715,-74.2080764799493,-74.208058974781,-74.2080342415126,-74.2080170538142,-74.2080081154483,-74.2080050305256,-74.2080054602359,-74.2080074684795,-74.208013601338,-74.2080277629518,-74.2080469413281,-74.2080738341233,-74.2080998882646,-74.2081254798898,-74.2081469996813,-74.2081685110219,-74.2078355901513,-74.2072734007967,-74.2072629820731,-74.2072315961312,-74.2071916590324,-74.2071271152609,-74.2070780041042,-74.2070812725485,-74.2070814108665,-74.2071184953354,-74.2071585868643,-74.2071814237471,-74.2072048365536,-74.2072265020605,-74.2071926714753,-74.207156691061,-74.2071189613316,-74.2070913697962,-74.207073133584,-74.2070702436618,-74.2070928750448,-74.2071261252015,-74.2071540445461,-74.2072004985494,-74.2072284180299,-74.2072716759952,-74.2072872336889,-74.2072843141318,-74.2072320502591,-74.2071736424704,-74.2071060177028,-74.2069741238682,-74.2069251207469,-74.2068739530644,-74.2068531146025,-74.2068314875071,-74.2068120562678,-74.2068188460739,-74.2068205403253,-74.2068382465956,-74.206846371558,-74.2068497191497,-74.2068737187725,-74.2068865558776,-74.20692807001,-74.2069711179594,-74.2070221322372,-74.2070555944011,-74.2070954581273,-74.2070891717934,-74.2070733377331,-74.2070511302468,-74.2070401023572,-74.2070146886313,-74.2069813061001,-74.2069399228888,-74.2069367859877,-74.2069368876106,-74.2069273996345,-74.2069051353393,-74.2068844114949,-74.2068540757068,-74.2068253518858,-74.2067918940203,-74.2067393654126,-74.206702747361,-74.2066470961086,-74.2066147196221,-74.2065804053206,-74.2065550934209,-74.2065361739342,-74.2065268053321,-74.2065253290733,-74.2065312542969,-74.2065477957595,-74.20659246376,-74.2066355459368,-74.2066658630576,-74.2066929750963,-74.206693061562,-74.2067058777524,-74.206729863902,-74.2067474500446,-74.2067777592813,-74.2067984974578,-74.2068160648222,-74.2068161663884,-74.2068082796181,-74.2067796654767,-74.2067509902721,-74.2067160282676,-74.2066890479285,-74.2066748099254,-74.2066701396916,-74.2066606734004,-74.2066352823779,-74.2065970932302,-74.2065461044337,-74.2065046836454,-74.2064728750412,-74.2064442936041,-74.2064188986813,-74.2063950714984,-74.2063517696305,-74.2063234419536,-74.2062949354444,-74.206266428888,-74.206230057074,-74.2062063610091,-74.2061985332781,-74.2061811721045,-74.2061686393901,-74.2061514087366,-74.2061595102619,-74.2061748245,-74.2061739020672,-74.2061651805497,-74.2061511244108,-74.2061334339959,-74.2061088669828,-74.2060954249186,-74.2060756171571,-74.2060629581204,-74.2060463200759,-74.206039230342,-74.2060313291472,-74.2060194179043,-74.2060067395652,-74.205989313912,-74.2059774432636,-74.2059639960465,-74.2059537275925,-74.2059490115257,-74.2059371536162,-74.2059348200609,-74.205917325094,-74.2060664901368,-74.2060284124252,-74.2053989146549,-74.2044119994804,-74.2029499998021,-74.2005840002506,-74.1988762263611,-74.1974980000875],"lat":[40.5788590005879,40.5772617088882,40.5766236356205,40.5766850285199,40.5766791202205,40.5763185234041,40.5748930690814,40.5744948794977,40.5739353174637,40.5732826221847,40.5727996205986,40.5723104626349,40.5717614809775,40.5715953050637,40.5710571385717,40.5710373525912,40.5709312067735,40.5713355039409,40.5717305371768,40.5721864095687,40.5726665061419,40.5732498561291,40.5738817225564,40.5746106996704,40.575321436036,40.5755255649528,40.5753372479939,40.5751445550771,40.5749475825282,40.5747464288116,40.5745411944807,40.5743319821281,40.5741188963337,40.5739020436207,40.573681532379,40.5734574728336,40.5732299769819,40.5729991585379,40.5727651328751,40.5725280169689,40.5725004743426,40.5724573031455,40.5723355342815,40.5717146255052,40.5720734943531,40.5721932001548,40.5722605918989,40.5705483133979,40.5698750000021,40.5671106388179,40.5637554402341,40.5632413293207,40.563181887334,40.5631283585313,40.5630808354085,40.5630394000365,40.5630041240522,40.5629750684109,40.5629572776488,40.5629346998332,40.5629074048034,40.5628754772072,40.5628390155932,40.5627981327469,40.5625729717263,40.5622869362441,40.5617048371558,40.561551719835,40.5615209230203,40.5614924158657,40.5613977305618,40.5613202637955,40.561285029582,40.5612281161901,40.5611766930729,40.5611307867612,40.5610904206046,40.5604766053655,40.5602904102697,40.5606424482222,40.5614469703726,40.5623456418449,40.562951695702,40.5653379837258,40.5656248615302,40.5667293999793,40.5703824434124,40.5707469288205,40.5712740617826,40.5714105750647,40.5714610589974,40.5720133209792,40.5718477694807,40.5720374100049,40.5723326139677,40.5724225526331,40.5725273721191,40.5727398873731,40.5727796429604,40.5729084522082,40.5729913095805,40.5730519498333,40.5731977126844,40.5732382283604,40.5732966040146,40.5733215435835,40.5733501081286,40.5733822778878,40.5734180314265,40.5734463493115,40.5734790937297,40.5735162067815,40.5735576226782,40.5737425306182,40.5741060101974,40.5746824823603,40.5747300541427,40.5750565385785,40.5751675762499,40.5752066245533,40.575240724315,40.5752802376302,40.5753245886939,40.575373131217,40.5754251577883,40.5754799102494,40.5764052186687,40.5762849329162,40.5759844469469,40.5759010430202,40.5758813539717,40.5758328716827,40.5758079333258,40.5757870129121,40.57578698613,40.5757869407644,40.5757518528895,40.5757518161857,40.5757517719419,40.5757027727791,40.5757027191787,40.5757026474738,40.5756405814445,40.5756405458491,40.5756405003575,40.5755667879619,40.5755667068616,40.5755666257362,40.5754830196804,40.5751325873752,40.5749069850808,40.5746531813966,40.5742170889656,40.573832027759,40.5735559198829,40.5729755487895,40.5728267437394,40.5726757347448,40.5726756622045,40.5725238710791,40.5723728007548,40.5723727112814,40.5723726119111,40.5722236682536,40.5720922110721,40.5717756146804,40.5715013938681,40.5709394937403,40.5705964331634,40.5704298447689,40.5701783647501,40.5701375377127,40.5700983608072,40.5699491962305,40.5699205329322,40.5698325286489,40.5694245377283,40.5689491424445,40.5684307186556,40.5682399812729,40.5680758638436,40.5679663664545,40.5670884600852,40.5662274656848,40.5657795527173,40.5653552243262,40.5649216420596,40.5644177637808,40.5639435159133,40.5639156379859,40.5638792104359,40.5638027318887,40.5631660707364,40.5629324875105,40.5626757240841,40.5636898192186,40.5655055577586,40.564310666832,40.5639089377653,40.5635283633471,40.5631455882576,40.5627698833931,40.5626670460355,40.5622963328294,40.5619899734925,40.5615952394129,40.5611732280791,40.5610296731188,40.5608896948932,40.5607533541202,40.5606207099398,40.5604918198884,40.5603667395555,40.5602455235095,40.5601282243285,40.5600148928915,40.5599055783561,40.5597200764875,40.5586914631006,40.5561875166401,40.5552880458486,40.5534236290893,40.5528108407792,40.5524646516058,40.5525130226466,40.550376512558,40.550148394863,40.5498584511809,40.550948085111,40.5506455113435,40.5505305226699,40.550215477254,40.549127741725,40.5490230404453,40.5489913911023,40.5504596952959,40.5516307519132,40.5517865892298,40.5522219060446,40.5530819500847,40.5543585024633,40.5550846581718,40.5552308277777,40.5563280570063,40.5572654909115,40.5572951724478,40.5565344367978,40.5557698719063,40.5550326257449,40.5544370425603,40.5539737593305,40.5534899710139,40.5523561791593,40.5512550782035,40.5508632389527,40.5504333007767,40.5495923695195,40.5493835464295,40.5486918314848,40.5484858167766,40.5484414795959,40.5480317959159,40.5473096046666,40.5470234823076,40.5469804431863,40.5464516962123,40.5462523500419,40.5460732244525,40.5459750074768,40.5459147476352,40.5459231816687,40.5459704975242,40.5459749884054,40.5459574964829,40.5458946559959,40.5458849643527,40.545952218157,40.5459309743596,40.5458640079923,40.5457928646606,40.5457731072957,40.5457740977644,40.5457603717557,40.5457148039238,40.5457004402763,40.5456527216079,40.5456382428392,40.5455921271677,40.5455755924444,40.5455297076368,40.5455130226567,40.5454686570221,40.5454522949455,40.5454071989604,40.5453903489881,40.5453480113057,40.5453308218429,40.545289054841,40.5452642880667,40.5452090218232,40.5451843060599,40.5451306719182,40.544963297436,40.5450394688265,40.5450198456799,40.5449445312017,40.5448546715063,40.5448742951115,40.5449470405893,40.5450238192585,40.5450882369259,40.5450918619453,40.5452469277242,40.5452511903707,40.5457567488644,40.5457658702388,40.5457842947001,40.5455775572387,40.5455590957828,40.5455649178379,40.5455505192948,40.545532251471,40.5455098039339,40.5454953158143,40.5454355517738,40.5454208509651,40.5453968824532,40.545385159485,40.5453232997171,40.5453186570778,40.5449177165074,40.5449145055556,40.5448889173232,40.5448796259871,40.544816826207,40.5448037420239,40.5448036539685,40.5448620754521,40.5448454865986,40.5448211866394,40.5447053237361,40.5446825939101,40.5446994427068,40.5447825844806,40.5454662480497,40.5454612400055,40.5454426240457,40.5454114740534,40.5454284455648,40.5454200927668,40.5454484235702,40.5454943697428,40.5455527144634,40.5455542162613,40.5455717980466,40.5455654720921,40.5455848658974,40.5458940185288,40.5460003370781,40.5459133413148,40.5457946368569,40.5457058589417,40.5456064142105,40.5455721970229,40.5455321456487,40.5454866801769,40.5454362774832,40.5453814662269,40.5453228213066,40.545260957829,40.5451965246579,40.5451301976073,40.5449910703051,40.5449454240186,40.5449292869276,40.5449284564968,40.544914183496,40.5448874196628,40.544871216455,40.544840933227,40.5448243557069,40.5447950889822,40.5447778466406,40.5447505435395,40.5447331324352,40.5447242225053,40.5446869291927,40.544668420924,40.5445509381739,40.5445383639836,40.5445109276413,40.5444989905795,40.5444998582801,40.5445477528052,40.5442535664183,40.5441449287782,40.544162838483,40.5442449588073,40.544258625718,40.5442765315792,40.5443013253921,40.5443514784496,40.5443752863069,40.5443884232617,40.544505916169,40.5445041843163,40.5444586518959,40.5444733494014,40.544510694784,40.544526541823,40.5445651876447,40.5445805135414,40.5446203221569,40.5446346067922,40.5446755480971,40.544688555326,40.5447300111945,40.5447425668588,40.5447845844508,40.5447970583205,40.5448400097493,40.5448506779014,40.5448932851064,40.5449050991852,40.5449178200611,40.5449339584269,40.54471556103,40.5446960197026,40.5446818790667,40.5446434591453,40.5446275210224,40.5445891931926,40.5445733505321,40.5445360228384,40.544519037862,40.5444809345596,40.5443767196152,40.5443717978033,40.5443341776655,40.54431785467,40.5443013640935,40.5442620652816,40.5442472998096,40.5441947502053,40.5441779531994,40.5441275534566,40.544110588686,40.5440563641666,40.5440394992188,40.5440301187969,40.5439983235619,40.5439900437894,40.5439983499749,40.5440704511219,40.544052544131,40.5439984073891,40.5439045624638,40.5439199102475,40.5439712269146,40.5439982661931,40.5440155653411,40.5440331609231,40.5440393445033,40.5447049103001,40.5442951408722,40.5442172175162,40.5442254011984,40.5442316344396,40.5442361065785,40.5442739819937,40.5442787563759,40.544312607951,40.5443180327188,40.5443330263793,40.5443384011407,40.5443696244542,40.5443761461185,40.5444061637795,40.544412562779,40.5444400015295,40.5444450210537,40.544472957985,40.544505211599,40.5445095806226,40.5444773275082,40.5444791913647,40.5444280973331,40.5444214053763,40.5444606893719,40.5444456693691,40.5443569516712,40.5443235391704,40.5443179250311,40.5442802370123,40.5442750703671,40.5442392924676,40.5442347548736,40.5442180963305,40.5442141211748,40.5442059435372,40.5441525974467,40.5441165894046,40.5443761018197,40.5443289755327,40.5443200698636,40.5443493236649,40.5443488962347,40.544318789923,40.5441981105066,40.5441858409325,40.5441785488252,40.5441417327933,40.5441346627998,40.5441405560712,40.5441215186911,40.5440854651292,40.5440667001713,40.544060565981,40.5439969718145,40.543968224884,40.543985337042,40.5439911568362,40.5440387663385,40.5440715559807,40.5440803196593,40.5441127211991,40.5441223321786,40.5441308732031,40.5441735200841,40.5441820619241,40.5442255537704,40.5442435579349,40.5442338592804,40.5441957596372,40.5441497361791,40.5441454422561,40.5441300225351,40.544115549509,40.5441632574432,40.5441592412467,40.5439747122355,40.5439800483146,40.5439601531657,40.5438774495436,40.5437913588905,40.5438126838452,40.5438232084188,40.5438378923764,40.5438866537949,40.5438902884259,40.5439469034463,40.5439677364073,40.5440364036957,40.5440414886138,40.5440517369006,40.5440960817845,40.5441046384903,40.5439977944383,40.5439784273163,40.5439698765311,40.5439977709135,40.5440236013432,40.5440235824375,40.5440145543871,40.5439635765562,40.5439491938079,40.5439277726949,40.5438823558692,40.5438642394978,40.5438494052361,40.5438311084937,40.5438170379593,40.5438014818984,40.543802712815,40.5437840548959,40.5435879281902,40.5436039925254,40.5436145321102,40.5436642762901,40.5436786523925,40.543686146544,40.5437051466693,40.5437152873997,40.5436504721831,40.5436522062883,40.5437001090255,40.5437274814488,40.5437736783601,40.5437890544156,40.5438538662149,40.5438666945706,40.5437720367572,40.5436017996904,40.5436410270242,40.5436418556121,40.5436238991206,40.5436291045691,40.5435785423061,40.5435657530921,40.5435648988578,40.543613657257,40.5436196446624,40.5435983275946,40.5435393030491,40.5435155516826,40.5435765193703,40.5435518283115,40.5434015512519,40.5434241559779,40.5435062859916,40.5435307495557,40.5434503403666,40.5434725121242,40.5435443673409,40.5436823398945,40.5437437454514,40.5438957708517,40.5439296180854,40.5439436550206,40.5439816123553,40.5440027373064,40.5440319717899,40.5440694440666,40.5440856024233,40.5440909312311,40.5440950189436,40.5441696882746,40.5441904087687,40.5441941029544,40.5442027774085,40.5442469146201,40.5442722748305,40.5440524628434,40.5434073986827,40.5434322645814,40.5432914108344,40.5431317776023,40.5431500400007,40.543291332203,40.5433656938733,40.5432269939407,40.543245255808,40.5433394629086,40.5433733694009,40.543384411373,40.543413938684,40.5438889958587,40.5437368233215,40.543752471885,40.5439087771863,40.5440268445121,40.5438839996238,40.5438458259352,40.5438304268448,40.5438588508326,40.5440504020557,40.5440166175625,40.5440331850079,40.5440027251731,40.5439890166955,40.5439320173566,40.5438253117535,40.5438078380735,40.5438020872711,40.5437939557338,40.5437931679677,40.5438342865225,40.5438261083167,40.5437852598346,40.5437716251276,40.5437420400476,40.5437212323946,40.5437103111862,40.5436733429661,40.5436557619803,40.5436257801328,40.5436096515059,40.5435755242495,40.5435686743094,40.5435275102707,40.5434894563346,40.5434687032815,40.5434391565184,40.5434107731119,40.5433848268248,40.5433518771983,40.5433465020236,40.5431592324521,40.5430960850942,40.5431819620798,40.5431660851379,40.5431506630977,40.5431302904842,40.5431059987132,40.5430165845853,40.543036067581,40.5430768690463,40.5430887818619,40.5431174603055,40.5431368636368,40.5431557046726,40.5431636501416,40.543205441983,40.5432130312066,40.5432561273817,40.5432628408876,40.5433030279158,40.5433113466614,40.5433507773596,40.5433603439366,40.5434009874839,40.5434262037489,40.5434487406994,40.543470173304,40.5434976764815,40.5435072567479,40.5435470825237,40.5435570671846,40.5436960628256,40.5436404571555,40.543579062284,40.5435747864831,40.5435133934169,40.5433850711192,40.5433322071432,40.5433226618805,40.5432692567445,40.5432601471557,40.5432063248439,40.5431984072355,40.5431433490584,40.5431354490045,40.5430812599675,40.5430732956792,40.5430186769224,40.5430115791504,40.5429557266973,40.5429482168146,40.542893592426,40.542885666581,40.5428527941093,40.5428231206305,40.5427856020985,40.5428437706569,40.5428258639987,40.5426821508698,40.5427000561277,40.5427684925777,40.5428068644754,40.5428269923885,40.5428675223118,40.5428766701538,40.5429282013251,40.5430519652023,40.5430557597329,40.5430682961604,40.5431192648812,40.5431336547392,40.543181604243,40.5432510554187,40.5433050294196,40.5433133869505,40.543367110617,40.5431130296925,40.5430472783767,40.5430377024273,40.5429723549339,40.5429640455432,40.5429143532478,40.5428895259002,40.5428254458213,40.5428179415459,40.5427589285252,40.5427430096214,40.5427002793811,40.5426697228317,40.5426558523688,40.5424811556552,40.5425607111017,40.5425410975662,40.5423571751292,40.542375935051,40.5424640483013,40.5430942149021,40.5429388449791,40.5429599417193,40.5430869856264,40.5430520553559,40.5429632647988,40.5429489975874,40.5430417205875,40.5431501468887,40.5430941338302,40.5430695963227,40.5430736957838,40.5424207713665,40.5424038195649,40.5424065008183,40.542382175047,40.5423608554505,40.5424557885189,40.5423662189361,40.5422722590173,40.5422350579976,40.5422282092595,40.5422454849487,40.5423652242984,40.5423893295243,40.5424221265302,40.5423270825521,40.5423820380138,40.5424217411359,40.5424246629401,40.5429864583076,40.5430548917787,40.5430612886838,40.543086165326,40.5430224150804,40.5427911718516,40.5427186737149,40.5426540462122,40.5426389142065,40.5427034664817,40.5426963222036,40.5427687707537,40.5427470474874,40.542678053538,40.5426046137452,40.5425876588514,40.5426603408564,40.5425887924703,40.5425745060639,40.5425991302564,40.5425555531585,40.5425314984727,40.5424952485722,40.5424870997357,40.5424451520926,40.5424363132244,40.5423868041995,40.5423771789671,40.5423231362245,40.5423155972807,40.5422567462003,40.5422489080592,40.5421869541269,40.5421784841463,40.5421151913906,40.5421064111717,40.542052568689,40.5420582173768,40.542127442536,40.5420906280288,40.5420605363927,40.5419615115226,40.541934230415,40.5420597877724,40.542060855324,40.5420265558486,40.54199253403,40.541976857628,40.541951390829,40.5419262308872,40.5419085934737,40.5419248177307,40.5420165071128,40.5420422671676,40.5420560216439,40.5421770000803,40.5421980803777,40.5422517253996,40.5423178348248,40.5423267498079,40.5423349715886,40.5424018135867,40.5424802182529,40.5425641394291,40.5425688718672,40.5425775231316,40.5424839022239,40.5423530792411,40.5423358758857,40.5424677090705,40.5424260008006,40.5422904648709,40.5422784513675,40.5424106175046,40.5423215221428,40.5422004153824,40.542181628521,40.5415711106901,40.5415840478445,40.5415555067285,40.5417093464562,40.5416945420373,40.5414320784676,40.5414476828109,40.5415165838995,40.5415370948605,40.5421867693591,40.5421517799348,40.5421666581294,40.5423354640952,40.5423478381945,40.5423563520693,40.5423606932836,40.5423620634359,40.5423566647289,40.542344660279,40.5423264127885,40.5422871753172,40.542264548242,40.5422517606604,40.542246097558,40.5422409354799,40.5422437040901,40.5422509952046,40.5422619317851,40.5422900245845,40.542306895009,40.5423017688811,40.5422959634566,40.5422949843387,40.5422911093551,40.5422860884831,40.5422806444406,40.5422748141406,40.5422686349865,40.5422633725886,40.5422578491556,40.542252111965,40.5422462119733,40.5422401987957,40.5422341238712,40.5422280411548,40.5422220015717,40.5422160583841,40.5422090520893,40.5422022576778,40.5421957459763,40.5421895812639,40.5421838257997,40.5421785423337,40.5421712147971,40.5421634347007,40.5421552306478,40.5421466325835,40.5421376714661,40.5420677825307,40.5420596847022,40.5420514337465,40.5420430770597,40.5420346637156,40.5420262422964,40.5420178610517,40.5420095692435,40.5420014142986,40.5419922521287,40.5419831702869,40.5419742044652,40.5419653891881,40.5419567598213,40.541948349054,40.5419401905836,40.541932317777,40.5418929336118,40.5418812575336,40.541869764833,40.5418584821607,40.5418474368444,40.5418366547005,40.5418261593753,40.5417694857165,40.5417559958502,40.5417426454497,40.5417294690402,40.5417165008128,40.5417037719457,40.5416985762918,40.5416930839711,40.5416873498094,40.5416814328141,40.5416753904711,40.5416692849527,40.5416631753975,40.5416571261391,40.5416511947862,40.5415903465424,40.5415790955221,40.5415678390187,40.5415566135513,40.5415454491161,40.5415343780513,40.541523434038,40.5415126477512,40.5415020510333,40.5414892733255,40.5414768250331,40.5414647338249,40.5414530231836,40.5414417217872,40.541430852113,40.5414263607386,40.5414213534576,40.5414158581406,40.5414099068471,40.5414035363195,40.5413967812868,40.5413896828401,40.5413822823971,40.5413746208732,40.541366746376,40.5413587019905,40.5413505368143,40.5413449543664,40.5413393260867,40.5413337097748,40.5413281602064,40.5413227328191,40.54131748036,40.5413124554019,40.5413077096692,40.541303288516,40.5412992357772,40.5412897295282,40.5412798539191,40.5412696569891,40.5412591936542,40.5412485178322,40.5412383072167,40.5412282594328,40.5412184119899,40.5412087987077,40.5411994587623,40.5411904226151,40.5411817255867,40.5411733982976,40.5411654737108,40.5411557147043,40.5411455608858,40.5411350350099,40.5411241631812,40.5411129686621,40.5411014790708,40.5410853672383,40.5410695852307,40.5410541543003,40.5410390960356,40.5410258492583,40.541012265352,40.5409983610498,40.5409841519138,40.540973323574,40.5409622673982,40.5409510197188,40.5409396173799,40.5409280963853,40.5409164920757,40.5409049463953,40.5408935610987,40.5408823794263,40.5408714409373,40.5408607907256,40.5408504683586,40.5408420874097,40.540826282341,40.5408139592355,40.5408075448023,40.5408013479737,40.5407954060776,40.5407897602907,40.5407844457554,40.5407794962649,40.5407749449436,40.5407660630899,40.5407575397578,40.5407493941772,40.540741643408,40.5407343060174,40.5407273995606,40.5407209410901,40.5407114723906,40.540701500942,40.5406910376045,40.540680091228,40.5406748334769,40.5406691429964,40.5406630522368,40.5406565956645,40.5406498104245,40.5406427378617,40.5406354168118,40.5406278884556,40.5406201978354,40.5406123881603,40.5406045056554,40.540598069201,40.5405916822504,40.5405853954048,40.5405792581048,40.5405733202993,40.5405676275894,40.5405622250766,40.5405571572053,40.5405536455357,40.540549662954,40.5405452623097,40.5405404979572,40.5405354304354,40.5405301227865,40.5405246449051,40.5405190648383,40.5405134527903,40.5404992055738,40.540485174801,40.5404713777103,40.5404578338902,40.5404445609142,40.5404315746822,40.5404188939397,40.5404108903189,40.540403334465,40.5403962720548,40.5403897434005,40.540383786963,40.5403808834643,40.5403774497619,40.5403734970326,40.5403690404715,40.5403640937654,40.5403562304812,40.5403482021672,40.540340055215,40.5403318418818,40.540323613255,40.5403154209403,40.5403073148657,40.5402993471479,40.540289092895,40.540278758283,40.5402683719604,40.5402579627504,40.5402475611408,40.5402371977899,40.5402269011723,40.5402167014386,40.5402051730844,40.5401939185685,40.5401829814234,40.5401723981348,40.5401622073694,40.5401491180907,40.5401364358087,40.5401241881267,40.5401123991374,40.5401116074695,40.5401102737922,40.5401084177674,40.5401060699482,40.5401032649183,40.5401000491657,40.5400964698529,40.5400925862155,40.5400884563348,40.5400841461749,40.5400797247252,40.5400752579801,40.5400706703133,40.5400661557937,40.5400617821238,40.5400576140074,40.5400537134743,40.5400501388872,40.5400469440903,40.5400441769086,40.5400418763002,40.5400400798889,40.5400388117318,40.540038090696,40.5400379306328,40.5400383299779,40.540039285656,40.5400407810242,40.5400371188861,40.5400329693182,40.5400283669046,40.5400233524173,40.5400179688045,40.5400122603477,40.5400062783517,40.5400000732871,40.5399936984524,40.5399872098275,40.5399806612008,40.5399741103752,40.5399634302627,40.5399527653389,40.5399421452585,40.5399316046894,40.5399211747884,40.5399108863661,40.5399007695652,40.5398908578737,40.5398774715407,40.5398638950484,40.5398501468159,40.5398362496157,40.5398222230408,40.5398080885263,40.5397938685173,40.5397857732175,40.5397776632404,40.5397695808004,40.5397615704693,40.5397536701175,40.5397459231521,40.5397383667862,40.5397310419164,40.5397239856004,40.539717234895,40.5397108231763,40.5397047856642,40.5396991498799,40.5396941035808,40.5396781777007,40.5396619908601,40.5396206559256,40.539567959667,40.5395359733082,40.5394997836444,40.539462641489,40.5394221864642,40.5393873278675,40.5393655036751,40.5393394840971,40.5393097127344,40.5392756564253,40.5392097474064,40.5391752333985,40.539157705916,40.5391540039188,40.539139249467,40.539102899839,40.5390699752897,40.5390306542488,40.5390129140767,40.5389491904084,40.5388165531869,40.5385420409998,40.5381403536647,40.5381296833588,40.5381646208624,40.5381675290584,40.5384440912218,40.5384216204268,40.5381264417345,40.5381319726977,40.5381144533773,40.538091054995,40.5380039642851,40.5379327610682,40.5379165805348,40.5379214851866,40.5372539984325,40.5372540241964,40.5373656436452,40.5373468849647,40.5372159731227,40.5371381779484,40.5371535206805,40.5372156176087,40.5372346917341,40.5378945990974,40.5379021496463,40.5379177777889,40.5377532605048,40.5370875779524,40.5370395113774,40.5372398738565,40.5371369118496,40.5370756048685,40.5370103767763,40.5369415064662,40.5368692884037,40.5367940313668,40.5367160571262,40.5366356990691,40.536567403579,40.5365280926544,40.5363948711375,40.5363583733621,40.5359469312721,40.5358010442112,40.5357909517087,40.5358027579223,40.5358292720841,40.535823072827,40.5357477204432,40.5356678394425,40.5356476545468,40.535641866177,40.5355535282229,40.5354323197583,40.5353903928119,40.535361539395,40.5354143085487,40.5352432584207,40.534923016993,40.5346108136568,40.5345110030593,40.5342415877609,40.5338878693042,40.5338261818855,40.5334919100224,40.5334243027555,40.5333596843561,40.5332985655887,40.5332414295541,40.5331887278712,40.5331705972071,40.533087117843,40.532922721866,40.5329028518302,40.5329181930097,40.5328973452198,40.5328569009363,40.5328763589281,40.5328916924455,40.5329083517551,40.532734330709,40.5325458389371,40.5327066747915,40.5327422230621,40.5327413825067,40.5326830307651,40.5325953508908,40.5324017940281,40.5323976689349,40.5323931169975,40.5323882748235,40.5323832877312,40.5323783053879,40.532373477318,40.5323689484165,40.5323648545997,40.5323453549426,40.5323264400132,40.5323222867094,40.5323172322173,40.5323114065443,40.5323049595336,40.5322980570095,40.532290876513,40.5322836027344,40.5322764227637,40.5322695212777,40.5322630757902,40.5322572520863,40.5322081280847,40.5321640210233,40.5321560618396,40.5321522556251,40.5321527096938,40.5321574112436,40.5321662277168,40.532178910538,40.532178965163,40.532176345745,40.5321711069948,40.532157849563,40.5321422039742,40.5321216067012,40.5321065831868,40.5320975072425,40.5320960981753,40.5320906370885,40.5320811856354,40.5320679440009,40.5318130592167,40.5313921495921,40.5313079637789,40.5312384517676,40.5311189897351,40.5309611935645,40.5308315533215,40.530810023445,40.5307920975387,40.5307103123453,40.5306893639066,40.5306737729356,40.5306617893665,40.5306635436603,40.5307528668954,40.5307608219976,40.5307524984412,40.5307330386086,40.5306708423917,40.5306134188423,40.5305933226354,40.5305686068575,40.530549566642,40.5305337628022,40.5303177432654,40.5303398092679,40.5303575800478,40.5303597580135,40.5303542962514,40.5303310711297,40.5302488801038,40.5301021668611,40.5300621363037,40.5302254835757,40.5301538145175,40.5300780026229,40.5299982159896,40.5299146315279,40.5298274345685,40.529736818451,40.5296429840957,40.5294775054709,40.5294380263377,40.5296009045325,40.5295126932989,40.5294196032163,40.5293218620271,40.5292197088514,40.5291133936019,40.5290031763727,40.5289318417014,40.5286493688204,40.5286113710917,40.5289933116072,40.5290231637554,40.5289776563122,40.528841505123,40.52865910433,40.5285288141413,40.528300499163,40.5280851039537,40.5280670858444,40.5282784267832,40.5281972294126,40.5281170720973,40.5280980880003,40.5279359090663,40.5276697515068,40.5275117248349,40.5274277521444,40.5272959928316,40.5273693585489,40.5273646079802,40.5273473391559,40.5273428107855,40.5273432396092,40.5273449381143,40.5273609010182,40.5274019173638,40.5274483323148,40.5274892531592,40.527508208063,40.5275244488837,40.5275302094021,40.5275474380615,40.5275525336403,40.5275557473221,40.5275498276286,40.5270595497459,40.5270293818294,40.5270237724847,40.5270134782793,40.5270146587978,40.5270239030137,40.527048016213,40.5270716154377,40.5270880273121,40.5271041776311,40.5271303477768,40.5271443746886,40.5271569737561,40.5271804594812,40.5271960760596,40.5272022748899,40.5271942623083,40.5271660617172,40.5271262777397,40.527095443792,40.5270689614862,40.5270368533743,40.5270073279163,40.5269749474563,40.5269447132819,40.5269180438899,40.5268902637081,40.52685384596,40.5268166307513,40.5267867241057,40.5267609336909,40.5267147415284,40.5266750471119,40.5266384434019,40.5266030782771,40.5265668079199,40.526528296433,40.526495391343,40.5264521666551,40.5264136812566,40.5263788574045,40.5263500324935,40.526334504293,40.5263226073243,40.5263245187315,40.5262825873425,40.5262515017366,40.5262132814696,40.5261726641486,40.5261320338757,40.5259886550839,40.525730674806,40.5255515269588,40.5254196191842,40.5253791789195,40.5252562850225,40.5251875176356,40.5250165043661,40.524831290062,40.5244090287685,40.5239498681102,40.5238904875368,40.523590681654,40.5235291616386,40.5234381032053,40.523360544525,40.5233279558493,40.523276289946,40.5232294378258,40.5232057986647,40.5231338998142,40.5230457724524,40.5230265516223,40.5230079376034,40.5230089725672,40.5230131584889,40.5230306375563,40.5230487197855,40.5231017320268,40.5231366967413,40.5231623170834,40.5232847006658,40.5233129442849,40.5233729837318,40.5234316188942,40.523449273612,40.5234577671397,40.5234531918728,40.5232584599243,40.5229687355236,40.522920949968,40.5225691599175,40.5214942737874,40.5208759628291,40.5193299350362,40.519326893238,40.5193091947127,40.519300686764,40.519296166422,40.5192715799371,40.5192484260111,40.5192308668661,40.51922990368,40.5192293875981,40.5192293317337,40.5192297375065,40.5192305946058,40.5192318812529,40.5192335647542,40.5193325738797,40.5193635103998,40.5199236756649,40.5199457856311,40.5199615835295,40.5199706401264,40.5199798115526,40.5199935005712,40.5200116017489,40.5200280771721,40.5200387985227,40.5200436658772,40.5200426338715,40.520035712124,40.5200229651458,40.5200045117393,40.5199985158799,40.5199931838113,40.5199886734064,40.5199851182101,40.5199826234855,40.5199812630969,40.5199810773228,40.5199820716637,40.519984216679,40.5199874488586,40.5199916725036,40.5199967625594,40.5200025683186,40.5200089178831,40.5201581797857,40.5202007856501,40.5202409844866,40.5202782792899,40.5203122089584,40.5203147724197,40.5203332660757,40.5204936689529,40.5205523377061,40.5205808783856,40.5205853058774,40.5205787058088,40.520577315098,40.5205855592801,40.5206042312744,40.5206340889505,40.520663254038,40.5206558362017,40.5205646487761,40.520477649293,40.5204341782043,40.5204182530117,40.5204196076221,40.5204342013278,40.5204083932686,40.5203182058023,40.5201239042575,40.5199062737628,40.5198557396094,40.5198596575412,40.519889724568,40.519751736011,40.5196187051481,40.5196041141342,40.5195783538744,40.5193413586009,40.5191292826255,40.5189223439431,40.5186361994914,40.5181158499023,40.517099383436,40.5169500089103,40.5167965238957,40.5166390587583,40.516477747244,40.5163127263647,40.5161441362818,40.5159721201875,40.5157968241822,40.5156480936163,40.5154974509458,40.5153449768724,40.5151048448747,40.5151033524069,40.5151016082269,40.5150996634479,40.5150975750616,40.5150954042684,40.5150932146834,40.5150910704723,40.5150890344715,40.5150871663457,40.5150855208407,40.5150841461778,40.5150830826417,40.5150823613992,40.5150820035864,40.5150820196889,40.5153336921358,40.5153487368792,40.5153583096294,40.5153621431337,40.5153601303682,40.5153523275253,40.5153389524453,40.5153203785343,40.5133407219017,40.513263554525,40.5131892862216,40.5131184728341,40.513051644346,40.5129893009154,40.5129319091319,40.5128798985248,40.5128336583491,40.5127935346722,40.5122093280971,40.5121938044375,40.511847698588,40.5117095219588,40.5115673095967,40.5114212683779,40.5112716107466,40.5111185544069,40.510962322005,40.5108031408059,40.5106412423623,40.5099776529557,40.5098562035786,40.5098529663838,40.5098555713856,40.5098640020625,40.5098782049461,40.5098980899591,40.5099235309876,40.5099543666802,40.5100084204281,40.5100680191675,40.5101329185599,40.5102028525349,40.5103521353916,40.5105063465628,40.5106653665367,40.5107384369497,40.5108072207406,40.510871437633,40.5109308259588,40.5109877054959,40.5110397737803,40.5110868361809,40.5111446556132,40.5111970231465,40.5112437021885,40.5112844818466,40.5113191778806,40.5113476335358,40.5113697202508,40.5113853382388,40.5113944169383,40.5113877594692,40.5113849063618,40.5113859282429,40.5113907998165,40.51139940049,40.5114115173595,40.5114268504797,40.5114450202888,40.5114655770046,40.5115100342276,40.5115591556391,40.5116123583604,40.5116690110821,40.5117284415553,40.5117899445677,40.5118527903124,40.511916233047,40.511979519943,40.5120419000192,40.5120808383308,40.5121200491621,40.5121586383311,40.5121957258308,40.5122304658977,40.5122620662993,40.5123194490483,40.5123785238637,40.5124386786369,40.5124992900676,40.5125597301222,40.5126193725409,40.5126775993272,40.5127129461866,40.5127218647023,40.5127773059984,40.5128444028168,40.513083884537,40.5130931616501,40.513041606944,40.5129959397419,40.5130101944293,40.5130174015275,40.5130174553009,40.5130103549605,40.5129962046758,40.5129816976301,40.5129655345281,40.5129471700076,40.5129353381225,40.5129302184102,40.5129318885572,40.5129403232207,40.5129706812136,40.5129958222639,40.5130155892948,40.5130298588055,40.5130385416425,40.5130415835568,40.5130389655432,40.5130307039585,40.5130073014905,40.5129655204626,40.5127386617546,40.5126209339615,40.5124737440776,40.5124160257219,40.5123584177991,40.5123281034607,40.5123234901946,40.5123164388421,40.5123053432371,40.5122935697886,40.5122851231381,40.512280055735,40.5123307415171,40.5123307357927,40.5123260051471,40.5123166102162,40.5118561521304,40.5117901779802,40.5117177497125,40.511638980824,40.511553994747,40.5114629246558,40.5113659132577,40.5112631125696,40.5111546836795,40.5110407964937,40.510921629471,40.5107973693424,40.5104833803483,40.5105235303545,40.5104990574578,40.5103986288955,40.5104223618203,40.5104617110697,40.510777703243,40.5106719253248,40.510551077023,40.5104167503305,40.5102785662265,40.510136709184,40.5099913685779,40.5098427384325,40.5096910171622,40.5095364073064,40.5093791152593,40.5092193509943,40.5090573277834,40.5090404461131,40.5090245755197,40.5090054327478,40.5089887830527,40.5089749695383,40.5089642768625,40.5089556202973,40.5089442356828,40.5089303721324,40.5089143330023,40.5088964692536,40.5088626559722,40.5088380305789,40.5088211868046,40.508805399405,40.5086878369841,40.5085671398746,40.5084434921724,40.5083170824729,40.5083133753558,40.5083061247222,40.5082964162066,40.5082749134012,40.5082623741733,40.5082512796434,40.5082380389711,40.5082180224169,40.5081983496566,40.5081939209599,40.508173273495,40.5081664474016,40.5081656236427,40.5081720926355,40.5081777315365,40.5081782006834,40.5081773042565,40.5081750688562,40.5081715608152,40.5081668842308,40.5081035920046,40.5080364092435,40.5079656593226,40.5078916827861,40.5078148357078,40.5077354879772,40.5077280135702,40.5077197378709,40.5077109024784,40.5077017653311,40.5076925931768,40.5076836537852,40.5076752081305,40.5076675027729,40.5076607626606,40.5076551845624,40.5076509313236,40.5076481271121,40.5076468537931,40.5076471485396,40.5076490027467,40.5076491184129,40.5076477389132,40.5076448998037,40.5076406742613,40.5076351711976,40.5076285324519,40.507620929135,40.5076125572192,40.5075430279719,40.5074769014428,40.5074147412903,40.5073853983644,40.5073586095533,40.5073348459549,40.5072301463024,40.5071223649931,40.5070818127037,40.5070440355633,40.5070093500107,40.5069780465877,40.5069107548499,40.5068401044387,40.5067662882154,40.5066895076831,40.5066099724358,40.5066011954946,40.506591649018,40.5065815895075,40.5065712872488,40.5065610190502,40.5065510608044,40.5065132291021,40.506474248041,40.5064352775466,40.5063974772279,40.5064037279916,40.5064130332562,40.5064251839024,40.5064399068661,40.5064568712744,40.506547060729,40.5065955199787,40.5066027625498,40.5066070246731,40.5066081921677,40.506606233757,40.506601201906,40.5065189112873,40.5064368534876,40.5063497576698,40.506257771082,40.5061610492402,40.5060597556653,40.5059540616068,40.5058441457524,40.5057327147326,40.5056165779357,40.5054959585003,40.5053710881762,40.5052422068792,40.5051095622301,40.504973409079,40.504834009015,40.504691629864,40.5036428964581,40.5035619715451,40.5033913444992,40.503380022029,40.5033695367064,40.5033600494907,40.5033496724217,40.5033413926607,40.5033354147875,40.5033318865055,40.5033308995103,40.5033325511098,40.5033367992616,40.503343535827,40.5033525893232,40.5033637292888,40.5033716489292,40.5033736907076,40.5033698088931,40.5033600904287,40.5033447529838,40.5033241400785,40.5032987133897,40.5032690424103,40.5032477156804,40.5032282593617,40.5032027594782,40.5031820733024,40.5031664697617,40.503156151707,40.5031079906492,40.5030543011242,40.5029951508156,40.5029306142912,40.5028607729086,40.5027857147127,40.5027616770117,40.5027426884599,40.5027288615672,40.50272027826,40.5027169893954,40.5027190144605,40.5027263414565,40.5027415774996,40.5027504141498,40.502752794322,40.5027487026403,40.502738165537,40.5027212510821,40.5026980685436,40.502668767681,40.502668499749,40.5026624225508,40.5026505973792,40.5026331434992,40.5026102369451,40.5025821087448,40.502561485376,40.5025461997724,40.5025373076502,40.5025330247904,40.5025333958129,40.5025384168524,40.5025736198384,40.5025892411257,40.5025987796368,40.5026020503461,40.5025989898093,40.5025896573939,40.5025742341277,40.5025530191871,40.5025342199735,40.5025191581877,40.5025082212514,40.502501690486,40.5024997338767,40.5025024017519,40.5025112367726,40.5025181822652,40.5025237946775,40.5025267888586,40.5025272274982,40.5025255405477,40.5025186212199,40.502505910684,40.5024875302679,40.5024781790128,40.5024619483508,40.5024392053775,40.5024104644796,40.5023763757005,40.5023556759509,40.50233785254,40.5023233521669,40.5023125382466,40.5023056818024,40.5023029546736,40.5023069849779,40.5023056718248,40.5022990245033,40.5022870900353,40.5022699528431,40.5022477341517,40.5022205911319,40.502151063865,40.5020848451253,40.5020220387575,40.5019627432547,40.5018582355501,40.5018271084699,40.501801800727,40.5017827525048,40.5017702951134,40.5017646452266,40.5017659011142,40.5017740409321,40.501788923103,40.5018443926255,40.5019047643097,40.5019699837486,40.5020399921661,40.50209386762,40.5021418014689,40.5021835939361,40.5022190708406,40.5022480843228,40.5022705134609,40.5022862647753,40.5022952726177,40.5022974994456,40.5022929359778,40.5022816012341,40.5022624762581,40.5022498382964,40.5022437446353,40.5022442228963,40.5022512709117,40.5022496525929,40.502248025765,40.5022469993571,40.5022465739511,40.5022467513043,40.5022475319967,40.5022489134351,40.5022508906647,40.502253422033,40.5022553903884,40.5022567914354,40.5022576237434,40.5022578826889,40.5022575708608,40.5022566853088,40.5022451995566,40.5022345992477,40.5022248892905,40.5022107946337,40.5022087722884,40.5022060028895,40.5022024893344,40.5021982326788,40.5021895533675,40.5021816042242,40.5021743909915,40.5021731610588,40.5021713641687,40.502169003225,40.5021660792771,40.5021625967343,40.5021585595057,40.5021539731674,40.5021488427956,40.5021431748113,40.5021374175906,40.5021322523533,40.502127679658,40.5021237060825,40.5021203350361,40.5021175682361,40.502117221328,40.502115057793,40.5021122869281,40.5021073876936,40.5021017950156,40.5020955085996,40.5020931321258,40.5020915086798,40.5020906405135,40.502089572295,40.5020879202341,40.5020856875877,40.5020828794538,40.5020795017704,40.5020623815728,40.5020448057211,40.5020267764068,40.5020183729186,40.5020105857016,40.5020034258814,40.5019969027384,40.5019239170975,40.5019195487571,40.5019146330598,40.5019091749199,40.5019031842799,40.5018966712439,40.5018896444091,40.5018821148922,40.5018740959754,40.5018706242314,40.501867646287,40.5018651870606,40.5018632625884,40.5018601629217,40.501854705994,40.5018513182956,40.5018318057113,40.5018117321154,40.5018082763832,40.5018048171701,40.501804178372,40.5018073079564,40.5018154584137,40.5018314476809,40.5018493761571,40.5018555882513,40.501878153577,40.501882861804,40.5018908003454,40.5018990165797,40.5019054544204,40.5019114232839,40.5019168899239,40.5019218212707,40.5019261906335,40.5019299729946,40.5019331463607,40.5019369338376,40.50194012963,40.5019427251072,40.5019447146534,40.5019460913127,40.5019468546598,40.5019469992532,40.5019465285286,40.5019443106683,40.5019415725876,40.5019383153328,40.5019345422902,40.501930253334,40.5019254548666,40.5019201465904,40.5019143342454,40.5019088638069,40.5019080193748,40.5019012087118,40.5018869544787,40.5018512163846,40.5018372271486,40.5018228556278,40.5018168541104,40.5018164423034,40.5018175508798,40.501826860319,40.5017245374731,40.5016158508088,40.5015008828905,40.5013797210534,40.5012524573379,40.5011191884188,40.5011017728305,40.5010793195174,40.5010956471732,40.5009125316013,40.5007740942329,40.5006591577963,40.5006536150626,40.5006451409607,40.5006283835104,40.5006060285483,40.5005782177998,40.5005451275785,40.5005069676685,40.5004639799939,40.5004308318277,40.500402070555,40.5003779064463,40.5003585161628,40.5003440414644,40.5002662166543,40.5001836522673,40.5001255811003,40.5000774120319,40.5001130393443,40.5000994322511,40.500072282322,40.5000393353429,40.5000008355382,40.499957068293,40.4999083580372,40.499855065841,40.4997975867376,40.4997022426368,40.4996031326497,40.4995004380587,40.4993943467022,40.4992850526305,40.4991727557511,40.4991232554364,40.4991008453765,40.4991803513882,40.4991838455324,40.4991835019192,40.499177685819,40.4991659808482,40.499148583054,40.4991257838329,40.4989358561812,40.4988960758663,40.4984433840666,40.497938579618,40.4977029249419,40.4976623372096,40.497626498768,40.4975960289495,40.4975830136406,40.4975736269044,40.4975680950763,40.4975665515412,40.4975690335169,40.4975754811576,40.4975857389962,40.4975995596931,40.4976194069172,40.497632859332,40.4976396369494,40.4976395987053,40.4976327453956,40.4976189903634,40.4976111975922,40.4976094300577,40.4976137020438,40.4976239790273,40.4976353165101,40.4976417864513,40.4976432790815,40.4976397690764,40.4976313159872,40.4976180632298,40.4976260850383,40.4976270777944,40.4976210365174,40.4976079915171,40.4975880082422,40.4975611869515,40.497527662211,40.4975229787388,40.497523297359,40.4975286150482,40.4975388813436,40.4975539988219,40.4975835603278,40.4976067914486,40.4976234830946,40.4976334850339,40.4976367072446,40.4976331207255,40.4976227577567,40.4976024495692,40.4975873331067,40.4975774409763,40.4975727945163,40.4975734037494,40.4975792673614,40.497581750367,40.4975771307861,40.4975654368839,40.4975467402097,40.4975211551595,40.4974888382758,40.4974499872897,40.4974048399108,40.4973223888393,40.4972348168163,40.4971422381953,40.4970447738671,40.4969425511017,40.4968357033822,40.4967852569442,40.496664934793,40.4965490249588,40.4964377584558,40.4963313570427,40.4962300327809,40.4961339876118,40.4961350557024,40.496142901358,40.4961575098879,40.4961788539381,40.4962068935425,40.4962415761977,40.4962828369612,40.4963305985731,40.4963847716006,40.4964452546054,40.4965119343336,40.4965846859275,40.4966633731595,40.4967478486871,40.4968379543285,40.4968859564021,40.4970829033178,40.4971708507987,40.4973170270398,40.4974142932893,40.4975385265438,40.4976916622383,40.4978475627591,40.4980061635952,40.4980292149233,40.4980916014136,40.4981562766408,40.498222795947,40.4982907019942,40.4983595279091,40.4984288004923,40.4984980434721,40.4985102384084,40.4986181711168,40.49872511105,40.4988306029834,40.4989341978542,40.4989930906544,40.4990484918837,40.4991001374209,40.4991477810494,40.4991911956308,40.4992301741881,40.4992916155125,40.4993632133301,40.499400419586,40.4994332098564,40.4994372442445,40.4995090446916,40.4995776687945,40.4996430758863,40.4997130687038,40.4997875394894,40.4998662566383,40.4999489753388,40.5000354383335,40.5001253767188,40.5002185107816,40.5003145508689,40.5004131982884,40.5005141462376,40.5006170807576,40.5009588582138,40.5013012488962,40.5014146471709,40.5015262314677,40.5016356693446,40.5017426347526,40.5018468090075,40.5019478817393,40.5020455518173,40.5021395282469,40.5021611805097,40.5029652011596,40.5039345697351,40.5040555319572,40.5041782751198,40.5043023985762,40.5044274971723,40.5045531625685,40.5051701277708,40.5059651012041,40.506536454119,40.5067001870569,40.5068631932827,40.5069878208672,40.50711172047,40.5072347634825,40.5073568221844,40.507448663102,40.5075124444041,40.5075782383622,40.5076453201444,40.5077129507291,40.5077631050358,40.5078612288519,40.5078671412342,40.5080327763056,40.508243230713,40.5083974073779,40.5084336858024,40.5086748257271,40.5087160631388,40.5087240107788,40.5087643834418,40.5087563679415,40.5087711727758,40.5088056616307,40.5087865843331,40.5087768055205,40.5087360906861,40.5087241175428,40.5086839087999,40.5088043748303,40.5087916521513,40.5089911676056,40.508983190378,40.5089531131464,40.5089489447205,40.5089487661495,40.5089559975255,40.5089703148108,40.5089917179729,40.5090202069629,40.5091670471808,40.5092526716457,40.509376263846,40.5093290171447,40.5093441841346,40.509413694649,40.5093971242181,40.509391556843,40.5092729762901,40.50942393252,40.5093768927459,40.5094255964392,40.50943441373,40.5094673901707,40.5094769883739,40.5096829275579,40.5097737610049,40.5097809547389,40.5098801102975,40.509814602109,40.5098262459244,40.5099730153836,40.5099631967047,40.5098959731815,40.5096936597677,40.5094799147632,40.50947795816,40.5094705304363,40.5094809004459,40.5096020117476,40.5096727021023,40.509861504541,40.5100518185863,40.5102417657313,40.5103884965418,40.5107125810455,40.5110552573698,40.5110786437933,40.5110886893808,40.5110676534578,40.5111360772354,40.5111939897054,40.5112851461071,40.511392839393,40.5114581697316,40.511636688346,40.5115951978661,40.5115989922828,40.511630437916,40.5116494452441,40.5116189890877,40.5116227214743,40.511655887242,40.5116777660319,40.5117009178519,40.5114660621807,40.5114107659354,40.5114193781019,40.5114331604588,40.5114682279405,40.5118322699747,40.511859145417,40.5118860592251,40.5119124245936,40.511937666674,40.5119612351087,40.5119826160301,40.5119977773678,40.5120166851172,40.512037143881,40.5120585425898,40.512080242099,40.5121015942791,40.5121219613739,40.5121407350499,40.5125943288518,40.5127828131173,40.5129970025473,40.5132094449929,40.5133474300147,40.5134605297994,40.5135534708155,40.5137103798,40.5140048054485,40.5140100462964,40.5140369383815,40.5140622438935,40.5140911899284,40.5141173402795,40.5141405177726,40.5141747245711,40.5142126330703,40.5142538583395,40.5142979817682,40.5143445553166,40.5143556560213,40.5143663479782,40.5143763120543,40.5143852508423,40.5143928975376,40.5143990239017,40.514403447075,40.5144060350346,40.5144067105352,40.5144054534144,40.5144023011947,40.5144260465691,40.5144549765631,40.514488899321,40.5145275898762,40.5145707916429,40.5146232028531,40.5146497086461,40.5146809990421,40.5147168397105,40.5147569622438,40.5148010661675,40.5148488211901,40.5148621032715,40.5148747342273,40.5148864267787,40.5148969149899,40.5149059603164,40.5149133570308,40.5149189369018,40.5149465302598,40.5149781373393,40.5150131245524,40.5150448198551,40.5151388665138,40.5152190922518,40.5153294396867,40.5153339969147,40.5154411671746,40.5154455598171,40.5154572072675,40.5154528132084,40.5157163424289,40.5157720071091,40.5155099310939,40.5154630667598,40.5154506938884,40.5154550921156,40.5153611881995,40.515521545193,40.5161172992994,40.5160860435421,40.5161067410325,40.5161883350259,40.5161641686354,40.5161294593824,40.5155180502089,40.5150059281938,40.5150500962005,40.5151288709251,40.5151408143794,40.5150611950858,40.5150848612993,40.5154099582512,40.5155453779511,40.5155747299395,40.5156464885669,40.5156821642143,40.5156939809765,40.516137488191,40.5161600624044,40.5157165315774,40.5157252176842,40.5156878855975,40.5159040961153,40.5158812361306,40.5161126284968,40.5161695490199,40.516176485625,40.5163058895621,40.5163128360029,40.5161817278563,40.516215751053,40.5163562211343,40.5163649169489,40.5161699171485,40.5161957472779,40.5162257179013,40.5162886959993,40.5163133319179,40.5164869495537,40.5171945397867,40.5169514963223,40.5169808309211,40.5174756262651,40.5174497456811,40.5172084336925,40.5164860197475,40.5157358647787,40.5160664544178,40.5160368817765,40.5160724435157,40.515965028006,40.516116596447,40.5161273687957,40.5161373925737,40.5161467400325,40.5161537595176,40.516157605294,40.5161592304624,40.5161592663479,40.5161540565712,40.5161533984429,40.516140611034,40.516377700643,40.5163582023269,40.5164956132405,40.5165868265981,40.516669855306,40.5168793844854,40.5168818628046,40.5168954320692,40.5168939812546,40.5171820851956,40.5171982420842,40.5169069563709,40.5169014960667,40.5168850070146,40.5168916172023,40.5166873272109,40.5167025451673,40.516715162018,40.5167390938615,40.5169457921992,40.5169599603795,40.516753371935,40.5169432418591,40.5169319936506,40.5172897436241,40.5177897080513,40.5178572950031,40.5179844216215,40.5180494691411,40.5180755807458,40.518089862109,40.5180904952668,40.5180808625016,40.5180600230042,40.5180399130353,40.518029374765,40.518034064011,40.5180377840478,40.5180668394042,40.5181200211493,40.5181553245625,40.5182083203211,40.518258670008,40.5183395629248,40.518417044539,40.5184773788572,40.5185132270437,40.5185150031078,40.5185076467845,40.5184411593901,40.5183293846925,40.5182946146232,40.5183079242669,40.5183081832958,40.5182427688344,40.5183265250218,40.5184853174982,40.5187421218894,40.519180469823,40.519345603829,40.5195425131905,40.5194940801612,40.5193196571287,40.5192098124494,40.5191916289701,40.5192790998913,40.5195174984686,40.5196638079804,40.5198682305318,40.5200104641699,40.5200016848208,40.5200496587652,40.5200907119464,40.5201136784601,40.5201619710606,40.5203131190185,40.5204085289132,40.5204475289001,40.5205691516538,40.520653520167,40.5207536732821,40.5208068368255,40.520887399467,40.521060131432,40.5210324881871,40.5209478378477,40.5208945175802,40.520902279026,40.5209471383504,40.5209775494917,40.5212271606302,40.5214166865378,40.5214585449422,40.5216561980676,40.5220616542492,40.522198648498,40.5222516378235,40.5224113594454,40.5225727261597,40.5226567593634,40.522700777372,40.5227267891276,40.5228000781047,40.5228409302677,40.5228839377759,40.5229471351977,40.5230253393361,40.5230809375245,40.5230989378896,40.5231322288421,40.5231516126756,40.5231775442322,40.5232294093114,40.523267486031,40.5233670369891,40.523512274621,40.5235638506278,40.5235827177116,40.5236062505351,40.5236261080459,40.5236376263438,40.5236499529848,40.5236841448777,40.5237000687133,40.5237213078897,40.523760892376,40.5238036299162,40.5238324527127,40.5238479661431,40.5238633879074,40.5238919510028,40.5239252572832,40.5239517089902,40.523980193473,40.5240072962867,40.5240288737737,40.5240873508413,40.5241338135428,40.5241880948735,40.5242539206657,40.5243383284857,40.5243799987951,40.5244536426971,40.5245111044123,40.5245910796743,40.5247121770018,40.5247737290467,40.5247946017169,40.5248189133178,40.524834807612,40.5248453875907,40.5248612589508,40.5248448398466,40.5249053663379,40.5249509544872,40.5249989335866,40.52585380518,40.5266941777193,40.5268122893443,40.5268763125236,40.5269406949059,40.5270047611486,40.5270678392234,40.5271292674655,40.5271884015147,40.5272446210742,40.5272973364176,40.5275862583635,40.5276094521853,40.5276338961244,40.527667928706,40.5276978453756,40.5277260170556,40.5278002135596,40.5278668530282,40.5279227828697,40.527943815604,40.5279601301742,40.5280029745604,40.528031988595,40.528049101178,40.5282001308261,40.5283057272884,40.5283096931001,40.5283412582118,40.5283695886232,40.528394609924,40.5284082926777,40.5284163473034,40.5284175712362,40.5284209612882,40.5284148646244,40.5284175239479,40.5284459352659,40.528452137552,40.5284864584706,40.5285111366202,40.5285284416112,40.5285842152749,40.5286393855964,40.528661824991,40.5286833276684,40.5287119193927,40.5287344362276,40.5288325555689,40.528867268551,40.5288917904898,40.5289137849492,40.5289306973837,40.5289429459066,40.5289546995459,40.5289638220335,40.5289809989562,40.5290019274515,40.5290293196263,40.5290544427088,40.5290829278327,40.529137579352,40.5291973647668,40.5292613203743,40.5293125325604,40.5293767770006,40.5294081804538,40.5294375516603,40.5295006465767,40.5295901915116,40.5296664461275,40.5296913345426,40.5297048081704,40.5297222161771,40.5297424900077,40.5297597413011,40.5297836374173,40.5297948424696,40.5298080028346,40.52981657672,40.529822779505,40.5298350031157,40.5300622186607,40.5301105977654,40.5301872852151,40.53024455907,40.5303148823187,40.5303623347349,40.5303978822769,40.5304173128875,40.5304314162471,40.5304531426898,40.5304755824888,40.5304983512554,40.5305168090924,40.5305372925642,40.5305740381879,40.5305975512667,40.5306193371411,40.5306510157163,40.5306817372039,40.5307128439861,40.5307418376663,40.5307648072238,40.5307808261797,40.5308287364365,40.530874891264,40.5309267166376,40.5309801255867,40.5310413427952,40.5310802203233,40.5311228525491,40.5311434401659,40.5311754368563,40.5312231085837,40.5312428122419,40.5312732529333,40.5314700737949,40.5316097276535,40.5319233194476,40.5325626754215,40.5325761384766,40.5333874965178,40.5334044979461,40.5334172439722,40.5334256500478,40.5334366807957,40.533446585555,40.5334535473715,40.5334577406616,40.5334594787218,40.5334651284958,40.5334794008373,40.5334992276784,40.533533688414,40.5335344331879,40.5335587970897,40.5335724872598,40.533593673228,40.5336145750768,40.5336337184332,40.5336529358445,40.5336655568175,40.5336790227974,40.5337110215386,40.5337280411337,40.533760782844,40.533772005342,40.5337913370988,40.5338063852396,40.5338251423671,40.5338418052859,40.5338607223718,40.5338729435533,40.5339159161509,40.5339636177273,40.5339900457198,40.5340159875538,40.5340412163619,40.5340672151169,40.5341024803808,40.5341309645501,40.534163175491,40.5342297266423,40.5342570259348,40.5342734314612,40.5343059132815,40.5343279157796,40.5343463770505,40.5343650535251,40.534380646657,40.5343961145234,40.5344038547814,40.5344167228886,40.5344326524585,40.5344523631896,40.5344730133404,40.5344914731742,40.5345208832814,40.534557774971,40.5346041391003,40.5346171964618,40.5346335825483,40.5346518757233,40.5346607239726,40.5346706279636,40.5346829466395,40.5346954375881,40.5347038572792,40.5347228301898,40.5347412920504,40.534752927393,40.5347591025912,40.5347593633673,40.5347532570657,40.5347499357237,40.5347515637461,40.5347536169764,40.5347566643644,40.5347593130154,40.5347611627675,40.5347697547674,40.5347833548115,40.5348046576673,40.5348195043022,40.5348298567845,40.5348452701069,40.5348600022673,40.5348774350921,40.5348868482966,40.5349043678526,40.5349171655647,40.534928969112,40.5349380705868,40.5349491070345,40.5349568746064,40.5349678260783,40.5349839263954,40.5350005398268,40.5350178902475,40.5350469939228,40.535051289912,40.5350624423285,40.535075328242,40.5350895776311,40.5351056776626,40.5351217780472,40.5351337557664,40.5351440537985,40.5351552626182,40.5351716181778,40.5351872907248,40.5351979853921,40.5352149937681,40.5352450006491,40.535261583062,40.5352712843988,40.5352808990008,40.5352935583713,40.5353129604403,40.5353302234933,40.5353441007,40.5353541410764,40.5353700364427,40.5353836036373,40.5353936999398,40.5354067616979,40.5354159467722,40.5354224646282,40.5354273037417,40.5354378559357,40.5354510534029,40.5354592932408,40.5354648198177,40.5354759448961,40.5354844236569,40.5354972052362,40.5355110689942,40.5355207770167,40.5355298920595,40.5355419813586,40.5355535765825,40.53557639059,40.5355855325703,40.5355992525943,40.5356116751914,40.5356192788284,40.5356289837029,40.5356331127557,40.5356363936328,40.5356394348625,40.5356423355141,40.535643844724,40.5356496537653,40.5356579214227,40.5356647244582,40.5356790864457,40.5356895520577,40.5357038182932,40.5357376180839,40.5357578353606,40.5357833339408,40.5358073368274,40.5358196883252,40.5358317324438,40.5358394577133,40.5358489752046,40.5358602887568,40.5358710448191,40.5358828511692,40.5358973474522,40.5359159749487,40.5359273443368,40.5359418871402,40.5359552369336,40.5359718316996,40.5359905750062,40.5359980666076,40.5360109041002,40.5360278079945,40.5360405825868,40.536057184642,40.5360676688104,40.5360801114245,40.536094559451,40.5361068553192,40.5361292021546,40.5361448291076,40.536160058568,40.5361706509038,40.5361762450931,40.5361803387483,40.5361831930289,40.5361875627541,40.5361878067581,40.5361873980348,40.5361849301841,40.5361817878715,40.5361803518608,40.5361821881944,40.5361828089009,40.536187310916,40.536196295729,40.5362064706342,40.5362212689829,40.5362264960506,40.5362373657428,40.5362827160319,40.536310809888,40.5363348101468,40.5363631776583,40.5363862042681,40.5364082007514,40.5364438896021,40.5364604985592,40.536492553851,40.5365179144538,40.5365466968021,40.536578069666,40.5366045845956,40.5366351821819,40.536669645486,40.536706796258,40.5367446935754,40.5367650713715,40.5368011120278,40.5368256581957,40.5368500616052,40.5368643465737,40.536881409917,40.5368936731239,40.5369193674361,40.5369261870475,40.5369333298733,40.5369340065399,40.5369315379676,40.5369292203306,40.5369228457604,40.5369165406049,40.5369104618827,40.5369092991663,40.5369128568749,40.5369203950905,40.536932696146,40.5369341823716,40.5369329270729,40.5369003809511,40.5368928799101,40.5368758094477,40.5368528445587,40.5368407213658,40.5368191762532,40.5367946970765,40.5367763510032,40.5367649744417,40.5367534554614,40.5367390951945,40.5367283088632,40.5367194207705,40.5367055212666,40.5366848452456,40.5366711895625,40.5366651754493,40.5366638769172,40.5366664714077,40.5366740422415,40.53668297337,40.5367062067076,40.5367124970447,40.536718901238,40.5367285841924,40.5367424344816,40.5367446928365,40.5367537816525,40.5367664075135,40.5367806140712,40.5367972438954,40.5368087277161,40.5368610344875,40.5368858010645,40.5369059944347,40.5369166877819,40.5369295208609,40.5369409020371,40.5369552284173,40.5369855482388,40.5370029190981,40.5370133506172,40.5370311418462,40.537057796466,40.5371139176075,40.5371460894479,40.5371570220122,40.5371649114617,40.5371687638757,40.5371763305214,40.5372002762859,40.53722673516,40.5372346457023,40.5372433885994,40.5372546213573,40.5372675136333,40.5372812600646,40.5372983039003,40.5373422175217,40.5373853926896,40.5374042114149,40.5374214157372,40.5375722931934,40.5377116381422,40.5377173576462,40.5377230783231,40.5377344255772,40.5377657929651,40.5377762872267,40.5377868502521,40.5377917402439,40.5377974815502,40.5378328149087,40.5378690460443,40.5379061754582,40.5379433966261,40.5379807118934,40.538016433399,40.5380514183244,40.5380848341388,40.5381199549326,40.5381409177338,40.5381585817918,40.5381661919508,40.5381738021127,40.5382265630738,40.5382445023768,40.5382822504714,40.5382993597441,40.5383197670836,40.5383298920868,40.5383400149131,40.5383441899563,40.5383483628249,40.5383533668751,40.5383583486191,40.5383682426704,40.5383888602752,40.5384210091413,40.5384251590298,40.5384292882847,40.5384376127167,40.5384635107818,40.5384802765505,40.5384971100736,40.5385140358427,40.5385293936701,40.5385430678212,40.5385568332104,40.5385856218998,40.5386412070319,40.5386892363448,40.5387222139784,40.5387677409539,40.5388300510951,40.5389386831538,40.5390221022161,40.5391133685951,40.539216203417,40.5393841523268,40.5394309091567,40.5394437337245,40.5394611914278,40.5394742091916,40.5394915259352,40.539513312429,40.5395332660278,40.5395516747157,40.5395692325816,40.5395855446137,40.5395990509836,40.5396190247196,40.5396353000146,40.5396569485744,40.5396884435529,40.5396932277889,40.5397170428338,40.5397506259848,40.539775619259,40.5398000130267,40.5398454746964,40.539896015277,40.5399723014307,40.5402135639307,40.5403857648649,40.5405185079056,40.5406330007916,40.5407576069281,40.5409267512491,40.5409495945773,40.5409597663464,40.5409695380618,40.5409762242218,40.540988485612,40.5409990531431,40.5410115993066,40.5410244434604,40.5410353118255,40.5410455807612,40.5410539451843,40.5410628206342,40.5410830767513,40.5412789321578,40.5413665126777,40.5414015623638,40.5414623713348,40.5415371214307,40.5416846431556,40.541809149598,40.5418413397944,40.5419306122808,40.5420221031478,40.5420663562588,40.5421241916123,40.5421927392043,40.5422133926557,40.5422343310506,40.5422401350427,40.5422501475459,40.5422624352719,40.542277831181,40.5422975141036,40.5423667996851,40.5424232559993,40.5425101014437,40.5431254033029,40.5430491192714,40.5430932404414,40.5435243204416,40.5435093317794,40.5448529483178,40.545696446932,40.547666195738,40.5476378111074,40.5478085075191,40.5478355113769,40.5478651352359,40.5478283445317,40.5477987150307,40.5478036175284,40.5476239908786,40.5471132197478,40.5470107997116,40.5469640127685,40.5469613240017,40.5469538091342,40.5469486777976,40.5469498453868,40.5469559732602,40.5469715229909,40.5469756889523,40.546984958823,40.5470016277856,40.5470505106587,40.5470683556056,40.5470960131832,40.547133217426,40.5471647693367,40.5471841400858,40.5472112811313,40.547231634753,40.5472581206082,40.547283738351,40.5473083311725,40.5473393384619,40.5473661092852,40.5473800866478,40.5473949885636,40.5474290593353,40.5474545610345,40.5474891835389,40.5475072313294,40.5475432672756,40.5475692984962,40.5476254843001,40.5476633101738,40.5476879567583,40.5477177408137,40.5477457590788,40.5477785866563,40.5478021521379,40.5478596562124,40.5479090397311,40.5479402364182,40.5479578079917,40.5479773179629,40.5480047570634,40.5480283899923,40.5480431696274,40.5480557817858,40.548075362195,40.5481034658855,40.5481447231582,40.5482105530967,40.5482398442218,40.5482729280895,40.5482934531067,40.5483149218837,40.5483333687509,40.5483602848393,40.5484167853267,40.5484542133651,40.548487115187,40.5485149542236,40.5485286485324,40.548524547457,40.5485242728314,40.5485349819311,40.5485583704181,40.548589476691,40.5486270433434,40.5486788101094,40.5487304733173,40.5488586741484,40.5489416752438,40.5489669897191,40.5489816317789,40.5489978120367,40.5490244172822,40.5490605397482,40.5491054626009,40.5491415668143,40.5491854570921,40.5492493100916,40.5493090068767,40.5493927876124,40.5494585262547,40.5495942100295,40.5496845546914,40.5497429760929,40.5498960519076,40.5498996515494,40.5499726885203,40.5500380950603,40.5500838898238,40.5501234685786,40.5501635367616,40.5501899811091,40.5502042731909,40.5502098354965,40.5502159885042,40.5502204659918,40.5502158289035,40.550207696017,40.5502165889972,40.550235820014,40.5502628927677,40.5502712459618,40.5502675850771,40.5502779487908,40.5502877186312,40.5502979227586,40.5503214550011,40.5503503994715,40.5503851599568,40.5503962049358,40.5504009600366,40.5504109283418,40.5504301436097,40.5504658895495,40.5505082234499,40.5505485894311,40.5505791769856,40.5506095459487,40.5506436085871,40.5506936990031,40.5507465110193,40.5508057805022,40.5508558156437,40.5509501666866,40.5510539010068,40.5510736188918,40.5511602011478,40.551203919967,40.5512562127038,40.5513110827821,40.5513539546876,40.5513934050192,40.5514294246617,40.5514534457627,40.5514723282535,40.551499799906,40.5515851770012,40.5516693060407,40.5517520062811,40.5518331000481,40.5518639173796,40.5518994844882,40.5519390984983,40.5519819765579,40.5520272713097,40.5520740876356,40.5521215003465,40.5521685724651,40.5522143737434,40.5522579990459,40.5522985862375,40.5523353332217,40.5523675137921,40.5530052166713,40.553005651786,40.5530048296193,40.5529989162419,40.5529862053543,40.5529819590446,40.5529760090161,40.5529530473146,40.5529454026044,40.5529386143521,40.5529369271517,40.5529360935121,40.552934474443,40.5529345476405,40.5529354172146,40.5529380254837,40.5529380414941,40.5529380483549,40.5529372016528,40.5529363542817,40.5529346528451,40.5529329507396,40.5529312498067,40.5529159133481,40.5529116567453,40.5528759005787,40.5528461168127,40.5528367618997,40.5528291228085,40.5528231960723,40.552807119724,40.5528011838318,40.5527943891346,40.5527790880418,40.5527722768529,40.5527688698978,40.5527654599865,40.5527611976267,40.5527569341536,40.5527347488035,40.5527296310983,40.5527253664533,40.5527006482454,40.5526597536277,40.5526256753612,40.5525950155097,40.5525677728411,40.5525430956321,40.5525328916314,40.5525226899005,40.5525142000163,40.5525057156887,40.5524913222139,40.5524752687453,40.5524693623427,40.5524660047963,40.5524652024344,40.5524661049837,40.5524687262001,40.5524730551039,40.5524782297294,40.5524842568072,40.5524919871261,40.5524997106138,40.5525091435659,40.5525194227505,40.5526170497514,40.5527686349536,40.5527951843808,40.5528225988845,40.5528877177281,40.5528902921079,40.5528937213153,40.5528988765517,40.5529117953626,40.5529169567266,40.5529246767473,40.5529281059498,40.55293324008,40.5529828842609,40.5530761629553,40.5532464654878,40.5533636979757,40.5533927900091,40.5534244388601,40.5534586486398,40.5534945644455,40.5535338947471,40.5535766401266,40.5536245127384,40.5536869139895,40.5537433362884,40.5538087773588,40.5538960128494,40.5539641920227,40.5540215201006,40.5540782358358,40.5541498301172,40.5542133200254,40.5542760948024,40.5544116317185,40.5545317791373,40.5545889380731,40.5547417333923,40.5548607840476,40.5549458009707,40.5550438329569,40.5551472535713,40.5553513037561,40.5554480985892,40.5555082416734,40.5555366580429,40.555557594259,40.5555752142087,40.5555786429469,40.5555637413842,40.5555379879935,40.5554955582395,40.5554622758758,40.5554165736652,40.5553867461627,40.5553902311873,40.5554346886008,40.5554862050538,40.5555164984662,40.5555208842654,40.555518532878,40.555489615686,40.5554814598646,40.5554915869628,40.5555275339146,40.555566774392,40.5556101361591,40.5556376434375,40.5556701289613,40.5556734822786,40.5556781815564,40.55568414505,40.5556912690233,40.5557012178997,40.5557124197142,40.5557245917192,40.5557374266781,40.5557506006204,40.5557852838731,40.5558174728418,40.5558462802193,40.5558709119129,40.555876798904,40.5558811854707,40.5558839636802,40.5558850651739,40.5558844628494,40.555882171527,40.5558782475853,40.5558727875739,40.5559155654796,40.5559369007815,40.5559636178882,40.5559994666251,40.5560294717631,40.5560645100242,40.5561070821051,40.5561422082308,40.5561656557033,40.5561924337997,40.5562551423876,40.5562970171392,40.5563105500536,40.5563115487116,40.5563125071648,40.5563117074991,40.5563175923925,40.5563418300989,40.5563618772567,40.5563794400924,40.5563903543115,40.5563888147754,40.5563855873968,40.5563765169267,40.5563616142242,40.5563350014883,40.5562941972232,40.5562725812173,40.556263488957,40.5562287446537,40.5561839786645,40.556146591495,40.5560883691282,40.5560385335164,40.5560354112466,40.5560585393957,40.5561012440972,40.5561073873266,40.5561107870519,40.5561070970169,40.5561063467583,40.5561109856868,40.5561331461376,40.5561482808225,40.5561500737047,40.5561584728676,40.5561951743784,40.5562306798821,40.5562538620644,40.5562557128459,40.5562498014911,40.5562157097815,40.5562290889671,40.556252367094,40.5562118792838,40.5558970655445,40.5560976940829,40.5560465699035,40.5559458700666,40.5559811002982,40.5559810256695,40.5559647609212,40.5558802675072,40.5557955614932,40.5557871426918,40.5557675579621,40.5557368400967,40.5556830692758,40.5556369421343,40.5555957933604,40.5555756195297,40.5555372411572,40.5555033736214,40.5554728600306,40.5554539633024,40.5554341889625,40.5554153306156,40.5554062097797,40.5554268220372,40.5554570571033,40.5554793677396,40.5554871540743,40.55548383538,40.5554703093969,40.5554661219303,40.5554652433524,40.5554458904455,40.5554168847142,40.5554027159695,40.5553933757712,40.5554170707591,40.5554393453128,40.5555030704898,40.5555551977382,40.5555892037056,40.5556362104214,40.5556462026804,40.5556489829577,40.55563420919,40.5555920558003,40.5555620366215,40.5555418487652,40.555529074999,40.5554820906085,40.5554513266668,40.5554129035281,40.5553787794529,40.5553643204767,40.5553584448025,40.5553662246856,40.5553876639592,40.5554313054143,40.5554637761489,40.5555193059903,40.555573982754,40.5556286573585,40.5556833439201,40.5557004728413,40.5556997458239,40.5557015312229,40.5557143698967,40.5557690665478,40.5558229069806,40.5558784664815,40.555911800557,40.555938348008,40.5559402022778,40.5559283310136,40.5559104943423,40.5559012410238,40.5558988210052,40.5558852841704,40.5558673947937,40.5558162003098,40.5557658638741,40.5557482891152,40.5557308875244,40.5557070145355,40.5556497941233,40.555635296662,40.5556157906798,40.5555979210628,40.5555774438252,40.5555210839151,40.5554997514427,40.5554988967083,40.5554733614595,40.5554255948957,40.5553786279028,40.5553222443684,40.5552641627717,40.55520864635,40.5551531583414,40.5550976741182,40.5550669391446,40.5550601355795,40.5550059234361,40.5549288129258,40.5548419072737,40.5547645037675,40.5546984378754,40.5546507855019,40.5546215637843,40.5546126720725,40.5546268358581,40.5546547233885,40.5547021463244,40.5547186469989,40.5547221648009,40.5547253297247,40.5547545323154,40.554745466985,40.5547587941402,40.554801299016,40.554847002198,40.5549280655237,40.5549747097994,40.5550714335956,40.555118169686,40.5551561951189,40.5552645263114,40.5553946478262,40.5554555836068,40.5554746065513,40.5554892643519,40.5555121822516,40.5556137481532,40.5556913669811,40.5557508520458,40.5557953823719,40.5557969698786,40.5557794458626,40.5557526527255,40.5557029764862,40.5556562016539,40.5555655530597,40.5555281053873,40.5555173636249,40.5555314801662,40.5555287106553,40.5555071405332,40.555442015202,40.5553525389268,40.5552279970314,40.5550470798131,40.5548575834158,40.5547776560985,40.5547387918329,40.5546722897858,40.5546742102478,40.5547073881393,40.5547388841095,40.5548200423723,40.5548736475094,40.5549328819815,40.5550402534272,40.5552700780666,40.5554761247155,40.5556624132944,40.5558129836863,40.5558747189862,40.5558934697881,40.555955465545,40.5560277405373,40.5560410156986,40.5560504118362,40.5560331498668,40.5557276261541,40.5556905496529,40.5556005232485,40.5555104132051,40.5554652717783,40.5552929288252,40.5550950434755,40.5550052847762,40.5550938654166,40.5551590894186,40.5552309357496,40.5553092927941,40.5553940388212,40.5554803152356,40.5555441187831,40.5556586489737,40.5558130984218,40.5562423891321,40.5565239272557,40.55665149155,40.5567556383799,40.556794932796,40.5569133622209,40.5568991652001,40.5567242985429,40.5566888641017,40.5567003056785,40.5567265713545,40.5566367520729,40.556557317917,40.5565887294133,40.5566197328443,40.556632232104,40.5566308113933,40.5566583358338,40.556657154797,40.5565872958573,40.5565744865323,40.5565421654975,40.5565138138674,40.5564961264968,40.5564876701396,40.5564712218028,40.5564292634126,40.5564012878501,40.556399062055,40.5563969433253,40.5564133032036,40.5564350035155,40.5564871921683,40.5565118197531,40.5565258804821,40.5565292877499,40.5565338979699,40.5565399136965,40.5565599037075,40.5565859579645,40.5566249342766,40.5566726237383,40.5567046944305,40.5567644573872,40.5567790816549,40.5568031387357,40.5568270275884,40.5568507359773,40.5568742525,40.5568874753485,40.5569009482098,40.5569146414035,40.5569285289445,40.5569425824919,40.5569567755679,40.5569710779986,40.5569854623024,40.5569940388014,40.5570025941895,40.5570110823932,40.557019461848,40.5570276862931,40.5570357139806,40.5570435021561,40.557051009891,40.5570581984364,40.5570650296988,40.5570714681033,40.5570774809012,40.557089579252,40.5571013225943,40.5571126857471,40.5571236433734,40.5571341723068,40.55714425122,40.5571538567741,40.557162970483,40.5571726221359,40.5571818393726,40.557190605725,40.5571989047231,40.5572067204065,40.5572140394855,40.5572208471682,40.5572271318377,40.5572328801982,40.5572302675659,40.557228209613,40.5572267078149,40.5572275568211,40.5572289868784,40.5572309830977,40.5572335244065,40.5572365865467,40.5572401342135,40.5572441349567,40.5572485452816,40.5572533206959,40.5572584126962,40.5572618052748,40.5572644919006,40.5572664592096,40.5572676983593,40.5572682020168,40.5572716990729,40.5572756334148,40.5572799719471,40.5572846839257,40.557289727057,40.5572950642514,40.5573006512171,40.5573064450216,40.5573123972077,40.5573184618424,40.5573245909921,40.5573307330488,40.5573368414442,40.5573428660971,40.5573487599547,40.5573544741329,40.5573599652829,40.5573651890653,40.5573701026542,40.5574127977916,40.5574329112739,40.5574531153822,40.557473385998,40.5574936966623,40.5575140265942,40.5575343483278,40.5575485248539,40.5575627584714,40.557577017858,40.5575912701764,40.5576054829286,40.5576196225968,40.5576336596878,40.5576475600081,40.5576635098191,40.5576791432349,40.5576944414674,40.5577093832056,40.5577239474781,40.5577381149821,40.557751865409,40.5577651818013,40.5577784444584,40.5577913438152,40.5578038604063,40.557815983308,40.5578276972452,40.5578389865958,40.5578498414487,40.557853465531,40.5578602476887,40.5578773129462,40.55789490211,40.5579316128322,40.5579389777118,40.5579468016491,40.5579550603007,40.5579637324983,40.5579727920575,40.5579822127956,40.5579919705443,40.5580020354409,40.5580123801398,40.5580222820111,40.5580229749496,40.558033790027,40.5580447931786,40.5580559563988,40.5580672443256,40.558078627959,40.5580948212349,40.5581114003082,40.5581283530903,40.5581456643075,40.5581633161796,40.5581812949404,40.5581995826445,40.558218164359,40.558237019624,40.5582561355173,40.5582754919238,40.5582954632922,40.5583157208548,40.5583362500217,40.5583570375396,40.5583780669784,40.5583993249165,40.5584207974345,40.5584424682743,40.5584643226759,40.5584863458882,40.5585085219889,40.5585308367214,40.5585532718222,40.5585758147169,40.5585984489846,40.5586211575264,40.558643926605,40.5587044284709,40.5587648282817,40.5588251188292,40.5588852957562,40.5589453536973,40.5590052864508,40.5590650896529,40.5591247572762,40.5591316201801,40.5591384877153,40.559145313807,40.5591520462034,40.5591586395327,40.5591650454021,40.5591712177899,40.5591771138588,40.5591826899448,40.5591879069138,40.5591927269857,40.5591971163984,40.5591993019999,40.5592021072815,40.5592055189128,40.5592095304412,40.5592141322271,40.5592193077622,40.5592250448807,40.5592313264098,40.5592381351561,40.5592434987111,40.5592492557655,40.5592553735544,40.5592618206414,40.5592685608902,40.5592755610193,40.5592827835399,40.5592901879449,40.559297737577,40.5593053917432,40.5593131097515,40.5593208517392,40.55932857465,40.5593362386039,40.5593438040505,40.559351230262,40.5593778390797,40.5594042917722,40.5594305715672,40.5594566638872,40.5594825519627,40.5595012076988,40.5595200552546,40.5595390729989,40.5595582413273,40.559577536094,40.5595969378618,40.5596115220237,40.559625911993,40.5596400869668,40.559654029341,40.5596677183166,40.559681134438,40.5596942604246,40.5597070751364,40.5597195649766,40.5597353428009,40.5597508166665,40.5597659706342,40.5597807844082,40.5597952420392,40.5598093269131,40.5598230242609,40.5598363154455,40.559849188374,40.5598603475444,40.5598719836542,40.5598840747112,40.5598965975472,40.5599095308465,40.5599228487663,40.5599365269777,40.559966135345,40.5599960452926,40.5600262482594,40.56005673318,40.5600874894862,40.5601037657049,40.560119812002,40.5601356107709,40.5601511457401,40.5601663997984,40.5601813568431,40.5601960022675,40.5602103182982,40.560224290661,40.5602578561961,40.5602918448836,40.5603262511797,40.5603610651807,40.5603725561317,40.5603843416801,40.5603963981751,40.5604087009632,40.5604212268959,40.560433949653,40.5604468429072,40.5604598818525,40.5604730401691,40.5604862903705,40.560499607151,40.5605129620274,40.5605263291962,40.560557982003,40.5605896521364,40.5606213238441,40.5606529800394,40.5606846043064,40.5607161790553,40.5607231725926,40.560730128386,40.5607369883147,40.5607436912528,40.5607501814623,40.5607564021996,40.5607623005899,40.5607678254516,40.5607729291248,40.5607775684854,40.560781040015,40.560785055338,40.5607895927764,40.5607946262831,40.5608001301434,40.5608060741155,40.5608124254405,40.5608191500076,40.5608262113611,40.5608375375949,40.5608491074018,40.5608608856381,40.5608728373159,40.560884928776,40.5608971235153,40.5609093856946,40.5609223489411,40.5609354816529,40.560948749001,40.5609621166593,40.560975549121,40.5609890118828,40.5610174065029,40.5610458267077,40.5610742616055,40.5611026957904,40.5611220255619,40.5611413150676,40.5611605334897,40.5611796485071,40.5611986281294,40.5612144882576,40.5612303530853,40.5612461986571,40.5612620011774,40.5612777345142,40.5612933736946,40.5613088964219,40.5613242752137,40.5613394862645,40.5613545077788,40.5614011391879,40.5614479738491,40.5614950052168,40.5615422193773,40.5615573824536,40.5615725325373,40.5615876473388,40.5616027030678,40.5616176801169,40.5616325541808,40.5616473034776,40.5616619058702,40.5616943474884,40.5617269287616,40.5617596371167,40.5617924631633,40.561814811046,40.5618373194059,40.5618599694761,40.5618827426451,40.5619056218225,40.5619285884005,40.5619516241149,40.5619747122124,40.5619978327518,40.5620209681398,40.562044099276,40.5620732317379,40.5621023584785,40.5621314712918,40.5621605562688,40.5621896053749,40.5622186042033,40.5622475452172,40.5623930635767,40.562415668165,40.5624381329512,40.5624604437152,40.5624825840387,40.5625045407035,40.5625262961301,40.5625478389351,40.5627152883389,40.5627353651293,40.5627556293122,40.5627760671585,40.5627966622587,40.5628174040709,40.5628382750149,40.5628592648768,40.562880492612,40.5629018476027,40.5629233132829,40.562944870384,40.5629665036722,40.5629881960605,40.5631182142499,40.5631344328511,40.5631507031944,40.5631670085184,40.5631833272163,40.563199639015,40.5632159248146,40.5632321658575,40.5632483408698,40.5632644304257,40.5632804142635,40.56329507219,40.5633156168015,40.5633508706127,40.5633861664819,40.5634214938589,40.5634568433615,40.5634922052749,40.5635158299911,40.5635392426254,40.5635624300968,40.5635853742934,40.5636080574439,40.5636304642835,40.5636525783799,40.5636784339357,40.5637045560829,40.5637309332432,40.5637575523379,40.5637844039764,40.5638114754093,40.5638387559115,40.5638662325672,40.5639125294586,40.5639590514252,40.5640057894149,40.5640527397388,40.5640998951828,40.564147250217,40.5641947989716,40.564242534073,40.5642904501503,40.564411630274,40.5644626002625,40.564513415102,40.5645640615607,40.5646145238742,40.5646377893915,40.5646612240992,40.5646848103953,40.5647085330291,40.5647323715496,40.5647563112075,40.5648563749541,40.5649686563648,40.5650691606796,40.5651394090472,40.5651828441244,40.5652281791292,40.5652739113621,40.5652970201072,40.5653218960115,40.565348623983,40.5653880208953,40.5654783944367,40.5655202001746,40.5655723953342,40.5656127855108,40.5657646766958,40.5658420978541,40.5659530616871,40.5659968521444,40.5660324800556,40.5660966211937,40.5661397882163,40.5661768033178,40.5662074588971,40.5662352204058,40.566275425732,40.5664147062594,40.5665604058212,40.5667003641124,40.5667917023392,40.5668530094794,40.5669150104237,40.5670287794258,40.5670703733084,40.5670982072199,40.5671334098729,40.5671747339821,40.5672090724096,40.5672490223286,40.5672899224859,40.5673183646423,40.5673611629271,40.5673953867993,40.5674424366568,40.567488948025,40.5675145848745,40.5675518270458,40.5675781570675,40.5676060187817,40.567638286862,40.5676672524185,40.5677014622518,40.5677907117819,40.5678252054795,40.5678458107647,40.5678852214847,40.5679280486581,40.5679353183823,40.5679492210779,40.5679495484677,40.5679477498916,40.5679482332954,40.5679617246303,40.567988171498,40.5680253007569,40.5680481031507,40.5680907163569,40.568123381156,40.5681589512212,40.5682496209371,40.5682828666464,40.5683243045152,40.5683719771764,40.5684098583772,40.5684454709937,40.5684752036048,40.5684913030333,40.5685177761293,40.5685419113513,40.5685750180244,40.5686027372391,40.5686403050682,40.5686790369875,40.5687256890681,40.5687639393424,40.568803322623,40.5688429042718,40.5688800904079,40.5689097939292,40.568943905532,40.5689883884386,40.5690246254702,40.5690620094681,40.5690902806721,40.5691079810947,40.5691340698344,40.5691756205568,40.569195658271,40.5692288051082,40.569271899254,40.5693019004363,40.5693410703216,40.5693686191907,40.5693975144406,40.56947561342,40.569538972065,40.5695642686089,40.5695917744844,40.56962429845,40.5696711203306,40.5697032346921,40.5697235847966,40.5697503549568,40.5697655197113,40.5697892291567,40.5698077373297,40.5698155893354,40.5698139892464,40.5698176744665,40.5698333202102,40.5698625856053,40.5699039524468,40.5699561034307,40.5701349051544,40.5701816562309,40.5702255072126,40.5702465814758,40.5702720202204,40.5702918471233,40.5703216932909,40.5703622522663,40.570411726478,40.5704371796881,40.5704564520564,40.5704895723132,40.5705179574008,40.5705493193003,40.5705642846515,40.5705864340291,40.5706071811697,40.5706233638559,40.5706399729415,40.5706493249187,40.5706621493878,40.5706719834503,40.570683135969,40.5706932253429,40.5707194234143,40.5726100009491,40.5740709849086,40.5741130277728,40.5741439596735,40.5741745573534,40.5742145921254,40.5742663402166,40.574327384941,40.5743719994408,40.5744141994022,40.574432912588,40.5744421467035,40.5744516141501,40.5744867964118,40.5745009465386,40.5745419525767,40.5745644791768,40.5746044472986,40.5746819683268,40.5747430253223,40.5747994711207,40.5748885088244,40.5749542066369,40.5750386553155,40.575104353109,40.5751512382511,40.5752028685576,40.5752545328726,40.5752828048705,40.5753157842927,40.5753558239328,40.575525127206,40.5756120970368,40.5756828746145,40.5757669615972,40.5758542300493,40.5759220201882,40.5759610605443,40.5759938585247,40.5760521391429,40.576103148283,40.576155380449,40.5761881377616,40.5762172710596,40.5762463522036,40.5762559935734,40.5762656204043,40.5762667750268,40.576277636849,40.5763055898362,40.5763372039776,40.5763688307762,40.5764089402397,40.5764344973347,40.5764588540215,40.5764722919368,40.5764880913083,40.5765208916516,40.5765439903516,40.5765573938155,40.576553787193,40.5765331887233,40.576518662148,40.5765187223779,40.5765346106395,40.5765431805194,40.5765797256094,40.576610461596,40.5766527368367,40.5767110941713,40.5767755148121,40.576837489263,40.5768751518161,40.5769016373689,40.5769273501177,40.5769454915328,40.5769660664752,40.5769805902315,40.5769890454447,40.5770169862721,40.5770400454918,40.5770679439849,40.5770873500021,40.5770994433858,40.5771079100462,40.5771212417852,40.5771540426293,40.5771795687926,40.5772002722201,40.5772015387563,40.5772307575801,40.5772648225804,40.5772976480489,40.577332887834,40.5773632750294,40.5773961217276,40.5774119841292,40.5774108603815,40.5774121502727,40.5774304296781,40.5774620666376,40.5774936978646,40.5775168229513,40.5775277811375,40.5775388189649,40.5775947527893,40.5776506867739,40.5777394357274,40.5778050798083,40.5778500434844,40.5779035275872,40.5779727967408,40.5780687993701,40.5781125195304,40.5781450560169,40.578163474742,40.5781738043745,40.5781884604905,40.5781999491033,40.5782321480402,40.5782594731698,40.578286810219,40.578310493682,40.5783335783241,40.5783566458399,40.5783748602953,40.5783827686304,40.5783997789014,40.5784258979093,40.5784465464842,40.5784726595279,40.5784969448158,40.5785157611864,40.5785412630765,40.5785582549629,40.5786166475536,40.5796032749716,40.5797642671455,40.5798424570515,40.5801700009204,40.5801020000802,40.5795110004113,40.5793036186336,40.5788590005879]}]],[[{"lng":[-73.897923512633,-73.8979673872822,-73.8980065291825,-73.8980403733342,-73.8980684312123,-73.8980902978177,-73.8981056575226,-73.8980911934983,-73.8980683174928,-73.8980371566637,-73.8975210877602,-73.8974703131031,-73.8974260640104,-73.8973884526943,-73.8973575745283,-73.897318413995,-73.8972874816492,-73.897264822315,-73.8973324762698,-73.8974219698374,-73.8972443746733,-73.8967343767552,-73.8963103780021,-73.8961557356709,-73.8957308002896,-73.8957024792063,-73.8956727864848,-73.8956446981448,-73.8955464921217,-73.8954708500579,-73.8952404495164,-73.8948968982871,-73.8944468875035,-73.8934431381874,-73.8921786575121,-73.8916898855302,-73.8912701795326,-73.8908867031674,-73.8905035830003,-73.8902542797344,-73.890177442278,-73.890159837874,-73.8901336687324,-73.8900515142445,-73.8896716347519,-73.8887607883856,-73.8883831716343,-73.8882358782069,-73.8877019927043,-73.8885228590148,-73.8891031898245,-73.8899345067149,-73.891138527973,-73.8913849792518,-73.8917501641674,-73.8923264405576,-73.8925555458947,-73.8927840566608,-73.8930108811507,-73.8932349445219,-73.893474082341,-73.8937090565305,-73.8939378054027,-73.8941583550504,-73.8942464489958,-73.8944075965432,-73.8945753186968,-73.8945754485786,-73.8945755791367,-73.8947480902758,-73.8947482794019,-73.8947484799933,-73.8949242170837,-73.895101334044,-73.8960293159074,-73.8965110517443,-73.8969118803862,-73.8978323694189,-73.8980688299364,-73.8980689598616,-73.898069101461,-73.8983078669028,-73.8983079961665,-73.8983081274275,-73.8985475866269,-73.8985477282389,-73.8985478709664,-73.8987862131798,-73.8987863429133,-73.898786461428,-73.8990220996638,-73.8992294476897,-73.8994334853201,-73.899632578958,-73.8998251310634,-73.9000096941265,-73.9000973899021,-73.9001821122135,-73.9002634864665,-73.9003411528722,-73.900414768038,-73.9004840064317,-73.9005485620062,-73.9006081493443,-73.9006625049975,-73.9007113886511,-73.900910948234,-73.901079709003,-73.9025965084254,-73.9041685326732,-73.9042188893803,-73.9051805791977,-73.9055774010374,-73.9057242363777,-73.9067302812899,-73.9069304991158,-73.9070686729543,-73.9071225307847,-73.9071670524445,-73.907300137503,-73.9074099735685,-73.9080468088052,-73.9088917379157,-73.9097164608149,-73.9113450690157,-73.9125718774385,-73.9131696980579,-73.9138482830903,-73.9142363291455,-73.9159775500327,-73.9161064067709,-73.9161065483886,-73.9161066790083,-73.9162316696665,-73.9162317520526,-73.9162318472211,-73.9163499523687,-73.9163500230956,-73.9164582462002,-73.9164584231399,-73.9164586007739,-73.916554679467,-73.9178930845565,-73.9190389757071,-73.9200671217348,-73.9205319833439,-73.9202753834074,-73.9203706416967,-73.9203784758091,-73.9203935863349,-73.9204096691618,-73.9204245680087,-73.920440613174,-73.9204594870263,-73.9204725382298,-73.9204892684868,-73.920508354633,-73.9205258077789,-73.9205441937068,-73.9205637391544,-73.9205865749245,-73.9206121432909,-73.9206268153005,-73.920640090708,-73.9206666344579,-73.9206917819405,-73.9207160196419,-73.9207365054163,-73.9207593479,-73.9207817057936,-73.9208164191427,-73.9208388119997,-73.9208588364714,-73.9208751461612,-73.9208891362726,-73.9209070691402,-73.9209247883789,-73.9209462455049,-73.9209639261338,-73.9209835116709,-73.9210063028364,-73.9210305009436,-73.9210500951436,-73.921069170603,-73.9210854764631,-73.9211003602585,-73.9211210645027,-73.9211373296538,-73.9211554651799,-73.9211773128802,-73.9212010450519,-73.9212229310019,-73.9212420038773,-73.9212615530438,-73.9212783211176,-73.9212941527061,-73.9213118324226,-73.9213318560393,-73.9213486251067,-73.9213649328236,-73.9213810125257,-73.9213955720277,-73.9214045064076,-73.9214170974647,-73.921433865007,-73.9214608364391,-73.921471767485,-73.9214847786441,-73.9214998865271,-73.9215137430053,-73.9215181799062,-73.9215332859704,-73.9215458268432,-73.9215632859764,-73.9215779153546,-73.9215937042001,-73.92160762415,-73.9216214246638,-73.9216344361816,-73.9216493313895,-73.9216656341425,-73.9216856551197,-73.9217019481027,-73.9217177447742,-73.9217354590234,-73.9217547948118,-73.9217754928398,-73.9217948304397,-73.9218148936461,-73.9218337989168,-73.9218445118109,-73.921861070586,-73.9218766582319,-73.9218946254405,-73.9219125537207,-73.9219244072777,-73.9219344352587,-73.9219464716273,-73.9219573905526,-73.9219743828753,-73.9219937196353,-73.922011651306,-73.9220321719551,-73.9220507846261,-73.9220698622336,-73.9220880381662,-73.9221062154286,-73.9221276108213,-73.9221462605746,-73.9221639664142,-73.9221825827191,-73.9221998268746,-73.9222186896429,-73.9222340595316,-73.922251723296,-73.9222680257458,-73.9222862028089,-73.9223039225149,-73.9223200136042,-73.9223354169007,-73.9223563826482,-73.9223741023187,-73.9223932169671,-73.9224184041264,-73.9224407734077,-73.9224621946858,-73.9224822182109,-73.9224999227984,-73.9225157558973,-73.9225329963935,-73.9225493037422,-73.9225632682978,-73.9225830276643,-73.922591261957,-73.9225979219738,-73.9226118696129,-73.9226253566582,-73.9226416597122,-73.9226588627156,-73.9226761032647,-73.9226909998883,-73.9227093903446,-73.9227266327153,-73.9227457620729,-73.9227625341968,-73.9227830219704,-73.9228026091175,-73.9228433687201,-73.9228612993968,-73.9228792284309,-73.9228981288989,-73.9229160606941,-73.9229312116517,-73.9229407760558,-73.9229631428591,-73.9230112747129,-73.9231477900728,-73.9232087602716,-73.9232142898864,-73.9232572329583,-73.9234449385153,-73.9234628472146,-73.9235012152602,-73.9236463752569,-73.9236866286138,-73.9237382036233,-73.9237514865551,-73.9240693967572,-73.9241270832848,-73.9241468540513,-73.9241764431352,-73.9241921799115,-73.9242843453707,-73.9243568372605,-73.9244806333846,-73.924557371089,-73.9246532739554,-73.9246880312783,-73.9249031616518,-73.9249873243426,-73.9250650689491,-73.9251366604138,-73.9251384459361,-73.9251696390122,-73.9252822231221,-73.9253014448664,-73.9253950325553,-73.9255238699896,-73.9255380741783,-73.9256878512807,-73.9261999127306,-73.9262280389225,-73.926556639124,-73.9265728603484,-73.9266199471805,-73.9269261311045,-73.9270877469128,-73.9271379695701,-73.927234332344,-73.9272172111994,-73.9277619680096,-73.9278527894414,-73.9281097231047,-73.9282834334517,-73.9284859122038,-73.9285567608544,-73.928614866243,-73.928655375073,-73.9287082478099,-73.9287755675614,-73.9288196428459,-73.9288988531177,-73.92893416423,-73.929102834849,-73.9292348587617,-73.929392573708,-73.9299441513706,-73.9304397104302,-73.9307087143373,-73.9309916366931,-73.9311926779665,-73.9312634539215,-73.9312980015332,-73.9314339805235,-73.9320430867127,-73.934130163278,-73.9345317637569,-73.9358875133336,-73.9359282069928,-73.9361331048847,-73.9363631594391,-73.9364456396713,-73.9364813861403,-73.9372540559563,-73.9377791569555,-73.9380447850717,-73.9387573597812,-73.9390136209659,-73.9391105457482,-73.9391741165019,-73.9392102684031,-73.9393686320022,-73.9394097369897,-73.939419187766,-73.9394525345588,-73.9394877863568,-73.9394964568393,-73.9394122092593,-73.9394641421489,-73.9394718657831,-73.9394848808119,-73.9395419671341,-73.9396676288666,-73.9397490270061,-73.939784369903,-73.939869831538,-73.939910498297,-73.940032009911,-73.9400562035605,-73.9401010733239,-73.9401653864096,-73.9400973777696,-73.9400180701291,-73.9400613502006,-73.9400798277736,-73.9401043685313,-73.9400670932704,-73.9403436597211,-73.9404503357523,-73.940664998562,-73.940864985927,-73.9412248046703,-73.9416219224385,-73.9416359680015,-73.9416229064841,-73.9416165522437,-73.9416247263647,-73.9418014397327,-73.9419045919499,-73.9419664127334,-73.9420304961384,-73.9420581884512,-73.9420836067158,-73.9421048338245,-73.9421480767947,-73.9421664528765,-73.942240434426,-73.9422794992248,-73.9422995102579,-73.9424079751155,-73.9425606631001,-73.942617301401,-73.9426417150165,-73.9426498587399,-73.9426591860719,-73.9427017688081,-73.9427115820274,-73.9427200810748,-73.9427367921152,-73.9427563072033,-73.9428693794647,-73.9429146802193,-73.9430393438586,-73.9431672166461,-73.9432420818111,-73.943288616927,-73.9433858428463,-73.9434315732658,-73.9434641066379,-73.9435767539787,-73.9435948034264,-73.943779415083,-73.943959137652,-73.9444505283114,-73.944846287513,-73.9454262974247,-73.9456025888231,-73.9457998131248,-73.9458912560021,-73.9459214586883,-73.9459286679214,-73.9459319100017,-73.9459347845989,-73.9459372701498,-73.9459393290148,-73.9459409598722,-73.9459421541397,-73.9459441033305,-73.9459451407771,-73.9459466981785,-73.9459474966501,-73.9459447990511,-73.9459372612599,-73.9459182746334,-73.9459117592784,-73.9459057556435,-73.9459000009114,-73.9458972659904,-73.9458946374178,-73.9458920914062,-73.9458896537249,-73.9458872862647,-73.9458568643379,-73.9458390231052,-73.9458253661904,-73.9458192949661,-73.945817518687,-73.9458156852472,-73.945813790249,-73.945811813659,-73.9458076700698,-73.945803158901,-73.9457942664955,-73.9457754367941,-73.9457233690433,-73.94568038334,-73.9456673765824,-73.9456386218702,-73.9456245960259,-73.9455853649194,-73.9455286316558,-73.9454881134532,-73.945455768032,-73.945425546034,-73.9453967338846,-73.9452426523583,-73.9451023158267,-73.9450582404641,-73.9450145771769,-73.9449646122529,-73.9449113999564,-73.9448983466561,-73.9448744062937,-73.944863816275,-73.9448539146758,-73.9448420965231,-73.9447876213864,-73.9447751976231,-73.9447650236028,-73.9447549529381,-73.944682454244,-73.9446579409492,-73.9446386006481,-73.9446350724616,-73.9446314383786,-73.9446277087421,-73.9446238370888,-73.9446156584657,-73.9446080364032,-73.9445995029498,-73.944566923444,-73.9445529583087,-73.9445454668576,-73.9445384229629,-73.9445316995587,-73.9445252592166,-73.9444955775668,-73.9444789503138,-73.9444625485796,-73.94402128752,-73.942578858122,-73.9428038426762,-73.9428008081442,-73.9425561280529,-73.9421533811752,-73.9414617346317,-73.9414088639151,-73.9413498379434,-73.9410177404142,-73.9407780174328,-73.9405088880573,-73.9403615928505,-73.9405614496908,-73.9402823024227,-73.9399239012415,-73.9396561121527,-73.9391087413809,-73.938669917532,-73.9385878697679,-73.9393074627925,-73.9397443589877,-73.9397560191852,-73.9400192297567,-73.9401485852122,-73.9396530152138,-73.9400481510223,-73.940084062907,-73.9401418148429,-73.940799728835,-73.9411881669621,-73.9415947003003,-73.9416500187961,-73.9418350499272,-73.9420336716566,-73.9420866491637,-73.942159377748,-73.942379730083,-73.942413219496,-73.9424481652732,-73.942481649229,-73.9425107645857,-73.9425340596049,-73.942570455487,-73.9425966684488,-73.9426156104155,-73.9426258139417,-73.9426491363561,-73.9426797256272,-73.9427001278653,-73.9427103405852,-73.9427276612133,-73.9427904564007,-73.9427113900596,-73.9426958836671,-73.9427060899211,-73.9427910693753,-73.9429014182886,-73.9432902686682,-73.9435316603867,-73.9435685336872,-73.9436055474795,-73.9436420113335,-73.9436772450775,-73.9437506879647,-73.9438227227753,-73.9438931341384,-73.943921871638,-73.9439417005788,-73.9439578703336,-73.9439699565719,-73.9443388253848,-73.9445925287479,-73.9448015954323,-73.9452386207262,-73.945294204149,-73.9453584794754,-73.9454823659012,-73.9460113525308,-73.9471508718118,-73.9503362620347,-73.9503931919435,-73.9507246822391,-73.9513603083832,-73.9513807145184,-73.9519220819225,-73.9521967275852,-73.9522153737711,-73.9522972079241,-73.9524335527293,-73.9524980537741,-73.9525664843774,-73.952602379668,-73.9526340058747,-73.9526988253611,-73.9527541290096,-73.9528313441821,-73.952916526892,-73.9530157405372,-73.9533183512227,-73.9534145447716,-73.9535001416298,-73.9536714854542,-73.953753519181,-73.9537772420148,-73.9537987880868,-73.9538088392085,-73.9538200274479,-73.9538588161983,-73.9538740654047,-73.9539963171034,-73.9540453811646,-73.9541609615426,-73.9542133515198,-73.9543425424345,-73.9544533926845,-73.9545743156288,-73.9546740564898,-73.9547421060803,-73.9547842177981,-73.9547966734193,-73.954810219488,-73.9548569689626,-73.9548758546972,-73.9549139806915,-73.9549396627944,-73.9549863108683,-73.9550231434197,-73.9550599759685,-73.9552036359052,-73.9552288078567,-73.9552906377164,-73.955319159808,-73.9553663637438,-73.9554117894204,-73.9554189159671,-73.9554267290453,-73.9554597198399,-73.9554676506792,-73.9554749670514,-73.9554944182283,-73.9555140840359,-73.9555150908609,-73.9555372448559,-73.9555513001427,-73.9555616242946,-73.9555680315287,-73.955574852079,-73.955602149902,-73.9556084627258,-73.9556145010639,-73.9556242935186,-73.9556352800724,-73.955679273707,-73.9556891959379,-73.9556980042799,-73.9558754192204,-73.9559807251381,-73.9561189747227,-73.956149084249,-73.9562149296224,-73.9562426116474,-73.956365934831,-73.9565418961317,-73.9565585662982,-73.9565767891618,-73.9566348235061,-73.9566558300674,-73.9567365002671,-73.9567987103568,-73.95682353901,-73.9568505322203,-73.9568802250153,-73.9569150907999,-73.9569190094735,-73.9569230334554,-73.9569315567593,-73.956957277261,-73.9569658816246,-73.9569736231516,-73.9569773173151,-73.9569809400718,-73.957020529486,-73.9570617922787,-73.9571046178665,-73.9571488910412,-73.9571745741813,-73.9572299336225,-73.9572534143635,-73.9572836920608,-73.957365367112,-73.95741470766,-73.9574660744286,-73.9575201657168,-73.9575786755596,-73.9575845020469,-73.9575899846836,-73.9575952093785,-73.9576002193402,-73.9576095673322,-73.9576345580439,-73.9576394031314,-73.9576443785898,-73.957649577856,-73.9576550372954,-73.9576916767166,-73.9577897723986,-73.9578129824212,-73.9578330544065,-73.9578717466859,-73.9579604436271,-73.9579851477651,-73.9580084880639,-73.9580372037262,-73.958106343487,-73.9581231238344,-73.9581376652032,-73.9582551216388,-73.9583670556231,-73.9584668239542,-73.9585843141115,-73.9586826049701,-73.9587857625724,-73.9588127854476,-73.9588750495311,-73.9589024865603,-73.9589248691931,-73.9589846885233,-73.959028446772,-73.9591362462812,-73.9591846931789,-73.9592059752958,-73.9592508637652,-73.959262363876,-73.9592734612116,-73.9593940815361,-73.9595318171985,-73.9596359543352,-73.9597242033729,-73.9597827034658,-73.9598369952847,-73.9598540465424,-73.9598734988492,-73.9599315835669,-73.9599529882304,-73.9600050997662,-73.9600176720868,-73.960028978455,-73.9600417288496,-73.9600546238286,-73.9600675790184,-73.9600804629095,-73.9600932301301,-73.9601055477781,-73.9601171329303,-73.9601275926811,-73.9601308516625,-73.9601334583407,-73.9601354506273,-73.960136863153,-73.9601384853693,-73.9601405649698,-73.9601426522078,-73.9601454720285,-73.9601490854786,-73.9601535168225,-73.9601604797993,-73.960169172422,-73.9602004587855,-73.9602111521168,-73.9602203656888,-73.9602240367821,-73.9602271534165,-73.960270489743,-73.9602854405677,-73.9607258037368,-73.961709101642,-73.9619544165528,-73.96209998909,-73.9621340461378,-73.9621641612823,-73.9621650561931,-73.9621658360878,-73.9621661744799,-73.9621664767356,-73.9621667637832,-73.9621670010405,-73.9621674098782,-73.9621676909266,-73.9621678571628,-73.9621679085983,-73.9621677386252,-73.9621672184747,-73.962163966583,-73.96215651228,-73.9621314673515,-73.962126540587,-73.962124687892,-73.9621248357296,-73.9621253712254,-73.9621263051699,-73.9621276250102,-73.9621314611295,-73.9621369520018,-73.9621432103087,-73.9621510758661,-73.9621821806658,-73.9622646205233,-73.9623520161974,-73.9623985933468,-73.9624253826674,-73.9624508562119,-73.9624747508786,-73.9624968456262,-73.9625169130367,-73.9625348459021,-73.9625505238162,-73.9625638494875,-73.9625918523497,-73.9626081981691,-73.9626201589866,-73.9624307900526,-73.9622091655788,-73.9617904832917,-73.961536557733,-73.9614315748347,-73.9614102719547,-73.9612851752416,-73.9612469794547,-73.9612468221942,-73.961261079398,-73.9613158836933,-73.9615053657722,-73.9617199019427,-73.9618263897672,-73.9619375008643,-73.9618880631812,-73.9618039742302,-73.961652517354,-73.9614589377523,-73.9612186285201,-73.9611177038758,-73.9610735862415,-73.96107392568,-73.9611090115081,-73.9612699680906,-73.9612909109322,-73.9613642674758,-73.9613661128063,-73.9613648658307,-73.9613605637523,-73.9613533349278,-73.9613469751279,-73.9613394216988,-73.9611081450143,-73.9611727785115,-73.9615525316896,-73.9611902978902,-73.9611136948121,-73.9610954865457,-73.9609716838548,-73.960934498066,-73.9606460218035,-73.9605972658329,-73.9605425204063,-73.9604826192219,-73.9604184744982,-73.9603510630808,-73.9602814115662,-73.9602105806668,-73.9601396490567,-73.9597747079781,-73.9597198152903,-73.9597558631759,-73.9597059836081,-73.9597572719071,-73.9600156892823,-73.9600219619768,-73.9599315706844,-73.9599331442771,-73.9599468523336,-73.960073636994,-73.9601237537595,-73.9601288535214,-73.9600349409628,-73.9600419950784,-73.9600576584307,-73.960177787216,-73.960216548921,-73.9602126194294,-73.9605088734164,-73.9605209098166,-73.9605685685849,-73.9605173253627,-73.9601195191879,-73.9601060263757,-73.9599229878987,-73.9599331149754,-73.9596322502396,-73.9595540130476,-73.9593619820903,-73.9594036821736,-73.9593910660958,-73.9594601317309,-73.9594691321388,-73.9597128047115,-73.9597285522864,-73.9601552551769,-73.9601260096239,-73.9600114713926,-73.9600261005691,-73.9598015174163,-73.9597913938324,-73.9595432284935,-73.9595241081917,-73.9593685295413,-73.9592997163362,-73.9592336894569,-73.9592159711042,-73.9591604228998,-73.9590995602886,-73.9590340408699,-73.9589448263477,-73.9588541993578,-73.958818415847,-73.9587753700448,-73.9591872398515,-73.9592218857206,-73.9594113400176,-73.9594181944255,-73.9594247965274,-73.9594310751916,-73.9594369665559,-73.9594424094085,-73.9594473453995,-73.959451726095,-73.959455498879,-73.9594586327234,-73.959461088671,-73.9594628429674,-73.959463877582,-73.9594641795542,-73.9594637511212,-73.9594632905869,-73.9594620474797,-73.9594600317459,-73.9594572667691,-73.959453776372,-73.9594495936257,-73.9594447610742,-73.9594393250003,-73.9594333382968,-73.9594268580354,-73.9594199474553,-73.9594126726536,-73.9594051050138,-73.959397318998,-73.9593893870819,-73.9593813868067,-73.9593733968078,-73.9588791994333,-73.958758548348,-73.9596490110313,-73.9596659058759,-73.9596367513388,-73.9596015058519,-73.9590666925803,-73.9590762888058,-73.9586225591623,-73.9584938930312,-73.9584785470835,-73.958471422987,-73.9584525226965,-73.9586245122263,-73.9586245007113,-73.9587375240832,-73.9591404409601,-73.9591694989292,-73.9591980100273,-73.9592253302228,-73.9592508423848,-73.9592739702227,-73.9592941913043,-73.9593110488566,-73.9593298227356,-73.9593407193065,-73.9593434270197,-73.9593378684471,-73.9593242024971,-73.959302819873,-73.9592743319041,-73.9592433877305,-73.9592055760204,-73.9591616778229,-73.9591125999168,-73.9590593560795,-73.9589674608343,-73.9588256570137,-73.9586415292084,-73.9585639815858,-73.9585022745932,-73.9585087621338,-73.9585201270168,-73.9585360582178,-73.9585561197422,-73.9585999347702,-73.9591437169293,-73.9587780625431,-73.9587203632678,-73.9586649067498,-73.9585774430487,-73.958483404791,-73.9584069333275,-73.9583981422614,-73.9583580081882,-73.9583078232392,-73.9584531679355,-73.9575188932101,-73.957493440047,-73.9570409727684,-73.9548539426804,-73.9547334795327,-73.9547056124169,-73.9543931791822,-73.9543059177703,-73.9543043432594,-73.9543724770986,-73.9543661914581,-73.9541516116393,-73.9541547616021,-73.9542275940771,-73.9542346639028,-73.9543027974418,-73.9543647478346,-73.9531838249286,-73.953053755714,-73.9547838786981,-73.9563216250967,-73.9561349924058,-73.9560116030271,-73.9560613473487,-73.9560688724459,-73.956249267227,-73.9562219902069,-73.9560453582323,-73.9560557026516,-73.9560006509462,-73.9557603914094,-73.9561741649249,-73.9561995300734,-73.9562013686724,-73.9561206641136,-73.9560879451089,-73.9560624580052,-73.9555951726589,-73.9554643693641,-73.9553492851445,-73.9552152996592,-73.955228094294,-73.9551323915248,-73.9552027504087,-73.9550665256017,-73.9545158457339,-73.9546500041312,-73.9544758598269,-73.95449874596,-73.9539571769585,-73.9539852368413,-73.953932227402,-73.9538018878991,-73.9536778274565,-73.9530311226815,-73.9530024245874,-73.9530115416991,-73.9528990276141,-73.9526932201441,-73.9521726229454,-73.9520814316973,-73.9517794957792,-73.951625387182,-73.9513674855783,-73.9510179266641,-73.9508770201765,-73.9508391707598,-73.9508076381835,-73.9491129519947,-73.9490827060623,-73.9490420195343,-73.948970213573,-73.9487795492734,-73.9478967108823,-73.9462957550284,-73.9440358037089,-73.9438353681251,-73.942719280804,-73.9425402228334,-73.9423834770959,-73.9418744195925,-73.9417770356669,-73.9410861243826,-73.9405203088532,-73.94039280634,-73.9402628154808,-73.9400209980992,-73.9394428434305,-73.9386371583589,-73.9379820917095,-73.9378116270893,-73.9374297356962,-73.9374154885158,-73.9373262628454,-73.9372960072456,-73.9373804606774,-73.937381538012,-73.9373836877828,-73.9373855812787,-73.9373928572593,-73.9373965378215,-73.9368348054646,-73.9367254201155,-73.9353868532155,-73.933939394172,-73.9315191206656,-73.9265160561276,-73.9246336947016,-73.9225504306775,-73.9216120809142,-73.921014801325,-73.9207124344269,-73.920539001505,-73.9202133376663,-73.9195757355013,-73.9181837583396,-73.9152560093149,-73.9131433924495,-73.9126711659089,-73.9098431864611,-73.9103411180102,-73.9106747489712,-73.9102312473466,-73.9082366112783,-73.907594259872,-73.906908897675,-73.9066854594976,-73.9061170803334,-73.9058644026395,-73.9049169137475,-73.9039228060483,-73.9029891234458,-73.9024721300924,-73.9021212034403,-73.9012134795135,-73.9003027629588,-73.8995734847149,-73.8992154677058,-73.8987381642835,-73.8986294744263,-73.8985422311188,-73.897923512633],"lat":[40.7542400026781,40.7542120009671,40.7541802000438,40.754145058949,40.7541070849377,40.7540668261564,40.7540248637308,40.7539385829134,40.7538533612141,40.7537696722237,40.752832376769,40.7527347880438,40.7526353790247,40.7525344018712,40.7524321127191,40.752268388305,40.7521036484609,40.7519381322374,40.7517890264151,40.7515416182159,40.7513005544233,40.7505204292329,40.7496277093708,40.7493346015193,40.7486150514112,40.748566072085,40.7485182124273,40.748473705578,40.7483222864038,40.7482056553529,40.7478504020762,40.7472810572633,40.7465352708128,40.7449579546392,40.7428727780394,40.7421448441982,40.7414282487896,40.7406872451642,40.7399027504751,40.7393922541524,40.7392349338419,40.7391988790892,40.7391444634683,40.7389736031946,40.7383151394919,40.7365363637948,40.7357583823087,40.7354411608881,40.7342913227586,40.7345311600154,40.7345923964625,40.7345599567433,40.7345129691644,40.734504989054,40.7344848097319,40.7344701402597,40.7344781263096,40.734495962249,40.7345235751979,40.7345608120557,40.7346021780483,40.7346574527841,40.7347262100445,40.7348077916827,40.7348418131671,40.7348993231489,40.7349464923144,40.7349465286191,40.7349465550403,40.7349827514936,40.7349827873496,40.7349828150073,40.7350077216808,40.7350211830895,40.7350178916089,40.7350967415428,40.7350866013284,40.7351603541823,40.7351835987958,40.7351836082923,40.7351836166265,40.7351941743269,40.7351941843251,40.735194184441,40.7351919100571,40.7351919101819,40.7351919009261,40.7351768201689,40.7351768109014,40.7351767929127,40.7351490839862,40.7351115982715,40.7350625906685,40.7350023583031,40.7349313950196,40.7348503206148,40.7348185058024,40.7347823281338,40.7347419475685,40.7346975426484,40.7346493097091,40.7345974622771,40.7345422293309,40.73448385508,40.7344225976226,40.7343587278039,40.7341260367359,40.7339146347793,40.7321044283459,40.7301865910331,40.7301252689164,40.7289565769738,40.7286366843154,40.7285200195862,40.7277326828304,40.7275760302747,40.7274665227726,40.7274247284378,40.7273886537873,40.7272943699146,40.7272087388807,40.7267338879102,40.7260684259766,40.7254459561267,40.7241821699518,40.7232396349499,40.7230815258964,40.7228984123538,40.7227736942151,40.7222516912755,40.7222258862613,40.7222258600627,40.7222258244747,40.722187436076,40.7221874093316,40.7221873737177,40.7221369855947,40.7221369499629,40.7220758660017,40.7220757667866,40.7220756406003,40.72200550648,40.7222706962186,40.722524493285,40.7227430484489,40.7229403423924,40.7236607855359,40.7236811133181,40.7236826847762,40.7236857748695,40.7236885779895,40.7236919116838,40.7236954612728,40.7236999229867,40.7237037774119,40.7237082096633,40.7237132122922,40.7237189609603,40.7237248803091,40.7237313961802,40.72373893087,40.7237472695576,40.7237519441213,40.7237554105225,40.7237606976998,40.7237648661705,40.7237676736917,40.7237693357573,40.7237712514014,40.7237725552349,40.7237745246019,40.7237762417369,40.7237784529514,40.7237792024513,40.7237792120646,40.7237791431343,40.7237783620656,40.723779800275,40.7237824243232,40.7237861920411,40.7237912865893,40.7237972373222,40.7238022495912,40.7238072234726,40.723811215086,40.7238157821822,40.723824693213,40.7238325752655,40.7238410162932,40.7238522067961,40.7238628397152,40.7238720485613,40.7238784914546,40.7238827010359,40.7238863322528,40.7238899459069,40.7238939384273,40.7238971036239,40.7238993395006,40.7239017906668,40.7239073213198,40.7239169132897,40.7239279230503,40.7239308680538,40.723934967485,40.7239474224041,40.7239533003333,40.723960396762,40.7239665750643,40.7239697728803,40.7239715588922,40.723978538637,40.7239842843049,40.7239936882538,40.7240036308816,40.7240147892013,40.7240252540257,40.7240356100422,40.7240426158222,40.7240491640267,40.7240553168185,40.7240613458219,40.7240658863242,40.7240698500272,40.7240745002159,40.724078601346,40.7240818838573,40.7240844452432,40.7240839643298,40.7240822747587,40.724081571215,40.7240816087554,40.7240822500712,40.7240830099327,40.7240861731042,40.7240918370142,40.7241000467622,40.7241103757445,40.7241155691048,40.7241207144791,40.7241232570681,40.7241246652159,40.7241275067979,40.7241321843508,40.7241354657121,40.7241385219742,40.7241423259064,40.7241465903655,40.724150448387,40.724151973292,40.7241535525858,40.7241550140158,40.7241582419337,40.724163601278,40.7241709966144,40.7241774825313,40.7241812864349,40.7241809377084,40.7241760678405,40.7241722328219,40.7241693655015,40.7241690442385,40.7241696603877,40.7241708033092,40.7241723038395,40.7241744081636,40.724177771344,40.7241803857907,40.7241833854595,40.7241880077322,40.7241908738616,40.7241930532286,40.7241995776115,40.7242032660563,40.7242062513375,40.7242125731217,40.7242188408186,40.7242254166448,40.7242312448986,40.7242358408482,40.7242401551167,40.7242435984115,40.7242460593935,40.7242452158334,40.7242449307307,40.724246177972,40.7242480015681,40.7242527196385,40.7242544613666,40.7242564815203,40.7242587717047,40.7242595489735,40.7242591188554,40.7242589352816,40.7242614721968,40.7242620697934,40.7242637655656,40.7242634192584,40.7242518153514,40.7242512407179,40.7242487448856,40.7242489281714,40.7242538431058,40.7242662947255,40.7242687708209,40.7242854558133,40.7242843118587,40.724289222582,40.7242926009261,40.724289850096,40.724280702018,40.7242757416934,40.7242910120934,40.7243072505331,40.7243393712908,40.7243592870883,40.7243876439844,40.7244036955173,40.7245065756715,40.7245549333568,40.7245948586997,40.7246339247652,40.7246349887159,40.7246534691011,40.7247208738991,40.7247329797924,40.724799840256,40.7248874171908,40.7248982412345,40.7250180341859,40.7254040876602,40.7254240425388,40.7256690652872,40.7256864285543,40.7257393187844,40.7260717647408,40.7262484303061,40.7263023933037,40.7264120557468,40.7264606452629,40.7269298647454,40.7269989907689,40.7272613806745,40.7275120908344,40.7277585796662,40.7278448281856,40.7278765596005,40.7278906800666,40.7279302757471,40.7279806886589,40.7280086136282,40.728056596974,40.7280810197028,40.7281976786858,40.7282601657611,40.7283085559944,40.7284331003509,40.7285631377871,40.7286066676042,40.7286175985837,40.7286429877768,40.7286772038105,40.7287254411126,40.7287425659902,40.7288097811031,40.7290519061202,40.729104806535,40.7294651148721,40.729481770739,40.7295633626513,40.7296433833015,40.7296721455986,40.7296865198416,40.7301346044158,40.7304004763208,40.7305099678461,40.7310782012054,40.7312984572628,40.7313798065256,40.7315062355775,40.7315595100273,40.7318610389953,40.7319348128633,40.7319815626066,40.7320870567146,40.7321661851417,40.7321994819165,40.7322358627536,40.7323017087395,40.7323351125699,40.7323809009008,40.732507029299,40.7327527266578,40.7329097093187,40.7329819945689,40.7331615192898,40.7332763283618,40.7332450443058,40.7332863764852,40.7333630289839,40.7334863743447,40.7335113349513,40.7335404412753,40.7336442347693,40.733688156104,40.7337529505413,40.7337621529801,40.7341952789314,40.7344325362747,40.7347788841614,40.7350704090911,40.7354428900986,40.7357987836502,40.7358190793985,40.7358238997184,40.7358328477718,40.7358414423382,40.7359625782013,40.7360134911547,40.7360422846099,40.7360667204671,40.7360790715554,40.7360917727964,40.7361047325959,40.7361356684894,40.7361466545562,40.7361843606823,40.7362016969772,40.7362105681503,40.7362526752734,40.7363146441841,40.7363400037614,40.7363495160144,40.7363516900405,40.7363530550001,40.7363542009677,40.7363552686377,40.7363571014167,40.7363626568636,40.7363708431974,40.7364244160105,40.736444096365,40.7364975946782,40.736548986957,40.7365790821462,40.7365960172028,40.736630545671,40.7366474884829,40.736659732885,40.7366982585715,40.7367177897736,40.7367754858605,40.736836101268,40.7370018298426,40.737127794559,40.7373232463832,40.7373820972261,40.7374521320005,40.7374825857392,40.7374937930369,40.7374962634162,40.7374977877537,40.737499454651,40.7375012388017,40.7375031127137,40.737505076554,40.7375071214396,40.7375125157005,40.7375183702311,40.7375245483317,40.7375331304154,40.7375454031408,40.7375564400968,40.7375675787257,40.7375709352409,40.7375733637321,40.7375749453263,40.7375753946876,40.7375756092267,40.7375755904403,40.7375753373352,40.7375748586049,40.7375688827107,40.737555735726,40.7375489580515,40.7375464783171,40.7375459460875,40.7375455582389,40.7375453058901,40.7375451781425,40.7375453386934,40.7375460304649,40.7375485113668,40.7375554275424,40.7375848673955,40.7376123127513,40.737622292531,40.7376482142303,40.7376592744045,40.7376843533437,40.7377157995456,40.7377370049668,40.7377523519926,40.7377646748233,40.737774224412,40.7378165297427,40.7378565620556,40.73787025609,40.7378855344341,40.7379058174502,40.7379309432528,40.7379386634942,40.7379560767953,40.7379629242265,40.7379679896726,40.7379727560031,40.7379905247232,40.7379962640849,40.7380026159957,40.7380112835054,40.7381079720933,40.7381295730668,40.7381383525421,40.7381389541087,40.7381392400044,40.7381392206209,40.7381388855493,40.7381372874349,40.7381348975227,40.7381314624769,40.7381155793674,40.7381097284854,40.738107338632,40.7381057241384,40.7381048650078,40.7381047449722,40.7381073145981,40.7381125754566,40.7381189062452,40.7382876639356,40.7388160202686,40.7388615469588,40.7388807235393,40.7390208657467,40.7390800517606,40.7392485836272,40.7392995707064,40.7393616308016,40.7396797728978,40.7399217814536,40.7401139417531,40.7403353456582,40.7404183229342,40.7407992824137,40.7413544306388,40.7417692158685,40.7426170356793,40.742534082025,40.7429308826875,40.743067754025,40.7431595125988,40.7431440174894,40.7432082722108,40.7428324414601,40.7427310870957,40.7420712263407,40.7420632446415,40.7419691861873,40.7408976683984,40.740290217792,40.739864126169,40.7398641542097,40.7396926207141,40.7396569385612,40.7395925870015,40.7395516335298,40.7394304719696,40.7394227376092,40.7394138966174,40.7394116994843,40.7394117140219,40.7394084027621,40.7394062070561,40.7393951478029,40.7393752264604,40.739358622475,40.7393232004168,40.7393021776813,40.7392778281562,40.7392512585251,40.7392315971958,40.7391937212044,40.7391436928612,40.7391338808317,40.7391150629787,40.7390690334541,40.7390038015044,40.7390086223932,40.7389228054914,40.7389255094908,40.7389243666841,40.7389193983884,40.7389106972788,40.7388926307465,40.7388715378655,40.7388474817,40.7388366292644,40.7388206171424,40.7388023798776,40.7387823960599,40.7386462397649,40.7385738880032,40.7385005783264,40.7383568236452,40.7383148585616,40.7382694853972,40.7382070312938,40.73812081425,40.7379001233448,40.7390069858434,40.7390275603396,40.7391305045488,40.7393149740384,40.7393364772951,40.739487305928,40.7395362548649,40.7395034567502,40.7395186285267,40.7395439344966,40.7395586394451,40.7395757779564,40.7395840236409,40.7395912888693,40.7396061794554,40.7396197002591,40.7396359957054,40.7396521130941,40.7396691732872,40.7397185986865,40.7397362699555,40.7397539274847,40.7397943388995,40.739813003818,40.7398172182536,40.7398198657746,40.7398202929779,40.7398198292286,40.739815116679,40.7398140698843,40.7398140913087,40.7398120578614,40.7398032702577,40.7398007334731,40.7397988486606,40.7398002791693,40.7398047487874,40.7398115330321,40.7398158997322,40.7398159162735,40.7398147151407,40.7398122435794,40.7397997084929,40.7397957810348,40.7397899874927,40.7397872687069,40.7397845773776,40.7397831858867,40.7397817960593,40.7397788080742,40.7397767923013,40.7397680902076,40.739765571126,40.7397648868244,40.7397670831009,40.7397679504634,40.7397694664182,40.7397777908352,40.7397790905562,40.7397796785547,40.739779560931,40.7397779656367,40.7397778847754,40.7397746336025,40.7397717845462,40.7397696986389,40.7397678824448,40.7397652193964,40.7397519387162,40.7397496711674,40.7397481424713,40.739746723946,40.7397461249164,40.73974760101,40.739747432946,40.7397467166414,40.7397217861325,40.7397113091255,40.739705157043,40.7397017556643,40.7396919293287,40.7396890133316,40.7396803340086,40.739668901197,40.7396668812549,40.7396632859752,40.7396476029152,40.7396427301099,40.7396273793441,40.7396173618367,40.7396147240636,40.7396135551297,40.7396138001178,40.7396154879278,40.7396158857611,40.739616580658,40.7396189344083,40.7396295068967,40.7396325359735,40.7396343756251,40.739634890306,40.7396351342375,40.7396349508352,40.7396318328136,40.7396257977201,40.7396168624302,40.7396098849612,40.7395921200965,40.7395859690372,40.7395801454955,40.7395671003274,40.7395565820116,40.7395434185115,40.7395274360221,40.7395081411281,40.7395057669126,40.7395027611632,40.7394991064889,40.739494740921,40.7394841908708,40.7394503220458,40.7394454529987,40.7394413031901,40.7394377934143,40.7394348859913,40.7394202211314,40.7393895954446,40.7393812110453,40.7393726728758,40.7393524702881,40.7392999126522,40.7392873513257,40.7392773013871,40.7392680362533,40.739250609197,40.7392451043522,40.7392391123621,40.7391836297192,40.7391333320791,40.7390950519714,40.7390411620124,40.7389982611435,40.7389546055505,40.7389441516876,40.7389221922991,40.7389111977878,40.7389003909397,40.738868272825,40.7388480540614,40.7388012208244,40.7387790593536,40.7387669185506,40.7387358309905,40.7387292437332,40.7387239975487,40.7386773579076,40.738618332731,40.7385762702298,40.7385355987465,40.7385117106613,40.7384939716428,40.7384900965041,40.7384874639052,40.7384846395307,40.7384851596066,40.7384912475323,40.7384920984087,40.7384921648208,40.7384909901947,40.7384881751989,40.7384837496238,40.7384777481017,40.7384701704494,40.7384611959724,40.7384510334783,40.7384400240825,40.7384356390347,40.7384307691071,40.7384253658978,40.7384193428077,40.7383797925649,40.7383668622572,40.7383610451228,40.7383558953321,40.7383513490785,40.738347343883,40.7383427800249,40.7383385062503,40.7383269907481,40.7383223656887,40.738316866132,40.7383138866028,40.7383107004895,40.738259935851,40.7382439923271,40.7380801701792,40.7382189186632,40.738240882265,40.7382601917795,40.7382658858129,40.7382722349097,40.738272538259,40.7382729249986,40.7382731490926,40.7382734011516,40.7382736729737,40.7382739700759,40.7382746409859,40.7382753931043,40.7382762572601,40.738277213015,40.7382790513939,40.7382812508446,40.7382912417207,40.7383188570031,40.7383928456819,40.7384154147254,40.7384359052745,40.7384385266086,40.7384411078638,40.7384436520593,40.7384461568454,40.7384510706508,40.7384559256958,40.7384602315062,40.7384647420592,40.7384800306847,40.7385233847426,40.7385645528017,40.7385832356519,40.7385970576164,40.7386120979002,40.7386281898972,40.7386451772341,40.7386628846054,40.7386812161523,40.7387000458566,40.7387192673085,40.7387682091899,40.7387955390568,40.7390326621261,40.7396714805854,40.7400061749957,40.7400131304171,40.7401598231021,40.7402966906947,40.7403236216282,40.7403492848866,40.7404235966126,40.7404247312156,40.740446795044,40.740470639565,40.7405302673822,40.7405994347961,40.7406316341944,40.7407948788159,40.7409821698098,40.741097673472,40.7411327570986,40.7411375051767,40.7411078601302,40.7415372776615,40.741625928074,40.7416945047522,40.7417940714644,40.7418310892129,40.7417939466234,40.7418100670162,40.7418236127327,40.7418371979019,40.7418504171917,40.7418628761863,40.7418707247334,40.7418779353153,40.7418280254053,40.7418863341411,40.7419932614072,40.7426448552597,40.7427485491379,40.7427819472288,40.7427540542637,40.7428297600225,40.7433927062632,40.7434319833622,40.7434663939715,40.743495414059,40.743518601683,40.7435356037229,40.7435461612573,40.7435501135071,40.7435474002838,40.7435046837005,40.7436930454653,40.7436988494501,40.7438586500612,40.7438747506824,40.7439201098011,40.7439073061033,40.7437997595164,40.7437887403534,40.7437845758951,40.7439299583349,40.7439392079025,40.7439264037928,40.7438131975336,40.7438030740234,40.7438036750124,40.7439478637493,40.7439574075467,40.7439809340804,40.7440419926505,40.7440197400753,40.7440296660829,40.744105341081,40.7440296722944,40.744058709807,40.7440270420961,40.7439945884111,40.7439346319142,40.7440154967009,40.7442139760372,40.7442260747472,40.7442833242413,40.7442925197971,40.7442677526999,40.7443148174134,40.7442721156194,40.7443687826056,40.7444439369915,40.7444225430444,40.7443738623127,40.744329368581,40.7443558442473,40.7443087787924,40.7443548959061,40.7443248053434,40.7443242221792,40.7443100430265,40.7443260261298,40.7443671621899,40.7444036904814,40.7444352163242,40.7444547603548,40.7444700911574,40.7445089072683,40.7445555998635,40.7446210112571,40.7445538056309,40.7445911441275,40.7445927598206,40.7445949009543,40.7445975435473,40.7446006626157,40.7446042206122,40.7446081835084,40.7446125097409,40.7446171535566,40.7446220660268,40.7446271973826,40.7446324904894,40.7446378935751,40.7446433486711,40.7446487984842,40.7446548773471,40.7446608917721,40.7446667851386,40.7446724993233,40.7446779787158,40.7446831720647,40.744688026279,40.7446924978181,40.7446965397933,40.7447001155363,40.7447031888835,40.7447057323841,40.7447077190912,40.7447091304357,40.7447099543813,40.7447101798984,40.7447098081875,40.7446243314547,40.7449450052529,40.7451338399505,40.7451703005826,40.7452031697384,40.7452073738491,40.7451103453052,40.7450924688073,40.745007815675,40.7449878649163,40.7450380916259,40.7450602413873,40.7451190118222,40.7451494306627,40.74516797196,40.7451950894374,40.745291763707,40.7452928734379,40.7452972827844,40.7453048921447,40.7453155296324,40.7453289549593,40.7453448648631,40.7453628999574,40.7453972477559,40.7454335101988,40.7454706505309,40.745507606896,40.7455433226958,40.745576776799,40.7456070127355,40.7456451435442,40.7456795068178,40.7457093927298,40.74573418394,40.7457533683464,40.7457750773656,40.7457533279257,40.7457291152278,40.7457346976412,40.7457649742178,40.7457878836226,40.7458096660897,40.745829725486,40.7458475128344,40.7458955754472,40.7460006036785,40.7465567369716,40.7466463016142,40.7466420206964,40.7467510848496,40.7468377779646,40.7468873073044,40.7469178016035,40.7469740165977,40.7470683491952,40.7470979456289,40.7483036195923,40.7483364647629,40.7489203508738,40.748040794641,40.7480187257111,40.7480136204525,40.7479563806244,40.7479948159126,40.7480079198554,40.7480162859838,40.748044874348,40.7480144114447,40.7479882035637,40.7479989540376,40.7479691747137,40.7479769446576,40.7479511725337,40.747734811961,40.7480874872293,40.7484276877732,40.7490815539323,40.7492646262748,40.7493739942268,40.7494028769619,40.7493928736635,40.7494865777093,40.7495173030304,40.7494193113742,40.7494114521468,40.7493837032092,40.7495966595302,40.7496650944919,40.7496707144228,40.7496856328214,40.7497598853697,40.7497687291696,40.7497642778299,40.7496839685396,40.7496742130827,40.750013856904,40.7499919676893,40.7499434460404,40.7499264243323,40.7496765374095,40.7496327303754,40.7505866989768,40.7508310409595,40.7510972655599,40.7512187593357,40.7517646302687,40.7517875337532,40.7518516068715,40.7519572932794,40.7520372637952,40.7526834337548,40.7527179394544,40.7527750921768,40.7528898407764,40.7530679250892,40.7537027611479,40.7537570412217,40.7540867135073,40.7542491593592,40.7545238832373,40.7550869197248,40.7551669147052,40.7552180836162,40.7552636801144,40.7545236203242,40.7545564576391,40.7546006186048,40.7546785623059,40.7548904187012,40.7544853006744,40.7537146046939,40.7526266199747,40.7525301225546,40.7520369517853,40.7519592388872,40.7518912083212,40.751670283674,40.7516279845761,40.7513278799854,40.7510793920614,40.7510225312797,40.750967100744,40.7508606171018,40.7506060198224,40.7502587994197,40.7499720872667,40.7498974782205,40.7497510932775,40.7496922815123,40.7496337966918,40.7495204983681,40.7494677129278,40.7493937359716,40.7492460641682,40.7491983147121,40.7490147471783,40.7489164399634,40.7483945519164,40.7484714113581,40.7494119331534,40.750269645274,40.751152455671,40.7515130743283,40.7516433456615,40.7515764796352,40.7513715516221,40.7509726094671,40.7504680069492,40.7497508278526,40.7498108010836,40.7499439122082,40.7502344982949,40.7508456259457,40.7509670521758,40.7510645887011,40.7516386798306,40.7526768150166,40.7529950763249,40.7529765234734,40.7531624245448,40.753222284605,40.753284848735,40.7533079423502,40.7533788762879,40.7534038487453,40.753505277894,40.7536113241357,40.7537083825432,40.753763037953,40.7538010119785,40.7539022110865,40.7539913147834,40.7540635323673,40.754106218947,40.7541536704362,40.7541615224451,40.7541701124326,40.7542400026781]}]],[[{"lng":[-73.8877019927043,-73.88710945095,-73.886794729562,-73.8862888460147,-73.8856999561787,-73.8856503153903,-73.8856119788771,-73.8855933098002,-73.8850919561427,-73.8846141461265,-73.8841609538133,-73.8840905169682,-73.8835332114184,-73.8829754338343,-73.8820851986599,-73.8817230176511,-73.881309176877,-73.8808979364915,-73.8808848465233,-73.8804906821248,-73.880088774892,-73.879693540886,-73.8786587482635,-73.8783662923012,-73.8778940272635,-73.876997241884,-73.8762830236057,-73.8753864726791,-73.8750915415561,-73.8749534951893,-73.8747547553187,-73.8740891317392,-73.8731694263047,-73.8723522953997,-73.8715474999877,-73.8714607424957,-73.8714098075705,-73.8711328338978,-73.8710112740359,-73.8710015610708,-73.8709308131908,-73.8708453942418,-73.8707456101135,-73.8706318513309,-73.8702113590573,-73.8697076535123,-73.8693102591821,-73.8692927042302,-73.8692721567242,-73.8687681732168,-73.868453052108,-73.8682106853056,-73.8676592737985,-73.8673090828058,-73.8671140456211,-73.8665724107751,-73.8660417615264,-73.8654761087032,-73.8652387061175,-73.8646872952352,-73.864122975782,-73.8635711113709,-73.8630185014243,-73.8627219509845,-73.8624254052537,-73.8621363821695,-73.8618336832683,-73.8615288665559,-73.8612240638327,-73.8606266329048,-73.8600378987578,-73.8599285549996,-73.8598335677945,-73.8597535876575,-73.8596890729929,-73.8596403110687,-73.8596361698067,-73.8596351129799,-73.8596425479584,-73.8596541683763,-73.8596606676163,-73.8597131364884,-73.8597593286286,-73.8597766601653,-73.8597838926762,-73.8597761798592,-73.8597534605845,-73.8597158631146,-73.8596636207086,-73.8596351660726,-73.8596250536085,-73.8595585851161,-73.8595394885174,-73.8594845604181,-73.8593868164633,-73.8592851159699,-73.8592636325765,-73.8592385824414,-73.859202767927,-73.8591948564638,-73.8591414922119,-73.8590819836905,-73.8590106373112,-73.8589277465738,-73.8588337133272,-73.8587587683495,-73.8586800647054,-73.8585976714024,-73.858511660872,-73.8584221083407,-73.8583290923231,-73.858276818239,-73.8582327984575,-73.8581773669283,-73.8581251154846,-73.8574306238659,-73.8567325773891,-73.8559200537607,-73.8558129540011,-73.8557145429801,-73.8556258725154,-73.8555977094858,-73.8555667831852,-73.8554395493513,-73.8553942350219,-73.8554283910726,-73.855350187959,-73.8553183028424,-73.8552927590464,-73.8552957150926,-73.8553891051467,-73.8563093401744,-73.8572276271792,-73.8572793404126,-73.8573922105983,-73.8582740576156,-73.8589322439911,-73.8582349496568,-73.8581989070063,-73.8583102747183,-73.8585456206014,-73.8588871191326,-73.8592241210709,-73.8597750087561,-73.8601307335372,-73.8605650630781,-73.8609387576988,-73.8622049653039,-73.8624074743969,-73.8627929587684,-73.8629210432223,-73.8631813516721,-73.8635709250918,-73.8639599298141,-73.8644898364108,-73.8646174232949,-73.8652378763399,-73.8654285679917,-73.8659355955898,-73.8666167732328,-73.8668554454553,-73.8668905494134,-73.8670847383692,-73.8673025313442,-73.8675068605491,-73.8676959937506,-73.8678684597139,-73.8680230761879,-73.8681129138768,-73.8681850269878,-73.8682546171208,-73.8683317597814,-73.8686502416753,-73.8688673074056,-73.8689484527443,-73.869043054218,-73.8691505174281,-73.8692700488922,-73.8694786510802,-73.8699033016364,-73.8701174316062,-73.8702112900175,-73.8703416191591,-73.8705739316604,-73.8705545830779,-73.8705140361971,-73.8689176275678,-73.8700429289989,-73.8710755255059,-73.8740205324067,-73.8793931510817,-73.879506412209,-73.8795613942397,-73.8811746909754,-73.8822666544277,-73.8837769864928,-73.884522508914,-73.887283929256,-73.8880834184255,-73.888092663383,-73.8882981117232,-73.8890889528668,-73.8896278757877,-73.890154186729,-73.8906308685609,-73.8916601065927,-73.8925830316834,-73.8927414244319,-73.8934403131568,-73.893985686658,-73.8940409878327,-73.8941425555181,-73.8941746326718,-73.8949106745415,-73.8950492683729,-73.8953050494877,-73.8955485950465,-73.8956147649848,-73.8957794543699,-73.8959972738213,-73.8962016955736,-73.8962863475366,-73.8963589890351,-73.8963679902941,-73.8964190907378,-73.8964301047751,-73.8964662506299,-73.896526442364,-73.8989768735436,-73.9011615506039,-73.9004246511309,-73.9018877625489,-73.9013984066204,-73.9014395867372,-73.9015539023884,-73.9017609660887,-73.9020727736498,-73.9027882470701,-73.9035405707189,-73.9038660054109,-73.9042879271097,-73.905042952955,-73.9057959700921,-73.9049142425983,-73.9048043538206,-73.9042601834566,-73.9046638475369,-73.9050048476836,-73.9054012773038,-73.9057653602042,-73.9061162600322,-73.9065235071222,-73.9068458346055,-73.9072745239221,-73.9075698522655,-73.9080224924566,-73.9087736610297,-73.9095327313856,-73.911034895788,-73.9118082010449,-73.9106788273735,-73.9114224265737,-73.9121616973804,-73.9129040412196,-73.9118071006943,-73.9125491390839,-73.9132916243198,-73.9140309747051,-73.9147706384764,-73.9155125050607,-73.9158973862979,-73.9162525203122,-73.9166089237908,-73.9166494811254,-73.9169950680197,-73.9173652032122,-73.9177366290558,-73.9180816760575,-73.9181029964512,-73.9184767086711,-73.9188434257222,-73.9192216260329,-73.9195647335138,-73.9199595293086,-73.9207006591888,-73.9214347597289,-73.9218918463265,-73.9207485304976,-73.9211202010852,-73.9212207352637,-73.9215460162964,-73.9218188030682,-73.9222346647762,-73.9231393634936,-73.9240401133402,-73.9240590973699,-73.9236835215252,-73.9237491153489,-73.9240522324596,-73.924122415755,-73.9240993129093,-73.9240624402141,-73.9239737525084,-73.9238970964526,-73.9238151312858,-73.9237638904394,-73.9236689576321,-73.9235983444235,-73.923560113471,-73.9235447073561,-73.9235332307986,-73.9235275210041,-73.9235274739841,-73.9235254725108,-73.9227919667243,-73.922329701677,-73.9206425894054,-73.9205692009295,-73.920568217331,-73.9205680891069,-73.9205690553611,-73.920573003167,-73.920578613887,-73.9206042510004,-73.9210948282622,-73.9212764627774,-73.9214071462264,-73.921700059875,-73.9217184781469,-73.9221695881019,-73.9222376112434,-73.9222820768139,-73.922327739569,-73.922349725625,-73.9223584472247,-73.9223512238468,-73.9224148847761,-73.9224837931259,-73.9225192815479,-73.9225977191975,-73.9226761578557,-73.922794147454,-73.9230576938633,-73.9232392822604,-73.9234261670814,-73.9234660265416,-73.923464646914,-73.9234408331729,-73.9234422540663,-73.9234476277227,-73.9234571659079,-73.9234679458739,-73.9234769482587,-73.9234831417299,-73.9234935914122,-73.9235046909438,-73.9235138017346,-73.9235224401305,-73.9235304024016,-73.9235381027946,-73.9235437943912,-73.9235491556811,-73.9235547999705,-73.9235596968507,-73.9235636845036,-73.9235676122674,-73.9235721422235,-73.923576233619,-73.9235792096976,-73.9235820088276,-73.9235857756141,-73.9235894370586,-73.9235935965215,-73.9236006165548,-73.9236064298081,-73.9236127962909,-73.9236192364079,-73.9236256716535,-73.9236317176537,-73.9236373013324,-73.9236427673784,-73.9236500747469,-73.923656618493,-73.9236621693762,-73.9236692575383,-73.9236768886436,-73.9236841297714,-73.9236893513344,-73.923695611748,-73.9237026752406,-73.9237101668778,-73.9237197150031,-73.9237261139587,-73.923731648007,-73.9237369052813,-73.9237446573535,-73.9237549176179,-73.9237663820715,-73.9237820267751,-73.9237940284995,-73.9238067467151,-73.9238219800125,-73.9238351219119,-73.9238437687801,-73.9238533492379,-73.9238600781395,-73.923867060324,-73.9238745498032,-73.9238795888901,-73.923888557963,-73.9238943450098,-73.9239028517397,-73.9239090414078,-73.9239164980205,-73.9239242754028,-73.9239325226696,-73.9239386732935,-73.9239431281534,-73.9239460344799,-73.9239478665674,-73.9239494390175,-73.9239505017461,-73.923953410184,-73.9239548419979,-73.923955191999,-73.923959035937,-73.9239638145542,-73.9239678681566,-73.9239701685264,-73.9239714045988,-73.9239726858481,-73.9239728785403,-73.9239733665381,-73.9239743474109,-73.923975051392,-73.9239755511968,-73.9239759929686,-73.9239753727637,-73.9239747379345,-73.9239746445257,-73.9239751187831,-73.9239756048683,-73.9239769537967,-73.9239766143334,-73.9239753976932,-73.9239739334666,-73.9239723675487,-73.923971596218,-73.9239713340061,-73.9239716717476,-73.9239725906934,-73.9239725009699,-73.9239724131001,-73.9239726121227,-73.9239725247451,-73.9239714681915,-73.9239704834588,-73.9239692004742,-73.9239683914068,-73.9239673706331,-73.9239665259541,-73.9239648383139,-73.9239628779626,-73.9239606577603,-73.9239595500558,-73.9239587793112,-73.9239574720444,-73.923955063197,-73.9239520891845,-73.9239481555846,-73.923931078394,-73.9239161472029,-73.9238981717334,-73.9238836528079,-73.9238708020666,-73.9238541963012,-73.9238411988924,-73.9238382644765,-73.9238456531245,-73.9238558080838,-73.9238638750884,-73.9238720872618,-73.9238776364686,-73.9238803188037,-73.9238787917846,-73.9238754994155,-73.9238706054306,-73.923866377769,-73.9238610247713,-73.9238563462614,-73.9238529498243,-73.9238477721269,-73.923844799903,-73.9238406412174,-73.9238386051869,-73.9238368621676,-73.9238357540565,-73.923839275926,-73.9238439814355,-73.9238492669483,-73.9238545188003,-73.9238604579411,-73.9238668386539,-73.9238746140054,-73.9238825445883,-73.9238918671833,-73.9238983156302,-73.9239055793795,-73.923911343209,-73.923919623192,-73.9239266377356,-73.9239325067287,-73.9239382293463,-73.9239435893412,-73.9239505323345,-73.9239567200091,-73.9239633091374,-73.9239731338836,-73.9239752226747,-73.923980688974,-73.9239859047206,-73.9239909792476,-73.9239959452948,-73.9240015488769,-73.9240073423725,-73.9240119419635,-73.9240160474747,-73.9240200707185,-73.9240257259172,-73.924031442296,-73.9240367308852,-73.9240416270804,-73.9240460151631,-73.9240509718202,-73.9240565184879,-73.924061611986,-73.9240649973678,-73.9240695644381,-73.9240753987935,-73.9240833126564,-73.9240911679561,-73.9241026553375,-73.9241141091499,-73.9241250334001,-73.92413761147,-73.9241502250365,-73.9241601319247,-73.924168667299,-73.9241790110887,-73.9241890266868,-73.9241999127456,-73.924208126276,-73.9242158655835,-73.9242216641565,-73.9242271624757,-73.9242299640774,-73.9242289797435,-73.9242261507128,-73.9242225288932,-73.9242209654276,-73.924216984968,-73.9242117748301,-73.9242057726275,-73.924208032398,-73.9242146911238,-73.9242178124387,-73.9242122056621,-73.9241980583624,-73.9241892771197,-73.9241831264193,-73.9241783328675,-73.9241755497644,-73.9241730390654,-73.9241688362885,-73.9241665808918,-73.924166530512,-73.9241678189765,-73.9241689863824,-73.9241707310908,-73.9241734239755,-73.9241803303899,-73.9241889386326,-73.9241972879216,-73.9242037353105,-73.9242099247461,-73.9242169397046,-73.9242220506965,-73.9242294695364,-73.9242344265724,-73.9242354642779,-73.9242346884764,-73.9242333760299,-73.9242346651039,-73.9242379261757,-73.9242436492101,-73.9242544168658,-73.9242703432464,-73.9242864952211,-73.9243004514696,-73.9243134618658,-73.9243283136747,-73.924341639228,-73.9243497124568,-73.9243623578131,-73.9243767750514,-73.9243925653769,-73.9244088274067,-73.9244250895905,-73.9244395062162,-73.9244562287895,-73.9244748652158,-73.9244919516253,-73.9245079836075,-73.9245236261411,-73.9245400943333,-73.9245477646652,-73.9245573802735,-73.9245611536046,-73.9245632710669,-73.9245636119707,-73.9245638414921,-73.9245701837073,-73.9245802289316,-73.9245899956589,-73.9246013126009,-73.924614983339,-73.924624964795,-73.9246370355188,-73.9246465521955,-73.9246649657762,-73.9246872887747,-73.924712383837,-73.9247352201419,-73.9247598780161,-73.9247798991604,-73.9247962026206,-73.9248110991235,-73.9248259823025,-73.9248376006182,-73.9248541151798,-73.9248706313357,-73.9248822361775,-73.9248972291883,-73.9249124113132,-73.9249264196654,-73.9249359699209,-73.9249436033662,-73.9249504772168,-73.9249578610383,-73.9249661794357,-73.9249761992485,-73.924984978383,-73.9249919040885,-73.9250010864603,-73.9250105515441,-73.9250192017173,-73.9250293176931,-73.9250424369067,-73.9250501793337,-73.9250574946242,-73.9250703868396,-73.9250814154722,-73.9250895592128,-73.9251010823691,-73.9251100169207,-73.9251211155162,-73.9251275896857,-73.9251355914159,-73.9251410947329,-73.9251420406149,-73.9251466765988,-73.9251520004648,-73.9251544690648,-73.9251520727199,-73.9251467162845,-73.9251409957791,-73.9251406405557,-73.9251349215354,-73.9251294655166,-73.9251199570656,-73.9251126278734,-73.9251047753209,-73.9250959628691,-73.9250832980838,-73.9250779609385,-73.9250690290653,-73.9250611520521,-73.9250535624929,-73.9250448459051,-73.9250356305136,-73.9250243525934,-73.9250127532683,-73.9250070708941,-73.9249981748532,-73.9249853074184,-73.9249786184233,-73.9249734931929,-73.9249637677976,-73.9249541832127,-73.9249450387536,-73.9249380159633,-73.924931904309,-73.9249255083754,-73.9249192447023,-73.9249102531088,-73.9248994707111,-73.9248940865169,-73.9248816246287,-73.9248716341861,-73.9248672897159,-73.9248599173775,-73.9248507721765,-73.924841911265,-73.9248329804376,-73.9248201520031,-73.9248116292523,-73.924802919002,-73.92479598408,-73.9247828978064,-73.9247701043804,-73.9247637139263,-73.9247591948804,-73.9247491533878,-73.924737296106,-73.9247322648406,-73.9247271626391,-73.924721349485,-73.9247142921069,-73.9247088695133,-73.9247040983238,-73.9246993502328,-73.9246946509333,-73.9246893707238,-73.9246840907286,-73.9246775516788,-73.9246717226952,-73.9246674861785,-73.924662995269,-73.9246554295016,-73.9246514833814,-73.924646412337,-73.9246413546892,-73.9246370058885,-73.9246335593798,-73.9246283098604,-73.9246235370711,-73.9246161933592,-73.9246091811413,-73.9245990153625,-73.9245872402939,-73.9245785228291,-73.9245724880282,-73.9245637030681,-73.924554029708,-73.9245438011551,-73.9245354552228,-73.9245317955016,-73.9245270265035,-73.924517342125,-73.9245000483342,-73.9244836458559,-73.9244229875493,-73.924336933923,-73.9243140533913,-73.9242893862099,-73.9242618570813,-73.9242320537093,-73.9242145604347,-73.924195658019,-73.9241772524377,-73.9241583836863,-73.9241382136637,-73.9241135085051,-73.9240896213146,-73.9240681481268,-73.924045895307,-73.9240293333561,-73.9240178862699,-73.9239997028337,-73.9239696127908,-73.9239490861267,-73.923930467329,-73.923909942456,-73.9238903891307,-73.9238745184626,-73.9238582081174,-73.9238381829421,-73.9238200042459,-73.9238008888995,-73.9237775819501,-73.9237495735823,-73.9237344205743,-73.9237164516081,-73.9236958537906,-73.9236752096362,-73.9236567779992,-73.9236378741682,-73.9236208751435,-73.9236052491437,-73.9235872792603,-73.9235688840095,-73.9235449610039,-73.9235218673536,-73.923503947584,-73.9234869503431,-73.9234708665931,-73.9234557036048,-73.923440091448,-73.9234235304246,-73.9234055974964,-73.9233845983407,-73.9233598820427,-73.9233367884478,-73.9233145206556,-73.9232857321677,-73.9232626388793,-73.9232395559501,-73.9232156674292,-73.9231991069633,-73.9231804524082,-73.9231616864687,-73.9231319636397,-73.9231122576179,-73.9230952382453,-73.923078715218,-73.9230639895022,-73.9230420879399,-73.9230192156096,-73.9229973006625,-73.9229606910422,-73.9229341342886,-73.9229117791737,-73.9228940991563,-73.9228782646348,-73.9228633314708,-73.9228416888578,-73.9228212044169,-73.9227969673748,-73.9227727632223,-73.9227494603527,-73.9227252102129,-73.9227033156731,-73.9226828296879,-73.9226613985247,-73.9226413528796,-73.9226190230157,-73.9225910700687,-73.9225654605077,-73.9225472838386,-73.9225281561382,-73.9225076664927,-73.9224857688588,-73.9224638234505,-73.9224451801978,-73.9224269874703,-73.9224027446284,-73.9223799108225,-73.9223579754138,-73.922332312687,-73.9223108843703,-73.9222989721924,-73.9222871899019,-73.9222776561882,-73.9222656940553,-73.9222504231605,-73.9222335939774,-73.9222144702518,-73.9221948382105,-73.922181078954,-73.9221624363503,-73.9221433096128,-73.9221195824235,-73.9220920937652,-73.9220755739322,-73.9220580844322,-73.9220415642131,-73.9220245728791,-73.9220080534333,-73.9219929069434,-73.9219782219471,-73.9219493719238,-73.9219305100287,-73.9219066311651,-73.9218844207231,-73.9218650880964,-73.9218467231106,-73.921827861557,-73.9218108818306,-73.9217966703229,-73.9217829200533,-73.9217701178659,-73.9217478034495,-73.9217249683635,-73.9217073045583,-73.9216872829614,-73.9216649195655,-73.9216426032981,-73.9216179360352,-73.9215927936962,-73.921568126361,-73.9215516213436,-73.92153369523,-73.9215250681611,-73.9215125662603,-73.921486949024,-73.9214709053492,-73.9214539161304,-73.9214378722059,-73.9214136785831,-73.9213890130932,-73.9213762485606,-73.9213539269868,-73.9213330261284,-73.9213125415283,-73.9212912061004,-73.9212721262882,-73.9212521208949,-73.9212260408723,-73.9212099937589,-73.9211929639228,-73.9211844910777,-73.921177378785,-73.9211622312922,-73.9211466094912,-73.9211182316325,-73.9211035467085,-73.9210755965235,-73.9210609477789,-73.9210481430037,-73.9210253166322,-73.9210038869307,-73.9209806225512,-73.9209417503183,-73.9209266033675,-73.9209105091525,-73.9208953986056,-73.9208807131255,-73.920855107482,-73.9208355610809,-73.920819267122,-73.9207987738136,-73.920775045045,-73.9207517407668,-73.9207335609413,-73.9207230594616,-73.920713915833,-73.9207013895249,-73.9206912665927,-73.9206824928509,-73.9206727733512,-73.9206641989165,-73.9206594970202,-73.920655372381,-73.9206513103748,-73.9206475793133,-73.9206432094334,-73.9206325696137,-73.9206264031795,-73.9206242227211,-73.9206161369675,-73.9205996279007,-73.9205837353695,-73.9205669376539,-73.9205587447375,-73.9205433809753,-73.9205252015948,-73.9205124013345,-73.9205074882824,-73.9204878908698,-73.9204664208658,-73.9204551942117,-73.920438734578,-73.9204264602166,-73.9203969262659,-73.9203706416967,-73.9202753834074,-73.9205319833439,-73.9200671217348,-73.9190389757071,-73.9178930845565,-73.916554679467,-73.9164586007739,-73.9164584231399,-73.9164582462002,-73.9163500230956,-73.9163499523687,-73.9162318472211,-73.9162317520526,-73.9162316696665,-73.9161066790083,-73.9161065483886,-73.9161064067709,-73.9159775500327,-73.9142363291455,-73.9138482830903,-73.9131696980579,-73.9125718774385,-73.9113450690157,-73.9097164608149,-73.9088917379157,-73.9080468088052,-73.9074099735685,-73.907300137503,-73.9071670524445,-73.9071225307847,-73.9070686729543,-73.9069304991158,-73.9067302812899,-73.9057242363777,-73.9055774010374,-73.9051805791977,-73.9042188893803,-73.9041685326732,-73.9025965084254,-73.901079709003,-73.900910948234,-73.9007113886511,-73.9006625049975,-73.9006081493443,-73.9005485620062,-73.9004840064317,-73.900414768038,-73.9003411528722,-73.9002634864665,-73.9001821122135,-73.9000973899021,-73.9000096941265,-73.8998251310634,-73.899632578958,-73.8994334853201,-73.8992294476897,-73.8990220996638,-73.898786461428,-73.8987863429133,-73.8987862131798,-73.8985478709664,-73.8985477282389,-73.8985475866269,-73.8983081274275,-73.8983079961665,-73.8983078669028,-73.898069101461,-73.8980689598616,-73.8980688299364,-73.8978323694189,-73.8969118803862,-73.8965110517443,-73.8960293159074,-73.895101334044,-73.8949242170837,-73.8947484799933,-73.8947482794019,-73.8947480902758,-73.8945755791367,-73.8945754485786,-73.8945753186968,-73.8944075965432,-73.8942464489958,-73.8941583550504,-73.8939378054027,-73.8937090565305,-73.893474082341,-73.8932349445219,-73.8930108811507,-73.8927840566608,-73.8925555458947,-73.8923264405576,-73.8917501641674,-73.8913849792518,-73.891138527973,-73.8899345067149,-73.8891031898245,-73.8885228590148,-73.8877019927043],"lat":[40.7342913227586,40.7327442933385,40.7319225785439,40.730601703117,40.7287269714786,40.7284963822676,40.7283421776956,40.7282744399751,40.7283602924179,40.7284030066901,40.7284435111192,40.7284494117285,40.7284974480576,40.728540950784,40.7286103753503,40.7286352540297,40.7286808265212,40.7287413119397,40.7287437302178,40.7288165420463,40.7289062742142,40.7290101589161,40.7293996769841,40.7295158866319,40.7297159303876,40.7300483531401,40.730313093919,40.7305906728702,40.7306713632197,40.7306186957731,40.7305418917538,40.7302827923819,40.7299506191985,40.7296554848453,40.729362383331,40.7293263741385,40.7291781024809,40.7283717202997,40.7279576114015,40.7279245240285,40.7277032066697,40.7274845934406,40.7272695393737,40.7270588540253,40.726187326382,40.7251464341414,40.7244659908253,40.7244359294742,40.7244118357159,40.7238209071637,40.7234854940857,40.7232547486383,40.7226612566289,40.7222890245247,40.722076403898,40.7214866374512,40.7209009226014,40.7202809377529,40.7199767100267,40.7194270756022,40.7188448079169,40.7182766798916,40.7177078818569,40.7174280189449,40.7171481470524,40.7168767739987,40.7165925433462,40.7163149367086,40.7160373287648,40.7154871695649,40.714932235724,40.7147562704477,40.7145749229762,40.7143892338106,40.7142002939749,40.7140092192411,40.7139781313718,40.7139199103773,40.7134931446792,40.7133799614124,40.713294646745,40.7126055390835,40.7118450597847,40.7116338113396,40.7114303226755,40.7112263569445,40.7110228860619,40.7108208540233,40.7106212108104,40.7104216041147,40.7103461644909,40.709850568005,40.7096858418024,40.7092625701052,40.7084923136751,40.7076759187473,40.7075034553001,40.7072727451099,40.707092043384,40.707053550507,40.706874064142,40.7067107912256,40.7065500158478,40.7063924788172,40.7062388976188,40.7061414321087,40.7060456977616,40.7059517784979,40.705859756802,40.7057697131799,40.7056817265627,40.7056361659763,40.705591689885,40.7055496042367,40.7055135695479,40.7050346140336,40.7045614742863,40.7040032402576,40.703926400887,40.7038428266498,40.7037534210224,40.7037262256514,40.7036805227357,40.7034874101538,40.7033486380369,40.7033181986624,40.7030131506169,40.7026730950705,40.7025955017877,40.7019910096105,40.7019769163009,40.7018235547299,40.701651719352,40.7012125133222,40.701213978868,40.7012236592381,40.7013203447589,40.7028328906715,40.7029110743658,40.7028562524738,40.7027477508212,40.7026210537247,40.7025329459159,40.7024450985606,40.7024221897877,40.7024379260682,40.7024848986747,40.7027093527079,40.7027467860454,40.7027872924558,40.702795356548,40.7028117445371,40.70282000485,40.7028120723206,40.7027983351115,40.7027811816812,40.7026977612825,40.7026535745541,40.7025360879046,40.7023189457641,40.7022137363015,40.7021954664947,40.7020944040107,40.7019617486236,40.7018167769618,40.701660727143,40.701495006793,40.701321177326,40.7012043125006,40.7010930557246,40.7009779599717,40.7008241331062,40.699759639585,40.6990230152974,40.6988719840545,40.6987251460306,40.6985835179112,40.6984480637176,40.698257905675,40.6979766243612,40.697868012383,40.6978277570425,40.6977718562824,40.6976889006651,40.6976598743711,40.6975990705662,40.6951465615148,40.6949414841501,40.694746747868,40.6941912952175,40.6912096316943,40.6911467688432,40.691104780826,40.6898725878353,40.6890385511502,40.687863411185,40.6866847490949,40.6856224754499,40.6852936321711,40.6852876279233,40.6851541932134,40.6846405530012,40.6842364542529,40.6850039898045,40.6847001780487,40.6840441779094,40.6834919108878,40.6836701856633,40.6844567900322,40.6850705947104,40.6851328346005,40.6852471462724,40.6852832481706,40.6845084863337,40.6843625985359,40.6840805200677,40.6837918923162,40.6837074215681,40.6834971833575,40.6831968787779,40.682891482754,40.6827583825879,40.6826208667338,40.6825997571336,40.6824798757412,40.6824463593363,40.6823364219728,40.6824032992416,40.6852976980837,40.6878779353556,40.6881838988769,40.6910777200733,40.6915899920378,40.6916121057659,40.6916798589335,40.691807310892,40.6919992313042,40.6924183392061,40.6928487817959,40.6930357122295,40.6932780687472,40.6937040067602,40.6941271555136,40.6950735713309,40.6951481695847,40.6957003714427,40.6959322465276,40.6961187462833,40.6963503058835,40.6965485551254,40.6967505571315,40.6969761436171,40.6971635493117,40.6973991897234,40.6975717504737,40.6978254091374,40.6982552266944,40.6986751051255,40.6995321139707,40.6999380026219,40.7010459695667,40.7014865880167,40.7019231641026,40.7023618912967,40.7034349520267,40.7038734198365,40.7043126385472,40.7047491130351,40.7051894377752,40.7056264446535,40.7058548171301,40.7060655429796,40.7062754946701,40.7062993881245,40.7065029645781,40.7067224690084,40.7069427389294,40.7071473301108,40.7071599694582,40.7073815627365,40.7075979984019,40.7078151343449,40.7080239783973,40.7082572885237,40.708694630124,40.7091287657063,40.7093960967104,40.7105336489583,40.7107354078152,40.7107905585565,40.7110432835344,40.7117820674471,40.7128559543629,40.713394728091,40.7140083126289,40.7141115601475,40.7140828414082,40.7142112760549,40.7148702451401,40.7151380484452,40.7151807081993,40.7152180648467,40.7152976647172,40.7153715283082,40.7154413003412,40.7154797172099,40.7155355679381,40.7155612575952,40.7155751624193,40.7155826723069,40.7155906250634,40.7156050833709,40.715605190892,40.7156166083679,40.7158002637476,40.7160765451724,40.7157731925314,40.7159711638162,40.715971973968,40.7159910729582,40.7160037083407,40.7160187759263,40.7160274246908,40.71603600719,40.7161417663361,40.7161803788276,40.7162097799717,40.716273771146,40.7162774863519,40.7163684819169,40.7163824404941,40.7164832729921,40.7165926441224,40.7166464913915,40.7166678400386,40.7166709329076,40.7168025404294,40.7169521966107,40.7170181562535,40.7171657131289,40.7173132692782,40.717534576144,40.7177615736409,40.7179264880667,40.7180973680073,40.7181303343223,40.7181362588319,40.7181478780773,40.7181570184526,40.7181670448256,40.7181787674966,40.7181905255029,40.7182046434509,40.7182121127338,40.7182231233481,40.7182353960384,40.718246964631,40.7182593970128,40.7182721720399,40.7182865574962,40.7182975661184,40.7183082232171,40.71831959132,40.7183320212145,40.7183433877144,40.7183547553471,40.7183682389092,40.7183820729812,40.7183973391703,40.7184133073472,40.7184310403919,40.7184480900244,40.7184644010261,40.7184832347031,40.7185020412772,40.7185234239441,40.7185422309333,40.7185564535453,40.7185685333973,40.7185809468234,40.7185930262901,40.7186091949689,40.7186202041502,40.7186305006834,40.7186429414071,40.7186550223075,40.7186667516449,40.7186754537725,40.7186868222763,40.7186987046144,40.7187097232995,40.7187230652694,40.718736902037,40.7187505757301,40.7187596373918,40.7187701253544,40.7187814960014,40.7187953624229,40.7188076193319,40.7188172361165,40.7188314635466,40.7188513391333,40.7188684218337,40.7188826190917,40.718899312447,40.7189142467262,40.7189252650638,40.7189382191746,40.7189501902922,40.7189631810636,40.7189740009276,40.7189871533906,40.7189972878325,40.7190074149025,40.71901719088,40.7190292721699,40.719042756787,40.7190594462455,40.7190740003884,40.7190864012686,40.7190988388331,40.7191108879012,40.7191245598485,40.7191350156446,40.7191495686011,40.7191623309926,40.719175481491,40.7191910985112,40.7192074089399,40.7192244294822,40.7192421883453,40.7192599190151,40.7192780018539,40.7193004343509,40.719316409844,40.7193247218527,40.7193410573554,40.7193566449869,40.7193736642934,40.7193928182499,40.7194123315912,40.7194332508259,40.7194538374193,40.7194719284226,40.7194903708206,40.719507740883,40.719521219899,40.7195339792416,40.7195449564344,40.7195600313958,40.7195742153304,40.7195909099942,40.7196057864901,40.7196185476461,40.7196320276382,40.7196462095981,40.7196586186684,40.7196720983735,40.7196862811667,40.7196994003596,40.7197143033273,40.7197302504358,40.7197472681959,40.7197639269418,40.7197799012374,40.7197919490933,40.7198070224651,40.7198220869005,40.719835367974,40.7198397865772,40.7198484739605,40.7198543989012,40.7198618521856,40.719869632252,40.719877168998,40.719887567801,40.7198997437681,40.7199086024905,40.7199164332281,40.7199274442819,40.7199414791543,40.7199541099119,40.7199660006173,40.7199794742312,40.7199904857676,40.7200019829698,40.7200182797627,40.7200306855144,40.7200434423282,40.7200569192833,40.7200671835857,40.7200826056997,40.7200942925855,40.720107410371,40.720118745902,40.7201318652852,40.7201481640782,40.7201637901306,40.7201783365851,40.7201932436058,40.7202063939172,40.7202181228824,40.7202284199522,40.7202383572585,40.7202486828265,40.7202630705003,40.7202747986275,40.7202879239646,40.7202989326132,40.7203129671191,40.720326830581,40.7203392709825,40.7203541782875,40.7203669421816,40.7203808055946,40.7203935789137,40.7204070814068,40.72042680078,40.7204319348471,40.720444365096,40.7204571645759,40.720471000451,40.720485546568,40.7205011739889,40.7205178648278,40.7205316998858,40.7205437784334,40.720554433451,40.720566513021,40.720578043143,40.7205901224704,40.7206039582254,40.7206167571562,40.7206297090789,40.7206439054449,40.7206600550423,40.720670700926,40.7206829504858,40.720694148645,40.7207078227142,40.7207216867196,40.7207360763052,40.7207495913773,40.7207606029131,40.7207739567253,40.7207872743737,40.7207976000511,40.720805954206,40.7208166314732,40.7208258594163,40.7208381411083,40.7208491508514,40.7208608804796,40.7208725994485,40.7208873445919,40.7209013672599,40.7209130641739,40.7209231663586,40.720934329639,40.7209456666592,40.7209594960605,40.720971703495,40.7209835591041,40.7209938534409,40.7210085993485,40.7210224327541,40.7210300562256,40.7210431136707,40.7210528517526,40.7210703894379,40.7210913051902,40.7211028297065,40.7211147150874,40.7211356213442,40.7211526400829,40.7211657605841,40.7211774502829,40.7211920026004,40.7212083295748,40.7212228840697,40.7212392144433,40.7212573120049,40.7212732925262,40.7212860840943,40.7212978127019,40.7213116491726,40.7213239178462,40.7213363580782,40.721347699389,40.7213620804077,40.7213782169194,40.7213876086152,40.7213987762996,40.7214140419827,40.7214294987586,40.7214429858895,40.7214575666773,40.7214708866367,40.7214799276877,40.7214883110749,40.7215004246506,40.7215132202284,40.7215228068952,40.7215387364505,40.721548461807,40.7215582155378,40.7215692848291,40.7215804172759,40.7215901163224,40.7216022569082,40.7216175596433,40.7216321686354,40.7216471094742,40.7216623827638,40.7216794670548,40.7216892429163,40.7217059357268,40.7217190587326,40.7217300637845,40.7217424730548,40.7217595203997,40.721771762892,40.7217843668196,40.721793819552,40.7218028325355,40.7218130706751,40.7218203535701,40.7218328242946,40.7218426018604,40.7218558694699,40.7218663119487,40.7218749551548,40.721881282496,40.7218880792604,40.721893630779,40.7218989453284,40.7219041959665,40.7219097434515,40.7219139834344,40.7219213156388,40.7219268460909,40.7219334729825,40.7219459099029,40.7219601388115,40.7219750876531,40.7219871697155,40.7219988898424,40.722011330844,40.722023771005,40.7220365374466,40.7220514743011,40.7220653383421,40.722074564703,40.7220872042169,40.7221012312038,40.7221136733582,40.7221275112945,40.7221438825154,40.722153298207,40.72216307263,40.7221811997159,40.7221947057008,40.722205003847,40.7222201123782,40.7222313113264,40.7222460600668,40.7222558351109,40.7222661331614,40.7222769072059,40.7222787352034,40.7222922457367,40.7223053697301,40.7223204636577,40.7223353393183,40.7223519953721,40.7223650034602,40.7223658321519,40.7223775161087,40.7223881386189,40.7224024601657,40.7224152157483,40.7224300866861,40.7224463891855,40.7224680019552,40.7224774635794,40.7224948013146,40.7225096722333,40.7225234723397,40.722538703396,40.7225553564294,40.7225741248201,40.7225953606701,40.7226065325147,40.7226227175155,40.7226460950369,40.7226579420273,40.7226676907579,40.7226861001389,40.7227038244263,40.7227208019977,40.7227349631508,40.7227491511992,40.722762952075,40.7227764280346,40.7227941264031,40.7228143180768,40.7228240579234,40.7228435095391,40.7228651334108,40.7228762699353,40.7228957610553,40.7229127660928,40.722929752552,40.722946054953,40.7229648135992,40.7229755954193,40.7229856937745,40.7229947211172,40.723011696603,40.7230308241603,40.7230408878424,40.723049232247,40.7230637415462,40.7230817987128,40.7230932942954,40.7231048173059,40.7231166730621,40.7231296006784,40.7231411234785,40.7231529799151,40.7231648544595,40.7231756399439,40.7231864508472,40.723199018939,40.7232140893921,40.7232284396092,40.7232388910117,40.7232536840394,40.7232770654935,40.7232910562563,40.7233057676532,40.7233201188759,40.7233348300748,40.7233466873753,40.7233622719715,40.7233761001937,40.723390611917,40.7234062035669,40.7234246126271,40.7234444528188,40.723459674456,40.7234690630595,40.7234812676613,40.723494354379,40.7235069192211,40.7235189621101,40.723530459755,40.7235409119756,40.7235522424996,40.7235641714647,40.7235720584231,40.7235899754836,40.7236038402738,40.723604752999,40.7236044667283,40.7236030432407,40.7236018445786,40.7236013103821,40.7236012441627,40.7236016997782,40.7236026238256,40.7236038452103,40.7236051974563,40.7236068026992,40.7236080490115,40.723609601547,40.7236116793442,40.7236127071062,40.7236145412503,40.7236171783594,40.723618515739,40.7236192149257,40.723619560876,40.7236191071894,40.7236180245259,40.723617275953,40.7236154435351,40.7236140892843,40.7236142116618,40.72361521396,40.7236184913368,40.7236200754856,40.7236217115429,40.7236234534074,40.7236247006984,40.723626363914,40.723628295694,40.7236301486567,40.7236317324747,40.7236333948129,40.7236348154598,40.7236361406287,40.7236366210033,40.7236368253762,40.7236365440291,40.7236357856678,40.7236355055352,40.7236361521952,40.7236368256964,40.7236377497403,40.7236390242175,40.7236406557291,40.7236422338696,40.7236443347365,40.7236463960741,40.7236477048169,40.7236490041805,40.7236511587291,40.7236532539982,40.7236536297131,40.7236579846143,40.7236593064968,40.7236579785889,40.7236562643126,40.7236564432505,40.7236575318848,40.7236609212247,40.723664804618,40.7236692924136,40.7236691516603,40.723666224953,40.7236630847757,40.7236600839242,40.7236570744221,40.7236539929826,40.7236488194938,40.7236448521326,40.723642008199,40.7236400471486,40.7236378883461,40.7236359002829,40.7236337956898,40.7236311705274,40.7236272926314,40.7236226328096,40.7236178721058,40.7236137653275,40.7236098214467,40.7236075042198,40.7236070773924,40.7236076130918,40.723608371823,40.7236091228116,40.7236098217417,40.7236101426968,40.7236115486633,40.7236133437343,40.7236155263934,40.7236169682435,40.7236204922876,40.723624356631,40.7236393865535,40.7236535458482,40.7236698372912,40.7236822085499,40.723690185029,40.7236968989814,40.723703692665,40.7237075825522,40.7237088309248,40.7237075570188,40.7237036967349,40.723697419505,40.7236937254169,40.7236899576284,40.7236865967459,40.723682578502,40.7236785599051,40.7236752806941,40.7236722272849,40.7236658673453,40.7236614601625,40.723655896822,40.7236496050295,40.7236436577778,40.7236387645882,40.7236340786242,40.7236295733562,40.7236262952568,40.7236225217573,40.723618640678,40.7236116548924,40.7236034633933,40.7235970302493,40.7235922077767,40.7235858801544,40.7235793637572,40.7235699900936,40.7235614631165,40.7235521624838,40.723546225817,40.7235413603507,40.7235392382727,40.7235322591289,40.7235244437939,40.7235190564153,40.7235133088769,40.7235073906012,40.7234978821902,40.7234863115323,40.7234800448533,40.7234689358169,40.7234570882837,40.723443683702,40.7234291532576,40.7234186217083,40.7234105938808,40.7234044618152,40.723401838925,40.7233993865722,40.7233979618206,40.7233967651662,40.7233944223199,40.7233922684519,40.7233871426294,40.7233841155777,40.7233778377884,40.7233747574826,40.7233725787283,40.7233679524013,40.7233629938171,40.7233578451672,40.7233490110964,40.7233462274564,40.7233428667039,40.7233398398359,40.7233372984156,40.7233302301171,40.7233238504937,40.7233197776022,40.7233143788609,40.7233120300603,40.7233100953381,40.7233098127705,40.723311885553,40.7233168236427,40.7233299080729,40.7233417606573,40.7233543167777,40.7233666928247,40.7233803294613,40.7233927347634,40.7234068882702,40.7234192945155,40.7234313403036,40.7234430355202,40.7234625154055,40.7234710292219,40.7234740359973,40.7234844582954,40.7235021511432,40.7235194832259,40.7235304846822,40.723532703953,40.7235331528775,40.7235320775406,40.7235266565839,40.7235272026799,40.7235342130438,40.7235434557455,40.7235479405559,40.7235542420954,40.7235544855734,40.7236054336764,40.7236811133181,40.7236607855359,40.7229403423924,40.7227430484489,40.722524493285,40.7222706962186,40.72200550648,40.7220756406003,40.7220757667866,40.7220758660017,40.7221369499629,40.7221369855947,40.7221873737177,40.7221874093316,40.722187436076,40.7222258244747,40.7222258600627,40.7222258862613,40.7222516912755,40.7227736942151,40.7228984123538,40.7230815258964,40.7232396349499,40.7241821699518,40.7254459561267,40.7260684259766,40.7267338879102,40.7272087388807,40.7272943699146,40.7273886537873,40.7274247284378,40.7274665227726,40.7275760302747,40.7277326828304,40.7285200195862,40.7286366843154,40.7289565769738,40.7301252689164,40.7301865910331,40.7321044283459,40.7339146347793,40.7341260367359,40.7343587278039,40.7344225976226,40.73448385508,40.7345422293309,40.7345974622771,40.7346493097091,40.7346975426484,40.7347419475685,40.7347823281338,40.7348185058024,40.7348503206148,40.7349313950196,40.7350023583031,40.7350625906685,40.7351115982715,40.7351490839862,40.7351767929127,40.7351768109014,40.7351768201689,40.7351919009261,40.7351919101819,40.7351919100571,40.735194184441,40.7351941843251,40.7351941743269,40.7351836166265,40.7351836082923,40.7351835987958,40.7351603541823,40.7350866013284,40.7350967415428,40.7350178916089,40.7350211830895,40.7350077216808,40.7349828150073,40.7349827873496,40.7349827514936,40.7349465550403,40.7349465286191,40.7349464923144,40.7348993231489,40.7348418131671,40.7348077916827,40.7347262100445,40.7346574527841,40.7346021780483,40.7345608120557,40.7345235751979,40.734495962249,40.7344781263096,40.7344701402597,40.7344848097319,40.734504989054,40.7345129691644,40.7345599567433,40.7345923964625,40.7345311600154,40.7342913227586]}]],[[{"lng":[-73.961284507884,-73.9612826200821,-73.9613418424428,-73.9614047239524,-73.9614017191776,-73.9616867065907,-73.9619102874724,-73.9618858636067,-73.961959204528,-73.9620249626652,-73.9619779494498,-73.9622147445928,-73.9624196427876,-73.9624854657924,-73.9625493395233,-73.9624778771383,-73.9624515741811,-73.9622673536835,-73.9622522887658,-73.9621946350352,-73.9622015691589,-73.9619440992803,-73.9617072421667,-73.9613527907771,-73.961284507884],"lat":[40.7301590617017,40.7300610250103,40.7300636775881,40.730061052264,40.7301110261134,40.7300818688011,40.7299625806154,40.7299525656679,40.7298596684481,40.7298854222378,40.7299440187498,40.7299169357768,40.7298012081141,40.7297111676151,40.7297440678466,40.7298369660556,40.7298283801201,40.7299312482395,40.7299855669819,40.7299759737556,40.7299540992371,40.7299868943748,40.7301211947923,40.7301519570532,40.7301590617017]}],[{"lng":[-73.9619703936979,-73.9619704078395,-73.9617128948076,-73.9616984824574,-73.9616744677247,-73.9619905022661,-73.961998003523,-73.962900068031,-73.9629025856754,-73.9632007653757,-73.96319829673,-73.9632809866388,-73.9632809740348,-73.9635591199135,-73.9635516415297,-73.9636593923288,-73.9636993813906,-73.9635841096573,-73.963566616573,-73.9632809572295,-73.9632934316184,-73.9629075478494,-73.962915054783,-73.9619703936979],"lat":[40.7315771116855,40.73155233267,40.7315661138451,40.7315323413948,40.7314812535528,40.7314665657085,40.7314932531542,40.7314478016774,40.7314287411495,40.7314174006247,40.7313506869078,40.7313430888365,40.731365962071,40.7313355533916,40.7312631197445,40.7312498114821,40.7314366195573,40.7314575502823,40.7313717711523,40.7313964596052,40.7314955793285,40.7315164229639,40.7315335801009,40.7315771116855]}],[{"lng":[-73.9605173253627,-73.9605685685849,-73.9606720464549,-73.9606486370075,-73.9605173253627],"lat":[40.744105341081,40.7440296660829,40.7440512158562,40.7441303171115,40.744105341081]}],[{"lng":[-73.964212303957,-73.9642736475246,-73.9643372932239,-73.9643776540431,-73.9644452275265,-73.9645831842695,-73.9645870239943,-73.9645451819259,-73.964475436577,-73.9643744377219,-73.9643375867175,-73.9642725620221,-73.9642161668237,-73.9641598028843,-73.9641251448618,-73.964133829335,-73.9642119246276,-73.964212303957],"lat":[40.7466043179741,40.7465418445525,40.7465457265932,40.7464950880389,40.7464104252606,40.7464544006734,40.7465158985447,40.746564150473,40.7466408331979,40.7467045306431,40.7467348481814,40.7467513080841,40.746837000831,40.7468655473596,40.7468457606054,40.7468127961655,40.746666676803,40.7466043179741]}],[{"lng":[-73.9576357683628,-73.957493440047,-73.9575188932101,-73.9576668047197,-73.9577265433446,-73.9578395394205,-73.9576883184342,-73.9575765046784,-73.9576357683628],"lat":[40.748406347465,40.7483364647629,40.7483036195923,40.7483734790189,40.7482940618958,40.7483380033753,40.7485350268717,40.7484885253783,40.748406347465]}],[{"lng":[-73.9621355905809,-73.9621938183841,-73.9622312516559,-73.9626870304654,-73.9628972920254,-73.9628689676923,-73.9631607404974,-73.9637357228317,-73.9647095284111,-73.9649444475547,-73.9653240558648,-73.9679127299439,-73.9681189339928,-73.9681737610107,-73.9682357475346,-73.9683651932415,-73.9682317171579,-73.9682962211324,-73.9682981145153,-73.968301910059,-73.9683161371577,-73.9683261043342,-73.9683469659132,-73.9683611884478,-73.9684000831416,-73.9684313915879,-73.9684636369071,-73.9684769194294,-73.9685006403585,-73.9685148595502,-73.9685347900078,-73.968544278662,-73.9685888522455,-73.9685916956957,-73.9686002347227,-73.9686097199753,-73.9686173087695,-73.9686391246467,-73.9686637979664,-73.9686704342135,-73.9686922519053,-73.9687045808976,-73.9687107654443,-73.9687527124037,-73.968943011093,-73.9689667053751,-73.9689736684949,-73.968988992317,-73.9689998159544,-73.9690030281009,-73.9690164175405,-73.9690196111592,-73.9690719333325,-73.9691309611885,-73.9692113592128,-73.9692343217233,-73.9692470758419,-73.969250288817,-73.9693259143739,-73.9693322802656,-73.9693392445918,-73.9693829064479,-73.9694002232787,-73.9694008665211,-73.9694175339956,-73.9694329238989,-73.9694621003831,-73.969520461252,-73.9695505965864,-73.9695974026117,-73.9696237058341,-73.9696320418026,-73.9696948777757,-73.9696967884592,-73.9698756140306,-73.9699057526526,-73.9699122797576,-73.9699313961495,-73.9699270495905,-73.9699737702628,-73.970047589049,-73.9700912317571,-73.9701296257695,-73.9702160228864,-73.9703393116125,-73.9703257132142,-73.970325719311,-73.9703781194052,-73.9704425548898,-73.9704606370362,-73.9704724057644,-73.9705056003266,-73.9705687722909,-73.9706238151065,-73.9707883477664,-73.9708570443435,-73.9708768823386,-73.9708896337672,-73.9708974206771,-73.9709094613216,-73.9709172484544,-73.9709285803236,-73.9709406296042,-73.9709822271237,-73.9710139239607,-73.9711143812398,-73.9707827612868,-73.9707775771611,-73.9707583395368,-73.9707508495514,-73.9707182349404,-73.9707057872082,-73.9707031753169,-73.9707227747486,-73.9707425727203,-73.9707506138201,-73.9707612352471,-73.9707920969472,-73.970798929893,-73.9708358740414,-73.9708359548652,-73.9708735785134,-73.9709596499281,-73.9709630019347,-73.9711734675316,-73.9711819357608,-73.9712061650298,-73.9712736246231,-73.9713575294187,-73.9712342398151,-73.9712054630197,-73.9712810183168,-73.9713556340918,-73.9714942127042,-73.9716377224042,-73.9716792120082,-73.9718888891307,-73.9717626132706,-73.9717405971582,-73.9717750124804,-73.9719595585625,-73.9720492631671,-73.972069496828,-73.9721016398068,-73.9721526357218,-73.9721980481378,-73.972286182485,-73.9722899209922,-73.9722128259938,-73.972195672753,-73.972182685701,-73.9721684838787,-73.9721647736866,-73.9721654976082,-73.972215254259,-73.9722251561434,-73.9722350431717,-73.9722356621101,-73.9721964164779,-73.9722168542233,-73.9722675364213,-73.9722700133416,-73.9722533231916,-73.9722483780364,-73.9722997959086,-73.9723103043909,-73.9723314172173,-73.9724388898142,-73.9726574380304,-73.9726552896889,-73.9726506037968,-73.9726443106242,-73.9726451272195,-73.9726467483074,-73.9726325645517,-73.9726310099864,-73.9726278745753,-73.9726263054338,-73.9726279218981,-73.9726208476636,-73.9726192965623,-73.9726275395251,-73.9726388480015,-73.9726383333126,-73.9726280732874,-73.972624526085,-73.9726327464414,-73.9726332710736,-73.9726225471807,-73.9726194686601,-73.972614740173,-73.9726060999749,-73.9726187294744,-73.9726124265646,-73.9726045730769,-73.9726140422564,-73.9726062119662,-73.9725903822468,-73.9725829245611,-73.9725797979851,-73.9725752587103,-73.9725562261096,-73.9725633368431,-73.9724899417474,-73.9725101678602,-73.9728693917847,-73.9744138581653,-73.9744597507046,-73.9744167735479,-73.974411543466,-73.9743995234331,-73.974026921043,-73.9740467925448,-73.9744293236688,-73.9744277547443,-73.9744664704729,-73.9745037601323,-73.974474717553,-73.9744408292406,-73.9744337287996,-73.9741406201839,-73.9741512763478,-73.9744472233676,-73.9744482861283,-73.9744782818308,-73.9745048828594,-73.974514597726,-73.9745079393816,-73.9744885407906,-73.9744507771782,-73.9744623333546,-73.9742498246837,-73.974246306583,-73.974258667755,-73.9744704050787,-73.9744696202373,-73.9744777543119,-73.9744715494167,-73.9744653776737,-73.974392239182,-73.974391854932,-73.974263758843,-73.9742647479944,-73.9741923370844,-73.9741895600019,-73.9741574743053,-73.9741461652347,-73.9740928793795,-73.9740900799467,-73.9734186958256,-73.9734388180185,-73.9732803029099,-73.9730569871205,-73.9728066171046,-73.9729367397369,-73.9729303192646,-73.9727630838035,-73.9729969520248,-73.9729639526809,-73.9729318560978,-73.9728851285693,-73.9728640311616,-73.9728374594346,-73.9729452075868,-73.972967197858,-73.9729451903181,-73.9729956023659,-73.9729708363561,-73.9730029119927,-73.9730368471371,-73.9732989504614,-73.9733218745816,-73.9733163834515,-73.9732989767244,-73.9732788163409,-73.9732724114406,-73.9732770085148,-73.9732962736297,-73.9733292904358,-73.9733687094268,-73.9734182124835,-73.9734594591503,-73.973522708343,-73.9735447288396,-73.9744406508259,-73.9744261618416,-73.9744112671412,-73.9743906308142,-73.9743741794684,-73.9743505499802,-73.9743155973787,-73.9742714792683,-73.9742554346787,-73.9742119222655,-73.9741831728198,-73.974169179789,-73.9741511084035,-73.9741059171423,-73.9740601621633,-73.9740217458826,-73.9739923708974,-73.9739590502971,-73.9739432192494,-73.9739353135699,-73.9739070269519,-73.9739013771137,-73.9738912038226,-73.973866318656,-73.9738629295861,-73.9738527519364,-73.9738448385489,-73.9738652080241,-73.9738573003649,-73.9738414596266,-73.9738493738128,-73.9738312684669,-73.9738097684656,-73.9737837578338,-73.9738029884743,-73.9737837686717,-73.9737645264947,-73.9737407689937,-73.9737271870777,-73.9737079516958,-73.9736898498261,-73.9736762757606,-73.9736943809861,-73.9736921285981,-73.9737158891425,-73.9737260735636,-73.9737373976232,-73.9737577603273,-73.9737781392266,-73.9738052975527,-73.9738188717185,-73.9738403679705,-73.9738720617402,-73.9738681077621,-73.9737703082617,-73.9736770279925,-73.9736473576662,-73.9736273640125,-73.9736083334664,-73.9735396928971,-73.9735213791428,-73.9734132173086,-73.9733818141015,-73.973365910007,-73.9733406468868,-73.9733171542638,-73.9732832111114,-73.9732362541794,-73.9732001291541,-73.973145927916,-73.9730985814847,-73.9730530485382,-73.9730060597536,-73.9729192910019,-73.9728321556286,-73.9727461164317,-73.9726427049241,-73.9725599000729,-73.9724797005302,-73.972459364719,-73.9723327743952,-73.9722401857878,-73.9722337012091,-73.9720891859023,-73.9720538521498,-73.9720102603346,-73.9719634030125,-73.9719023851281,-73.9718560894905,-73.9718299284167,-73.9717482235701,-73.9717449479008,-73.9717002903813,-73.9716272999856,-73.9715771944183,-73.9715188262802,-73.9715081603157,-73.9714799490723,-73.9714571612231,-73.9714398156672,-73.9714322181422,-73.9714213920824,-73.9714123510978,-73.9714065967207,-73.9714061790852,-73.9714194637928,-73.9714271844355,-73.9714526955966,-73.9714566218295,-73.9714734381999,-73.9715104844795,-73.9715555351495,-73.971569316471,-73.9715727876014,-73.9715896514999,-73.97161872707,-73.9716358615215,-73.9716516007559,-73.9716851486658,-73.9715860410633,-73.9715611436591,-73.9715368659274,-73.9715207678963,-73.9715128218126,-73.9714926005824,-73.9714903909286,-73.9716269727173,-73.9717960198696,-73.9718567123771,-73.9719124415182,-73.9719768505994,-73.9720501541323,-73.9732979683815,-73.9756678261324,-73.9758124489941,-73.9761963235918,-73.9769043637167,-73.9775384383504,-73.9780269795085,-73.9791080389467,-73.9799210997628,-73.9803400750025,-73.9816665703113,-73.9819091150614,-73.9824687621402,-73.9825562923175,-73.9829644066345,-73.9832146714656,-73.9834664420825,-73.9835605212129,-73.984945506,-73.9871804967054,-73.9875719527018,-73.9887793168407,-73.9882860036744,-73.987816450892,-73.9873871843564,-73.9869611550926,-73.9865350000197,-73.9876064539275,-73.9871753728691,-73.9872886374606,-73.9868534526938,-73.9872282000595,-73.9873015486895,-73.9870359272105,-73.986960482836,-73.9866496967712,-73.9864719497867,-73.9852322461129,-73.9847423100253,-73.9842577192636,-73.9838113565054,-73.9833596221309,-73.9832796584488,-73.9829118010137,-73.982455207304,-73.9820087537404,-73.981559970852,-73.9811085987999,-73.9806584262387,-73.9802097127826,-73.9797234650314,-73.9812591988635,-73.981340686616,-73.9814328194381,-73.9829569102128,-73.9824721204708,-73.9820246450754,-73.98157269673,-73.9811232286508,-73.9806734524911,-73.9802208997001,-73.9787064217339,-73.9786072413417,-73.9784850338427,-73.9769857072833,-73.9765348538745,-73.9760482492897,-73.9755580087778,-73.9751026616537,-73.9746479807628,-73.9741893717431,-73.9737341050976,-73.9732755973791,-73.9728196744526,-73.9723627592047,-73.9719067600844,-73.9714504804381,-73.9709937066437,-73.9705341753114,-73.970081008278,-73.9696250012669,-73.9691324742657,-73.9686422611989,-73.9681868780361,-73.9665833842226,-73.9643135356523,-73.9635561893216,-73.963080735288,-73.9619657361163,-73.9597218041865,-73.9590368100845,-73.958934485137,-73.9588635886981,-73.958777908227,-73.9590700303121,-73.9591726424884,-73.9591810321999,-73.9596577087666,-73.9596640030011,-73.9600390099062,-73.9603645514082,-73.9606563818047,-73.9607970991498,-73.9607972298593,-73.9610279086717,-73.9616292753492,-73.9621355905809],"lat":[40.7545732314733,40.7545043151533,40.7545221304219,40.7540043732867,40.7537655170943,40.7537425091569,40.7534122073282,40.7527837757771,40.7517194150958,40.751462643217,40.751047718272,40.7479709356422,40.7477258297499,40.7476667537418,40.7475912183926,40.7474334946201,40.7473684764892,40.7472956513671,40.7472833950029,40.7472732992446,40.7472740243593,40.7472520340963,40.7472412183101,40.7472181449838,40.7471669539643,40.7471294566203,40.7470941284857,40.7470725008057,40.7470443845072,40.7470328439981,40.7470003977796,40.7469881423127,40.7469434435808,40.7469333470503,40.7469210913198,40.7469146031031,40.7468994552753,40.7468792741441,40.7468468198124,40.74683600998,40.7468086079577,40.7468006827962,40.7467882639172,40.7467427152167,40.7465183356965,40.7465305002969,40.7465290068339,40.7465057914948,40.746501935275,40.7464908083793,40.7464811520863,40.7464724389026,40.7464129830064,40.7463407153067,40.7462445153039,40.7462222840115,40.7462077819937,40.7461961714427,40.7461040877104,40.7461016723375,40.7460926560884,40.746035949025,40.7460208432655,40.74601402713,40.745996966332,40.7459769887287,40.7459445776336,40.7458690411165,40.7458388276936,40.7457827841118,40.7457467167945,40.745743305646,40.745666796891,40.745657000293,40.7454447891377,40.7454582051452,40.7454517594362,40.7454630019199,40.745467792035,40.7454957474306,40.7454028612993,40.745351129151,40.7453053665944,40.7452005790328,40.7450496320225,40.7450369494644,40.7450232614002,40.7449523055833,40.7448703765122,40.7448647433907,40.7448662417477,40.7448237642593,40.7447318653061,40.7446564262101,40.7444062176904,40.7444326373972,40.744445573431,40.7444477297019,40.7444547367798,40.7444563520942,40.7444633603434,40.7444633632042,40.7444714440254,40.7444076347199,40.7443586148051,40.7442043609325,40.7440472468869,40.7440466247194,40.7440391903824,40.7440298046648,40.7440169278482,40.7440025619868,40.7439904949088,40.7439695157213,40.7439483246601,40.7439486336106,40.7439421076417,40.7439560099325,40.7439527970038,40.7439696722381,40.743969703586,40.7439876747694,40.7440256969871,40.7440236727749,40.7441075350083,40.7441032327079,40.7440660298467,40.7439647484236,40.7438384553595,40.7437846461903,40.7437715103013,40.7436519420514,40.7435396493495,40.7433346744651,40.7431172009847,40.7430544640598,40.742724819853,40.7426726715347,40.7426635800115,40.7426159121446,40.7423379215437,40.7418877537763,40.7417889059348,40.741623202061,40.7413885876013,40.7411446686918,40.7407382735764,40.7407210390318,40.7407116636083,40.7407095794614,40.7407062799096,40.7406931203005,40.7406757221292,40.74067216505,40.7404265635194,40.7404166969312,40.740413403402,40.7404054152252,40.7404025792529,40.7403076250616,40.7403137432772,40.7403085743457,40.7403001055548,40.7402911718587,40.740034962743,40.7400185126749,40.7400109081997,40.7400217499733,40.739222754277,40.7391782684801,40.7390582657156,40.7390174623353,40.738958668311,40.7388458715124,40.7387894695502,40.7387402650081,40.7387090614696,40.7386658640845,40.7385938691686,40.7385206654936,40.738463068046,40.7384003859874,40.7383953097772,40.7383796859765,40.7383679672454,40.738243363457,40.7382324242622,40.7382238332985,40.7382170682118,40.738044278245,40.7380298693481,40.7379386722888,40.7379146768007,40.7378978725717,40.7378222730757,40.7377982763333,40.7376662775704,40.7367696548423,40.7367446845935,40.7366906890767,40.7366465089315,40.7364614855275,40.7364458816321,40.7358032801077,40.7357871298597,40.7357708612856,40.736414393859,40.7362940197184,40.7362777261068,40.7362852790468,40.7362840835871,40.7361257672455,40.7360999294321,40.7362606334915,40.7362661990414,40.7362784568299,40.7360645884441,40.736062380713,40.7360504791544,40.736053716367,40.7359556566648,40.7359337926681,40.736033472954,40.7360377923566,40.7360441854511,40.7360422810393,40.7358945984113,40.7357969457724,40.7358756802464,40.7358691299667,40.7358311445682,40.73579718202,40.7357801104559,40.7357662681639,40.7357978722552,40.7357878680719,40.7357878616661,40.735727223758,40.7356668860637,40.7356675345683,40.7356719481347,40.7356714742932,40.7356758766068,40.7356801267981,40.7356599127694,40.7356578419828,40.7356716215104,40.7356407250289,40.7356446542345,40.7353677373002,40.7353412178141,40.735273365428,40.7351774534156,40.7355239185212,40.7355992492997,40.7356076143967,40.7355050874736,40.7351865068911,40.7351690661774,40.735205312369,40.7351802039019,40.7352122670153,40.7351997167045,40.7350651700712,40.7350784307669,40.7351077005132,40.7351279379832,40.7351572169713,40.7351725600353,40.7351279476476,40.7352423550771,40.7352019186648,40.7351963427821,40.7351768158837,40.7351475274143,40.7351189338515,40.7350791957984,40.7350408566426,40.7350108778943,40.7349892747627,40.7349711581611,40.7349683768512,40.734975360847,40.7349443261015,40.7353167719006,40.7352342191836,40.7351782459545,40.7350921329331,40.7350306363395,40.7349423126339,40.7348036771935,40.7346306089814,40.7345668858633,40.7344058689429,40.7343009569165,40.7342397122951,40.7341639661661,40.7339935435475,40.7338110724424,40.7336638939344,40.7335545747563,40.7334211655385,40.7334030888633,40.733366076784,40.7333497166083,40.733327337305,40.7333092619045,40.7333109760868,40.7332911823961,40.7332825714011,40.7332653611138,40.7332464280397,40.7332163036386,40.7332197403656,40.7332326551063,40.7332455651092,40.733248999373,40.7332274812081,40.7332119875398,40.7331999343244,40.7332128433879,40.7332093889371,40.7332197143509,40.733213685205,40.7332188506035,40.7332059338881,40.733195609011,40.7331740962501,40.7331697967472,40.7331594705595,40.7331431193724,40.7331396848629,40.7331241914603,40.733120757987,40.7330992476546,40.7331035562959,40.7330949548067,40.7330656871956,40.7326884461769,40.7323102307488,40.732175493264,40.7321074456079,40.7320426897297,40.7317643328235,40.7316901647813,40.7312824164287,40.7312360239194,40.7312200199484,40.731183041662,40.7311579271731,40.7311126759086,40.731056926741,40.7310166323901,40.7309608809961,40.7309136798907,40.730867303253,40.7308231324131,40.7307502415027,40.7306814808071,40.7306058319469,40.7305235378074,40.7304580936181,40.7304008073629,40.7303863293777,40.7302965724682,40.7302304976386,40.7302256778432,40.7301183570417,40.7300866504325,40.7300451714876,40.7300003772175,40.7299307086445,40.7298755502673,40.7298456919728,40.7297420145446,40.7297345485885,40.729665702454,40.729557884146,40.7294691361353,40.7293513617402,40.7293239664924,40.7292495771959,40.729169407558,40.7290958498645,40.7290636190442,40.7289958439723,40.7288798560217,40.7287944713058,40.7287187642511,40.7285688275441,40.728485825885,40.7283414333132,40.7283192380143,40.7282092559281,40.7280027634041,40.7277031085981,40.7276937671985,40.7276459197677,40.7276400336933,40.7276505581858,40.7276479741213,40.7276432125347,40.7274058866366,40.7273969330527,40.7273946882477,40.7273929651008,40.7273861657371,40.7273743080786,40.7273731233514,40.7273500976074,40.7266284529969,40.7267136796566,40.7267586854661,40.7267910087674,40.7268303562017,40.7268809467975,40.72742800886,40.7284625320068,40.7285197676225,40.7286619765265,40.728957824278,40.7292262479172,40.7294330591074,40.7299105584781,40.7302622052087,40.7304424608738,40.7309985475813,40.7310951283115,40.7313148847332,40.7313501340519,40.7315208425476,40.7316241682911,40.731731080616,40.7317702249338,40.732349672818,40.7332921477617,40.7334569906786,40.7339653997385,40.7346590025307,40.7352922810599,40.7358789328976,40.736464342419,40.7370500104712,40.7374978246478,40.7380841334007,40.7381307864771,40.7387147516696,40.7388709785074,40.7389030260365,40.7392663785494,40.7392355272563,40.7391009115229,40.7393628214297,40.738840230795,40.7395103601641,40.7401685929103,40.7407898806718,40.7414121661736,40.7415217628685,40.7420259399277,40.7426469600848,40.7432646208938,40.7438818838497,40.7444982793065,40.7451158253887,40.7457333623706,40.7464028758359,40.7470457052569,40.7470786636824,40.7471197779358,40.7477643531884,40.7484315019191,40.749049540406,40.7496680890156,40.750282458774,40.7509051014574,40.7515219796268,40.7508846466341,40.7508424848914,40.7507882418086,40.7501569592558,40.7507755069916,40.7514413933756,40.7521161830587,40.7527413795409,40.7533671226279,40.753993511311,40.7546187736035,40.7552435380833,40.7558705520048,40.7564977256586,40.7571246738538,40.7577492320373,40.7583733305535,40.7590006498643,40.7596249069017,40.7602514400397,40.7609291906075,40.7615999606762,40.7622268213259,40.7615509355766,40.7605992313504,40.7602808185822,40.7600831637403,40.7596194607855,40.7586630636816,40.7583837826046,40.7583351554485,40.7583060704377,40.7582709208488,40.7579390980203,40.757864780394,40.7578561110523,40.7572601451233,40.7572114121869,40.7567253502389,40.7562694111334,40.7559231495502,40.7558047727407,40.755804655852,40.7556105845791,40.7551523842592,40.7545732314733]}]],[[{"lng":[-73.9240590973699,-73.9240401133402,-73.9231393634936,-73.9222346647762,-73.9218188030682,-73.9215460162964,-73.9212207352637,-73.9211202010852,-73.9207485304976,-73.9218918463265,-73.9223369695204,-73.9228621886442,-73.923062441265,-73.9238514837559,-73.924169050099,-73.9249070671207,-73.9251376222063,-73.9259618393912,-73.9260893009301,-73.9266480844634,-73.9281093220348,-73.928737731971,-73.9297999423443,-73.930236889214,-73.931155339243,-73.9317287178306,-73.9326978492492,-73.9335226266566,-73.9339509297254,-73.9353365296369,-73.9369807406091,-73.9372906345065,-73.937378979284,-73.9375289602967,-73.9376549335342,-73.9381159247666,-73.9382713952967,-73.938365196089,-73.938868641261,-73.9395100827194,-73.9398249573838,-73.9400171205594,-73.9402056390494,-73.9404205787432,-73.9419307881624,-73.9437235275685,-73.9443878859653,-73.9446176611153,-73.9463155753173,-73.9471276214676,-73.9472480870593,-73.9481322539088,-73.9497937934865,-73.9500909464941,-73.9510111210262,-73.9513727858213,-73.9515373886443,-73.9517725790113,-73.9519516224498,-73.9525480011187,-73.9533700073659,-73.9542905331819,-73.9551837082092,-73.9560745618457,-73.9570199312341,-73.9579593822098,-73.9588587462741,-73.9601968885747,-73.9610510070001,-73.9618983782424,-73.9623307288082,-73.9623590331906,-73.9623976909045,-73.962482959087,-73.9628396371634,-73.9623657998502,-73.9621797815518,-73.9625193039367,-73.9625499252884,-73.9631825209575,-73.9638688939085,-73.9645184480918,-73.9652043896813,-73.9658741864341,-73.9660741357412,-73.9665374718372,-73.9666697024391,-73.9672096204262,-73.9676154779079,-73.9679513912622,-73.9683893374683,-73.9692929641454,-73.9696225211887,-73.9698486482354,-73.9698889946892,-73.9699419663263,-73.9696148570143,-73.9696054133035,-73.96968584951,-73.9699926916954,-73.9700990269547,-73.9700128529068,-73.9699407692469,-73.9698521150036,-73.9696843672288,-73.9696310612746,-73.969737433141,-73.969812412881,-73.9697891849518,-73.9696923082645,-73.9694180924718,-73.969385311673,-73.9698257281511,-73.9698093487901,-73.9697119420397,-73.9696620679486,-73.969554331394,-73.9693170560697,-73.9692856264722,-73.969234929313,-73.969291015522,-73.9692335267394,-73.9691448322554,-73.9690958002747,-73.9690797859159,-73.9688847322085,-73.9688659155737,-73.9688161207987,-73.9688653751136,-73.968838175985,-73.9689407930188,-73.9689246627715,-73.968905972631,-73.9688959500675,-73.9688724852357,-73.9688371173459,-73.9688244978786,-73.9688069333314,-73.9687838634211,-73.9687319475613,-73.9687224361543,-73.9687169871728,-73.9686660573397,-73.9685438824263,-73.9684984755434,-73.9684697334704,-73.9684729800564,-73.9684540558431,-73.9684703137231,-73.9685715752624,-73.9685067261952,-73.9688482866971,-73.9683912521389,-73.9680083068735,-73.9676544824914,-73.9673639169947,-73.9672923533356,-73.9672440434898,-73.9672633138167,-73.9671135428995,-73.9671515999891,-73.967267984221,-73.9667684172985,-73.9665969026662,-73.9671834322379,-73.9671928262696,-73.9673074154044,-73.9672301330496,-73.967182436973,-73.9670686768916,-73.9670909626731,-73.9671510117258,-73.966562418975,-73.9665522968005,-73.9665379520819,-73.9665293242056,-73.966515124115,-73.9663243339293,-73.9662336347475,-73.966216840297,-73.9661631672506,-73.9660520999234,-73.9660858848832,-73.9661129297724,-73.9661305929221,-73.9658789353267,-73.9663425984009,-73.9663706791417,-73.9666299336091,-73.9665434463055,-73.9663189780678,-73.9663650323923,-73.9658584717515,-73.9657063633605,-73.965702983132,-73.9656322842164,-73.9655299347028,-73.9651195041622,-73.9652801928745,-73.9654011712709,-73.9653916321955,-73.9653273238765,-73.9652810913342,-73.9651173682371,-73.9656765569886,-73.965598233114,-73.9650327839416,-73.964479462231,-73.9643819088928,-73.9643335973677,-73.964447548536,-73.9643347539806,-73.9643973566168,-73.9648644086133,-73.9649258175784,-73.9650310006452,-73.9649307430027,-73.9648530414549,-73.9647528719096,-73.9648343360944,-73.9643610795633,-73.9642746249727,-73.9649505973669,-73.9648428486345,-73.9642019309861,-73.9640659131032,-73.9643750430115,-73.9643084623728,-73.9640261745855,-73.9639979365841,-73.9635595835819,-73.9635385541452,-73.9634375955293,-73.9634152282094,-73.9629656640302,-73.9627566548873,-73.9622534632019,-73.9622350496432,-73.9620727194389,-73.9624679001106,-73.962471951129,-73.9624434091143,-73.9623904304463,-73.9623659688944,-73.962007448651,-73.9619025618004,-73.9618942677825,-73.9616598430135,-73.9621146156684,-73.9619023964316,-73.9617607035081,-73.9615367935869,-73.9614126357784,-73.9611636636839,-73.9604323024061,-73.9603665103636,-73.9587592816989,-73.9583307822691,-73.9581429250712,-73.9580391674166,-73.957941834895,-73.9579509621324,-73.9582758822373,-73.9583517707886,-73.9584261184392,-73.9601249713324,-73.9602854494421,-73.961063435117,-73.96161518902,-73.961652808281,-73.9616171702982,-73.9614992010534,-73.9614182688696,-73.9611415931247,-73.9610168813666,-73.9611509325364,-73.9612826200821,-73.961284507884,-73.9613014367309,-73.9614318767787,-73.9616744677247,-73.9616984824574,-73.9617128948076,-73.9617549570839,-73.9620345849863,-73.9622634048936,-73.9623039187058,-73.9623406226019,-73.9623083769673,-73.9623550595522,-73.9623246789464,-73.9622852023693,-73.9621855287732,-73.9620903444991,-73.9619847787049,-73.9619096467635,-73.9617620845885,-73.9615749430675,-73.9611900313403,-73.9605191671798,-73.9605115504618,-73.9604674814229,-73.9604226223434,-73.9602955704477,-73.9602386308907,-73.9602228845032,-73.9602157750854,-73.9601876530762,-73.9601473184298,-73.9600952141967,-73.9600771355493,-73.9600338318451,-73.9600010657914,-73.9599165921341,-73.9598950195285,-73.9598508141779,-73.9598293114784,-73.9598158325267,-73.9597990733821,-73.9597797455522,-73.9597224391933,-73.9597058590907,-73.9596922503639,-73.959665432361,-73.9596023986839,-73.9595831145233,-73.9595643178502,-73.9594701001917,-73.9594013832884,-73.95936872915,-73.9593057412758,-73.9591910755679,-73.9591637296287,-73.9591099041089,-73.9590895340494,-73.9590279708699,-73.9589885658971,-73.9588881976613,-73.9588333204565,-73.9588247447747,-73.958814324506,-73.9587779705527,-73.9587654299908,-73.9587303631383,-73.9586780030557,-73.9586403101832,-73.9586134230507,-73.9584874691582,-73.9584586868082,-73.9584318951817,-73.9583750790278,-73.9583123551326,-73.9582421355096,-73.9581558807683,-73.9579598711734,-73.9578942469992,-73.9578544414846,-73.9577648807612,-73.9577167367704,-73.9576340960703,-73.9575470386147,-73.9574182351603,-73.9571547953331,-73.9570932951827,-73.9569585107304,-73.9569464079314,-73.9569300286512,-73.9569182000966,-73.9569034729188,-73.9567781691444,-73.955640045761,-73.9556351553076,-73.9556300411183,-73.9556145431914,-73.9555833632283,-73.9555306715092,-73.9551966091339,-73.9549228049316,-73.9548075756689,-73.9547631402039,-73.9547153325348,-73.9546632150002,-73.9546035338013,-73.9545464481909,-73.9544412511326,-73.9543955541709,-73.954283170276,-73.9542326293959,-73.954193512678,-73.9541562788532,-73.9541218660032,-73.9540277811602,-73.9539724039831,-73.953815514917,-73.9537378328537,-73.9535808906475,-73.9535146185367,-73.9533674459887,-73.9532329903767,-73.9529235572418,-73.9528623207419,-73.9528230147117,-73.9527870757471,-73.9527178138873,-73.9526570290261,-73.9525552757203,-73.9523844877751,-73.9521866942478,-73.9521773188058,-73.9521450608481,-73.9521054173809,-73.9520333747342,-73.9520175131944,-73.9520051419177,-73.9519879435446,-73.9519773122518,-73.9519728512576,-73.9519546919035,-73.9519492725807,-73.9519436860237,-73.951935886692,-73.9519275902918,-73.9519105667552,-73.9519023635228,-73.9518945132561,-73.9518871496452,-73.9518803528664,-73.9518800444408,-73.9518797608839,-73.9518794878858,-73.951879250341,-73.9518790257653,-73.9518788119751,-73.9518784695848,-73.9518782086344,-73.9518780306528,-73.9518778989462,-73.9518782520032,-73.9518804005861,-73.9518806844618,-73.9518806953028,-73.9518806002769,-73.951880446284,-73.9518803395728,-73.951880220321,-73.9518800896361,-73.9518799358311,-73.9518797582595,-73.9518795696814,-73.9518793676876,-73.951879143242,-73.9518786452734,-73.9518780658649,-73.9518578844408,-73.9518126933136,-73.9517171496976,-73.9515420295665,-73.9506452173329,-73.9505097388958,-73.9504645828052,-73.950387481977,-73.9502194406016,-73.9500484853742,-73.9499651646993,-73.9496477167888,-73.9494843055123,-73.9493970100016,-73.949257432886,-73.9488437740077,-73.9486120038477,-73.9485840832611,-73.9484052177219,-73.9481229165706,-73.9481067530303,-73.9480917268227,-73.9475421149279,-73.9472014958558,-73.9471813979384,-73.9471617858923,-73.9471363414268,-73.9470955720832,-73.9470493494224,-73.9470361798764,-73.9470340024367,-73.9470057003398,-73.9469886118082,-73.9469682797806,-73.9469104765004,-73.9468599083619,-73.9468397774887,-73.9468215743279,-73.9467782401273,-73.9467592546025,-73.9466991905293,-73.9466158952047,-73.9465805064899,-73.9465235285479,-73.9464422914086,-73.9466617484334,-73.9466751535911,-73.9469037682147,-73.9470014458955,-73.9471998336716,-73.9471869111846,-73.9471577585992,-73.947086434635,-73.9470653291539,-73.9465980670735,-73.9466282822118,-73.946736923407,-73.9466971949813,-73.9465591900049,-73.9465538324106,-73.9465466944821,-73.9465410522329,-73.9465281650494,-73.9465125404017,-73.9464897659012,-73.9464643481678,-73.9464431007418,-73.9464305125695,-73.9464005067587,-73.9463072009062,-73.9462474829692,-73.9461719588151,-73.9458731056289,-73.9455704845722,-73.9455325990528,-73.9455199804413,-73.9455452848521,-73.9454158498641,-73.9454000312712,-73.945358971799,-73.945207437018,-73.9452011393878,-73.9452201211517,-73.9450780667231,-73.9450590833407,-73.9450338142478,-73.9449990888949,-73.944999104756,-73.9452549227956,-73.9451850718132,-73.9450329903192,-73.9450278576712,-73.9450217993007,-73.9450064221209,-73.9449905853296,-73.9449612448358,-73.9449230922739,-73.9448854042497,-73.9448621404606,-73.9448365341482,-73.9447855127091,-73.9447727208076,-73.9447592102149,-73.9447395406782,-73.9446905205898,-73.9446709474212,-73.9446330062904,-73.9446127299451,-73.9445772611248,-73.9445676624135,-73.944549625305,-73.9445490329952,-73.9445483700264,-73.9445467944337,-73.9445448877422,-73.944542613803,-73.944539168612,-73.9445271511209,-73.944524297879,-73.9445219171834,-73.944520069636,-73.9445185058877,-73.9445172153366,-73.9445161724513,-73.9445156506814,-73.9445153425662,-73.9445152715396,-73.9445152474309,-73.9445152816791,-73.9445153765078,-73.9445155184606,-73.9445157079921,-73.9445162630205,-73.944517044022,-73.9445180500948,-73.9445200849663,-73.9445228060318,-73.9445369136418,-73.9445399894343,-73.9445411961087,-73.9445422028042,-73.9445429831163,-73.9445436341022,-73.94454415356,-73.9445445438963,-73.9445447914801,-73.9445449211989,-73.9445447525729,-73.9445440411409,-73.9445428076356,-73.9445410648893,-73.9445388600858,-73.9445332210585,-73.9445300112339,-73.9445266713042,-73.9445200873574,-73.944515421174,-73.9444924208175,-73.9444813883173,-73.9444640823815,-73.9444283719635,-73.9443908967087,-73.9443235508269,-73.9442224871692,-73.9432996801761,-73.9432134765295,-73.9431678832003,-73.9431050709283,-73.9430069111081,-73.9429441431141,-73.9428804403222,-73.9428418960536,-73.9423944354243,-73.9421224596296,-73.9421053659689,-73.9419689213012,-73.9417723107772,-73.9417381958986,-73.9417918916102,-73.9417861664157,-73.9417630650352,-73.9416936883217,-73.9416065819686,-73.9415456683245,-73.9412980185681,-73.9411474670195,-73.9409974659992,-73.9411561580941,-73.9411353395534,-73.9410384327478,-73.9409420754878,-73.9409291468145,-73.940917580517,-73.9408181722585,-73.9407549070069,-73.9407256205499,-73.9406442348713,-73.9405911274645,-73.9405686893025,-73.9406849160134,-73.9403665895295,-73.939887851462,-73.9398132262545,-73.9397460775415,-73.9389150347707,-73.9385612041251,-73.9381033496067,-73.9380890091206,-73.9372951126293,-73.9371187450795,-73.9369312479987,-73.9368400137809,-73.9365589437499,-73.9360824548658,-73.9356359123366,-73.9356145398115,-73.9352743816798,-73.9350119320212,-73.9349292639187,-73.9348084572107,-73.9342557278262,-73.9342303276802,-73.934235240337,-73.9342287100879,-73.9341542156219,-73.9337667607522,-73.933527616527,-73.9334994819438,-73.9334855598164,-73.9334827199932,-73.9332572980561,-73.9330165861012,-73.9329111623526,-73.9326268266163,-73.9324078986619,-73.9323870036787,-73.932360906291,-73.9323459884982,-73.9321339751577,-73.9320042045381,-73.9319608529366,-73.931881254929,-73.9317484132201,-73.9316831782669,-73.9316685874969,-73.9315735618688,-73.9312077015134,-73.9308047913176,-73.9307225423455,-73.9303263555996,-73.92991812728,-73.929835312754,-73.9296630804213,-73.9296548490522,-73.9296322460576,-73.9296240063502,-73.9296273430395,-73.9296116352238,-73.9295802069088,-73.9295111773887,-73.9294247630484,-73.9293758860378,-73.9292878754255,-73.9292433394839,-73.9292689889354,-73.9292434125346,-73.9291793419222,-73.9291110261476,-73.9288695325505,-73.9284941854016,-73.9283373801302,-73.9281587072564,-73.9281307474383,-73.928054295343,-73.9279551407347,-73.9279391262521,-73.9279275436285,-73.9279017185606,-73.9278825766521,-73.9278717240503,-73.9278643199705,-73.9278589538521,-73.9278028716823,-73.9277965010413,-73.9272027596346,-73.9256147051662,-73.924817989437,-73.9248153715802,-73.9247089165573,-73.9247109844173,-73.9247450310812,-73.924676223692,-73.9246088564732,-73.9245343256218,-73.9245199941513,-73.9245201859684,-73.924520830482,-73.924538549858,-73.9245535587675,-73.9245794808889,-73.9246295419992,-73.9246900485712,-73.9247022780711,-73.9247718325362,-73.9248155567726,-73.9248641350911,-73.92493181379,-73.9249920442661,-73.9250867752077,-73.9261579023423,-73.926383666008,-73.928379301015,-73.9283915383406,-73.9284037507559,-73.9284212741908,-73.9284241972088,-73.9284268816078,-73.9284293775785,-73.928431718539,-73.9284356896591,-73.9284456138612,-73.9284495386324,-73.9284516558226,-73.928453890207,-73.9284619456356,-73.928470830849,-73.928480640266,-73.928491537878,-73.9285135383971,-73.9285742522137,-73.9285917078937,-73.9286066756521,-73.9286372006141,-73.9286677468448,-73.928698268136,-73.9287286693929,-73.9287353864659,-73.9287420797614,-73.9287684578225,-73.9287760856202,-73.928779989409,-73.9287839882596,-73.9287896305719,-73.9287956187773,-73.9288085531668,-73.9288225296615,-73.9288371369767,-73.9288520289608,-73.9288664256039,-73.9288796518002,-73.9288910810599,-73.9289685070605,-73.9289822116627,-73.9290741935762,-73.9290934667455,-73.9291100394285,-73.9291243277067,-73.9291364861019,-73.9291385605439,-73.9291402089788,-73.9291423120929,-73.9291429714401,-73.9291424545693,-73.92914397868,-73.9291453078458,-73.9291470154509,-73.9291570069504,-73.9291698977279,-73.9291853904298,-73.9292029421139,-73.9295685690548,-73.9296057883535,-73.9296394007181,-73.9296487614611,-73.9296672372045,-73.9296829561913,-73.9296957285304,-73.9297053991533,-73.9297076228221,-73.9297084843028,-73.9297079860933,-73.9297061273464,-73.9296984781283,-73.9296928553877,-73.9296861770914,-73.9295071485949,-73.9295023492771,-73.929498461682,-73.9294956154654,-73.9294939059558,-73.9294934720096,-73.9294946497543,-73.9294963979435,-73.929497314861,-73.9295016940007,-73.9293199976608,-73.929315726363,-73.9293165196558,-73.9293218797777,-73.9293317763478,-73.9293448342123,-73.9293613166862,-73.9293825020932,-73.9294005289397,-73.9294198181735,-73.9294406781308,-73.9294632508139,-73.9294735692146,-73.9294853192335,-73.9294983453227,-73.9295124723109,-73.9295274741894,-73.9295431388072,-73.929559203856,-73.9295754332346,-73.9302996242696,-73.9314930461092,-73.9315129843278,-73.9315332550619,-73.9315359654061,-73.9315589243162,-73.9315843812833,-73.9316592671744,-73.9317053453831,-73.9317500895425,-73.9317926722912,-73.9318324282947,-73.9319048299599,-73.9319881491739,-73.9320446165217,-73.9320804705364,-73.9321047811306,-73.9321299951439,-73.9321557326612,-73.9321975314633,-73.932206073073,-73.9322136328231,-73.9322252981197,-73.9322303771756,-73.9322341491633,-73.9322346904511,-73.9322353635064,-73.9322339746947,-73.932230015088,-73.9322151930618,-73.9321969843875,-73.9321736792135,-73.9321566533723,-73.9321536155983,-73.9321499860121,-73.9321412815338,-73.9321368692123,-73.9317535718227,-73.9315904835653,-73.9315566200755,-73.9315420382568,-73.9314260410093,-73.9313674684806,-73.9313130786729,-73.9314360302114,-73.9312406705949,-73.9314530173299,-73.9315560427115,-73.9315914426215,-73.9316452739167,-73.9319718412763,-73.932451631567,-73.9325504173053,-73.9325776548012,-73.932595636195,-73.9326105193551,-73.9326167598056,-73.9326222660991,-73.9326315998166,-73.9326390524246,-73.9326443754896,-73.9326462145881,-73.9326474728588,-73.9326482349775,-73.9326491737302,-73.9326469395629,-73.9320326298051,-73.933384846153,-73.933283493203,-73.9319010192086,-73.9316639886082,-73.9315109259059,-73.9312657270327,-73.9310297877014,-73.9309322754774,-73.9307949018102,-73.930791803705,-73.9307874517292,-73.9307869429517,-73.930783526474,-73.9307800270698,-73.9307769310975,-73.9307719933312,-73.930768572108,-73.9307660006668,-73.9307668365166,-73.9307660262381,-73.9307627053335,-73.9307599915477,-73.9307565310478,-73.9307390315692,-73.9307188219671,-73.9306959378436,-73.9306704392642,-73.930641803742,-73.9305721330634,-73.9305429663506,-73.9305279439577,-73.9305257228551,-73.9305158586311,-73.9305071231641,-73.930502031801,-73.930501000832,-73.9303609456584,-73.9303734795637,-73.9303772099989,-73.9303818492877,-73.9303856313317,-73.9303857407662,-73.9303846690073,-73.9303802173511,-73.9303728780508,-73.9303628542563,-73.9303505350377,-73.9302887981322,-73.9302662809465,-73.9302650972975,-73.9302565183526,-73.9302503884903,-73.9303767140616,-73.9306809942876,-73.9309983562131,-73.9311583696588,-73.9315461374687,-73.9308888191221,-73.9308596617392,-73.9308357102641,-73.9308163730948,-73.9308084145055,-73.9308015902649,-73.9307878093358,-73.9307828650395,-73.9307793659171,-73.9307773691761,-73.9307768754867,-73.9307778853387,-73.9307789473705,-73.9307803752297,-73.930790204141,-73.930800805444,-73.9308125804357,-73.9308189429891,-73.9308256373481,-73.930833692726,-73.9308468254447,-73.9308552876547,-73.9308640944476,-73.9316103273489,-73.9318204207725,-73.9318333498546,-73.9318412232115,-73.9318463511817,-73.9318486887745,-73.93184794873,-73.9318424949343,-73.9318341574614,-73.9318218728667,-73.9318163387005,-73.9318097033648,-73.931792859637,-73.9317722642453,-73.9317343685178,-73.9306678864662,-73.9305711431028,-73.9305464277637,-73.9305271320737,-73.9305190693687,-73.9305120595293,-73.9305060787523,-73.9305011378325,-73.9304915043938,-73.930473615222,-73.9304641824193,-73.9304360384999,-73.9304305881457,-73.9304263110575,-73.930424485839,-73.9304229431307,-73.9304226389901,-73.930771665474,-73.9309507359177,-73.9310523190167,-73.9308519013403,-73.9299166552832,-73.9299027990128,-73.9293141228578,-73.9292716706695,-73.9292536656753,-73.9284388181459,-73.9289024285406,-73.9289059898621,-73.9289060126502,-73.9289025104378,-73.9288955189768,-73.928884418546,-73.9288707269487,-73.9288544671095,-73.9288356617239,-73.9287905809,-73.9287680502739,-73.9287453198781,-73.9287111132049,-73.9286772879615,-73.9286436542239,-73.9286100919124,-73.9285758110837,-73.928489109203,-73.9284362240153,-73.9283224194212,-73.9282714510703,-73.9282526348971,-73.9282325304488,-73.9282113500457,-73.9281892718894,-73.9281665195066,-73.9281433662164,-73.9281200610616,-73.928096887447,-73.9259516394395,-73.925940911088,-73.9251460605983,-73.9249974068021,-73.9249747370717,-73.9249548965358,-73.9249425244251,-73.924926210813,-73.9249023936849,-73.9248891124791,-73.9248629971176,-73.9248373090317,-73.9248221434472,-73.9247946191773,-73.9247717357909,-73.9247507718374,-73.9247290613489,-73.9247122757727,-73.9246936210236,-73.9246759143407,-73.924660040746,-73.9246451386399,-73.9246255503999,-73.9246033947608,-73.9245869348676,-73.9245840710721,-73.9245682413708,-73.9245529097176,-73.9245380167142,-73.9245208166272,-73.9245075570141,-73.9244926653785,-73.9244778104609,-73.9244606131204,-73.9244506295892,-73.9244292467153,-73.9244087753188,-73.9243902055648,-73.9243692700281,-73.9243507009103,-73.9243330315124,-73.9243130678671,-73.924293056077,-73.9242758587178,-73.9242600692737,-73.9242456522157,-73.9242335769337,-73.9242219623099,-73.9242057123545,-73.9241908235595,-73.9241808416879,-73.9241659886564,-73.9241506260189,-73.924135311216,-73.9241199951014,-73.9241028009434,-73.9240842361937,-73.92406646436,-73.9240482660733,-73.924030423535,-73.9240145690646,-73.924001231726,-73.9239891245494,-73.9239772799705,-73.9239656378104,-73.9239545032466,-73.9239403746935,-73.9239313285829,-73.923903678816,-73.9238941706456,-73.9238732614853,-73.9238518917777,-73.9238323896616,-73.9238147213608,-73.9238065716195,-73.9237952188527,-73.9237824235474,-73.9237701371041,-73.9237487547003,-73.9237283193838,-73.9237097150153,-73.9236873979866,-73.9236737038475,-73.9236600084222,-73.9236398926207,-73.9236269941497,-73.9236149949463,-73.9236015524262,-73.9235878623398,-73.9235760424432,-73.9235660685178,-73.923558754813,-73.9235495029838,-73.9235353436641,-73.9235272708796,-73.9235190216807,-73.9235105240247,-73.923496119394,-73.9234849854512,-73.9234748199425,-73.923462786962,-73.923452338527,-73.9234400204305,-73.9234289199994,-73.9234186143472,-73.9234106992331,-73.9234052216491,-73.9234013059782,-73.9233929943387,-73.9233853977937,-73.9233783416715,-73.9233705225069,-73.92336526384,-73.9233535568471,-73.9232865323734,-73.923231571136,-73.9231677608526,-73.9231344572239,-73.9231171816841,-73.9231114960376,-73.9231036112499,-73.9230757991148,-73.9230550001433,-73.9232603979891,-73.9233124491608,-73.9233347737978,-73.9233662758325,-73.9233857974686,-73.9234049108595,-73.9234316927592,-73.923471440708,-73.9236114515555,-73.9235900100315,-73.9243132996157,-73.9245940828105,-73.9248328755903,-73.924885535076,-73.9248523093602,-73.9247874513713,-73.9247662928441,-73.9247612878214,-73.9247625720616,-73.9247649334008,-73.9247615504935,-73.9247298162903,-73.9246900933839,-73.9246601307839,-73.9246150150585,-73.9245556874402,-73.9245258166989,-73.9245122616133,-73.9244822173475,-73.9244315317407,-73.9244191096702,-73.924414531177,-73.9244091086461,-73.9243902805051,-73.924367188328,-73.9243475111798,-73.9243377960684,-73.9243369910777,-73.924336374636,-73.9243358975712,-73.9240590973699],"lat":[40.7141115601475,40.7140083126289,40.713394728091,40.7128559543629,40.7117820674471,40.7110432835344,40.7107905585565,40.7107354078152,40.7105336489583,40.7093960967104,40.7090062604165,40.7085454975254,40.7083689691659,40.7076762980633,40.7073944496271,40.7067443945278,40.70653890478,40.7058097831741,40.7056797011623,40.7055292245019,40.704963939698,40.7047169507642,40.7043045299944,40.7041311315899,40.7037723348702,40.7035459911243,40.7031703912226,40.7028489818732,40.7026745926979,40.7023148258386,40.7019102776596,40.7018284443381,40.7018051310971,40.7017655535374,40.7017323123984,40.7016106683499,40.7015696423227,40.7015448898458,40.7014276729813,40.7012797812481,40.7012087986458,40.7011661481724,40.7011243056465,40.701076598295,40.7007252341929,40.7005058357302,40.70042452328,40.7004053004199,40.7002149527619,40.7001228108842,40.7001049092465,40.7000062728164,40.6998233144236,40.6997905932375,40.6996779853941,40.699633724601,40.6996135788452,40.6995847944241,40.6995628810171,40.6994947771409,40.6994045406529,40.6992953542764,40.6991929024127,40.6990900019673,40.6989739143496,40.6988200032159,40.6986773264163,40.6984627274387,40.6983260788191,40.6981883325315,40.6981195943247,40.6981150917399,40.6981089457377,40.6980953847548,40.6980386683399,40.6996055858518,40.7002207106044,40.7004726819675,40.7004970336439,40.7010000953747,40.7015418892111,40.7020749782679,40.7026227448141,40.7031576959966,40.7033201529412,40.7036966129153,40.7038066038877,40.7042557091534,40.704961635387,40.7057312170614,40.7068291867471,40.7070933310958,40.7076275885551,40.7080030416877,40.7085748720672,40.7093020533538,40.7101477491818,40.7102708438748,40.7103217314837,40.7103820507433,40.7104578579221,40.7105227497149,40.7105169554208,40.7105169201751,40.7104940194041,40.710656945988,40.7106798225086,40.7107327842513,40.7107919337904,40.7108469029217,40.710938127262,40.711005576651,40.7112039882907,40.7112226637601,40.7112121679025,40.7111852418907,40.711163402436,40.7110906560018,40.7111747120036,40.7112405414383,40.7112701993124,40.7114331322863,40.7114569945475,40.7115631136033,40.7116234424766,40.7121768592334,40.7122318986553,40.7122519477066,40.7122723596265,40.7123896419288,40.712418772448,40.7124634269349,40.7125067765303,40.7125283147768,40.7125787434364,40.7126323818693,40.7126606171347,40.7127086204145,40.7127565262057,40.7127405699145,40.7127376458277,40.7127469447746,40.7128571934916,40.7128207009424,40.7128069037367,40.7128247093462,40.7128534282115,40.7129243861121,40.7129277731031,40.7129488751829,40.7131054718895,40.7132276370316,40.714261918674,40.7151207233035,40.7158691092228,40.7164836790553,40.7165155721164,40.7165853499164,40.7166661666832,40.7168975386014,40.7169192736823,40.7169857409558,40.7177054035189,40.7179679813901,40.7182759210276,40.718265144022,40.7183130671844,40.7184146688431,40.7184830563018,40.7184390357913,40.7184057668083,40.7183161264351,40.7180158668063,40.7180370561811,40.7180330990489,40.7180307184972,40.7180491778381,40.7182972155567,40.7182474368664,40.7182382194703,40.7182838732036,40.7183871933501,40.7184119939305,40.7184318476272,40.7184894944578,40.7187550776865,40.7190187424302,40.7189897083511,40.7191324278609,40.7192229424695,40.7191084200085,40.719056330784,40.7187732288491,40.7189149026368,40.7189178616616,40.7189284611104,40.7188887083911,40.7192268939974,40.7193485112609,40.7195510125624,40.7198291796064,40.7200424027964,40.720125184468,40.7203163388564,40.7206789605404,40.7207444584025,40.7203770694752,40.7200361882556,40.7201394246605,40.7202083196805,40.7202769739059,40.7203865389111,40.720441833924,40.7207755418605,40.7207202844473,40.7207908413709,40.7208813500634,40.7209528048595,40.7208774838425,40.7207955469382,40.7204772398772,40.7205757675939,40.7214241816044,40.7214641760947,40.7206538937544,40.7207999109626,40.7209925507686,40.7210556694882,40.720880892566,40.7209384380726,40.7215394874682,40.7215733785144,40.7215590951624,40.7215816274453,40.7220344771229,40.7223990151263,40.7235322975463,40.7235702592653,40.723880300403,40.7241315796013,40.7241749892735,40.7241997854814,40.7241935671868,40.7242090616143,40.7239919011055,40.7240982899786,40.7241067021013,40.7248604544631,40.7251480633989,40.7253205003086,40.7252287916082,40.7251089188521,40.7251772194927,40.7252646063335,40.7251141086606,40.7250473093859,40.7245413543696,40.7244117007662,40.7244042839001,40.7244274408787,40.7246492026999,40.7250364391684,40.725167457041,40.7251980573018,40.7254005358322,40.725319636637,40.725948122413,40.7258448991855,40.7258655630743,40.7262039262311,40.7266614219913,40.7267510906227,40.7273561797049,40.7281037254046,40.7287044401018,40.7295362047707,40.7300610250103,40.7301590617017,40.7302529429247,40.7309651711453,40.7314812535528,40.7315323413948,40.7315661138451,40.7316646781653,40.7323803700424,40.7329155516238,40.7331136604796,40.7333892266331,40.7335323247664,40.7337132611241,40.7339077603459,40.7340476958767,40.7342490166328,40.7345079978736,40.7346380331482,40.7347508062467,40.7348916147792,40.7351796149286,40.735602796583,40.7363421923001,40.7363506088976,40.736399645353,40.7364445560135,40.7365629198,40.7366137610139,40.7366366556025,40.7366451810799,40.7366754728731,40.7367156937461,40.7367585487333,40.7367785610387,40.736834313893,40.7368691346129,40.7369540503563,40.7369790590649,40.7370368558599,40.7370609006332,40.7370727378713,40.7370843933693,40.7370956609817,40.737126312529,40.737136852015,40.7371472570096,40.7371721644954,40.7372369515062,40.7372541631057,40.7372686718343,40.7373347818313,40.7373810160274,40.737404328377,40.7374520685889,40.7375391162866,40.7375570089685,40.7375860397879,40.7375980090169,40.7376373578487,40.7376647276904,40.7377411635235,40.7377854672204,40.7377908032214,40.737795833999,40.737809445915,40.7378148084692,40.737833742475,40.7378664927029,40.7378999420698,40.7379212020659,40.7380166834734,40.738039203051,40.7380586443721,40.7380969493687,40.7381370264709,40.7381799196203,40.738230830411,40.7383483913731,40.7383864052726,40.7384101097699,40.7384643593652,40.7384933202474,40.7385381177614,40.7385822459951,40.738649241835,40.7387763216203,40.7388059892583,40.7388738732591,40.7388791820021,40.7388870730716,40.738888914788,40.7388899626838,40.7389055931794,40.7390443167101,40.7390447018122,40.739044699842,40.7390458104334,40.7390400711877,40.7390326932623,40.7390845416937,40.739103300665,40.7391188429977,40.7391235355563,40.739126541959,40.7391279531344,40.7391278483742,40.7391249169296,40.73911765397,40.7391147725225,40.7391073703734,40.7391073502993,40.739106957143,40.7391069148531,40.7391007688459,40.7390831445748,40.7390749458279,40.7390531258635,40.7390453331872,40.739032977285,40.7390269269752,40.7390105142204,40.7389926836408,40.7389349423952,40.7389215603005,40.73891247885,40.7389041749163,40.7388910848033,40.7388788764745,40.7388576813775,40.73882039306,40.7387852540356,40.7387835840928,40.7387782574259,40.7387709838699,40.7387572569284,40.7387537651017,40.7387515174384,40.7387476204743,40.7387312890866,40.7387274336166,40.7387089390017,40.7387048212873,40.7387017118441,40.7386985208971,40.7386958973214,40.7386926931404,40.7386922038881,40.7386924525689,40.7386934397414,40.7386951567277,40.7386952648208,40.7386953997286,40.7386955527337,40.738695715135,40.7386959127223,40.7386961195281,40.7386965970028,40.7386971463804,40.7386977852517,40.738699307509,40.7387020534142,40.7387098977303,40.738711456347,40.7387126085981,40.738713050493,40.7387134099403,40.738713563685,40.7387136986614,40.7387138061588,40.7387139054376,40.7387139767297,40.7387140398083,40.7387140759097,40.7387140934061,40.7387140756078,40.7387139859066,40.7387082953116,40.7386941832534,40.7386652189662,40.7386112582023,40.7383644721523,40.7383226845242,40.7383095807951,40.7382848371257,40.7382215316004,40.7381580526832,40.7381244810761,40.7379977311122,40.7379338594584,40.7378996643399,40.7378449878044,40.7376858919138,40.7375954501017,40.7375845502646,40.7375138345934,40.7373971546085,40.7374337079595,40.7374677048648,40.7372789165484,40.7371664488197,40.7371612531526,40.7371549317598,40.73714465423,40.7371248600172,40.7370999575793,40.7370917936557,40.737090279723,40.7370706175265,40.7370610640049,40.7370525985793,40.7370317343376,40.7370073886882,40.7369991489907,40.7369937641603,40.7369840188966,40.7369787236565,40.7369577507113,40.7369245549604,40.7369442689772,40.7369268539582,40.7367806262632,40.736365663237,40.7363406240721,40.7359136581787,40.7357169108341,40.7353551776116,40.7352307821005,40.7350322972516,40.7345459154896,40.7344019928193,40.7344422243473,40.7345847893349,40.7352949437199,40.7353666414143,40.7356079137531,40.7356176283049,40.7356299983298,40.7356401166552,40.7356628312826,40.7356903516416,40.735730512737,40.7357757602102,40.7358131844558,40.7358353589379,40.7358890685369,40.7360575195062,40.736166165227,40.7362028887743,40.7361018312582,40.7366123039105,40.7366050805178,40.7365906629183,40.7365378328546,40.7365017440082,40.7365377640788,40.7365497545759,40.7365088505162,40.7364872304083,40.7364440057189,40.7363934976849,40.7364391251824,40.736448720264,40.7364366937126,40.7364174787705,40.7358927890038,40.7354791526778,40.7354286156834,40.7354505230167,40.7354749061166,40.7355314418091,40.7355703087646,40.7356342491509,40.7357027865971,40.7357663704945,40.7358105389372,40.7358677811913,40.7359645433152,40.7359857612772,40.7360041078243,40.7360242427751,40.7360641382862,40.7360827521311,40.7361238502515,40.7361473987429,40.736191181305,40.7362028211145,40.7362246578818,40.7362252883337,40.7362258731844,40.7362269258321,40.7362278076109,40.7362285536839,40.7362293177883,40.7362310137339,40.7362315806092,40.7362322540914,40.7362329914904,40.7362338372483,40.7362348280481,40.7362359441096,40.736236762895,40.7362375554818,40.7362379511451,40.7362383387897,40.7362387345037,40.7362391128242,40.7362394998787,40.7362398787473,40.7362406442756,40.736241401704,40.736242176161,40.7362434111412,40.7362447354086,40.7362506676149,40.7362523532397,40.7362531728577,40.7362539935521,40.736254785993,40.7362556328177,40.736256533355,40.7362575068717,40.7362585247142,40.7362595863919,40.7362618743871,40.7362643234489,40.7362668974016,40.7362695260577,40.7362721462824,40.7362771686903,40.7362793371145,40.7362811722658,40.7362836541816,40.7362843908928,40.7362830737726,40.7362814930355,40.7362787262004,40.7362702787069,40.7362587376441,40.7362325909117,40.7361877201332,40.7358236122307,40.7357905300162,40.7357675086524,40.7357357977102,40.7356886519511,40.735660191794,40.735632947046,40.7356172323656,40.7354257499476,40.7352337614063,40.7352190381247,40.7351189764035,40.73498208139,40.7349507179176,40.7349128966475,40.7348949369233,40.7348593823185,40.7347693781114,40.7346877021639,40.7347343359348,40.7343762934337,40.7341529275376,40.7337904855558,40.7337489096099,40.73370281125,40.733488260203,40.7335086520785,40.7335113918772,40.7334840471214,40.7332489094403,40.7332778099146,40.7332911854071,40.7331705114796,40.7330917657177,40.7330584942577,40.7330170771246,40.7322125869148,40.7312956210336,40.7311526889121,40.7310654754721,40.7303837947332,40.7301336432188,40.7297285195214,40.7297468462605,40.7293005567874,40.729189932065,40.7291080912656,40.7290879139383,40.729017826267,40.7288827118521,40.7287519526528,40.7287459856344,40.7286510190735,40.7285724277312,40.728543915753,40.7285286107039,40.7284329144726,40.7284313151652,40.7283954955784,40.7283908269012,40.7283816536207,40.728333938938,40.7283073975901,40.7283041392015,40.7282944147814,40.728281563846,40.7282407028148,40.7282103422337,40.7282333159417,40.7281806135635,40.7281459238374,40.7281476945562,40.7281677703671,40.7281823938847,40.7281596034337,40.7281450828935,40.7281256243596,40.7280953827941,40.7280537276967,40.7280317265996,40.7280382823069,40.7280182945584,40.7279413386244,40.7278488392617,40.7278410726897,40.727795142249,40.7276388983563,40.7276078893267,40.7275433977113,40.7275476520488,40.7275645947863,40.7275775745762,40.7276000540057,40.7276112194395,40.7276128207087,40.7275699311767,40.7275117520126,40.7274799695389,40.7274255040288,40.7273979423187,40.7273652153212,40.7273420003438,40.7272838446055,40.7272197405277,40.7270026311259,40.7266146033079,40.7264175826986,40.7262052307578,40.7261726868244,40.7260723401626,40.7259165175137,40.7258837290458,40.7258790568471,40.7258757804416,40.7258664846255,40.7258540511977,40.7258266790583,40.7257545989973,40.7250102671816,40.7249256687137,40.7236529471862,40.7200616622125,40.7202651374753,40.7202255585509,40.7199988755664,40.7199911954769,40.7199852472463,40.7198856959834,40.7197896928349,40.7196661577725,40.7196127304242,40.7195683707742,40.7195535665119,40.7193425802045,40.7192791311942,40.7191625233348,40.7189869743737,40.7187223355559,40.7186883041007,40.7185646108553,40.718486835906,40.7184404454135,40.7184058287495,40.7183847877612,40.7183842192043,40.7180994676333,40.7180848075262,40.7175783672901,40.7175787536806,40.717580192961,40.7175842105983,40.7175853026808,40.7175867541275,40.7175885743514,40.7175908089404,40.7175959539825,40.7176118628106,40.7176160882683,40.7176177732295,40.7176191980942,40.7176231203817,40.7176262868002,40.7176287324213,40.7176304958777,40.7176320943452,40.7176331316613,40.7176350605051,40.717638338238,40.7176479572927,40.7176593131039,40.7176723806816,40.7176871410362,40.7176911876186,40.7176964688592,40.7177220422503,40.7177272702909,40.7177293163667,40.7177310024858,40.7177328521224,40.7177342973951,40.7177359709466,40.7177359976812,40.7177343674604,40.7177311077119,40.717726344604,40.7177203186236,40.7177133111643,40.7176475401509,40.7176365712372,40.7175713328194,40.7175561612246,40.7175416011124,40.7175272927246,40.7175130713107,40.717510038005,40.7175067618582,40.717499332999,40.7174907159879,40.717464519654,40.7174566139918,40.717453139464,40.7174499159569,40.717436414578,40.7174235551023,40.7174116501187,40.7174010980063,40.7172215360652,40.7171901845551,40.7171564988538,40.7171459421695,40.7171225489422,40.7170984430439,40.7170739290912,40.7170492793892,40.7170402038032,40.7170306673566,40.7170208074229,40.7170108015802,40.7169910302404,40.7169817248743,40.7169730752338,40.716590780876,40.7165855184292,40.7165796537786,40.7165734208713,40.7165670343678,40.7165632699394,40.7165357692718,40.7165268197134,40.7165221377296,40.7164997898054,40.7161120088327,40.7160781012698,40.716043837806,40.7160120704493,40.7159765609796,40.7159389179831,40.7158983155449,40.7158516280597,40.7158165187663,40.7157850036969,40.7157565786164,40.7157310447563,40.7157214526212,40.7157124274356,40.715704069285,40.7156965052146,40.7156898412978,40.7156841961809,40.715679649111,40.7156762731529,40.715507876364,40.7152084805726,40.7152119046247,40.7152139884879,40.7152141608097,40.7152148502648,40.7152142527501,40.7152085523943,40.7152031676125,40.7151945849368,40.7151829750912,40.7151685283298,40.7151375838835,40.7151001364142,40.7150741719206,40.715056497541,40.7150425992693,40.715025603784,40.7150060591763,40.7149721074904,40.7149639809294,40.7149551066193,40.7149357974609,40.7149215452463,40.7149020158329,40.7148934612194,40.714882853138,40.7148644283749,40.7148469655459,40.7148056135094,40.7147664493887,40.7147221395195,40.7146948344854,40.71469104223,40.7146874647303,40.7146812910892,40.7146790464748,40.7147416755057,40.7143994924812,40.714393384423,40.7143596070047,40.7143823430806,40.7142524913519,40.7141440248959,40.7141261825179,40.7137248108847,40.7134388449662,40.7133994727547,40.7133848159179,40.7133427937582,40.7132532609103,40.7131217169368,40.7130953712621,40.7130891116558,40.7130837006766,40.7130772882474,40.7130736721442,40.7130697498743,40.7130613711127,40.7130525861694,40.7130437018088,40.713039272298,40.7130348786333,40.7130310430458,40.713015815055,40.7130007307889,40.7115902230743,40.7112337277457,40.7109787069554,40.7113384714282,40.7108102434826,40.7104698083942,40.709924443553,40.7093585122073,40.7091653112542,40.7091147015711,40.7091129348106,40.7091100051606,40.7091095903927,40.7091067975045,40.7091033012877,40.7090994814834,40.7090910130348,40.7090811325744,40.7090606535207,40.7090191674455,40.7090025435792,40.7089863770596,40.7089793784905,40.7089729827373,40.708947316942,40.708921739475,40.7088963130113,40.7088710744416,40.7088469416653,40.7087948682607,40.7087688708975,40.7087511838697,40.7087476083384,40.7087317623618,40.7087112251342,40.7086902944068,40.7086812250396,40.7087177380327,40.708739303505,40.7087475186101,40.7087577687139,40.708774538789,40.7087823191489,40.7087897655831,40.7088028477628,40.7088158732468,40.708828465054,40.708840137758,40.7088857287389,40.7089049235904,40.7089060937203,40.7089165433867,40.7089279134226,40.7092223400329,40.7099209529672,40.7106182251161,40.7110010485448,40.7118553517511,40.7120560068582,40.7120649411568,40.7120749314833,40.7120862210696,40.7120923842966,40.7120988907977,40.7121164792172,40.7121253193263,40.7121339071707,40.7121420645364,40.7121497825448,40.7121570139537,40.7121604279555,40.7121637066479,40.7121808222605,40.7121946963534,40.7122058059496,40.7122103490857,40.7122142342072,40.7122179224641,40.7122214063722,40.7122206637821,40.7122181926869,40.7120380226804,40.7124789836111,40.7125075279878,40.7125282627781,40.7125472486356,40.7125647741833,40.7125934910591,40.7126272379906,40.7126553745774,40.7126794652262,40.7126871609876,40.7126947748458,40.7127100378027,40.712724956611,40.7127492922381,40.7130212668937,40.7130510969147,40.7130557464607,40.7130615614071,40.713065031889,40.7130688824544,40.7130731375483,40.7130777908112,40.7130904192119,40.7131199628539,40.7131316723203,40.7131560864507,40.7131615490608,40.7131667878934,40.7131695870043,40.7131725586711,40.7131916312695,40.7139294680851,40.7143638194785,40.714610224426,40.7149029855928,40.7151498169994,40.715124963477,40.715279834187,40.7153142169788,40.7153288025398,40.7155309495758,40.7165728123179,40.7165963547318,40.7166189573121,40.7166401079375,40.7166595189858,40.7166804216683,40.7167014490641,40.7167225742146,40.7167437785373,40.7167879385702,40.7168073306165,40.7168251283484,40.7168497458599,40.7168724087257,40.7168932436464,40.7169123312956,40.7169298336846,40.7169710419118,40.7169988342672,40.7170624562006,40.7170897288322,40.7170985958669,40.7171064542534,40.7171132397932,40.7171188802252,40.7171233328014,40.7171265248179,40.7171284364942,40.7171290346693,40.7176910705699,40.7176741521623,40.7178556123768,40.7178895550873,40.7178938995342,40.7178981459748,40.7179008843457,40.7179048541483,40.7179094223188,40.7179115474451,40.7179165005926,40.7179219234235,40.7179250925122,40.7179317739369,40.7179369466248,40.7179404439534,40.7179440506878,40.7179461559121,40.7179481248846,40.7179499225918,40.7179514432337,40.7179531089174,40.7179538432647,40.7179533060734,40.7179507026463,40.7179502407415,40.7179448819069,40.7179391347341,40.7179323717961,40.7179244813952,40.7179176377709,40.7179096758377,40.7179009855197,40.7178908795682,40.7178853796423,40.7178722988444,40.7178588948115,40.717848256553,40.7178364200925,40.7178252323396,40.7178139907289,40.7178021548969,40.7177900658966,40.7177806075764,40.7177708807965,40.7177617307075,40.7177545638337,40.7177477480631,40.7177369762748,40.717726971146,40.7177202470784,40.7177099719165,40.7176999927721,40.7176895817727,40.7176793600758,40.7176671372024,40.7176521951309,40.717638567158,40.7176243368092,40.7176093935301,40.7175947770652,40.7175834044082,40.7175720139663,40.7175599209211,40.7175464150863,40.7175336105183,40.7175208138552,40.7175141359514,40.7174956206966,40.7174890594182,40.7174745466417,40.7174607554303,40.7174484773809,40.7174366324262,40.7174314948456,40.7174235539266,40.7174145936554,40.7174059944051,40.7173921763616,40.7173782765184,40.7173673136266,40.7173531067925,40.717344038361,40.7173355194153,40.7173206574934,40.7173085730942,40.7172968225012,40.7172847377382,40.7172715806369,40.7172584259481,40.717245271981,40.7172347760864,40.7172205509276,40.7172045664914,40.7171951504717,40.7171850146385,40.7171738146762,40.7171546153978,40.7171421726421,40.7171308008586,40.7171176460163,40.717105896437,40.7170929297029,40.7170819992296,40.7170690157387,40.7170569252481,40.7170444944562,40.7170320832986,40.7170153907456,40.7170029496637,40.7169942462993,40.7169814450528,40.7169745258731,40.7169658994891,40.7168340031082,40.7166994391576,40.7164789153861,40.7164794689454,40.7164761884565,40.7164691882316,40.7164515324939,40.7163892347664,40.7163426647934,40.7162497341354,40.7162288498968,40.7162253262613,40.7162173056064,40.7162127886707,40.7161924044799,40.7161725210986,40.7161466666239,40.7161035081713,40.7160281486949,40.7158470565768,40.7155343758555,40.7152829120414,40.7152671876526,40.7151986006984,40.7150755935461,40.7150320495119,40.7150194746817,40.7150040762739,40.7149886527709,40.7149759714484,40.7149379664753,40.714880957033,40.7148668804073,40.7148270836542,40.7147536537328,40.714690417847,40.7146207721807,40.7145234523006,40.7143647761764,40.7143496125249,40.7143485385189,40.714349912868,40.7143491791324,40.7143308294748,40.7143070530095,40.7142537087109,40.7142015873513,40.7141400817555,40.7141225934664,40.7141115601475]}]],[[{"lng":[-73.8525475023021,-73.852241585414,-73.8522610366254,-73.8524939623295,-73.8525305061513,-73.8525395503782,-73.8525539727034,-73.8526653448466,-73.8526891729137,-73.8525607000627,-73.8525660456009,-73.8525475023021],"lat":[40.760069811743,40.759921607984,40.7598959113081,40.7600104121597,40.7600056578146,40.7599943523337,40.7599995155202,40.7599183267704,40.7599283156638,40.7600166710964,40.7600468580992,40.760069811743]}],[{"lng":[-73.8527010783819,-73.8527155183443,-73.8527427464126,-73.8527587008236,-73.8527748332086,-73.8527937652885,-73.8527783645368,-73.8527972731736,-73.8527782869497,-73.8529907939976,-73.8529740888236,-73.8527010783819],"lat":[40.760128117819,40.7601005142437,40.760108029594,40.7600804279491,40.7599642281752,40.7599721661337,40.7600862082713,40.7600914111682,40.7601213107524,40.7601917882932,40.7602170867005,40.760128117819]}],[{"lng":[-73.8397005336242,-73.839894946295,-73.8405407985583,-73.8406256288308,-73.8414440958441,-73.8419868148216,-73.8420174078952,-73.8424402247995,-73.8426131219734,-73.8423114797328,-73.8421165215355,-73.8418332213885,-73.8410708526977,-73.8405263547938,-73.8404651959791,-73.8401672408474,-73.8399281323675,-73.8397005336242],"lat":[40.7652895884368,40.7650940540317,40.7641096110879,40.7640234198922,40.7637724706044,40.7636346482519,40.763688570101,40.7645042729928,40.764682989692,40.7648316653291,40.7649010341971,40.7649750539696,40.7652084067205,40.7653879897001,40.7653028700007,40.7653085449268,40.7653502119004,40.7652895884368]}],[{"lng":[-73.8397005336242,-73.8395782685355,-73.8394581344615,-73.8391318926341,-73.8392562170269,-73.8395267864783,-73.8395437155588,-73.8396977254908,-73.8397377880207,-73.8397338680685,-73.8396937599099,-73.8395605054185,-73.8395100059495,-73.839498057958,-73.8395907260982,-73.8396817500014,-73.8397538798215,-73.8397875047296,-73.839869578183,-73.8399392217747,-73.8399402231328,-73.8398843082264,-73.8399019091333,-73.8400075897093,-73.840113137722,-73.840223744468,-73.8402702092048,-73.840274380491,-73.8403117031529,-73.8405722221806,-73.8408651507117,-73.8408475949733,-73.8408401364553,-73.840836443574,-73.8408600710315,-73.840871220179,-73.8408650021131,-73.8408888353827,-73.8410219192257,-73.8410080289379,-73.8410788870798,-73.8410849707359,-73.8410576192273,-73.841056430088,-73.8412053056116,-73.8412033740023,-73.8411957449596,-73.8412007549781,-73.8412367974932,-73.8412367682111,-73.8412230910439,-73.8412272392916,-73.8414436438792,-73.8417228607504,-73.8417012582299,-73.8416732380633,-73.8416621163819,-73.8417130964574,-73.8417448125708,-73.8419644492187,-73.8419840191644,-73.8419654658316,-73.8419157397382,-73.841915728522,-73.8418734447532,-73.8418623149472,-73.8419033560001,-73.8419058306349,-73.8423186823178,-73.8423174449702,-73.842357230672,-73.8423646345371,-73.8423285691252,-73.8423260973578,-73.8422726159543,-73.8422899117665,-73.8423182801006,-73.8425134757182,-73.8424927236075,-73.8424815287943,-73.842472878599,-73.8425226165896,-73.8425275458323,-73.8425113777536,-73.8425362349485,-73.8426819600242,-73.8429591563736,-73.8433696975304,-73.8434682069571,-73.843599743765,-73.8437063352786,-73.8439474833579,-73.8440790636557,-73.844265680065,-73.8444889588419,-73.8449133284601,-73.8452816354158,-73.8459302329294,-73.8460271598125,-73.8461407214992,-73.8462002403795,-73.8465217041874,-73.8466676854462,-73.8468496463689,-73.8470130919798,-73.8471218859345,-73.8472306797614,-73.8473826309707,-73.8476935357508,-73.8478057510442,-73.8478616771611,-73.8479223456838,-73.8479904827163,-73.8480424881757,-73.8480941144258,-73.8482132401846,-73.8482822285698,-73.8483741186846,-73.8484203827973,-73.8485033313528,-73.8486231381937,-73.8485253028606,-73.8485114987878,-73.8482713408881,-73.8482363010162,-73.8482084111575,-73.8481883341731,-73.8481765472404,-73.848173330512,-73.8481787604554,-73.8481927080345,-73.8482148417744,-73.8482446356389,-73.8482813815304,-73.8483242061195,-73.8483720916009,-73.8484238998825,-73.8485630381577,-73.848573301391,-73.8485838064554,-73.8485942755272,-73.8486044317349,-73.8486140064813,-73.8486227465464,-73.8486304207847,-73.8486368262383,-73.8486417935039,-73.8486451912138,-73.848646929509,-73.8486469624171,-73.8487454360023,-73.8489965636812,-73.8488219438439,-73.848514351803,-73.8484931402133,-73.8484769230442,-73.8484661676675,-73.8484611840512,-73.8484621158264,-73.8485936853999,-73.84859790419,-73.8486102761274,-73.8486219128766,-73.8486452704888,-73.8486715286884,-73.848747467963,-73.8488263633886,-73.8489052706554,-73.8491299111492,-73.8493381477534,-73.8494940271186,-73.8495760947736,-73.849609790169,-73.8497323042617,-73.8497380449763,-73.8497730365678,-73.8498050147528,-73.8498226879864,-73.8499325288583,-73.849940466773,-73.8499424188297,-73.8502018833616,-73.8502024009588,-73.8503039745047,-73.850310750245,-73.850283798234,-73.8502906085098,-73.8503141582523,-73.8503380881852,-73.85037848157,-73.8503682352618,-73.8512605246145,-73.8512674258831,-73.8513010837448,-73.8512703762072,-73.8512400780663,-73.8512537491334,-73.8503614653021,-73.8503341056926,-73.8502970778994,-73.850297175739,-73.8501973454494,-73.8501948666894,-73.849951625173,-73.849962928372,-73.8499462080866,-73.8498690241191,-73.8500373857281,-73.8500406554625,-73.8498395837767,-73.8497276954476,-73.8495716095589,-73.8491858043713,-73.8489761986719,-73.8489611240003,-73.8491236529015,-73.8492119720892,-73.8492198600987,-73.8492189792075,-73.8492093333181,-73.8491909655552,-73.8490932500087,-73.849062203239,-73.8490334958886,-73.8490144282875,-73.848968509044,-73.8489298868185,-73.8489890559831,-73.8490964175549,-73.8490965844089,-73.8491924041105,-73.8491897329178,-73.8490932343741,-73.8490264586265,-73.8491273741165,-73.8491256356391,-73.8490217298192,-73.8490197116363,-73.8490349131232,-73.84901842052,-73.8489994143167,-73.848977716763,-73.8489740492575,-73.8489716598805,-73.8489568088469,-73.8489545091338,-73.8489555932542,-73.84896008359,-73.8489680254469,-73.8489738348037,-73.8489820746995,-73.848992542023,-73.8489938074022,-73.8490049192053,-73.8490188266483,-73.8490338863596,-73.8490496960331,-73.8490659137323,-73.8491140666188,-73.8491760538887,-73.8492056110266,-73.849236627992,-73.849287646568,-73.8493120634356,-73.8493333857542,-73.8493453407138,-73.8493567111171,-73.8493676162693,-73.8493782575125,-73.8493958540834,-73.8494353566523,-73.8494784449966,-73.8494943632536,-73.8495075733188,-73.849517316323,-73.8495252080799,-73.8495311450571,-73.8495350564192,-73.8495358659634,-73.8496919692504,-73.8496962613019,-73.8497474142047,-73.8497444580872,-73.8495366469045,-73.8495343034801,-73.84952990131,-73.8495285897792,-73.8495265700725,-73.8495238381854,-73.8495203371549,-73.8495113336778,-73.849481318617,-73.8494772242041,-73.8494738893154,-73.8494712409086,-73.8494692797771,-73.8494584613067,-73.8494510632477,-73.8494461945274,-73.8494438267176,-73.8494439741274,-73.8494467073114,-73.8494490536041,-73.8494520389504,-73.8494556650752,-73.8494599557768,-73.8494690484616,-73.8494795769649,-73.8495051386488,-73.8495368533371,-73.8495772081674,-73.8496042924005,-73.8496868797888,-73.8496951331868,-73.84973917397,-73.8497578686036,-73.8497731134845,-73.8497854085521,-73.8497903057578,-73.8497943604447,-73.8497975864761,-73.8497999937689,-73.8498015715241,-73.849801320979,-73.8499335329618,-73.8499308085666,-73.849800881122,-73.8497961047961,-73.8497922389795,-73.8497904499096,-73.8497879996375,-73.8497848969631,-73.8497811431635,-73.8497716115908,-73.8497592371477,-73.8497310839671,-73.8496617948397,-73.8496581187053,-73.849653982055,-73.8496440972789,-73.8496016047256,-73.8495957738881,-73.8495930234844,-73.8495861258342,-73.8495824620826,-73.8495793189661,-73.8495766621077,-73.8495744894822,-73.8495727922538,-73.849571554537,-73.8495775485019,-73.8495792144374,-73.8495828564967,-73.8495883373438,-73.8495954771789,-73.8496040054478,-73.8496137809668,-73.8496246034214,-73.8496363163359,-73.8496396893303,-73.849643241763,-73.8496509609571,-73.8496595245861,-73.8496691205745,-73.8496877344868,-73.8497318773017,-73.8497426251204,-73.8497486904764,-73.849751900693,-73.8497540443524,-73.8497385127623,-73.8500700712478,-73.8500911408919,-73.8500939813191,-73.8501286695787,-73.8501114813009,-73.8506722779776,-73.850657884151,-73.8509671895646,-73.8509470572425,-73.8511870038709,-73.8511927579449,-73.8514760606033,-73.8514875548042,-73.8512042618531,-73.8512099815756,-73.8510133961941,-73.8510276713211,-73.8510507916471,-73.8510794601664,-73.8510505558126,-73.8510390476669,-73.8509465557471,-73.8509493705478,-73.8507441542307,-73.8507355559626,-73.8501574165167,-73.8501401731583,-73.8501112588136,-73.8501227525042,-73.8500369687846,-73.8497930434762,-73.8498172006613,-73.8498785983377,-73.8498753731961,-73.8499864327529,-73.8500054245655,-73.8500070194975,-73.8523526788141,-73.8523208624222,-73.8523566193624,-73.852388327784,-73.8523623209583,-73.8523575191727,-73.8499749305626,-73.8498210225987,-73.8498436284433,-73.8498424903832,-73.8498411266337,-73.8498404033678,-73.8498395261934,-73.8498363029474,-73.8498322511673,-73.8498137596969,-73.8498058694271,-73.8498020776475,-73.8497988767489,-73.8497962211328,-73.8497950943898,-73.8497940862725,-73.8497701402023,-73.8497544934995,-73.8497381878454,-73.8497217813201,-73.8497055321618,-73.8496894070345,-73.8496734158977,-73.8496642425201,-73.8496539355512,-73.8496185152682,-73.8496102005045,-73.8496001652216,-73.8495912905816,-73.8495863362687,-73.8495814397404,-73.8495766122702,-73.8495719387722,-73.8495674417425,-73.8495632520746,-73.8495594523538,-73.8495561490703,-73.8495525938664,-73.8495500198537,-73.8495476758588,-73.8495484951426,-73.8495485770481,-73.8495524547828,-73.8497308600606,-73.8497326928696,-73.8496367777574,-73.8496386669402,-73.8498688587428,-73.8498695681708,-73.8503147615601,-73.8503147395773,-73.8503742647849,-73.8503764244708,-73.8504163523557,-73.8504184001099,-73.8504499279542,-73.8504565603158,-73.8504817801942,-73.8504837158839,-73.8516228678168,-73.8516356332863,-73.8516902808542,-73.8516709916224,-73.8516226613418,-73.8516249264616,-73.8504857822591,-73.8504751054994,-73.8504204557043,-73.8504183032119,-73.8503678606033,-73.8503658086133,-73.8499980041286,-73.8497371104991,-73.8494938120832,-73.849489779298,-73.8494874774245,-73.8494868694162,-73.849487193038,-73.8494879433641,-73.8494910274917,-73.8494957465128,-73.8495123606577,-73.8495263735185,-73.8495653283724,-73.8495749556846,-73.8495821916793,-73.8495859647979,-73.8495887290542,-73.8495913141527,-73.8495907270451,-73.8495861252853,-73.8495861868718,-73.849591292068,-73.8495970795902,-73.8496031561403,-73.8496103773161,-73.8496130358924,-73.849617400299,-73.849623434817,-73.8496310337892,-73.8496401257918,-73.8496504409401,-73.8496617154408,-73.8496735742172,-73.8496791492526,-73.849685329843,-73.8496921628949,-73.849699778369,-73.849708427545,-73.8497514675155,-73.8497609454888,-73.8497690463917,-73.8497773348782,-73.8497810051181,-73.849784389933,-73.8497874793645,-73.8497903179067,-73.8497928720839,-73.8497951894794,-73.8498016276668,-73.8498070799836,-73.8498082942797,-73.8498150315213,-73.849817465627,-73.849819114673,-73.8498194312396,-73.8498194304299,-73.8498121479652,-73.8498106738803,-73.8498100889878,-73.8498117316842,-73.8498148830908,-73.8498267696491,-73.8498498080579,-73.8498567369541,-73.8498826323617,-73.8498856081573,-73.8498880083087,-73.8498893208179,-73.8499121999631,-73.8509397094504,-73.8509364639653,-73.8499185528998,-73.8498872806375,-73.8498447080574,-73.8498409204437,-73.8498366001427,-73.8498317255162,-73.8498262943367,-73.8498131350058,-73.8497989693572,-73.8497668772079,-73.8497362003665,-73.8496531836167,-73.8495843534843,-73.8495464630235,-73.8494905339534,-73.8494510762917,-73.8493616991155,-73.8492881538969,-73.8492012595272,-73.8491997794827,-73.8491983569139,-73.8491969699857,-73.8491956292934,-73.8491943489423,-73.8491931267296,-73.8491908492488,-73.8491888299035,-73.8491870941846,-73.8491856773962,-73.849184603081,-73.8491836140263,-73.8491843320554,-73.8491853185187,-73.8491866746324,-73.8491883858081,-73.8491904054503,-73.8492029285044,-73.8492177284127,-73.849234925789,-73.8492548508884,-73.8492746246153,-73.8492887645058,-73.8492976002976,-73.8493870577167,-73.8494234520113,-73.8494421137358,-73.8494588065872,-73.8494738402559,-73.849487379028,-73.8495012434971,-73.8495137890027,-73.8495247660925,-73.8495338918321,-73.8495409427998,-73.8495456102457,-73.8495477426599,-73.8495472582156,-73.8495406937947,-73.8495291345937,-73.8495216158552,-73.8495129851483,-73.8495033275319,-73.8494926631581,-73.8494729490394,-73.8494538829606,-73.8494481288945,-73.8494227221584,-73.8493618666762,-73.8493342037846,-73.8493117668668,-73.8492939241004,-73.8492695022477,-73.849251862032,-73.8492406454269,-73.8492374298696,-73.8492358036873,-73.8492364433759,-73.8492386676868,-73.8492421263771,-73.8492467598012,-73.8492525818285,-73.8492595424889,-73.849263456849,-73.8492676449515,-73.8492960072154,-73.8493290404437,-73.8493673000706,-73.8494136653904,-73.849477556218,-73.8495231920476,-73.8495649005389,-73.849603367286,-73.8496446346406,-73.8497424654662,-73.8497865521717,-73.8498276497408,-73.8499344172467,-73.8499944211066,-73.8501756039079,-73.8502096129721,-73.8502303385557,-73.8502323040437,-73.850234220722,-73.8502360685135,-73.8502378544331,-73.8502412846246,-73.8502445600841,-73.8502498394481,-73.8502606656706,-73.8502636551281,-73.8502666224842,-73.8502698746824,-73.8502715669128,-73.8502733055723,-73.8502751045427,-73.8502769638241,-73.8502788948754,-73.8502808965778,-73.850285208824,-73.8502896179352,-73.8502941212662,-73.85029868704,-73.8503079857205,-73.8503171116785,-73.850321124998,-73.8503250914903,-73.8503404094519,-73.8503447798017,-73.8503493383474,-73.8503539659174,-73.8503591841537,-73.8503713617038,-73.8503857403835,-73.8504019872408,-73.8504421173962,-73.8504623769214,-73.8504836628953,-73.8505012124317,-73.8505186990861,-73.8505278566229,-73.8505729439596,-73.8506445275671,-73.850802556775,-73.8508519106285,-73.8509597436332,-73.8510586521182,-73.8511588822416,-73.8511666176466,-73.8511745163957,-73.8511824502199,-73.8511902860846,-73.8512051392021,-73.8512118475053,-73.851217914744,-73.851225019733,-73.8512304773424,-73.8516873553553,-73.8519205472727,-73.8520158256492,-73.8520964483179,-73.8521603986763,-73.8522809761908,-73.8523442645095,-73.8523815719044,-73.8525345815865,-73.8526005387797,-73.8527763562536,-73.8528552953956,-73.8529739584343,-73.8531499306918,-73.8532233094994,-73.8532440720573,-73.8532669278286,-73.8532919615053,-73.8533193385004,-73.8534681212245,-73.8536450698241,-73.8536797409506,-73.8537171100586,-73.8537579607567,-73.8538051223873,-73.8539565077767,-73.8540557089919,-73.8541396953641,-73.8541715708133,-73.8542402730513,-73.8542681772494,-73.8542940146698,-73.8543523304115,-73.8543783332217,-73.8544982659683,-73.8545964185493,-73.8546314693325,-73.8547096110761,-73.8547442826478,-73.8548062259648,-73.8548542920655,-73.8549001856964,-73.8549644151702,-73.8550584217123,-73.8551673946048,-73.8551957726588,-73.8552245033217,-73.8552534429529,-73.8552824278659,-73.8553022800623,-73.855320504664,-73.855336429502,-73.8553496148037,-73.8553663118615,-73.8553794260627,-73.8553884517444,-73.8554506283493,-73.8556161701541,-73.8557347526391,-73.8557346758225,-73.8558186269766,-73.8558756799679,-73.8558745893039,-73.8559265654997,-73.8559329668011,-73.8559397928041,-73.8559460569667,-73.8559515743171,-73.8559561819346,-73.8561213757192,-73.8561409367522,-73.8564537874142,-73.8564399366304,-73.8566769089333,-73.8566715926442,-73.8566533206465,-73.8566213363517,-73.8566187594762,-73.8566094295479,-73.8566028691233,-73.8566495109061,-73.8566534100588,-73.8566813904766,-73.8567025683102,-73.856703774319,-73.8567107416798,-73.8567166980192,-73.8567187222903,-73.8567267682451,-73.8567440555453,-73.856783191625,-73.856803652428,-73.8568247680223,-73.8568320988492,-73.8568412901467,-73.8568520938422,-73.856864192288,-73.8568772045523,-73.8568905755415,-73.8569038060162,-73.8569097784974,-73.8569157487935,-73.856916424825,-73.8569305618581,-73.8569871461256,-73.857080732806,-73.8571287329935,-73.8571778452565,-73.8572794625962,-73.8572982732324,-73.8573185003105,-73.8573405231684,-73.8573682487103,-73.8573952026222,-73.8574199855093,-73.857442612377,-73.8574630450794,-73.8574935136815,-73.8575173357796,-73.8575267060602,-73.8575343581186,-73.8575756101128,-73.8576122335284,-73.8576342068337,-73.8576593241534,-73.857687047151,-73.8577167816424,-73.8577478903299,-73.8580099583406,-73.8580359580916,-73.8580606029558,-73.8580831810342,-73.8580928560566,-73.8580937671542,-73.8581026647801,-73.8581092059747,-73.858114888409,-73.858135725119,-73.8581586875018,-73.8581692814619,-73.8581720906369,-73.8581734007758,-73.8581728999853,-73.8581697266112,-73.8581497386987,-73.8581365752164,-73.8581340679924,-73.8581254220579,-73.85812274224,-73.8581193244985,-73.8581103439309,-73.8580985169115,-73.8580840204605,-73.8580668514261,-73.8580475264075,-73.858026553258,-73.8580047619792,-73.8579968497707,-73.8579877553578,-73.857957159486,-73.8579462618326,-73.8579359943457,-73.8579314448641,-73.8579272140556,-73.8579083833539,-73.8578968091742,-73.8578922103488,-73.8579016554721,-73.8579717930963,-73.8579736503145,-73.8579779869261,-73.8580071092676,-73.8579968441452,-73.8579912078299,-73.8579857118921,-73.8579808467939,-73.8579788421786,-73.8579770612822,-73.8579755371838,-73.8579742709989,-73.8579732600888,-73.8579728610185,-73.8579725322007,-73.8579722747739,-73.85797207351,-73.8579719445013,-73.8579718855387,-73.8579722069898,-73.8579735840979,-73.8579760273527,-73.8579795821829,-73.8579884170501,-73.8580106807068,-73.8580507336236,-73.8581331189015,-73.8581663862647,-73.8582759765529,-73.8583105479409,-73.8583397920101,-73.8584118313145,-73.8584636537244,-73.8584749951258,-73.8585022696847,-73.8585118198584,-73.8585173177108,-73.8585214909577,-73.8585248542611,-73.8585252017042,-73.8590017140746,-73.8590564453236,-73.8590950000835,-73.859091930461,-73.8590811990642,-73.8590300448282,-73.8590747615189,-73.8591230174794,-73.8591072442365,-73.8591073220796,-73.8592069151527,-73.8592520435447,-73.8592512623232,-73.8592034906694,-73.8592361058371,-73.8592996965809,-73.8593419053047,-73.8594632808303,-73.8593119145823,-73.8593486011995,-73.8595083348476,-73.8594158876295,-73.8590999872229,-73.8591031712013,-73.859066385959,-73.859088877022,-73.8589904893737,-73.8589403443186,-73.8589694590099,-73.8589980889287,-73.8590255282003,-73.859051100305,-73.8590741747574,-73.8590941826513,-73.8591106306864,-73.8591231133293,-73.8591313228145,-73.8591350567309,-73.8591343198297,-73.8591318830869,-73.8591280401277,-73.8591228585809,-73.8591153905055,-73.8591059796067,-73.8590785149879,-73.859073094663,-73.8590665971082,-73.8590459572914,-73.8590427912807,-73.8590340303879,-73.8590260006667,-73.8590227377988,-73.8590199353911,-73.8590150068732,-73.859012474675,-73.8591246122371,-73.8591032279805,-73.8590075486967,-73.8590076575516,-73.8590126256115,-73.8590158623747,-73.8590267291246,-73.8590304506407,-73.8590316943146,-73.8590322609396,-73.8590313789377,-73.8590278402291,-73.8590212250379,-73.8590158599166,-73.8590081859403,-73.8589981662399,-73.8589857998795,-73.8589711614874,-73.8589540346852,-73.8589107413936,-73.8588557160953,-73.8588048897857,-73.8587566398488,-73.8587103004744,-73.858651027365,-73.8586507788746,-73.858638071021,-73.8586270572705,-73.8586117707735,-73.8585986022946,-73.8585931069524,-73.8585884050855,-73.8585845314169,-73.8585815239076,-73.8585764279673,-73.8585723356879,-73.8585662329842,-73.8585649236142,-73.8585664570324,-73.8585694261782,-73.8585784455328,-73.8585912769972,-73.8586081570027,-73.8586303130777,-73.8586413032532,-73.8586690018288,-73.8586791994799,-73.8586887976565,-73.8586944557939,-73.8586968468518,-73.8586968111797,-73.8586959592165,-73.8586907357678,-73.8586828335007,-73.8586722305374,-73.8586588762671,-73.8586094910695,-73.8585672513092,-73.8585449318842,-73.8584830336685,-73.8584712422876,-73.8584450638356,-73.8584295364326,-73.8584256195931,-73.8584209222441,-73.8583971812771,-73.8583918434039,-73.8583874538475,-73.8583230983823,-73.8582674310271,-73.8582615204913,-73.858255747815,-73.8582341240623,-73.8582053737903,-73.8581695641935,-73.8581575411004,-73.8581435417625,-73.8581281715849,-73.8581120350973,-73.8580913167539,-73.8580690623594,-73.8580455195342,-73.8580358282388,-73.858021091643,-73.8579996160449,-73.8579799805232,-73.8579620284476,-73.8579456899835,-73.8579217200928,-73.8578631484034,-73.8578059968867,-73.8577298616972,-73.8577090935057,-73.8576848260181,-73.857602556052,-73.857573784934,-73.8575473410334,-73.8575358112572,-73.8575252176092,-73.8575054207683,-73.8574657686572,-73.8574473935771,-73.8573774340095,-73.8573613658272,-73.8573483429966,-73.8572937439897,-73.8572855959106,-73.8572434981615,-73.8572383645425,-73.8572324711961,-73.8572180769616,-73.8572031450029,-73.8571681858959,-73.8571535620552,-73.8571234576355,-73.8570511235634,-73.8570304295576,-73.857011189699,-73.8570088928026,-73.8570065822965,-73.85700423682,-73.8570018440101,-73.8569969380467,-73.8569917453668,-73.8569816544257,-73.8569625005109,-73.8569521826025,-73.8569485775113,-73.8569441800101,-73.8569399361998,-73.8569358006761,-73.8569154596122,-73.8568664875655,-73.8568415584446,-73.8568113376548,-73.8567842570316,-73.8568309468409,-73.8566251050963,-73.8565943049048,-73.85658367207,-73.8565601248598,-73.8565517820311,-73.8565428156593,-73.8565210751089,-73.8565168695887,-73.8565123593114,-73.8565074691837,-73.8565021433667,-73.8565003764531,-73.8564985392624,-73.8564946154943,-73.8564903374551,-73.8564855973523,-73.8564763470182,-73.8564516069263,-73.8564445353755,-73.856441347344,-73.856438338054,-73.8564098120099,-73.8563852262836,-73.8563646514819,-73.8563558975458,-73.8563481731828,-73.8563343560463,-73.8563213857149,-73.8562849514648,-73.8562691866179,-73.8562533829157,-73.8562107120178,-73.8562002031507,-73.8561920416779,-73.8561785660261,-73.8561690442091,-73.8561637123685,-73.8561627502643,-73.8561704583648,-73.8561760427645,-73.8561760439437,-73.8561743696005,-73.8561737828743,-73.8561727578656,-73.8561712812902,-73.8561693571337,-73.8561669694893,-73.8561641329056,-73.8561569904048,-73.8561491032481,-73.8561393208458,-73.8560977299245,-73.8560810462333,-73.8560750929999,-73.8560664806243,-73.8560569353308,-73.8560374216807,-73.8560202758011,-73.856005866244,-73.855994502745,-73.8559864295653,-73.8559818202406,-73.8559790045778,-73.8559742376895,-73.8559676482223,-73.8559594140093,-73.8559497572716,-73.8559389386217,-73.8559272500289,-73.8559150069408,-73.8559025397695,-73.8558901849745,-73.8558782759827,-73.855364155737,-73.855228869316,-73.8552279423134,-73.8552218638764,-73.8551274939933,-73.8549497141386,-73.8549154203117,-73.8548368560723,-73.8548017316441,-73.8547645733254,-73.8547313812559,-73.8547070531823,-73.8546802286187,-73.8545703238903,-73.8545388696969,-73.8545109791795,-73.8544987783975,-73.8544845470797,-73.8544674801146,-73.8544499838544,-73.8544275447974,-73.8544158710038,-73.8544053243703,-73.854392114847,-73.8543774136702,-73.8543140923596,-73.8542988328643,-73.8542849819707,-73.8541687791334,-73.8540180561719,-73.8539315220122,-73.8537152444741,-73.8535406808038,-73.8534518446134,-73.8533645753844,-73.8533203375243,-73.8532843310634,-73.8532539136759,-73.8532286567929,-73.8531394532828,-73.8530431848867,-73.8530198637786,-73.8529945522266,-73.8529374264022,-73.8528729257569,-73.8528525604419,-73.8528423013387,-73.8528420113836,-73.8528617928357,-73.8528899026119,-73.8529729685184,-73.853066638841,-73.8531259333368,-73.8531642037782,-73.8532509376302,-73.8532896704259,-73.8534696174507,-73.8535377195181,-73.8535905188923,-73.8536144229767,-73.8536726190396,-73.8536995815986,-73.8538649677078,-73.8540177076405,-73.8541534556627,-73.8542411911325,-73.8543260101729,-73.8543536350784,-73.8543836478858,-73.8544161171376,-73.8544644028455,-73.8545002771564,-73.8545350335831,-73.8545682818972,-73.8545997369168,-73.8546311018012,-73.8546621264137,-73.8546934145886,-73.8547274472931,-73.8547654977257,-73.8547851813468,-73.8547924992481,-73.854797686158,-73.8548008362411,-73.854801947332,-73.8548006534152,-73.8547953603152,-73.8547935555014,-73.8547928987249,-73.8547917082223,-73.8547901501402,-73.8547882875254,-73.8547748875346,-73.8547748676024,-73.8547725437133,-73.8547670010299,-73.8547509245973,-73.8547451367765,-73.8547271693993,-73.8547134155777,-73.8547006703473,-73.854693308821,-73.8546740230833,-73.8546667849742,-73.8546457583267,-73.8546375473026,-73.8546148631208,-73.8546074354342,-73.8545936426242,-73.8545792407035,-73.8545612018878,-73.8545485136166,-73.8545315068943,-73.8545261443121,-73.8545254129659,-73.8545234573319,-73.8545212436374,-73.85451938179,-73.8545147646745,-73.8545077372496,-73.8545029730325,-73.8544961845873,-73.8544864837776,-73.8544773471365,-73.8544719407123,-73.854465992515,-73.85445942841,-73.8544522277977,-73.8544472824194,-73.8544348052176,-73.8544237147415,-73.8541592614838,-73.8540697206796,-73.8538989057514,-73.8538312013555,-73.8536295532005,-73.8535519793621,-73.8534774943624,-73.8534095404109,-73.8533785130151,-73.8533068131877,-73.8532744562699,-73.8531679145579,-73.8531286860247,-73.8530937697147,-73.853005963764,-73.8528362203768,-73.8527991299458,-73.8527712656627,-73.8527451415859,-73.8527359569694,-73.852720981704,-73.852698951807,-73.8526885390596,-73.8526792733986,-73.8526711413716,-73.8526641451899,-73.8526583069305,-73.8526535906472,-73.8526475996978,-73.8526474241987,-73.8526529909005,-73.8526641843186,-73.8526807110952,-73.8527070359152,-73.8527343133696,-73.852762579209,-73.8527918796175,-73.8528350217929,-73.852858796491,-73.8528846908182,-73.8529094802153,-73.8529791055956,-73.8530608095311,-73.8531465716288,-73.8531747881396,-73.853201198733,-73.8533545089095,-73.853424455239,-73.8534617023301,-73.8535700185279,-73.8536655370685,-73.8537169511726,-73.8537433789416,-73.8537533639223,-73.8537613721071,-73.8537629995277,-73.853769898906,-73.8537722241845,-73.8537752195276,-73.8537776078747,-73.8537785491069,-73.8537779734007,-73.8537759581933,-73.8537726775182,-73.853731265373,-73.8536973940717,-73.8536903856595,-73.8536723572886,-73.8536660273111,-73.8536578451733,-73.8536496767006,-73.8536360708706,-73.85363080166,-73.8536315280859,-73.8536365935801,-73.8536504217716,-73.8536839681405,-73.8537108977222,-73.8537263587465,-73.853740514107,-73.8537335159383,-73.853718255533,-73.8536856184859,-73.8535845163886,-73.8535323717638,-73.8535176462218,-73.8533882035106,-73.8532170102761,-73.8530403426025,-73.8529022710568,-73.8528287203345,-73.8527662719851,-73.8526850827292,-73.8526372529344,-73.8526241681154,-73.8526231078306,-73.8526571103394,-73.8526587999629,-73.8526309825624,-73.8525926125183,-73.8525804269362,-73.8525561151049,-73.8525315320726,-73.8524907658293,-73.8524265122297,-73.8523360101605,-73.8522547863188,-73.8521406258595,-73.852002889473,-73.8519316067721,-73.8518973071364,-73.8518165129967,-73.8516807217834,-73.8515907715734,-73.8514372374564,-73.8512917816523,-73.8511201166095,-73.8509703415275,-73.8507980725843,-73.8506280829412,-73.8504908278996,-73.850326381366,-73.8501676964223,-73.8500072169576,-73.8498408564086,-73.8497346793859,-73.8496225183908,-73.8494823389847,-73.8493365487603,-73.8492203438544,-73.8491345572552,-73.8490616083509,-73.8489834275515,-73.848930518328,-73.8489013144504,-73.8488619839784,-73.8488489472311,-73.8488584837078,-73.8488796549556,-73.8489014742577,-73.8489619483971,-73.849017211755,-73.8490781479572,-73.8490316303219,-73.8489627121751,-73.8487837015379,-73.8487774547026,-73.848771220004,-73.8487845736854,-73.8488469096149,-73.8488716220684,-73.8488765456334,-73.8488456648997,-73.8488137643307,-73.8487099936133,-73.8485598873898,-73.848400677251,-73.8482344227651,-73.8480593399491,-73.8479236486364,-73.8478196718063,-73.8476376207219,-73.8474584037846,-73.8472983967437,-73.8471264674746,-73.8468583117691,-73.8467714617375,-73.8467308665806,-73.8466091425802,-73.8465163191613,-73.8464472761264,-73.8463782325881,-73.8463226431793,-73.8462442065603,-73.8461155783733,-73.8460330637517,-73.8459656757289,-73.8458748717784,-73.845692560646,-73.8456625160152,-73.8456082717433,-73.8455780270891,-73.8455817326852,-73.8456152437029,-73.8456046907874,-73.8455653750983,-73.845506387169,-73.8454278023763,-73.8453669860478,-73.8452788515889,-73.8451963347884,-73.8450589172057,-73.8449801717,-73.8449476501911,-73.844886607545,-73.8448708565802,-73.8447994423333,-73.8446668184044,-73.8445991504444,-73.8445139190618,-73.8443847198837,-73.8442231186504,-73.8440788737386,-73.8439052393605,-73.8438249965106,-73.8437985793812,-73.8437323304134,-73.8435466893899,-73.8434326202129,-73.8433851140708,-73.8433376087611,-73.8433241415377,-73.8433558880399,-73.8433641564146,-73.8433511805362,-73.8433063238679,-73.8432346215896,-73.8431796131482,-73.8431483000161,-73.8431105900181,-73.8430436391916,-73.8429342686601,-73.842895458472,-73.8428605365847,-73.842848653224,-73.8428925458173,-73.8432849719419,-73.8432065363665,-73.8428087524122,-73.8422595936833,-73.8429206902527,-73.8428667525936,-73.8421674734113,-73.8420880490143,-73.8420333490165,-73.8419786496746,-73.8419048025206,-73.841820621436,-73.841727017147,-73.8415967418836,-73.841548646721,-73.8415080407278,-73.8414212272911,-73.8413729488767,-73.8413071108237,-73.8412908228942,-73.841309210666,-73.8413449688797,-73.8414198844707,-73.8414224368436,-73.8413886311956,-73.8413064226972,-73.8412855112433,-73.841279032704,-73.8413004755521,-73.8412994354598,-73.8405998229451,-73.8401393036445,-73.8404397757594,-73.8404005522561,-73.8404151797583,-73.8392338815539,-73.8392094832411,-73.8384194408379,-73.8384291582917,-73.8378996750371,-73.8378704405095,-73.8383901335455,-73.8391900472718,-73.8402242579982,-73.8402586080913,-73.8399709959005,-73.839036768124,-73.8384336828721,-73.8384008307784,-73.8373622528982,-73.8373024877491,-73.8372279142248,-73.8371749743957,-73.8370840676992,-73.8370649888026,-73.8370714677767,-73.8371260469754,-73.8368630862893,-73.8366328892337,-73.8366294253706,-73.8365907861628,-73.8366102142351,-73.8366159894419,-73.8366935352506,-73.8367625557923,-73.836829904335,-73.8368845519323,-73.8369090553901,-73.8369850193697,-73.8370959764528,-73.8371487549736,-73.8372298811017,-73.8372477046244,-73.8373208541538,-73.8374471459377,-73.8375111765367,-73.8375133794964,-73.8375156667403,-73.8375168383489,-73.8375158801366,-73.83751584646,-73.8375104031856,-73.8375060145697,-73.8374999820409,-73.8374667297139,-73.8374598338326,-73.8374547848095,-73.8374456942373,-73.837441615315,-73.837442180247,-73.8374442254277,-73.837447468808,-73.8374483292751,-73.8374493806748,-73.8374520266737,-73.8374554564251,-73.8374597128238,-73.8374686881968,-73.8374910219434,-73.837500207957,-73.8375036379504,-73.8375063812467,-73.837508464171,-73.8375092561835,-73.8375099010895,-73.8375208894185,-73.8375270569787,-73.8375316673332,-73.8375338039271,-73.8375331672405,-73.8375281726597,-73.837527081776,-73.8375278139443,-73.8375301828611,-73.8375192836421,-73.837514377804,-73.837507601637,-73.8375035888358,-73.8373803439679,-73.8373782033161,-73.8370268279212,-73.837026885597,-73.8368181495703,-73.836814104385,-73.8370187262289,-73.8370125769383,-73.8373722220789,-73.8373721299883,-73.8374819140324,-73.8374508919051,-73.8374200148674,-73.8374143511726,-73.8373942918109,-73.83739029705,-73.8373878196751,-73.8373868129715,-73.8373872643558,-73.8373914393444,-73.8374084843626,-73.8374107295372,-73.8374100065504,-73.8374080353147,-73.8373973446218,-73.8373926697835,-73.8373822323697,-73.837377900121,-73.8373744303478,-73.8373734632574,-73.8373735206522,-73.8373750628347,-73.8373863455611,-73.8373890635478,-73.8373889413932,-73.8373874204076,-73.8373844756458,-73.8373800841348,-73.8373755570148,-73.837369596236,-73.8373644340958,-73.8373472569724,-73.8373396629284,-73.8372873952907,-73.8372791334292,-73.8372716779358,-73.8372589211474,-73.8372490846532,-73.8372355414541,-73.8372320821526,-73.8372309850249,-73.8372311986952,-73.8372321098003,-73.8372376576321,-73.8372389297466,-73.8372386293318,-73.8372359179059,-73.8372343655256,-73.8372319940143,-73.837228781882,-73.8372246700367,-73.8371932389034,-73.8371840541178,-73.8371806869702,-73.8371781504834,-73.8371764070544,-73.8371754453492,-73.8371730234024,-73.8371742727186,-73.8371767424435,-73.8371791828275,-73.8371876673392,-73.8372267484199,-73.8372393458872,-73.8372421560892,-73.8372607251764,-73.8372722567523,-73.8372804584517,-73.8372808514521,-73.8372807613386,-73.837280656971,-73.8372804913477,-73.8372803978697,-73.8372803502172,-73.8372802912989,-73.8372802444608,-73.8372801729376,-73.8372801015876,-73.8372800429803,-73.8372799709277,-73.8372799001519,-73.8372798170114,-73.8372797461712,-73.8372796629879,-73.8372795804186,-73.8372794024147,-73.8372790108047,-73.8372785823879,-73.8372775827064,-73.837266001129,-73.8372443196715,-73.8371835081318,-73.8371631119537,-73.8371421058783,-73.8371403549997,-73.8371396215367,-73.8371412213885,-73.8371465826774,-73.8371620804049,-73.8371675553936,-73.8371706706596,-73.8371700220552,-73.8371688384306,-73.8371666829684,-73.8371635673516,-73.8371595053576,-73.8371545086411,-73.8371486225017,-73.8371343298951,-73.8371166282192,-73.8370969993734,-73.8370769836274,-73.8370674341211,-73.8370585143649,-73.8370244177763,-73.8369875229484,-73.8369533227849,-73.8368751148168,-73.8368372548438,-73.8368030213076,-73.8367708647443,-73.8367046913399,-73.8365594745967,-73.8365002315705,-73.8364746941772,-73.8364012061894,-73.8363780957213,-73.8363573014982,-73.836324280858,-73.8362883747538,-73.8362546207189,-73.8361739331066,-73.8361320352926,-73.8360115515264,-73.8358970710529,-73.8358420654401,-73.8357872203977,-73.835733118655,-73.8356802206902,-73.8356580816107,-73.8356361852022,-73.8356155114778,-73.8355966535509,-73.8355802632775,-73.8355663876003,-73.8355552153945,-73.8355506795717,-73.8355468539768,-73.8355328510253,-73.8355204071833,-73.8355092848568,-73.8354988958976,-73.835496906232,-73.835495972851,-73.8354963427606,-73.8354945129096,-73.8354911034666,-73.8354834603427,-73.8354724855882,-73.8354581455256,-73.8354404160666,-73.8354194845401,-73.8353949047019,-73.8353664018567,-73.8353315024208,-73.8352873522948,-73.8352390508021,-73.8351858044978,-73.8351538256697,-73.8351250094095,-73.8349780269809,-73.8348305034449,-73.8347838186912,-73.8347783348525,-73.8345718401692,-73.8344094198247,-73.8343230279735,-73.8342825536445,-73.8342429246197,-73.8342080856836,-73.8341656427456,-73.8341495333757,-73.8341356652128,-73.8341040311044,-73.8340944160126,-73.8340866372143,-73.8340700485124,-73.8340556094338,-73.8340386640801,-73.8340238877849,-73.8340153585356,-73.8340130586667,-73.8340119530419,-73.8340133190867,-73.8340100722631,-73.8340050630477,-73.8340009128614,-73.8339953026959,-73.8339602331381,-73.8339173279228,-73.8339012951562,-73.8338741748252,-73.8338576792035,-73.8338426105596,-73.8338278680335,-73.833813167647,-73.8337954810989,-73.8337759787702,-73.8337544480732,-73.8337302141756,-73.8336582986799,-73.8336243060336,-73.833599746345,-73.8335801772682,-73.8335378246062,-73.8335186358529,-73.8335031118512,-73.8334884608336,-73.833472644589,-73.8334566482067,-73.8334409313363,-73.8334260048772,-73.8334039699257,-73.8333541772204,-73.833309302012,-73.8332755900768,-73.833266887727,-73.833257595359,-73.8332370922419,-73.8332137172594,-73.8331834262378,-73.8331639070994,-73.833119556496,-73.8330984850652,-73.8330617942645,-73.833011201537,-73.8329690119346,-73.8329487737087,-73.8329293717141,-73.8329207297279,-73.8329126686747,-73.8329022798741,-73.832891400987,-73.8328562425718,-73.8328420054377,-73.8328075819369,-73.8327968490003,-73.8327867590612,-73.8327782953704,-73.832768660113,-73.8327261578566,-73.8326597673408,-73.8326010642634,-73.8325688586259,-73.8325387240547,-73.8325106364789,-73.8324845939412,-73.8324076713228,-73.8323253960775,-73.8322854413618,-73.8322482535866,-73.8322319869708,-73.8321961405534,-73.8321831471979,-73.832161006322,-73.8321408429274,-73.83211813286,-73.8320967198753,-73.8320862807575,-73.8320670430497,-73.8320580512578,-73.831982011453,-73.831954187398,-73.8319364253556,-73.8319189243068,-73.8319017675677,-73.8318657116592,-73.8318379215461,-73.8318168066416,-73.8318011223299,-73.8317924013116,-73.8317800623501,-73.8317731964558,-73.8317646012586,-73.8317543363848,-73.8317425561311,-73.8317185418299,-73.8316893160563,-73.8316657849287,-73.8316420224039,-73.8316264284816,-73.8316100547248,-73.8315749348592,-73.8315632822403,-73.8315513726695,-73.8315266952119,-73.8314980541268,-73.8314733739143,-73.8314652067866,-73.8314580484436,-73.8314520518862,-73.8314473475409,-73.8314459006845,-73.8314445011178,-73.8314418774933,-73.8314395731395,-73.8314376710139,-73.8314362888939,-73.831435487383,-73.8314353129363,-73.8314357681011,-73.8314362860445,-73.8314369940182,-73.8314486380926,-73.831462773095,-73.8314786815224,-73.8314871408735,-73.8314958517997,-73.8315759380439,-73.831595633309,-73.8316686331891,-73.8316777614239,-73.8316882051471,-73.8317197321571,-73.8318005388155,-73.8318331730223,-73.831863178599,-73.8318836035021,-73.8318915404827,-73.8318983771186,-73.8319162764075,-73.8319334019433,-73.8319511846373,-73.8319654857831,-73.8319764602668,-73.83198460174,-73.8319905352748,-73.8319927096875,-73.8319923460442,-73.8319896769523,-73.8319896071371,-73.831989214208,-73.8319919695185,-73.8319996926694,-73.8320145825813,-73.8320342959017,-73.8320400085848,-73.8320698642152,-73.8320938108713,-73.8321027574814,-73.8321184197733,-73.8321362575627,-73.8321411593998,-73.8321487200091,-73.8321491450611,-73.8321482043049,-73.8321420712418,-73.8321320657602,-73.8321205720609,-73.8320926141504,-73.8320711081038,-73.8320547674901,-73.8320522465236,-73.8320138440064,-73.8319663976775,-73.8319552968357,-73.8319150734245,-73.8318957473128,-73.8318755490509,-73.8318567064817,-73.8318419080428,-73.8318305799804,-73.8318248335112,-73.8318191832819,-73.8318135381466,-73.8318090153389,-73.83180861575,-73.8318036961292,-73.831793952622,-73.8317704456483,-73.8317569299928,-73.8317537170288,-73.8317433157102,-73.8317244357661,-73.8316911764934,-73.8316608092787,-73.8316353113213,-73.8315549569592,-73.8315088724828,-73.8314859742178,-73.8314377301935,-73.8313852926183,-73.8313735338278,-73.8313590483407,-73.8313415544379,-73.8313181047826,-73.8312710216949,-73.8312331137441,-73.8311548609695,-73.8310761015808,-73.8310300162704,-73.8309921604013,-73.8309626970729,-73.8308818630855,-73.8307803563245,-73.8307054772942,-73.8306597213265,-73.8306123010916,-73.8305677931393,-73.8305250120632,-73.8304838384136,-73.8304511252325,-73.8303998595889,-73.8303630805944,-73.8302747655989,-73.830270481087,-73.8301913154801,-73.8301544391422,-73.8301233950612,-73.8301087619912,-73.8300926392661,-73.8300747093041,-73.8300518978067,-73.8300074152255,-73.8299732710481,-73.8298832526848,-73.8297751081308,-73.8297371745017,-73.8296859687039,-73.8295605073398,-73.8294772382874,-73.8294266966538,-73.8292878158699,-73.829161940046,-73.8291357944974,-73.8291091360507,-73.8290813648905,-73.8290488866591,-73.8289503571012,-73.8288785592665,-73.8288154319914,-73.8287125364049,-73.8286501058817,-73.8286005124541,-73.8285189301212,-73.8285911382139,-73.8292971366424,-73.8292317465186,-73.8284799993745,-73.8283974307666,-73.8283227582265,-73.828087887253,-73.8280748924746,-73.8280632079706,-73.8280379589597,-73.8280211013301,-73.8280191198214,-73.8279650829266,-73.8279141374605,-73.827920208738,-73.8279197337085,-73.8277927784251,-73.8277857137446,-73.8277837841145,-73.8277845736865,-73.827797207354,-73.8278045224107,-73.8278137932253,-73.8278202839657,-73.8278292637064,-73.8278639049884,-73.8278875081374,-73.8278975202539,-73.8279096865817,-73.8279170518339,-73.8279202263338,-73.8279203171207,-73.8279178345461,-73.8279063864718,-73.8278974695319,-73.8278939457798,-73.8278872039361,-73.8278865058678,-73.8278872228765,-73.8278887132359,-73.8278941359297,-73.8278989464259,-73.8279155637413,-73.8279338422016,-73.8279597782931,-73.8279732152972,-73.8279776450364,-73.8279799623541,-73.827980373964,-73.8279791603718,-73.8279729345594,-73.8279688570556,-73.8279695086866,-73.8279672449034,-73.8279667384919,-73.8279699773486,-73.8279717197728,-73.8279740950432,-73.8279774341962,-73.827979489617,-73.8279818186779,-73.8279837577867,-73.8279860185326,-73.8279885877119,-73.8280191712943,-73.828022553604,-73.8280159507809,-73.8280129803821,-73.828010436448,-73.8280083766549,-73.8280068369433,-73.8280054641173,-73.8280056547058,-73.8280064503866,-73.8280137235592,-73.8280248715984,-73.8280522646091,-73.8280838802924,-73.8280936084658,-73.8281070896524,-73.828115985711,-73.8281378530296,-73.8281427741165,-73.8281469011996,-73.8281601150291,-73.8281750547651,-73.8281991620083,-73.828207996744,-73.8282139355277,-73.8282301195962,-73.8282439276414,-73.8282598831811,-73.8282603202986,-73.8282626283355,-73.8282857216235,-73.8282916389549,-73.828311457451,-73.828314536548,-73.8283247688867,-73.8283265100748,-73.8283427607983,-73.8283587502388,-73.8283852812648,-73.8283992593345,-73.8283994205969,-73.8284127982247,-73.8284354021509,-73.8284470120795,-73.8284598336017,-73.8284735119724,-73.8284877636888,-73.8285183200744,-73.8285296539386,-73.8285401721286,-73.8285578243105,-73.828572424305,-73.8285764426279,-73.8285808528249,-73.8285997419102,-73.8286045318389,-73.8286089526041,-73.8286101140829,-73.8286112985239,-73.8286136914404,-73.8286161302811,-73.8286185568929,-73.8286209827162,-73.828623300956,-73.8286254524083,-73.8286269776096,-73.8286273551027,-73.8286318074325,-73.8286353444791,-73.8286378746646,-73.8286393137288,-73.8286395783191,-73.8286365763191,-73.8286343147076,-73.8286255772901,-73.8286214492205,-73.8286218963724,-73.8286240286923,-73.8286272547001,-73.828631902214,-73.8286486203378,-73.8286692597616,-73.8286843346028,-73.8286916168457,-73.8286951052269,-73.8286984305136,-73.8287015559444,-73.8287030474011,-73.8287044929586,-73.8287058789741,-73.8287072190932,-73.8287084992292,-73.8287097325843,-73.8287120462173,-73.8287143718711,-73.8287228629976,-73.8287244418332,-73.8287260072009,-73.8287408724285,-73.8287549721202,-73.8287561103734,-73.8287572831818,-73.8287585046233,-73.8287597597326,-73.8287610513783,-73.8287623535247,-73.8287650403317,-73.8287677866013,-73.8287704596177,-73.8287729072672,-73.8287749507548,-73.828780109538,-73.8287840688513,-73.8287867477618,-73.8287880867679,-73.8287881173917,-73.8287873645984,-73.8287834262599,-73.8287633247015,-73.8287546722156,-73.8287532714507,-73.8287535319323,-73.8287546416061,-73.8287565917898,-73.8287632487474,-73.8287863496255,-73.828806159871,-73.8288077283588,-73.8288096294295,-73.8288143216992,-73.8288199627045,-73.8288230397387,-73.8288262351358,-73.8288350536631,-73.8288421105,-73.8288467939715,-73.8288490244251,-73.8288626793351,-73.8288872484245,-73.8289357005723,-73.82895826242,-73.8289768362135,-73.8289953996389,-73.829013966959,-73.8290305441415,-73.8290471191507,-73.8290583740773,-73.8290696086922,-73.8290815241437,-73.8290960772771,-73.8290993621062,-73.82910198708,-73.8291052421193,-73.8291045343394,-73.829102029492,-73.8290726813123,-73.8294515775454,-73.829487990964,-73.8295496252148,-73.8298572613695,-73.8298236118633,-73.8299406091385,-73.8300329443145,-73.8300156145071,-73.830041505216,-73.8300319757947,-73.8299853707851,-73.8299680875736,-73.8299351608173,-73.8299402970841,-73.8299800013606,-73.8299756518178,-73.8299333662679,-73.8299091686461,-73.8298797006409,-73.8298813907157,-73.8299279917501,-73.8299175973826,-73.8298735816801,-73.8298528402873,-73.8298225129244,-73.8298242000693,-73.8298716692633,-73.8298630009959,-73.8298129404613,-73.8297956491651,-73.8297627264713,-73.8297670088826,-73.8298144727028,-73.8298023533342,-73.8297557465548,-73.8297358677,-73.8297072676678,-73.8297089564714,-73.8297529658668,-73.8297451643854,-73.8296976951446,-73.8296778137927,-73.8296466147608,-73.8296534908379,-73.8296949122683,-73.8296914282374,-73.8296396415092,-73.82962062784,-73.8295885638311,-73.8295937185881,-73.8296368583435,-73.8296307782157,-73.8295833185762,-73.8295608443769,-73.829492276532,-73.8294707247006,-73.8295040012882,-73.82976585679,-73.8297866030409,-73.8298307789223,-73.8298273637335,-73.8297540210477,-73.8297704757728,-73.8298420856107,-73.8298602362405,-73.8299044120343,-73.829904445595,-73.8298285197538,-73.8298406490147,-73.8299139891951,-73.8299312725471,-73.8299780379271,-73.8299746269444,-73.8299056078384,-73.8299160056104,-73.8299893478836,-73.8300109562862,-73.8300525355158,-73.8300525724024,-73.8300335622905,-73.829976644932,-73.829992230628,-73.8300543467955,-73.8300828612234,-73.8301270266901,-73.8301227477592,-73.8300485497951,-73.8300684464461,-73.8301348729292,-73.8301547509279,-73.8301989255712,-73.8301989657734,-73.8301264912601,-73.8301386247866,-73.8302085067143,-73.8302318413919,-73.8302742840467,-73.8302734586587,-73.8301983991715,-73.8302174345567,-73.8302855888015,-73.8303054659663,-73.8303487823446,-73.8303470854679,-73.8302797968067,-73.8302884700164,-73.8305222756408,-73.8305058345289,-73.8303945364234,-73.8303772531652,-73.8302958387891,-73.8302949263392,-73.8304122666409,-73.8303984157369,-73.8302793497512,-73.8302629286933,-73.8301789076457,-73.8301806032634,-73.8302522262501,-73.8303022656767,-73.8302849525636,-73.8302124176842,-73.8301684784509,-73.8301485933849,-73.8301182774176,-73.8300714993509,-73.830074046676,-73.8301922576882,-73.8301766722053,-73.8300601894346,-73.830042040873,-73.8299597501245,-73.8299597115421,-73.8300796563303,-73.8300666688711,-73.8299467213843,-73.8299311651675,-73.8298497393932,-73.82984969743,-73.8299679047682,-73.8299566400493,-73.8298392898919,-73.8298159596576,-73.8297847702346,-73.8297191848798,-73.8297278412522,-73.829509171038,-73.8290596676864,-73.8290090743692,-73.828960444934,-73.8289095957073,-73.8288579293983,-73.8288068712561,-73.828757829753,-73.8287121577285,-73.8286645165372,-73.828585483157,-73.8285003272194,-73.8284097063524,-73.8283143203924,-73.8282149059798,-73.8281122308697,-73.8280070880018,-73.8279002893762,-73.8276056090772,-73.8276027889433,-73.8275885963555,-73.8275785493864,-73.8275607571205,-73.8275380084077,-73.8275157986197,-73.8274968849233,-73.8274795080914,-73.8274590338144,-73.8274405711723,-73.8274242282285,-73.8274055025788,-73.8273776931525,-73.8273588429042,-73.8273531368229,-73.8273447009813,-73.8273331767463,-73.8273199967443,-73.8273106614427,-73.827300198207,-73.8272904333818,-73.8272850387962,-73.8272836072227,-73.8272897646315,-73.8272976506556,-73.827298282291,-73.8272971026192,-73.8272944488063,-73.8272929981584,-73.8272902749056,-73.8272887537967,-73.8272821144383,-73.8272670484356,-73.8272499611361,-73.8272432851017,-73.8272345277413,-73.827222907285,-73.8272141262322,-73.8272092466439,-73.8272033286361,-73.8271893127914,-73.8271721960532,-73.8271576051503,-73.8271435742503,-73.8271264131901,-73.827110274994,-73.8270931742999,-73.8270741648767,-73.8270600857157,-73.8270431688529,-73.8270280644883,-73.8270120797275,-73.8269986882981,-73.8269877699252,-73.8269836152528,-73.8269791299634,-73.8269761331764,-73.8269750965656,-73.8269709151065,-73.8269700163889,-73.8269695833253,-73.8269703797001,-73.8269720485954,-73.8269752051808,-73.826979789216,-73.8269827931124,-73.8269855433577,-73.826990797513,-73.8269934694809,-73.8269989718579,-73.8270121432221,-73.8270333026989,-73.827046543209,-73.8270583749397,-73.8270744122585,-73.827088431521,-73.8271015684704,-73.8271122553128,-73.8271196969115,-73.8271272872512,-73.8271364852386,-73.8271490459672,-73.827161276906,-73.8271723586359,-73.8271803954517,-73.8271866948234,-73.8271924001669,-73.8271961600784,-73.8271978557148,-73.8271970542192,-73.827194950571,-73.827191016701,-73.8271864326282,-73.8271821380805,-73.8271736560119,-73.8271632624306,-73.8271494703902,-73.8271291243554,-73.8271143925931,-73.8270962341913,-73.8270722150752,-73.8270674456251,-73.8270607189322,-73.8270381895881,-73.8270305591211,-73.8269793177835,-73.8269192831184,-73.8268997881391,-73.8268841823594,-73.8268684709321,-73.8268666088378,-73.8268510044664,-73.8268473410131,-73.8268307631098,-73.8268100142613,-73.8267927031821,-73.8267763627913,-73.8267580782078,-73.8267385616669,-73.8267154511218,-73.826694572381,-73.8266717458493,-73.826652866685,-73.8266339533126,-73.8266160544051,-73.8265749359417,-73.8265359831284,-73.8264999472252,-73.8264665002288,-73.8264488063056,-73.8264109479002,-73.826403243279,-73.826383533314,-73.8263640011442,-73.8263574907308,-73.8263426926312,-73.826330073524,-73.8263128189316,-73.8262983637238,-73.8262636490374,-73.8262382879492,-73.8262025899919,-73.826160296923,-73.8261182190996,-73.8260718964991,-73.8259993048382,-73.8259412067233,-73.8259073669954,-73.8258716398926,-73.8258179151769,-73.825772677445,-73.8257221928607,-73.8256702140956,-73.8256118196272,-73.8255621423105,-73.8255267623435,-73.8254981285771,-73.8254915821559,-73.825479264461,-73.8254418543866,-73.8254115588335,-73.8253786421847,-73.8253419934664,-73.8253034523545,-73.8252677084013,-73.8252326919296,-73.8252087751785,-73.8251820325112,-73.8251647119696,-73.8251403602042,-73.8251158863622,-73.8251024306893,-73.8250799026241,-73.8250649669944,-73.8250461253825,-73.8250250372478,-73.8250100948325,-73.8249936410678,-73.8249767018886,-73.8249597380397,-73.824942338682,-73.8249254043183,-73.8249089784118,-73.8248925106846,-73.8248765554671,-73.824838276494,-73.824817871704,-73.8247994595369,-73.8247840021649,-73.8247694962471,-73.8247559988863,-73.8247425029705,-73.8247309675253,-73.8247199270591,-73.8247044490539,-73.8246889907999,-73.8246731445774,-73.8246583728353,-73.8246428314557,-73.8246289249748,-73.8246160804289,-73.8246050455444,-73.8245952714944,-73.8245775723814,-73.8245564072595,-73.8245339044116,-73.8245212496349,-73.8245081508399,-73.8244949802952,-73.8244813185571,-73.8244684357805,-73.8244553616135,-73.8244280438463,-73.8244142788195,-73.8244005086863,-73.8243853220088,-73.8243805728507,-73.8243712434107,-73.8243583255907,-73.824338223092,-73.8243187626452,-73.8242957429416,-73.824271534035,-73.8242594650701,-73.8242468190298,-73.8242350622741,-73.8242232297059,-73.8242087674522,-73.8241939794438,-73.8241799325721,-73.8241651823112,-73.8241514101767,-73.8241379837773,-73.824124868116,-73.824111356663,-73.8241027258485,-73.8240738849599,-73.8240504555702,-73.824032035458,-73.8240141961936,-73.8239935653759,-73.8239843314779,-73.8239801779165,-73.8239797824764,-73.8239828057809,-73.8239890844756,-73.8239991490447,-73.8240089505248,-73.8240206163171,-73.8240333687886,-73.82408466091,-73.8240391744904,-73.8239504507964,-73.8239478785763,-73.8242331874496,-73.8242066629029,-73.8239317610895,-73.8239173778405,-73.8239076208602,-73.8239002731479,-73.8238994815355,-73.8238899102278,-73.8238842393207,-73.8238781341523,-73.8238731354905,-73.8238676785514,-73.8238612291018,-73.823859483847,-73.8238477661748,-73.8238299397591,-73.8238150195748,-73.8237981656644,-73.8237776714884,-73.8237522166074,-73.8237377897914,-73.8237243379906,-73.8237104220852,-73.8236820351623,-73.8236695665341,-73.8236600143127,-73.8236433399257,-73.8236292240782,-73.8236104082985,-73.8235895924163,-73.8235736238433,-73.8235635697473,-73.8235491326251,-73.8235384160622,-73.8235281548401,-73.823518373176,-73.8235072089332,-73.8234985809342,-73.8234944639465,-73.8234946001946,-73.8234954114755,-73.8235029352361,-73.8235131524603,-73.823513657306,-73.8235060001573,-73.8235014844061,-73.8234930480537,-73.8234838582191,-73.8234725126417,-73.8234607319843,-73.8234503338251,-73.823433234508,-73.8237572349898,-73.8237234821917,-73.8234087230988,-73.823411525855,-73.8234097025365,-73.8234030406431,-73.8233893803275,-73.8233752995912,-73.823360587572,-73.8233475141383,-73.8233333843507,-73.8233143755997,-73.8232882383827,-73.8232772556516,-73.8232537106009,-73.8232424180278,-73.823233651955,-73.8232197511897,-73.8232120542041,-73.8232113933426,-73.82320630261,-73.8231935154969,-73.8231738265833,-73.8231618117355,-73.8231502723526,-73.823140207653,-73.8231240065516,-73.8231139697611,-73.8231076966837,-73.8231083912214,-73.8231159049384,-73.8231233781971,-73.8231357311568,-73.823137660082,-73.8231367392194,-73.8231284109347,-73.8231148951217,-73.8231085737902,-73.8230960275046,-73.8233055249758,-73.8232711822339,-73.8230536068968,-73.8230372416952,-73.8230210340875,-73.8230026297057,-73.8229830729671,-73.8229590940557,-73.8229480961611,-73.8229270091917,-73.8228959053395,-73.8228747760199,-73.822854142911,-73.8228341676642,-73.8228234170841,-73.8228132370193,-73.8228029953688,-73.8227911152968,-73.822779308267,-73.822767800657,-73.8227552022074,-73.8227426916024,-73.8227306453943,-73.8227176491408,-73.8227046664776,-73.8226916815406,-73.8226806068443,-73.8226585825854,-73.8226355362199,-73.8226110157918,-73.8225993561728,-73.8225874570764,-73.8225780007387,-73.8225691285687,-73.8225532677467,-73.822540564193,-73.8227927062575,-73.8227550476576,-73.8225191645587,-73.8225033003103,-73.8224965989514,-73.822479619967,-73.8224603870063,-73.8224506114262,-73.8224409568012,-73.8224310609939,-73.8224122700474,-73.8226778789685,-73.8226488535693,-73.8223875473663,-73.8223376525748,-73.8222899216731,-73.8222832151028,-73.8222182404191,-73.8221779369783,-73.8221397825815,-73.8220930471913,-73.8220703694761,-73.822049207835,-73.821978067137,-73.8219005893767,-73.8218798602792,-73.8218492253245,-73.8217761612472,-73.8216990004616,-73.8216178917917,-73.8215087966158,-73.8214037411502,-73.821302920133,-73.8212065204556,-73.8211460474444,-73.8210875836676,-73.8210368860973,-73.8209807192305,-73.8209197049688,-73.8208545188894,-73.8207858827653,-73.8207145565726,-73.8206413300755,-73.8206252188405,-73.820604795339,-73.8205940665487,-73.8205743375102,-73.8205557928915,-73.8205382327478,-73.8205187163785,-73.8204933804734,-73.8204690302308,-73.8204495125835,-73.8204324596663,-73.8205281078842,-73.820499199953,-73.8204045492723,-73.8203917839438,-73.8203756253297,-73.8203569679969,-73.8203373245228,-73.8203222859607,-73.8203060193374,-73.8202919885794,-73.8202760924161,-73.8202561038768,-73.8202387824776,-73.8202157143401,-73.8201999529024,-73.8201836585497,-73.8201664103865,-73.8201516323712,-73.8201371228602,-73.8201176274634,-73.820102620658,-73.8200874505508,-73.8200665503948,-73.8200544450595,-73.8200454830627,-73.8200331470761,-73.8200235303213,-73.820011229364,-73.8200012231732,-73.8198930806363,-73.8198484255399,-73.8198399938566,-73.8198392533583,-73.8198257039893,-73.8198164468579,-73.8198052363464,-73.819798010517,-73.8197905641338,-73.8197845440389,-73.819777595444,-73.8197666734939,-73.8197545923601,-73.8197395700098,-73.8197209608938,-73.819701315333,-73.8196844279076,-73.8196700444016,-73.81965385459,-73.8196386710753,-73.8196255938604,-73.8196100604116,-73.8195955784965,-73.8195788260631,-73.8195628640205,-73.8195509536908,-73.8195364090156,-73.8195209388368,-73.819504742541,-73.819489335487,-73.8194627856516,-73.8194456902309,-73.8194365271893,-73.8194204493316,-73.8194071055732,-73.8193931517076,-73.8193763244573,-73.8193593289699,-73.819342673692,-73.8193245315324,-73.819302572591,-73.819291292566,-73.8192801280371,-73.819268091075,-73.8192571899981,-73.8192476928964,-73.8192301401039,-73.819216180064,-73.819203998996,-73.8191924199202,-73.8191768094265,-73.8191594035227,-73.8191430451187,-73.8191261669764,-73.8191110684764,-73.8190850107157,-73.8190660587927,-73.8190550267821,-73.819043179568,-73.8190311321372,-73.8190183387,-73.8190055089638,-73.8189915709464,-73.8189779170938,-73.8189624896381,-73.8189472153802,-73.8189331954723,-73.8189203355856,-73.8189076174803,-73.8188955512075,-73.8188843435727,-73.8188736095904,-73.8188634421726,-73.8188527780072,-73.8188390829564,-73.8188244067289,-73.8188097397865,-73.8187955277619,-73.8187793618741,-73.818762224734,-73.8187441577161,-73.8187089987795,-73.8186919549232,-73.8186763046139,-73.8186616293155,-73.8186501377253,-73.8186398251508,-73.8186298457822,-73.8186176007066,-73.8186050272415,-73.8185891395799,-73.8185738168624,-73.8185614263992,-73.8185516250524,-73.8185474099904,-73.8185323465083,-73.8185163501645,-73.818496019897,-73.8184739151142,-73.8184541984707,-73.8184335022854,-73.8184226932885,-73.8184122764526,-73.8184022961533,-73.8183806649418,-73.8183684116438,-73.8183556867148,-73.8183292304157,-73.8183155248189,-73.8183022996457,-73.8182871568092,-73.8182729483596,-73.8182601839083,-73.8182483887205,-73.8182360995905,-73.818212512374,-73.818199287448,-73.8181865230117,-73.8181732858177,-73.8181590780625,-73.8181463504821,-73.818133116421,-73.8181189593013,-73.8181023419335,-73.8180881696164,-73.8180734528212,-73.8180597541865,-73.8180460570544,-73.8180318516745,-73.8180171717855,-73.8180015230471,-73.817985921389,-73.8179712062428,-73.8179432986104,-73.8179305351215,-73.8179192510686,-73.8179069496441,-73.8178942237833,-73.8178814979225,-73.817871517954,-73.8178536024054,-73.8178349333941,-73.8178137732241,-73.8178019922339,-73.8177906989894,-73.8177765422893,-73.8177643143803,-73.8177527835499,-73.8177409921744,-73.8177287390086,-73.8177174565763,-73.8177057028777,-73.8176948933572,-73.8176799667018,-73.8176660098457,-73.817648705424,-73.8176266145921,-73.8176124093678,-73.8175992123081,-73.8175850200989,-73.8175619464638,-73.8175417580299,-73.8175232278205,-73.8175040189219,-73.8174852333388,-73.8174707625935,-73.8174561345641,-73.8174398004204,-73.8174247401816,-73.8174042987671,-73.8173859827669,-73.8173628228345,-73.8173391547405,-73.8173258857586,-73.8173131172399,-73.8173003120924,-73.8172870697628,-73.8172752344366,-73.8172530172023,-73.8172356687874,-73.8172206954378,-73.8172081388266,-73.8168393084002,-73.8166042840285,-73.816571090776,-73.8168191572232,-73.8166990465463,-73.816485961532,-73.8164593235967,-73.8166807166823,-73.8164913280699,-73.8162318290432,-73.816191115513,-73.8161528669631,-73.8161223114611,-73.8161136333443,-73.8158053638498,-73.815774167798,-73.8161013689338,-73.8160793513417,-73.8160673518891,-73.8160539446521,-73.8160387698372,-73.816026038666,-73.8160108208728,-73.815996134392,-73.8159833646252,-73.8159679334491,-73.8159537206731,-73.8159362958914,-73.8159205996433,-73.8159036701585,-73.8158857453396,-73.8158673357198,-73.8158477060187,-73.8158324819722,-73.8158177557999,-73.8157998567454,-73.8157841257758,-73.8157704160955,-73.8157561636016,-73.8157400097906,-73.8157203912731,-73.8157019921395,-73.8156923233418,-73.81567586907,-73.8156577209972,-73.8156398269461,-73.81562608703,-73.8156133537509,-73.8156003352455,-73.8155870933543,-73.8155719093235,-73.8155557046396,-73.8155400207041,-73.8155262660757,-73.815514253379,-73.8154981006991,-73.8154816479128,-73.8154644740023,-73.8154438767478,-73.8154264414591,-73.8154095276851,-73.8153945954023,-73.8153796206149,-73.815363167914,-73.815346974238,-73.8153305546773,-73.8153121481771,-73.8153006085692,-73.815284917883,-73.8152694888631,-73.8152498529913,-73.8152326863558,-73.8152152850832,-73.8151988441484,-73.8151782349332,-73.8151566204945,-73.8151330996782,-73.8151095459968,-73.8150840424853,-73.8150700798322,-73.8150565902428,-73.8150426388455,-73.8150291498919,-73.8150146808249,-73.8149992514518,-73.8149833102316,-73.8149668941184,-73.814953875305,-73.814940383131,-73.8149234627499,-73.8149073100879,-73.8148975378919,-73.8148820880495,-73.8148666073559,-73.8148462590269,-73.8148261357662,-73.8148035851497,-73.8147864054609,-73.8147674864042,-73.8147512901142,-73.8147323804279,-73.8147171568834,-73.8147044676819,-73.8147005292792,-73.8146927142876,-73.814679775536,-73.8146714025965,-73.8146642355555,-73.8146518005808,-73.81463789535,-73.8146248821458,-73.8146077450427,-73.8145915414399,-73.8145711516688,-73.8145539710084,-73.8145353109556,-73.8145061301752,-73.8144965672572,-73.8144783870268,-73.8144617218092,-73.8144460280099,-73.8144308316148,-73.8144136747679,-73.814397515615,-73.8143837792621,-73.8143777203316,-73.8143673656162,-73.8143531165646,-73.8143391492345,-73.8143232048633,-73.814308227583,-73.8142922819912,-73.8142716373735,-73.8142524595689,-73.8142357421299,-73.8142146243539,-73.8141979145348,-73.8141785332332,-73.8141637711834,-73.8141498148072,-73.8141250305327,-73.8141024886704,-73.8140779571246,-73.8140645064876,-73.8140505091125,-73.8140390080248,-73.8140149828785,-73.8139929119167,-73.8139747714609,-73.8139640274477,-73.8139498169543,-73.8139319303985,-73.8139164862746,-73.8138993159446,-73.8138816470127,-73.813864981552,-73.8138502636202,-73.8138382947007,-73.8138213744634,-73.8138081489672,-73.8137958909828,-73.8137770124223,-73.8137647474292,-73.8137463118747,-73.8137239657909,-73.8137089860868,-73.813694767553,-73.8136790763318,-73.8136668224697,-73.8136567255426,-73.8136444820302,-73.8136373567635,-73.8136322372784,-73.8136293095656,-73.8136288009536,-73.8136280755721,-73.8136279693076,-73.8136290534617,-73.8136309723761,-73.8136354906062,-73.8136416717813,-73.8136473087962,-73.8136527579948,-73.8136585037273,-73.813667659183,-73.8136725351919,-73.8136768879982,-73.8136866641381,-73.8136910002959,-73.8136961681689,-73.813701726909,-73.8137059163297,-73.813709190536,-73.8137174389894,-73.8137297039222,-73.8137349711501,-73.8137439111017,-73.8137491075235,-73.8137459694732,-73.813716577534,-73.8136996372512,-73.8134205041584,-73.813350137201,-73.8134864830931,-73.8136352545395,-73.8134935036856,-73.8133697499187,-73.8132773907467,-73.8132509965719,-73.8132464969534,-73.8130380186018,-73.8129903107844,-73.8129372920604,-73.8129858958536,-73.8129125254206,-73.8129093132844,-73.8129088809916,-73.8129077930367,-73.8129056438068,-73.8129022557825,-73.8129004404474,-73.8128744891472,-73.8128748386125,-73.8128618792699,-73.8128564385509,-73.8128128585723,-73.8128088930211,-73.8128016628448,-73.8127923446208,-73.8127837095386,-73.8127751529378,-73.8127723057753,-73.8127688155327,-73.8127657826656,-73.8127640509605,-73.8127625747233,-73.8127586985131,-73.8127558201595,-73.8127527130522,-73.8127491690451,-73.8127457282869,-73.8127419297457,-73.8127382042504,-73.8127332579822,-73.8127300786385,-73.812726931291,-73.8127252253463,-73.8127241119879,-73.8127226698631,-73.8127203592397,-73.8127172114867,-73.8127151199385,-73.8127117632335,-73.8127057673219,-73.8127020818842,-73.8126991207695,-73.8126957342366,-73.8126923703307,-73.8126883331545,-73.8126829889164,-73.8126773467226,-73.8126726588053,-73.8126652883366,-73.8126590083994,-73.8126536702625,-73.812647419682,-73.8126433365018,-73.8126396561113,-73.812637272487,-73.8126306288453,-73.8126264438964,-73.8126196812594,-73.8126123847577,-73.8126070761149,-73.8126028416917,-73.8125984752266,-73.8125937471706,-73.8125883589877,-73.8125839068951,-73.8125809816406,-73.8125758146831,-73.8125699013929,-73.8125650943268,-73.8125585191572,-73.8125523138586,-73.8125479897452,-73.8125397193572,-73.8125197685328,-73.8125044728914,-73.8124871944264,-73.8124721614688,-73.8124576360668,-73.8124420919372,-73.8124216396584,-73.812401683879,-73.8123809756512,-73.8123661499454,-73.8123484084577,-73.8123316688906,-73.812310006623,-73.8122932729213,-73.8122708845778,-73.8122536556717,-73.812241844721,-73.8122261406938,-73.8122116377489,-73.812194250655,-73.8121807582969,-73.8121655218004,-73.8121463549996,-73.8121249273068,-73.8117900276939,-73.8117732583477,-73.8117635643614,-73.8117609881511,-73.8117655409696,-73.8117772028576,-73.8117959227322,-73.8118216186102,-73.8116078138,-73.8114959428979,-73.8114213383556,-73.8114123624297,-73.811393727619,-73.8113748450622,-73.8113591327879,-73.8113461272937,-73.811326014507,-73.8113088595486,-73.8112931466205,-73.8112774679231,-73.8112583345784,-73.8112372164392,-73.8112171019458,-73.8111950124818,-73.8111704631286,-73.8111473896978,-73.8111218712487,-73.8110963499333,-73.8110534224336,-73.8110374576779,-73.8110219886949,-73.8110085077959,-73.8109839618659,-73.810959463459,-73.810937363928,-73.8109187391171,-73.8109045003787,-73.8108853551668,-73.810869141706,-73.8108480570369,-73.8108311111722,-73.810815642846,-73.8107999244939,-73.8107785887118,-73.810763121451,-73.8107474066232,-73.8107282714787,-73.8107044766672,-73.8106863147198,-73.8106780249655,-73.8106634785814,-73.8106553524913,-73.8106327518934,-73.8106126016818,-73.8105980902103,-73.8105802435465,-73.8105608197968,-73.8105426232119,-73.8105251812552,-73.8105067290585,-73.8104875666712,-73.8104733444217,-73.8104539199418,-73.8104354777112,-73.8104162993492,-73.8103981480666,-73.8103794823904,-73.8103573586171,-73.8103396645372,-73.8103209995797,-73.8103028092048,-73.8102841476247,-73.8102723533939,-73.810252714215,-73.8102352313956,-73.8102190260213,-73.8101988788293,-73.8101797102159,-73.8101595837814,-73.8101446446119,-73.8101274752821,-73.8101093337271,-73.8100921585912,-73.8100774310778,-73.8100634338597,-73.8100462543706,-73.8100305194369,-73.8100123652393,-73.8099975949554,-73.8099804130776,-73.809962989714,-73.8099497445596,-73.8099360015135,-73.8099217439491,-73.8099013896809,-73.8098898436133,-73.8098711356007,-73.8098576267296,-73.8098379539452,-73.8098217429013,-73.809804559448,-73.8097834075906,-73.8097645979722,-73.8097439890609,-73.8097297301429,-73.8097130241487,-73.8096990518548,-73.8096847942764,-73.8096690587717,-73.8096536150676,-73.8096373609592,-73.8096203829495,-73.8096024441237,-73.8095862261635,-73.8095655881744,-73.8095475341328,-73.8095226895855,-73.8095140906278,-73.809494418608,-73.8094725441662,-73.8094538785883,-73.8094366945283,-73.809417532436,-73.8093939185532,-73.8093693804077,-73.8093462731694,-73.8093276070367,-73.8093123774854,-73.8092900334443,-73.8092728177415,-73.8092551373472,-73.80924387841,-73.8092276737445,-73.8092102534095,-73.8091945602848,-73.8091791279406,-73.8091599658424,-73.8091411011941,-73.8091322623125,-73.8091153504846,-73.8090974560636,-73.8090861670189,-73.8090714311021,-73.8090707209728,-73.8090535442947,-73.8090334102362,-73.8090196512684,-73.8090039181027,-73.8089857719575,-73.8089740193231,-73.8089590485839,-73.8089431083111,-73.8089254616258,-73.8089099778562,-73.8088911094892,-73.8088751640465,-73.8088609093992,-73.808841030431,-73.8088240968372,-73.8088068804042,-73.808793380422,-73.8087837817191,-73.8087689894624,-73.8087574366751,-73.808745480284,-73.8087293673428,-73.8087136659147,-73.80869968005,-73.8086835188334,-73.8086675680821,-73.8086478996898,-73.8086331720157,-73.8086144017919,-73.8086018449519,-73.8085829137313,-73.8085689113518,-73.8085501949489,-73.8085339284627,-73.8085171666939,-73.8085009169147,-73.8084773311045,-73.8084591395229,-73.8084475927899,-73.8084279398142,-73.8084116980158,-73.8083964637334,-73.8083802093964,-73.8083618047731,-73.8083468279735,-73.8083328248347,-73.8083168789884,-73.8082962678463,-73.8082776206217,-73.8082550089192,-73.8082377976911,-73.808222054476,-73.8082063082925,-73.8081917791527,-73.8081755712381,-73.8081613093673,-73.8081455680237,-73.8081216321909,-73.8081099536809,-73.8077874818767,-73.8076775124593,-73.8076774056528,-73.8074719688976,-73.8074654442394,-73.8074475405136,-73.807427605629,-73.8074116102241,-73.8073939512052,-73.8070431672326,-73.8064262615134,-73.8064194096874,-73.8063633145241,-73.8063282539434,-73.8063201315526,-73.8063050394079,-73.806314519401,-73.8062733188222,-73.8062313501237,-73.8062752503751,-73.8062833766501,-73.8062984651632,-73.8062903478813,-73.8063307671466,-73.8062653557645,-73.8062319676502,-73.8061733749662,-73.8061146829595,-73.8060373315095,-73.8059608468102,-73.8058858137981,-73.8058413349594,-73.8058323840028,-73.8057530975041,-73.8057053763202,-73.805629279206,-73.8055588255115,-73.8055292711463,-73.8055078281916,-73.8054942823119,-73.8054472558832,-73.8054051597781,-73.8053957327497,-73.805377030253,-73.8053663863014,-73.8053514171302,-73.805347037172,-73.8053270077253,-73.805339561445,-73.8053171165924,-73.805278236246,-73.8052988001961,-73.8053119655859,-73.8053242611425,-73.8053297538725,-73.8053243393983,-73.8053394448756,-73.805305428945,-73.8052775176929,-73.8052570694738,-73.8052369014303,-73.8052368096802,-73.8052293820593,-73.8052171673721,-73.8052078734331,-73.8051981471905,-73.8051837356548,-73.8051682405871,-73.8051519480558,-73.8051352185824,-73.805130721999,-73.8051159367206,-73.8051014313883,-73.8050932682505,-73.8050825618474,-73.8050723816716,-73.8050631218871,-73.8050531512377,-73.8050426121881,-73.8050303668525,-73.8050160892279,-73.8050017491559,-73.804987676143,-73.8049610797921,-73.8049350578343,-73.804910254718,-73.8048872847081,-73.8047998180203,-73.8047123440482,-73.8047002997545,-73.8046866300115,-73.8046717376879,-73.8046494961376,-73.8046278207782,-73.8046292113955,-73.8046487397684,-73.8046244101049,-73.8046095345106,-73.8045932738987,-73.8045761451659,-73.8045576802621,-73.8045376901564,-73.8045199470673,-73.8044987074299,-73.8044794366572,-73.804463635446,-73.8044488403196,-73.8044323149458,-73.8044160120975,-73.8044016942814,-73.8043859370585,-73.8043612930712,-73.804348259354,-73.8043438066597,-73.8043302698808,-73.8042971136374,-73.8042929355325,-73.8042735361489,-73.8042356338897,-73.8042590781061,-73.8042673271141,-73.8043113869992,-73.8042899654997,-73.8042678261809,-73.8042535193403,-73.8042348056609,-73.8042114333508,-73.8041983928953,-73.8041771691163,-73.8041653564286,-73.8041161132764,-73.804128390967,-73.8041149774973,-73.8040650839379,-73.8040880708148,-73.8041010160078,-73.8041364476697,-73.8041281314649,-73.8041147161138,-73.8041006607418,-73.8040796996796,-73.8040671193591,-73.804049876567,-73.8040368358973,-73.8040220133602,-73.80400524331,-73.8039554562278,-73.8039672154354,-73.8039547539794,-73.803914119191,-73.8039274274208,-73.8039390000383,-73.8039741892507,-73.8039583885257,-73.8039430874496,-73.8039253416985,-73.8039070863923,-73.8038888196422,-73.8038740040376,-73.8038614177526,-73.8038461241258,-73.8038163742869,-73.8038241470429,-73.8038132886805,-73.8037982412154,-73.8037955562348,-73.8038031466057,-73.8038229419601,-73.8038145200749,-73.8037987566135,-73.8037834652302,-73.8037708407861,-73.8037580029411,-73.8037340611402,-73.8037138477622,-73.8036941095678,-73.8036758544001,-73.8036595802143,-73.8036430150915,-73.8036086781063,-73.8036181526845,-73.8036058999648,-73.8035906674373,-73.8035856589099,-73.803593785182,-73.8036128854655,-73.803595596383,-73.8035852511018,-73.8035716546947,-73.8035570860463,-73.8035408103211,-73.8035292037878,-73.8035168721132,-73.8035040359231,-73.8034834626523,-73.803445557299,-73.8034558317571,-73.8034335820571,-73.8033995735736,-73.8034164591856,-73.803428314723,-73.8034637640922,-73.8034111642757,-73.8032779298772,-73.8032506901383,-73.803263537696,-73.8032384116162,-73.8032054984747,-73.8032340835544,-73.803260669186,-73.8029800708994,-73.8029703885954,-73.8029583031669,-73.8029492516022,-73.802934382342,-73.802919664938,-73.8029054106601,-73.8028899600624,-73.8028693209155,-73.8028548386048,-73.8028430505456,-73.8028288335978,-73.8028067400295,-73.8027912566217,-73.8027786798554,-73.8027626748621,-73.8027452003599,-73.8027277563663,-73.8027105741649,-73.8026928979529,-73.8026735202478,-73.802660748789,-73.8026403602291,-73.8026347973918,-73.802630862373,-73.8026267094629,-73.8026227289253,-73.8026132224078,-73.8026047428096,-73.8025996800889,-73.8025945898493,-73.8025912788273,-73.8025793447505,-73.8025604248378,-73.8025456545461,-73.8025299485763,-73.8025129896295,-73.8024952957972,-73.802475625805,-73.8024559923277,-73.8024387724593,-73.80242602952,-73.8024060942062,-73.8023906109964,-73.8023687259994,-73.8023535941851,-73.8023353856918,-73.8023144876145,-73.8022960283176,-73.8022765961874,-73.8022603884021,-73.8022414300477,-73.8022244500396,-73.8022030242085,-73.8021865653578,-73.8021683524821,-73.8021481721449,-73.802130466399,-73.8021102705203,-73.8020945207192,-73.8020792424272,-73.8020600522875,-73.8020413472182,-73.8020282975793,-73.802011288051,-73.8019898524299,-73.8019686812946,-73.801947509527,-73.8019302375867,-73.8019120260175,-73.8018974509737,-73.8018819554925,-73.8018659498346,-73.801848926956,-73.8018216132067,-73.8018134798433,-73.8017962071802,-73.8017794769841,-73.8017633122994,-73.801775498608,-73.801765849418,-73.8017550187977,-73.8017454308867,-73.8017210683155,-73.8017555025178,-73.8017484241892,-73.8017336136855,-73.8017148930793,-73.8017037946004,-73.8016846185893,-73.8016695931901,-73.8016533732422,-73.8016316950158,-73.8016174229502,-73.801598207894,-73.80157800485,-73.8015632210194,-73.8015474275224,-73.8015341369438,-73.8015146919568,-73.801497925833,-73.8014757329999,-73.8014579968945,-73.8014377924248,-73.8014277020551,-73.8014121694856,-73.8013963731797,-73.8013813342763,-73.8013657837771,-73.8013497738193,-73.8013337624705,-73.8013199433688,-73.8013048658101,-73.8012878424983,-73.8012752557659,-73.8012635401182,-73.8012528638542,-73.8012385371124,-73.8012215067169,-73.8012057027607,-73.801191120749,-73.801175827585,-73.8011605342965,-73.801138329918,-73.8011102189341,-73.801091744991,-73.8010742560221,-73.8010569787678,-73.8010527048736,-73.8010523494083,-73.8010390964323,-73.8010260435534,-73.8010112623059,-73.8009972490819,-73.8009870947545,-73.8009793743633,-73.8009749635183,-73.8009721819278,-73.8009714982003,-73.8009717940961,-73.8009700623574,-73.800967204411,-73.8009637769024,-73.8009570656215,-73.8009488566857,-73.8009351321022,-73.8009231279294,-73.8009064570493,-73.8008905198349,-73.8008782604881,-73.800863073467,-73.8008456415488,-73.800827186681,-73.800809446101,-73.8007914990872,-73.8007754815148,-73.8007614301352,-73.8007444010151,-73.8007283962637,-73.8007123815481,-73.8006971004959,-73.8006717326892,-73.8006592016224,-73.8006446193063,-73.8006406873051,-73.8006399581187,-73.8006369837154,-73.8006357641517,-73.8006333403199,-73.8006275260228,-73.8006218474008,-73.8006162240526,-73.8006078249428,-73.8006075411921,-73.8006074491836,-73.8006059618275,-73.8006012799462,-73.8006000997627,-73.8005941145921,-73.8005792061105,-73.8005664802632,-73.8005548778182,-73.8005463536181,-73.8005363092008,-73.800527139962,-73.8005180662202,-73.8005048303709,-73.8004916010108,-73.8004751825102,-73.8004565219796,-73.8004405358603,-73.8004245871912,-73.8004054140345,-73.8003906945668,-73.8003654755477,-73.8002859118806,-73.8003216303837,-73.8002938164511,-73.8002768301992,-73.8002719637551,-73.8002566293584,-73.8002349429996,-73.8002166961748,-73.8002043800044,-73.8001630240589,-73.8001286151249,-73.8001288717903,-73.8001400193935,-73.8001589819298,-73.8001823538811,-73.8001478857996,-73.8001282099448,-73.8001100744716,-73.8001042080742,-73.8000921419159,-73.8000695379,-73.8000518451734,-73.8000371189902,-73.8000219014645,-73.8000089241668,-73.7999900640491,-73.7999704438387,-73.7999527585559,-73.7999365605216,-73.7999102863849,-73.7998920964863,-73.7998729600525,-73.7998572241805,-73.7998430044205,-73.7998277740568,-73.7998095831271,-73.7997904065649,-73.7997697575304,-73.7997495701958,-73.799733347553,-73.7997114224618,-73.7996941907505,-73.7996806790041,-73.7996658639812,-73.7996540165911,-73.7996474305403,-73.7996471880429,-73.7996491338961,-73.7996528830596,-73.7996574003359,-73.7996625990561,-73.7996691685271,-73.7996754769607,-73.7996798070314,-73.7996768809803,-73.7996736249844,-73.799668729494,-73.7996566146603,-73.7996398847831,-73.7996251133271,-73.7996054829251,-73.7995868313636,-73.7995736032431,-73.7995691350723,-73.7995650221793,-73.7995556795003,-73.7995518868551,-73.7995485594174,-73.7995389496976,-73.7995261609094,-73.7995122923087,-73.7994997824298,-73.7994848516004,-73.7994698810062,-73.7994522134826,-73.7994360479975,-73.7994186288404,-73.7994048905364,-73.7993919114274,-73.7993804449354,-73.7993739088909,-73.7993690339035,-73.7993649309701,-73.7993603694524,-73.7993530051207,-73.799339267998,-73.7993238421915,-73.7993083975589,-73.7992924518791,-73.7992767174237,-73.7992605223637,-73.7992423619815,-73.7992251928137,-73.7992094549436,-73.799190281189,-73.7991708963034,-73.7991441223516,-73.7991365074757,-73.7991222458943,-73.7991023460217,-73.7990821624019,-73.7990674369922,-73.7990480121733,-73.799031759796,-73.7990160533129,-73.7989954063732,-73.7989752604599,-73.7989617239451,-73.798947971837,-73.7989310385911,-73.7989162820213,-73.7988936889729,-73.7988841241962,-73.7988625073702,-73.7988423675561,-73.7988261696429,-73.7988094980308,-73.7987922836119,-73.7987753533385,-73.7987579262318,-73.7987440489464,-73.798737063726,-73.7987242934587,-73.7987108023999,-73.7986926579497,-73.798676720102,-73.7986678836079,-73.7986603114518,-73.7986503939319,-73.7986416602315,-73.7986259659865,-73.7986093032565,-73.7985978093236,-73.798586559548,-73.7985765536522,-73.7985675945055,-73.7985592086933,-73.7985447908015,-73.7985341351093,-73.7985248178542,-73.7985165731081,-73.7985062711381,-73.7984955433862,-73.7984799407698,-73.7984655648682,-73.7984527019277,-73.7984386099636,-73.7984220384457,-73.7984098475431,-73.7983939915718,-73.7983791862032,-73.7983627435531,-73.7983454331612,-73.7983329831837,-73.798318805127,-73.7982993220303,-73.798286676221,-73.7982693203662,-73.7982513325532,-73.7982303796086,-73.7982144655101,-73.7981981691724,-73.7981852566918,-73.7981710792899,-73.798155279673,-73.7981421064217,-73.7981289791493,-73.7981110804521,-73.798092775034,-73.7980602583789,-73.7980426863742,-73.7980215730465,-73.7980061537943,-73.7979877142593,-73.7979730167745,-73.7979597425576,-73.7979378265244,-73.7979233236591,-73.7979074089083,-73.7978983268707,-73.7976725994333,-73.7976974419377,-73.7976699400886,-73.7975829547134,-73.7976154261265,-73.7976377969031,-73.7978701491456,-73.7978446443421,-73.7978244450395,-73.7978070413419,-73.7977911281147,-73.7977744909257,-73.7977578903357,-73.7977412188076,-73.7977279329275,-73.7977131820566,-73.7976931505703,-73.7976712481886,-73.7976498080887,-73.7976331375614,-73.7976140897327,-73.797599326475,-73.7975807732134,-73.7975646779008,-73.7975477934909,-73.7975311811306,-73.7975181542886,-73.7974992057908,-73.7974798165808,-73.7974613761999,-73.7974443322619,-73.7974273247754,-73.7974117366559,-73.7973938251833,-73.7973773226005,-73.7973589713445,-73.797337055249,-73.7973219980645,-73.7973049001019,-73.7972882065268,-73.7972711960891,-73.7972567921071,-73.7972412827387,-73.7972324114631,-73.7972314456308,-73.797235080784,-73.7972395623911,-73.7972421122368,-73.79724685379,-73.7972520908842,-73.7972564330191,-73.797257959374,-73.7972581469172,-73.7972582002881,-73.7972511566096,-73.7972384940083,-73.7972201203202,-73.7972045450424,-73.7971885977539,-73.7971740825867,-73.7971595455066,-73.7971430890971,-73.7971278313319,-73.7971135742493,-73.7970986631842,-73.7970805376643,-73.7970638232038,-73.7970503877143,-73.79702796654,-73.7970099856453,-73.7969878906262,-73.7969668435592,-73.7969398425857,-73.7969150864556,-73.796890840059,-73.7968722183676,-73.7968525610062,-73.7968348752348,-73.7968186352144,-73.7967980749978,-73.796789268447,-73.7967640974351,-73.7967356766024,-73.7965193993096,-73.7965417523289,-73.7965117570959,-73.7964869033435,-73.7964670270414,-73.7964421857451,-73.7964672004413,-73.7964920644025,-73.7967058756235,-73.7966770537475,-73.7966619426277,-73.7966470777627,-73.7966357899755,-73.7966177906951,-73.7965984153865,-73.7965844639275,-73.7965717331017,-73.7965587511496,-73.7965439549709,-73.7965262368538,-73.7964993160719,-73.7964827154592,-73.7964641382384,-73.7964442097864,-73.7964247547501,-73.7964062129195,-73.7963892836488,-73.7963759977474,-73.7963584598068,-73.7963458600089,-73.7963311434106,-73.7963134906273,-73.7962929999282,-73.796278677112,-73.7962653239902,-73.7962464882874,-73.7962248347786,-73.796205999829,-73.7961869837366,-73.7961677077587,-73.7961544336422,-73.7961345386037,-73.7961159061228,-73.7959627006605,-73.7958082607835,-73.7956529915045,-73.7954973000106,-73.7953415945962,-73.79528852797,-73.7952368915094,-73.7951878539466,-73.7951514290446,-73.7951105719225,-73.7951057969207,-73.7951006977191,-73.795095407745,-73.7950900654183,-73.7950848105281,-73.7950797805765,-73.7950751071789,-73.7950709126212,-73.7950673066601,-73.7950643836501,-73.7950622200763,-73.7950608725509,-73.7950745015959,-73.7950704323447,-73.7950623685044,-73.7950085765517,-73.794951356626,-73.7948915842635,-73.7948301740533,-73.7947680656446,-73.7947062093694,-73.794693559825,-73.7946780986399,-73.7946602617106,-73.7946405519155,-73.7946195249345,-73.7945977735838,-73.7945210091966,-73.7944458784508,-73.7944367700041,-73.7944276781931,-73.7944188464611,-73.7944105112879,-73.7944028958568,-73.7943962040795,-73.7943906151357,-73.794386278675,-73.7943833108108,-73.7943817910103,-73.7943819346958,-73.7943827605593,-73.7943842446277,-73.7943863438223,-73.7943889972085,-73.7943921277654,-73.7943956446204,-73.7943994456882,-73.7944034206336,-73.7944074540735,-73.7944114289274,-73.7944152298154,-73.7944187464073,-73.7944218766251,-73.7944245296065,-73.7944518061822,-73.794478559939,-73.7945042551955,-73.7945283774633,-73.7945382189135,-73.7945464377397,-73.7945528489552,-73.7945573082585,-73.794559715282,-73.7945600158492,-73.794558203197,-73.7945247288193,-73.7944828504784,-73.7944329903368,-73.7943956666892,-73.7943645425967,-73.7943399047022,-73.7943219799084,-73.7943109332879,-73.7943068665639,-73.7943098171738,-73.7942909504923,-73.794279823568,-73.7942767061587,-73.7942816738315,-73.794294606132,-73.7943151895058,-73.7943429249022,-73.7943488264663,-73.7943569276218,-73.7943654789022,-73.7943724345706,-73.7943782987007,-73.7943827044192,-73.7943817607258,-73.7943775807479,-73.7943734844584,-73.7943703325635,-73.7943672604298,-73.794364247506,-73.794361084486,-73.7943574180086,-73.7943522610986,-73.7943478362527,-73.7943424728952,-73.7943383956929,-73.7943337320004,-73.7943288503701,-73.7943214080538,-73.7943150111846,-73.7943087462056,-73.7943104708188,-73.7943113502147,-73.7943130748269,-73.7943146613876,-73.7943152439613,-73.7943165501015,-73.7943184655083,-73.7943213974321,-73.7943258782615,-73.79433154643,-73.7943406535323,-73.7943498505217,-73.7943601205195,-73.7943685797043,-73.794375546826,-73.7943873614097,-73.7943982789798,-73.7944042164608,-73.794419657067,-73.7944311259212,-73.7944410092171,-73.7944553797338,-73.794468864275,-73.7944828200568,-73.7944982528728,-73.7945057589829,-73.7945142664085,-73.7945231077581,-73.794532212854,-73.7945464701942,-73.7945553126007,-73.7945606280312,-73.794567434884,-73.7945757379011,-73.7945847667186,-73.7945939858825,-73.7946034244886,-73.7946189788817,-73.794630466922,-73.7946416811711,-73.7946438890573,-73.7946455971384,-73.7946462422119,-73.7946477059855,-73.7946494216159,-73.7946518595399,-73.7946541071133,-73.794656561254,-73.7946587922231,-73.7946601649252,-73.7946602009965,-73.7946595991165,-73.794657383919,-73.7946523113506,-73.794647993053,-73.7946435244396,-73.7946391191856,-73.794632488227,-73.7946276203988,-73.7946212901824,-73.7946155502647,-73.7946070637687,-73.7945994499252,-73.7945925418195,-73.794586685282,-73.794582007584,-73.7945788381075,-73.7945754627589,-73.794572604912,-73.7945756539779,-73.7945813380862,-73.7945848969886,-73.7945917333896,-73.7946077917974,-73.7946248173506,-73.7946486470668,-73.7946630195593,-73.7946850647669,-73.794701793766,-73.7947182641735,-73.7947340618769,-73.7947498186069,-73.7947661192564,-73.7947812458773,-73.7947946505346,-73.7948058878594,-73.7948147225782,-73.7948235011868,-73.7948313500112,-73.794838107932,-73.7948435330899,-73.7948467521584,-73.7948494527115,-73.7948506485796,-73.7948529783923,-73.7948552478793,-73.7948560645476,-73.7948546436791,-73.7948525080319,-73.7948513009568,-73.7948519107358,-73.7948527336081,-73.7948587464797,-73.7948622035563,-73.7948666821033,-73.7948692149693,-73.7948712524958,-73.7948731036335,-73.7948760179344,-73.7948794422768,-73.7948825614369,-73.7948856236394,-73.7948916570271,-73.7948977285335,-73.7949034326896,-73.7949078401333,-73.7949120080767,-73.7949150232542,-73.7949166724605,-73.79491812087,-73.7949206793127,-73.7949221323649,-73.7949266165377,-73.7949284173611,-73.7949299207635,-73.7949325662475,-73.7949365732162,-73.7949414049897,-73.7949473339102,-73.7949526016059,-73.794956203078,-73.7949588507887,-73.7949610635079,-73.7949616050163,-73.7949607968868,-73.7949593415069,-73.7949563980658,-73.7949534903278,-73.7949505893085,-73.7949482916619,-73.7949437702274,-73.7949117390956,-73.7948877196468,-73.7948724317812,-73.7948663336926,-73.7948696081362,-73.7948305592926,-73.7947826103856,-73.7947258949344,-73.7946822264694,-73.7946346029354,-73.79443444762,-73.7944017958488,-73.7943619554122,-73.7942554441641,-73.7941190228438,-73.7941102303753,-73.7941050313695,-73.7940998729436,-73.7940942125419,-73.7940865973556,-73.794079395864,-73.7940727631524,-73.7940653436977,-73.7940574223687,-73.7940502995993,-73.7940428459774,-73.7940347384136,-73.7940286774496,-73.7940226126138,-73.794014454332,-73.7940051927443,-73.7939952515392,-73.7939862116625,-73.7939794343709,-73.7939737579885,-73.7939677325631,-73.7939607018586,-73.7939525496235,-73.7939437766355,-73.793934684159,-73.793933682169,-73.7939245140732,-73.7939159522149,-73.7939074378363,-73.79390031635,-73.7938947923841,-73.793889450275,-73.7938849006296,-73.7938765029903,-73.7938694135655,-73.7938618873091,-73.7938579485176,-73.793852778981,-73.7938412175272,-73.7938352978795,-73.7938245360673,-73.7938171757823,-73.7938116590685,-73.7938059536609,-73.7938012311754,-73.7937975146636,-73.7937928927188,-73.7937917529374,-73.7937886402979,-73.793782687033,-73.7937778335223,-73.7937715201357,-73.7937641204838,-73.793758374169,-73.793751264841,-73.7937401115893,-73.7937276153105,-73.793722074284,-73.7937036219413,-73.7936858674426,-73.793665984651,-73.7936603775312,-73.7936446964654,-73.7933843981269,-73.7934067956803,-73.7933803350498,-73.7932394178115,-73.7932602267708,-73.7933317821612,-73.7936200727617,-73.7935758027398,-73.7935563164595,-73.7935385650692,-73.7935227863601,-73.7935034662859,-73.793485556935,-73.7934699712618,-73.7934533594123,-73.7934336919603,-73.7934185672628,-73.7934008839755,-73.7933883064869,-73.7933843509896,-73.793359698335,-73.7933449020286,-73.793324920974,-73.7933084659138,-73.7932950813052,-73.793281120977,-73.7932628102149,-73.7932461891633,-73.793231111898,-73.7932172863078,-73.7932005858247,-73.7931826882644,-73.7931669237166,-73.7931520726462,-73.7931343228935,-73.7931187662353,-73.7931074783846,-73.7930876483789,-73.7930747045003,-73.7930629076335,-73.7930603044395,-73.7930459159718,-73.7930286735365,-73.7930155475456,-73.7929983722028,-73.7929204923397,-73.7928615672973,-73.7928066958046,-73.7927590792978,-73.7926879011278,-73.7926321602874,-73.7925876329098,-73.7925397321671,-73.7925150508998,-73.792496234437,-73.7924642519386,-73.7923529115414,-73.7922397076399,-73.7922047711356,-73.7921568484992,-73.7921025310121,-73.792055919124,-73.79200172967,-73.7919631785584,-73.7919421295374,-73.7919151021627,-73.7918614005513,-73.7917928040392,-73.7917525425264,-73.7916279561771,-73.790282023532,-73.7898873866892,-73.7893090713177,-73.7888314335281,-73.7883542902718,-73.7879935835311,-73.7875019994468,-73.7856810130141,-73.7838384251435,-73.7831794097532,-73.7825308066352,-73.7825226569483,-73.7844066900349,-73.7843984536896,-73.7843415305959,-73.7822733018339,-73.781747087631,-73.7817021394188,-73.7816054588198,-73.7814326046088,-73.7812336211205,-73.7810784597021,-73.7808978479111,-73.7807750313901,-73.7807789248195,-73.7808501549086,-73.7808394901414,-73.7815888154501,-73.781587816366,-73.7815815324612,-73.7816386425779,-73.7816837283031,-73.7816266232814,-73.7816087937936,-73.7816160767875,-73.7816601155538,-73.7816421343347,-73.7808215486979,-73.7808080873793,-73.7807243506983,-73.7807002551626,-73.7807918207265,-73.781005396673,-73.7813176840371,-73.7815285754529,-73.7818100376292,-73.7819038542103,-73.7825816559182,-73.7826551713862,-73.7828436204445,-73.7830747533759,-73.7831097696396,-73.7831400085433,-73.7831702627592,-73.7832152257256,-73.7832478929539,-73.7832894883369,-73.7833179668426,-73.7833204336284,-73.7832962431701,-73.7832872387991,-73.783272528907,-73.7832650292733,-73.7832686833775,-73.7832723127863,-73.7832587625303,-73.783239112949,-73.7832182224646,-73.7831740685685,-73.783136500511,-73.7831115989783,-73.7830541548124,-73.7828681478728,-73.7823667880234,-73.7820032610338,-73.781824599083,-73.7817262557558,-73.7816576105101,-73.7815415003274,-73.7798983755808,-73.7798030505223,-73.779449614565,-73.7794686919289,-73.7794330151623,-73.7793624680482,-73.77928446351,-73.7792728777514,-73.778714787626,-73.778689688201,-73.7786853036192,-73.7786710899564,-73.778653137277,-73.7786374737861,-73.7786239496225,-73.7786045630003,-73.7785865899087,-73.7785723534402,-73.7785550680796,-73.7785352098166,-73.7785181861754,-73.7784973595596,-73.7784810185005,-73.778467000366,-73.778448311218,-73.7784321848823,-73.7784120944444,-73.7783955054967,-73.7783796082476,-73.778367454402,-73.7783492400557,-73.7783328775433,-73.7783108978019,-73.7782912488836,-73.778270663011,-73.777521697539,-73.7768705048974,-73.7761788595337,-73.7758446549887,-73.7750482978347,-73.7749591310615,-73.774874162469,-73.7747937271815,-73.7747181424402,-73.7744357888758,-73.7743717434029,-73.7743143749185,-73.7742639923037,-73.7742208668211,-73.7741852306552,-73.7741712311341,-73.7741514310781,-73.7741262768627,-73.7740963355649,-73.7740776311862,-73.7740602893141,-73.774044802506,-73.7740316106298,-73.7740210883699,-73.7740135345862,-73.7740091638248,-73.7740081002253,-73.7740103739945,-73.774015920549,-73.7740245823499,-73.7740361133771,-73.7740290584891,-73.7740182219482,-73.7739806797672,-73.7739355506151,-73.77388293132,-73.7738229347715,-73.7737556896788,-73.7737490541825,-73.7737471060747,-73.7737498617783,-73.7736808347047,-73.7736324818891,-73.773567295294,-73.7734964926851,-73.773420254083,-73.7732746589103,-73.7732046717258,-73.7730798654209,-73.7728774373825,-73.7728605968493,-73.772779106503,-73.772720122682,-73.772668657467,-73.7726004175282,-73.7725275706376,-73.7724687526048,-73.7724137940309,-73.7723629616219,-73.7722731692834,-73.7722707536458,-73.7722605142219,-73.7722424878759,-73.7722384161348,-73.7722420681907,-73.7722534277751,-73.7722330375401,-73.7722060789364,-73.7721726632143,-73.7721329282647,-73.7721025534893,-73.7720259534436,-73.7719440384826,-73.7718957413781,-73.7718514388746,-73.7718121772805,-73.771778883848,-73.771752344873,-73.7717368064766,-73.771730423718,-73.7717333624005,-73.7717455461606,-73.7717186048762,-73.7716681128188,-73.771443375423,-73.7711276990068,-73.7708781604282,-73.7706312453759,-73.7708231502143,-73.7711714496876,-73.7712437174048,-73.7713134806265,-73.7713805160969,-73.7714967283403,-73.7716157862565,-73.7717375635067,-73.77190205681,-73.7719932047445,-73.7720876998626,-73.7721847160562,-73.7722834051798,-73.773790965526,-73.7739672884747,-73.7741296782694,-73.7742683605896,-73.7743460921796,-73.7743923119785,-73.7743897690103,-73.7742643952068,-73.7742000266197,-73.7741998086814,-73.7742301148685,-73.7743241010546,-73.7744461714191,-73.775019226783,-73.7762894485544,-73.7763372881872,-73.775872336885,-73.7750481043883,-73.7748624824042,-73.774806953694,-73.7747412474551,-73.7746308254633,-73.7745858466651,-73.7745623664434,-73.7745119519224,-73.7744546250304,-73.7743566127427,-73.7742646669442,-73.7740960989509,-73.7740763829778,-73.7726172080581,-73.7720920025976,-73.7716073197949,-73.7706097445486,-73.7707638281677,-73.7708686712456,-73.7709360216871,-73.7709987179751,-73.771814665066,-73.7723506921408,-73.7726695015009,-73.7732718173538,-73.7740381110771,-73.775598853662,-73.7758395833216,-73.7767836326242,-73.7776935496137,-73.7785877112417,-73.7794765605842,-73.7803618035438,-73.78279772917,-73.7840764529224,-73.7844091872914,-73.7844833065156,-73.784593393492,-73.7849148919768,-73.7856943384527,-73.786264983026,-73.7865507335238,-73.7874099159046,-73.7882697295325,-73.788939757696,-73.7891387365924,-73.7898420408074,-73.790349717911,-73.7914959869521,-73.7916352606645,-73.7922679522091,-73.7927125938287,-73.7925514464414,-73.7923669778862,-73.792289196193,-73.7921678938403,-73.7922312493825,-73.792379106946,-73.7923824381352,-73.7923901269483,-73.7924567735076,-73.7926823244245,-73.7930255136591,-73.7932248387382,-73.7933454619449,-73.7934367370331,-73.793438001825,-73.7934429997643,-73.7934403346991,-73.7934399114645,-73.7932162364112,-73.7930301581337,-73.7930144042443,-73.7927155327382,-73.7924191072557,-73.7923751799838,-73.7924309918035,-73.7934332013521,-73.7945772698999,-73.794627691541,-73.7946558385144,-73.7946832464622,-73.7947214125748,-73.7947576982429,-73.7947752525681,-73.7947910033461,-73.7948050444504,-73.7948103456185,-73.7948153134903,-73.7947354566905,-73.7947226487797,-73.7946756881825,-73.794579760412,-73.7945201930523,-73.794481238857,-73.7944812155691,-73.7944812052733,-73.7944586915747,-73.7944528269304,-73.7944528171415,-73.7944528289865,-73.7944636833295,-73.7944911461267,-73.7944911705002,-73.7944912065203,-73.7945350735507,-73.7946732717469,-73.7946734082346,-73.7946735656202,-73.7948329545002,-73.7950128584735,-73.7950129845307,-73.79501312009,-73.7952125770971,-73.7954305928757,-73.7956656682183,-73.7958930287862,-73.7958931909793,-73.795893352483,-73.7961362496825,-73.7961363119708,-73.7961363857089,-73.796394149669,-73.7963942358,-73.7963943219327,-73.7966658185437,-73.7966660174628,-73.7966662287098,-73.7969506529852,-73.7972308497208,-73.7972679511915,-73.7972788541304,-73.7972788787145,-73.7972788680565,-73.7972751758787,-73.7972751763732,-73.7972751530502,-73.7972567434465,-73.7972567079298,-73.797256650196,-73.7972238015304,-73.7972237300281,-73.7972236245784,-73.7971768666997,-73.7964083366987,-73.7962929729161,-73.7967249785875,-73.7964394004849,-73.7964117836611,-73.7964021870636,-73.7968479577502,-73.797292605541,-73.7982205892731,-73.799111957239,-73.8000029241536,-73.8008915119533,-73.8013215540357,-73.8018083430405,-73.8026863206076,-73.8036360051951,-73.8046155349878,-73.8046654326126,-73.8047129152036,-73.8056455091005,-73.8065788386773,-73.8075208191378,-73.8080525845573,-73.808448913235,-73.8089301670512,-73.8094114217823,-73.8104043557634,-73.8113972909521,-73.8122773782403,-73.8132240172633,-73.814073820425,-73.814894970308,-73.8149975569087,-73.8150499868699,-73.8151033194465,-73.8152246716851,-73.8159359422738,-73.8166446777877,-73.8171592827276,-73.8177436933596,-73.8186304914798,-73.8189066552469,-73.8194832991281,-73.8210086280554,-73.8212199748999,-73.8217006188712,-73.8230151947775,-73.8235721143048,-73.8244595325713,-73.8252857978249,-73.8253738766737,-73.8253632475165,-73.8252701510202,-73.8252057209488,-73.8251258065185,-73.8249838447333,-73.8248549614948,-73.8248117842176,-73.8249480087467,-73.8249743999207,-73.8254041332308,-73.825560793229,-73.8255647887844,-73.8256064165045,-73.8256415128456,-73.8256897373689,-73.8258136411484,-73.8258218972737,-73.8259167329176,-73.825975804621,-73.8260258503621,-73.8261403824347,-73.8262380227564,-73.8263091815382,-73.8263378820486,-73.8263916478629,-73.8264679595493,-73.8265726273055,-73.8266951412572,-73.8268719177106,-73.8269582483883,-73.8270122248051,-73.8270529611979,-73.8271388594393,-73.8272277268523,-73.8273135404409,-73.8274094222052,-73.8274550878747,-73.8274982660807,-73.8275238028317,-73.8276056949615,-73.8279003027045,-73.8279645508448,-73.8279496908658,-73.8280915257717,-73.8294675199701,-73.8305355123144,-73.8311345171537,-73.8309942308935,-73.83090596523,-73.8303961756113,-73.8303438659767,-73.8313011725404,-73.8312881943025,-73.8312400552556,-73.831198727747,-73.8311554935487,-73.8310970924222,-73.8315594226786,-73.831639755564,-73.8320706479482,-73.8329689305268,-73.833868509533,-73.8351795043705,-73.8358613187213,-73.8359019695286,-73.8359156487578,-73.8359253040333,-73.8359507145917,-73.835849677861,-73.8356755394758,-73.835569586648,-73.8354377716984,-73.8350657468726,-73.8346981123397,-73.8347781005969,-73.8348585180662,-73.8349343215961,-73.8350048058533,-73.8350693149264,-73.83514009988,-73.8350233466827,-73.8348488943387,-73.8347853545841,-73.8347334508157,-73.8347070809014,-73.8347116851386,-73.8347873606395,-73.8350804930398,-73.8355485237687,-73.8358365151829,-73.8362511917507,-73.8377803814653,-73.837989211983,-73.8380577884866,-73.8398495469039,-73.8400426281376,-73.8406799997367,-73.8407187671669,-73.840731668502,-73.8407513822146,-73.8407661408272,-73.8407754979146,-73.8407791704356,-73.840777047297,-73.8407691927133,-73.8407642340115,-73.8407515307587,-73.8407313758005,-73.840704233775,-73.8406966245417,-73.8406923733551,-73.8406901877132,-73.8406877895865,-73.8406872980397,-73.8406890093981,-73.8406910649728,-73.8406943418647,-73.8407052355804,-73.8407143317528,-73.8407214759005,-73.8407338456162,-73.8407512692184,-73.8407637206892,-73.8407663356797,-73.8407672662649,-73.8407641504865,-73.8407603880669,-73.8407554092046,-73.8407413407186,-73.8407323201707,-73.8407293073011,-73.8407297376543,-73.8407330658331,-73.8407427730881,-73.8407482775543,-73.8407518743926,-73.8407518584395,-73.8407508231658,-73.8407451513152,-73.8407431271486,-73.8407376108939,-73.840735612048,-73.8407225165151,-73.8407124298574,-73.8407041250609,-73.8406922050722,-73.8406775686861,-73.8406626902551,-73.8406577222069,-73.8406514989966,-73.8406343935757,-73.8405953295077,-73.8405532025165,-73.8405059753626,-73.8404812395459,-73.84045672255,-73.8404406373626,-73.8404247934767,-73.8404215600194,-73.840414797887,-73.840412812824,-73.8404106976494,-73.8403916635384,-73.8403821351714,-73.8403722771602,-73.8403372143646,-73.8402889935782,-73.8402335863824,-73.8402083900236,-73.8401769423668,-73.8401241631381,-73.8400912763909,-73.8400689687023,-73.8400510679703,-73.8400190454037,-73.8399027777269,-73.8398443429219,-73.8398041950025,-73.839771416636,-73.8397462785115,-73.8397245207943,-73.8396844312565,-73.8396628598361,-73.8396512084001,-73.839622600321,-73.8396024383919,-73.8395566654183,-73.8395487761811,-73.8395415306644,-73.8395344059686,-73.8395314389151,-73.8395316635444,-73.8395349525504,-73.8395355345489,-73.8395325246988,-73.8395285309119,-73.8395219457002,-73.8395169771944,-73.8395104933792,-73.8394927394836,-73.8394690964411,-73.839447439768,-73.8394060201174,-73.8393357252279,-73.839294785399,-73.8392407117513,-73.8391872975274,-73.8391410437484,-73.8390973191603,-73.8390823455288,-73.8390728451971,-73.8390653242181,-73.8390624275515,-73.8390600758805,-73.8390564035898,-73.839055356176,-73.8390546765639,-73.8390539569385,-73.8390539355273,-73.8390551859349,-73.8390562496216,-73.8390583364731,-73.8390597507521,-73.8390766786794,-73.8390943905909,-73.8390960881024,-73.8391053150766,-73.8391199522324,-73.8391220967654,-73.8391232990766,-73.839783358533,-73.8404553715744,-73.8411383911255,-73.8418314671024,-73.8425336059876,-73.843243813566,-73.8436344271319,-73.8440443109266,-73.8444497030347,-73.8447902700433,-73.8451340402415,-73.8454898618525,-73.8458523574436,-73.8454947910387,-73.8452215006881,-73.8445463383914,-73.843716577998,-73.8428314247658,-73.8426182239694,-73.8423956988243,-73.8421660064799,-73.8421131088285,-73.841984389944,-73.8418543882371,-73.8417235428068,-73.8415922956026,-73.8414610895386,-73.8413303681582,-73.8412005729918,-73.8410721424405,-73.8401778961229,-73.8394040091775,-73.8392536576608,-73.8395678280505,-73.8395986548871,-73.8396034594921,-73.8396272925196,-73.8397250358941,-73.8398320564931,-73.8399176745095,-73.839981192061,-73.8400200337903,-73.8400249430433,-73.8400268132413,-73.8400240333708,-73.8400222020751,-73.8397283042786,-73.8397005336242],"lat":[40.7652895884368,40.7652523229731,40.7654457684587,40.7659911055684,40.7660342096388,40.7661395497257,40.7662117217216,40.7663926770455,40.766650871719,40.7667344146533,40.7668248059599,40.7669168411771,40.7669741602152,40.7670170169848,40.7671108247191,40.7671048916637,40.7671204449384,40.7670514854102,40.7670865357092,40.7670642771474,40.7670018816497,40.7669522042086,40.7668241589167,40.766623420466,40.7665666646123,40.7665292403015,40.7664646665052,40.7663796729563,40.7662947978985,40.7662704043815,40.7662148697484,40.7661620202001,40.7661629545759,40.7661478309242,40.7661421939807,40.7661573274276,40.7661592088674,40.7662103797609,40.7661851487789,40.7661168842159,40.7661103677166,40.7661651820664,40.766168924393,40.7661786050842,40.7661503808775,40.7660974765248,40.7660972996561,40.7660812426624,40.7660812923348,40.7660935761373,40.7660954473175,40.7661462221189,40.7661051929873,40.7660432805295,40.7659883262833,40.765994957493,40.7659684839921,40.7659581602287,40.766038413565,40.7659897108492,40.7659651458819,40.7659273230535,40.7659329244163,40.7659376498065,40.7659489302744,40.7659252914889,40.7659140081471,40.7659187369483,40.765821028797,40.7658191370754,40.7658125765892,40.7658352660528,40.7658446651674,40.7658389928728,40.7658559282466,40.7658994198914,40.7659112518797,40.7658679679703,40.765802367585,40.7658061323363,40.7657853318745,40.765775004882,40.7657929655471,40.7657976688529,40.7658629206955,40.7658306071643,40.765854722425,40.7657252928477,40.7656530714174,40.7656434799385,40.765679968848,40.7654948814858,40.7654967613636,40.7654692150089,40.765459602584,40.7655283881786,40.7656661194826,40.7660125758185,40.7660448715539,40.7661157043138,40.7661963431665,40.7662958001292,40.766283756731,40.7662620347584,40.7662679615278,40.7662905639677,40.7663131580958,40.766419412624,40.7667059116311,40.7667729481717,40.7668502329003,40.767012496033,40.7671171613372,40.7672377807649,40.767378768977,40.767634597848,40.7677453787863,40.7678693459678,40.7679107668138,40.7678803220334,40.7681139737714,40.7681405307259,40.7681117877467,40.7682021811483,40.7682354881896,40.7682724941985,40.7683123196664,40.768354018074,40.7683965983867,40.7684390486081,40.7684803598314,40.7685195502188,40.7685556883361,40.7685879152909,40.7686154651458,40.7686376831233,40.7686540411678,40.7686365983954,40.7686348274798,40.7686343447258,40.7686351629007,40.7686372603664,40.7686405816521,40.768645038921,40.7686505142932,40.7686568629639,40.7686639170317,40.7686714899403,40.7686793814116,40.7686873827425,40.7687117475274,40.7691483140067,40.7694763635387,40.7696566229569,40.7696776973586,40.769701195878,40.7697264413064,40.7697527060891,40.7697792332942,40.7706239195225,40.7706354051099,40.7706590865698,40.7706880446292,40.77071924132,40.7707615729026,40.7708440330094,40.770913141616,40.7709822506859,40.7710637883776,40.771187619866,40.7713286168155,40.7714389166097,40.7714842044611,40.7717300940228,40.7717424198502,40.7718047991526,40.7718425892653,40.7718582908746,40.7718937785809,40.7719205974044,40.77192719326,40.7719373927848,40.7719455348769,40.7719381995896,40.7719202868164,40.7719253723929,40.7718920990567,40.7719023708404,40.7717436685388,40.7717514018896,40.7718153938307,40.7718728728169,40.7717986364652,40.7718063607977,40.7719855347437,40.7719803750371,40.7718907861486,40.7718307456479,40.7720176057582,40.7720098772678,40.7719663535201,40.7719613264906,40.7719722742625,40.7719582988771,40.7719964846866,40.7720573726163,40.7721830620083,40.772181073431,40.7722246010576,40.7722310028675,40.7724132017968,40.7725611038308,40.7731047205878,40.773561667957,40.7737426847534,40.7742602289575,40.774547634476,40.774647143387,40.7747468305643,40.7748462499292,40.7749449565996,40.7751806772603,40.7752401986213,40.7753003947951,40.7753437966687,40.7754496026242,40.7755570801295,40.7756777117085,40.7757859545258,40.7757872041511,40.7757904695304,40.7758628976196,40.7758570040435,40.7768987582343,40.7768953095458,40.7769709551684,40.7769725328638,40.7770040190173,40.7772884434292,40.7774046325397,40.7775220511735,40.7776349182881,40.7776746535854,40.7777726162806,40.7778905618542,40.7779277044723,40.7779616737314,40.7779930975469,40.7780222126916,40.778035349459,40.77804830061,40.7780607408781,40.7780619227545,40.7780722833649,40.7780825861551,40.7780913763564,40.7780984127069,40.7781035572198,40.7781146964072,40.7781268708983,40.7781313856985,40.7781350098243,40.7781409662616,40.7781454562187,40.778151013116,40.7781554680088,40.7781613363876,40.7781686807282,40.7781776358171,40.7781963620502,40.7782455631846,40.7782960661401,40.7783177984236,40.7783385362539,40.7783571533709,40.7783765783913,40.7783965952396,40.7784169520326,40.7784258855571,40.7784280226931,40.7784150676699,40.7784140540061,40.7784648141079,40.7784576207925,40.7784774737098,40.7784967206788,40.77849996042,40.778503046788,40.7785059965302,40.7785088558094,40.7785142474239,40.7785289402598,40.7785317531955,40.7785346220716,40.7785375895118,40.7785406945507,40.7785628227849,40.7785809042142,40.7785972153535,40.778611854336,40.7786252187192,40.7786370998582,40.7786425051229,40.7786475428337,40.7786522300801,40.7786565680661,40.7786637832117,40.7786703974749,40.778681831986,40.7786910397336,40.7786987387911,40.7787021144364,40.7787093897783,40.7787106971923,40.7787176895194,40.7787223057725,40.7787275670224,40.7787337148237,40.7787370807666,40.7787406432912,40.7787444116298,40.7787483857953,40.7787525659411,40.7787673065305,40.7787691233811,40.7787972078514,40.7787932848278,40.7790753440231,40.779092971224,40.7790979571351,40.7791027721457,40.779107423136,40.7791119300429,40.779120544852,40.7791287409931,40.7791422210895,40.7791686954207,40.77917013101,40.7791714321454,40.7791736610764,40.779179107167,40.7791801623394,40.7791806638393,40.7791824734944,40.7791837921646,40.7791852653028,40.7791868916915,40.7791886899235,40.779190668866,40.7791928367071,40.7793974127518,40.7794102641417,40.779423236719,40.7794358597249,40.7794477285177,40.7794584194067,40.7794677983543,40.7794756640682,40.7794819203516,40.7794832751768,40.779484414463,40.7794860543913,40.7794868489138,40.7794868257497,40.7794850214888,40.7794780826873,40.7794771327596,40.7794770512094,40.7794770016193,40.7794772014244,40.7794014466933,40.7793479301085,40.7793513879418,40.779373355586,40.7793668110852,40.7793008958767,40.7791939971125,40.779169818249,40.7791109141126,40.7790691554303,40.7790145548318,40.7790255445723,40.778964409228,40.778992978115,40.7790497196378,40.7790760853376,40.7791219566744,40.7791988509629,40.7791966839187,40.7792977581858,40.7793021135179,40.7792801335207,40.7792931924929,40.7793261428947,40.7793544313482,40.7793236703812,40.7794327419909,40.7793909869257,40.7793997352013,40.7794283042224,40.7794494320195,40.779497684695,40.7796303475517,40.7796257361652,40.7796146119484,40.7796058207622,40.7796036617876,40.7796172547142,40.7794806723308,40.7791692847038,40.7791693305224,40.779528902387,40.7795301047395,40.7794967390453,40.7796412908963,40.7796513388014,40.7797754749193,40.7797760591059,40.7797765525346,40.7797767321848,40.7797769473173,40.7797773932584,40.7797775943701,40.7797772551562,40.779777578081,40.7797780958188,40.7797788930893,40.7797799606192,40.7797806079772,40.7797813268558,40.7798040781185,40.779818952924,40.7798318720117,40.7798420252853,40.7798503157095,40.7798567695424,40.7798613687042,40.7798629683335,40.7798637569994,40.7798630981408,40.7798629428829,40.779863362337,40.7798644217452,40.7798655236281,40.7798671914877,40.7798694100939,40.7798721504081,40.7798754047535,40.7798790821672,40.779883111391,40.7798873751284,40.7798934034192,40.7798999023976,40.7799146226605,40.7799297884833,40.7799303106001,40.779956619026,40.7799541367178,40.7799755827205,40.7799772444365,40.7799932316923,40.779992164306,40.7800384925936,40.7800317570607,40.7800415360041,40.7800351500029,40.780009591583,40.7800112407751,40.7800352073006,40.7800336506964,40.7798882804164,40.7798883131417,40.7799618037754,40.779939312462,40.7798690354904,40.7798675084782,40.7800352288782,40.7800319717782,40.779958486575,40.7799777820332,40.780052854328,40.7800559787879,40.7800783418344,40.7800798737037,40.7800575053661,40.780063417452,40.7800637654157,40.7800658281143,40.7800733149272,40.780080506978,40.780087511267,40.7800909787996,40.7800944294669,40.7801028883447,40.7801119000144,40.7801355242267,40.780152066413,40.7801922887394,40.780204394645,40.780215877081,40.78022402241,40.7802327251199,40.7802522507548,40.7802711782034,40.7803150277184,40.780335081953,40.7803880829938,40.7804481086025,40.7804905309982,40.7805290820304,40.7805375497305,40.7805460020664,40.7805543490301,40.7805624361923,40.7805701745035,40.780577329243,40.7805837007107,40.7805890838684,40.7805909816672,40.7805924219055,40.7805934205594,40.7805940074504,40.7805937749811,40.7805926426787,40.7805928356284,40.7805935576707,40.7805951438864,40.7805962570201,40.7805975761732,40.7805991194254,40.780600897389,40.7806028999686,40.7806051361054,40.7806130421558,40.7806217654511,40.7806248109736,40.7806417130347,40.7806556199932,40.7806650503149,40.7806921747954,40.7806925338017,40.7807704002551,40.7807983057512,40.7808527216544,40.7808707336331,40.7808868213689,40.7809263320207,40.7809904868128,40.7810069582443,40.7810598518288,40.7810695797273,40.7810774454993,40.7810891347985,40.7810875045878,40.7810811628921,40.7811195751561,40.7811207445754,40.781121511317,40.7815925035828,40.7815963078438,40.7815996249163,40.7816024725298,40.781604861068,40.7816092744673,40.7816129120829,40.7816180841482,40.7816204397676,40.7816238793465,40.7816294265947,40.7816313939725,40.7816314472538,40.7816301979054,40.7816273708799,40.7816281569096,40.7816322931913,40.781632444373,40.7816327132327,40.7816331071132,40.7816336186571,40.7816342477153,40.7816349937825,40.7816368270498,40.7816391211826,40.7816418115496,40.7816448799365,40.781648246297,40.781655810122,40.78166340131,40.7816669065658,40.7816700955143,40.7816728897348,40.781675233045,40.7816855422035,40.781694297022,40.7817015683533,40.7817075022081,40.7817116693043,40.7817137863902,40.7817151039746,40.7817237213406,40.781728766523,40.7817326088131,40.7817371879861,40.7817425835193,40.7817488509115,40.7817574776549,40.781768120017,40.7817805696058,40.7817945127795,40.7818096322885,40.7818253345221,40.7818410783428,40.781856304946,40.7818882275847,40.7819182179949,40.7819321025794,40.7819451490889,40.7819572654948,40.7819684089369,40.7819847269812,40.7819971028197,40.7820008413416,40.7820147657062,40.7820455551029,40.7820614132617,40.782077151263,40.7820933366979,40.7821216618079,40.7821482489952,40.7821736373941,40.782185916496,40.7821979450485,40.7822241773711,40.7822360040669,40.782246777804,40.7822563658243,40.7822647750141,40.782271979174,40.7822751094832,40.7822779414523,40.7822932607292,40.7823070452062,40.7823195678342,40.7823317673307,40.7823468617589,40.7823565383288,40.7823638509943,40.7823688187471,40.7823721947953,40.7823772124648,40.7823805569578,40.7823852474595,40.7823994885058,40.7824047361298,40.7824111759684,40.7824128500344,40.782415578321,40.7824160584908,40.7824166823339,40.7824174593734,40.7824184063708,40.7824207613793,40.782423809575,40.7824304439133,40.7824471718367,40.7824508766953,40.7824538251473,40.7824562419081,40.7824571993375,40.7824579936572,40.7824586262256,40.7824590968751,40.7824594062907,40.7824595620097,40.7824594501765,40.7824587981992,40.7824576062418,40.7824558923558,40.7824508624185,40.7824439398875,40.7824400365618,40.7824353948901,40.7824143253286,40.7824096391163,40.7824057458791,40.7824026184906,40.7823997795102,40.7823949958829,40.7823914579839,40.7823892365788,40.7823655417529,40.7823596976135,40.7823556816683,40.7823538758949,40.7823533770715,40.7823535777509,40.7823545545972,40.7823574119004,40.7823656856376,40.7823661090331,40.7823644293834,40.7823648822581,40.7823669391368,40.7823675073224,40.7823687510139,40.7823706705482,40.7823732288978,40.782380055477,40.7823842065423,40.7823887261734,40.7823954522827,40.7824025473338,40.7823627485047,40.7823473517416,40.7823444313643,40.7823420129366,40.7823415905752,40.7823463020602,40.7823453746638,40.7823444047413,40.78233528002,40.7823325916867,40.7823336079911,40.7823319439296,40.7823294478093,40.7823239362762,40.7820605343677,40.7820523924323,40.7820453796002,40.7820394680011,40.7820346040685,40.7820133075259,40.7819893452158,40.7819857420443,40.7819834657389,40.7819824641859,40.7819826590508,40.7819898478721,40.7819910363287,40.7819891532956,40.7819858434604,40.7819737738869,40.7819711698128,40.7819711580894,40.7819742306819,40.7819745786585,40.7819707403591,40.7819642543566,40.781960354355,40.7819494855051,40.781945945171,40.7819417721035,40.7819400414699,40.7819401624212,40.7819419356182,40.7819463587956,40.7819541316171,40.7819571755349,40.7819617492294,40.7819678283961,40.78197538435,40.7819821898746,40.781990722551,40.7820006664206,40.78201175909,40.7820311583959,40.7820527693984,40.7820757163107,40.7831430791384,40.7831462937428,40.7831565720153,40.7831920256768,40.7831941569609,40.7833097043257,40.7831982787344,40.7831963175047,40.7833178794989,40.7833199265098,40.7833228315917,40.7833265089613,40.7833308500307,40.7833476593407,40.7833668419768,40.7833509256586,40.7831575174696,40.7831500881622,40.7830952690483,40.7829794392901,40.7829793995011,40.7829388779057,40.782939879659,40.7828922612489,40.7828923192765,40.7829379076501,40.7829399691744,40.7830971218703,40.7831492454122,40.7831816096159,40.7831994643511,40.7832055366518,40.7832210176351,40.7832478019948,40.7833056179529,40.7833324144557,40.7833578888195,40.7833649579539,40.7833713634853,40.7833769596927,40.7833815677666,40.7833850230585,40.7833871833197,40.7833879650051,40.7833876753983,40.7833873770771,40.7833873417309,40.7833856300841,40.7833787846975,40.7833698420242,40.7833660023862,40.7833632081253,40.7833607852837,40.7833618988338,40.783365399195,40.7833712705862,40.7833805717448,40.7833909159606,40.7834020408334,40.7834139376717,40.7834266144708,40.7834495245746,40.7834726521098,40.7834842355178,40.7834958250098,40.7835529504445,40.7836118705042,40.7836294639796,40.7836444302952,40.7836564486787,40.7836652615408,40.7836706799958,40.783701262811,40.7837056587245,40.7837133378409,40.7837240783392,40.7837360666499,40.783737216159,40.7837527480158,40.7837685641093,40.783787113496,40.7838563745811,40.7839312743377,40.7839922803871,40.7840038792876,40.7840143904432,40.784029104427,40.784045385003,40.7841047537112,40.7841508656469,40.7841581943129,40.784183492245,40.7841894851851,40.7841953875906,40.7842068533689,40.7842177996633,40.7842281037271,40.7842376930169,40.7842462646117,40.7842535869457,40.7842593603326,40.784260646058,40.78426120025,40.7842602952641,40.7842605084938,40.7842618368787,40.7842629736266,40.7842644314109,40.7842721828844,40.7842783382413,40.7842816306445,40.7844902808531,40.7844869928471,40.7845006749303,40.7845214338316,40.78464204265,40.7846418219353,40.7846416218333,40.7846419465937,40.784642762981,40.7846433138472,40.7846439621539,40.7846446990629,40.7846455182097,40.7846464167432,40.7846468982221,40.7846474055865,40.7846479217502,40.7846484562435,40.7846490077458,40.7846495785999,40.7846542812683,40.7846590127117,40.7846638151596,40.7846687798017,40.7846779246796,40.7846971992795,40.7847327874711,40.7847995493064,40.7848278812825,40.7849260256983,40.7849600514155,40.7849918104881,40.7850760026552,40.7851351155134,40.7851460266367,40.7851681101616,40.7851774798582,40.7851847788229,40.7851927985309,40.7852023581436,40.7852135187801,40.7851867547312,40.7854318130604,40.7854387488516,40.7854210766932,40.7854210635718,40.7852424356453,40.7852373818136,40.7854210532163,40.7854238078202,40.7854621177997,40.7854730966686,40.7854779160476,40.7854712964987,40.7853134585011,40.7853065887557,40.785474638804,40.7854847761963,40.7854948519958,40.7850329229736,40.7850272499427,40.7855349344498,40.7855238142884,40.785490787009,40.7854674413741,40.785466687763,40.7855322885732,40.7854915989337,40.7855676473883,40.785568258522,40.7855723261863,40.7855797500922,40.7855903472023,40.7856038562431,40.785619944147,40.7856382142637,40.7856582161397,40.7856794566244,40.7857014120282,40.7857086430327,40.7857175812215,40.7857258080536,40.785733131795,40.7857407941577,40.7857484372248,40.7857658557739,40.7857686317432,40.7857712532768,40.7857777385755,40.7857787343275,40.7857819826515,40.7857861246122,40.7857884162219,40.7857908990386,40.7857967552268,40.7858012183569,40.7858501596633,40.78587950877,40.7858331440172,40.7858379435863,40.7858640010405,40.7858736231374,40.7858953110374,40.7859053119992,40.7859113826315,40.7859177494582,40.7859314633508,40.7859467137198,40.7859653280889,40.7859757493133,40.7859858070305,40.7859955298419,40.7860049428746,40.7860139837321,40.7860228320711,40.7860407269143,40.786060406764,40.7860773459903,40.7860920651219,40.7861047586804,40.7861160509228,40.7861160950122,40.786119285862,40.7861229634397,40.7861300502776,40.78613862516,40.7861432828277,40.7861481401539,40.7861531412278,40.7861582619724,40.7861701689543,40.7861834550642,40.7862177485719,40.7862483282274,40.7862626208649,40.7862761856911,40.7863022756082,40.7863296299931,40.7863588004607,40.7863919296574,40.7864051903775,40.7864332749708,40.786446307886,40.7864623396077,40.7864755937846,40.7864875994094,40.7864931915313,40.7864985311968,40.7865146429146,40.7865311664753,40.7865481279856,40.7865655912097,40.7866236937792,40.7866696936795,40.7866909095136,40.7867446917686,40.7867570418366,40.7867881399263,40.7868028166846,40.7868056038515,40.7868083088096,40.7868190763193,40.7868219967646,40.786824962769,40.7868746539632,40.7869167106169,40.786922025965,40.7869284305649,40.786957292383,40.7869886573049,40.7870251198739,40.7870353797448,40.7870443224427,40.7870515610583,40.7870568095318,40.7870610245931,40.7870634921445,40.7870641652476,40.7870637207597,40.7870630366927,40.7870607052523,40.7870573945442,40.7870530675205,40.7870477078462,40.7870373942496,40.7870085512159,40.7869854726106,40.7869588672528,40.7869533043963,40.7869494384355,40.7869438697911,40.7869405383442,40.7869345633679,40.7869305506197,40.7869257918643,40.786914159889,40.7868858707636,40.7868743943249,40.7868406018259,40.7868311443964,40.7868214932216,40.7867741129347,40.7867670428218,40.7867297906616,40.786726038937,40.7867226906774,40.7867170801769,40.7867132881668,40.786706338611,40.7867023487939,40.7866910921323,40.7866603673984,40.7866529665899,40.7866473587636,40.7866468613788,40.7866465433968,40.7866463960797,40.7866464287937,40.7866470078726,40.7866482898672,40.7866523110221,40.7866618960064,40.7866669170037,40.7866681997942,40.7866694015238,40.786670161512,40.7866704802051,40.7866702304688,40.7866674589294,40.7866680581964,40.7866726136972,40.7866789999569,40.7867250942854,40.7868210958118,40.7867814844711,40.786805703958,40.78686911485,40.7868867897883,40.7869021140709,40.7869405473222,40.7869456209542,40.7869499470433,40.7869535975319,40.7869566073632,40.7869573798007,40.7869580345478,40.7869589837193,40.7869594565097,40.7869594588159,40.7869584476724,40.7869540231713,40.7869535010652,40.7869535233956,40.7869537546852,40.786958122218,40.7869644939021,40.7869728343127,40.7869777303889,40.7869831152467,40.786995560741,40.7870107630822,40.7870665582273,40.7870869352879,40.787102539164,40.7871391813683,40.787150099959,40.7871605901001,40.787184399752,40.7872103854659,40.7872378980414,40.7872660650637,40.7873564851248,40.7874367360879,40.7874632288901,40.7874870532672,40.7874902139066,40.7874932203783,40.7874960999724,40.7874988444849,40.7875014709837,40.7875039788167,40.7875087254457,40.787512604871,40.7875164561311,40.7875295070387,40.7875358166556,40.7875387538151,40.787543885084,40.7875530575746,40.7875642754802,40.7875775414562,40.7875925703506,40.7876090391171,40.7876265937591,40.787644856939,40.7876540915578,40.7876628511852,40.7876708994197,40.7876780190586,40.78768401796,40.7876887342275,40.7876920405804,40.7876938477878,40.7876941070777,40.7876928114524,40.7876899958776,40.7877012650506,40.7877406633472,40.7877408454555,40.7877415317101,40.7877479774383,40.787760244018,40.7877636317717,40.7877747077918,40.7877785363976,40.7877800112108,40.7877779701303,40.7877744366748,40.7877693420802,40.7877443942782,40.7877383573417,40.7877332970451,40.7877322639257,40.7877332993578,40.7877361785098,40.7877401363158,40.7877452411208,40.7877470363194,40.7877478326466,40.787747770894,40.7877467625796,40.7877391812691,40.787738585524,40.7877391174959,40.7877496234577,40.7877642541169,40.7877735914002,40.7877988908432,40.7878148065272,40.7878261122989,40.7878414804763,40.7878516000105,40.7878626478783,40.7878754419326,40.7878902230359,40.7879552694068,40.7880216484108,40.788040223036,40.7880636401194,40.7881256745966,40.7881798029866,40.7882007950567,40.78821137174,40.7883425559736,40.7883443198081,40.7883466700547,40.7883518368267,40.7883565481552,40.7883584792453,40.7883582035134,40.788354361055,40.7883537164766,40.7883585027618,40.7883582918015,40.7883559182099,40.7883530671375,40.7883421193779,40.7883386501492,40.7883268654901,40.788317567238,40.7883145244578,40.7883134195514,40.7883135904509,40.7883153364687,40.7883201287631,40.7883277705762,40.7883414289246,40.7883528560614,40.7883661828541,40.7883812533475,40.7883979524285,40.7884179836344,40.7884419403596,40.7884702736739,40.7885052109386,40.7885458079073,40.7885712545172,40.7885838077019,40.7885958718753,40.7886076265757,40.788619154726,40.7886424406296,40.7886791650702,40.7886916255109,40.7886996843287,40.7887130458246,40.7888025727664,40.788841633481,40.788955872243,40.7890140184268,40.7890363746053,40.7890569444254,40.7891001932848,40.7891192585846,40.7891978495561,40.7892508270213,40.7892933054345,40.7893112160053,40.7893476708363,40.7893636640657,40.7894326424126,40.7894490307779,40.7894844723069,40.789500662973,40.7895444735531,40.7895964949524,40.789669701203,40.7897613922474,40.789839561727,40.7898602595823,40.7898630841415,40.7898742202651,40.7899056090383,40.7899715681131,40.7900676017097,40.7901438739899,40.7901826438907,40.7902092631364,40.7902350585008,40.7902519232989,40.7902589753197,40.7902650106149,40.7902700630987,40.7902741788143,40.7902765226143,40.7902824409385,40.7902877220713,40.7904127194676,40.7904523273892,40.7905214314555,40.7905500358302,40.7906429548221,40.7906768141644,40.7907062924061,40.7907300418345,40.7907391966593,40.7907580336076,40.7907680508078,40.7908062321866,40.7908221208975,40.7908378437132,40.7908801362715,40.7909624692666,40.7909804673935,40.7909949843917,40.7910106020699,40.7910169207815,40.7910272026103,40.7910446716385,40.7910546453516,40.7910658077818,40.7910781619277,40.7910917047769,40.7911064206104,40.7911223175911,40.7911577175786,40.7911894064415,40.7912222992785,40.791255795028,40.791288990017,40.7913324371743,40.791374021321,40.7914138230817,40.7914518894217,40.791504695552,40.7915337855143,40.7915629676357,40.7915888437369,40.7916568213596,40.7917334591462,40.7918130109537,40.7918373960324,40.7918585827567,40.7919704847854,40.7920223256694,40.7920518097362,40.7921446096513,40.7922277032182,40.792269110706,40.7922937728053,40.7923056536358,40.7923174431689,40.7923209480197,40.7923357789069,40.7923452100119,40.7923570638797,40.7923805338499,40.7924212740071,40.7924623998931,40.7924791912423,40.792494576789,40.7926410359781,40.7927520959118,40.7927708176801,40.7928117594108,40.7928294911268,40.7928646270355,40.7929208166977,40.7930242496179,40.7930981827107,40.7931452525336,40.7932072949071,40.7933359306464,40.7934537228789,40.7935954061873,40.7937199835051,40.7938404968421,40.7939353745886,40.7939620361281,40.7940183940818,40.7941078285374,40.7941388568118,40.7941433773621,40.7941831141106,40.7942205813618,40.794263553964,40.7943152285713,40.7943552604912,40.7943892473268,40.7944749702777,40.7945422928064,40.7946134426322,40.7947501559246,40.7948750902792,40.7949197124436,40.7949448542448,40.7949356383685,40.794921584004,40.7948935654752,40.7947900575559,40.7946749747057,40.7946097588211,40.7945453656644,40.7945125465837,40.7944464925885,40.7943631810886,40.7943097895453,40.7942866563134,40.7942369078767,40.7941425580734,40.7940865310779,40.794025918326,40.7939832182086,40.7939241220337,40.7938579483241,40.7938096113682,40.7937752170512,40.7937372727052,40.7936776621959,40.7936430661054,40.7936009112341,40.7935444852096,40.7934956948206,40.7934656957081,40.7934186008034,40.7933714995663,40.793366160022,40.7933627058054,40.7933626102986,40.7933936118035,40.7934106970552,40.7934353871783,40.7934686357805,40.7935016856584,40.793591099023,40.7936548825396,40.7936682835136,40.7938049149536,40.7939248437994,40.7941453844808,40.7943380851379,40.7944084774066,40.7945421022253,40.7945797434827,40.7946173760442,40.794700915277,40.7949052303921,40.7950274880249,40.7951340416913,40.7952291665776,40.7952873147896,40.7954164812899,40.7954950602184,40.7955646214925,40.7956318413205,40.7957001884428,40.7957535136949,40.7957846954682,40.7958258147621,40.7958612647809,40.7959003503074,40.7959350617996,40.7959795421146,40.7959928896873,40.7960014793448,40.7960272349111,40.7960618337927,40.7961016793411,40.7961415161359,40.7961640887608,40.7961630954373,40.7960953012324,40.7960405418083,40.7960206501275,40.7960182462148,40.7960364754668,40.7960371406902,40.796038345425,40.7960208961932,40.7959921834845,40.7959010204484,40.7958547832608,40.7958161924222,40.7957730473326,40.7956537920135,40.7955551768003,40.7954493863021,40.7954033132889,40.7953295785435,40.7952686434177,40.7952055964521,40.7951115949874,40.7950991978634,40.7950594299096,40.7949572448069,40.7949115498753,40.7948817901689,40.7948703415296,40.7948769850736,40.7948750608418,40.7948693062064,40.7948753627733,40.7948773563773,40.7948823536506,40.7949139440105,40.7949484490879,40.7949849186198,40.7950213869604,40.7950690501908,40.7952343537995,40.7953460986688,40.7954725292437,40.7955009339915,40.7954766038033,40.7954338725297,40.795386787331,40.79526369124,40.7952147395144,40.7951911498972,40.7951827854082,40.795198875175,40.7952134016718,40.7953927788397,40.7961743926851,40.7961929035958,40.7954182224131,40.7955849689374,40.7969036861841,40.796922229072,40.7956129401637,40.7956370563647,40.795638683134,40.7956403110508,40.7956217937382,40.7955440423641,40.7954226065058,40.7952351385212,40.7951837711614,40.7951372996179,40.7951469514577,40.7951729435774,40.7952725142188,40.795529810553,40.7957073377287,40.7958312820762,40.7959683836091,40.7959997878801,40.7960350947157,40.7960972419744,40.7961422695915,40.7961719767958,40.796201242151,40.7962196693301,40.7968068037132,40.7968791878362,40.7976375132454,40.7976486295221,40.7976784372588,40.7978853064483,40.797844314354,40.7983421471381,40.7983756711534,40.7985089706841,40.7984419086133,40.798304872076,40.7977772664477,40.7976111513116,40.7975888584322,40.7969056418923,40.7970524765783,40.7967867588929,40.7967552588095,40.7942635242478,40.7942195856369,40.7941113844932,40.7940236995242,40.7939034619706,40.7938510984263,40.7937989224516,40.7936955500412,40.7930667981122,40.7925163755387,40.7923243621429,40.7920825505518,40.7918833361863,40.7917627670009,40.7916874911644,40.7916272228539,40.7915871742873,40.7915546200463,40.7915372195209,40.7915077311203,40.7914927024973,40.7914741650158,40.7914552174065,40.7914381313692,40.7913927856811,40.7911833296721,40.7910277512074,40.7910191446822,40.7910121295992,40.7910044250841,40.7909877330138,40.790986990829,40.7909672880357,40.7909572733806,40.7909466312029,40.7909002191577,40.7908888440096,40.790878303229,40.7908525585119,40.7908313562768,40.7908126724666,40.7908042298948,40.7907963322975,40.7907948205895,40.7907933795114,40.7907906440359,40.7907881153867,40.7907857390111,40.790782015015,40.7907745033427,40.7907702696939,40.7907680018807,40.7907655886923,40.7907629913001,40.7907616200489,40.790760193642,40.7907259999499,40.7906931359785,40.7906480491706,40.790611082348,40.7905919797049,40.7905505540257,40.7905323191937,40.7905243984534,40.7905156114012,40.7904857619449,40.7904751756337,40.7904656106005,40.7904616607255,40.7904581350507,40.7904879771789,40.7904969051698,40.7904733439796,40.7904699063598,40.7904337722765,40.7904293496586,40.7904089201215,40.7903984321205,40.7904361320694,40.7904344979218,40.7904016496895,40.7903652718936,40.7903585990744,40.790329213628,40.7903205911565,40.7903114196671,40.7903016031022,40.7902909683901,40.7902701105019,40.7902136099767,40.7901969180668,40.7901821212049,40.7901697682851,40.7901027777262,40.7900721756343,40.7900038366834,40.7899678015552,40.7899242871322,40.7899121529087,40.7899029136292,40.7898924798109,40.7898524231538,40.7898361731723,40.7898276176456,40.7898198989449,40.7898128523576,40.7898064081605,40.7898018805973,40.7897974691165,40.7897945649832,40.789784902337,40.7897799390664,40.7897383697499,40.7897305954614,40.7897218868489,40.7897012915246,40.7896776394661,40.7896347656684,40.7896199205454,40.7896033775379,40.7895998261337,40.789584629851,40.7895388538312,40.7895283586535,40.7895106816189,40.7894950267289,40.7894906933349,40.7894863857555,40.7894820587286,40.7894776305858,40.789452732624,40.789444092426,40.7894398832841,40.789435710496,40.7894315381581,40.789427313819,40.7893955043588,40.7893639619274,40.7893484758498,40.7893331800396,40.7893036021802,40.7892038906392,40.7891687971141,40.7891602710237,40.7891039286292,40.7890636647658,40.7890189130523,40.789012960759,40.7890110520147,40.7890103760698,40.789009872422,40.7890097010791,40.7890096284733,40.7890095659032,40.7890095207727,40.7890094751048,40.7890094487026,40.7890094392384,40.7890094297553,40.7890094390368,40.7890094570122,40.7890094925951,40.7890095281605,40.7890095829923,40.7890097259752,40.7890101492616,40.7890107519158,40.7890125060032,40.7890392349159,40.7891022119487,40.789245540709,40.7893012350331,40.7893738579389,40.7893824640929,40.7893914410781,40.7894108754482,40.7894321899102,40.7894760661054,40.7894948763895,40.7895146554894,40.7895323762479,40.7895370570781,40.789541565827,40.7895459020083,40.789550019907,40.7895539307637,40.789557587735,40.7895640330144,40.7895692575746,40.7895727058168,40.7895741096988,40.7895739968566,40.7895733359232,40.7895676955481,40.7895578458149,40.7895461723474,40.7895167139114,40.7895045219314,40.7894964138152,40.7894920903487,40.7894878361173,40.7894809666191,40.7894769752289,40.7894738950618,40.7894618763641,40.7894601786897,40.7894606793847,40.7894649099217,40.7894726309308,40.7894819935521,40.7895067775186,40.7895173977004,40.7895419267815,40.7895626562645,40.7895704025412,40.7895750618621,40.7895765695558,40.7895749175684,40.7895726709811,40.7895687318914,40.7895632633592,40.78955645587,40.7895485435499,40.7895396182709,40.7895297778033,40.7895245480567,40.7895191218109,40.7894944457748,40.789467323243,40.7894373018933,40.7894028071528,40.7893930704165,40.7893820648424,40.7893331591739,40.7893210989204,40.7893104136386,40.7892964002845,40.7892830303298,40.7892702858001,40.7892581035027,40.7892465830462,40.7892354180576,40.7892244538512,40.7892127427169,40.7892001718458,40.789189323718,40.7891799988435,40.7891756575894,40.7891717446899,40.789155676374,40.7891427409931,40.7891393150272,40.7891389201822,40.7891274759955,40.7891158515245,40.7891096669679,40.7891058171757,40.7891001055345,40.7890926171273,40.7890799571479,40.7890733609397,40.7890661365515,40.7890472527871,40.7890402333683,40.789033297172,40.7890147407899,40.7889946301841,40.7889667164861,40.7889393565653,40.7889194070805,40.7889107676648,40.788902643937,40.7888350452047,40.7887734727541,40.7887388505966,40.7887258587175,40.7887144413172,40.7886619097705,40.7886016047977,40.7885837963545,40.7885602897998,40.7885472543206,40.7885370391768,40.788528894613,40.7885226779909,40.7885171690437,40.788512638504,40.7885090415024,40.7885062601313,40.7885011037913,40.7884968047721,40.7884916542611,40.7884855299223,40.7884695833259,40.7884632432505,40.78845948417,40.7884575175306,40.7884570983135,40.7884582011377,40.7884607903143,40.7884647848294,40.7884730727962,40.7884950098003,40.7885124146259,40.7885237395001,40.788526022512,40.7885277657402,40.7885297167285,40.7885296829038,40.788527676001,40.788525207069,40.7885174257998,40.7885152791057,40.7885143613674,40.788514855148,40.7885148757639,40.7885157011463,40.7885181142032,40.7885199653959,40.7885222861663,40.7885262597179,40.7885315928645,40.7885528569813,40.7885603920656,40.788577145438,40.7885813166635,40.7885842384108,40.7885858290144,40.7885868322485,40.7885885441614,40.7885958865843,40.7886038966672,40.7886095496034,40.7886164038494,40.7886244771295,40.7886337587207,40.7886647414551,40.7886987959711,40.7887143889003,40.7887272300497,40.7887315375748,40.7887388067533,40.7887422812427,40.7887500836638,40.7887590504147,40.7887720384188,40.7887876670013,40.7887974850335,40.7888194835839,40.7888285654378,40.788893858384,40.7889195359881,40.7889388884259,40.7889629425079,40.788991697183,40.7890583724827,40.7891077420572,40.789145695126,40.7891776215153,40.7891921252012,40.7892083878162,40.7892155190687,40.7892222695243,40.7892285938699,40.7892344025369,40.789243471813,40.7892516507821,40.7892564344472,40.789259370634,40.7892601312027,40.7892598471141,40.7892561486008,40.7892537540507,40.7892502063814,40.789239634972,40.7892230142825,40.7892044825516,40.7891966716302,40.7891881877258,40.7891791920547,40.7891698821525,40.7891705107698,40.7891712657704,40.7891731881408,40.7891755897658,40.7891783514885,40.7891813565486,40.7891844349964,40.789187433614,40.7891902168771,40.7891916230055,40.7891929293991,40.7892081830342,40.7892216935229,40.7892327841852,40.7892373071763,40.789241102134,40.789271629249,40.7892796458089,40.7893060201033,40.7893087523728,40.7893111181742,40.7893160805797,40.7893245733004,40.7893321409708,40.7893432690681,40.7893534659813,40.7893583488628,40.7893633301516,40.7893786290476,40.7893952772349,40.7894147721322,40.7894329016443,40.7894504768215,40.7894687516419,40.78948843565,40.789504855641,40.789512437144,40.7895329018442,40.7895368097755,40.7895611494737,40.7895818108823,40.7896061093056,40.7896405834491,40.7896832691773,40.7896968480665,40.7897678518196,40.7898191342405,40.7898420915545,40.7898941633425,40.7899618174896,40.7899819419177,40.7900332448532,40.7900434400634,40.7900544598549,40.7900809167541,40.7901112589578,40.7901400043185,40.7901996934345,40.7902425073936,40.7902711919094,40.7902749617456,40.7903322581006,40.7904000058992,40.79041409217,40.7904602378586,40.790489188048,40.7905255301926,40.7905647007998,40.7906020861226,40.7906397834136,40.7906729845925,40.7907521131649,40.7908195349017,40.7908560882048,40.790859302769,40.7908791240621,40.7909039908807,40.7909558617997,40.7909826674085,40.7909882016103,40.7910061062816,40.7910319856811,40.7910698479439,40.7911025911598,40.7911260307549,40.7911863809625,40.7912215329647,40.7912430928392,40.7912979170084,40.7913572381043,40.7913689446621,40.7913806753732,40.7913926980327,40.7914070368904,40.7914342890164,40.7914546478222,40.7914942451025,40.7915329687798,40.791554098882,40.7915678652264,40.79157601669,40.7915958172113,40.7916244040189,40.7916419976364,40.7916502145486,40.7916558544669,40.7916579233204,40.7916559781076,40.7916507931246,40.7916440753189,40.7916304601576,40.7916209333094,40.7915970833747,40.7915959270037,40.7915705286389,40.7915598702818,40.7915526437225,40.7915504987699,40.7915495763973,40.7915498573733,40.7915514480657,40.7915565497871,40.7915635083495,40.7915878519821,40.7916177224087,40.7916310086012,40.7916542022209,40.7917153699128,40.7917555240344,40.7917768279976,40.7918276613294,40.7918732926752,40.7918843295234,40.7918985284842,40.7919161612314,40.7919395009458,40.7920140188104,40.7920710926641,40.7921242116801,40.7922026565185,40.7922868546113,40.792353130464,40.7924942361753,40.7925336706635,40.7929309066725,40.7930022876791,40.7925972864188,40.7925522975458,40.7925879798131,40.7927385281976,40.7927466063202,40.7927552600028,40.7927780163369,40.7927978948717,40.7928002315742,40.7928321983638,40.7928935928908,40.7929744250619,40.792975450948,40.793295389702,40.7933603766324,40.7933920715531,40.7934207904286,40.7934979275818,40.7935739956814,40.7936591510975,40.7937055369979,40.7937384997958,40.7938319609771,40.79389588653,40.7939282382229,40.7939797201671,40.794013329539,40.7940370975774,40.794056467828,40.7940821641805,40.7941518101459,40.7942205436928,40.79424771288,40.794320580512,40.794338895682,40.79434539841,40.7943511909803,40.7943664350018,40.7943759884469,40.7944012357006,40.7944259908969,40.7944678938515,40.7944950824909,40.7945097036748,40.7945250968455,40.7945405141435,40.7945559107558,40.794590075621,40.7946320151909,40.7946733759828,40.7947102837887,40.7947499779853,40.7947852009929,40.7947943704103,40.7948012446704,40.7948068691226,40.7948092222351,40.7948112881149,40.7948125876547,40.7948137075846,40.7948146391739,40.7948395207714,40.7948763113577,40.7948816591324,40.7948848331576,40.794888377715,40.7948922376072,40.7948963239321,40.7949048403774,40.7949090549281,40.7949130991709,40.79493240877,40.7949515242925,40.7949888095511,40.7950247332572,40.7950336356533,40.795044119891,40.7950497697134,40.7950613203545,40.7950644434948,40.7950675654511,40.7950806055523,40.7950996653981,40.7951341718389,40.7951495835963,40.7951624696138,40.7952046193068,40.7952395792921,40.7952895802148,40.7952909500502,40.7952981847181,40.7953628845531,40.7953808532513,40.7954410407666,40.7954492301356,40.795476450644,40.7954810819608,40.7955153066166,40.7955413554798,40.7955778109591,40.7955958740747,40.7955960828837,40.795613368289,40.7956380479194,40.7956481604402,40.7956570488129,40.7956644804868,40.7956702920377,40.7956801982065,40.7956828170702,40.7956843456376,40.7956854527677,40.7956848536338,40.7956842645603,40.7956832719984,40.7956778605428,40.7956769849748,40.7956765963562,40.7956765980832,40.7956766712102,40.7956770716356,40.7956777860716,40.7956787981818,40.795680116527,40.7956816958841,40.7956834996445,40.795685042307,40.7956854298517,40.7956913618401,40.7956979044375,40.7957049238224,40.7957121834917,40.7957289427782,40.7957490999816,40.7957572912853,40.7957820149089,40.7958072504737,40.7958175708626,40.7958268939663,40.7958347240356,40.795843105701,40.795866778087,40.7958950213628,40.7959125045928,40.7959190710148,40.7959214887306,40.7959232954068,40.7959244708857,40.7959248239001,40.7959250242307,40.795925062476,40.7959249470323,40.7959246695025,40.7959242392877,40.7959230723944,40.7959215173628,40.7959144617545,40.7959134107017,40.7959125390484,40.7959059425478,40.7959014697983,40.7959012470055,40.7959011306426,40.7959011324572,40.7959012430458,40.7959014612398,40.795901796382,40.7959027819041,40.7959042176548,40.7959060226898,40.795908115701,40.7959103330855,40.7959179239474,40.795926312793,40.7959353403533,40.7959447430224,40.7959510922755,40.795957862361,40.7959733725335,40.7960218881434,40.7960501059762,40.7960605135799,40.7960699695953,40.796076059112,40.7960825000051,40.7960971794118,40.7961409686457,40.7961785674522,40.7961811992583,40.7961837684011,40.7961885654197,40.7961926898928,40.7961944323696,40.7961959225614,40.7961994022571,40.7962015739794,40.7962027638297,40.7962030861097,40.7961963807478,40.7961954077164,40.7962015344996,40.7962061094235,40.796212695765,40.7962233196144,40.7962324295407,40.7962410319261,40.7962501388919,40.796262769733,40.7962829695014,40.7962971149104,40.7963178246856,40.7963314527096,40.7963435670021,40.7963688002937,40.7963859543328,40.7964130861918,40.796447324875,40.7966589605576,40.7966241157381,40.7965570361419,40.7962344002831,40.7962133347325,40.7960834717906,40.796135491225,40.7961531977153,40.7961670275782,40.7961762084853,40.7961524960761,40.7961524705822,40.7961865730344,40.7962056268936,40.7962247305741,40.7962358887113,40.7962121836578,40.7962128044846,40.7962462549905,40.7962613629018,40.7962863879073,40.7962962238925,40.7962731729633,40.7962737988795,40.7963052778375,40.7963216999809,40.7963454120549,40.7963559077844,40.7963315341766,40.7963341352735,40.7963669241161,40.796382035355,40.7964083757481,40.7964162385763,40.7963931842793,40.7963938114484,40.7964259501288,40.7964417139018,40.7964667351482,40.7964759179134,40.7964522052852,40.7964541460061,40.7964882504251,40.7965033660037,40.7965264131829,40.7965369165588,40.7965118832921,40.7965125122227,40.7965472718786,40.7965574383978,40.7965860918575,40.7965985609888,40.7965709072968,40.7965728448342,40.7966416773831,40.7966679400952,40.7966897143297,40.7968325629782,40.7968306228491,40.7967906270947,40.7967742030716,40.7967300927569,40.7967163253761,40.7967624032192,40.7967611169492,40.7967211199935,40.796707985394,40.7966599304505,40.7966481274406,40.7966935505924,40.7966935760943,40.7966548971664,40.7966371600907,40.7965917426835,40.7965805929718,40.7966253602179,40.7966240790242,40.7965853924174,40.796570943587,40.7965614538987,40.7965235459391,40.7965117473414,40.7965532141586,40.7965545692591,40.7965185130658,40.7965020889506,40.7964540366968,40.7964461848062,40.7964915982962,40.796490971057,40.7964516310196,40.7964358698009,40.7963897904002,40.7963760164304,40.796422091502,40.7964214693413,40.7963827834226,40.7963676772933,40.796318968005,40.7963098005842,40.796355217036,40.796355246301,40.7963132783136,40.7963007971953,40.7962547260251,40.7962422606771,40.7963949704071,40.7964034834863,40.7963317348935,40.796331709461,40.796402518474,40.7964215622384,40.7964959471146,40.7965051215259,40.7964300770606,40.796430709412,40.7965067691,40.7965199062475,40.796563449367,40.7965936404006,40.7966047799653,40.7965630860071,40.7965297392029,40.796533650264,40.796562227108,40.7966044654833,40.796622201283,40.7966939608685,40.7967057594933,40.7966340024399,40.7966339756815,40.7967093805579,40.7967244854143,40.7967942780775,40.7968041097503,40.7967356306351,40.7967356076837,40.796811014427,40.7968274321735,40.7969005057141,40.7969123106824,40.7968418656942,40.7968405181879,40.7968713388268,40.7968351206682,40.7968292224952,40.7967108964971,40.7964625076552,40.796508668745,40.7965219404778,40.7965289123122,40.7965293919253,40.796523366087,40.7965110010237,40.7964926378338,40.7964755754441,40.7965312143566,40.7965813653352,40.796625641075,40.7966636996436,40.7966952471217,40.7967200398739,40.7967378864299,40.7967486489636,40.7967063535991,40.7967061128356,40.7967078010353,40.7967097391838,40.7967148710052,40.7967171320665,40.796720433759,40.7967262621377,40.7967319375176,40.7967387301751,40.7967430963892,40.7967486749712,40.796758574145,40.7967809113614,40.7967972835165,40.79680220172,40.7968103651541,40.7968229533289,40.796837762752,40.7968471358761,40.7968555492327,40.7968664899154,40.7968793008641,40.7968923965129,40.7969020650773,40.7969150808727,40.7969277142277,40.796930043239,40.7969352806251,40.7969381401178,40.7969395539711,40.7969403432487,40.7969437828126,40.7969446089193,40.7969408746379,40.7969339820252,40.7969223872093,40.7969090967664,40.7968994984793,40.796898186813,40.796899817176,40.7969049018308,40.7969110689058,40.7969203686349,40.7969298900002,40.7969400477883,40.7969493485413,40.7969604494146,40.7969747446412,40.7969878147786,40.7970034968981,40.7970185714405,40.7970380361664,40.7970585789541,40.7970814394785,40.7970932312075,40.7971050048499,40.7971127612935,40.7971150022303,40.7971282776896,40.7971408202955,40.7971526532934,40.7971655762132,40.7971751874636,40.7971868628477,40.7972013042058,40.7972127811782,40.7972260945164,40.7972469936374,40.797258110602,40.79727052779,40.7972863336283,40.7973014026144,40.7973086724716,40.7973154076509,40.7973271566352,40.7973405681258,40.7973554637375,40.7973699780709,40.7973836859279,40.7973992846971,40.7974163443515,40.7974345542502,40.7974520054338,40.7974694741584,40.7974861549687,40.7974971136947,40.7975089816943,40.7975211980775,40.797539121631,40.7975557523341,40.7975716159974,40.7975852250426,40.7975981134245,40.7976095256729,40.7976222013163,40.7976320914989,40.7976452450015,40.7976637375865,40.7976738187706,40.7976849401704,40.7976983483731,40.7977007812227,40.7977042020472,40.7977144609935,40.7977184569144,40.7977381464797,40.7977495288125,40.7977548747524,40.7977594081695,40.7977637075605,40.7977642173908,40.7977678686176,40.7977688446448,40.7977732772519,40.7977780180345,40.7977824406557,40.7977869191786,40.7977917723791,40.797796245453,40.7977980469567,40.7977974665872,40.7977947490138,40.7977910647206,40.7977872270874,40.7977806891301,40.7977505285184,40.7977144568403,40.7976762876002,40.7976391426423,40.7976103143955,40.7975352801308,40.797518675991,40.7974839880151,40.7974521361705,40.7974384718839,40.797414212542,40.7973958201996,40.7973758307214,40.7973640466572,40.7973311146629,40.7973182106637,40.7973017170903,40.7972895023732,40.7972714344658,40.7972683700645,40.7972662503716,40.7972642555479,40.7972642763115,40.7972647823826,40.7972664803288,40.7972687856255,40.797272307581,40.7972828226062,40.7972924686648,40.7972989221231,40.7973025553039,40.797307197305,40.7973132285219,40.797316349296,40.7973107494062,40.797308950204,40.7973092653798,40.7972975567979,40.7972889210997,40.7972902969168,40.7972985493968,40.7973115011964,40.7973230461838,40.7973389651337,40.7973414467692,40.7973524681486,40.797359039516,40.7973692443067,40.7973757765682,40.7973848072342,40.7973971029044,40.7974062120218,40.7974174970059,40.7974291149608,40.7974407229916,40.7974514575522,40.7974609862996,40.7974710559181,40.7974832785052,40.7974945010728,40.797519008811,40.7975324577201,40.7975451361903,40.7975563151075,40.797566144378,40.797575291342,40.7975838881537,40.7975908674732,40.7975985677353,40.7976085312147,40.7976200334416,40.7976296038452,40.7976394090763,40.7976506613902,40.7976593679631,40.7976674656881,40.7976747109491,40.7976809908369,40.797693083013,40.7977054959152,40.7977181840314,40.7977249475287,40.7977314759807,40.7977385450935,40.7977456298744,40.7977537499731,40.7977614680533,40.7977768084465,40.7977841840534,40.7977918230004,40.7977991986159,40.7978015035636,40.7978060235871,40.7978117920683,40.7978208860318,40.7978294319902,40.7978387136516,40.7978493767512,40.7978555850966,40.7978623589635,40.7978688768663,40.797876388077,40.7978846508149,40.7978936397784,40.7979027099477,40.7979116765168,40.797920052207,40.7979277295078,40.7979345214076,40.7979407637219,40.7979440876544,40.7979501358625,40.7979615950126,40.7979739264029,40.7979933521978,40.7980096282737,40.7980582804202,40.7980746799906,40.798088171366,40.7981014654238,40.7981139811045,40.7981304363929,40.7981435952198,40.7981560028611,40.7981712917511,40.7982481275856,40.7982575890033,40.7982257574227,40.7982273640816,40.7986952373906,40.7987059694831,40.7982323826432,40.7982360698484,40.7982377578373,40.7982292725163,40.7982283529336,40.7982136873923,40.7982029177453,40.7981903095152,40.7981806673343,40.7981693485306,40.7981573885986,40.7981541351047,40.7981578456399,40.7981641307469,40.7981692943562,40.7981750319645,40.7981819530992,40.7981917112237,40.7981979482414,40.7982036905386,40.7982098733859,40.7982212486548,40.7982269929521,40.798232021016,40.798241711299,40.7982516316533,40.7982643900624,40.7982806388109,40.7982969949873,40.7983037327077,40.7983138420314,40.7983248291855,40.798338015134,40.7983490043875,40.7983629634207,40.7983769164523,40.7983879500603,40.7983899408036,40.7984016488759,40.7984107372477,40.7984232160979,40.7984381740251,40.7984388188324,40.798439200074,40.7984348284849,40.7984236389726,40.7984122841613,40.7984042252438,40.7984020386938,40.7984065144079,40.7988808286788,40.7988992413604,40.798417814296,40.7984333532035,40.798441832212,40.7984468201208,40.7984508603382,40.7984475165708,40.7984411542024,40.7984379464979,40.7984394645672,40.7984448200275,40.7984525420747,40.7984560648775,40.7984695361684,40.7984784968641,40.798485975987,40.7985002810908,40.7985112740179,40.7985193946269,40.7985311661874,40.7985447352149,40.7985608956554,40.7985695488316,40.7985773026229,40.7985835187838,40.7985933184414,40.7986024693497,40.7986131037729,40.7986238395195,40.7986364482758,40.7986515080311,40.7986672761986,40.7986726644238,40.7986802356531,40.7986884543933,40.798691018065,40.7986888647119,40.7986832983629,40.7989628661206,40.7989751635981,40.79866039655,40.7986518078731,40.7986462983818,40.798642289724,40.7986489233433,40.7986601164022,40.7986652596218,40.7986763214205,40.7986935895444,40.7987074707178,40.79872201739,40.7987384478854,40.7987481483266,40.798757848471,40.7987679092016,40.7987790663779,40.7987898629835,40.7987995622555,40.7988089534455,40.7988168132536,40.7988241247944,40.7988315693956,40.7988390419929,40.7988470360912,40.798854178413,40.7988658426489,40.7988786211934,40.7988931893145,40.7989018424758,40.7989115136531,40.7989201176003,40.7989279834924,40.7989437089598,40.798957277373,40.7993397832258,40.7993528298176,40.7989877356893,40.7990044058192,40.7990111678741,40.7990283857667,40.7990463039587,40.7990549069012,40.7990631223757,40.799072085143,40.7990889137537,40.7994861352365,40.7994950258741,40.7991128915737,40.7991638792443,40.7992160495453,40.7992236739993,40.7993017640174,40.7993546021811,40.7994083538574,40.7994792423947,40.7995129099436,40.7995439153402,40.7996376134367,40.7997283629062,40.7997509848059,40.799783285238,40.7998554049575,40.7999250172011,40.7999919876928,40.8000615245527,40.8001345654076,40.8002109748732,40.8002906113208,40.8003442821941,40.8003992236636,40.8004408058262,40.8004781094891,40.800510721606,40.8005382810775,40.8005604827495,40.800577080792,40.8005878914219,40.8005907757621,40.8005928326834,40.8005947071777,40.8005984680678,40.8006023383494,40.8006065609584,40.8006107535474,40.8006149464523,40.8006190509257,40.8006234691573,40.8006278644212,40.8010060238682,40.801011467819,40.8006395002925,40.8006452054087,40.8006536290276,40.8006623320353,40.8006708073441,40.80067721151,40.8006828474995,40.8006889639165,40.8006972562558,40.8007069688562,40.8007139524393,40.8007210779971,40.8007270682377,40.8007333310458,40.8007394764362,40.800744900629,40.8007511430968,40.8007612549849,40.8007711472133,40.8007831382753,40.8007984729049,40.8008055595887,40.8008033925649,40.8007998984993,40.8007968385474,40.8007909894653,40.8007858527641,40.8007950148335,40.8007982387664,40.8007956224153,40.8007951310793,40.8008000317917,40.8008018386559,40.800801504342,40.8007966195717,40.8007881075361,40.8007792073962,40.8007701257147,40.8007603533125,40.800752061192,40.8007436590975,40.8007363905628,40.8007311920203,40.8007280970468,40.800727605141,40.8007280552494,40.8007290212323,40.8007300377512,40.8007319254089,40.8007330923416,40.8007329810196,40.800729593135,40.8007262906626,40.8007226344399,40.8007187489321,40.8007138670181,40.8007074350547,40.8006936676359,40.8006815168958,40.8006760278205,40.8006687752638,40.8006650061512,40.8006619287978,40.8006577112871,40.8006528560771,40.8006465214803,40.8006394281744,40.800630899893,40.8006263803061,40.8006221128572,40.8006165018275,40.8006118258604,40.8006075906747,40.8005997395565,40.8005939109059,40.8005883589474,40.8005828320555,40.8005745415417,40.8005662663018,40.8005577841339,40.8005494323204,40.8005367296526,40.8005148960784,40.8004988376908,40.800489707842,40.8004801617524,40.8004699038679,40.8004596448109,40.8004493593939,40.8004372343164,40.8004251108561,40.8004111466899,40.8003982448718,40.8003857601495,40.8003732777502,40.8003615152604,40.8003497713835,40.8003399017859,40.8003303942833,40.800321616572,40.8003124598074,40.800302451271,40.8002919372752,40.8002820634058,40.8002745748032,40.8002668422259,40.800258683778,40.8002486683564,40.8002270103581,40.8002150428586,40.8002047517953,40.8001936713773,40.8001841526102,40.800176401245,40.8001683703009,40.8001569867948,40.8001441178272,40.8001297659028,40.8001168996411,40.8001066148654,40.8000982246856,40.8000926528636,40.8000806072077,40.800067155885,40.8000524367738,40.8000368685273,40.8000230868408,40.8000080428134,40.7999996515379,40.7999915118318,40.799983761471,40.7999683557817,40.7999596916722,40.7999503329289,40.7999310028872,40.7999209580858,40.7999121848862,40.7999030747843,40.799894650829,40.7998866967115,40.7998794117087,40.7998712070501,40.7998559694553,40.799847438318,40.7998394853649,40.7998311704803,40.7998225032653,40.7998140546588,40.7998046774972,40.7997945868954,40.7997829712809,40.7997742503374,40.7997651953252,40.7997563401005,40.7997471784729,40.7997376548569,40.7997283303476,40.7997177059865,40.7997071185531,40.7996977934796,40.7996806760747,40.7996727219218,40.799664771277,40.7996568997711,40.7996476041317,40.7996385515699,40.7996310444096,40.799617346212,40.7996020263495,40.7995879442435,40.7995799390261,40.7995714113972,40.7995612850707,40.7995521801775,40.7995437954032,40.7995354020072,40.7995270710366,40.7995188684165,40.7995093585208,40.7995017044537,40.7994918025539,40.7994822898395,40.7994706993734,40.7994543657292,40.7994442667796,40.7994343126576,40.7994242137251,40.7994079860643,40.799393627689,40.7993791906853,40.7993664181398,40.7993549154324,40.7993468784477,40.7993360668269,40.7993250367297,40.7993117036684,40.799299019785,40.7992888868213,40.7992778733734,40.7992663903801,40.7992608222578,40.7992545159733,40.7992486247569,40.799242263943,40.7992367518628,40.7992275773037,40.7992194544773,40.7992131984622,40.7992072801555,40.7991059404918,40.7994278391008,40.7994130140791,40.7991004035915,40.7990674021695,40.7993585560164,40.7993459788652,40.7990623655235,40.7990103275249,40.7987854284541,40.7987667333926,40.7987356969783,40.7986767044841,40.7986080717983,40.7990361582586,40.7990231625573,40.7985950092196,40.7985715587525,40.7985612205533,40.7985503294508,40.7985399317356,40.798532968333,40.7985253620187,40.7985186211483,40.7985127836166,40.798505257033,40.7984983725066,40.798491844034,40.7984861093734,40.7984802377157,40.7984748519642,40.7984689234913,40.7984622465737,40.7984571527694,40.7984519416533,40.7984453762167,40.7984393714312,40.798434954663,40.7984296097733,40.7984217055747,40.7984117947458,40.7984018513529,40.7983977204682,40.7983915706072,40.7983849054077,40.7983769434637,40.7983707166871,40.798364302718,40.7983583560219,40.798351959329,40.798345487659,40.798338933104,40.798332757652,40.7983276304757,40.7983221179296,40.7983143024871,40.7983076305919,40.7983005787652,40.7982927474883,40.7982859115126,40.7982787805198,40.7982711290139,40.79826553046,40.7982590748231,40.7982530967106,40.7982472525893,40.7982400017554,40.7982352913857,40.7982271171443,40.7982191041442,40.7982108066427,40.7982050432297,40.7981986755095,40.7981922017751,40.7981848111902,40.7981765461832,40.7981674766737,40.7981580194533,40.7981461010018,40.7981389098609,40.7981322795142,40.7981249270611,40.798118069883,40.7981098700907,40.7981017675952,40.7980945293765,40.7980874704829,40.7980819919458,40.7980759824299,40.7980669047112,40.7980588921757,40.7980537696434,40.7980483607379,40.7980420767964,40.7980343632471,40.7980268120528,40.7980185623952,40.798013402153,40.7980073921053,40.7980023151905,40.7979973761413,40.7979916162768,40.797982887916,40.797979855241,40.797973837232,40.7979649553493,40.7979590977686,40.7979540881288,40.7979428119441,40.797931893573,40.7979246588403,40.7979168066763,40.7979102519867,40.7979047796425,40.7979002226224,40.79789487116,40.7978842245459,40.7978802024546,40.7978729868639,40.7978661256794,40.7978593736074,40.7978525142803,40.797843535448,40.7978340181183,40.7978262789477,40.7978233602821,40.7978183816757,40.7978121271225,40.7978066662534,40.7978006877278,40.7977960529704,40.7977907509056,40.797787043479,40.7977850039486,40.7977839961477,40.797780557999,40.7977768207157,40.7977710810493,40.7977659509128,40.7977604444714,40.7977502467808,40.7977389267638,40.7977271991271,40.79771963159,40.7977119995097,40.797706190612,40.7976955615719,40.7976855845057,40.7976765591237,40.7976666278054,40.7976593011025,40.7976527436033,40.7976455867858,40.7976373742829,40.7976293849536,40.7976224967105,40.7976145384431,40.7976063162381,40.797597283421,40.7975895537179,40.7975832490384,40.7975754465399,40.7975711762729,40.7975664008293,40.7975613408038,40.7975576062452,40.7975531708164,40.797545787911,40.7975377815026,40.797529497975,40.7975180326865,40.7975064136749,40.797493861942,40.7974815020511,40.7974686064727,40.7974569973053,40.7974439304964,40.7974295158609,40.7974170111906,40.7974028265912,40.7973873299418,40.7973716342298,40.7973593235648,40.7973473921537,40.797327614679,40.7973169691255,40.7973074585474,40.7972858161778,40.797273667384,40.7972604202984,40.7972471644628,40.7972361676702,40.7972266447935,40.7972090984582,40.7971878400541,40.7971768168578,40.7971581731745,40.7971476368592,40.7971432451388,40.7971021083784,40.7970794161677,40.7976930204106,40.7976723226576,40.7973459392483,40.7970472179298,40.7970583803778,40.7970745595228,40.7971057564411,40.7971963586028,40.7972118211008,40.797177403971,40.7972920274618,40.7972791125125,40.7971687987448,40.7971677030094,40.7971684350746,40.7971690646031,40.7971706591858,40.7971725127152,40.79717543204,40.7971769984703,40.7971771424642,40.7972033908947,40.797279056443,40.7972872818129,40.7972819609745,40.7972931750437,40.7973066157503,40.7973207662203,40.7973323322138,40.7973453849535,40.7973547634205,40.7973654912641,40.797378193466,40.7973873299953,40.7973982780555,40.7974152643517,40.7974236607341,40.7974371274005,40.7974541137333,40.7974683275227,40.797483639194,40.7974978250464,40.7975123871874,40.7975258262614,40.7975415259734,40.797554039686,40.7975663843231,40.7975775837258,40.7975900976285,40.7976056261287,40.7976162749931,40.7976299119606,40.7976554771306,40.7976677988251,40.7976801397893,40.7976920749859,40.7977040376934,40.797715620532,40.7977283171322,40.7977413746001,40.7977525605183,40.7977650656939,40.7977775719712,40.7977880185479,40.7978029380739,40.7978133948986,40.7978205482768,40.7978251550331,40.7978406234021,40.7978499547934,40.7978656404162,40.7978813064079,40.7978936430504,40.7979080175413,40.7979184744063,40.7979311451997,40.7979468318825,40.797962331956,40.7979742947028,40.797987352938,40.7980002204882,40.7980114320068,40.7980235519875,40.7980347443117,40.7980470649621,40.7980591810122,40.7980748714815,40.7980824824045,40.798087011153,40.7980901118812,40.7980930234594,40.7980967348192,40.7981007357147,40.7981053413433,40.7981119257248,40.7981168097479,40.7981218322565,40.7981248219667,40.7981248954202,40.7981258041354,40.7981274156215,40.7981269468017,40.7981258279278,40.7981227595853,40.7981184855077,40.7981113433872,40.7981057193583,40.7981008687978,40.7980987481879,40.7980996762003,40.798026331252,40.7979454476399,40.7978638983258,40.7977820403465,40.7977002320891,40.7976188317214,40.7975381956243,40.7974586768314,40.7973724068804,40.797344192647,40.7973341901425,40.7973331570711,40.7973302451462,40.7973266225056,40.797323744507,40.7973215795683,40.7973181706788,40.7973150986629,40.797312219984,40.7973094753794,40.7973068410433,40.7973038712511,40.7973011456755,40.7972981188339,40.7972951598267,40.7972924915433,40.7972892339156,40.7972864435056,40.7972815710337,40.7972798151644,40.7972780606081,40.7972759486275,40.7972721003619,40.7972680528137,40.7972647751208,40.7972621594877,40.7972605783121,40.7972580963427,40.7972562050165,40.7972536479902,40.797251557777,40.7972499640184,40.7972485412257,40.7972466940818,40.7972448039657,40.7972426075398,40.797240620263,40.7972378424851,40.7972352557187,40.7972343319384,40.7972327225861,40.7972316102719,40.7972289624302,40.7972268756318,40.7972253933128,40.7972255802616,40.7972224506302,40.7972209615776,40.7972207704085,40.7972176973133,40.7972139016835,40.7972111044156,40.7972080022391,40.7972052249987,40.7972032484881,40.7971984724731,40.7971952809011,40.7971914003009,40.7971879402701,40.797184730597,40.7971809903117,40.7971761326917,40.7971737813269,40.7971707595103,40.7971686683255,40.7971670474744,40.7971638353411,40.7971584466517,40.7971522087036,40.7971468077086,40.7971386841024,40.7971302794597,40.7971238850349,40.7971192496355,40.7971160931783,40.7971109953853,40.7971064395695,40.7971027810501,40.7971006224317,40.797096441826,40.7970897494476,40.7970845416965,40.7970798447451,40.7970763090666,40.7970712872664,40.7970690433203,40.7970678064488,40.7970684148983,40.7970650590775,40.7970612682059,40.7970576464357,40.79705387488,40.7970513225824,40.797047938899,40.7970451140045,40.7970404220194,40.7970368867844,40.7970335948259,40.7970295621412,40.7970267089794,40.7970257275777,40.7970247360991,40.7970240219607,40.7970227342076,40.7970174230656,40.7970158359214,40.7970146414568,40.7970134750077,40.7970097865916,40.7970059412463,40.7970027495242,40.7969995059703,40.7969958813737,40.7969910160911,40.7969860579738,40.7969820943029,40.796979100742,40.7969762204145,40.7969705562727,40.7969660521814,40.7969619337996,40.7969588174569,40.7969526677557,40.7969449580545,40.7969382315679,40.7969315066837,40.7969238203928,40.7969158020536,40.796911365587,40.7969041425369,40.7968965665563,40.7968911181958,40.7968853815097,40.7968851047543,40.7968791509307,40.7968757136285,40.796872070443,40.7968670192847,40.796860289375,40.796855307966,40.7968488275665,40.7968416685881,40.7968345799874,40.7968291234833,40.7968224203381,40.7968169900355,40.7968127077375,40.7968072709074,40.7968034254238,40.7967988944574,40.7967959631543,40.7967960547826,40.796801659261,40.7968017838306,40.7968015932843,40.7968009895907,40.7967971813157,40.7967903500435,40.7967816164269,40.7967778889816,40.7967730557263,40.7967686913651,40.7967645178022,40.7967633984888,40.7967619353807,40.7967606243596,40.7967630332807,40.7967663834049,40.7967683367155,40.7967700926918,40.7967675503414,40.7967646112036,40.7967624039672,40.7967607233591,40.796759399718,40.7967577346576,40.7967570149201,40.796753805362,40.7967489991207,40.7967442027052,40.7967389348241,40.7967321744048,40.7967271720763,40.7967239560059,40.7967220006649,40.796720164529,40.7967198945803,40.7967203930831,40.796719402673,40.7967176497412,40.7967156242944,40.7967115507771,40.7967304414271,40.7966863375013,40.7966722152909,40.7966721782571,40.7966081706484,40.7966065925506,40.7966022495364,40.7965996675029,40.7965994513074,40.7966084371768,40.7965474877634,40.7964078541585,40.7964063034286,40.7963936059403,40.7965603362703,40.7965592933469,40.79662616655,40.7966261824799,40.7968226933324,40.7968174775829,40.7966240591093,40.7966240727667,40.7965582276634,40.7965551261951,40.7963927404361,40.7963952780836,40.796502780434,40.7965053955334,40.796505062252,40.7965000957865,40.7964900125098,40.7964748895362,40.7964633317653,40.7964607607534,40.7964341729039,40.7964129294995,40.7963725792134,40.7963266902754,40.7963044476633,40.7962869972236,40.7962753393956,40.7962304154546,40.7961827506592,40.7961708215134,40.7961685662046,40.7961681342767,40.7962283125851,40.7962449920537,40.7963397894696,40.7963355221897,40.7965060773532,40.7965074405016,40.7963368828385,40.7963373815183,40.7962519395632,40.7962262179512,40.7962251795308,40.7961639282888,40.7961596346238,40.7961592388551,40.7961607135854,40.7961636711367,40.7961636873992,40.7961651713524,40.7961680919545,40.7961707337032,40.7961739104667,40.7961794507995,40.79618441449,40.7961875764252,40.7961888666376,40.7961888903629,40.7961880039505,40.7961856541726,40.7961836427972,40.7961801729652,40.7961758848935,40.796170935987,40.7961668621053,40.7961637214574,40.7961613731479,40.7961602344117,40.7961607487963,40.7961629044818,40.7961640915676,40.7961684349114,40.7961758269478,40.7961860846087,40.7961882224755,40.7961862642878,40.796178253485,40.7961719262864,40.7961674691641,40.796362981806,40.7963650031178,40.796352655841,40.7961591959832,40.7961426875067,40.7961354578634,40.7961385181255,40.7961412135511,40.7961463423597,40.79615086465,40.7961564086317,40.7961662870947,40.7961757457245,40.7961819505285,40.7961884540596,40.7961949640347,40.7962025634672,40.7962076180378,40.7962110759925,40.7962143030893,40.7962140909928,40.7962327822798,40.7962307007495,40.7964529547914,40.7964920579981,40.7966412613285,40.7966350213082,40.7964920005073,40.7964498163874,40.7962128761601,40.7962126153062,40.796214252632,40.7962155698796,40.7962170510195,40.7962187130444,40.7962209415963,40.7962257054779,40.7962290087769,40.7965290191302,40.7965326701012,40.7966808212981,40.7966697833551,40.7965294879517,40.7965247451974,40.7962342311778,40.7962354022881,40.7962399269662,40.7962446299747,40.796248431014,40.7962516780498,40.7962562598739,40.7962584071574,40.7962621460838,40.7962673589353,40.7965283754295,40.7965276094001,40.796649389018,40.7966477801733,40.7965283991202,40.7965269179456,40.7962782559197,40.7962842713516,40.7962893422857,40.7962959851377,40.7963022932421,40.7963090427534,40.7963143126868,40.7963191275597,40.7963258546493,40.7965093401043,40.7965099247624,40.7965352572227,40.7965346596787,40.7965096856225,40.7965101481805,40.796335012841,40.7963382278933,40.7963438563831,40.7963498182124,40.7963555337943,40.7963613285861,40.7963713011477,40.796378984956,40.796385948206,40.7963924177684,40.7963983253042,40.7964060855076,40.7966051367524,40.7966072114464,40.7966323120016,40.7966309987821,40.7966040682539,40.7966040821009,40.7964208568206,40.7964291483468,40.7964337951271,40.7964395891081,40.7964451926294,40.7964518379276,40.7964579405263,40.7964645293865,40.7964697488708,40.7964711119638,40.796737515499,40.7967373140632,40.796911542686,40.7969149397281,40.7967365212011,40.7967368905426,40.7964744143103,40.796705292482,40.7967063541105,40.7969021774137,40.7969046333183,40.7970784671589,40.7970766236432,40.7969012338756,40.796706491506,40.7967087256389,40.7966116403778,40.7964095908428,40.7964049295559,40.7964002929999,40.7963967831422,40.79639253512,40.7963882857205,40.7963833878336,40.7963802916546,40.7963752475742,40.7963708283955,40.7963650277281,40.7963638215249,40.7963653936752,40.796368139504,40.7963668129547,40.7963635228903,40.7963595943296,40.7963547014824,40.7963482209296,40.796343561628,40.7963380970557,40.7963398974747,40.7963482835898,40.7963622784158,40.7963660906753,40.7963550339725,40.7963417102315,40.7963306698488,40.7963167930469,40.79630237919,40.7962954431362,40.7962938978079,40.7962921801655,40.7962898388965,40.7962871265878,40.7962838003772,40.7962797055215,40.7962756376967,40.7962727525462,40.796270452527,40.7962681133731,40.7962666276839,40.7962664826112,40.7962664028898,40.7962651381769,40.7962639495954,40.7962632602308,40.7962627311914,40.7962622088529,40.7962619593826,40.7962620389729,40.796262713688,40.7962626316676,40.7962628429866,40.7962634390819,40.7962644259028,40.7962656521953,40.7962666428712,40.796268155861,40.7962702390886,40.7962722869606,40.79627349854,40.7962754236752,40.7962796098331,40.7962824011225,40.7962855524191,40.796288098443,40.7962914980666,40.7962957328528,40.7962986684037,40.7963016303821,40.7963041855334,40.7963085510259,40.7963099687136,40.7963129016997,40.7963161418526,40.7964198068922,40.7964208571258,40.796477448021,40.7964764001181,40.796512406103,40.7965072178183,40.7963212959181,40.796323004732,40.7963263557312,40.7963301327204,40.7963322835837,40.7963339797895,40.7963340621586,40.7963335484251,40.7963353203934,40.7963372950784,40.7963397388684,40.7963434320338,40.7963462610481,40.7963497729983,40.7963523070548,40.7963560832667,40.7963596834964,40.7963634807685,40.7963667998894,40.7963711874205,40.7963733937695,40.796376851705,40.7963813000964,40.7963858310407,40.7963909373886,40.7963955467325,40.7964003998211,40.7964054823429,40.7964109222032,40.7964178892188,40.7964227843886,40.7964254211417,40.7964334442862,40.7964416861213,40.7964503560102,40.7964575775773,40.7964636753118,40.7964703670353,40.7964768779968,40.7964845205613,40.7964895509258,40.7964939676837,40.7964979986523,40.7965022192874,40.7965045807194,40.7965048407753,40.7965145435849,40.7965207258579,40.7965223745896,40.7965129584227,40.7965007839105,40.7964872638482,40.7964762245195,40.7964631267717,40.7964504191273,40.7964384526314,40.7964231043178,40.7964118788689,40.7964010044073,40.7963867734328,40.7963781424224,40.7963673840303,40.7963597631749,40.796351333319,40.7963434800101,40.7963378941425,40.7963325359084,40.7963290748715,40.7963271249859,40.7963278063124,40.7963302159738,40.7963330152807,40.7963365932914,40.7963409218599,40.7963435605256,40.7963459190695,40.79634811638,40.7963517466806,40.7963538686646,40.7963603533132,40.7963715489339,40.7963736006962,40.7963896511829,40.7964008700901,40.7964152559918,40.7964257006906,40.7964267623605,40.7964248252541,40.7964165535674,40.7964162741468,40.7964153457296,40.7964016732543,40.7963861322031,40.7963846435414,40.7963771417879,40.7963658597987,40.7963577962282,40.7963465556388,40.7963364106299,40.7963232723267,40.7963107124945,40.7963018899829,40.7962936543119,40.7962878147661,40.7962822117725,40.7962777670187,40.7962741914906,40.7962701834746,40.7962661435714,40.7962631553958,40.7963369203832,40.7963235490558,40.796253571428,40.796254973006,40.7962570597552,40.7962578038468,40.7962601492666,40.7962649205,40.7962685085958,40.7962700539455,40.7964488638335,40.7964468203378,40.7964359296236,40.796434033133,40.7963441243203,40.7962669136969,40.7962610329355,40.7962591608981,40.7962571581783,40.7962534371503,40.7962546776903,40.7962532694679,40.7962496183872,40.7962449828777,40.7962380676663,40.7962310384019,40.7962216493849,40.7962132955252,40.7962073927336,40.7962031959187,40.796196891229,40.7961933486547,40.7961891368456,40.7961854891324,40.7961817909443,40.796178936835,40.7961759601466,40.7961735136364,40.7961720005294,40.7961708939673,40.7961710008079,40.7961722511498,40.7961731301988,40.7961745027065,40.7961792583003,40.7961904312517,40.7962057376544,40.7962152642335,40.796230413585,40.7962442788059,40.7962553270823,40.7962682583554,40.7962824891596,40.7962963670364,40.7963105852366,40.7963223588603,40.7963253240965,40.7963297829874,40.7963354703582,40.7963390072238,40.7963374780061,40.7963322206057,40.7963243717786,40.7963181451459,40.7963142194604,40.7963106101781,40.7962969252013,40.7962854999088,40.7962729501573,40.7962611277644,40.7962505157407,40.796239865652,40.7962313610771,40.7962235455095,40.796217369609,40.7962096837988,40.7962025956496,40.7961951545184,40.7961890439109,40.7961823477818,40.7961733235033,40.7961641171616,40.7961497016612,40.7961351149533,40.796123112531,40.7961133564357,40.7961029854844,40.7960944850279,40.7960881358973,40.7960831736726,40.7960785631141,40.7960738430274,40.7960682105226,40.796064146439,40.7960611826399,40.7960573851098,40.7960534258819,40.7960479220904,40.7960464766463,40.7960445342972,40.7960424909856,40.796040097048,40.7960386753901,40.796036192138,40.7960347678135,40.7960328762051,40.7960306164698,40.7960275642044,40.7960251719542,40.7960233654976,40.7960198775663,40.7960170248329,40.7960122397572,40.7960092329082,40.7960026583482,40.7959973005858,40.7959931036147,40.7959893373598,40.7959845067039,40.7959797495825,40.7959750547483,40.7959714201793,40.7959695881544,40.7959646494881,40.7959591145114,40.7959522484582,40.795944503565,40.7959397687729,40.7959357218701,40.7959316428931,40.7959280523095,40.795922126993,40.7959154342236,40.7959075883597,40.7959012295417,40.7958910273509,40.7958800613974,40.795870852949,40.7958584456141,40.7958477197721,40.795836942493,40.7958286164766,40.795818575759,40.7958082104696,40.7957954778989,40.7957845017968,40.7957750967111,40.7957643373773,40.7957509097167,40.7957421891375,40.7957312379119,40.7957211625019,40.795712138128,40.7957039488554,40.7956989656414,40.7956930605255,40.7956862815263,40.7956791455982,40.795670470411,40.7956627305819,40.7956523111842,40.7956448450303,40.7956381803165,40.7956332133643,40.7956271011699,40.7956209231436,40.7956159562325,40.7956116020406,40.7956058885654,40.7956014891142,40.7955944352845,40.7955906128951,40.79558599274,40.7955832730838,40.7955801430559,40.7955776235129,40.7955747720822,40.7955690245665,40.7955652080416,40.7955615329439,40.7955592214193,40.7959371119986,40.7959484990821,40.7959938223818,40.7959672021548,40.7959237776229,40.7959294886397,40.795552012644,40.7955458537406,40.7955406312234,40.7955359094817,40.7955319549381,40.7955280890833,40.7955245121041,40.7955203411205,40.795517490145,40.7955131055824,40.7955073608248,40.7955014157698,40.7954951733269,40.7954906778326,40.7954852048392,40.7954808390031,40.7954761957883,40.7954734842671,40.7954694467343,40.7954657621504,40.7954632717854,40.7954598618552,40.7954574140837,40.795454581495,40.7954521916141,40.7954496310864,40.7954478756651,40.7954463944176,40.795445104445,40.7954443519921,40.7954426385411,40.7954413505994,40.7954374488536,40.7954369874482,40.7954392357091,40.7954492237027,40.7954528798025,40.7954475328683,40.7954380849141,40.7954270332918,40.7954146134706,40.7954101073344,40.7954017228197,40.7953897913232,40.7953766247628,40.795361696578,40.7953546913302,40.7953525839545,40.7953424769863,40.7953375108696,40.7953322646534,40.7953260873934,40.7953216919471,40.7953179654346,40.7953135454942,40.7953086896234,40.7953037184246,40.7953003711338,40.7952982369141,40.7952971340159,40.79529572619,40.7952948297269,40.7952920701367,40.7952899497651,40.7952889556217,40.7952858659017,40.7952808026263,40.7952743928774,40.7952678121403,40.7952619352008,40.7952541292207,40.7952485601612,40.7952428763797,40.7952357801117,40.7952329369245,40.7952225734819,40.7952089429181,40.7955947934966,40.7956061757654,40.7956533850828,40.7956457794413,40.7956381825837,40.7956267952361,40.7955814673312,40.7955852922816,40.7951976254493,40.7951873455096,40.7951810053223,40.7951751619455,40.7951697299543,40.7951623143456,40.7951550670143,40.7951488925356,40.7951426922328,40.7951373746793,40.7951322159191,40.7951259255581,40.7951180252777,40.7951142949961,40.7951095440073,40.7951049256547,40.7951009108913,40.7950961231001,40.7950914557574,40.7950886584013,40.7950850889454,40.7950824010195,40.795078619599,40.7950738976935,40.7950674579899,40.7950627144901,40.7950585479847,40.7950534900998,40.795047275158,40.7950417572431,40.7950373024561,40.7950324139857,40.7950295903234,40.7950260967419,40.7950242183252,40.7950029105118,40.7949875912879,40.7949783008275,40.7949750634945,40.7949778877787,40.7949820905005,40.7949922958551,40.7950082728559,40.7950374252161,40.7950629600455,40.7950647826642,40.795065996351,40.7950665693479,40.7950664866619,40.7950657504564,40.7950643799952,40.7950624111385,40.7950598954042,40.7950568986199,40.7950534992006,40.795049786097,40.7950458564675,40.7950051899456,40.7949763586193,40.7949480169059,40.794924382359,40.7949059758189,40.794893078928,40.7948858890237,40.7948845161203,40.794888981225,40.794902562165,40.7949143431989,40.7949239921826,40.7949312370814,40.7949358736388,40.7949377711359,40.7948850531692,40.7948309930432,40.794831483782,40.794830839037,40.794829076072,40.7948262420925,40.7948224129815,40.7948176912675,40.7948122033798,40.7948060962627,40.794799533441,40.7947926906413,40.7947896272578,40.7947866268725,40.794783776579,40.7947811591141,40.7947788504565,40.7947769176205,40.7947754167115,40.7947743912972,40.7947738711429,40.7947738713472,40.7947743919042,40.7947754177034,40.7947769189686,40.7947788521217,40.7947811610481,40.7947825057477,40.7947867629092,40.7947938472926,40.7948036170498,40.7947959368157,40.7947872240882,40.7947776749713,40.7947675043945,40.7947569412747,40.7947462233637,40.7947355918975,40.7946706187855,40.7946085240904,40.7945499337365,40.7945021456675,40.794451858602,40.7943995356913,40.7943456588356,40.7942907242464,40.7942352378753,40.794179710755,40.7941429389051,40.794104386994,40.7940649897099,40.7940257022351,40.7939874770882,40.7939512410301,40.7939178725952,40.7939076841751,40.7938986673315,40.793888221293,40.7938775308355,40.7938673271022,40.793855065397,40.7938420850134,40.7938301472307,40.7938180202933,40.7938053009953,40.7937933784232,40.7937834108111,40.7937737947347,40.7937649616115,40.7937524501528,40.7937412195596,40.793729106275,40.7937197241076,40.7937095327505,40.7936993910945,40.7936847362559,40.7936728829681,40.7936634325655,40.7936506737206,40.7936381566143,40.7936253977693,40.7936116598266,40.7935963996311,40.7935822440495,40.7935664481405,40.7935542541678,40.7935407942884,40.7935302261745,40.7935168025262,40.7935037501066,40.7934893553762,40.793478092821,40.7934694609362,40.7934545523103,40.7934379562742,40.793429539999,40.7934087179899,40.7933946902618,40.7933825195726,40.7933653714942,40.7933499568954,40.7933354094095,40.7933180243284,40.7933087264777,40.7932988160957,40.7932881993508,40.793276116725,40.7932558420728,40.7932408078479,40.7932298077155,40.7932186646613,40.7932066273419,40.7931935410982,40.7931782013052,40.7931628942349,40.7931395878308,40.7931223131378,40.7931057571427,40.7930903701755,40.7930747271765,40.7930576159328,40.7930419961196,40.7930260489075,40.7930121901822,40.7929977271884,40.7929826123858,40.7929700301708,40.7929574929988,40.7929420105254,40.7929268958065,40.7929147124222,40.7928970853996,40.7928834007578,40.7928720695811,40.7928633515796,40.7928494316313,40.7928378226554,40.7928249506117,40.7928162258753,40.7928038731705,40.7927926714125,40.792783279852,40.7927737759127,40.7927637036499,40.7927553282601,40.7927448076745,40.7927339504472,40.7927193412928,40.7927063578112,40.7927021103467,40.7926939454437,40.7926819268003,40.7926715074012,40.7926607965661,40.7926563043446,40.7926497122875,40.792644387134,40.7926383560676,40.792631667771,40.7926251129171,40.7926181588112,40.7926096412749,40.7926013327583,40.792592195151,40.792581824801,40.7925699194819,40.7925575915155,40.7925444792626,40.7925311001143,40.7925168804168,40.7925018967175,40.7924872155714,40.7924737277174,40.7924587142687,40.7924461283591,40.7924311773625,40.7924177078619,40.7924016194125,40.7923855703824,40.792379698068,40.7923556363611,40.7923431467872,40.7923282195247,40.7923149302141,40.7923025841956,40.7922875611227,40.7922723791175,40.7922572045534,40.7922439261697,40.7922295311272,40.7922133258981,40.7921971245895,40.7921797452576,40.792166140313,40.7921489239298,40.7921333331731,40.7921206021589,40.7921076528368,40.792091206552,40.7920750322044,40.7920443144974,40.7920315936367,40.7920188228267,40.7920046016026,40.7919904062541,40.7919755032376,40.7919598540038,40.7919441876784,40.7919281729509,40.7919139413434,40.7919004554555,40.7918868814917,40.7918733001011,40.7918596743374,40.7918373806693,40.79181508941,40.7917943388945,40.7917762854405,40.7917506942401,40.7917175058423,40.7916806160649,40.7916411305731,40.7916002328294,40.7915591486222,40.7914301120614,40.7913028203389,40.7911776277792,40.7910935548895,40.7910107316775,40.7905581785281,40.7904835968814,40.7903925904227,40.7901492932796,40.7898376722479,40.7898188539742,40.7898065263639,40.7897927664823,40.7897801036662,40.7897639169751,40.7897477409065,40.789731889178,40.7897135678892,40.7896923924075,40.7896740728203,40.7896554001676,40.7896374296181,40.7896240832484,40.7896121316893,40.7895991586705,40.7895786735077,40.7895597092666,40.7895403767393,40.7895253179801,40.7895139165964,40.7895007036371,40.7894871930301,40.7894722750455,40.7894584457043,40.7894446513067,40.7894432903802,40.7894308556516,40.7894181075607,40.7894053314099,40.7893939544099,40.7893832378042,40.7893714495273,40.7893599963782,40.7893399178261,40.7893223184787,40.7893039976545,40.7892943010974,40.7892839453035,40.7892600168798,40.7892471828775,40.7892257585472,40.7892110044688,40.789197955413,40.7891847704912,40.7891720560641,40.7891593434367,40.7891444850291,40.7891412864341,40.7891325103979,40.789118937377,40.7891098156358,40.7890982243002,40.7890847311128,40.7890733021183,40.789061933339,40.7890479920027,40.7890353444072,40.7890383340358,40.789043685616,40.7890493178751,40.7890576394628,40.7890584127739,40.7890605628664,40.7894811900042,40.7895369830024,40.7895783926207,40.7895302497038,40.7894916894739,40.7894653705433,40.7889966372473,40.7889873460682,40.7889820972664,40.7889792652778,40.7889784348985,40.788976950518,40.7889756581336,40.7889733515223,40.7889700258545,40.7889661995021,40.7889643631167,40.7889626017176,40.7889609493142,40.7889604289248,40.7889552795518,40.788951110114,40.7889452839302,40.788940590006,40.7889358741122,40.7889293117221,40.7889195893653,40.7889113561562,40.7889060339586,40.788901938617,40.7888962896761,40.7888909267287,40.7888853332382,40.7888797862819,40.7888723980403,40.7888684972599,40.7888639476077,40.7888548532293,40.7888493998157,40.7888443810112,40.7888432773692,40.7888373261527,40.7888308209956,40.7888265918603,40.7888212658642,40.7888033685811,40.7887896472166,40.7887830462462,40.7887791965015,40.7887776187236,40.7887841288378,40.7887961239585,40.7888228011319,40.7888345086226,40.7888429570702,40.7888597483707,40.78890684181,40.7889967958874,40.7890147434132,40.7890367547998,40.7890612772318,40.7890921790114,40.7891594387465,40.7892076728262,40.7892329110914,40.7892601213921,40.7892999164551,40.789351616596,40.7893864382636,40.7894861231687,40.7903169633999,40.7903719309797,40.7903800695504,40.7903571875823,40.7903278477712,40.7903496883742,40.7903088180058,40.79034067166,40.7906409546716,40.7908664642024,40.791276789432,40.7913522269072,40.7916758393326,40.7917189168617,40.7917493537949,40.7913737157181,40.7911334066446,40.7911752578666,40.7912179212233,40.7913651232937,40.7914846024618,40.7916773217791,40.7921937053516,40.7929907053406,40.7931897858639,40.7932524793774,40.7932774406755,40.7934635410126,40.7934483854298,40.7934443865819,40.7933097077681,40.7933217570109,40.793454840008,40.7934516157029,40.7934707713045,40.7934820203131,40.7935250533777,40.7933194290007,40.7933509327133,40.7933336188242,40.7936485059095,40.7940359198644,40.7943848186272,40.7946046645685,40.7947248557779,40.7948018524199,40.7949012038943,40.7948833580295,40.7949007007072,40.7949018539931,40.7949168171964,40.7949144605059,40.7948973128702,40.7948758653787,40.7948252957744,40.7947885557133,40.7947599602636,40.7947583564742,40.7947878462676,40.7948206838654,40.7948284218584,40.7948330482259,40.794879566171,40.7948895325995,40.7948994336467,40.7949239148006,40.7949412504099,40.7949635472946,40.7949845580471,40.7949876598002,40.7949897142181,40.7949910965862,40.7949865786379,40.7949596147037,40.7949754625036,40.7950772897136,40.79542750552,40.7955586233421,40.7956597373201,40.7962380983655,40.7962055284342,40.7965762380639,40.7966084412961,40.796661538074,40.7966853925349,40.7966746979701,40.7966376833156,40.796597360196,40.7966052728178,40.7966091910286,40.7966181055761,40.7966291115331,40.7966355013639,40.7966404467087,40.7966479283515,40.796654394989,40.7966595552348,40.7966658343875,40.7966726843791,40.7966786132307,40.7966842553393,40.79668803313,40.7966914371105,40.7966957960526,40.7966995017105,40.7967047044594,40.7967080497133,40.7967102160778,40.7967125514676,40.7967168488196,40.7967201132501,40.796723032494,40.7967240673674,40.796725126234,40.7966401337599,40.7964452041929,40.7960960528602,40.7957953289049,40.7950787573146,40.795030059629,40.7949772042917,40.7949203997751,40.7948598701278,40.794563473021,40.7944960610404,40.7944252613423,40.7943514551504,40.7942750398758,40.7941964269769,40.7941661826222,40.7941378721413,40.7941121337604,40.7940895477197,40.7940845837282,40.7940773030679,40.7940679125301,40.7940566788322,40.7940439210424,40.7940300015172,40.7940153156094,40.7940002804388,40.793985323045,40.7939708682581,40.793957326633,40.7939450827875,40.7938565401439,40.7937682184537,40.793643014948,40.793519266666,40.7933972390035,40.7932771936646,40.7931593881009,40.7931207894449,40.7930818909144,40.7930430205976,40.7928657560922,40.7927497562152,40.792663828398,40.7925805069941,40.7925000038301,40.7923224913521,40.7922425322319,40.7921446089334,40.7919976933209,40.7919770960304,40.7918975371453,40.7918443569973,40.7917868435775,40.7917262087873,40.7916687533236,40.791628180034,40.7915845929593,40.7915382036276,40.7910437117125,40.7909444637836,40.7908455043997,40.7907471894985,40.790659206659,40.790571213178,40.7904836002902,40.7904053426725,40.7903282414145,40.7902526146265,40.7901787743345,40.7901300001594,40.7900636925847,40.7900011624276,40.7899841772635,40.789961768167,40.7899344643841,40.7899029107607,40.7898678525119,40.7898254940857,40.7897817885629,40.789737871395,40.7896948835297,40.7896614134884,40.7895919110971,40.7893426318701,40.7890127742128,40.7887767297228,40.7884629055346,40.78798266706,40.7877637200014,40.7877316117417,40.7876964488154,40.7876583437527,40.7875904962566,40.7875255616759,40.7874636089119,40.7873865954948,40.787356113952,40.7873322361454,40.7873151708222,40.7873050671722,40.7868289578339,40.7867817742185,40.786764099156,40.7867566586548,40.7867722341351,40.7868149609292,40.7868571452982,40.7869288735466,40.7869621636423,40.7870264252499,40.787065041676,40.7870822535724,40.7871785650297,40.7873944743842,40.7885136481995,40.7884872257538,40.7880203176229,40.7871925940727,40.7870791301347,40.7869706872789,40.7869272358795,40.7869194186892,40.7868780925889,40.7868214968412,40.7867288608486,40.7866799092223,40.7866617245994,40.7866512291453,40.7862965653039,40.7859172840193,40.784191049149,40.7835696932077,40.7829962651856,40.7820797939408,40.7819966438442,40.7819400652649,40.7819018918519,40.781869696526,40.7814268719043,40.7811254518184,40.7809481422011,40.7806131514076,40.7801869518335,40.7793233661237,40.7786123726147,40.7784095832878,40.7781604165531,40.7779123920832,40.7776641699193,40.777387046691,40.7766660361785,40.7762888230571,40.7761902191018,40.7761682592347,40.7761412251906,40.7760405100574,40.7758127749039,40.7756460798116,40.7755577466778,40.7753178924042,40.7750753573297,40.7749005918048,40.7748486906747,40.774687326249,40.7745730947092,40.7742748884656,40.7742386555859,40.7739900420079,40.7737875273617,40.7729749632613,40.772041698361,40.7716493070118,40.7709766894677,40.7703812726859,40.7695569007772,40.7694838399384,40.7693924069926,40.768777094785,40.7671494936249,40.7646211916861,40.7631420081823,40.7622953428512,40.7615968308279,40.7615135266284,40.7611853370067,40.760822527218,40.7607641279613,40.7591494775036,40.7577561937756,40.7576433408061,40.7555017211948,40.7533951609421,40.7530704482596,40.753084812721,40.7533427010099,40.7535630113391,40.7527026753188,40.7519881445332,40.7512750458755,40.7506213192936,40.7498551213338,40.7495879814059,40.7491374666713,40.7487816637054,40.7486473267049,40.7484222272169,40.747704478333,40.7475993302079,40.747211928463,40.7464026828165,40.7459001592616,40.7456696943573,40.7456695318148,40.7456693704683,40.7454369542154,40.7452037573372,40.7452034318154,40.7452030909198,40.7449700217063,40.7447379378598,40.7447377484306,40.7447375679011,40.7445076382148,40.744244607082,40.7442443464862,40.7442440948066,40.7439869420689,40.743737045852,40.7437368813976,40.743736707076,40.7434955687911,40.7432642904056,40.7430442361737,40.742803857683,40.7428036877632,40.7428035272238,40.7425715241404,40.742571467124,40.7425714113005,40.7423485005303,40.7423484254631,40.7423483498933,40.7421355239413,40.7421353716756,40.7421352216096,40.7419330351485,40.7416955066349,40.7405644860259,40.7404481241979,40.7404478623968,40.7404476010363,40.7403303489093,40.7403301864092,40.7403300337513,40.7402132420446,40.7402130432953,40.7402128351253,40.7400982780954,40.7400980347206,40.7400978006675,40.7399866857629,40.7385934199823,40.7385523064316,40.7384166431246,40.7384389476447,40.738325326189,40.7382823581914,40.7382355413158,40.7381854288368,40.7381746306951,40.7382061404715,40.7382376243901,40.7382690155478,40.7382842022456,40.7383026552872,40.7383310516215,40.7383608519982,40.738391577879,40.7383929854824,40.7383939487086,40.7384186525956,40.7384472109873,40.7384808479782,40.738500294466,40.7385147868745,40.7385323803882,40.7385499718919,40.7385896483002,40.7386293072684,40.7386644514245,40.7387022549407,40.7387809020789,40.7389157436598,40.7389325861239,40.7389431338887,40.7389524852625,40.7389780482677,40.7391278608713,40.7393523000362,40.7395112749715,40.7397042613101,40.7399989035571,40.7400902263996,40.7402831022068,40.7408096601895,40.7408798052049,40.7410357525542,40.7414846222237,40.7416638128473,40.7419495404638,40.7422094961843,40.7422322404994,40.7421906660535,40.7417531841915,40.7414415368014,40.7410438045624,40.7403431380092,40.7398293639291,40.7396309598996,40.7395671055064,40.7394404262537,40.7394882257504,40.7394543595712,40.739449572182,40.7393959559896,40.7393507546433,40.7392886430774,40.7391290603414,40.7391184248319,40.7390456971277,40.7390003952147,40.7389766249098,40.7389222299026,40.7388758547659,40.7388420593962,40.7388284283118,40.738807744776,40.7387783881571,40.7387381221347,40.7386909913284,40.7386229847228,40.7385897733083,40.7385690085487,40.7385641933642,40.7385540432256,40.7385435406457,40.7385333996315,40.7385220674502,40.7385166711569,40.7385156038626,40.7385149723389,40.7385043519711,40.7385024519221,40.7385032039502,40.7378195987375,40.7370831757755,40.7370244827535,40.7375201947633,40.7385619069765,40.7385654949987,40.7391327638927,40.7391612062805,40.7394770969316,40.7395610621863,40.7402648871458,40.7409566917453,40.7416390413239,40.7423409179436,40.7427397573551,40.7427847418805,40.7423991372422,40.7424509378266,40.742593616599,40.7427722064174,40.7430720507685,40.7432279845386,40.7433798061134,40.7434308938952,40.7435005707196,40.743730569606,40.7441757626274,40.7448505175602,40.7451506314946,40.7455239740791,40.7462041091385,40.7468885585259,40.7469042832447,40.7469377497663,40.7469769533884,40.7470215294036,40.7470710629488,40.7471576525076,40.7473647340025,40.7477913486168,40.7480126684928,40.7482866879021,40.748631931769,40.7489095914899,40.7494582894496,40.7501532252542,40.7508826481068,40.7513017845451,40.7519052837267,40.7541306833468,40.7545150424789,40.7544910603547,40.7538639206673,40.7537963150002,40.7535838066692,40.7537736536655,40.7537996374089,40.753820076997,40.7538428048671,40.7538671335439,40.7538923271295,40.7539176235634,40.7539422576735,40.7539814448168,40.7540196093608,40.7540558714667,40.7540893951526,40.7541065667952,40.7541219781921,40.7541394087918,40.7541913377843,40.7542332736228,40.7542852895483,40.7543122984646,40.7543336083181,40.7543831342661,40.7544273697602,40.7544600685378,40.7544970870012,40.7545450004849,40.7545771383473,40.7545878217618,40.7545998807513,40.7546352941779,40.754663357333,40.7546854034404,40.7547251329483,40.7547688404763,40.754805613184,40.7548333033575,40.7548528044981,40.7548839126363,40.7549043703445,40.7549256717579,40.7549323448095,40.754939655397,40.7549592610277,40.7549637881394,40.75497267733,40.7549765650288,40.7550106031681,40.7550439983126,40.7550902644495,40.7551377321101,40.7551772966466,40.7552088127174,40.755216361112,40.7552241327578,40.7552414349947,40.7552748076255,40.7553066175065,40.7553414109893,40.7553607833142,40.7553819645502,40.7553982142634,40.7554177426298,40.7554229163869,40.7554377736336,40.7554413199272,40.7554443696601,40.7554657298573,40.7554739113687,40.7554807419935,40.7555002613041,40.7555293706623,40.7555635487591,40.7555817038106,40.7556090095135,40.7556583922,40.7556881710824,40.7557067351916,40.7557196150517,40.7557403182063,40.7558148351846,40.7558467050646,40.7558726903565,40.7558976071835,40.7559211210439,40.7559468090668,40.7560027737209,40.756034973066,40.7560545153688,40.7561075063088,40.7561447228374,40.7562196989529,40.7562354553661,40.7562539602731,40.7562768146641,40.7562945405022,40.7563040859573,40.7563250093719,40.7563342676821,40.7563693918972,40.7563856951799,40.7564006975291,40.7564083452159,40.7564160077115,40.7564316428249,40.7564486926966,40.7564623231062,40.7564849403806,40.7565195030352,40.7565395363441,40.7565694923169,40.7565969465104,40.7566201865045,40.7566409273383,40.7566483903217,40.7566540411119,40.7566598296928,40.7566626801253,40.7566655495795,40.7566709196953,40.7566729543457,40.7566748533111,40.7566787240042,40.7566824794097,40.7566893430308,40.7566951622001,40.7566991356548,40.7567018208982,40.7567340558191,40.7567699841103,40.7567734350087,40.7567921242221,40.7568218252855,40.756825818085,40.7568280622701,40.7565400363045,40.7562672966429,40.7560102445045,40.7557692688936,40.7555446991363,40.7553368037671,40.7561569937639,40.7569447726627,40.7577434838967,40.7584031589058,40.7590684748989,40.7597286721183,40.7604553976932,40.7606852052743,40.7608608475474,40.7612947608349,40.7617390014391,40.7620785302424,40.7621529544777,40.7622141990183,40.7622613143798,40.7622686175674,40.7622882528572,40.762302169393,40.7623103201699,40.7623126776575,40.7623092341065,40.7623000009174,40.7622850092768,40.7622643098209,40.7620524302832,40.7619316501592,40.7619080623721,40.7624757649154,40.7625398165393,40.7625482648678,40.7625901790638,40.7627553996359,40.7629781495759,40.7632065080956,40.7634386899531,40.7636722713598,40.7639584520316,40.7640675144162,40.7641273882156,40.7642324655417,40.7651457024598,40.7652895884368]}]],[[{"lng":[-73.7446137607096,-73.7442928971144,-73.74434568661,-73.7444044998039,-73.744468017882,-73.7445462970969,-73.7446156802704,-73.7448123560443,-73.744841491771,-73.744933731174,-73.7450603114964,-73.7450024879486,-73.7446137607096],"lat":[40.7789473761095,40.778747261922,40.7787162223782,40.7787312700383,40.7787985381142,40.7788546506472,40.7786720696433,40.7785568975969,40.7786352768837,40.7788890722169,40.7791429434438,40.7791989746049,40.7789473761095]}],[{"lng":[-73.7467245708425,-73.7455922427413,-73.7457355420909,-73.7458187294903,-73.7458876546068,-73.7460789852557,-73.7462557106814,-73.7464916769484,-73.7466391941569,-73.7468206555507,-73.7468401232696,-73.7469282170603,-73.7470404860418,-73.7470498727007,-73.7470840306214,-73.7470542967688,-73.7472011345441,-73.7472448071309,-73.7472102534048,-73.7471364942635,-73.7469991124608,-73.7469206041618,-73.7468712752269,-73.7467878741471,-73.7467245708425],"lat":[40.7803065257983,40.7795806792697,40.7796105943866,40.7796667168735,40.779603471322,40.7796038930759,40.7795744486399,40.7794481721916,40.7793589936387,40.7793743101578,40.7794153748702,40.7794715080051,40.7796209249126,40.7797328236124,40.7797813801263,40.7798596291098,40.7799494536327,40.7800763447095,40.7801322078755,40.7801767981221,40.7801802255466,40.7801837821185,40.7802545305928,40.7802543473645,40.7803065257983]}],[{"lng":[-73.7487310863818,-73.7485151365582,-73.7483991560592,-73.7482491101888,-73.7481337690715,-73.7480276333644,-73.7480186537227,-73.748056608542,-73.7481445240551,-73.7479942101676,-73.747872465633,-73.7477758065254,-73.7477510749064,-73.747675887334,-73.7476481466931,-73.7475326559952,-73.7474234325161,-73.7473579106255,-73.7474871041715,-73.7475748831239,-73.7476596090639,-73.7477789291149,-73.7476694454435,-73.7475817301239,-73.7474689313245,-73.7473967341298,-73.7473593841095,-73.7472751379813,-73.7471655822889,-73.7470119744345,-73.7469428653211,-73.746889637884,-73.7468142070461,-73.7467937513753,-73.746866256832,-73.7467409691547,-73.7464583980822,-73.746458695642,-73.7462911127679,-73.7462335869638,-73.7461783080177,-73.7461282617391,-73.7461008390674,-73.7460082320923,-73.7459757743357,-73.7459758834065,-73.7459008361518,-73.7458610518889,-73.7458161877857,-73.7457539544525,-73.7457189950918,-73.7456412962378,-73.745626520085,-73.7455916065369,-73.7456318270995,-73.7455692512098,-73.7454843137334,-73.7454946260544,-73.745464749902,-73.7455277180041,-73.7454777237485,-73.7454006133039,-73.7453912255148,-73.7454502217555,-73.7453677269197,-73.7453655039721,-73.7453480030487,-73.7453203056624,-73.7452998601095,-73.7453373460303,-73.7453722538791,-73.7454320954377,-73.7454567100757,-73.7455266326822,-73.7455063557253,-73.7456111197254,-73.7456007479053,-73.745673017466,-73.7456876990982,-73.7457301141593,-73.7457774637295,-73.7458925573134,-73.7459601703084,-73.7460527622024,-73.7461103025022,-73.7461053290655,-73.7459733201898,-73.7459537514426,-73.7460099642454,-73.7459206236904,-73.7457278093868,-73.7456101370233,-73.7455490594702,-73.7454594989305,-73.7454077690133,-73.7452906841548,-73.745192405603,-73.74517892998,-73.7452214891433,-73.7451374793755,-73.7450767718396,-73.7449499431247,-73.7448373013205,-73.7446639804331,-73.7446172949822,-73.7446646793409,-73.7447541835903,-73.7448862457739,-73.7449287359631,-73.7451311125746,-73.7451830055166,-73.7452398592266,-73.7451839081333,-73.7451466951776,-73.7451752035599,-73.7451990518829,-73.7452462420091,-73.7452183907857,-73.7451480903204,-73.7450918799599,-73.7450546385282,-73.7450172740409,-73.7449372161502,-73.7449510186446,-73.7451195401095,-73.7451379761579,-73.7450669361281,-73.7450712403748,-73.7451035895889,-73.7450751205001,-73.7449573545215,-73.7448349420469,-73.7447923961585,-73.7446652137936,-73.7446701889314,-73.7447176819392,-73.7445846577234,-73.7444844262264,-73.7444310162936,-73.74442453717,-73.7443993171625,-73.7443770749458,-73.744458447392,-73.7444771608828,-73.7444801030793,-73.7444101080776,-73.7444098977406,-73.7444159181414,-73.7443781342689,-73.7442809167698,-73.7442182686587,-73.7441524490722,-73.7440844303473,-73.7441042993767,-73.7441266463817,-73.7441942514571,-73.7442643931099,-73.744332144646,-73.7443344982057,-73.744296703414,-73.7442062531877,-73.7441460159234,-73.7440907434024,-73.7440409145722,-73.7434499226589,-73.7415196945707,-73.7407599148931,-73.7403662941908,-73.7400797397189,-73.7393759888705,-73.7391236200372,-73.7388622736383,-73.737702836223,-73.7368822298614,-73.7338926159133,-73.7330421584566,-73.7320586557862,-73.7312873864364,-73.7304883467394,-73.7295434194624,-73.7289331886981,-73.7279428140826,-73.7268594127359,-73.7258254369014,-73.7237886267034,-73.7229310395313,-73.7223309076035,-73.7215332474577,-73.7209758843428,-73.7208090485533,-73.7207522264702,-73.7207126990036,-73.7206308309875,-73.720214357172,-73.7165758525221,-73.7141353801854,-73.7138698269596,-73.7136555701363,-73.7135182810599,-73.7142628773707,-73.7145568590179,-73.7149821402296,-73.716125282335,-73.7161384267906,-73.7168544044493,-73.717672370657,-73.7183197181875,-73.7187778771528,-73.7189705036507,-73.7191790962089,-73.7195646072074,-73.719677323078,-73.719982969885,-73.7203159529136,-73.7206331939909,-73.7209651171016,-73.7211100148293,-73.7212117612937,-73.7214587026136,-73.7215963147849,-73.7216135707177,-73.7217633963702,-73.7218028921022,-73.7220707143631,-73.7224109479736,-73.7226454352784,-73.7227970316873,-73.722993013251,-73.7232667341128,-73.723441354726,-73.723518672625,-73.7238269889925,-73.7238445185635,-73.7247582308592,-73.7250684805801,-73.7250944536574,-73.725829888901,-73.7260296634162,-73.7264147213715,-73.7266652997626,-73.7267773946019,-73.7270938962406,-73.7273788914016,-73.7277135618633,-73.7278840110042,-73.7280535563183,-73.728253810495,-73.7283779840264,-73.7284917856987,-73.7286220742307,-73.7287195280344,-73.7289618301044,-73.7290667097408,-73.7291459381016,-73.7295344898019,-73.729646192304,-73.729931691068,-73.7304313463387,-73.7306280183626,-73.7310646188084,-73.7322691805635,-73.7323273171628,-73.732416946137,-73.7336646151422,-73.7337063066621,-73.7337548485368,-73.7343696590925,-73.7353950876422,-73.7356078673722,-73.736858942342,-73.7375103806105,-73.7381604798647,-73.7385717593228,-73.7390121035239,-73.7393315136078,-73.7397224415904,-73.7398699553434,-73.7401695182886,-73.7414462859306,-73.741516368396,-73.7415894454279,-73.7422843119843,-73.7429478585603,-73.7447241770073,-73.7455536803748,-73.7461625945476,-73.7467214036271,-73.7470453150768,-73.7473312659008,-73.7474969286838,-73.7479342385097,-73.7491718855846,-73.7498098750692,-73.7504829564986,-73.750810669395,-73.7510675391817,-73.7517767991304,-73.7518423828998,-73.7519241349113,-73.752219141375,-73.7525947100116,-73.7528907647338,-73.7531916268874,-73.7534971274941,-73.7538070928292,-73.754064692594,-73.7544222251128,-73.7552758438404,-73.7561259878482,-73.7565525339654,-73.7566365811251,-73.7567032923354,-73.7567473961243,-73.7567827271554,-73.7568485473757,-73.7578714145791,-73.7583167551701,-73.7599381830034,-73.7602421099526,-73.7611408368041,-73.7616081443854,-73.7623420983915,-73.7632753774446,-73.763818667354,-73.7643507152622,-73.7648685309736,-73.7652883037966,-73.7655885617446,-73.7656437446564,-73.76555086054,-73.7649166761364,-73.7643401501722,-73.7636997917017,-73.7637401047644,-73.7647122863809,-73.7634077835836,-73.762495339435,-73.7627330346792,-73.762528757224,-73.7624853862956,-73.7624633455236,-73.762463483763,-73.7624860927728,-73.7625308618954,-73.7625969477084,-73.7626829717928,-73.7631681653848,-73.763612254194,-73.7643149555986,-73.7651512888328,-73.7655684981059,-73.7661748475612,-73.7663375608593,-73.7664910963283,-73.766633525764,-73.7667631486094,-73.7668785359679,-73.7669786290539,-73.7676150802808,-73.7677061458968,-73.7677299142538,-73.7685770122043,-73.7693716412279,-73.7703898232084,-73.7713767848846,-73.7714521884746,-73.7715340231325,-73.771566719034,-73.7716209796026,-73.7724146100266,-73.7728126768902,-73.7732153479139,-73.7736218517439,-73.77403143122,-73.7744433045205,-73.7748638213836,-73.7755123829721,-73.7756918242702,-73.775738369271,-73.77579713377,-73.7780583566693,-73.7785992477799,-73.7796564130618,-73.7803660354377,-73.7806858491643,-73.7810056636336,-73.7812185758443,-73.7813769887811,-73.781765268269,-73.7821600971818,-73.7831101185109,-73.7834969715438,-73.7840094412037,-73.7848424455737,-73.7857705120003,-73.7866484461612,-73.7866908531654,-73.7867351682107,-73.7875944436014,-73.7884824349903,-73.7886511024846,-73.7893472725741,-73.7902075013792,-73.791115264333,-73.7920281759569,-73.7928579703722,-73.7929160314509,-73.7929788166896,-73.7936934138513,-73.794408017501,-73.7953377292228,-73.7958868169561,-73.796115847736,-73.7964021870636,-73.7964117836612,-73.796439400485,-73.7967249785876,-73.7962929729161,-73.7964083366988,-73.7971768666997,-73.7972236245783,-73.7972237300281,-73.7972238015305,-73.797256650196,-73.7972567079298,-73.7972567434467,-73.7972751530502,-73.7972751763732,-73.7972751758787,-73.7972788680566,-73.7972788787146,-73.7972788541305,-73.7972679511916,-73.7972308497208,-73.7969506529853,-73.7966662287099,-73.7966660174629,-73.7966658185438,-73.7963943219328,-73.7963942358001,-73.7963941496689,-73.796136385709,-73.7961363119708,-73.7961362496826,-73.795893352483,-73.7958931909794,-73.7958930287863,-73.7956656682183,-73.7954305928757,-73.7952125770972,-73.7950131200899,-73.7950129845309,-73.7950128584735,-73.7948329545002,-73.7946735656202,-73.7946734082346,-73.7946732717469,-73.7945350735508,-73.7944912065203,-73.7944911705002,-73.7944911461268,-73.7944636833295,-73.7944528289866,-73.7944528171416,-73.7944528269305,-73.7944586915746,-73.7944812052734,-73.794481215569,-73.794481238857,-73.7945201930523,-73.794579760412,-73.7946756881826,-73.7947226487799,-73.7947354566906,-73.7948153134904,-73.7948103456186,-73.7948050444504,-73.794791003346,-73.7947752525681,-73.7947576982429,-73.794721412575,-73.7946832464622,-73.7946558385144,-73.7946276915411,-73.7945772699,-73.7934332013522,-73.7924309918035,-73.7923751799838,-73.7924191072558,-73.7927155327382,-73.7930144042444,-73.7930301581338,-73.7932162364112,-73.7934399114646,-73.7934403346992,-73.7934429997644,-73.7934380018251,-73.7934367370331,-73.7933454619449,-73.7932248387383,-73.7930255136592,-73.7926823244246,-73.7924567735076,-73.7923901269484,-73.7923824381353,-73.7923791069461,-73.7922312493827,-73.7921678938404,-73.7922891961931,-73.7923669778863,-73.7925514464415,-73.7927125938288,-73.7922679522092,-73.7916352606646,-73.7914959869521,-73.7903497179111,-73.7898420408074,-73.7891387365923,-73.7889397576961,-73.7882697295326,-73.7874099159046,-73.786550733524,-73.7862649830261,-73.7856943384528,-73.7849148919768,-73.7845933934921,-73.7844833065157,-73.7844091872914,-73.7840764529224,-73.78279772917,-73.7803618035437,-73.7794765605842,-73.7785877112418,-73.7776935496137,-73.7767836326243,-73.7758395833217,-73.775598853662,-73.7740381110772,-73.7732718173539,-73.7726695015009,-73.7723506921408,-73.771814665066,-73.7709987179752,-73.7709360216871,-73.7708686712456,-73.7707638281677,-73.7706097445486,-73.7698101452351,-73.7693040571013,-73.7690880771458,-73.7690244549392,-73.7685805854947,-73.7683379567389,-73.7682733357088,-73.7681591544423,-73.7681345883816,-73.7682319025411,-73.7682005546003,-73.7671619368759,-73.7672072936747,-73.766997835351,-73.7670734335662,-73.7670239234651,-73.7669275026483,-73.7669580014478,-73.7668899470384,-73.7667757037394,-73.7667586863122,-73.7668691297144,-73.766863454366,-73.7670881591274,-73.7671354490991,-73.7681617305158,-73.768077888618,-73.7677945062199,-73.7676045463379,-73.7676189407549,-73.7674781736673,-73.7671371731236,-73.7670911348473,-73.7670006806978,-73.7665882727841,-73.7663282325811,-73.7662778796919,-73.7661423329391,-73.7660039832656,-73.7657279690393,-73.7651043682021,-73.7646938542461,-73.7643606700638,-73.764176331147,-73.7637840134912,-73.7622386311044,-73.7612630125984,-73.7608590005573,-73.7606052406625,-73.7605234950785,-73.7604405684868,-73.7600114229605,-73.7596007809282,-73.7593738942836,-73.7590735292443,-73.758935120937,-73.75880776561,-73.7588384787157,-73.758822044628,-73.7588273600204,-73.75879456996,-73.7587340354635,-73.7586426435808,-73.758421565508,-73.7580238719254,-73.7578703056723,-73.7576068379924,-73.7575219437506,-73.7573902080387,-73.7573452317401,-73.7571843001929,-73.7570311482004,-73.75692940163,-73.7566598285143,-73.7564108428975,-73.7564092114074,-73.7564083615959,-73.756408306114,-73.7564090326287,-73.7564131832044,-73.7564200366035,-73.756448380187,-73.756460190179,-73.7564990397731,-73.756508848166,-73.7565124009093,-73.7565146831241,-73.7565151252273,-73.7565155091384,-73.7565157265295,-73.7565157778407,-73.7565156399346,-73.7565153487326,-73.7565148782585,-73.7565142430309,-73.7565134291599,-73.7565124492458,-73.7565112924534,-73.7565084674455,-73.7565049424883,-73.7565007193764,-73.7564910753618,-73.7564787624025,-73.7564737783002,-73.7564358283957,-73.7564035715683,-73.7563875860459,-73.7563431222663,-73.7563156703824,-73.7562866441139,-73.7562555932361,-73.7562206450325,-73.7562057809939,-73.7561910361845,-73.7561770200206,-73.7561635345615,-73.7561448970506,-73.7560221033329,-73.7558829495031,-73.7554731043979,-73.7549367434126,-73.7542555341964,-73.7542523503824,-73.7541006548844,-73.7540196191293,-73.7539749824477,-73.753882348747,-73.7538508590688,-73.7538227060357,-73.7537703646453,-73.7538073375998,-73.7538044144522,-73.7537519010711,-73.7536722945569,-73.7535570448884,-73.753467453831,-73.7534099472643,-73.7533073647488,-73.7532177566978,-73.7531154099183,-73.7529744306812,-73.7528589825038,-73.7526473236616,-73.7526925441734,-73.7526412812655,-73.75249376942,-73.7523683473865,-73.7522630407005,-73.7521926153652,-73.7521223355825,-73.7520456318618,-73.7520040194554,-73.7519527555826,-73.7518901313187,-73.7518188487802,-73.7517804277757,-73.7516008270044,-73.751503453479,-73.7513972211751,-73.7512853356981,-73.751173402329,-73.7510703776262,-73.7510524589615,-73.7510403349292,-73.7510842820424,-73.7510743225256,-73.7509735123675,-73.750901704247,-73.7508218773704,-73.7507272869203,-73.7505746821474,-73.750411283387,-73.7501928997779,-73.7499854816292,-73.7494937607277,-73.7491466574023,-73.7486809083737,-73.7486122507256,-73.748531663865,-73.7484570766552,-73.7484004868574,-73.7482281259855,-73.7479657349687,-73.7478976470269,-73.7477856783314,-73.747733274254,-73.7476583327049,-73.7475351347506,-73.747461175008,-73.7472896712355,-73.7471698249883,-73.7469555869677,-73.7467301639041,-73.7465598186795,-73.7464254631054,-73.7462890449138,-73.7462858285577,-73.7462860009914,-73.746291892682,-73.7463259792522,-73.74634096547,-73.7463233354084,-73.7463032588723,-73.7463562190214,-73.7464148644748,-73.7463814416708,-73.7464030940343,-73.7464133762817,-73.7464134955851,-73.74642482956,-73.7464116758474,-73.7463715759126,-73.7463302358407,-73.7463145414671,-73.7462674358693,-73.7462483820593,-73.7462439033724,-73.7462405449713,-73.7462371874518,-73.7462360784227,-73.7462349617885,-73.746234968301,-73.7462349748072,-73.7462349813178,-73.74623499433,-73.7462372525343,-73.7462530874619,-73.7462768264514,-73.7462813571867,-73.74628363711,-73.7462847882126,-73.7462848012267,-73.7462836924199,-73.746280345103,-73.7462770053958,-73.7462613631368,-73.7462378903304,-73.7462188906347,-73.7462099395367,-73.7462077019163,-73.7462054625861,-73.7461953829455,-73.7461819373621,-73.7461752084503,-73.7461684791487,-73.7461572592268,-73.7461550133862,-73.7461482808305,-73.7461392985163,-73.7461314345495,-73.7461100861663,-73.746103342529,-73.7460977177147,-73.7460718396238,-73.7460583371605,-73.7460009489511,-73.7459806913368,-73.7459491686193,-73.7458906154765,-73.7458838559702,-73.7458770927613,-73.7458455206548,-73.745837635395,-73.7458275062291,-73.7458173801011,-73.7458072622513,-73.7457971445738,-73.7457926526606,-73.7457892814675,-73.7457847921554,-73.7457814262053,-73.7457791855548,-73.7457758222061,-73.7457601429555,-73.7457500678887,-73.7457444715135,-73.7456974812008,-73.7456795754427,-73.7456303182634,-73.7455485979349,-73.7455306935768,-73.7455206238213,-73.7454870588205,-73.7454613121112,-73.7454467482771,-73.7454299362329,-73.7453839662908,-73.7453738704466,-73.7453256374991,-73.7453043316149,-73.7452875228687,-73.7452729590776,-73.7452617662516,-73.745251697623,-73.745233836749,-73.7452271343133,-73.7451913550951,-73.7451555419652,-73.7451286679652,-73.7450939488287,-73.7450894687103,-73.7450861054042,-73.7450760152758,-73.745039013066,-73.7450289238233,-73.7450233164287,-73.7450084885698,-73.7449941770573,-73.7449818485416,-73.744980727798,-73.7449594375181,-73.7449426452472,-73.7449359336921,-73.7449303481281,-73.7449236542484,-73.7449136099371,-73.7449080361435,-73.7448935224387,-73.7448868253003,-73.7448834816394,-73.7448812604462,-73.7448757592936,-73.7448757723799,-73.7448735518497,-73.7448690817933,-73.7448679682607,-73.7448657289832,-73.7448646115154,-73.7448623713614,-73.7448567661879,-73.7448500317493,-73.7448354395602,-73.7448118618965,-73.7447927758708,-73.7447871619567,-73.7447815528578,-73.7447759422125,-73.7447714595121,-73.7447681003837,-73.7447434495468,-73.7447221733626,-73.7446762773944,-73.744644942625,-73.7446359905721,-73.7446337602459,-73.7446315268739,-73.7446281799729,-73.7446281930719,-73.744628202896,-73.7446282225441,-73.744629365317,-73.7446406799882,-73.7446418059506,-73.7446429489442,-73.7446440925967,-73.7446441089695,-73.7446452569719,-73.7446453028103,-73.7446453355551,-73.7446454206896,-73.7446421825129,-73.7446389404058,-73.7446401102504,-73.7446435252452,-73.7446446590736,-73.7446491847514,-73.7446559671608,-73.7446908691357,-73.7446900151412,-73.7446898675859,-73.7446887772025,-73.7446574864687,-73.7446541192787,-73.7446265350062,-73.7446260610741,-73.7446148381392,-73.7446058599398,-73.7446013700702,-73.7445586403078,-73.7445529283833,-73.7445403903811,-73.7445502656966,-73.744551375938,-73.7445590849611,-73.7445601853751,-73.7445656680267,-73.7445688760304,-73.7445710218453,-73.7445730842367,-73.7445763964285,-73.7445819524496,-73.7445897571554,-73.7446009329802,-73.7446154806234,-73.7446244368375,-73.7446249097816,-73.7446345175069,-73.7446423595431,-73.7446546836406,-73.7446995060563,-73.7447107113849,-73.7447163122051,-73.7447387082629,-73.7447745258563,-73.7448080913025,-73.7448215019216,-73.7448505243073,-73.7448605880151,-73.7448661833866,-73.7448729040966,-73.7449166044947,-73.7449188470491,-73.7449591987752,-73.7449738892486,-73.7449883390323,-73.7449950656361,-73.7450488734675,-73.7450600801974,-73.7450903371021,-73.745107129439,-73.7451205630638,-73.745125039926,-73.7451485406159,-73.7451630782255,-73.7451954960785,-73.7452100302295,-73.7452234567032,-73.7452402569588,-73.7452581766556,-73.7452794638312,-73.7452828262693,-73.7452873138328,-73.7452929229879,-73.7452985360705,-73.7453378376873,-73.7453513066512,-73.7453569203961,-73.7453614024937,-73.7453658898398,-73.7453692492365,-73.7454263528675,-73.7454789770749,-73.7455036178822,-73.7455506480056,-73.7455663154504,-73.7455819715772,-73.7456110278219,-73.7456266711448,-73.7456423188386,-73.745679223236,-73.7457060813346,-73.7457329557598,-73.7457598495421,-73.7457643316789,-73.745768819061,-73.7457800390093,-73.745792388621,-73.7458047410526,-73.7458182238133,-73.7458305892891,-73.7458418353149,-73.7458519605685,-73.7458992321995,-73.745927385563,-73.7459780780731,-73.7459938457391,-73.7460062265892,-73.7460129769799,-73.7460185985493,-73.746024222978,-73.746029838031,-73.746034331263,-73.746038825156,-73.7460421911073,-73.7460466817461,-73.7460545318213,-73.7460623738428,-73.746075811869,-73.7461049062021,-73.7461463202188,-73.7461608605697,-73.7461720382231,-73.7461753788079,-73.7461787187288,-73.7461853239819,-73.7461886630268,-73.7461908967381,-73.7461931295728,-73.7461964877543,-73.7461998472101,-73.7462032040704,-73.7462076868893,-73.7462177841696,-73.7462233936144,-73.7462278836038,-73.7462301301166,-73.7462559295553,-73.7463119670549,-73.7463071094461,-73.7463011030953,-73.7462929050674,-73.7462701103278,-73.7461944243327,-73.7460997318356,-73.7460621494219,-73.7461020156208,-73.7461622437191,-73.746258367141,-73.7463589302906,-73.7465537809883,-73.7467242297633,-73.7469115423723,-73.747089839716,-73.747366553645,-73.7474942415331,-73.7474971489095,-73.7475467015488,-73.7476047704845,-73.7476505701627,-73.7477434840654,-73.7479068841613,-73.748034402722,-73.7481586590462,-73.7482481009681,-73.7482454950975,-73.7482715290177,-73.7483143742703,-73.7483516962762,-73.7483451508418,-73.7483698763008,-73.7484072345006,-73.7485009511289,-73.748541460287,-73.7486634776684,-73.7487478026685,-73.74889172729,-73.7488725496159,-73.7489665531784,-73.7490824746181,-73.7490546590151,-73.7491500604039,-73.7492220217639,-73.7492490513216,-73.7492054165399,-73.7491715886307,-73.7491739446257,-73.7494702746145,-73.7496610256023,-73.7497979210247,-73.7500404213058,-73.7501884612584,-73.7503228270199,-73.7504618300976,-73.7505704936531,-73.7506384796376,-73.7508480282828,-73.7509835695331,-73.7511089924216,-73.7512310028011,-73.7513260906423,-73.7514204878961,-73.7515099562406,-73.751535450835,-73.7515694325175,-73.7515602450935,-73.751600453026,-73.7516212179659,-73.7516350320006,-73.7516383319996,-73.7516383448885,-73.7516383734937,-73.7516489966525,-73.7516506376482,-73.7516508283345,-73.7516952345571,-73.7518283443911,-73.7519761577314,-73.7520701437327,-73.7521574815897,-73.7521921982344,-73.7522224303414,-73.7522177378063,-73.7522534997686,-73.7523432667933,-73.7524014799701,-73.7524484210662,-73.7524785175615,-73.752510927501,-73.7525670418802,-73.7526624986509,-73.7527410267386,-73.7528160503571,-73.7528932785593,-73.7529829885679,-73.7530457109001,-73.7530792107005,-73.7531137350034,-73.7531459999792,-73.7531922785675,-73.7532127018819,-73.753237647802,-73.7532667758971,-73.7533282652925,-73.7533885307276,-73.7534001231941,-73.7534183226519,-73.7534416607274,-73.753469267086,-73.7534831975824,-73.7534843097526,-73.753487522447,-73.7534954047873,-73.753503314483,-73.7535120448882,-73.7535182390559,-73.7535187559146,-73.7535210070676,-73.7535213064567,-73.7535287280918,-73.753573280168,-73.7535921875176,-73.7536121348811,-73.7536320455312,-73.7536340014967,-73.7536508302104,-73.7536696851945,-73.7536741338879,-73.7536758853482,-73.7536785921258,-73.7536882270221,-73.7536997507449,-73.7537053116151,-73.7537066845901,-73.7537097616395,-73.7537219049886,-73.7537237984852,-73.753737316036,-73.7537395055209,-73.7537399433634,-73.7537405533288,-73.753742519041,-73.7537432676561,-73.7537447087516,-73.7537452677196,-73.7537457749836,-73.7537681227005,-73.7537700288709,-73.7537976599968,-73.7538287017118,-73.7538506037983,-73.7538620038602,-73.7538654162748,-73.7538697997688,-73.7538792605499,-73.7538876208657,-73.7538893477113,-73.7538920791285,-73.7538944791813,-73.7538954078997,-73.7539431094199,-73.7539575591431,-73.7539909530528,-73.7540042994855,-73.7540198350029,-73.7540342223942,-73.7540474647478,-73.7540705776829,-73.7540793684444,-73.7540804977592,-73.754087010633,-73.7541042786437,-73.754104377114,-73.754111886448,-73.7541128220731,-73.7541206401855,-73.754131665996,-73.7541463408143,-73.7541493885,-73.7541609692396,-73.7541693659911,-73.7541697518113,-73.7541938337717,-73.7542136821523,-73.754219433937,-73.7542272381381,-73.7542350483444,-73.7542763654207,-73.754282463521,-73.7542852798393,-73.7542941867074,-73.754296441075,-73.7543197505425,-73.7543419334423,-73.7543598396167,-73.7543607458207,-73.7543761797363,-73.7544345133909,-73.7544642556946,-73.7545082654964,-73.7545378273115,-73.7545423969539,-73.7545475911434,-73.7545930955986,-73.7546140585558,-73.7546383774398,-73.7546660584744,-73.7546959821427,-73.7547104160306,-73.7547270799064,-73.7547347346516,-73.7548049397892,-73.7548189487657,-73.754821606567,-73.7548360285511,-73.7548747711695,-73.7548869173083,-73.7548907827852,-73.75489569735,-73.7549175352747,-73.7549274620185,-73.7549462169186,-73.7549615783909,-73.754972557855,-73.7549856449813,-73.7549953167758,-73.7549953693009,-73.7550721084905,-73.7550760338357,-73.7549960546209,-73.7549561747356,-73.7549291189627,-73.7549245771509,-73.7549189644604,-73.7549042884009,-73.7548918486509,-73.7548816492422,-73.7548725610019,-73.7548706037508,-73.7548657108474,-73.7548627188635,-73.754859878268,-73.7548565353118,-73.754855296298,-73.7548512996063,-73.7548496011014,-73.7548468230341,-73.7548325806339,-73.7548280175187,-73.7548280169125,-73.7548279986503,-73.754827986028,-73.754827982932,-73.7548290867226,-73.7548312300767,-73.7548324391402,-73.7548347461835,-73.7548380211583,-73.7548547963937,-73.7548560543148,-73.7548615001371,-73.7548624413194,-73.7548626086195,-73.7548632480079,-73.7548637157805,-73.7548637114084,-73.7548637000603,-73.7548625614615,-73.7548614230767,-73.7548608421909,-73.754859158295,-73.7548557728255,-73.7548512638194,-73.7548500276616,-73.7548400016422,-73.754805091386,-73.7548034573359,-73.7548005817152,-73.7547960726986,-73.7547953357619,-73.7547926903714,-73.7547904271204,-73.7547813589895,-73.7547745940004,-73.7547676839497,-73.7547606853533,-73.7547574915998,-73.7547531531514,-73.7547439247949,-73.7547315044275,-73.7547218161563,-73.7547168457389,-73.7547021996303,-73.7546923613106,-73.7546841837603,-73.7546685553857,-73.7546628069064,-73.7546465639611,-73.7546403127919,-73.7546379863661,-73.7546167047864,-73.7546065894999,-73.7545942318125,-73.7545852472526,-73.7545530736197,-73.7545470598684,-73.7545454835146,-73.754538071278,-73.7545373434738,-73.7545369483927,-73.7545290808636,-73.7545276689698,-73.7545110901412,-73.7545083832145,-73.7545054690429,-73.7544919691383,-73.7544891892807,-73.7544728353093,-73.7544533204202,-73.7544514458186,-73.7544450654173,-73.7544379299329,-73.7544266604809,-73.7544175397214,-73.7544153887572,-73.7544074890571,-73.7544007110769,-73.7543961824546,-73.7543954723921,-73.7543950235997,-73.754394381209,-73.7543938826916,-73.7543943248036,-73.7543949889492,-73.754394877375,-73.7543960911064,-73.7543971660462,-73.7543983278733,-73.754400566181,-73.7544039271577,-73.7544072906218,-73.7544129270207,-73.7544151399296,-73.7544263612728,-73.7544387095357,-73.7544424605018,-73.7544432035095,-73.7544521889686,-73.7544619730294,-73.7544645118718,-73.7544645471335,-73.7544705466883,-73.7546027658762,-73.7546701842513,-73.754673554015,-73.7546763903145,-73.7546780433015,-73.7546800519154,-73.7546859027286,-73.7546905208465,-73.7546937545399,-73.7547004798819,-73.7547051792451,-73.7547072041188,-73.754711679219,-73.7547139168786,-73.7547150263036,-73.7547150243261,-73.7547150168634,-73.7547158602656,-73.75471613164,-73.7547158064279,-73.7547149539493,-73.7547129698419,-73.7547114338375,-73.7547111507077,-73.7547111363226,-73.7547111223941,-73.7547134257974,-73.754714460046,-73.7547311809782,-73.7547317559587,-73.7547322768819,-73.7547331158565,-73.754733370578,-73.7547298718332,-73.754720736877,-73.7546968258224,-73.7546875741882,-73.7546786423856,-73.7546775350123,-73.7546763379747,-73.7546751624736,-73.7546756370723,-73.7546761995354,-73.7546820222257,-73.7546861330943,-73.7546973621606,-73.754698163209,-73.7546992140293,-73.7546991416696,-73.7546944494409,-73.7546830113072,-73.7546806850853,-73.7546817234745,-73.7546841870983,-73.7546849847046,-73.7546863132397,-73.7546904447688,-73.7546959452994,-73.7547019742068,-73.7547059371668,-73.7547203878203,-73.7547248321874,-73.7547268555581,-73.7547470653856,-73.7547512282215,-73.7547548544207,-73.7547637758073,-73.7547805363482,-73.7548129826099,-73.7548722816632,-73.7549012504291,-73.7552066537824,-73.7553327945919,-73.755404150086,-73.7553997585901,-73.7555129578636,-73.755534987289,-73.7554018026175,-73.7553974111173,-73.7553421625608,-73.7554054138866,-73.7554223780355,-73.755502439619,-73.7555614028681,-73.7555733264931,-73.7555014651064,-73.7554242370358,-73.7552555566659,-73.7550826771365,-73.7551075319324,-73.75511414903,-73.7551152356232,-73.7550738686908,-73.7550749874305,-73.7550805012016,-73.7550592038605,-73.7550105425548,-73.7548546586284,-73.7547060494338,-73.7543807475754,-73.7542960028262,-73.7541985912039,-73.754033315618,-73.7539752122952,-73.7539257846815,-73.7538775605071,-73.7538086391265,-73.7537222129142,-73.7536397451796,-73.7535700090613,-73.7535060983176,-73.7534519259874,-73.7534098581235,-73.7533899402959,-73.7533669199949,-73.7533923720636,-73.7534784794408,-73.7535616749842,-73.7536224771742,-73.7536397274899,-73.7536796912164,-73.7537527724858,-73.7538076815875,-73.7538361571892,-73.7539136717676,-73.7539557393991,-73.7539802762599,-73.7540059672431,-73.7540206184198,-73.7541040610497,-73.7541211549044,-73.7541441545853,-73.7541834418297,-73.7541895302818,-73.7542740418214,-73.7542414999939,-73.7543334926649,-73.7544224891778,-73.7544830212019,-73.7545456055867,-73.754571582022,-73.7545799674909,-73.7546604244236,-73.7547091212971,-73.7547523356378,-73.7548009712007,-73.7548008272755,-73.7548195740527,-73.7548382598212,-73.7548543147689,-73.7548569144588,-73.7548868812834,-73.7549295876919,-73.7550105312519,-73.7550968405145,-73.7551366423307,-73.7551615414468,-73.7551857539433,-73.7551769714196,-73.7551069413847,-73.7550663022348,-73.7550228671798,-73.7549754937699,-73.7549684849081,-73.7549385058148,-73.7548957829689,-73.754878754446,-73.7548660633368,-73.7548580065974,-73.7548547727476,-73.7548564374598,-73.7548635403637,-73.7548735856186,-73.7548863795857,-73.7549016756391,-73.7549197011355,-73.754939838267,-73.7549819374722,-73.7548943832531,-73.7548357769242,-73.7548418087061,-73.7548492969871,-73.7548151718828,-73.7548132289344,-73.7554183128755,-73.7554243457828,-73.7555178160454,-73.755517375818,-73.7554200211088,-73.7554221421191,-73.7548121705854,-73.7547946858063,-73.7547391477637,-73.7547233193417,-73.7547083722661,-73.7546945341839,-73.7546722837533,-73.7546597253111,-73.7546490043087,-73.7545644968616,-73.754649813175,-73.7544419628203,-73.7543733654965,-73.7543018354087,-73.7543000636342,-73.7542886526156,-73.7542821406951,-73.7542737976824,-73.7542625096784,-73.754248170366,-73.7542306948311,-73.754122444388,-73.7541117187848,-73.7541314302937,-73.7541296408308,-73.7540262400954,-73.7539327546702,-73.7539065978494,-73.7535304003175,-73.7530081254972,-73.7529983929643,-73.7527478689581,-73.7524596268728,-73.7523586899674,-73.7523158955917,-73.7521791091579,-73.7520188130994,-73.7519481150122,-73.7518397628445,-73.7517268690029,-73.7513480846683,-73.7510676865771,-73.750828611401,-73.7507195192557,-73.7506209058185,-73.7503251145417,-73.7502077036602,-73.7501715134524,-73.7500647992313,-73.7499751589997,-73.749939183211,-73.7499180642073,-73.7497296757822,-73.7495351467203,-73.7492532635324,-73.7491915740152,-73.7491122803627,-73.7489935137732,-73.7489563495424,-73.7487310863818],"lat":[40.7809564388987,40.7808701945074,40.7808723237316,40.7807647797125,40.7805977464647,40.7804831496097,40.7803711481976,40.7802806924042,40.7802403803011,40.7802043128513,40.7800730041559,40.7799393671786,40.7798487754299,40.7798390799295,40.7797151246166,40.7795885935177,40.7794620777116,40.7793833080643,40.779202513643,40.779197941014,40.7791719181275,40.7791149975083,40.7790575748072,40.7790454699236,40.7790356925626,40.7790641251622,40.7789949481553,40.7788946949004,40.7788563333472,40.7788631435491,40.7789034965974,40.7788890833555,40.7790408839114,40.7790348515836,40.7788775040246,40.7787728718799,40.7785702063297,40.7784920573996,40.7783830426862,40.7783447947828,40.7783751693193,40.7783483746775,40.7783063799621,40.7782623368105,40.7782260499727,40.7781974586995,40.778151547051,40.7780637800022,40.7779931564075,40.7778748423383,40.7778366439611,40.7778288487003,40.777758291439,40.7777086562823,40.7776820595021,40.7776533298367,40.7775711819502,40.7774968670172,40.7774415251108,40.7773673276451,40.7773271888701,40.7773439942823,40.7773272091997,40.7773061615549,40.7772411724766,40.7771668310235,40.7771534495623,40.7771838858137,40.7772848627385,40.7773173489964,40.7773688901661,40.7774567017071,40.7775768388125,40.7776513297833,40.7777084680355,40.7778516545951,40.7779412169603,40.7780576473178,40.7781529839861,40.7782083534961,40.7782847004389,40.7783497610996,40.7783727826833,40.7784206389009,40.7784550750372,40.7785265422736,40.7786227462094,40.7788228413038,40.7788765728966,40.7788799501145,40.7788938199884,40.7789292991212,40.7789184427689,40.7789790009927,40.7789824603823,40.7788642642773,40.7787461079614,40.7785816792705,40.7785174430158,40.778356432681,40.7782490813512,40.7782202103651,40.7781699258035,40.7780051436468,40.7779192668156,40.7778228757671,40.7777766137021,40.7776661160962,40.777619749801,40.7775630145575,40.7775166689648,40.7774024297759,40.7772807944984,40.7771770688057,40.7770985063066,40.7770092114872,40.7769628554641,40.776869872662,40.7768125353349,40.7767588021321,40.776662224846,40.7765978124634,40.7766333746431,40.7767120300766,40.7769018192438,40.7769983549138,40.7771340056859,40.7772376586057,40.7773842590815,40.7774521006444,40.7775125955839,40.7775587854443,40.7776194479271,40.7776834953801,40.7776120286998,40.7774870475212,40.7774398159434,40.7774229155015,40.7774561535222,40.7775109386268,40.777549004433,40.7776275806377,40.7776587350261,40.7776826020904,40.7777326431414,40.7780041037167,40.7780589027202,40.778123246439,40.7781684317049,40.7781825123506,40.7781728424125,40.778172696295,40.778255459126,40.7783050613291,40.7783622939819,40.7783872225299,40.7784045328892,40.7783913404438,40.7784313740201,40.7784789411197,40.7785263925082,40.7785415075083,40.7785699762874,40.7785901047824,40.7782411534161,40.7771022454265,40.7766947104985,40.7763897044495,40.7762087953964,40.7760136691673,40.7757041430727,40.7755731579013,40.7747935857324,40.7743309613431,40.7725271787593,40.7719544343677,40.7713021427098,40.7708151144791,40.7703456867535,40.7697668703074,40.7693796333054,40.7687790301227,40.7680850628287,40.7674646250229,40.7662391177369,40.7656842956555,40.7653149779241,40.7648231895878,40.7647601592888,40.7646477158382,40.7645873521461,40.7645321905059,40.7644764035055,40.7641926055928,40.7617818115222,40.7602427097405,40.7600606159987,40.7599355703866,40.7598377308309,40.7598267478674,40.7598088089902,40.7597828650221,40.7596607143073,40.7596582791953,40.7595255140197,40.7593112115204,40.7590820756754,40.7588716921729,40.7587832370366,40.7586664369445,40.7584505604206,40.7583724994122,40.758160821513,40.7578972586201,40.7576168355581,40.7572937891688,40.7571115258158,40.7569792084914,40.7566580805462,40.7564275043306,40.7563985948905,40.7561384666047,40.7560698974494,40.7554967031379,40.7549201892485,40.7546005240278,40.7544335381729,40.7542176709969,40.753947599497,40.753790845185,40.7537214379596,40.7534690887281,40.7534568116676,40.7529081483262,40.7527218443301,40.7527075918191,40.752291720602,40.752174355186,40.7519158778128,40.7517135882693,40.7516230921697,40.7513416042427,40.7510295673998,40.7506268946116,40.7503874833239,40.750082150822,40.7496937286457,40.7493811671894,40.7490447070445,40.7485120923062,40.7481970805566,40.7476328690356,40.7473909592462,40.7472737998128,40.7467163958914,40.7465619144726,40.7461881245902,40.7455848364248,40.7453641582395,40.7448883758843,40.7438189627454,40.7437714334179,40.7436945764047,40.7428131842682,40.7427825014306,40.7427476283125,40.7423515985612,40.7418088441,40.7416962195012,40.7410504010433,40.7407154477009,40.7403764358186,40.7400921232972,40.7397464791752,40.7394744746668,40.7390360895513,40.7388669013292,40.7384818975084,40.7369387463049,40.7368603610405,40.7367820094244,40.7360864083399,40.7354565515303,40.7340110302484,40.7334043180213,40.7329272200849,40.732477150644,40.7321936537058,40.7319387409959,40.7317910511832,40.7314011962218,40.7302990688401,40.7297467500573,40.7292212943939,40.7289950387789,40.7288176983399,40.7283680781811,40.7283265024008,40.7282800322624,40.7281123435807,40.727908985978,40.7277524406117,40.7276012935542,40.7274556294987,40.727315531504,40.7272010455232,40.7270421482329,40.7267154406002,40.7264302603588,40.726270754933,40.7262464107945,40.7262294326618,40.7262728959838,40.7263057848626,40.7263558121672,40.7271068514865,40.7273624071146,40.7281584118185,40.728307611567,40.7287944142644,40.7290475344412,40.7295382907013,40.7302405411147,40.7306835738072,40.7311511921359,40.7316686396683,40.732114664552,40.7324675205314,40.7325331267391,40.7325442834415,40.7326546728048,40.7327529552508,40.7328641168479,40.7329128725579,40.7340856997238,40.7344677423728,40.7347345589718,40.7352621626723,40.7360039606939,40.7361816951815,40.7363636253029,40.7365475010895,40.7367309819523,40.7369116801443,40.7370873264227,40.7372558362195,40.7382617079325,40.7391684115849,40.7406726268385,40.7424373457594,40.7432581550272,40.7435672716866,40.7436522585927,40.7437484301853,40.7438548526521,40.7439703628017,40.7440935792063,40.744222968236,40.7455263553193,40.7457227427204,40.745776226174,40.7455222048845,40.7452203090864,40.7447379136895,40.7442510355007,40.7442215225215,40.7441916253791,40.7441795155559,40.7441597313636,40.743884845222,40.7437892494286,40.7437043961096,40.7436304626194,40.7435676012212,40.743515899643,40.7434533366434,40.7433568425023,40.7433335887637,40.743325647164,40.7433176661759,40.7429864891389,40.7429081226516,40.7427293105529,40.7425916631466,40.7425056067887,40.7424195413359,40.7423622505907,40.7423199933991,40.7422164053246,40.7421155489653,40.7418483056439,40.7417413598523,40.74159935688,40.741368529938,40.7411106793814,40.7408667486418,40.7408529864632,40.7408417760526,40.7406179583688,40.7403682781607,40.7403257146845,40.7401263377529,40.7398947039536,40.7396498394492,40.73940358109,40.7391797328983,40.7391677614787,40.7391518812423,40.7389500622674,40.7387482308308,40.7384936727728,40.738376374998,40.738336140698,40.7382823581914,40.738325326189,40.7384389476447,40.7384166431246,40.7385523064316,40.7385934199823,40.7399866857629,40.7400978006675,40.7400980347206,40.7400982780954,40.7402128351253,40.7402130432953,40.7402132420445,40.7403300337513,40.7403301864092,40.7403303489093,40.7404476010363,40.7404478623968,40.7404481241979,40.7405644860259,40.7416955066349,40.7419330351485,40.7421352216096,40.7421353716756,40.7421355239413,40.7423483498933,40.7423484254631,40.7423485005303,40.7425714113005,40.742571467124,40.7425715241403,40.7428035272237,40.7428036877632,40.7428038576829,40.7430442361737,40.7432642904056,40.7434955687911,40.743736707076,40.7437368813976,40.743737045852,40.7439869420689,40.7442440948066,40.7442443464862,40.744244607082,40.7445076382147,40.7447375679011,40.7447377484306,40.7447379378598,40.7449700217062,40.7452030909198,40.7452034318154,40.7452037573372,40.7454369542153,40.7456693704682,40.7456695318148,40.7456696943572,40.7459001592616,40.7464026828165,40.747211928463,40.7475993302079,40.747704478333,40.7484222272169,40.7486473267049,40.7487816637053,40.7491374666713,40.7495879814058,40.7498551213338,40.7506213192936,40.7512750458755,40.7519881445332,40.7527026753188,40.7535630113391,40.7533427010099,40.7530848127209,40.7530704482596,40.7533951609421,40.7555017211948,40.7576433408061,40.7577561937756,40.7591494775036,40.7607641279613,40.760822527218,40.7611853370067,40.7615135266284,40.7615968308279,40.7622953428512,40.7631420081823,40.7646211916861,40.7671494936249,40.7687770947849,40.7693924069925,40.7694838399384,40.7695569007771,40.7703812726859,40.7709766894677,40.7716493070118,40.772041698361,40.7729749632613,40.7737875273617,40.7739900420079,40.7742386555859,40.7742748884656,40.7745730947092,40.774687326249,40.7748486906747,40.7749005918048,40.7750753573296,40.7753178924042,40.7755577466778,40.7756460798116,40.7758127749039,40.7760405100573,40.7761412251906,40.7761682592347,40.7761902191018,40.7762888230571,40.7766660361785,40.777387046691,40.7776641699192,40.7779123920832,40.7781604165531,40.7784095832878,40.7786123726146,40.7793233661236,40.7801869518334,40.7806131514076,40.7809481422011,40.7811254518184,40.7814268719043,40.781869696526,40.7819018918519,40.7819400652649,40.7819966438441,40.7820797939407,40.7812977084519,40.7807819579814,40.7805328323341,40.7804505919967,40.7798768249122,40.7796348722008,40.7796202841132,40.7796359591975,40.7795896404421,40.7795016376427,40.779444179191,40.7797828756607,40.7798668286119,40.779931470526,40.7800704289944,40.7800862341583,40.7799183160521,40.779899581154,40.7797794339434,40.7798124586984,40.7797835055899,40.7797490277504,40.7797403412719,40.7796670547509,40.7797423371454,40.779396821242,40.7792520615438,40.7787455689545,40.7782990346607,40.7779946939159,40.7776555408665,40.7769377532915,40.7768448411092,40.7766952139655,40.776172594166,40.7758430543308,40.7757411863253,40.7754669597865,40.7750670069326,40.7746033280921,40.7737990387231,40.773340474352,40.7730285203453,40.7728299899402,40.7725172231501,40.7712206617706,40.7703959650743,40.7700226427234,40.7697659334573,40.7696168208548,40.7694851869315,40.7690958316268,40.768723256713,40.7686363887858,40.7684537863381,40.7683343285159,40.7681826527254,40.7680382872365,40.7679493344011,40.7677675238723,40.767653890656,40.7675492261534,40.7673571700355,40.7671990674481,40.7670753295456,40.7669464279496,40.7669699190069,40.7671067561338,40.7671666723585,40.7670698075666,40.7669520008923,40.7668232543414,40.7667976826061,40.7666503291596,40.7665142227676,40.7665101494332,40.7665060408956,40.7665018720526,40.766497641203,40.7664864925561,40.7664746475203,40.7664388489277,40.7664253664106,40.7663861952588,40.7663728348211,40.7663663937376,40.7663610496119,40.7663599976431,40.7663587106794,40.7663574682609,40.7663562705559,40.7663551180182,40.7663540090485,40.7663529370582,40.7663519086117,40.7663509260249,40.7663499781002,40.7663490753689,40.7663473939675,40.7663458735873,40.7663445055206,40.7663423776563,40.7663407212651,40.76634035993,40.7663376497125,40.7663357452595,40.7663347930804,40.7663352029743,40.7663378819601,40.7663434045519,40.7663518487009,40.7663637061534,40.7663704109361,40.7663796360682,40.7663906112129,40.7664023334739,40.7664105162213,40.7664644212102,40.7664122934621,40.7663655804165,40.7660932521389,40.7655328927883,40.7655291124655,40.7653493539646,40.7653074508247,40.7653069509386,40.7653492928971,40.7653421293731,40.765335721143,40.765304631483,40.7651153319596,40.7650682278446,40.7650304384263,40.7649716227856,40.7648688071037,40.7647758153476,40.7646926596566,40.7646387131555,40.7645506040567,40.7644331635333,40.7643400607503,40.7642909696538,40.7642025993948,40.7641343170454,40.7641000171946,40.7640362055233,40.7639493796232,40.763894066012,40.7638304185151,40.7637276980909,40.7636249637963,40.763502871086,40.7633612636982,40.763204381551,40.7629977275337,40.7628965016646,40.7625738618255,40.7623625023046,40.762232442439,40.7621117666607,40.7620039009152,40.7619174102501,40.7619028506697,40.7618404719478,40.7618038387369,40.7617636713363,40.7616857258662,40.7616625092607,40.7616811277414,40.761742422088,40.7616788158594,40.7615121726566,40.7614285535739,40.7613366452073,40.7612441167673,40.7611927905867,40.7609643423171,40.760927803076,40.7608821405618,40.7608319425781,40.7607681373088,40.7605013697669,40.7602960998588,40.7602380865391,40.7601421762591,40.7600387088588,40.759953984862,40.7598571961874,40.7598100554444,40.7597140141478,40.7596223574021,40.7595390344068,40.7594437292117,40.7593391476885,40.7592235421436,40.7590592448176,40.7590190923328,40.7589738230079,40.7589012333103,40.7587996634589,40.7586989079363,40.7586091830818,40.7585715566233,40.7585281106309,40.7584667418989,40.7583940656427,40.7583129684493,40.7582677218775,40.7582671133484,40.7582096652798,40.7581242212091,40.7580353011069,40.7579771265956,40.7579685508582,40.757949655989,40.7579385098534,40.7579350844553,40.7579316603522,40.7579282362508,40.7579248177726,40.7579231063738,40.7579213969466,40.7579196891947,40.75791798027,40.757914564766,40.7579111530352,40.7578830003903,40.7578437626607,40.7578335225235,40.7578249858654,40.7578173009392,40.7578138842626,40.7578104651151,40.7578044792204,40.7577967849059,40.7577745414492,40.7577437402339,40.7577189280607,40.7577095136157,40.7577069461988,40.7577052323263,40.7576975231602,40.7576889518562,40.7576855209947,40.7576829441826,40.7576795010789,40.75767949613,40.7576777735279,40.7576769006884,40.7576768833583,40.7576785440758,40.7576793822585,40.7576819335211,40.7576929806484,40.7576989289042,40.757725281641,40.7577354864194,40.7577542080311,40.7577916623108,40.7577967718719,40.7578027361452,40.7578342702229,40.7578402325209,40.7578453346441,40.7578495825549,40.7578521227167,40.7578538093299,40.7578537994176,40.7578537919784,40.7578529273508,40.7578520657046,40.7578503529936,40.7578486366322,40.757836644817,40.7578272261805,40.757822089357,40.7577732980425,40.7577553221084,40.757711652411,40.7576388687431,40.7576208922858,40.7576106194222,40.7575755255038,40.7575524065665,40.7575421249389,40.7575326913868,40.7575103819579,40.7575069441101,40.7574888999096,40.757479456404,40.7574691697927,40.7574588886455,40.757448612773,40.7574374868425,40.7574084067692,40.7573989955448,40.7573553554636,40.7573211095196,40.757298842231,40.7572722873228,40.7572688602009,40.7572671449919,40.7572619970184,40.7572448334427,40.7572396861372,40.7572371100658,40.7572283846226,40.7572199638788,40.7572131021704,40.757212245471,40.7571985321841,40.7571839753041,40.7571762718087,40.7571685724814,40.7571565992729,40.7571394948427,40.7571283783319,40.7571052841392,40.7570941651396,40.7570873243229,40.7570804866622,40.7570505796846,40.7570471630077,40.7570403253482,40.7570343357523,40.7570317701284,40.7570300574024,40.7570283466582,40.7570266327574,40.757024058358,40.7570223356754,40.7570197408665,40.7570171261511,40.7570145213817,40.7570136542235,40.7570119328573,40.7570102126602,40.7570076407434,40.7570050708134,40.75698878705,40.7569716570438,40.7569305563643,40.7568997373927,40.7568911758672,40.7568869011713,40.7568834785092,40.7568774923987,40.7568740757217,40.7568715132559,40.7568663883242,40.7568612663849,40.7568399378502,40.7568390856252,40.7568339631836,40.7568288412461,40.7568245703579,40.7568177389881,40.756805781875,40.7567972402663,40.7567750326196,40.7567408592185,40.7567075395243,40.7566955849027,40.7566836340853,40.7566810741109,40.756672542964,40.756661453829,40.7566401775703,40.7566132407421,40.7566085716147,40.7566000275165,40.7565581049774,40.7565572427926,40.75655130414,40.7565512020708,40.7565486152052,40.756546886361,40.7565460216857,40.7565578858326,40.7565826441605,40.7566304480649,40.7566911147806,40.7566945339487,40.7567346952877,40.7567406774241,40.7567757100229,40.7568175696494,40.7568440536697,40.7568918911217,40.7569072723864,40.7569226597988,40.7569380515265,40.7569525971795,40.7569671491338,40.7569748571218,40.7569752176824,40.7569825669316,40.7569877087881,40.7569962777875,40.7570245641608,40.7570314217354,40.7570357055742,40.7570536927837,40.7570870829757,40.7571213235584,40.7571392908459,40.7571871868352,40.7571991675115,40.757204304879,40.757209444236,40.757237728541,40.757238587725,40.7572608854053,40.7572695304729,40.7572780327757,40.7572814643719,40.7573097693248,40.7573166280407,40.7573354861253,40.7573500441561,40.7573620322657,40.7573663124248,40.7573894264695,40.7574065419911,40.7574476131635,40.757465581717,40.757479277565,40.7574921278269,40.7575058336075,40.7575204003795,40.7575221167535,40.7575238344425,40.7575255557839,40.7575264229155,40.7575299258402,40.7575325175995,40.7575333847296,40.7575359566219,40.7575376743074,40.7575402447229,40.7575882033002,40.7576327357487,40.7576515808122,40.757690121676,40.7577055313723,40.7577235023559,40.7577628577153,40.7577842458724,40.7578047804887,40.7578475686916,40.7578741072401,40.7578963743921,40.7579135171087,40.7579160894878,40.7579178071574,40.7579212486236,40.7579229848152,40.7579238667934,40.7579230418228,40.7579205054465,40.7579171135535,40.7579128661413,40.7578882001035,40.7578694710745,40.7578319994433,40.7578209312173,40.7578141251051,40.7578115775013,40.7578098809565,40.7578081855905,40.7578081979698,40.7578082078757,40.7578082177829,40.7578090794215,40.7578099428693,40.7578133768799,40.7578185191411,40.7578296535995,40.7578587582984,40.7578972860362,40.7579135472177,40.7579280927191,40.7579357865358,40.7579434813561,40.7579793710638,40.7579870653793,40.7579904875086,40.7579939084632,40.7579973325672,40.7579999019532,40.7580033260541,40.7580058989199,40.75800933787,40.7580110579937,40.7580119226057,40.7580119275546,40.7580213791101,40.7580548140228,40.7581504695632,40.7582529538047,40.7583409128492,40.758427131977,40.7585388591155,40.7586266275469,40.7587615004493,40.7589119191463,40.759024799277,40.7591505715463,40.7592908727012,40.7594501740359,40.7595274218228,40.7596012908741,40.7596828261139,40.7598790339378,40.7599766873548,40.7599816166627,40.7600656341216,40.7601563009175,40.7602238794377,40.7603086432933,40.7604687264758,40.7606116487699,40.7607263772803,40.7608384654184,40.7608503879479,40.7608954010843,40.7609472898789,40.7610212321813,40.7610950781508,40.761185671199,40.7612500833107,40.7613265305989,40.7613861845873,40.7614364849921,40.7615105291918,40.7615680254852,40.7616680536324,40.7616682585068,40.7616732753304,40.7615707635731,40.7615975268074,40.7615797470829,40.761540213373,40.7614781697673,40.7614067814246,40.7613777443254,40.7614398886086,40.7614975308269,40.7615379741041,40.7615760827397,40.7616404648094,40.7617569201395,40.7618349494158,40.7619154748216,40.7620591188232,40.7621979440518,40.7623007349987,40.7624060664095,40.7625224951399,40.7626294690689,40.7627616943668,40.7629490405715,40.7630385592112,40.7631608261247,40.7633157300872,40.7634391913064,40.7634927592685,40.7635287003539,40.763536296081,40.763536325761,40.7635363950111,40.7635578741964,40.763561191742,40.7635615786365,40.7636518273688,40.7638058610685,40.7639325933217,40.7640344387642,40.7641115012113,40.7641406164291,40.7641671590047,40.7642209609138,40.7642705784018,40.7642989588961,40.7643537502352,40.7644187655857,40.7644820374659,40.7645273769187,40.7645420183028,40.7645507637702,40.7645799740406,40.7646459042241,40.764722944412,40.7647666976778,40.7648172274352,40.7648719642767,40.7649531825268,40.7650378119553,40.7651019522589,40.7651323463595,40.7651607221497,40.7651866923857,40.7652671140945,40.7653339455862,40.7653573683082,40.7653866372661,40.7654160544221,40.7654451458213,40.7654608947978,40.7654617535724,40.7654649811413,40.7654729034094,40.7654810552465,40.7654900541771,40.7654945100613,40.7654948817354,40.765496499328,40.765496750923,40.7655029429957,40.7655313460686,40.7655459529275,40.7655682400767,40.7655947970563,40.7655974707719,40.765620476467,40.7656401977814,40.7656436353853,40.7656446503192,40.7656462201327,40.7656524899683,40.7656599879563,40.7656642850016,40.7656653446931,40.7656677210993,40.7656856981797,40.7656890596235,40.7657130705894,40.7657182002365,40.7657210524714,40.7657250264957,40.7657514653551,40.7657532192811,40.7657565939973,40.7657592839904,40.7657617152123,40.7657979838548,40.7658010774502,40.765838750025,40.7658730433347,40.7658939217003,40.765904788363,40.7659070475427,40.7659099504229,40.7659158905134,40.765921140389,40.7659221410273,40.7659237256305,40.7659261977507,40.7659271548024,40.7659760370176,40.7659880597496,40.7660112796862,40.7660215906174,40.7660370300148,40.7660550197258,40.7660755589198,40.7661166203891,40.7661337229899,40.7661366271246,40.7661533769104,40.7662174192256,40.7662177234961,40.7662404825673,40.7662426743013,40.7662609962574,40.7662789655468,40.7662959945901,40.7662995330519,40.7663109693242,40.7663192615354,40.7663195588803,40.7663381653142,40.7663521662906,40.7663562221447,40.7663605321586,40.7663639913183,40.7663804375577,40.7663839738103,40.7663856068328,40.7663916286327,40.7663935229703,40.7664130960324,40.7664362475637,40.7664590798811,40.7664602307089,40.7664850471282,40.7665894067102,40.7666421879627,40.766720285366,40.7667721495094,40.7667801685122,40.7667887591051,40.7668640194164,40.7668965415614,40.7669299361227,40.7669633525805,40.7669967803397,40.767010507354,40.7670251010369,40.7670310140922,40.7670852472239,40.7670975136632,40.7670998414017,40.7671144209162,40.7671623954451,40.7671803725709,40.7671882768134,40.7671983276247,40.7672476884731,40.7672701298059,40.7673039867316,40.7673317167,40.7673539483466,40.7673889794655,40.767429105167,40.7674293820322,40.7675331067874,40.7676637478064,40.7678478032742,40.7679910514697,40.7680157641974,40.7680211041545,40.7680277004587,40.7680473145482,40.7680694963785,40.7680933902343,40.7681207048277,40.7681292423278,40.7681505843192,40.7681803689904,40.7682086536177,40.7682260943705,40.7682325605953,40.7682475373202,40.7682539020514,40.7682614266156,40.7682999908544,40.7683187717331,40.7683189364102,40.7683238971604,40.7683273258946,40.7683281668701,40.7683332948539,40.7683365765644,40.7683384269524,40.7683423151214,40.7683478340407,40.7683683697615,40.7683702964776,40.7683786334519,40.7683822635717,40.7683829067261,40.7683853772567,40.7683871798299,40.7683875894224,40.7683914507122,40.7683957185353,40.7683999880341,40.7684010792372,40.7684042524559,40.7684085171736,40.7684127778253,40.768413618355,40.7684204408066,40.768442574811,40.7684441182715,40.7684468349568,40.768451096779,40.7684518407028,40.7684545062797,40.7684587722112,40.7684809607014,40.7685067195552,40.7685330352923,40.768548270148,40.7685552202149,40.7685625856558,40.7685782538455,40.7685953107336,40.7686048868535,40.7686098003728,40.7686208728354,40.7686269150011,40.7686319381214,40.7686381502255,40.768640433598,40.7686453341673,40.7686472190958,40.7686476351352,40.7686514402372,40.7686522734128,40.7686522470923,40.7686513732361,40.7686491451193,40.7686487294072,40.7686487248763,40.768648710258,40.7686487087074,40.7686487078657,40.7686495446506,40.7686498770302,40.7686537777379,40.7686541825773,40.7686546193076,40.7686597150044,40.7686610749229,40.7686690706146,40.7686799400149,40.7686809828916,40.76868540472,40.7686903504688,40.7686997216598,40.7687079957766,40.7687099470614,40.7687193261032,40.768729561082,40.7687389478113,40.7687447108778,40.7687483400486,40.7687512283404,40.7687534632513,40.7687551707841,40.7687577358549,40.7687611627026,40.7687637178881,40.7687649509953,40.7687662846359,40.7687688518895,40.7687714210335,40.7687731364687,40.7687762155545,40.7687774246179,40.7687808652345,40.7687834540353,40.768783461527,40.7687834636131,40.7687843369797,40.7687843578309,40.7687843615661,40.768784359966,40.7687839676727,40.7687752614047,40.7687728429977,40.7687728501729,40.7687733958143,40.7687737132781,40.768774154631,40.7687754384455,40.7687774579236,40.7687788723644,40.7687831569284,40.7687861510793,40.7687874426623,40.7687925766515,40.7687951438976,40.7687985622882,40.7687990992058,40.7688011254205,40.7688030649927,40.7688036891033,40.7688076914519,40.7688182074407,40.7688413245263,40.7688591999979,40.768936072187,40.7689399778644,40.7689437595733,40.7689496568795,40.7689523083421,40.7689882183539,40.7689922626574,40.7689959076308,40.7690018024892,40.7690035980757,40.7690386098216,40.7690787362084,40.7691649533019,40.7691936146079,40.7692212885239,40.7692286772584,40.7692366591801,40.7692511768507,40.7692617144271,40.7692742410627,40.7693027922334,40.7693229480324,40.7694066972216,40.7694126595123,40.7694314528377,40.7694510979883,40.7695048999532,40.7695603953176,40.7695817439344,40.7696048086506,40.7696273944281,40.7696347103237,40.769645109163,40.7696774290877,40.7697090439607,40.7697286427959,40.7697415229467,40.7697834067998,40.7697970833894,40.7698029197889,40.7698611915911,40.7698721570052,40.7698817081929,40.7698996635496,40.7699244694891,40.7699612671666,40.770028017197,40.7700805584376,40.770675053602,40.7709981546533,40.770981876686,40.7709700643021,40.7709450139564,40.7709855264944,40.7710172788762,40.7710054671624,40.7710221527438,40.7711518901893,40.7711866873914,40.7712825090925,40.771448699263,40.7715291259227,40.7715996804131,40.7716421353499,40.7716574387015,40.7717132289948,40.771831118261,40.7718307130066,40.771834906487,40.7718402668492,40.7718360785589,40.7718356709611,40.7717191746934,40.7717375115199,40.7717979152607,40.771870737752,40.7720412716422,40.7721303365339,40.772201766666,40.7723383770385,40.7723831213692,40.7724194655041,40.7724548872761,40.7725044314936,40.772570217951,40.7726316350122,40.7726946161293,40.7727695571326,40.7728626848093,40.7729591743141,40.7730564483266,40.7732078472609,40.7732722018087,40.7734899134641,40.7736648847328,40.7738222384132,40.7738668796444,40.7739729788297,40.7740555609262,40.7741457301085,40.7742243374328,40.7742724680917,40.7743062090752,40.7743967250921,40.7744694065534,40.7745108554909,40.7747104741482,40.7749174833217,40.7750446790469,40.7751185180931,40.7751299580397,40.7751842356672,40.7752668303653,40.7754195483559,40.7755491935454,40.7756290234276,40.7756839507017,40.7757067490442,40.7757189760408,40.7758362844872,40.7758551973224,40.7758779192365,40.7758985957846,40.7759376828401,40.7759912101342,40.776061197071,40.7761106048599,40.7761394116477,40.7761893221208,40.776246542711,40.7763125465628,40.7763773237428,40.776407195475,40.7764589308561,40.7764980708303,40.7765436732141,40.7765884219023,40.7766006791852,40.7766376161509,40.7766984471819,40.7767074476953,40.7767649857811,40.7768298461225,40.7768504719679,40.7768728308197,40.7768963995164,40.7769206265882,40.7769449451592,40.7769614698545,40.7769770874122,40.7769914967751,40.777004420176,40.7770157250146,40.7770247378237,40.7770438033628,40.7772016773563,40.7774669862017,40.7774850484619,40.7775074746918,40.7776130205784,40.7776190323056,40.7776357443254,40.7775839461739,40.7775841445225,40.7777040483642,40.7777008812502,40.7776535159125,40.777635995922,40.7776516158717,40.777688876766,40.777701797197,40.7777178122007,40.7777361446061,40.7777695079676,40.7777895957508,40.7778100608605,40.7779468701495,40.7779921062945,40.7781251565385,40.7782626939807,40.7784061114899,40.7784176159148,40.7785179351691,40.7785585160299,40.7785949594477,40.7786329632882,40.7786729692575,40.7787152922898,40.7789717412588,40.7790245689871,40.779146728652,40.7793841432376,40.7796038793947,40.7797626105804,40.7797787102639,40.7802340023881,40.7808660751885,40.7812894895222,40.7815180842781,40.7817810900659,40.7818712159459,40.7819997839284,40.7821174283092,40.7822350212694,40.7822813294286,40.7823382786307,40.7823523311301,40.7825287306358,40.7825981640434,40.7826272637828,40.782627027855,40.7826031213021,40.7824658923865,40.7823992748795,40.7823373118294,40.7822279674127,40.7821365738284,40.7820176121247,40.7819361384454,40.7818966443156,40.7817805942377,40.781535698341,40.7814183079516,40.7812765366669,40.7811857392725,40.7810665292255,40.7809564388987]}]],[[{"lng":[-73.746943206382,-73.7469397001251,-73.7469047397856,-73.7468779125462,-73.7468280291083,-73.7468085185123,-73.7467738977573,-73.7467945086395,-73.7446210730149,-73.7445149239263,-73.7440259471514,-73.7439906316605,-73.7443211473035,-73.7471166625671,-73.7474602099074,-73.7476038169861,-73.7477533982256,-73.7479087752626,-73.7480697628182,-73.748236168919,-73.7484077951259,-73.7515738419136,-73.7528415105018,-73.7541108667463,-73.7546575813913,-73.7574546223855,-73.7579393745807,-73.76277911964,-73.7635989728986,-73.7640629014157,-73.7641777017885,-73.7647545539745,-73.7656689709815,-73.7662800826662,-73.7666959390493,-73.7668759760595,-73.7672056655397,-73.7673909708656,-73.7677065346624,-73.7681199793464,-73.7683274016358,-73.768951778703,-73.7689965406991,-73.7689911301614,-73.7690490402092,-73.769743641745,-73.770286208232,-73.7721062607331,-73.7744768829416,-73.7745447294383,-73.7746032624106,-73.7752530803675,-73.7757740384892,-73.7759426865885,-73.7761158019386,-73.7762931311092,-73.776474414498,-73.7766593867108,-73.7768477768636,-73.7770393092753,-73.7772337035326,-73.7774306750304,-73.7776299353881,-73.7781347923249,-73.7782791535562,-73.7784216493244,-73.7785620757681,-73.7787002319852,-73.7788359205605,-73.7789689472066,-73.7790991216144,-73.7792262575534,-73.7793105067034,-73.7793694751359,-73.7829039833809,-73.7839398185867,-73.7841565762977,-73.7850251380631,-73.7861847037956,-73.7875117799428,-73.7881167984523,-73.7898434719976,-73.7899075998327,-73.7899673676853,-73.7900598003176,-73.7905783251857,-73.7911891908512,-73.7919946470631,-73.7925643312553,-73.7939431779478,-73.7952263042856,-73.7958191481579,-73.795890798775,-73.7964149265147,-73.7970129189816,-73.7976123758087,-73.7978588167746,-73.7998195446255,-73.801220509571,-73.8018004962112,-73.8018866747649,-73.8020320768996,-73.8018364641517,-73.8017029793769,-73.8016826655336,-73.8016057923137,-73.8015284675928,-73.8002640083731,-73.8000083910058,-73.7998270573683,-73.7993087296479,-73.7986684478486,-73.7981196214381,-73.7975311711846,-73.7969869082699,-73.7963786015381,-73.7958739653934,-73.7952869811172,-73.7949477091976,-73.7938312466941,-73.7930598086958,-73.7900299374484,-73.7894808966139,-73.7881416092969,-73.7875280945621,-73.7869186855416,-73.7868787584367,-73.7863041589221,-73.7859075824703,-73.7850689960425,-73.7844108856223,-73.7836648051584,-73.7824122428447,-73.7816168987204,-73.7803166723924,-73.7796624332781,-73.7792131093037,-73.7789686627138,-73.7784156101092,-73.7776921443559,-73.7769771393288,-73.7761539799492,-73.7752740919794,-73.7752069524185,-73.7744510767558,-73.7734358668527,-73.7722939722367,-73.7718800034976,-73.7715329052512,-73.7710884528857,-73.7701748198214,-73.7669902341904,-73.7662096331377,-73.7654426628721,-73.764403391469,-73.7634780225603,-73.7628615716047,-73.7625834337871,-73.761966576912,-73.7616801228422,-73.759971165375,-73.7590282767345,-73.7580419575247,-73.7579564366485,-73.7579189293433,-73.7576312961815,-73.757316927804,-73.7569953336142,-73.7567160246846,-73.7566845473024,-73.7564373429195,-73.7564062123614,-73.7564247873451,-73.7564612722833,-73.7564837456172,-73.7564638829438,-73.7563623925967,-73.7561823385891,-73.7560622901594,-73.75581771087,-73.7557616922747,-73.7556364696883,-73.7556223647356,-73.7554939240218,-73.7552345780572,-73.7548490967056,-73.7541785694589,-73.7539939508953,-73.7537259608402,-73.7534560422091,-73.7532868997966,-73.7532381712931,-73.7532105785222,-73.7526829098727,-73.7524705986931,-73.7522582861939,-73.7518040921566,-73.7515421552228,-73.7512579347298,-73.7510302062257,-73.750557614059,-73.7502561578794,-73.7500899113111,-73.7494454676422,-73.7488460144439,-73.7485699309448,-73.7475517543229,-73.7472861763531,-73.7462434557995,-73.7459533209743,-73.7451048500096,-73.7448795153754,-73.7448461056506,-73.7448792323999,-73.7453309842404,-73.7457314650401,-73.7460220095442,-73.7461815788437,-73.7464936723342,-73.7468190925791,-73.7471243688162,-73.7474186795521,-73.7477301211579,-73.7480407369862,-73.7483288087051,-73.7486428636018,-73.7489509461727,-73.7492501392002,-73.749556079175,-73.7498552299581,-73.7501552293658,-73.7504705818291,-73.7507743583769,-73.7512124697011,-73.7513702073877,-73.7513982866851,-73.7518426986276,-73.7523096398835,-73.7524596548407,-73.7531839938608,-73.7535751213263,-73.7536066185572,-73.7537083455682,-73.7540102453054,-73.7540478395502,-73.754075409734,-73.754353618376,-73.7547007835067,-73.7558887802178,-73.7572567144309,-73.7583272860686,-73.7591282421315,-73.7591950051836,-73.7594414294101,-73.7593851050134,-73.7586756908226,-73.7579743023855,-73.7572855504249,-73.7565465244302,-73.7557712100535,-73.7549691946279,-73.7540914239924,-73.7543963402084,-73.7546881382104,-73.7548784341632,-73.7550016504758,-73.7551681397904,-73.7555548669492,-73.7556625068433,-73.755908472002,-73.7561856596602,-73.756612219805,-73.7567032923354,-73.7566365811251,-73.7565525339654,-73.7561259878482,-73.7552758438404,-73.7544222251128,-73.754064692594,-73.7538070928292,-73.7534971274941,-73.7531916268874,-73.7528907647338,-73.7525947100116,-73.752219141375,-73.7519241349113,-73.7518423828998,-73.7517767991304,-73.7510675391817,-73.750810669395,-73.7504829564986,-73.7498098750692,-73.7491718855846,-73.7479342385097,-73.7474969286838,-73.7473312659008,-73.7470453150768,-73.7467214036271,-73.7461625945476,-73.7455536803748,-73.7447241770073,-73.7429478585603,-73.7422843119843,-73.7415894454279,-73.741516368396,-73.7414462859306,-73.7401695182886,-73.7398699553434,-73.7397224415904,-73.7393315136078,-73.7390121035239,-73.7385717593228,-73.7381604798647,-73.7375103806105,-73.736858942342,-73.7356078673722,-73.7353950876422,-73.7343696590925,-73.7337548485368,-73.7337063066621,-73.7336646151422,-73.732416946137,-73.7323273171628,-73.7322691805635,-73.7310646188084,-73.7306280183626,-73.7304313463387,-73.729931691068,-73.729646192304,-73.7295344898019,-73.7291459381016,-73.7290667097408,-73.7289618301044,-73.7287195280344,-73.7286220742307,-73.7284917856987,-73.7283779840264,-73.728253810495,-73.7280535563183,-73.7278840110042,-73.7277135618633,-73.7273788914016,-73.7270938962406,-73.7267773946019,-73.7266652997626,-73.7264147213715,-73.7260296634162,-73.725829888901,-73.7250944536574,-73.7250684805801,-73.7247582308592,-73.7238445185635,-73.7238269889925,-73.723518672625,-73.723441354726,-73.7232667341128,-73.722993013251,-73.7227970316873,-73.7226454352784,-73.7224109479736,-73.7220707143631,-73.7218028921022,-73.7217633963702,-73.7216135707177,-73.7215963147849,-73.7214587026136,-73.7212117612937,-73.7211100148293,-73.7209651171016,-73.7206331939909,-73.7203159529136,-73.719982969885,-73.719677323078,-73.7195646072074,-73.7191790962089,-73.7189705036507,-73.7187778771528,-73.7183197181875,-73.717672370657,-73.7168544044493,-73.7161384267906,-73.716125282335,-73.7149821402296,-73.7145568590179,-73.7142628773707,-73.7135182810599,-73.7133254207879,-73.7124494073072,-73.7108576899832,-73.7105449972654,-73.7078253863159,-73.7052712831666,-73.7034678191636,-73.7027349563764,-73.7021784167989,-73.7016938696175,-73.7016334589238,-73.7016221220492,-73.701347159168,-73.7011731654869,-73.7009012741335,-73.7008934002784,-73.7007796080665,-73.7005816403768,-73.7002922217535,-73.7000214039664,-73.7000090632127,-73.7000202043722,-73.7003183517693,-73.7008114709626,-73.7014707303812,-73.7020603635669,-73.7022808419969,-73.7026879452597,-73.7033149095269,-73.7035224902264,-73.7039446307764,-73.7046011435119,-73.7049953626658,-73.7052216576233,-73.7058473475467,-73.7064802819995,-73.7070997014254,-73.7076621730599,-73.7085694901585,-73.7104310957422,-73.7104999536207,-73.7105628561628,-73.7141039116818,-73.7149694480979,-73.7158797192858,-73.7161876827716,-73.716494081335,-73.7167986891995,-73.7171012819096,-73.7174016363839,-73.7176995314177,-73.7179947475078,-73.718287067127,-73.7203862725068,-73.7211926564569,-73.7217965885372,-73.7220463736031,-73.7225787930546,-73.722911703067,-73.7229571206864,-73.7229623344239,-73.7231516352961,-73.7234275402812,-73.7241967547207,-73.7245451879786,-73.7246342252152,-73.7247179242095,-73.7249016098383,-73.7250848905787,-73.7256719695944,-73.7264755945474,-73.7273282651796,-73.727971573862,-73.7281623392121,-73.7284960063421,-73.7288238352312,-73.7291443534112,-73.7294561427539,-73.7296518689654,-73.7297578845232,-73.7300483090278,-73.730326289681,-73.7303013197867,-73.729661031931,-73.7292418979373,-73.7291762951544,-73.7288375738651,-73.7285695153224,-73.7285529549538,-73.728522365303,-73.728501524541,-73.72736801316,-73.7273596177661,-73.7271887622913,-73.7269852021198,-73.7269714678306,-73.7269651552445,-73.7269000418874,-73.7268948748132,-73.7270469655292,-73.7269613562645,-73.7268949772598,-73.726835252952,-73.7267775953371,-73.7267284122114,-73.7267896122916,-73.7267130259289,-73.7266540915015,-73.7265443505858,-73.7265245222049,-73.7265114745604,-73.7265026929626,-73.7262625434881,-73.7262583124994,-73.7262588645552,-73.7262025974276,-73.7261749510041,-73.7261633831879,-73.7259961634151,-73.7259409855958,-73.72593196243,-73.7259263557322,-73.7258433000573,-73.7257978794231,-73.725801478934,-73.7258626418236,-73.7259066006047,-73.7258236759901,-73.7257985891968,-73.7257541912711,-73.7256873676077,-73.7256300511969,-73.7258410619058,-73.7260111608917,-73.7261946499739,-73.7262401352831,-73.7262943711882,-73.7263572690502,-73.726428723535,-73.7265431731976,-73.7267140299966,-73.7269938310577,-73.727141342039,-73.727440804587,-73.7275335842069,-73.7275561629064,-73.727535003023,-73.7277905018081,-73.7278835862699,-73.7279257285026,-73.7279998924634,-73.7281725558933,-73.728241311454,-73.7282221704064,-73.7282662078571,-73.7282727225497,-73.7282191195836,-73.7281425203863,-73.7281135139662,-73.7278578721934,-73.7278748669398,-73.7278090071723,-73.7277702925448,-73.7278335231988,-73.7278139239344,-73.7278175101589,-73.7283307187596,-73.7281528159182,-73.7280460790485,-73.7279312441149,-73.727591759063,-73.7272080203123,-73.726809786504,-73.7264443867425,-73.7262113990278,-73.7260287591169,-73.7259268774099,-73.7256623724025,-73.7255676977041,-73.7255497654665,-73.7255025907249,-73.7249847077882,-73.7250556911956,-73.725099345821,-73.7252260810702,-73.7264979017956,-73.7302865297218,-73.7305145730104,-73.732072630971,-73.733982598807,-73.7351350147231,-73.7367350863663,-73.7390448213143,-73.7414370597636,-73.7414389090016,-73.7414397962678,-73.7414476004277,-73.7414681120082,-73.7414852360659,-73.7416225820903,-73.7416614125175,-73.7420508488679,-73.7414227931496,-73.7422738722592,-73.7412590006758,-73.740331032634,-73.7395575963179,-73.7394712156082,-73.7398692139203,-73.7399595750441,-73.7400039041414,-73.7401745811947,-73.7402046119024,-73.7406594030945,-73.7406709619267,-73.7406651846279,-73.7407734904741,-73.7407622431204,-73.7407515090692,-73.740750476529,-73.7409092787867,-73.7408979578286,-73.7409699367394,-73.7409775478105,-73.7410355185554,-73.7410359964018,-73.741003435741,-73.7410090731667,-73.7410204905788,-73.7410306862775,-73.740945561025,-73.7409280442394,-73.7409091774957,-73.7409101985234,-73.7408049484004,-73.7407946528372,-73.7407742254765,-73.7407878120011,-73.7414432917507,-73.7414308992635,-73.7414442854066,-73.741412905495,-73.7414354507909,-73.7414567175553,-73.7414758845376,-73.7414882775369,-73.74164684545,-73.7417062098291,-73.7416959670253,-73.7416847342001,-73.7416434249556,-73.7416392535392,-73.7415583574047,-73.7415598513444,-73.7415063164798,-73.7415114017934,-73.7414888710594,-73.7414647372992,-73.7414872680117,-73.7415026099907,-73.7415439289615,-73.7415244372028,-73.741552589378,-73.7415637294683,-73.7416261580928,-73.7416145738256,-73.7416220849282,-73.74163696338,-73.7416979942779,-73.7416929626455,-73.7417018845614,-73.7417158227484,-73.7417693079242,-73.7417586535676,-73.741770383121,-73.7417986132242,-73.7417850007896,-73.7417716622889,-73.7417016314134,-73.7417193582408,-73.7417689924356,-73.7417877532228,-73.7417896065014,-73.7419170377674,-73.7419098324408,-73.7419225120595,-73.7419109274655,-73.7418874648509,-73.741881465982,-73.7419556483044,-73.7419630432563,-73.7419306601783,-73.7419389367889,-73.741976493114,-73.7419801789604,-73.7420284407194,-73.7420766353897,-73.7421239244825,-73.7421694852639,-73.7422125250678,-73.7422767203175,-73.7423382667307,-73.7423960557314,-73.7424490464192,-73.7424962843171,-73.7425369185639,-73.7425510506016,-73.7425615555178,-73.7425681401769,-73.742570620835,-73.7425689282673,-73.7425631097004,-73.7425533274947,-73.7425398546144,-73.7425230670106,-73.7425034331309,-73.7424836789464,-73.7424648811645,-73.7424476082519,-73.7424323825623,-73.7424196645394,-73.7424630864548,-73.7424730954828,-73.74250233638,-73.7424849758185,-73.7424591859473,-73.7424611762322,-73.7424272333788,-73.7423880051053,-73.7423654773219,-73.7424158673349,-73.7423912395264,-73.7424290274014,-73.7424366556818,-73.7425532913056,-73.7425853984359,-73.742436380205,-73.7424012521536,-73.742399294471,-73.7424075245044,-73.7424271766669,-73.7424223472874,-73.7423834350799,-73.7423660384749,-73.7423134040803,-73.7422968334174,-73.7423786223836,-73.7423929367299,-73.7424206531476,-73.7423721539235,-73.7423473268347,-73.7423728426177,-73.742328901186,-73.7422982525127,-73.7422590391429,-73.7422275132439,-73.7422530548094,-73.7422614237258,-73.7422455500211,-73.7422116912842,-73.7421642532747,-73.7421098248828,-73.742048615461,-73.7419808604497,-73.7419068204723,-73.7418530830867,-73.7417746111471,-73.741794933132,-73.7417499694806,-73.7417319335768,-73.7415876770313,-73.7416244759344,-73.7416202275854,-73.7415791197198,-73.741474570602,-73.7414935305285,-73.7414690191478,-73.7415030390689,-73.7415262790633,-73.7415509289841,-73.7415053877831,-73.7414831548753,-73.7414964246262,-73.7414606873598,-73.7414175218352,-73.7413972337303,-73.7412495918248,-73.7412573590277,-73.7412347149689,-73.7412898566471,-73.7412862665105,-73.7412320879926,-73.7411678073531,-73.7412181885352,-73.7412138500331,-73.7411614857111,-73.7411458666319,-73.7411881532555,-73.7411810066354,-73.7411374012685,-73.7410230900335,-73.7411179417445,-73.7411024469396,-73.741023775441,-73.7409787082064,-73.7409648768637,-73.7410942192873,-73.7411298950691,-73.741152784543,-73.7411730649558,-73.7411864435453,-73.7412009538615,-73.7412165879649,-73.7412333509219,-73.7412534595919,-73.7412907868505,-73.741303724911,-73.7413056658438,-73.7413182551544,-73.7413361518615,-73.7413484588492,-73.7413540421292,-73.7413596484625,-73.7413674833128,-73.7413719561146,-73.7413797936212,-73.7413829865628,-73.7413876439164,-73.7413966168832,-73.7413999840108,-73.7414022304511,-73.7414134617801,-73.741416831555,-73.7414202000014,-73.7414224420314,-73.7414246838416,-73.7414448634185,-73.7414538271192,-73.7414627914776,-73.7414851899293,-73.7415086956139,-73.7415814251785,-73.7416082861063,-73.7417224688215,-73.7418769647214,-73.7418904030561,-73.7419374796424,-73.7420249012169,-73.7421111981674,-73.7421974852488,-73.7422837706004,-73.7423879718548,-73.7424944092758,-73.7426041971993,-73.742716218246,-73.7427296630337,-73.7427644549706,-73.7428935019613,-73.7430236561582,-73.7431010700437,-73.7431807217734,-73.743261488907,-73.743344495219,-73.7435051766006,-73.7437388410157,-73.7439712849624,-73.7440381545062,-73.7437853783844,-73.7436606468547,-73.7435238926192,-73.7435222623819,-73.7435635500901,-73.7436474653792,-73.7436661124192,-73.7437342150463,-73.7437661835955,-73.7437868490737,-73.7438314892824,-73.7438464584798,-73.7440245088548,-73.7440280479543,-73.7440299754129,-73.7440256493742,-73.7440161136874,-73.7439662797157,-73.743959374556,-73.743956632636,-73.7439839192313,-73.7440357225226,-73.7440418353233,-73.7440451978797,-73.7440620216782,-73.7440786978076,-73.7440809439553,-73.744090803119,-73.7441122930937,-73.7441247678697,-73.7441832781468,-73.7441678709716,-73.744156297643,-73.7441577313485,-73.7442212441808,-73.7442633351235,-73.7444589673922,-73.7445050310441,-73.7445308373114,-73.7445532889307,-73.7445735039669,-73.7445813692433,-73.7445892362508,-73.7446027348112,-73.7446162416366,-73.7446500203473,-73.7446939616317,-73.7447289188652,-73.7447311719971,-73.7447323048636,-73.7447334562662,-73.7447323636809,-73.7447279674387,-73.7447279935795,-73.7446758574121,-73.7446865794609,-73.7447013059634,-73.7447037925836,-73.744674329365,-73.7447089599057,-73.7447138760467,-73.7447955814851,-73.7448389621327,-73.744712755117,-73.7447344746421,-73.7447427138136,-73.7447596472962,-73.7447799364705,-73.7448035844102,-73.7448114594325,-73.7448204516396,-73.7448406769869,-73.7448653806855,-73.7448923163628,-73.7449327040973,-73.7449685938785,-73.7450011098689,-73.7450302490283,-73.7450425730113,-73.7450560111387,-73.7450828745754,-73.7450833479325,-73.7451007854298,-73.7451175790956,-73.7451276632475,-73.7451366254048,-73.7451455936865,-73.7451466706037,-73.7451534451759,-73.7451635391132,-73.7451725195586,-73.745194969668,-73.7452257881081,-73.7452878075687,-73.7453095005182,-73.7453199080694,-73.745332330702,-73.7453445714967,-73.7453854460565,-73.7454006004633,-73.7454140881389,-73.7455320565953,-73.7456342919627,-73.7456713808442,-73.7457354656979,-73.7457613197752,-73.7458669503776,-73.7459220305851,-73.7459782539319,-73.7460063772045,-73.7460322562672,-73.746054775689,-73.7460735938911,-73.7460739313466,-73.7461014404632,-73.7461221412761,-73.7461435306222,-73.7461655987984,-73.7461883356296,-73.7462117333876,-73.7462365281768,-73.7462638571203,-73.7462921900067,-73.7463629009629,-73.7464308689639,-73.7464954765697,-73.7465561368644,-73.7466122987885,-73.7466807350242,-73.7467426908613,-73.7467631910028,-73.7467793619223,-73.7467907463806,-73.7467970224756,-73.7467980127441,-73.7467936891803,-73.7467841740285,-73.746769736327,-73.7466521856608,-73.746589869372,-73.7464818105477,-73.7464597351529,-73.7464539430192,-73.7463502037371,-73.7462067513302,-73.7461947212191,-73.7461388861924,-73.7461491720659,-73.7460362068704,-73.7459865386328,-73.7459674618141,-73.7457196111918,-73.7455363073641,-73.745492264095,-73.7454548133547,-73.7452713864293,-73.7452712998674,-73.7452379014123,-73.7452428031345,-73.7452448951909,-73.7451937774935,-73.7451681335059,-73.7451588677508,-73.7451621997371,-73.7451918200666,-73.7452161722481,-73.7452347922802,-73.7452473253772,-73.7452535327296,-73.7452537152606,-73.7452547324771,-73.7452576164886,-73.7452623022219,-73.7452686839502,-73.7452766176783,-73.7452859243923,-73.7452963940982,-73.745379805586,-73.7456731600425,-73.7455105825175,-73.7456650449018,-73.7457189569518,-73.7460201512612,-73.7461430025018,-73.7461572623632,-73.7461715382572,-73.7461854820224,-73.7461987535973,-73.7462110293141,-73.7462220097922,-73.7462887893466,-73.7463510240964,-73.7463578508616,-73.7463814839672,-73.7464089339532,-73.7464395090182,-73.7464470959582,-73.7464533957863,-73.746458322692,-73.746461686227,-73.7464828988755,-73.7465099920016,-73.74654231124,-73.7465719956633,-73.746608864082,-73.7466523971926,-73.7466790757272,-73.7467337866924,-73.7467816254318,-73.7468353068622,-73.7468939276613,-73.7469028739713,-73.7469142713771,-73.7469278054907,-73.7469431029851,-73.7469597418926,-73.7469772632443,-73.7469951837302,-73.7470100137691,-73.747023004408,-73.7470338408574,-73.7470422605277,-73.7470480593921,-73.7470510969311,-73.7470512995372,-73.7470509125495,-73.747042018701,-73.7470248493986,-73.7469998513829,-73.7470110239015,-73.7470378910967,-73.7470683485385,-73.7470668324994,-73.7471205352314,-73.7471363137449,-73.7471578161476,-73.7471492449572,-73.7471543585771,-73.7471301991938,-73.7471040262248,-73.7471215426247,-73.7470665547415,-73.7470648567124,-73.7470283632631,-73.7470062844618,-73.7469939119096,-73.7469998065659,-73.746943206382],"lat":[40.637529202177,40.6375542352153,40.6376319804351,40.6377479226099,40.6377836043961,40.6378006088721,40.6378532354732,40.6378716951649,40.6394461872735,40.6398622237486,40.6411537997528,40.6412470695419,40.6415831142638,40.6443718457897,40.64471575568,40.6448494288012,40.644979245241,40.6451050501743,40.6452266935595,40.6453440303174,40.6454569205046,40.6472593012057,40.6479793389674,40.6486976651584,40.6490120966032,40.6505813522893,40.6508533039385,40.6536219366957,40.6540909013783,40.6543562668311,40.6544215005823,40.6547468966045,40.6552534688908,40.6555782154991,40.655802847503,40.6558299853118,40.6558568305942,40.6558381686998,40.6557308884535,40.6556101976931,40.6556001151361,40.6556703691068,40.6556786357565,40.6557144745297,40.6557265855447,40.6559482547964,40.6562320931192,40.657478486007,40.6589018281002,40.6589381796209,40.6589699922588,40.6593200441285,40.6595671739484,40.65965855631,40.6597449586683,40.6598262545276,40.6599023248673,40.6599730583171,40.660038351381,40.6600981083457,40.6601522417218,40.6602006722528,40.6602433290318,40.6603590931561,40.6603945798054,40.6604341985495,40.6604778927086,40.6605255997728,40.6605772514111,40.6606327737113,40.6606920872454,40.6607551071615,40.6607856705753,40.6608118444399,40.6623853557278,40.6627828314206,40.662908590548,40.6634210723975,40.6636095530448,40.6638252434728,40.6639058808683,40.6641359922341,40.6641445380632,40.6641532888246,40.6641669075752,40.6642433008384,40.6643332337139,40.6644392769414,40.6645142759682,40.6647023883246,40.6648774254888,40.6649556274503,40.6649634816834,40.6650209300159,40.665073247268,40.665112528433,40.6651259895878,40.6652592619759,40.6652760575563,40.6652504410463,40.6652489173924,40.6652480253324,40.6658810937387,40.6662640702941,40.6663223525709,40.6663191854131,40.6663167738154,40.6662733954771,40.6662633605444,40.6662562369716,40.6662390891618,40.6662193926456,40.6662021767147,40.666183726289,40.6661711588822,40.6661642763963,40.6661564200896,40.6661577008222,40.6661622830918,40.6661805771446,40.6661932040816,40.6663276983717,40.6663676516217,40.6664785904247,40.6665294051331,40.6665855418631,40.6665898095678,40.666651220509,40.6666936091536,40.6667851046506,40.6668569048781,40.6669242770384,40.6670289866888,40.6670755227508,40.6671763718263,40.6672201318224,40.667250182699,40.6672665349925,40.6673035219654,40.6673519029135,40.6673907212974,40.6674354051205,40.6674540983191,40.6674555244903,40.6674715765186,40.6674599271148,40.6674468130344,40.6674249481372,40.6674053395036,40.6673893541188,40.6673154637619,40.6669716151109,40.6668781962599,40.6667864028128,40.6666720415289,40.6665702043647,40.6665023599371,40.6664717483847,40.6664038544264,40.6663723248568,40.6661842055746,40.6660804032886,40.6659702256372,40.6659554033968,40.6660125616196,40.6664511566071,40.6670403158804,40.6677412685644,40.6685625268752,40.6687585221339,40.6696663787421,40.6703729149189,40.6706335640968,40.6710940315838,40.6714898663732,40.6716840025685,40.6724292371103,40.6733723831302,40.6741968599303,40.67575274273,40.6758859094205,40.6762151785818,40.6762584734758,40.6766296731824,40.6772884092449,40.6779288383874,40.6788444857862,40.6790945072142,40.6794574278661,40.6798229563559,40.6800511448316,40.6801168860067,40.6801542881716,40.6808696168608,40.6811805143678,40.6814914114727,40.6824033234907,40.6830460426678,40.6837341259315,40.6842228673682,40.685071682496,40.6856131099465,40.6859234463587,40.6866720220613,40.6874474842651,40.6878037382071,40.6893473366572,40.6897371731037,40.691279444851,40.6916625651026,40.6927829348501,40.6930930777136,40.6931390561153,40.6932071819817,40.6941960574533,40.6950909418837,40.6957564370627,40.6961219259815,40.6967998738387,40.6975254521686,40.6981980346706,40.6988590284427,40.6995531363303,40.7002394336849,40.7008872105622,40.7015869393525,40.7022655651025,40.7029280059931,40.7036134515685,40.7042776917444,40.7049445805243,40.7056399305325,40.7063218369015,40.7073065795755,40.7076819076429,40.7077487195527,40.7088229209535,40.7099533868739,40.7103165636493,40.7120551756148,40.7129922961522,40.7130711226607,40.7133246367383,40.7138349013797,40.7138775399133,40.7139046952291,40.7142629751936,40.7147100533219,40.7162986441314,40.7181386016612,40.7195820898652,40.7206470410294,40.7207358075491,40.7210634437532,40.7210987066722,40.7215998160167,40.7220907361015,40.7225703223631,40.7230876094671,40.7236402158935,40.724159647309,40.7246919062893,40.7249214405119,40.7251111605688,40.7252210409408,40.7252865726764,40.725359040128,40.7255209269319,40.7255774665291,40.7257066612665,40.7258957432521,40.7262079265278,40.7262294326618,40.7262464107945,40.726270754933,40.7264302603588,40.7267154406002,40.7270421482329,40.7272010455232,40.727315531504,40.7274556294987,40.7276012935542,40.7277524406117,40.727908985978,40.7281123435807,40.7282800322624,40.7283265024008,40.7283680781811,40.7288176983399,40.7289950387789,40.7292212943939,40.7297467500573,40.7302990688401,40.7314011962218,40.7317910511832,40.7319387409959,40.7321936537058,40.732477150644,40.7329272200849,40.7334043180213,40.7340110302484,40.7354565515303,40.7360864083399,40.7367820094244,40.7368603610405,40.7369387463049,40.7384818975084,40.7388669013292,40.7390360895513,40.7394744746668,40.7397464791752,40.7400921232972,40.7403764358186,40.7407154477009,40.7410504010433,40.7416962195012,40.7418088441,40.7423515985612,40.7427476283125,40.7427825014306,40.7428131842682,40.7436945764047,40.7437714334179,40.7438189627454,40.7448883758843,40.7453641582395,40.7455848364248,40.7461881245902,40.7465619144726,40.7467163958914,40.7472737998128,40.7473909592462,40.7476328690356,40.7481970805566,40.7485120923062,40.7490447070445,40.7493811671894,40.7496937286457,40.750082150822,40.7503874833239,40.7506268946116,40.7510295673998,40.7513416042427,40.7516230921697,40.7517135882693,40.7519158778128,40.752174355186,40.752291720602,40.7527075918191,40.7527218443301,40.7529081483262,40.7534568116676,40.7534690887281,40.7537214379596,40.753790845185,40.753947599497,40.7542176709969,40.7544335381729,40.7546005240278,40.7549201892485,40.7554967031379,40.7560698974494,40.7561384666047,40.7563985948905,40.7564275043306,40.7566580805462,40.7569792084914,40.7571115258158,40.7572937891688,40.7576168355581,40.7578972586201,40.758160821513,40.7583724994122,40.7584505604206,40.7586664369445,40.7587832370366,40.7588716921729,40.7590820756754,40.7593112115204,40.7595255140197,40.7596582791953,40.7596607143073,40.7597828650221,40.7598088089902,40.7598267478674,40.7598377308309,40.7597301895698,40.7592417042187,40.7581950646408,40.7579910343249,40.7562164043244,40.7547704409511,40.7536833630354,40.7532505168082,40.7528859394974,40.7525368545441,40.7524933291904,40.7524255178912,40.7507805808717,40.7489243021238,40.7471285440806,40.7470572656252,40.7450414538002,40.7431838410859,40.741010602011,40.7394041661773,40.7393234126591,40.7392365417302,40.7389680825816,40.7384391523879,40.7375115609641,40.7364427566659,40.7361257966169,40.7354902222864,40.7345632568835,40.7342079448034,40.7335262617127,40.7325697474278,40.7319705575223,40.7316196302047,40.7306728543998,40.7297112987263,40.7287477145535,40.7278309345095,40.7276364179219,40.7272410619695,40.7272270874133,40.7272188718508,40.7267563359049,40.7266466103683,40.7265419056576,40.7265012269612,40.7264542043534,40.7264008724843,40.726341270653,40.7262754427947,40.7262034374028,40.7261253075361,40.7260411107663,40.7254745543822,40.7252665463892,40.7250860354402,40.7250196114389,40.7248776755337,40.7247939464662,40.7247824481086,40.7247811278044,40.7247332070367,40.7246633508996,40.7244546018606,40.7243600359046,40.7243364479079,40.7243126050022,40.7242544760628,40.724195613601,40.7240376589932,40.723752496388,40.7234119632414,40.7231591164937,40.7230841402854,40.7229907791208,40.7228836426954,40.7227630705237,40.722629528914,40.7225348581448,40.7224835794093,40.7223259148531,40.7221572967849,40.7220945169883,40.7204813842252,40.7193454595995,40.7191672145618,40.7179330185092,40.7169562927702,40.7168959461075,40.716784480638,40.7167055462257,40.7124111316229,40.7123889411133,40.7116926176865,40.7107763116538,40.7107145040335,40.7106607101172,40.7099968309999,40.7099785736194,40.7094987528105,40.7075490875973,40.7058001726043,40.7044056996457,40.7030592919015,40.7021457357555,40.701945452369,40.701446632614,40.7011126588927,40.6989826401661,40.6982580918721,40.697781192633,40.6968860740714,40.69077325317,40.6906108623216,40.6902689278962,40.6889843408107,40.68865003011,40.6884536176983,40.6869320542896,40.6863991053614,40.6863119408171,40.686225208255,40.6850154546012,40.6843538498251,40.684283780773,40.6832410809479,40.6826566051267,40.6816357506113,40.681386692625,40.680945913592,40.6802504548615,40.679587951284,40.6787521263589,40.6780783383318,40.6773855911724,40.6772210797204,40.6770581128022,40.6768969603986,40.676737888915,40.6764867291179,40.6760894619924,40.675438870362,40.675095875342,40.6744287413509,40.6742138636166,40.6741615876874,40.673930284795,40.6714895139628,40.6707964366237,40.6700971480202,40.6694050451439,40.6687174293387,40.6680240975001,40.6673136395573,40.6666062863441,40.6664295920836,40.6659145844532,40.6655143742763,40.6653453144369,40.6650679701841,40.6646951327175,40.6646140933382,40.664064398922,40.6639764374431,40.6632239694781,40.6631167834835,40.6630439437312,40.6624541425041,40.6623989965438,40.6617488351049,40.6610944877359,40.6604223211972,40.6597948561296,40.6591616154238,40.6584788173997,40.657998999374,40.6577313198555,40.6569903430917,40.6567251430814,40.6563922928124,40.6555165155723,40.6542534354056,40.6535078936419,40.6523457483118,40.6520010001475,40.6516635144002,40.6503685226744,40.6503103120065,40.6500874742202,40.6498522098002,40.6497320404669,40.6490998164975,40.6482011803444,40.64688917832,40.6463448439174,40.6460855762732,40.6459417176864,40.6455635270691,40.6452478332446,40.6427160274269,40.6421980616784,40.6414742045242,40.6405033907534,40.6401233814515,40.638897499435,40.6372603009562,40.635862534261,40.6357064318279,40.6352479127237,40.6351438098744,40.6353088647928,40.6352768658441,40.6352644711974,40.6352101791869,40.6352081861939,40.6351869366522,40.6351632000648,40.6351321134422,40.6351356624729,40.6351078316915,40.6350747080653,40.6350503323447,40.6350344066824,40.6350572160167,40.6350489031168,40.6350728201679,40.6350797038188,40.635097978714,40.6350975696916,40.6351175939735,40.6351382741896,40.635092578309,40.6351007971691,40.6351253230733,40.6351471348975,40.6351183016817,40.6351225348311,40.6351610348698,40.6350896707887,40.6350592646738,40.6350562107288,40.6349813118784,40.6349800050886,40.6350551527587,40.6350525158887,40.635082624468,40.6350471547252,40.635037546267,40.6350016904244,40.6349498170619,40.6349565148829,40.6349432815879,40.6349595592063,40.6349738394078,40.6349876571687,40.6350069683067,40.6350101340488,40.6349428893297,40.6349397235923,40.6349754976038,40.634962036699,40.6349119299478,40.6349109210412,40.6349416823386,40.6349328877973,40.6348956927193,40.6348942795678,40.6349289810027,40.6349176810648,40.6348844324586,40.6348823076239,40.6349359816355,40.6349264582781,40.6348813631154,40.6348810326208,40.6349811659342,40.6349829227358,40.6349359375127,40.6349477101437,40.6349971613787,40.6349886662097,40.635021719479,40.6350214036599,40.6349985434066,40.6349721232825,40.6349689360181,40.6349313831271,40.6349331173284,40.6349073713678,40.6348918129038,40.6349207777176,40.6349239219385,40.6349675428519,40.6349608365033,40.6349783571103,40.6349763153541,40.6349791303912,40.6349867532456,40.6349990512952,40.635015810579,40.6350275911969,40.635045814438,40.6350701520654,40.6351001657097,40.6351353147641,40.6351749661218,40.6351906633417,40.635207933688,40.6352262952433,40.6352452356401,40.6352642263582,40.6352827374731,40.6353002524425,40.6353162825208,40.6353303803973,40.6353421526777,40.6353450449,40.6353505005046,40.635358354508,40.6353683693958,40.6353802423061,40.6353910250866,40.6353503053958,40.6353531699606,40.6354325320715,40.6354292585868,40.6353995983056,40.635394361538,40.6354986522527,40.6355542229967,40.6355691171621,40.6356303001268,40.6356395211542,40.6356413815658,40.6354414597271,40.6354533566612,40.6357127551075,40.6356986751598,40.6356978907579,40.6356853182,40.6356552979282,40.6356537483539,40.6356412623409,40.6356961265499,40.6356879844579,40.6357389110572,40.6357677753385,40.6357415133589,40.6357495665948,40.6358165463661,40.6358104972116,40.6357749800512,40.6357625080488,40.6358127076857,40.6358025655278,40.635856619535,40.6358626160374,40.6358648855519,40.6358935127154,40.6358834046583,40.6359704273445,40.6360550423093,40.6361369240508,40.6362157575802,40.6362912396337,40.6363073566081,40.6363798512413,40.63639378438,40.6364272813919,40.6364164473099,40.6365585458405,40.6365841821024,40.6365909631861,40.6365669746057,40.6366699598826,40.6366788835683,40.6367086118072,40.6367270339141,40.6367025454699,40.6367176116631,40.6367665911698,40.6367542599546,40.6367389325504,40.6367175701278,40.6367611516211,40.6367503842924,40.6369397007699,40.6369412102631,40.6369885142914,40.6370038516968,40.6370099902665,40.6369958583894,40.6371282836105,40.6371442186327,40.6371500695435,40.6371337820972,40.6371630690749,40.6371953293686,40.6371993163937,40.6371683392504,40.6372720124605,40.6374681497943,40.6374713318046,40.6373128286458,40.637320231943,40.6373047750301,40.6376463551761,40.63771433358,40.6377428580379,40.6377627068143,40.6377823825753,40.6377994988576,40.6378157624305,40.6378303205812,40.6378491584204,40.6378860331623,40.6378988129185,40.6379004141735,40.6379108030042,40.6379219482723,40.637928808802,40.6379318060611,40.6379348132559,40.637938248139,40.6379416737846,40.6379442534363,40.6379442606174,40.637944271092,40.6379434382132,40.6379425910516,40.6379417418722,40.6379366425788,40.6379349418613,40.6379340947021,40.6379340997438,40.637934104785,40.6379350048949,40.637936733345,40.6379384624659,40.6379453451672,40.6379556476139,40.6379951028817,40.6380079765476,40.6380560661763,40.6381179118832,40.6381222135403,40.6381265895199,40.6381361817234,40.638146625402,40.6381596305152,40.6381734907961,40.6381933699328,40.6382149629478,40.6382399794519,40.6382675633739,40.6382701559817,40.6382616920066,40.6382355009522,40.6382127301581,40.6382009445661,40.6381900181515,40.6381808041427,40.6381724471285,40.6380839724638,40.6379691810837,40.6378800126149,40.6379860766226,40.6384287305723,40.6386471559027,40.6388866326333,40.6388894863748,40.638941682376,40.6389888483481,40.6389959995201,40.639022117664,40.6390203224613,40.6390057112132,40.6389597810222,40.6389553941113,40.6386620060729,40.6386561730462,40.6386529966278,40.638651566853,40.6386484143378,40.6386319394746,40.6386287681849,40.6386203355294,40.6385585575775,40.6384412763244,40.6384354977772,40.6384350946479,40.638433073496,40.6384349210994,40.6384349463694,40.638435058442,40.6383793703115,40.6383470429922,40.6381954225573,40.638191574143,40.638184220332,40.6381805899814,40.6380197043964,40.6379544130468,40.6376551193112,40.6375805334688,40.6375763204861,40.6375695368486,40.6375610399434,40.6375567870952,40.6375516795164,40.6375406056633,40.6375269687977,40.6374903150475,40.6374348914313,40.6373828651147,40.6373803080925,40.6373768938494,40.6373692088256,40.6373615181501,40.637338446656,40.637331613198,40.6373138319929,40.6372957532648,40.6373014045561,40.6372939195113,40.6372851152676,40.6372283902096,40.637228401124,40.6370750290762,40.6370869850748,40.6373070468943,40.637313227016,40.6372940630451,40.6372642048804,40.6372360624566,40.6372096364488,40.6372028204097,40.6371968610807,40.6371858016247,40.637176460397,40.6371696873126,40.6371637976236,40.6371613147025,40.6371613868151,40.637164868189,40.6371674580418,40.6371717593288,40.6371837762824,40.6371839798746,40.6371915035677,40.6371983748125,40.6372001049573,40.6372018332845,40.637202706723,40.6372025921745,40.6372018705632,40.6372010387025,40.6371984965806,40.637191712312,40.6371636305004,40.6371297038506,40.6371165713738,40.6371117553445,40.6371066479205,40.6371018200338,40.6370808826185,40.6370760013694,40.6370674894209,40.6370053975177,40.6369526655613,40.6369296846927,40.6368837022776,40.6368666758214,40.6368054093536,40.6367688013005,40.6367262181369,40.6367023631222,40.6366785038141,40.6366537833517,40.6366294884446,40.6366290549541,40.6366041243626,40.6365794893318,40.63655520009,40.6365312636513,40.6365076954058,40.6364845035449,40.636462655331,40.6364422191115,40.6364372679825,40.6364566468417,40.6364810660684,40.6365103038327,40.6365440945317,40.6365821312022,40.6366475188466,40.6367165545718,40.6367349197784,40.6367556420782,40.6367781355454,40.6368017641739,40.6368258598599,40.6368497412929,40.6368727332195,40.6368941855369,40.6370329902415,40.6371132639232,40.6372004920539,40.6372279786469,40.6372598208813,40.6373292413477,40.637404511645,40.6373996262433,40.6374337854925,40.6374497373783,40.6375218364239,40.6375368445498,40.6375211449612,40.6376523358983,40.6377696312171,40.6377959897852,40.6377986176782,40.6379159012454,40.6379385774692,40.6379617195057,40.6379773878107,40.6379860314231,40.6380091348591,40.6380430926544,40.6380774122521,40.6381121879731,40.6381397702723,40.6381701970209,40.6382028884832,40.638237221772,40.6382725427165,40.6382749047797,40.6382844571613,40.6382937857041,40.6383026799216,40.6383109391273,40.6383183769627,40.6383248256023,40.6383301395408,40.6382924615009,40.638124657428,40.6379438810334,40.6378363259436,40.6378240265713,40.6376438215166,40.637580922902,40.6375818521671,40.6375810788397,40.6375786217798,40.6375745409103,40.6375689357558,40.637561943015,40.6375264008985,40.6374863570571,40.6374792559786,40.6374594486467,40.6374427399799,40.6374295510729,40.637423250769,40.637416175003,40.6374083807278,40.6374001180196,40.637369946015,40.6373426421437,40.6373188658541,40.637271326941,40.6372268018522,40.6371859177214,40.6371629514534,40.6371088749687,40.6370511406719,40.6369932107298,40.6369381293077,40.6369262797345,40.6369157215936,40.6369067461217,40.6368996008991,40.6368944830199,40.6368915336563,40.6368908341635,40.6368989811979,40.6369087828243,40.6369200015303,40.6369323654645,40.6369455750241,40.6369593101153,40.6369732379091,40.6370135675781,40.6370533251495,40.6370914761127,40.6371270277604,40.6371287063577,40.6371327421065,40.6371373188243,40.637143166279,40.6371512410253,40.637058060807,40.6370605235258,40.6371258313464,40.6371263636066,40.6372168608447,40.6372112592413,40.637162275708,40.6371542497343,40.6371609992684,40.6371556731475,40.6371524505643,40.6371506451869,40.637354391911,40.637529202177]}]],[[{"lng":[-73.835900721417,-73.8357035139729,-73.8353995615279,-73.8348761972718,-73.8343772846659,-73.834047919776,-73.8344103057214,-73.8348123068994,-73.8363117940522,-73.8363696429638,-73.836391679472,-73.8365310312022,-73.836573390022,-73.8365763662954,-73.8365856505032,-73.8366260416097,-73.8369232207586,-73.8369448968254,-73.8369509368217,-73.8369679679288,-73.8373661358879,-73.8373827978206,-73.8374029131513,-73.8374093620758,-73.8374296234805,-73.8374402849152,-73.8374520301377,-73.8374571648824,-73.8374668178907,-73.8375010765286,-73.8381154639458,-73.8382490770014,-73.8382842883624,-73.8371470292285,-73.837843159085,-73.838081378743,-73.8381090773705,-73.8381285312553,-73.8381396038401,-73.8381422174135,-73.8381363534196,-73.8381220533075,-73.8380994175054,-73.8380686049643,-73.8378459516089,-73.8373309565426,-73.83696237745,-73.83856418283,-73.8394781524145,-73.8415637809442,-73.8421584479979,-73.8423651228293,-73.8423652895894,-73.8423654433828,-73.8425650701426,-73.8425652600801,-73.8425654377089,-73.8427564879882,-73.8427566424662,-73.8427567833131,-73.8429378956652,-73.8435939812998,-73.8442735217034,-73.8450247287711,-73.8470040531641,-73.8478966979251,-73.8482091285539,-73.849138372429,-73.8507084225627,-73.8510378068372,-73.8541011646925,-73.8544142783975,-73.8544996463028,-73.8543747078542,-73.8538625040373,-73.8533848640604,-73.8528326227881,-73.8527739700244,-73.8527320843455,-73.8527076981109,-73.8527011098125,-73.8527121632538,-73.8527451168608,-73.852835443863,-73.8547879606038,-73.8556742185687,-73.8565718515049,-73.8574444773962,-73.8583307891721,-73.8592849835958,-73.8601636430352,-73.8623683420772,-73.8636865642969,-73.8645570888365,-73.8668143382809,-73.8684051894918,-73.8689176275678,-73.8705140361971,-73.8705545830779,-73.8705739316604,-73.8703416191591,-73.8702112900175,-73.8701174316062,-73.8699033016364,-73.8694786510802,-73.8692700488922,-73.8691505174281,-73.869043054218,-73.8689484527443,-73.8688673074056,-73.8686502416753,-73.8683317597814,-73.8682546171208,-73.8681850269878,-73.8681129138768,-73.8680230761879,-73.8678684597139,-73.8676959937506,-73.8675068605491,-73.8673025313442,-73.8670847383692,-73.8668905494134,-73.8668554454553,-73.8666167732328,-73.8659355955898,-73.8654285679917,-73.8652378763399,-73.8646174232949,-73.8644898364108,-73.8639599298141,-73.8635709250918,-73.8631813516721,-73.8629210432223,-73.8627929587684,-73.8624074743969,-73.8622049653039,-73.8609387576988,-73.8605650630781,-73.8601307335372,-73.8597750087561,-73.8592241210709,-73.8588871191326,-73.8585456206014,-73.8583102747183,-73.8581989070063,-73.8582349496568,-73.8589322439911,-73.8582740576156,-73.8573922105983,-73.8572793404126,-73.8572276271792,-73.8563093401744,-73.8553891051467,-73.8552957150926,-73.8552927590464,-73.8551810971139,-73.8526653541771,-73.8525201905444,-73.8530566390123,-73.8537121987122,-73.8538948015939,-73.8539215421986,-73.8539610547933,-73.854112647798,-73.8547082395536,-73.854699434123,-73.8547165251997,-73.852753706286,-73.8526822571381,-73.8511012167543,-73.850590510987,-73.8504290537064,-73.8495120740421,-73.8493315621403,-73.8491459157301,-73.848957126142,-73.848767252333,-73.8485783880685,-73.8476241018882,-73.8466572411161,-73.8461595844368,-73.8456719821516,-73.8452889856384,-73.8449101116967,-73.844537388464,-73.8441728125617,-73.8438182573482,-73.8435697335957,-73.8434863043221,-73.8432588089117,-73.843146253013,-73.8429909127847,-73.8427189027115,-73.8426306799134,-73.8413393660909,-73.8406915419902,-73.8402420632721,-73.840191993236,-73.8397802516746,-73.8397243990885,-73.8395231273259,-73.8380575612948,-73.8377089419937,-73.83736817904,-73.8370370836197,-73.8370368821731,-73.8370366930364,-73.8367168530655,-73.8367166161094,-73.8367163908027,-73.8364090261818,-73.8364088015291,-73.8364085761741,-73.8361147658281,-73.8360278645999,-73.836005107525,-73.8359770711086,-73.835900721417],"lat":[40.7116413707688,40.7114646345007,40.7111922371615,40.7107231935459,40.7103027602552,40.7100293917755,40.7098464286569,40.7096433509599,40.7088372559869,40.7088915572839,40.7089120393388,40.7090415917049,40.7090832229207,40.7090853554134,40.7090945108954,40.7091343750677,40.7094076351508,40.7094245879593,40.709428224989,40.7094357214998,40.709604945203,40.7096118388699,40.7096201427989,40.7096208660767,40.709620460462,40.7096159923195,40.7096071091837,40.709602451971,40.7095923462805,40.7095493352663,40.7086650885321,40.7084640364838,40.7084093586259,40.7079570462625,40.7069519253094,40.7065620434741,40.7064879826599,40.7064124171869,40.7063358775998,40.7062589012806,40.7061820288086,40.7061057997818,40.7060307493963,40.7059574045712,40.7056295408818,40.7048549764566,40.7042124523322,40.7032969693934,40.7026901943316,40.7011005987176,40.700902563635,40.7008325439617,40.7008324904137,40.7008324281366,40.700750735857,40.7007506548659,40.7007505661518,40.7006577681377,40.7006576953068,40.700657615421,40.7005544292202,40.7001723519251,40.6997805061122,40.6993593770162,40.6988252110124,40.6986003293224,40.6985184085461,40.6982827412019,40.7002031251044,40.7002332854879,40.7005137488268,40.7005436911184,40.7005518549602,40.700420652783,40.6998648552405,40.6992542988145,40.6984077665833,40.6982650980146,40.6981181201147,40.6979685615504,40.6978182549633,40.6976690012452,40.697560750099,40.6975489621307,40.6972966237558,40.697179357049,40.697064691022,40.6969129847168,40.6967437106509,40.6965537112189,40.6963846579409,40.695950143246,40.6956914183774,40.6955204565116,40.6950653508091,40.6947311862439,40.6951465615148,40.6975990705662,40.6976598743711,40.6976889006651,40.6977718562824,40.6978277570425,40.697868012383,40.6979766243612,40.698257905675,40.6984480637176,40.6985835179112,40.6987251460306,40.6988719840545,40.6990230152974,40.699759639585,40.7008241331062,40.7009779599717,40.7010930557246,40.7012043125006,40.701321177326,40.701495006793,40.701660727143,40.7018167769618,40.7019617486236,40.7020944040107,40.7021954664947,40.7022137363015,40.7023189457641,40.7025360879046,40.7026535745541,40.7026977612825,40.7027811816812,40.7027983351115,40.7028120723206,40.70282000485,40.7028117445371,40.702795356548,40.7027872924558,40.7027467860454,40.7027093527079,40.7024848986747,40.7024379260682,40.7024221897877,40.7024450985606,40.7025329459159,40.7026210537247,40.7027477508212,40.7028562524738,40.7029110743658,40.7028328906715,40.7013203447589,40.7012236592381,40.701213978868,40.7012125133222,40.701651719352,40.7018235547299,40.7019769163009,40.7019910096105,40.7025955017877,40.7025832673792,40.7023076309691,40.7022917236176,40.7031370466141,40.7039178878835,40.7041834191978,40.7042246126051,40.7042642171313,40.7044259340715,40.7052109741452,40.7067425546217,40.7067694963278,40.707397147062,40.7074181453227,40.7079009830216,40.7080398834242,40.708087067055,40.708345661375,40.7083883336808,40.7084193204789,40.708438137523,40.708444578931,40.7084387208288,40.7083326229842,40.7083186423409,40.708350820549,40.7084103661249,40.7084766794978,40.7085603313705,40.708661054971,40.7087784213437,40.7089118196223,40.7090196089831,40.7090557752932,40.7091681796368,40.7092234564188,40.7092869276406,40.7093980733765,40.7094329772343,40.7099462343632,40.7101532140614,40.7102619316906,40.7102768294158,40.7103855240801,40.7103987655874,40.7104964514565,40.7109208727847,40.7110364842713,40.7111669287835,40.7113116142325,40.7113117050822,40.7113118036555,40.7114700753335,40.7114701919314,40.7114703162521,40.7116414996779,40.7116416261768,40.7116417697625,40.7118251468743,40.7117490639129,40.7117296715407,40.7117059569769,40.7116413707688]}]],[[{"lng":[-73.915133319182,-73.9150971106472,-73.9150553874018,-73.9149819671475,-73.9149089072476,-73.9148811142976,-73.9148613737012,-73.9148490627048,-73.9148396445783,-73.9148224973119,-73.9147966455588,-73.9147763034479,-73.914758227511,-73.9147368970149,-73.9147271941806,-73.9147090981123,-73.9146936049053,-73.9146813399378,-73.9146593741191,-73.9145744453553,-73.9145518229784,-73.9145317636042,-73.9145187944734,-73.9145100277956,-73.9145022307247,-73.9144879570341,-73.9144730675133,-73.9144484860091,-73.9144106863387,-73.9143022162539,-73.9142751008004,-73.9142566771619,-73.914245349679,-73.9142256135202,-73.9142130074535,-73.9141913886114,-73.9141659222066,-73.9141091490558,-73.9140855711148,-73.9140555096976,-73.9140318838635,-73.9140156926837,-73.913995958737,-73.9139756147861,-73.9139460155849,-73.9139117166535,-73.9138737347761,-73.9138331959138,-73.9137913018271,-73.9137492944507,-73.9137084190775,-73.9136698874435,-73.9136658534681,-73.9136627790999,-73.9136607481348,-73.9136598159296,-73.9136600078929,-73.9136613187929,-73.9136637128994,-73.9136671249584,-73.9136714619699,-73.9136685417355,-73.9136648170473,-73.913660378429,-73.9136553337558,-73.9136498056321,-73.9136439284122,-73.9136378449347,-73.9136317030512,-73.9136256520324,-73.913561806864,-73.9134996167748,-73.913440300483,-73.9133850203874,-73.9133092605195,-73.9132359622219,-73.9131657577768,-73.9130992527758,-73.9130370208962,-73.9129795989523,-73.9129033815855,-73.913847871606,-73.914122348,-73.9143631573804,-73.9147195183528,-73.9150832214209,-73.9154533335453,-73.9158289001943,-73.915944601434,-73.9170698269373,-73.9170403780771,-73.9170339610201,-73.9170276376191,-73.9170287371855,-73.9170400432002,-73.9170390377449,-73.9170290190665,-73.9170226643395,-73.9170237711214,-73.9170269941501,-73.9170147907954,-73.9169930377723,-73.9169759868208,-73.9169589459718,-73.9169291171968,-73.9169024583747,-73.9168918212955,-73.9168795944798,-73.916852448207,-73.9168274673989,-73.9167944025174,-73.9167762265553,-73.9167618179399,-73.9167469028879,-73.9167293501976,-73.9166910012725,-73.9166426187406,-73.9165856373618,-73.9165377373791,-73.9164717388202,-73.9164094258579,-73.916365244573,-73.9163285089401,-73.9162854261934,-73.9162550797345,-73.9162332212097,-73.9162180277741,-73.9162066946854,-73.9161895191418,-73.9161369879014,-73.9161123387012,-73.9160802627422,-73.9160553103666,-73.9160309865432,-73.9160047045846,-73.9159719458552,-73.9159447363411,-73.9159172454699,-73.9158897898531,-73.9158616783661,-73.9157999169683,-73.9157840515783,-73.9157645926605,-73.915756120954,-73.9157518442222,-73.9157240720084,-73.9157078300645,-73.9156938771774,-73.9156611496352,-73.9156038536518,-73.9154990107901,-73.9154695670438,-73.9154494894382,-73.9154348830657,-73.9154131303429,-73.9153872628821,-73.91535428833,-73.9152779635083,-73.9152491567722,-73.9152332859743,-73.91522159402,-73.9152112096578,-73.9151943677029,-73.9151659108836,-73.9151520415639,-73.915133319182],"lat":[40.5862693854007,40.5862665836933,40.58626722046,40.5862692575949,40.586262172972,40.5862576662828,40.586260576051,40.5862657233166,40.5862750683323,40.5862765065944,40.5862715111327,40.5862643107088,40.5862561292348,40.5862528707084,40.58625284709,40.5862495958171,40.5862424083595,40.5862364599992,40.5862304880149,40.5862009375446,40.5861971828063,40.5861993516331,40.5862067173012,40.5862150780366,40.5862231952348,40.5862337614163,40.5862366834395,40.5862371157935,40.5862281450888,40.5861827569063,40.5861711009219,40.5861683428751,40.5861707806863,40.5861724578344,40.5861706999184,40.5861593055107,40.5861402573228,40.5861060914957,40.5860988824993,40.5860953559716,40.586099241398,40.5861041332044,40.5861058098121,40.5860986085748,40.5860757711297,40.5860571430782,40.5860432766428,40.5860345828891,40.5860313195403,40.5860335833371,40.5860413071701,40.5860542620692,40.5860584538249,40.5860630944587,40.5860680574845,40.5860732076288,40.5860784045178,40.586083506504,40.5860883745262,40.5860928759003,40.5860968879355,40.5861010080283,40.5861047320327,40.5861079694413,40.5861106415731,40.586112683485,40.586114045551,40.5861146946676,40.5861146150589,40.5861138086597,40.5861081881798,40.586095825669,40.5860769633916,40.5860519709852,40.586034428581,40.5860116032495,40.5859836918861,40.5859509352593,40.5859136159331,40.5858720558297,40.5858106764392,40.5852318404784,40.5851097007037,40.5850068246937,40.584869066249,40.5847426679417,40.5846279347572,40.5845251540852,40.5846661618891,40.5857369821111,40.5857590048785,40.5857606735291,40.5857704414578,40.5857789572706,40.5857984419045,40.5858142869506,40.5858338277214,40.5858415656729,40.5858460431938,40.5858553844499,40.5858680033358,40.585883109835,40.5858888549998,40.5858905379155,40.5858914359225,40.5858915138125,40.5858976252993,40.585904173222,40.585915235988,40.5859230329885,40.5859206869234,40.5859138259938,40.5859134521851,40.5859139002422,40.5859184384598,40.5859283067923,40.5859475550103,40.5859615197883,40.5859738751461,40.5859935683525,40.5860075824415,40.5860162348491,40.5860297575494,40.5860469525497,40.5860547689704,40.5860481605857,40.5860454025279,40.5860466024858,40.58605173261,40.5860735335853,40.5860850553543,40.5860931016568,40.5861001814842,40.5861112121096,40.5861251956801,40.5861403944575,40.5861459876292,40.5861434401658,40.586133490936,40.586125760817,40.5861174372743,40.5861193651351,40.5861279409429,40.5861395111834,40.5861533128082,40.5861945303147,40.5862068167364,40.5862144233928,40.5862234545083,40.5862279720861,40.5862284028108,40.5862275758392,40.5862309701231,40.5862395610052,40.5862540523723,40.5862527547417,40.5862499615278,40.5862502659655,40.5862558655012,40.5862614960175,40.5862730556338,40.5862814135536,40.5862872892812,40.5862862329423,40.5862778154041,40.5862693854007]}],[{"lng":[-73.9199006433604,-73.9199631960034,-73.9199835610963,-73.9199877139095,-73.9199833296921,-73.9199718826697,-73.9199146361374,-73.9198650516551,-73.9198196741477,-73.9197724993102,-73.919690043808,-73.9196674291977,-73.9196387882034,-73.9195585916136,-73.9195128009455,-73.919485668104,-73.9194634744964,-73.9194367504256,-73.9193981785875,-73.9193569467423,-73.9193310968869,-73.91928832602,-73.9192658578634,-73.9192376961938,-73.919202648972,-73.91917567514,-73.9191585690273,-73.9191477699326,-73.9191424471691,-73.9191411605704,-73.9191359504542,-73.9191274227276,-73.9191157221529,-73.9190990836608,-73.9190822941847,-73.9190712317762,-73.9190561420666,-73.9190359091714,-73.9190170521918,-73.9189964313295,-73.9189739346452,-73.9189614407331,-73.9189494839437,-73.9189416667214,-73.9189345003427,-73.9189278061892,-73.9189230622087,-73.9189238994985,-73.9189317929633,-73.9189393629621,-73.9189446669312,-73.918943347467,-73.9189367403539,-73.9189236534879,-73.9189090103476,-73.9188916996777,-73.9188726171174,-73.9188568793002,-73.9188439458921,-73.9188356158988,-73.9188340934144,-73.9188309929433,-73.9188174828058,-73.9188027532796,-73.9187897589134,-73.9187729061907,-73.9187526297541,-73.9187229202248,-73.918693973028,-73.9186588759807,-73.9186246466749,-73.918601938001,-73.9185943122042,-73.9185880918601,-73.9185809834588,-73.9185740177185,-73.9185676996967,-73.9185602220429,-73.9185479546135,-73.9185248192156,-73.9185162581544,-73.9185010135044,-73.9184587927519,-73.9184567146926,-73.9184602497122,-73.9184655087395,-73.9184735379482,-73.9185086679878,-73.9185139615107,-73.9185151877483,-73.9185139330123,-73.9185095875011,-73.9185056337515,-73.9185015438579,-73.918502023378,-73.9184996222335,-73.918492504028,-73.9184453406403,-73.9184354828305,-73.9184241817476,-73.9183999537187,-73.9183825284197,-73.9183734172165,-73.9183657432805,-73.9183647682736,-73.9183618857569,-73.9183584628583,-73.9183499664369,-73.9183307496015,-73.9182676695605,-73.9182424763975,-73.9182276816967,-73.9182039982093,-73.9181882663925,-73.9181744468988,-73.9181672520988,-73.9181591250102,-73.9181494507976,-73.9181344116776,-73.9181046173185,-73.9180765125408,-73.9180458532651,-73.9179944280496,-73.9179612335588,-73.9179206484543,-73.9178865272079,-73.9178644649358,-73.9178371500943,-73.9177917663746,-73.9177729838564,-73.9177590252434,-73.917739058459,-73.9177305676084,-73.9177162426041,-73.917708719408,-73.9176780486537,-73.9176619593623,-73.9176466643518,-73.9176329168621,-73.9176158979435,-73.9176011471583,-73.9175886636265,-73.9175762556133,-73.9175613302918,-73.9175468708204,-73.9175284169118,-73.9175129083159,-73.9174582784191,-73.9174319344596,-73.9174114240795,-73.917391203015,-73.917371412598,-73.9173521232305,-73.9173285122681,-73.9173030065422,-73.9172521684484,-73.9172208211366,-73.9171859848672,-73.91716367078,-73.9171313562008,-73.9171113486772,-73.9170878537731,-73.9170691090283,-73.9170555782001,-73.9170330131274,-73.9170099056763,-73.9169850318699,-73.9169657041724,-73.9169433896202,-73.9169235969525,-73.9168949456317,-73.9168315915157,-73.9167607519508,-73.9167168437377,-73.9166990656994,-73.9166820470104,-73.9166673346892,-73.9166538808642,-73.9166349221261,-73.9166166053427,-73.9165970641423,-73.9165739938356,-73.9165468516945,-73.9165191703803,-73.9164841350737,-73.9164583891869,-73.9164331858464,-73.9163882090847,-73.9163741320582,-73.9163630452538,-73.9163525369256,-73.9163432903383,-73.9163363508623,-73.9163298768715,-73.9163199519246,-73.916305240902,-73.9162887259239,-73.9162639310834,-73.9162427571722,-73.9162433893739,-73.9162430176174,-73.9162416452983,-73.9162392936179,-73.916236162932,-73.9162337438659,-73.9162320495625,-73.9162310883265,-73.9162308334289,-73.9162298545457,-73.9162281476998,-73.9162257183695,-73.9162225671949,-73.9162203337729,-73.9162171688223,-73.9162130791255,-73.9162080661936,-73.9162021368082,-73.9161950170623,-73.9161871870219,-73.9161786539232,-73.9161694197291,-73.9161594927781,-73.9161493611691,-73.9161385429552,-73.9161270475711,-73.9161148778615,-73.916102040184,-73.9160885433173,-73.9160753817664,-73.916061579456,-73.9160471462615,-73.9160320894245,-73.9160164174995,-73.9160001414593,-73.9159464129425,-73.9159387571534,-73.9159305292407,-73.915921761041,-73.9159124835104,-73.915902736403,-73.9158925528763,-73.9158819735677,-73.9158742440111,-73.9158662261882,-73.9158580060108,-73.9158496764291,-73.9158413264496,-73.9158386715837,-73.9158356839595,-73.9158325350679,-73.9158294027273,-73.915826466914,-73.9158238976761,-73.9158218395281,-73.9158204112406,-73.9158205552971,-73.915821495223,-73.9158231208833,-73.915825244384,-73.915827615491,-73.9158299605389,-73.9158368700923,-73.9158436463508,-73.9158501991813,-73.9158564347081,-73.9158582673622,-73.9158593627109,-73.9158596713739,-73.915859186168,-73.9158570347626,-73.9158540996633,-73.9158503979552,-73.91584594695,-73.9158407698958,-73.9158348937767,-73.9158283482137,-73.9158211648145,-73.9157495649087,-73.9157442437281,-73.9157382183366,-73.9157315335158,-73.9157242417387,-73.9157163954874,-73.9157080516386,-73.915702269334,-73.9156969561004,-73.9156922085774,-73.9156881115206,-73.9156847391282,-73.9156822365428,-73.9156789426851,-73.91567489089,-73.9156701213026,-73.9156646828704,-73.9156586276222,-73.915652016376,-73.9156428210923,-73.9156331073448,-73.9156229298249,-73.9156123403681,-73.915601394993,-73.9155901495026,-73.9155808786541,-73.9155720203294,-73.9155636279037,-73.9155557430992,-73.915548412473,-73.915541676642,-73.9155355744637,-73.9155301357831,-73.9155253952732,-73.9155213755222,-73.9154835100154,-73.9154743509254,-73.9154643275877,-73.9154534489857,-73.9154415129246,-73.915440597078,-73.9154309057264,-73.9154204376922,-73.915409212502,-73.9153857076595,-73.9153630791868,-73.9153413362919,-73.9153297919425,-73.9153174693082,-73.9153043892365,-73.9152905769746,-73.9152760540304,-73.9152608491663,-73.9152509446071,-73.9152418094117,-73.9152334789215,-73.9152259858295,-73.9152193595366,-73.915203472236,-73.9151868563211,-73.915169524737,-73.9151514992188,-73.9151131826698,-73.9150742036665,-73.9150345718736,-73.9150235011752,-73.9150116866197,-73.9149991896976,-73.914986069043,-73.9149805445723,-73.9149756574759,-73.9149714903039,-73.9149681222959,-73.9149396409267,-73.9149301237839,-73.9149200834365,-73.9149095550183,-73.914898577186,-73.9148871894712,-73.9148754333927,-73.9148633509031,-73.9148128494454,-73.9148069635735,-73.9148014723568,-73.9147964961667,-73.9147921362442,-73.9147884894141,-73.9147659796407,-73.9147605046419,-73.9147540575636,-73.9147466796544,-73.914738409529,-73.9147321093824,-73.9147252051043,-73.9147177586143,-73.9147098404172,-73.9147015260729,-73.91469289247,-73.9146840206802,-73.9146749937614,-73.9146636390128,-73.9146524428996,-73.91464147134,-73.9146307882716,-73.9146171990915,-73.9146041646221,-73.9145917393309,-73.9145799789992,-73.9145718507425,-73.9145644494436,-73.9145578203215,-73.9145520024345,-73.9145454071461,-73.9145381280386,-73.9145302096819,-73.9145216979601,-73.9145126475539,-73.9145031109536,-73.9144398539781,-73.9144328871098,-73.9144264104254,-73.9144204621261,-73.9144150810711,-73.9144103001818,-73.9144061486421,-73.9144026538735,-73.9143998351648,-73.9143964915774,-73.9143923996852,-73.9143875750576,-73.9143820242508,-73.914375762396,-73.91436880748,-73.9143643360543,-73.9143606757416,-73.914357857899,-73.914355902671,-73.9143548280045,-73.914354640415,-73.9143560521525,-73.9143565530348,-73.9143561385514,-73.9143548136386,-73.9143526027973,-73.91434954174,-73.9143456837633,-73.9143338212981,-73.9143227817543,-73.91431259103,-73.9143032664485,-73.9142811022045,-73.9142368858917,-73.9142093644515,-73.9141826773458,-73.9141568340093,-73.9141071813744,-73.9140568872103,-73.914005951515,-73.9139725961951,-73.9139385441527,-73.9139037982397,-73.9138976159784,-73.913890571694,-73.9138826763328,-73.9138739503023,-73.9138684451163,-73.913863639445,-73.9138595675168,-73.9138562547672,-73.913853723549,-73.9138334602494,-73.9138289858908,-73.9138237094786,-73.9138176516204,-73.9138108375408,-73.9138033008156,-73.913795071731,-73.9137777075952,-73.9137612701867,-73.9137457832079,-73.9137351992192,-73.9137237195586,-73.913711369236,-73.9136981780982,-73.9136846401943,-73.9136705978066,-73.9136560746553,-73.9136410913766,-73.9136256738906,-73.9136098459133,-73.9136032311758,-73.9135963735642,-73.91358934624,-73.9135822258931,-73.9135750867971,-73.9135680039012,-73.9135610534738,-73.913554307619,-73.913547839105,-73.9135426389074,-73.9135371552201,-73.9135315406026,-73.91352596209,-73.913520576365,-73.9135155420536,-73.9135086014473,-73.9135022555663,-73.9134965693988,-73.9134916033147,-73.9134874130607,-73.9134840400897,-73.9134710012899,-73.9134571250311,-73.9134424358925,-73.9134350503717,-73.9134268875065,-73.9134180078898,-73.9134084778352,-73.91340112506,-73.9133944153961,-73.9133883830795,-73.9133830575126,-73.9133767120794,-73.9133711460206,-73.9133663702874,-73.9133623969313,-73.9133592331667,-73.9133290245016,-73.9133005072446,-73.9132973974194,-73.913293391619,-73.9132885069414,-73.9132827505953,-73.9132761412145,-73.9132568099071,-73.9132498263306,-73.9132420076643,-73.9132333769448,-73.91322395918,-73.9132156874962,-73.9132085417794,-73.9132025487663,-73.9131956958424,-73.913187971035,-73.9131794103295,-73.9131700523504,-73.9131599399014,-73.9131121915665,-73.9131053617516,-73.9130990532032,-73.9130933256427,-73.9130882293434,-73.9130838112728,-73.9130801115832,-73.9130758836964,-73.9130725269445,-73.913070081451,-73.9130685737094,-73.9130680181256,-73.9130684244904,-73.9130634000126,-73.9130667459139,-73.9130707849859,-73.9130754985079,-73.9130808743549,-73.913087482204,-73.9130933817974,-73.913098562115,-73.9131030103757,-73.9131067175354,-73.9131096747697,-73.913111877868,-73.9131141359411,-73.9131135825949,-73.9131121247656,-73.9131097854149,-73.9131066042111,-73.913102632917,-73.9130979349526,-73.9130943311379,-73.9130914823226,-73.9130894150251,-73.913088147192,-73.913087688415,-73.913088045432,-73.9130895484483,-73.9130903025535,-73.9130903041877,-73.9130895546238,-73.9130880566742,-73.9130858142515,-73.913087538186,-73.9130900468537,-73.9130933356168,-73.913097403347,-73.9131022458482,-73.9131078565016,-73.9131175529166,-73.9131188115122,-73.9131191203676,-73.9131184743031,-73.9131168868155,-73.9131143845976,-73.913106722527,-73.9131026758835,-73.9131028841186,-73.9131025649725,-73.9130938986187,-73.9130939124347,-73.9130947197819,-73.9130963091272,-73.9130986507024,-73.9131017026504,-73.9131054101615,-73.9131097063372,-73.9131225174648,-73.9131347279397,-73.9131463249957,-73.9131572947696,-73.9131676238308,-73.9131773007287,-73.9131863140186,-73.913191881288,-73.9131966518519,-73.913200594442,-73.9132036876761,-73.9132059132457,-73.913207253944,-73.913207705307,-73.9132063359221,-73.9132042803229,-73.9132017400721,-73.9131989655922,-73.9131962256316,-73.9131939925759,-73.9131926107232,-73.913192110058,-73.9131924985839,-73.9131937711212,-73.9131982148095,-73.9131983365354,-73.9131976446419,-73.9131961495811,-73.9131938721347,-73.91319084913,-73.913187125533,-73.9131787005045,-73.9131711819525,-73.9131646486788,-73.9131650901921,-73.9131663733328,-73.9131684865953,-73.9131714112151,-73.9131751161308,-73.9131795667644,-73.9131868675545,-73.9131934114305,-73.9131991770285,-73.9132041443037,-73.9132082951852,-73.9132116153452,-73.9132140922044,-73.9132157182404,-73.9132194198597,-73.9132223051983,-73.9132243687204,-73.913225601598,-73.9132260068675,-73.9132255789991,-73.9132243214659,-73.9132222364311,-73.9132193289064,-73.9132183716059,-73.9132166154014,-73.9132140622417,-73.913210715176,-73.9132065796674,-73.9132016603053,-73.9131959645302,-73.9131885487169,-73.9131818913423,-73.9131759985321,-73.9131708761973,-73.9131665319985,-73.9131629711875,-73.9131562860422,-73.9131571916869,-73.9131590075066,-73.9131617277256,-73.9131653368963,-73.9131698145188,-73.9131801117354,-73.9131895739264,-73.9131981900743,-73.9132059526823,-73.9132128555716,-73.9132188879447,-73.9132240477994,-73.9132315492855,-73.9132402751285,-73.91325022047,-73.9132542569776,-73.9132575851122,-73.9132601989085,-73.913262094825,-73.9132632693116,-73.9132637199272,-73.9132634470766,-73.9132631063348,-73.9132618034043,-73.9132595432722,-73.9132563403779,-73.913252206741,-73.9132437178345,-73.9132341121507,-73.913223407446,-73.9132177473899,-73.913211275877,-73.9132040411842,-73.91319610149,-73.9131875151903,-73.9131794390961,-73.9131710340264,-73.9131623509414,-73.9131534476174,-73.9131443756878,-73.9131351973332,-73.9131259670467,-73.9131167430657,-73.9130824906355,-73.9130481519274,-73.9130137579354,-73.9129793367902,-73.912945104797,-73.9129387298094,-73.9129355910524,-73.9129327540294,-73.9129303516168,-73.9129285030382,-73.9129272962904,-73.912926788801,-73.9129270061272,-73.9129279353657,-73.9129295354882,-73.9129512263198,-73.9129819927619,-73.9130089786016,-73.9130466107174,-73.9130980328505,-73.913168871009,-73.913240948823,-73.9132964103566,-73.9133518802411,-73.9134236499027,-73.9134621866577,-73.9134706538551,-73.9134750601911,-73.9134785405969,-73.913485463545,-73.9134901741944,-73.9135184002251,-73.9136344081534,-73.9136748352012,-73.9136958451518,-73.9137118474014,-73.913724730559,-73.9137426196458,-73.9137630134539,-73.9138232370166,-73.9139295519439,-73.9140029265417,-73.914047785409,-73.9140866943562,-73.9141174400444,-73.9142212292127,-73.9142886330383,-73.9143475326265,-73.9143704121119,-73.9143942267779,-73.9144186608707,-73.9144415190664,-73.9144816006691,-73.9145323131109,-73.914565484213,-73.914590776066,-73.914624014063,-73.9146697109434,-73.9147605100271,-73.9147927461738,-73.91482496107,-73.9148434029871,-73.9148543390795,-73.9148662011697,-73.9148786824852,-73.9148943144643,-73.9149074518061,-73.9149262287545,-73.9149694054121,-73.9150103764671,-73.9150529019536,-73.9151707793105,-73.9151917378252,-73.9152020636926,-73.9152062943876,-73.9152105250794,-73.915215240651,-73.9152231845253,-73.9152291606558,-73.9152447830468,-73.9152518012274,-73.9152486453364,-73.9152439083253,-73.9152479539187,-73.9152573297239,-73.9152973505864,-73.9153292343402,-73.9153685946689,-73.9153795065657,-73.9153901027232,-73.9154022898333,-73.9154222915462,-73.9154447907878,-73.9154532060606,-73.915459116394,-73.9154728581765,-73.9154885003045,-73.9154988072588,-73.915505082661,-73.9155207053473,-73.915528501591,-73.9155300466647,-73.9155421872516,-73.9155562281831,-73.9155977337417,-73.9156392327757,-73.9156688715727,-73.9156935197094,-73.9157103619504,-73.9157234585623,-73.9157374988947,-73.9157602880166,-73.9157858862607,-73.9158169348259,-73.9158414740982,-73.9158848745586,-73.9159123378295,-73.9159428273057,-73.9159574117952,-73.9159648596226,-73.9159658410901,-73.9159692050882,-73.9159654848042,-73.9159592077003,-73.9159537599741,-73.9159582069383,-73.9159645302787,-73.915979386829,-73.9159980976627,-73.9160176442525,-73.91603722802,-73.9160499289557,-73.9160567568716,-73.9160595152073,-73.9160592847214,-73.9160569267811,-73.9160548556776,-73.9160608519147,-73.9160727195372,-73.9160923272059,-73.916099873024,-73.9161023777216,-73.9160938932147,-73.9160809079497,-73.9160693358746,-73.9160572985325,-73.9160384929751,-73.9160209498559,-73.9160134886717,-73.9160079652212,-73.9160104692453,-73.9160153600638,-73.9160265475078,-73.9160439629369,-73.9160644019286,-73.9160838712855,-73.9161521689216,-73.9161675669101,-73.9161773450763,-73.9161808957229,-73.9161877245727,-73.9161996703768,-73.9162129517673,-73.9162311972886,-73.9162453771657,-73.9162585043183,-73.9162656238558,-73.916267234314,-73.9162635552359,-73.9162565548598,-73.9162522949776,-73.9162484985649,-73.9162494525181,-73.9162518590549,-73.9162639026074,-73.9162641154821,-73.9162688010084,-73.9162740285169,-73.9162797442124,-73.9162858910001,-73.9163051741629,-73.9163239447399,-73.9163421884635,-73.9163598882041,-73.9163644487019,-73.9163682796309,-73.916371346778,-73.9163736207639,-73.9163750823232,-73.9163757192208,-73.9163739092128,-73.9163729318465,-73.9163727897912,-73.9163734837425,-73.9163734104961,-73.9163740609625,-73.9163754351861,-73.9163775261784,-73.9163803236575,-73.9163838190933,-73.9163879934115,-73.9163948564784,-73.9164010264833,-73.9164064832414,-73.9164112103136,-73.9164151916958,-73.9164320109279,-73.916433427132,-73.9164311311522,-73.9164296158379,-73.9164288946666,-73.9164289749604,-73.9164298561324,-73.9164315288029,-73.916433981612,-73.9164371893554,-73.9164411290223,-73.9164457655144,-73.9164510569141,-73.9164604226293,-73.9164692181128,-73.9164774023079,-73.9164849392117,-73.9164917888687,-73.9164979229781,-73.916503311258,-73.916514281958,-73.9165259237,-73.9165382272735,-73.9165511823696,-73.9165765160747,-73.9166011582466,-73.9166251033997,-73.9166483456092,-73.9166538710308,-73.916660197403,-73.9166673014705,-73.916675159109,-73.9166837450781,-73.9166930304151,-73.9167026701456,-73.9167115691327,-73.9167196869835,-73.9167269912218,-73.9167334533267,-73.9167390463202,-73.9167538892718,-73.9167694648882,-73.9167857624129,-73.9168027697808,-73.916820472506,-73.91683861745,-73.91685613451,-73.9168730155714,-73.9168892463648,-73.9169048159176,-73.9169197123784,-73.9169380100018,-73.9169570690913,-73.9169768797784,-73.9169974304281,-73.9170187162245,-73.917027447896,-73.917036957087,-73.9170472236108,-73.9170582244267,-73.9170699336338,-73.9170823266496,-73.9170953771323,-73.9171090528015,-73.9171324239187,-73.9171564894067,-73.9171812349961,-73.917206648176,-73.9172327137972,-73.9172638046521,-73.9172943095774,-73.9173242197943,-73.9173535256386,-73.9173812292882,-73.9174096723289,-73.9174388503787,-73.9174687513626,-73.9174993636461,-73.9175306793306,-73.9175548643012,-73.9175783820556,-73.9176012216201,-73.9176233788292,-73.9176677944074,-73.9177113184974,-73.9177539464955,-73.9177907224614,-73.9178268959167,-73.9178624629142,-73.9178754355804,-73.9178891965713,-73.9179037116354,-73.9179189397124,-73.9179244513048,-73.9179306933151,-73.9179376066929,-73.9179451227077,-73.9179531651491,-73.9179616525299,-73.9179705018111,-73.9180338397107,-73.9180470399481,-73.9180608211167,-73.9180751610394,-73.9180900364391,-73.9181054244802,-73.9181212985894,-73.9181378407658,-73.9181548033581,-73.9181721606699,-73.9181898786486,-73.9182079300592,-73.9182262852408,-73.9183422119112,-73.9183527028898,-73.9183627920506,-73.9183724145856,-73.9183815199848,-73.918390050926,-73.9183979582236,-73.9184051975258,-73.9184117231716,-73.9184406465941,-73.9184777788562,-73.918481908383,-73.9184867320409,-73.9184922270216,-73.9184983634791,-73.9185051073927,-73.9185124242969,-73.9185202753283,-73.9185286203023,-73.9185374137589,-73.9185454393004,-73.9185538495057,-73.9185625679228,-73.9185715183128,-73.9185806235511,-73.9185898023316,-73.9185989739999,-73.918608060091,-73.9186169805952,-73.918626165461,-73.9186355700652,-73.9186451352712,-73.9186547968997,-73.9186644953832,-73.9186741634711,-73.918683741612,-73.918693167835,-73.9187023779835,-73.9187113151501,-73.9187199191435,-73.9187301734,-73.9187400217425,-73.9187494178239,-73.9187583133268,-73.9187666676261,-73.9187744387818,-73.9187815888108,-73.9188308261616,-73.9188309571888,-73.9188302737738,-73.9188287940674,-73.9188265634709,-73.9188236513251,-73.9188201432295,-73.9188161456412,-73.9188091820489,-73.9188027870882,-73.9187970186111,-73.9187919274469,-73.9187875595847,-73.9187905435465,-73.9187941658632,-73.918798382861,-73.9188031381213,-73.9188083736726,-73.9188140216545,-73.9188200108978,-73.9188459968369,-73.9188714108259,-73.9188962251874,-73.9189005206864,-73.9189051530466,-73.9189100223089,-73.9189150269629,-73.9189200588865,-73.9189250114883,-73.9189297812339,-73.9189345207774,-73.9189400545511,-73.918946330616,-73.9189532803328,-73.9189608366163,-73.9189689227073,-73.9189733008395,-73.9189776565332,-73.918981863209,-73.9189858022234,-73.9189893639569,-73.9189924469415,-73.9189949642266,-73.9189968444786,-73.9189980346156,-73.9189985015639,-73.9189982296095,-73.9189972289799,-73.9189936002051,-73.9189910839742,-73.918989689144,-73.9189914458569,-73.9189940590452,-73.918997492102,-73.9190017033527,-73.9190066315592,-73.9190122172363,-73.9190183839672,-73.9190351853775,-73.9190525979938,-73.919070566677,-73.9190833719594,-73.91909582871,-73.9191078989246,-73.9191195472413,-73.9191307420304,-73.9191414501346,-73.9191516399282,-73.9192066106134,-73.9192279709202,-73.9192498902815,-73.9192723465144,-73.9193499525693,-73.9193584166329,-73.9193674821084,-73.9193771090321,-73.9193872543592,-73.9193978706508,-73.9194089137598,-73.9194203294223,-73.9194320719496,-73.9194409479341,-73.9194495073556,-73.9194576733241,-73.9194653812606,-73.9194725602192,-73.9195104730215,-73.9195266076629,-73.9195434284079,-73.9195609102271,-73.919579157281,-73.9195979408793,-73.919617230049,-73.9196369881096,-73.9196662471378,-73.9196947111286,-73.9197223605453,-73.9197309495241,-73.9197401713007,-73.9197499920642,-73.9197603773394,-73.9197712889186,-73.9197840727537,-73.9197965148699,-73.9198085794588,-73.9198202311605,-73.9198314326298,-73.9198421555407,-73.9198523643165,-73.9198605018809,-73.9198692124716,-73.9198784572209,-73.9198881985773,-73.9198983937115,-73.9199090000145,-73.9199146350249,-73.9199205513129,-73.9199266680247,-73.9199329005616,-73.9199391638788,-73.9199453724822,-73.919951440645,-73.9199572861554,-73.9199628254629,-73.9199679857909,-73.9199721793007,-73.9199766768218,-73.919981375241,-73.9199861683878,-73.9199909448284,-73.9199955960027,-73.9200000175396,-73.9200041072843,-73.9200077707837,-73.9200109261241,-73.920013500638,-73.9200154346267,-73.9200166870847,-73.9200182181476,-73.9200205317017,-73.9200235621523,-73.9200272175156,-73.9200313928329,-73.9200359617981,-73.9200407932588,-73.9200459190937,-73.920051040324,-73.9200559780675,-73.9200605655565,-73.9200646452836,-73.9200680762517,-73.9200695949839,-73.9200702399514,-73.9200699932537,-73.9200688666598,-73.9200668818287,-73.9200640850284,-73.9200615613464,-73.9200597050338,-73.9200585623431,-73.9200581575581,-73.9200585068256,-73.9200595970668,-73.9200614022336,-73.9200638780323,-73.9200669656509,-73.9201009659287,-73.9201040999392,-73.920107808254,-73.9201120085278,-73.9201166102737,-73.9201215117783,-73.9201266053866,-73.9201317816675,-73.9201369243598,-73.9201423578983,-73.9201475550369,-73.9201523762624,-73.9201566897749,-73.920160380496,-73.9201633476475,-73.9201655150817,-73.9201668209448,-73.9201703374823,-73.9201746829112,-73.9201798214724,-73.9201857101547,-73.9201923037431,-73.9201995453721,-73.9202316098719,-73.9202360892332,-73.9202410881835,-73.9202465447943,-73.9202523947115,-73.9202585707198,-73.9202649957051,-73.920271595623,-73.9202764087121,-73.9202813682673,-73.9202863299054,-73.9202911547164,-73.9202957028903,-73.9202998471213,-73.9203034690987,-73.9203143661648,-73.9203258183317,-73.9203377288563,-73.9203433149429,-73.9203489110921,-73.9203544100588,-73.9203597072437,-73.9203646987275,-73.9203692904896,-73.9203733926952,-73.920376926951,-73.9203798241034,-73.92038203105,-73.9204046067784,-73.9204239359154,-73.9204439518029,-73.9204646296263,-73.9204859496263,-73.9204971207856,-73.9205088139806,-73.9205210004454,-73.9205336538252,-73.9205467435925,-73.9205602394343,-73.9205741112581,-73.9205835786957,-73.9205932816222,-73.9206031488417,-73.9206131003666,-73.9206230641104,-73.9206329583144,-73.9206427133015,-73.9206522497142,-73.9206663006935,-73.9206800923513,-73.920693585113,-73.9207067378635,-73.9207195138858,-73.9207318749134,-73.9207437899419,-73.9207478135065,-73.9207523692099,-73.9207573440168,-73.9207626185348,-73.9207680641631,-73.9207735481389,-73.920778939259,-73.9207841026029,-73.9207889182103,-73.9207932670205,-73.9207939851088,-73.9207954752559,-73.9207976837485,-73.9208005263121,-73.9208038918402,-73.9208076525018,-73.9208182892087,-73.9208294770879,-73.9208319625911,-73.9208336135727,-73.9208343300117,-73.920834068603,-73.9208328438511,-73.9208332103846,-73.9208348115476,-73.9208372958535,-73.920840655865,-73.9208448911699,-73.9208499921304,-73.920855953284,-73.9208636701551,-73.9208673233463,-73.9208717532551,-73.9208769416863,-73.9208828658238,-73.9208895010971,-73.920896820953,-73.920904792243,-73.9209114813282,-73.9209187548046,-73.9209265755675,-73.9209349102433,-73.9209437135879,-73.9209529473853,-73.9209625663909,-73.920972524469,-73.9209827719719,-73.9209919337443,-73.9210008094881,-73.921009324724,-73.9210174041009,-73.9210249801875,-73.921031987972,-73.9210383646474,-73.9210440570847,-73.9210799717563,-73.9211137690257,-73.9211482624022,-73.9211834457428,-73.9211880288036,-73.9211932334131,-73.9211990051163,-73.9212052850625,-73.9212120108803,-73.9212191102955,-73.9212265105916,-73.9212341399264,-73.9212419161186,-73.9212497600562,-73.9212575917408,-73.9212628804994,-73.9212684105679,-73.9212740854395,-73.9212797934544,-73.9212854286798,-73.9212908854198,-73.9212960626006,-73.9213008598256,-73.9213051898924,-73.9213112937609,-73.9213167535342,-73.9213215373855,-73.9213256253553,-73.9213289977092,-73.9213316377882,-73.9213350636892,-73.9213392034222,-73.9213440427387,-73.9213495643176,-73.9213557508287,-73.9213625746169,-73.921370016594,-73.9213780471223,-73.921400733169,-73.9214242033438,-73.9214484348068,-73.9214734121957,-73.9214845279767,-73.921496279558,-73.9215086173052,-73.9215214988278,-73.9215348742653,-73.9215410082147,-73.9215475468775,-73.9215544309438,-73.921561600879,-73.9215689887934,-73.921576535141,-73.9215841685042,-73.92159182339,-73.9215973802168,-73.921602739588,-73.9216077723079,-73.9216123597464,-73.9216163955998,-73.9216197852247,-73.9216224447577,-73.9216243138662,-73.9216297725668,-73.9216329863462,-73.9216371707257,-73.9216422987393,-73.9216483381445,-73.921655249445,-73.9216583341728,-73.921662152996,-73.9216666822272,-73.9216718937842,-73.9216777545277,-73.9216842315337,-73.9216912830862,-73.9216988650471,-73.9217069323972,-73.9217231009898,-73.9217395650496,-73.9217562540405,-73.9217653400537,-73.9217741176824,-73.9217825208021,-73.9217904898824,-73.9217979621017,-73.9218048849728,-73.9218112060109,-73.9218155423738,-73.9218194248033,-73.921822777319,-73.9218255309804,-73.9218276309208,-73.9218290323921,-73.9218297119677,-73.9218296503983,-73.9218288543711,-73.92182733387,-73.9218203814143,-73.9218128440554,-73.9218047466605,-73.9217961167302,-73.9217898001668,-73.92178403247,-73.9217788827079,-73.9217744096275,-73.9217706680213,-73.9217670142135,-73.9217640730799,-73.9217618734758,-73.9217604420658,-73.921759789909,-73.9217599263055,-73.9217608486934,-73.9217625479114,-73.921766260138,-73.9217708784269,-73.9217763968728,-73.9217828095664,-73.9217901116982,-73.9217975704915,-73.9218059717166,-73.9218153085887,-73.9218255719023,-73.9218367544304,-73.9218423023689,-73.9218467683653,-73.9218501460817,-73.9218513889101,-73.9218534250157,-73.9218562511432,-73.9218598596385,-73.9218642366909,-73.921869370913,-73.921884553642,-73.9219004518309,-73.9219170588992,-73.9219288650577,-73.9219398828664,-73.9219500952146,-73.9219594810315,-73.9219722927827,-73.9219858902556,-73.9220002587464,-73.9220088750983,-73.9220181702647,-73.9220281240527,-73.9220344665145,-73.9220399434605,-73.9220445120987,-73.9220481432683,-73.9220857644662,-73.9220888138627,-73.9220925117697,-73.9220968099021,-73.9221016417258,-73.9221069356452,-73.9221126132411,-73.9221185945514,-73.922124787734,-73.9221311033515,-73.9221374462479,-73.9221443721258,-73.9221511420762,-73.9221576468409,-73.9221637835241,-73.9221694494391,-73.9221745524384,-73.9221787781185,-73.9221829929591,-73.9221870400508,-73.9221907695411,-73.9221940390799,-73.9221967302906,-73.9221987393216,-73.9222042029618,-73.9222090232044,-73.9222131820687,-73.9222166571768,-73.9222194364793,-73.9222226862976,-73.9222251464813,-73.9222268074062,-73.9222276601082,-73.9222277011182,-73.9222284712605,-73.9222302792856,-73.9222331201848,-73.9222402476927,-73.9222465107496,-73.9222518992765,-73.9222597005775,-73.9222664135646,-73.9222720154372,-73.9222737660788,-73.9222746168385,-73.9222745609611,-73.9222736000366,-73.9222733571767,-73.9222717387349,-73.9222694987886,-73.9222663622689,-73.922262343075,-73.9222574597156,-73.922251730043,-73.9222238902586,-73.9221950875138,-73.9221653264388,-73.9221544319806,-73.9221428154369,-73.922130493534,-73.9221174827781,-73.9221037961574,-73.9220894530347,-73.9220744725505,-73.9220588714297,-73.9220426718903,-73.9220134910915,-73.9219850154048,-73.9219572644098,-73.9219302466931,-73.9219122298792,-73.9218935293676,-73.9218741653997,-73.9218541544766,-73.9217815294417,-73.9217418624316,-73.9216328367768,-73.9215182161155,-73.9214095375319,-73.9212908829846,-73.9211699680542,-73.9210736991064,-73.920948314347,-73.9208916323192,-73.9208687808322,-73.9208615660414,-73.9208613363902,-73.9208663980295,-73.9208775781156,-73.9208812352666,-73.9208805085479,-73.9208705564061,-73.9208489368267,-73.9208316862817,-73.9207991762107,-73.9207772529125,-73.9207545719536,-73.9207388387751,-73.9207286933285,-73.9207125712705,-73.9206903601962,-73.9206638599306,-73.9206332109225,-73.9205517694873,-73.9205163673782,-73.9204627102111,-73.9204158269712,-73.9203696653611,-73.9203087337188,-73.9202884196989,-73.9202704363787,-73.920258134295,-73.9202558476349,-73.9202533194608,-73.9202429694859,-73.920236413685,-73.920225397306,-73.9202149229112,-73.9202034350728,-73.9201920865933,-73.9201834039526,-73.9201791162964,-73.9201736416114,-73.9201624131184,-73.9201479477898,-73.9201320739547,-73.9201178545924,-73.9200925395554,-73.9200196420724,-73.919999180675,-73.9199678679597,-73.9199433634818,-73.9199262206321,-73.9199144810455,-73.9199014863666,-73.9198963077592,-73.9198959912969,-73.9199006433604],"lat":[40.5996005220902,40.5995686991021,40.5995521340897,40.5995430517043,40.5995359665218,40.5995313478121,40.5995243921599,40.5995224082257,40.5995261089586,40.5995273392058,40.5995195132845,40.5995208424033,40.5995309227156,40.5995622138382,40.5995813399158,40.599594330726,40.5996035651332,40.5996078282814,40.5996119184332,40.5996113679892,40.5996073435535,40.5995990236749,40.5995977179181,40.5995983019061,40.5996054143509,40.599608276886,40.5996092809189,40.5996059790274,40.5995999087146,40.5995917013908,40.59958299676,40.5995769241914,40.5995746372245,40.5995766298325,40.5995826021557,40.5995896480162,40.5995907906601,40.5995867696114,40.5995772862335,40.5995653312234,40.5995573011018,40.5995563859592,40.5995569544978,40.5995589258291,40.5995597716551,40.5995567190739,40.5995489753748,40.5995420047398,40.5995349836303,40.5995297190035,40.5995204727864,40.5995098483256,40.599495572354,40.5994778031823,40.599466512271,40.5994586224962,40.5994563039923,40.5994567039982,40.5994615245654,40.599471099176,40.5994799632443,40.5994835024546,40.599488681124,40.5994886157684,40.5994848170758,40.5994835156932,40.5994869598332,40.5994878451585,40.5994830492621,40.5994724283707,40.5994583782573,40.5994470815954,40.5994413121836,40.5994331001858,40.5994159676328,40.5993986430244,40.5993825820447,40.5993723117281,40.5993623388988,40.5993473907872,40.5993402476377,40.5993201723556,40.5992739468939,40.5992665356019,40.5992615425563,40.5992603385694,40.5992611396944,40.5992741469524,40.5992734924836,40.5992725607179,40.599266768343,40.5992583661843,40.5992511445465,40.5992398598933,40.5992303638395,40.5992204259785,40.599211361955,40.599173149423,40.5991663908318,40.5991615514352,40.5991559079333,40.599152546315,40.5991524580896,40.5991566241164,40.5991589834079,40.5991609582051,40.5991619713357,40.5991602360628,40.5991495445979,40.5991127463541,40.5991014215516,40.5990964972257,40.5990886297844,40.5990842000029,40.5990769433524,40.5990710648223,40.5990619183054,40.5990517293243,40.5990410957514,40.599023672425,40.5990081711853,40.5989909943326,40.5989639768988,40.5989480602119,40.5989314795123,40.5989171278701,40.598907505308,40.5988943937085,40.5988732262677,40.5988624812429,40.5988511895013,40.5988365728605,40.5988303630076,40.5988242598812,40.5988213175394,40.5988141316882,40.5988087952452,40.5988013458204,40.5987935413355,40.5987829885323,40.5987728496422,40.5987631241629,40.598749555951,40.598734998347,40.5987215928389,40.5987066204095,40.5986966731202,40.5986694603189,40.5986576667699,40.5986448058902,40.5986315339306,40.5986194420179,40.5986104252937,40.5986011863292,40.5985924745512,40.5985751100732,40.5985613635027,40.5985443206171,40.5985341219406,40.5985161470481,40.5985044409213,40.5984894088299,40.5984767423239,40.5984685531114,40.5984587366975,40.5984506514697,40.5984423441577,40.5984352480634,40.5984260094537,40.59841584053,40.5984065412076,40.5983875293904,40.5983655471843,40.5983478663345,40.5983375055033,40.5983269800361,40.5983149208332,40.5983028608659,40.5982886558801,40.5982790632694,40.5982694702698,40.5982604236982,40.59825269061,40.5982456981055,40.5982430925319,40.5982417288941,40.5982395702161,40.5982412947158,40.5982386763777,40.5982353190649,40.5982302066332,40.5982232012008,40.5982156479515,40.598208286694,40.5981985622689,40.5981855417376,40.5981742486247,40.5981611373128,40.5981058268454,40.5980996136465,40.598093386481,40.5980872420159,40.5980812742504,40.5980732757977,40.5980651363014,40.5980568907847,40.5980485766128,40.5980290894252,40.5980096154472,40.5979901717639,40.5979707719491,40.5979514319185,40.5979303936427,40.5979094238774,40.5978885477566,40.5978677878979,40.5978471701056,40.5978253393708,40.5978036508524,40.5977821182929,40.5977607542583,40.5977395698115,40.5977166718928,40.5976939562465,40.5976714361141,40.5976491218844,40.5976270267965,40.5976051612435,40.5975852841708,40.5975656619432,40.5975463066297,40.5975272274495,40.5975084383134,40.5974899522967,40.5974349890477,40.5974277448438,40.5974208751513,40.5974144052903,40.5974083615855,40.5974027650069,40.5973976390329,40.5973930012835,40.5973905878949,40.5973888028645,40.5973876643483,40.5973871861518,40.5973873721932,40.5973886855211,40.5973894821126,40.5973897136772,40.5973893687857,40.5973884675059,40.5973870602211,40.5973852279538,40.5973830749942,40.5973812530516,40.5973795750969,40.5973782345459,40.5973773902461,40.5973771388461,40.5973775094631,40.5973769529656,40.5973757837156,40.5973740192376,40.5973716824145,40.5973689784939,40.5973660495443,40.5973630139726,40.5973599910545,40.5973515865468,40.5973433181691,40.5973352320044,40.5973273687748,40.5973197673643,40.5973124668266,40.5973055067203,40.5972989194017,40.5972236875069,40.5972172804698,40.5972112468415,40.5972056293745,40.5972004714974,40.5971958094348,40.5971916800849,40.5971892999435,40.5971863525568,40.5971828889246,40.5971789724353,40.597174672668,40.597168528539,40.5971626056381,40.5971569609497,40.597151653976,40.597146735179,40.5971422516728,40.5971382520853,40.597132567434,40.5971274055953,40.5971227934138,40.5971187568945,40.5971153161819,40.5971124879024,40.597108517015,40.5971040299373,40.5970990518378,40.5970936113949,40.5970877376255,40.5970814640653,40.5970748254216,40.5970678572327,40.5970606009038,40.5970530953183,40.5969842273568,40.5969635215422,40.5969430489619,40.5969228320712,40.5968931498356,40.5968912574212,40.5968774763685,40.5968640284617,40.596850940687,40.5968228330806,40.5967943106421,40.5967653908019,40.5967511454921,40.5967372850924,40.5967238347473,40.5967108164216,40.596698254255,40.596686170885,40.5966769613658,40.5966673017595,40.5966572259332,40.5966467764637,40.5966359922395,40.5966180602466,40.5966005163816,40.5965833782443,40.5965666639437,40.5965301660319,40.5964940777293,40.5964584039007,40.5964501020108,40.5964424182552,40.5964353900383,40.5964290540922,40.596425684342,40.5964217853356,40.596417425151,40.5964126829207,40.5963833469002,40.5963764920962,40.5963700865527,40.5963641544196,40.5963587148239,40.5963537899086,40.5963493949495,40.5963455494108,40.5963316233061,40.5963298836746,40.5963275080592,40.5963245493208,40.5963210678453,40.5963171400979,40.5962636272859,40.5962537177214,40.5962441533835,40.5962349890847,40.5962262769551,40.5962212701914,40.5962167498192,40.5962127611172,40.596209338481,40.5962065161427,40.5962043204614,40.5962027719357,40.5962018846998,40.5962006053913,40.5961986735055,40.5961961011534,40.5961929026225,40.5961869423893,40.596180304073,40.5961730171996,40.5961651149815,40.5961582288469,40.5961508820441,40.5961431176618,40.5961349843127,40.596128090437,40.59612161119,40.5961155816182,40.5961100406224,40.5961050224192,40.5961005555275,40.5960654299942,40.5960609013487,40.5960559684847,40.5960506627585,40.5960450165324,40.5960390650121,40.5960328444058,40.5960263942708,40.5960197546611,40.5960083541482,40.5959970963153,40.5959860086488,40.5959751203034,40.5959644575924,40.595954048004,40.5959472347742,40.5959401460604,40.5959328373383,40.5959253667556,40.5959177924583,40.5959101749295,40.5959049504083,40.5958996308892,40.5958943061646,40.5958890687143,40.5958840078498,40.5958792103776,40.5958747614425,40.5958612207571,40.5958472821319,40.5958329730613,40.5958183237135,40.5957777109837,40.5957200926491,40.5956846081665,40.5956487554008,40.5956125459191,40.5955398424857,40.5954673965455,40.5953952107783,40.5953385545458,40.5952821398613,40.5952259717522,40.5952111347465,40.5951965210812,40.5951821642701,40.5951680889553,40.5951616493587,40.5951548919806,40.5951478605718,40.5951406002168,40.5951331605211,40.5950696855661,40.5950602943717,40.5950511491789,40.5950422898748,40.59503375501,40.5950255831414,40.5950178074622,40.5949980494318,40.5949778359119,40.5949571922176,40.5949431523538,40.5949295277917,40.5949163528935,40.594903660852,40.5948938341372,40.5948844298858,40.5948754598424,40.5948669414454,40.594858884766,40.5948513048993,40.594849254561,40.5948477325948,40.5948467568135,40.5948463358189,40.5948464770381,40.5948471755015,40.5948484257382,40.5948502135624,40.5948525209356,40.5948541479211,40.5948550814567,40.5948552935124,40.5948547788529,40.5948535499933,40.5948516462548,40.5948475189726,40.5948428699488,40.5948377493237,40.594832209412,40.5948263087235,40.5948201122907,40.5948048973464,40.594790119859,40.5947758073215,40.5947687097403,40.5947621258879,40.594756105901,40.5947506942249,40.5947439409388,40.5947368081805,40.5947293333349,40.5947215527781,40.594708950964,40.5946961368074,40.5946831387965,40.5946699844154,40.5946567026522,40.5945716728217,40.5944612835043,40.5944481148621,40.5944350877761,40.5944222367702,40.5944095958582,40.5943972014077,40.5943370751226,40.5943251387484,40.5943135086569,40.5943022155233,40.59429129505,40.5942787088598,40.5942657288204,40.5942524125823,40.5942424360612,40.5942328366596,40.5942236586323,40.5942149445608,40.594206734349,40.5941811166971,40.5941772106127,40.5941728229402,40.5941679971151,40.5941627748902,40.5941572050521,40.5941513382251,40.5941452004386,40.5941387558947,40.5941320769964,40.5941252396546,40.5941183196035,40.5941113925738,40.5940721106871,40.5940627468218,40.5940535416285,40.5940445257508,40.5940357278269,40.5940242540511,40.5940125586006,40.5940006659265,40.5939886026562,40.5939763949177,40.5939640686714,40.5939516512214,40.5939044148546,40.593898981963,40.5938936465597,40.5938884966149,40.5938836167608,40.5938790864455,40.5938749777544,40.5938690798398,40.5938629462797,40.5938566338868,40.5938501996345,40.5938437035057,40.593837202968,40.5938277427189,40.5938182309745,40.593808701573,40.5937991896965,40.5937897300257,40.5937803559018,40.5937610640266,40.593741822166,40.5937226472368,40.5937035613522,40.5936845797538,40.5936657217026,40.5936017477432,40.593596362292,40.5935908965463,40.5935854464965,40.5935801116651,40.5935749835435,40.5935614892939,40.5935522208571,40.593530010647,40.5935256511251,40.5934898249588,40.5934852882751,40.5934807945765,40.5934764244358,40.5934722540563,40.5934683609724,40.5934648119868,40.5934616752333,40.5934484093933,40.5934348197662,40.5934209217553,40.5934067289201,40.5933922606841,40.5933775344619,40.5933625634797,40.5933548926644,40.5933469160087,40.5933386807322,40.5933302367425,40.5933216362952,40.5933129296359,40.5933041697008,40.5933023142844,40.5933008711419,40.593299982658,40.5932997363045,40.5933001542308,40.5932957476953,40.5932911424429,40.5932864336529,40.5932817195036,40.5932770959853,40.5932380683592,40.5932330162692,40.5932279922121,40.5932230707463,40.5932183261031,40.5932138305153,40.5932096506935,40.593203216563,40.5931961600753,40.5931885541653,40.5931819642301,40.5931754397648,40.5931690404011,40.5931628306234,40.5931568673684,40.5931512075696,40.5931416727926,40.5931318233259,40.5931216950047,40.5931113233303,40.5931007469882,40.5930899991387,40.5930791206494,40.5930681503816,40.5930552465498,40.5930422208103,40.593029105492,40.5930159297385,40.59300272488,40.5929895187222,40.5929763449411,40.5929632303431,40.5929502084377,40.5929337998919,40.5929174296094,40.5929011203759,40.5928848938046,40.5928687743591,40.5928527821463,40.5928369419659,40.5928201975027,40.5928032696648,40.5927861793981,40.5927689436277,40.5927515861486,40.5927341237179,40.5926696158502,40.5926598252825,40.5926501101207,40.5926405174361,40.5926310961357,40.592621893447,40.5926019042554,40.5925816745301,40.5925612273819,40.5925405824063,40.5925197595347,40.5924987817108,40.592477668199,40.5924321782555,40.5923868172281,40.5923416013633,40.5923286878981,40.5923156569627,40.5923025333467,40.5922893366486,40.5922760933354,40.5922628220008,40.5922495496176,40.5922391410973,40.592228776246,40.5922185073365,40.5922083848061,40.5921984609328,40.5921780238178,40.5921578763548,40.5921380535705,40.592130790417,40.5921239317363,40.5921175325144,40.592111638363,40.5921062965694,40.5921028830884,40.592099967758,40.5920975698826,40.5920957060912,40.5920943849667,40.5920936161054,40.5920934060819,40.5920937547728,40.5920963743254,40.5920982477943,40.5920993706797,40.5920997431702,40.5920944340359,40.5920931248225,40.5920923407525,40.5920910534853,40.592089325275,40.5920872394741,40.5920848949917,40.5920824072989,40.592079895361,40.5920774796219,40.5920752766507,40.5920543299696,40.5920338842014,40.5920191546799,40.5920037364542,40.5919852501265,40.5919646638936,40.5919469463204,40.5919353902923,40.5919214484582,40.5919030125073,40.5918957096136,40.5918923903648,40.59188691229,40.5918780909722,40.5918699946328,40.5918664266211,40.5918545640057,40.5918130905742,40.5918029289688,40.5917948668203,40.5917860773484,40.5917748920406,40.5917644362263,40.5917537479155,40.5917266932132,40.5916820913096,40.5916541130568,40.5916325076913,40.5916116033259,40.5915959293114,40.5915563335398,40.5915338286896,40.591522997105,40.5915168499144,40.5915116579982,40.5915079010923,40.5915065259453,40.5915039997868,40.591504364702,40.5915075491406,40.5915087460087,40.5915103193503,40.5915123410292,40.5915089868004,40.5915112142223,40.5915182153683,40.5915247040462,40.5915295051649,40.5915376478391,40.5915472243518,40.5915520371542,40.5915546940147,40.5915559337302,40.5915617687375,40.5915709381093,40.5915824977517,40.5916164391639,40.5916203099872,40.5916212904506,40.5916202257405,40.5916191633757,40.5916144013152,40.591586976758,40.5915803096455,40.5915875081786,40.591630242721,40.5916362015903,40.5916457357098,40.5916514725533,40.5916550751506,40.591666868904,40.5916779248798,40.5916978300603,40.5917085966637,40.5917198383144,40.5917251184308,40.5917328054961,40.5917426456402,40.5917512573123,40.5917601021844,40.5917677724056,40.5917701971711,40.591771557383,40.591772386577,40.5917795844025,40.5917895614807,40.5917915399654,40.591807559334,40.5918183330786,40.5918492206352,40.5918813021536,40.5919052398959,40.5919248701401,40.5919397071674,40.5919519114019,40.5919626846212,40.5919780145173,40.591995021426,40.5920129562463,40.5920271368168,40.5920539726193,40.5920740868589,40.5920927821541,40.5921009722744,40.5921058628769,40.5921077854913,40.5921143755401,40.5921235398575,40.5921336361135,40.5921416475704,40.5921564733164,40.5921667422961,40.5921784472105,40.5921873265428,40.592192199181,40.5921951218015,40.5922025975288,40.5922130602008,40.5922238492625,40.5922353498157,40.5922499229782,40.5922641115353,40.5922776209582,40.5922891033759,40.5923022367501,40.5923134695735,40.592326564155,40.5923454685042,40.5923625865511,40.592374901725,40.5923832107639,40.5923912392706,40.5923983080836,40.592404532209,40.5924154261227,40.5924285207057,40.5924343432443,40.5924421740352,40.5924510251057,40.5924610859337,40.5924697743197,40.5925036664413,40.5925127086797,40.5925262756373,40.5925368726149,40.5925473352794,40.5925540138371,40.592557838835,40.592564603737,40.5925716957056,40.592583205994,40.5925904025463,40.5925982812841,40.5926045653089,40.5926148532097,40.5926247845946,40.5926368320451,40.5926512429434,40.5926560755732,40.5926657921722,40.5926660305541,40.5926703312632,40.592674251908,40.5926777545874,40.5926808035762,40.5926938153858,40.5927072555264,40.5927211102506,40.5927353698294,40.5927410679733,40.5927470719971,40.5927533252512,40.5927597722621,40.5927663537103,40.5927730119569,40.5927881092206,40.5928032504802,40.592818410441,40.5928335606232,40.5928420348735,40.5928504937352,40.5928589020271,40.5928672247305,40.5928754243114,40.5928834685977,40.5928913212218,40.5929003121534,40.5929095880504,40.5929191219259,40.5929288787545,40.5929388271967,40.5929931035187,40.5930693014094,40.5930756742305,40.5930821826479,40.5930887697116,40.593095379807,40.5931019553037,40.5931084402401,40.5931147803283,40.5931209206004,40.5931268094405,40.593132395224,40.5931376316823,40.5931437209786,40.5931502853079,40.5931572926423,40.5931647117954,40.5931725087297,40.5931806438879,40.5931890803918,40.5932072951145,40.5932252677412,40.5932429828521,40.5932604245245,40.5932927124169,40.5933253083908,40.5933582050712,40.5933913945805,40.5934019681806,40.5934122773299,40.5934222900133,40.5934319661737,40.5934412794905,40.5934501925836,40.5934588308496,40.5934679204046,40.5934774255355,40.593487306012,40.5934975224443,40.5935080314228,40.5935294060176,40.5935504732222,40.593571223647,40.5935916396921,40.5936117066044,40.5936294543906,40.5936475640855,40.5936660219461,40.5936848152301,40.5937039308627,40.5937233556006,40.593749855045,40.5937760432647,40.5938019036667,40.5938274265256,40.5938525969273,40.5938653572388,40.5938777897535,40.5938898688247,40.5939015662905,40.5939128565002,40.5939237139714,40.5939341140579,40.5939440359626,40.5939663285209,40.5939881873389,40.5940095998414,40.5940305532866,40.594051035601,40.5940777841083,40.5941049230312,40.5941324424797,40.594160337589,40.5941909647794,40.5942211934396,40.5942510130116,40.5942804137695,40.59430938515,40.59433791676,40.5943634310688,40.5943893062545,40.5944155299127,40.5944420934966,40.5944891509697,40.5945366885962,40.5945846964894,40.5946262576734,40.594668125831,40.5947102932534,40.5947221815249,40.5947335394579,40.594744340223,40.5947545534677,40.5947603626295,40.5947657250095,40.5947705849456,40.5947748946429,40.5947786124995,40.5947816987526,40.5947841243604,40.594814362355,40.5948256687726,40.594836564486,40.5948470328938,40.5948570587341,40.5948666249022,40.5948757154639,40.5948837711683,40.5948913017979,40.5948982930942,40.594904734646,40.5949106125287,40.5949159191824,40.5949599184164,40.5949636456911,40.5949679709265,40.5949728734706,40.5949783222946,40.594984285695,40.5949907277856,40.5949976136891,40.5950049008207,40.5950565240594,40.5951094147773,40.5951168280298,40.5951239943337,40.595130874471,40.5951374329042,40.5951436332551,40.5951494436688,40.5951548339621,40.5951597761292,40.5951642426629,40.5951676470186,40.5951704641211,40.5951726694569,40.5951742442086,40.5951751745842,40.595175451647,40.5951750728268,40.5951740422563,40.5951723692606,40.5951699971842,40.5951681955322,40.5951669786705,40.5951663509091,40.5951663194098,40.5951668839573,40.5951680386461,40.5951697789089,40.5951720904605,40.5951749618688,40.5951783709771,40.595182525082,40.5951872134849,40.595192415547,40.5951981040945,40.5952042517917,40.595210828286,40.5952178023904,40.595265129524,40.5952687115602,40.5952722568348,40.595275658812,40.5952788126505,40.595281626258,40.5952840117423,40.5952858984811,40.5952902473123,40.5952950775216,40.5953003472674,40.5953060061596,40.5953120081601,40.5953164667153,40.5953206402517,40.595324478312,40.5953279285871,40.5953309504939,40.5953335027722,40.5953355540437,40.5953488264774,40.5953627275739,40.595377245922,40.595379248248,40.5953807529145,40.5953817280204,40.5953821520504,40.5953820188969,40.5953813284849,40.5953800973266,40.5953738737742,40.595368043303,40.5953626651815,40.5953577964887,40.595353481405,40.5953497674544,40.5953495986565,40.5953499908981,40.595350934876,40.5953524016914,40.5953543513952,40.5953567277936,40.5953594644836,40.5953624845192,40.5953657022554,40.5953690248577,40.5953723618494,40.595375615903,40.5953890716425,40.5954026747543,40.5954163714678,40.5954221306876,40.5954277012031,40.5954330044171,40.5954379721157,40.5954425390869,40.595446644308,40.595450233948,40.5954589423994,40.5954669216888,40.5954741510036,40.5954788327477,40.5954840330832,40.5954897380785,40.5954959297833,40.5955025932652,40.5955097048794,40.5955172465107,40.5955589512117,40.595573451144,40.5955874601018,40.5956009660071,40.5956530333138,40.5956601037958,40.5956667262234,40.5956728709155,40.5956785120425,40.595683622096,40.5956881779259,40.5956921620711,40.5956955535581,40.5956978500735,40.5957007638792,40.5957042686194,40.5957083352662,40.5957129290915,40.5957464690468,40.5957596411116,40.595772304198,40.5957844375144,40.5957944100685,40.5958037824026,40.5958125414276,40.5958206683542,40.5958408509601,40.5958616825138,40.5958831435691,40.5958913000355,40.595899043481,40.5959063448992,40.5959131796391,40.595919519529,40.5959240545917,40.5959291109331,40.5959346759636,40.5959407297227,40.595947258112,40.5959542401708,40.5959616532578,40.5959685423758,40.5959750113942,40.5959810328112,40.5959865813033,40.5959916338893,40.5959961674202,40.5959982557466,40.5959998261006,40.5960008579874,40.5960013382808,40.5960012592149,40.5960006212329,40.5959994353321,40.5959977140199,40.5959954863881,40.5959927775156,40.5959909990973,40.595989721468,40.5959889760514,40.5959887778511,40.5959891324856,40.5959900316704,40.5959914560669,40.5959933709255,40.5959957334606,40.5959984908433,40.5960015771843,40.5960049250951,40.5960084568138,40.596012049707,40.5960153901755,40.596018379164,40.5960209304983,40.5960229650313,40.5960244273907,40.5960252717494,40.596024938247,40.5960253299753,40.5960264329051,40.5960282109015,40.5960306028743,40.5960335251285,40.5960378745746,40.5960423478872,40.5960468436987,40.596051260997,40.5960554986096,40.5960594607417,40.5960625594504,40.5960659216443,40.5960694644285,40.5960730976893,40.5960767353278,40.5960802873717,40.5960836658499,40.5960867861295,40.596089574289,40.5961127360712,40.5961158782513,40.5961186328327,40.5961209402854,40.5961227489473,40.5961240220587,40.5961247293896,40.5961248554512,40.59612439899,40.5961251620086,40.5961265922993,40.5961286515685,40.596131284105,40.5961344184614,40.5961379711381,40.5961418455856,40.5961459383951,40.5961530340273,40.5961598561572,40.596166350648,40.5961724630228,40.5961781438288,40.5961833452806,40.5961979144437,40.596201727336,40.5962051448846,40.5962081261693,40.596210636802,40.5962126459105,40.5962141298196,40.5962150708873,40.5962160381899,40.5962163748462,40.5962160713744,40.5962151360546,40.5962135949244,40.5962114931285,40.5962088892201,40.5962039012216,40.5961996981465,40.5961963142711,40.5961959603008,40.5961961985532,40.596197023593,40.596198422783,40.596200366231,40.5962028166805,40.5962057285012,40.596209045014,40.5962127020074,40.5962166290822,40.5962480732117,40.5962640635292,40.5962795564218,40.5962945347842,40.596308981179,40.5963174456179,40.5963254915936,40.596333098145,40.5963402495058,40.5963469272267,40.5963531173816,40.5963588053745,40.5963611851371,40.5963629220844,40.5963640054452,40.5963644251124,40.5963641800311,40.5963632706474,40.5963617029442,40.5963594912742,40.5963560929274,40.5963521236277,40.5963475952424,40.5963425214807,40.5963369138769,40.5963307933458,40.5963241727661,40.596321330894,40.5963189981752,40.5963172328318,40.5963160793441,40.5963155632556,40.5963156987145,40.5963164819448,40.596317893085,40.5963198995519,40.5963224513396,40.5963255409067,40.5963284651519,40.5963311126312,40.5963333817639,40.5963351868657,40.5963364603344,40.5963360252191,40.5963346906829,40.5963370786821,40.5963398559469,40.5963428553818,40.5963458987059,40.5963488013118,40.5963749868909,40.5963923493867,40.5964096526828,40.596426867624,40.596443971761,40.5964609381149,40.5964777403796,40.5965608308262,40.596570088831,40.5965791480106,40.5965879694857,40.5965965187294,40.5966047581982,40.5966126540327,40.5966201742119,40.596626776788,40.5966330118717,40.5966388472715,40.5966442553223,40.5966492101931,40.5966536900788,40.5966576694837,40.596661133131,40.5966640617203,40.5966660778681,40.596668732105,40.5966720026011,40.5966758613272,40.5966802735587,40.5966852030645,40.5966906075843,40.5966964381631,40.5967444138951,40.5967796309767,40.5968144526543,40.5968488702114,40.5968537283524,40.5968582064606,40.5968622617784,40.5968658513781,40.5968689361824,40.5968714876618,40.5968734794642,40.5968748894265,40.5968757034198,40.596875913516,40.5968755181526,40.5968738737911,40.5968727961786,40.5968723048499,40.5968724097802,40.5968731097243,40.5968743891971,40.5968762268532,40.59687858627,40.5968814246679,40.5968884061061,40.5968956923412,40.5969032481704,40.5969110390691,40.5969190259896,40.596927171059,40.5969363459659,40.5969453484711,40.5969541472368,40.59696270707,40.5969710006514,40.5969789964664,40.5969866666921,40.5969939838332,40.5970150437064,40.5970355985079,40.5970556334791,40.5970751298456,40.5970832433436,40.5970908210138,40.5970978319965,40.5971042531437,40.5971100587891,40.5971135494284,40.5971165846641,40.5971191381535,40.5971211874071,40.5971227131125,40.5971237024969,40.5971241457949,40.5971240412863,40.5971247081584,40.5971260150247,40.5971279316419,40.597130413869,40.5971334018256,40.5971368252523,40.5971406050184,40.5971446494441,40.5971890365235,40.5971984726222,40.5972076842234,40.5972166143486,40.5972252075235,40.597233409274,40.5972406362433,40.5972476556417,40.597254425738,40.5972609042957,40.5972670505826,40.5972728278871,40.597278199827,40.5972831342063,40.5972876000015,40.5972914333632,40.5972944495486,40.5972966364475,40.5972990657765,40.5973020844303,40.5973056672345,40.5973097881817,40.5973144165714,40.597319517857,40.5973250551463,40.5973272522271,40.5973298964696,40.5973329328725,40.5973363009109,40.5973399332008,40.5973437549936,40.5973476892101,40.597351657601,40.5973555799244,40.597359376108,40.5973671484211,40.5973745976745,40.5973816967453,40.5973884216954,40.5973920070459,40.5973960945197,40.5974006359154,40.5974055756536,40.5974108568115,40.5974160475633,40.5974214934445,40.5974271401955,40.5974329273564,40.5974387952944,40.5974446852129,40.5974505327791,40.5974562788488,40.5974781387491,40.5974998994185,40.5975215370639,40.597543031075,40.5975643603396,40.5975877950502,40.5976110442767,40.5976340843924,40.5976568946172,40.5976794535024,40.5977007108729,40.5977221156031,40.5977436360259,40.597754754949,40.5977658068974,40.5977767566874,40.5977875719808,40.5977982226128,40.5978086733944,40.5978365960972,40.5978642870887,40.5978917359771,40.5979058077427,40.5979202468658,40.59793502519,40.5979501180745,40.5979669584365,40.5979834337815,40.5979995258388,40.5980118140926,40.5980238134833,40.5980355010457,40.5980430930829,40.5980510671694,40.5980593666513,40.598067930696,40.5981372081032,40.5981414508381,40.5981453805654,40.5981489396222,40.5981520758617,40.5981547429973,40.5981569031142,40.5981585223172,40.5981595765874,40.5981600529643,40.5981599420019,40.5981593576615,40.5981581051084,40.5981562057124,40.5981536907319,40.5981506006394,40.5981469847938,40.5981467103946,40.598147061877,40.5981480247274,40.5981495643333,40.5981516202878,40.5981541176253,40.5981569648045,40.5981641225041,40.5981715449667,40.5981791964965,40.5981870423997,40.5981950491626,40.5982040372951,40.5982131698058,40.5982224066489,40.5982317071087,40.5982410301382,40.5982568670301,40.5982726547006,40.598288354112,40.5983033697215,40.5983186075596,40.5983340403123,40.5983479902204,40.5983622660738,40.5983768184362,40.5983869703837,40.5983971915823,40.5984074317686,40.5984176462134,40.5984189651743,40.5984277880117,40.5984384560981,40.5984489929053,40.5984593528745,40.5984694954761,40.5984793778347,40.5985255721016,40.5985714226097,40.598616915624,40.598632455292,40.5986476887289,40.5986625961774,40.5986771583825,40.5986913572597,40.5987051742262,40.5987185927093,40.5987315946269,40.5987441630733,40.598766886707,40.598790126802,40.5988138674567,40.5988380961128,40.5988550088468,40.5988714868774,40.5988875121251,40.5989030698581,40.5989590686918,40.5989890806811,40.5990576977221,40.5991196525574,40.5991804019485,40.5992426561882,40.5992977152177,40.5993392322392,40.5993984343134,40.5994311144353,40.5994476492491,40.5994584033422,40.5994698764223,40.599484427307,40.5994999436867,40.5995132311036,40.5995194327023,40.5995300773576,40.5995413973285,40.5995426486165,40.5995366700501,40.5995307255778,40.5995266761719,40.5995227940569,40.5995159250627,40.5995065547539,40.5995005008374,40.5994976005411,40.5995019162074,40.599519371763,40.5995234375091,40.5995249374664,40.599523833995,40.5995208370867,40.5995215090279,40.5995262983373,40.5995380336811,40.599556470112,40.5995715369404,40.5995790291029,40.5995903304774,40.5995913689643,40.5995890556132,40.5995858369743,40.5995868445604,40.5995900480475,40.5995941592155,40.599596736355,40.5995970619148,40.5995914552885,40.5995829072796,40.5995768313563,40.5995739657705,40.5995733454012,40.5995826550512,40.5995900786038,40.5996072942177,40.5996206163288,40.5996234868932,40.5996230938983,40.5996187486835,40.5996130083712,40.5996062011036,40.5996005220902]}],[{"lng":[-73.8978033326603,-73.8976101330835,-73.8974134466262,-73.8967821330709,-73.896677454942,-73.8959444275682,-73.8955888446442,-73.8954642725973,-73.8952054035487,-73.8944111404313,-73.8935467713984,-73.8924573741515,-73.8913654358725,-73.8900378251875,-73.8900058919058,-73.8899585373793,-73.8895289317097,-73.889085352959,-73.888628250132,-73.8881581183427,-73.887675444841,-73.8849483577282,-73.8817902790232,-73.8802966914578,-73.8791915645211,-73.8786470531725,-73.8786849317358,-73.8780368114511,-73.8779734133435,-73.8784158941397,-73.8784686650073,-73.8785641338681,-73.8785517042653,-73.8785278703982,-73.8785612751928,-73.8785892552113,-73.8786111550537,-73.8786264617375,-73.8786348167139,-73.8786360242674,-73.8786300561012,-73.8786170520011,-73.8788424524132,-73.879106730719,-73.8791321451151,-73.8791654401008,-73.8792063404996,-73.8792545082698,-73.8793095452979,-73.8793709966891,-73.8794383545271,-73.8795110620713,-73.8795885183596,-73.879670083175,-73.8797550823379,-73.8797977038345,-73.8798638128148,-73.8798940439765,-73.8798966968779,-73.879900739591,-73.8798995199382,-73.8798995176126,-73.8798825182457,-73.879874807478,-73.8798740365594,-73.8798736362229,-73.8798755855182,-73.8798892803519,-73.8799071890126,-73.8799205989621,-73.8799406962303,-73.8799541676404,-73.8799799397146,-73.8800494297017,-73.8800580570922,-73.8800953627711,-73.8801024464887,-73.8801087752118,-73.8801187857745,-73.8801248405584,-73.8801264891146,-73.8801266081373,-73.880163250385,-73.8801635999479,-73.8801659898817,-73.8801691622173,-73.8801657482871,-73.8801694841882,-73.8801701815014,-73.8801712428575,-73.8801678043809,-73.8801745580505,-73.8801913226311,-73.8801916164721,-73.8801935636742,-73.8802059008085,-73.8802078324764,-73.8802137486279,-73.8802219660698,-73.8802361406777,-73.8802333890755,-73.8802305172569,-73.8802562566604,-73.8802584968331,-73.8802864928494,-73.8803358377168,-73.8804031477204,-73.8804693203197,-73.8804838692263,-73.8804871805416,-73.8804792323826,-73.8804780102218,-73.8804958942976,-73.8805249550592,-73.8805528929325,-73.8805752249226,-73.8805986798831,-73.8806277408174,-73.880677003491,-73.8806892543181,-73.8807250540903,-73.8807362354642,-73.8807283624747,-73.8807149306578,-73.8806802514144,-73.8806275895374,-73.8806096991928,-73.8805884179952,-73.8805424621398,-73.8805267381819,-73.880460588049,-73.8804572789135,-73.8804079514431,-73.8803900360554,-73.8803586436717,-73.8803328681754,-73.8802924806857,-73.8802441955917,-73.8801906002302,-73.880190305821,-73.8801880623493,-73.8801364091892,-73.8800970822606,-73.8800711977313,-73.8800486771754,-73.8800261642626,-73.8800250448096,-73.8800250222249,-73.8800193370552,-73.8800192679419,-73.8800192372239,-73.8800247427087,-73.8800392204129,-73.8800414575423,-73.8800593155298,-73.8800608313644,-73.8800671413242,-73.8801197766652,-73.8801668275462,-73.8801892307079,-73.8801895244297,-73.8802239534878,-73.8802534515157,-73.8802788609492,-73.88029385334,-73.8803192320206,-73.8803310349823,-73.8803360775953,-73.8803653193577,-73.8803655333291,-73.8803955912832,-73.8804342026679,-73.8804583580926,-73.8804842539794,-73.880500965631,-73.8805290299146,-73.8805354467327,-73.8805413611362,-73.8805596830738,-73.8805727422563,-73.8806040882411,-73.8806399509166,-73.8806659264155,-73.8806780791352,-73.8806949085863,-73.8806993483435,-73.880732898191,-73.8807332072028,-73.880779962267,-73.8808517152622,-73.8808794632659,-73.8809245981686,-73.8809666898605,-73.8809667366908,-73.8809896139518,-73.8810103395704,-73.8810366659409,-73.8810611180493,-73.8810937911746,-73.8811327772497,-73.8811330135346,-73.881201382175,-73.8812522830563,-73.8812731240256,-73.8813280552183,-73.8813466398481,-73.8813466967837,-73.8813930623062,-73.8814255353955,-73.8814379975936,-73.8814725573114,-73.8814878299484,-73.8814879406635,-73.8815285584656,-73.8815673404369,-73.8815721019061,-73.8815722105769,-73.8815772020862,-73.8815900750037,-73.8815945020351,-73.8815955915779,-73.8816045329313,-73.8816100807203,-73.881617879409,-73.8816269244134,-73.8816289945394,-73.8816389985553,-73.8816491269725,-73.881683813367,-73.8816874221403,-73.8816874510622,-73.881699455626,-73.8817184719164,-73.8817512279546,-73.8817531443446,-73.8817701089466,-73.881793471286,-73.8818032883057,-73.8818248082783,-73.8818673371245,-73.8818887417745,-73.8819031484402,-73.8819378245726,-73.8819848475401,-73.8820093512286,-73.8820262545109,-73.8820710338718,-73.8820834479769,-73.8821012602465,-73.8821325675666,-73.8821485544379,-73.8821593900552,-73.8821996756551,-73.8822410816566,-73.8822477661491,-73.882246200987,-73.8822387016209,-73.8822049924588,-73.8821915742118,-73.8821735229399,-73.8821487591416,-73.8821352225243,-73.8821352510555,-73.8821352503442,-73.8821483256257,-73.8827018992972,-73.8830200475129,-73.8831533311727,-73.8832455446222,-73.8834199920303,-73.8836049704785,-73.8836975956031,-73.8838722339892,-73.8839954100449,-73.8841290628367,-73.8843245260121,-73.8845506370338,-73.8848075041113,-73.8855776214899,-73.8857417071963,-73.8860058292221,-73.88600571242,-73.8860910714245,-73.886244489273,-73.8867313498488,-73.8867959523455,-73.8872011346562,-73.8872203376547,-73.8872203533829,-73.8872741952881,-73.8872789606891,-73.8873229793388,-73.8873299719461,-73.887333828688,-73.8873502980822,-73.8874344470842,-73.8874012011271,-73.8873602991523,-73.8873882378126,-73.8874469336019,-73.8874622211171,-73.8874647188716,-73.8875336378742,-73.8876366864042,-73.8876658922948,-73.8876376490732,-73.8876707446012,-73.8876553101662,-73.8877109748743,-73.8877261123323,-73.8876443045171,-73.8875675598212,-73.8875316868804,-73.8875162324726,-73.8875723293541,-73.8876156618932,-73.8876410820128,-73.8876461315462,-73.8876230210014,-73.8876407216673,-73.887712111561,-73.8877708221423,-73.8878415352003,-73.8879613104371,-73.8879649405896,-73.8879653819387,-73.8880210878483,-73.8880696128443,-73.8881229334594,-73.8881539485117,-73.888227969114,-73.8884346542795,-73.8886360535893,-73.888636384341,-73.8886520498474,-73.8886721924494,-73.8886841599324,-73.8887035191367,-73.8887120376317,-73.8887382577594,-73.8887492038272,-73.8887516760089,-73.8887606071995,-73.8887784202995,-73.8887784613448,-73.8887818714047,-73.888785737428,-73.8887896332399,-73.8887903425636,-73.8887917823198,-73.8888009670933,-73.8888130437335,-73.8888802948602,-73.8889071649289,-73.8889192100957,-73.8889305801328,-73.8889306268076,-73.8889451964663,-73.888964965711,-73.8890547680365,-73.8891160112304,-73.8891499818832,-73.8892213676699,-73.8892467793602,-73.8892535996305,-73.8892625978013,-73.8892721038874,-73.8892921474433,-73.8893126313275,-73.8893335348854,-73.8893548284385,-73.8893764882512,-73.8893984888237,-73.889420800697,-73.8894382976529,-73.8894554186528,-73.8894721318268,-73.8894884079406,-73.8895042168912,-73.8895195268084,-73.8895343078074,-73.8895485366049,-73.8895621837576,-73.889575224001,-73.8895876320789,-73.8896091870524,-73.8896301004703,-73.8896503639977,-73.8896699637976,-73.8896888906478,-73.8897071329151,-73.8897193422217,-73.8897321050063,-73.8897453889677,-73.8897560495366,-73.8897734101277,-73.8897880831581,-73.8898031529833,-73.8898149112122,-73.8898412593168,-73.8898466000989,-73.8898558749603,-73.8898644592518,-73.8898723360785,-73.8898794786586,-73.8898858725186,-73.8898914950526,-73.889903275498,-73.8899157131622,-73.8899287871816,-73.8899424709771,-73.8899567414852,-73.8899715705868,-73.889989944662,-73.8900087725793,-73.8900280367598,-73.890047719843,-73.8900678007307,-73.8900882613987,-73.8901090792111,-73.8901302372426,-73.8901517102082,-73.8901734796478,-73.8901955237954,-73.8902178211033,-73.890229285237,-73.8902407627059,-73.8902521941241,-73.890263521634,-73.8902746900169,-73.890285640966,-73.890296321893,-73.890306678002,-73.8903148200937,-73.8903166586725,-73.8903262121791,-73.8903352914123,-73.8901370101697,-73.8903473469378,-73.8905352631518,-73.8905679292267,-73.8905812243994,-73.8905891828561,-73.890596954543,-73.8906044702013,-73.8906076723734,-73.8906116678353,-73.8906184832629,-73.8906319246609,-73.8906449724447,-73.8906575764932,-73.8906920634393,-73.8907082114337,-73.8907234724986,-73.8907396996315,-73.890756856595,-73.8907629410376,-73.8907698109272,-73.8907774267507,-73.8907857331583,-73.8907946761026,-73.890803524896,-73.8908129286573,-73.8908228295895,-73.8908331637341,-73.8908438680023,-73.8908529230099,-73.8908622572135,-73.8908718079561,-73.890881506846,-73.8908912881291,-73.8909010812096,-73.8909163550211,-73.8909315102687,-73.8909464985534,-73.8909612683912,-73.8909757715952,-73.8909807485967,-73.8909896348528,-73.8910029805153,-73.8910157784161,-73.8910279948662,-73.8910396016766,-73.8910505697726,-73.8910596719932,-73.8910608718441,-73.891070481891,-73.8910793796367,-73.89108753996,-73.8910949439026,-73.8911020410883,-73.891109863209,-73.8911183930687,-73.8911276086252,-73.8911374852007,-73.8911479974591,-73.8911567365719,-73.8911591224897,-73.8911708299015,-73.8911830893013,-73.89118832603,-73.8911929066581,-73.8911968058248,-73.8911999997128,-73.8912024746162,-73.8912042130967,-73.8912052071625,-73.8912054508062,-73.8912050491175,-73.8912049408827,-73.8912036847972,-73.8912016846787,-73.8911989534381,-73.8911955064074,-73.8911913641942,-73.8911876868434,-73.8911832186282,-73.8911779654608,-73.8911719286328,-73.8911651109834,-73.8911575232601,-73.8911491665384,-73.8911400502501,-73.8911301778888,-73.8911195591098,-73.891108203346,-73.891096114747,-73.8910833060537,-73.8910405899323,-73.8910021806594,-73.890998341226,-73.8909952783794,-73.8909565652046,-73.8909152631784,-73.8909130586125,-73.8908744430551,-73.8908521594433,-73.8908461261975,-73.8908172170863,-73.8907877242855,-73.8907863020696,-73.8907576550378,-73.890727017915,-73.8907149265683,-73.8906958236795,-73.8906640804567,-73.8906317979142,-73.890598985278,-73.8905656544158,-73.8905452327877,-73.8905254338721,-73.8905062763383,-73.8904877702885,-73.8904699328515,-73.8904527752209,-73.8904363099129,-73.8904205507594,-73.8904055056561,-73.8903911897488,-73.8903402373585,-73.8903212633528,-73.8903015330323,-73.8902810567167,-73.8902598460379,-73.8902379154932,-73.8902152758389,-73.8901919400286,-73.8901679225629,-73.8901282110313,-73.8901221550469,-73.8901120996377,-73.8900916525544,-73.8900771256953,-73.8900328474689,-73.8899997985235,-73.8899951792163,-73.8899893276089,-73.8899751536972,-73.8899614891697,-73.8899483507188,-73.8899357592159,-73.889923727391,-73.889912273691,-73.8899014128319,-73.8898911599533,-73.8898815288918,-73.88987253171,-73.889864180698,-73.8898564881415,-73.8898361594499,-73.8898151082957,-73.8897933478588,-73.8897708897713,-73.8897546848205,-73.8897477465543,-73.8897239294043,-73.8896994543569,-73.8896743319523,-73.8896445223008,-73.889613985502,-73.8895827301099,-73.8895507677697,-73.889518107704,-73.8894847630915,-73.8894507422767,-73.8894323816677,-73.8894146948438,-73.8893976894822,-73.8893813778799,-73.8893657674931,-73.8893508659988,-73.8894734993448,-73.8894894451721,-73.8894815257607,-73.8894101279679,-73.8891938310903,-73.8890809317505,-73.8887969084867,-73.888779002113,-73.8887610824868,-73.8889992056442,-73.8893087980161,-73.8894139481681,-73.8894218635042,-73.8894138728553,-73.8893760297505,-73.8893112237849,-73.8891879927448,-73.8891871147141,-73.8891323460895,-73.8890947396007,-73.8890604248535,-73.8890448745863,-73.8890423902258,-73.8890489028009,-73.888985775779,-73.8888956901532,-73.8888654177821,-73.8888458026407,-73.8888016423797,-73.8887814604977,-73.8887811933173,-73.8887607627378,-73.8887338175948,-73.8887291468568,-73.8887232216067,-73.8887126066979,-73.8886905447409,-73.8886660149626,-73.8886413764137,-73.8886100486939,-73.8885865544105,-73.8885824789519,-73.8885881021732,-73.8886058808228,-73.8886261017208,-73.888642837341,-73.8886357258818,-73.8886062843827,-73.8885938986803,-73.8885781071857,-73.8885500525067,-73.8885163756852,-73.8884628652518,-73.8884625474033,-73.8884446114139,-73.8883998288279,-73.8883903094234,-73.8883763677676,-73.8883525019477,-73.8883438753317,-73.8883437259361,-73.8883248617605,-73.8883128546047,-73.8883081080414,-73.8883068176624,-73.8883036443521,-73.8882863165544,-73.8882666647588,-73.8882005072666,-73.8882004729225,-73.8881978771867,-73.8881971830518,-73.8881910957765,-73.8881860587453,-73.8881860202114,-73.888185807547,-73.8881838638654,-73.8881895634224,-73.888197450704,-73.8881975837522,-73.888208719432,-73.8882064524796,-73.8882042980555,-73.8881912733654,-73.8881864038364,-73.888176393264,-73.8881899083885,-73.8882269621624,-73.8882662315028,-73.8882853135606,-73.8882918314305,-73.8883077544903,-73.8883392925627,-73.8883526223748,-73.8883739579869,-73.8884053189619,-73.8884501510236,-73.8884972019387,-73.888536179038,-73.8885364000042,-73.8885377294145,-73.8885397036874,-73.8885329769589,-73.8885329121287,-73.8885095050094,-73.8884678792331,-73.8884581424499,-73.8884501049444,-73.8884460762796,-73.888444911166,-73.8884496427119,-73.8884498097198,-73.8884531555449,-73.8884555743291,-73.8884598647732,-73.8884808434621,-73.8884845321832,-73.8885354929323,-73.888549083047,-73.8885580132433,-73.8885669395,-73.8885794408547,-73.8885950705728,-73.8886156214393,-73.8886404864065,-73.8886539856279,-73.8886545363101,-73.8886552004397,-73.8886462562195,-73.8886418159309,-73.8886149871964,-73.8885994356712,-73.8885993255203,-73.8885645969962,-73.8884996011824,-73.88843010109,-73.8883594588713,-73.8883550364736,-73.8882887873972,-73.8882278450763,-73.8881891139797,-73.8881608918387,-73.8881388653089,-73.8881026623147,-73.8880813888399,-73.8880657411518,-73.888060043625,-73.8880600122958,-73.8880568620131,-73.8880569576788,-73.8880636199673,-73.8880662700268,-73.8880673451985,-73.8880734950461,-73.8880906549401,-73.8880882339976,-73.8880944193573,-73.888137082136,-73.8881426999283,-73.8881640304334,-73.8882100789995,-73.8882144721319,-73.8882729241556,-73.8882897784556,-73.8882897892512,-73.8882898142074,-73.8882894131317,-73.888274913222,-73.8882696107507,-73.8882687707751,-73.8882629374047,-73.8882303091945,-73.8882240030451,-73.8882232229558,-73.8882531151052,-73.888256221699,-73.8882561100694,-73.8882483105599,-73.8882405361017,-73.8882256499759,-73.8882113835561,-73.8881917813462,-73.8881799759289,-73.8881283678035,-73.8881053861192,-73.8880745203193,-73.8880361981285,-73.8880285350117,-73.8880055972573,-73.8880005202701,-73.8879817286608,-73.8879624724086,-73.8879288850421,-73.8879286314985,-73.8878717545082,-73.8878395447129,-73.8878393001916,-73.8878364859783,-73.887804619525,-73.8877710878166,-73.8877643275201,-73.8877408383243,-73.887745346797,-73.8877468422897,-73.887749853391,-73.8877392553051,-73.8877150953559,-73.8876748035825,-73.8876288945357,-73.8876071915466,-73.887596455669,-73.8875847905671,-73.8875847646706,-73.8875751970743,-73.8875546216293,-73.8875427618252,-73.8875124992284,-73.8874991023325,-73.8874955194376,-73.887467762069,-73.8874616912354,-73.8874420121382,-73.8874256812615,-73.8874162715332,-73.8874114797073,-73.887409601565,-73.8874364943121,-73.8874544917707,-73.8874801709586,-73.8874802875462,-73.887485048901,-73.8874937323772,-73.8874942582483,-73.8875071840712,-73.8875016761739,-73.8875016405139,-73.8875173610867,-73.8875176084284,-73.8875476549086,-73.8876015226691,-73.8876438507178,-73.8876643710068,-73.8876713055163,-73.8877249750268,-73.8877522538269,-73.8877676193186,-73.8878090250816,-73.8878259740111,-73.8878475212705,-73.887886582198,-73.8879036735175,-73.8879169072354,-73.8879258807562,-73.8879337004716,-73.8879558736692,-73.8879650287928,-73.8879651892691,-73.8879885653265,-73.8880064712427,-73.8880253750506,-73.8880255300625,-73.8880268490781,-73.8880681212523,-73.8880719688209,-73.8880759667135,-73.8880783066116,-73.8880838316491,-73.8880838387567,-73.8880838545711,-73.8880558718278,-73.8880457157159,-73.8880099658953,-73.8879640644287,-73.8879487693024,-73.8879271047491,-73.8879125294196,-73.887881101482,-73.8878809637127,-73.887868076512,-73.8878451928548,-73.8877823900498,-73.8877352861537,-73.8876724480614,-73.887611840357,-73.887548995852,-73.8874966561793,-73.8874872687577,-73.8874255405377,-73.8874250246466,-73.8873694089588,-73.8873436166568,-73.8873148714774,-73.8873021744443,-73.8872912181404,-73.8872685828088,-73.8872529307313,-73.8872451342893,-73.8872094090394,-73.887199205875,-73.8871920591583,-73.8871835496121,-73.8871869793507,-73.8871809710147,-73.887173579731,-73.8871644921651,-73.8871500460037,-73.8871119618962,-73.8870918229423,-73.8870911770818,-73.8870907875409,-73.8870751789797,-73.887067560302,-73.8870618024612,-73.8870344533708,-73.8870147716993,-73.8869845793164,-73.8869588754986,-73.8869410265078,-73.8869365699228,-73.8869250057349,-73.8869164333014,-73.8869120345451,-73.886889641439,-73.8868717156668,-73.8868033181381,-73.8867842443031,-73.8867841553518,-73.8867789508059,-73.8867752427268,-73.8867839180963,-73.8867841964753,-73.8867942499054,-73.8867964557142,-73.8867860550348,-73.8867852374325,-73.8867482931072,-73.8867102483657,-73.8866836655693,-73.8866833639223,-73.8866774568037,-73.8866520186378,-73.8866388736411,-73.8866307773552,-73.8866304837735,-73.8866173330251,-73.886583560071,-73.8865809150806,-73.8865795037645,-73.88654888956,-73.8865511118942,-73.8865761610945,-73.886542215947,-73.8864333200532,-73.8864325000971,-73.8864258065683,-73.8864168906533,-73.8864074296283,-73.8863721085288,-73.8863618586515,-73.8863575872551,-73.8863463875928,-73.8863374930814,-73.8863050400767,-73.8862851676738,-73.8862260272726,-73.8862363352513,-73.8862466423342,-73.8862364679181,-73.8861652274431,-73.8861372067947,-73.8861291045218,-73.8861204115462,-73.8860980377358,-73.8860723356275,-73.8860721076197,-73.8860252967909,-73.8859908619233,-73.8859524100367,-73.8859101775899,-73.8858795227053,-73.8858791826368,-73.8858668500662,-73.885850381286,-73.8858279911254,-73.8858011094989,-73.8857885828904,-73.885768621624,-73.8857275231905,-73.8857002497674,-73.8856886383046,-73.8856688804522,-73.8856464878182,-73.8856223616398,-73.8856061513847,-73.8855849393403,-73.885538908857,-73.8855131618489,-73.8854849551704,-73.8854761778706,-73.8854358163807,-73.8853797761384,-73.8853521641245,-73.8853517777482,-73.8853237600689,-73.8852531466708,-73.8851903951511,-73.8851276487512,-73.8850981973541,-73.8850682742299,-73.8850212074055,-73.8849550854284,-73.8849382948492,-73.8849224496537,-73.884921512681,-73.8849139690309,-73.8849138725703,-73.8848632551552,-73.8848322247268,-73.8847993878379,-73.884751503504,-73.8847332667142,-73.8846918143662,-73.8846835451484,-73.8846335642668,-73.8846173429458,-73.884382709926,-73.8837357876379,-73.8831126192456,-73.8825163484787,-73.8819016774992,-73.8812653338029,-73.8807888972565,-73.8807668549838,-73.8805512388226,-73.8797498303041,-73.8795388801708,-73.8794552216839,-73.8793548001826,-73.8791178779807,-73.8790771564274,-73.879050608504,-73.8789668607114,-73.8788736264867,-73.8787651808329,-73.8787003914134,-73.8789370872557,-73.8789535877491,-73.8790173117542,-73.8790799104255,-73.8791451427625,-73.8791695596886,-73.8792563256351,-73.8793404042684,-73.8794340175015,-73.8795299405538,-73.879975459385,-73.8801210453158,-73.8802941853155,-73.8804057727442,-73.8805173569765,-73.8806568100395,-73.880743765109,-73.8808553316143,-73.8809570243761,-73.8810800672583,-73.8811916137202,-73.8813262524205,-73.8825543035618,-73.8834487815581,-73.8834823178755,-73.8837245750953,-73.8838199042828,-73.8841553029174,-73.8842909604013,-73.8844119453547,-73.8845162081575,-73.8846020439878,-73.884668162112,-73.8847137670356,-73.8847385226749,-73.8847426643222,-73.8847364113229,-73.8847268487133,-73.8847593778489,-73.8847407940681,-73.8847373797384,-73.8847426687268,-73.8847648202445,-73.8848030491185,-73.8848547180938,-73.8849159404165,-73.8849864586851,-73.885071781629,-73.8851682536885,-73.8852702895132,-73.8853713558031,-73.8854652995816,-73.8855475083986,-73.8859254520789,-73.8861162792192,-73.886340592969,-73.8865099810516,-73.8866990060801,-73.886902124809,-73.8871355924869,-73.8873108861771,-73.887536129845,-73.8880542078172,-73.8883663017257,-73.8912129976544,-73.8918341140108,-73.8921705698979,-73.8924879958441,-73.8928333280948,-73.8930497455622,-73.8933501530381,-73.8935835752479,-73.8937697128522,-73.8939559679226,-73.8941001952536,-73.8942383881476,-73.8944552643118,-73.8946013353659,-73.8947293509273,-73.8949051955448,-73.8950321037624,-73.8951632926857,-73.8952496934687,-73.8953636929985,-73.8954715046768,-73.89558588818,-73.8956816844572,-73.8957622250945,-73.8958748912299,-73.8962579773043,-73.8964613830911,-73.8975498986198,-73.901461611025,-73.9021161182336,-73.9028981674214,-73.903703697827,-73.9041279320763,-73.9044869797308,-73.9045447715639,-73.9046052092317,-73.904834878512,-73.9048927064581,-73.9049063484711,-73.90493526224,-73.9050114916937,-73.9050486258982,-73.9050551104066,-73.905063544578,-73.9052916082105,-73.9057960409118,-73.9059490888677,-73.9066367320419,-73.9074633316008,-73.9082520114174,-73.908263338241,-73.9082844461988,-73.9091148452629,-73.9099191284119,-73.9106566840264,-73.9112441893432,-73.9115908231538,-73.9124508362557,-73.9132168803885,-73.914145320418,-73.9143051745633,-73.9144607094102,-73.9146114888326,-73.914757090034,-73.9148971047335,-73.9150311403104,-73.9151588209049,-73.9159021108311,-73.9159508373968,-73.9160039467752,-73.9160607998865,-73.9161207125988,-73.9161829639607,-73.9162468048775,-73.9163454941254,-73.916443754872,-73.9165408671357,-73.9166361193511,-73.9167288135833,-73.9168182706426,-73.9169038350615,-73.9169848798975,-73.9170608113275,-73.917131072999,-73.9171951501062,-73.9173939467481,-73.9174314814251,-73.9174616308028,-73.9174839920899,-73.9174982665495,-73.9175042634897,-73.9175019028097,-73.9174912160695,-73.9174723460668,-73.9174455449284,-73.9174111707403,-73.9173696827633,-73.9173216352962,-73.9167274649028,-73.9166869419112,-73.9166522022989,-73.9166238711376,-73.916602458187,-73.9165883487231,-73.9165817966066,-73.9165829197164,-73.9165916978292,-73.9155793635767,-73.9150217346099,-73.9148949764836,-73.9091803329732,-73.9082635730681,-73.9046420922078,-73.9039610671126,-73.9038554066149,-73.9038795992604,-73.9038667886285,-73.9042953851388,-73.9050086857623,-73.9054620613726,-73.9054456224268,-73.9054129826684,-73.9053295804466,-73.9053187038137,-73.9053972670154,-73.9053102020986,-73.9052963871087,-73.9052144077383,-73.9052018060492,-73.905121606948,-73.9051041354597,-73.9050236675442,-73.9050096972735,-73.9049289576819,-73.9049141358098,-73.904833600891,-73.9048175268759,-73.9047366871096,-73.9047186460013,-73.9046358148505,-73.9046255301735,-73.904543592505,-73.9045286158195,-73.9044481231161,-73.9044331682043,-73.9043524899594,-73.9043343806248,-73.9042557084927,-73.9042399340886,-73.9041602661059,-73.9041444660198,-73.9040647052122,-73.9040477661521,-73.9039661855735,-73.903954842642,-73.9038695615476,-73.9038580624162,-73.9037806175106,-73.9037701745543,-73.9036998205377,-73.9036874294035,-73.903619110891,-73.9036031336258,-73.9035373680357,-73.903522487372,-73.9034543281034,-73.903440894481,-73.9034222354569,-73.9033598553629,-73.9032905968249,-73.9032778744425,-73.903208978293,-73.9031407632171,-73.9031244379258,-73.9032084827847,-73.9031522612403,-73.903070056556,-73.9030543308402,-73.903124365857,-73.9030375683652,-73.9029656876546,-73.9029303690019,-73.902882639085,-73.9028679118272,-73.9027983883607,-73.9027845026159,-73.9027116273265,-73.9026992455198,-73.9026274717336,-73.9025586567165,-73.9025465611261,-73.902630595172,-73.9031323178665,-73.9031737227908,-73.9032033436977,-73.9032704594403,-73.9030228356249,-73.9028853605296,-73.9026933327198,-73.9028326222325,-73.902786289517,-73.9027554825764,-73.902718988289,-73.9024154305031,-73.9022870793228,-73.902296940499,-73.9024038097297,-73.9027136957305,-73.9026190873502,-73.9026236445669,-73.9027193711578,-73.9027453101951,-73.9026355880259,-73.902643555547,-73.9027020908574,-73.9027123675958,-73.9028344908604,-73.9028345657888,-73.902839581404,-73.902844484734,-73.9028481626175,-73.9028749237501,-73.9028743526673,-73.9028713027798,-73.9028681966419,-73.9028680087711,-73.9027392621568,-73.902751683756,-73.9028818162023,-73.9029161957411,-73.9029258874348,-73.9029282896843,-73.9029233750588,-73.9029111997292,-73.9028919028258,-73.902865704848,-73.9028329051439,-73.9027938784895,-73.9027447653789,-73.9026925420737,-73.9026381822575,-73.9025826994467,-73.9025271280945,-73.9024725043048,-73.9024198465156,-73.9023701365109,-73.9023243011164,-73.9023133022337,-73.9023012136959,-73.9022883700091,-73.9022751265758,-73.9022618498599,-73.9022489072463,-73.9022366568749,-73.90222543773,-73.9022155602602,-73.9022072977882,-73.902200878947,-73.9021964813538,-73.9021942266949,-73.9021941773586,-73.9021963347092,-73.9021885323971,-73.9021731017475,-73.9021501527437,-73.9021198489441,-73.9020824063163,-73.9020380916971,-73.9019872208908,-73.9019301564184,-73.9018673049339,-73.9018236921877,-73.901778992381,-73.9017338255721,-73.9016888182974,-73.90159876483,-73.9015102845169,-73.9014240685029,-73.9013407902442,-73.9012611002468,-73.9011856209853,-73.9011149420401,-73.9010496154919,-73.9009901516093,-73.900937014863,-73.900890620298,-73.9008513302916,-73.900635070827,-73.9006051606847,-73.9005682539552,-73.9005253229122,-73.9004774985288,-73.9004260406836,-73.9003723049714,-73.9003177069924,-73.9002636850615,-73.9002116623188,-73.90016300924,-73.9001168933873,-73.9000935534621,-73.9000698935925,-73.9000459368711,-73.9000198034865,-73.8999933230783,-73.8999665163261,-73.8999394012711,-73.8999119974871,-73.8998843249903,-73.8998564055602,-73.8998282578906,-73.8997999044147,-73.8997713629478,-73.8997426581193,-73.8997138055493,-73.8996848303053,-73.8996557534954,-73.8996265940348,-73.8995973756714,-73.899568118413,-73.8995544519647,-73.8995403932257,-73.8995259709788,-73.899511213571,-73.8994961548393,-73.899480818956,-73.899465244386,-73.8994494577155,-73.899433492574,-73.8994173817151,-73.89940115833,-73.8993848540723,-73.8993685027986,-73.8993521379237,-73.8993357937474,-73.8993195012708,-73.8993032956773,-73.8992872097292,-73.8991827974816,-73.8990784954819,-73.8989743087886,-73.8989610632236,-73.8989475386674,-73.8989337746792,-73.8989198145566,-73.898905704238,-73.898891485273,-73.8988772025038,-73.8988629051775,-73.8988486335294,-73.8988344343923,-73.898820351964,-73.898806430668,-73.8987927142675,-73.8987792458673,-73.8987642902614,-73.8987492634061,-73.8987342007021,-73.8987191417266,-73.898704124732,-73.8986891848975,-73.8986743604695,-73.8986596897001,-73.8986452077562,-73.898630952885,-73.8986169582684,-73.8986143472153,-73.8986110997015,-73.8986072622478,-73.8986028877649,-73.8985980355486,-73.8985927763314,-73.8985871828397,-73.8985813335198,-73.8985753103544,-73.8985691977504,-73.8985630823293,-73.898557047421,-73.8985511816496,-73.8985455622144,-73.8985051500907,-73.8984643680203,-73.8984232430613,-73.8983818027059,-73.8983421137375,-73.8983023764783,-73.8982626036802,-73.8982228118342,-73.8981830165568,-73.898117675681,-73.8981096619867,-73.8980425821651,-73.8980083838214,-73.8979618889221,-73.8978722356108,-73.8977209457803,-73.8976369001461,-73.8976223342306,-73.8975898452834,-73.8975813505004,-73.8975741582977,-73.8975731455857,-73.8975014994876,-73.8974809447067,-73.8974459426413,-73.8973989789771,-73.8971916396652,-73.8970522396707,-73.896994504372,-73.8969245112827,-73.8970717166319,-73.8971479172305,-73.8972185991283,-73.8972930573074,-73.8973306853778,-73.897344056026,-73.8973668038461,-73.8973876948109,-73.8973973565469,-73.8974088802114,-73.897418411566,-73.8974167789968,-73.8974094943071,-73.8974038019086,-73.8973262920142,-73.8972603878599,-73.8972061044235,-73.8971634489842,-73.897149258593,-73.8971294394962,-73.897129112271,-73.8971274733407,-73.8971263315366,-73.8971265471953,-73.8971269679088,-73.8971302438283,-73.8971413028214,-73.8971471760744,-73.8971604866737,-73.8971812256639,-73.897209379771,-73.8972449295147,-73.8972878511016,-73.8976089486917,-73.8982671480452,-73.8983237178363,-73.8986941157259,-73.8989511291848,-73.8989922257415,-73.8990463035057,-73.8992471869184,-73.8993099461888,-73.8993442977415,-73.8993512566008,-73.8993603732891,-73.899379237745,-73.8993993704752,-73.8994447521548,-73.8994804773002,-73.8995136204795,-73.8995468022037,-73.8995906797143,-73.8996220607459,-73.8996532944496,-73.8996977350455,-73.8997616287743,-73.8998282596582,-73.8998478610297,-73.8998560588359,-73.8998643649591,-73.8999015498527,-73.8999676154556,-73.9000232051821,-73.9000591937617,-73.900087545452,-73.9001166831249,-73.9001357604735,-73.9001405876266,-73.9001503512013,-73.9001643450497,-73.9001706300606,-73.9001675645937,-73.9001765460035,-73.9001912115877,-73.9002056548761,-73.9002123922264,-73.9002073080751,-73.900198852004,-73.9001924186405,-73.9001943667207,-73.9002033105087,-73.9002284158827,-73.900262645067,-73.9002772026637,-73.9002893981053,-73.9003006998603,-73.9003267387975,-73.9003581403156,-73.900396615962,-73.9004327403557,-73.9004737367834,-73.9005331668629,-73.9005981449608,-73.9006397572874,-73.9007361551919,-73.900776429412,-73.9008488299904,-73.9008900835326,-73.9009479716564,-73.9009935376356,-73.9010634082908,-73.9010955772667,-73.9010994890884,-73.9010910943137,-73.9010610286713,-73.9010244354279,-73.9009379276118,-73.9008210296445,-73.9007775325586,-73.9007702193054,-73.9007689327142,-73.9007712927222,-73.9007341859371,-73.9007233273091,-73.9007134492869,-73.9006909742426,-73.9006804674304,-73.9006834316555,-73.9006936915894,-73.9006907078765,-73.9006603680403,-73.9006351921556,-73.900613724036,-73.9006207126255,-73.9006404407336,-73.9006534360449,-73.9006405836465,-73.9006146748875,-73.9006089729732,-73.9006246270629,-73.9006416726547,-73.9006419860525,-73.9006293536351,-73.9006248535797,-73.9006164249499,-73.9005892738051,-73.9005752276523,-73.9005574079823,-73.9005429349236,-73.9005129972769,-73.900478771376,-73.9004418776915,-73.9004241529547,-73.9003931728814,-73.9003732293538,-73.9003534685542,-73.9003415960951,-73.9003224107072,-73.9002910321893,-73.9002795000761,-73.9002859862319,-73.9003040613444,-73.9003219239301,-73.9003538059495,-73.9003737559757,-73.9003977563063,-73.9004566021521,-73.9005225556332,-73.9005480799281,-73.9005597638919,-73.9005606323696,-73.9005377147712,-73.9005149854258,-73.9005221518937,-73.9005505231578,-73.9006329002549,-73.9007627287386,-73.9007997925509,-73.9008500241438,-73.9009320516455,-73.9009845073496,-73.9009972550451,-73.9010097150375,-73.901052234631,-73.9011040485326,-73.9011457931654,-73.9011684704456,-73.9011653686314,-73.9011553977687,-73.9011526088371,-73.9011550980137,-73.9011771204405,-73.9012202703854,-73.9012676208131,-73.9012847250829,-73.901309192254,-73.90135539419,-73.9014064603621,-73.9014446327037,-73.9014741962038,-73.9014857436897,-73.9014751142047,-73.9014746142435,-73.9014658951599,-73.9014449736197,-73.9014405911301,-73.9014205570473,-73.9014015422248,-73.9013772880984,-73.9013541648618,-73.9013515231911,-73.9013490767816,-73.9013661982311,-73.9014259079255,-73.9014921109909,-73.9015543250581,-73.9015775489572,-73.901585807013,-73.9016087418389,-73.9016355110479,-73.9017156921984,-73.9017239501834,-73.9017254426589,-73.9019050030853,-73.9019714036204,-73.9020035753997,-73.9020379967165,-73.9021824487332,-73.9022230288152,-73.9022909077179,-73.9023069158266,-73.9023172256857,-73.9023323476476,-73.9024475715824,-73.9024871104336,-73.9024596126822,-73.902493929853,-73.9012194426385,-73.9012076150597,-73.9011925346545,-73.9012076728411,-73.9012356515129,-73.9012503967299,-73.9012767949627,-73.901293247317,-73.9013139570878,-73.9013296265941,-73.9013449735864,-73.9013018441844,-73.9013105739888,-73.9012538846132,-73.9012483686557,-73.9013089885229,-73.9025355512105,-73.902557307369,-73.9026400798301,-73.9026507794679,-73.9025022719906,-73.9024984853692,-73.9024671553139,-73.9024724301828,-73.9023603209621,-73.9024069353587,-73.9025070096554,-73.9025149923374,-73.9025630841481,-73.9025716876861,-73.9027185426066,-73.9027280638814,-73.9026389947444,-73.9026382774741,-73.9026671089062,-73.9026815311062,-73.9027110789619,-73.9027272659197,-73.9027581954358,-73.9027735665674,-73.9028050684898,-73.902819739052,-73.902843718119,-73.9029266698344,-73.9030278119923,-73.903043928125,-73.9029175037036,-73.9029011311734,-73.9029095306502,-73.9028054666336,-73.9027066445075,-73.9026291824535,-73.9025974474087,-73.9025811404981,-73.9025278831392,-73.9024227471758,-73.9025597512367,-73.9027112413336,-73.9041761237921,-73.9041804259029,-73.9041898239051,-73.9058710527737,-73.9059069550503,-73.9058733697039,-73.9057345590124,-73.9057502631135,-73.9057790314497,-73.9057870839,-73.9058086859139,-73.9058167572533,-73.9058434333229,-73.9058857111461,-73.9059979051369,-73.9060086541314,-73.9060332892487,-73.9059858769134,-73.9059595075557,-73.9059283188068,-73.9059663822289,-73.9059237460909,-73.9059192679266,-73.9058793762093,-73.9059589131693,-73.905962463641,-73.9069651511668,-73.9069628364508,-73.9071474543953,-73.9071729114985,-73.9069867972527,-73.9067384866641,-73.9068102317299,-73.9070631177649,-73.9072568556499,-73.9072746609148,-73.9070834696827,-73.9072259243727,-73.9074120219435,-73.9074425541207,-73.9072549471798,-73.9070216067845,-73.9071059539903,-73.9073591924334,-73.9075273513217,-73.9075433286789,-73.9073751688889,-73.907241693827,-73.9072949558037,-73.9073429922426,-73.9074750370572,-73.9075897717354,-73.9076788286201,-73.9075513560224,-73.9076194856061,-73.9075900038479,-73.9076165910457,-73.9076492629661,-73.9076717467147,-73.9077114691581,-73.9078127920195,-73.907915914535,-73.9079965006117,-73.907988892375,-73.9079963331283,-73.9079943330381,-73.9080631504784,-73.9081331824062,-73.9081725296137,-73.9082457067644,-73.9083864623968,-73.9085225257282,-73.9086035159342,-73.9087908801765,-73.9088691099089,-73.9088139602081,-73.9086333391297,-73.9086639288127,-73.9088369111078,-73.9090714515395,-73.9083540321468,-73.9083744262503,-73.9087942081917,-73.9091383944822,-73.9091385318665,-73.908598311334,-73.9084789198752,-73.9081056047634,-73.9079908725976,-73.9079730639052,-73.908156638516,-73.9081744525562,-73.908123458225,-73.9085065389191,-73.9086286169873,-73.9091767510533,-73.9091689415312,-73.9088145620859,-73.9089570612872,-73.9091144927294,-73.9094302789909,-73.9094537083595,-73.9096440604036,-73.9096362583485,-73.9095974091034,-73.9090296056528,-73.9090202084436,-73.9090078273074,-73.9086163431735,-73.908535014809,-73.9083603562737,-73.9082909214441,-73.9077759619366,-73.907275904126,-73.9070628052691,-73.9069939905885,-73.9069362516362,-73.9068409369713,-73.906736396139,-73.9066869820963,-73.9053584507717,-73.9050217969073,-73.9050246349407,-73.9050147382876,-73.9048983350137,-73.9042156949238,-73.9043548553967,-73.9043008577121,-73.9042746621034,-73.9042601969841,-73.9042798052675,-73.9042860043331,-73.9042081411341,-73.9041062988295,-73.9040433252934,-73.9040677098566,-73.9041163714217,-73.9041608387749,-73.904099299029,-73.9041408914517,-73.9038492515957,-73.9035098078224,-73.9033950928256,-73.9034051053773,-73.903310470125,-73.9032832889575,-73.9033736213701,-73.9033764820907,-73.9034940744778,-73.9034554986213,-73.9034218726651,-73.9033385611318,-73.903135787071,-73.9028649606525,-73.9027450453749,-73.9026290686441,-73.9026827792878,-73.902391382413,-73.9023236133432,-73.9022586003223,-73.9022144276591,-73.902224976396,-73.9022198334353,-73.902205162944,-73.9020749081877,-73.9021459909271,-73.9021033616366,-73.9019616421984,-73.9019619658436,-73.9019906392132,-73.9020144080904,-73.9020043464916,-73.902001309366,-73.9019968182828,-73.9019788587876,-73.9019730740152,-73.9019708640879,-73.9019474600089,-73.901916231516,-73.9018780341217,-73.9019135415302,-73.9019117758592,-73.9018877939877,-73.9018764102409,-73.9019075212497,-73.9018974527644,-73.9018689301857,-73.9017199615079,-73.901704956772,-73.9016987261811,-73.9016773960648,-73.9016863280984,-73.9017115043726,-73.9017008103719,-73.9016585810002,-73.9016480828611,-73.9016421179009,-73.9017766980998,-73.9018126727041,-73.9018503741234,-73.9018737620181,-73.9018758279152,-73.9018971006949,-73.9029190912243,-73.9038128996268,-73.9047075761312,-73.905205309798,-73.905243009921,-73.905287930234,-73.9053918142236,-73.9053353447315,-73.9054244000322,-73.9056069037709,-73.9057000105689,-73.9057520593648,-73.9058848197945,-73.9059746117786,-73.9062342240524,-73.9069550840054,-73.9070989561338,-73.9072435397904,-73.9073883383935,-73.9075328546229,-73.9076765921286,-73.9078190572357,-73.9079597606407,-73.908098219092,-73.9081851262524,-73.90835106213,-73.9084145076679,-73.9084481536089,-73.9084809317711,-73.9085697157624,-73.9086147239464,-73.9086395953543,-73.9087052910715,-73.9087459909934,-73.9088291986607,-73.908885744221,-73.9090627964693,-73.9090873738523,-73.9091332276486,-73.9091872847109,-73.9092344962552,-73.9092725433401,-73.9093380498315,-73.9098452832665,-73.9098088373603,-73.9098547878519,-73.9098515484547,-73.9097766138252,-73.909609434184,-73.9095907093664,-73.909152335878,-73.908985357892,-73.9089453186321,-73.9088569131567,-73.9087247642439,-73.9087428590494,-73.9086135794197,-73.9085784099038,-73.9085443686702,-73.9084746106101,-73.908309661749,-73.9083253683517,-73.9088994495653,-73.9089337567326,-73.9091252659386,-73.9091345297295,-73.9109227002118,-73.9124725401532,-73.91306509094,-73.9132900399955,-73.9135250091696,-73.913651197596,-73.9136253383354,-73.9137777644715,-73.913841421729,-73.9149777907493,-73.9149134535406,-73.9150040110156,-73.9150438909926,-73.9150961629301,-73.9156700690795,-73.9159188769135,-73.9159512486576,-73.9162659441616,-73.9163482853368,-73.9167355648614,-73.9166973689036,-73.9167555403451,-73.916691214279,-73.9167158360474,-73.9166044214795,-73.9167064442666,-73.9166146526477,-73.9166695535851,-73.9167211575904,-73.9166417159367,-73.9163223001753,-73.9166877515028,-73.9167839443282,-73.9165707398336,-73.9166256837356,-73.9168398111877,-73.9164870092733,-73.9165092453593,-73.9168896458732,-73.9168553679985,-73.9168739501378,-73.9168280324376,-73.9169986709837,-73.9170516577582,-73.9170883850332,-73.917028227419,-73.9168196452964,-73.9166567653347,-73.9168103695898,-73.9167995309069,-73.9167037928953,-73.9166807528295,-73.9166409980965,-73.9166637973002,-73.9165660406583,-73.9163858514521,-73.9162767815813,-73.9160607713265,-73.9161647503773,-73.9156289810896,-73.9155457767295,-73.9149203593212,-73.9149995085535,-73.9148900110566,-73.91481827328,-73.9146493305456,-73.9145593876359,-73.9144954220598,-73.9145805764986,-73.9147439564002,-73.9148625905378,-73.9148256823382,-73.9147633645915,-73.914792897811,-73.9148557036074,-73.9148697779123,-73.9149341879044,-73.9148785129801,-73.9141576235188,-73.9138605306075,-73.914079858683,-73.9141815817566,-73.9141642499162,-73.914184093778,-73.9142261959574,-73.9141120615842,-73.914165792459,-73.9142223866503,-73.9142807266294,-73.9143396603931,-73.9143969043977,-73.9144508787714,-73.9145009124253,-73.91454638327,-73.9145754123262,-73.9146017069913,-73.9146036333186,-73.9146191293957,-73.9146687577439,-73.9147562127792,-73.9147778053186,-73.9150876407781,-73.9152681819283,-73.9158022419976,-73.9159639324669,-73.916420990035,-73.9164042825166,-73.9161455612036,-73.915929075294,-73.9159145211068,-73.9159560237016,-73.9157253830337,-73.9157680735657,-73.9157500426097,-73.915971731754,-73.916247689596,-73.9158849085212,-73.9157648836179,-73.9157458523034,-73.9159657250027,-73.9159825187881,-73.9158894155016,-73.9162645276666,-73.9163867968379,-73.9163375361718,-73.9163958674589,-73.9159930713155,-73.9158809341074,-73.9158708653637,-73.9160031884948,-73.9164182793016,-73.9164586620609,-73.9165056823666,-73.9164697884776,-73.9164991210399,-73.9166280437116,-73.9157318192713,-73.9167465238931,-73.9166915481744,-73.9166710821547,-73.9165893648605,-73.9166209824894,-73.9166506988006,-73.9167158204887,-73.9166731127403,-73.9166917125713,-73.9167882790561,-73.9167808339109,-73.9168292081245,-73.9180528636206,-73.9181103667901,-73.91810261499,-73.9177434091677,-73.9177365783831,-73.9177318548392,-73.9177293225395,-73.9177290265173,-73.9178663862696,-73.9178171947312,-73.917704223101,-73.9176787075734,-73.9179627008307,-73.9179845529726,-73.9178197277143,-73.9178740030876,-73.9180158470274,-73.9180217710347,-73.9180296445981,-73.9180392919471,-73.9180504977133,-73.9180630117384,-73.918556661206,-73.9180992539838,-73.9180050050113,-73.918187285901,-73.9181230385933,-73.9185735757095,-73.9188797831433,-73.9188885240194,-73.9188985511521,-73.9189095670764,-73.9189212449933,-73.9189314197853,-73.9189416044458,-73.9190073714733,-73.9182489343411,-73.9181475953426,-73.9181381488997,-73.9183624673764,-73.9184103979026,-73.9183079453259,-73.9190231076531,-73.9193539848405,-73.9183782694015,-73.9182721564306,-73.9182526909295,-73.9185030041392,-73.9185167450281,-73.9184015935965,-73.9193710042986,-73.9194228518385,-73.9194749422927,-73.9195035891893,-73.9195045928214,-73.9195220979602,-73.9192413501154,-73.9190515017678,-73.9188771952237,-73.9186847182968,-73.918580792166,-73.9185834211486,-73.9179498050121,-73.9170178790776,-73.91712470644,-73.9156008610433,-73.9154993583362,-73.915416007354,-73.9147685316395,-73.9148935810251,-73.9144281346228,-73.9139960892504,-73.9139696125376,-73.9139518562453,-73.9138943479936,-73.9138600521234,-73.9138488563693,-73.9138010981716,-73.913821187126,-73.9138202016283,-73.9138070900703,-73.9136871851004,-73.9136933221124,-73.9137866275074,-73.9138353183267,-73.9138196676429,-73.9138242894799,-73.913855243921,-73.9138286958813,-73.913836927374,-73.913837596891,-73.9137540873682,-73.9137345589701,-73.913640756674,-73.9133270039903,-73.9134890381997,-73.9134707264901,-73.9132965103048,-73.9136383462035,-73.9136310285275,-73.9136608933892,-73.9136503020276,-73.9135780820087,-73.9134982641367,-73.9133835175516,-73.9133762053867,-73.9133383546094,-73.9133517559874,-73.913271175111,-73.9133869327257,-73.9131989162876,-73.9131843008117,-73.9133539907785,-73.9133564397609,-73.9132638382419,-73.9132492034726,-73.9130172324187,-73.9130001752337,-73.9132980629286,-73.9132822259617,-73.9133188590903,-73.9133237355469,-73.9133627931573,-73.913356706362,-73.9134751154424,-73.913403213537,-73.9133687650809,-73.913314445938,-73.9132985463573,-73.9132448525482,-73.9131759159591,-73.9131165873372,-73.9129000035977,-73.9129060487109,-73.9127386686234,-73.9127069603352,-73.9128531979508,-73.9127239862236,-73.9127489095881,-73.912886934854,-73.9129259657374,-73.9129217554562,-73.9130969130689,-73.9130599440945,-73.9129903429,-73.9129286893925,-73.9128140127467,-73.9127709317324,-73.9126741470971,-73.9125680940864,-73.9124368547521,-73.9122678192515,-73.9121213047698,-73.9119575384141,-73.9117626332563,-73.9115842768934,-73.9115783655671,-73.9118119539088,-73.9121604026645,-73.9123093997728,-73.9123215242301,-73.9125417018243,-73.9125280177496,-73.9125051581593,-73.9125141069241,-73.912306020751,-73.9122551466251,-73.9122521842669,-73.9120242222258,-73.9118294147914,-73.9116518923066,-73.9116485592092,-73.9115770834805,-73.9115741222559,-73.9115596471397,-73.9115441118299,-73.9116227784925,-73.9116256878661,-73.9120862627355,-73.9120879377322,-73.9121987574071,-73.9122096646703,-73.9122320888062,-73.9122569063315,-73.9122757464331,-73.912295598964,-73.9123186078849,-73.912342511006,-73.9123614627513,-73.9123840602915,-73.9124028406286,-73.9124356002454,-73.9124505877854,-73.9125031148365,-73.9126109867653,-73.912572904076,-73.9125588994303,-73.9125912998566,-73.9125188925805,-73.9124888282043,-73.9124752877759,-73.9124900672872,-73.9124793898826,-73.9124593363615,-73.9124079292691,-73.9124011270447,-73.9122953683368,-73.9122929248291,-73.9122584131131,-73.9122524196074,-73.9121284666316,-73.9121179120215,-73.9120873814935,-73.9120601313176,-73.9120334980105,-73.9119984503387,-73.9119731140574,-73.9119408037157,-73.9119203606018,-73.9118845971897,-73.9118697794801,-73.9118263007669,-73.911811189461,-73.9117811674936,-73.9117597752543,-73.9117202557417,-73.9117010325299,-73.9116604199448,-73.9116378201391,-73.9116000771785,-73.9115697693314,-73.911543613613,-73.9115150592302,-73.9114923292104,-73.9114618082355,-73.9114363206478,-73.9114047315496,-73.911364608642,-73.9113377030437,-73.9113057425235,-73.9112807553814,-73.9112492528857,-73.9112237960785,-73.9111897377733,-73.9111750547642,-73.9111346338553,-73.911112836378,-73.9111101227647,-73.9110492415209,-73.9110172449767,-73.910972696629,-73.9109595759846,-73.9109522497183,-73.9109400798246,-73.9109565554934,-73.9109463434671,-73.9108935517123,-73.9108863935303,-73.9108653658578,-73.910876833782,-73.9109875275015,-73.910981655004,-73.9110308200309,-73.9110514931488,-73.9115095375722,-73.911519571944,-73.9115423436918,-73.9115113505712,-73.9110845383308,-73.9110649524614,-73.911052894986,-73.911050831858,-73.9109445390473,-73.9109288688255,-73.9109162676306,-73.9109399963992,-73.9109600866328,-73.9109586354268,-73.9111202277719,-73.9113224366003,-73.911552225948,-73.911555291408,-73.9114856913811,-73.9114897901589,-73.9109155341383,-73.910758308465,-73.9107422983945,-73.91073679023,-73.9107493938426,-73.9107512397226,-73.9107022786896,-73.9106838822212,-73.9106611494385,-73.9106249117812,-73.9105976573655,-73.9105785304057,-73.9105432601986,-73.9105251165239,-73.9105017466704,-73.9104688587273,-73.9104422826864,-73.9104121722566,-73.9103861422628,-73.9103523545553,-73.9103208378816,-73.9102963020476,-73.910270324585,-73.9102424456104,-73.9102148044882,-73.9101893847206,-73.9101512395692,-73.9101326808392,-73.910093260679,-73.9100897931181,-73.910052880528,-73.9100461201669,-73.9099910825552,-73.9099658867758,-73.9099316760779,-73.9099119208131,-73.9098775546913,-73.9098631177172,-73.9098152811976,-73.9097937958812,-73.9097505190227,-73.9097384814668,-73.9097163513892,-73.9096875029287,-73.9096600741146,-73.9096395641649,-73.9096074956579,-73.9095865311005,-73.9095575254529,-73.9095296334502,-73.9094999608391,-73.9094689512308,-73.9094369077679,-73.9094219473662,-73.9093931850543,-73.9093688867897,-73.9093359855484,-73.909307090233,-73.9092895802568,-73.9092614174049,-73.9092328210496,-73.9092051264278,-73.9091840479752,-73.9091507246452,-73.9091330333045,-73.9090940335634,-73.9090734270739,-73.9090442723399,-73.9090532806522,-73.9090368953053,-73.9090184856708,-73.9090320275445,-73.9090393117698,-73.9090499955246,-73.9090687409044,-73.9095731102396,-73.9095971923446,-73.9096261497804,-73.9096407019207,-73.9096595211301,-73.9096880701234,-73.9097241752419,-73.9097312899562,-73.9097581163751,-73.9097846079937,-73.909804386964,-73.9098333188822,-73.9098548705371,-73.9098817307991,-73.9099068027643,-73.9099266067868,-73.9099493943052,-73.9099753350228,-73.909991516507,-73.910022365305,-73.9100441178693,-73.9100671150938,-73.9100951265758,-73.9101110609698,-73.9101328350718,-73.910159964161,-73.9101801924354,-73.9102091698283,-73.9102271167347,-73.9102510064443,-73.9102763390989,-73.9103029227872,-73.9104293486064,-73.910435474305,-73.9107115445703,-73.9107226252371,-73.9107156541623,-73.9107063305395,-73.9106587683433,-73.9106282960659,-73.9106207028889,-73.910589592716,-73.9105813374669,-73.9105500789177,-73.9105408852925,-73.9105103721247,-73.9104999086447,-73.9104711442972,-73.9104599776398,-73.9104274492331,-73.9104165059041,-73.9103860835126,-73.9103748320067,-73.9103380201244,-73.9103266620085,-73.9102957654785,-73.9102857910784,-73.9102505169935,-73.9102429317267,-73.9102105688297,-73.9101967479394,-73.9101699854068,-73.9101537841734,-73.9101289575217,-73.9101041862617,-73.9100813816578,-73.9100559535992,-73.9100402025379,-73.9100192395156,-73.9099962704904,-73.9099726804952,-73.9099510015438,-73.9099325120635,-73.9099042677671,-73.9098877157083,-73.909862033319,-73.9098204767692,-73.9098196478584,-73.9098003270455,-73.9097800893953,-73.9097536075464,-73.9097321626885,-73.9097081269057,-73.9096923707813,-73.9096520653915,-73.9096457348044,-73.9096336189861,-73.9096320682116,-73.9095198917507,-73.9095175536104,-73.9094270433497,-73.9094246939597,-73.9094313826584,-73.9094192457984,-73.909409343046,-73.9102518111957,-73.9102805229684,-73.910614143214,-73.91072006392,-73.9107312301327,-73.9106793461234,-73.9106010511823,-73.9104788592528,-73.9103472587772,-73.9103177976558,-73.9102926926834,-73.9102148318404,-73.9101213357175,-73.9100478549404,-73.9099718498461,-73.9099228895697,-73.9098764754276,-73.9098470289373,-73.9098107226289,-73.9097738577114,-73.9097469694355,-73.9097044035396,-73.9096630633823,-73.9095836939123,-73.909485660626,-73.9094014044668,-73.9093566680788,-73.9092749984076,-73.9092462545629,-73.9092042753668,-73.9091411824771,-73.909093643843,-73.9090408322154,-73.9089879493969,-73.9089666170899,-73.908945247947,-73.90888436065,-73.9087971052295,-73.908709712997,-73.908606386626,-73.9085770909385,-73.9086084653253,-73.9085421872401,-73.908454795471,-73.9084097956865,-73.9083593133267,-73.9082667174598,-73.9081953736763,-73.9081186656986,-73.9081316357311,-73.9080892190454,-73.9080363728425,-73.9079941774226,-73.9079625262747,-73.907898960972,-73.9078273286774,-73.9078694105898,-73.9078427909539,-73.9077476421852,-73.9076444991477,-73.9075916058584,-73.907525779151,-73.9074916020999,-73.9074123090974,-73.9073379766733,-73.9072769481949,-73.9072053502288,-73.9071445884411,-73.9070416527308,-73.9069756280333,-73.9069121435514,-73.9068726580547,-73.9067961340534,-73.9067378181099,-73.9066687813675,-73.9065286095346,-73.9064412969787,-73.9063542142878,-73.9062748514886,-73.9061980264683,-73.9061212939207,-73.9060763858697,-73.9060418500412,-73.9059837744438,-73.9059493324716,-73.9059465048718,-73.905896196087,-73.9058407988728,-73.9057932143496,-73.9057428703926,-73.9056741111668,-73.9056451726156,-73.9056028013029,-73.9055685783886,-73.9054629780363,-73.9052808301754,-73.9052093113666,-73.9051619002834,-73.9049058594987,-73.9046862998883,-73.9044851902119,-73.9043526186992,-73.9042996667813,-73.9042231325221,-73.9041361203438,-73.9040649402469,-73.9040493302895,-73.9039701297796,-73.9038116827317,-73.9037563213804,-73.9037248229739,-73.9037277449889,-73.9037064653663,-73.9036744662182,-73.903639777592,-73.9036024939532,-73.9035418014132,-73.9034732172098,-73.9034389011643,-73.9033198191293,-73.9032610350775,-73.903179976668,-73.9031213774586,-73.9030788798216,-73.903015036866,-73.9029935531539,-73.9029296645026,-73.9028708755391,-73.9027963386276,-73.9027113411626,-73.9025514999138,-73.9024820405439,-73.9024236045887,-73.9023386286848,-73.9022322410404,-73.902200202169,-73.9021364769099,-73.9019286828342,-73.9018170992619,-73.9016522984049,-73.9015514574765,-73.9015038338917,-73.9014026405001,-73.9013123069385,-73.9011636774121,-73.9010574297317,-73.9009667648136,-73.9008390318569,-73.9007116051781,-73.9006002113871,-73.9004195899776,-73.900132176409,-73.8998179892353,-73.8996357586245,-73.8994890199782,-73.899590308821,-73.8996991956042,-73.8998155845945,-73.8999393734697,-73.9000704534091,-73.9002087091887,-73.900354019115,-73.9005062556392,-73.9006652849595,-73.900830967309,-73.9010031570797,-73.9011817029494,-73.9019009310352,-73.9020593611875,-73.9021650100405,-73.9023353294384,-73.9024969040977,-73.9027871225686,-73.9029249435091,-73.9031660464263,-73.9034774716655,-73.9037857188094,-73.9040823703496,-73.9041527175597,-73.9048516225612,-73.9052452586827,-73.9053798489386,-73.9056255159958,-73.9058500735001,-73.9059437172881,-73.9064749109102,-73.9065787287486,-73.9067549321042,-73.9070156793696,-73.9070827447786,-73.9071633957955,-73.9071945075739,-73.9073351223029,-73.9074506822383,-73.9076386832031,-73.9077757111496,-73.9078430302393,-73.9078753644682,-73.9079021860949,-73.9079385640278,-73.9080293542757,-73.9081797470745,-73.9082423204567,-73.9082809116004,-73.9082832983576,-73.9083628130422,-73.9083859411146,-73.9084250129616,-73.9084672977055,-73.908489570756,-73.9084918912251,-73.9083515517494,-73.9082516232515,-73.9082383551573,-73.9082366844553,-73.90817173567,-73.9081233187932,-73.9081195215006,-73.9080916297229,-73.908076704318,-73.9080637342068,-73.9080655223171,-73.9080773021823,-73.9081154504348,-73.9081781316708,-73.9082657228423,-73.9083783478719,-73.9085158709206,-73.908677916435,-73.9088638092002,-73.9090726561231,-73.9093033056542,-73.9095544128517,-73.9098244111122,-73.9101115852793,-73.9104141071618,-73.9107300235754,-73.9110573585828,-73.9113941044518,-73.9118743668229,-73.9119061583975,-73.911918117836,-73.9119727843174,-73.9119671793707,-73.9119566271885,-73.9119370481068,-73.9119149356208,-73.9118963649721,-73.9118893612412,-73.9118873647621,-73.9118824889412,-73.9118750542976,-73.9118731269851,-73.9118631803942,-73.9118532688722,-73.9118469436141,-73.9118433908045,-73.9118366883188,-73.911826736384,-73.9118096895506,-73.9117877938878,-73.9117546110132,-73.9117162363818,-73.9116762094347,-73.9116606646326,-73.9116343454447,-73.9116306983573,-73.9116287232521,-73.9116186647837,-73.9115924344319,-73.9115831567731,-73.9115810492887,-73.911576774498,-73.9115798821267,-73.9115946134969,-73.9116019490054,-73.9116117837217,-73.9116483770056,-73.9116687154504,-73.9116783266059,-73.9117085573094,-73.9117309949561,-73.9117403129149,-73.9117711179017,-73.9118037815628,-73.9118277557483,-73.911845001611,-73.9118720568983,-73.9118821586251,-73.9118919257536,-73.9119018954122,-73.9119113838673,-73.9119108013531,-73.9119044455011,-73.9118840540437,-73.9118665939464,-73.9118618100231,-73.911863700339,-73.9118678588675,-73.9118755656036,-73.9118784336509,-73.9118728889099,-73.9118673769556,-73.9118593105859,-73.9118521617203,-73.9118504942186,-73.9118562138099,-73.9118577978271,-73.911855204609,-73.9118481101666,-73.9118439402619,-73.9118407333417,-73.9118134253642,-73.9117958260046,-73.9117541901642,-73.9117294908857,-73.9117019174995,-73.9116911952923,-73.911688554926,-73.9116921778698,-73.9116929945118,-73.9117045685122,-73.9117180381834,-73.9117234450221,-73.9117213148528,-73.9117191842418,-73.9117114260784,-73.9116991629255,-73.9116929550831,-73.9116974068571,-73.9117009134839,-73.9117027678327,-73.9117091517762,-73.9117190942474,-73.9117290255654,-73.9117318942906,-73.9117325093061,-73.9117241135686,-73.9117192808354,-73.9117031450337,-73.9116976285104,-73.9116930243378,-73.9116749306458,-73.9116763655099,-73.9116801316113,-73.9116871419638,-73.9116973704342,-73.9117095231409,-73.9117191149534,-73.9117213410074,-73.9117158483983,-73.9117123115074,-73.9116955715612,-73.9116871757854,-73.9116887308228,-73.9116960606179,-73.911707564857,-73.9117162070393,-73.9117219311672,-73.9117180397537,-73.9117035176243,-73.9116818984236,-73.9116776712768,-73.91168470756,-73.9116988350351,-73.911699462085,-73.9116936200787,-73.9116793867526,-73.9116612450379,-73.9116450268851,-73.9116198142785,-73.9116116887786,-73.9115997350567,-73.9115913640586,-73.9115803876511,-73.9115725943545,-73.9115701795048,-73.9115781774767,-73.9115839247949,-73.9115941441235,-73.9116008254478,-73.9116010492829,-73.9115944057259,-73.9115798597866,-73.9115803130229,-73.9115848068932,-73.9115916263416,-73.9115918928345,-73.9115792568454,-73.9115714665766,-73.9115703829972,-73.911563334329,-73.9115620078216,-73.9115709344824,-73.9115721997419,-73.9115708509133,-73.9115624215453,-73.9115565749761,-73.911553616626,-73.9115570652834,-73.9115602193327,-73.9115579208534,-73.9115455939725,-73.9115374514127,-73.9115341280052,-73.9115315317106,-73.911528176349,-73.9114995276518,-73.9114857900562,-73.9114902834027,-73.9114994286716,-73.911504217726,-73.9115012754567,-73.9114999805601,-73.9115030436487,-73.911510156695,-73.9115519429467,-73.9115682301968,-73.9115905547574,-73.9116014447899,-73.9116042991909,-73.9116006977331,-73.9115941804483,-73.9115907097724,-73.9115910301358,-73.9115988299734,-73.911646187886,-73.9116543903516,-73.911669007738,-73.9116836452893,-73.9116970064862,-73.9117037400628,-73.9117097959365,-73.911707061367,-73.9117075030943,-73.9117122141014,-73.9117206820519,-73.9117240832171,-73.9117215309299,-73.9117150576562,-73.9116990391291,-73.9116802606626,-73.9116801243658,-73.9116771198131,-73.911679755852,-73.9116843620905,-73.9116884092919,-73.9116899148634,-73.911701055142,-73.9117114862049,-73.9117219511953,-73.911721688759,-73.9117218105556,-73.911728112255,-73.9117351722421,-73.911742989869,-73.9117658107784,-73.9117685787144,-73.9117720834853,-73.9117763187591,-73.9117812678743,-73.9117869157096,-73.9117932438433,-73.911797357151,-73.9118021232351,-73.9118074775577,-73.9118133516169,-73.91181966657,-73.9118263415901,-73.9118342136107,-73.9118422906361,-73.911850485656,-73.9118587081337,-73.9118627571447,-73.911866645357,-73.9118702174455,-73.9118733255875,-73.9118758444038,-73.9118776698572,-73.9118766600262,-73.9118750381183,-73.911872701339,-73.9118696836153,-73.911866254237,-73.9118636680839,-73.9118619399511,-73.9118610802322,-73.9118610947074,-73.9118619825692,-73.9118650877911,-73.911869041339,-73.9118738292068,-73.9118794217832,-73.911885794733,-73.9118920142431,-73.9118974140055,-73.9119019619992,-73.911905626867,-73.9119083884633,-73.9119255970582,-73.9119289270029,-73.9119314555423,-73.9119331787577,-73.9119314584419,-73.911928931693,-73.9119256020683,-73.9119214812539,-73.9119165778638,-73.9119109062239,-73.911905124942,-73.9119001029574,-73.9118958475487,-73.9118923657824,-73.9118896627463,-73.9118877426439,-73.9118866094646,-73.911886200807,-73.9118887680061,-73.911892066311,-73.911896084992,-73.9119008117813,-73.9119062337508,-73.9119123342367,-73.911948841201,-73.9119544556616,-73.9119593358629,-73.9119634486859,-73.9119667599132,-73.9119692454409,-73.9119707313167,-73.9119730246225,-73.9119760931462,-73.9119798958833,-73.9119843781934,-73.9119894825744,-73.9119968178345,-73.9120032877257,-73.9120088461729,-73.9120134550135,-73.9120173558201,-73.9120204856179,-73.9120228275477,-73.9120243636531,-73.9120250865256,-73.912024988321,-73.9120249514191,-73.9120238438381,-73.9120216656332,-73.9120184274094,-73.912011660131,-73.9120055404427,-73.9120001029023,-73.9119953803106,-73.9119914004148,-73.9119881907456,-73.9119857671882,-73.9119841451869,-73.911984550384,-73.91198574769,-73.9119877279342,-73.9119904810667,-73.9119939906663,-73.9119982350321,-73.9120292575224,-73.9120337013521,-73.9120372447207,-73.9120398681337,-73.9120415573735,-73.9120423048166,-73.9120421063535,-73.9120369423419,-73.9120326097495,-73.9120291145445,-73.9120303641273,-73.9120308886156,-73.9120306849936,-73.9120297533259,-73.9120280996085,-73.912023613953,-73.912019813478,-73.9120167133915,-73.9120143284676,-73.9120126728226,-73.9120119329853,-73.9120120262813,-73.9120129516458,-73.9120147064698,-73.9120126440893,-73.9120115134725,-73.9120113161932,-73.9120120507474,-73.9120137171702,-73.9120174160704,-73.9120218705195,-73.9120270669305,-73.9120329939121,-73.912039636994,-73.9120689913081,-73.9120719972905,-73.9120738212379,-73.9120744583701,-73.9120750473432,-73.9120748293107,-73.9120738054029,-73.9120719776278,-73.9120693464533,-73.9120551359563,-73.9120527443818,-73.912049590565,-73.9120456848722,-73.9120410356937,-73.9120356542739,-73.9120305652397,-73.9120243377104,-73.9120169791869,-73.912015216836,-73.9120145717721,-73.9120142372172,-73.9120140482977,-73.9120146479313,-73.9120160361731,-73.9120182045055,-73.9120210442553,-73.9120211654342,-73.9120205405206,-73.9120191775284,-73.9120171040248,-73.9120143561459,-73.9120097729926,-73.912005838305,-73.9120026088655,-73.9120001331146,-73.9119984476273,-73.9119946711583,-73.9119917340344,-73.9119896422329,-73.9119884028342,-73.9119880213808,-73.9119884946226,-73.9119898263442,-73.91199201066,-73.911995037946,-73.9119989034138,-73.9120189414443,-73.9120243967626,-73.9120291418621,-73.912033173245,-73.9120364871921,-73.912039080208,-73.9120423401564,-73.9120463851029,-73.9120512045402,-73.9120567862026,-73.9120631129881,-73.9120701702087,-73.9120779392197,-73.9120887623525,-73.9121002992559,-73.9121124844895,-73.9121252545813,-73.9121303365778,-73.9121348299926,-73.9121386426114,-73.9121416919014,-73.9121439206203,-73.9121452798793,-73.9121762226843,-73.9121851171624,-73.9121932486881,-73.912200607183,-73.9122071759743,-73.9122129495995,-73.912217915564,-73.9122220664276,-73.9122295396065,-73.9122361787787,-73.9122419815482,-73.9122469415631,-73.9122510568668,-73.9122543208877,-73.9122570881906,-73.9122605681485,-73.9122647553016,-73.9122696397955,-73.912275210232,-73.9122814541188,-73.9122883580801,-73.9122959076394,-73.9123040848107,-73.9123128731363,-73.9123268081394,-73.9123399314985,-73.9123522089714,-73.9123636122518,-73.9123727439431,-73.9123811261692,-73.9123887330367,-73.9123955388756,-73.9124015283447,-73.9124073222242,-73.9124119397986,-73.9124153650891,-73.9124166505988,-73.9124172120585,-73.9124170447193,-73.9124161477926,-73.912414536749,-73.9124122347504,-73.9124092746252,-73.9124052432342,-73.9124018848584,-73.9123992347285,-73.9123973203939,-73.9123961628081,-73.9123957728196,-73.9123961527011,-73.9123982137779,-73.9124012113343,-73.9124051173296,-73.9124099008537,-73.9124155145201,-73.9124249649989,-73.912435214132,-73.9124462456873,-73.9124563380904,-73.9124672447436,-73.9124789524932,-73.9124896983524,-73.9124996606475,-73.9125088202971,-73.9125171505298,-73.9125246329206,-73.9125312514717,-73.9125369882005,-73.9125406527255,-73.9125450815883,-73.9125502638344,-73.9125561904835,-73.9125628497021,-73.9125702278972,-73.9125783444475,-73.9125872607522,-73.9125969546517,-73.9126074044242,-73.912618582855,-73.9126822012698,-73.9127038189189,-73.9127247724683,-73.9127450254625,-73.9127645530926,-73.9127798594126,-73.9127945037966,-73.9128084601213,-73.9128217055562,-73.9128265439699,-73.9128321929203,-73.9128386129114,-73.9128457585103,-73.9128609868853,-73.9128757055138,-73.9128898963912,-73.912895387577,-73.9129002134396,-73.912904327668,-73.9129076923162,-73.9129111585425,-73.912915208599,-73.9129197575117,-73.9129247121594,-73.9129299662194,-73.9129381936288,-73.9129458916705,-73.9129529797442,-73.9129593864882,-73.9129650429628,-73.9129878502072,-73.9130099986676,-73.9130314703376,-73.9130354003512,-73.9130387449909,-73.9130414322636,-73.9130433978788,-73.9130445997505,-73.9130450085435,-73.9130446180051,-73.9130438518032,-73.9130439722479,-73.9130461086365,-73.9130489895877,-73.9130526032861,-73.9130569280223,-73.9130619464842,-73.9130676310278,-73.9130739546652,-73.9130808873288,-73.9130883928005,-73.9130973506204,-73.9131058559836,-73.9131138656256,-73.9131213424388,-73.9131282526154,-73.9131372191081,-73.9131451565956,-73.9131520161545,-73.9131558695601,-73.9131607375463,-73.9131665922705,-73.9131704743165,-73.9131750502434,-73.9131802618846,-73.9131860409555,-73.9131923125738,-73.9131955046469,-73.9131980027167,-73.9131997609416,-73.9132007491004,-73.9132009442158,-73.9132003450819,-73.9131987395235,-73.9131982336503,-73.9131988301899,-73.9132029436695,-73.913207762452,-73.9132132698725,-73.913219450367,-73.9132269572388,-73.9132351618312,-73.9132440202371,-73.9132534806396,-73.9132594433088,-73.9132647242254,-73.9132692880556,-73.9132731071662,-73.9132761567814,-73.9132869742407,-73.9132891624083,-73.9132904963674,-73.9132909673992,-73.9132905720593,-73.9132906914466,-73.9132917846997,-73.9132938496629,-73.9132934681482,-73.9132941042277,-73.9132957485553,-73.9132983843204,-73.913301978881,-73.9133073070196,-73.9133132318292,-73.9133197274145,-73.9133267557979,-73.9133342796507,-73.9133422583479,-73.9133506517036,-73.913373779839,-73.9133860835059,-73.9133976309504,-73.9134084092348,-73.9134184062952,-73.9134276107307,-73.9134302311595,-73.9134321028284,-73.9134332104108,-73.9134335460657,-73.9134331081,-73.9134318974597,-73.9134299249803,-73.9134278975783,-73.9134268803897,-73.9134268822816,-73.9134279017939,-73.9134299317493,-73.9134357024326,-73.9134423569444,-73.9134498759857,-73.913458238283,-73.9134627383963,-73.9134679527196,-73.9134738529497,-73.9134804039764,-73.9134875719994,-73.9134953131057,-73.9135160129813,-73.9135359972078,-73.9135552541546,-73.9135591464792,-73.9135637239006,-73.9135689249513,-73.9135746833274,-73.9135809221581,-73.9135875619378,-73.9135948917838,-73.9136015376346,-73.9136074672346,-73.9136126546961,-73.9136170712788,-73.9136206974774,-73.9136275439903,-73.9136351353649,-73.9136434637161,-73.9136481541126,-73.9136521076035,-73.9136552855848,-73.9136576569219,-73.9136592012544,-73.9136599034983,-73.9136597545012,-73.913654622641,-73.9136503502018,-73.9136469631884,-73.9136444799075,-73.913642918456,-73.9136439303304,-73.9136456239688,-73.9136479566182,-73.913650862888,-73.9136542630815,-73.9136580643044,-73.91366216134,-73.9136664456539,-73.91366677329,-73.9137118834433,-73.9137398578549,-73.9137676257639,-73.9137951658583,-73.9138224537498,-73.9138494696654,-73.9138564479819,-73.9138632249196,-73.9138697238006,-73.9138758747671,-73.9138816046716,-73.9138868493848,-73.9138915533576,-73.9138956606042,-73.9138991250328,-73.9139015792636,-73.9139047748558,-73.9139086202827,-73.9139129982791,-73.9139177821121,-73.9139228280989,-73.9139279872609,-73.9139419778777,-73.913955815895,-73.9139694637395,-73.9139828774668,-73.9139960234632,-73.9140159093214,-73.914035140205,-73.9140536888887,-73.9140715334176,-73.914092317479,-73.9141125341551,-73.9141321654416,-73.9141511977288,-73.9141696123517,-73.9141873948224,-73.9141976307064,-73.9142070300541,-73.914215567629,-73.914223221061,-73.9142299703917,-73.9142357980833,-73.91424010991,-73.9142437083947,-73.914246559096,-73.9142486368116,-73.9142499220557,-73.9142504028121,-73.9142500747614,-73.9142455595355,-73.9142403740325,-73.9142345349943,-73.9142280646569,-73.9142272851875,-73.9142272913646,-73.9142280818037,-73.9142296265435,-73.9142318659421,-73.9142347157294,-73.914238063264,-73.9142417793986,-73.9142457208905,-73.9142649680164,-73.9142843360978,-73.9143037956834,-73.9143123007692,-73.9143206603747,-73.9143287797951,-73.9143365737824,-73.9143439522626,-73.9143508416565,-73.9143589072929,-73.9143662694607,-73.9143728792078,-73.9143786948325,-73.9143836790381,-73.9143878000207,-73.9143910303774,-73.9143930041245,-73.9143942090502,-73.9143946164819,-73.9143942168692,-73.9143930178079,-73.9143910512845,-73.9143883633448,-73.9143850149718,-73.9143789213537,-73.9143734227473,-73.9143685818539,-73.9143644503952,-73.9143610763585,-73.9143584971887,-73.9143567422005,-73.9143558290628,-73.9143568038785,-73.914358722136,-73.9143615689791,-73.9143653170206,-73.9143699346934,-73.9143782585451,-73.9143857916604,-73.9143924844364,-73.9143982969349,-73.9144031905459,-73.9144066843662,-73.914409433302,-73.9144114200535,-73.9144126281986,-73.9144130490125,-73.9144097503776,-73.9144071868314,-73.9144054444473,-73.9144045796463,-73.9144046244552,-73.914405574642,-73.9144074002569,-73.9144156495808,-73.9144248245273,-73.9144348458319,-73.914441642985,-73.9144479284816,-73.9144536353436,-73.9144587078049,-73.9144630848354,-73.9144641180745,-73.9144640431279,-73.9144628640346,-73.9144649500133,-73.9144677412069,-73.9144712319451,-73.9144754049073,-73.9144802462852,-73.9144857350229,-73.9144918526943,-73.9144985736251,-73.9145029300601,-73.9145080021394,-73.9145137409179,-73.9145200860183,-73.9145269733206,-73.9145343323228,-73.9145420739161,-73.9145497871489,-73.9145573047849,-73.9145602378311,-73.9145621004273,-73.9145628573353,-73.9145624950751,-73.9145630595414,-73.9145643695911,-73.9145664136387,-73.9145691772368,-73.9145726426407,-73.9145840411137,-73.9145961413169,-73.9146089298668,-73.9146223920615,-73.9146365116574,-73.9146512719741,-73.9146666563287,-73.9146826471603,-73.9146868281469,-73.9146915987078,-73.914696886166,-73.9147026009053,-73.9147086548418,-73.9147149506424,-73.9147213841548,-73.9147278573665,-73.914734265656,-73.9147439307897,-73.914753452997,-73.9147627716323,-73.9147718352837,-73.9147805857282,-73.9147889724421,-73.9147969438054,-73.9148044534753,-73.914808404132,-73.9148131201221,-73.9148185417417,-73.9148245971976,-73.9148312091909,-73.9148382935982,-73.9148457577195,-73.9148498609935,-73.9148539505043,-73.9148578618677,-73.9148614415052,-73.914864546417,-73.9148670538469,-73.9148688623802,-73.9148687643142,-73.914867668024,-73.9148655786262,-73.9148638975294,-73.9148629690843,-73.9148627986275,-73.9148633904068,-73.9148647389892,-73.9148668341136,-73.9148696551829,-73.9148731831401,-73.9148773905711,-73.9148857142996,-73.9148947354345,-73.9149044250006,-73.9149147560003,-73.9149234443169,-73.9149310281033,-73.9149374676563,-73.91494867331,-73.9149588192013,-73.9149678871328,-73.9149916248217,-73.9149981362713,-73.9150055411542,-73.9150138078725,-73.9150229010988,-73.9150304621422,-73.9150374429603,-73.9150438123807,-73.915049550219,-73.915054633434,-73.9150590440427,-73.9150627656017,-73.9150776010398,-73.9150915522541,-73.9151046047694,-73.9151106105252,-73.9151158490517,-73.9151202905107,-73.9151239136417,-73.9151266995989,-73.9151286291024,-73.9151260640626,-73.9151251089277,-73.9151250150574,-73.91512578544,-73.9151273986691,-73.9151298137693,-73.915132974595,-73.9151367988361,-73.9151435643307,-73.915150758119,-73.9151583215506,-73.9151662016874,-73.9151745837049,-73.91518251481,-73.915189920761,-73.915196724909,-73.9152028585199,-73.9152082627623,-73.9152150246411,-73.9152224163841,-73.9152304127473,-73.9152612915435,-73.9152657660481,-73.9152698729037,-73.9152735282044,-73.9152766487228,-73.9152791732208,-73.9152810448596,-73.9152822241716,-73.915285278068,-73.9152893551291,-73.9152944292779,-73.9153005489014,-73.9153071579587,-73.9153141870409,-73.9153215662952,-73.9153329798164,-73.9153447011838,-73.9153566317336,-73.9153623700253,-73.9153678381532,-73.9153729398914,-73.915377592433,-73.9153817142961,-73.9153995841755,-73.9154261279682,-73.9154447156952,-73.9155344739183,-73.915565852499,-73.9156039447752,-73.9156344942327,-73.9156731186942,-73.9157312968609,-73.9157838779378,-73.9158003375755,-73.9158041067247,-73.9158180528162,-73.9158535895655,-73.9158850140668,-73.9159143302012,-73.9159492348887,-73.9160369012686,-73.9160636457982,-73.9161137232452,-73.9161655196713,-73.9162078670344,-73.9162422425337,-73.9162762465608,-73.9162827623351,-73.9162972731159,-73.9163218190347,-73.9163377606311,-73.9163513221006,-73.9163561429635,-73.916371583182,-73.9163828159806,-73.9163993395496,-73.916420427806,-73.9164368010448,-73.9164544411382,-73.9164773000227,-73.9164893596636,-73.9165068142587,-73.9165250671892,-73.9165470343392,-73.916561584875,-73.9165708373062,-73.9165810191711,-73.9166161102276,-73.9166277528089,-73.9166353058762,-73.9166516433371,-73.9166698615986,-73.9166819982058,-73.9166977097354,-73.9167089854257,-73.9167221992638,-73.916737774248,-73.9167494102651,-73.9167621356519,-73.9167726001109,-73.9167849802828,-73.9168344055606,-73.9168626221947,-73.9168766160552,-73.9168770324865,-73.9168723040669,-73.9168646609248,-73.9168591408242,-73.9168586588729,-73.9168635775906,-73.9168713368964,-73.9168861909504,-73.9169038958429,-73.916919049059,-73.9169346735718,-73.9169513859822,-73.9169697627812,-73.9169883181112,-73.9170088109341,-73.9170255893388,-73.9170704074154,-73.9170912851347,-73.9171136757814,-73.9171388701236,-73.917158587198,-73.9171656255817,-73.9171647511229,-73.9171603838178,-73.9171570935442,-73.9171607583583,-73.9171670906804,-73.9171737867899,-73.9171913344825,-73.9172176133197,-73.917231558833,-73.9172466870697,-73.9172634664249,-73.9172772187407,-73.9172869351116,-73.9173005756603,-73.9173129581608,-73.9173187482439,-73.9173203243177,-73.9173239521627,-73.9173338821583,-73.9173483850213,-73.9174321152555,-73.9175046142532,-73.917542768612,-73.9175664452153,-73.9175869503373,-73.9176085345767,-73.9176267079218,-73.9176680631817,-73.9176926435318,-73.9177056653233,-73.9177092903134,-73.9177080138957,-73.9176843588364,-73.9176792535393,-73.9176840640311,-73.9176961462693,-73.9177126212793,-73.9177454576068,-73.9177812363041,-73.917795218532,-73.9178263749154,-73.917836588592,-73.9178452953707,-73.9178727996214,-73.9178929994365,-73.9179048841773,-73.9179195117059,-73.9179264385235,-73.9179339447675,-73.9179458738325,-73.9179595187873,-73.9179747044879,-73.9179904241556,-73.9180077656355,-73.918035006332,-73.918061820368,-73.9180751407819,-73.9180915283441,-73.9181142243024,-73.91812603535,-73.9181318293468,-73.9181338391021,-73.9181330924772,-73.9181327846058,-73.9181335609574,-73.9181417573795,-73.9181485581497,-73.9181889556136,-73.9182081464091,-73.9182225101546,-73.9182400366665,-73.9182488118397,-73.9182644788392,-73.9183054368037,-73.9183287507137,-73.9183770355273,-73.9184075131228,-73.9184378891984,-73.9185091212503,-73.9185293447795,-73.9185447788515,-73.9185560348778,-73.9185733692309,-73.918591903952,-73.9186091837388,-73.918620999288,-73.9186360230482,-73.9186685591237,-73.9186782867599,-73.9186931220332,-73.9187572305969,-73.9187842240964,-73.9188040970477,-73.9188251962707,-73.9188373646786,-73.9188477987169,-73.9188790185029,-73.9188940203799,-73.9189114437647,-73.918937298436,-73.9189616109319,-73.9189805985433,-73.9189823257694,-73.9189936735285,-73.9190048336398,-73.9190518481636,-73.9190694772531,-73.9190747807222,-73.9190859350909,-73.9190980529106,-73.9191008228612,-73.9191079478484,-73.9191635337563,-73.91917533855,-73.919178141683,-73.9191770574994,-73.9191634367696,-73.9191413597034,-73.9191210477844,-73.9191117134947,-73.9191114557779,-73.9191160236534,-73.919133696612,-73.919185907099,-73.9192071479771,-73.9192207157129,-73.9192325789721,-73.9192419297451,-73.9192536298802,-73.9192689379232,-73.9192847193516,-73.91930014678,-73.9193074017462,-73.9193076191793,-73.919310687955,-73.9193188674929,-73.9193378816892,-73.9193518205465,-73.919359210494,-73.9193597929412,-73.9193553319237,-73.9193230998261,-73.9193136305065,-73.9193026500493,-73.9192980448084,-73.9192979805831,-73.9193035689007,-73.9193207124202,-73.9194033608011,-73.9194177594273,-73.9194285176335,-73.9194438593342,-73.919448885459,-73.9194499175549,-73.9194519650373,-73.9194621474115,-73.9194835657343,-73.919511179236,-73.9195427157373,-73.9195731752888,-73.9196246712143,-73.9196742619384,-73.9196935323066,-73.9197120904498,-73.919728693952,-73.9197428061191,-73.9197624930116,-73.9197767033069,-73.9197825118494,-73.9197807746835,-73.9197726666242,-73.9197598449511,-73.9197537542258,-73.91975014484,-73.9197558270936,-73.9197693575246,-73.9197857005322,-73.9198039208379,-73.9198235209856,-73.9198529261122,-73.9198786538682,-73.919897634889,-73.9199220404841,-73.9199319370965,-73.9199377902387,-73.919943134884,-73.9199576304389,-73.9199779640225,-73.920011580492,-73.9200373220692,-73.9200499243745,-73.920060985755,-73.9200722678312,-73.9200975300688,-73.9201070078637,-73.9201226048244,-73.9201439928501,-73.9201601774403,-73.9201657379814,-73.9201730075279,-73.9201743340783,-73.9201743921243,-73.9201744359529,-73.920169930104,-73.9201511851903,-73.9201294010789,-73.9201088353203,-73.9200978633908,-73.9200981003469,-73.9201083123753,-73.9201277705999,-73.9201459765806,-73.9201807018588,-73.9202292153117,-73.9202524656747,-73.9202745033029,-73.9202864689777,-73.9202933607781,-73.9203028162319,-73.9203137389987,-73.9203357866021,-73.920359560006,-73.920379545077,-73.9203972169382,-73.9204201777607,-73.9204353244498,-73.9204427311025,-73.9204474743678,-73.9204557535982,-73.9204692897883,-73.9204843076467,-73.9205107612078,-73.9205300788218,-73.920550624191,-73.9205779825189,-73.9205952986218,-73.9206277940877,-73.9206554305041,-73.9206664372179,-73.9206684076842,-73.9206678527514,-73.9206699329284,-73.9206755416458,-73.9206839228055,-73.9206975665752,-73.9207239586944,-73.9207393708552,-73.920755036288,-73.9207680709548,-73.9207759900617,-73.9208085186536,-73.9208193541584,-73.9208339723948,-73.9208529867688,-73.9208774719375,-73.9208959393703,-73.9209255289305,-73.9209488139979,-73.9209558979177,-73.9209576160505,-73.9209557669246,-73.920955210087,-73.9209622206436,-73.9209777006381,-73.9209971090961,-73.9210220967272,-73.9210407084196,-73.9210588114722,-73.9210749233248,-73.9210942375575,-73.921124570816,-73.9211408413559,-73.9211491240612,-73.921156980094,-73.9211655983086,-73.9211765195159,-73.9211846275468,-73.9212051531972,-73.9212287038724,-73.9212486875537,-73.9212661098175,-73.9212811513907,-73.9212899603696,-73.921294951692,-73.9212995478703,-73.92131055775,-73.9213207840063,-73.921362780076,-73.9213856126353,-73.9213998701299,-73.9214121072998,-73.9214203434899,-73.9214250446191,-73.9214224428488,-73.9214110524726,-73.9213890714321,-73.9213749738209,-73.9213634645329,-73.9213579059916,-73.9213589029557,-73.9213682902453,-73.9214164536572,-73.9214561720882,-73.9214700235795,-73.9214783014091,-73.9214878069561,-73.9215168998195,-73.9215261209632,-73.921533220599,-73.9215369410667,-73.921535980057,-73.9215381169433,-73.9215485441989,-73.9215596523129,-73.9215697796086,-73.9215870691007,-73.9216081000255,-73.9216269382331,-73.9216409196623,-73.921651160242,-73.9216535155739,-73.9216503245389,-73.921650946481,-73.9216634928246,-73.9216825524792,-73.9217031511561,-73.9217192807532,-73.9217273061777,-73.9217393254988,-73.9217546827089,-73.9217647924982,-73.9217794065531,-73.9217946389654,-73.9218075337209,-73.9218207948173,-73.9218468548937,-73.9218870118012,-73.9219079521378,-73.9219165730451,-73.9219230174412,-73.92193443677,-73.9219496736328,-73.9219649789355,-73.9219726935911,-73.9219745563864,-73.9219850644886,-73.9219888770856,-73.9219910649248,-73.9219942193429,-73.9219985311912,-73.9220042570422,-73.9220138365327,-73.9220244662526,-73.9220355950188,-73.9220413178442,-73.9220458123504,-73.922050275685,-73.9220556792905,-73.9220603668551,-73.922069211262,-73.9220813579041,-73.9220918758037,-73.9221009857617,-73.9221422305458,-73.9221554396351,-73.9221712798768,-73.9221845687261,-73.922196675769,-73.9222305515412,-73.9222553818948,-73.9222676324509,-73.922273717557,-73.9222855220692,-73.9222919241169,-73.9223010639712,-73.9223107830385,-73.9223238587559,-73.9223352407356,-73.9223477078365,-73.9223705577354,-73.922415451752,-73.9224370350868,-73.9224456162315,-73.9224508138356,-73.9224489881639,-73.9224405368449,-73.9224239450019,-73.9224050173529,-73.9223960942728,-73.9223915997438,-73.9223910654596,-73.9223946031271,-73.9224022815045,-73.9224123719518,-73.9224416273324,-73.9224560708449,-73.9224745791333,-73.9224939509948,-73.9225188650542,-73.9225372978731,-73.9225493193939,-73.9225533116609,-73.9225553226529,-73.922558484741,-73.9225643159703,-73.9225888275678,-73.9225980450361,-73.9226093186134,-73.9226231151937,-73.9226349294418,-73.9226440024456,-73.9226506281865,-73.9226622277746,-73.9226744437425,-73.9226925401749,-73.9227048796415,-73.9227222792066,-73.9227283733311,-73.9227448416798,-73.9227840784365,-73.9228361473451,-73.9228703850745,-73.9229190473697,-73.9229480304595,-73.9229659136674,-73.9229728791972,-73.9229790890417,-73.9229864363685,-73.9229964135425,-73.9230022646799,-73.9230138419725,-73.9230390404919,-73.9230507546789,-73.923063364585,-73.9230736990785,-73.9230789556485,-73.9230851876819,-73.9230898738835,-73.9230986707884,-73.9231063890775,-73.9231134887278,-73.9231235367041,-73.9231327202103,-73.9231391639737,-73.9231495705806,-73.9231599477341,-73.9231706187,-73.9231741937473,-73.9231778118183,-73.9231770693301,-73.9231729376023,-73.9231734503977,-73.9231799046338,-73.9231898810724,-73.9231994946469,-73.9232125308211,-73.9232231512375,-73.9232285902368,-73.9232335960528,-73.9232412043377,-73.923252537869,-73.9232599135747,-73.9232621264983,-73.9232619931056,-73.9232614266486,-73.9232605341959,-73.923265116977,-73.9232720034337,-73.9232831720635,-73.9233015470242,-73.9233167543084,-73.9233282511922,-73.923349595327,-73.9233708443445,-73.9233727615419,-73.9233708677197,-73.9233675944141,-73.923359964922,-73.9233487287047,-73.9233378516854,-73.9233248849948,-73.9233166766266,-73.9233122874642,-73.9233098462805,-73.9233074889159,-73.9233122948644,-73.9233176713276,-73.9233267171408,-73.9233412374305,-73.9233564413049,-73.9233676480221,-73.9233807359722,-73.9233850740511,-73.9233876030936,-73.9233880569038,-73.9233904036554,-73.923397576587,-73.9234084211173,-73.9234205966139,-73.9234281637174,-73.923436887757,-73.9234479610256,-73.9234501690865,-73.9234506163369,-73.9234451349292,-73.9234454346587,-73.9234481416065,-73.9234564358491,-73.9234676059371,-73.9234853250785,-73.9235100986407,-73.9235278484508,-73.9235377846389,-73.9235452700752,-73.9235523243471,-73.9235587355998,-73.9235705166734,-73.9235803924271,-73.9235909565069,-73.9236154405108,-73.923622726407,-73.9236272756049,-73.9236249516773,-73.9236060461288,-73.9235934032253,-73.9235855354008,-73.92358353125,-73.9235848011176,-73.9235901059585,-73.9236002744768,-73.9236096193694,-73.9236160065525,-73.9236217056903,-73.9236316528669,-73.9236433245289,-73.9236759953347,-73.9236940481654,-73.9237052186913,-73.9237152054747,-73.9237213054259,-73.9237275545443,-73.9237296892496,-73.9237310339481,-73.9237338912794,-73.923738406398,-73.9237478912782,-73.9237557525307,-73.9237689929273,-73.9237810076312,-73.9238018730274,-73.9238268218856,-73.923850676461,-73.9238550125715,-73.9238621520257,-73.9238698639815,-73.9238770383886,-73.9238844996532,-73.9238934428193,-73.9238997184258,-73.9238994883798,-73.923900866367,-73.9239046937621,-73.9239152522287,-73.9239274704871,-73.9239298866244,-73.9239341150687,-73.9239277423937,-73.9239276076872,-73.9239347823481,-73.9239455220354,-73.9239606928678,-73.9239715747329,-73.9239817722244,-73.9239883406072,-73.9239973367065,-73.9240030785461,-73.9240123789017,-73.9240268251661,-73.9240454470132,-73.9240654724664,-73.9240801380967,-73.9240870951441,-73.924094779051,-73.92410988674,-73.9241252356463,-73.9241561770419,-73.9241638512212,-73.9241828097034,-73.924184629823,-73.9242117431256,-73.9242454101214,-73.924275786537,-73.9242907392807,-73.9243071537799,-73.9243129111789,-73.924315205492,-73.924310192793,-73.9243003928949,-73.9242955278526,-73.9242912722804,-73.9242912308895,-73.9242964769783,-73.9243065894023,-73.9243219563431,-73.9243443754088,-73.9243570803949,-73.9243714117234,-73.9243818630807,-73.9243924997064,-73.9244048698762,-73.9244145636565,-73.9244265938045,-73.9244465070079,-73.9244651164011,-73.9244815309581,-73.9245221136551,-73.9245523937624,-73.9245704293272,-73.924578417855,-73.9245824039355,-73.9245830772899,-73.9245857956167,-73.9245906838475,-73.9245987778115,-73.9246175294069,-73.9246343049759,-73.924650761776,-73.9246638050117,-73.9246738166712,-73.9246871725132,-73.9247027238631,-73.92471629808,-73.9247356794492,-73.9247494022102,-73.9247674378049,-73.9247806099445,-73.9247962660778,-73.9248254277085,-73.9248541912217,-73.9248649193498,-73.9248792445505,-73.9248950083654,-73.9249164221912,-73.9249589671474,-73.9250159449891,-73.9250452756295,-73.9250762560669,-73.9251010794198,-73.9251306445381,-73.9251468961936,-73.9251724338563,-73.9251906036021,-73.9252079878427,-73.9252152969284,-73.9252421209985,-73.9252781181391,-73.9253061219659,-73.925324177023,-73.9253808749358,-73.9254249818069,-73.9254766598619,-73.9255535786737,-73.9256219877577,-73.9256877808747,-73.9257320153266,-73.9257996295787,-73.925799717398,-73.9258064299542,-73.9258232050428,-73.9258299194332,-73.9258316432436,-73.925833275969,-73.9258377548341,-73.9258425186784,-73.9258433548601,-73.925850073628,-73.9258610094562,-73.9258646361316,-73.9258649861697,-73.9259184127532,-73.925928368708,-73.9259352151696,-73.9260337234565,-73.9260561936268,-73.926085315848,-73.9261239067441,-73.9261581201277,-73.9261704424701,-73.9261727459083,-73.9261838860385,-73.9262499858011,-73.9262603844983,-73.9262667876193,-73.9262735092793,-73.9262782620453,-73.9262802307233,-73.9262914274844,-73.9263015023,-73.9263361987899,-73.9263411859882,-73.9263518724018,-73.9263711401607,-73.9263899414806,-73.9264324902298,-73.926477282729,-73.9265836694373,-73.9265942895125,-73.9266295815794,-73.9266609279601,-73.9267247363248,-73.9267362962585,-73.9267549643136,-73.926778132084,-73.9268042272686,-73.9268361074794,-73.9268378200977,-73.9268508759536,-73.9268870950355,-73.9268989856578,-73.9269341353762,-73.9270287457061,-73.9270450257636,-73.9271089544355,-73.927130152405,-73.9271304337977,-73.9271581531183,-73.9271786461189,-73.9271839135278,-73.9272029505343,-73.9272113775148,-73.9272219851407,-73.9272802035588,-73.9273438649212,-73.9273451401178,-73.927346314367,-73.9273630537375,-73.9273764833723,-73.9273876687054,-73.9274077913679,-73.9274154778035,-73.9274301584161,-73.9274491792272,-73.9274570124265,-73.92746597086,-73.9274894852241,-73.9275152467655,-73.9275779722909,-73.9275964855019,-73.9276070923786,-73.9276197667859,-73.9277011574422,-73.9278131370969,-73.9278512081296,-73.9279385454346,-73.9279696189242,-73.9279855783604,-73.9279922977792,-73.9280001379863,-73.9280180616489,-73.9280830429901,-73.9281054483289,-73.9281155299936,-73.9281217661889,-73.928124489776,-73.9281312069713,-73.9281379252257,-73.928150290835,-73.9281569565741,-73.9281594595407,-73.9281659085721,-73.9281696644517,-73.9281737414069,-73.9281743771236,-73.9281748541818,-73.9281759700744,-73.9281765357301,-73.9281770869246,-73.9281762785052,-73.928175962724,-73.9281749117808,-73.928172584164,-73.9281725804883,-73.928172578651,-73.9281725773518,-73.9281725768125,-73.9281728601055,-73.9281748137515,-73.9281753450173,-73.9281759314819,-73.928178856782,-73.9281792907455,-73.9281798260256,-73.9281826490905,-73.9281904892852,-73.9282117688976,-73.9282173599516,-73.9282207284062,-73.9282330415723,-73.9282442362585,-73.9282542979957,-73.9282561205668,-73.9282822552591,-73.9282934437778,-73.9283057551074,-73.9283135934933,-73.9283193173991,-73.9283225523737,-73.9283326322997,-73.9283396720062,-73.9283449550823,-73.9283707227965,-73.9283744083327,-73.9283852889159,-73.9283987356808,-73.9285264887883,-73.9286486324237,-73.9286520366774,-73.9286553573977,-73.9286632031199,-73.9286807265752,-73.9286807740662,-73.928681138584,-73.9286835178315,-73.9286979560313,-73.9287279850636,-73.928739439184,-73.9287453182654,-73.9287596173288,-73.9287652224269,-73.9287674702998,-73.9287697049849,-73.9287741871033,-73.9287757542623,-73.9287786698812,-73.9287811637934,-73.9287831508361,-73.9287847874482,-73.9287865119542,-73.9287875388954,-73.9287898712497,-73.9287923597713,-73.928793231457,-73.9287943041659,-73.9287988292683,-73.9288044255409,-73.9288076282771,-73.9288133763082,-73.9288149185336,-73.9288189636975,-73.9288335008079,-73.928834201225,-73.9288469035708,-73.928875405226,-73.9288770711101,-73.9288871324126,-73.9288876450376,-73.9288983152255,-73.9289072660119,-73.9289155236538,-73.9289184567719,-73.9289318906441,-73.9289371192132,-73.9289486874746,-73.9289622730493,-73.9289666072645,-73.928985646803,-73.9289884610669,-73.929005811777,-73.9290259763731,-73.9290566721838,-73.9290752740358,-73.9291122482178,-73.9291241437997,-73.9291301776385,-73.9291817286507,-73.9291910137716,-73.9291974162892,-73.9292052584477,-73.92920595125,-73.9292108601934,-73.929307194748,-73.9294024095158,-73.9294337720649,-73.9294617725747,-73.9295067120279,-73.9295265337167,-73.929531199765,-73.929542179334,-73.9295658509882,-73.9295661690762,-73.9295840432561,-73.9295988094564,-73.9296239850041,-73.9296339519133,-73.9296340876198,-73.9296354575059,-73.9296482180399,-73.9296478101646,-73.929640633547,-73.929629077679,-73.9296255238327,-73.9296254455263,-73.9296254107018,-73.9296158974918,-73.9295988778327,-73.929595046245,-73.9295684460807,-73.9295117207443,-73.9294794281907,-73.9294493170406,-73.9294283580784,-73.9294152024961,-73.9294080822125,-73.9293999160437,-73.9293923722846,-73.9293791374652,-73.9293663010544,-73.9293413298024,-73.9293270955538,-73.9293107381106,-73.929300106235,-73.9292820117361,-73.9292420678279,-73.9291812000314,-73.9290796040099,-73.9290390611207,-73.9290190532019,-73.9290116971971,-73.9290096670351,-73.9290135071657,-73.9290161239676,-73.9290245750173,-73.9290372022201,-73.9290395640046,-73.9290405264794,-73.9290527913101,-73.9290901118504,-73.9291125387482,-73.9291299663146,-73.9291489767142,-73.9291576858894,-73.9291649047424,-73.9291668532353,-73.9291687232559,-73.9291722050192,-73.9291676770342,-73.9291695689506,-73.9291803552892,-73.9291956836582,-73.9292137458925,-73.9292401523519,-73.9292523809935,-73.929274584718,-73.9293010492842,-73.9293572634511,-73.9294087234951,-73.9294215838027,-73.9294410395181,-73.9294646491876,-73.9294913330261,-73.9295033481617,-73.9295328244803,-73.9295718189977,-73.929612280664,-73.9296423920461,-73.9296671768887,-73.9296981556522,-73.929733794945,-73.9297744443398,-73.9298111259236,-73.9298464361067,-73.9298749299692,-73.9298975087134,-73.9299235720071,-73.9299730016948,-73.9300474797363,-73.9300611862039,-73.930077115001,-73.9300807560249,-73.9300851142911,-73.9300874875835,-73.9300988165806,-73.9301098156933,-73.9301252494629,-73.9301425251589,-73.9301676270879,-73.9301932802189,-73.9302140488229,-73.9302344287917,-73.9302573077003,-73.9302694752258,-73.9302846227128,-73.9303173946355,-73.9303448641378,-73.9303762198871,-73.9303904833392,-73.930397117697,-73.930443669557,-73.9304892010015,-73.9305266957181,-73.9305652321444,-73.9306194981435,-73.9306683636012,-73.9307139099747,-73.9307470641536,-73.9307889604073,-73.9308257433845,-73.9308540629538,-73.9308759037908,-73.9309028863698,-73.9309198538557,-73.9309286146428,-73.9309438942451,-73.9309556198494,-73.9309812857934,-73.9309865025847,-73.9310033614312,-73.9310482605661,-73.9310634389551,-73.9310748887684,-73.9310821724324,-73.9310990660284,-73.9311228428378,-73.9311747616174,-73.9312084979802,-73.9312312846584,-73.9312344359678,-73.9312481133079,-73.9312749672491,-73.9313049731433,-73.9313564906459,-73.931425464815,-73.9314484634489,-73.9314815991782,-73.9315140450782,-73.9315440662299,-73.9315625716463,-73.9316074195267,-73.9316605996823,-73.9316944967631,-73.931727844346,-73.9317721416584,-73.9318209303192,-73.9318682322139,-73.931914632212,-73.9319366926158,-73.9319622706444,-73.9319720559381,-73.9319888839124,-73.932006064538,-73.9320369543099,-73.9320736302606,-73.9320931984942,-73.9321193707685,-73.9321231964614,-73.9321160883975,-73.9320982415332,-73.9320580727728,-73.9320064410066,-73.9319882344828,-73.9319733787607,-73.9319202948156,-73.9318788860884,-73.9318343113282,-73.9317889606715,-73.9317620034205,-73.9317550722581,-73.9317438456504,-73.9317211035116,-73.9317055953244,-73.9316837551458,-73.93163945295,-73.9315742784797,-73.931525907259,-73.9315039089118,-73.9314882388509,-73.9314456147065,-73.9313961451998,-73.9313723564488,-73.9313416856059,-73.931284558118,-73.9312430842816,-73.931199345991,-73.9311440592346,-73.9310891952845,-73.9310253982194,-73.9309657578804,-73.930910359915,-73.9308773357322,-73.9308535603594,-73.9308248167906,-73.9307820826574,-73.930730188218,-73.9306824586595,-73.9306822289304,-73.9306632082979,-73.9306520148848,-73.9306408232284,-73.9306399697666,-73.9306329811905,-73.9306304646084,-73.9306217813475,-73.9305792170503,-73.9305710519938,-73.9305624190717,-73.9305258229981,-73.9305086665455,-73.9304089920537,-73.9303384554811,-73.9303188583355,-73.9303240448997,-73.9303275332228,-73.9303363809153,-73.9303253811347,-73.9303068098691,-73.9302845232926,-73.930266516354,-73.9302536909923,-73.9302394503119,-73.9302205559278,-73.9301855361497,-73.9301580737881,-73.9301521926659,-73.9301446238434,-73.930136833877,-73.9301334178266,-73.9300717836611,-73.9300269612015,-73.9300155556746,-73.9298275109263,-73.9297674575298,-73.9297311454627,-73.9297031333958,-73.9296984989899,-73.9296796053814,-73.9296747525164,-73.9296695236837,-73.9296662100759,-73.9296594416093,-73.9296536647658,-73.929649361734,-73.9296404041743,-73.9296353003255,-73.9296247318835,-73.9296007208903,-73.9295866717665,-73.929566367047,-73.9295396584038,-73.9295329763197,-73.9294981881416,-73.9294430032464,-73.9293789210338,-73.9293596248876,-73.9293426803924,-73.9293301796775,-73.9293202799767,-73.9293359594061,-73.9293528014468,-73.9293943070747,-73.9294104244444,-73.9293783012561,-73.9293265092698,-73.9292749428095,-73.9292795590311,-73.9292936105745,-73.9293030085235,-73.9293115171905,-73.9293280227474,-73.929347305292,-73.9293595304215,-73.9293665378207,-73.9293622431999,-73.9293556846754,-73.9293307327231,-73.9292974468056,-73.9292559900515,-73.9292269825969,-73.9291924216628,-73.9291482359441,-73.9291053783617,-73.9290727066086,-73.9290435384601,-73.9290140186248,-73.9289876276833,-73.9289483989088,-73.9289164885186,-73.9288875332281,-73.9288689272137,-73.9288077845978,-73.9287494348255,-73.9286978030232,-73.9286525041383,-73.928627065862,-73.9286258273594,-73.9286316082062,-73.9286399562815,-73.9286416693993,-73.9286421225889,-73.9286515562876,-73.9286468612285,-73.9286411661359,-73.9286222581435,-73.9286109489663,-73.9286101826063,-73.9286223818028,-73.9286246464683,-73.9286245383917,-73.9286226194688,-73.9286030334134,-73.9285923060008,-73.9285787056342,-73.9285751879846,-73.9285686290398,-73.9285546210609,-73.9285090763263,-73.9284747682274,-73.9284348201947,-73.9284011384031,-73.9283885861441,-73.9283829548567,-73.9283832968834,-73.9283885778021,-73.9284066378799,-73.9284193577784,-73.9284305692001,-73.9284354807066,-73.9284332935406,-73.9284249552667,-73.9284064979439,-73.9283768102623,-73.9283317742871,-73.9283067134786,-73.9282777579205,-73.9282530057144,-73.9282318856454,-73.9281960446756,-73.9281687092027,-73.9281469977689,-73.9281193902246,-73.9280846158366,-73.9279977375047,-73.9279233851209,-73.9278671471758,-73.927847991663,-73.9278294647705,-73.9278247310099,-73.9278263353958,-73.9278283358679,-73.9278263345314,-73.9278173437466,-73.927802190762,-73.9277785060595,-73.9277624634073,-73.9277517890025,-73.9277274696527,-73.927712923607,-73.92769451953,-73.9276783440392,-73.9276600797816,-73.9276285310535,-73.9276004141354,-73.9275795396468,-73.927563990587,-73.9275566215088,-73.9275463270441,-73.9275341173215,-73.9275020849733,-73.9274690121999,-73.9274210074887,-73.9273614901442,-73.9273187049339,-73.9272876241028,-73.9272665837988,-73.9272664870943,-73.927264839787,-73.9272575667989,-73.9272450665125,-73.9272264149505,-73.9272113065423,-73.9272024040045,-73.9271908221473,-73.9271904335363,-73.9271926122707,-73.9271928227897,-73.9272091477677,-73.9272277740414,-73.9272361019767,-73.9272346318112,-73.9272276861663,-73.9272054023586,-73.9271722759156,-73.9271603231904,-73.9271559426837,-73.9271041392105,-73.927089010138,-73.9270530495445,-73.9270197835651,-73.9270020227237,-73.9269853109275,-73.9269622259071,-73.9269511099266,-73.9269398183663,-73.9269259966075,-73.9269031770076,-73.9268942568122,-73.9268747134275,-73.9268471064393,-73.9268270278512,-73.9268059068983,-73.9267652631131,-73.9267401777042,-73.9267233414799,-73.9266936993977,-73.9266592515151,-73.9266389162073,-73.9265996121576,-73.9265350348013,-73.926531180701,-73.9264951855823,-73.9264840697184,-73.9264754552105,-73.926467243388,-73.9264612055624,-73.9264511044743,-73.9264373273268,-73.9264147371351,-73.9263861690164,-73.9263695630675,-73.9263646394414,-73.9263547814406,-73.9263504451637,-73.9263492030368,-73.9263489112908,-73.9263444614851,-73.9263341018861,-73.9263156460135,-73.9262944827676,-73.9262836847324,-73.926268919351,-73.9262512732329,-73.9262361916386,-73.9262268739333,-73.9262221671554,-73.9262194444938,-73.9261993303113,-73.926163525531,-73.9261230146764,-73.9260984390226,-73.9260490256657,-73.926024884904,-73.9260243323216,-73.9260142531347,-73.925950578664,-73.9259425890535,-73.9259381105083,-73.9259347533845,-73.9259337534649,-73.9259315624204,-73.9259269184445,-73.9259067903029,-73.9259011958783,-73.9258956851601,-73.9258956002196,-73.92589261456,-73.9258597776118,-73.9258375331714,-73.9258205890195,-73.9258059835587,-73.9258015522391,-73.925755633124,-73.9257525155868,-73.9257365980446,-73.9256582274613,-73.9256266906352,-73.9256011263941,-73.9255641743504,-73.9255523371866,-73.925527216692,-73.9254812962653,-73.9254129715834,-73.9253625593859,-73.9253166507248,-73.925285284765,-73.9252799289894,-73.9252796957769,-73.9252561833472,-73.9252336354785,-73.925149804394,-73.9251107031777,-73.9250971787667,-73.9250479145893,-73.9250064920105,-73.924946047099,-73.9249225426097,-73.9249108197113,-73.9249012781813,-73.9248609924901,-73.9248383707141,-73.9248363788443,-73.9248326100901,-73.9248229553083,-73.9247938771283,-73.9247846543268,-73.9247793349494,-73.9247791855023,-73.924765908562,-73.9247622735301,-73.9247513614209,-73.9247400993721,-73.9247356885242,-73.9247319376334,-73.924720014367,-73.9247091511671,-73.9246897815425,-73.9246069161496,-73.9245206957027,-73.9244760783539,-73.9244613543604,-73.9244487071713,-73.9244143334285,-73.9243046244528,-73.9241859465509,-73.9241590794246,-73.9241366906365,-73.924102195222,-73.9240952758587,-73.9240855960226,-73.9240292428982,-73.9239464192516,-73.9239463825887,-73.9239285113853,-73.9239061155879,-73.9238803590294,-73.9238366820514,-73.9238232411105,-73.9238064403766,-73.9237336273621,-73.9237179459884,-73.9237045073616,-73.9236966677926,-73.9236753930123,-73.9236485223988,-73.9236381528057,-73.9236227734172,-73.923612614377,-73.9236003920107,-73.9235690554465,-73.9235355013047,-73.9235243230843,-73.9235119672284,-73.9235019776282,-73.923494150086,-73.92348519927,-73.9234807233843,-73.9234789235145,-73.9234751257418,-73.9234616898173,-73.9234615903086,-73.9234448889639,-73.9234105078047,-73.9234000899736,-73.9233877705673,-73.9233776938006,-73.9233674939144,-73.9233530647217,-73.9232959736463,-73.9232635066696,-73.923132498697,-73.9230747822124,-73.9230014994927,-73.9229779233367,-73.9229387975448,-73.9229236420458,-73.9229018553398,-73.9228873041768,-73.9228727553203,-73.9228291173511,-73.9227832490183,-73.9227664663851,-73.9227627141749,-73.9227507936472,-73.922731762706,-73.9227104871775,-73.9226853149529,-73.9226578543788,-73.922644233772,-73.922630981684,-73.922607472161,-73.922596793709,-73.9225862065855,-73.922579736243,-73.9225660626609,-73.922552135944,-73.9225492809139,-73.922541393841,-73.9225336247772,-73.9225202119299,-73.9225101611388,-73.9224889511689,-73.9224877586735,-73.9224766627582,-73.9224715207827,-73.9224621286613,-73.9224540860442,-73.9224464709582,-73.9223535997281,-73.9223529489382,-73.922338980265,-73.9223323153005,-73.9223247737697,-73.922316371013,-73.9223071320518,-73.9222970794827,-73.922286242719,-73.9222691205749,-73.9222529150898,-73.9222376534766,-73.9222329404742,-73.9222289645187,-73.9222257615906,-73.9222233575599,-73.922221776095,-73.9222218941756,-73.9222208713644,-73.9222187163707,-73.9222163910791,-73.922213328826,-73.9222095682198,-73.9222051577627,-73.9222001549721,-73.9221946279212,-73.9221886466713,-73.9221807631201,-73.9221732644181,-73.9221662276701,-73.9221597211829,-73.9221538077599,-73.9221485480034,-73.9221439943835,-73.9221273421912,-73.9221100846135,-73.9220922326256,-73.9220737976458,-73.9220562383136,-73.9220393361775,-73.922023108142,-73.9220075689087,-73.9219927393395,-73.9219786334779,-73.9219609545827,-73.9219404991777,-73.9219366182268,-73.9219166445631,-73.9219095228159,-73.9219043265567,-73.9218998405271,-73.9218974841541,-73.9218947484252,-73.9218937186505,-73.9218930438554,-73.9218924850795,-73.9218919932834,-73.9218910483446,-73.9218893690646,-73.9218873708996,-73.9218848257098,-73.9218819570818,-73.9218786379991,-73.9218743994567,-73.9218721118332,-73.9218692099591,-73.9218667250628,-73.9218615686679,-73.9218561488656,-73.921850687989,-73.9218452954848,-73.9218400772675,-73.9218351352872,-73.9218305679585,-73.9218256449113,-73.9218213958785,-73.9218178592622,-73.9218150732393,-73.9218130638916,-73.9217936671077,-73.9217903454467,-73.9217861500219,-73.9217811352477,-73.9217753632435,-73.9217692570346,-73.9217628412221,-73.9217561900634,-73.9217493826576,-73.9217424961338,-73.921735611145,-73.9217288046172,-73.9217221602952,-73.9217157500624,-73.9217096495493,-73.9217048810362,-73.9216997150594,-73.9216942303393,-73.9216885110771,-73.921682643228,-73.9216767182312,-73.921670824436,-73.9216630451577,-73.9216555100143,-73.9216482785464,-73.9216414157773,-73.9216349761799,-73.9216306114482,-73.9216274123538,-73.9216254262432,-73.9216199760735,-73.9216140012445,-73.921607558418,-73.9216007095301,-73.9215935202611,-73.9215860558565,-73.9215783868423,-73.9215569204252,-73.9215350485983,-73.9215127928867,-73.921490171742,-73.9214672097684,-73.9214439262955,-73.9214203443917,-73.9213964855873,-73.9213723747068,-73.9213480313033,-73.9213089101163,-73.9212695527818,-73.9212299773133,-73.921190204368,-73.9211502519597,-73.9211101396465,-73.9210698889591,-73.9210582137595,-73.9210464622746,-73.9210346854905,-73.9210229304371,-73.9210112489831,-73.9209996883861,-73.9209882965643,-73.9209771242956,-73.9209622611823,-73.920947158159,-73.9209318635913,-73.9209164245165,-73.9209008903923,-73.9208853115497,-73.9208697356827,-73.9208587240538,-73.9208477744974,-73.920836951843,-73.9208263156394,-73.9208159307031,-73.9208058576716,-73.9207961554237,-73.9207697999679,-73.9207581053398,-73.9207439889855,-73.9207187497152,-73.920687629181,-73.9206561072349,-73.9206242043055,-73.920591948294,-73.9205593605076,-73.9205264657742,-73.9205084636299,-73.9204903017001,-73.9204720087709,-73.920453615606,-73.9204351558251,-73.9204166555795,-73.9204074786515,-73.9203983436945,-73.9203893065269,-73.9203804234033,-73.9203717496948,-73.9203633394465,-73.9203521672796,-73.9203414206208,-73.9203311528486,-73.920321410524,-73.9203122430581,-73.92030509875,-73.920298555523,-73.9202926456423,-73.9202873965402,-73.920282835423,-73.9202789870804,-73.9202708408963,-73.920261821832,-73.9202519538033,-73.9202412600656,-73.920229767177,-73.9202183217011,-73.92020621098,-73.9201934569657,-73.920180081392,-73.9201661064345,-73.9201532223689,-73.9201399033581,-73.9201261898211,-73.9201121254745,-73.9200977571106,-73.9200874794901,-73.9200776279219,-73.920068238421,-73.92005935008,-73.9200509956168,-73.9200432057688,-73.9200360125883,-73.920029440435,-73.9200196331542,-73.9200092564773,-73.919998332139,-73.9199868814335,-73.9199749271994,-73.9199624905123,-73.9199496003646,-73.9199362776158,-73.9199225495012,-73.9199084463323,-73.9199011376501,-73.9198934161228,-73.9198861309705,-73.9198859279584,-73.9198709865229,-73.9198643447806,-73.9198116646367,-73.9198027120859,-73.919780331563,-73.9197803006148,-73.9197765155536,-73.9197724991251,-73.9197720703081,-73.9197637997451,-73.9197635421885,-73.9197614775329,-73.9197456264111,-73.9197041913585,-73.9196965324449,-73.9196873955538,-73.9195821473435,-73.9194936964816,-73.9194223213225,-73.9193862147967,-73.9193852497961,-73.919383976885,-73.9193817387566,-73.9193795001868,-73.9193776757533,-73.9193772620572,-73.9193739106027,-73.9193713879657,-73.9193672160331,-73.9193655786836,-73.9193649784972,-73.9193627422801,-73.9193614801241,-73.9193605034933,-73.9193603811943,-73.9193571449742,-73.9193123626818,-73.9192664587219,-73.9191679284425,-73.9191488916004,-73.9191341874147,-73.9190996178148,-73.9190910764339,-73.9190861794542,-73.9190810187483,-73.9190761054957,-73.9190568374373,-73.9190414027981,-73.9190067047772,-73.9189697673662,-73.9189305956604,-73.918883590141,-73.9188688709467,-73.9188556168757,-73.9188349380062,-73.918823173522,-73.9188116327407,-73.9187907378601,-73.9187845918219,-73.9187773181366,-73.9187512762786,-73.9187471353389,-73.9187325954252,-73.9187158128977,-73.9187111966399,-73.9186956673198,-73.9186743997328,-73.9186564874949,-73.9186493877576,-73.9186374540033,-73.9185926631209,-73.9185644849586,-73.9185400270366,-73.9184694690409,-73.9184541925096,-73.9184369876613,-73.9183882544599,-73.9183596986307,-73.9183360189858,-73.9183227384675,-73.9183104343813,-73.9182880213862,-73.9182589069218,-73.9182586484207,-73.9182580273313,-73.9182320319041,-73.9182126102968,-73.9182085188573,-73.9182004710366,-73.918181651294,-73.918177323231,-73.9181559042375,-73.9181312775744,-73.9181088936557,-73.9180974514365,-73.9180898680704,-73.9180451179027,-73.918044766913,-73.9180372829567,-73.918027207486,-73.9180005698735,-73.9179768208267,-73.9179656258739,-73.9179566703521,-73.9179489236582,-73.9179387657123,-73.9179208625227,-73.9179008837881,-73.9178850618686,-73.9178608909031,-73.9178548663177,-73.9177832999984,-73.917774077934,-73.917760928632,-73.9177487889554,-73.9177396760839,-73.9176714308013,-73.9176224127655,-73.9176222014365,-73.9176219900966,-73.9175763259172,-73.9175315621306,-73.9175227031169,-73.9175226080541,-73.9175114132504,-73.9174712855078,-73.9174688633542,-73.9174531941932,-73.9174397623795,-73.9174372040017,-73.9174341690128,-73.9174308157136,-73.9173905970464,-73.9173783961284,-73.9173704925592,-73.9173675405874,-73.9173593183346,-73.917356780998,-73.9173548470265,-73.9173481343415,-73.9173470150398,-73.9173461541652,-73.9173114977476,-73.9172918457409,-73.9172839319138,-73.9172765617685,-73.917273223484,-73.9172719003007,-73.9172673579677,-73.9172669885805,-73.9172639059613,-73.9172538704642,-73.9172310489464,-73.9171647142826,-73.9171052899358,-73.9170754069334,-73.9170703073424,-73.917044907494,-73.9170348755062,-73.917009721268,-73.9169933166932,-73.9169696638963,-73.9169480971895,-73.916930148324,-73.9169153646123,-73.9169084937795,-73.9169074944438,-73.9169106727824,-73.9169155773828,-73.9169343155826,-73.9169557207127,-73.9169750017461,-73.9169782490745,-73.916978831774,-73.9169692952175,-73.9169400240332,-73.9168980458869,-73.9168917182131,-73.916886098294,-73.9168714828245,-73.9168546614208,-73.9168383789929,-73.9168347573897,-73.9168285112746,-73.9168206411843,-73.9167989892455,-73.9167773338284,-73.9167625486671,-73.9167525181446,-73.9167419804853,-73.9167281993474,-73.9167138336214,-73.9167011670887,-73.9166957982761,-73.9166751864801,-73.9166366687624,-73.9166180530485,-73.9166045281198,-73.9165856229251,-73.9165826228718,-73.9165829623147,-73.9165895000649,-73.9165870007573,-73.9165770502994,-73.9165617692258,-73.9165518175944,-73.9165584358835,-73.9165655623066,-73.9165646477851,-73.9165594004014,-73.9165514873813,-73.9165334983325,-73.9165158853885,-73.9165078454085,-73.9164944761625,-73.9164768220882,-73.9164624564369,-73.9164470906232,-73.9164381384997,-73.9164292230806,-73.9164149824388,-73.9163975352469,-73.9163725966856,-73.9163449852703,-73.9163376535899,-73.9163178368848,-73.9162976373871,-73.9162758591824,-73.9162623868509,-73.9162573327127,-73.9162568192414,-73.9162561203212,-73.9162446648197,-73.916223952966,-73.9162125143615,-73.9162068276224,-73.9161909146701,-73.9161705137734,-73.9161501177061,-73.9161326246639,-73.9161122698496,-73.9160992641165,-73.9160925937234,-73.916079251405,-73.9160560203672,-73.9160273196701,-73.9159938111045,-73.915955192073,-73.9159357336787,-73.9159143732944,-73.9159016386141,-73.9159010369593,-73.9158915408334,-73.9158797753793,-73.9158450473121,-73.9158182552553,-73.9157844096923,-73.9157639779409,-73.9157298462754,-73.915712976652,-73.9156992443461,-73.9156861867102,-73.9156843058204,-73.9156865663903,-73.9156814860268,-73.9156700108887,-73.9156604731009,-73.9156589448791,-73.9156529159507,-73.9156360400999,-73.9155914032639,-73.9155489874625,-73.9155301632933,-73.9155228186343,-73.9155071807511,-73.9155019977137,-73.9154995414485,-73.9155027747764,-73.9154999543631,-73.9154891169085,-73.9154804973864,-73.9154680576691,-73.915451503773,-73.9154416494084,-73.9154340349635,-73.9154216005324,-73.9154094561203,-73.9153925436142,-73.9153804359287,-73.9153642175995,-73.9153473625054,-73.9153301591207,-73.9153173981806,-73.9152982266323,-73.915274283922,-73.9152510118643,-73.9152016425748,-73.9151783846262,-73.915156704081,-73.9151426568539,-73.9151324262792,-73.9151234580179,-73.9151164366011,-73.9150995432826,-73.9150734361884,-73.9150441987662,-73.9150299128763,-73.9150197294281,-73.9149945643239,-73.914975785844,-73.9149694417349,-73.9149640765658,-73.9149606089247,-73.9149545713095,-73.9149357714904,-73.9149147390235,-73.9149007396339,-73.9148877145628,-73.9148845635572,-73.914889377858,-73.9149018595598,-73.9149191187714,-73.9149335231025,-73.9149344393973,-73.9149390016945,-73.914938758641,-73.9149314970687,-73.9149076699125,-73.9148583790172,-73.9148173332905,-73.9147603603691,-73.9147024134157,-73.9146871227449,-73.9146635034615,-73.9146452951137,-73.9146104599485,-73.9145871398625,-73.9145641588807,-73.9145475832347,-73.914540591211,-73.914544477951,-73.9145611473274,-73.9145701149138,-73.9145797437459,-73.914583310765,-73.9145833321558,-73.9145722711073,-73.914543219669,-73.9145348243551,-73.9145378157158,-73.9145497523562,-73.9145651300669,-73.9145795283737,-73.91458498118,-73.9145856549886,-73.914579296442,-73.9145675660408,-73.914567053451,-73.9145729216681,-73.9145793893745,-73.9145823650487,-73.914581209742,-73.9145701333217,-73.9145711649863,-73.9145814379993,-73.9145891302396,-73.9145990233473,-73.9146121013319,-73.9146200828431,-73.9146252146031,-73.9146233530672,-73.9146176734119,-73.9146145540176,-73.9146168759422,-73.9146223692955,-73.9146192139587,-73.9146131491245,-73.9146041869133,-73.9145907164659,-73.9145810654453,-73.9145698381931,-73.9145490547377,-73.9145314841766,-73.9145082017844,-73.9144904024148,-73.9144801456891,-73.9144719108965,-73.9144550715459,-73.9144340482951,-73.9144031216041,-73.9143769416627,-73.9143584115918,-73.9143357145897,-73.9142956654171,-73.914278010984,-73.9142705624779,-73.9142638193823,-73.9142596575191,-73.914247213663,-73.9142367167323,-73.9142275445243,-73.9142206451325,-73.9142168778305,-73.9142118553576,-73.9142058636273,-73.9142056620668,-73.9142155010722,-73.9142288267402,-73.9142507619856,-73.9142629944839,-73.9142780872765,-73.9143034228063,-73.9143124426024,-73.9143147385561,-73.9143186045313,-73.9143442767172,-73.9144035614102,-73.9144426308692,-73.9144822973295,-73.9145155986984,-73.9145303493829,-73.9145469979544,-73.9145789818957,-73.9147149238431,-73.914816323713,-73.9149395049035,-73.9150310055409,-73.9151973648858,-73.9153147915344,-73.9154833724582,-73.9156004459609,-73.915742142964,-73.9158966219578,-73.9160501777818,-73.9161180019858,-73.9162945948816,-73.9163479150407,-73.9163574633773,-73.9163670097331,-73.9163856104158,-73.9163967884827,-73.9164143062015,-73.9164223121702,-73.916439202457,-73.9164509182284,-73.9164547143443,-73.9164558425448,-73.9164696033255,-73.9164774856516,-73.9164837832827,-73.9164911196418,-73.9165016269866,-73.9165263995563,-73.9165470007693,-73.9165670615828,-73.9165930400693,-73.9166639761764,-73.9167110595789,-73.9167438391974,-73.9167898763149,-73.9168306184822,-73.9168829969205,-73.9169379656611,-73.9169897717314,-73.9170131490069,-73.9170803751035,-73.9171379335935,-73.917254821697,-73.9173665965453,-73.9174729201113,-73.9175734708578,-73.9176679447099,-73.9177560559743,-73.9178375382034,-73.9179121450007,-73.9179796507661,-73.9180398513776,-73.9180925648084,-73.9181908779807,-73.919725107872,-73.9209599200278,-73.922307925163,-73.9233217785486,-73.9236367728711,-73.9240555304218,-73.9244041329122,-73.9254714779807,-73.9265330499539,-73.9275993669829,-73.9286685095516,-73.9295685824336,-73.9291243705818,-73.9287901015488,-73.9281313960502,-73.9299222492492,-73.9317339012848,-73.9335511715361,-73.9342626672588,-73.9360940729623,-73.9379155784185,-73.9384349357584,-73.938098082759,-73.9378905081103,-73.938347083712,-73.9384898668512,-73.9390496277481,-73.9390124693896,-73.9408289785009,-73.9426513822668,-73.9438316165953,-73.9440556093215,-73.9441745062859,-73.9443088819456,-73.9444361462781,-73.9445736645838,-73.9447954727965,-73.9448277099629,-73.9448601234275,-73.9450664280808,-73.9455166357478,-73.9459684975583,-73.9464226599836,-73.946874399467,-73.9473267222654,-73.9463262223442,-73.9454005321308,-73.9444678405052,-73.9441553525583,-73.9445399503591,-73.9448081607081,-73.9454487808206,-73.9455109552195,-73.9445364292418,-73.9435730877707,-73.942623913925,-73.9416715693295,-73.9410288926998,-73.9407095754807,-73.9405807579267,-73.9404774223896,-73.9400170267874,-73.9397372201333,-73.9396696980432,-73.9395451882993,-73.9390277231562,-73.9388318881106,-73.9385171651273,-73.9380145373732,-73.9375927357049,-73.9370366905544,-73.9364119713421,-73.9361041162562,-73.9352099304649,-73.9343051029594,-73.9333791512903,-73.932235548344,-73.9315481248931,-73.9310277683218,-73.9295845672209,-73.9287811084919,-73.9276401540758,-73.9267551566779,-73.9260813465546,-73.9255918603648,-73.9251134440834,-73.9246469500312,-73.9241931459387,-73.9238584223179,-73.9237527784941,-73.9233265458737,-73.9215494808753,-73.9202580235395,-73.9197373704819,-73.9185942316251,-73.9177670150513,-73.9159308624383,-73.9152525951674,-73.9145894931745,-73.9137267068675,-73.9129369754959,-73.9127882761001,-73.9122336906649,-73.9114921263236,-73.91136110205,-73.9108196941893,-73.9100695676753,-73.9092216277097,-73.9091489002397,-73.9084908428466,-73.9075520957351,-73.9062337671228,-73.9015385661799,-73.9012847816899,-73.9010454603378,-73.9008222483241,-73.9006166251606,-73.900429882757,-73.9002631093379,-73.9001171585725,-73.8999926378766,-73.8999442811324,-73.8999175377391,-73.8998898683659,-73.8998535044498,-73.8998250823794,-73.8997770418753,-73.8996954800287,-73.8996320551593,-73.8995872163133,-73.8995612019019,-73.8995540452846,-73.8995655897609,-73.8993165289739,-73.8992176089417,-73.8988357145382,-73.8988183473785,-73.8988069843351,-73.8988860174521,-73.8990418038891,-73.8990244634611,-73.8990033229351,-73.898872111499,-73.8985970379314,-73.8981364616514,-73.8980025574774,-73.8978033326603],"lat":[40.6536248534122,40.6534538161212,40.6535383207189,40.6538095558218,40.6538549566563,40.6541728884023,40.6543244722693,40.6543775766565,40.6544879295266,40.6548329486657,40.6552027140843,40.6537109390806,40.652364719447,40.6511781774775,40.6511486971311,40.6511053045391,40.6507050708338,40.6503134324823,40.6499307837856,40.6495575484092,40.6491940977459,40.6468021729202,40.6439490289227,40.6426378289533,40.6416523796818,40.6410658560679,40.6405385525687,40.6398722842505,40.6398071177214,40.6389121892042,40.6389609896186,40.6390435566079,40.6390646876029,40.6391052051913,40.6391303326162,40.6391590489139,40.6391906814457,40.6392244892629,40.6392596804627,40.6392954307375,40.6393309026822,40.6393652654103,40.6394657445316,40.6397577837957,40.6398247635251,40.6398897081818,40.6399520809668,40.6400113663375,40.640067074269,40.6401187443046,40.6401659493619,40.6402082992636,40.6402454439619,40.6402770764332,40.6403029352148,40.6403127825429,40.6403384769682,40.6403632791572,40.6403703881558,40.6403812227664,40.6404366717804,40.6404367419725,40.6404531770321,40.6404606332138,40.6404786382136,40.6404879639444,40.6404916918165,40.6405178771024,40.6405428047946,40.6405614712637,40.6405845017967,40.6405999432332,40.6406102208737,40.640628230498,40.6406324104561,40.6406504864935,40.6406631265399,40.6406744175287,40.6407196977066,40.6407309445163,40.6407340061444,40.6407342269036,40.6407410325794,40.6407410982798,40.6407513806592,40.6407650211267,40.6407932049232,40.6408176807213,40.6408222509575,40.6408555639491,40.6408974140312,40.6409020822165,40.6409136678676,40.6409137790777,40.6409145249333,40.6409128294971,40.640913040585,40.6409136912303,40.6409205969414,40.6409325058989,40.6409371016926,40.64094189605,40.640970109036,40.6409718203277,40.6409923497805,40.6409881296635,40.6409711166305,40.6409617900947,40.6409780345475,40.6410079331285,40.641062590615,40.6411189645532,40.641150587238,40.6412027211664,40.641255708149,40.6413086893028,40.6413608173897,40.6414129507884,40.6414548560803,40.6415018474876,40.6415480085901,40.6415659579732,40.6415787618899,40.6415659358757,40.64151977476,40.6414975131891,40.6414693072647,40.6414556183552,40.6414453203899,40.6414589703652,40.6414554855452,40.641424732739,40.6414187021882,40.6414041625139,40.6414015673405,40.6413938534723,40.6414049157332,40.641442447646,40.6414797697887,40.6414799736993,40.6414808260927,40.6415209181406,40.6415652933213,40.6416182252924,40.6416703045278,40.641718113296,40.6417290095262,40.6417292164004,40.6417736278198,40.6418120646637,40.6418291481893,40.6418846744067,40.6419402088106,40.6419436278893,40.641989772155,40.6419924180068,40.6420034466268,40.6420402294657,40.6420650491102,40.6420787404384,40.6420789208376,40.6421001304697,40.6421111738471,40.6421206862728,40.6421200689572,40.6421190205093,40.64210945619,40.6421053717302,40.6420567151733,40.6420567262852,40.6420584549509,40.6420679530952,40.6420738943114,40.6420749599049,40.6420756463811,40.642058593659,40.6420594885617,40.6420603142555,40.6420653201095,40.6420688881259,40.6420979627559,40.6421091047828,40.6421079674175,40.6421074360628,40.6421236729687,40.6421279572592,40.642177533269,40.6421776505245,40.6421955186834,40.6422032817722,40.6422039605293,40.6422050650492,40.6422128506231,40.6422128588805,40.6422170908758,40.6422280222848,40.6422419101646,40.6422569247397,40.6422769894146,40.6422914685027,40.6422915471503,40.6423095589346,40.6423187016061,40.6423224456094,40.6423301893566,40.642335092661,40.6423351074623,40.6423473399792,40.6423729982989,40.6423841050562,40.6424149004313,40.6424249323686,40.6424250055252,40.6424516860917,40.6424911862153,40.6424960378873,40.6424961477304,40.6425085632179,40.6425405822997,40.6425738992392,40.6425776151389,40.6426080766785,40.6426405395378,40.642669590147,40.6427147814033,40.6427251220555,40.6427391400841,40.6427533296215,40.6427960730299,40.642803565101,40.6428036266138,40.6428285479447,40.6428550458939,40.6429026906888,40.6429054769836,40.6429148364877,40.642927727031,40.6429387080628,40.6429627794035,40.6430089470562,40.6430329639869,40.6430491302088,40.6430978522868,40.6431397547091,40.6431670746068,40.6431859223233,40.6432286759661,40.6432402662576,40.6432568943043,40.6433081760548,40.6433387390889,40.6433594530333,40.6434064729924,40.6434534924091,40.6434782715295,40.6434875567032,40.6435320744205,40.643570476804,40.6435879439901,40.643611444491,40.6436635223294,40.6437096329118,40.6437097915906,40.6437098207398,40.6437437278406,40.6440458751311,40.644179192377,40.6443123210557,40.644437584642,40.6445238156495,40.6444614180559,40.6443519881635,40.6443286950753,40.6443679359587,40.6442898387417,40.6441022811263,40.6440086305595,40.6439463036803,40.6440409497898,40.6441819286849,40.644502890609,40.6445712577003,40.6446429652357,40.644745823788,40.6451319353229,40.6452394738166,40.6456021717169,40.6456815796135,40.6456816432897,40.6457062219115,40.6457595105207,40.6457931256929,40.6457984656452,40.6458102808509,40.6458607346133,40.6459366817738,40.6459638829904,40.6459871856828,40.6460786413691,40.6461039870834,40.6461253992822,40.6461584720126,40.6461799366696,40.6463254512651,40.6465049245539,40.6465943797746,40.6466566599826,40.6467227832965,40.6470321350494,40.6471430291999,40.647191581473,40.6472673712237,40.6473373655494,40.6474151606943,40.6474677375557,40.6475183575817,40.647588411819,40.6476234308654,40.6476973286995,40.6478023900073,40.6478744346366,40.6478919986652,40.6478785139287,40.6478804575729,40.6478805165612,40.6478806997646,40.6479039139852,40.6479039612225,40.6478831055566,40.6478709746672,40.6479069528305,40.6480074155948,40.6480244616377,40.6480244926157,40.6480450080697,40.6480706523825,40.6480876310778,40.6481150993463,40.6481188778168,40.6481305070423,40.6481493309057,40.6481535823205,40.6481775073171,40.6481989876165,40.6481990387524,40.648203152695,40.648229958133,40.6482569721725,40.6482755869412,40.6483133489042,40.6483251658583,40.6483407025606,40.6483612673405,40.6483877733434,40.6484149698143,40.6484406478243,40.6484407527422,40.6484467460688,40.6484778783668,40.6485607939285,40.6485919765882,40.6486412898288,40.6487182564979,40.6487456536068,40.6487513419006,40.6487579940716,40.6487642212087,40.6487744066311,40.6487840743083,40.6487932114882,40.6488018089279,40.6488098548773,40.6488173402653,40.6488242560166,40.6488306161341,40.6488375444789,40.6488450274509,40.6488530534626,40.6488616043922,40.6488706664721,40.6488802225857,40.6488902536127,40.6489007414319,40.6489116677588,40.6489230096178,40.6489436781853,40.6489647265901,40.6489861405846,40.6490079079263,40.6490300188899,40.6490524585547,40.6490616608709,40.6490704190961,40.6490787139334,40.6490847588609,40.6490938387875,40.6491006335616,40.6491068973139,40.6491151539924,40.6491374157798,40.6491425449189,40.6491524684677,40.6491627438341,40.6491733457054,40.6491842422258,40.6491954069118,40.6492068097546,40.6492186818757,40.6492301570797,40.6492412162483,40.6492518379121,40.6492620029507,40.6492716902283,40.6492829883299,40.6492938422422,40.6493042413939,40.6493141760516,40.6493236356405,40.6493326126045,40.6493410951947,40.6493490763586,40.6493565500409,40.6493635063395,40.6493699392024,40.6493758437507,40.6493762833984,40.6493761043753,40.6493753056196,40.6493738929396,40.6493718724811,40.6493692555806,40.6493660539149,40.6493622841847,40.6493587604515,40.6493579651049,40.6493531187401,40.649347769002,40.6491704121165,40.6490336057781,40.6492076822843,40.6492086324319,40.6492101710978,40.6492114401579,40.6492132640615,40.6492156268274,40.6492169094551,40.6492185096335,40.6492218856143,40.6492265392689,40.6492318030212,40.6492376597356,40.6492582943229,40.6492685505127,40.6492847663502,40.6493004292547,40.6493155056855,40.6493231056944,40.6493303073964,40.6493370630081,40.6493433245638,40.6493490548206,40.6493546581683,40.649359709366,40.649364177366,40.6493680326224,40.6493712519564,40.6493740986487,40.6493763621039,40.6493780240018,40.6493790757335,40.6493795098654,40.6493793204669,40.6493780980927,40.6493762081708,40.6493736560165,40.6493704504598,40.6493666016746,40.649363839661,40.6493589101847,40.6493507055657,40.6493420078926,40.6493328392475,40.6493232210474,40.6493131783941,40.6493039491657,40.6493027332084,40.6492919136104,40.6492807447104,40.6492692551322,40.6492574709923,40.6492463114424,40.6492354385494,40.6492248764209,40.6492146536834,40.6492047966151,40.6491953304888,40.6491882193055,40.6491862772289,40.6491776597577,40.649169502338,40.6491629725125,40.6491561609533,40.649149108346,40.6491418530322,40.6491344373835,40.64912689958,40.6491192848469,40.6491116353957,40.6491055993025,40.6491039917652,40.6490963990275,40.6490889005747,40.6490815371281,40.649074348574,40.6490673766464,40.6490453721651,40.6490234523748,40.6490016340339,40.6489799347339,40.6489583673772,40.6489369509044,40.6489157005615,40.6488946327751,40.648873763631,40.648853107378,40.6488326797726,40.6488124990791,40.648792575696,40.6487436754075,40.6486989977174,40.648694532797,40.6486909132909,40.6486451528961,40.6485955412349,40.6485928493077,40.6485457038524,40.6485248388216,40.6485191909062,40.6484930501414,40.6484672902771,40.6484660905958,40.648441920869,40.6484169459453,40.6484074216903,40.6483923747299,40.648368215104,40.6483444732748,40.6483211564544,40.6482982705171,40.6482809348436,40.6482631824459,40.6482450294248,40.6482264850044,40.6482075657865,40.6481882860221,40.6481686582879,40.6481486975076,40.6481284172587,40.6481078358166,40.6480405394938,40.6480163798847,40.6479925753815,40.6479691372179,40.6479460811522,40.6479234190925,40.6479011641158,40.6478793306416,40.6478579285673,40.6478252343198,40.6478202472438,40.6478117178108,40.6477943748275,40.6477820522951,40.6477433534512,40.647713590408,40.6477094297769,40.6477041607715,40.6476937708366,40.6476829927214,40.6476718406818,40.6476603291457,40.6476484743755,40.6476362936445,40.6476237993641,40.6476110136626,40.6475979486157,40.6475846250084,40.6475710589354,40.6475572693394,40.6475335832944,40.6475102664564,40.6474873293918,40.6474647875241,40.6474492858302,40.6474426505814,40.6474209313063,40.6473996422783,40.6473787940615,40.6473482231845,40.6473180697527,40.6472883483486,40.6472590665218,40.6472302334944,40.6472018605031,40.6471739555965,40.6471514861194,40.6471287043441,40.6471056225078,40.6470822525172,40.6470586071119,40.6470346988642,40.64695667214,40.6469339672562,40.6469127550683,40.6467975722778,40.6465232126519,40.6463886878661,40.6460502580564,40.6460560459366,40.6460699128613,40.6463715594754,40.6467459777211,40.6468930001539,40.6469157279725,40.6469384394916,40.6469747544232,40.6470145847782,40.6470795153901,40.6470796517499,40.6470881858025,40.6470713244939,40.6470438731899,40.6470469735472,40.6470656653142,40.6470849899721,40.6471634452779,40.6472188189086,40.6472200357357,40.6472075538358,40.6471969173174,40.6471944379818,40.6471944053904,40.6471806764433,40.6471488690594,40.6471384266808,40.6471251794998,40.6471127062851,40.6470958593827,40.6470877353033,40.6470795533161,40.647081360932,40.6470936682672,40.6471103114528,40.6471362117718,40.6471534914593,40.6471627599537,40.6471853476016,40.6472164078598,40.6472454708278,40.6472762080055,40.6473308595822,40.6473419366858,40.647360691522,40.6473631900908,40.6473632051952,40.6473580632713,40.6473144567334,40.6472929591252,40.6472614767171,40.6472489060055,40.6472443621329,40.6472441302961,40.647214446881,40.6471850517374,40.6471734312081,40.6471697250634,40.6471606153029,40.6471529931836,40.647144350566,40.6471408695291,40.647140626412,40.647121946645,40.6471169499369,40.647100178275,40.6470862946514,40.6470861892386,40.6470810567979,40.6470340834504,40.6469794232872,40.646957221709,40.6469568392034,40.646924775032,40.6469050696401,40.6468863338447,40.6468651836159,40.6468572738842,40.6468085777033,40.6467735695239,40.6467454193833,40.6467334990266,40.6467224132761,40.6467187190714,40.6467156022575,40.6467102289176,40.6467079576087,40.6467103992731,40.6467139885154,40.6467285525379,40.6467567860001,40.6467882482677,40.6467884268996,40.6468028718209,40.6468243049786,40.6468615194269,40.6468618822307,40.6468811641793,40.6468997340506,40.6469018523863,40.6469049033249,40.6469116993968,40.6469184459775,40.6469322113536,40.6469326961754,40.6469429489785,40.6469472645119,40.646954915174,40.6469571142262,40.646957500438,40.6469681491984,40.6469675523983,40.6469658609735,40.6469658696229,40.6469638412388,40.6469580774866,40.6469461993545,40.6469106740653,40.6468850618171,40.6468599250419,40.6468295425581,40.6467998495324,40.6467851129488,40.6467346920647,40.6467126253992,40.646712468821,40.6466910808265,40.6466636840549,40.646647389008,40.6466430489808,40.6466439531945,40.6466575013859,40.6466532179427,40.6466497828167,40.6466466086878,40.6466444891391,40.6466402368937,40.6466205701313,40.6465889508272,40.6465538696817,40.646553665434,40.6465342764774,40.646534020252,40.6465163452811,40.6464880546497,40.6463003913233,40.6462826846923,40.6462677856628,40.6462519349472,40.6462127865494,40.6461764613117,40.6461696339601,40.6461559884033,40.6461133248084,40.6461113582738,40.6460851985463,40.6460655693589,40.6460591213664,40.6460442155456,40.6460444188707,40.6460517612949,40.6460544454779,40.64605511109,40.6460597397624,40.6460310854832,40.6460255463916,40.6460248621173,40.6460152827393,40.6460142877909,40.6460142273722,40.6460099719417,40.6460057302724,40.6460044075754,40.6460031399257,40.6460068527338,40.6460090886501,40.6460227047609,40.6460281510345,40.6460354644416,40.6460396991145,40.6460405447086,40.6460300312383,40.6460277053547,40.6460044836899,40.6459806891245,40.6459481992659,40.6459480386941,40.6459122686969,40.6458732393411,40.6458729454252,40.6458689226674,40.6458233704129,40.645784950724,40.6457772059866,40.6457413081786,40.6457276462769,40.6457233972043,40.6457148386009,40.6457140465681,40.6457122409813,40.6456669302483,40.645625033436,40.6455924359809,40.64557631528,40.6455608348012,40.6455608012702,40.645548107164,40.6455161169189,40.6454976795353,40.6454674551086,40.6454540737341,40.6454500673036,40.6454190229184,40.6454131766001,40.6453942271256,40.6453752435664,40.6453643068073,40.6453391428568,40.6453292801243,40.645317024602,40.6453088237718,40.645306298446,40.6453062870006,40.6453087109379,40.6453131336411,40.6453132675083,40.6453165635434,40.6452792180679,40.6452789747816,40.645265323353,40.6452652466994,40.6452559569769,40.6452312390442,40.6452111468334,40.6452014048276,40.6451979910046,40.6451715688882,40.6451601211562,40.6451536727363,40.6451355306013,40.6451281043469,40.6451165868381,40.6450957058106,40.6450798367506,40.6450675492054,40.6450658489928,40.6450837932177,40.6451140426569,40.645126532113,40.6451265795124,40.6451333885267,40.6451547598159,40.6451581679949,40.6451581951179,40.6451585658025,40.6451701956006,40.6451685243957,40.6451667903462,40.6451660273533,40.645164231129,40.6451599936705,40.6451505653505,40.6451197877599,40.6451103297696,40.6450770346945,40.6450325738294,40.6450212477395,40.6450052047072,40.645003481544,40.6450213886855,40.6450214406526,40.6450263336568,40.645035019975,40.6450392301835,40.6450426002836,40.6450664564628,40.6450980001566,40.6451261260605,40.645152870548,40.6451576724471,40.645187504983,40.6451878442258,40.6452241791344,40.645224153871,40.6452045734595,40.6451959259295,40.6451861640294,40.6451659962081,40.6451377946994,40.6451061829747,40.6450842214789,40.6450779512671,40.645066637927,40.6450531653152,40.6450138770514,40.6449985508448,40.644979697309,40.644976389757,40.6449711329456,40.6449454702429,40.6449189715897,40.6448870693433,40.6448677209282,40.644813892939,40.644787129315,40.6447669023017,40.6447440262291,40.6447275644753,40.6446771393899,40.6446250104204,40.6445703254787,40.6445540939522,40.6445374036129,40.6445250320833,40.6444737776079,40.6444532569658,40.6444446970552,40.6444403582769,40.6444463187602,40.6444465052994,40.6444573635609,40.6444651024072,40.644474210426,40.6444745060529,40.644498432988,40.6445197895142,40.6445221546621,40.6445223399814,40.6444872827779,40.6444385588439,40.6444216412576,40.6444214488052,40.6444156481737,40.6443906680588,40.644382392764,40.6443522102197,40.6443520606624,40.6443453641479,40.6443314470882,40.6443297822619,40.6443306768124,40.6443124903784,40.6443110131266,40.6442943610431,40.6442320796632,40.6441930670323,40.6441924403361,40.6441868744599,40.644179458549,40.6441704276268,40.6441367071062,40.6441131851903,40.6441033803844,40.6440738551496,40.6440504025874,40.6440059499888,40.6439933625191,40.6439490558924,40.643894599054,40.6438401417108,40.643816787721,40.6438016719912,40.6437939567027,40.6437865305177,40.6437785648081,40.6437477927917,40.6436956641218,40.6436954975401,40.6436614504065,40.6436610133672,40.6436605250909,40.6436604832001,40.6436604527836,40.6436603531017,40.6436567254298,40.6436518820848,40.6436305060034,40.6436116868008,40.6436047586161,40.6435937167537,40.6435828939546,40.6435757122099,40.643569693431,40.6435594522047,40.6435389296429,40.6435276663289,40.6435200981871,40.6435130718798,40.6434978231959,40.6434721734095,40.6434630249049,40.6434601780636,40.6434558675598,40.6434395817223,40.6434193371913,40.6434190535153,40.6434096307478,40.6433907684692,40.6433650810105,40.6433368310063,40.6433202774078,40.6433034593052,40.6432863292051,40.6432640544893,40.6432469553097,40.6432259714171,40.6432247292607,40.6432207412338,40.6432206890359,40.6431939227624,40.643180195731,40.643165671456,40.6431495395663,40.643143396613,40.6431211469724,40.6431162880596,40.6430869219451,40.6430741786959,40.6429106699013,40.6424503491884,40.6418744659761,40.6413507105514,40.6408349391228,40.6402187727684,40.6397574331381,40.6395816471509,40.6391588197373,40.6384222356303,40.6382178393207,40.6381922454172,40.6381793878211,40.6382665874406,40.6383029810972,40.6384359481243,40.6384595436956,40.6384394052468,40.6383685571927,40.6383377247465,40.6378673460452,40.6378357011734,40.6377134505503,40.6375865973655,40.6374544066025,40.6374049392746,40.6372291053996,40.6370746548416,40.6369026640831,40.6367354751942,40.636026079762,40.6358084951236,40.6355642563578,40.6354059975606,40.635256474768,40.635082035605,40.6349686418916,40.6348278444788,40.634708234642,40.6345549765454,40.6344241559521,40.634263210453,40.6330044006804,40.632232088569,40.6321024657081,40.6318898090714,40.6318016911699,40.631479931125,40.6313435127016,40.6311964362661,40.6310401202817,40.6308762579708,40.6307068009622,40.6305338211574,40.6303594962852,40.6301859516969,40.6301184614918,40.6300152334118,40.6299221637511,40.6298177865945,40.6297976078495,40.629732800961,40.6296687904851,40.62960934251,40.6295577015887,40.6295160349859,40.6294692415527,40.6294319257387,40.6294077575985,40.6293991838171,40.6294067547319,40.6294290197829,40.6294629811594,40.6295609280354,40.6295901762479,40.6295902000275,40.6295902142316,40.6295593785202,40.6295262501616,40.629453600378,40.6293990570893,40.6292890808949,40.6290361258462,40.6289162349389,40.6270840111824,40.626680605523,40.6264614194652,40.6262566961515,40.6260344630684,40.6258952012101,40.6257018950258,40.6255473215584,40.6254210421054,40.6252947006402,40.6251820340768,40.6250815553665,40.6249099531853,40.6247905980889,40.624682644705,40.6245330128578,40.6244106375749,40.6242781414487,40.6241897934552,40.6240767695628,40.6239600256484,40.6238221439521,40.6237012338742,40.6235995711791,40.6234325659253,40.6229028460825,40.6230167763594,40.623489014407,40.6252314183503,40.6255332381548,40.6258775876737,40.6262178579574,40.6263062001343,40.6264752921064,40.6265025184656,40.6265309800029,40.6266391339272,40.626666367847,40.6266727909604,40.6266864131829,40.6267223055691,40.6267397903968,40.6267428390799,40.626746817817,40.6268542213158,40.627091766522,40.6271638377239,40.6274876549916,40.6278768995159,40.6282482765628,40.6282523138297,40.6282598426587,40.6285556982776,40.6289460081003,40.6292939445283,40.6295338902397,40.629674593442,40.6300920840584,40.6304660782446,40.6308705827424,40.6309295249514,40.6309948313043,40.6310663186849,40.6311437866448,40.6312270179656,40.6313157792677,40.6314098216647,40.6319496036457,40.6319821276652,40.6320103899215,40.6320340503241,40.6320528241585,40.6320664855117,40.6320748699909,40.6320742736645,40.6320672495282,40.6320538490497,40.6320341704175,40.632008357822,40.6319766003982,40.63193913084,40.6318962236953,40.6318481933534,40.6317953917419,40.6317382057474,40.6316137945316,40.6315666906195,40.6315166015534,40.6314641965442,40.6314101757429,40.6313552608869,40.6313001856561,40.6312456858717,40.6311924896649,40.631141307749,40.6310928239244,40.6310476859428,40.6310064968541,40.6307682297696,40.6307373832716,40.6307026823168,40.6306647512909,40.6306242726979,40.6305819748798,40.6305386189111,40.6304949849043,40.630451857973,40.6299956843306,40.6297599665778,40.6297238742527,40.6272014092517,40.6267836383167,40.6251331918815,40.6248336155542,40.6249401986997,40.6249494941617,40.6249688484408,40.6251832317866,40.6255451449599,40.6257748196835,40.625792780664,40.6257756176298,40.6258649560844,40.6258584656061,40.6257672676287,40.6257268809866,40.6257199010797,40.6256784827233,40.6256721159555,40.6256315959497,40.6256227696826,40.6255821131854,40.6255750552147,40.6255342623931,40.6255267738276,40.6254860843057,40.6254779634427,40.6254371193062,40.6254280036886,40.6253861543329,40.6253809587746,40.6253395590706,40.6253319924257,40.6252913241113,40.6252837683615,40.6252430053393,40.6252338550935,40.6251941065515,40.625186137303,40.6251458844419,40.6251379009189,40.6250976018434,40.6250890430678,40.6250478245146,40.6250420932601,40.6249990051079,40.6249931951422,40.6249540648112,40.6249487887973,40.6249132419243,40.6249069805418,40.624872461941,40.6248643892369,40.6248311605219,40.6248236427444,40.624789203085,40.6247824161,40.6247729884906,40.6247414698037,40.624706475775,40.6247000472108,40.6246652368816,40.6247453816744,40.6247379537638,40.624640769383,40.6246133871959,40.6247054984719,40.6246994560176,40.6246188537803,40.624575406894,40.6245394262253,40.6245217474162,40.6244978565305,40.6244904847151,40.6244556839956,40.6244487328757,40.6244122544834,40.6244060566628,40.6243701291463,40.624448887625,40.6244442391696,40.624349364751,40.6246022561968,40.6245557410155,40.624570588909,40.624484183941,40.6243679502277,40.6243105651223,40.6242133348733,40.6240509944495,40.6240391828618,40.6240680600541,40.6240523937135,40.62446290725,40.6244098539303,40.6243965183052,40.6244423970509,40.624023326836,40.6239827133039,40.6239765512653,40.624017646045,40.6239825670153,40.6239354635428,40.6239246893073,40.6239498185985,40.6239359210622,40.6239883489576,40.623988381354,40.6239905336476,40.6239926392731,40.6239942178223,40.6239580267315,40.6239577803167,40.6239564718528,40.623955138547,40.6239550576393,40.6238997867403,40.6238829880753,40.6239388525132,40.6239545312565,40.6239028916939,40.6238507589239,40.6237987286118,40.6237473952509,40.62369734537,40.6236491508316,40.6236033622981,40.6235605029404,40.6235405459163,40.6235258727886,40.6235167571318,40.6235133689033,40.6235157712752,40.6235239194564,40.6235376615274,40.6235567412731,40.6235808029592,40.623586510926,40.6235907506615,40.6235934048461,40.6235944000352,40.6235937086904,40.6235913499421,40.6235873890603,40.6235819356478,40.623575140608,40.6235671919689,40.62355830968,40.6235487395261,40.6235387463259,40.6235286066045,40.6235186009411,40.6234494339465,40.6233810148032,40.6233138310719,40.623248361508,40.6231850726506,40.6231244154975,40.6230668222918,40.6230127034416,40.6229624445962,40.6229534393256,40.6229484036109,40.6229474073054,40.6229504642295,40.6229399237097,40.6229233658442,40.6229009199713,40.6228727614224,40.6228391101519,40.6228002290189,40.6227564217342,40.6227080304873,40.6226554332732,40.62259904094,40.622539293979,40.6224766590841,40.6217727551257,40.6217379444994,40.6217072793056,40.6216815673831,40.6216614860818,40.621647564419,40.6216401691436,40.6216394950747,40.62164555997,40.6216582040574,40.6216770942442,40.6216873619028,40.6216954470039,40.6217029707679,40.621709928859,40.6217199833312,40.6217294995603,40.6217384693552,40.6217468848575,40.6217547423984,40.6217620364667,40.6217687588722,40.6217749062804,40.6217804743551,40.6217854592584,40.6217898583312,40.6217936653884,40.6217968789441,40.6217994985139,40.6218015200936,40.6218029421962,40.6218037653417,40.621796903481,40.6217905189006,40.6217846241903,40.621779229259,40.6217743485435,40.6217699901063,40.6217661611845,40.6217628728584,40.6217601311882,40.6217579398883,40.6217563040133,40.6217552276118,40.6217547120534,40.6217547597129,40.6217553696152,40.6217565411171,40.6217582703965,40.6217605553042,40.621781802944,40.6218033787748,40.621825280791,40.6218211722316,40.6218176360392,40.6218146826351,40.6218123219417,40.6218105622081,40.6218094061512,40.6218088600092,40.6218089248304,40.6218096001476,40.6218108843268,40.6218127735538,40.6218152601613,40.6218183369842,40.6218219960192,40.6218233706594,40.6218241742964,40.6218244052863,40.6218240626585,40.6218231491274,40.6218216642213,40.6218196145076,40.6218170028681,40.6218138368726,40.6218101225859,40.6218058717644,40.6218016507495,40.621797692026,40.6217940551077,40.6217907899647,40.621787940877,40.6217855494541,40.6217836472553,40.6217822636676,40.6217814156836,40.6217811166124,40.6217813692111,40.6217821720453,40.6217835122936,40.6217853715959,40.6217968366147,40.6218075157497,40.6218174001454,40.6218264844646,40.6218301016725,40.6218335199671,40.6218367395273,40.6218397598651,40.6218425769735,40.6218515616238,40.6218506421593,40.6218429520814,40.6218374914653,40.621830068884,40.6218137604164,40.6217854380092,40.621766571825,40.6217622873704,40.6217494468294,40.6217471265255,40.6217451613701,40.621744604942,40.6217052098269,40.6216956671465,40.6216876479827,40.6216820622121,40.6216831999536,40.6216839656214,40.6216735100261,40.6216551159452,40.6212436759307,40.6210161464114,40.6207715825901,40.6204083796304,40.6202248332221,40.6201216084871,40.6199461090915,40.6197563422735,40.6195594256787,40.619373928507,40.6192626318,40.6191099473268,40.6189743765835,40.6187951227492,40.6180025403001,40.6172093028479,40.6164155529934,40.6156214346673,40.6152289213095,40.614640034109,40.6145686317806,40.6142134466973,40.6139647841999,40.6138248437176,40.6135518418141,40.6132210650464,40.6127617997904,40.6125423115649,40.6123230121769,40.6121040479619,40.6118855647149,40.6116677085526,40.6114506248433,40.6101853714281,40.6083111707694,40.6081500847918,40.6067882167964,40.6054002913384,40.6054158103404,40.6054320922665,40.6055258863466,40.6055440658224,40.6055418726324,40.6055473178956,40.6055567256047,40.605569707538,40.6055757088006,40.6056003094609,40.6056130206579,40.6056111935843,40.605606683723,40.6055942207036,40.6055714371776,40.6055567198757,40.6055539217289,40.60556691424,40.6055836716385,40.605591367587,40.6056054215472,40.605614088031,40.6056246620268,40.6056317529225,40.6056360513387,40.6056326280197,40.605622187291,40.6056079577288,40.6056033350892,40.6056092657947,40.6056158223217,40.6056213223982,40.6056251426637,40.6056401402263,40.6056504323069,40.6056575573261,40.6056781119573,40.6056969569627,40.6057044271965,40.6057064828081,40.6057107306192,40.6057209380192,40.6057339100287,40.605749187867,40.6057667173356,40.6057792040205,40.6057938070603,40.6058073426654,40.6058500188413,40.6058975167934,40.6059360771564,40.6059690262586,40.6060523247569,40.6061295895492,40.6062410620256,40.606287105697,40.6063460929076,40.6063744238577,40.6065052193762,40.6065729943578,40.6067191750657,40.6067972385059,40.60693328793,40.6070084286412,40.6070677723318,40.6071074373451,40.6071518623058,40.6071968460431,40.6072792340411,40.6074504458281,40.6075434914857,40.6076163920016,40.607669785436,40.6076996173729,40.6078498569373,40.607940110737,40.6080698081008,40.6081726807072,40.6082169835802,40.6082595514346,40.6083292023167,40.6083866181618,40.6084723371921,40.6085413394309,40.6086078937517,40.6086536044136,40.6086926069988,40.6087445859261,40.6088074948927,40.6088715218823,40.6089208386905,40.6089598014005,40.6090133726754,40.6090931745925,40.6091921053485,40.609242675475,40.6092596722225,40.6092755586455,40.6092872239439,40.609330213413,40.6093924858602,40.6094291501619,40.60945397364,40.6094675931323,40.6094801533491,40.6095304693316,40.6096280883329,40.6098874824485,40.6099898361084,40.6100166668447,40.6100418269555,40.6100740101763,40.6101007758929,40.610116474304,40.6101203714447,40.6101141562852,40.6101149680017,40.6101173707301,40.610156127123,40.6102086131164,40.610242082216,40.6102747976857,40.6102962297612,40.6103270609135,40.6103712456314,40.6104060915147,40.610439897465,40.6104847785475,40.6105428443767,40.6105683508406,40.6106107485455,40.6107015803233,40.6107573537309,40.6107748637924,40.6107852289927,40.6108011624363,40.6108215299791,40.610859810763,40.6108929430532,40.6109081284033,40.6109198312834,40.6109406086871,40.6109626779231,40.6109861768946,40.6110132935497,40.6110326878591,40.611033161412,40.6110318435301,40.6110468785487,40.6110880438777,40.611145232,40.6112302828639,40.6113207502419,40.6113755070488,40.6113780877403,40.6113879406913,40.6113900522164,40.6113904935834,40.6113701182727,40.6113618632195,40.6113749833907,40.6114182336222,40.6115538988934,40.6116529269004,40.6117018406422,40.6117378097564,40.611750552314,40.611782820278,40.6118075718089,40.6118256599545,40.6118432682957,40.6118506648302,40.6118269409431,40.611824497389,40.6118240145061,40.6117659909123,40.6117420947601,40.6117430241693,40.6117557734881,40.6118664529445,40.6118975728199,40.6119606412289,40.6119517282182,40.6119459893939,40.6119614207792,40.6118856475719,40.6118618584918,40.6118393673383,40.6118149990323,40.6105752492363,40.6105815421847,40.6105638175466,40.6105546777758,40.6105377845673,40.6105288810042,40.6105129421812,40.6105030086024,40.6104905040899,40.6104810431033,40.6104988210591,40.6105250577841,40.6105333206097,40.6105647563297,40.6105802744991,40.6106389526909,40.6118262111995,40.611827233144,40.6117716399164,40.6117806211642,40.6118781891843,40.6118726551686,40.6118975612658,40.6119070078458,40.6119804121826,40.6120160166773,40.6119432909676,40.611943297738,40.6119243137495,40.6119209669434,40.611826025296,40.6118368818644,40.6118947897639,40.6119065225554,40.6119318073368,40.6119444560964,40.6119703688695,40.6119845649074,40.6120116910776,40.6120251705671,40.6120527977855,40.6120656651954,40.61208669411,40.6121594419764,40.6120842562175,40.6120952149873,40.6121865434486,40.6121750305937,40.6121684090674,40.6120787463598,40.6119942272823,40.6119258091708,40.6119483636902,40.611936401197,40.6119583792475,40.6120335600048,40.6121639739466,40.6122470670015,40.6135507534181,40.6135550894721,40.613564560182,40.6150633139773,40.6150385727035,40.6150095030529,40.6148829739438,40.614875299251,40.6149021723704,40.6149096948233,40.6149298741369,40.6149374135235,40.6149623328646,40.6150018260908,40.6149258969279,40.614934853273,40.6149533892196,40.6149899808314,40.6149701407506,40.6149907566442,40.6150241002558,40.6150539617539,40.6150505413353,40.6150774614114,40.615150178466,40.6151534240616,40.6160638715008,40.6161140175788,40.616000150328,40.6160098753384,40.6161378277568,40.6162959199902,40.616359594281,40.6162038826614,40.6160875818794,40.6161050646555,40.6162213675258,40.6163515259324,40.616235218724,40.6162585357007,40.6163780969955,40.6165336003568,40.6166098602143,40.616443881555,40.6163444325489,40.6163627367146,40.6164621857432,40.6165515018876,40.6166084499154,40.6165861334143,40.6167127445685,40.6166293764513,40.6166954400081,40.6167807396306,40.616845429918,40.6168653910846,40.616896467128,40.6168766896164,40.6169087531164,40.616873349794,40.6168605645372,40.6169035346007,40.6169636415001,40.6170394027203,40.6170851556364,40.6171752172589,40.6172006397175,40.6171581733431,40.6171939442325,40.6171854251832,40.6173910292781,40.6173209081646,40.6172654970542,40.6174363967214,40.6173907930586,40.6173310379918,40.6171678549094,40.6171504108085,40.6173116466277,40.6171604383319,40.6165309989616,40.6165174284536,40.6168729573246,40.6166325516129,40.6165316217291,40.616085198377,40.6159801902155,40.6156690164285,40.6157523867443,40.6157368440612,40.6156011240516,40.6156127838919,40.6156515622868,40.6159693598432,40.6160648226364,40.6165219474828,40.6166461618491,40.6168904418824,40.6169914848194,40.6168664615923,40.616670505789,40.6166864083358,40.6165753714996,40.6165654374337,40.6163926697994,40.6157962913698,40.6157861501057,40.6157727864047,40.6154927664738,40.6154506305757,40.6154549830879,40.615392438067,40.6152431462564,40.614798266643,40.6145366540086,40.6145580417259,40.614484133139,40.6144506995698,40.6143076571172,40.6143178615798,40.6130403392662,40.6128816747953,40.6128793665801,40.6128736371189,40.6128062434577,40.6123565720308,40.6122266982815,40.6121875388266,40.6121552711932,40.6120999581468,40.6120367595738,40.6120167810349,40.6119551526017,40.612042410287,40.6119986864317,40.6119779621676,40.612010756372,40.6119725815915,40.6119277670078,40.6118961393837,40.6116888679322,40.6114064903726,40.6114795439001,40.6114904700152,40.6115471638637,40.6115198461586,40.6114664244107,40.611469702511,40.6113890087427,40.6113474733717,40.6113112670576,40.6112714881188,40.6109675376546,40.610881933282,40.6109314687315,40.6108101878957,40.610752722667,40.6104824497254,40.6105042330877,40.6104227726005,40.6103433160321,40.6102559631195,40.6101831353653,40.6095530845587,40.6095490030531,40.6090427655628,40.6090379159839,40.6086196995301,40.6083993107518,40.6083789281505,40.6083506813982,40.6083141928554,40.6083070850216,40.6082997328633,40.6082905411419,40.6082875734561,40.6082798543432,40.6080597291121,40.6080596749922,40.6078077841515,40.6078074812434,40.6077870557599,40.6075104217712,40.6073454189906,40.607345166108,40.6072331775322,40.607233090025,40.6063475334301,40.6062583684602,40.6062213698497,40.6060945491333,40.6060951337444,40.606096766405,40.6058722212995,40.6058569219289,40.605797243755,40.6057633607389,40.6056746865559,40.6056678646822,40.605710384119,40.6057035514769,40.6057058582742,40.6057296117958,40.605475863929,40.6052539333397,40.6050317785639,40.6049081829094,40.6049100903244,40.6049347970237,40.6052268088299,40.6053242701596,40.6055402975894,40.6058978586435,40.6060055333403,40.6061165042758,40.6062976110349,40.6063840287044,40.6063539800078,40.6063589229357,40.606371394478,40.6063774212887,40.6063769826683,40.6063700801231,40.6063567373605,40.6063370002069,40.6063109364508,40.6062786356096,40.6064332975922,40.6063908422836,40.6065275750092,40.6066167467397,40.606635399067,40.6066532851099,40.6066608372663,40.6066587220479,40.6066469376475,40.6066086163553,40.6065649654979,40.606536519331,40.6064661462109,40.6064661656541,40.6064836845838,40.6064937184098,40.606483646661,40.6064525759252,40.6064776030248,40.6061683055072,40.6060808600487,40.6060271979874,40.6059997221777,40.6058226772315,40.6056577955482,40.6056651971674,40.605293847168,40.6051505096431,40.6050494265281,40.6050600737971,40.6047399699945,40.6047292670212,40.6045165478595,40.6045254997872,40.6044458559816,40.6044581630975,40.6041289500776,40.6040733739186,40.6039136725236,40.6039765286766,40.603927107042,40.6039441068494,40.6035054761007,40.6037519024197,40.6038461133724,40.6038784358375,40.6039291391616,40.603982513837,40.6040164870758,40.6042064569534,40.6041576846878,40.6052040945471,40.6052453862556,40.6053219881056,40.605355722106,40.6053236070347,40.6058388354957,40.6060621994005,40.6060997417253,40.6064406336589,40.6064605972484,40.6068145620528,40.6068359695563,40.6069064426111,40.6069385485231,40.6069885870373,40.6070893934447,40.6071633760684,40.607205259801,40.6073194996768,40.6076248467802,40.6078341464356,40.608675662669,40.6087534175416,40.6087738838897,40.6094235400486,40.6094368366582,40.6087600147206,40.6086992087224,40.60862975409,40.608710013687,40.6087609323074,40.6087629488929,40.6089060573668,40.6089367303121,40.6088141310899,40.6088208548986,40.6089748774135,40.6089313863826,40.6094367499708,40.6094669156244,40.6094941922311,40.6094727123421,40.609551335121,40.60954543189,40.6094572855877,40.6094378226778,40.6100888929049,40.610109589457,40.6104305088604,40.6105155750761,40.6108834775449,40.6109284706933,40.6112666573381,40.6113357288087,40.6113931594926,40.6113420778482,40.611455026073,40.6115708516417,40.6116532236649,40.6118953851747,40.6127082875381,40.6132985420998,40.6133252111723,40.6133702383189,40.6135326872776,40.6135003332075,40.6134930825904,40.613958155055,40.613993630319,40.6144529693109,40.6146422685683,40.614888233399,40.6148052074812,40.6147919739918,40.6147787675893,40.6148033523939,40.6149014780134,40.6149199282147,40.6149324567371,40.6149388161878,40.6149388809906,40.6149189369133,40.6148942602078,40.6148651576932,40.6148319912163,40.6148063650452,40.614779078602,40.6147728186379,40.614722430734,40.614675250551,40.6146768305711,40.6146772205063,40.6144683287447,40.6143509474298,40.6140037143864,40.6138902096963,40.6135693546927,40.61355234522,40.6137302335499,40.6138590549775,40.6138453763124,40.6138197829392,40.6136180308037,40.6135403333358,40.6136171958229,40.6138078353667,40.6136261007912,40.6133285871969,40.61340281131,40.6133848602005,40.6132363964689,40.6132517840535,40.6133097996057,40.6136056127041,40.6135296807404,40.6134835208167,40.6134468340347,40.6128819393443,40.6129245653353,40.6129100373905,40.6128597385913,40.613450267087,40.6134246710421,40.6134691219989,40.6134904505059,40.613520542098,40.6134435892655,40.6118308445138,40.6111784554682,40.6111276566865,40.6111432240611,40.6110907540043,40.6110751947341,40.6110936305744,40.6110398507016,40.6110058232506,40.6109959208572,40.6110654000929,40.6110738942881,40.6111180777229,40.6102753430802,40.6102083940582,40.610124283596,40.6098065694399,40.6097948480504,40.6097825382017,40.6097698588146,40.6097570353818,40.6093272338009,40.6093174985393,40.6096676306587,40.6096628644463,40.6087859371204,40.6087917728424,40.6093043000659,40.6093113276688,40.6088665298833,40.608856219529,40.6088466969415,40.6088381747033,40.6088308430654,40.6088248656993,40.6084983090434,40.6080933582585,40.6081497790173,40.6080245809108,40.6080806942583,40.6084879462874,40.6083007475359,40.6082944590012,40.6082894068728,40.6082857410271,40.6082835702153,40.6082829500701,40.60828346764,40.6082672549711,40.6075888729273,40.6076539337654,40.6076453869077,40.6075013694187,40.6075447316676,40.6076105077085,40.6082568681995,40.6080429227903,40.6071740219358,40.6072431434162,40.6072293506406,40.607071236027,40.6070846678652,40.6071548528981,40.6080326417445,40.6079986579748,40.6079808362169,40.6079749039753,40.6079220777348,40.6077387974348,40.6073854138607,40.6072166240866,40.6071133237112,40.6069663569929,40.6067936582573,40.6067718340938,40.6062092523422,40.6053817785037,40.6053104238462,40.6039362526545,40.6039143513684,40.6039500059302,40.6033602216727,40.6032888837601,40.6028639195633,40.6027862134982,40.6027755049857,40.6027683227844,40.6027035782713,40.6027590122662,40.6027564787071,40.602872821727,40.6028778598195,40.6028881800501,40.6028844581063,40.6028504210127,40.6028393909776,40.6028681446828,40.6027557274091,40.6027511719481,40.6027432566448,40.6026902515068,40.6026684367292,40.6026641797859,40.6026638333349,40.60259677511,40.6026079147135,40.6025241817043,40.6027637777699,40.6028986903068,40.60291169069,40.6027656146779,40.6025018702001,40.6024941523278,40.6024689100275,40.6024567749681,40.6024253932301,40.6023669755652,40.6024468335641,40.6024421799559,40.6024756165467,40.6024867815816,40.6025527210977,40.6026346115506,40.6027850620121,40.6027692474432,40.6026438822437,40.6026364479725,40.6025675884661,40.6025666474658,40.6027542487176,40.6027402916835,40.6025090507809,40.6024960246633,40.6024607277663,40.6024625913531,40.6024393811553,40.6024310098244,40.6023492958734,40.6023105604036,40.6022908278168,40.6022584481983,40.602250351749,40.6022467736836,40.6022396477052,40.6022202559288,40.60248795356,40.6024911690055,40.6027086770165,40.6026947099864,40.6025074055747,40.6024532629461,40.6024227042768,40.6024847036406,40.6024345863744,40.6024320853244,40.6022144534231,40.6022062101667,40.6022000942777,40.6022000475843,40.6021908654864,40.602182748843,40.6021791377972,40.6021654144263,40.6021476292916,40.6021368889129,40.6021398089178,40.6021548419536,40.6021557036834,40.6021354884034,40.6022178711912,40.6022327622449,40.6022597359265,40.602275084478,40.6022833281228,40.6023644399555,40.6023921789073,40.6023860411629,40.6023725436155,40.6022978911655,40.6022898918512,40.6023244471742,40.6023028085564,40.6022894288186,40.6022782578443,40.6022939286424,40.6022887414161,40.6023215120344,40.6023204035801,40.6024393231039,40.6024504457434,40.6024508564167,40.602515972583,40.6025162094103,40.602531876853,40.6025334184123,40.6025365887735,40.6025400980263,40.6025427617149,40.6025455677351,40.6025488209501,40.6025521998192,40.6025548794941,40.6025580740821,40.6025607294953,40.6025653601719,40.6025604309871,40.6025164175162,40.6025320065939,40.6026832995322,40.6026796931991,40.6025494216934,40.6025403093036,40.6026741502693,40.6026733988092,40.6026068487114,40.6025929244346,40.60258967032,40.6025826247465,40.6025816924555,40.6025671965813,40.602566861501,40.6025621311065,40.6025613103284,40.6025443213109,40.6025428745,40.6025386893903,40.6025349549231,40.6025313041836,40.6025264997554,40.6025230274085,40.6025185989844,40.6025157973086,40.6025108951302,40.6025088635341,40.6025029041754,40.6025008334797,40.6024967185385,40.6024937859353,40.6024883691877,40.6024857342638,40.6024801678899,40.6024770703247,40.6024718969813,40.6024677422281,40.602464157749,40.6024602430599,40.6024587181299,40.6024566695284,40.6024549590184,40.6024528382112,40.6024501459058,40.6024483399614,40.6024461952189,40.6024445180638,40.6024424033118,40.6024406944537,40.6024384086742,40.6024374234798,40.6024347105927,40.6024332466192,40.6024330644265,40.6024289786963,40.6024268304951,40.6024238404451,40.6024330522595,40.6024989217383,40.602497814322,40.6023757110459,40.6023646421866,40.6023630641876,40.6024923380602,40.6024904832885,40.6023423548366,40.602348369481,40.6024032064486,40.6024068259582,40.602408348885,40.6024420687611,40.6023968685694,40.6022245407857,40.602220762095,40.6021687162498,40.6021663273742,40.6021648578586,40.6021646064759,40.6021516438462,40.6022089431025,40.6022067655079,40.6021284742225,40.6021317293011,40.6021392214222,40.6021603173055,40.6021854500984,40.6022131580821,40.6021554647298,40.6021474506622,40.6021247455727,40.6020504541757,40.6020275009834,40.6021503341867,40.6024184967246,40.6024188913276,40.6024372998626,40.6024420406007,40.6024438218832,40.6024460226356,40.6024495308342,40.6024521693295,40.6024540208917,40.6024574365035,40.602459192828,40.6024614555412,40.6024646391146,40.6024672122626,40.602470127927,40.6024726482135,40.6024759183346,40.602478969582,40.6024813461012,40.6024838603713,40.602486559778,40.6024892352396,40.6024916966528,40.6024953893363,40.6024971858164,40.6025010032981,40.6025013381567,40.6025049126586,40.6025055665948,40.6025108951596,40.6025133347525,40.6025166461334,40.6025185585754,40.6025218852311,40.6025232836673,40.6025279150104,40.602529994609,40.6025341843789,40.6025353491375,40.6025374918763,40.6025402848733,40.6025429405998,40.6025449259472,40.602548030342,40.6025500598851,40.6025528674683,40.6025555683672,40.6025584407473,40.6025614427393,40.6025645449284,40.6025659928204,40.6025687769324,40.6025711293167,40.6025743142307,40.602577111451,40.6025788070999,40.6025815335193,40.6025843018069,40.6025869825119,40.602589022781,40.6025922490232,40.6025939609227,40.6025977360093,40.6025997317336,40.6026025533094,40.6026773836625,40.6026773432202,40.6025248276693,40.6025238228268,40.6025694196495,40.6025779918616,40.602576203913,40.6025280936214,40.6025257959735,40.6025230344128,40.6025216459811,40.6025198514606,40.6025171274248,40.6025136830786,40.6025130046453,40.6025104455957,40.6025079192802,40.6025060315055,40.6025032727206,40.6025012161182,40.6024986543858,40.6024962629627,40.6024943736788,40.602492198914,40.6024897247271,40.6024881817251,40.6024852387716,40.6024831636953,40.602480969973,40.6024782975171,40.6024767772565,40.6024747000024,40.6024721126157,40.6024701829101,40.6024674185377,40.6024657060021,40.6024634278354,40.6024610107357,40.6024584744885,40.6024464141567,40.6024458298981,40.6024194931783,40.6021588283835,40.602148118188,40.6021445152654,40.6021467536831,40.6021481874947,40.6021485456307,40.6021500095938,40.6021503978699,40.6021518700833,40.6021523020214,40.6021537379478,40.6021542310471,40.6021555848955,40.6021561102791,40.6021576417803,40.6021581564444,40.6021595885554,40.6021601177178,40.6021618500713,40.6021623846742,40.6021638395104,40.6021643081776,40.6021659693309,40.6021663262753,40.6021678489654,40.6021684997395,40.6021697589149,40.602170521408,40.6021716899462,40.6021728558419,40.6021739292871,40.6021751253163,40.602175866702,40.6021768537911,40.6021779342944,40.6021790444619,40.6021800649861,40.6021809348842,40.602182264874,40.6021830434725,40.6021842524942,40.6021862076276,40.6021862465141,40.602187155778,40.6021881088817,40.6021893551132,40.6021903642205,40.6021914954273,40.6021922367614,40.602194133009,40.6021944315951,40.6021950012176,40.6021950747162,40.6022003535893,40.6022004631554,40.602204722658,40.6022100462244,40.6022706292128,40.6022713058473,40.602190766258,40.6021374940651,40.6021356791902,40.6021145813573,40.6021078822754,40.6020213760277,40.6020003024256,40.6019852274149,40.6019709641885,40.6019566693689,40.6019546603244,40.6019588780471,40.6019777383277,40.6019893772129,40.6020096855776,40.6020328526463,40.6020417727388,40.6020440073769,40.6020396090894,40.6020284965373,40.6020054338454,40.6019924407801,40.6019793941798,40.6019716104516,40.6019571718541,40.6019287837607,40.6018761396736,40.6018437674106,40.6018012024864,40.6017447149137,40.6016922111089,40.6016356084143,40.6016314229658,40.601625205886,40.6016310724392,40.6016652403797,40.6017054507301,40.6017253878696,40.6017351692083,40.6017691166266,40.6018171101909,40.6018572932275,40.6019158037965,40.6019538505618,40.6019877977862,40.6020017477726,40.6020499155636,40.6020697480136,40.6020695116221,40.6020833549097,40.6021256916966,40.6021497186604,40.6021495435349,40.6021353054651,40.6021251298634,40.6021511007478,40.6022012121153,40.6022355910174,40.6022697407718,40.6022734522702,40.6022892212107,40.6022971018192,40.6022566014613,40.6022262763017,40.6022300414964,40.6022902140297,40.6023343198075,40.6023783895445,40.6023761721379,40.6023556895657,40.6023494273438,40.6023613005013,40.6023349848574,40.6023166035063,40.6023486335157,40.6024068106199,40.602428496439,40.60244834495,40.6024279142033,40.6024437610969,40.6024777426967,40.6024956123681,40.6024934483906,40.6025255574537,40.6025152931922,40.6025312896817,40.6025635052415,40.6025814628931,40.6025651660159,40.6025690339689,40.6025930344699,40.6026028751792,40.6025806234839,40.6025965942611,40.6025743249713,40.6025578588264,40.6025270396173,40.6025570092547,40.6025306683928,40.6024834878363,40.6025250466941,40.6025747220117,40.6026528247715,40.6026707723209,40.6026544027817,40.6026218861974,40.6025934510427,40.6025511043891,40.6025387536583,40.6025221089761,40.6024997693507,40.6024634112469,40.6024150843691,40.6024391806944,40.6024894231927,40.6025477145449,40.6025979376817,40.6025836363906,40.6025632650553,40.6025571076754,40.6025869170525,40.6026995036635,40.6026889041851,40.6027170504699,40.6027169075875,40.6027328894569,40.6027733076793,40.6027973864836,40.6028579244172,40.6028860170261,40.6028857305011,40.6029661741105,40.6030347735155,40.6030345763241,40.6030302403613,40.6030541767776,40.6030824115252,40.6030781467688,40.6031827216233,40.6031863932464,40.6032060819329,40.6031895449003,40.6031569913709,40.6032011892681,40.6032049324064,40.6031841841866,40.6031838237152,40.6032442536514,40.6032843114857,40.6032717329438,40.603243011613,40.6032423990735,40.6033345527554,40.6034630576613,40.6035018435102,40.6035302562173,40.6033337157131,40.6031395496582,40.6029479286463,40.6027590210335,40.6025729927906,40.6023900073572,40.6022102254256,40.6020338050139,40.6018609011165,40.6016916656375,40.6015262472569,40.6013647913002,40.6007224257862,40.6006172967681,40.6005394997349,40.6004421878207,40.60034986915,40.6001766530602,40.6001094747396,40.5999919367527,40.5998486122727,40.5997067538537,40.5995702245892,40.5995378517975,40.5992166619952,40.5990119106525,40.59893526048,40.5987839495326,40.5986470931164,40.5985768292878,40.5981782684278,40.5980803579686,40.5979142106879,40.5976683271628,40.5975857941684,40.5974865679341,40.5974482849823,40.5972752448865,40.5971330378058,40.5968897933079,40.596660945946,40.5965549837345,40.5965117752097,40.5964577740419,40.5963784851089,40.5961806050299,40.5958255678822,40.5956482055085,40.5955388143861,40.5955303424915,40.5952479116488,40.5951386420114,40.5949539854935,40.5946582059737,40.5943617534459,40.5940657889468,40.5931418129814,40.5927122640616,40.5926706050014,40.592665353465,40.5924072924776,40.592146975816,40.5921156518264,40.5918853203784,40.5916232749262,40.5913053973443,40.5912503951971,40.5909871660531,40.5906671631846,40.5903461214503,40.5900256519061,40.5897074315636,40.5893931542987,40.5890845033947,40.5887831268698,40.5884906201229,40.588208476483,40.5879380792242,40.5876806472683,40.5874372865109,40.5872088873254,40.5869961892243,40.5867997352066,40.5866198896791,40.5863656846476,40.586417452337,40.5864279659366,40.5866973574714,40.5867355921057,40.5867942064226,40.5868567234545,40.5869096652388,40.5869621255744,40.5870190309566,40.5870342384174,40.5870452676639,40.5870528552334,40.5870521142803,40.5870452188461,40.5870297365494,40.5870151085554,40.5870068933694,40.5869938728654,40.586988204912,40.5869859543062,40.5869885976983,40.5869961204242,40.5870139360131,40.587041561345,40.5870638504099,40.5871219332312,40.5871469509465,40.5871572511471,40.5871761189513,40.5872133479352,40.5872363191327,40.5872415348799,40.587262625388,40.5872883959831,40.5873051170384,40.58732083778,40.587353495323,40.5874505028999,40.5874983729816,40.5875209965069,40.5876008133338,40.5876710826952,40.5877002632586,40.58779627474,40.5879089767518,40.5879925199568,40.5880526135931,40.5881226087026,40.5881682702251,40.5882168766571,40.5882932073502,40.5884068312272,40.5884674333711,40.588523359866,40.588624886986,40.5887183248473,40.5887828409391,40.5887921704262,40.5887980699807,40.5888022589332,40.5888088909413,40.588825807326,40.5888353621585,40.5888402493375,40.5888559336521,40.5888694241856,40.5888863684762,40.5888925069634,40.5888964256647,40.5888998430154,40.5888963984273,40.5888939366353,40.5889571700909,40.589008160573,40.5891101253604,40.5891657594871,40.5892159895817,40.5892395163739,40.5892544762274,40.5892668976308,40.5892696995174,40.5892729187775,40.589284238869,40.5892992203183,40.5893079240117,40.5893166288774,40.5893247058748,40.589332281345,40.5893538578783,40.5894409708878,40.5895234203245,40.5895413360023,40.5895536199744,40.5895617412294,40.5895723169482,40.58957894896,40.5895853294542,40.5895919335467,40.58959314794,40.5896029219387,40.5896137047494,40.5896365110076,40.5897272474354,40.5897677348628,40.5897900727755,40.5898062834487,40.5898225026256,40.5898406892375,40.5898554361776,40.5898618200873,40.5898664683259,40.5898657239558,40.5898666629945,40.5898732665815,40.5898855381314,40.5899024868488,40.5899216533444,40.5899329613493,40.5899486781605,40.5899557836101,40.5899643345437,40.5899775303013,40.5899875791503,40.5899976574302,40.5900055436763,40.590009471382,40.5900207431277,40.5900373914778,40.5900648260487,40.5900942285556,40.5901189458845,40.590137328162,40.5901480939536,40.5901485634642,40.5901566329502,40.590172070314,40.5902098500165,40.5902209105975,40.5902317208325,40.5902503938137,40.5902683225871,40.5902911407633,40.5903389688079,40.5904279978046,40.5904724080131,40.5905107420246,40.5905357393038,40.5905487438091,40.5905678505283,40.5905832883963,40.5905859011882,40.5906028964769,40.5906122167903,40.5906316228917,40.5906370228345,40.5906512509038,40.5906652143559,40.5906777134107,40.5906919368903,40.5907135367613,40.590728266696,40.5907390570015,40.5907613528763,40.5907834147494,40.590807943014,40.5908874321935,40.5909193203333,40.5910566234351,40.5911087530185,40.591136033276,40.5911590000519,40.5911870193409,40.5912156151751,40.5912430204739,40.5912653720878,40.5912912368956,40.5913721890998,40.5913930989128,40.59141584681,40.5914258682505,40.5914450319521,40.5914559792356,40.5914676012618,40.5914748772397,40.5914930085187,40.5915086006134,40.5915955450695,40.591608481627,40.5916315304964,40.5916536303257,40.5916845217829,40.5917120924049,40.591740628145,40.5917724125612,40.5917961789499,40.591817341192,40.5918412718948,40.5918631412766,40.5918807230292,40.5918911219639,40.5918988736361,40.5919210189821,40.5919217161345,40.5919371203269,40.5919624015271,40.5920046244744,40.5920225570786,40.5920292309297,40.5920412171691,40.5920460857131,40.592059037741,40.5920663803508,40.592077648971,40.5921214131483,40.5921651092205,40.5922087294806,40.5922680627818,40.5922780488186,40.5922878982145,40.5922975801391,40.5923070639219,40.5923163177205,40.5923253123704,40.592329837815,40.5923339757624,40.592337671046,40.5923408743594,40.5923435454352,40.5923456486948,40.5923474668998,40.5923486473099,40.5923491767909,40.5923490502474,40.5923493458593,40.5923502546727,40.5923517395445,40.5923537402183,40.5923561756812,40.5923589460062,40.5923682776214,40.5923728020153,40.5923771397359,40.5923812276504,40.5923895033153,40.5923979570403,40.5924065353952,40.5924151896367,40.5924238698458,40.5924325220771,40.5924418995685,40.5924510889048,40.5924600456799,40.5924687268161,40.5924770878992,40.5924848166086,40.5924928948254,40.5925012732717,40.5925098991517,40.5925187169979,40.5925758494856,40.5925888124428,40.5926018801615,40.592615024159,40.5926270093974,40.5926389105881,40.5926506964056,40.5926623372064,40.5926738001611,40.5926850537851,40.5926994546985,40.592714018027,40.5927287241754,40.5927435478524,40.5927584642674,40.5927734526503,40.5927884878745,40.5928793398937,40.5928897595064,40.5929000588911,40.5929102088892,40.5929201800061,40.5929299435843,40.5929394704609,40.5929709269436,40.5929772179514,40.592983854847,40.5929907875139,40.5929979654996,40.5930053350088,40.5930106500101,40.5930157960901,40.5930207023594,40.5930252989266,40.5930295239316,40.5930333188625,40.5930409380184,40.5930490001289,40.5930574473611,40.5930662210508,40.5930734500802,40.5930808941295,40.5930885051049,40.5930962339065,40.5931040319452,40.5931118479511,40.5931271798723,40.5931424878547,40.5931577291784,40.593172860964,40.5931789959,40.593185514471,40.5931923756591,40.593199537607,40.5932069576161,40.5932145906422,40.5932223899568,40.5932303096687,40.593238188716,40.593246019954,40.5932537584778,40.5932613593817,40.5932687762477,40.5932759665065,40.5933155434321,40.5933249730393,40.5933346220905,40.5933444411498,40.5933543786073,40.5933643823557,40.5933744017978,40.5933908271112,40.5934073924452,40.5934240721724,40.5934304300294,40.5934368456314,40.5934432727382,40.5934496619286,40.5934559659639,40.5934635975113,40.5934714408377,40.5934794626163,40.5934876254995,40.5934958909665,40.5935129740355,40.5935300666216,40.5935471432593,40.593564183173,40.5935832442532,40.5936023499395,40.593621473931,40.5936405909296,40.5936596746333,40.5936715531166,40.5936832812343,40.5936948298258,40.5937061714075,40.5937172798336,40.5937659675571,40.5937856885611,40.5938054942679,40.5938253422892,40.5938417078416,40.5938580798127,40.5938744337442,40.5938907463508,40.5939069956868,40.5939518079517,40.5939631756661,40.5939744340706,40.593985554693,40.5939965077194,40.594007265516,40.5940409748853,40.5940745741535,40.5941080402071,40.594116883233,40.5941227472703,40.5941257970529,40.5941347399583,40.5941436730805,40.594152554705,40.594161344618,40.5941923082201,40.594196580813,40.5942008287105,40.5942049745201,40.5942089452201,40.5942126699734,40.5942165311979,40.5942207869477,40.5942253754481,40.5942302280492,40.5942352744167,40.5942468787931,40.5942586215214,40.5942704697703,40.5942823878617,40.5942943394459,40.5943062896743,40.5943182020284,40.5943300403175,40.5943417700229,40.5943533561274,40.5943939944811,40.5944140802288,40.5944342701383,40.594454549632,40.5944749054724,40.5944953210713,40.5945069542889,40.5945184443672,40.5945297599699,40.5945408697596,40.5945517434003,40.5945623530708,40.5945726717844,40.594580369325,40.5945874405159,40.5945938457699,40.5945995527051,40.5946024183269,40.5946058076975,40.5946096522272,40.5946138744544,40.5946183842045,40.5946230898017,40.5946684855841,40.5946828307122,40.5946974364348,40.5947122787878,40.5947273346393,40.5947425793587,40.5947579879745,40.5947735355194,40.5947969450716,40.5948204994017,40.5948441815876,40.5948679745366,40.5948918613268,40.5949158248653,40.5949274352513,40.5949389342717,40.5949502959553,40.5949614934899,40.5949725044176,40.5949833022593,40.594993864053,40.5950041683439,40.595014188146,40.5950239043481,40.5950359662008,40.595048546941,40.5950616138747,40.5950751329721,40.5950854724728,40.5950961747725,40.5951072091936,40.5951185422108,40.5951301408094,40.5951459217951,40.5951619258705,40.5951781029324,40.5951825916871,40.5951871654973,40.5951917585205,40.5951963015666,40.5952007288082,40.5952049749265,40.5952089772906,40.5952138798107,40.595219068146,40.5952244915621,40.5952300911098,40.5952358098451,40.5952415872982,40.595247366511,40.5952550529861,40.5952625590759,40.5952698159044,40.595276763975,40.5952833387527,40.5952976413976,40.5953116191409,40.5953252483482,40.5953410996178,40.5953566330334,40.5953718239582,40.5953837813363,40.5953961257797,40.5954088274536,40.5954218545074,40.5954351791173,40.5954487659227,40.5954625849222,40.5954760218853,40.595489324904,40.5955024681702,40.5955154287256,40.595528180594,40.5955406986355,40.5955531217465,40.5955652199559,40.595576964599,40.595588328352,40.5955992825464,40.59565996411,40.5956727460983,40.5956861571533,40.5957001764739,40.5957147842733,40.5957264147179,40.5957385298231,40.5957511066176,40.5957641248134,40.595771680034,40.5957788998055,40.5957857353468,40.5957921400501,40.5958028947491,40.5958140541455,40.5958256051585,40.5958306164362,40.5958360096787,40.5958417374403,40.595847741727,40.5958510188814,40.5958538810054,40.5958562668865,40.5958581272005,40.595859424005,40.5958630929313,40.5958673789689,40.5958722376616,40.5958776185292,40.5958834675752,40.5959031382097,40.5959232419068,40.5959437667586,40.5959465024705,40.5959496577351,40.5959531604606,40.5959569305192,40.5959608822718,40.5959649274082,40.5959689729449,40.5959771178065,40.5959946642448,40.5960028185064,40.5960108383028,40.5960186834179,40.5960263166437,40.5960336996028,40.5960407954177,40.5960475698921,40.5960539908374,40.5960600235475,40.5960648320463,40.5960700975572,40.5960757957558,40.5960818998096,40.596088380543,40.5960980155638,40.5961081631159,40.5961187559833,40.5961298798242,40.5961407703933,40.5961513747301,40.596156195303,40.5961606464953,40.596164670968,40.5961682177406,40.5961712390106,40.596174947002,40.5961789501583,40.5961831774124,40.5961875456472,40.5961919781167,40.5961963880401,40.596206592041,40.5962168615389,40.5962271275136,40.5962366819675,40.5962460421173,40.5962551788004,40.5962640611794,40.5962714120017,40.5962783153771,40.5962847339132,40.5962906285363,40.5962969988147,40.596303707825,40.5963107165063,40.5963179794374,40.5963254508643,40.5963693203703,40.5963768981979,40.5963845901385,40.5963923402308,40.5964000928524,40.5964178270892,40.5964355422923,40.5964532066295,40.5964602983585,40.5964673771179,40.5964743628216,40.5964811691793,40.5964877154172,40.5964941242486,40.5965002182397,40.5965059675507,40.596511338312,40.5965163043607,40.5965208393641,40.5965249173246,40.5965438178234,40.596560440808,40.5965773773388,40.5965946046223,40.5966121037187,40.5966298530084,40.5966362981583,40.5966428903373,40.5966495846363,40.5966563260995,40.5966630642996,40.5966697474705,40.5966763241891,40.5966864432726,40.5966966504,40.5967068874451,40.5967170944315,40.5967272133885,40.5967406683257,40.5967538840264,40.5967668286453,40.5967794676552,40.5967868413268,40.596793935092,40.5968007115704,40.5968071288531,40.5968131513983,40.5968187461697,40.5968405692023,40.5968627760048,40.5968853526639,40.5968900975077,40.5968944717893,40.5968984205129,40.5969018898516,40.5969048392053,40.5969072261294,40.5969145734435,40.5969222908176,40.5969303380206,40.5969386790143,40.5969472740728,40.5969560804615,40.5969729765785,40.5969896866271,40.5970061901629,40.5970117585071,40.5970176518068,40.597023810225,40.5970301761085,40.5970366879587,40.5970432831083,40.5970499007375,40.5970582070034,40.5970667928511,40.5970756038532,40.5970845900998,40.5970936939745,40.5970969215161,40.5970999771823,40.5971027803595,40.5971052505845,40.5971073227958,40.597108940634,40.5971100586194,40.597110647688,40.5971106923294,40.5971149087454,40.5971200207938,40.5971257458375,40.5971320790024,40.5971390152444,40.5971465491879,40.5971477127165,40.597149433296,40.5971516911005,40.5971544607809,40.5971577116246,40.5971614073972,40.5971655050021,40.5971699589971,40.5971747210992,40.5971781835899,40.5971812755588,40.5971839024505,40.5971859879514,40.5971874693105,40.5971883042029,40.5971884667174,40.5971903551983,40.5971928111523,40.5971958275153,40.5971993953753,40.597203504823,40.5972171426807,40.5972313186516,40.5972460111043,40.5972612020972,40.5972760960775,40.5972914387759,40.5973072162743,40.5973234154956,40.5973400236939,40.5973570267863,40.5973693624049,40.5973820783595,40.5973951444764,40.5974085233799,40.5974221822196,40.597436085634,40.5974416261964,40.5974474538741,40.5974535182151,40.5974597625757,40.5974661286414,40.5974725601133,40.5974789975153,40.5974877363253,40.5974962566794,40.5975045284347,40.597512521955,40.5975155241676,40.5975185857694,40.5975215869759,40.597524412002,40.5975269525793,40.5975291104726,40.5975308021683,40.5975319615635,40.5975325453287,40.597535207322,40.5975372984625,40.5975388187283,40.5975395541576,40.5975409624428,40.5975430270955,40.5975457266085,40.5975490324347,40.5975529071604,40.5975593799682,40.5975663243488,40.5975736940276,40.5975814442434,40.597589523202,40.597597880286,40.5976064606929,40.5976101566859,40.5976140404091,40.5976180190298,40.5976219987246,40.5976258833375,40.5976295807509,40.5976330042192,40.5976360732061,40.5976401200262,40.5976446343608,40.5976495670033,40.5976548613673,40.5976604593559,40.5976662973362,40.5976723103285,40.597678431167,40.5976860816143,40.5976936290641,40.5977010043156,40.5977081408393,40.5977149749504,40.5977223449008,40.5977301962432,40.5977384756664,40.5977471343899,40.5977561162627,40.5977626910376,40.5977694678005,40.5977763971174,40.5977834307277,40.5977905165233,40.5977933565354,40.5977966072065,40.597800161047,40.5978038959702,40.5978076888658,40.5978114120736,40.5978149404266,40.5978230256686,40.5978305093317,40.5978373310459,40.5978408367979,40.5978448576561,40.5978493501806,40.5978542682594,40.5978595574004,40.5978703381742,40.5978811471057,40.597891919029,40.5979006610852,40.5979092879036,40.5979177653038,40.5979260604372,40.5979341436408,40.597941981393,40.5979495457025,40.5979568052222,40.5979623952288,40.5979676212239,40.5979724310695,40.5979767752995,40.5979806094707,40.5979838955015,40.5979836174641,40.5979842045262,40.5979856418207,40.5979914607844,40.5979975309163,40.5980037369299,40.5980099640578,40.5980167874412,40.598023552241,40.5980302093626,40.5980367132272,40.5980430189237,40.5980588116671,40.5980742975146,40.5980894583629,40.5981042759403,40.5981187344866,40.5981328158961,40.5981465040733,40.5981597820845,40.598163549403,40.5981668857712,40.5981697348453,40.5981720530011,40.5981738009712,40.5981749540566,40.5981754919089,40.5981754055764,40.5981746978293,40.5981758259382,40.598177522702,40.5981797765163,40.5981825736057,40.5981858985142,40.5981897304309,40.5981940461986,40.5981988211562,40.5982041424684,40.5982090865692,40.5982135926014,40.5982176007036,40.5982210595544,40.598223926539,40.598226163057,40.5982259054219,40.5982262718229,40.5982272507462,40.5982288020385,40.5982308629381,40.5982333521024,40.5982361707814,40.5982475807905,40.5982589599049,40.5982702592098,40.5982766061501,40.5982830409306,40.598289515307,40.5982959731601,40.5983023662375,40.5983086407546,40.5983147477775,40.5983206368659,40.5983262619288,40.5983360735805,40.5983455207019,40.5983545747913,40.5983632076837,40.5983751254452,40.5983874754515,40.5984001963577,40.5984209888317,40.5984420973181,40.5984634859526,40.5985149684967,40.5985256154405,40.5985359160917,40.5985458303872,40.5985553127327,40.5985624218982,40.5985698698809,40.5985776275078,40.5985856662841,40.598593957713,40.5986024704532,40.5986111724946,40.5986309756976,40.5986511498252,40.5986716702402,40.5986795500586,40.5986877410818,40.5986962017408,40.5987048856142,40.5987137484606,40.5987227418499,40.5987575982662,40.5987617021946,40.5987658687449,40.5987699947213,40.5987739759047,40.5987777144279,40.5987811159303,40.5987840940736,40.5987880576176,40.5987915587618,40.5987945714955,40.5987970718231,40.5988001801492,40.5988039101779,40.5988082255007,40.5988130816659,40.5988184320497,40.5988242203191,40.5988327687963,40.5988410081438,40.5988489135484,40.5988634277676,40.5988650966425,40.5988672422018,40.5988698228366,40.5988727818606,40.598876054395,40.5988795723809,40.5988832617414,40.5988931716715,40.5989028654053,40.5989122821104,40.5989161974233,40.5989196190528,40.5989225122691,40.5989248458604,40.5989278165216,40.5989299809228,40.5989313225732,40.5989326420715,40.5989345175675,40.5989369169926,40.5989397985707,40.5989431156691,40.5989656087355,40.5990188229919,40.5990421949351,40.5991107979863,40.5991277301048,40.5991618479378,40.5991800958732,40.599190883786,40.5992027010851,40.599226180821,40.5992511704841,40.5992577943357,40.5992823095547,40.5993138453146,40.5993242996941,40.5993217953096,40.5993124879575,40.5993843290991,40.5993937907503,40.5994033248813,40.599421614484,40.5994508780447,40.5994616901424,40.5994539542965,40.5994550778033,40.5994572836759,40.5994664960574,40.5994757301474,40.599486746689,40.599490950323,40.5994968897488,40.5994987918401,40.5995034980302,40.5995139155933,40.599523012777,40.5995275550898,40.5995330613027,40.5995365560147,40.5995449677745,40.5995484120326,40.5995471098665,40.5995456667807,40.5995474565114,40.5995542166704,40.5995982681453,40.5996180671538,40.599625812483,40.5996343885941,40.5996372838107,40.599635837954,40.5996269567252,40.5996233955203,40.5996254373933,40.5996389788408,40.5996653109691,40.5996825855803,40.5996936541082,40.5996995912621,40.5997126105543,40.5997261902824,40.5997376186938,40.5997495040202,40.5997583937209,40.5997662932258,40.5997735898206,40.5997852005868,40.5997975282643,40.5998121362262,40.5998275172727,40.5998373015522,40.5998431326403,40.5998452025335,40.599842907232,40.5998341382939,40.5998256696942,40.5998233519856,40.599825779537,40.5998372851251,40.5998444910452,40.5998509031265,40.5998613514961,40.5998741833708,40.5998906297611,40.599898177327,40.5999063817703,40.5999175500789,40.5999237285175,40.5999282082897,40.5999291177736,40.5999205671633,40.5998998074473,40.5998921600665,40.5998890956272,40.5998897121538,40.5998932364814,40.5998977724597,40.5999038751463,40.599908001254,40.5999140982898,40.5999208784932,40.5999283475451,40.5999360950405,40.599942501402,40.5999674574353,40.5999886707848,40.6000034388945,40.6000165479527,40.600034568531,40.6000519311544,40.6000626769407,40.6000790369875,40.6000906107592,40.6001019835908,40.6001118119421,40.6001241900964,40.6001805524302,40.6002026438654,40.6002151910605,40.6002293902754,40.6002437579857,40.6002773766267,40.6003190402727,40.6003406809759,40.6003928264515,40.6004043069916,40.6004100767232,40.6004171242317,40.6004183452104,40.6004173381387,40.6004115021527,40.600401791076,40.6003880999188,40.6003816037802,40.6003835344115,40.6003917246969,40.6004055691369,40.6004183728677,40.6004342291698,40.6004454750927,40.6004491352179,40.6004462104469,40.6004388700781,40.6004386313874,40.6004428894166,40.6004477496977,40.6004694319679,40.6004855179025,40.6004991047388,40.600509923917,40.6005142660919,40.6005190707791,40.6005220768454,40.6005263134939,40.6005357960547,40.6005444484792,40.6005721265677,40.6006196956186,40.6006370873124,40.6006706631393,40.6006904466931,40.6007044673298,40.6007320475991,40.6007440029159,40.6007553761889,40.6007680108418,40.6007868244239,40.6007963900694,40.6008002998752,40.6007982221689,40.6007917276476,40.6007761602432,40.6007723518171,40.6007733498983,40.6007954640243,40.600807559613,40.6008123507502,40.6008143962765,40.6008171226968,40.6008239920609,40.6008562924545,40.6008678025817,40.600873853969,40.6008735708235,40.6008693885155,40.6008608106708,40.6008605570765,40.6008588979926,40.6008615407576,40.6008745848695,40.6008792172378,40.6008806121349,40.6008874550123,40.6009022025942,40.6009051957779,40.6009088793992,40.6009213530301,40.6009276188832,40.6009317105772,40.6009360191682,40.6009424592947,40.6009445298374,40.6009458879438,40.6009513989484,40.6009554879871,40.6009606519388,40.6009681028392,40.600972667879,40.6009768554629,40.6009836990186,40.6010006981671,40.6010119035621,40.6010147658105,40.6010120042918,40.6010041932712,40.6009915781002,40.600978298297,40.6009467887216,40.6009402302656,40.6009366678039,40.6009351715454,40.6009330123273,40.6009278847535,40.6009220667058,40.6009184953713,40.6009203112144,40.6009195366127,40.6009177167398,40.600913816442,40.6009067622451,40.6009023470841,40.6008999436846,40.6008973940834,40.6009021795999,40.600909132568,40.6009380186543,40.6009519651292,40.6009603924034,40.6009657737034,40.6009725324335,40.6009794094368,40.6009862364957,40.6009927900387,40.6009982197038,40.6009980910488,40.6009952437157,40.6009914688453,40.6009811888183,40.6009791418177,40.6009820062036,40.6009919298043,40.6010023973993,40.6010233985573,40.6010306436524,40.6010352767083,40.6010372714061,40.6010407531008,40.6010476400509,40.6010544785394,40.6010631609721,40.6010675646604,40.6010686472176,40.6010613328313,40.6010428809031,40.6010302721673,40.6010282267999,40.6010352979595,40.6010424962128,40.601055674786,40.6010720655443,40.6010868156967,40.6010980286803,40.6011123250666,40.6011182711678,40.601119597385,40.6011146370015,40.6011050667021,40.6010902343138,40.601084504871,40.6010805345489,40.6010826904354,40.6010865218482,40.6010878388048,40.6010912748522,40.6010961620975,40.6010994542539,40.6011019531497,40.6011056829053,40.6011216446288,40.6011501754598,40.6011825222757,40.6012029084785,40.6012144648065,40.6012283051259,40.6012470381945,40.601260143587,40.601282675591,40.6013068909399,40.6013177478893,40.6013193282368,40.6013110198857,40.6012989474867,40.6012811946104,40.6012723090652,40.601265517807,40.6012611426737,40.6012615133582,40.6012689633931,40.6012815510196,40.6012933915802,40.6013031681825,40.6013104732254,40.6013145412037,40.6013166641199,40.6013161792953,40.6013286316112,40.6013457729869,40.6013601699074,40.6013692461149,40.6013737058126,40.6013923374014,40.6014093467919,40.6014200596726,40.6014285688348,40.6014409200432,40.6014486623325,40.6014562686781,40.6014637409032,40.601468032197,40.6014710428115,40.6014722611597,40.6014712009485,40.6014723901786,40.6014752776424,40.6014962703589,40.6015001485865,40.6015021343287,40.6015024493126,40.6015045522457,40.6015093958298,40.6015205325913,40.6015319389191,40.6015405630003,40.6015494842731,40.6015593099279,40.6015734996015,40.6015833868017,40.6015874866664,40.6015895031562,40.6015931160093,40.6015977412112,40.60160741472,40.6016247729296,40.6016460863542,40.6016655666954,40.6016712321382,40.6016711285922,40.6016664123396,40.6016567297043,40.6016478166016,40.6016450498895,40.6016450639639,40.601645848732,40.6016480582321,40.6016541087583,40.6016643291277,40.6016753423305,40.6016869293862,40.6016981027091,40.6017070033668,40.601708301013,40.6017013860067,40.601700357418,40.6017030022362,40.6017091589255,40.6017181406029,40.6017314829927,40.6017384266384,40.6017487667922,40.601760772815,40.6017746518424,40.6017930066733,40.601804477278,40.6018129033375,40.6018241090858,40.6018704187798,40.6019034664338,40.6019145922976,40.6019186596984,40.6019199831393,40.6019236541412,40.601922535647,40.6019173248088,40.6019083792808,40.6018981410845,40.6018883985441,40.6018701801637,40.6018561343936,40.6018498283034,40.6018477260505,40.6018468900196,40.6018427034138,40.6018350823287,40.6018243835261,40.6018118425576,40.6018000645891,40.6017911444196,40.6017788568333,40.6017700584588,40.6017706214871,40.6017741463992,40.6017786538768,40.6017852489742,40.6018021130333,40.6018101616512,40.601815798401,40.6018166871228,40.601813923624,40.6018063301717,40.6017865298651,40.6017528504635,40.6017360397393,40.6017305471218,40.6017264431821,40.6017226631048,40.6017193521877,40.6017189777665,40.6017204646325,40.6017208232369,40.6017264028935,40.6017310991464,40.6017380723581,40.6017511397644,40.6017585799812,40.6017599562662,40.601758179754,40.6017533560952,40.6017518265652,40.6017550413115,40.6017609742228,40.6017627322858,40.6017611176189,40.6017558771348,40.6017374111982,40.6017275930104,40.6017253500565,40.601726810385,40.6017475615253,40.6017538017207,40.6017572434463,40.6017561551287,40.6017518259953,40.6017291214133,40.6017138771429,40.6017080389963,40.6017087572888,40.6017145019732,40.6017218348659,40.6017280168409,40.6017301912389,40.6017282798578,40.6017257891875,40.6017189630916,40.6017035802517,40.6016837650615,40.6016724161261,40.6016640228419,40.6016537333567,40.6016437421925,40.601635172733,40.6016252248766,40.6016139858012,40.6016068158936,40.6016008846712,40.6015970684983,40.6015890829286,40.6015822540956,40.6015753989131,40.6015632037726,40.6015606888542,40.6015618810812,40.6015651609662,40.6015695413979,40.6015738363718,40.6015791407413,40.6015835911638,40.6015884501949,40.6015936675089,40.6015966643468,40.6016071385335,40.6016083787616,40.6016066571176,40.6016028797454,40.6016008011231,40.6016017123905,40.601602101162,40.6015986236914,40.601592236485,40.6015755597379,40.6015545702657,40.6015193668312,40.6015117123325,40.6015015128357,40.6014850429415,40.6014569162588,40.601433553006,40.6013927984978,40.6013661385764,40.6013480359697,40.6013346997873,40.6013208152776,40.6012887889573,40.6012558026134,40.6012407655963,40.6012252921482,40.6012028570995,40.6011936967414,40.6011884906705,40.6011877559367,40.6011881717444,40.6011868577959,40.6011834585819,40.6011746256289,40.6011641456444,40.601158935881,40.6011575415562,40.601158262546,40.6011601321256,40.601159947599,40.6011555622577,40.6011447274058,40.6011354810121,40.6011207427054,40.6011100649042,40.6011011152462,40.6010942256163,40.6010877527499,40.6010858655007,40.6010864477233,40.6010876361746,40.6010888235133,40.601088277651,40.6010873220578,40.6010793934601,40.6010560159656,40.6010305211062,40.6010176769486,40.6010077132288,40.6009991490938,40.6009923419546,40.6009836703534,40.6009770885414,40.600971907786,40.6009631366629,40.6009551325497,40.6009464117823,40.60092348005,40.6008911051327,40.6008823504981,40.6008707381225,40.6008662630781,40.6008639792585,40.6008639168153,40.6008655290648,40.600867222176,40.6008660352834,40.6008617241742,40.6008551624373,40.6008389659852,40.600823323809,40.6008152034036,40.6008077441708,40.6008021258817,40.6007964817446,40.6007894905185,40.6007755830978,40.6007608184594,40.6007222287917,40.6007040860181,40.6006975549493,40.6006910545722,40.600687081809,40.6006843451245,40.600680068288,40.6006720043868,40.6006550489302,40.6006464037169,40.6006324335882,40.6006078914339,40.600597790796,40.600592440209,40.6005821527401,40.6005769719677,40.6005747609888,40.6005770002572,40.6005794829576,40.6005825357521,40.6005873721064,40.6005894616999,40.6005889735962,40.6005840121808,40.6005763058718,40.6005644285426,40.6005360080785,40.6005256381731,40.6005158971959,40.6005007717862,40.6004691665656,40.6004409417214,40.6004247421132,40.6004138708165,40.6004056927181,40.6003951831182,40.6003834152566,40.6003682433236,40.6003564992492,40.6003477196488,40.6003405623758,40.6003368640503,40.6003289264404,40.6003194963154,40.6003125313342,40.6003022449699,40.6002904475922,40.6002729387402,40.60023264771,40.6002218603923,40.6002102786498,40.6001982056389,40.6001864647853,40.6001762862361,40.6001561201483,40.6001345265675,40.6000902679652,40.6000340699141,40.5999881932765,40.5999757896071,40.5999669291945,40.5999606196254,40.5999546424126,40.5999482514247,40.5999373599081,40.5999287465293,40.599908818611,40.599900420447,40.5998925447531,40.5998842905438,40.5998760910415,40.5998724415094,40.5998584475785,40.5998270691614,40.5998189450786,40.5998106050305,40.599803201149,40.5997946749048,40.5997894126408,40.5997823652344,40.5997696606461,40.5997431249441,40.599730145228,40.5997222738195,40.5997155860556,40.5997123595224,40.599709106439,40.5997014312285,40.5996946287776,40.5996812387204,40.5996661528087,40.599657928548,40.5996499342073,40.5996489620738,40.5996465603193,40.5996463298272,40.5996480219977,40.5996508719205,40.5996551776721,40.5996572960462,40.5996627689808,40.5996670266743,40.5996756210933,40.5996825615424,40.5996871383516,40.5996902367826,40.5996958607826,40.5997013503523,40.5997101383695,40.5997158535881,40.5997248660577,40.5997378088798,40.5997443778541,40.5997444427383,40.5997369563694,40.5997255986892,40.5997093301919,40.5997031607714,40.5997000945222,40.5997012335792,40.5997082170372,40.5997136624721,40.5997145949631,40.5997191723106,40.5997236027324,40.5997293994599,40.599738570279,40.5997481775155,40.5997631922612,40.5997726380849,40.5997800543849,40.5997886304441,40.5997934168665,40.5997934013555,40.599786766871,40.5997854010344,40.5997890329417,40.5997942033664,40.5997955846586,40.5997887078824,40.5997862185058,40.5997906500693,40.5997981519376,40.599804941923,40.5998114929657,40.5998187038058,40.5998214824233,40.5998270088596,40.5998353907644,40.5998464389001,40.5998637051081,40.5998881156193,40.5999033408757,40.5999246057903,40.599947732624,40.5999787137975,40.6000005718665,40.6000278734749,40.6000409493982,40.6000483167527,40.6000499415165,40.6000533624919,40.6000653422936,40.6000768995739,40.6000962615995,40.6001458694783,40.6001836127829,40.6002127126208,40.6002449046247,40.6002872736616,40.6003174810273,40.6003383974964,40.6004067230537,40.6004068108957,40.6004162100988,40.6004469709101,40.6004555170544,40.6004577117942,40.6004597907124,40.6004632103606,40.6004661190609,40.6004666300619,40.6004700511549,40.60047454816,40.6004760398341,40.6004761218141,40.6004888866414,40.6004924349608,40.6004948767555,40.6005318023157,40.6005402257355,40.6005522018652,40.6005703374215,40.6005864154068,40.6005906936425,40.6005912803017,40.6005941207111,40.6006086825675,40.6006123897923,40.6006146714599,40.6006180942052,40.6006205131925,40.600621514102,40.6006292100357,40.6006386125388,40.6006770718422,40.6006819662208,40.6006924565433,40.6007071678999,40.6007215226198,40.6007531534075,40.6007839320536,40.6008497703463,40.6008572852854,40.6008822586131,40.6009096106717,40.6009728608027,40.6009829943063,40.6009993580585,40.6010186539223,40.6010403902006,40.6010631071861,40.6010643275538,40.6010724829759,40.601095109395,40.6011011620817,40.601119055274,40.6011606557521,40.6011678123799,40.6011967188912,40.6012063034432,40.6012064540628,40.6012208422877,40.6012317290908,40.6012345266474,40.6012464961024,40.6012533091554,40.6012618834828,40.6013123152887,40.6013651094842,40.601366170415,40.6013672877392,40.6013832636828,40.6013995015584,40.6014191542694,40.6014652911127,40.6014796786818,40.6015071595535,40.6015353590154,40.601544760001,40.6015524532338,40.6015686969578,40.6015815248342,40.6016097523336,40.6016200811147,40.6016259995658,40.6016346399917,40.6016901212626,40.601768774726,40.6017969854144,40.6018662272414,40.6018876912913,40.6018987156651,40.6019029913664,40.6019064123656,40.6019132571076,40.6019286724425,40.6019355188026,40.6019397965999,40.6019433687039,40.6019449272558,40.6019500560061,40.6019560394904,40.6019682582547,40.6019748427997,40.6019781897541,40.6019868074645,40.6019921347264,40.6019979161928,40.6020013311695,40.6020038961715,40.6020090214184,40.6020107515104,40.6020124393761,40.6020148955185,40.6020158542581,40.6020206389042,40.6020312279729,40.6020346447278,40.6020363525189,40.6020375602358,40.6020380614827,40.60203849422,40.6020414789678,40.6020430993068,40.6020448964235,40.6020471297401,40.6020474610489,40.6020480060207,40.6020508799047,40.602055155122,40.6020662727514,40.6020696891477,40.6020731118619,40.602085078118,40.6021004597615,40.6021184043953,40.6021220786098,40.6021747955738,40.6021910326124,40.6022055602126,40.6022115443852,40.6022159132626,40.6022183823146,40.6022235136527,40.6022259582721,40.6022277928273,40.6022346424043,40.6022352930391,40.6022372145104,40.6022380759471,40.6022398644328,40.6022476274045,40.6022471974602,40.6022467768456,40.6022459286574,40.6022417685597,40.6022417548518,40.6022416682979,40.6022407024609,40.6022348458887,40.6022218793302,40.6022169337684,40.6022149463296,40.602210113434,40.6022092626771,40.6022092640704,40.6022092654554,40.6022092682333,40.6022092692045,40.6022092710114,40.6022102227822,40.6022109827531,40.6022113987369,40.6022118383968,40.6022126207242,40.6022144030043,40.6022156693913,40.6022161128785,40.6022172609503,40.6022220951271,40.6022280783798,40.6022329710424,40.6022417502826,40.6022457592054,40.6022562748354,40.6022955684197,40.602297293231,40.6023280416904,40.6024087591307,40.6024134767774,40.6024373989625,40.6024383798278,40.6024587604873,40.6024732871162,40.6024840062158,40.6024878151299,40.6025006360672,40.602504361798,40.6025126045159,40.6025216784189,40.6025245729861,40.6025339812947,40.6025350557228,40.602541680828,40.6025476725653,40.6025551370155,40.602559662067,40.6025656624862,40.6025662374116,40.6025665282774,40.6025665600545,40.6025680830871,40.602569132246,40.6025708448691,40.6025710567177,40.6025725572845,40.6026127619256,40.6026538212017,40.6026683603814,40.6026828981592,40.6027092335044,40.6027278284961,40.6027335273481,40.6027469407672,40.6027753946895,40.6027757758457,40.6027976084748,40.6028311320614,40.6028623283396,40.6029039724707,40.6029076412744,40.6029446787859,40.6029686492961,40.6030125921077,40.6030571373985,40.6030874323242,40.6031106786694,40.6031378416285,40.6031498187679,40.6031896399795,40.6032165379177,40.6032225927541,40.6032457425526,40.6032849583449,40.6033090659134,40.6033143443695,40.6033149627515,40.6033241228721,40.6033490950828,40.6033737108185,40.6033906964865,40.6034086679167,40.6034238113633,40.6034377109836,40.6034465135939,40.6034546012224,40.6034617026087,40.6034770079949,40.603516124749,40.6035558313678,40.6036295214104,40.6036566699454,40.6036752112739,40.6036854184688,40.6036974669151,40.6037105345488,40.6037212402713,40.6037329658285,40.6037441729481,40.6037596830805,40.6037688232264,40.603782856672,40.6038065118657,40.603814238574,40.603817324654,40.6038199702679,40.6038268930818,40.6038386347894,40.603841802961,40.6038462166632,40.6038544317569,40.60387932547,40.6038956295654,40.603912077521,40.6039252076789,40.6039402597374,40.6039650346252,40.6039790675243,40.6039935748049,40.6039988050964,40.6040015301803,40.6040036203969,40.6039992360165,40.6039903010696,40.6039700309678,40.6039380978616,40.603926644062,40.6038985433799,40.6038718323139,40.6038534680991,40.6038481879253,40.6038410666896,40.6038321930296,40.6038111611038,40.6037860167078,40.603765371382,40.6037491442906,40.6037423259888,40.6037432460957,40.6037512762487,40.6037653872001,40.6037979590057,40.6038095223338,40.6038346195127,40.6038652810657,40.6038990721638,40.6039361558444,40.6039841424064,40.6040045983706,40.6040197041394,40.6040295948388,40.6040284578283,40.6040177131843,40.6039935441406,40.6039613885763,40.6039163867162,40.6038872723437,40.6038660643043,40.6038303743403,40.6038036017443,40.6037811128704,40.6037733290604,40.6037697077481,40.6037475853973,40.603735864629,40.6037311668318,40.6037268258187,40.6037328154237,40.6037349852644,40.6037448391522,40.6037582262836,40.6037785624175,40.603801038156,40.6038225733086,40.6038399061103,40.6038658612052,40.6038801174115,40.6038874782107,40.6039115318426,40.6039249609857,40.6039356805074,40.6039357094396,40.603935804164,40.603910001972,40.6038926914138,40.6038886211246,40.6038860333143,40.6038824752405,40.6038756554767,40.6038504064348,40.6038226218237,40.6037966977636,40.603778994501,40.6037518023198,40.6037273073619,40.6036850828313,40.603631535787,40.6035858755184,40.6035637936543,40.6035245353718,40.6034906838387,40.6034691276579,40.6034379846266,40.6033915144508,40.6033309958633,40.6032863867558,40.6032509706405,40.6032136952442,40.6031854796229,40.6031680238308,40.6031521040622,40.6031315586235,40.6031216376155,40.6030968573047,40.6030519624194,40.6030147256645,40.6029502966487,40.602900993732,40.602851434261,40.6027534878948,40.6027097392488,40.602688516647,40.6026729716293,40.6026534861968,40.6026450570911,40.6026460136316,40.6026467942368,40.6026491232894,40.6026442131004,40.6026363359203,40.6026131983678,40.6025963842178,40.6025789775098,40.6025356860025,40.6024827801916,40.6024342704514,40.6023798006137,40.602317577734,40.6022406566387,40.6021770314179,40.6021394140455,40.6021077291306,40.6020592311628,40.6020139954089,40.6020001742908,40.6019895873952,40.6019323247903,40.6018861061658,40.6018353550094,40.6017749918008,40.6017222582641,40.6016720999592,40.6016439854248,40.6016211428719,40.6016228802276,40.6016296999425,40.6016366538686,40.6016256764222,40.6015927618614,40.6015575980296,40.6015574271788,40.60152794699,40.6015151281084,40.6015040076374,40.6015033681661,40.6014980330026,40.6014966882348,40.6014920469587,40.6014723756132,40.601467388866,40.6014621158633,40.601437087003,40.6014253536095,40.6013537660492,40.6013031053827,40.6012885735818,40.6012546048265,40.601223892646,40.6012006501541,40.6011818421898,40.6011716746409,40.6011677349101,40.6011690421049,40.6011740029023,40.6011897488697,40.6012132603374,40.6012556071961,40.601261996323,40.6012631136864,40.6012645506747,40.6012645459394,40.6012645438628,40.6012628024379,40.6012593545457,40.6012580296489,40.6012361712061,40.6012302787078,40.6012267162848,40.6012224271602,40.6012214147946,40.6012172882166,40.6012160517299,40.6012147195212,40.6012130333226,40.6012095882985,40.6012066473061,40.6012044575788,40.6011976180777,40.6011926090138,40.6011822343298,40.6011563542926,40.6011412114355,40.6011194315928,40.6010907864958,40.6010592418489,40.601026585495,40.6010075290255,40.6009910488545,40.6009862610738,40.600969151122,40.6009404322857,40.6009032347207,40.6008560887525,40.6008318619908,40.6007786115439,40.6007597635228,40.6007599376187,40.6007683598057,40.6008012370123,40.600793445223,40.6007532431804,40.6007208329035,40.6007106268989,40.6006994377244,40.6006835577624,40.6006671244663,40.6006470088538,40.6006211227882,40.600590706347,40.6005539376168,40.6005311908051,40.6005056112292,40.6004881090186,40.6004799355925,40.6004797157016,40.6004855636824,40.6004949301833,40.6004942539559,40.6004859470522,40.600480605833,40.6004595558364,40.6004635435691,40.6004667095481,40.6004565417443,40.6004185439492,40.6003965207556,40.6003880913329,40.6003855918288,40.6003993554764,40.6004139295788,40.6004290575362,40.6004357045822,40.6004494296367,40.6004983960182,40.6005654584465,40.6005790970979,40.6005834578646,40.6005856144529,40.6005872257603,40.6005972448696,40.6006046079833,40.6006077659746,40.6006083252875,40.6006181119881,40.6006145058184,40.6006116159763,40.6006013699842,40.6005987799748,40.6005939522305,40.6005930651675,40.6005860381454,40.6005757787549,40.6005540973881,40.6005306358932,40.6005168211547,40.600496725703,40.6004786657674,40.6004575878557,40.6004393752831,40.600431916263,40.600419983943,40.6004082661572,40.6003980272542,40.6003841059145,40.600369820931,40.6003500953045,40.6003369471801,40.6003338024389,40.6003372428444,40.6003492226517,40.6003656228015,40.6003753718888,40.6003777702423,40.6003742427453,40.6003631365567,40.6003519171506,40.6003377264721,40.6003286488688,40.6003187049031,40.600316058482,40.6003001818347,40.6002819803337,40.6002635636848,40.6002445160346,40.6002304071447,40.6002194223051,40.6002118096419,40.6002028461885,40.6001862580871,40.6001675867824,40.6001457503115,40.6001423376399,40.6001454545024,40.6001517030473,40.6001580320295,40.6001605648088,40.6001556059932,40.6001436803426,40.6001367267932,40.6001246999184,40.6001211515266,40.6001224624506,40.6001066591552,40.6000873697494,40.6000565708634,40.6000154989947,40.5999881052125,40.5999584422659,40.5999346041223,40.5999243110673,40.5999166234502,40.5999149187606,40.5999184785494,40.5999167929559,40.5999125685207,40.5999100804342,40.5998981875708,40.5998901450855,40.5998801109644,40.599879139931,40.5998674019522,40.599860414546,40.5998498529151,40.5998454054243,40.5998414210352,40.5998353135504,40.5998317791404,40.5998292463977,40.5998174410217,40.59977036229,40.5997581279195,40.5997290474948,40.5996891450434,40.5996632778091,40.5996338148892,40.5996029492151,40.5995920179058,40.5995778469716,40.5995714977061,40.5995628381845,40.5995534453467,40.5995427551041,40.599531647939,40.599518378403,40.5995016210794,40.5994915486274,40.5994797312117,40.5994644594051,40.5994376517435,40.5994241791801,40.5994147795395,40.5993972689172,40.5993734044983,40.5993723018701,40.5993620150089,40.5993510836541,40.5993388109845,40.5993271101815,40.5993163472573,40.5993002288392,40.5992867974136,40.5992655662147,40.5992438639434,40.5992160205051,40.5992103779822,40.599199076176,40.5991802166444,40.5991695517765,40.5991670406618,40.5991536711568,40.5991414221522,40.5991271368317,40.599117462186,40.5991129537503,40.5991133828696,40.599115184213,40.5991091903904,40.5991004559699,40.5990909284101,40.5990781359744,40.5990648936125,40.5990414843735,40.5990085482299,40.5989905815063,40.5989656548789,40.598953533681,40.5989531704571,40.5989471841809,40.5989038846141,40.5988984513516,40.5988950312046,40.5988907580512,40.5988896666241,40.5988872772505,40.5988822111894,40.5988446158825,40.5988360704634,40.5988293377641,40.5988292323334,40.5988265268217,40.5987967519507,40.598779768731,40.5987668309057,40.5987583032867,40.5987557147798,40.5987317674794,40.5987296690046,40.5987189430483,40.5986539768159,40.5986294244369,40.598609523009,40.5985847283777,40.5985781550724,40.5985642040507,40.5985428196688,40.598513734824,40.5984904554041,40.5984692554135,40.5984512918081,40.5984472017856,40.5984470232154,40.5984299243005,40.5984150647012,40.5983598132723,40.5983318638595,40.5983221961479,40.5982845816943,40.5982486801297,40.5981897027145,40.5981649166573,40.5981512546959,40.5981401320591,40.59809056482,40.5980591468402,40.5980563814727,40.5980506237085,40.5980358723079,40.5979846040801,40.597969971067,40.5979615316509,40.5979613311881,40.5979435856745,40.5979393161577,40.5979264930268,40.5979160520989,40.5979119616644,40.597908894428,40.5978991392648,40.5978920724663,40.5978794738058,40.5978281690962,40.5977700304484,40.597736604517,40.5977255751015,40.5977154570683,40.5976879606753,40.597592222401,40.597499894193,40.5974776682865,40.5974571531231,40.5974222686836,40.597415271443,40.5974049961766,40.5973451871832,40.597254592393,40.5972545566851,40.5972392042035,40.5972238147148,40.5972092765572,40.5971878930004,40.5971819059779,40.5971759155535,40.5971536585718,40.5971476693799,40.5971408276109,40.5971359915325,40.5971228704188,40.5971032064144,40.5970942569807,40.5970809811243,40.5970697299763,40.5970561955399,40.5970160303388,40.5969647571343,40.5969416867818,40.5969100337908,40.5968844434145,40.5968699171031,40.5968570990093,40.5968519709742,40.5968503217905,40.5968468415218,40.5968382919327,40.596838246801,40.5968305924892,40.5968154924502,40.5968109169838,40.5968040759234,40.5967972351843,40.5967890928274,40.5967775731072,40.5967254310715,40.5966997856293,40.5966142809375,40.5965739744822,40.5965227974847,40.5965064018474,40.5964791933248,40.5964662172338,40.5964475638164,40.5964338876862,40.5964176490281,40.5963620990274,40.5962971526375,40.5962757862369,40.5962723071478,40.5962612557738,40.5962467218778,40.5962338959377,40.5962195813875,40.5962039635892,40.5961952956714,40.5961868630436,40.5961672003862,40.5961564719913,40.5961458321124,40.5961386945249,40.5961236108613,40.5961037527764,40.5960996830742,40.5960863369002,40.5960731928455,40.5960432885405,40.5960142402301,40.5959450388513,40.5959418057373,40.5959117185398,40.5959017427236,40.5958835212644,40.59587035122,40.595857885254,40.5957416560688,40.5957407377362,40.5956631619087,40.5956499549249,40.5956370234364,40.5956244054826,40.5956121298952,40.5956002315354,40.5955887422535,40.5955723479854,40.5955554180736,40.5955379860428,40.5955320539925,40.5955258156946,40.595519324783,40.5955126357223,40.5955058061587,40.595495376536,40.5954849769665,40.5954746781534,40.5954696381365,40.5954648326643,40.5954603237486,40.5954561700576,40.5954524265796,40.5954491422793,40.595446357746,40.5954436953934,40.5954404492937,40.5954366506598,40.5954323368971,40.5954275531136,40.5954223470963,40.5954167671291,40.5953969872237,40.5953775099659,40.5953583474251,40.5953395083202,40.595324390129,40.595308844176,40.5952928858858,40.5952765350371,40.5952598058843,40.595242717033,40.5952103432299,40.5951803199842,40.5951753859559,40.595163615851,40.5951599967349,40.5951567191789,40.5951518215946,40.5951476429855,40.5951425462256,40.5951400268905,40.5951382219739,40.5951356843631,40.5951337544266,40.595131420604,40.5951293379112,40.5951272483005,40.5951255392795,40.5951245217669,40.5951245600527,40.5951254712109,40.5951258368799,40.5951261857132,40.5951264788753,40.5951265132308,40.5951270233577,40.5951269499519,40.5951262940931,40.5951250702607,40.595123300303,40.5951210223161,40.5951160337983,40.5951106999584,40.5951050707463,40.5950992004675,40.5950931501206,40.5950527340518,40.5950467206729,40.5950410322087,40.5950357455919,40.5950309262012,40.5950284846608,40.5950265562191,40.5950251633755,40.5950243226016,40.5950240440016,40.5950243308137,40.5950251787343,40.595026578439,40.5950285152341,40.5950309648795,40.5950336466225,40.5950358608553,40.5950375726179,40.595038758346,40.5950393983296,40.5950394815742,40.5950390081399,40.5950372560092,40.5950349716364,40.5950321708098,40.5950288790383,40.5950251229963,40.5950176431877,40.5950098287804,40.5950017856851,40.5949974677537,40.5949935743184,40.5949901394262,40.5949871972954,40.5949847752778,40.5949828965371,40.5949815793819,40.594971261847,40.594961448462,40.5949521497955,40.5949433735665,40.5949351283355,40.5949274226594,40.59492026292,40.5949136551629,40.5949076072788,40.5949021246418,40.5948936290861,40.5948857947609,40.5948786273744,40.5948721272754,40.5948663001723,40.5948611464131,40.5948566710386,40.594855499863,40.5948549066097,40.5948548924867,40.5948554585313,40.5948566027689,40.5948583197035,40.5948606026669,40.5948634429826,40.5948669932607,40.5948699149695,40.594872195745,40.5948738309287,40.5948748138534,40.5948751423758,40.5948748143508,40.5948745087331,40.5948735657081,40.5948719888387,40.5948697867099,40.5948669737739,40.5948635671606,40.5948595843337,40.5948467665927,40.5948406755405,40.5948333229966,40.5948192647892,40.5948077223252,40.5947968322698,40.5947866028455,40.5947770417778,40.5947681574576,40.5947599545924,40.5947566780003,40.5947539651983,40.5947518192219,40.5947502436105,40.594749242743,40.5947488176426,40.5947486888229,40.5947480117082,40.5947467900227,40.5947450300042,40.5947427419102,40.5947399418611,40.5947355056488,40.5947304956076,40.5947249340559,40.5947188469931,40.5947122662842,40.5947059345861,40.5946992349074,40.5946922019493,40.5946848685667,40.5946772728077,40.5946694518809,40.5946558895914,40.5946426490219,40.5946297635272,40.5946172672993,40.5946051893388,40.5945926118377,40.59458039959,40.5945685737193,40.5945571543442,40.5945461594053,40.5945399971027,40.5945344005778,40.5945293856065,40.5945249671289,40.5945211610929,40.5945161595628,40.5945106812047,40.5945047491628,40.5944983860807,40.5944916154356,40.5944844630484,40.5944769575891,40.5944691282248,40.5944591616151,40.5944495355304,40.5944402690838,40.5944313822262,40.5944228897158,40.5944148103304,40.5944071586652,40.5943999503146,40.5943931990351,40.5943869189199,40.5943839329769,40.5943815912309,40.5943798766832,40.5943798287958,40.5943664572466,40.5943602356028,40.5943108946463,40.594301492853,40.594274999896,40.5942749668711,40.594271249434,40.5942673056708,40.5942669748361,40.5942606620861,40.5942604658969,40.5942592842114,40.594250203776,40.5942296739352,40.5942249946833,40.5942194130904,40.5941518596871,40.5940928614479,40.5940451644122,40.5940210353072,40.5940199312822,40.5940184723817,40.5940159071105,40.5940133435144,40.594011253479,40.5940107794159,40.5940030899823,40.5939940764759,40.5939791688014,40.5939766671101,40.5939757504712,40.5939723321418,40.5939708858133,40.5939697680425,40.5939696741403,40.59396720366,40.593935566983,40.5939039305057,40.5938415076692,40.5938312451687,40.5938243513779,40.5938081475675,40.5938037981891,40.5938013052556,40.5937973633426,40.5937936099067,40.5937779460831,40.5937653986568,40.5937346242013,40.5937012856277,40.5936628214144,40.5936158088357,40.5935987191662,40.5935833301142,40.5935566393151,40.5935414533518,40.5935241211597,40.5934927432322,40.5934829596999,40.5934713797911,40.5934205078575,40.5934124214726,40.5933902024994,40.5933696914071,40.5933651871315,40.5933500314949,40.5933320785787,40.5933192525882,40.5933144694586,40.5933064269736,40.5932824792683,40.5932701132294,40.5932593790435,40.5932319957579,40.5932267631968,40.5932208688644,40.5932073694298,40.5931994600224,40.5931906872766,40.5931857673859,40.5931803090784,40.5931703673659,40.5931558250504,40.5931556893353,40.5931553501492,40.5931412859962,40.593128572447,40.5931258939241,40.5931202597129,40.5931070833683,40.5931036350461,40.5930865658104,40.5930660478721,40.5930455315269,40.5930337092042,40.5930258723057,40.5929703174951,40.5929699763226,40.5929626264992,40.5929549322292,40.592939559329,40.5929258540609,40.5929181589864,40.5929104655097,40.5929023287752,40.592891660793,40.5928711481129,40.5928458695807,40.5928258514208,40.5927882298429,40.592778852103,40.5926609259451,40.5926475384439,40.5926284516316,40.5926118538535,40.5925993947077,40.5925139293283,40.5924552043175,40.5924549565577,40.5924547176769,40.5924028196929,40.5923566628967,40.5923490456808,40.592348968214,40.5923412730948,40.5923162715217,40.5923147667089,40.592303648929,40.5922908259656,40.5922876983651,40.5922839890953,40.5922771538343,40.5921814581377,40.5921493110401,40.592128485481,40.5921221648217,40.5921045609569,40.5920997118382,40.5920960164253,40.5920874697788,40.592086614239,40.5920863045282,40.5920738479127,40.5920672736556,40.5920611459346,40.5920521937246,40.5920414211951,40.5920371482444,40.592011975701,40.5919904830959,40.5919791180313,40.591972166379,40.5919663864311,40.5919457526258,40.5919288281763,40.5919172477605,40.5919152715898,40.5918993059704,40.5918883195247,40.5918480356827,40.5918366043636,40.5918060651039,40.5917763519265,40.591761242548,40.5917494006022,40.5917436870716,40.5917372091619,40.5917316394341,40.591723051238,40.5917109882645,40.591696894917,40.5916819776291,40.5916771211217,40.5916722626891,40.5916665465659,40.5916663893777,40.5916613080171,40.5916547971035,40.5916271820244,40.591597087872,40.5915722615897,40.5915507041925,40.5915381030293,40.591523468673,40.591511248579,40.591491689935,40.5914761667313,40.5914643259371,40.5914533114899,40.5914431205836,40.5914357540487,40.5914352775706,40.5914332245311,40.5914323538422,40.5914172424927,40.5913809293733,40.591358993143,40.5913430558099,40.5913153739451,40.5912959100498,40.5912553432307,40.5912375330726,40.5912213112338,40.5912022001353,40.5911850878112,40.5911679810309,40.5911441060351,40.5911173768751,40.5911007427239,40.5910925874377,40.5910864876435,40.5910754399219,40.5910797914342,40.5910878832917,40.5910979469495,40.5911063606778,40.591105882493,40.5910989280669,40.5910883266656,40.5910777241177,40.5910630576215,40.5910512148433,40.5910405468551,40.5910359434886,40.5910361226006,40.5910366099212,40.5910368965944,40.5910315278304,40.5910221335214,40.5910092210309,40.5910028242183,40.5909941259197,40.5909848495112,40.5909750624252,40.5909621337183,40.590947758903,40.5909355488151,40.5909277096425,40.5909186533689,40.5909027899798,40.5908839967557,40.5908637631157,40.5908557148253,40.5908396172372,40.5908215483096,40.5908129580448,40.5908092236147,40.590805964236,40.5908015352685,40.5907939374282,40.5907853867916,40.5907766227228,40.5907571272491,40.590745901708,40.5907282908896,40.5907216535199,40.5907220557518,40.5907215187541,40.5907138900726,40.5907074082182,40.5907021308537,40.5906940652888,40.5906860293679,40.5906801927957,40.5906733649268,40.5906689555094,40.5906591962898,40.5906433708469,40.590634349656,40.59062359964,40.5906088844182,40.5905968529565,40.5905938845722,40.5905941103634,40.5905923684549,40.5905887228902,40.5905869940237,40.5905772666308,40.5905646016821,40.5905604369733,40.590560173811,40.590557221672,40.5905459843551,40.5905354936187,40.5905240350374,40.5905198657963,40.5905225138724,40.590520280819,40.5905144090456,40.590499034993,40.5904834162112,40.590474367672,40.5904719016177,40.5904755051165,40.5904742293195,40.5904658965024,40.5904377818224,40.5904257978659,40.5904186859858,40.5904181639782,40.5904215457093,40.5904278532672,40.5904275922632,40.5904204921175,40.5904031449272,40.5903711875255,40.5903516795591,40.5903441084123,40.590330172631,40.5903162524595,40.5903065004036,40.5902916399285,40.5902811654362,40.5902745784037,40.5902655252731,40.5902562245531,40.5902447491459,40.5902293834214,40.5902196392543,40.5902135658598,40.5902067822907,40.5902024434959,40.5901939605887,40.5901919675,40.5901820467723,40.5901642772542,40.5901450307948,40.5901169799594,40.5900706123607,40.5900371645201,40.5899951580045,40.5899570441201,40.5899487308501,40.5899469681579,40.5899491125797,40.5899570592537,40.5899596791691,40.5899581611887,40.5899517907881,40.5899442291755,40.5899310954174,40.5899155590765,40.5899092515617,40.5898971053013,40.5898844583121,40.5898795895892,40.5898527877224,40.5897770183808,40.5897244223184,40.5896969254328,40.5896679904262,40.5896556150734,40.5896483488041,40.5896425206572,40.5896342467143,40.5896281457608,40.5896084002356,40.589578947016,40.5895507277034,40.5895312707906,40.5895074261998,40.5894789446753,40.5894557939313,40.5894385145446,40.5894253965895,40.5894186006144,40.5894193551487,40.5894225521145,40.5894225722855,40.5894172292305,40.5894043245665,40.5893887337471,40.5893716873243,40.5893512462761,40.5893356835272,40.5893271557797,40.5893266538782,40.5893317437971,40.5893460704477,40.5893630854322,40.5893752266517,40.5893824777849,40.5893848680935,40.589378968649,40.5893599394787,40.5892944392465,40.5892790847448,40.5892598135333,40.5892480786965,40.5892380211544,40.5892377134985,40.5892403451456,40.5892468608678,40.589279620358,40.5893014826739,40.5893260474797,40.5893350360962,40.5893377047495,40.5893359700782,40.5893264504279,40.5893064685498,40.5892770001732,40.5892621430324,40.589241928202,40.589224387757,40.5891968836362,40.5891360573744,40.5890808380748,40.5890283172286,40.5890049813031,40.5889845729084,40.5889583493322,40.5889398725407,40.5889255173187,40.5889172517882,40.5888868898076,40.5888359229604,40.5888082711758,40.5887906017263,40.5887680477316,40.5887529936235,40.588742326007,40.5887290166265,40.5886709376624,40.5886264033189,40.5885658574743,40.5885217855324,40.5884430913768,40.5883839923569,40.588307980062,40.5882566680944,40.5881959247377,40.5881327784743,40.5880613535331,40.5880289052097,40.5879456095403,40.587921775263,40.5879163886048,40.587911003117,40.5878930377332,40.5878802270192,40.5878638538799,40.5878538406073,40.5878503121577,40.5878387375263,40.5878250992044,40.5878154377661,40.5878106998195,40.587812736676,40.5878151836648,40.5878220510016,40.5878261213933,40.5878246577625,40.5878195394583,40.5878132135411,40.5877980810419,40.5877630808364,40.5877420349171,40.5877285547977,40.5877090994499,40.5876916177683,40.5876685992667,40.5876475852603,40.5876232066275,40.5876122059421,40.5875787941615,40.5875463378266,40.5874778795177,40.5874046260482,40.5873267989609,40.5872446336301,40.5871583785491,40.5870682945792,40.5869746541602,40.5868777404866,40.5867778466506,40.5866752747561,40.5865703350048,40.5866068549255,40.5879872778977,40.5890956514713,40.5903082078847,40.5912119158327,40.5914953697973,40.5918723492592,40.5921842516915,40.5931487882873,40.5941043148464,40.5950607791786,40.5960204511543,40.5968202649194,40.5971073036215,40.5973232949648,40.5977779281458,40.5994373827175,40.6010620694992,40.6026872808249,40.602230711367,40.6038731622438,40.605497900603,40.6059738630588,40.6061952096804,40.6065878610635,40.6070004560576,40.6069219435036,40.6074332974761,40.6075994773071,40.609229317663,40.6108564298636,40.6119194575028,40.6119928417343,40.6127225384378,40.6134117379848,40.6140808069615,40.614803772404,40.6158885305079,40.6160462091094,40.6162051569828,40.6172126872092,40.6196056119517,40.6219948159592,40.6243855672862,40.6267736686311,40.6291665672098,40.6292766427586,40.6293778123557,40.6294800515109,40.629508285208,40.6298665632107,40.6301271666631,40.6307327133548,40.6307914829014,40.6308947957303,40.6309941556314,40.631101784416,40.6312087906018,40.6313095874154,40.6313686382038,40.6313929601883,40.6314124732462,40.6315126060848,40.6315816487626,40.6315983109317,40.6316284442441,40.6317691192041,40.6318283466246,40.6319232137334,40.6320904666279,40.6322678569992,40.632509250074,40.632810290765,40.6329589540274,40.6334140627752,40.6338855739312,40.6343675942147,40.6349633387563,40.635325877722,40.6355951033264,40.636341774394,40.6367574447959,40.6373514434135,40.6378121710962,40.6381629464124,40.6384225741831,40.6386947792532,40.6389791287543,40.6392751549271,40.6395086650372,40.639582363369,40.6399002155921,40.6413446923951,40.6423662985682,40.642778147843,40.6436754767375,40.644327494557,40.645774695238,40.6462178282136,40.6466387171483,40.6471962866268,40.6477058443952,40.6478078679181,40.6481547584833,40.6486387495646,40.6487290613685,40.6490778277107,40.6495572103232,40.6501310385613,40.6501760427395,40.6505864186227,40.6511859257308,40.652048896178,40.6551715977333,40.6553646491783,40.65557059861,40.6557884673294,40.6560171284051,40.6562553167027,40.6565016437778,40.6567546437481,40.6570127948912,40.6571359524246,40.6572040535054,40.6572745209475,40.6573568607414,40.6574219175225,40.6575318475627,40.6577637018589,40.6579994798497,40.6582379457657,40.6584778011579,40.6587177706758,40.6589565756107,40.6590673908684,40.6591114041932,40.6575259418736,40.6574538129022,40.6574066618045,40.6573948832092,40.6573716575709,40.6573127030726,40.657240805857,40.6567123638255,40.6558281670742,40.6540430147487,40.6538012239551,40.6536248534122]}]],[[{"lng":[-73.9123679028881,-73.9123748607236,-73.9123923232893,-73.9124193285944,-73.9124847379624,-73.9125088520565,-73.9125205153034,-73.9125787364287,-73.9126084771918,-73.9126172003247,-73.9126175882372,-73.9126180809409,-73.9126317024624,-73.9126398258417,-73.912634196808,-73.9126167474667,-73.912602092437,-73.9125942554243,-73.9125846685284,-73.9125855857068,-73.912593183151,-73.9126126660453,-73.912638307341,-73.9126358139795,-73.912616669057,-73.9125899036262,-73.9125388956094,-73.9125210309124,-73.912504238309,-73.9125046003574,-73.9125132712553,-73.9125346754147,-73.9125681371219,-73.912606643217,-73.9126500531051,-73.9126727844487,-73.9126901490435,-73.9126990254692,-73.912706059561,-73.9127028058082,-73.9127107973976,-73.912704858546,-73.9126928262587,-73.9126791029834,-73.9126622812161,-73.912651111551,-73.9126306765385,-73.9126268602529,-73.9126109098732,-73.9125955974678,-73.9125826382142,-73.91256416724,-73.9125432334965,-73.912525844042,-73.9124835531972,-73.912451813437,-73.9124242085303,-73.9124086401795,-73.9124007270714,-73.912406606087,-73.9124210306946,-73.9124387884734,-73.9124602203607,-73.9124951143902,-73.9125707297115,-73.9126052251263,-73.9126212430634,-73.9126495750032,-73.912677482873,-73.9127040405266,-73.9127502584439,-73.9128168158525,-73.9128617308353,-73.9129671564777,-73.9130466095046,-73.9130627469508,-73.913083424819,-73.9131006349205,-73.9131076452217,-73.9131080307202,-73.9130936606921,-73.9130311612599,-73.9130131486545,-73.9130040092071,-73.9130101054408,-73.9130276523281,-73.9130543937188,-73.9130770238816,-73.9130823320629,-73.9130925917694,-73.9131153751903,-73.9131537572721,-73.9132074776382,-73.9133453000465,-73.9134426509052,-73.9135119443682,-73.9135602987766,-73.9135911465638,-73.9136289096197,-73.9136704080064,-73.9137057441612,-73.9137981788346,-73.9138419814023,-73.9138878302082,-73.913933638425,-73.9139827654238,-73.9140144821997,-73.9140488061528,-73.9140804924904,-73.9141257471768,-73.9141501966294,-73.9141869659045,-73.9142144094021,-73.9142420915365,-73.914264611633,-73.9142875703119,-73.9143048086493,-73.9143134782537,-73.9143203815268,-73.9143386907519,-73.9143481386469,-73.9143627247842,-73.9143802440391,-73.9144085262642,-73.9144253178723,-73.9144307579211,-73.9144165647472,-73.9144135471854,-73.9144260182394,-73.9144456207809,-73.9144813795111,-73.9145087196776,-73.9145405606919,-73.9145713661856,-73.9145910991113,-73.9146096161664,-73.9146316627537,-73.9147207505513,-73.9147531684699,-73.914786629988,-73.914812067686,-73.9148209234614,-73.914824357159,-73.9148196690462,-73.9148139671491,-73.9148251681042,-73.9148566460507,-73.9148814366393,-73.9148974197058,-73.9149069536754,-73.9149020081095,-73.914884639735,-73.914859618503,-73.914851264506,-73.914857513246,-73.9148785016829,-73.91487974591,-73.9148712856978,-73.9148618361729,-73.9148711327222,-73.9148975950198,-73.914921207793,-73.9149508720015,-73.9149668021376,-73.9149825348614,-73.914986856806,-73.9149935501604,-73.9150043495072,-73.9150293243891,-73.9150473894705,-73.9150639019343,-73.9150721823486,-73.9150857720053,-73.9151053823759,-73.9151404499266,-73.915166782184,-73.9152135907856,-73.9152573344254,-73.9152833390794,-73.9153536435194,-73.9153958461791,-73.9154299060241,-73.915454498169,-73.9154765054017,-73.9155053193232,-73.9155269382118,-73.915544997565,-73.9155671901143,-73.9156071309141,-73.9156530441542,-73.9156987077507,-73.9157300688921,-73.9157501285275,-73.9157588827691,-73.9157616045729,-73.9157789647609,-73.9157964642004,-73.9159008307972,-73.9159559503258,-73.9160135271607,-73.9160452893165,-73.91607986037,-73.9161222613293,-73.9161419947328,-73.9161562087907,-73.9161652638916,-73.9161634065209,-73.9161611729504,-73.9161653343487,-73.9161929139961,-73.9162545840778,-73.9162874592204,-73.9163254558276,-73.9163582813013,-73.916401109339,-73.9164738146702,-73.9165253744714,-73.9165634573712,-73.9166043299236,-73.9167443570615,-73.9168090421503,-73.9168419871632,-73.9168686550118,-73.9168841435417,-73.9169045960364,-73.9169166457056,-73.9169280467959,-73.9169473272844,-73.9169742162955,-73.9170081143389,-73.9170454990349,-73.9172215494406,-73.9172715063787,-73.9172974760781,-73.9173041099016,-73.9173107459236,-73.9172986141072,-73.9170838294655,-73.9168767663595,-73.9168456114544,-73.9168180242801,-73.9168023754274,-73.9168099685985,-73.916830958948,-73.9168329873401,-73.9168110438531,-73.9167694271823,-73.9167130311422,-73.9166355518949,-73.9165904939618,-73.9165602576572,-73.9164838423551,-73.9164297950498,-73.916410785555,-73.9163910623969,-73.9163755408858,-73.9163509359137,-73.9163331007142,-73.9163264056804,-73.9163112552774,-73.9162933048909,-73.9162906180458,-73.9162931658865,-73.9162847688571,-73.9162755368557,-73.9162610483293,-73.9162472712827,-73.9162099122437,-73.9161613368347,-73.9161435989042,-73.9161270768209,-73.9161125248706,-73.9160977630738,-73.9160827619387,-73.9160660850751,-73.9160610513273,-73.9160483111864,-73.9160431267682,-73.9160339846931,-73.9160265379797,-73.9160232783398,-73.9160315082901,-73.9160451073758,-73.9160592444141,-73.9160598299387,-73.9160553342886,-73.9160421323441,-73.9160123409459,-73.9160007626264,-73.9159967391404,-73.9159950756427,-73.9159893032506,-73.9159850675689,-73.9159732376387,-73.915961510809,-73.9159447356366,-73.9159291477184,-73.9159073662861,-73.9158997987654,-73.9158960153525,-73.9158853218926,-73.9158787393107,-73.915875254895,-73.9158623761139,-73.9158442416109,-73.9158230823414,-73.9158042230052,-73.9157805779701,-73.9157652891067,-73.9157439799606,-73.9157300442487,-73.9157189407782,-73.9157085996047,-73.915667295489,-73.9156141628192,-73.915578280018,-73.915556183783,-73.9155415816185,-73.9155302905145,-73.9155236696394,-73.9155169388029,-73.9155041366084,-73.9154929220835,-73.9154848927125,-73.915471576988,-73.9154639576831,-73.9154627460607,-73.9154555256811,-73.9154327802967,-73.9154129090081,-73.9153768011705,-73.9153363698117,-73.9152975529992,-73.9152602938725,-73.915185492377,-73.9151453494572,-73.9151034718225,-73.9150718857621,-73.9150324429906,-73.9149923101569,-73.9149562170526,-73.9149236143769,-73.9148914534752,-73.9148542962049,-73.914812003414,-73.91477047212,-73.9146947696882,-73.9146614460975,-73.9146294466243,-73.9145603874642,-73.9144206985687,-73.9143866763601,-73.9143565257403,-73.9143386047636,-73.9143279797447,-73.9143340251042,-73.9143418953652,-73.9143637397223,-73.9143943284774,-73.9144126777679,-73.9144320504709,-73.9144443935677,-73.9144557861914,-73.9144642930279,-73.9144585986722,-73.9144417752447,-73.9144030684122,-73.9143930884403,-73.9143802634552,-73.9143717701619,-73.9143664973898,-73.9143653335133,-73.9143532173149,-73.914343963579,-73.9143293246253,-73.9143108166108,-73.9142977634743,-73.9142833750804,-73.9142574196969,-73.9142369244518,-73.9142141072634,-73.9141761412381,-73.9141684620959,-73.9141668522852,-73.9141820042773,-73.9141877018788,-73.9141822088067,-73.91417322816,-73.9141539194827,-73.914139678847,-73.9141325725105,-73.9141239526859,-73.9141058657211,-73.9140810716332,-73.914054904743,-73.9140218193195,-73.9139318291414,-73.9138805329889,-73.9138505061941,-73.9138166967135,-73.9137907406298,-73.9137611149445,-73.913726006249,-73.9137094703205,-73.913702864317,-73.9136961454761,-73.9136756762096,-73.9136466739328,-73.9136143267,-73.9135275871485,-73.9134352510518,-73.9133591144628,-73.9133350692023,-73.9133100897815,-73.913293102937,-73.9132754302322,-73.9132601481827,-73.913244866795,-73.9132191248818,-73.9131830787932,-73.913145021746,-73.9131127601354,-73.9130704563262,-73.91303517142,-73.9130063968499,-73.9129778681807,-73.9129690516787,-73.9129454191364,-73.9129289192581,-73.912930629038,-73.912945016827,-73.912959078388,-73.9129720797649,-73.9129803602876,-73.9129953721431,-73.9130049373253,-73.913006822421,-73.9130481141271,-73.913054395772,-73.9130417041944,-73.9130193231835,-73.9129938424696,-73.9129818894497,-73.9129633425216,-73.9129462568751,-73.9129379387424,-73.9129438870421,-73.9129530042072,-73.9129578768319,-73.9129544439206,-73.9129462246988,-73.9129320729492,-73.9129096045791,-73.9128927058131,-73.9128884734803,-73.9128894847222,-73.9128858784707,-73.9128883021146,-73.9128947357859,-73.9128904277056,-73.9128735664389,-73.9128537958871,-73.9128299648527,-73.9128148124989,-73.9128039595741,-73.9127915566794,-73.9127698601734,-73.912753122262,-73.9127234589584,-73.9126932927514,-73.9126622109673,-73.9126422880589,-73.9125826795245,-73.9125307903315,-73.9125121275723,-73.9125011108394,-73.9124923404176,-73.9125040570049,-73.9125070558335,-73.9125073523522,-73.9124970981476,-73.9124744504414,-73.9124499909523,-73.9124027092491,-73.91237934988,-73.9123471443585,-73.9122702557757,-73.912250081346,-73.9122316671484,-73.9122205227265,-73.9122249968691,-73.9122405854893,-73.9123274913306,-73.9123696252465,-73.91241554493,-73.9124548328969,-73.912484037605,-73.9124983164753,-73.9124995142279,-73.9124900946457,-73.9124840487742,-73.9124432502063,-73.9124020267366,-73.9123755323444,-73.9123510482274,-73.9123291495486,-73.9123063260794,-73.9122884759118,-73.9122632047922,-73.9122340367465,-73.9121369264972,-73.9120428482675,-73.9119964425542,-73.9119816384673,-73.9119761950232,-73.9119740573841,-73.9119706478938,-73.9119633293296,-73.9119555465508,-73.9119360708442,-73.9119105886035,-73.9118854042794,-73.9118657297485,-73.9118483521907,-73.9118287771951,-73.9118027936418,-73.9117865670516,-73.9117524633354,-73.9116853427978,-73.9116374602404,-73.911556050379,-73.9115207341232,-73.9115023316449,-73.9114803459921,-73.9114414690023,-73.9113869136904,-73.9113200784103,-73.9112863598385,-73.9112820739052,-73.9112737538341,-73.9112782380327,-73.9112905774616,-73.9113423155129,-73.9113972019499,-73.9114520608356,-73.9114752333858,-73.9114832760197,-73.9114996013073,-73.9115174012135,-73.9115416117162,-73.9115710034729,-73.9116053180548,-73.9117501692078,-73.911838086706,-73.9119719708825,-73.9121351874067,-73.9123155420279,-73.9124878145035,-73.9126239724757,-73.9128091019642,-73.9128457496793,-73.9129824938361,-73.9131765000868,-73.9133445105788,-73.9135272991878,-73.9136239458856,-73.913711299861,-73.9137578059496,-73.9137594677359,-73.9138185656496,-73.9139558373651,-73.9140795447299,-73.9141518593633,-73.9142745011442,-73.9143867033748,-73.9144408160937,-73.914498863424,-73.9146318440628,-73.9149272537049,-73.9150142040297,-73.9150552017076,-73.9152602172067,-73.9154347891476,-73.9155338116844,-73.915654284721,-73.9157976770829,-73.9160202569389,-73.9161400152494,-73.9162085837168,-73.9163114542804,-73.9164253673688,-73.9164864681709,-73.9165644083998,-73.9166460962574,-73.9167525002006,-73.916844193686,-73.9169404636913,-73.9170590491502,-73.9171706875147,-73.9173008230307,-73.917400316965,-73.9174727568556,-73.9175428264031,-73.9176559499189,-73.9177451139125,-73.9178718350552,-73.9179531674513,-73.9180154429836,-73.9180700430863,-73.9181401186959,-73.9182225636431,-73.9184699334942,-73.9185654146302,-73.9186419887748,-73.918663987797,-73.9187688154804,-73.9188552089824,-73.9190324465495,-73.9191480033092,-73.9192758349004,-73.9194045256148,-73.9195547389229,-73.9196702977618,-73.9197966193003,-73.919889006175,-73.9200198391403,-73.9201613688444,-73.9202913480022,-73.9203859749159,-73.9204837313242,-73.9205807274262,-73.9206908544314,-73.9208180318996,-73.9209704859754,-73.9211015498323,-73.9213218375612,-73.9214412496221,-73.9215483513951,-73.9216538372553,-73.9218193970368,-73.9219564179251,-73.922072602898,-73.9222127187776,-73.922378935374,-73.9225235966035,-73.922647452215,-73.922811365913,-73.9229422666663,-73.9230930457787,-73.9232138446036,-73.9233053131361,-73.9233645621588,-73.9234322328644,-73.9235283444922,-73.9236306089874,-73.9237413694447,-73.9238189801508,-73.9239181213014,-73.9240049525131,-73.9240840821462,-73.9241424063894,-73.9242861807158,-73.9243776503876,-73.9244360409498,-73.9245204672411,-73.9246257016451,-73.9247392581667,-73.9248505137917,-73.9249632482277,-73.9250944489741,-73.9252187554043,-73.9255737274039,-73.9255918819244,-73.9255974402587,-73.9256036580788,-73.9256204999699,-73.9256344639744,-73.9256380583402,-73.9256457081107,-73.9259909277581,-73.9262678535249,-73.9263038203984,-73.9271253183681,-73.9282302525206,-73.929437458406,-73.9294466193238,-73.9294729498456,-73.929466011776,-73.929632480749,-73.929936904353,-73.9299834173285,-73.9287156972737,-73.92863344177,-73.9279589375641,-73.9270927808393,-73.925945807442,-73.9252412425509,-73.9246647476181,-73.9246539325931,-73.9240846472311,-73.923791477666,-73.9235048569352,-73.9228485463533,-73.9227960812382,-73.922367608929,-73.9211616247793,-73.9209287181441,-73.9207565880955,-73.9198693072058,-73.9190857231541,-73.9183322456026,-73.9175750002432,-73.9172301984166,-73.9171359020326,-73.9157540475484,-73.9158289001943,-73.9154533335453,-73.9150832214209,-73.9147195183528,-73.9143631573804,-73.914122348,-73.913847871606,-73.9129033815855,-73.9128439827589,-73.9127820379921,-73.9127250938929,-73.9125539169126,-73.9125337530749,-73.91255362999,-73.9125645856406,-73.9125663016206,-73.912558728073,-73.9125420851364,-73.9125168565452,-73.9124837755684,-73.9124742597049,-73.912471360111,-73.9124751148233,-73.9124854745578,-73.9125006491401,-73.9125027871405,-73.9125059887557,-73.9124983136451,-73.9124777354631,-73.9124429998138,-73.9124137811955,-73.9123941214235,-73.912381993484,-73.912377906725,-73.9123697232459,-73.9123679028881],"lat":[40.5845261742473,40.584505245574,40.5844996692697,40.5845023919406,40.5845061845565,40.5844843274259,40.5844612524211,40.5843788258298,40.584319948276,40.5842776833718,40.5842497493001,40.5842248564705,40.5842002349709,40.5841798511356,40.5841726181262,40.5841686721022,40.5841599385335,40.5841451891405,40.5841201140768,40.5840893999207,40.5840675828087,40.5840245827606,40.5839669322481,40.5839502980258,40.5839264750153,40.5839160941304,40.583916130534,40.5839137887765,40.5839005515479,40.5838863557107,40.5838757530066,40.5838754580329,40.5838863327101,40.5838946304229,40.5838942725874,40.5838879564148,40.5838751536066,40.5838527045327,40.5838306284868,40.5837538797551,40.5836999416693,40.5836752416365,40.5836503074577,40.5836234495917,40.5836059968193,40.5836041503622,40.5836084612736,40.5836107332543,40.5836202295944,40.5836429269031,40.5836540421742,40.5836556305386,40.5836447682448,40.5836270844997,40.583566931324,40.5835400283778,40.5835149340398,40.5834884754652,40.5834527611928,40.5834248055065,40.5833927840273,40.5833699735122,40.5833517539238,40.5833375354725,40.5833128584809,40.5832907249298,40.5832713527783,40.5832459135252,40.5832263247425,40.5832043250155,40.5831454049874,40.5830928733655,40.5830704598273,40.5830341700889,40.5830075484956,40.5830079647886,40.5830139218665,40.58302555473,40.5830393284431,40.5830556466096,40.5830781178634,40.5831114957203,40.5831294023787,40.5831511617276,40.5831735095837,40.5831847106544,40.5831867164534,40.5831731737396,40.5831491732927,40.5831332667575,40.5831174295006,40.5831101249159,40.5831064495378,40.583087744027,40.5830665012918,40.5830408713711,40.5830307092351,40.5830303097622,40.5830322962412,40.583028121267,40.5830207001216,40.5829913359189,40.5829809687112,40.5829846827013,40.5829895462301,40.5829898805527,40.5829862702439,40.5829759797955,40.5829681808734,40.5829674214545,40.582967244219,40.5829568409664,40.58294421935,40.5829238851826,40.582907330475,40.5829017306761,40.5828954375573,40.5828848348833,40.582873456235,40.5828562671216,40.5828520021632,40.5828576953013,40.5828646812706,40.5828667455329,40.5828578714389,40.5828452856494,40.5828295835957,40.5828115414373,40.5827989927158,40.582797920383,40.5828067895464,40.5828090541182,40.5827989313828,40.5827775678123,40.5827657716538,40.5827588465134,40.5827576344028,40.5827728358466,40.5827767104019,40.5827875842665,40.5828039846663,40.5828173853823,40.582833823241,40.5828485313676,40.5828604264247,40.5828664605972,40.5828705073167,40.5828698708126,40.5828726103676,40.5828850958631,40.5828949273539,40.582911918564,40.5829381639581,40.5829620462995,40.5829820995192,40.5830055227934,40.5830270040109,40.5830478456148,40.583074250139,40.5830944215466,40.5831052595343,40.5831124804548,40.5831211430854,40.5831334037947,40.5831491920241,40.5831528403286,40.5831533612718,40.5831514512163,40.5831305668679,40.5831252229687,40.5831252082046,40.5831245869277,40.5831179172365,40.5831085038388,40.583104517916,40.583103942297,40.5830951512282,40.5830872921916,40.5830759533725,40.5830530854807,40.5830448278762,40.5830427114222,40.583039709132,40.5830326723327,40.5830225372189,40.5830082526312,40.5829901782514,40.5829773219317,40.5829645873722,40.582955453539,40.582945633136,40.5829418403232,40.5829363934056,40.5829316788436,40.5829144708701,40.5829084994437,40.5829067560584,40.5829083695823,40.5829071479154,40.5828980497767,40.5828914289383,40.5828830288017,40.5828612380433,40.5828574376339,40.5828626082507,40.5828751586287,40.5828933278566,40.5829220099553,40.5829349119246,40.5829609264229,40.5830191062994,40.583041939564,40.5830585727647,40.5830660081703,40.5830757285758,40.5831115340889,40.5831403382153,40.5831520136998,40.5831593868615,40.5831492431489,40.5831361391065,40.5831124099561,40.5830983638143,40.583098847118,40.5831052166401,40.5831191294635,40.5831421683203,40.5831882587298,40.5832117802044,40.5832299111136,40.5832426634834,40.5832527892873,40.5832488590087,40.5832358881392,40.5832270108362,40.583218131189,40.5831908017496,40.5830589776529,40.5829233708975,40.582892885462,40.5828704393254,40.5828431210236,40.5828178694413,40.5827963291212,40.582782368347,40.5827620485571,40.5827477026872,40.5827344790914,40.5827266962727,40.5827257775073,40.5827317864467,40.5827846474601,40.5828111322666,40.5828106600774,40.5828085815956,40.5828027315618,40.5828081834884,40.5828192601164,40.5828188704256,40.5828139181088,40.5828018834514,40.5827913133986,40.5827699063266,40.5827475569682,40.5827308075115,40.5827160298983,40.5827068791122,40.5826982063461,40.5826778593002,40.5826688714655,40.5826680628027,40.5826733771036,40.5826744922903,40.582666027294,40.5826432595814,40.5826382603421,40.5826354507783,40.5826351193023,40.582633766522,40.5826277774287,40.5826158082472,40.582598467086,40.5825767936819,40.5825576996181,40.5825502335914,40.5825466620962,40.5825389120846,40.5825238493454,40.5825138229524,40.5825062718019,40.5824831307419,40.5824647912559,40.5824542212358,40.5824422995623,40.5824357583402,40.582434264438,40.5824332654465,40.5824344567239,40.5824408471258,40.5824440277518,40.5824438002923,40.5824387731062,40.5824338012951,40.5824256129071,40.582418243573,40.5824108165677,40.5824067135214,40.5824006296133,40.5823914518614,40.5823875369874,40.5823919195578,40.5824033566933,40.582410403774,40.5824184431921,40.5824145620584,40.5824070692434,40.5823998616341,40.5823885966045,40.5823781038054,40.5823754084138,40.5823750466269,40.5823911223894,40.5824060726825,40.5824075500826,40.5824033133501,40.5823931244638,40.5823837626942,40.582371927286,40.5823656534873,40.5823640737987,40.5823635806399,40.5823648683055,40.5823715649993,40.58236942347,40.5823632479205,40.5823640691622,40.5823707075749,40.5823815262375,40.5823979921967,40.5824305768173,40.5824626626632,40.5824814651558,40.5824908554891,40.5824940931083,40.5824869263417,40.5824753668309,40.5824416325292,40.5824316446358,40.5824275036584,40.5824065084561,40.5823822237872,40.5823831580494,40.5823963380756,40.5824186125049,40.582451542222,40.58248061427,40.5824915169265,40.5824980104033,40.582507503306,40.5825167401453,40.5825411552459,40.5825733895739,40.5825892624299,40.5826092778161,40.5826140506801,40.5826226002508,40.5826269642111,40.5826323646276,40.5826395727442,40.5826372888511,40.5826215565823,40.5826021511085,40.582589542854,40.5825916763123,40.5826081896694,40.582611332458,40.5826000964031,40.5825906979868,40.5825890048325,40.5825972519227,40.5826198795151,40.5826641786278,40.5827006799134,40.5827207152381,40.582751138353,40.5827729363527,40.582789647505,40.5828013616625,40.5828112571092,40.5827983453569,40.5827818712269,40.5827653684904,40.5827491332569,40.5827402209125,40.5827355083379,40.5827362527118,40.5827262754623,40.5827219556406,40.5827227560347,40.5827267649564,40.5827250716963,40.5827230737879,40.5827288938743,40.5827381314297,40.5827520146631,40.5827693847702,40.5827853166926,40.582801297148,40.5828153530152,40.5828806147181,40.5829305828947,40.5829540210144,40.5829507365569,40.5829464907756,40.5829419489652,40.5829394922091,40.5829386034885,40.582937713091,40.5829390660523,40.5829451042258,40.5829485619189,40.5829513915584,40.5829531167757,40.5829559161285,40.5829637461172,40.582974592821,40.582972802624,40.5829566727389,40.5829381328143,40.5829246302278,40.5829062504127,40.5828894908615,40.5828587034286,40.5828313434227,40.5828043190494,40.5827851401446,40.5827746838783,40.5827489134154,40.5827354960411,40.5827214605317,40.5827135397162,40.5827067401693,40.582707197184,40.5827126464398,40.5827293487509,40.5827567350282,40.5827792474581,40.5827995110272,40.5828180421405,40.5828284972333,40.582835792779,40.5828383067249,40.5828415828232,40.5828524399962,40.5828684665119,40.5828925385863,40.5829253642612,40.5829440856767,40.5829792509741,40.5829975834757,40.583007286731,40.5830122672988,40.5830108493443,40.5830070511782,40.5829925772731,40.582979254961,40.5829692480369,40.5829666002565,40.5829657543199,40.5829646878597,40.5829726515404,40.5829845768911,40.5830322362461,40.5830677150169,40.5830789539308,40.5830791931501,40.5830685629229,40.5830562477067,40.5830486200272,40.5830404955753,40.5830363425839,40.583038905455,40.5830495646465,40.5830586133972,40.5830544234308,40.5830419105473,40.5830071290306,40.5829906727825,40.5829761112937,40.5829633400481,40.5829568925756,40.5829567398022,40.5829573281724,40.582947945661,40.5829342286816,40.5829266286611,40.5829202554719,40.5829042635952,40.5828958933936,40.5828861696765,40.5828849024016,40.5828912942309,40.5828927724168,40.5828908582928,40.5828938583312,40.5829008420108,40.5828992325601,40.5828949085681,40.5828934898991,40.5828987107923,40.5829104929674,40.5829146485911,40.582915793301,40.5829203932102,40.5829270309142,40.5829367464898,40.5829559843048,40.5829642131069,40.5829687091632,40.5829678433549,40.5829633772526,40.5829507861927,40.582936910382,40.5829286346634,40.582921264093,40.5829130641873,40.5829064641352,40.5828867028039,40.5828435030038,40.5828169524676,40.5827708863958,40.5827429714065,40.5827195714557,40.5826847229584,40.5825999889115,40.5825011883746,40.5823791582415,40.5823135862924,40.5822964202554,40.5822630990806,40.5822213272183,40.5821739071326,40.5820888844634,40.5819927769279,40.5818878304872,40.5818436301023,40.5818321618675,40.581818780962,40.5818065527877,40.5817940271557,40.5817829876402,40.5817781014106,40.5817621550599,40.5817602189037,40.5817610357395,40.5817696689982,40.5817758453859,40.581769306881,40.581765759875,40.5817584077606,40.5817569534329,40.5817459954437,40.5817194078582,40.58169463881,40.5816576124537,40.5816409412492,40.5816287376978,40.5816294614978,40.5816294880422,40.5816411428525,40.5816680905005,40.5816889321124,40.5816971388253,40.5817063436689,40.5817160336423,40.5817126972276,40.5817015427681,40.581665506879,40.5815474612214,40.5815392955171,40.5815436077226,40.5815786736072,40.5816030931733,40.5816150778661,40.5816328429132,40.5816587498146,40.5816973949216,40.5817095601007,40.5817209455099,40.5817362536108,40.5817590086326,40.5817614272904,40.5817820299036,40.5818096184825,40.5818493585736,40.5818792329971,40.5819049671486,40.5819346691845,40.5819632687715,40.5819987430712,40.5820373511188,40.5820614756562,40.5820803810756,40.5821036563312,40.582110718913,40.5821128681689,40.5821082612522,40.5821125601189,40.5821227548728,40.5821386971728,40.5821651065986,40.582247295964,40.5822712989531,40.5822931013784,40.5822993646316,40.5823355889779,40.5823707566693,40.5824281920395,40.5824626114332,40.5824986851451,40.5825394534935,40.5825853420625,40.5826197609315,40.5826552572084,40.5826781029928,40.5827036378509,40.5827273421952,40.5827452461879,40.5827616434088,40.5827821049724,40.5828037473451,40.5828346744729,40.5828777732066,40.5829172112463,40.5829632492981,40.583028012458,40.5830624042043,40.5830950861595,40.5831242811271,40.5831642198465,40.5831949998774,40.5832194251268,40.5832513329165,40.5832842457575,40.5833091009023,40.5833305669783,40.583364081419,40.583395460105,40.5834226248458,40.5834429343216,40.5834523008393,40.5834613152624,40.5834720102272,40.5834831083979,40.5834965166212,40.5835116311518,40.5835187647782,40.5835251429811,40.5835298671474,40.5835317299498,40.5835301776124,40.583544490505,40.583553881969,40.5835582034443,40.5835547455107,40.5835546494114,40.5835475050069,40.5835380264727,40.5835261871336,40.5835154039357,40.5835064242463,40.5835139010564,40.583498616035,40.5834665729239,40.5834553826316,40.5834538207692,40.583461138616,40.5834773939806,40.5834887624548,40.5835231719093,40.5835506919363,40.5835529339395,40.5835792738834,40.583525761222,40.5834189297596,40.583372643646,40.5833743155054,40.5834156281985,40.5833988086255,40.584122815037,40.5842334352726,40.5842325662829,40.5842315336653,40.5842080591651,40.5841398649231,40.5840259719442,40.5839536177232,40.5838744269389,40.5838732362516,40.5838105496045,40.5837843485854,40.5837591122947,40.5837328958707,40.5837307998489,40.5837136828037,40.5837090024076,40.5837138022341,40.5837173473468,40.5837551948854,40.5838300257755,40.5839019751362,40.5840069337284,40.5840621972455,40.584077310797,40.5844232681167,40.5845251540852,40.5846279347572,40.5847426679417,40.584869066249,40.5850068246937,40.5851097007037,40.5852318404784,40.5858106764392,40.5857569797572,40.5857070064198,40.5856536876868,40.5855263360063,40.58534227012,40.5853035256613,40.585262770151,40.5852211881347,40.5851799881777,40.585140367739,40.5851034783674,40.5850703922325,40.5850267024159,40.5849824695578,40.5849382741018,40.5848946959993,40.5847417973841,40.5847316239427,40.584707306966,40.5846860195181,40.5846651774191,40.584650746268,40.5846446941103,40.5846373621049,40.5846231533945,40.5845938676349,40.5845616521784,40.5845261742473]}],[{"lng":[-73.8632747107196,-73.8638123946197,-73.8644924533569,-73.8650358927805,-73.8655792529256,-73.8663761931267,-73.8670023299128,-73.8677279690368,-73.8689509792263,-73.8689629221041,-73.869257580513,-73.8696863104371,-73.8700031364301,-73.8703477840131,-73.8705059791845,-73.8705138809595,-73.8706149779442,-73.8708474394764,-73.8709979164803,-73.8711592267543,-73.869813564821,-73.8684967164721,-73.867592757752,-73.8669026817396,-73.866350521641,-73.8647622296209,-73.8643082669254,-73.8637111879819,-73.8632727349283,-73.8627415602877,-73.8627234849807,-73.8623137461719,-73.8619321622174,-73.8614940111164,-73.8612529937737,-73.8613758412504,-73.8615082436249,-73.8615914017584,-73.8616744786746,-73.8619222039882,-73.8621862457983,-73.8624996564085,-73.8628294860507,-73.8631756329361,-73.8632747107196],"lat":[40.5838768485318,40.5836040035887,40.5836149381788,40.5833020600857,40.583026802455,40.5825386578675,40.5819770802755,40.5816634094289,40.5817135421227,40.5816937947886,40.5819096405709,40.5823087857919,40.5826366143133,40.5830641370353,40.5833419525112,40.5840823269006,40.5849153510604,40.5854210541284,40.5860617978628,40.5868738879673,40.5894609267883,40.5900898502896,40.5910057916907,40.5914730354414,40.5918926765648,40.5914922185828,40.5914147443264,40.5911292819831,40.5909080756926,40.5903664065974,40.5900745107534,40.589518746808,40.5888989453747,40.5885424730994,40.5879880859212,40.5873734200329,40.5869848199976,40.5865459962742,40.5861447949937,40.585668547723,40.5852550222771,40.5848290148766,40.5844155671425,40.5840648408604,40.5838768485318]}],[{"lng":[-73.8695270754893,-73.869670707115,-73.8702089983623,-73.8695270754893],"lat":[40.5987137503545,40.5966885636221,40.5969542327894,40.5987137503545]}],[{"lng":[-73.8701949148995,-73.8710814181148,-73.8704941191478,-73.8702628056502,-73.8701949148995],"lat":[40.5989964059019,40.5989011474702,40.6026044462046,40.601681221756,40.5989964059019]}],[{"lng":[-73.8524333580702,-73.8526902935183,-73.8528611743197,-73.8536531642096,-73.853995595994,-73.8543697470413,-73.8546586309012,-73.8549264858156,-73.8559530056204,-73.8567336439498,-73.8571613235071,-73.8577811996852,-73.8604442053396,-73.8605497798519,-73.8614148516693,-73.8617727637101,-73.8627482079274,-73.8632866313415,-73.8633599914751,-73.8629750626097,-73.8618718984724,-73.8615408126042,-73.8611749560862,-73.8611281422454,-73.8607816916686,-73.8604888421352,-73.8590591432787,-73.8548259578297,-73.8547120072918,-73.8542738736082,-73.8537209034069,-73.8527683815584,-73.8525785163532,-73.8520453763197,-73.8517604530561,-73.8507674800156,-73.8515312289378,-73.8520048190978,-73.8524333580702],"lat":[40.5973333977953,40.5971707504633,40.5972443082327,40.5968378779478,40.5966834863468,40.5966921104023,40.5965783889276,40.5963016638707,40.5961888761897,40.596075764354,40.5960436978647,40.596117814918,40.596471906099,40.5970630201917,40.5977536963778,40.5982991785712,40.599071205422,40.5998100421632,40.6003222032738,40.6010182726156,40.6021643258159,40.6023803598694,40.602486648427,40.6025503310743,40.6026084002563,40.6023393473947,40.6020614310715,40.6018671953537,40.6016490258277,40.6014304366971,40.6014006651786,40.6009488540259,40.600570687846,40.600206622801,40.5996975138126,40.5988394438374,40.5984339362205,40.5977484382743,40.5973333977953]}],[{"lng":[-73.8670290518557,-73.8676819415421,-73.8683080846471,-73.8679350537271,-73.8670260728703,-73.8670290518557],"lat":[40.6037433888539,40.6030707666774,40.6031391606436,40.603961135453,40.6041715840083,40.6037433888539]}],[{"lng":[-73.846736514711,-73.8467246739848,-73.8467055588768,-73.8466804921793,-73.8466739233521,-73.8466693383373,-73.8466752982894,-73.8466700450561,-73.8466568389331,-73.8466443263161,-73.8466495863449,-73.846659328719,-73.8466638363763,-73.8466563829927,-73.8466436728569,-73.8466332189596,-73.8466220022054,-73.8466092761314,-73.8465958033664,-73.8465935798892,-73.8465838696311,-73.8465786561206,-73.8465779371766,-73.8465764595205,-73.8465742360573,-73.8465615311845,-73.8465473158874,-73.846530853536,-73.8465226419213,-73.8465189250828,-73.8465182070224,-73.8465099842636,-73.8464995238409,-73.8465040422265,-73.8465048146988,-73.846498090792,-73.8464839074292,-73.8464697157635,-73.8464607618506,-73.8464577928126,-73.8464555805152,-73.8464443847941,-73.8464286897227,-73.8464085066558,-73.8463942887821,-73.8463763282869,-73.846358364727,-73.8463426396984,-73.8463253967818,-73.8463014115906,-73.8462894201961,-73.8462804190395,-73.8462721728868,-73.846260188046,-73.8462317358487,-73.8462092827435,-73.8461935660021,-73.8461771030216,-73.846153151946,-73.8461478912008,-73.8461314275581,-73.8461306955487,-73.8461164855483,-73.8461022667802,-73.8460850601812,-73.8460805903788,-73.8460888413737,-73.8460971052932,-73.8461106038853,-73.8461218527779,-73.8461338485705,-73.8461525894827,-73.8461638436214,-73.8461713678443,-73.8461819013588,-73.846192414272,-73.846203674962,-73.8462209204996,-73.8462433774851,-73.846274075349,-73.8463040184263,-73.8463302342058,-73.8463512185893,-73.8463662078386,-73.8463714705055,-73.8463744928972,-73.8463962211021,-73.8464037032521,-73.8464186754288,-73.8464254412917,-73.8464329772319,-73.8464300160756,-73.8464315481455,-73.8464233551849,-73.846413681099,-73.8463735381499,-73.846325594993,-73.846291841498,-73.8462545438904,-73.8462243882593,-73.8461924276592,-73.8461675596619,-73.8461338521592,-73.8460948311765,-73.8460699936649,-73.8460663870122,-73.8460876136718,-73.8460910954315,-73.8460733164406,-73.8460395761299,-73.8460359694593,-73.8460359164565,-73.8460270036693,-73.845993274242,-73.8459754702441,-73.8459683150055,-73.8459700117361,-73.8459788091496,-73.8459574603516,-73.8459254812422,-73.8458934952107,-73.8458703997309,-73.8458171341203,-73.8458046575147,-73.8457851130077,-73.8457850474284,-73.8457832247235,-73.8457601666583,-73.8457442239997,-73.8457318104911,-73.8457158240981,-73.8456927883498,-73.8456839535454,-73.8456627130823,-73.84563257286,-73.8456006842614,-73.8455723362156,-73.8455475047911,-73.8455120589601,-73.8454854628755,-73.8454446644906,-73.8454109361757,-73.8453718736031,-73.8453416801831,-73.8453167861066,-73.8453114240995,-73.8452989566857,-73.8452865049302,-73.8452669484206,-73.8452243940402,-73.8451995813894,-73.8451801101634,-73.8451677266997,-73.8451358037115,-73.8451092022314,-73.8450808235591,-73.8450542306174,-73.845009933633,-73.8449815901674,-73.8449797809213,-73.8449531612817,-73.8449354871169,-73.8449089083116,-73.8448929812799,-73.8449018845557,-73.844932040375,-73.8449550719449,-73.844988742006,-73.8450312994224,-73.8450826977838,-73.8451305827815,-73.845189108098,-73.8452281174467,-73.8452583140359,-73.8452601375669,-73.8452708409797,-73.8452655716496,-73.8452673933642,-73.8452710039135,-73.8452923055524,-73.8453188702646,-73.8453454804301,-73.8453845500937,-73.8454235320933,-73.8454501391262,-73.8454501735512,-73.8454342410304,-73.8454058984596,-73.8454183501448,-73.8454520734477,-73.8454733973939,-73.8455035594083,-73.8455514601505,-73.8455710006338,-73.84556040995,-73.845535600499,-73.8454912454161,-73.8454504207974,-73.8454096350475,-73.8453652723702,-73.8453332805979,-73.8452959874848,-73.8452569663702,-73.8452322046224,-73.8452092131513,-73.8451862427654,-73.8451720185435,-73.8451772582891,-73.8451754052001,-73.8451841912373,-73.8451681499803,-73.8451663201525,-73.8451662574417,-73.8451750665942,-73.8451590933515,-73.8451342682181,-73.8451129947705,-73.845100539859,-73.8450739227304,-73.8450561864366,-73.8450100905631,-73.8449604604763,-73.8449267567794,-73.8448895024948,-73.8448557985775,-73.8448256270548,-73.8448095990457,-73.8447988904861,-73.844784633147,-73.8447562199112,-73.844724286852,-73.8446887971244,-73.8446532727871,-73.8446355270365,-73.8445929547508,-73.8445486578985,-73.8445362878328,-73.844497337501,-73.8444566241404,-73.8444548998268,-73.8444708816056,-73.8445045877896,-73.8445489317685,-73.8445985938799,-73.8446393740301,-73.8446854936794,-73.8447192359913,-73.8447423178189,-73.8447547853824,-73.8447831897867,-73.8448151497333,-73.8448347038198,-73.8448542540942,-73.844868498578,-73.8448845135182,-73.844884576343,-73.8448952697852,-73.844900663285,-73.844907821404,-73.8449380179261,-73.8449504822388,-73.8449629528249,-73.8449594589893,-73.8449435414562,-73.8449365107872,-73.8449312743244,-73.8449543857751,-73.8449615310729,-73.8449935291146,-73.8450113208845,-73.8450167111655,-73.845011449564,-73.8449777373967,-73.8449245188521,-73.8448979358373,-73.8448855846381,-73.8448856882952,-73.8448857793855,-73.8448840713146,-73.8448788160604,-73.8448789040146,-73.8448772078555,-73.8448790422277,-73.8448897254811,-73.8449163839741,-73.8449057980898,-73.8448916446555,-73.8448987838596,-73.8449148015157,-73.8449219909514,-73.844948643096,-73.8449770589539,-73.8450142913461,-73.8450355272397,-73.845054972993,-73.8450673266688,-73.8450974036336,-73.8451150805228,-73.8451380679119,-73.8451788133362,-73.8452160358028,-73.8452444172123,-73.8452763404146,-73.8453206870008,-73.8453756798037,-73.8454182742698,-73.8454501778196,-73.8455016446784,-73.845522974638,-73.8455159202865,-73.8455088838306,-73.845523131045,-73.8455338118702,-73.8455125311149,-73.8454770576535,-73.8454397594256,-73.8454113317609,-73.8453563045752,-73.845308386451,-73.845260494972,-73.8452108431042,-73.8451718491169,-73.8451559482099,-73.845154214285,-73.8451542519129,-73.8451791268494,-73.8451951325219,-73.8452146974544,-73.8452395504173,-73.845262631822,-73.8453034528079,-73.8453478417726,-73.8453744662542,-73.8453940192407,-73.8454118013234,-73.8454419848075,-73.8454650849263,-73.8454828169123,-73.8454881130702,-73.8455058307385,-73.8455235783731,-73.8455307104605,-73.8455307323568,-73.8455449203082,-73.8455715440779,-73.8455928857658,-73.8456230379246,-73.8456478276068,-73.8456442279648,-73.8456423970208,-73.8456281871771,-73.8456139788714,-73.8456281402858,-73.8456458423583,-73.8456440310464,-73.8456776891496,-73.8457060157744,-73.8457538656898,-73.8457786780002,-73.8457999065968,-73.8458282208117,-73.8458530010609,-73.845881370181,-73.845895586057,-73.8459027243188,-73.8459187244546,-73.8459435704629,-73.8459577520056,-73.8459807740804,-73.8459966886777,-73.8460179349478,-73.8460214231025,-73.8460036317693,-73.8459893969623,-73.8459875643352,-73.8460212017192,-73.8460193584275,-73.8460210302234,-73.8460209803353,-73.8460191339224,-73.8460492364545,-73.8460864879206,-73.8461130744548,-73.8461360935678,-73.8461609029659,-73.8461839345614,-73.8461945098269,-73.8461962396016,-73.8462157246846,-73.8462494268153,-73.8462795861787,-73.8463168501528,-73.8463293002404,-73.8463275868669,-73.8462708914103,-73.8462691883159,-73.8462710221585,-73.8462923364037,-73.8463278140348,-73.8463384253725,-73.8463525821147,-73.8463738679112,-73.8464146889977,-73.8464448383116,-73.8464714149036,-73.8464908775884,-73.8465156683949,-73.8465404150494,-73.8465740836477,-73.8466095697862,-73.8466663213298,-73.8466574001051,-73.8466236243379,-73.8466058517428,-73.8466022515142,-73.8466234845722,-73.8466252064737,-73.8466074338566,-73.8465755041609,-73.8465524438006,-73.8465222881478,-73.8464761734272,-73.8464513141493,-73.8464388503006,-73.8464139736631,-73.8463890981454,-73.8463819692854,-73.8464032334182,-73.8464369378611,-73.8464794943477,-73.8465149535328,-73.8465503994142,-73.8465734156607,-73.846596454982,-73.8466195085207,-73.8466442997216,-73.8466513668647,-73.8466371516153,-73.8466317766747,-73.8466299531536,-73.8466458841174,-73.84666364437,-73.8466902801933,-73.8467186674497,-73.8467382079428,-73.8467577521907,-73.8467843327935,-73.846807346034,-73.8468268778654,-73.8468446535952,-73.8468464615394,-73.8468677629823,-73.8469067918413,-73.8469546581866,-73.8469848015338,-73.8470042954995,-73.8470398034892,-73.8470610520454,-73.8470911861199,-73.847114200778,-73.8471177079688,-73.847137177864,-73.8471549597201,-73.8471461491629,-73.8471408761023,-73.8471621509865,-73.8471833964861,-73.8472170515024,-73.8472312257943,-73.8472596114902,-73.8472826904976,-73.8472756161676,-73.8472827307001,-73.8473004784938,-73.8473306528016,-73.8473448781002,-73.8473396085085,-73.8473502982834,-73.8473716279262,-73.8473929485051,-73.8474231165792,-73.8474532815578,-73.8474780937282,-73.8474957797153,-73.8475170422595,-73.8475329696597,-73.8475577787762,-73.8475896713115,-73.8476109325694,-73.8476108893659,-73.8476232664998,-73.847640964911,-73.8476551198535,-73.8476692763493,-73.8477011685247,-73.8477224342392,-73.8477366748901,-73.8477402560299,-73.8477456173841,-73.8477704303129,-73.8478005244561,-73.8478129108988,-73.8478306179643,-73.8478447637228,-73.8478624837863,-73.847862449897,-73.8478553169331,-73.8478552676362,-73.8478605488692,-73.8478463280366,-73.8478427425131,-73.8478355917049,-73.8478568451698,-73.8478319735967,-73.8478106615772,-73.8477822372432,-73.8477645549947,-73.8477427213121,-73.8477196423054,-73.8477183471647,-73.8477144224283,-73.8477131373455,-73.8477032789624,-73.8476973712137,-73.8476742956824,-73.8476650278307,-73.8476676083017,-73.84766560304,-73.8476471115898,-73.8476207138464,-73.8475897005346,-73.8475613312032,-73.8475316472383,-73.84750989214,-73.8474808703417,-73.847455136569,-73.8474254378983,-73.8473792425945,-73.8473462439172,-73.8472993710027,-73.8472703308094,-73.8472419470223,-73.8472214732067,-73.8471977035976,-73.8471561251946,-73.8471185192691,-73.8470994087015,-73.8470968031095,-73.8470803188753,-73.84707633416,-73.847069695694,-73.8470564605503,-73.8470399396574,-73.8469983533302,-73.8469726126194,-73.8469521268444,-73.8469382361423,-73.8469296383652,-73.846900583128,-73.8468425141626,-73.8468379292647,-73.8468353187251,-73.8468320445948,-73.8468096368558,-73.8467806081665,-73.8467542324925,-73.8467364431291,-73.8467364812289,-73.846736514711],"lat":[40.6048530148517,40.6048369051903,40.6048278267474,40.6048237705972,40.6048111879216,40.6047960936122,40.6047870486141,40.6047759772999,40.6047794808121,40.6047723550105,40.6047626662698,40.6047569755654,40.6047489964621,40.6047358679674,40.6047307172403,40.6047210075318,40.6047170000048,40.6047186934953,40.6047198162205,40.604710116991,40.6047021189123,40.6046912754868,40.6046787264137,40.6046701688865,40.6046610394238,40.6046536076154,40.6046518781622,40.6046512852411,40.6046427187211,40.6046318767887,40.6046187572791,40.6046147537393,40.6046073249214,40.6045953526098,40.604584517175,40.6045799446962,40.604564525787,40.6045525291539,40.6045411097861,40.6045308391204,40.6045165769069,40.6045034440685,40.604494867543,40.6044845733706,40.6044845543693,40.6044845303637,40.6044856470583,40.6044901890319,40.6045032850313,40.6045197931279,40.6045277622086,40.6045368766647,40.6045431391057,40.6045476860707,40.604554492418,40.6045556030826,40.6045555820508,40.6045555600182,40.6045572391043,40.6045669283241,40.604566906284,40.6045594911264,40.6045560493097,40.6045560302711,40.6045537263178,40.6045445938371,40.6045366202718,40.6045223715775,40.6045104118087,40.6045001608408,40.6044904806389,40.604476246469,40.6044637134196,40.6044460414408,40.6044221000185,40.6044061436853,40.6043907582864,40.6043765221042,40.604373700298,40.6043668969515,40.6043629444391,40.6043527127948,40.6043390520293,40.604329375805,40.6043191161402,40.6043065720664,40.6042951937013,40.6042957746407,40.6042935125645,40.6042804037244,40.6042575984779,40.6042433352629,40.6042279373444,40.604211385054,40.6041874166058,40.6042194161724,40.604240984469,40.6042625710536,40.6042828009256,40.6042827605818,40.6042962381012,40.6043110767318,40.6043123830692,40.6043109793634,40.6043122975596,40.6043379808379,40.6043636978774,40.6043920935669,40.6044096464308,40.6044258246097,40.6044515078868,40.604474491666,40.6044934078588,40.6045041776895,40.6045325460301,40.6045582245492,40.6045920261985,40.604623133943,40.6046501448984,40.6046717337531,40.6046960268479,40.6047108682931,40.6047324280667,40.604758099939,40.6047715934994,40.6047999844372,40.6048216143821,40.6048202313111,40.6048107458486,40.6048093777281,40.6048188203353,40.604807972712,40.6047930889375,40.6047727806576,40.6047659803716,40.6047483620361,40.6047334515345,40.6047320660381,40.6047184986147,40.6047130550155,40.6047130001587,40.6047237704902,40.6047399418167,40.6047561252326,40.6047817796718,40.6047993479559,40.6048209635659,40.6048358187175,40.6048547205226,40.6048465506165,40.604837053133,40.604819451405,40.6048045634805,40.6048018157097,40.6047990756043,40.6047976858966,40.6047908895701,40.6047691981216,40.6047529358538,40.6047678058289,40.6047731777677,40.6047447622267,40.6047325582067,40.6047163126713,40.6047014527735,40.6047014934643,40.6047136928613,40.6047286101908,40.6047354273893,40.6047544243111,40.6047585450656,40.6047640317594,40.6047708447758,40.6047533087622,40.6047316794965,40.6047060069712,40.604683016027,40.6046627377151,40.6046357030085,40.6046289717086,40.6046479350942,40.6046466187753,40.6046277443816,40.6046467237769,40.6046467595588,40.6046318883624,40.6046183471529,40.604600732359,40.6045858771942,40.604577811112,40.6045616159097,40.6045589522006,40.6045563124904,40.6045441715958,40.6045211728446,40.6045103239786,40.6045143200754,40.6045250807109,40.6045196186821,40.6045263183084,40.6045533160009,40.6045708413096,40.6045694366492,40.6045383075198,40.6045085327307,40.6044692945689,40.6044841466509,40.6045193058848,40.6045531034347,40.6045896189043,40.6046220447094,40.6046463775535,40.6046734182093,40.6046991175148,40.6047031517134,40.6046990625478,40.6046936255317,40.6047098332908,40.6047138531318,40.604712477093,40.6047015987446,40.6046853079312,40.6046852624609,40.6046865648207,40.6046865193293,40.6046932379029,40.6047202570019,40.6047486335684,40.6047770060113,40.6047904874194,40.6047917964106,40.6047971568067,40.6048173890579,40.6048200686588,40.6048200111019,40.6047983188055,40.6047780224818,40.6047455218719,40.6047089636479,40.6046873289229,40.6046805907428,40.604679284221,40.6046806963363,40.604683467587,40.6046916341542,40.6046916964879,40.6046755187091,40.6046660858254,40.6046444709456,40.6046350452432,40.6046215686172,40.6046040188468,40.6045878213646,40.6045648567418,40.6045432471385,40.6045162064826,40.6044945891928,40.6044635011859,40.6044364712773,40.6044189353473,40.6043986730733,40.6043757060453,40.6043527174813,40.6043324157449,40.6043040140591,40.6042675033585,40.6042459033196,40.6042242805665,40.6041945793966,40.6041716195396,40.6041418836512,40.6041161884459,40.6041201986963,40.6041214790303,40.6041106269627,40.6040822192654,40.6040376031611,40.6039983960592,40.6039700020551,40.6039416027609,40.6039037471135,40.6038699447757,40.6038442598109,40.603826698727,40.6038051023093,40.603780752713,40.6037645090664,40.6037455905665,40.6037226283293,40.6036820791777,40.6036631870023,40.6036483529174,40.6036565150704,40.6036781754287,40.603706593346,40.603733650743,40.6037674901608,40.603794554727,40.603825680991,40.603848719738,40.6038609375295,40.6038609757491,40.6038637234909,40.6038637831835,40.6038625045508,40.603853098284,40.6038639573864,40.6038532103874,40.6038343109246,40.6038167254377,40.6037910278689,40.6037667122108,40.6037505020204,40.6037477698286,40.6037463695083,40.6037666001212,40.6037868409785,40.6038029909935,40.6038137420338,40.6038123261045,40.6038054992674,40.6037919269583,40.6037648654638,40.603747287625,40.6037310636322,40.6037135211383,40.6036959666929,40.6036730096944,40.6036649305551,40.603655497566,40.6036460884513,40.6036272212287,40.6036204965732,40.6036029468726,40.6035840431599,40.6035719154288,40.6035543709887,40.6035570990884,40.6035679217353,40.6035774091184,40.6035733772565,40.6035571634689,40.6035476994309,40.6035490699583,40.6035423459264,40.6035180386189,40.6035194312535,40.6035383926838,40.6035613717019,40.6035857045544,40.603593798077,40.6036018904272,40.603614078278,40.6036303254272,40.603646546368,40.6036655197019,40.6036898937155,40.6037088855762,40.603718382941,40.6037427474064,40.6037725290522,40.6037955468128,40.6038009920354,40.6037901955714,40.603771277511,40.6037564265461,40.6037510520064,40.6037551272352,40.603771382133,40.6037930351818,40.6038106391515,40.603836331935,40.6038592919492,40.603878201009,40.6039038859931,40.6039323227622,40.6039620646226,40.6040066824359,40.6040283135885,40.6040594075737,40.6040824317514,40.6040824816441,40.6040919808096,40.6041095876331,40.6041204370401,40.6041326355215,40.604162393501,40.6041813239492,40.604193517678,40.6041935627685,40.6041922509816,40.6041868936397,40.6041720378712,40.6041463474711,40.6041165284938,40.6040854297571,40.6040597447708,40.6040476049532,40.6040476523953,40.6040611863674,40.6040760772074,40.6040761056618,40.6040666961528,40.6040694406968,40.6040829964887,40.6041046542076,40.604123614948,40.6041615037573,40.6041764206211,40.6041724122702,40.6041778963478,40.6042008682959,40.6042319185121,40.6042467672086,40.6042697457513,40.6042927579394,40.6043157440876,40.6043305927843,40.604330550165,40.6043305193787,40.6043304791132,40.6043277127619,40.604338495748,40.6043587593576,40.6043776542498,40.6043951965063,40.6044100593935,40.6044195507071,40.6044195957456,40.604426413077,40.6044345718711,40.6044481401583,40.6044670978459,40.6044765926661,40.6044793276926,40.6044982889074,40.6045104659915,40.6045212632191,40.604544239394,40.6045658686812,40.6045807618517,40.6045713219844,40.6045591898633,40.604556523468,40.6045443813701,40.6045308876473,40.6045430907395,40.6045634016778,40.6045553162757,40.6045391154204,40.604524245917,40.6045175149952,40.6045162143582,40.6045284457625,40.6045338942471,40.6045420316334,40.6045285591125,40.6045448114315,40.604554315593,40.6045746258015,40.6045922071401,40.6046111599969,40.6045922566865,40.6045665563589,40.6045449176255,40.6045503542681,40.6045679580193,40.6045896344835,40.6045964138031,40.6045950994012,40.6045870181332,40.6045775446668,40.6045694426862,40.6045654093776,40.6045573380292,40.6045424845095,40.6045194936607,40.6044992287705,40.6044803289658,40.604465485365,40.6044601170696,40.6044561013939,40.6044655983903,40.604488605709,40.6044994501159,40.6045156946176,40.6045265437217,40.6045428093902,40.6045536537779,40.6045725818527,40.6045901737634,40.6046077732296,40.6046240160346,40.6046389067107,40.60465517285,40.6046646650938,40.6046430517384,40.6046281845705,40.6046106161728,40.6046201131067,40.6046471925294,40.6046607287147,40.6046742719432,40.6046945709322,40.6047027063268,40.6047175781939,40.6047337921226,40.6047554244472,40.6047730069382,40.6047865083982,40.6048027270222,40.6048270535328,40.6048419535812,40.6048581451978,40.6048689325038,40.6048878224904,40.6049076214733,40.6048976047887,40.6048905332904,40.6048794672687,40.6048643733737,40.6048492839814,40.6048316679437,40.6048180810269,40.6048095004201,40.6048225649719,40.6048482174645,40.604859279615,40.6048662960262,40.604867266709,40.6048667228312,40.6048646731803,40.6048601076661,40.604851025855,40.6048454550252,40.6048449179496,40.6048468905548,40.6048483376542,40.6048508086122,40.60486030272,40.6048627789155,40.6048667639074,40.604874783964,40.6048807876081,40.6048832466019,40.6048801788795,40.6048690891514,40.6048545004156,40.6048489466662,40.6048600061729,40.604877599142,40.6048936754011,40.604904215468,40.6049106987833,40.6049131792959,40.6049257247579,40.6049402910264,40.6049488302719,40.6049578438503,40.6049577664827,40.6049431751035,40.6049300959619,40.60491902612,40.6049069262711,40.6049043727932,40.6048962910276,40.6048841968197,40.6048676000766,40.6048530148517]}],[{"lng":[-73.8482798266716,-73.8482718721637,-73.8482602586827,-73.8482483047522,-73.8482383446829,-73.8482247402087,-73.8482131272991,-73.8482028555244,-73.8481982370712,-73.8482035586633,-73.8482085536029,-73.8482118896505,-73.8482112486073,-73.8482036385834,-73.8481847379329,-73.8481655125313,-73.8481502625949,-73.8481349869962,-73.8481316256319,-73.84811401337,-73.8480867922365,-73.8480595834012,-73.8480386880077,-73.8480201134367,-73.8480138714441,-73.8480112526741,-73.8479928149755,-73.8479822824234,-73.8479706838099,-73.8479527718675,-73.8479380345023,-73.8479206741374,-73.8479054065746,-73.8478917456295,-73.8478733327067,-73.8478686324935,-73.8478681553013,-73.8478708143167,-73.8478566080206,-73.847848209042,-73.8478350745814,-73.8478430160846,-73.8478483290589,-73.8478404571905,-73.8478367950671,-73.8478368225598,-73.8478498917147,-73.8478871736904,-73.8479095145439,-73.8479206385968,-73.8479317881064,-73.8479560058972,-73.8479858432303,-73.8479858885216,-73.8479822179441,-73.8480064566724,-73.8480437565243,-73.848090397342,-73.8481444274427,-73.8481611536162,-73.8481778892731,-73.8482132960883,-73.8482486841882,-73.8482747345733,-73.848293331234,-73.8482951695936,-73.8482746635363,-73.8482522889623,-73.8482504771925,-73.8482561056879,-73.8482614013941,-73.8482540809805,-73.8482470929625,-73.8482394514194,-73.8482407573998,-73.8482556774889,-73.8482696145289,-73.8482838830872,-73.8482895361298,-73.8483014687651,-73.8483107409892,-73.8483146894816,-73.8483159956443,-73.8483136467761,-73.8483209367406,-73.8483312343572,-73.8483478137906,-73.84836238599,-73.848363037883,-73.8483587125805,-73.8483517258854,-73.8483454003228,-73.8483437206688,-73.8483513273472,-73.8483526374507,-73.8483496374383,-73.8483416712748,-73.8483330493695,-73.8483247465644,-73.84831644185,-73.8483111214205,-73.8483174020112,-73.8483303239516,-73.848340938388,-73.8483458988456,-73.8483485376055,-73.8483607943652,-73.8483604420459,-73.8483501468793,-73.8483368792315,-73.8483202941888,-73.8483043745216,-73.8482894456859,-73.8482798266716],"lat":[40.6054332552303,40.6054297045003,40.6054299411323,40.6054342241514,40.6054364870532,40.605437480798,40.6054374654619,40.6054311306805,40.6054197446504,40.6054139353968,40.6054061027952,40.6053982675,40.6053881515694,40.6053787850074,40.6053734500344,40.605365837906,40.6053602546133,40.6053660507123,40.6053850122627,40.6053971276596,40.6054034128986,40.6054043886414,40.6054010739235,40.6053980140674,40.605392063884,40.6053844222576,40.6053743474561,40.6053670977675,40.6053646708416,40.6053549986319,40.6053417134944,40.6053215903589,40.6053087057483,40.6052857735142,40.6052648453403,40.6052439353152,40.605222226069,40.605212581576,40.6051972862765,40.6051795877492,40.6051566562049,40.6051438023111,40.6051269250713,40.6051092265709,40.6050963579849,40.6050849703843,40.6050764627901,40.6050779329548,40.6050907505352,40.6051177602572,40.6051334044887,40.6051405406091,40.6051363174614,40.6051164259294,40.6050908467209,40.6050894574597,40.6050824021985,40.6050668348782,40.6050811151092,40.6051038700965,40.6051223631484,40.6051280926758,40.6051423487389,40.6051636948693,40.605183611512,40.6051949801316,40.6051949530628,40.605196344842,40.6052079018042,40.6052134723811,40.6052190431884,40.6052283893649,40.6052372310464,40.605242026032,40.6052508786644,40.6052554498003,40.6052552150636,40.6052544758295,40.6052486665068,40.6052537397993,40.605261844205,40.6052765166065,40.6052858741717,40.6052969980327,40.6053010539889,40.6052960095338,40.6053005833499,40.6053124881105,40.6053175465126,40.6053223458813,40.6053311875709,40.6053405350657,40.6053493832547,40.6053605200851,40.6053678554087,40.605374173336,40.605375174534,40.6053733927071,40.6053766695128,40.6053814636283,40.6053867666151,40.6053966370188,40.6054047462395,40.6054057714531,40.6054131115935,40.6054201955336,40.6054288094766,40.605437407453,40.6054419453053,40.6054399048821,40.6054383656827,40.6054355630156,40.6054345316012,40.6054332552303]}],[{"lng":[-73.8839643488208,-73.8829842701189,-73.8827177721047,-73.8830089724302,-73.8829484834167,-73.8833914527329,-73.8833636794474,-73.8833273399188,-73.8832825151611,-73.8832293050911,-73.8831678283051,-73.8830982218145,-73.8830206407398,-73.882935257965,-73.8828422637521,-73.8827967085432,-73.8827572208443,-73.8827248060163,-73.8827002893387,-73.8826842949982,-73.8826772301977,-73.8826792747909,-73.8826903767047,-73.8826905832342,-73.8826827802676,-73.8826670074141,-73.8826433447077,-73.8826119122,-73.8825728693512,-73.8825264142207,-73.882471115189,-73.8824232226051,-73.8823829994748,-73.8823506666798,-73.8823264017652,-73.8823103379651,-73.8823248610385,-73.8823311696178,-73.8823291937454,-73.8823189553614,-73.8823005680591,-73.882274235824,-73.8822402507705,-73.8821989899001,-73.8821509109196,-73.8820965471626,-73.8820705161809,-73.8820502736244,-73.8820361513215,-73.8820283807696,-73.8820270893407,-73.8820277059497,-73.882021233701,-73.8820077784767,-73.8819875603815,-73.881960910141,-73.8819282636915,-73.8818901550489,-73.8818615381839,-73.8818376295631,-73.8818190237737,-73.8818061835229,-73.8817994281313,-73.8817989255927,-73.8818046883961,-73.881816573217,-73.8818246971226,-73.8818240528805,-73.8818146582887,-73.8817967726672,-73.8817708896993,-73.8817377238035,-73.8817104309229,-73.8816918245323,-73.8816823726598,-73.8816823130491,-73.8816916471807,-73.8817101402367,-73.8817373270094,-73.8817448656585,-73.8817430419853,-73.8817318599212,-73.8817113432367,-73.8816815354908,-73.8816424999381,-73.8815943193938,-73.881537096058,-73.8814709512984,-73.8813960253925,-73.88131247723,-73.8812204839752,-73.8811202406914,-73.8810119599267,-73.8809585331711,-73.8809126560756,-73.8808745846746,-73.8808445314323,-73.8808226640584,-73.8808091045724,-73.8808039286228,-73.8808071650662,-73.8808187958065,-73.8808387558971,-73.8808669339034,-73.8808732041496,-73.8808725570637,-73.8808649934018,-73.8808505214721,-73.8808287249605,-73.8807998189794,-73.8807638362481,-73.87990713259,-73.8794161717699,-73.8794080701356,-73.8798990285193,-73.87971492228,-73.879357292059,-73.8789788125648,-73.8789689043874,-73.8789241193115,-73.8792932637739,-73.8792449540145,-73.8792343976643,-73.8790174369786,-73.8790001967278,-73.8789888589541,-73.8789683125909,-73.8789684036414,-73.8790749839099,-73.8791390116136,-73.8790539499211,-73.8790345817072,-73.8790119424827,-73.8789686363356,-73.8789167745396,-73.8788564098446,-73.8787876036347,-73.8787104258653,-73.878624954992,-73.8785312778906,-73.8784294897685,-73.8783196940677,-73.8782020023599,-73.8780765342322,-73.8780288677368,-73.8779868359684,-73.8779509878502,-73.8779217915447,-73.8778996283394,-73.8778847876681,-73.8767167248207,-73.87970231664,-73.881742900221,-73.8818672452674,-73.8817467698389,-73.8820695820365,-73.8821469414322,-73.8823234776982,-73.8825006623342,-73.8826260154997,-73.88275043256,-73.882873429436,-73.882994527575,-73.8831132558135,-73.8832291522106,-73.8833417658454,-73.8834862003407,-73.8836344632157,-73.883786289109,-73.8839414062848,-73.8840817656923,-73.8842255475285,-73.8843722932402,-73.8845215348248,-73.8846727963216,-73.8847761954207,-73.8848801795165,-73.8849844237208,-73.8851031933524,-73.8852227129886,-73.8852809657266,-73.8853379207511,-73.8853928983497,-73.8854452424102,-73.8854943282512,-73.8855340163612,-73.8855704199848,-73.8855849420712,-73.8856003567013,-73.8856162729996,-73.8856322873698,-73.8856479937286,-73.8856579878948,-73.8856692821562,-73.8856815678487,-73.885694509213,-73.8857077525705,-73.885716710413,-73.8857255282977,-73.88573148505,-73.8858387288462,-73.8859496697706,-73.8860637854403,-73.8861805385268,-73.8862993792846,-73.8864197481405,-73.8865410783272,-73.8866627985516,-73.8866828423271,-73.8867592302169,-73.8868350033763,-73.8869093620346,-73.8869815213519,-73.8870507197037,-73.8870563769344,-73.8871510359753,-73.8872485943421,-73.8873482465043,-73.8874491696449,-73.887550530454,-73.8876514920082,-73.8876939583691,-73.8877407158825,-73.8878049855753,-73.887952686218,-73.8880572736722,-73.888164174346,-73.8882728491101,-73.8883827498863,-73.8884933224126,-73.8886040090384,-73.8887142515377,-73.8888234939248,-73.8889311852584,-73.8890367824211,-73.8890806784577,-73.8891306130118,-73.8891861058064,-73.8892466231093,-73.8893115828658,-73.8893803602974,-73.8894522939102,-73.8895266918572,-73.8896406060859,-73.8897553358589,-73.8898704136244,-73.8899853704128,-73.8900997377473,-73.890213049553,-73.8903248440556,-73.891040145538,-73.8911123939552,-73.8911841376729,-73.891254246968,-73.8913216178552,-73.8913851894724,-73.8914439607867,-73.8914970063571,-73.8915434909078,-73.8915826824805,-73.8917434771594,-73.89190796869,-73.8920758292435,-73.8922467242791,-73.8924203132113,-73.8925962500876,-73.8927741842784,-73.8929537611752,-73.893141547182,-73.8933275145719,-73.893511364238,-73.8936928004812,-73.893871531486,-73.8940472697901,-73.8941849227737,-73.8943208356929,-73.8944326988065,-73.8945477207822,-73.8946654348951,-73.8947853634984,-73.8949070199614,-73.8950299106438,-73.8951535368981,-73.895277397093,-73.8954009886477,-73.8955238100717,-73.8955760501105,-73.8956359931791,-73.8957035929774,-73.8957787972805,-73.895861547979,-73.8959517811235,-73.8960494269741,-73.8961544100542,-73.8962666492086,-73.8963860576659,-73.896512543106,-73.8966009021167,-73.8966830162076,-73.8967584699579,-73.8968268816361,-73.8968879051321,-73.8969412317081,-73.896986591561,-73.8970282801124,-73.8970619681131,-73.8970875589117,-73.8971049790763,-73.8971141786061,-73.8971151310749,-73.8971078337079,-73.8970923073894,-73.897068596604,-73.8970367693095,-73.896996916742,-73.8969491531553,-73.8968936154932,-73.8968304629974,-73.8967598767511,-73.8966715360673,-73.8965897759913,-73.8965803172788,-73.8965791912631,-73.896586400284,-73.8966019297511,-73.8966257481726,-73.8966578072192,-73.8966980418215,-73.896746370302,-73.8968026945405,-73.8968669001733,-73.8969388568246,-73.8971754177963,-73.8972029246977,-73.8972227303222,-73.8972343493363,-73.8972374970105,-73.8972320961978,-73.8972295661074,-73.8972330863875,-73.8972425622543,-73.8972727819876,-73.8974158963369,-73.8975013546482,-73.8975986660776,-73.8976870239908,-73.897786513427,-73.8979133794581,-73.8980186438686,-73.8981106047904,-73.8981510735252,-73.8981615661982,-73.8981673852479,-73.8981676846788,-73.8981678478404,-73.8981701655836,-73.8981629857611,-73.8981472792676,-73.8981047157334,-73.8980416874388,-73.8980018713903,-73.8979557495133,-73.897939638628,-73.897945237437,-73.8979565525015,-73.8979731350904,-73.8980392363941,-73.8980814854005,-73.8981498835083,-73.8982056198804,-73.8982578171085,-73.8982788659783,-73.8982757927803,-73.8982555921217,-73.8982385367798,-73.8982230694567,-73.8982212440209,-73.8982451889138,-73.8982630555028,-73.8983050622705,-73.898384918464,-73.8984695708251,-73.8985455781012,-73.8985971205744,-73.8986407234685,-73.8986961284724,-73.8987673794287,-73.8988045858541,-73.8988674867638,-73.8989159990881,-73.8990514438021,-73.8990921789261,-73.8991807519471,-73.8991872325984,-73.8992778751174,-73.8992569844776,-73.8993501676845,-73.8993808723408,-73.8996584253937,-73.8997334130518,-73.8996324668466,-73.8996100738978,-73.8994427492431,-73.899329070181,-73.8993111744699,-73.8992373981271,-73.8992300152655,-73.8992171004856,-73.8992247811384,-73.8991436709467,-73.8991565072907,-73.8989937173517,-73.8990097073435,-73.8990302609673,-73.8990548218975,-73.8990827253402,-73.8991538330112,-73.8992214776953,-73.8992847804204,-73.8993429186298,-73.8993951368706,-73.8994407566099,-73.8994813255303,-73.8995278402806,-73.8995792795826,-73.8996345140303,-73.8996923308877,-73.8997514607167,-73.8998106052503,-73.8998440245824,-73.8999060446049,-73.8999481128302,-73.899943834594,-73.8999347671132,-73.8998797733796,-73.8998782784665,-73.8999434505931,-73.8999446503535,-73.8999957240049,-73.9000038525531,-73.9000093251499,-73.9000647675982,-73.9003036084704,-73.9003553033137,-73.9005586004787,-73.9011570921118,-73.9011068481534,-73.9011782660363,-73.9012179188318,-73.9012301853091,-73.9011604686851,-73.9012075237375,-73.9009528562996,-73.9009189887109,-73.9003425683552,-73.9002937300776,-73.9000311566967,-73.8999682025135,-73.8999614788038,-73.8999541071711,-73.8999523407064,-73.9000785532031,-73.9001274515845,-73.9001655069839,-73.9002356197154,-73.9002749614678,-73.9003111265336,-73.9003520358429,-73.900444627436,-73.90051186094,-73.9005746544121,-73.9006212825124,-73.9006526806752,-73.9007154604566,-73.9008115206215,-73.9008803029072,-73.9009424181542,-73.9009927926347,-73.9010190968361,-73.9010789728446,-73.9011398017573,-73.9011695777667,-73.9012129675054,-73.9012601653682,-73.9013073923898,-73.9013305222222,-73.9013450777914,-73.9013539269368,-73.9014023143955,-73.9014909399419,-73.9015571156469,-73.9016106270967,-73.9016479768182,-73.9016792907157,-73.9017286837505,-73.9017736504788,-73.9018002379086,-73.9018138314068,-73.9018271149581,-73.9018407298467,-73.9018521459141,-73.9018730830575,-73.9019197055407,-73.9019476041,-73.9019732551164,-73.9019830550829,-73.9019906415916,-73.9020128011631,-73.9020378329486,-73.9020619093533,-73.9020758233953,-73.9020786577811,-73.9020846574702,-73.9020995373636,-73.9021448686589,-73.902177863105,-73.9022121138639,-73.902244764902,-73.9022761552481,-73.9023028000531,-73.9023364362419,-73.9023995829334,-73.9024614529643,-73.9025772228277,-73.9026076716146,-73.9026381204031,-73.9027037766589,-73.9027684751242,-73.9028179371104,-73.9028559755755,-73.9028952659025,-73.9029462977435,-73.9029817937592,-73.9030185288647,-73.9030460797956,-73.9030799902785,-73.903161474745,-73.9032515308429,-73.9032851377987,-73.9032994023761,-73.9033019388543,-73.903323161168,-73.9033938411317,-73.9034299527941,-73.903451474143,-73.9034644566827,-73.9035037403845,-73.903536374457,-73.9035452392034,-73.9035528254645,-73.9035575364813,-73.9035558954109,-73.9035561578455,-73.9035637330602,-73.9035868548217,-73.9036905070496,-73.9037222048383,-73.9037910282246,-73.9038947444342,-73.904017462595,-73.9040907002982,-73.9041306310855,-73.904168962877,-73.9041842517432,-73.9041972530376,-73.9042076295559,-73.9042151121715,-73.904219506815,-73.9042241529796,-73.9042299115881,-73.9042366165583,-73.9042440745147,-73.9042520703652,-73.9042603735045,-73.904268744465,-73.9042769418231,-73.904284729162,-73.9042918818901,-73.9042981937181,-73.9043659243298,-73.9048648546071,-73.9050818841452,-73.9051553687624,-73.9052355542867,-73.9058534506534,-73.9058668692897,-73.9058791985159,-73.9058900768242,-73.905899185249,-73.9059062567194,-73.9059110838903,-73.9059135252221,-73.9058923383952,-73.9058730687806,-73.9058561907213,-73.9058421196901,-73.9058312020627,-73.9058237065908,-73.9058198177866,-73.9058340125977,-73.9058565156166,-73.9058871842592,-73.9060005422514,-73.9061160973603,-73.9062336913941,-73.9063034144778,-73.9063748543122,-73.9064469789896,-73.9065187467095,-73.9065891208277,-73.9066570848311,-73.9067216570213,-73.9067932504916,-73.9068597254094,-73.9069205571219,-73.906975265519,-73.9070234188232,-73.9070646369968,-73.9070985947413,-73.9071250240639,-73.9071052923528,-73.907078046249,-73.9070440725634,-73.9070043523793,-73.9069600327209,-73.9069123934303,-73.9068628102094,-73.9068127148941,-73.9067834938513,-73.9067526049965,-73.9067180522812,-73.9066832040299,-73.9066489438129,-73.9066147612927,-73.9065813656673,-73.9065495382909,-73.9065200238246,-73.9064935128137,-73.9064706255305,-73.9064518974621,-73.9064377667817,-73.9063451302407,-73.9063351761274,-73.9063877280191,-73.9064086337729,-73.9064146314435,-73.9064155714569,-73.906409207086,-73.9064170896789,-73.9064392422378,-73.9064737780756,-73.9066545122583,-73.9068362092547,-73.907080632566,-73.9073476580153,-73.9074667947058,-73.9076194588429,-73.9078053541995,-73.907956449617,-73.9081088503597,-73.9083002775173,-73.9084661514601,-73.9086454783863,-73.9088964953132,-73.9090018208193,-73.9091045945329,-73.9093152106272,-73.9095133439718,-73.909648502307,-73.909875942286,-73.9100261077433,-73.9102120225233,-73.9103740498896,-73.9104448855846,-73.9105854539825,-73.9106974536598,-73.9107870740807,-73.9108855417119,-73.9109756463222,-73.9110653070009,-73.911153789669,-73.9112403698915,-73.9113243388076,-73.9114050089342,-73.9114817197938,-73.9115538433217,-73.9116207890084,-73.9116820087338,-73.9117427422674,-73.9118010999149,-73.9118743668229,-73.9113941044518,-73.9110573585828,-73.9107300235754,-73.9104141071618,-73.9101115852793,-73.9098244111122,-73.9095544128517,-73.9093033056542,-73.9090726561231,-73.9088638092002,-73.908677916435,-73.9085158709206,-73.9083783478719,-73.9082657228423,-73.9081781316708,-73.9081154504348,-73.9080773021823,-73.9080655223171,-73.9080637342068,-73.908076704318,-73.9080916297229,-73.9081195215006,-73.9081233187932,-73.90817173567,-73.9082366844553,-73.9082383551573,-73.9082516232515,-73.9083515517494,-73.9084918912251,-73.908489570756,-73.9084672977055,-73.9084250129616,-73.9083859411146,-73.9083628130422,-73.9082832983576,-73.9082809116004,-73.9082423204567,-73.9081797470745,-73.9080293542757,-73.9079385640278,-73.9079021860949,-73.9078753644682,-73.9078430302393,-73.9077757111496,-73.9076386832031,-73.9074506822383,-73.9073351223029,-73.9071945075739,-73.9071633957955,-73.9070827447786,-73.9070156793696,-73.9067549321042,-73.9065787287486,-73.9064749109102,-73.9059437172881,-73.9058500735001,-73.9056255159958,-73.9053798489386,-73.9052452586827,-73.9048516225612,-73.9041527175597,-73.9040823703496,-73.9037857188094,-73.9034774716655,-73.9031660464263,-73.9029249435091,-73.9027871225686,-73.9024969040977,-73.9023353294384,-73.9021650100405,-73.9020593611875,-73.9019009310352,-73.9011817029494,-73.9010031570797,-73.900830967309,-73.9006652849595,-73.9005062556392,-73.900354019115,-73.9002087091887,-73.9000704534091,-73.8999393734697,-73.8998155845945,-73.8996991956042,-73.899590308821,-73.8994890199782,-73.8993994292007,-73.8993681083491,-73.8993360836816,-73.8992803864527,-73.8992252122329,-73.899171220101,-73.8991190550145,-73.8990693401052,-73.8990084655103,-73.8989491210036,-73.8988917007438,-73.8988203657302,-73.8987537522022,-73.8986926117351,-73.8986128148341,-73.8985350515257,-73.898461978166,-73.8984174134884,-73.8984033501416,-73.8983864289434,-73.8983585286139,-73.8983314389896,-73.8982838450096,-73.8982201544585,-73.8981440052611,-73.8981051184618,-73.8980677196643,-73.8980354941385,-73.8979921856846,-73.8979760284555,-73.8979752570613,-73.897996468627,-73.8980023015969,-73.8979926835426,-73.8979787068523,-73.8979427231993,-73.8979081506146,-73.8978912392124,-73.8978641480976,-73.8978429356587,-73.8978282103621,-73.8978106194538,-73.8977966980335,-73.8977345552366,-73.8976570536081,-73.8976248760304,-73.8976050739893,-73.8975778685248,-73.8975624328717,-73.897535281396,-73.8974729710483,-73.8973667245568,-73.8972868478249,-73.8972142894708,-73.8971380934296,-73.8970589345331,-73.8970200152946,-73.8969840541064,-73.8969649702592,-73.8969583501034,-73.8969553369189,-73.8969457807556,-73.8969112266873,-73.8968672054309,-73.8968326780509,-73.8968047621885,-73.8967834101634,-73.8967605724512,-73.8967436675014,-73.8967070195135,-73.8966557591242,-73.8966279455932,-73.8965957382097,-73.8965569596432,-73.8965247609143,-73.8964954277081,-73.896452887313,-73.896418454899,-73.8963840068308,-73.8963524997939,-73.8962997438492,-73.8962286730509,-73.896153973625,-73.896097595796,-73.8960485167858,-73.8959767609178,-73.895943789859,-73.8958887996991,-73.8958279228625,-73.8957722144074,-73.8957296834125,-73.8956885826692,-73.8956342639371,-73.8956019165725,-73.8955673971082,-73.8955668476813,-73.8955629649596,-73.8955558575107,-73.8955464387147,-73.8955345900778,-73.8955206029983,-73.8955103347084,-73.8954954866095,-73.8954797064294,-73.8954633015672,-73.8954236973983,-73.8953760021763,-73.895345890906,-73.8953142683578,-73.8952848569776,-73.8952650246873,-73.8952180457626,-73.8951820618822,-73.8951496603619,-73.8951268215851,-73.8950959230208,-73.8950738799213,-73.8950467869095,-73.8950057128691,-73.8949236556173,-73.8948936126881,-73.8948188196054,-73.8947579717483,-73.8946979055401,-73.8945843896477,-73.8945177115197,-73.8944583586357,-73.8943755611032,-73.8942941661011,-73.8942244893592,-73.8941767560961,-73.8941554581835,-73.8941399938218,-73.8941274324923,-73.8941222068201,-73.8941141181562,-73.8940965258196,-73.8940760005558,-73.8940598744885,-73.8940363496209,-73.8940171529388,-73.8939912393427,-73.8939432384447,-73.8939048241924,-73.8938650001912,-73.8938200619863,-73.8937987117157,-73.8937700707645,-73.8937238396175,-73.8936973490574,-73.8936811367864,-73.8936428932998,-73.8936017315435,-73.893548150911,-73.8934946297192,-73.8934520922646,-73.893392801617,-73.893254313094,-73.8931422055962,-73.8930630839991,-73.8929971236467,-73.8929502605763,-73.8929157589905,-73.8928702734461,-73.8928343142885,-73.8927998487487,-73.8927550496876,-73.8926999739365,-73.892658875175,-73.8925899440884,-73.8925304760885,-73.8924886299564,-73.8924489158513,-73.8924040303642,-73.8923775232679,-73.8923400196565,-73.8923128376763,-73.8922776007898,-73.892198960071,-73.8921401604878,-73.8921077970024,-73.8920783780655,-73.8920475255277,-73.8920152641861,-73.891987426908,-73.8919716708278,-73.8919559136525,-73.8919119249328,-73.8918575643211,-73.891700439316,-73.8916431885735,-73.8916218671038,-73.8916056551348,-73.8916150924256,-73.891613604325,-73.8915848238888,-73.8915450783049,-73.8915230100287,-73.8914936581666,-73.8914746219644,-73.8914629405609,-73.8914409837896,-73.8914219046024,-73.8914136980484,-73.8914060748848,-73.8914087758175,-73.8913990572881,-73.8913827322693,-73.8913613018037,-73.8913332981943,-73.8912876095741,-73.8912559306291,-73.891213094539,-73.8911917408703,-73.8911621942134,-73.8911283293021,-73.891097396986,-73.8910686445046,-73.8910391407796,-73.8909964726522,-73.8909523587324,-73.8909163207241,-73.8908773454784,-73.8908339627541,-73.8907788298748,-73.8907383677684,-73.8906809126038,-73.8906323596562,-73.890562539061,-73.8905184331187,-73.8904949553484,-73.8904354935565,-73.8903854994786,-73.8903532135763,-73.89032017498,-73.8902673144349,-73.8902239503097,-73.890178348341,-73.8901283297816,-73.8900820179362,-73.8900489312225,-73.8900172432815,-73.8899841012015,-73.8899473140705,-73.8899010187877,-73.8898613590805,-73.8898121376361,-73.8897614571676,-73.889723181519,-73.8896753693208,-73.8896260040511,-73.8895988352197,-73.8895524850827,-73.8895194210865,-73.8894812253259,-73.8894481990802,-73.88942609818,-73.8893336275283,-73.889289948624,-73.8892713976391,-73.8892516881721,-73.889236021238,-73.8892210620355,-73.8892028002872,-73.8891903128421,-73.8891732126461,-73.8891503774275,-73.889140442438,-73.889133473995,-73.8891256253062,-73.8891232175619,-73.8891262483452,-73.8891321104866,-73.8891356183016,-73.8891349765639,-73.8891263709695,-73.8891127754756,-73.889090484529,-73.8890651864,-73.8890396903985,-73.8890137846694,-73.88899071977,-73.8889594931125,-73.8889244351975,-73.8888864888115,-73.8888614206187,-73.8888494645925,-73.8886795095474,-73.8885914427993,-73.8885472345815,-73.8885115257172,-73.8884894081118,-73.8884844824965,-73.8884836209356,-73.888459121027,-73.8884326548828,-73.888404502716,-73.8883751886896,-73.8883533394815,-73.8883208878745,-73.8882927195918,-73.8882692453559,-73.8882360605332,-73.8882155103837,-73.8881834584229,-73.8881521230907,-73.8881103647194,-73.8880703323683,-73.8879305241406,-73.8878798405584,-73.887818727514,-73.887756553346,-73.8876710517827,-73.887560240179,-73.8874464004964,-73.8873544086022,-73.8872498944192,-73.8871849417828,-73.8871276649822,-73.8870766100737,-73.8870001814188,-73.8869428778269,-73.8869049786911,-73.8868513336513,-73.886781074413,-73.8866878228549,-73.8865709264015,-73.8864896341742,-73.8864109717101,-73.8863218423448,-73.8862436712601,-73.8861755963654,-73.8861027051433,-73.8860240840583,-73.8859030503283,-73.88578924254,-73.8856928097833,-73.8856148781966,-73.8855174089141,-73.8852542063051,-73.885131511313,-73.8850450799092,-73.8849520098465,-73.8849109355787,-73.884866983496,-73.8848214443571,-73.8847756555268,-73.8847309617026,-73.8846886754255,-73.8846500385348,-73.8846161856995,-73.8845881110961,-73.8845666392124,-73.8845524006336,-73.8845541665854,-73.8845533643147,-73.8845500181196,-73.8845442293499,-73.8845361733371,-73.8845260940843,-73.8845142968759,-73.8845011390305,-73.8839643488208],"lat":[40.6055491404265,40.6046133535887,40.6041788371794,40.6037431545846,40.6034572083902,40.6030163225246,40.6028774580949,40.6027397472487,40.6026034967941,40.6024690102839,40.6023365873388,40.6022065229806,40.6020791069749,40.6019546231851,40.601833348941,40.6018070520703,40.6017755672524,40.6017396961015,40.6017003519081,40.6016585363854,40.6016153141657,40.601571785694,40.6015290592101,40.6014432916179,40.6013577303389,40.6012728093615,40.6011889594246,40.6011066058333,40.6010261663009,40.6009480488311,40.600873384283,40.6007958032679,40.6007157318704,40.600633609851,40.6005498882309,40.6004650268146,40.6004060797808,40.6003462954194,40.6002863369047,40.6002268693414,40.6001685523863,40.6001120329309,40.6000579379263,40.6000068674285,40.5999593879422,40.5999160261376,40.5998827684347,40.599847248139,40.5998100475379,40.5997717764627,40.5997330622926,40.5996907581445,40.599648740002,40.5996076951721,40.59956829504,40.5995311840866,40.599496969347,40.5994662104811,40.5994451079259,40.599420838639,40.5993940061828,40.5993652778626,40.5993353681324,40.5993050208258,40.5992749906575,40.5992460244544,40.5992061732341,40.5991658467783,40.5991261581601,40.5990882028452,40.5990530284559,40.5990216058552,40.5989813825657,40.5989383760653,40.5988936681859,40.5988483835552,40.598803661307,40.5987606264261,40.5987203614494,40.5985654616535,40.5984104615424,40.5982556897143,40.5981014742813,40.5979481421734,40.597796018446,40.5976454255906,40.5974966828509,40.5973501055469,40.5972060044056,40.5970646849031,40.5969264466168,40.5967915825905,40.5966603787134,40.5965848181106,40.5965064279709,40.5964256458255,40.5963429225549,40.5962587198721,40.5961735077455,40.5960877617762,40.5960019605425,40.5959165829296,40.5958321054567,40.5957489996169,40.5955894844964,40.5954298985448,40.5952704160127,40.5951112110367,40.5949497022151,40.5947888431418,40.5946288156127,40.5920479943225,40.5921320057981,40.5921034068923,40.5920206388521,40.591398891829,40.5908437352975,40.5908954193611,40.5908967731176,40.5907127802815,40.5906614313681,40.5904450478227,40.5902664094559,40.5900482026224,40.5900308620909,40.5899846661329,40.5899009350483,40.5897304181304,40.5896005348511,40.5893732002313,40.5890971005664,40.5889701772099,40.5888435688353,40.5886383506143,40.5884342886112,40.5882315900753,40.588030460869,40.5878311052592,40.5876337257095,40.5874385226751,40.5872456943989,40.5870554367105,40.586867942827,40.5866834031574,40.5866478317783,40.5866083465593,40.5865654631764,40.5865197416844,40.5864717792025,40.5864222021157,40.5849144302008,40.5801351006982,40.5795917007647,40.5794546257877,40.5791588072125,40.5790739786966,40.5791899713202,40.5791770985792,40.5791714086437,40.5791629429174,40.5791485349099,40.5791282406798,40.5791021391874,40.5790703319878,40.5790329428356,40.5789901172032,40.5789187718126,40.5788521482215,40.5787903656683,40.5787335347266,40.5786842847773,40.5786411547278,40.5786042821277,40.5785737845704,40.5785497593181,40.5785395720489,40.5785338058026,40.5785324785953,40.5785204865193,40.5785141691985,40.57850752798,40.5784960814902,40.578479966334,40.5784593748329,40.5784345527298,40.5784096825106,40.5783820451842,40.5783768735025,40.578373525005,40.5783720846012,40.5783725888159,40.5783750248635,40.5783816737884,40.5783869764222,40.5783907878476,40.5783930039009,40.578393564019,40.578392993206,40.5783916619795,40.5783890060262,40.5783450932652,40.5783068916474,40.5782745810493,40.5782483136083,40.5782282130073,40.5782143738915,40.5782068614236,40.5782057109766,40.5782062901299,40.5782047176417,40.5781971776276,40.5781837496709,40.578164575501,40.5781398574973,40.5781379631056,40.5781103268488,40.5780893563045,40.5780752246241,40.5780680484913,40.5780678871585,40.5780747419577,40.5780632388446,40.5780566662851,40.5780592768581,40.5780652744897,40.5780929594608,40.5781149150511,40.5781310305321,40.5781412246286,40.5781454459289,40.5781436731436,40.5781359152134,40.5781222112639,40.5781026304082,40.5780772713982,40.5780286237732,40.5779834885436,40.5779422998152,40.5779054537359,40.5778733046862,40.5778461618705,40.5778242863439,40.5778078885011,40.5777953687673,40.5777884165139,40.5777870600731,40.5777913049727,40.5778011339138,40.5778165068409,40.5778373611056,40.5778782334368,40.5778786239087,40.5778721122379,40.5778588009614,40.5778388996872,40.5778127217934,40.5777806794934,40.5777432773443,40.577701104302,40.5776548244462,40.5775889286761,40.5775285705682,40.5774738704117,40.57742493722,40.5773818685126,40.577344750122,40.5773136560216,40.5772886481792,40.5772569379007,40.57721951207,40.5771764308825,40.5771277636301,40.5770735885887,40.5770139928929,40.5769659432039,40.5769150953068,40.5768745461237,40.5768395097289,40.5768101282885,40.5767865210221,40.57676878372,40.5767569883539,40.5767511827852,40.576751390571,40.5767576108679,40.5767698184364,40.5769815605073,40.5771921129026,40.5774013127364,40.5776089981674,40.5778150085246,40.5780191844313,40.5782213679284,40.5784214025971,40.5786191336793,40.5788144081981,40.5790070750756,40.5790716658354,40.5791408819626,40.5792143733045,40.5792917680799,40.5793726747594,40.5794566840457,40.5795433709446,40.5796564705866,40.5797711096266,40.5798869593038,40.5800036873836,40.5801209591106,40.5802384381685,40.5803557876448,40.5804726709968,40.5805887530168,40.5807037007934,40.5808171846667,40.5809288791731,40.5810384639795,40.5811456248015,40.5812500543053,40.5816617288246,40.5820741929313,40.5822150294348,40.5823560478376,40.5824969617008,40.5826374847961,40.5827773316869,40.5829162183087,40.5830538625455,40.5831899848033,40.583324308578,40.5834565610171,40.5835864734739,40.5840183409592,40.5840543183586,40.5840931277096,40.5841338180224,40.5841753922142,40.5842168315415,40.5842265525234,40.5842462182749,40.5842700274991,40.5843208070826,40.5844827806778,40.58460850139,40.5847313631564,40.5848185674274,40.5849057166989,40.5850478785829,40.5851471418133,40.5852718621547,40.5853307263484,40.5853504905583,40.585371068504,40.5853791900962,40.585393527414,40.5854257326557,40.5854526434219,40.5854805469479,40.5855317958473,40.5856075091635,40.5856678397225,40.5857937395585,40.5858806718751,40.5859580721156,40.585999506676,40.586041800648,40.5861593500898,40.5862187390769,40.5863082742018,40.586400070773,40.5864730129292,40.5865184377471,40.5865571291395,40.5865953605759,40.5866227083947,40.5866512609817,40.5866819715362,40.5867435921549,40.5867853953524,40.5868411850035,40.5869397155655,40.5870527473032,40.5871341159832,40.5871983547487,40.5872577698476,40.5873440055766,40.5874253814731,40.5874642542751,40.5875050216571,40.5875374360611,40.5874541779086,40.5874838905266,40.5874241627775,40.5874304086007,40.5873757434895,40.587355611254,40.5872994162563,40.5872750572264,40.5870971995505,40.5871652121099,40.5872307675447,40.5872453103121,40.5873518248062,40.5874245283683,40.5874081887856,40.5874551519734,40.5874484108149,40.5874566317174,40.5874636436979,40.5875152758048,40.5875269953694,40.5876279466869,40.5876501718665,40.5876700975149,40.5876871843001,40.58770096973,40.5877210729975,40.5877472150467,40.5877790561907,40.5878161826885,40.5878581121211,40.5879042996593,40.5879372726878,40.5879653135326,40.5879878065249,40.5880042578046,40.5880143061642,40.5880177309799,40.5880144570555,40.5879791572474,40.5877940892483,40.5878052104726,40.5878140971997,40.5878118351948,40.5879669240749,40.5879711383156,40.5879834165257,40.5879799508837,40.5878325116411,40.5878341481068,40.5878183488119,40.5878295107814,40.5877325654262,40.5878065854063,40.5877277233154,40.587495511166,40.5874202450345,40.5873987256718,40.5873833400232,40.5874017154811,40.5874287654813,40.5874992545933,40.5875980606626,40.5876112004503,40.5878348359082,40.587761674812,40.5878697472449,40.588017148183,40.5880163990012,40.5880366897796,40.5880415986969,40.588060692121,40.5880843959886,40.588083130204,40.5880910045061,40.5880962635659,40.5881003200103,40.5880983248713,40.5880911737247,40.5880901054902,40.5880885596013,40.5880911487319,40.5880903766007,40.5880839953884,40.5880691022248,40.5880535238795,40.5880348123061,40.5880146687608,40.5880071333325,40.5879809303528,40.5879556921261,40.5879416236569,40.5879188297224,40.5878962729152,40.5878845953077,40.5878758565656,40.587863261636,40.5878509159478,40.5877986179319,40.5877295738134,40.5876876449705,40.5876541976483,40.5876248843298,40.5875926794697,40.5875606882521,40.5875342650912,40.5875141569765,40.5874969690155,40.5874826844083,40.5874739582069,40.5874734579993,40.5874753604204,40.5874755314024,40.5874716202817,40.5874565908205,40.5874440033121,40.5874348037055,40.5874190542313,40.5874098277826,40.5873996365497,40.5873843829582,40.5873763995803,40.5873659937433,40.5873565411764,40.5873477679102,40.5873518281036,40.5873515344288,40.5873451992762,40.5873420074023,40.5873436599546,40.5873503786703,40.5873628553044,40.5873724328958,40.5873758835447,40.5873765627224,40.5873772412219,40.5873798005644,40.587378976472,40.5873735819864,40.5873662706668,40.5873521868422,40.5873407463177,40.5873312616274,40.5873101703594,40.587294653579,40.5872851725463,40.5872756185262,40.5872699193149,40.587265757361,40.587263317741,40.5872630717645,40.5872524019143,40.5872351262527,40.5872186301642,40.5872014300764,40.5871936726442,40.5871771709885,40.5871647896521,40.587158490113,40.5871492904031,40.5871311495783,40.5871106000442,40.587089563592,40.5870755286372,40.5870643706438,40.5870426929832,40.5870366001997,40.5870367364188,40.5870392374824,40.5870320367818,40.5870229779695,40.5870115534519,40.5869952950324,40.5869853724183,40.5869737074432,40.5869606026537,40.5869463979391,40.5869314617168,40.5869261478253,40.5869215099281,40.586917681785,40.5869147738021,40.5869128698473,40.5869120248318,40.5869122631265,40.5869135778587,40.5869159311108,40.5869192550135,40.5869234537035,40.5869601620216,40.5870746694541,40.587207329551,40.5872328669365,40.5872456717007,40.5874882114337,40.5874922004707,40.5874978763043,40.5875050725124,40.5875135780934,40.5875231436535,40.5875334887186,40.5875443099586,40.5875523836285,40.5875628843007,40.58757555349,40.5875900793308,40.5876061042538,40.5876232337879,40.5876410462704,40.5877211030713,40.5878000453854,40.5878773729144,40.5879242488569,40.5879678957819,40.5880082539363,40.5880223632586,40.5880299939314,40.5880310357338,40.5880254736178,40.5880133879247,40.5879949532257,40.5879704357993,40.5879288961179,40.5878826762478,40.5878321409869,40.5877776891921,40.5877197506311,40.5876587825903,40.5875952662651,40.5875297029624,40.5874945864312,40.5874625239756,40.5874344414808,40.5874111498995,40.587393321834,40.5873814721134,40.5873759429272,40.5873768939441,40.5873872049962,40.5873941368963,40.5873976602648,40.5873969578284,40.587392047397,40.5873901128374,40.5873842265,40.587374526107,40.5873612386175,40.5873446749175,40.5873252225458,40.5873033366266,40.5872795292213,40.5871828889462,40.5871319262508,40.5871018794503,40.5870916919275,40.5870812856957,40.587077415191,40.5870689631728,40.5870520248279,40.5870338563748,40.5870209889124,40.5870049909031,40.5869935860422,40.586956451872,40.5869177083639,40.586900732785,40.5868814098164,40.5868541407555,40.5868287280606,40.5867965053016,40.5867451575068,40.5866973941053,40.5866389566361,40.5865373841483,40.586499227676,40.5864620241739,40.5863876833828,40.5863213352572,40.5862801121042,40.5862238168853,40.5861804459387,40.586133765551,40.5860947747644,40.5860777294287,40.5860391953896,40.5860024586827,40.5859753541887,40.5859476450045,40.5859482782124,40.5859551182023,40.5859681089731,40.5859871441654,40.5860120679324,40.5860426762151,40.5860787184137,40.5861198994384,40.5861658821257,40.5862162899985,40.586263888099,40.5863131835063,40.5863656846476,40.5866198896791,40.5867997352066,40.5869961892243,40.5872088873254,40.5874372865109,40.5876806472683,40.5879380792242,40.588208476483,40.5884906201229,40.5887831268698,40.5890845033947,40.5893931542987,40.5897074315636,40.5900256519061,40.5903461214503,40.5906671631846,40.5909871660531,40.5912503951971,40.5913053973443,40.5916232749262,40.5918853203784,40.5921156518264,40.592146975816,40.5924072924776,40.592665353465,40.5926706050014,40.5927122640616,40.5931418129814,40.5940657889468,40.5943617534459,40.5946582059737,40.5949539854935,40.5951386420114,40.5952479116488,40.5955303424915,40.5955388143861,40.5956482055085,40.5958255678822,40.5961806050299,40.5963784851089,40.5964577740419,40.5965117752097,40.5965549837345,40.596660945946,40.5968897933079,40.5971330378058,40.5972752448865,40.5974482849823,40.5974865679341,40.5975857941684,40.5976683271628,40.5979142106879,40.5980803579686,40.5981782684278,40.5985768292878,40.5986470931164,40.5987839495326,40.59893526048,40.5990119106525,40.5992166619952,40.5995378517975,40.5995702245892,40.5997067538537,40.5998486122727,40.5999919367527,40.6001094747396,40.6001766530602,40.60034986915,40.6004421878207,40.6005394997349,40.6006172967681,40.6007224257862,40.6013647913002,40.6015262472569,40.6016916656375,40.6018609011165,40.6020338050139,40.6022102254256,40.6023900073572,40.6025729927906,40.6027590210335,40.6029479286463,40.6031395496582,40.6033337157131,40.6035302562173,40.6035472959639,40.6035552751271,40.6035614206718,40.6035600912944,40.6035541370807,40.6035436291561,40.6035286930421,40.6035095071567,40.6034970779004,40.6034809117837,40.6034611161803,40.6034300811767,40.6033934541995,40.6033516485015,40.6032947729184,40.6032362839332,40.6032149833965,40.603295122316,40.6033107195852,40.6033224057023,40.6033228465948,40.6033165974167,40.6032996303323,40.6032792563407,40.6032554985751,40.6032558971681,40.6032512923004,40.6032472513904,40.6032487428359,40.6032509387067,40.6032576276303,40.6032672301334,40.6032750810376,40.6032839843844,40.6032884064762,40.6032955461181,40.6033116312185,40.6033121124163,40.6033058631267,40.6032962611009,40.6033017990911,40.6033006229767,40.6032966416634,40.6032656618354,40.6032245279229,40.6032093100624,40.60320868027,40.603216408442,40.6032230623472,40.6032223871251,40.6032137574113,40.6031965881724,40.6031811833686,40.6031685961946,40.6031560117501,40.6031422634563,40.6031454910537,40.6031470289094,40.6031480570168,40.6031552967195,40.6031653625229,40.6031686921413,40.603176373024,40.6031790074631,40.6031839165754,40.6031927308563,40.6032027367971,40.6032177456641,40.6032210286247,40.6032180801824,40.6032039175875,40.6031931824324,40.60318076568,40.6031643871373,40.6031547711259,40.6031518412637,40.6031466415369,40.6031431751555,40.6031340769205,40.6031317215299,40.6031197910941,40.6031021707222,40.6030873576651,40.6030670006629,40.6030550647242,40.6030329847868,40.6030300591974,40.6030242497422,40.6030189921273,40.6030114966215,40.603009096886,40.6030100702933,40.6030171217052,40.603024255205,40.6030319641953,40.6030472458935,40.6030622441558,40.6030765395966,40.6030889501315,40.6031000857108,40.6031096724719,40.6031150495358,40.6031209436787,40.6031252047375,40.6031277497066,40.6031264615634,40.6031290723198,40.6031300874388,40.6031417081173,40.6031527818086,40.6031549255339,40.6031592222214,40.6031663621718,40.6031818702798,40.6031969074691,40.6032129868678,40.6032157043401,40.603209455557,40.6032048248927,40.6031871623485,40.6031853748153,40.6031789352546,40.603170874001,40.6031588972685,40.6031277017949,40.6031117871604,40.603101495631,40.6030877500208,40.6030801467591,40.6030799008836,40.60308251228,40.6030840852002,40.6030935388704,40.6031097062653,40.6031203166044,40.6031241864485,40.6031230109369,40.6031178942754,40.6031172893739,40.6031278114723,40.6031456168688,40.603176294707,40.6032236365604,40.6032648504814,40.6032971480209,40.60332324911,40.6033332258507,40.603337580605,40.603340761461,40.6033501752222,40.6033607435481,40.6033796044526,40.6033861500838,40.6033892833553,40.6033868429603,40.6033816427957,40.6033657767424,40.6033361575299,40.6033139049842,40.6033001809448,40.6032859531152,40.6032762428718,40.6032755469797,40.6032776109347,40.6032791479966,40.6032784527734,40.6032850022476,40.6032903663902,40.6032913380459,40.603289946814,40.6032936313109,40.6032957199617,40.6033112095786,40.6033289352111,40.6033467219302,40.6033616650887,40.6033638185077,40.6033698130192,40.603385727768,40.6034022720643,40.6034178096737,40.603426082287,40.6034309835286,40.6034269693766,40.6034218049298,40.6034192270915,40.6034166475748,40.6034164782207,40.6034235569587,40.6034413808685,40.6034473199285,40.6034544945338,40.6034650647453,40.6034757114152,40.6034807451022,40.6035046799942,40.6035229695198,40.6035312896368,40.6035367602377,40.6035266107675,40.6035193105407,40.6035108227094,40.6035146798043,40.6035325258061,40.6035772401901,40.603609134607,40.6036376169485,40.6036649352514,40.6036889189155,40.6037089354679,40.603736151942,40.6037561464032,40.6037984795288,40.6038084552795,40.6038419100244,40.6038568754989,40.603875754544,40.6038968875743,40.6039163651993,40.6039363173392,40.6039473243777,40.6039628372236,40.603974438143,40.6039927333505,40.6040065004534,40.6040231053501,40.6040541953981,40.6040746995098,40.6040940026061,40.604107811914,40.6041071571243,40.6041136424694,40.6041279719871,40.6041295332201,40.6041294050313,40.6041370235579,40.6041469156232,40.6041629548606,40.6041828885974,40.6042000443701,40.6042110946108,40.6042283152757,40.6042477392241,40.6042643671285,40.6042731495673,40.604280262887,40.60428790446,40.6042977771066,40.6043194101216,40.6043360240092,40.6043632165244,40.6043709423406,40.6043880971931,40.6043935451267,40.6044012284842,40.6044067027357,40.6044177968695,40.6044688851891,40.604490238779,40.6044954365944,40.6045025518348,40.6045064327959,40.604507424056,40.6045087914164,40.6045090944999,40.6045085477818,40.6045106924149,40.6045118784882,40.6045148882971,40.6045261904542,40.6045386270068,40.6045521991253,40.6045730289944,40.6045976904977,40.6046123257317,40.6046366604274,40.6046607741956,40.6046857577593,40.6047088862132,40.604727271049,40.6047463135382,40.6047624087438,40.6047834591119,40.6048024000946,40.6048210593379,40.604830238986,40.6048330578297,40.6048834218202,40.6049102931066,40.6049291036453,40.6049423286123,40.6049619089081,40.6049734629731,40.6049731498627,40.6049848440851,40.604989597167,40.604993750694,40.6049998491048,40.60500545368,40.6050167010543,40.6050310009436,40.6050477543312,40.605082184663,40.6050991901664,40.6051199557263,40.605127687031,40.6051356611497,40.6051442314952,40.6052091315933,40.6052334950169,40.6052565306218,40.6052745071166,40.6052920841757,40.6053124991517,40.6053193128789,40.6053205507583,40.6053220615826,40.605322663271,40.6053173385774,40.6053118911386,40.6052959005803,40.605280458513,40.6052702176933,40.6052622856607,40.6052547490244,40.6052461553541,40.6052292467528,40.6052178371663,40.6052089102234,40.605198625102,40.6051922407861,40.6051878157859,40.6051777946857,40.6051704381051,40.6051637684612,40.6051518571809,40.6051468409809,40.6051451993943,40.6051452725575,40.6051565975756,40.605161074696,40.6051666189365,40.6051691054252,40.6051535668371,40.6051436014443,40.6051395019043,40.6051413886097,40.6051492061532,40.6051627249538,40.6051815479997,40.6052051225068,40.6052327561521,40.6052636374053,40.6052968593609,40.6053080317295,40.6053192682543,40.6053302285989,40.6053405807921,40.6053500112821,40.6053582344344,40.6053650011822,40.6053701065715,40.6055491404265]}],[{"lng":[-73.8484034118661,-73.8484131500268,-73.8484262837322,-73.8484330821445,-73.8484259019775,-73.8484157365848,-73.8484060211331,-73.8484051902475,-73.8483924918398,-73.8483819051446,-73.848371308852,-73.8483594451332,-73.8483454805448,-73.8483395678844,-73.8483387385431,-73.8483264826161,-73.8483231128636,-73.8483231253228,-73.8483231429106,-73.8483176458388,-73.8483117128806,-73.8483053629485,-73.8482994511732,-73.8482948083594,-73.848290157629,-73.8482825387345,-73.8482762005317,-73.8482711329021,-73.8482686086166,-73.8482736989728,-73.8482741362553,-73.8482652687855,-73.8482563857757,-73.8482530217519,-73.8482543062556,-73.8482560091973,-73.8482611001367,-73.8482691516145,-73.8482763471484,-73.8482907374081,-73.8482949520254,-73.8483080646053,-73.8483249930785,-73.8483389576446,-73.8483520684691,-73.8483605221202,-73.8483762014912,-73.8483872070535,-73.8483914139195,-73.8483926566552,-73.8483981307998,-73.8484074324081,-73.8484192668879,-73.8484213682738,-73.8484099413263,-73.8484002009792,-73.8484073701504,-73.8484213338531,-73.8484433389234,-73.8484682910698,-73.8484767557203,-73.8484771922503,-73.8484789040391,-73.8484869567561,-73.8484954273324,-73.8485009478325,-73.848506474846,-73.8485094578617,-73.8485099097609,-73.8485052650292,-73.8485018966512,-73.8485065597554,-73.8485150191269,-73.8485285588769,-73.848537455802,-73.8485526997199,-73.8485721825798,-73.84859333756,-73.8485966877315,-73.8485945393642,-73.8485856197625,-73.8485771309724,-73.8485576474377,-73.8485508563739,-73.84854152848,-73.848549123517,-73.8485605447648,-73.8485694408181,-73.8485741070701,-73.8485804429549,-73.8485795718838,-73.8485795477421,-73.8485816462204,-73.8485820391375,-73.8485926016859,-73.848607845637,-73.8486243718564,-73.8486370791157,-73.8486514789113,-73.8486663152886,-73.8486781895082,-73.8486739673811,-73.8486718665557,-73.8486794871328,-73.8486917613049,-73.8487031787565,-73.8487175485699,-73.8487196444303,-73.8486959095209,-73.8486696290718,-73.8486353059841,-73.8485908359231,-73.8485434084378,-73.8485095489073,-73.8484748441327,-73.8484376163717,-73.8484075994048,-73.8483970384852,-73.8483978993318,-73.8484034118661],"lat":[40.6059208288698,40.6059192289095,40.6059131170043,40.6059018355009,40.6058953746465,40.6058985870164,40.6058901871836,40.6058834118733,40.6058833951238,40.6058862846086,40.6058927220152,40.6058981904344,40.6058975270213,40.6058917123191,40.6058839698638,40.6058762116597,40.6058687880106,40.6058633039557,40.6058555624504,40.6058539423913,40.6058571608403,40.6058574741158,40.6058516599153,40.605845847557,40.6058439062874,40.6058442190593,40.6058393716089,40.605834203509,40.6058274266323,40.6058225942687,40.6058164656193,40.6058074219061,40.6058048295573,40.6057954707827,40.6057890205906,40.6057848299158,40.6057793530683,40.6057751696021,40.6057748562721,40.6057748752678,40.6057826228621,40.6057861886071,40.6057868566063,40.6057875195194,40.6057920530737,40.6057969028085,40.6057885364753,40.6057879065085,40.6057988791953,40.6058108162915,40.6058234034542,40.6058276098188,40.6058347218006,40.6058414987864,40.6058411608867,40.6058437286605,40.6058550285856,40.6058566593042,40.6058579789688,40.6058667210468,40.6058667322065,40.6058609270545,40.6058525422923,40.6058477138247,40.6058448220433,40.6058370879593,40.6058258047755,40.6058170988596,40.6058045190106,40.6057993514785,40.6057916056776,40.605788385545,40.6057913001451,40.6057926086357,40.6057890712526,40.6057855434051,40.6057794400168,40.605783016325,40.6057985041304,40.6058130180484,40.6058265540566,40.6058371883544,40.60584329124,40.6058523142982,40.6058593983796,40.6058694088814,40.6058726495398,40.6058691128233,40.6058646027166,40.6058700951353,40.6058807394689,40.6058913837455,40.6058994507,40.60591267732,40.605920433266,40.6059178720553,40.6059088618161,40.6059046856287,40.6059005104959,40.6058902085525,40.6058799015345,40.6058750568921,40.6058686027406,40.6058676449573,40.6058676611167,40.605872191899,40.6058812433235,40.6058902787588,40.6059044402618,40.6059221475163,40.6059398441731,40.6059530105282,40.6059635935204,40.6059635488963,40.6059628581601,40.6059553898721,40.6059405118808,40.6059314659444,40.6059253373507,40.6059208288698]}],[{"lng":[-73.8344626562024,-73.8357358758743,-73.8353261263945,-73.8352806039376,-73.8352289225224,-73.8351715156978,-73.8351088650465,-73.835041496146,-73.8349699741583,-73.8348948990896,-73.8348418007878,-73.8347926693088,-73.8347477716751,-73.8347073519011,-73.8346993643827,-73.8346942198566,-73.8346920509738,-73.8346929136598,-73.8346967856725,-73.8347035671757,-73.834713083313,-73.8347250887163,-73.8347215084134,-73.8347097744037,-73.8346901791851,-73.8346632112262,-73.8346295427904,-73.834590013178,-73.834543866253,-73.8345026377908,-73.8344666903548,-73.8344363400704,-73.8344189255579,-73.8343979707374,-73.8343738656812,-73.8344626562024],"lat":[40.6071925329424,40.6057931884524,40.6068523629794,40.6069052561388,40.6069547530282,40.6070004384121,40.607041929029,40.6070788768076,40.6071109717864,40.6071379447147,40.6071774900413,40.60721990923,40.6072649717453,40.6073124326853,40.6073254797023,40.6073393328753,40.6073536350073,40.6073680173247,40.6073821089862,40.6073955466448,40.6074079838162,40.6074190998133,40.6074587976576,40.607497571218,40.6075344539261,40.6075685263484,40.6075989391063,40.6076249340506,40.6076633008569,40.6077047934304,40.6077490468947,40.6077956720936,40.6078164017912,40.6078351319547,40.6078515139207,40.6071925329424]}],[{"lng":[-73.8670239947516,-73.8687431755927,-73.8686846882675,-73.8677750156114,-73.8670239947516],"lat":[40.6080681787694,40.6070351787767,40.6082411581839,40.6085394887784,40.6080681787694]}],[{"lng":[-73.869664429585,-73.8710933076808,-73.8710565664624,-73.8724557981188,-73.8726895931165,-73.8730012272477,-73.8718008286799,-73.8710387011171,-73.8707600854119,-73.869664429585],"lat":[40.606540123413,40.6046941739947,40.6062850879917,40.6081855303486,40.6091779983085,40.6105554584599,40.6102804135803,40.6097235825266,40.6087054014107,40.606540123413]}],[{"lng":[-73.8504762496644,-73.8504313879888,-73.8504074823758,-73.8503776011776,-73.8503517080591,-73.850308843368,-73.8502769361343,-73.8502480221231,-73.8502260932382,-73.8501921671292,-73.8501622433868,-73.8501203209173,-73.8500953606183,-73.8500843953352,-73.8500784419716,-73.8500635029703,-73.8500465681375,-73.8500146552023,-73.8499777474387,-73.8499518083619,-73.8499218692795,-73.8498959113982,-73.8498609849744,-73.8498330412887,-73.8498110874924,-73.8497901306267,-73.8497811723654,-73.8497592367392,-73.8497223279605,-73.8496894052922,-73.8496714508654,-73.8496674290618,-73.8497064526076,-73.8497344168082,-73.8498123154017,-73.8498372951397,-73.8498522963,-73.8498643405598,-73.849861393756,-73.8498454659876,-73.8498455001991,-73.8498385589291,-73.8498126148171,-73.8497916679005,-73.8497737460417,-73.8497548413992,-73.8497406347882,-73.8497301583424,-73.8497116739341,-73.8497024248075,-73.8496952753329,-73.8496860350998,-73.8496738455767,-73.8496681476015,-73.8496608061005,-73.8496469397301,-73.8496410705243,-73.849635191141,-73.8496360520317,-73.8496457476271,-73.8496562841601,-73.8496682669005,-73.8496748155562,-73.8496832492329,-73.8496799084656,-73.8496799438658,-73.849679552671,-73.8496863125054,-73.8497040169494,-73.8497229819497,-73.8497398487106,-73.849754611987,-73.8497634765047,-73.8497580517479,-73.8497370180183,-73.8497315758756,-73.8497198137323,-73.8497101736303,-73.849705138588,-73.849696727235,-73.8496743982633,-73.8496686909892,-73.8496579674418,-73.8496377584946,-73.8496162909688,-73.8495910383818,-73.8495653729975,-73.849556565578,-73.8495523761745,-73.8495604145485,-73.8495566545105,-73.8495503812889,-73.8495605172157,-73.8495862223876,-73.849586682834,-73.84959557331,-73.8495964499479,-73.8496032140999,-73.8495998733036,-73.8496007550623,-73.849604992886,-73.8496109119838,-73.849619364406,-73.8496253159554,-73.8496463879344,-73.849664491226,-73.8496693153184,-73.8496838687659,-73.8496902064248,-73.8497083414313,-73.8497256180054,-73.8497353223404,-73.8497349204302,-73.8497269406361,-73.8497118079185,-73.8496996121582,-73.8496929124874,-73.8496853599554,-73.8496778030276,-73.8496695918095,-73.8496610006838,-73.8496610346415,-73.8496635818462,-73.8496696833178,-73.8496990500481,-73.8497319944657,-73.8497659214866,-73.8497978794192,-73.8498228273431,-73.8498408150499,-73.8498468349723,-73.849847866097,-73.8498568809319,-73.8498509313653,-73.8498390037705,-73.8498270631562,-73.8498190977079,-73.849811156385,-73.8498091980022,-73.8498002467465,-73.8497873010801,-73.8497643533273,-73.8497374137516,-73.8496965095303,-73.8496795485287,-73.8496565982352,-73.8496353092838,-73.8496186533561,-73.849604702245,-73.8496047313712,-73.8496027856952,-73.8495978318436,-73.8495879348678,-73.8495869826811,-73.8495880119739,-73.8496104812204,-73.8496459481416,-73.8496659217521,-73.8496978784817,-73.8497168722435,-73.8497219117117,-73.8497229753856,-73.8497210238817,-73.849711092014,-73.8497001544185,-73.8496762650544,-73.8496473621409,-73.8496294276393,-73.8496135043556,-73.8495995749375,-73.8495966291166,-73.8496066438233,-73.8496316377729,-73.8496546114997,-73.8496776019038,-73.8496826353467,-73.8496767017306,-73.8496657600966,-73.8496617950937,-73.8496488264606,-73.8496278633064,-73.8496218502539,-73.8496337999373,-73.8496198011408,-73.8495928504379,-73.8495669052051,-73.8495492707593,-73.8495359832267,-73.8495250360894,-73.8495260602447,-73.849513105108,-73.849496157963,-73.8494961836791,-73.8495031936552,-73.8495111982481,-73.8495359246301,-73.8495610857928,-73.8495780226579,-73.8495919764137,-73.8496189395727,-73.8496429196065,-73.849656923035,-73.8496838998676,-73.8497028832346,-73.8497278438955,-73.8497408469689,-73.8497807643418,-73.8498176744621,-73.8498485916659,-73.8498825148537,-73.8499154537201,-73.8499413989039,-73.8499753351061,-73.8500162793087,-73.8500472407244,-73.8500851787183,-73.8500882258811,-73.8500932976329,-73.8500733993861,-73.8500664298605,-73.8500375834194,-73.8500146499942,-73.8499787134176,-73.8499527477889,-73.8499467348132,-73.8499477091034,-73.8499486709856,-73.8499576067836,-73.8499725363766,-73.8499784895368,-73.8499635110347,-73.8499385931599,-73.8499226591745,-73.8499187047892,-73.8498977874872,-73.8498908183693,-73.8498788751374,-73.8498719073429,-73.8498629599953,-73.8498679812158,-73.8498660057404,-73.8498490757336,-73.8498291434046,-73.8498082069004,-73.849792269996,-73.8497723577843,-73.8497364588903,-73.8497105187323,-73.8496736216393,-73.849645700908,-73.849620774175,-73.8496008462198,-73.8495819117424,-73.849561978661,-73.8495300559158,-73.8495041434422,-73.8494872135571,-73.849462666922,-73.8494483289187,-73.8494293958065,-73.8494184584088,-73.8494214881967,-73.8494344764686,-73.8494526797302,-73.8494909163366,-73.8495317245949,-73.8495725260984,-73.8496239731738,-73.849661269805,-73.8496914522794,-73.8497234332779,-73.8497482210165,-73.8497517046143,-73.8497782635273,-73.8498226125437,-73.8498687585705,-73.8498883280519,-73.8499220944621,-73.8499398701692,-73.8499487840864,-73.8499541604655,-73.849940016039,-73.8499116632058,-73.8498708973878,-73.8498798343168,-73.8498837700687,-73.8498888083775,-73.8498888722188,-73.849904929068,-73.8499085380029,-73.8499139417295,-73.8499317362491,-73.8499743065004,-73.85001149021,-73.8500220736626,-73.8500628749703,-73.8500983498639,-73.8501167399172,-73.8501550478985,-73.8501745315697,-73.8501975748692,-73.8502384139256,-73.8502809918102,-73.850316454609,-73.8503270685059,-73.8503270078835,-73.8503304849933,-73.8503623693893,-73.8503924880499,-73.8504262639256,-73.8504884026415,-73.850532830421,-73.8505577757249,-73.8505809098401,-73.8506128819898,-73.8506413256184,-73.85065377704,-73.8506839712805,-73.8507229908276,-73.8507265722173,-73.8507656424786,-73.8507958178819,-73.8508313155871,-73.8508614946553,-73.8508863309269,-73.8509235514666,-73.8509341477851,-73.850959032365,-73.8509998857726,-73.8510584569359,-73.8511081686628,-73.8511561048685,-73.8511703339973,-73.8511899051981,-73.8512182979403,-73.8512733124741,-73.8512981366576,-73.8513264986217,-73.8513477512647,-73.851369089669,-73.8513939944619,-73.8514277705319,-73.8514526660289,-73.8514314323306,-73.8514314925053,-73.8514457238762,-73.8514652916868,-73.8515078675623,-73.8515504466628,-73.8515823710757,-73.8515877811845,-73.851589659885,-73.8516075107665,-73.851616468517,-73.8516484722804,-73.8516893731972,-73.851701838627,-73.8517213921221,-73.8517046488925,-73.8516930431246,-73.8516664644907,-73.8516682744774,-73.8516700870305,-73.8516808156494,-73.8516808577031,-73.8516844534171,-73.8516986843995,-73.8517270530371,-73.8517412299638,-73.8517625082074,-73.8517855543865,-73.8518281029851,-73.8518546501516,-73.851881290826,-73.8518919461767,-73.8519327799631,-73.8519775324461,-73.8520055035247,-73.8520303185582,-73.8520391501761,-73.8520550856639,-73.8520781438778,-73.8520870503972,-73.8520977271971,-73.8521101804843,-73.8521510035539,-73.8521918142007,-73.8521918501197,-73.8521918830464,-73.8521848554902,-73.8521602665726,-73.8521405746439,-73.8521459621042,-73.8521743940502,-73.8522329561286,-73.8522542790153,-73.8523181669485,-73.8523448030708,-73.8523466513191,-73.8523538134843,-73.8523574333252,-73.8523574961155,-73.8523983633452,-73.8524569990321,-73.8525244215307,-73.8525598839158,-73.8525882883074,-73.8526166947979,-73.8526717089503,-73.8527125107978,-73.852728440566,-73.8527248541589,-73.8527248064387,-73.8526910710967,-73.8526883769409,-73.8526892038062,-73.8527016098214,-73.8527388838776,-73.8527690890412,-73.8527711375399,-73.852785210967,-73.8528118760641,-73.8528456390423,-73.8528581097185,-73.8528936431573,-73.8529185229961,-73.8529150379204,-73.852902670662,-73.8529062778643,-73.8529134278259,-73.8529205560552,-73.8529525434244,-73.8529986815449,-73.853066101619,-73.8531033127216,-73.8531476161139,-73.853167157103,-73.853213262513,-73.8532397997719,-73.8532685051427,-73.8532894267641,-73.8533284715281,-73.8533675455378,-73.8533661161996,-73.8533587921892,-73.8533198395575,-73.8532897446698,-73.8532490447188,-73.8532455624878,-73.8532438658446,-73.8532332866419,-73.8532422105899,-73.8532706167617,-73.8533025130921,-73.8533219731179,-73.8533449924267,-73.8533395907101,-73.8533395223984,-73.8533837944387,-73.8534316139241,-73.8534511183466,-73.8534671253798,-73.8534884365759,-73.8535114776229,-73.8535904180317,-73.8536534237982,-73.8536694248387,-73.8537089328419,-73.8537475320605,-73.8537847471391,-73.8538060464287,-73.8538450846663,-73.8538911841561,-73.8539355031688,-73.8539302378387,-73.8539157702279,-73.8539108419939,-73.8539339219621,-73.8539835956481,-73.8540208478696,-73.8540598519019,-73.8540704417609,-73.854085967501,-73.8541040977003,-73.8541427727595,-73.8542176805468,-73.8542691193148,-73.8542763875009,-73.8542920955336,-73.8542920276658,-73.8544587845092,-73.8544623864979,-73.8544542151283,-73.8544482940578,-73.8544483294294,-73.8544324473883,-73.8544165615375,-73.8543740749792,-73.854338618563,-73.85430317528,-73.8542641844112,-73.8542252314995,-73.8542039904924,-73.8541667944911,-73.8541437914239,-73.8540852549509,-73.8540373792284,-73.8539894908118,-73.85396111901,-73.8539256588139,-73.8538759610011,-73.8538280734778,-73.8537607080705,-73.8537323636161,-73.8537164745959,-73.8537076590497,-73.8536935524098,-73.853670550918,-73.8536316302017,-73.8536050784337,-73.8536264065348,-73.853668969413,-73.8537097367792,-73.8537452345652,-73.8537718959541,-73.8538021239875,-73.8538216935748,-73.8538908837712,-73.8539653893056,-73.8540487404731,-73.8540913417583,-73.8541551977668,-73.8542225747937,-73.8542492368594,-73.8543184683322,-73.8543876340047,-73.8544195703025,-73.8544603436696,-73.8544868913722,-73.8545098931447,-73.8545560285388,-73.8546020733955,-73.854628582922,-73.854644489174,-73.8546835165866,-73.8547438306197,-73.8548041116493,-73.8548040116762,-73.8547631557581,-73.8547418028539,-73.8547754323715,-73.8548304214386,-73.8548996221199,-73.8549528944062,-73.8550309595783,-73.8550664264055,-73.8550486342832,-73.8550521229512,-73.8550467221881,-73.8550306953552,-73.8549277686445,-73.8548426305196,-73.8547716717026,-73.8547130733887,-73.854665094511,-73.8546401676134,-73.8546631643881,-73.854689785081,-73.8547412615901,-73.8547713687735,-73.8547968777576,-73.8548052112459,-73.8548025047865,-73.8548006994845,-73.854737492857,-73.8546952823808,-73.8546993410054,-73.8547076396167,-73.8547410278943,-73.8547660215292,-73.854782610427,-73.8548034478689,-73.8548705311637,-73.8549166329124,-73.8549922262498,-73.8550593874217,-73.855122539379,-73.8552317645277,-73.8552947568622,-73.8553704465037,-73.8554335206922,-73.8555495238704,-73.8555366095147,-73.8555454320194,-73.8555476071832,-73.8555186769796,-73.8554096942408,-73.8553540455456,-73.8553183785051,-73.8552337362596,-73.855231281958,-73.85524219258,-73.8552486892998,-73.8552997127547,-73.855359731099,-73.8554353920271,-73.8555955418864,-73.8556466908172,-73.8557778552213,-73.8558546570705,-73.8559112424697,-73.8559467836783,-73.8559822737272,-73.8559888298202,-73.8559776349809,-73.8559505985188,-73.8559196988923,-73.8558929487573,-73.8558839710508,-73.8558772284775,-73.8558749214987,-73.8558903990779,-73.8559237036674,-73.8559704017594,-73.8560126756292,-73.8560349439689,-73.8560672073674,-73.8560626615349,-73.8560532559236,-73.8560569688938,-73.8560588107383,-73.8560597291283,-73.8560662719139,-73.8560859258106,-73.8560877753685,-73.856100885828,-73.8561252468488,-73.8561430366884,-73.8561557202216,-73.856171161553,-73.8561852223382,-73.8561927088565,-73.8562020880672,-73.8562020572734,-73.8561842205575,-73.8561790326617,-73.8561691903198,-73.8561691656787,-73.856176639882,-73.8561841143071,-73.8561953400286,-73.85620658423,-73.856229590309,-73.8562280699971,-73.8562280407494,-73.856232693091,-73.8562532982924,-73.8562561025874,-73.8562753827356,-73.8562701141695,-73.8562616441175,-73.8562606856815,-73.8562681700367,-73.8562643963096,-73.8562521857223,-73.856262494383,-73.8562671605926,-73.8562774452959,-73.8562877240702,-73.8562914353683,-73.8562885895194,-73.8562922964248,-73.8562932003456,-73.8562819206984,-73.8562903246016,-73.8563034499041,-73.8563147233989,-73.8563166253184,-73.8563110318695,-73.8563270038887,-73.8563382666042,-73.8563570099652,-73.8563626161654,-73.8563569653607,-73.8563691436629,-73.856375687861,-73.8563756601796,-73.856366264655,-73.8563568700055,-73.8563530978178,-73.856335257052,-73.8563314848621,-73.8563323980224,-73.8563511442704,-73.8563802249261,-73.8563801941702,-73.856380141886,-73.8563801142069,-73.8563594713018,-73.8563472767165,-73.8563378666672,-73.8563368858226,-73.8563284203551,-73.856333078905,-73.8563536673385,-73.8563686761453,-73.8563846310761,-73.856402432121,-73.8564211669944,-73.8564342868558,-73.8564539920091,-73.8564680428437,-73.8564726968188,-73.8564605008951,-73.8564445549632,-73.856442653938,-73.8564463846231,-73.8564613695105,-73.8564838673768,-73.8564969988901,-73.8565082447502,-73.8565147830712,-73.8565025847253,-73.8565035034054,-73.856527871575,-73.8565438113787,-73.8565503479581,-73.8565587695275,-73.8565728320274,-73.8565887733774,-73.8566006760669,-73.856599993154,-73.8565877855856,-73.8565708818776,-73.8565483578608,-73.8565230301596,-73.8565080035363,-73.856504232886,-73.8565060794704,-73.8564900873982,-73.8564741260525,-73.8564506927666,-73.8564338410682,-73.8564169428178,-73.8563953464409,-73.8563850124168,-73.8563606242217,-73.8563465707149,-73.8563268696604,-73.8563109021397,-73.8563061835701,-73.8563061435663,-73.8563201660897,-73.8563388816992,-73.8563322805357,-73.8563162991441,-73.8562890643722,-73.8562506019367,-73.8562243462674,-73.8561868510866,-73.8561662456508,-73.8561363141306,-73.8561213591684,-73.8560998439427,-73.8560867462911,-73.8560736438033,-73.8560605254662,-73.8560333682013,-73.8560146357575,-73.8559958870204,-73.8559668095076,-73.8559480515195,-73.8559208696191,-73.8559012201429,-73.8559031514626,-73.8559003762623,-73.8558947901582,-73.8558798152714,-73.8558591969725,-73.8558385826513,-73.8558132867305,-73.8557907935608,-73.8557664014588,-73.8557401452788,-73.8557251633732,-73.8557026841261,-73.8556820954518,-73.8556746574903,-73.8556672009893,-73.8556512912851,-73.8556475986991,-73.8556429495728,-73.8556317486275,-73.8556186403443,-73.8555980283311,-73.8555980654384,-73.8555896641428,-73.8555634288309,-73.8555418784117,-73.8555034417008,-73.8554762735061,-73.8554265756006,-73.8554050035397,-73.8553768708384,-73.8553609652267,-73.8553609992977,-73.8553629208621,-73.8553770473672,-73.8554005232522,-73.8554314809402,-73.8554530693355,-73.8554624755504,-73.8554662750471,-73.8554719547223,-73.8554938797418,-73.855507623986,-73.8555076502873,-73.8555039599936,-73.8554946240859,-73.8554890403577,-73.8555012702412,-73.8555050511495,-73.8554169490072,-73.8553287856401,-73.8552706266138,-73.8552321517282,-73.8552189920807,-73.8552002132643,-73.8551870439843,-73.8551645169636,-73.8551429254948,-73.8551241599422,-73.8551091574377,-73.8550969886168,-73.8550848266771,-73.8550774152675,-73.8550642554388,-73.8550558270629,-73.8550501969114,-73.8550333264262,-73.8550145540182,-73.8550004575757,-73.8549960620182,-73.8549929175079,-73.8549760252798,-73.8549628830143,-73.85496192261,-73.8549609535632,-73.8549374778634,-73.854911231908,-73.8548859201787,-73.8548765642571,-73.8548549958268,-73.8548362358201,-73.854829648359,-73.8548239964343,-73.8548099121554,-73.8547808473588,-73.8547508447987,-73.8547302308021,-73.8547096050275,-73.8546792304995,-73.8546642523191,-73.8546413403528,-73.8546134372986,-73.8545884980042,-73.8545615493382,-73.8545455554875,-73.8545186035011,-73.8544916771512,-73.8544837288431,-73.8544667811844,-73.8544558049471,-73.8544437782078,-73.8544337779689,-73.8544284659305,-73.854415752485,-73.8543828191052,-73.854355893637,-73.8543357140207,-73.8543230131439,-73.8542851084749,-73.8542522000173,-73.8542362310173,-73.854217272097,-73.8541983027714,-73.854161375746,-73.8541404401022,-73.8541184869633,-73.8540965265183,-73.8541034062468,-73.8540904942999,-73.8540715323929,-73.854062840563,-73.8540466386682,-73.8540276992647,-73.8540067513453,-73.8539977471624,-73.8539988448648,-73.8540006864967,-73.8539906774345,-73.8539806864467,-73.853960719312,-73.8539228038024,-73.8538978577468,-73.8538888735121,-73.8538918381189,-73.8539007940614,-73.853908762431,-73.8538917965074,-73.8538808285795,-73.8538658769695,-73.8538569276936,-73.853845964106,-73.8538210065197,-73.8538090243838,-73.8538089960721,-73.8538139566676,-73.8538199123738,-73.8538039396698,-73.8537929720897,-73.8537850036038,-73.8537770419084,-73.853774021472,-73.8537650155741,-73.853751033431,-73.853733064938,-73.8537151038981,-73.8537001529614,-73.8536971854033,-73.8536882418195,-73.8536812885828,-73.8536683171196,-73.8536663003259,-73.8536463122792,-73.8536283264539,-73.853612350629,-73.8535854170194,-73.8535614778591,-73.8535415307052,-73.8535196009019,-73.8534886776347,-73.8534707218368,-73.8534447800117,-73.8534208225038,-73.8534088468033,-73.853393863739,-73.8533818650038,-73.8533688777153,-73.8533509031869,-73.8533429358845,-73.8533289744213,-73.8533130100533,-73.8533010773575,-73.853284149872,-73.8532791951899,-73.8532792804949,-73.8532892156569,-73.8532792536892,-73.8532652698554,-73.8532493140855,-73.8532233806506,-73.8532093788588,-73.8531860836648,-73.853186372303,-73.8531704012579,-73.8531334735192,-73.8530995197823,-73.8530935033295,-73.8530994561921,-73.8531064494667,-73.8531314005541,-73.8531413437593,-73.8531453083386,-73.8531462751296,-73.8531392641077,-73.8531172858252,-73.8530973196168,-73.8530743679875,-73.8530494210136,-73.8530324720249,-73.8530205134053,-73.8529965575196,-73.8529516332671,-73.8529126977316,-73.8528957129871,-73.8528876929795,-73.8528906490201,-73.8528756639761,-73.8528507111558,-73.852838717339,-73.8528107526375,-73.8527798017227,-73.8527648149811,-73.8527478137772,-73.8527318160401,-73.8527038620244,-73.8526759274827,-73.852649009632,-73.8526260867235,-73.8525891853565,-73.8525682458384,-73.8525393076982,-73.8525063790045,-73.8524714740327,-73.8524505644276,-73.8524336154864,-73.8524116572394,-73.852409632651,-73.8523906477891,-73.8523726691132,-73.8523537088094,-73.8523237806403,-73.8522978370962,-73.852286269696,-73.8522649187274,-73.8522419933465,-73.8522111255308,-73.8521633079637,-73.8521134775984,-73.8520516163077,-73.8520087237193,-73.8519638121882,-73.851954755384,-73.8519496990107,-73.8519246794946,-73.8519295663958,-73.851965407495,-73.8519683254009,-73.8519602745652,-73.851986127102,-73.8519920571493,-73.8520309073452,-73.8520767863382,-73.8521246024009,-73.852128533787,-73.8521154849752,-73.8521473543762,-73.8521612680621,-73.8521622048547,-73.8521900679255,-73.852221983892,-73.852260877445,-73.8523037552985,-73.852334695372,-73.8523716146554,-73.8524035358441,-73.8524264244444,-73.852464307485,-73.8524998268765,-73.8525181685117,-73.8525390974557,-73.8525719966265,-73.8525939046891,-73.8526317605148,-73.8526446580399,-73.8526405703008,-73.8526405182616,-73.8526554212502,-73.8526633493177,-73.8526532959709,-73.8526223570771,-73.8526038802099,-73.8525555983036,-73.8525187866038,-73.8524809862299,-73.8524671164259,-73.8524522354028,-73.8524043298245,-73.8523684032317,-73.8523344615481,-73.8522845212308,-73.8522695140979,-73.8522305726578,-73.8521915992135,-73.8521596261123,-73.8521177042803,-73.8520747808388,-73.852051822424,-73.8520339183496,-73.8520379499764,-73.8520400070478,-73.8520400761553,-73.8520211692655,-73.8519832930584,-73.8519404034285,-73.8519014900086,-73.8518805348517,-73.8518495677383,-73.8518176001013,-73.8517806563366,-73.8517227510034,-73.8517017379504,-73.8516996675923,-73.8516716382238,-73.8517025236902,-73.8517244567142,-73.8517443776384,-73.8517602906569,-73.8517802612273,-73.8518052388981,-73.8518481100765,-73.8518700382252,-73.851894996077,-73.8519249448049,-73.8519438972568,-73.8519618222183,-73.8519637548232,-73.8519646935954,-73.8519546635018,-73.8519296807585,-73.8519076749588,-73.8518876773598,-73.8518666866459,-73.8518606521707,-73.8518476324458,-73.8518286397961,-73.8518066660026,-73.8517767181874,-73.8517647439484,-73.8517617057672,-73.8517606758819,-73.8517546447402,-73.851735638536,-73.8517176381949,-73.8517126179115,-73.8517145767865,-73.8517199514252,-73.8517284676991,-73.8517334381237,-73.8517344034624,-73.8517403353418,-73.851723341874,-73.8517033760077,-73.8516794077641,-73.8516564411363,-73.8516324711914,-73.8515985574022,-73.8515756171554,-73.8515656078221,-73.8515466226777,-73.8515176746595,-73.8514807440011,-73.8514537865038,-73.8514308079914,-73.8514018550967,-73.8513848559532,-73.8513728461028,-73.8513827877656,-73.8514076868365,-73.8514315789991,-73.8514335428904,-73.8514205474514,-73.8513956248761,-73.8513786805421,-73.8513527280025,-73.8513268275913,-73.851294923369,-73.8512620024979,-73.8512141051585,-73.8511612292601,-73.8511612437272,-73.8511612970837,-73.8511603386555,-73.8511563885801,-73.8511534587287,-73.851151523729,-73.8511326084907,-73.8511236928843,-73.8511207406258,-73.8511138140651,-73.8510839331837,-73.8510569890697,-73.8510399837668,-73.8510379652877,-73.8510479078754,-73.8510588476728,-73.8510618167239,-73.851044860614,-73.851035896276,-73.8510269253721,-73.8510109755557,-73.8509880207676,-73.850997936849,-73.8510098402733,-73.8510117599378,-73.8509867407329,-73.8509697098994,-73.850968627208,-73.8509825296504,-73.8509817072239,-73.8509774574467,-73.850968462524,-73.8509495009996,-73.850929975844,-73.8509086052947,-73.8508866448223,-73.8508686655915,-73.8508740871468,-73.8508796062097,-73.8509015352977,-73.8509114895691,-73.8509004648336,-73.8508815275121,-73.8508814816469,-73.8509024031353,-73.850920328698,-73.8509452575911,-73.8509641656976,-73.850963123747,-73.8509580909464,-73.8509181263258,-73.8508961937835,-73.8508732553844,-73.8508533163888,-73.8508353559603,-73.8508044506331,-73.8507904897753,-73.8507695066495,-73.8507565000538,-73.8507315477329,-73.8507105752314,-73.8506936011984,-73.8506795971563,-73.8506785672471,-73.8506695518534,-73.8506425924211,-73.8506545340705,-73.8506774360948,-73.8506883714473,-73.8506843095895,-73.8506872524286,-73.850694200116,-73.8506931283458,-73.8506920849917,-73.8506770924734,-73.8506601011445,-73.8506500951482,-73.850632097047,-73.8506051202775,-73.8505881061336,-73.8505721023665,-73.8505471063031,-73.8505241565495,-73.8505042277061,-73.8504942259011,-73.8504762496644],"lat":[40.6123422190572,40.6123223877252,40.6123025841529,40.6122774490552,40.6122538398042,40.612233250609,40.6122218016554,40.6122103572627,40.6121989212945,40.6121973559186,40.6121912322552,40.6121957410937,40.6122010317842,40.6121956942437,40.6121804758347,40.6121675289598,40.6121545783066,40.6121454101824,40.6121385176128,40.6121354419276,40.6121361637588,40.6121414526009,40.6121414069858,40.6121421312328,40.6121421025496,40.612142075165,40.6121321767234,40.612123782987,40.6121176512515,40.6121138049565,40.6121099794017,40.6120971904925,40.6120765633969,40.6120667137255,40.6120394372462,40.6120257810728,40.6120113514449,40.6119801868134,40.6119596502527,40.6119421373899,40.61192692746,40.6119071459279,40.6119063511144,40.6119025211656,40.6118842459419,40.6118598852735,40.6118465467925,40.6118253580779,40.6118076875594,40.6118022215532,40.6117986835373,40.611789366548,40.6117803673569,40.611778116354,40.6117752170411,40.6117639694225,40.6117527327663,40.6117463082049,40.6117382885362,40.6117325261529,40.6117274066731,40.611725140263,40.6117239015728,40.6117174964018,40.6117053007664,40.6116895797062,40.6116767456211,40.6116661666166,40.611655602593,40.6116469647901,40.6116347949037,40.611622301782,40.6116114050406,40.6115902229306,40.6115828162774,40.6115696556086,40.611558411252,40.6115391477011,40.6115317619594,40.6115275799865,40.6115349304472,40.6115368180732,40.6115403628703,40.6115409782402,40.6115396672172,40.6115364254891,40.611529654548,40.611515205355,40.611505896138,40.6114885809576,40.6114757429652,40.6114568054633,40.6114430228684,40.6114318275296,40.6114145029331,40.6113923772592,40.6113769779501,40.611364474883,40.6113525992255,40.6113346335433,40.6113224483238,40.6113112259164,40.6112964788257,40.6112711406174,40.6112612226448,40.6112609256729,40.6112595744932,40.6112554965999,40.611245238196,40.6112311448944,40.6112237883243,40.6112144972773,40.6112058341522,40.6111971611202,40.6111871952943,40.6111814042812,40.6111656755858,40.6111541150738,40.611144800787,40.6111367933769,40.61112841657,40.611113337814,40.6111040367414,40.6110961572793,40.6110848449102,40.6110788038262,40.6110796090926,40.6110682434602,40.6110682760583,40.6110568921604,40.6110424502962,40.6110272416672,40.6110128042173,40.6109960653044,40.6109747560915,40.6109595310182,40.6109519152879,40.6109328928604,40.6109161596628,40.6109032194027,40.6108910341694,40.6108894830126,40.6108879266329,40.6108833108294,40.610881767484,40.6108817374676,40.6108927843053,40.6108923343106,40.6108839509891,40.6108710224637,40.610848965536,40.6108329886626,40.6107964721038,40.6107759381435,40.6107622500091,40.6107458979017,40.6107364693517,40.6107296504014,40.61071904521,40.6107038605714,40.6106818126106,40.6106521547983,40.6106323792773,40.6106118330745,40.6105943272159,40.6105676785999,40.6105516704045,40.610539479297,40.6105204457423,40.610502175712,40.6104808777222,40.6104649211044,40.6104444199169,40.6104345637355,40.6104171029179,40.6103973365306,40.610373753055,40.6103577690227,40.6103463559351,40.6103448178068,40.6103478327141,40.6103592315763,40.6103706546085,40.6103828046111,40.6103865719258,40.6103865379722,40.6103837394348,40.6103804140097,40.6103674711146,40.6103560650564,40.610348442772,40.6103408152591,40.6103294085638,40.6103180103433,40.6103088943349,40.6103047837082,40.6103120019706,40.6103241917835,40.6103310551198,40.6103227241583,40.6103090667177,40.6102938750578,40.6102794611133,40.6102688394561,40.6102627879336,40.6102491161209,40.610248407379,40.6102537788524,40.6102614245683,40.610263750291,40.6102599907276,40.6102600246026,40.6102562668267,40.610242630779,40.6102305035289,40.6102221874455,40.6101986163741,40.6101621198812,40.6101354765517,40.6101286223845,40.6100875176461,40.6100791226541,40.6100851599137,40.6100942525094,40.6101056520589,40.6101162993098,40.6101322714605,40.610152056096,40.6101695664714,40.6101847848889,40.610189327661,40.6101763665678,40.6101618972071,40.6101451602312,40.6101284022771,40.6101207885223,40.610107083442,40.6100994696877,40.6100842485261,40.6100705656025,40.6100614377059,40.6100462049434,40.6100347715041,40.6100263785772,40.6100134303596,40.6099928704475,40.6099821770404,40.6099798610425,40.6099691658079,40.6099600033016,40.6099508448731,40.6099378902344,40.6099264580577,40.6099157848184,40.6099111807093,40.6098966970539,40.6098814654105,40.6098713444874,40.609866964755,40.6098555325548,40.6098380266681,40.6098220604118,40.6098152335227,40.6098122507196,40.609813278998,40.6098106288407,40.6098106822466,40.609810749566,40.6097918702335,40.6097810935183,40.6097595036277,40.6097811677412,40.6098095639745,40.6098325825249,40.6098326404784,40.6098232372039,40.6097989267987,40.6097719308388,40.609755730015,40.6097368147035,40.6097124852548,40.609690835584,40.6096772776162,40.6096610010149,40.6096312688793,40.6096111102024,40.6095853129264,40.6095569208272,40.6095163824686,40.6094893471268,40.6094528510727,40.6094285378391,40.6094312975011,40.609462442469,40.6094894953285,40.6094895485603,40.6094922989204,40.6095024089996,40.6095234692898,40.6095370144645,40.6095451559293,40.6095289851154,40.6095276891263,40.609535846744,40.6095493808441,40.6095764203166,40.6096075212834,40.6096291940028,40.6096468092026,40.609615757392,40.6095942058593,40.6095591121576,40.6095104726639,40.6094780553452,40.6094605209104,40.6094335183234,40.6094186625985,40.6094024779622,40.6094065843601,40.6093917171071,40.6093728402222,40.6093647674645,40.6093567021089,40.6093472772104,40.6093473094337,40.6093622289488,40.6093838750702,40.6093622749619,40.609339344092,40.609325900229,40.6093083886424,40.6092908752377,40.6092746696306,40.6092490070447,40.6092449880857,40.6092355952243,40.609241035689,40.6092505364394,40.6092667872901,40.6092438310485,40.6092127674813,40.6091817152087,40.6091547078343,40.6091303439219,40.6091033044476,40.6090857468482,40.6090614366742,40.6090614916867,40.6090601952292,40.6090629395408,40.6090237386565,40.6089764224521,40.6089264209373,40.6088872253015,40.6088548187143,40.6088102557835,40.6087886396557,40.608771089391,40.6087614856205,40.6087548287821,40.6087412747078,40.6087250536804,40.6087074793551,40.6086696381272,40.6086507093885,40.6086290823188,40.6086115251896,40.6086183222639,40.6086250998535,40.6086291830135,40.6086359732088,40.608648195716,40.6086766216175,40.608679061504,40.6086577420625,40.6086429222654,40.6086341526255,40.6086470721449,40.6086565688255,40.6086741556864,40.6086876959756,40.6086890771114,40.6086728652102,40.6086580070446,40.6086417997055,40.6086323881634,40.6086283837643,40.6086121604472,40.6085972885846,40.6085661837761,40.6085488857508,40.6085350315523,40.6085052941699,40.6084836990308,40.6084743102729,40.6084581136505,40.6084473795667,40.6084352461396,40.6084014484856,40.6083717145457,40.6083392712956,40.6083108791914,40.6082811878691,40.6082380002356,40.6082326784181,40.6082408353447,40.6082314082188,40.6082206284575,40.6082112349266,40.6082112872196,40.6082275316656,40.608245103065,40.6082667347139,40.6082802112592,40.6083024550186,40.6083221214976,40.6083275445708,40.6083181282717,40.6082965352573,40.6082638363421,40.6082262522639,40.6082005989887,40.6081749541247,40.6081506341231,40.60812634431,40.6081060958987,40.6080776997563,40.6080547000904,40.6080276646501,40.6080033383352,40.6079884750488,40.6079628285511,40.6079561275972,40.6079521575877,40.6079711332754,40.6079914701413,40.6079793267878,40.6079874982818,40.6080199795675,40.6080317462792,40.6080403225059,40.6080322604043,40.6080106785496,40.6079861980239,40.6079579397322,40.6079240899991,40.6078956599058,40.6078496402693,40.6078198921791,40.6077847378544,40.6077549812043,40.6077306566312,40.6077198767077,40.6077361414569,40.6077605015905,40.6077794590885,40.6078159558126,40.6078470516656,40.6078822601389,40.6079174727837,40.6079215533695,40.6079026461569,40.6078918571341,40.6079013505643,40.6078815289053,40.6078880116112,40.6078718086198,40.6078262244497,40.6078475715643,40.6078651949079,40.6078598141576,40.6078544554591,40.6078653302606,40.6078789063678,40.6078532122506,40.6078313792109,40.6077991073181,40.6077910252205,40.6077897362084,40.6077897835277,40.607800648747,40.6078249981603,40.6078356209645,40.6078480247254,40.6078370363149,40.6078251850073,40.6078279543285,40.6078403662358,40.6078671913309,40.6078982870168,40.6078957947096,40.607871462801,40.6078447965418,40.6078254772784,40.6078092532892,40.6077713774313,40.6077348536948,40.6076942400377,40.6076833794209,40.6076671106308,40.607650837164,40.6076169877368,40.6075953290839,40.6075695944688,40.6075425257249,40.6075410992979,40.6075315744465,40.6075274579056,40.6075220135131,40.6075138570208,40.6075259609949,40.6075218443879,40.6075014789452,40.6074838668819,40.6074486945013,40.6074243479828,40.6073851221519,40.6073580528119,40.6073093324891,40.6072836100729,40.6072647096145,40.6072701716556,40.6072850954579,40.6072770292027,40.6072527271569,40.607220317708,40.6071946545011,40.6071920383884,40.6071921330773,40.6072030544717,40.6071909409116,40.6071937267174,40.6072086834302,40.6071843819448,40.6071628373348,40.6071710375856,40.6071683732815,40.6071805925681,40.6072090183684,40.6072360870428,40.6072307382594,40.6072659480061,40.6073119492182,40.6073390088907,40.6073390582406,40.6073391344811,40.6073540825545,40.6074000501074,40.6074256865846,40.607455403915,40.6074905973973,40.607492019495,40.607483994274,40.607459726217,40.6074544163603,40.6074598694356,40.6074841822963,40.6075112262505,40.607547723726,40.6075760956981,40.6075935413234,40.6075880254847,40.6075879358465,40.6076149018467,40.6076526969333,40.6076945768712,40.6077243495965,40.6077189760813,40.6077041687413,40.6077271906261,40.6077501567703,40.6077854193027,40.6078534748037,40.607926421621,40.6079872312608,40.6080608855752,40.6081281898792,40.6081794760417,40.6082948880848,40.6084038805116,40.6085096569764,40.6085962103029,40.6086860280342,40.6087565902389,40.6088015509634,40.6088561155069,40.6088209442975,40.608869152085,40.6089076877399,40.6089077830063,40.6089078623563,40.6089825124656,40.6090217781499,40.609053981317,40.6090760094514,40.6090895273752,40.6091114174058,40.6091435394664,40.6091875463819,40.6092619896353,40.6093687289532,40.6094636243699,40.6095432657176,40.6095941598321,40.6095976241554,40.6095638325395,40.6095267589415,40.6095200457969,40.6095219050095,40.6095229768743,40.6095237670265,40.6095373653582,40.6095746852475,40.6096272173852,40.6096644782709,40.6096929091097,40.6097254012008,40.6097592537973,40.6097982126811,40.6098320898555,40.6098710564324,40.6099100454758,40.6099304195761,40.6099253947634,40.6099101987179,40.609893282876,40.609899448652,40.6099181531228,40.6099302930743,40.6099481675611,40.6099638953308,40.6099731886553,40.6099832038702,40.6100032430255,40.6100153965689,40.6100247051575,40.6100361722015,40.6100504904045,40.6100530853901,40.6100562442104,40.610059835537,40.6100677075517,40.610067719286,40.6100820153513,40.6100898551802,40.6100935492413,40.6101005580741,40.6101119950938,40.6101255852004,40.6101391758094,40.6101527711113,40.6101577889405,40.6101813054796,40.6101978437351,40.6102114244525,40.6102285852609,40.6102421922884,40.6102464842076,40.610260787333,40.6102729495629,40.6102865202275,40.6102958107004,40.6103043975543,40.6103151145359,40.6103229620808,40.6103272645574,40.6103379920932,40.6103530157365,40.6103708977545,40.6103894874129,40.6104044946375,40.6104252279938,40.6104409545862,40.6104523763606,40.610469541857,40.6104724178223,40.6104638544211,40.610451705069,40.6104359731171,40.6104231265059,40.6104195668508,40.6104267377412,40.6104367522708,40.6104474675797,40.6104539154165,40.6104639306149,40.6104767971569,40.6104846475612,40.6104917837889,40.6105010719187,40.6105103412923,40.6105203435983,40.6105317817897,40.6105375231581,40.610534700445,40.6105489965096,40.6105732994007,40.6105861652725,40.6105904285595,40.610591127999,40.6106054123411,40.6106254249893,40.6106368509555,40.6106511527138,40.6106726225162,40.610671211243,40.610666942097,40.6106755418315,40.6106870022854,40.6106920219322,40.6106877586334,40.6106963536742,40.6107127991244,40.6107142134213,40.6107149081864,40.6107263423593,40.6107363545419,40.6107463802766,40.610752126308,40.6107521427032,40.6107564463276,40.6107686057163,40.6107714493737,40.6107800280146,40.6107886359279,40.6107908006992,40.6108043889401,40.6108136922937,40.6108165693976,40.6108180181448,40.6108254056191,40.6108344724515,40.6108416051885,40.6108508769403,40.6108572814497,40.6108593947133,40.6108686676262,40.610877240413,40.6108908239738,40.6109129627577,40.6109208049726,40.6109136277422,40.6108993112628,40.6109064376201,40.61091784769,40.6109256974256,40.6109263817981,40.6109192167702,40.6109213363524,40.6109320375899,40.6109456129467,40.6109641979137,40.6109856588428,40.6110056962768,40.6110221288371,40.6110392638486,40.6110549547593,40.6110584808989,40.6110555885046,40.6110455345774,40.6110319275392,40.6109940063721,40.6109696846979,40.6109432106028,40.6109274692457,40.6109145857613,40.6109088513959,40.6108888028406,40.6108766281499,40.6108723155802,40.6108729944967,40.6108729709897,40.6108643594265,40.6108428907241,40.6108171606628,40.6107992875158,40.6107799813182,40.6107649517605,40.6107577784413,40.6107484597447,40.6107355621092,40.6107276710762,40.6107304995238,40.6107276075205,40.6107161523364,40.6107018280153,40.6106803587659,40.6106503278616,40.6106288750979,40.6106124143071,40.61058524766,40.610566657976,40.6105416256016,40.6105308874362,40.610520854522,40.6105036995797,40.6104851040066,40.610472919815,40.6104628857114,40.6104542599034,40.6104399303129,40.6104341487021,40.6104341215668,40.6104319419667,40.6104140527865,40.6103983273668,40.6103768857132,40.610350456325,40.6103376192837,40.6103347998421,40.6103269636753,40.6103148242765,40.610292670303,40.6102683749899,40.6102604931682,40.610255553258,40.610243401561,40.6102148060546,40.6101947797724,40.610174758207,40.6101576185929,40.6101440425918,40.6101153404327,40.6101152294992,40.6101187300151,40.6101269032254,40.610141537916,40.6101508064349,40.6101686601832,40.6101764939446,40.6101850442304,40.6101885954847,40.6101864316977,40.6101756941539,40.6101613833871,40.6101428657522,40.6101320512321,40.6101263219948,40.6101277444215,40.6101220052062,40.6101284148172,40.6101412624399,40.6101512583878,40.6101584079175,40.6101626761905,40.6101676621972,40.6101783833565,40.6101926775676,40.6102055150222,40.6101983332569,40.6101925828619,40.6101818498511,40.6101803925878,40.6101810835761,40.6101910822779,40.6102025121901,40.6102096418658,40.6102046018889,40.6101995602171,40.6101902424939,40.6101866421885,40.6101839407457,40.610173337313,40.6101558167839,40.6101382906074,40.6101344558117,40.6101374640461,40.6101496121233,40.6101541403359,40.610146501599,40.6101305206431,40.6101228943655,40.6101228804674,40.610146440952,40.6101563150233,40.6101701173926,40.6101851904778,40.6101866699249,40.6101790311574,40.6101650031602,40.6101561746928,40.6101492822405,40.6101393531108,40.6101400937782,40.6101400697337,40.6101446086657,40.6101468432308,40.61013769135,40.6101376634895,40.6101406767731,40.6101521961021,40.6101612024997,40.6101619386748,40.6101499591859,40.6101375722783,40.610128421739,40.6101245925559,40.6101352281021,40.6101464310014,40.610160328045,40.6101740043094,40.6101793148578,40.6101838529855,40.6101815227227,40.6101814910164,40.6101830007613,40.6101959330932,40.6102073518755,40.6102142064091,40.6102149457616,40.6102111285713,40.6102035054127,40.6101890443059,40.6101829462076,40.6101874774628,40.6101912648014,40.6102041933288,40.6102171276988,40.6102315850018,40.6102346070171,40.6102300295713,40.6102239352771,40.6102140389157,40.6102262033891,40.6102375986598,40.6102429047805,40.6102459242466,40.6102451404715,40.6102375161195,40.6102253446965,40.6102086026737,40.6101941440939,40.6101933673332,40.6102032515013,40.6102169143608,40.6102275391116,40.6102320810888,40.6102274844607,40.6102228904685,40.6102183020607,40.6102076269648,40.6102022643118,40.6101991990925,40.610197646026,40.6102014175518,40.6102021625267,40.6102089878225,40.6102196196684,40.6102264475067,40.6102325087331,40.6102248932445,40.610221072852,40.6102202920645,40.610201264784,40.6101845125395,40.6101685353212,40.6101605277017,40.6101495353901,40.6101419180211,40.6101479848307,40.6101434009649,40.610138043941,40.610152475789,40.6101623537136,40.6101775432849,40.6101798037942,40.6101820380282,40.6101941629547,40.6102070831587,40.6102230611582,40.6102192680205,40.6102170189949,40.6102337623384,40.6102459350497,40.6102596245934,40.6102717839516,40.6102831637687,40.6102869403275,40.6102869109915,40.6102868790999,40.6102800130242,40.6102723924098,40.6102754041043,40.6102844731283,40.6102920274606,40.6103018924602,40.6103186128345,40.6103353472565,40.6103429333999,40.6103459432854,40.6103542935008,40.6103649041744,40.6103724698589,40.6103808162331,40.6103975250927,40.6104119543253,40.6104180021613,40.6104149245325,40.6104034826297,40.6103905246776,40.6103813520425,40.6103737198628,40.6103736827411,40.610372880244,40.6103629492152,40.6103423884889,40.6103355223249,40.6103377755446,40.6103507015085,40.6103620845279,40.6103696662586,40.610369641905,40.610365800712,40.6103650071294,40.6103563559666,40.6103596415835,40.610347443799,40.6103177449115,40.6102811798107,40.6102522174233,40.6102483345662,40.6102406746952,40.6102436591914,40.6102778690523,40.61030828266,40.6103409519639,40.610387348101,40.6104246581223,40.6104588845781,40.6104892943291,40.6105311544711,40.6105570192341,40.6105874887034,40.6105981949067,40.6106355202878,40.6106629031346,40.6106971090436,40.6107260483262,40.6107511624314,40.6107793028452,40.6108143211204,40.610821966811,40.6108326639592,40.6108471687916,40.6108449264615,40.6108464950505,40.6108510990373,40.6108800267093,40.6108968071513,40.610904375133,40.6109082836705,40.6109204776649,40.6109349700974,40.6109555309078,40.6109844789047,40.6110187169626,40.6110620604024,40.6110856353782,40.6111153136832,40.6111404200533,40.6111738696137,40.6111761108584,40.6111713869673,40.6111303956524,40.6110801560107,40.6110261118404,40.6109804644483,40.6109408994112,40.6109438802366,40.6109445950159,40.6109506349039,40.6109711041181,40.6109885762189,40.6109991733129,40.6110242194102,40.6110424300933,40.6110469391579,40.6110529680833,40.6110559808649,40.6110301006928,40.6110118540798,40.6109837186922,40.6109525384154,40.6109289378601,40.610909117296,40.6108999355691,40.6108976045274,40.6108975775256,40.6109119861713,40.610927915354,40.610937754456,40.6109498474173,40.6109756774342,40.6110091360389,40.6110486458077,40.6110707402079,40.6110806552387,40.6110974115727,40.6111210071393,40.6111157096533,40.6111020530493,40.6111195991999,40.6111310348591,40.6111265040277,40.611121219373,40.6111242856144,40.6111410398421,40.6111699412839,40.611196559363,40.6112193617424,40.6112352992821,40.6112588471471,40.6112763122654,40.6112922556053,40.6113135414581,40.6113348188098,40.6113492440557,40.6113583410424,40.61136286542,40.6113628499782,40.6113826190273,40.6113970674264,40.6114168326153,40.6114373413156,40.6114548096504,40.611468491481,40.6114852251479,40.6114990609455,40.611520986424,40.6115293579027,40.6115445691225,40.6115689127332,40.6115825796225,40.6115855956923,40.6115939303365,40.6116007451034,40.6116098401505,40.6116029519654,40.6115975996081,40.6116112749898,40.6116226578686,40.6116264230551,40.6116301774176,40.6116362267398,40.6116483646861,40.611654411417,40.6116695994139,40.6116855542748,40.6117022982688,40.6117243850061,40.6117502723439,40.6117647241066,40.6117745940437,40.6117631544284,40.6117540067037,40.6117570154743,40.6117372090099,40.6117242391772,40.6117196330872,40.6117180504353,40.6117126587396,40.6117061700181,40.6116822387109,40.6116639856679,40.6116457282483,40.6116168255025,40.6115894453774,40.6115696484166,40.6115399771673,40.6115217215413,40.6114950956999,40.611469960114,40.6114699252031,40.6114881549688,40.6114987995029,40.6115147832801,40.6115315280934,40.6115429393379,40.6115391146208,40.6115314983512,40.6115269237323,40.6115192977369,40.6115207891458,40.6115489400351,40.611580896747,40.6116151219297,40.6116470296067,40.6116766667258,40.611714690091,40.6117451287347,40.6117727222377,40.6117823855073,40.6117884580025,40.6117891936636,40.6117854935907,40.6117807755588,40.6117837888996,40.6117913708966,40.611799291674,40.61180735481,40.6118187906542,40.6118294512181,40.611850730547,40.6118408197488,40.6118613524009,40.611876589515,40.6118933434021,40.6119017419713,40.6119253415303,40.6119451131458,40.611964118669,40.6119861213884,40.6119762062055,40.6119700927933,40.6119617013535,40.6119601568824,40.6119471882102,40.6119426070961,40.6119547481704,40.6119699412576,40.6119714295192,40.6119790076042,40.611983549052,40.6119979794147,40.6120124278036,40.6120276255631,40.6120344349401,40.6120496611006,40.6120717447307,40.6120907709848,40.6121219460715,40.6121447646877,40.6121615055216,40.6121949654019,40.6122147370127,40.6122253640162,40.6122375095858,40.6122496648994,40.612265612404,40.6122800258989,40.6123020583299,40.6123187686649,40.6123400297955,40.6123392402089,40.6123262857299,40.6123361582828,40.6123422190572]}],[{"lng":[-73.8447349265296,-73.8447229936206,-73.8447057035394,-73.8446924017881,-73.844672452951,-73.8446591630022,-73.8446472024612,-73.8446312728595,-73.8446299707323,-73.8446100115926,-73.8445913840002,-73.8445780805596,-73.8445554929216,-73.844531544806,-73.8445089483928,-73.8444756836863,-73.8444543997129,-73.8444357993846,-73.8444118678238,-73.8443852818047,-73.8443746661564,-73.844356035341,-73.8443454117264,-73.8443308086007,-73.8443108537807,-73.844288243238,-73.8442762877069,-73.8442603265959,-73.844243056165,-73.8442284365072,-73.844213834245,-73.8442072149274,-73.8441952568305,-73.8441699729367,-73.8441446731284,-73.8441313247431,-73.8441113492895,-73.8440927120422,-73.844071417098,-73.8440527886617,-73.8440368463459,-73.8440275558222,-73.8440022654655,-73.8439809776353,-73.8439490529149,-73.8439251095962,-73.8439238153723,-73.8439105184294,-73.8438892345181,-73.8438639605477,-73.8438493348779,-73.8438492993004,-73.8438373104049,-73.8438200363659,-73.843801446562,-73.8437855083859,-73.8437642158303,-73.8437535267425,-73.843742353819,-73.843709821569,-73.8436763916728,-73.8436577788051,-73.8436325447933,-73.8436019592404,-73.8435700244192,-73.8435580830358,-73.8435302093554,-73.8435023199414,-73.8434757601056,-73.843466505357,-73.8434825487096,-73.8435092124542,-73.8435464875277,-73.8435824349682,-73.8435955539724,-73.8436037855299,-73.8436557448743,-73.8436837467453,-73.8436865025941,-73.8436493299525,-73.8436360948614,-73.8436361779906,-73.8436375891791,-73.8436017604471,-73.8435885766166,-73.8435607966931,-73.8434850728361,-73.8434312967933,-73.8426418488656,-73.8421426031247,-73.8420354369124,-73.8419543412693,-73.8418912318505,-73.8418365785253,-73.8417819948889,-73.8417064523443,-73.8416687422647,-73.8416141423191,-73.8415848279028,-73.8415807366068,-73.8415598169002,-73.8415094462146,-73.8415153526835,-73.8415097049056,-73.8415224868138,-73.8415730940218,-73.8415690179674,-73.8415691320521,-73.8415776340019,-73.8415777404744,-73.8415988736229,-73.8415779001828,-73.8414853935297,-73.8414054648174,-73.8413297642604,-73.841262571892,-73.8411366758422,-73.8410191228151,-73.8409392400831,-73.8409097271296,-73.8408382161589,-73.8407793362014,-73.840708152915,-73.8406786495179,-73.840674688955,-73.8406283326262,-73.8406027793688,-73.8406006584557,-73.8405940947806,-73.8404633512916,-73.8403410559739,-73.8401515000889,-73.8399746201101,-73.8398020218296,-73.8395537524229,-73.8393223730004,-73.8391121111206,-73.8389399375165,-73.8388603078202,-73.838818619427,-73.8387726252625,-73.8387137535223,-73.8387261835229,-73.8387553022767,-73.838822345053,-73.8388431397745,-73.8388764872634,-73.83887203436,-73.8388297654202,-73.8387959226323,-73.8386905585273,-73.838576893997,-73.8384295310793,-73.8381770604344,-73.8379793668549,-73.8378363876277,-73.837710268571,-73.8373824375975,-73.8370799718539,-73.8367775784568,-73.8365382728351,-73.8363620065488,-73.8362733164666,-73.836236211469,-73.8362279975167,-73.8363589402717,-73.8365277127985,-73.8366459827445,-73.8367894210466,-73.8369707506827,-73.8371113805957,-73.8372021497535,-73.8373536056825,-73.8374126576274,-73.8374800638429,-73.8375222398563,-73.8375266557178,-73.8374973920094,-73.8374933817753,-73.8374859767051,-73.8374771458891,-73.837460871766,-73.8375619728567,-73.8376797541219,-73.8378102272631,-73.8378878469759,-73.8379286157015,-73.8379918150998,-73.8380341221359,-73.8381185042153,-73.8381822895361,-73.8382571682532,-73.8383202833473,-73.8384426014277,-73.8385185790254,-73.8385230386758,-73.8386411827455,-73.8386566155071,-73.8386627570756,-73.8386798951334,-73.8387180262269,-73.838726598829,-73.8387268852698,-73.8387566835218,-73.8387736971928,-73.8388369487246,-73.8388708044949,-73.8389802341521,-73.8390095754642,-73.8389925788957,-73.8389713833827,-73.8389711669462,-73.8389835890153,-73.8390075544954,-73.8391010956617,-73.8391894616978,-73.8392947320806,-73.8394000172514,-73.8394926651175,-73.8396020867914,-73.8396565500674,-73.8396900831466,-73.8397235993446,-73.839778171914,-73.8398454582904,-73.8399254522003,-73.8399970134174,-73.8400431989323,-73.8400682523409,-73.8400806211448,-73.8400216290304,-73.8400424848316,-73.8400675613826,-73.8401515841758,-73.8401682350298,-73.8400881946618,-73.8400627881147,-73.8400668166789,-73.8400961200363,-73.8401423828568,-73.8401257324051,-73.8401721869819,-73.8402439092965,-73.8403197289947,-73.8404250151227,-73.8404965681561,-73.8405219824354,-73.8405306286689,-73.8404845194153,-73.8404341834747,-73.8403585239177,-73.8402239970561,-73.8401483535744,-73.8401400347869,-73.8401107777867,-73.8400688741971,-73.8400058223426,-73.8399049354177,-73.8398377246423,-73.8397622668143,-73.8396783297804,-73.8395816698765,-73.8394681370959,-73.8394346367263,-73.8394020446723,-73.8393718097293,-73.839359278682,-73.8394056099844,-73.8394705995675,-73.8395317111387,-73.8396326912675,-73.8397840751769,-73.8398807886116,-73.8399944144774,-73.8400156302481,-73.8399400959425,-73.840032749957,-73.8401505941793,-73.8402180566008,-73.8403359466906,-73.8404117798632,-73.8404203354783,-73.8405129962012,-73.8406685684013,-73.8407609918428,-73.8408408155674,-73.8410132010961,-73.8412236431589,-73.8413121436932,-73.841362776236,-73.8413882575904,-73.8413927595267,-73.8414098748905,-73.8413344470237,-73.841267352949,-73.8411749302719,-73.841128799264,-73.8410364537453,-73.8409692221773,-73.8408676978385,-73.8408090878788,-73.8407664325983,-73.8407131738463,-73.8406474232933,-73.8406100996152,-73.8405693842242,-73.8405783433284,-73.8406156992576,-73.8406158089979,-73.8406123673323,-73.840582194758,-73.840582068853,-73.840555357249,-73.8405126863364,-73.8404612355841,-73.8404245509224,-73.840418801155,-73.8404189336526,-73.8404243649144,-73.840424426314,-73.8404475818357,-73.8405309807364,-73.8405328385665,-73.8404974351022,-73.8404549387876,-73.8404195896725,-73.8404197157053,-73.8404411519911,-73.8404395355822,-73.8404574391524,-73.840541016456,-73.8405766039554,-73.840597983577,-73.8406316820575,-73.8406546937252,-73.8406527776698,-73.8406703841384,-73.8407128183989,-73.840751741587,-73.8407944240837,-73.8409927689482,-73.8411064047208,-73.8412284505578,-73.8412375783217,-73.8412792333321,-73.8412681516725,-73.8411840257591,-73.8410719999349,-73.8410554055813,-73.8411003879656,-73.8412013841208,-73.8412798834686,-73.8413416134941,-73.8413249578802,-73.841207365894,-73.8411570728115,-73.841151668878,-73.8411237590197,-73.8411295289571,-73.841269685684,-73.8413538716714,-73.8413821065203,-73.8414887884929,-73.8415841458137,-73.8416512600571,-73.8417071308875,-73.8417349695759,-73.8418581059152,-73.8419478468317,-73.8420321241897,-73.8420715091649,-73.8421836765808,-73.842206343518,-73.8423522988255,-73.8425148924678,-73.8426382307298,-73.8427614782015,-73.8428121866157,-73.8428852985389,-73.8429583110585,-73.8430535971933,-73.8431599262429,-73.84326616483,-73.8433560058054,-73.843602841562,-73.8435638980328,-73.8436312041417,-73.8438329693177,-73.8439733062666,-73.8441806877136,-73.8443095422673,-73.8444272940636,-73.8445268176749,-73.8444940021314,-73.8444309008437,-73.8443845816464,-73.8443257091225,-73.8442458571163,-73.8441534504043,-73.8440441495053,-73.8439180082548,-73.8437918151786,-73.8436908565118,-73.8436193318495,-73.8435351024205,-73.8434718731325,-73.8434338128622,-73.8433916077402,-73.8432906723569,-73.8431603933092,-73.8430763966545,-73.8429418451101,-73.8428619246376,-73.8427610272104,-73.8427063351035,-73.8426431576781,-73.8426304388112,-73.8426386808705,-73.8426469546981,-73.8426552587491,-73.8426887453705,-73.8427054139716,-73.8426674580761,-73.8426212962705,-73.8425835594378,-73.8425080314681,-73.8424997744113,-73.842436747899,-73.8423861999215,-73.8423020142335,-73.8422178745521,-73.8421001343882,-73.842028751858,-73.8419488536346,-73.8419361789036,-73.8419738706307,-73.8420073869784,-73.8420620180231,-73.8421460533585,-73.8422090096454,-73.8422341101596,-73.8422718477437,-73.8423600640593,-73.8424314992509,-73.8425408317016,-73.8426165474347,-73.8427300983309,-73.8428142313857,-73.8427975717112,-73.842797699992,-73.8429154706039,-73.8429660184463,-73.8429577066272,-73.8428778843754,-73.8428443145761,-73.8428108495608,-73.8427984168461,-73.8427607253048,-73.8428238634568,-73.8428701232123,-73.8429247324202,-73.8429751367756,-73.8430255478182,-73.8430717774779,-73.8431432276526,-73.8431852072885,-73.843201906219,-73.843227006355,-73.8432394705631,-73.8432309328276,-73.8432434419889,-73.843298012708,-73.8433484024526,-73.8433190673572,-73.8432897320798,-73.8432898298672,-73.84332777048,-73.8433824837837,-73.8434202602679,-73.8434369430773,-73.8434283754323,-73.8434535523078,-73.8434955398126,-73.8435417472865,-73.8436005755113,-73.8436509504348,-73.843688688135,-73.8436885680832,-73.8437094726817,-73.8437094351696,-73.843751452938,-73.8437851358407,-73.8438229480293,-73.8437850083666,-73.8437302939203,-73.8436671472708,-73.8436586848626,-73.8436501849251,-73.8436458599018,-73.8436415505399,-73.8436456422502,-73.8436119066003,-73.8435697910323,-73.8435654734411,-73.8436032189251,-73.8436493893907,-73.843691362444,-73.8437248812552,-73.8437500278978,-73.8437751593484,-73.8437246412071,-73.8437035046801,-73.8437244611726,-73.8437327879583,-73.8437537228616,-73.8437494428749,-73.8437745969175,-73.8437955462145,-73.8438333446034,-73.8438795754816,-73.8439005321218,-73.8439090606711,-73.8438923244586,-73.8439218036658,-73.8439050518134,-73.8439009517326,-73.843875865111,-73.8439137901323,-73.8438718924608,-73.8438677767656,-73.8439224404882,-73.8439393868358,-73.8438931936972,-73.8438595480259,-73.8438175748896,-73.8438134598942,-73.8438345664936,-73.8437840935402,-73.8437210363684,-73.8437084973965,-73.8437211864011,-73.8437464979693,-73.8438096447991,-73.8438475702581,-73.843830833808,-73.8438519700832,-73.8439318611261,-73.8439949471583,-73.8440244788632,-73.8440540169153,-73.8440541741135,-73.8439912228098,-73.8439492499654,-73.843928285485,-73.8438820559874,-73.843877918509,-73.8439074794641,-73.843869695365,-73.84380667694,-73.843760477777,-73.8437059054494,-73.8436471057611,-73.843621990431,-73.8436430891426,-73.8436515733431,-73.8436558758055,-73.8436223282128,-73.8436140084964,-73.8436141060839,-73.8436058164089,-73.8436058914794,-73.8436060040863,-73.8436313534893,-73.8436482465284,-73.8436652161333,-73.8437367559516,-73.8437956826357,-73.8438965656515,-73.8439889949052,-73.8440688547443,-73.8441191917836,-73.8441442626371,-73.8441567725592,-73.8442029649474,-73.8442617032225,-73.8443288753376,-73.8443834462525,-73.8444632033723,-73.8445178348101,-73.8445682168209,-73.8446059556451,-73.8445511963998,-73.8445342731685,-73.8445383586826,-73.8445466938932,-73.8445171705728,-73.8445254901962,-73.8445548566162,-73.8445968371787,-73.8446514163262,-73.8446681248533,-73.8446217379038,-73.8446048218555,-73.8446089135903,-73.8446718749707,-73.8447011881021,-73.8447220635424,-73.8446757360693,-73.8446335314697,-73.8445913566257,-73.8445870257229,-73.8445616392546,-73.8446035836209,-73.844645527387,-73.8446917581891,-73.8446916761829,-73.8446495744421,-73.8445823432986,-73.8445403622346,-73.8444858185454,-73.8444607321131,-73.8444482889468,-73.8444483486802,-73.8443894807622,-73.8443306965795,-73.8443308310816,-73.844246727576,-73.8441878597376,-73.8441247196037,-73.8441120015107,-73.8441202377955,-73.8441201330395,-73.8441242108087,-73.8441535483533,-73.8441788364937,-73.844271402603,-73.8442965187778,-73.8443005892225,-73.8443257443588,-73.8443340637702,-73.8443381111787,-73.8443673817241,-73.8444008856648,-73.8444511947197,-73.8444973660491,-73.844522475099,-73.84457707892,-73.8446486422981,-73.8446697649016,-73.8446866809421,-73.8446868076839,-73.8446532425202,-73.844615481836,-73.8446239663994,-73.8446912214224,-73.8447289976995,-73.8447752883111,-73.8448132210653,-73.8448595935368,-73.844897488968,-73.8449522178618,-73.8450699319287,-73.8451581814246,-73.8452085570635,-73.8452799876177,-73.8452968883699,-73.8452969849093,-73.8452844970965,-73.8453056541078,-73.8453183878321,-73.8453058768757,-73.8452975864161,-73.8452598391715,-73.8452304876952,-73.8451885511006,-73.8451464510356,-73.8450959633299,-73.845049747506,-73.8450666788946,-73.8450793814595,-73.8450920929833,-73.8451005400605,-73.8451635895842,-73.8452097830512,-73.8452559684677,-73.845319041228,-73.8453947489137,-73.8453948008631,-73.845394889919,-73.8453613193322,-73.8452983290103,-73.8452395364885,-73.8451932687932,-73.8451427887159,-73.8450839210421,-73.8450587524169,-73.845050446663,-73.8450505210409,-73.8450841515641,-73.8451430117167,-73.8452060759337,-73.8452860343942,-73.8453071466422,-73.8453072357483,-73.8453073322773,-73.8452779810111,-73.845189762376,-73.8450888844541,-73.8449838329598,-73.844950299104,-73.8449083915856,-73.8449085106988,-73.8449170247396,-73.8449390597056,-73.8450117952542,-73.8450721015728,-73.8451075380719,-73.8451465095109,-73.8451748396747,-73.8452102887727,-73.8452439356139,-73.8452935667617,-73.8453450039767,-73.8453982199839,-73.8454443475309,-73.8455011454216,-73.8455189310117,-73.8455349565766,-73.8455208152221,-73.845535078568,-73.845554628578,-73.8455989971601,-73.8456220195819,-73.8456485907965,-73.84565738812,-73.8456715194846,-73.8457034064625,-73.8457459572916,-73.8457796237374,-73.8458150644845,-73.845845239241,-73.8458853976148,-73.8459116326988,-73.8459416914646,-73.8459935255172,-73.8460446784227,-73.8460504195721,-73.8460438415911,-73.8460296911847,-73.846045219229,-73.8460588271093,-73.8460547567248,-73.8460481599907,-73.8460301744177,-73.8460207334771,-73.8460548837839,-73.8460779906174,-73.8460868849336,-73.8460983214542,-73.8460879518978,-73.8460690622675,-73.8460956122559,-73.846132542225,-73.8461419399122,-73.846188977504,-73.8462205337263,-73.8462748413707,-73.8462793020998,-73.8462824556455,-73.8462585004051,-73.8462579279705,-73.8462702729731,-73.8462983392961,-73.8463184810365,-73.8463396070433,-73.8463549581849,-73.846362552251,-73.8463672573075,-73.8463874308773,-73.8464079132409,-73.8464059829668,-73.8464340305646,-73.8464630258632,-73.8465071518604,-73.8465355249001,-73.8465739602192,-73.8466250373112,-73.8466814830252,-73.8467136286114,-73.8467460962748,-73.8467931429447,-73.8468262916206,-73.8468806062335,-73.8469251344865,-73.8469472502145,-73.846981654836,-73.8470034177526,-73.8470185463289,-73.8470406234706,-73.8470586067358,-73.8470860580826,-73.8471015295498,-73.8471144809448,-73.8471258566548,-73.847132505541,-73.8471404189847,-73.8471555816326,-73.847186264103,-73.8472035374234,-73.8472314926934,-73.8472581014459,-73.8472780640355,-73.8472967132438,-73.8473219994547,-73.8473486111781,-73.8473738950662,-73.8474071600266,-73.8474478431249,-73.8474674283526,-73.8474830941582,-73.847485290091,-73.8474790696756,-73.8474685933531,-73.8474604978682,-73.8474710776743,-73.8474743715105,-73.847482731605,-73.8474837936962,-73.8474792734866,-73.847488788202,-73.8474921212367,-73.847494838285,-73.8474913809244,-73.8474918701014,-73.8474862062627,-73.84747551045,-73.847446322338,-73.8474462939929,-73.8474563311199,-73.8474562646574,-73.847444918044,-73.8474279124212,-73.8474065676336,-73.8473678111149,-73.8473453494942,-73.8473004510236,-73.8472724115819,-73.8472393297459,-73.8472163046748,-73.8471927107935,-73.8471764037968,-73.8471741126429,-73.847162228985,-73.8471941989318,-73.8472374174058,-73.8472834227156,-73.8472906636346,-73.8472726583086,-73.8472176256624,-73.847179988871,-73.8471086668699,-73.8470631661799,-73.8469969089644,-73.8469334561756,-73.8468733304052,-73.846852492672,-73.8468305280846,-73.8467867347636,-73.846741787,-73.8467142582716,-73.8466715994951,-73.846642448688,-73.8466458650911,-73.8466745282921,-73.8466930813617,-73.8467200736655,-73.8467380788477,-73.8467594358104,-73.846760607356,-73.8467651306896,-73.8467831070486,-73.8467870646168,-73.8468140301243,-73.846832596764,-73.8468298371257,-73.8468315518319,-73.8468096794549,-73.8467703547163,-73.8467484096785,-73.8467494849963,-73.846729767396,-73.8467229887737,-73.846697162719,-73.8466640926878,-73.8466310377441,-73.8465845158443,-73.8465693481907,-73.8465911860481,-73.8466091083637,-73.8466152255963,-73.846646612637,-73.8466246833438,-73.8465915389406,-73.8465897812541,-73.8465925426887,-73.8465829552932,-73.8465975038199,-73.8466233050396,-73.8466429299481,-73.846631658268,-73.8466119783197,-73.8465805027333,-73.8465389806843,-73.846514303228,-73.8464828564615,-73.8464530864459,-73.8464261107155,-73.846377216809,-73.8463642502363,-73.8463423316166,-73.8463125666837,-73.8462811126293,-73.8462350530638,-73.8462069425118,-73.8461984800592,-73.8462034748197,-73.8461888530893,-73.8461658466539,-73.8461427943188,-73.8461236717565,-73.8461073873949,-73.8460765207276,-73.8460372448246,-73.8460193254917,-73.8460025431043,-73.8459728045195,-73.8459581968995,-73.8459295659693,-73.8459099209065,-73.8459121413754,-73.8459463424081,-73.8459648347448,-73.8459878397641,-73.8460029498037,-73.8460225513655,-73.8460371047392,-73.8460511587599,-73.8460511883533,-73.846066356498,-73.8460848945702,-73.8461045119311,-73.8461241343376,-73.846158372811,-73.8462004538797,-73.8462341206655,-73.8462492211557,-73.8462536761064,-73.8462429621471,-73.8462238333264,-73.8462159192286,-73.8462181105161,-73.846198969192,-73.8461955664159,-73.8461831884732,-73.8461685673366,-73.84616797297,-73.8461482900335,-73.8461471315242,-73.8461398035331,-73.8461268873866,-73.846110047686,-73.8461083383983,-73.8461217966628,-73.8461335564893,-73.8461543224932,-73.8461643848721,-73.8461738887078,-73.8461660037995,-73.8461530646397,-73.8461681799647,-73.8461776907093,-73.8461967625744,-73.8462298834772,-73.8462467104018,-73.8462686095276,-73.8462843058774,-73.8462803491472,-73.8462724736669,-73.8462791826803,-73.8463066625615,-73.8463336006361,-73.8463498991057,-73.8463718318137,-73.8463752493269,-73.8463792021,-73.8464111887138,-73.8464189968277,-73.8464442266324,-73.8464745371526,-73.8465098964454,-73.8465200172955,-73.8465419627298,-73.8465751026303,-73.8465986887707,-73.8466216765968,-73.8466340279571,-73.846636233155,-73.8466316955492,-73.8466209889603,-73.8466108388645,-73.8466018259754,-73.8465793619473,-73.8465546324227,-73.8465321431399,-73.846507987573,-73.8464832579145,-73.846464149367,-73.8464433460035,-73.8464286890837,-73.8464269637659,-73.8464157085971,-73.8464050103455,-73.8463909553648,-73.8463757775816,-73.846362280392,-73.8463532711398,-73.8463549199082,-73.8463605055052,-73.8463750640408,-73.8464087181833,-73.8464350760565,-73.8464692817815,-73.8464962091687,-73.8465231144832,-73.8465314901909,-73.8465308854146,-73.8464904602627,-73.846464058077,-73.8464488581801,-73.846451598082,-73.846442009482,-73.8464144716567,-73.8463942506791,-73.8463903067346,-73.8464026472686,-73.8464296029182,-73.8464492881836,-73.8464689699295,-73.8464707345959,-73.8464994004375,-73.8465240963296,-73.8465481992477,-73.8465560753011,-73.8465550217555,-73.8465556255419,-73.8465360529923,-73.8465058072302,-73.84646487242,-73.8464368171189,-73.8464087870713,-73.8463875004395,-73.8463993292806,-73.8464195511628,-73.8464465372022,-73.8464465982044,-73.8464775375434,-73.846540484632,-73.8465662989658,-73.8466027538306,-73.8466370020919,-73.8466404106805,-73.8466556057604,-73.8466893276248,-73.8466770489423,-73.8466585369991,-73.8466546759774,-73.8466698988621,-73.8466553678406,-73.846630178304,-73.8466162069531,-73.8466297432352,-73.8466275701361,-73.8466287555083,-73.846633275633,-73.8466635752536,-73.8466854102264,-73.8467150851618,-73.8467234467892,-73.8467379811063,-73.8467581920525,-73.8467627200143,-73.846759963644,-73.8467560934141,-73.8467718192485,-73.8467875093137,-73.8467924781365,-73.846809242262,-73.8468266107697,-73.8468428906098,-73.8468513347219,-73.8468457785077,-73.8468318122202,-73.8468279507954,-73.8468274468614,-73.8468617413856,-73.84689095135,-73.8468724744663,-73.8468382601141,-73.8468382228223,-73.846810703705,-73.8467686080554,-73.8467338072198,-73.8466900280334,-73.8466625894622,-73.8466300007083,-73.8466164801738,-73.8465996015116,-73.8466028931304,-73.8465798377412,-73.8465585100093,-73.8465466906863,-73.8465258677535,-73.8465017050381,-73.8464775275586,-73.8464522424614,-73.8464213762561,-73.8463882593184,-73.8463416745643,-73.8462788247281,-73.8462243796058,-73.8462075889394,-73.8461931026913,-73.8461998921582,-73.8462324363734,-73.8462588275285,-73.846270116818,-73.8462926556356,-73.8463045769856,-73.8463041087022,-73.8463333344551,-73.8463216294492,-73.8463463841175,-73.8463841490159,-73.8464100890794,-73.8464444171341,-73.8465044974546,-73.8465926446059,-73.84663983014,-73.8467211971561,-73.84679137598,-73.8468301973431,-73.8468915167321,-73.846965646439,-73.8470307839784,-73.8470475627628,-73.8470829320346,-73.8471267371283,-73.8471789635597,-73.8472216197211,-73.8472637081964,-73.8473074971552,-73.8473748634714,-73.8474259749738,-73.847480976467,-73.8475354056262,-73.8475719021788,-73.8475966321568,-73.8476000668075,-73.847604024889,-73.8476164138215,-73.8476344150842,-73.8476613811097,-73.8476797813579,-73.8477045885999,-73.8477382497663,-73.8477577435819,-73.8477772349777,-73.8478055994573,-73.8478339542603,-73.8478623150133,-73.8478959980423,-73.8479349985045,-73.8479509155932,-73.8479739358657,-73.847991634763,-73.8479987062778,-73.8480217696668,-73.848051923043,-73.8480785106575,-73.8481104040756,-73.8481192114769,-73.8481298033024,-73.8481511027284,-73.8481848089312,-73.8482096163547,-73.8482433001765,-73.8482787534881,-73.848312421091,-73.848340782225,-73.8483815692561,-73.8484259327645,-73.8484543151811,-73.8484897998896,-73.8485270481652,-73.8485607320532,-73.8485855540202,-73.8486068650358,-73.8486334534416,-73.8486618076212,-73.8486653157499,-73.8486759226641,-73.8486812171507,-73.8487060363065,-73.8487379638836,-73.8487592471102,-73.8487805073757,-73.8487946821949,-73.8488106333108,-73.8488176949182,-73.8488194316181,-73.8488442538751,-73.8488460745464,-73.8488319318526,-73.848842624966,-73.8488621655849,-73.8489100855769,-73.848933177424,-73.8489704292325,-73.8489916943225,-73.8490218325103,-73.8490413248379,-73.8490501605885,-73.8490518820587,-73.8490909027691,-73.8491033784022,-73.8491176241883,-73.8491619778384,-73.8491939298478,-73.8491940031416,-73.8491958237028,-73.8492029556223,-73.8492349062696,-73.8492438168606,-73.8492278877698,-73.8492279274612,-73.8492155245294,-73.8492155703328,-73.8492297955432,-73.849251119938,-73.8492742107693,-73.8493008318994,-73.8493221030756,-73.8493344900916,-73.8493344473768,-73.8493468435533,-73.8493681090879,-73.8493893839989,-73.8494106556425,-73.8494372482468,-73.8494585540947,-73.8494958313123,-73.849501210611,-73.8495172302967,-73.8495420653506,-73.8495563087591,-73.8495918048541,-73.849635982392,-73.8496467834861,-73.8496449424131,-73.849639566215,-73.849607583235,-73.8495827068365,-73.8495666986836,-73.8495915154954,-73.8495985470238,-73.8495931586147,-73.8495930946534,-73.8495912169969,-73.8495823047528,-73.8495840355468,-73.8495697890391,-73.849564385373,-73.8495802993732,-73.8496139941548,-73.8496281401711,-73.8496316387696,-73.8496120501696,-73.8496403628918,-73.8496634233566,-73.8496846805986,-73.8496988436044,-73.8496899228845,-73.8496561847337,-73.8496490306907,-73.8496383482383,-73.8496223375981,-73.8495885954672,-73.8495601800025,-73.8495335431887,-73.8494927459699,-73.8494537372229,-73.8494129254234,-73.8493880846949,-73.8493632097502,-73.8493472020559,-73.8493170572959,-73.8492993487248,-73.8492798693227,-73.8492781318439,-73.8492834838045,-73.8492888449174,-73.84929952573,-73.8492960082593,-73.8492871782947,-73.8492641805878,-73.8492518100776,-73.8492146054203,-73.8491844579278,-73.8491578287562,-73.8491329965817,-73.8491188384753,-73.8490904963147,-73.8490709825215,-73.8490531854088,-73.8490336447532,-73.8490123583855,-73.8489786528634,-73.8489543328232,-73.8489396578239,-73.8489077364696,-73.8488864485689,-73.8488580819835,-73.8488226069714,-73.8487818127208,-73.8487569928139,-73.8487321278423,-73.8487036855439,-73.8486859011951,-73.8486432901259,-73.8485953729335,-73.8485900116402,-73.8485810861472,-73.8485792575064,-73.8485774284258,-73.8485560883379,-73.8485400780077,-73.8485400043956,-73.8485399062453,-73.8485363150859,-73.8485061337585,-73.8484671075202,-73.8484351520667,-73.8483925591821,-73.8483535228402,-73.8483339856923,-73.8483002563116,-73.8482452702949,-73.8482275772676,-73.8482294012131,-73.8482489421009,-73.8482808697004,-73.8482773770072,-73.8482454454666,-73.8482223664663,-73.8481886590586,-73.8481656125533,-73.8481585422554,-73.8481692413715,-73.8481692997929,-73.8481480118247,-73.8481214039527,-73.8480877137147,-73.8480611333172,-73.8480557644012,-73.8480326700117,-73.8480379637609,-73.848020196959,-73.8480130638106,-73.8480130207196,-73.8480165080418,-73.8480217624411,-73.848042974401,-73.8480766862563,-73.8481263440223,-73.84815293966,-73.8481688601052,-73.8481812286026,-73.8481847329069,-73.8482024474718,-73.8482272576179,-73.8482378551021,-73.8482413455995,-73.8482395247253,-73.8482345963592,-73.8481984234031,-73.8481629481098,-73.8481381219063,-73.8481097813104,-73.8480743244917,-73.8480228780035,-73.8479909377683,-73.8479608178286,-73.8479537770134,-73.8479361055956,-73.8479166446815,-73.8478954096684,-73.8478687979787,-73.8478456995201,-73.847826164906,-73.8477729690261,-73.8477090886136,-73.8476576413066,-73.8476274807159,-73.847584896917,-73.8475458589125,-73.8475529057512,-73.8475315497744,-73.8475030997333,-73.8474676050558,-73.8474303528024,-73.8473966253902,-73.8473717442603,-73.8474196132007,-73.847444400977,-73.8474443515467,-73.8474407609378,-73.8474353962068,-73.8474016718232,-73.847380429181,-73.8473609244676,-73.8473324981455,-73.847327133382,-73.8473164396325,-73.8473004164354,-73.8472861837043,-73.8472577767547,-73.8472275764518,-73.8472044622408,-73.8471973142451,-73.8471830449883,-73.8471510946003,-73.8471209010721,-73.8471066571957,-73.8470853327281,-73.8470586896271,-73.847058655559,-73.8470231663681,-73.8469929789649,-73.8469805239896,-73.8469911143198,-73.8470087960743,-73.8470229371197,-73.8470353177523,-73.8470334971579,-73.8470122042541,-73.846983802432,-73.8469660352123,-73.8469393798304,-73.8469056179418,-73.8468949401432,-73.8468860276065,-73.8468788701561,-73.8468805962389,-73.8469071781516,-73.8469355432905,-73.84695858337,-73.8469673965028,-73.8469371989769,-73.8469123198643,-73.8468839064059,-73.8468501754085,-73.8468501071746,-73.8468571445813,-73.8468986130557,-73.8468709395582,-73.84682444495,-73.8467546230246,-73.8467210419884,-73.8466749206159,-73.8466244905019,-73.8465950041963,-73.8465403100643,-73.8464940709735,-73.8463973946578,-73.8463259907791,-73.8462671890173,-73.846204106855,-73.8461283666438,-73.8460735616297,-73.8460062829947,-73.8459473401565,-73.8459598223434,-73.8459681355389,-73.8459006861952,-73.8458501746615,-73.8457785872661,-73.8457280608301,-73.8456481371384,-73.8455976624969,-73.845509358193,-73.8454757262426,-73.8454211503515,-73.845341360265,-73.8452489853405,-73.8451732965413,-73.8450934835554,-73.8449841995092,-73.8449086075543,-73.8448623381214,-73.8448999888913,-73.8449587694943,-73.845042823912,-73.8451689650871,-73.8452445418556,-73.8453242799603,-73.8453746507303,-73.8454249844575,-73.8454248805759,-73.8455005103915,-73.8456224914639,-73.8456940807396,-73.8458035351152,-73.8458835039221,-73.8459803146305,-73.8460686693409,-73.8461486902625,-73.8462412056391,-73.8462789702237,-73.8462367730337,-73.8461693090065,-73.8461187524202,-73.8460219946532,-73.8459504138359,-73.8458746136635,-73.845828255169,-73.8458113236181,-73.8459204460745,-73.8459539238551,-73.8459158867749,-73.8458064523165,-73.8457978798185,-73.8458103391959,-73.8457471093452,-73.845746968655,-73.845721567298,-73.8456373335037,-73.8455532700862,-73.8455320527278,-73.8455655520094,-73.8456286415475,-73.8456959229829,-73.845737899252,-73.8457672377796,-73.8457670897029,-73.8457627290229,-73.8457415786805,-73.8456657458134,-73.8455858499757,-73.8454933607707,-73.8454429605181,-73.8453882352513,-73.8454554338533,-73.8455562667923,-73.8456150640832,-73.8456779910245,-73.8456736450496,-73.8456146490559,-73.8455262757017,-73.8454505609284,-73.8454210665241,-73.8454545955214,-73.8455049825833,-73.8455680224644,-73.8456184229,-73.845681373951,-73.8456980615756,-73.8457357665139,-73.845735677648,-73.8457020140977,-73.8456473705077,-73.8455884911553,-73.8455296131163,-73.8455547246654,-73.8455798063803,-73.8456427947639,-73.8457352851574,-73.8457603670892,-73.8457518010638,-73.8456844754145,-73.8456045783877,-73.8455246591147,-73.8455370583472,-73.8456292600771,-73.8456921600087,-73.8457095247721,-73.8457548512181,-73.8457504163704,-73.8457334263563,-73.8457022190523,-73.845666150348,-73.8456241803107,-73.8455528636917,-73.8454562264151,-73.8453217505209,-73.8452209837994,-73.8451748608899,-73.8450868057208,-73.8449902369881,-73.8448977239226,-73.8448555013712,-73.8448804932449,-73.8450189135337,-73.845165819394,-73.8452581242005,-73.845249454442,-73.8452870259815,-73.8452699379231,-73.8452360800081,-73.8451979814699,-73.8451766655275,-73.8450881107296,-73.8450753467759,-73.845188648562,-73.8452094671394,-73.8452891288004,-73.8453016184833,-73.8454023578588,-73.8454780309238,-73.8456209268539,-73.8456579795156,-73.8457090815461,-73.8456963326668,-73.8456546076206,-73.8455658816745,-73.8455153293429,-73.8453890452969,-73.845300719866,-73.8452863840803,-73.845274362746,-73.8452836369212,-73.8453142536135,-73.8453635017833,-73.8453874566839,-73.8454140449336,-73.8454232990439,-73.8454072533455,-73.8453792710077,-73.8453379970861,-73.8452967238102,-73.8452714001662,-73.8452567123506,-73.8452606316723,-73.8452779060393,-73.8453111845649,-73.8453537936773,-73.8453710718755,-73.8453563535428,-73.8453416432756,-73.8453136685546,-73.8452857237123,-73.8452790320115,-73.8453002883219,-73.8453229075339,-73.8453614735047,-73.8453734017971,-73.8453706960724,-73.8453546865376,-73.8453320049006,-73.8453252967523,-73.84532526151,-73.8453372124266,-73.8453491836774,-73.8453597947619,-73.8453677368914,-73.8453823542844,-73.845403620073,-73.8454235838232,-73.8454542024074,-73.8455033975926,-73.8455406534994,-73.8455832205485,-73.8456217604414,-73.8456321551454,-73.845644323898,-73.8456442652822,-73.8456301337211,-73.8455736553617,-73.8455350486359,-73.8454977884076,-73.8454764474528,-73.8454675712321,-73.8454351591163,-73.8454098594437,-73.8453894493949,-73.8453272967811,-73.845286082765,-73.8452475022612,-73.8451916222918,-73.8451556967308,-73.8451317227583,-73.845107769956,-73.8450851234064,-73.8450797425702,-73.8450584065889,-73.8450171253638,-73.844973165642,-73.8449491774759,-73.8449211970709,-73.8448905240891,-73.8448798440511,-73.8448612553972,-73.8448346032667,-73.8448332074818,-73.8448331650566,-73.8448194177593,-73.8447907028927,-73.8447721168316,-73.8447668396115,-73.8447495557174,-73.8447349265296],"lat":[40.6139691718016,40.6139509038826,40.6139478386979,40.6139457929535,40.6139417102849,40.6139345936123,40.6139284939615,40.6139122484043,40.6139000784983,40.6139000515186,40.6139000263356,40.6138989949648,40.6138847683349,40.6138837213906,40.613873551626,40.6138735066236,40.6138714493812,40.6138592565665,40.6138511115762,40.6138399218304,40.613827739815,40.6138287284761,40.6138195887769,40.6138053729146,40.6138033174456,40.6137992311051,40.6137911029791,40.6137880390251,40.6137768618674,40.613769744013,40.6137545140828,40.6137403101973,40.613733195946,40.6137341750562,40.6137422526854,40.6137604863864,40.6137675573414,40.6137715877782,40.6137735873363,40.6137735620649,40.6137634005645,40.6137532475853,40.6137572701524,40.6137562267036,40.6137521271511,40.6137490528163,40.6137338410855,40.6137297673163,40.6137277104718,40.6137246338145,40.6137195443468,40.6137347537695,40.6137408216394,40.6137306582996,40.6137144096824,40.6137022197094,40.6137032041546,40.6137224559831,40.6137336181742,40.6137244173037,40.6137149620667,40.6136990037228,40.6136786898246,40.6136715501702,40.613671506715,40.6136572948789,40.6136278513812,40.6136055047262,40.6135831610476,40.6135577986,40.6135253725579,40.6135031013463,40.6134950401569,40.6134859630947,40.6134697800369,40.6134596284145,40.6134313069234,40.6134059951614,40.6133654400948,40.6133298993194,40.6132994612001,40.6132639715964,40.6132294978533,40.6131878752352,40.6131361437179,40.6130671549218,40.6130163521458,40.6129715737463,40.6131729663062,40.6127756523877,40.612690365989,40.6126819053616,40.6126946379054,40.6126881530491,40.6126528259334,40.612588627601,40.612530890334,40.6125019727824,40.6124506568903,40.6124025804223,40.6123576862626,40.6123191599891,40.6122764590751,40.6122101995178,40.6121397136472,40.6120788934113,40.6120244079645,40.6119763372902,40.6119378921755,40.6118930264916,40.6118481896182,40.6118257280492,40.6118223951778,40.6118351035889,40.6118382039496,40.611799654343,40.61169052075,40.6116102397173,40.6116037195342,40.6116357270294,40.61164524136,40.6116483646482,40.6116340386037,40.6115488787971,40.6114463221371,40.6114879195419,40.611622482446,40.6116506542339,40.611737839734,40.6118978941751,40.612041937204,40.6121762715807,40.612284986297,40.612361659543,40.612428611255,40.6124667448835,40.6124664507737,40.6123668633239,40.6122545872252,40.6121039067746,40.6119948814334,40.6119947988415,40.612071729952,40.612203164304,40.6123026041622,40.6123987748166,40.6125206012305,40.6126231461515,40.612712818719,40.612796094593,40.6128920882712,40.6129432036973,40.6130167054845,40.6130804441549,40.6130993940008,40.6130991923777,40.6130829908841,40.6130088192322,40.6128802022665,40.6127227422723,40.6125621657072,40.6124177032412,40.6123194591012,40.6122701064132,40.6121899773767,40.6119530143525,40.6117225151532,40.6115079664369,40.61131909201,40.6111110426474,40.6110820274373,40.6110633004495,40.6110346713533,40.6109610472251,40.6109098663743,40.6108586509949,40.6107721295549,40.6107015841733,40.6106214606568,40.6105289070302,40.6103810838214,40.6101567305944,40.6100831646659,40.6100673073868,40.6100501154332,40.6099355010662,40.6097535964866,40.6097024105725,40.6095967141666,40.6094814625058,40.6095007170012,40.6095233193967,40.6095073845231,40.6093537298052,40.6092352617035,40.6091295131078,40.608963033473,40.6088002977682,40.608735528012,40.6086041585204,40.6084856378246,40.6084183506612,40.6082997768531,40.6081491965993,40.6080691031034,40.6079954829453,40.6079057985426,40.6078642902127,40.6079027881651,40.6079764720502,40.6080469463871,40.6081366779521,40.6082168138895,40.60828206728,40.6083131199814,40.6082876056379,40.6082268633519,40.6081597113198,40.6081021565521,40.6080638519525,40.6081472506434,40.6081921634356,40.608243485697,40.6082820186321,40.6082789075736,40.6082373573257,40.6082054097887,40.608234317087,40.6083080601423,40.6084106280538,40.6084618221478,40.6085323551995,40.60859648445,40.6086286485109,40.6086991756903,40.6087599533755,40.6088336262129,40.6089073406759,40.6089618619644,40.6089587214813,40.6088881943006,40.6088049360477,40.608705689394,40.6086513149041,40.6085841619377,40.6085554189142,40.6084785404853,40.608379206617,40.6083182526111,40.6082669077262,40.6082539833243,40.6082409775584,40.6082216440403,40.6081831761244,40.6081094265663,40.6080484787441,40.608038776487,40.6080258173364,40.6079968818581,40.6079006351463,40.6078332189014,40.6078106501864,40.6078104916719,40.6077527601873,40.6076995160611,40.607650121692,40.6076148521626,40.6075828697271,40.6075982782207,40.6076022743614,40.6075767771198,40.6075737834058,40.6075739181788,40.6075356202347,40.6074555317319,40.6073913322059,40.6073305716712,40.6072858691026,40.6072090503755,40.6071451191704,40.6070843349616,40.6070234568098,40.6069594910608,40.6069629116663,40.6069982917702,40.6070272446816,40.607033892937,40.6069508609689,40.6068676604866,40.6067940220145,40.6066883011285,40.606563323446,40.606438363167,40.6063292981718,40.6062522923221,40.6062169126228,40.6061655733379,40.6060981464488,40.6060788261031,40.6061135867961,40.6061432487866,40.6061769897422,40.6061944914434,40.6062430722569,40.6062727641591,40.6062375561857,40.6061997128521,40.6061565005516,40.6061105330059,40.6060659126641,40.6060726306254,40.6061253581242,40.6061685851809,40.6062090853259,40.6062117180099,40.6061895051325,40.6061535237476,40.6060980921675,40.6060521320101,40.6060264439879,40.6059872689143,40.6059765684641,40.6059414188681,40.6059102744575,40.6058777675584,40.6058236388467,40.6057709113465,40.6057087500363,40.6056424998302,40.6055735731334,40.6054885135262,40.6054425951941,40.6054034169548,40.6054061679452,40.6054264794436,40.6054859649421,40.6055414211181,40.6055996147885,40.605642932838,40.6056432663827,40.605617294643,40.6055328977409,40.6055278885743,40.605486492626,40.6053912242992,40.6053356602923,40.6053483627502,40.6053054780346,40.6052114500266,40.6051559640243,40.6051219199229,40.6051177551858,40.6050922029021,40.6050238130328,40.6049638282474,40.6048953917059,40.6048099255147,40.6047586107313,40.6046902511587,40.6046904448125,40.6046521053611,40.6045666844348,40.6044984640688,40.6044772305281,40.6045456905648,40.6046269537515,40.6047081789824,40.6047938072017,40.604776838802,40.6047000421196,40.6046402743693,40.6046233365998,40.604520816484,40.604439830556,40.6044357802952,40.6044359492339,40.6044745747771,40.6043678204014,40.604269642135,40.6042141932155,40.6042228690466,40.6043042004208,40.6044239891032,40.6043642897095,40.6042962589889,40.6041680165627,40.604155289481,40.6041812013318,40.6041044787151,40.6041261245768,40.6041647560624,40.6041563698428,40.6043227817333,40.6043598420681,40.6043725760166,40.6044013556621,40.6044044807703,40.6043883495754,40.6043465621102,40.6043367998405,40.6043366286036,40.604358889838,40.60437798109,40.6043971121389,40.6044546822059,40.6045218953218,40.6046147808779,40.6046820225872,40.6046914988441,40.604662478783,40.6046207031016,40.6046205193107,40.6046332287428,40.6046266810762,40.6046394250801,40.6046842051315,40.604729053579,40.6047995684092,40.6048572644402,40.6049021423404,40.604966282554,40.6050303997416,40.6050784186534,40.6050398985938,40.6049949808856,40.6049275782037,40.6048634725138,40.6048441582829,40.6048825458339,40.6049208872132,40.604939999578,40.6049430422139,40.6049012829294,40.6049043779195,40.6049299980045,40.6049941442102,40.6050454659895,40.6050583597494,40.6050841127138,40.6051322705308,40.6051867848543,40.6052317031802,40.6052670757301,40.6052864027027,40.6052833477057,40.6052706320687,40.6052611734989,40.6052452650837,40.6051779430897,40.6051234627299,40.6051076002445,40.6050692129642,40.6050275399128,40.6049985884659,40.6049697002172,40.6048959455708,40.6048190160202,40.604754870085,40.6047261134258,40.6047229725136,40.6047454798397,40.6047679813949,40.6047872792737,40.6047969562431,40.6048098726206,40.6048387722572,40.6048900712432,40.6049445848471,40.6050086962216,40.6050631649442,40.6051080480336,40.6051465793077,40.6051754903496,40.6051337891713,40.6050920874825,40.6050504270945,40.6050088166234,40.6049864590178,40.60501535284,40.6050730597653,40.6051403473021,40.6051628147787,40.6051885094752,40.6052078008995,40.6052239044767,40.6052592250369,40.6053041423935,40.6053554184303,40.6054067218862,40.6054227460141,40.6054356213143,40.6054164392586,40.6054293088164,40.6054709189478,40.6054932772453,40.6055252385548,40.605547660894,40.6055861061874,40.6056373753297,40.6056822359942,40.6057303117505,40.6057719270403,40.6058007125774,40.6058487775603,40.6058904899494,40.6059258047859,40.6059579090598,40.6060092303342,40.6060445165418,40.6060862123942,40.6061117812277,40.6061598226742,40.6061886935176,40.6062239568572,40.6062624421722,40.6062944835359,40.6063265649116,40.6063586405671,40.6063779204419,40.6063875970847,40.6064164678954,40.6063652044565,40.6063299297087,40.6063107414018,40.606281876808,40.6062370047154,40.6061760811118,40.6061408806041,40.606076729332,40.6060382668871,40.6060383411322,40.6059838842845,40.6059581833707,40.6059613425027,40.6059292382903,40.6058907758438,40.6058555525051,40.6058618935855,40.6058553981907,40.6058233339567,40.6057913040273,40.605756086422,40.6057241250696,40.6056889245831,40.6056536498234,40.605605608351,40.6056057168631,40.6055993928391,40.6055577712289,40.6055129459566,40.605445646965,40.6053942853335,40.6053621816699,40.6053365151873,40.6053268383963,40.6052979904267,40.605243550212,40.6052178613766,40.6051953424036,40.6051728464289,40.6051343158752,40.605105393047,40.6050572880146,40.6050252695336,40.6049932338891,40.6049515792204,40.6049130767217,40.6048746085428,40.6048329469809,40.6047816606709,40.6047496135859,40.6047015423719,40.6046503018327,40.6046182776275,40.6045542056661,40.6045286654398,40.604503108027,40.6045160639355,40.6045482366264,40.6045611636765,40.6046125076602,40.6046798408712,40.6047247243658,40.6047504245066,40.6048049839805,40.6048499415125,40.604888472272,40.6049462644324,40.6049591570251,40.6049912723576,40.6050361899176,40.6050777770579,40.6051226200261,40.60517390125,40.6052059597093,40.6052443766301,40.6052828447412,40.6053117268117,40.6053406259313,40.6053759517363,40.6054240456821,40.6054816676779,40.605523306499,40.6055713822208,40.6056195386902,40.6056708533268,40.6057349758988,40.6057669604832,40.6058342026409,40.6058886254808,40.6059431001537,40.6060103650243,40.6060552882673,40.6061002103213,40.6061098873078,40.6061451392146,40.6061675149912,40.6061481962586,40.6061192971362,40.6060679471522,40.6060070236761,40.6059332979641,40.6059076605332,40.6059075808461,40.6058722492236,40.6058145647105,40.6058176556033,40.6058175758129,40.6058463325461,40.6058911811524,40.6059649006936,40.6060097670766,40.6060642524659,40.6061059539395,40.606080350715,40.6060548386622,40.6061029428778,40.6061606330857,40.6061927143423,40.6062311824633,40.6062984871442,40.6063690308173,40.6064267608721,40.6064909233321,40.6065262378259,40.6065775474851,40.6066032588472,40.6065681035818,40.606526470946,40.6064848327893,40.6064303524345,40.6063982598912,40.6063629568306,40.6063309211195,40.6063406260232,40.6063695199119,40.606353558262,40.6063151538063,40.606263940216,40.6062415581838,40.6062127901832,40.6062225622543,40.606245114525,40.6062804343978,40.6063029637545,40.6062677344878,40.6062260729302,40.6061715762641,40.6061139200496,40.6060626609933,40.6060177788038,40.60596649145,40.6059247794494,40.6058894879106,40.605841360741,40.6058637372047,40.6058764880095,40.6058604020369,40.6058123541717,40.6057739144403,40.6057322703866,40.6057162582635,40.6057259570567,40.6057516574604,40.6057805620001,40.6057806469026,40.6057711347633,40.6057487016544,40.6057102449202,40.6056813574097,40.6056460206224,40.6056138942886,40.6056202421525,40.6056297874825,40.6056297081511,40.6056040367119,40.6055591589885,40.605527111905,40.6055303620755,40.6055336462324,40.6055369360213,40.605508201335,40.6054697728977,40.6054313161625,40.6053896557741,40.6053543642455,40.6053189934321,40.6053028333304,40.6052738493407,40.6052289380817,40.6051679920047,40.6051167166358,40.6050718620986,40.6050325341671,40.6050299275145,40.6050327135837,40.6050503368469,40.6050733732108,40.605096395227,40.605108610629,40.6051329919175,40.6051492827761,40.6051520560931,40.6051521276891,40.6051494856378,40.6051346900908,40.605114433737,40.6050887678388,40.6050671176151,40.6050360403293,40.6050198432309,40.6050104387786,40.6050266930761,40.605042952805,40.6050740604052,40.6050997668184,40.6051187377628,40.6051282596154,40.6051445281661,40.6051607990873,40.6051527281294,40.6051315394362,40.6051183402993,40.6050897463174,40.6050650313315,40.6050617308493,40.6050364732766,40.6050136045881,40.6049895242346,40.6049642786,40.6049503406304,40.6049356570975,40.6049212105851,40.6049168551891,40.6049036082278,40.6048805536933,40.6048545979966,40.6048310276438,40.6048002430291,40.6047790541076,40.6047559297002,40.6047429708447,40.6047463886359,40.6047784045097,40.6047799112365,40.6047864504177,40.6047843574174,40.604774919086,40.6047682457528,40.6047513699785,40.6047256229723,40.6047116832881,40.6047251950409,40.6047528939652,40.6047644723531,40.6047944368984,40.6048092591545,40.6048220194508,40.6048364829192,40.6048533540254,40.6048689924852,40.6048906858085,40.6049131029449,40.6049451651761,40.6049625282764,40.6049986731112,40.6050283390223,40.605057528918,40.6050825973236,40.6051047779443,40.605102434612,40.605102478795,40.6050977383869,40.6050917822265,40.6050855551301,40.6050884884759,40.6050979019378,40.6051094722164,40.6051191264939,40.6051249254961,40.6051319404558,40.6051312391553,40.6051276469653,40.6051233307943,40.6051153989163,40.6051060249522,40.6051024356986,40.6050962211212,40.6051053694078,40.6050983085202,40.6050983438856,40.6050953280814,40.6050852129821,40.6050811908585,40.6050802123195,40.6050772040688,40.605075220464,40.6050763811693,40.605082477588,40.6051038875145,40.6051257065973,40.6051462322421,40.6051582827945,40.6051675955587,40.6052048269051,40.6052373423482,40.6052625924022,40.6052895439155,40.6053023709967,40.6053143612978,40.6053293381494,40.6053686972357,40.6054080486316,40.6054392769099,40.6054615137672,40.6054756165975,40.6054764337663,40.6054888386032,40.6055175136755,40.605546601867,40.605599631106,40.6056727596977,40.6056804305047,40.6056927849218,40.6056974608209,40.6056956900337,40.605684958042,40.6056703698535,40.6056763279178,40.6056848521051,40.6056980915399,40.6057181941869,40.605760956153,40.6057704099552,40.6057704674067,40.6057786558937,40.6058034769384,40.6058227027999,40.6058350362071,40.6058486744861,40.6058661182734,40.6058823136068,40.6058942030969,40.605906524656,40.6059363885845,40.6059675884484,40.6060000707512,40.6060060010503,40.6060256191144,40.6060371320401,40.6060379308784,40.6060224920231,40.6060011074465,40.6059848904879,40.605971225748,40.6059490173769,40.6059293638995,40.6059174147021,40.6058955994266,40.6058814889364,40.6058746684925,40.6058622678889,40.6058516094321,40.6058323843904,40.6058118468143,40.6057981602807,40.6057908590182,40.6058062065602,40.6058305610226,40.6058506676472,40.6058827247223,40.6059015379339,40.60590492561,40.6058852046769,40.605858637502,40.6058307700732,40.6058367389985,40.6058594407263,40.6058761475492,40.6059009664668,40.6059202588064,40.6059373411543,40.6059497017936,40.6059817828152,40.6060018921942,40.606021557388,40.6060408265928,40.6060485613433,40.6060575701162,40.6060776612714,40.6060926067666,40.6061118152117,40.6061066270161,40.6060984655426,40.606104840418,40.6061146396459,40.6061295753621,40.6061568883272,40.6061816817483,40.6061940578235,40.6062017183427,40.6062115152741,40.6062264254202,40.6062469217068,40.6062653049315,40.6062901223682,40.6063020806432,40.6062999110061,40.606316991256,40.6063340767626,40.6063370495457,40.6063357247705,40.6063296834948,40.6063116926429,40.6062872869397,40.6062833967642,40.6062897938941,40.6062918948667,40.6062922967356,40.6063029934422,40.6063188674565,40.6063317258227,40.60633517827,40.6063544489721,40.6063732973172,40.60639042792,40.6063810354526,40.606368201911,40.6063618065252,40.6063554139751,40.6063674185883,40.606376855651,40.6063769014848,40.6063833740075,40.6063876970817,40.6064112457664,40.6064262234832,40.6064480253173,40.606467250181,40.6064920503445,40.6065151535547,40.6065403668994,40.606555762308,40.6065685793243,40.6065805380999,40.6065946538246,40.6066117385849,40.6066271369961,40.6066408155018,40.6066433650943,40.6066437702507,40.6066553186037,40.606660469385,40.6066724634726,40.6066729183028,40.6066904710822,40.6067071667034,40.6067187062891,40.6067315225509,40.6067486543911,40.6067623554352,40.606767514223,40.6067649921586,40.606770147432,40.6067663269023,40.6067744757465,40.6067864482958,40.6067945656131,40.6068056965203,40.6068155722648,40.6068173194278,40.6068083586324,40.6067895651984,40.6067677529306,40.606757492187,40.6067605295213,40.6067823561207,40.6067943681746,40.6067939804612,40.6067940276872,40.606786768589,40.6067624146752,40.6067521928909,40.6067466622335,40.6067573878144,40.6067561208545,40.6067732354053,40.606794190279,40.6068121423344,40.6068330902199,40.606847194711,40.6068527256942,40.6068668092012,40.6068830350431,40.6068924140791,40.6069069252728,40.6069175944825,40.6069329661495,40.6069607530762,40.6069787171134,40.6069915351518,40.6070064931147,40.6070158851211,40.607026131532,40.6070376636292,40.607050057464,40.6070654602995,40.6070774449367,40.6070924366558,40.6071023201253,40.6071121943393,40.6071263577283,40.6071328093958,40.6071486734922,40.6071670792231,40.6071863281993,40.607191835181,40.6072012118771,40.6072208683874,40.6072499614958,40.6072700543763,40.6072849893377,40.6072913796916,40.6072977906244,40.6073016569392,40.6072952767552,40.6072781914482,40.6072619630454,40.6072268867831,40.607209386431,40.6072094194105,40.6072235686148,40.6072158788144,40.6071859327228,40.6071671114474,40.6071358576911,40.6071080119661,40.6070908461861,40.6070873859148,40.6070723767046,40.6070539537098,40.6070360020035,40.6070291846177,40.6070095431878,40.6069830208716,40.6069535457213,40.6069172688944,40.6069194420371,40.6069314678676,40.6069276637487,40.6069097019545,40.6068921829181,40.606872549915,40.6068421618179,40.6068374313916,40.6068083374613,40.6067784130843,40.6067514435978,40.606721893506,40.6066949247612,40.6066667092824,40.6066350505518,40.6066081020328,40.6065948474515,40.6065991654039,40.606623150047,40.6066548459607,40.6066796678637,40.606705781439,40.6067036697091,40.6066869923425,40.606665599534,40.606639927715,40.6066352429513,40.6066468140067,40.6066827544885,40.6067152879012,40.606728999867,40.6067277381201,40.6067166274381,40.6066918092829,40.6066635564591,40.6066340348314,40.6066087952032,40.6065844571824,40.6065742300708,40.6065545274659,40.60654421518,40.6065604703292,40.6065677057652,40.6065672226187,40.6065680314539,40.606567544861,40.6065397029199,40.6065546316975,40.6065760027887,40.6065939472756,40.6066268902714,40.6066456817484,40.6066447973702,40.6066593263153,40.6066832540269,40.6066951996007,40.6067135618564,40.606725505753,40.6067233258343,40.6067241368151,40.6067236468425,40.6067171460939,40.6067179296725,40.6066969456075,40.6066507258344,40.6066272076098,40.6066311009771,40.6066264305518,40.6065990673464,40.6065610261255,40.6065028638376,40.6064622247945,40.6064451522639,40.6064096309591,40.6063839973961,40.6063151754136,40.6062625933192,40.6062232837092,40.606213097265,40.6062016648129,40.6061850443793,40.6061928532372,40.6061843912545,40.6061442316117,40.6060827129613,40.6060652728796,40.6060520989781,40.6060782155032,40.6060744122409,40.6060633485796,40.6060514401922,40.6060514969017,40.6060549751293,40.6060507552844,40.6060452837951,40.6060295234892,40.606030879932,40.6060377965566,40.6060314287607,40.60601691683,40.6059874043986,40.6059750042704,40.6059566266507,40.6059395389067,40.6059191670712,40.6059326941517,40.6059448953483,40.6059638680762,40.6059720053327,40.6059814952142,40.6059896447134,40.6060018499094,40.6060113521887,40.6060208596618,40.6060317274621,40.6060533802371,40.6060709873593,40.6060885862663,40.606099411142,40.6060980901824,40.6060994815093,40.6061089813909,40.6061252469122,40.6061522981132,40.6061752959547,40.6061699162517,40.60616860932,40.6061808097372,40.6061903177794,40.6062011807789,40.6062174490886,40.6062269505798,40.6062324122376,40.6062257114482,40.6062257488751,40.6062230908974,40.6062244921221,40.6062340005738,40.6062394416248,40.6062286530022,40.6062381520861,40.606250357579,40.6062679376953,40.6062841756993,40.6062963503217,40.6063031434717,40.606304537624,40.606305917091,40.606318113387,40.6063248918425,40.6063316728004,40.6063465545012,40.6063627801536,40.6063682206464,40.6063479432863,40.6063262929701,40.6063046753179,40.6062925326935,40.6062817795049,40.606268290078,40.6062683390348,40.6062778310404,40.6062859832394,40.6062954724045,40.6063103564213,40.6063333425267,40.6063360968525,40.6063104263029,40.6062861090317,40.6062834624891,40.6062740403538,40.6062415930437,40.6062213158454,40.6062051011646,40.6061956790162,40.6061781147047,40.6061618697715,40.6061442943265,40.606137518249,40.6061172380517,40.6061023848036,40.6060861894066,40.6060726999097,40.60606732647,40.606074114165,40.6060876501844,40.6061065777543,40.6061160580679,40.6061255500046,40.6061309857306,40.6061377740799,40.6061445687256,40.6061364846987,40.6061257173255,40.6061000369371,40.6060757219389,40.6060757544527,40.6060527892526,40.6060447237746,40.6060283533224,40.606050204057,40.6060799447975,40.606104273738,40.6061272157372,40.6061461108093,40.6061650179862,40.6061731624007,40.6062015632922,40.606231300562,40.6062596914979,40.6063056573997,40.6063245738644,40.6063435030849,40.6063678204125,40.6064043169644,40.6064273216369,40.6064314226187,40.606451720211,40.6064733565035,40.6065071309108,40.6065382644025,40.6065382945682,40.6065518421511,40.6065640283242,40.6065870005019,40.6066018282834,40.6066275063562,40.6066450690504,40.6066653271871,40.6066815070723,40.6066963422937,40.6067084750765,40.6067070695311,40.6066989065077,40.6067042608886,40.6067069324298,40.6067244753268,40.6067433824729,40.6067379357816,40.6067243916112,40.6067094948301,40.6066932685142,40.6066797552499,40.6066621867838,40.6066459767513,40.6066324523592,40.6066148647821,40.6065864429343,40.6065661464534,40.6065444659347,40.6065403706634,40.6065497992792,40.6065484145577,40.6065335240635,40.6065159113572,40.606515885734,40.6065415504636,40.6065536924501,40.6065536644886,40.6065536202054,40.6065451568335,40.6065400491801,40.6065359510022,40.6065359230154,40.6065291257423,40.6065277276277,40.6065249697048,40.6065181772406,40.6065316642983,40.606557314293,40.6065775711377,40.6065937383992,40.6066031393514,40.606620708958,40.6066450325024,40.6066693660661,40.6066936991266,40.6067166548538,40.6067369145157,40.6067693618238,40.6068126251244,40.6068315480168,40.6068423244319,40.6068422729856,40.6068530470431,40.6068611023005,40.6068651070211,40.6068758974345,40.6068866684434,40.6068838917659,40.6068635886499,40.6068419593435,40.606829816824,40.6068312111029,40.6068068705197,40.6068068283634,40.6068149104939,40.6068162174354,40.6068094271861,40.6067986021557,40.6067742809872,40.6067485924602,40.6067485643366,40.6067485291793,40.6067417246813,40.606729521895,40.606749795054,40.6067646364299,40.6067768105779,40.60678895524,40.6068051698453,40.606824097916,40.6068511420876,40.6068808933557,40.6069133681369,40.6069107091153,40.6069161825878,40.6069216260753,40.6069419273636,40.6069635749141,40.6069825076702,40.6069933465898,40.6070041955467,40.6070244897962,40.6070501818357,40.6070704591848,40.6070908223938,40.6070873798109,40.6070859808226,40.6070818923069,40.6070629267305,40.6070534158044,40.6070546999181,40.6070587138985,40.607042450692,40.6070181049033,40.6069883377075,40.6069653281148,40.6069423161708,40.6069436330789,40.6069598263729,40.606969264072,40.6069597300676,40.6069677575456,40.6069690408245,40.6069703529727,40.6069743527294,40.6069797087998,40.6070013498617,40.6070310653512,40.6070607719271,40.6070674846334,40.6070674351895,40.6070768539748,40.6070971011929,40.6071093324013,40.6071296455611,40.6071512772102,40.607170200069,40.6071891210752,40.6071971882398,40.6071782319071,40.6071741502897,40.6071930401597,40.6072119611608,40.6072335786701,40.6072592449816,40.60727680207,40.6072875805149,40.6073064685039,40.6073294216214,40.6073523954592,40.6073861770258,40.607394245973,40.6074104291828,40.6074333940788,40.607449589747,40.6074644267079,40.6074792979007,40.6074833075599,40.6074967871569,40.6075129939425,40.6075359918841,40.6075617035216,40.6075833540578,40.6075995950746,40.6076198717342,40.6076225476514,40.6076306217779,40.6076427657734,40.6076630100323,40.6076873015406,40.6077021585552,40.6077210754792,40.6077481055024,40.6077683873868,40.6077805911168,40.6077887403267,40.6077982350705,40.6078225827759,40.6078401180604,40.6078590130521,40.607872494983,40.6078832655641,40.607913009791,40.6079387072671,40.6080120480196,40.6080311304308,40.6080631897,40.6080646057316,40.6080389234482,40.6079811772521,40.6079682906288,40.6079906839483,40.608003430275,40.6079969588596,40.6079808067006,40.6079454592441,40.6079165382692,40.6079196587119,40.607941990011,40.6080028061438,40.6080027160232,40.6080346842113,40.6080923856213,40.6081340584416,40.6082076763817,40.6082300418218,40.6082748118003,40.6083035863336,40.6083162976993,40.6083226395745,40.6083225209167,40.6083192708716,40.6082807418145,40.6082357674615,40.608177958948,40.6081778570164,40.6081424974665,40.6081231211188,40.6080813586359,40.6080877046898,40.6081710783604,40.608209615013,40.6082289562005,40.6082323310275,40.6082805041597,40.608347909505,40.6083864341234,40.6084409823405,40.6084858480436,40.6085115879045,40.6084957276329,40.6084509577547,40.6083966248024,40.6083646848836,40.6083231529749,40.6083008386683,40.6082464659646,40.6082433844276,40.6082786874527,40.6083427248549,40.6084227524331,40.6084643459332,40.6084834446892,40.6085250104506,40.6085729796761,40.6086177840147,40.6086658314761,40.6087557096606,40.6088262585484,40.6089095304127,40.6089542494959,40.6090247420087,40.6090920579018,40.6091592722403,40.6092201615602,40.6092938358112,40.6093514073906,40.6093352714644,40.609418565128,40.609479500823,40.6094731759047,40.6094732662481,40.6095053692606,40.6095470696357,40.6096111637775,40.6096784571005,40.6097329092242,40.6097936969312,40.6097935896247,40.6097838513349,40.6097581460728,40.6097837099737,40.6098190523501,40.6098576442173,40.6098897703767,40.6099539492196,40.6100148328884,40.6100692341672,40.6100979582699,40.6101074709914,40.6101330683274,40.6101811840833,40.6102132989892,40.6102294073731,40.6102551130814,40.6103096781199,40.6103673851909,40.6104283253026,40.6104667820188,40.6104763513358,40.610466663467,40.6104697892182,40.6104729149409,40.6105242236845,40.6105883517181,40.6106268931585,40.6106366318298,40.6107007593208,40.6107680469928,40.6107871849579,40.6107870776645,40.6107965842848,40.6108895381157,40.6110242598109,40.6111012579362,40.6112085786799,40.6112679875735,40.6113673274474,40.6114410139786,40.611439484934,40.6114377183309,40.6114024099721,40.6113286058395,40.6112932239504,40.611254586233,40.611187151423,40.6111294046425,40.61102032567,40.6109561011471,40.6109559763481,40.6110296276974,40.6111322125933,40.6112830206392,40.6114017934515,40.6114916500824,40.611603803569,40.6117224283005,40.611837775791,40.611930666362,40.6120395763842,40.6121645309887,40.6122701676637,40.6123342447847,40.6124369485904,40.6125267084445,40.6126293663397,40.6126838634733,40.6127641169929,40.6127738325752,40.6128092765753,40.6128376126305,40.6128766940913,40.6129343623006,40.6129441414168,40.6129726439347,40.6130110321604,40.6130653428575,40.6130716336858,40.6130975142347,40.6131177782985,40.6131350286966,40.6131289857451,40.6131219539651,40.6131199589184,40.6131301338797,40.6131554961698,40.6131899504202,40.6132071506976,40.6132182489279,40.6132293471442,40.6132475653628,40.6132698531057,40.6133012923836,40.6133114555077,40.6133054161399,40.6132922924451,40.613300427117,40.6133358975346,40.613367310572,40.6133814690163,40.6133824459636,40.6133996742008,40.6134138988974,40.613413929337,40.6134231072107,40.6134434028311,40.6134626650461,40.6134808958119,40.6135072290253,40.6135315554538,40.6135467653798,40.6135569213312,40.6135589658812,40.6135731762438,40.6135914387288,40.6135995698192,40.6136097387953,40.6136077372004,40.6136006803276,40.6136169709897,40.6136170210581,40.6136221478496,40.6136424793574,40.613653705207,40.6136668461184,40.6136921958832,40.6137176024725,40.6137306319145,40.6137386926416,40.6137406703387,40.6137629491658,40.613781893996,40.6137801315681,40.6137882094757,40.6138127908867,40.6138164900798,40.6138022385286,40.6137991447674,40.6137970417502,40.6137969933609,40.6138071014363,40.6138080825462,40.6138192062871,40.6138445488786,40.6138647998618,40.6138789402966,40.6139001751473,40.6139163661495,40.6139325524308,40.6139629304883,40.6139781260491,40.6139608637192,40.6139780649885,40.6140064547745,40.6140247065171,40.6140382286712,40.6140158911004,40.6139976137004,40.6139783413899,40.6139722338906,40.6139691718016]}],[{"lng":[-73.8337015227225,-73.8338077661466,-73.8339526640577,-73.8340188813449,-73.8340549238553,-73.8340650454801,-73.8341058115228,-73.8341784916675,-73.8343416812231,-73.8344594662892,-73.8346032336605,-73.8347239132572,-73.8348424786392,-73.834901835637,-73.8349619025123,-73.8350122087838,-73.835041773853,-73.8350662022084,-73.8351209854228,-73.8351713481256,-73.8352062395714,-73.8352550105003,-73.8353228174421,-73.8353889195752,-73.8354228868332,-73.8354544927341,-73.835469559392,-73.8354787638207,-73.8354581461233,-73.835439879285,-73.835428798389,-73.8354247935325,-73.8354277774211,-73.8354660015076,-73.8355164942013,-73.8355889456075,-73.8356577857653,-73.8357479272823,-73.8357932219405,-73.8358557262376,-73.8359045024457,-73.8359859131346,-73.8360464298303,-73.836101642926,-73.8361513804287,-73.8362017028098,-73.8362217349483,-73.8362210400551,-73.8362114540538,-73.8361537005866,-73.8361428910179,-73.8361481696719,-73.8361902526526,-73.8362319289268,-73.8362551680592,-73.8362729621881,-73.836296643472,-73.8363197142523,-73.8363440349503,-73.8363429894532,-73.8363016504599,-73.8362555309458,-73.836256190453,-73.8362586810274,-73.8362844365984,-73.8363225946108,-73.8363821447317,-73.8364208085591,-73.8364707116641,-73.8365081016467,-73.836548424924,-73.836585093377,-73.83660620421,-73.8366029365979,-73.8365920203188,-73.8366066329066,-73.8366362635533,-73.8366737023648,-73.8367397195243,-73.8367910638889,-73.8368484115524,-73.8368634180439,-73.8368896711259,-73.8369199842638,-73.836978729401,-73.8370292180859,-73.8370708085917,-73.8371224799957,-73.837177169173,-73.8372153034175,-73.8372456728408,-73.8372664239446,-73.8372628363242,-73.8372781397399,-73.8372972061423,-73.8373329658717,-73.8373677899974,-73.8373892307087,-73.837422505036,-73.8374676028083,-73.8375080870981,-73.8375307723101,-73.837573779575,-73.8376112429984,-73.8377057274092,-73.8377413708324,-73.8377670214337,-73.8377855655564,-73.8377916748415,-73.8377878317712,-73.837755562017,-73.8377251129955,-73.837711540363,-73.8376795970798,-73.8376222064016,-73.837495949028,-73.8374229981589,-73.8372996732636,-73.8372499300114,-73.8372186510887,-73.8371732756671,-73.8370492699034,-73.8370134265097,-73.836955260843,-73.8369098915,-73.8368820624732,-73.8368202713212,-73.8367477066058,-73.8366104464637,-73.8365605989013,-73.836530385384,-73.8364653987026,-73.8364402972008,-73.8363382174353,-73.8362102842952,-73.8361498330898,-73.8359416252941,-73.8357451095983,-73.8355888870073,-73.8355431630785,-73.8354318767107,-73.8352737830109,-73.8352001877936,-73.8351567994511,-73.8351060716074,-73.835067600605,-73.8350307973849,-73.8349818113316,-73.8349622264558,-73.8349541688198,-73.834942837811,-73.8349503574373,-73.834960316077,-73.8349660070491,-73.8349669990919,-73.8349785438372,-73.8350130729502,-73.835050905278,-73.8350822278179,-73.8351110576517,-73.8351473448358,-73.8351647277844,-73.8351689232542,-73.8351591311129,-73.8351484802342,-73.8351287554167,-73.8351089917363,-73.8350842823252,-73.8350538664354,-73.8350317253916,-73.8350186575449,-73.8350039738718,-73.835004125879,-73.8349894757005,-73.8349682566811,-73.8349734195504,-73.8349613891382,-73.8349607978382,-73.8349758522933,-73.8350336707774,-73.8350881781379,-73.8351220063945,-73.8351500488315,-73.8351673058481,-73.8352056672886,-73.8352129061446,-73.8352580236195,-73.8353150144401,-73.8353434918206,-73.8353565078121,-73.8353618279897,-73.8353404200956,-73.8353302749994,-73.8353355951704,-73.8353562961643,-73.8353888561235,-73.8354143575975,-73.8354351031843,-73.8354611268022,-73.8354918361831,-73.8355035026626,-73.8354938344984,-73.8354948847951,-73.8354948178916,-73.8355031030524,-73.8355207781153,-73.8355497645033,-73.8355721829268,-73.8356087250804,-73.8356595804958,-73.8357144689941,-73.8357287001622,-73.8357451368968,-73.8357470655858,-73.8357258314019,-73.8357145401232,-73.8357073321676,-73.8356673493014,-73.835649230649,-73.835638702927,-73.8356062648575,-73.8355628264294,-73.8355469640055,-73.8355369686483,-73.8355332703174,-73.8355123629349,-73.8354939159681,-73.8353830853108,-73.835316998665,-73.8352673933079,-73.8352293791051,-73.8352087585221,-73.8351961685202,-73.8351464581919,-73.8351176637602,-73.835082431984,-73.8350496237331,-73.8350126805641,-73.8349920065261,-73.834958150637,-73.8349562086194,-73.8349558553738,-73.8349555051878,-73.8349551170195,-73.8349547307974,-73.8349543433933,-73.8349539207935,-73.8349534982628,-73.834953112246,-73.834952725887,-73.8349526740325,-73.8349530577307,-73.8349534274694,-73.8349537597853,-73.8349538231921,-73.8349546689988,-73.8349559415769,-73.8349560500377,-73.8349572147898,-73.8349575746703,-73.8349577912142,-73.8349600367523,-73.8349602894884,-73.8349624981702,-73.8349628472383,-73.8349651381767,-73.8349678131547,-73.834970488724,-73.8349707236585,-73.8349708147561,-73.8349744631493,-73.8349748596191,-73.8349785064757,-73.8349788677645,-73.8349825889968,-73.8349829126306,-73.8349866323872,-73.8349869574908,-73.8349873200319,-73.8349876436657,-73.8349909538887,-73.8349913280428,-73.8349916883216,-73.8349957312985,-73.8349960576545,-73.8350001006294,-73.8350003893888,-73.8350044706901,-73.8350047573987,-73.8350088740133,-73.8350098863333,-73.8350101381706,-73.8350142166818,-73.8350146512523,-73.8350187296925,-73.8350303567066,-73.8350329547013,-73.835035627714,-73.8350388417637,-73.8350420905486,-73.8350454113645,-73.8350460063108,-73.8350486620065,-73.8350518758538,-73.8350527483464,-73.8350556643468,-73.8350599580498,-73.8350628545979,-73.8350646847321,-73.8350699521088,-73.8350761228927,-73.8350765558735,-73.8350822214234,-73.8350881028404,-73.8350938384386,-73.8350998647206,-73.8351057108908,-73.8351077682307,-73.8351108711779,-73.83511563654,-73.8351178795717,-73.835119860312,-73.8351233990678,-73.8351257453127,-73.8351265079199,-73.8351288220163,-73.835131175028,-73.8351334896464,-73.8351358058727,-73.8351392553218,-73.8351442393881,-73.8351448904941,-73.8351455113529,-73.8351464219773,-73.8351471583276,-73.8351473326706,-73.835148243368,-73.8351491540611,-73.8351494257211,-73.8351490917753,-73.835148632656,-73.8351483285457,-73.8351479582799,-73.8351468885224,-73.8351461071233,-73.8351457096841,-73.835144993865,-73.8351437763399,-73.8351427632169,-73.8351406900305,-73.8351382940466,-73.83513659621,-73.8351345117639,-73.8351327038441,-73.8351310980016,-73.8351259921634,-73.8351249877988,-73.8351203971722,-73.8351172543379,-73.835113679823,-73.835111438535,-73.8351084370432,-73.8351080784115,-73.8351047176257,-73.835102476429,-73.8350991135346,-73.8350957504204,-73.8350901355716,-73.8350823496953,-73.8350822889517,-73.8350765455416,-73.8350720393943,-73.8350688268189,-73.8350685426179,-73.8350663066242,-73.8350643232076,-73.8350625928299,-73.8350610788407,-73.8350564819439,-73.8350549463464,-73.8350538626773,-73.835052853897,-73.8350519518141,-73.8350510859881,-73.8350502914641,-73.8350474995207,-73.8350340190451,-73.8350181244029,-73.8350174383655,-73.8350167875065,-73.8350161730606,-73.8350150188325,-73.835014440574,-73.8350138994767,-73.8350133580035,-73.8350128517082,-73.8350117692039,-73.8350112281037,-73.8350081733543,-73.8350079768696,-73.8350046200055,-73.8349973994533,-73.834996938946,-73.8349935377353,-73.834989677692,-73.8349858161755,-73.8349820281611,-73.8349782393332,-73.8349739816187,-73.8349722351654,-73.8349695797157,-73.8349649997164,-73.8349603458414,-73.8349556555557,-73.8349509300929,-73.834946169317,-73.8349417322705,-73.8349396811897,-73.8349374365567,-73.8349366472464,-73.8349340715475,-73.8349318282334,-73.8349295479193,-73.8349284659933,-73.8349165094118,-73.8349049269299,-73.8349030728471,-73.8349015619161,-73.8349014869659,-73.834901415513,-73.8349013069047,-73.8349010547312,-73.8348981996759,-73.8348969468732,-73.8348948346632,-73.8348937136233,-73.8348925904721,-73.8348919737453,-73.8348914696521,-73.8348892261189,-73.8348892240046,-73.8348881010744,-73.8348878242643,-73.8348868480473,-73.834886595127,-73.8348865595945,-73.8348865221499,-73.8348864874956,-73.8348829467631,-73.8348824800686,-73.8348799830297,-73.8348799829617,-73.8348779770239,-73.8348772335999,-73.8348771974066,-73.8348748086946,-73.8348747713192,-73.8348734734939,-73.8348733607847,-73.834873177487,-73.8348715428282,-73.8348715426231,-73.8348712096223,-73.8348705209105,-73.8348678015525,-73.8348680589444,-73.8348680582626,-73.8348683345925,-73.834868368295,-73.8348686092908,-73.834868643738,-73.8348688705579,-73.8348689196081,-73.8348689552389,-73.8348694830631,-73.8348695532258,-73.8348699675616,-73.8348702612646,-73.8348717975153,-73.834873083494,-73.8348733338331,-73.8348745832996,-73.8348748346877,-73.8348760852348,-73.8348763695508,-73.8348766377702,-73.8348769009059,-73.8348770072858,-73.8348773571777,-73.8348774618856,-73.8348775679978,-73.834877672959,-73.8348777276899,-73.8348777413551,-73.8348777298149,-73.8348777264199,-73.8348777065593,-73.8348773560909,-73.8348771371727,-73.83487656804,-73.834876405793,-73.834874311164,-73.83487206296,-73.8348698154167,-73.8348630748097,-73.8348540914558,-73.8348532598478,-73.8348516000331,-73.8348498695797,-73.8348476693381,-73.8348454332642,-73.8348432325852,-73.8348413931647,-73.8348395898668,-73.8348377865713,-73.8348360554538,-73.8348320873145,-73.8348296716328,-73.8348271829766,-73.8348245869599,-73.8348218459241,-73.834820420544,-73.8348192127855,-73.8348167235162,-73.8348080715868,-73.8348049974978,-73.8348016051196,-73.8348002105884,-73.8347985363993,-73.8347934678554,-73.8347820215867,-73.8347799660519,-73.8347787296537,-73.8347756192995,-73.8347754643891,-73.8347742749141,-73.8347732007194,-73.8347731095789,-73.8347720600692,-73.8347720346959,-73.8347752830577,-73.8347753438709,-73.834776712699,-73.8347817184696,-73.8347827551249,-73.8347838644834,-73.8347842455876,-73.8347896345754,-73.8347898237672,-73.8347912485592,-73.8347929706605,-73.8347947643135,-73.8347965214561,-73.8347967010424,-73.8347994309424,-73.834802233262,-73.8348050342786,-73.8348054631281,-73.8348081235095,-73.8348114313081,-73.834814843199,-73.8348155271719,-73.8348189414525,-73.8348231839132,-73.8348274623599,-73.8348278341032,-73.8348319938026,-73.8348365260383,-73.8348409850448,-73.8348412646402,-73.8348453732592,-73.834849688398,-73.8348539328114,-73.8348546953976,-73.8348581422215,-73.8348622064133,-73.8348660574796,-73.8348692512109,-73.8348791189421,-73.8348844811744,-73.8348897331126,-73.8348902009296,-73.8348907053958,-73.8348958868924,-73.8349006027424,-73.8349058543033,-73.8349107125517,-73.8349155344521,-73.8349203559822,-73.8349241199415,-73.8349251798324,-73.8349300747496,-73.8349449784079,-73.8349465256441,-73.8349503789478,-73.834951385703,-73.8349568233634,-73.8349666933991,-73.83497299098,-73.8349788981573,-73.8349847319693,-73.8349903869734,-73.8349959325553,-73.8350364867561,-73.8350619411889,-73.8351114097911,-73.8351494542104,-73.8351892113872,-73.8352126728637,-73.8352471340972,-73.8352833721995,-73.8352988919841,-73.8353120185351,-73.8353050459971,-73.8352570359082,-73.835228061921,-73.8351794740809,-73.8351110938128,-73.8350599286959,-73.8350194544917,-73.8349766806337,-73.8349429124769,-73.8349347485128,-73.8349043679197,-73.8348827460917,-73.8348444306079,-73.834824453102,-73.8347827736635,-73.8347310977346,-73.8346794067441,-73.8346527279906,-73.8346127141456,-73.8345777052103,-73.834559364116,-73.8345460578162,-73.8345694355255,-73.83462614303,-73.8346778434283,-73.834689574062,-73.8347163193084,-73.8347297458532,-73.8347264638929,-73.8347232100316,-73.8346999821335,-73.8346633668199,-73.8346300636243,-73.8345834541984,-73.8345634743623,-73.8345235205711,-73.8344769049511,-73.8344452760072,-73.8344119830706,-73.8343786768854,-73.8343654236579,-73.8343755092232,-73.8343905863805,-73.8343589361294,-73.8343055565618,-73.834270529007,-73.8342455365804,-73.8342005543395,-73.8341605620879,-73.8341322410162,-73.8341172483734,-73.834075609784,-73.83404064383,-73.8339940223268,-73.8339640748134,-73.8339224837632,-73.8338941700059,-73.8338557951345,-73.8338007558092,-73.8337790198303,-73.8337772801058,-73.8337755546647,-73.8338305305606,-73.8338855148847,-73.8339221739153,-73.8339854906472,-73.8340204865856,-73.8340704618825,-73.8341121059441,-73.8341037142295,-73.8340986453067,-73.8340952395092,-73.8340884901161,-73.8340734064944,-73.8340716375813,-73.834095008943,-73.8341200803642,-73.8341251508249,-73.8341252329306,-73.8341353044454,-73.8341703636061,-73.8341953844502,-73.8342303883988,-73.8342436383952,-73.8342485501454,-73.8342851944559,-73.8343268436663,-73.8343484358198,-73.8343900787738,-73.8344300901345,-73.8344583654138,-73.8344733045855,-73.8344532295521,-73.8344397817051,-73.8343896657507,-73.8343646542486,-73.8343112741536,-73.834257874678,-73.8342328284572,-73.8342144085002,-73.8341993138516,-73.8341992160009,-73.8342057545651,-73.8342390160906,-73.8342756415141,-73.834322241588,-73.8343154512397,-73.8343019834162,-73.8342802175788,-73.8342401156836,-73.8341933484597,-73.8341032502094,-73.8340264935901,-73.8339647695521,-73.8338846272314,-73.833819522399,-73.8337627138631,-73.8337359329923,-73.8337015227225],"lat":[40.6209786013443,40.6187701020658,40.6157578334979,40.6143811664197,40.6143618879342,40.6143564744324,40.6143594422504,40.6143619905331,40.6143654371974,40.6143924504214,40.6144139015845,40.6144505266687,40.6144679338275,40.6144681574751,40.6144729087501,40.6144923329335,40.6145093936503,40.6145202152383,40.6145356921087,40.6145466343004,40.6145359790443,40.6145497449672,40.6145706757232,40.6145965983779,40.6146104544359,40.6146324580686,40.6146572640704,40.6146933993851,40.6147138454587,40.614730672913,40.6147547015079,40.6147723722809,40.6147745998328,40.6148734667822,40.6149487464122,40.6150289164449,40.6150986783764,40.6151629251547,40.6151843987559,40.615208999053,40.6152205139515,40.6152318849171,40.615229775946,40.6152313083341,40.6152184248794,40.6152023566694,40.6151850650413,40.6151746611596,40.6151620494748,40.6151392671333,40.6151261876325,40.6151180150423,40.6151123927661,40.615125765023,40.6151378746374,40.6151377907546,40.6151308795603,40.6151226237403,40.6151193371028,40.6151347333883,40.6151597899967,40.6151808323152,40.6151912349736,40.6152034259337,40.6152322550199,40.6152555858629,40.6152801816666,40.6152890205831,40.6152964750999,40.6152958420858,40.6152884055151,40.6152728672172,40.615242458014,40.6152085545113,40.6151796643356,40.6151547068426,40.6151455269784,40.6151539238023,40.6151708152314,40.6152081075967,40.6152498824936,40.6152701609165,40.6152867773611,40.6152925009496,40.6152931337722,40.615297404985,40.6153017183459,40.6153087090198,40.6153179535268,40.6153367545528,40.6153492588781,40.6153468997937,40.6153410487844,40.6153287738078,40.6153381599809,40.615356079754,40.6154029552737,40.6154132506208,40.615416701209,40.6154155847403,40.6154307658384,40.6154483097273,40.615477932534,40.6154908865501,40.6155026299267,40.6155092391791,40.6155222314188,40.6155393313238,40.6155596503429,40.6155999117266,40.6156430418002,40.6156924869337,40.6157043253189,40.6157171258501,40.615737301416,40.6157564749607,40.6157617784767,40.6157741477358,40.615789310913,40.6158102643932,40.6158507401747,40.6159946938111,40.6160410031714,40.6161127514913,40.6161509496178,40.61615969402,40.61615230406,40.6161318351783,40.6161130584976,40.6161123836919,40.6161214100884,40.616156714052,40.6161704023274,40.6162437078503,40.6163433802153,40.6163922898092,40.6165452624197,40.6167178485843,40.6168807210776,40.6169318527468,40.6170563006552,40.6172472219554,40.6173520500243,40.6174186320784,40.6174965116373,40.6175555518475,40.6176246136856,40.617740730025,40.6177803088119,40.6178336286353,40.6178857092358,40.6179183007631,40.6179408492371,40.6179590170627,40.6179621864628,40.6179696683019,40.6179608247481,40.6179563507277,40.6179619395423,40.6179712863045,40.6179944226899,40.6180150598984,40.6180370242923,40.6180646229048,40.6180746816604,40.6180828877639,40.6180785225901,40.6180785963733,40.6180842899368,40.618108796659,40.6181351828409,40.618173451721,40.6182142395856,40.6182682081686,40.6183134125824,40.6183811335909,40.6184689503312,40.6185329306967,40.6185918557153,40.6186481783947,40.6187032634478,40.6187301561674,40.6187376341746,40.618736341974,40.6187074042166,40.6187079438181,40.6187002956113,40.6186971938818,40.6187035751492,40.6187130901799,40.6187320912455,40.6187510552021,40.6187754687606,40.6187944715027,40.6188283988267,40.6188578427943,40.6188732496018,40.6188891156615,40.6189262076718,40.6190058524099,40.6191098958029,40.619203508123,40.6192740497668,40.619301196255,40.619315673244,40.6193789935434,40.6194274246221,40.6194457106613,40.6194731011598,40.6195049591694,40.6195372610087,40.6195505117888,40.6195755678085,40.6196115263298,40.6196626595426,40.619698984489,40.619729166952,40.6197587530719,40.6197879872992,40.6198058956831,40.619828493873,40.6198567305938,40.6198912649671,40.6199126875233,40.6199376318378,40.6199581061453,40.6199597535322,40.6199420001359,40.6199372404674,40.6199531721088,40.6199581949332,40.619950178091,40.6199431047223,40.6198997765966,40.6198906225556,40.6198915046523,40.6198886310303,40.6198826761329,40.6198672207155,40.6198392877338,40.619820892596,40.6198174880651,40.6198140021195,40.6198104058851,40.6198066449725,40.619802828606,40.6197989309373,40.6197950052915,40.6197911614522,40.6197874559914,40.6197871764784,40.6197837778639,40.6197801564156,40.6197766429699,40.619776073797,40.6197731315251,40.6197685763931,40.6197681917344,40.6197641201041,40.6197634185064,40.6197629797235,40.6197585631946,40.6197580695141,40.6197537095571,40.6197530238591,40.6197495406999,40.6197454548197,40.6197413964151,40.619741077777,40.6197409576218,40.6197370927695,40.6197367090269,40.6197328429996,40.6197324608817,40.619728568659,40.6197282106113,40.6197242925868,40.6197239625185,40.6197236073747,40.6197232493269,40.6197197522176,40.6197194130057,40.619719083658,40.6197153301081,40.6197150270139,40.619711274134,40.6197109714883,40.6197071895132,40.6197069160146,40.6197030786379,40.6197021474563,40.6197019281871,40.6196981182302,40.6196977077375,40.6196939262604,40.6196831004629,40.6196807157287,40.6196782228783,40.6196752076109,40.6196721930633,40.6196691224967,40.6196685820639,40.6196658899963,40.6196626003155,40.6196617572207,40.6196597785303,40.619656875213,40.6196549388793,40.619653671132,40.6196500830121,40.6196458637657,40.6196455624995,40.6196417010402,40.6196376740365,40.6196337577276,40.619629649177,40.6196256495966,40.6196242538471,40.6196216227301,40.6196176215989,40.6196157265439,40.619613565914,40.6196097551791,40.619607196019,40.6196058900507,40.6196017486996,40.6195976069017,40.6195935210034,40.6195894071299,40.6195832994425,40.6195727303103,40.6195713489614,40.6195685057102,40.6195644177982,40.619561102113,40.6195603019089,40.6195561843444,40.6195520684551,40.6195508550963,40.6195480895496,40.6195441083997,40.6195414581558,40.6195400456896,40.6195359269603,40.6195329136664,40.6195316433934,40.6195294948113,40.6195271665887,40.6195252201229,40.6195224405224,40.6195192361077,40.619517412799,40.6195151865309,40.6195132483068,40.6195118318906,40.6195072593998,40.6195066628959,40.6195038341165,40.619502233224,40.6195004077258,40.6194995514528,40.6194987616036,40.6194986918997,40.6194978335182,40.6194978303034,40.6194978254796,40.6194978206553,40.6194995862314,40.6195020459488,40.6195020716611,40.6195039040637,40.6195053249469,40.6195063238371,40.6195064726978,40.6195075668054,40.6195084977669,40.619509345662,40.6195100839683,40.6195122847362,40.6195133151822,40.6195140278039,40.6195146845783,40.619515314031,40.6195158622841,40.6195163826622,40.6195182511288,40.6195301898448,40.619545924822,40.619546583232,40.6195472410224,40.6195478434128,40.6195489945241,40.6195495438597,40.6195500909033,40.6195506121469,40.6195511329383,40.6195521744209,40.6195527226372,40.619555778172,40.6195559293363,40.6195589981748,40.6195656033679,40.6195660116454,40.6195683426217,40.6195710269284,40.6195736844281,40.6195763133857,40.6195789155374,40.6195818468806,40.6195830597972,40.6195845853582,40.6195872401506,40.6195898965119,40.6195926071002,40.6195953176378,40.619598083074,40.6196006293442,40.6196018044639,40.6196026559744,40.6196028453217,40.6196035042009,40.6196043557132,40.6196043442299,40.6196043508853,40.6196038874183,40.6196034623488,40.6196039230716,40.6196043122496,40.6196043039331,40.6196043038304,40.6196043036745,40.6196043033123,40.6196043074208,40.6196046004728,40.6196051568189,40.6196051552088,40.6196060071564,40.6196060200081,40.6196060055467,40.6196068565552,40.6196077112857,40.619608562731,40.6196089230236,40.619610101864,40.6196104033882,40.6196104582867,40.6196104862103,40.6196105416126,40.619614790426,40.6196153886722,40.6196191772744,40.619619204749,40.6196222162189,40.6196236753347,40.6196237307349,40.6196282551128,40.6196282550591,40.6196307503837,40.6196311636836,40.6196318496195,40.6196379944168,40.6196380773434,40.6196392889382,40.6196430714261,40.6196580749444,40.6196627200585,40.6196629956429,40.6196680728417,40.6196684022523,40.6196734541035,40.6196738379622,40.6196785768486,40.6196788344113,40.6196792730537,40.6196842698647,40.6196847914836,40.6196888280224,40.6196898155257,40.6196949225117,40.6196992605146,40.6197000025255,40.6197042582192,40.6197051094606,40.6197092839042,40.6197102444219,40.6197110462664,40.6197141697218,40.6197151596366,40.6197190292237,40.6197200729129,40.619721171051,40.6197223789191,40.6197230063942,40.619723614712,40.6197282797107,40.6197296521042,40.6197315481701,40.6197340438503,40.6197354422363,40.6197392336075,40.6197395863583,40.6197452096469,40.6197477689426,40.6197503277367,40.6197562973351,40.6197622642139,40.6197626649215,40.6197635134174,40.6197643881137,40.6197655114185,40.6197666329964,40.6197677552953,40.6197686857897,40.6197695895313,40.6197704922678,40.6197713686383,40.6197733940599,40.6197745983063,40.6197758842021,40.6197771985911,40.619778567051,40.6197792989479,40.6197800453975,40.6197815789001,40.6197869687787,40.6197893023974,40.6197918771356,40.6197929362609,40.6197946175224,40.6197997605856,40.6198164154588,40.6198193861461,40.619821488032,40.6198268359489,40.6198270667488,40.6198315286846,40.6198356047989,40.6198362749519,40.6198441454682,40.6198543956997,40.6198753639547,40.6198757543849,40.619879839539,40.6198946417307,40.6198978266085,40.6199010395681,40.6199022456552,40.6199129603522,40.6199133580032,40.6199157074685,40.6199185644716,40.619921559454,40.619924471457,40.619924663871,40.6199277974051,40.6199309848201,40.6199342546574,40.6199347355796,40.6199374429871,40.619940796982,40.6199442883326,40.6199449996388,40.6199476143131,40.6199508592489,40.6199541328838,40.6199544133591,40.6199570751744,40.6199599636892,40.6199627703443,40.6199629732887,40.619965576395,40.619968327391,40.6199710508104,40.6199715343897,40.6199731709071,40.6199750701593,40.6199769146582,40.6199783888111,40.6199826969234,40.6199850388082,40.6199873508818,40.6199875442121,40.6199877645673,40.6199900232652,40.619992100195,40.6199942097246,40.6199961369201,40.6199980932131,40.6200000215282,40.6200015293341,40.6200018119698,40.6200031364474,40.6200071390083,40.6200075419593,40.6200082166029,40.6200083822269,40.6200092963662,40.6200109869996,40.6200114324535,40.6200118527198,40.6200122459084,40.6200126651421,40.6200130574137,40.6200302980697,40.6200350842111,40.6200596936653,40.6200862612142,40.620119669241,40.6201298854601,40.6201344638349,40.6201342406812,40.620136981412,40.6201453713114,40.6201536499917,40.6201801228341,40.6201996533975,40.6202269767623,40.6202605837127,40.6202959187595,40.6203336833885,40.6203845654127,40.6204341429028,40.6204696900673,40.6204693785619,40.6204464750969,40.6204298996789,40.6204158933545,40.6204107501258,40.6204017810569,40.6203991649811,40.620397855736,40.6203939857169,40.6203888525129,40.6203875552434,40.6203735579685,40.6203608843633,40.6203584242025,40.6203572283588,40.6203343716437,40.6203089961046,40.6202747054502,40.6202530975203,40.6202200537599,40.620171732782,40.6201424530009,40.6201220732649,40.6200876962481,40.6200749595773,40.6200469458225,40.6200151098345,40.6199921913739,40.6199679991293,40.6199488901913,40.6199132902613,40.6198815370869,40.619853601887,40.6198395781615,40.6198458549439,40.6198483460357,40.6198394147099,40.6198215597597,40.6198087941533,40.619797317422,40.6197909415774,40.6197692787756,40.6197476257594,40.6197183318197,40.6196903328205,40.6196496085699,40.619635589536,40.6196431584976,40.6196456206896,40.6196684621792,40.6196976867914,40.6197205572127,40.6197435107815,40.6197626512061,40.6197741400444,40.61979583421,40.6198060509121,40.6198277262698,40.6198468473296,40.6198684372598,40.6198951154876,40.6199230668236,40.6199548259611,40.6199853015232,40.620025962638,40.6200158302011,40.6199929934655,40.6199663152392,40.6199332757713,40.6199066047604,40.6198914063381,40.6198889013472,40.6198953055369,40.6199321761862,40.6199690349793,40.6199868778913,40.6200034577988,40.6200390697495,40.6200581907063,40.6200633305028,40.6200938692249,40.6201218476569,40.6201472327457,40.6201904193002,40.6202246570721,40.6202233496592,40.6202296269464,40.6202435280948,40.6202561987283,40.6202866701671,40.6203209583559,40.6203603510055,40.6204137313511,40.620450631528,40.6204760983283,40.6205142885844,40.6205625663773,40.6206133761289,40.6206476547114,40.6206793657712,40.6207085249498,40.620726185549,40.620743865508,40.6207514002906,40.6207894069298,40.6208159983761,40.6208591209881,40.62089847555,40.6209786013443]}],[{"lng":[-73.8966648819572,-73.8966188263533,-73.8965730408542,-73.8965146421595,-73.8964747541237,-73.8964592116951,-73.8964531363604,-73.896441233469,-73.8963814651949,-73.8963667405294,-73.8963000604762,-73.8963005460908,-73.8963068767292,-73.8963132963581,-73.8963175349058,-73.8963137362031,-73.8963058886522,-73.8963010474466,-73.8962884780292,-73.896279049668,-73.8962765204942,-73.8962717592219,-73.8962669507595,-73.8962509782225,-73.8962347835979,-73.8962224331227,-73.896213835188,-73.8962046284574,-73.896125515165,-73.896100544694,-73.8960837028472,-73.8960784220068,-73.8960752320393,-73.8960804303584,-73.896080700543,-73.8960718421055,-73.8960530311997,-73.8960315992047,-73.8960208212096,-73.8960027485294,-73.8959917510126,-73.8959697150187,-73.8959422203543,-73.8959064724862,-73.8958764463915,-73.8958530526829,-73.8958158246942,-73.8957293299553,-73.8957180308928,-73.8957172889291,-73.8957261109569,-73.8957424364745,-73.8957467992111,-73.8957366762562,-73.895746326476,-73.89576993938,-73.8957796278231,-73.895777403447,-73.8957628710835,-73.8957404381813,-73.8957277395292,-73.8957083593663,-73.895698806766,-73.8956798586982,-73.8956655035056,-73.8956821361816,-73.8957011668355,-73.8957091110667,-73.8957050977126,-73.8956953200621,-73.8956743695962,-73.8956570847363,-73.8956414660354,-73.8956138850193,-73.8956184277539,-73.8956452706756,-73.8956939880069,-73.8957116624628,-73.89571934603,-73.8957167412087,-73.8957132693235,-73.8956961228619,-73.8956688618946,-73.8956408733817,-73.8956244051197,-73.8956124361602,-73.8956104467766,-73.8956279913398,-73.8956374375807,-73.8956786407145,-73.8957010465394,-73.8957206581295,-73.8957403187178,-73.8957637468172,-73.8958010353228,-73.8958266651061,-73.8958529385134,-73.8958662868526,-73.895875194153,-73.8959009137832,-73.8958997409798,-73.8958920370437,-73.8959022966381,-73.8959227590299,-73.8959474535908,-73.8959744431929,-73.8959870771419,-73.8959967376833,-73.8960086507564,-73.8960145897211,-73.8960148077333,-73.8960137254552,-73.8960199184326,-73.8960356508572,-73.8960490075756,-73.896060876142,-73.8960610538039,-73.8960612767322,-73.8960732287558,-73.8960835774604,-73.8961186944803,-73.8961602574431,-73.8961995294756,-73.8962576889647,-73.8963043296809,-73.896319616921,-73.896326143364,-73.8963385144918,-73.89634089502,-73.8963541538669,-73.8963795735807,-73.8964019740634,-73.8964207301033,-73.8964388205493,-73.8964534797444,-73.896451455604,-73.8964263867058,-73.8964078514045,-73.8964144139217,-73.8964247155975,-73.8964026207187,-73.8963971261558,-73.8964030140709,-73.896430716644,-73.8964503276905,-73.8964749857016,-73.896483754737,-73.8964651641387,-73.8964450581999,-73.8964394767218,-73.8964513003799,-73.8964760784469,-73.8964985693021,-73.8965397836322,-73.8965471522924,-73.8965292040767,-73.8965316687731,-73.8965464167863,-73.8965560811243,-73.896579472873,-73.8966051067316,-73.8966190030317,-73.8966282974112,-73.8966433522531,-73.8966425310698,-73.8966372981586,-73.8966305008977,-73.8966242402839,-73.8966012956822,-73.8965741101827,-73.8965470226457,-73.8965215956256,-73.8964863953877,-73.896470778978,-73.8964538113099,-73.8964534004968,-73.8964528984,-73.8964590060186,-73.8964673194708,-73.8964705515664,-73.8964787773187,-73.8964797659758,-73.896474991646,-73.8964738543903,-73.8964668789326,-73.8964714618066,-73.8964803149139,-73.8965020880993,-73.8965129738092,-73.896511622357,-73.8965009107415,-73.8964786028266,-73.8964512933026,-73.8964430479373,-73.8964412417415,-73.8964538748979,-73.8964628183035,-73.8964600270788,-73.8964493155114,-73.8964104897844,-73.8963839025468,-73.8963594695087,-73.896331313616,-73.8963002241372,-73.8962900198331,-73.8962783208323,-73.8962731509235,-73.896255785868,-73.896236354404,-73.8962264045079,-73.8961955415309,-73.8961705245914,-73.8961649843462,-73.8961724470908,-73.8962065895595,-73.8962271845637,-73.8962425585599,-73.8962456577012,-73.8962375685197,-73.8962143578367,-73.8961761931683,-73.8961674495314,-73.8961545074585,-73.8961517799647,-73.8961682578317,-73.8961819601655,-73.8961733697758,-73.896165315147,-73.8961442313183,-73.896110417563,-73.8960953963919,-73.8960765741882,-73.8960717522288,-73.8960684390199,-73.8960817843356,-73.8961052467118,-73.8960905437194,-73.8960607532528,-73.8960325997656,-73.8960050700418,-73.8959872530431,-73.8959886094388,-73.8959894831165,-73.8959948937292,-73.8959913445865,-73.8959837116083,-73.8959529309325,-73.8959266731793,-73.8959033626995,-73.8958885243663,-73.8958410010153,-73.8958077281093,-73.895794818165,-73.8957928770522,-73.8957918237688,-73.8957850751473,-73.8957528549671,-73.8957344515297,-73.8957370650942,-73.8957510648205,-73.8957765901637,-73.8957821500269,-73.8957875439296,-73.8958052774503,-73.8958283217262,-73.8958442321342,-73.8958515674099,-73.8958689818205,-73.8958928450205,-73.8959131096775,-73.8959491147468,-73.8959763779137,-73.8959891734012,-73.8960018347202,-73.8960171760583,-73.8960288166784,-73.8960212816377,-73.8960071986157,-73.8959728522883,-73.8959364117325,-73.895919348651,-73.8959092860417,-73.8958907151541,-73.895866416726,-73.8958622492245,-73.8958611289419,-73.895845050086,-73.8958161128408,-73.8957484560102,-73.8957167371392,-73.8956850189354,-73.8956188388825,-73.8955899991694,-73.8955825661115,-73.8955773251832,-73.8955775765203,-73.8955771749052,-73.8955719333243,-73.8955589064678,-73.8955363967229,-73.8955325292626,-73.8955219277578,-73.8955294292694,-73.8955268148037,-73.895517720667,-73.8955022129437,-73.8954794051591,-73.8954564610939,-73.8954181943246,-73.8953516114978,-73.8952740916742,-73.8951798123059,-73.8950818625676,-73.8949514433278,-73.8948739898148,-73.8947899587911,-73.8947356861192,-73.8946525742942,-73.8946011447679,-73.894527494574,-73.8944509638565,-73.894399016325,-73.8943276952913,-73.8942758140807,-73.8942095988277,-73.8941592247362,-73.8940930419318,-73.8940183533286,-73.8939516495013,-73.893915292737,-73.8938688205104,-73.8938207402508,-73.8937647388852,-73.893713192667,-73.8936774541794,-73.8936410966633,-73.8935945245514,-73.8935701409324,-73.8935393447913,-73.8934829237281,-73.8934322299478,-73.8933726946368,-73.8933058922291,-73.8932636087532,-73.8932371313793,-73.8932035527704,-73.8931505997651,-73.8930694294944,-73.892996077809,-73.892917756445,-73.8928321652225,-73.8927768847313,-73.8927055281984,-73.8926710978868,-73.8926114949625,-73.892555394561,-73.8924992624969,-73.8924350055885,-73.8923035830356,-73.8921851903461,-73.8920753684858,-73.891968495442,-73.8918911816604,-73.8918680042854,-73.8917948432373,-73.8917339540428,-73.8916579143492,-73.8915766646833,-73.8914917155381,-73.8914249689624,-73.8913758017451,-73.8913402845188,-73.8913155690616,-73.8912783137042,-73.8912310759174,-73.8912143113059,-73.8912098064092,-73.8912038320689,-73.8911872592617,-73.8911734991628,-73.8911403610433,-73.8910870297521,-73.8910367450094,-73.8909806325801,-73.8909541456468,-73.8909435536639,-73.8909491025358,-73.8909586166175,-73.8909825988295,-73.8910279027647,-73.8910435592943,-73.8910472336024,-73.8910457011408,-73.891037103025,-73.8910441064479,-73.8910669139076,-73.891092290755,-73.891127745401,-73.8911652242947,-73.8912081899751,-73.8912337431522,-73.8912560424506,-73.8912725815865,-73.8913094251673,-73.8913438617284,-73.8913729796069,-73.8913830769422,-73.8914143047419,-73.8914577118661,-73.8914961816723,-73.8915401043935,-73.8915846815314,-73.89161708481,-73.891646577468,-73.8916642358477,-73.8916801776258,-73.8916763660208,-73.8916727601363,-73.8916844810591,-73.8917198269096,-73.8917419077218,-73.8917587432829,-73.8917789805629,-73.891796366825,-73.8918115597381,-73.8918292278619,-73.8918596094374,-73.8920021457804,-73.8920736385453,-73.8920963376866,-73.8921156055985,-73.8921286317787,-73.8921157672184,-73.8921091444771,-73.8920976534755,-73.8920861604427,-73.8920963744581,-73.8921201341393,-73.8921528446363,-73.892177499894,-73.8922013661422,-73.8922285622076,-73.8922633735415,-73.8923231069566,-73.8924026289974,-73.8924742959735,-73.8925642451589,-73.8926374884221,-73.8926664306974,-73.892706380421,-73.8927487958703,-73.8927979612826,-73.8928636222239,-73.8929336328697,-73.8929773785925,-73.8930119700202,-73.8930336714232,-73.8930771466139,-73.8931149984838,-73.8931504529308,-73.8932077483893,-73.8932646390634,-73.8933062999077,-73.8933588291868,-73.8934180488138,-73.893483779084,-73.8935342917288,-73.8935926213784,-73.8936447069749,-73.8936963802044,-73.8937620387303,-73.8938365056483,-73.893884606314,-73.893932400722,-73.8939649070352,-73.894002179548,-73.8940339386831,-73.894042279015,-73.8940403298224,-73.8940409879994,-73.8940308819601,-73.8939885136291,-73.893968869809,-73.8939661674475,-73.8939583892696,-73.8939664865008,-73.893963850609,-73.8939401331766,-73.8939199740807,-73.8938934387445,-73.8938807517071,-73.8938656266567,-73.8938478244458,-73.8938323248957,-73.8937915272276,-73.8937168229822,-73.8936456169549,-73.893593814031,-73.893580855394,-73.8935747216995,-73.8935817584825,-73.893571855795,-73.8935726510378,-73.8935800940461,-73.8935949752857,-73.8936083475606,-73.8936060875694,-73.8935985132635,-73.8935776019499,-73.8935493885304,-73.8935188715207,-73.8934791662547,-73.8934580781589,-73.8934421631138,-73.8933885681998,-73.8933640516737,-73.8933132693803,-73.8932518581988,-73.8931964472586,-73.8931596216856,-73.893133357874,-73.8931159029392,-73.8930885375216,-73.8930418031411,-73.8929933904563,-73.8929361667042,-73.8929077099931,-73.892895328126,-73.8928808213098,-73.8928600719735,-73.8928193004152,-73.8927757844807,-73.8927422803436,-73.8926926974703,-73.8926603625196,-73.8926243567053,-73.892575326159,-73.8924813122802,-73.8924328995918,-73.8923714192019,-73.8922639902434,-73.8921729185508,-73.8921065677905,-73.8920434762341,-73.8920222171404,-73.8919986952915,-73.8919753522301,-73.8919417536426,-73.8919130241683,-73.8918938908652,-73.8918723204436,-73.8918605208172,-73.8918608942806,-73.891845769807,-73.8918162504582,-73.8917946530984,-73.8917677699422,-73.8917555250401,-73.8917510275932,-73.8917556844997,-73.891767510253,-73.8917673329861,-73.8917338282398,-73.8916898283412,-73.8916245375481,-73.8915780373994,-73.8915347342243,-73.8914902655565,-73.8914598178604,-73.8914422940615,-73.8914229162386,-73.8913730475449,-73.8913484258599,-73.8913228463994,-73.891277245851,-73.8912561569234,-73.891227283307,-73.8911909395723,-73.8911535299487,-73.891114883189,-73.8910863830434,-73.8910162937615,-73.8909970932319,-73.8909882098883,-73.8909986619288,-73.8910319492455,-73.8910708923046,-73.8911380178028,-73.8911505614258,-73.8911595068531,-73.8911613882108,-73.891152639307,-73.8911383350982,-73.8911231730949,-73.8910992043693,-73.8910779463262,-73.891022576505,-73.890977771294,-73.8908809593486,-73.8908299781525,-73.8907513283151,-73.8906954091548,-73.890643607718,-73.8905882756978,-73.8905493643465,-73.8904906752194,-73.8904449799142,-73.8903685663573,-73.8903339069819,-73.8903255119452,-73.8903019665162,-73.8902554140872,-73.8901893241625,-73.8901369809088,-73.8900624543933,-73.8899914950041,-73.889927800184,-73.8898737366221,-73.8898183008587,-73.8897916313015,-73.8897667138749,-73.8897357979812,-73.889715131838,-73.8897020806497,-73.8896964366385,-73.8896963184647,-73.8897077194202,-73.8897208042511,-73.8897365916125,-73.8897485743127,-73.8897568499693,-73.8897506910981,-73.8897433999619,-73.8897470078521,-73.8897540096988,-73.8897664021325,-73.889784517762,-73.8898030753887,-73.8898508863007,-73.8898819592724,-73.8899367663652,-73.8899886261971,-73.89003276808,-73.8900687474416,-73.8901075032236,-73.8901243146048,-73.8901549142776,-73.8902171644627,-73.8903021138949,-73.8904214560367,-73.8905172049769,-73.8905882283046,-73.8906610658908,-73.8907137714646,-73.890785677587,-73.8908602603516,-73.8909341202569,-73.8909930679526,-73.8910330863644,-73.8910779065652,-73.8911626406936,-73.8912635280208,-73.8913650664434,-73.8914751069734,-73.8915604955093,-73.8916965703808,-73.8918171469525,-73.8919042180364,-73.8919446144681,-73.8919729366765,-73.8919835665811,-73.8919901455717,-73.8919925108926,-73.8919815325084,-73.8919649690348,-73.8919505967327,-73.8919473024031,-73.8919469214284,-73.8919129348595,-73.8918956845558,-73.8918770605388,-73.891864950885,-73.8918655272165,-73.8918803006254,-73.8919111529,-73.8919456758464,-73.8919725162863,-73.8919805379837,-73.8919820446748,-73.8919771075809,-73.8919543422603,-73.891914916054,-73.891904287419,-73.891841478176,-73.8918129158035,-73.891793201432,-73.8917682687249,-73.8917384646052,-73.8917461729698,-73.8917525506488,-73.8917623578281,-73.8917721304933,-73.8917863254454,-73.8917930094765,-73.8917960250416,-73.8917857021248,-73.8917687630457,-73.8917613860105,-73.8917694068231,-73.8917866166984,-73.8918297521876,-73.8918594781802,-73.8919186964822,-73.8919538117462,-73.8919886506704,-73.892002269229,-73.8920126272567,-73.8920367396705,-73.8920744962619,-73.8920861910738,-73.8920957998755,-73.8921079793807,-73.8921480638507,-73.8921898262499,-73.8922520582136,-73.8922673545897,-73.8922585439279,-73.8922399635147,-73.8922373648939,-73.8922341509154,-73.8922663666659,-73.8922871295626,-73.8923104661718,-73.8923238806387,-73.8923347526969,-73.8923547482889,-73.8923665113154,-73.8923721087752,-73.8923665937145,-73.8923511711267,-73.8923223391061,-73.8922690323718,-73.8922299210863,-73.892224847529,-73.8922232040977,-73.8922408614732,-73.8922709288866,-73.8923088457973,-73.8923388780439,-73.8923741950039,-73.8924057764902,-73.8924216558238,-73.8924232720762,-73.892418749798,-73.8924000321741,-73.8923723029574,-73.892350466837,-73.8923208148942,-73.8923065527174,-73.8922875909203,-73.8922660530438,-73.8922515466934,-73.89222497129,-73.8922022717767,-73.8921764920605,-73.892172804221,-73.8921703593748,-73.8921856610637,-73.8922009566391,-73.8922061384982,-73.8922197567358,-73.8922445541159,-73.8922476512886,-73.8922647675758,-73.8922706339314,-73.8922649175475,-73.8922755182375,-73.8922865289044,-73.8923267466181,-73.8923406706305,-73.892362547195,-73.8924281002395,-73.8924586138717,-73.8924669457719,-73.8924832404149,-73.8924963496892,-73.8925039094105,-73.8925122567251,-73.892512650001,-73.8925160682589,-73.8925316136601,-73.8925345342453,-73.8925533288799,-73.8925726373485,-73.8925764469323,-73.8925792331861,-73.8925892568118,-73.8925925566797,-73.8925987716385,-73.8926274479689,-73.8926456276853,-73.8926562981233,-73.8926628882219,-73.8926686517774,-73.8926775387693,-73.8926980536611,-73.8927134948341,-73.8927294499925,-73.8927457807248,-73.8927729822488,-73.8928205208266,-73.8928597231121,-73.8929175514211,-73.8929588118857,-73.8930173584923,-73.8930510046089,-73.893078684751,-73.8931120243378,-73.8931313365312,-73.8931450934131,-73.8931619384659,-73.8931950803473,-73.893214429387,-73.8932400878238,-73.893256827852,-73.8933048814524,-73.8933307781672,-73.8933462142002,-73.8933563326656,-73.8933743712569,-73.8933985855705,-73.8934319249572,-73.8934602906867,-73.8935021684265,-73.8935322804853,-73.8935586557758,-73.8935663742215,-73.8935682955377,-73.8936103466953,-73.8936431345333,-73.8936687560408,-73.893702610662,-73.8937209246846,-73.8937509691804,-73.8937681193186,-73.8937910298784,-73.8938052630494,-73.8938239889522,-73.8938489920781,-73.8938776645143,-73.8939009881144,-73.8939280493264,-73.8939542523284,-73.8939963033267,-73.894037047817,-73.8940664066727,-73.8941198423734,-73.8941783875378,-73.8942274701388,-73.8942667062872,-73.8943311507794,-73.8943655495217,-73.8943891805254,-73.8944395610919,-73.8944779373409,-73.8945309257695,-73.8945476974328,-73.8945796596804,-73.8946178997269,-73.8946668391788,-73.8947133128377,-73.8947631475013,-73.8947979937308,-73.8948279702858,-73.8948616836842,-73.8948915917469,-73.8949290106372,-73.8949600537027,-73.894992018269,-73.8950219586699,-73.8950603394096,-73.8950919639528,-73.8951284934897,-73.8951650230412,-73.8951946917748,-73.8952439083291,-73.8952772469879,-73.8953104135116,-73.8953475604165,-73.8954135530859,-73.8954530647933,-73.8954968654536,-73.8955813413635,-73.8956296326534,-73.8956944533786,-73.8957521084812,-73.8958174463282,-73.8958785319965,-73.895913444248,-73.895966297932,-73.8960084815338,-73.8960450421947,-73.8960933645975,-73.8961128280492,-73.8961322917227,-73.8961624704545,-73.8961925141855,-73.8962258510643,-73.8962508986745,-73.8962786567386,-73.8963091409688,-73.8963423922054,-73.8963741968421,-73.8964137403908,-73.8964661234959,-73.896513613368,-73.8965533232536,-73.8966192291039,-73.8966696507697,-73.8966987359737,-73.896725731512,-73.8967603828681,-73.8968239904493,-73.8968890004358,-73.8969462734801,-73.8970027013132,-73.897024634461,-73.8970529976051,-73.8970990839521,-73.8971451296441,-73.897181954938,-73.8972293150113,-73.8972695851943,-73.8973070437233,-73.8973380821672,-73.8973626183635,-73.8973738428314,-73.8974063278037,-73.8974664912283,-73.897533751905,-73.8976073964285,-73.897678908239,-73.8977412358709,-73.8977702764431,-73.8977993572169,-73.8978285230874,-73.8978709989603,-73.8979084617761,-73.8979473239487,-73.8979910694053,-73.8980220281825,-73.8980594466855,-73.8981082952895,-73.8981437165485,-73.8981975859076,-73.8982345715058,-73.8982444557701,-73.8982583900202,-73.8982623540165,-73.8982860129755,-73.8983173043672,-73.8983387811786,-73.898502110433,-73.8985572030616,-73.8986972085319,-73.8987999324267,-73.8988219924594,-73.8988683184527,-73.8989511291848,-73.8986941157259,-73.8983237178363,-73.8982671480452,-73.8976089486917,-73.8972878511016,-73.8972449295147,-73.897209379771,-73.8971812256639,-73.8971604866737,-73.8971471760744,-73.8971413028214,-73.8971302438283,-73.8971269679088,-73.8971265471953,-73.8971263315366,-73.8971274733407,-73.897129112271,-73.8971294394962,-73.897149258593,-73.8971634489842,-73.8972061044235,-73.8972603878599,-73.8973262920142,-73.8974038019086,-73.8974094943071,-73.8974167789968,-73.897418411566,-73.8974088802114,-73.8973973565469,-73.8973876948109,-73.8973668038461,-73.897344056026,-73.8973306853778,-73.8972930573074,-73.8972185991283,-73.8971479172305,-73.8970717166319,-73.8969245112827,-73.8968430227625,-73.8968003262926,-73.8967508196571,-73.8966648819572],"lat":[40.6214773501578,40.6214619445085,40.6214623698936,40.6214444761825,40.6214282465916,40.6214159073261,40.6214087604326,40.6213947561901,40.6212640886008,40.6212318953729,40.6210712923029,40.6210147225881,40.6209974641104,40.6209691978913,40.62090700527,40.6208243286769,40.6207755735363,40.6207610777518,40.6207364999746,40.6207305078386,40.6207358292901,40.6207631362259,40.6207967556079,40.6208299812735,40.6208434160448,40.6208402210095,40.6208329394777,40.6208002132736,40.6206442375757,40.6206258798093,40.6206154337343,40.6206062894212,40.6205955817754,40.6205660799435,40.6205314958553,40.6205060155795,40.6204876908455,40.6204872596785,40.6204925468594,40.6204855598011,40.6204694654013,40.6204404329734,40.6204242686893,40.6204096335008,40.6204003838422,40.6203873796632,40.6203516647855,40.6202409157608,40.6202113165551,40.6202015713952,40.6201805816587,40.6201529838474,40.6201263089919,40.6201042585344,40.6200835441272,40.6200714066252,40.6200491539992,40.6200199205321,40.6199843347684,40.6199559338541,40.6199454921536,40.6199450897594,40.6199500491628,40.6199505814645,40.6199395338096,40.6199223121887,40.6199154942765,40.6199020246199,40.6198894223016,40.6198761841743,40.6198672713882,40.6198637429543,40.6198545342871,40.6198012871507,40.6197525986596,40.6197015143115,40.6195989855913,40.6195601079442,40.6195299501588,40.6195160041959,40.6195009046798,40.6194776682742,40.6194505529363,40.6194272780345,40.6194084618144,40.6193692821806,40.6193505333845,40.6193269441538,40.6193209146522,40.6193244379926,40.6193234427629,40.6193130851529,40.6192944379176,40.6192620711303,40.6192115726815,40.6191758861132,40.6191446193679,40.6191083177214,40.6190786277684,40.619031934111,40.6189983093218,40.6189718429928,40.6189537087326,40.618928475624,40.6189159274452,40.6188863069564,40.6188456125425,40.6188175425956,40.6187779465166,40.6187581345559,40.6187333486792,40.6186887173208,40.6186441474925,40.6185797687904,40.6185379502329,40.6185038706678,40.6184818312234,40.6184543000535,40.6184119312302,40.6183827908844,40.6183383294491,40.6182950267599,40.6182660222578,40.618227758041,40.618185008204,40.6181757176027,40.6181713581871,40.6181609396613,40.6181356079129,40.6181103409226,40.6180939493524,40.6180956982732,40.6181029619745,40.6180975436342,40.6180755710104,40.6180568496699,40.6180319312787,40.6179998833768,40.6179954970165,40.6179718741625,40.6179343049838,40.6179017741184,40.6178902239478,40.6178650242432,40.6178546676799,40.6178421181812,40.6178316952228,40.6178106534294,40.6177918340471,40.6177675644604,40.6177389749035,40.6177181641573,40.6177089064885,40.6177041676739,40.6176904228588,40.6176738007322,40.6176402066939,40.6176072274849,40.6175764401714,40.617544045203,40.6175056131625,40.6174875094142,40.617416483651,40.6173477126449,40.6172727783799,40.6172099447853,40.6171575691191,40.6171289073247,40.6171062151614,40.6170763273269,40.6170299160245,40.6169592689569,40.6168489251349,40.6168152318849,40.6167699817696,40.6167325155554,40.6167088275116,40.6166724919582,40.6166301198092,40.6165899114107,40.6165585733099,40.6165244009698,40.6164907734372,40.6164571761521,40.6164268399212,40.6163982151893,40.6163795311166,40.6163686264927,40.616363174681,40.6163515898406,40.6163377739661,40.6163222194189,40.6163033643969,40.6162559538067,40.6162124202765,40.6161717269728,40.6161420083509,40.6161298743931,40.6161160573407,40.6160899747853,40.6160699961107,40.6160550149188,40.6160482654191,40.6160514207627,40.6160585211517,40.6160760766803,40.616089274472,40.6160908513317,40.6160791953871,40.6160615099195,40.6160343639692,40.6160011837037,40.6159741693413,40.6159466468815,40.6159253501023,40.6159073348711,40.6158885749482,40.6158639563453,40.6158542335352,40.6158402959483,40.6158303533174,40.6158244447138,40.6157858132351,40.6157563585047,40.6157217340908,40.6156888089271,40.615654491231,40.6156447674416,40.6156302569694,40.6156246264228,40.6156259023166,40.6156162785191,40.6155901168529,40.6155672216906,40.6155544985368,40.6155454887596,40.6155265369872,40.6155061430519,40.6154971702033,40.6154816646163,40.6154507140996,40.6154119318619,40.6153824261054,40.6153315700352,40.615297722951,40.6152732330214,40.6152402676231,40.6152171052501,40.6151977052259,40.615173290016,40.6150908213551,40.6150392988166,40.6150034126209,40.6149782965883,40.6149602897836,40.6149456258827,40.6149121113045,40.6148877471202,40.6148751509745,40.6148586124762,40.6148435667236,40.6148347615817,40.6148177761826,40.6148093657169,40.6148151226285,40.6148209280213,40.6148290323496,40.6148408502098,40.6148509738237,40.6148610930015,40.6148688939185,40.6148707570569,40.6148645928462,40.6148529663971,40.6148314879797,40.614804600052,40.6147855718255,40.6147627766485,40.6147298634798,40.6147002410199,40.6146709386527,40.6146333807617,40.6146008107116,40.6145688672217,40.614538862351,40.6145181374948,40.6145040975656,40.6144907871289,40.6144768371304,40.6144679152488,40.6144589938617,40.6144455654721,40.6144376897081,40.6144241226554,40.6144127280994,40.6143897812085,40.6143706497004,40.6143592539708,40.6143517488977,40.6143585448639,40.6143597122094,40.6143680193845,40.6143843302937,40.6143969276072,40.6144085012923,40.614421773084,40.6144269668556,40.6144266715782,40.6144140101071,40.614381451729,40.6143408404478,40.6142845966099,40.6142256308509,40.6141561227257,40.6141182560294,40.614073877606,40.6140472045412,40.6140126537761,40.6139870246136,40.6139600306206,40.6139319639275,40.6139156390957,40.6138962507541,40.6138826437507,40.6138692156886,40.6138588763331,40.6138481655544,40.6138397519273,40.613838345484,40.6138480284523,40.6138540511098,40.6138513166936,40.6138470397009,40.6138498449018,40.6138557149033,40.6138654247563,40.6138659574519,40.6138651389473,40.6138660447384,40.6138765313853,40.6138863930703,40.6138849111825,40.6138780414865,40.6138774264341,40.6138799265075,40.6138852202251,40.6138902225177,40.6138807592132,40.6138701510327,40.6138590434626,40.6138452676953,40.6138399187075,40.6138205281529,40.6138187393003,40.6138145121595,40.613804770023,40.6137923116812,40.6137701285228,40.6137219428939,40.6136785201248,40.6136355428668,40.613596356609,40.6135639221692,40.6135527302022,40.6135136847197,40.6134805251554,40.6134404343407,40.6133916655829,40.6133374861077,40.6132967440134,40.6132760018607,40.6132562069006,40.6132389999127,40.613202294751,40.6131700536596,40.613157136718,40.6131473231263,40.6131343175529,40.6130930206982,40.6130500235712,40.6130067073774,40.6129559593845,40.6129144938561,40.6128681639333,40.6128340473171,40.6127691777256,40.612723784627,40.6126974430079,40.6126791310411,40.6126496669397,40.6126237709003,40.6126008554032,40.6125693442482,40.6125406804203,40.612509560998,40.6124814754272,40.6124691478916,40.6124604255723,40.6124484393473,40.6124276739172,40.6123951991376,40.6123480926365,40.612298894108,40.6122341798086,40.6121874404302,40.6121549152118,40.6121477153081,40.6121254476995,40.6121209866886,40.6121187717537,40.6121077522681,40.6120929455508,40.6120777693283,40.6120588311684,40.6120531106126,40.6120615796558,40.6120790329272,40.6121046385241,40.6121169741802,40.6121311157745,40.612129681248,40.6121196237481,40.6121013910147,40.6120848002267,40.6120660949977,40.6120321042314,40.6120202203295,40.6119870319718,40.6119658269514,40.6119605788032,40.6119608433246,40.6119682390584,40.6119945501563,40.6120136745864,40.6120377636933,40.6120618802719,40.6120709751293,40.6120782150857,40.6120739096264,40.6120626521873,40.6120470566755,40.6120232561944,40.6119901036662,40.6119565645328,40.6119140117319,40.6118726872225,40.6118191111016,40.6117837442919,40.6117713373143,40.6117440633536,40.6117298306345,40.6117274335901,40.6117269727893,40.6117307983806,40.6117399243887,40.6117524458829,40.6117629781939,40.611761234459,40.6117628347197,40.6117541112738,40.6117358567764,40.6117012703037,40.6116853897,40.611674816099,40.6116478067053,40.6116245093924,40.6115916472833,40.6115575823261,40.6115306777853,40.611515737263,40.6115152776222,40.6115261059793,40.6115368002185,40.6115365967242,40.6115241379265,40.6115039986215,40.6114643655653,40.6114283335632,40.6114087888304,40.6113794205862,40.611347488773,40.6113106425628,40.6112967912333,40.6112756257981,40.6112512722927,40.6112326694606,40.6112142225808,40.6111814266513,40.6111741074664,40.611168539102,40.6111747031813,40.6111961535438,40.6112247098579,40.6112325456199,40.6112271830182,40.6112082297543,40.611186480603,40.6111704024722,40.6111657254606,40.6111500464316,40.6111189543571,40.6110951753256,40.6110712408479,40.6110564257718,40.6110524047784,40.6110451165746,40.6110402561395,40.6110240817348,40.6110151417872,40.6110008976365,40.611007348222,40.6110171909575,40.6110283982061,40.6110482289476,40.6110718661859,40.61108855983,40.6111105535018,40.6111354186131,40.6111449739265,40.6111558646088,40.611161165105,40.6111750100633,40.6111933747824,40.6112060665292,40.6112100569097,40.6112055021166,40.6112086601672,40.611225693206,40.6112433282053,40.6112681224353,40.6112910308816,40.6113183278579,40.611346596615,40.6113609325401,40.6113788257816,40.611394080185,40.6114018844493,40.6114082199463,40.6114122368955,40.61143438482,40.6114735347313,40.6115091866356,40.6115362972539,40.611552487162,40.6115582581706,40.6115591698789,40.6115399343692,40.6115371854666,40.6115294735609,40.6115346707473,40.6115551260286,40.611568345369,40.6115819319929,40.6116033825925,40.6115940499134,40.6115862069817,40.6115953212198,40.6116178175549,40.6116363676667,40.6116515238839,40.611666548975,40.6116866682117,40.6117149349985,40.6117514810573,40.6117910823581,40.6118146443566,40.6118218223299,40.6118138198804,40.6118229873061,40.6118341141208,40.6118567129122,40.6119140326058,40.6119279792484,40.6119321819924,40.6119345280011,40.6119457056944,40.6119608290334,40.6119624975682,40.6119772011889,40.6119995345745,40.6120282456766,40.6120499729319,40.6120524524163,40.6120667169655,40.6120839647807,40.6121013977535,40.6121182065023,40.6121465409597,40.612163212599,40.612177193161,40.6121940200537,40.6122137468603,40.6122395074926,40.6122609562851,40.6122711168332,40.6122768618686,40.6122608609551,40.6122392449123,40.6121934248176,40.6121817110252,40.6121747473371,40.612165279042,40.6121492012599,40.6121332001728,40.6121191097847,40.6120857606671,40.6120570877463,40.6120267124001,40.6120114737293,40.6119909609993,40.6119635739979,40.6119305920057,40.6118864742697,40.6118486564987,40.6118095536494,40.6117703998861,40.6117365784499,40.6117156656098,40.6116969204277,40.6116859156746,40.6116607495201,40.6116253399043,40.6115989969041,40.6115633020282,40.6115128204364,40.6114535595923,40.6113984824481,40.6113264990457,40.6112756805074,40.6112167892792,40.6111780407037,40.6111340905778,40.6111004873017,40.6110748812615,40.6110437893859,40.6109984571789,40.6109552440054,40.6109283085462,40.6108742818474,40.610835747262,40.6107761826867,40.6107128550738,40.6106561892191,40.610612664229,40.6105674945686,40.6105291657439,40.6104716092104,40.6103972577883,40.6103176568626,40.6102168714417,40.61013980699,40.6100740269712,40.6100223562597,40.6099916378223,40.6099584392448,40.6099181615412,40.6098789541168,40.6098410764219,40.6098165484024,40.6097843390193,40.6097248583334,40.6096536971578,40.609581469516,40.6095069149588,40.6094436176133,40.6093273384785,40.6092189228194,40.6091387469027,40.6091022521483,40.609093660068,40.6090907880549,40.6090971896613,40.6091047680531,40.609122350806,40.6091432510807,40.6091663207371,40.6091772425486,40.609189209465,40.6092266995072,40.6092487234138,40.6092729424997,40.6093008456455,40.6093225844299,40.6093414001195,40.6093485387373,40.609358342165,40.6093747823991,40.6093817336846,40.6093849739408,40.6093872200544,40.6093897512979,40.609382193513,40.609385065521,40.6093838531642,40.6093842933546,40.6093933046157,40.6094219643019,40.6094555879727,40.6094772242458,40.6094754730395,40.609468263446,40.6094610538192,40.6094581034269,40.60946724927,40.6094737304595,40.6094874727028,40.6094948122866,40.60951231766,40.6095192689593,40.609522797411,40.6095074682236,40.6094993985081,40.6094723910536,40.6094501083535,40.6094196739191,40.6093949835439,40.6093812423192,40.6093482444808,40.6093188562996,40.6093028920394,40.6092619772171,40.6092367622847,40.6092149524331,40.6092018166209,40.6091812889989,40.6091652731467,40.6091567016376,40.6091553667704,40.6091369187088,40.6090967324978,40.6090195515459,40.608940959979,40.6088524896168,40.6088196738489,40.6087993731385,40.6087729862626,40.608759740532,40.6087281251552,40.6087086325012,40.6086909415579,40.6086804848581,40.6086611933495,40.608638951202,40.6086357625538,40.6086270868576,40.6086213953612,40.6086241946458,40.6086285120549,40.6086313124614,40.6086171829601,40.6085976421112,40.60857783895,40.6085582432413,40.608548521817,40.6085417252301,40.608518231286,40.6085022635721,40.6084874950768,40.6084877018478,40.6084983339059,40.6085215077919,40.608539115242,40.6085591005067,40.6085643486807,40.608560400465,40.6085509698067,40.6085447213573,40.6085031509629,40.6084871362905,40.608467488309,40.6084428265531,40.6084087308223,40.6083641032971,40.6083366445656,40.6083158987341,40.6082882539184,40.6082570823282,40.6082422433682,40.6082258665472,40.6082120463753,40.6082024600742,40.6081992831069,40.6081928334772,40.6081851009244,40.6081533050673,40.6081096185292,40.6080436955164,40.6079821392158,40.6079163182258,40.607828735517,40.6077697637156,40.6077452554263,40.6077264712029,40.6077011833056,40.6076837288226,40.6076537582865,40.6076008753554,40.6075644001424,40.6075289437173,40.6074801124798,40.6074395894204,40.60741091622,40.6073888810682,40.6073652263102,40.6073480796248,40.6073121145246,40.6072729606259,40.6072271923165,40.6071951483426,40.6071656396752,40.6071434780275,40.6071318778357,40.6071161204941,40.6071011729434,40.6070870648749,40.6070815516433,40.6070684853291,40.6070520475541,40.6070237666569,40.6070016277386,40.6069629960996,40.6068895492883,40.606861268411,40.6068285193576,40.606810144226,40.6067813964474,40.6067568545128,40.6067434462347,40.6067443899337,40.6067468216023,40.60673929587,40.6067228310295,40.6067086662676,40.6066898763101,40.6066871862148,40.6066790861503,40.6066723690131,40.6066635869039,40.6066502866627,40.606640408329,40.6066306605627,40.6066076350086,40.6065952728808,40.6065898385383,40.6065851893743,40.6065826017838,40.6065768789049,40.606578213152,40.6065723355352,40.6065690945242,40.6065544594343,40.6065452624347,40.6065316718551,40.60651837097,40.6065100099698,40.6065056722286,40.6064883475213,40.6064742388599,40.6064553163897,40.6064437150789,40.6064344144923,40.6064305760218,40.6064268916583,40.6064287775784,40.6064385568162,40.606430563216,40.6064379346427,40.6064494641696,40.6064537816179,40.6064551439287,40.6064461556842,40.6064288821611,40.606415711592,40.6064075309355,40.6064047632058,40.6063938651472,40.6063707612397,40.6063494351761,40.6063351919059,40.6063270398132,40.6063110446682,40.6062858488414,40.6062556631023,40.6062254470288,40.6062063159553,40.6061929114159,40.6061764460393,40.606154517873,40.6061204888375,40.6060656797588,40.6060392553139,40.6060116824897,40.6059730039105,40.6059524617907,40.6059311105768,40.6059098907036,40.6058819261733,40.6058551642987,40.6058447112765,40.6058312267945,40.6058234153911,40.605818973929,40.6058241783611,40.6058257742477,40.6058273694611,40.605827424205,40.6058219897262,40.6058055510447,40.6057925078911,40.6057774915066,40.6057663751408,40.6057590484267,40.6057565524422,40.6057557104032,40.6057436524483,40.6057283523951,40.6057140597093,40.60568971889,40.6056647305177,40.6056503739495,40.6056365375172,40.6056324514516,40.6056274587385,40.6056230150687,40.6056169174459,40.6056199604333,40.6056190194744,40.6056057320109,40.605589880963,40.6055767202111,40.6055640172587,40.605562165197,40.6055575624838,40.6055545772512,40.605558529518,40.6055748280624,40.6055818922358,40.6055810154075,40.6055679220776,40.605552199475,40.6055322006428,40.6055154107287,40.605499107145,40.6054901581073,40.6054784911049,40.6054587539561,40.6054482516107,40.605442548863,40.6054401136617,40.6054462996438,40.6054556325243,40.6054553363566,40.6054459375619,40.6054327110358,40.6054131340626,40.6053896713547,40.6053796335499,40.6053574685429,40.6053540261446,40.6053334760116,40.6053121760649,40.6053036592854,40.6052966901829,40.6053089180249,40.6053399930272,40.6053627917656,40.6053676881291,40.6053779691214,40.6054002913384,40.6067882167964,40.6081500847918,40.6083111707694,40.6101853714281,40.6114506248433,40.6116677085526,40.6118855647149,40.6121040479619,40.6123230121769,40.6125423115649,40.6127617997904,40.6132210650464,40.6135518418141,40.6138248437176,40.6139647841999,40.6142134466973,40.6145686317806,40.614640034109,40.6152289213095,40.6156214346673,40.6164155529934,40.6172093028479,40.6180025403001,40.6187951227492,40.6189743765835,40.6191099473268,40.6192626318,40.619373928507,40.6195594256787,40.6197563422735,40.6199461090915,40.6201216084871,40.6202248332221,40.6204083796304,40.6207715825901,40.6210161464114,40.6212436759307,40.6216551159452,40.6216200648317,40.6215710983597,40.6215143222598,40.6214773501578]}],[{"lng":[-73.8347803231749,-73.8347319094261,-73.8346607067945,-73.8346370516269,-73.8346064859116,-73.8345650075001,-73.8345304754801,-73.8344930010363,-73.8344673936666,-73.8344307891737,-73.834409004827,-73.8343694350106,-73.8342626093011,-73.8342399341093,-73.834219294585,-73.8342214082534,-73.8342224794984,-73.8342097223196,-73.8341840812289,-73.8341386534053,-73.834092170168,-73.8340140581377,-73.8339586251381,-73.8339377640601,-73.8339377100848,-73.83392577651,-73.8339069176449,-73.8338673138766,-73.8338385796002,-73.8338226529387,-73.8338245183193,-73.8338135634965,-73.833786836052,-73.8337502314451,-73.8337245054012,-73.8337145390478,-73.8336858809756,-73.8336542645498,-73.8336224200233,-73.8336821495259,-73.8337047526352,-73.8337364706052,-73.8337582318075,-73.8337849565308,-73.833836664006,-73.8338767108543,-73.8338767772716,-73.8338535342474,-73.83388696926,-73.8339487560571,-73.8339722140552,-73.83396897383,-73.8340074253541,-73.8340625213625,-73.8340875268353,-73.8341092193731,-73.8341226213258,-73.8341643121622,-73.8342176689437,-73.8342627087712,-73.8342977606197,-73.8343460863338,-73.8344194292896,-73.834491116589,-73.8345444702577,-73.8346295188742,-73.8347045788093,-73.8347679819011,-73.8348396950558,-73.8349280753408,-73.8349871609935,-73.8349757931267,-73.834932522732,-73.8348843020923,-73.8348421365286,-73.8348018316871,-73.834794209512,-73.8347709831159,-73.8347510504564,-73.8347718887184,-73.834805823094,-73.8348587319632,-73.8348753813239,-73.834868227237,-73.8348596625441,-73.834852593012,-73.8348612671132,-73.834860604311,-73.8348395210462,-73.8348117974542,-73.8347824804358,-73.8347492075249,-73.8347537141712,-73.8347729853798,-73.8348029389788,-73.8348034033985,-73.8347922790384,-73.8347518755666,-73.8347056036696,-73.8346668760949,-73.8346478271709,-73.8346442476693,-73.8346645108069,-73.8346910957331,-73.8347250042847,-73.8347590612046,-73.8347585592242,-73.834759770632,-73.8347812946888,-73.834819948265,-73.8348562212528,-73.8348770606047,-73.8348814092082,-73.8348547139485,-73.8348419367484,-73.834848244613,-73.8348977616524,-73.834971475771,-73.8349694404924,-73.8349672605839,-73.8349783591859,-73.8350007056752,-73.8350198157447,-73.835018271776,-73.8350061078969,-73.8349922033027,-73.8347803231749],"lat":[40.6226254941408,40.6226163513465,40.6226207218231,40.6226003313448,40.6225769127164,40.6225640182993,40.6225436056126,40.6225171588062,40.6224899852463,40.6224959342625,40.6225049283469,40.6225108725698,40.6225234550089,40.6225053258283,40.6224713819878,40.6224337176354,40.622411119008,40.6223847248365,40.6223665896919,40.6223521809923,40.6223558501525,40.6223571927234,40.6223751552187,40.6224022327962,40.622417299444,40.6224361081156,40.6224564088463,40.6224713937205,40.6224886597873,40.6225180071229,40.6225488981564,40.6225707225813,40.6225797067216,40.6225856571965,40.6225908752096,40.6226127022274,40.6226088751178,40.6226027809057,40.6226026388295,40.6213813056865,40.6213647917057,40.6213521296646,40.6213191220558,40.6213026419966,40.6212989036167,40.6212900667045,40.6212633807587,40.6212214133006,40.6211884220355,40.6211554727213,40.6211110304796,40.6210729032175,40.6210348368323,40.6210095012063,40.6210133504269,40.621008298397,40.6209841739471,40.6209842340959,40.6209881230102,40.6209831046179,40.6209704477309,40.6209857663765,40.6209998508323,40.6210088488525,40.6210140089888,40.6210154015686,40.6210091559779,40.6209965397091,40.6209953725547,40.6209980400732,40.6210112998889,40.6210194779207,40.6210297548553,40.6210350852363,40.6210690633922,40.6211254818782,40.6211723135623,40.6212148898622,40.6212618065442,40.6212928730999,40.6213256935697,40.6213671413928,40.6213919716732,40.6214094841003,40.621448222947,40.6214719886846,40.6215124649439,40.6215262060663,40.6215431940516,40.6215546023176,40.6215685284267,40.6215918277894,40.6216292513822,40.6216659094794,40.6217050032165,40.6217455720524,40.6217755829709,40.6218195212166,40.6218535187147,40.6219011912173,40.6219531008454,40.6219968159237,40.6220478214804,40.6220825764234,40.6221122980917,40.6221513731104,40.6221806928222,40.622213747879,40.6222341732993,40.6222470091334,40.6222698507256,40.6223008902878,40.6223227039584,40.6223484583867,40.6223778631591,40.6224252469246,40.6224592244213,40.6225317100157,40.6225666511412,40.6225922377393,40.6226289597886,40.622651279593,40.6226723585517,40.6226811045354,40.6226905429206,40.6226931469715,40.6226254941408]}],[{"lng":[-73.8502309076298,-73.8502342652207,-73.8502311500824,-73.8502038435183,-73.8501636457728,-73.8500831023781,-73.8499880387451,-73.8499010293712,-73.8498430843372,-73.8497851448792,-73.8497740221644,-73.8497564598513,-73.8497388312375,-73.8497083357134,-73.8496972297073,-73.8496667349366,-73.8495975648871,-73.8495251702842,-73.8495026853759,-73.8493948557491,-73.8492821232876,-73.8491741954384,-73.84908235073,-73.849021113128,-73.84894047909,-73.8488647041636,-73.8487390801998,-73.8486569393312,-73.8485683394826,-73.8484778158128,-73.8484636483461,-73.8484637152501,-73.8484734903511,-73.8485122642855,-73.8485445896421,-73.8485930238358,-73.848602800727,-73.8486480122872,-73.8486883669562,-73.8487464552882,-73.8487867927445,-73.8488126477115,-73.8488336982439,-73.8488741252281,-73.8489080707478,-73.8489113803082,-73.8489259412123,-73.8489904575177,-73.8490114362965,-73.8490501507761,-73.8490808062824,-73.8490969821223,-73.8490825517877,-73.8490680798187,-73.8490261757704,-73.8489987372382,-73.8489600603631,-73.8489407744318,-73.8489650729352,-73.8489973920977,-73.8490232627784,-73.849087777534,-73.8491409642194,-73.8491893198066,-73.8492199890269,-73.8492587342168,-73.8493006833405,-73.8493538279315,-73.8493925101897,-73.8494360895669,-73.8494780386004,-73.8495376156673,-73.8495971699727,-73.8496439053649,-73.84970679902,-73.8498229263462,-73.8498794080277,-73.8499488280765,-73.8500069094851,-73.8500634399438,-73.8501006177589,-73.8501151697749,-73.8501409899884,-73.8501732144715,-73.8502006117317,-73.8502570641078,-73.8502732358905,-73.850291044015,-73.8502765912313,-73.8502443826699,-73.8502057518684,-73.8501864593512,-73.8501897562307,-73.8502397118241,-73.8502767564834,-73.8503105844065,-73.8503765986413,-73.8504160043176,-73.8504506614111,-73.8504893420106,-73.8505087148131,-73.8505264671308,-73.850531334386,-73.8505313976246,-73.8505189192839,-73.8505024754569,-73.8504847836643,-73.8504735450696,-73.85049454524,-73.8505235718663,-73.8505654830727,-73.8505977197244,-73.8506267628105,-73.8506300294598,-73.8506187990853,-73.8506140096885,-73.8506140728919,-73.850617355808,-73.8506174080187,-73.8506206964266,-73.8506336372537,-73.8506449610204,-73.850653060785,-73.8506836802593,-73.850715909973,-73.8507433084172,-73.8507578189078,-73.8507610834208,-73.8507514584489,-73.8507659881468,-73.850778898706,-73.8508046560367,-73.8508271893842,-73.8508513961957,-73.8508498291982,-73.8508337428432,-73.8508208960682,-73.8508273759816,-73.8508644631179,-73.8508789845456,-73.8508790229472,-73.8508758334196,-73.8508677952972,-73.8508516815297,-73.8508372067554,-73.8508510792684,-73.8508694431416,-73.8508877974653,-73.8509061413749,-73.8509152835097,-73.8509295048173,-73.8509483258466,-73.8509860117162,-73.8510237214702,-73.8510421087652,-73.8510650493843,-73.8510802973886,-73.851086344464,-73.8510899323021,-73.8511016360977,-73.851140401752,-73.851171025426,-73.8512001026175,-73.8512312051642,-73.8512801859452,-73.8512894242435,-73.8512971206782,-73.851333354754,-73.8513466408823,-73.8513472132443,-73.8513462268524,-73.8513416704529,-73.85134018417,-73.8513358228248,-73.8513397372806,-73.8513514767397,-73.8513600121221,-73.851386897214,-73.8514126673447,-73.8514287400925,-73.8514721975027,-73.8514947290424,-73.8515253252233,-73.8515494744524,-73.8515897474933,-73.8516332541206,-73.8516735383035,-73.8517235016086,-73.8517396392544,-73.8517863901272,-73.8518089802944,-73.8518235424611,-73.8518574210593,-73.8518815921103,-73.8518896124623,-73.8518960152919,-73.8519024084158,-73.8519345896227,-73.8519780465761,-73.8520231191543,-73.852058561196,-73.8521504132856,-73.8522003690918,-73.852253543084,-73.8523002900229,-73.8523599231411,-73.8524404800214,-73.8524888457489,-73.8525308066019,-73.8525566340216,-73.8525856791025,-73.8526098908351,-73.8526373324676,-73.8526840831563,-73.8527342676751,-73.8527759302728,-73.8528226538619,-73.8528661604273,-73.8529032227726,-73.8529547803581,-73.8529869918297,-73.8530224140547,-73.8530513887075,-73.8530851953204,-73.8531012768643,-73.8531334766973,-73.8531673252469,-73.8532076181784,-73.8532495078367,-73.8532897971856,-73.8533591174695,-73.8534074587241,-73.8534670873834,-73.853497732979,-73.8535444943397,-73.8535832044147,-73.8536235127778,-73.8536816076592,-73.8536945285529,-73.8537090953138,-73.8537784341729,-73.8538139064228,-73.8538509772573,-73.8538848430976,-73.8539010086737,-73.8539027002565,-73.8539205161956,-73.8539705433364,-73.8540221170809,-73.85405109986,-73.8540720334232,-73.8540977562127,-73.8541294591784,-73.854156866285,-73.8542201202714,-73.854257162425,-73.8543183907751,-73.854368351664,-73.8544086555645,-73.8544538197251,-73.854478057869,-73.8545180551247,-73.8545519674163,-73.854589224022,-73.8546069084717,-73.8546310206092,-73.854650316628,-73.8546857022999,-73.8547324160511,-73.8547678218318,-73.8547935910306,-73.8548225953606,-73.854846765489,-73.8548677160727,-73.8549144470101,-73.8549450815647,-73.8549773418743,-73.8549983155754,-73.8550337867457,-73.8550531284333,-73.8550789127547,-73.8551015008577,-73.8551079970211,-73.8551257757757,-73.8551386983499,-73.8551532351244,-73.8551774018783,-73.8551918800389,-73.8552064061468,-73.8552080503113,-73.8552258174798,-73.8552483948598,-73.855272573128,-73.8552999664934,-73.8553209081464,-73.8553321559116,-73.8553692172228,-73.8553821497111,-73.8553805973547,-73.8554192996575,-73.8554563762292,-73.8554821334476,-73.8555030367626,-73.8555255866433,-73.8555497496052,-73.855578753849,-73.855606176427,-73.8556255437233,-73.8556416753099,-73.8556771257036,-73.8557045137401,-73.855739957729,-73.8557689486941,-73.8558140665851,-73.8558446817002,-73.8558833706495,-73.8559220454589,-73.8559494361572,-73.8559768255364,-73.8560058615508,-73.8560203769062,-73.8560381186464,-73.8560558301599,-73.8560606323505,-73.8560847679777,-73.8561153469197,-73.8561427402788,-73.8561782211173,-73.8561830861686,-73.8561815182763,-73.8561606077043,-73.8561606421014,-73.8562089922928,-73.8562347740762,-73.8562557844781,-73.8562864378796,-73.8563347439768,-73.8563508153339,-73.8563830155333,-73.8564104214054,-73.8564314092806,-73.8564539811781,-73.8564572346246,-73.8564411427769,-73.8564444285728,-73.8564493135787,-73.8564558191406,-73.8564784154183,-73.8565084496815,-73.8565515562474,-73.8565783715693,-73.8565896090148,-73.8565859648402,-73.8565798804365,-73.8565733681091,-73.8565700823734,-73.8565571040904,-73.8565650986828,-73.8565666409629,-73.8565665407022,-73.8565680889234,-73.8565680414317,-73.8565744157109,-73.8565985062171,-73.8566161806798,-73.85665804988,-73.8566886571652,-73.8567079517834,-73.8567078964304,-73.8567094607523,-73.8567399949444,-73.8567721716776,-73.8567785091976,-73.8567333403342,-73.8567300625473,-73.8567444988701,-73.8567444040029,-73.8567394415339,-73.8567634905731,-73.8568037294177,-73.8568391426159,-73.8568745929125,-73.8569068205348,-73.8569535576472,-73.8569971012347,-73.857063140623,-73.8570921398706,-73.8571404806405,-73.8572098088521,-73.8572501384454,-73.8572695423034,-73.8572761095137,-73.8572874619167,-73.8573223689736,-73.8573459571312,-73.8573818178797,-73.857401708052,-73.8574095959715,-73.8573922450456,-73.8573988268545,-73.8574280104437,-73.8574492221662,-73.8574597943935,-73.8574371339626,-73.8574131464168,-73.8573851994198,-73.8573798451359,-73.8573850998604,-73.8573743869548,-73.8573437670716,-73.8573038925644,-73.8572826687228,-73.8572707644617,-73.857228250305,-73.857202726678,-73.8571803733776,-73.8571590362081,-73.8571177645832,-73.8570898044596,-73.857045872293,-73.8570006142849,-73.8569991984303,-73.857021743475,-73.8570402313066,-73.8570627612088,-73.8570898415436,-73.8571091401701,-73.8570851479869,-73.8570595190407,-73.8570301307339,-73.8569910180597,-73.8569519088144,-73.8569139659115,-73.8569008663275,-73.8568984362241,-73.8568948440869,-73.8568699385599,-73.8568462350635,-73.8568166523894,-73.8567905850597,-73.8567988233535,-73.856808261096,-73.8567856961347,-73.8567418558684,-73.8567016054614,-73.8566767515889,-73.856637633239,-73.8566044357914,-73.8566031535285,-73.8566102021708,-73.8566433175384,-73.8566781281687,-73.8567037060881,-73.8567416039178,-73.8567463083884,-73.856728497336,-73.8566751871635,-73.8566262574887,-73.8565922632804,-73.8565858161337,-73.8566016147471,-73.8566323915526,-73.8566287851351,-73.8565967527673,-73.8566026239187,-73.8565966577053,-73.8565681610504,-73.8565231381414,-73.8565030041371,-73.8564816945726,-73.8564615968104,-73.8564461888537,-73.8564166373807,-73.8563893525278,-73.8563502434864,-73.8563383450181,-73.8563458079641,-73.8563322731485,-73.856303785432,-73.856284778152,-73.8562740711875,-73.8562870538693,-73.8562704257371,-73.8562325413774,-73.8562076636956,-73.8561837999847,-73.8561293557765,-73.8561003428445,-73.8560994311984,-73.8560970329799,-73.8560937284057,-73.8560485137302,-73.8559984200771,-73.8559628604543,-73.8558355204835,-73.8557823410725,-73.8556904651037,-73.8556018388449,-73.8555390912999,-73.8555070524117,-73.8554200611937,-73.8553298155569,-73.855299169642,-73.8553248749991,-73.8553456868584,-73.8553358860187,-73.8552987464067,-73.8552583919946,-73.855171309273,-73.8550907430343,-73.8550408046919,-73.8549989772351,-73.8549861909486,-73.8549975690249,-73.8550105480043,-73.8550106706926,-73.8549946585965,-73.8549689534345,-73.854873908432,-73.8548158957126,-73.8547530299712,-73.8546869920472,-73.8546435647286,-73.8546356429626,-73.8546256086321,-73.8546196659415,-73.8546375032283,-73.8546472925932,-73.8546280336156,-73.8546184909393,-73.8545943923642,-73.8545702753068,-73.8545542360064,-73.8545591371757,-73.8545704813002,-73.8545673149942,-73.8545851281473,-73.8546206393931,-73.8546046163797,-73.854583797228,-73.8545726245741,-73.8545662810675,-73.8545115586442,-73.8544278233718,-73.8543536841102,-73.8542731553061,-73.8541894047363,-73.8541234107571,-73.8540847908811,-73.8540235672503,-73.853952650511,-73.8538673389772,-73.8537578612249,-73.8536934735561,-73.8536774774883,-73.8535889708175,-73.853532522814,-73.8535116234851,-73.8534277832035,-73.8532843390958,-73.8531474224198,-73.8530281620764,-73.8529459124045,-73.852878080816,-73.8527893655267,-73.8527007781428,-73.8526267994771,-73.8525157156756,-73.852396441198,-73.8522949056411,-73.8521917598187,-73.8521159851947,-73.8520676361862,-73.8519967057546,-73.851853296586,-73.8518000526752,-73.8517821840826,-73.851770780886,-73.8517610669065,-73.8517239151051,-73.8516642239528,-73.8516206808132,-73.8515546632329,-73.8514709188284,-73.8514031949832,-73.8513821128721,-73.8513819570418,-73.8513785726017,-73.8513800331472,-73.8514008070984,-73.8514006458204,-73.8513747459049,-73.8513346764398,-73.8513503502229,-73.8513194779567,-73.8513047812683,-73.8512884121128,-73.8512834172644,-73.8512929295506,-73.8513201665137,-73.8513990330117,-73.8514472600952,-73.8514858114649,-73.851493739726,-73.8515370994339,-73.851585352025,-73.8516287917058,-73.8517172639136,-73.8517380507502,-73.8518104550897,-73.8518957294901,-73.8519681428933,-73.8520067052372,-73.8520533331974,-73.852130538915,-73.8521804013604,-73.8521948878003,-73.8522576052621,-73.8523122687913,-73.8523411575507,-73.8523603825202,-73.8523361357074,-73.8522603950418,-73.8521975937662,-73.8521589161634,-73.8521186772284,-73.8520769058345,-73.852051193591,-73.8519949322741,-73.8519482667627,-73.8518983036278,-73.8519110292598,-73.8519415449994,-73.851965610843,-73.8519574279193,-73.8519235499606,-73.8518783597079,-73.8518395866614,-73.8518233713514,-73.8518054830137,-73.8518020886696,-73.8517955574295,-73.8517583973335,-73.8516826239216,-73.8516214157173,-73.8515779316096,-73.8515295784461,-73.8515020798234,-73.8514327530384,-73.8513328053809,-73.8512796965883,-73.8512202156709,-73.8511478052805,-73.8510592804988,-73.8509883990511,-73.8508981482894,-73.8508046294747,-73.8506401729873,-73.8505353111138,-73.8504804370899,-73.8504352183677,-73.8503883843225,-73.8503270564228,-73.8502753837763,-73.8502480408106,-73.8502269891564,-73.850212795513,-73.850193540382,-73.8502323284938,-73.8502372474644,-73.8502309076298],"lat":[40.6233208231195,40.6232606638142,40.623212773438,40.6231734472878,40.6231341036599,40.6231217201219,40.623116684501,40.6231128874727,40.623083343622,40.6230513449468,40.6229813424962,40.6229088773285,40.6228658795835,40.6228118149703,40.6227344461146,40.6226803814905,40.6226262657641,40.6225733737626,40.6225401933561,40.622479887288,40.6224502713648,40.6224341683254,40.6224315918171,40.6224327393983,40.6224608735035,40.6224779640621,40.6224483301551,40.6224298050833,40.6224174103779,40.6224187847906,40.6223951713315,40.6223657027322,40.6223190579503,40.6222749063535,40.6222319742357,40.6221915193007,40.6221436465219,40.6221031873195,40.6220725449378,40.6220382410746,40.6220149650539,40.6219830754004,40.6219376728994,40.6218751068884,40.6218284926664,40.6217904339211,40.6217646690011,40.6217377410521,40.6217242620829,40.621705895286,40.6216887460518,40.6216617545722,40.6216298114672,40.621616286446,40.6216199155533,40.6216395244714,40.6216407011479,40.6216185747095,40.6215621259016,40.6215216502915,40.6214823930187,40.621456693168,40.6214518513595,40.6214457758713,40.6214224870141,40.6213906136622,40.6213673400761,40.6213809157522,40.6213772834775,40.6213454163988,40.621322142748,40.6213418651921,40.6213714118124,40.6213690169713,40.6213469981137,40.6212992647184,40.6212625027099,40.6212048846185,40.6211730367537,40.6211141742893,40.6210626529829,40.6210405708577,40.6210234155385,40.6210246850262,40.6210234932445,40.6209990090466,40.6209732455504,40.6209364336332,40.6209143137115,40.6209056766818,40.6208872087131,40.6208675379466,40.6208343912637,40.6208332276949,40.6208406435394,40.6208455985378,40.6208690142335,40.6208867721599,40.6208961226498,40.6208924895016,40.6208765525295,40.6208642970755,40.6208495693935,40.6208213292751,40.6208054212467,40.6207844565573,40.6207696995383,40.6207512672821,40.6207279655074,40.6207181801884,40.6207108675869,40.6207072260257,40.6206900747856,40.6206704334034,40.6206483177111,40.6206286653581,40.6206004252389,40.6205734169564,40.6205500879364,40.6205206240201,40.6204985397347,40.62047890882,40.6204592743859,40.6204580866753,40.620456899875,40.6204544799779,40.6204508153558,40.6204324019544,40.6204127438317,40.6204004841564,40.6203919070111,40.6204029909924,40.6204140707844,40.6203981395242,40.6203784918638,40.6203661929565,40.620346531329,40.6203305770686,40.6203195746374,40.6203109983979,40.620293809466,40.6202790706473,40.6202704658129,40.6202704449079,40.620258146919,40.620247157758,40.6202429079163,40.6202429317251,40.6202476178505,40.6202635583677,40.6202876634645,40.6203071121903,40.6203258092059,40.6203344054119,40.6203196660776,40.6203212492974,40.6203422487119,40.6203568868558,40.6203655705125,40.6203760751676,40.6203679667076,40.6203536318643,40.6203458995082,40.6203455517652,40.6203292983157,40.6203017267788,40.620280369579,40.6202644884527,40.6202509073021,40.6202229368919,40.6202077837878,40.6201934034019,40.6201739771583,40.6201596787785,40.6201460044246,40.6201398042778,40.6201405574679,40.6201618600381,40.6201668042959,40.6201852427089,40.6202073999651,40.620219707612,40.6202283422097,40.620238196462,40.6202431594073,40.6202432155656,40.6202432675497,40.6202384210584,40.6202273913218,40.6202176285413,40.6202041509708,40.6201771571926,40.6201587832161,40.6201588143619,40.6201747868619,40.6201944412409,40.6202177780627,40.6202386931313,40.6202608501953,40.6202817806645,40.6202855104117,40.6202831731073,40.6202820086872,40.6202820770395,40.6202747706907,40.6202687076884,40.6202737227346,40.6202627342561,40.6202333199021,40.620212479416,40.6201940990257,40.6201757125988,40.6201536466788,40.6201438840357,40.6201336717689,40.6201440016985,40.6201465169996,40.6201465726913,40.620146620121,40.6201491415537,40.6201565498406,40.6201688736721,40.6201824167363,40.6201971946263,40.6202119491878,40.6202242683646,40.6202194006572,40.620215767984,40.6202182781117,40.6202158728903,40.620201227828,40.6202012894819,40.6201976820428,40.6201842144085,40.6201695399807,40.6201524003092,40.6201414010911,40.6201021832925,40.6200886937145,40.6200592440635,40.6200360031925,40.620026225744,40.6200213614303,40.6200091264446,40.6199796228466,40.6199489842715,40.6199072601848,40.6198729441064,40.6198680986622,40.6198779580242,40.6198841235331,40.6199111694016,40.6199494578522,40.6199458386501,40.6199567543234,40.6199653968706,40.6199667019642,40.6199630811358,40.6199533102947,40.6199324938704,40.6199034274431,40.6198981466236,40.6198936682619,40.6199093366384,40.619927775975,40.6199548196868,40.6199732610545,40.6200027739783,40.6200102006095,40.6200298909714,40.620036061955,40.6200360985874,40.6200361291086,40.6200349275724,40.6200337590745,40.6200252026567,40.6200105098505,40.6199982570999,40.6199884799438,40.6199860476871,40.6199848527096,40.6199713751602,40.6199480542608,40.619923520095,40.6199088016991,40.6198928585206,40.6198941164533,40.6199051852416,40.6198941529888,40.6198794210491,40.6198597977992,40.6198512316559,40.6198475786371,40.619847613121,40.6198500949518,40.6198648431176,40.6198648897511,40.6198452610644,40.6198182463958,40.6198047885521,40.6197974680877,40.6198085510208,40.6198294509117,40.6198331622119,40.6198368767073,40.6198369131489,40.6198234415737,40.6198087312179,40.6198001563994,40.6198002009108,40.6198026914347,40.6198051913916,40.6198113667023,40.6198114233003,40.6198114616952,40.6198041432825,40.6198029642754,40.6198042260864,40.6198054883918,40.6197907912576,40.6197846698345,40.619777325635,40.6197834862449,40.6197982262684,40.619814218652,40.6198314464129,40.619831480696,40.6198167910805,40.6198020636591,40.6197824155686,40.6197651997554,40.6197492378001,40.6197443866715,40.6197444189168,40.6197149776719,40.6196978258434,40.6197138483887,40.6197335134288,40.6197458328687,40.6197397274999,40.6197213360744,40.6197152253281,40.61970049471,40.6196906527237,40.6196611881358,40.6196378651485,40.6196096330709,40.6195924718004,40.6195743585282,40.6195673224978,40.6195680399769,40.6195876984504,40.619598270682,40.6196159270171,40.6196466155713,40.6196760789903,40.6197165815351,40.6197460602014,40.6197779862896,40.619824643836,40.6198541132857,40.6198762143255,40.6199093739271,40.6199462397599,40.6199695908927,40.6199819211418,40.6199856427628,40.6200053124405,40.6200310969308,40.6200531999793,40.6200913012985,40.6201146704786,40.6201650195046,40.620188292308,40.6202140729493,40.6202447876171,40.6202889896951,40.6203491472017,40.6204056579012,40.6204265816436,40.6204438159021,40.6204438600436,40.6204439001629,40.6204402741981,40.6204231388902,40.6204354995573,40.6204379910833,40.6204380511665,40.6204197191601,40.6203988961364,40.6203669960681,40.6203105234896,40.6202761584514,40.6202606163887,40.6202651119856,40.6202803510269,40.6203036741287,40.6203452153607,40.620377609362,40.6204080062844,40.6204374188615,40.6204647949477,40.6204941844367,40.620522520004,40.6205498398678,40.6205639865317,40.6205812006988,40.6206105830946,40.6206470366811,40.6206672579711,40.6206641700092,40.6206428714992,40.6206144930534,40.6206022846916,40.6206071135093,40.6206113418153,40.6206427179479,40.6206710291529,40.6206912536811,40.6207205756059,40.620747868931,40.6207883864059,40.6208137384678,40.6208715010023,40.6209039445399,40.6209340402823,40.6209738961351,40.6210032433597,40.621021858479,40.6210233112668,40.6210259717292,40.6210268255498,40.6210367117948,40.6210664940409,40.6210944841072,40.6211116362809,40.621120635591,40.6211215085554,40.6211007029759,40.6210988650459,40.621125964748,40.6211458427631,40.6211683895225,40.6211647233089,40.6211457098658,40.6211303278651,40.6211356973118,40.6211428795908,40.6211880277276,40.6212169320893,40.6212476760943,40.6212626034447,40.6212712287301,40.6212821124087,40.6212992742459,40.6213155062161,40.6213073129332,40.6212953456346,40.6212927614834,40.6213208733509,40.6213523709201,40.6213686634721,40.6213930393021,40.621409253515,40.6214345448176,40.6214534999826,40.6214787484109,40.6214741776574,40.6214687343045,40.6214587747416,40.6214361754522,40.6214090101491,40.6214018055155,40.6214153158186,40.621416169435,40.6214378269555,40.6214723718818,40.6215064469515,40.6215271800838,40.6215488287127,40.6215677774317,40.6215930781434,40.6216102139998,40.621592107003,40.6215884642987,40.6215746340791,40.6215553535635,40.621559000711,40.6215701621944,40.6215995152986,40.6216375742525,40.621681719835,40.6217467328984,40.6217970296405,40.6218152874908,40.6218164494478,40.6218286121862,40.6218285009006,40.6217829923938,40.6216957752331,40.6216846153145,40.6216881847399,40.6217016521903,40.6217372928309,40.6217999381757,40.6218613186859,40.6218968785569,40.6219287519135,40.6219593377393,40.6219580087287,40.6219505788506,40.6219186019436,40.621870700668,40.6218252841718,40.6217847819786,40.6217283019098,40.6216816228779,40.621645983336,40.6216335848557,40.6216347395937,40.6216444827438,40.6216308932691,40.6215940037665,40.6215313734195,40.6214920289418,40.621468732885,40.6214171868304,40.6213619464672,40.621326313825,40.6212685935432,40.62123541142,40.6212108238413,40.6211764239168,40.6211457344474,40.621116280111,40.621090491548,40.6210499953475,40.6210218002305,40.6209800332446,40.6209210707077,40.6208719434338,40.6208252765681,40.6207957398104,40.6207698485793,40.620777121762,40.6207586020715,40.6207400789082,40.6207068435376,40.620682236781,40.6206784755945,40.6206857531131,40.6206438974729,40.6206007840467,40.6205700059446,40.6205159603238,40.6204618235469,40.620485080728,40.620462952497,40.6204849472332,40.6204994977607,40.6204772218412,40.6204856645087,40.620517483489,40.6205873829551,40.6206277886252,40.6206104849976,40.6205453143715,40.6204997422288,40.6205143226541,40.6205227873178,40.6205312498214,40.6205495705108,40.6205531912624,40.6205666064907,40.6205651937824,40.6205958213314,40.6206608741077,40.620716112153,40.6207369732413,40.6207774433959,40.6208092905535,40.6208251965257,40.6208030101982,40.6207820284161,40.6208028145101,40.6208629509509,40.6209329375069,40.6210053760314,40.6210729092031,40.6211515178899,40.6212239599096,40.6212767237005,40.6213174946909,40.6213773750867,40.62149275277,40.6215799106665,40.6216940784394,40.6217665142023,40.6218365139282,40.6219065359075,40.621948384599,40.6220000167113,40.6220553185913,40.6221130377162,40.6221793975101,40.6222199778752,40.6222507301182,40.6223208321868,40.6223933007128,40.6224425077047,40.6225015544618,40.6225470774027,40.6225974693458,40.6226441870231,40.6227081334949,40.6227499443353,40.6227573300483,40.622815119376,40.6228716703352,40.622924504706,40.6229748705166,40.6230092196736,40.623010349849,40.6229906235044,40.6229918017596,40.622970876397,40.6229143419352,40.6228823851949,40.6228196924519,40.6227901643506,40.622793783456,40.6228686982066,40.6229141676869,40.6229620843259,40.6230185545108,40.6230357010291,40.6230675664669,40.6231117186916,40.6231571279674,40.6232307751095,40.623308125733,40.6233461798978,40.6233903341734,40.6234061991053,40.623393840919,40.6233827342414,40.6233875834205,40.6234342055625,40.6234500786566,40.6234671384274,40.6234363740722,40.623372448801,40.6233256974099,40.6232789245944,40.6232690101832,40.6232738052856,40.6232982400222,40.6233385450397,40.6233912060182,40.623429198421,40.6234733417886,40.6235187110236,40.6235603779109,40.6235836117296,40.6235848315782,40.6235522519334,40.6234926971594,40.6234558369703,40.6234055457181,40.623367489541,40.6233208231195]}],[{"lng":[-73.8335933921562,-73.8336174675501,-73.833629942791,-73.8336327824799,-73.8336345902873,-73.8336365829234,-73.8336548436299,-73.8336702106451,-73.8336866156981,-73.8336991074219,-73.8337075749593,-73.8337076887117,-73.8336906572967,-73.8336623866821,-73.8336373157374,-73.8336372444152,-73.8336304335293,-73.833606328792,-73.8336209267452,-73.8336293118299,-73.8336350424366,-73.8336503793823,-73.8336522412148,-73.833635825799,-73.8336021277616,-73.8335771195807,-73.8335592388046,-73.8335755064209,-73.8335933921562],"lat":[40.6235949794134,40.623594280817,40.6236111739035,40.6236309876514,40.6236407607285,40.6236515369018,40.6236655040864,40.6236665907997,40.6236677513853,40.6236780416661,40.6236936855462,40.6237125385907,40.6237213263164,40.6237300820309,40.6237439860125,40.623772600371,40.6238004710318,40.6238129101908,40.6238352503737,40.6238643029961,40.6238833869823,40.6239112908645,40.6239369727435,40.6239552919114,40.623953041811,40.6239420001273,40.6239360345,40.6235979172793,40.6235949794134]}],[{"lng":[-73.862124015412,-73.8620874584394,-73.8620924186303,-73.8621267120669,-73.8621683005201,-73.8622342709098,-73.8623075528181,-73.8623368002439,-73.8623587058715,-73.8623683972524,-73.862390310594,-73.8624367145339,-73.8624904828513,-73.8625174328617,-73.8625321469116,-73.8625859342784,-73.8626080200542,-73.8626349867852,-73.8626570724888,-73.8626767923067,-73.862698698811,-73.8627720333262,-73.8627867656627,-73.862781958904,-73.8627453920016,-73.8627112804464,-73.8627650320841,-73.8627870563836,-73.8627993247553,-73.8628799082508,-73.8629165707041,-73.8629898589846,-73.863038767708,-73.8631242067206,-73.8631802930177,-73.8632217166325,-73.8632656619831,-73.8633609223538,-73.86347880947,-73.86350742741,-73.8635195844843,-73.8635195350208,-73.8634974798404,-73.8635315659003,-73.8635436894298,-73.8635411703911,-73.8635459789006,-73.8635483034932,-73.8635579688896,-73.8635969657005,-73.8636432892512,-73.8637091678756,-73.8637457392597,-73.8637773910003,-73.8637187422316,-73.8636577291184,-73.8635991952754,-73.8635382075591,-73.8634795975033,-73.8634331682966,-73.8633939421441,-73.8633938583594,-73.8634498667726,-73.8634961517186,-73.8634862960225,-73.8634349817493,-73.8633959572609,-73.8633447648866,-73.86330578239,-73.8632424063748,-73.8631765811926,-73.8631497749989,-73.8631204629701,-73.863100846776,-73.8630812411302,-73.8630258180266,-73.862973841731,-73.8629250700365,-73.8628713591559,-73.8628273471468,-73.8627638537017,-73.8627174855008,-73.8626491333771,-73.862580663177,-73.862526836891,-73.8625047624551,-73.8624777622859,-73.8624556979617,-73.8624455385797,-73.8623617467977,-73.8623041469864,-73.862235690936,-73.8621379887684,-73.8620647223128,-73.8619695801788,-73.8620870816475,-73.862077462787,-73.8620751018825,-73.862124015412],"lat":[40.62399037244,40.6239549744579,40.6239177653625,40.6238675664089,40.6238322628126,40.6238155946879,40.6238063787608,40.6238343251128,40.6238697053081,40.6239069319562,40.6239385903316,40.6239367854575,40.6239163812644,40.6238736167216,40.6238438625818,40.6238141551498,40.6237620810516,40.6237118730224,40.6236597989143,40.6236342585598,40.6236058870615,40.6235706199835,40.6235315621124,40.6234943419986,40.6234626662027,40.6234254099225,40.6234124488916,40.6233901462525,40.6233622497347,40.6233642067881,40.623349364391,40.623336427219,40.6233029917694,40.623319840053,40.6233589822717,40.6234036894182,40.6234093240931,40.6234001341358,40.6233886093158,40.6234096113863,40.6234356760672,40.6234598658473,40.6234970542061,40.6235473347593,40.6235901465953,40.6236273579811,40.6236645787342,40.6237222638841,40.6237725156082,40.6238097774313,40.6238470462561,40.6238750356995,40.6239048506157,40.6239514075582,40.6239699449859,40.623951265708,40.6239139812306,40.6238822762096,40.6238822066253,40.6238970375999,40.6239714199132,40.6240123561783,40.624090573622,40.6241464510698,40.62418923681,40.6242040619843,40.6241798251142,40.6241351070935,40.6240904023954,40.6240326446347,40.6239786047413,40.62395066218,40.6239543481019,40.6239934001984,40.6240268704074,40.6240371627014,40.6240006922026,40.6239671410071,40.6239596341461,40.6239856313849,40.623985555609,40.6239706141305,40.6239575072822,40.6240020833122,40.6240503981334,40.6240968904992,40.6241638443131,40.6242047549522,40.6242288843861,40.6242565679356,40.6242734212267,40.6243105535896,40.6243197396873,40.6243215133873,40.6242730200247,40.6241373265712,40.624064746021,40.6240256677346,40.62399037244]}],[{"lng":[-73.8458945844698,-73.8457935211543,-73.8457078351173,-73.8456222115019,-73.845517053158,-73.8454235726018,-73.8452756999025,-73.8451939218419,-73.8450925910342,-73.8449951320719,-73.8448899598636,-73.8447654539807,-73.8447461197082,-73.8447690644389,-73.8447970519189,-73.8448323230581,-73.8448441854845,-73.8448404982959,-73.8448251685962,-73.8447785733916,-73.8446696606588,-73.8445177769054,-73.8443892678519,-73.8443356972132,-73.84428413131,-73.8441790231576,-73.8441089103844,-73.844081503146,-73.8440035242233,-73.8439411158688,-73.8438359867758,-73.8438282957336,-73.8438907097327,-73.8439180902653,-73.8439260235522,-73.8439340004315,-73.8439341600177,-73.843926495388,-73.8438916327988,-73.8438139120438,-73.8437321429892,-73.8436463831987,-73.843576304234,-73.843459562042,-73.8434167524784,-73.843346708427,-73.8432844595685,-73.8432221641694,-73.8431871910034,-73.8431366615855,-73.8431094703439,-73.8430628911438,-73.8430006356072,-73.8429539601476,-73.8429423601766,-73.8429385778281,-73.8429386476541,-73.8429775914006,-73.8430242962457,-73.8430904378876,-73.8432111495434,-73.8433396639502,-73.8434449028839,-73.8435269016411,-73.8435801075551,-73.8437199090267,-73.8438910069316,-73.8440912976078,-73.8442832344089,-73.8444415931161,-73.8445957996467,-73.84474169589,-73.8448709739665,-73.8449503306274,-73.8452004227051,-73.845367040258,-73.8454502214189,-73.8453124124613,-73.8451789868127,-73.8450871066017,-73.8450993351125,-73.8452033689738,-73.8453281628692,-73.8454903848329,-73.845535798992,-73.8455397772271,-73.8454187555008,-73.8453104613489,-73.8452103969266,-73.8451642390928,-73.8452055791733,-73.8454678977559,-73.8456221509606,-73.8458012449806,-73.8458593089416,-73.8459673326214,-73.845999591347,-73.8459528172794,-73.8459068400354,-73.8458945844698],"lat":[40.6249718158164,40.6248885948126,40.6248914464517,40.6248675928199,40.6248704186702,40.6248762284045,40.6248255840025,40.6248225068092,40.6248550108273,40.6248964224661,40.6249051826058,40.6248545695733,40.6247951966605,40.6247457895071,40.6246647020553,40.6245697945746,40.6244926599704,40.6244036341133,40.6242967887334,40.6242373790237,40.6241808522199,40.6241806469087,40.6241775052618,40.6241744091759,40.624171428695,40.6241534824739,40.6241593216354,40.6242215990542,40.6242600691664,40.6243015269662,40.6242924822239,40.6242509287753,40.6242065034356,40.6241560956223,40.6240937918062,40.6240136849097,40.6239454351542,40.6238920133224,40.6238118470886,40.6237405256198,40.6237344791178,40.6237699713066,40.6237609734859,40.6237222391893,40.6237103112928,40.6236864778488,40.6236596867094,40.6236536663886,40.6236209781769,40.6235793662383,40.6235496562292,40.6234843104533,40.623460486759,40.6234366838124,40.6234010603453,40.6233535772895,40.6233239039767,40.6233239571742,40.6233358900513,40.6233626866462,40.6233687860522,40.6233689612494,40.62333052871,40.6232386530143,40.6231781641845,40.6231543510923,40.6230878696485,40.6230182506911,40.6229549737752,40.6229869570229,40.6230125802316,40.6230254846002,40.623012951875,40.622952698563,40.6229816275956,40.623048565731,40.6231376292877,40.6232327498535,40.6232357470999,40.6233023360581,40.6234230735986,40.6235089885725,40.623633052774,40.6237984668961,40.6239923159096,40.6240749187416,40.6241224090309,40.6240746104182,40.6240744757347,40.6242014876659,40.6243540320705,40.6245068736994,40.6245134346401,40.6245962729752,40.6247297781191,40.624895118865,40.6250356500322,40.625052011573,40.6250247447609,40.6249718158164]}],[{"lng":[-73.8577744101864,-73.8578735568606,-73.8579013331242,-73.8578474021551,-73.8577986915825,-73.8578138677174,-73.8578051192438,-73.8578413390383,-73.8576550876023,-73.8575330893759,-73.857334864308,-73.8573290953966,-73.8574227205988,-73.8575220044172,-73.8576734720748,-73.8577744101864],"lat":[40.6248235341474,40.6248207889991,40.624846004608,40.6249313378207,40.6249995017285,40.6250404573657,40.6250859371837,40.6251909132177,40.6253095609559,40.625262009374,40.6251456395462,40.6251169805845,40.6249752930412,40.6249104758806,40.624845722746,40.6248235341474]}],[{"lng":[-73.8404847267472,-73.8404560178746,-73.8404292362694,-73.8404027609764,-73.8403868074995,-73.8403838641029,-73.840380486999,-73.8403316018799,-73.8402741754242,-73.8402210179352,-73.8401624943099,-73.840132678584,-73.8400560618738,-73.8400188168665,-73.8399613360951,-73.8399509063907,-73.8399325670664,-73.8399027690353,-73.8398794779334,-73.8398613549117,-73.8398262935193,-73.8397880239167,-73.8397316138779,-73.8397070887422,-73.8397095126396,-73.839717654155,-73.8397410216166,-73.8397910005163,-73.8398367149886,-73.8398472750482,-73.8398386972671,-73.8398099498,-73.8397737709115,-73.8397269664689,-73.839696142918,-73.8396653384199,-73.8396154140938,-73.8395580112583,-73.8395229850707,-73.8394876479837,-73.8394670088788,-73.8394872779741,-73.8395454869679,-73.8395607673927,-73.8396214141825,-73.8396805060712,-73.839682071448,-73.8396519361172,-73.8397605253511,-73.8398220314201,-73.8398665320323,-73.8399903263649,-73.840083690532,-73.8401468370285,-73.840154539406,-73.8401698321144,-73.8402178919786,-73.8402482852745,-73.8402787370068,-73.8403041661401,-73.8404380778816,-73.8405240793374,-73.8405848416771,-73.8406052245698,-73.8406101902414,-73.8406129999231,-73.8406535189936,-73.8407212211531,-73.8407923193131,-73.840808718505,-73.8408039434837,-73.8407947777121,-73.8407890785025,-73.8408439003418,-73.8409290618351,-73.8410039168835,-73.8410746266063,-73.8411020156707,-73.8411540909223,-73.841233693773,-73.8413408447389,-73.8414370322217,-73.8415414258603,-73.8415577758545,-73.8415603698312,-73.8416345433004,-73.8416867231713,-73.8417223338065,-73.8417194765675,-73.8416589811182,-73.8416946265519,-73.8417550737014,-73.8417852404295,-73.8417906654875,-73.8417054077442,-73.841598201573,-73.8415680157531,-73.8415074192764,-73.8415072303841,-73.8415730327347,-73.8416691315994,-73.841754239893,-73.8418008464493,-73.841822621932,-73.8419268885204,-73.8420229128782,-73.8420857999955,-73.8422394167694,-73.8423817864799,-73.8423611404103,-73.8423100486586,-73.8422494007962,-73.8422247249343,-73.8421760766736,-73.8419825713118,-73.8418421351055,-73.8417549077468,-73.841686923392,-73.8416147609533,-73.8415073744778,-73.8414170393913,-73.8413415970778,-73.8412757598082,-73.841209806469,-73.8411289854834,-73.8410556696196,-73.840951508837,-73.840873945609,-73.8407804068637,-73.8406495632359,-73.840600648662,-73.840518772424,-73.8404464565166,-73.8404069872355,-73.8403696737018,-73.8403376904484,-73.8403355079327,-73.840332209226,-73.8402937777133,-73.8402564398746,-73.8402169867532,-73.8402041309526,-73.8401934115885,-73.8401646304996,-73.8401453701627,-73.8401516361425,-73.8401813429669,-73.8402345260412,-73.8402898121261,-73.8403217229434,-73.8403876762915,-73.8404301916302,-73.8404535342442,-73.8404534625207,-73.8404597843085,-73.8404884560355,-73.840550061195,-73.8406170047672,-73.8406690439082,-73.8406774729539,-73.8406656933803,-73.8406390180551,-73.8406132283396,-73.8405495439377,-73.8405112464527,-73.8404918608468,-73.8404847267472],"lat":[40.6274952885278,40.6274838962611,40.6274928301009,40.627501661832,40.6274967748121,40.627483928962,40.6274691951287,40.6274391249927,40.6274203937261,40.6273959933204,40.6273910465976,40.6273974921986,40.6273925207643,40.6273900359213,40.6273940099559,40.6273989931609,40.6274077553606,40.6274069037006,40.6273849804253,40.6273679231858,40.6273427357884,40.6273240321382,40.6273247643571,40.6273441918372,40.6273516375226,40.6273766423495,40.6273961360918,40.6274140452345,40.6274351922778,40.6274692644505,40.6274960125702,40.6275008373928,40.6274975431159,40.6274877476299,40.6274706753394,40.6274454956713,40.6274048810167,40.6273764196786,40.6273366366129,40.6273081112154,40.6272938407629,40.627257348924,40.6271805457788,40.6271209814104,40.6270787792049,40.6270824584669,40.6270327331976,40.6269750285432,40.6269290486645,40.6269168673992,40.6269080527002,40.6268332630531,40.6268237823212,40.6267911939487,40.6267354639203,40.6266701333068,40.6266163800906,40.6265664479348,40.6264915270645,40.6264069892452,40.626320680138,40.6262246937928,40.6261344385686,40.6260498936831,40.625994662748,40.625963409423,40.6258981137107,40.6258647451217,40.6258782596553,40.62591386803,40.6259432599046,40.6259996724773,40.6260854888381,40.6261378952643,40.6261401069024,40.6261330591386,40.6261591473486,40.6261947703687,40.6262471740226,40.6262765896517,40.6262746449674,40.6262622175185,40.6262644545556,40.6263209951623,40.6263858900748,40.6263880860466,40.6263965311753,40.626440538632,40.6264865857285,40.626509529115,40.6265388832048,40.6265368733138,40.626559940849,40.6265892539873,40.6266268149,40.626651786536,40.6266684497577,40.6267019005087,40.6267814433307,40.6268380525968,40.6268633042704,40.6268885400664,40.6269304695236,40.6270163237274,40.6270729851993,40.6271296345809,40.6272574105306,40.6273580979108,40.6274407862717,40.6274694948743,40.6274718578329,40.627464476739,40.6274486147448,40.6274173440341,40.6273343671925,40.6273130907396,40.6272943203865,40.627239086149,40.6271505999958,40.6271058529547,40.6270513984148,40.6270002077167,40.6269376788029,40.6269238022761,40.6268969310553,40.6268465544494,40.6267880258908,40.6267335885888,40.6266839951571,40.6266578651517,40.626639957856,40.6266090307083,40.6265862248369,40.6266242820558,40.6266509898219,40.6266736509451,40.6266963522763,40.6267401359117,40.626789547635,40.626825985077,40.6268575551964,40.6268924054656,40.6269248270202,40.6269434373398,40.6269863874346,40.6270366714182,40.6270756355563,40.6270886840878,40.6271122766051,40.6271196188255,40.6271334958615,40.6271570712511,40.6271871059034,40.627217109066,40.6272438769026,40.627270676252,40.6273226591595,40.6273673510357,40.6274136444012,40.6274493345539,40.6274801323309,40.6275084766053,40.6275289241167,40.627539166652,40.6275318151335,40.6275051154543,40.6274952885278]}],[{"lng":[-73.8687291529088,-73.8691918981228,-73.8695623896577,-73.869992900327,-73.8707590635289,-73.8710844342514,-73.8712515250932,-73.8715349498553,-73.8717588590605,-73.8719678937706,-73.8721621420211,-73.8723560849694,-73.8725500054888,-73.8727589310809,-73.8729977322284,-73.8732963093785,-73.8735351960934,-73.8739530620689,-73.8743260055674,-73.8747884518977,-73.8753552930286,-73.8757133419071,-73.8762056412654,-73.8767128563797,-73.8772498645819,-73.8775630983918,-73.8779807086464,-73.878293859901,-73.8786218875722,-73.8789646464479,-73.8792476784885,-73.8795157731661,-73.8797238960811,-73.8797531767839,-73.8797825207117,-73.8797819474835,-73.8797814766141,-73.8797810466857,-73.8797805553365,-73.8797352700206,-73.8795854787742,-73.8794805010424,-73.8793755632116,-73.8792559539565,-73.8790315676754,-73.8788819759142,-73.8786428756926,-73.8785082210804,-73.878254198493,-73.8780001748347,-73.8777909888892,-73.877477580462,-73.8772236568971,-73.8768951412764,-73.876626297179,-73.8763723697184,-73.8761332966013,-73.8758641933534,-73.8755656128396,-73.8753862716748,-73.8748138686504,-73.8664548405525,-73.8659032012413,-73.8654707843299,-73.865187862763,-73.8649798168286,-73.8648908983954,-73.8647276604543,-73.8648774518156,-73.8649819349592,-73.8652518325117,-73.8655358906139,-73.8657005929935,-73.8657011190694,-73.8658658215415,-73.8662690623231,-73.8665086032255,-73.8665093989422,-73.866375836495,-73.8661824213304,-73.8658994496943,-73.8654970664666,-73.8652293618183,-73.8650956955132,-73.865036367452,-73.8649325607174,-73.8649779588224,-73.8650083012007,-73.865068501621,-73.8651734314687,-73.8654185596023,-73.8653387669192,-73.8655038923137,-73.8656386076045,-73.865758313194,-73.8660421114301,-73.8662065447406,-73.8666095879342,-73.8668486744204,-73.8671769911555,-73.8675949696113,-73.8680575627639,-73.8682069376314,-73.8687291529088],"lat":[40.6173567850034,40.6171981709783,40.6172470924647,40.6170706440366,40.6167566195711,40.6167639983598,40.6166548670656,40.6166551841563,40.6165758625664,40.6164737904514,40.6163034970899,40.6162923447597,40.6162925599279,40.6162473228252,40.6161793836582,40.6160546723202,40.6159412624034,40.615839415733,40.6158284567228,40.6158175940294,40.6158182100695,40.6157958637291,40.6157736604281,40.6157514703475,40.6157520450454,40.6157637469553,40.6157982928784,40.6158554614284,40.6159353786905,40.6161176174877,40.6163338932321,40.6165615197965,40.6169595931841,40.6172665401394,40.617539385443,40.6178576689948,40.6181191157535,40.6183578285297,40.6186306424297,40.6189261446581,40.6192670061426,40.6195738130537,40.6198578847145,40.6200055339287,40.6203463162852,40.6205735046083,40.6208005976075,40.6210164345321,40.6212435104418,40.6214705869581,40.621652242058,40.6217201121719,40.6218903495327,40.6220605074847,40.6222307287173,40.6224009651941,40.6226053191336,40.6229119450344,40.6230252946331,40.6231956103004,40.6235871891837,40.6282553868071,40.6280615008735,40.6279359561981,40.6276628099184,40.6272533440261,40.6269576901562,40.6265255419135,40.6262301691283,40.625660706041,40.6255372045954,40.6252419882165,40.6249466312624,40.6246851842486,40.6243898275457,40.6241743193655,40.623754008018,40.623356154369,40.623003613142,40.6227419416624,40.6225028982591,40.6222978180387,40.6218882820313,40.6215925761807,40.6214219965638,40.6211149588849,40.6207967274223,40.6205466831577,40.620285306081,40.6200353492825,40.6198360278927,40.6194217102809,40.6189103752017,40.6186831874848,40.618501449958,40.6183199048115,40.618149586943,40.6180136483379,40.6178093141079,40.6177414901789,40.6175941975244,40.6175151583161,40.617413024548,40.6173567850034]}],[{"lng":[-73.8481397702266,-73.848185394944,-73.8483144988127,-73.8484068666603,-73.8484336046341,-73.8484555042687,-73.8484722569827,-73.8484836267158,-73.8484839771036,-73.8484788997307,-73.8484684824963,-73.8484400625001,-73.8484064606528,-73.8483683427021,-73.8481259367432,-73.8481004553481,-73.8480535049012,-73.8481397702266],"lat":[40.6285427045882,40.6285182938955,40.628541138998,40.6285689778093,40.6285988762892,40.6286309780194,40.6286648306746,40.6286999572573,40.6287314363124,40.6287626779133,40.6287931411615,40.6288227865722,40.6288490980282,40.6288715542207,40.6288404448054,40.6287967360251,40.6286735874904,40.6285427045882]}],[{"lng":[-73.8485199356512,-73.8484981956066,-73.8484755183415,-73.8484556262791,-73.8484399039566,-73.8484260478847,-73.848418209256,-73.8484173147326,-73.8484247441954,-73.8484247834146,-73.8484299157886,-73.8484327410127,-73.8484484929209,-73.848475795188,-73.8484998554826,-73.848525270291,-73.8485432625727,-73.8485765465696,-73.8486103146725,-73.8486366973171,-73.8486575465376,-73.8486843780153,-73.8486912754748,-73.8486898366095,-73.8486888680236,-73.8486976230646,-73.8487008332151,-73.8486970996923,-73.8486938161749,-73.8487039363097,-73.8486937426674,-73.8486803362776,-73.8486622993835,-73.8486442710626,-73.8486290200261,-73.8486105197676,-73.8485911045206,-73.8485712325826,-73.8485583016502,-73.8485402813453,-73.8485199356512],"lat":[40.6305610242755,40.6305606438206,40.6305658993052,40.6305665778821,40.6305640901283,40.6305549092065,40.6305443264611,40.6305305810464,40.6305179038802,40.6305006358944,40.630481611884,40.6304594135107,40.630448861863,40.6304439644571,40.6304404723609,40.6304524873431,40.6304736558686,40.6304825105538,40.630482202038,40.6304751886663,40.630460062121,40.6304590401613,40.6304770232427,40.6304995752574,40.6305189565695,40.6305337697685,40.6305461084728,40.6305605527565,40.6305802835029,40.6306056707415,40.6306127059367,40.6306095164695,40.6306080829745,40.6306027727027,40.6305967624632,40.6305960326413,40.6305903682217,40.6305818841892,40.6305730569826,40.6305642224003,40.6305610242755]}],[{"lng":[-73.853000146445,-73.8530168208518,-73.8530288908026,-73.8530360467788,-73.8530381052772,-73.8530350135151,-73.8530268507833,-73.8530138264124,-73.8529962744038,-73.8529746448645,-73.8529494924643,-73.8529214622115,-73.8528939888105,-73.8528691487434,-73.852847551428,-73.8528297267239,-73.8528161119333,-73.852807041073,-73.8528027366796,-73.8528033043503,-73.8528087301529,-73.8527872445,-73.8527578318799,-73.8527207276679,-73.8526762287829,-73.852624691311,-73.8525665276556,-73.8525022032373,-73.8524322327693,-73.8523571761391,-73.8522776339279,-73.8521942426059,-73.8521076694391,-73.8520186071508,-73.8519277683793,-73.8518818675454,-73.8518367333023,-73.8517937345952,-73.851754175596,-73.8517192561457,-73.8516900353626,-73.8516673995187,-73.8516520351588,-73.8516444082786,-73.8516753049462,-73.8517147353434,-73.8517622968948,-73.8518175040159,-73.8518797930721,-73.8519485281323,-73.8520230074622,-73.852102470688,-73.8521861065591,-73.8522400822719,-73.8522961057107,-73.8523532032925,-73.8524103827683,-73.852466650466,-73.8525210285578,-73.8525725720525,-73.8526203852167,-73.8526636371409,-73.852844548361,-73.8530287074291,-73.8532160031971,-73.85334176026,-73.8534688111903,-73.8535040256802,-73.8535419350678,-73.85358160589,-73.8536220613104,-73.8536623051719,-73.8537013465274,-73.8537382240402,-73.8537720296565,-73.8538019309652,-73.853827191695,-73.8538957346024,-73.8539659753895,-73.8541102263093,-73.8542606582511,-73.8544169176162,-73.8545786371135,-73.8547454366229,-73.8549169240886,-73.8550926964404,-73.8552723405407,-73.8554554341556,-73.8556415469466,-73.855830241482,-73.8560210742645,-73.8562135967734,-73.856407356518,-73.856601898101,-73.8567967642884,-73.8569914970835,-73.8571856388028,-73.8573787331518,-73.8575703262963,-73.8577599679293,-73.8578789782846,-73.8579935679069,-73.8581031692508,-73.8582072394726,-73.8583052631187,-73.8583967546784,-73.858481260989,-73.8585583634798,-73.8585507561771,-73.8585352656181,-73.8585119833375,-73.8584810469274,-73.8584426392237,-73.8583969872267,-73.8583443607593,-73.8582850708728,-73.8582376342226,-73.8581954826286,-73.8581595507892,-73.858130635486,-73.8581093779158,-73.8580962494712,-73.8580915412864,-73.8580953577805,-73.8581338205999,-73.8581648803138,-73.8581883211747,-73.8582039803499,-73.858211749053,-73.8582115733006,-73.8582034542873,-73.8581874483789,-73.8581636667209,-73.8581171737965,-73.8580628578278,-73.8580009045881,-73.8579315259796,-73.857854959309,-73.857771466476,-73.8576813330772,-73.85758486743,-73.8575356796427,-73.8574825628283,-73.8574262617726,-73.8573675659117,-73.8573072982629,-73.8572463038838,-73.8555643706512,-73.8555243347113,-73.855482139265,-73.8554389863815,-73.8553961054056,-73.8553547179356,-73.855316003024,-73.8552810635888,-73.8552508949941,-73.8552263566941,-73.8552081477486,-73.8551967869075,-73.8551925978317,-73.8551956998717,-73.855175726918,-73.8551482299439,-73.855113393551,-73.8550714516221,-73.8550226857518,-73.854967423356,-73.854906035474,-73.854838934277,-73.8547665703014,-73.8546303890244,-73.8544901004211,-73.8543461721584,-73.8541990840397,-73.8540493264051,-73.8538973984963,-73.8537438067922,-73.8535890633193,-73.8534336839455,-73.8532781866585,-73.8531230898396,-73.8529689105346,-73.8528161627297,-73.8526653556376,-73.8525169919997,-73.8524611157175,-73.8524124745414,-73.8523716891286,-73.8523392798908,-73.8523156603543,-73.8523011318843,-73.8522958798405,-73.8522999712134,-73.8523133537706,-73.8523358567245,-73.8524109408927,-73.8524927681485,-73.8525812617132,-73.8526763385589,-73.8527779094866,-73.85288587921,-73.853000146445],"lat":[40.6320228422534,40.6320018865053,40.6319791716816,40.6319552802842,40.6319308249862,40.6319064329211,40.6318827296001,40.6318603228714,40.631839787333,40.6318216495975,40.6318063747879,40.6317943546103,40.6317831509683,40.631768816393,40.6317517025651,40.6317322293503,40.6317108744986,40.6316881619227,40.631664648845,40.6316409121264,40.6316175341139,40.6315492202513,40.6314826424908,40.6314183335698,40.6313568080696,40.6312985582983,40.6312440503509,40.6311937203808,40.6311479711098,40.6311071686057,40.6310716393535,40.6310416676436,40.6310174932966,40.6309993097451,40.6309872624857,40.6309869529355,40.6309805809221,40.6309683397121,40.6309506005878,40.6309279015857,40.6309009311773,40.6308705073869,40.6308375529804,40.6308030674768,40.6307374481594,40.6306745391819,40.6306149827934,40.6305593870143,40.6305083194293,40.6304623013925,40.630421802706,40.6303872368233,40.6303589566292,40.6303443798045,40.6303353388981,40.6303319910241,40.6303343943623,40.630342507147,40.6303561883933,40.6303752003467,40.6303992126145,40.6304278079075,40.6305302196523,40.6306292145633,40.6307247328853,40.6307860721183,40.6308458438147,40.6308610798918,40.6308719314318,40.6308781312312,40.6308795266288,40.6308760832649,40.6308678859275,40.6308551364642,40.630838148812,40.6308173412668,40.6307932261837,40.6307396390503,40.6306873437152,40.6305875147269,40.6304931296478,40.6304044103195,40.6303215652663,40.6302447892047,40.6301742625863,40.6301101511736,40.6300526056508,40.6300017612695,40.629957737531,40.6299206379057,40.6298905495898,40.6298675433005,40.6298516731101,40.6298429763184,40.6298414733658,40.6298471677846,40.6298600461911,40.629880078317,40.6299072170805,40.6299413986966,40.6299860943859,40.6300370565586,40.6300940328112,40.6301567409534,40.6302248704052,40.6302980837351,40.6303760183309,40.6304582881956,40.6305366888904,40.630614412617,40.6306909999626,40.6307659982299,40.6308389641129,40.6309094663173,40.63097708811,40.6310414297827,40.6310658463608,40.631095358984,40.6311293132245,40.6311669561629,40.6312074530831,40.6312499059818,40.6312933734809,40.631336891702,40.6314034051945,40.6314721277082,40.6315425819327,40.6316142785284,40.6316867195254,40.6317594017817,40.6318318204782,40.6319034726246,40.6319738605534,40.6320768409277,40.6321775743593,40.6322757162514,40.6323709308711,40.632462892498,40.6325512865384,40.632635810602,40.6327161755363,40.6327437209531,40.6327666436903,40.6327846223316,40.6327974047855,40.6328048118196,40.6328067395743,40.6328198029409,40.6328074373556,40.6328003776622,40.6327988249778,40.6328028235357,40.6328122594244,40.6328268638331,40.6328462207092,40.6328697786109,40.6328968664162,40.6329267124415,40.6329584664254,40.632991223751,40.6330240512165,40.6330946877915,40.6331638414423,40.6332310478466,40.6332958557551,40.6333578300219,40.6334165545258,40.6334716349652,40.6335227015049,40.6335694112606,40.633626624383,40.6336777545481,40.6337226313049,40.6337611050488,40.6337930475208,40.6338183522345,40.6338369348321,40.6338487333647,40.6338537084996,40.6338518436513,40.6338431450366,40.633827641654,40.6338053851872,40.6337764498322,40.6337409320505,40.6336944673231,40.6336434981429,40.6335886748902,40.6335306971228,40.6334703046488,40.6334082680867,40.6333453790315,40.6332824399539,40.6332202539607,40.633159614547,40.6329909545053,40.6328241249912,40.6326592824388,40.6324965814183,40.6323361744904,40.6321782120636,40.6320228422534]}],[{"lng":[-73.8840472614938,-73.882632484334,-73.88313893883,-73.8836923157159,-73.8851295402378,-73.8857216703731,-73.8860111664062,-73.8860833204875,-73.8861570802403,-73.8862318125812,-73.8863068760785,-73.8863816264579,-73.886455422133,-73.8865276297122,-73.887526737062,-73.8882846126345,-73.8904229974356,-73.8914872074832,-73.893005588644,-73.8930739019846,-73.8931195160797,-73.8931894260757,-73.8932684545068,-73.8934492537216,-73.893518783167,-73.8939491170406,-73.8945279313366,-73.8946467070627,-73.8947616990121,-73.8948726026422,-73.8949791242407,-73.8951879785758,-73.8953361247067,-73.8954846797204,-73.8955337061117,-73.8955595573055,-73.8955219701346,-73.8955139976167,-73.8955223772904,-73.8955767262188,-73.8956204310028,-73.8956660187321,-73.8957261268837,-73.8958310834572,-73.8962579773043,-73.8958748912299,-73.8957622250945,-73.8956816844572,-73.89558588818,-73.8954715046768,-73.8953636929985,-73.8952496934687,-73.8951632926857,-73.8950321037624,-73.8949051955448,-73.8947293509273,-73.8946013353659,-73.8944552643118,-73.8942383881476,-73.8941001952536,-73.8939559679226,-73.8937697128522,-73.8935835752479,-73.8933501530381,-73.8930497455622,-73.8928333280948,-73.8924879958441,-73.8921705698979,-73.8918341140108,-73.8912129976544,-73.8883663017257,-73.8880542078172,-73.887536129845,-73.8873108861771,-73.8871355924869,-73.886902124809,-73.8866990060801,-73.8865099810516,-73.886340592969,-73.8861162792192,-73.8859254520789,-73.8855475083986,-73.8854652995816,-73.8853713558031,-73.8852702895132,-73.8851682536885,-73.885071781629,-73.8849864586851,-73.8849159404165,-73.8848547180938,-73.8848030491185,-73.8847648202445,-73.8847426687268,-73.8847373797384,-73.8847407940681,-73.8847593778489,-73.8847268487133,-73.8847364113229,-73.8847426643222,-73.8847385226749,-73.8847137670356,-73.884668162112,-73.8846020439878,-73.8845162081575,-73.8844119453547,-73.8842909604013,-73.8841553029174,-73.8838199042828,-73.8837245750953,-73.8834823178755,-73.8834487815581,-73.8825543035618,-73.8813262524205,-73.8811916137202,-73.8810800672583,-73.8809570243761,-73.8808553316143,-73.880743765109,-73.8806568100395,-73.8805173569765,-73.8804057727442,-73.8802941853155,-73.8801210453158,-73.879975459385,-73.8795299405538,-73.8794340175015,-73.8793404042684,-73.8792563256351,-73.8791695596886,-73.8791451427625,-73.8790799104255,-73.8790173117542,-73.8789535877491,-73.8789370872557,-73.8787003914134,-73.8786386390807,-73.8785339777289,-73.8783840233021,-73.8785566670694,-73.8785803423816,-73.87841750135,-73.8778095267733,-73.877144348686,-73.877493816927,-73.8779388963426,-73.8781371779873,-73.8782059048978,-73.8783334958633,-73.8785654291765,-73.8787277618309,-73.8789045527894,-73.8791833562457,-73.87936895387,-73.8797120639606,-73.8799876750384,-73.8801846834287,-73.8802328219403,-73.880376294891,-73.880933201223,-73.8812706810454,-73.8814449590912,-73.8816219773807,-73.8816303732891,-73.8817821476964,-73.8819789199706,-73.8820858308973,-73.8821589950239,-73.882569451828,-73.8827268494473,-73.8830136210351,-73.8832218127964,-73.8834526563568,-73.8836445172823,-73.8837550166025,-73.8837693279638,-73.8834541292338,-73.8840472614938],"lat":[40.6295601185465,40.6282742731269,40.627932651807,40.6275593734115,40.6288272586714,40.6284467152238,40.6286458835711,40.6286616516539,40.628672264541,40.6286776311416,40.6286777053938,40.6286724866603,40.6286620197339,40.6286463944525,40.6283318244825,40.6278924602235,40.6262785987977,40.6244817224152,40.6233564685934,40.6233566134023,40.6233956763061,40.6234052048171,40.6234141510446,40.6233466380991,40.6233526928488,40.6231853014206,40.6228859795138,40.6228322691382,40.6227739739439,40.6227112483238,40.6226442584046,40.622501020503,40.6224705702292,40.6224855683745,40.6225139189487,40.6225402523437,40.6225772822784,40.622585138838,40.622619583186,40.622654589642,40.6226762846161,40.6226733726317,40.6226670384533,40.622687011909,40.6229028460825,40.6234325659253,40.6235995711791,40.6237012338742,40.6238221439521,40.6239600256484,40.6240767695628,40.6241897934552,40.6242781414487,40.6244106375749,40.6245330128578,40.624682644705,40.6247905980889,40.6249099531853,40.6250815553665,40.6251820340768,40.6252947006402,40.6254210421054,40.6255473215584,40.6257018950258,40.6258952012101,40.6260344630684,40.6262566961515,40.6264614194652,40.626680605523,40.6270840111824,40.6289162349389,40.6290361258462,40.6292890808949,40.6293990570893,40.629453600378,40.6295262501616,40.6295593785202,40.6295902142316,40.6295902000275,40.6295901762479,40.6295609280354,40.6294629811594,40.6294290197829,40.6294067547319,40.6293991838171,40.6294077575985,40.6294319257387,40.6294692415527,40.6295160349859,40.6295577015887,40.62960934251,40.6296687904851,40.629732800961,40.6297976078495,40.6298177865945,40.6299221637511,40.6300152334118,40.6301184614918,40.6301859516969,40.6303594962852,40.6305338211574,40.6307068009622,40.6308762579708,40.6310401202817,40.6311964362661,40.6313435127016,40.631479931125,40.6318016911699,40.6318898090714,40.6321024657081,40.632232088569,40.6330044006804,40.634263210453,40.6344241559521,40.6345549765454,40.634708234642,40.6348278444788,40.6349686418916,40.635082035605,40.635256474768,40.6354059975606,40.6355642563578,40.6358084951236,40.636026079762,40.6367354751942,40.6369026640831,40.6370746548416,40.6372291053996,40.6374049392746,40.6374544066025,40.6375865973655,40.6377134505503,40.6378357011734,40.6378673460452,40.6383377247465,40.6382936062603,40.63816625608,40.6379041080905,40.637613120581,40.6375187565935,40.6374574871673,40.6368818642752,40.6359764980076,40.6353904239771,40.6350195711393,40.6346947318909,40.6345729436626,40.6344804179453,40.6343394650762,40.634251388647,40.6341158824162,40.6340148260288,40.633908015784,40.6336900848251,40.633514883481,40.6333096385907,40.6332268905214,40.6329802623633,40.6325870617929,40.6323691191611,40.6323050961165,40.632297105614,40.6322967272664,40.6322498009729,40.6321729589996,40.6320789043053,40.632006215385,40.6318183058851,40.6317671049003,40.6316261495354,40.63144231259,40.631155772113,40.6309433121386,40.6305564380126,40.6302217613424,40.6299076704375,40.6295601185465]}],[{"lng":[-73.8463845890998,-73.8464203814143,-73.8464563237132,-73.8464914591734,-73.846524852451,-73.8465556145821,-73.8465829266478,-73.8466060615757,-73.8466244034944,-73.8466374641293,-73.8466448957997,-73.8466465006745,-73.8466367224908,-73.8466357883211,-73.8466437016874,-73.8466604323453,-73.8466859164009,-73.8467200565543,-73.8467627224724,-73.8468137512864,-73.8468729482141,-73.8469181745619,-73.846961144185,-73.847019372374,-73.8470720889704,-73.8471189141,-73.8471595103464,-73.8471940043556,-73.8472365518028,-73.847286715006,-73.8473439779477,-73.8474077515839,-73.8474773799033,-73.8475521466751,-73.8475786667478,-73.8475994527212,-73.8476139308869,-73.8476217016405,-73.847622550511,-73.8476164540783,-73.8476035806195,-73.8475842854629,-73.8475862200991,-73.8475965937464,-73.8476153208969,-73.8476422472095,-73.8476771507818,-73.8477197439801,-73.8477696758097,-73.8478265348078,-73.8478898524346,-73.8479591069345,-73.8480337276351,-73.84811309965,-73.8481965689454,-73.8482834477288,-73.8483730201164,-73.8484645480311,-73.848516413595,-73.8485657631997,-73.8486116045834,-73.8486530160258,-73.8486891648813,-73.848719324321,-73.8487428879465,-73.8487593819823,-73.8487684748007,-73.8488547437259,-73.8489452713283,-73.8490395187477,-73.8491369249848,-73.8492369102404,-73.849338879366,-73.8494422254061,-73.8495463332104,-73.8496505830951,-73.8497543545307,-73.8498570298351,-73.84995799785,-73.8499937757455,-73.8500247019529,-73.850050002804,-73.8500690453544,-73.8500813532177,-73.8500866184841,-73.850084709424,-73.8500756737845,-73.8500328920983,-73.8499989222518,-73.849973795419,-73.8499575346823,-73.8499501550115,-73.8499516632491,-73.8499465345734,-73.849933157282,-73.8499115790425,-73.8498818767696,-73.8498441563516,-73.8497985522731,-73.8497452271359,-73.8496843710797,-73.8496162011045,-73.8495409602967,-73.8494589169629,-73.849370363673,-73.8492756162171,-73.8491750124797,-73.8490969721738,-73.849025733165,-73.8489615569053,-73.8489046789315,-73.8488553080005,-73.848813625323,-73.848779783898,-73.8487539079508,-73.8487360924767,-73.8487197237944,-73.8486946612738,-73.8486609366215,-73.8486185925288,-73.8485676826173,-73.8485082713719,-73.8484404340593,-73.8483642566323,-73.8482798356219,-73.8481872780148,-73.8481317700251,-73.8480685565381,-73.8479978590669,-73.8479199253567,-73.8478350285176,-73.847743466067,-73.8476455588874,-73.8475416501022,-73.8474321038725,-73.8473173041217,-73.8471976531893,-73.8470735704208,-73.846945490698,-73.8468138629145,-73.8466791484023,-73.8465963609227,-73.8465147506552,-73.846435241731,-73.8463587344842,-73.8462860952565,-73.8462181465859,-73.8461556578927,-73.8460993367663,-73.8460498209527,-73.8460076711334,-73.8459733645766,-73.8459472897336,-73.8459297418408,-73.8459170879623,-73.8458987748053,-73.8458691874397,-73.8458315449401,-73.8457860037775,-73.8457327532462,-73.845672014677,-73.8456040405167,-73.8455291132789,-73.8454475443692,-73.8453596727913,-73.8452658637375,-73.8451665070714,-73.8450620157074,-73.8449528238946,-73.8448690182269,-73.8447872807118,-73.8447080787966,-73.8446318654259,-73.8445590764514,-73.8444901281391,-73.8444294694815,-73.8443728187804,-73.8443204594247,-73.8442726533341,-73.8449184334688,-73.8450180413497,-73.845123322149,-73.8452338463697,-73.8453491631288,-73.8454688019961,-73.8455922749135,-73.8457190781853,-73.8458486945332,-73.8459805952054,-73.8461142421337,-73.8462490901281,-73.8463845890998],"lat":[40.6352857676889,40.6352887022148,40.6352871636155,40.63528119285,40.6352709488668,40.6352567043715,40.6352388385679,40.6352178270622,40.6351942292021,40.6351686731861,40.63514183934,40.6351144420059,40.6350055591375,40.634896424068,40.634787453308,40.6346790627391,40.6345716660266,40.6344656730409,40.6343614882931,40.6342595093918,40.6341601255251,40.634131635722,40.6341011860269,40.634053563052,40.63400234938,40.6339479140676,40.6338906493865,40.633828743569,40.63376981796,40.6337144786939,40.633663295013,40.6336167934122,40.6335754522238,40.6335396966972,40.633514995242,40.633487289684,40.6334573447273,40.6334259868848,40.6333940816653,40.6333625096848,40.6333321423601,40.6333038178574,40.6332328530637,40.6331623143081,40.6330927828459,40.6330248316306,40.6329590205922,40.6328958920236,40.6328359661125,40.6327797366548,40.6327276669859,40.6326801861634,40.6326376854314,40.6326005149973,40.6325689811461,40.6325433437168,40.6325238139616,40.6325105528055,40.6324998096727,40.6324835856754,40.6324622070267,40.6324361035832,40.6324058002011,40.6323719061836,40.6323351030285,40.6322961307259,40.6322557728793,40.632211150738,40.6321717283762,40.63213774045,40.6321093892679,40.6320868435858,40.6320702376033,40.6320596701649,40.6320552041714,40.6320568662059,40.6320646463753,40.6320784983697,40.6320983397373,40.6321196204147,40.6321449326074,40.6321736430955,40.6322050336452,40.6322383189759,40.6322726664053,40.6323072166798,40.6323411054698,40.6325625617935,40.6327849026387,40.6330079245412,40.6332314234114,40.6334551947214,40.6336790336917,40.6337844268299,40.6338893988161,40.6339935752979,40.6340965847585,40.6341980598408,40.6342976386585,40.6343949660859,40.634489695025,40.6345814876434,40.634670016579,40.6347549661078,40.6348360332703,40.6349129289512,40.6349853789119,40.6350691492613,40.6351563657852,40.6352467084264,40.6353398456542,40.6354354356815,40.6355331277184,40.6356325632597,40.6357333774005,40.6358352001749,40.6360214453583,40.6362071284982,40.6363920141501,40.636575867879,40.6367584565563,40.6369395486554,40.6371189145459,40.6372963267843,40.6374715604026,40.6376443931938,40.6377448416871,40.6378426119498,40.6379373613233,40.6380287577353,40.6381164808632,40.6382002232573,40.6382796914185,40.6383546068265,40.6384247069171,40.6384897460017,40.6385494961292,40.6386037478848,40.6386523111239,40.6386950156392,40.6387317117571,40.6387266328005,40.6387148811444,40.6386965898612,40.6386719660761,40.6386412886215,40.6386049048792,40.638563226847,40.6385167264721,40.6384659303075,40.638411413549,40.6383537935212,40.6382937226874,40.6382318812609,40.6381508309199,40.6380704104184,40.6379744475692,40.6378801363866,40.6377878688151,40.6376980283047,40.6376109882172,40.6375271102749,40.6374467430576,40.637370220554,40.6372978607738,40.6372299644265,40.6371668136717,40.6371086709468,40.6370557778766,40.6370373452191,40.6370141407369,40.6369862971345,40.6369539736466,40.6369173551279,40.6368766509955,40.6368350908267,40.6367903683255,40.6367427072178,40.6366923459296,40.6357509449138,40.6356808214314,40.6356156851685,40.6355558018408,40.6355014157352,40.6354527487123,40.6354099993023,40.6353733418948,40.6353429260279,40.6353188757781,40.6353012892543,40.6352902381976,40.6352857676889]}],[{"lng":[-73.8732703125524,-73.8730981560066,-73.8729732073257,-73.8727563570499,-73.8719488011655,-73.8718943983012,-73.8711789731836,-73.8708810717364,-73.8708450342227,-73.8706175271154,-73.8704357830426,-73.8700854422443,-73.8700795840702,-73.8698958338615,-73.8697775375914,-73.8695243518936,-73.8685978009536,-73.8680885710802,-73.8679970966813,-73.8686067398552,-73.8692669169379,-73.8696097213656,-73.8696156933926,-73.869624894667,-73.8696954981895,-73.8692084611064,-73.869559024903,-73.8697633366665,-73.8699705906323,-73.870180624162,-73.8702530857081,-73.8704296930409,-73.8706079590496,-73.8711864960206,-73.8716724430034,-73.8724346083404,-73.8725533712021,-73.8726766014874,-73.872803774841,-73.8729343501329,-73.8730677717611,-73.8732034720147,-73.8733408734895,-73.8734793915441,-73.8736801218665,-73.873877672926,-73.8740717829886,-73.8742621948765,-73.8744486563086,-73.8746309202352,-73.8748087451643,-73.8749818954824,-73.875150141766,-73.8753132610856,-73.8754710373013,-73.8756231352192,-73.8757823816996,-73.8759485961947,-73.8761215902503,-73.8763011677193,-73.8769261891869,-73.8769830257084,-73.8770458980016,-73.8771142848463,-73.8771876193009,-73.8772652934034,-73.8773466632113,-73.8774310541404,-73.877517766558,-73.8776060815833,-73.8777281390406,-73.8778502268274,-73.8779719717465,-73.8780930016485,-73.8782129465692,-73.8783507656265,-73.8784158941397,-73.8779734133435,-73.8775289455008,-73.8773424827109,-73.877096271282,-73.8768334902356,-73.876548599704,-73.8762191253342,-73.8761993303292,-73.8761776706062,-73.8761608741758,-73.8759630900538,-73.8754586187918,-73.8753064636552,-73.8749535774166,-73.8745808100912,-73.873901277361,-73.873860340091,-73.8738216037815,-73.8737570902775,-73.8736728495642,-73.8736026528691,-73.8735246246315,-73.8734535281798,-73.8734233708269,-73.8733574021275,-73.8733067800077,-73.8731859333095,-73.8733137831294,-73.8733563817569,-73.8733907484653,-73.8734167680294,-73.8734343532218,-73.8734434451045,-73.8734440132268,-73.8734360557261,-73.873419599334,-73.8733946992859,-73.8733614391354,-73.8733199304731,-73.8732703125524],"lat":[40.6439032143449,40.6439346840435,40.6438392310653,40.6432489646548,40.6423940845388,40.6422482367275,40.6412059067585,40.6407718707525,40.6405566201832,40.6403862786639,40.6402908073794,40.6398441813663,40.639211694017,40.6389345294222,40.6388441456585,40.6386457019187,40.6383495665783,40.6381856142803,40.6381152652097,40.637743362595,40.6373114813096,40.6370855346088,40.6370905648955,40.637083191837,40.6371473896151,40.637465809261,40.6379474843275,40.6378652802738,40.6377874680958,40.6377141088513,40.6376900452316,40.6376340015056,40.6375810932792,40.6373089865557,40.637080424393,40.6365485192002,40.6364933651174,40.636444226944,40.6364013137635,40.6363648081716,40.6363348654994,40.6363116131528,40.6362951500701,40.6362855463014,40.6363493166598,40.6364186099535,40.6364933343796,40.6365733909398,40.6366586735711,40.6367490692861,40.636844458323,40.636944714304,40.6370497044027,40.6371592895198,40.6372733244677,40.6374370028935,40.6375966872206,40.6377521963538,40.6379033539322,40.6380499885283,40.6384967845992,40.6385493081062,40.6385976757656,40.638641486593,40.6386803773809,40.63871402571,40.6387421526227,40.6387645249356,40.6387809571731,40.6387913131052,40.6387883236764,40.638790477641,40.6387977684149,40.6388101737115,40.6388276556105,40.6388716137451,40.6389121892042,40.6398071177214,40.6407168001053,40.6410826809833,40.6416029545283,40.6421185898394,40.6426389282807,40.6432221341946,40.6432571730929,40.6432896590227,40.6433205280068,40.6436444842541,40.6444269313803,40.6446556691015,40.6451415836971,40.6456101054833,40.6463683678613,40.6463144060991,40.6462565314282,40.646160143301,40.6460679791433,40.6459666291909,40.6458712290682,40.6457528149191,40.645650703595,40.6455944759142,40.6455826795916,40.6454450133617,40.6452220887127,40.6451147145336,40.6450056420587,40.6448952371167,40.6447838700036,40.6446719142408,40.6445597453218,40.6444477394535,40.6443362722938,40.6442257176921,40.6441164464353,40.6440088250043,40.6439032143449]}],[{"lng":[-73.8583760531767,-73.8571697829821,-73.8574134314292,-73.8576606712952,-73.8579112270487,-73.8581648194661,-73.8584211659423,-73.8586799808055,-73.8589409756355,-73.8592038595848,-73.8594683397022,-73.8597341212596,-73.8600009080795,-73.8602684028652,-73.8605284136249,-73.8607878455916,-73.8610465336103,-73.8613043130001,-73.861561019659,-73.8617875573481,-73.8620130102775,-73.8628946322439,-73.8633113893912,-73.8637986577751,-73.8643939396158,-73.8650936239441,-73.8653117366513,-73.8667041197378,-73.8661992807425,-73.8662847677707,-73.8668152820125,-73.8670299440306,-73.8673229107271,-73.8686728289509,-73.8699123933943,-73.8700170827358,-73.8706149246106,-73.8711710894152,-73.8711917294955,-73.8715717418369,-73.8719847673392,-73.8721220285791,-73.8725704310289,-73.873378282878,-73.8734250885653,-73.8734655825853,-73.8734002412763,-73.8728165793136,-73.8721847326651,-73.8713166100128,-73.8711645285202,-73.8701856522754,-73.8699327052746,-73.8696177059267,-73.8693844004147,-73.8691753364724,-73.8688921986943,-73.8688236145514,-73.8684816771708,-73.8683003031427,-73.8679313096204,-73.8675581768578,-73.8673016789663,-73.8672402628091,-73.8670922526893,-73.8669524199474,-73.8665377371266,-73.865781613718,-73.8657814362307,-73.8630437576723,-73.862415662489,-73.8605783620238,-73.8605407788259,-73.8604959572287,-73.86001322825,-73.8599126509162,-73.8590215495896,-73.8572233098447,-73.8574324941972,-73.8575526806712,-73.8575933542786,-73.8577054207763,-73.8578346941633,-73.8583760531767],"lat":[40.6472744153135,40.643678558886,40.6435934965675,40.6435146765377,40.6434421866322,40.6433761076323,40.6433165131747,40.6432634696698,40.6432170362277,40.6431772645921,40.6431441990833,40.6431178765482,40.6430983263195,40.6430855701834,40.6430705946755,40.6430506274423,40.6430256811952,40.642995771815,40.6429609183419,40.6429259048613,40.6428870410201,40.6425506796825,40.6422991290286,40.6417995776692,40.6414136062164,40.6409396756942,40.6407511914438,40.6400217634955,40.6395368333038,40.6394728836932,40.6399635276668,40.6398510690214,40.6398719839529,40.6409250792034,40.6432782029936,40.6440713724055,40.6448567418868,40.6452893035611,40.6453053568151,40.6454149623349,40.6454458718156,40.6454237038645,40.6455756123597,40.6467152052675,40.6467812305159,40.6468166334718,40.6468810876709,40.6474157972005,40.6479450700283,40.6485883154056,40.6486871358636,40.6493231823679,40.64947579544,40.6496539930983,40.6497848796895,40.6498963066432,40.6500492524762,40.6500856936291,40.6502673752048,40.6503651351014,40.6505611782635,40.6507561620547,40.6508927806821,40.6509254890873,40.6510100211849,40.6510793881619,40.6513027581793,40.6517059233221,40.6517060219567,40.6532094155741,40.6535648293056,40.654675329646,40.6546239961079,40.654558824478,40.6539734258613,40.6538402372783,40.6526601758645,40.6502786700388,40.6501582850791,40.6499325759654,40.6493972858929,40.6487459714673,40.6483023382877,40.6472744153135]}]],[[{"lng":[-73.9713963168815,-73.9712103909894,-73.9708411379564,-73.9707697608326,-73.9705455439065,-73.9703167705145,-73.9700889779307,-73.9698846467177,-73.9696861180754,-73.969484681379,-73.969399030656,-73.9689146112439,-73.9687909917334,-73.9687221844786,-73.968223433854,-73.968038684878,-73.9676273629279,-73.9682199904168,-73.9683812728676,-73.968999222299,-73.9698686933957,-73.9708756759865,-73.9719042708228,-73.9721614589298,-73.9723112916953,-73.9724148165127,-73.9725572159544,-73.9736539980313,-73.9745825640536,-73.9755101590261,-73.9764334217983,-73.9776164223733,-73.9771651199467,-73.9770709895754,-73.9769984892818,-73.9768496430902,-73.976696043719,-73.9765777562319,-73.9765334489562,-73.9765146210018,-73.975899627138,-73.9753718443551,-73.9744212241826,-73.9735315201505,-73.9725816536227,-73.9714862572631,-73.9713731442201,-73.9712075045825,-73.9709595094521,-73.970391871602,-73.9698376240615,-73.9687609035355,-73.9678341520123,-73.9669062964746,-73.9659068688001,-73.9658856448401,-73.9656256507117,-73.9651725895604,-73.9649455754421,-73.9647198338556,-73.9642679833937,-73.9638893557891,-73.9638114523662,-73.9637541865893,-73.9636224548921,-73.963564705592,-73.9633609408921,-73.9628597396146,-73.9623794782476,-73.9633709296116,-73.9642964996393,-73.9652237806769,-73.9662983547991,-73.9673997951279,-73.9676863568787,-73.9678067633597,-73.9679216879961,-73.9690408663949,-73.9699656611014,-73.9708953837774,-73.9719151872532,-73.972994339389,-73.9730265604729,-73.9732177484846,-73.9734837349883,-73.9737060382879,-73.9739470935797,-73.9739931946138,-73.9740567930897,-73.9741225370718,-73.9741824018726,-73.9742285162174,-73.9742562563154,-73.974265609942,-73.9748929575664,-73.9749726459846,-73.9768267894513,-73.9790579579084,-73.9812863830633,-73.9827363580095,-73.9834887256461,-73.9856935782417,-73.9878509553418,-73.9900935605129,-73.9925497361658,-73.9939819708341,-73.9947348567926,-73.9951180672689,-73.9954933816905,-73.995858841457,-73.9962125404841,-73.9965527313994,-73.9968777841972,-73.9971817527544,-73.9983141752881,-73.9993952679115,-74.0016269681283,-74.0037731632313,-74.0060056409891,-74.0066191489383,-74.0091227192795,-74.0093073410079,-74.0094965066905,-74.0096900302874,-74.0098877214696,-74.0100893858062,-74.0102948249559,-74.0105038368618,-74.0101605728009,-74.0095570830591,-74.0089527434016,-74.0083757478107,-74.0077879438202,-74.0072059128772,-74.0066225945808,-74.0060415268045,-74.0054578234326,-74.0048763207071,-74.0042940983291,-74.0037124585813,-74.0031251337937,-74.0025448697904,-74.0019597833134,-74.0013799010446,-74.0007978693591,-74.0002142135508,-73.9996388598532,-73.9990477303076,-73.9984657784391,-73.9978828574525,-73.9973004251067,-73.9970221625663,-73.9968137289788,-73.9962531437978,-73.9960456530866,-73.99392923789,-73.9918082348231,-73.9890587239361,-73.9883498667103,-73.9852841274358,-73.9830734007398,-73.9823093975949,-73.9818053385719,-73.9813288763919,-73.980291154772,-73.9791182187705,-73.9781907435932,-73.9772631110038,-73.9763353546432,-73.9752721343549,-73.9751731459734,-73.9750352598249,-73.9749587331438,-73.9748640363946,-73.9747284787882,-73.9746571434982,-73.9735039685979,-73.97338805027,-73.9733878261546,-73.9733876020281,-73.9732670673364,-73.9732668900588,-73.9732667358651,-73.9731476945395,-73.973147600175,-73.973147506463,-73.9730366868249,-73.9730365095256,-73.9730363553095,-73.9729390213175,-73.9722987063983,-73.9713963168815],"lat":[40.6482577861141,40.6476201544842,40.6463785715751,40.6461109073431,40.6453166681215,40.6445379413466,40.6437458395071,40.6430302975691,40.6423560097723,40.6416898970341,40.6413824462183,40.6397571597543,40.6392559332214,40.6390185382493,40.637296906442,40.6366509854364,40.6352386218227,40.6349659597113,40.6348917538486,40.6346074303302,40.6341946745982,40.6337195138168,40.63323009464,40.6331116218521,40.6330419145454,40.6329938342684,40.633713379927,40.6335908505929,40.6334883019416,40.6333856735468,40.6332891225907,40.6331536424038,40.6307466541294,40.6302522808925,40.629871496628,40.6290885814784,40.6283545647114,40.6275731868189,40.6273776054817,40.6272944904939,40.6273979582648,40.6274825055266,40.6276388064315,40.6277717559978,40.6279179673593,40.6280548772379,40.6280690128406,40.6280897121976,40.6281166832553,40.6281784163611,40.6282386812865,40.6283518810401,40.6284490347037,40.6285482244288,40.6286544813084,40.6285413336952,40.6271552220219,40.6247654848458,40.6235685520107,40.6223729612054,40.619983803788,40.6180005498844,40.6175894015448,40.617302433543,40.616589737204,40.6162387224673,40.6152044283364,40.6125494864671,40.6099863745259,40.6098786579925,40.6097764261755,40.6096744010222,40.6095552138141,40.6094596075738,40.6094177874826,40.6094031552795,40.6093891895262,40.6092531931632,40.6091504768934,40.6090497192104,40.6089359216909,40.6088141418023,40.6089824766405,40.6099813857914,40.6113710612012,40.6125723708565,40.6137959280038,40.6140298942426,40.6140284945025,40.6140131730554,40.6139832177728,40.6139414611534,40.6138935328248,40.6138455646908,40.6131863689167,40.6136681101717,40.6147764019036,40.6161258365951,40.617470905421,40.618345979472,40.6188000242624,40.6201315149502,40.6214350324407,40.6227889533431,40.6242742687793,40.6251413990506,40.625614741106,40.6257266289914,40.6258557065811,40.6260014341036,40.6261631253919,40.626339908347,40.6265307825624,40.6267101558363,40.6273882283809,40.6280287270261,40.6293467864133,40.6307116464701,40.6320168033571,40.6323754580869,40.6338882802393,40.6340008746154,40.6341090032007,40.6342125596412,40.6343114420795,40.634405553255,40.6344948005997,40.6345790963294,40.6349123382514,40.6354929641312,40.6360750812267,40.6366365576289,40.6371955287901,40.6377545819896,40.6383148016311,40.6388773342414,40.6394351358499,40.6399954645496,40.640556240282,40.6411158515382,40.6416745415814,40.6422357596208,40.6427987386857,40.6433567536584,40.6439175471607,40.6444782999913,40.6450418872787,40.6455973458957,40.6461592271116,40.6467185290791,40.6472720195273,40.6475377922889,40.6477104242787,40.6481749762339,40.648340654929,40.6470693112323,40.6457839691121,40.6441192410392,40.6445622438873,40.6457679387295,40.6466251347049,40.6469274038084,40.6471277997649,40.6471816727075,40.6472971614313,40.6474280612562,40.6475259915112,40.647627336523,40.6477261421713,40.6478306045699,40.647817625097,40.6478033942094,40.6477954978785,40.6477857238903,40.6477737093756,40.6477643729061,40.6475956805563,40.647580957036,40.6475809295095,40.6475809294576,40.647583072167,40.6475830721258,40.6475830983919,40.6476029011522,40.6476029187206,40.6476029543823,40.6476393368779,40.6476393901104,40.6476394713254,40.6476896796483,40.6479424820365,40.6482577861141]}]],[[{"lng":[-73.9563003512271,-73.9561640963249,-73.9561082560446,-73.9560378310877,-73.9560105568092,-73.9559067073484,-73.9558251843973,-73.9557908301855,-73.9557623285312,-73.9557365123291,-73.9556519624085,-73.9547302470444,-73.9546656395126,-73.9545248417564,-73.9542806129959,-73.9541771797979,-73.9541264117089,-73.9540435859013,-73.9539417253589,-73.9537485377843,-73.9536000471938,-73.9530788527286,-73.9521366111647,-73.9511598853806,-73.9501709009553,-73.9492329569703,-73.9482649965689,-73.9480146601131,-73.9477733032834,-73.9468051587991,-73.945867735272,-73.9456175464572,-73.9455109552195,-73.9454487808206,-73.9448081607081,-73.9445399503591,-73.9441553525583,-73.9444678405052,-73.9454005321308,-73.9463262223442,-73.9473267222654,-73.946874399467,-73.9464226599836,-73.9459684975583,-73.9455166357478,-73.9450664280808,-73.9448601234275,-73.9448277099629,-73.9457369191203,-73.9465736676219,-73.9474260878081,-73.9476405732208,-73.9482483442374,-73.9491197021277,-73.9499629669533,-73.9507693807591,-73.9509027889262,-73.9510101005227,-73.9511202608527,-73.9512330307057,-73.951348165338,-73.9514654146038,-73.9515845239035,-73.9516677680696,-73.9525878694897,-73.9535988878696,-73.9547955270999,-73.9557406698915,-73.9567047140635,-73.9576680137943,-73.9580473192722,-73.9585927849577,-73.9595206963374,-73.9604436188151,-73.9613726831358,-73.9623794782476,-73.9628597396146,-73.9633609408921,-73.963564705592,-73.9636224548921,-73.9637541865893,-73.9638114523662,-73.9638893557891,-73.9642679833937,-73.9647198338556,-73.9649455754421,-73.9651725895604,-73.9656256507117,-73.9658856448401,-73.9659068688001,-73.9669062964746,-73.9678341520123,-73.9687609035355,-73.9698376240615,-73.970391871602,-73.9709595094521,-73.9712075045825,-73.9713731442201,-73.9714862572631,-73.9725816536227,-73.9735315201505,-73.9744212241826,-73.9753718443551,-73.975899627138,-73.9765146210018,-73.9765334489562,-73.9765777562319,-73.976696043719,-73.9768496430902,-73.9769984892818,-73.9770709895754,-73.9771651199467,-73.9776164223733,-73.9764334217983,-73.9755101590261,-73.9745825640536,-73.9736539980313,-73.9725572159544,-73.9724148165127,-73.9723112916953,-73.9721614589298,-73.9719042708228,-73.9708756759865,-73.9698686933957,-73.968999222299,-73.9683812728676,-73.9682199904168,-73.9676273629279,-73.968038684878,-73.968223433854,-73.9687221844786,-73.9687909917334,-73.9689146112439,-73.969399030656,-73.969484681379,-73.9696861180754,-73.9698846467177,-73.9700889779307,-73.9703167705145,-73.9705455439065,-73.9707697608326,-73.9708411379564,-73.9712103909894,-73.9713963168815,-73.9715593035278,-73.9719089031181,-73.9720358499465,-73.972088461074,-73.9722222860573,-73.9717057070882,-73.9714562030853,-73.9662132202526,-73.9641466633954,-73.961880864398,-73.9615646142233,-73.9606980937955,-73.959861031131,-73.9596966586303,-73.9563003512271],"lat":[40.6550482818312,40.6537765193077,40.6532447502487,40.652701220771,40.6523142734144,40.6513688344374,40.6505298080789,40.6495229898266,40.648643289987,40.647868996887,40.6466304101446,40.6447725783615,40.644196744303,40.6428875874788,40.6405893852227,40.6396323001962,40.6391612992827,40.6388775491903,40.6384947249419,40.6385863380881,40.6384223474501,40.6384279736585,40.6384258411824,40.6384178994072,40.6384850857478,40.638547673901,40.6386071897069,40.6362669523824,40.6339981566971,40.6340588398669,40.6341175481595,40.6317774303119,40.6307914829014,40.6307327133548,40.6301271666631,40.6298665632107,40.629508285208,40.6294800515109,40.6293778123557,40.6292766427586,40.6291665672098,40.6267736686311,40.6243855672862,40.6219948159592,40.6196056119517,40.6172126872092,40.6162051569828,40.6160462091094,40.6153634067567,40.6147891311372,40.6142246005537,40.6140777104131,40.6136353579565,40.6130532176678,40.6123157278494,40.6115902447675,40.6115786468387,40.6115301384506,40.6114854926219,40.6114448062977,40.6114081679081,40.6113756569322,40.6113473439651,40.6113131859999,40.6111122395891,40.6109498656061,40.6108207661552,40.6107148274562,40.6106118778289,40.610503715219,40.6104627624443,40.6104030309351,40.6103020533396,40.6102015073052,40.6100988747117,40.6099863745259,40.6125494864671,40.6152044283364,40.6162387224673,40.616589737204,40.617302433543,40.6175894015448,40.6180005498844,40.619983803788,40.6223729612054,40.6235685520107,40.6247654848458,40.6271552220219,40.6285413336952,40.6286544813084,40.6285482244288,40.6284490347037,40.6283518810401,40.6282386812865,40.6281784163611,40.6281166832553,40.6280897121976,40.6280690128406,40.6280548772379,40.6279179673593,40.6277717559978,40.6276388064315,40.6274825055266,40.6273979582648,40.6272944904939,40.6273776054817,40.6275731868189,40.6283545647114,40.6290885814784,40.629871496628,40.6302522808925,40.6307466541294,40.6331536424038,40.6332891225907,40.6333856735468,40.6334883019416,40.6335908505929,40.633713379927,40.6329938342684,40.6330419145454,40.6331116218521,40.63323009464,40.6337195138168,40.6341946745982,40.6346074303302,40.6348917538486,40.6349659597113,40.6352386218227,40.6366509854364,40.637296906442,40.6390185382493,40.6392559332214,40.6397571597543,40.6413824462183,40.6416898970341,40.6423560097723,40.6430302975691,40.6437458395071,40.6445379413466,40.6453166681215,40.6461109073431,40.6463785715751,40.6476201544842,40.6482577861141,40.6488228287575,40.6500514098843,40.6504856276553,40.6506569087538,40.6510469517658,40.6511099064229,40.6511403124624,40.6531894045468,40.6539949723505,40.6548811920523,40.6550041171529,40.6553409246806,40.6556347894394,40.6548392152288,40.6550482818312]}]],[[{"lng":[-73.9837215268118,-73.983046594855,-73.981977400581,-73.9809372332252,-73.9807101319402,-73.9806015960486,-73.9801528345959,-73.9800780913951,-73.9799449997963,-73.9798853448458,-73.9796275845859,-73.9795736900813,-73.9794156499557,-73.9790851061331,-73.9790261723355,-73.9787617541352,-73.9785011318742,-73.9783933903959,-73.9783104901111,-73.9781819154221,-73.9776956586936,-73.9773128445781,-73.9772213207711,-73.9765127912138,-73.9758382003545,-73.9751350915463,-73.9741929026631,-73.9742016805361,-73.9742428825228,-73.9742850539179,-73.974335918312,-73.9742079975138,-73.9726033099826,-73.9716772248391,-73.9707527585702,-73.9698231824748,-73.9688973502415,-73.9679700384309,-73.9675424033235,-73.9670455920232,-73.9665263588817,-73.9659316287091,-73.9658201454498,-73.9656409195882,-73.9653598608265,-73.9642641511992,-73.9633698203609,-73.9624443468343,-73.9605166723842,-73.9604596836014,-73.9604071009965,-73.9603495358521,-73.9603171210085,-73.9603176630362,-73.9603380372185,-73.9603461500906,-73.9603419076201,-73.9603253926731,-73.9602685185012,-73.9602582590248,-73.9602431539677,-73.9602394336217,-73.9602346157069,-73.9602312436683,-73.9602275387826,-73.9602179211174,-73.9601967315189,-73.9601492412961,-73.9601050945464,-73.9600479866748,-73.9598350287983,-73.9591095880835,-73.9590076424999,-73.9574554664552,-73.9573360838997,-73.9572361001647,-73.9571329137328,-73.957031341804,-73.9569559603608,-73.95689047345,-73.9568258363904,-73.9567561828483,-73.9564572912573,-73.9560414673453,-73.9560265976333,-73.9560177456007,-73.956014466753,-73.9559960775631,-73.955962617691,-73.9559199765486,-73.9549402417257,-73.9549891767211,-73.9550496174754,-73.9550694371045,-73.9550711159212,-73.9550550541248,-73.95471326915,-73.9544382860244,-73.9543453980122,-73.9542056252297,-73.9540328089505,-73.95397148475,-73.9538405298239,-73.9536517177126,-73.9542854678707,-73.9541336080345,-73.9543979382181,-73.9551111442602,-73.955137052469,-73.9556948404436,-73.9562081659513,-73.9563450668163,-73.9563690410771,-73.9562956120362,-73.9563111145327,-73.9563453345457,-73.9563898004083,-73.9564716944755,-73.9565675090591,-73.9572005349817,-73.9579441385945,-73.9584347635904,-73.9586514713908,-73.9588841918157,-73.9589663415274,-73.9589754338893,-73.9589426846185,-73.9589871897258,-73.9590260777376,-73.9590724802757,-73.9590964219456,-73.959391822474,-73.9598286491124,-73.9602153229932,-73.9604890840351,-73.9606875536364,-73.9608141694139,-73.960908858936,-73.9621076955076,-73.9626760712735,-73.9630589978632,-73.9639829238005,-73.9645361845445,-73.965084785767,-73.9660223954298,-73.9672029410396,-73.9673897547888,-73.9674356779313,-73.9673639008057,-73.9673947223879,-73.9674262847454,-73.9674494637434,-73.967531497537,-73.9676238810411,-73.9677915522393,-73.9681850609859,-73.9683903782888,-73.9685633598548,-73.9688489394463,-73.9689721411386,-73.9690645439124,-73.9692022919878,-73.9694512620237,-73.9694683863316,-73.9692119795212,-73.9692462121557,-73.9692838522803,-73.9695589515174,-73.9697558033688,-73.9699611020173,-73.9702108938786,-73.9708536307437,-73.9710869168941,-73.9713298962634,-73.9713504458751,-73.9713778579133,-73.9711424879454,-73.9711539457254,-73.9711351515381,-73.9711830635572,-73.9712206941635,-73.9714565707675,-73.9715179092027,-73.9716070645239,-73.971836320568,-73.9724967374708,-73.9729347616272,-73.9731469334436,-73.9733450222981,-73.9733625622408,-73.9732326807863,-73.9732122456461,-73.9732499011514,-73.9732909547817,-73.9733251575625,-73.9733430697665,-73.9733490403311,-73.9733661147647,-73.9733900057704,-73.9734275866676,-73.9734480532568,-73.9737320997119,-73.9740067825874,-73.9744096194083,-73.9748476269656,-73.975285649671,-73.9754708190278,-73.9754056102001,-73.9754056409422,-73.9754569655919,-73.9754843266846,-73.9755088303411,-73.9755171882038,-73.9756026994882,-73.9756791802926,-73.9759255209153,-73.9762197885708,-73.9768425624799,-73.9768535461359,-73.9769944904983,-73.9771336414522,-73.9772705702066,-73.9774048548199,-73.9775360815003,-73.9776638458814,-73.9775682009121,-73.977598772045,-73.9776708752382,-73.9780472493389,-73.9780759979822,-73.9777153307247,-73.9776981972807,-73.977705023843,-73.9777391887408,-73.9777512794976,-73.9777650379148,-73.9777840795224,-73.9778079651891,-73.977836144068,-73.9778825890334,-73.977930801936,-73.9779992449302,-73.9780697809881,-73.9781966052419,-73.9783251607863,-73.9784548651119,-73.9785851305029,-73.9787153667008,-73.9788449835794,-73.978973393819,-73.9791000155689,-73.9794568104666,-73.979521830451,-73.9797648105728,-73.9798469446941,-73.979860648247,-73.9798059254359,-73.9797238222547,-73.9796656580905,-73.9794672106514,-73.9794455260633,-73.9794252416215,-73.9794068174228,-73.9793906713687,-73.9794432836762,-73.9795835711478,-73.9797546474568,-73.9799598892665,-73.9799874371307,-73.9800077157223,-73.980103515519,-73.9803259222603,-73.9806489086184,-73.9810444940945,-73.9813387792364,-73.9816364889063,-73.9818418065135,-73.9820407585252,-73.9820368507678,-73.9820163341175,-73.9819923913308,-73.9819205450171,-73.9816965690948,-73.9815989105754,-73.9815578547024,-73.9815441742737,-73.9815715542343,-73.9819479404239,-73.9820266291875,-73.9820950434624,-73.9821463213306,-73.982177106911,-73.9822558025301,-73.9824919005115,-73.9828272320183,-73.9830804449657,-73.9836727015326,-73.9834044073768,-73.983058092451,-73.9830432888371,-73.9833916843665,-73.9832699667533,-73.9833605803929,-73.9834852186614,-73.983821253949,-73.9838394948926,-73.9834884214668,-73.9837579044865,-73.985729317548,-73.9859353817573,-73.9864508758885,-73.9864679985272,-73.9865090582135,-73.986546685941,-73.9868614842503,-73.9872686683531,-73.9875218763042,-73.9877750842576,-73.9880371667854,-73.9886202548146,-73.9885777203887,-73.9886339755543,-73.9886647641226,-73.9886955452091,-73.9887214584883,-73.9888358220813,-73.9889282061789,-73.9891471971602,-73.9893593417585,-73.9896465753045,-73.9899376116338,-73.9901462953121,-73.9902626752744,-73.9905261484993,-73.9907731032392,-73.9907417467296,-73.9907178159274,-73.9907926476694,-73.9908272859811,-73.9908637468487,-73.9911933752362,-73.9915629151274,-73.9918913975633,-73.9922061931928,-73.9922954521958,-73.9925278285878,-73.9927285489707,-73.9929692301485,-73.992945293196,-73.9929809807217,-73.9930137268676,-73.993027407132,-73.9930528994427,-73.9931574188674,-73.9932977052498,-73.9936261803441,-73.9936750974708,-73.994019665383,-73.9944063104658,-73.9946836032281,-73.9948066423787,-73.9949376322995,-73.995138544368,-73.9951522406497,-73.9951351400428,-73.9951872608573,-73.9952480521327,-73.9952617292692,-73.9952930120326,-73.9955149204595,-73.995764696771,-73.9960007879412,-73.9964079635876,-73.996650898707,-73.9968490171764,-73.9969964077653,-73.9970443866112,-73.9971949382584,-73.9973181177229,-73.997355757509,-73.9973557607108,-73.997369448826,-73.9974196615895,-73.9974481404858,-73.9975199935546,-73.997667121352,-73.9978450441239,-73.9979955952131,-73.9981872062096,-73.9982966978162,-73.9984677790016,-73.9986324281594,-73.9989912881183,-73.9992273802893,-73.9996140257525,-73.9996413990162,-73.9996585068643,-73.9997032141999,-73.9997329117932,-73.9997295079268,-73.9997192982345,-73.9997485215655,-73.9999543184083,-74.0001605408467,-74.0003668722813,-74.0005729959457,-74.0007785953927,-74.0009257125824,-74.001070958859,-74.0012138747982,-74.0013540083489,-74.0019057237496,-74.0020116705391,-74.0020578093162,-74.0019839688837,-74.0020854763973,-74.0022008496998,-74.002228543204,-74.0023485271797,-74.0024870773771,-74.0048224779999,-74.006669156326,-74.008708657302,-74.0094289369033,-74.0100741078543,-74.0107130684611,-74.0111566872926,-74.0119019649012,-74.0120154019113,-74.0123218352068,-74.0123678861701,-74.0124047180166,-74.0124322872269,-74.0124505612036,-74.0124595183103,-74.0127972193453,-74.0130129552997,-74.0130238006225,-74.0130271545442,-74.0129622761214,-74.0129055693098,-74.0128571422026,-74.0128170871204,-74.0123503592923,-74.0122466287824,-74.0121356515214,-74.0120176217092,-74.0118927458933,-74.0117612426074,-74.0116233419888,-74.011479285376,-74.0113293248862,-74.0111737229741,-74.0110127519726,-74.0108603557124,-74.0107038895301,-74.0105435846376,-74.0103787195844,-74.0102158027042,-74.0100552919434,-74.0098976384874,-74.0097432854921,-74.0095926668394,-74.0094462059168,-74.0093043144285,-74.0091950614788,-74.0090891414802,-74.0089867425502,-74.0088880465543,-74.0088657272753,-74.0087265097831,-74.0085819919882,-74.0084325342244,-74.0082785091469,-74.0081203008027,-74.0079583036735,-74.0077929216912,-74.0076245672307,-74.0074536600817,-74.0064798483473,-74.0060473423582,-74.0048362757678,-74.0039802361643,-74.0029437415781,-74.002205828768,-74.0018599131743,-74.0011921230361,-74.0007602995901,-74.0006605529053,-74.0005598676383,-73.9996415228003,-73.9994773917243,-73.9993106358264,-73.9991415448986,-73.9989704127925,-73.9987975369086,-73.9986232176788,-73.9984477580447,-73.9982714629305,-73.9982145349434,-73.9981584276895,-73.9981042926054,-73.9980532406533,-73.9980063195204,-73.9979644921186,-73.9979286168227,-73.9978994298549,-73.997877530177,-73.9978633671985,-73.9978572315556,-73.9978592491471,-73.9979702364174,-73.9979845390404,-73.9979918166478,-73.9979918742821,-73.9979847104101,-73.9979705169629,-73.9979496741929,-73.997922740486,-73.9978904374015,-73.9978536303414,-73.9921546480925,-73.9918291279028,-73.9917471424708,-73.9916642362256,-73.9915809106585,-73.9914922463514,-73.9914042867856,-73.9913176357696,-73.9912328881298,-73.9911506256284,-73.9910714129698,-73.9906977094526,-73.9903620646656,-73.9896950130442,-73.989579561386,-73.9894479718619,-73.9889909355634,-73.9884283376943,-73.9881420829041,-73.9879832405625,-73.9876083793465,-73.9876163152134,-73.9878545690183,-73.9878664768794,-73.987512858145,-73.9874515182493,-73.9874415948843,-73.9874618696751,-73.9875974538736,-73.9875865395821,-73.9874878527,-73.9873906438841,-73.9873830220656,-73.9866953999707,-73.9867512931706,-73.9868122550081,-73.9868778839146,-73.9869477475753,-73.9870213857771,-73.9867810958389,-73.9861652674458,-73.9858856739485,-73.9859129534192,-73.9859241877661,-73.9860450991623,-73.9868447899645,-73.9869450692819,-73.9870390218689,-73.9871264179875,-73.9872070439366,-73.9872807025749,-73.9873472138026,-73.9874064150014,-73.9874581614325,-73.9875740022818,-73.9876289333413,-73.9876392579393,-73.9877334195981,-73.9877494059196,-73.987765335494,-73.9877807928605,-73.9877953748741,-73.9878087012201,-73.9878204243335,-73.9878302384635,-73.987837887648,-73.9879617102952,-73.9879725627284,-73.9879858080792,-73.9880010508576,-73.9880178359337,-73.9880356621269,-73.9880539971706,-73.9880722936048,-73.9880900051223,-73.9881066028804,-73.9881215912917,-73.9881345228212,-73.9881718948557,-73.9882137192603,-73.9882593245663,-73.9883079786021,-73.988358900248,-73.988417457349,-73.9884745692303,-73.9885292884315,-73.9885807071837,-73.9889035392383,-73.9891363620141,-73.9895419521619,-73.9896996938388,-73.9899550492177,-73.9911944079675,-73.9916300747238,-73.99174273417,-73.991682618812,-73.991730781285,-73.9918253244997,-73.9918553565664,-73.9918252957587,-73.9916955301478,-73.9903376250445,-73.9903506723531,-73.990355738165,-73.9903527680394,-73.9903417938619,-73.9903229335028,-73.9902963895521,-73.9902624471436,-73.9909761229884,-73.9926739127504,-73.9927266475071,-73.9927736783526,-73.9928139870549,-73.9928467009243,-73.9928860163815,-73.9929297108896,-73.9929769902119,-73.9930269949535,-73.9930489297209,-73.9930688071455,-73.9930860334672,-73.9931000941183,-73.9931105690939,-73.993117145498,-73.9931466251024,-73.9931795160316,-73.9932150419686,-73.9932523644047,-73.9933974570168,-73.9935475486442,-73.9937023614729,-73.9938616089541,-73.9940249963341,-73.9941922212001,-73.9943629740394,-73.9945369388126,-73.9945896184423,-73.9946405256253,-73.9946883366441,-73.9947318082924,-73.9947698102015,-73.9947958637201,-73.9948276768426,-73.9948644669247,-73.9949053288858,-73.9949492574755,-73.9949951720029,-73.9950497384471,-73.9951028058057,-73.9951529565864,-73.9951988512048,-73.9952392637668,-73.9952731148144,-73.9952874280529,-73.9953075467103,-73.9953329332768,-73.9953629095045,-73.9953966745271,-73.9954333262566,-73.995471885484,-73.9955113220396,-73.9955505823151,-73.9955886174119,-73.9958967185115,-73.9960552882052,-73.9962242980962,-73.9967257040299,-73.9973961201266,-73.9978130171092,-74.0001792285941,-74.0003088081067,-74.0004173950371,-74.0004368535805,-74.0003595179048,-74.0002468390726,-74.0001003557999,-73.9999820428925,-73.9998580944458,-73.9997397798044,-73.999632733412,-73.9995313217703,-73.9994580792612,-73.9993397630994,-73.9991538395443,-73.9989848172947,-73.9987876230712,-73.9986016987774,-73.9984608461169,-73.9982636529196,-73.9980852377601,-73.9980889918839,-73.9982867355359,-73.9986711016602,-73.9992890500947,-73.9994693390151,-73.9997059709951,-73.9997003362607,-73.9995256799036,-73.999634238235,-73.9995651157032,-73.9993566515775,-73.9989735281157,-73.9987763305323,-73.9986382638476,-73.9982805244254,-73.9982185478421,-73.99814530449,-73.9962365379423,-73.9941730563838,-73.9942350292251,-73.9955985741035,-73.9956605451227,-73.9940790462178,-73.9942155460831,-73.9933085496695,-73.9929783595407,-73.9929159153588,-73.9928606773962,-73.9925574782609,-73.9916141237686,-73.9915393444445,-73.9914734213569,-73.9906631198364,-73.99036425111,-73.990049946831,-73.9887312972833,-73.9874913607019,-73.9867631492432,-73.9864672684189,-73.9852002737078,-73.9850613649743,-73.984063802494,-73.9837215268118],"lat":[40.5958210782172,40.5954145396838,40.594763406169,40.5941369339831,40.593997228133,40.5939323051821,40.5936653067229,40.5936208352135,40.5935416487985,40.5935061546723,40.5933472320641,40.5933140021166,40.5932165610171,40.5930127592894,40.5929764216716,40.5928133880796,40.5926539529476,40.5925882793623,40.5925383440452,40.5924585327202,40.5921865378584,40.5919776507471,40.5919219335133,40.591452646914,40.5910645882994,40.5906406890456,40.5901061899912,40.5900172593661,40.5895773364773,40.5887089520017,40.587941518708,40.5879546107953,40.588118774307,40.5882220731785,40.5883219257882,40.5884266603017,40.5885285776684,40.5886314236517,40.5886808231431,40.588738199577,40.5887932710085,40.5888563457395,40.5888680664891,40.5888871750408,40.5889186179983,40.5890411764382,40.5891365659574,40.5892388640036,40.5894529116476,40.5887238198211,40.5880343523024,40.587306286074,40.5865147235995,40.5864364684721,40.5862810895005,40.5861247709756,40.5859683662622,40.5858127232536,40.5851490325848,40.5850293078417,40.5848270810659,40.5847918749835,40.584746283206,40.5846760046288,40.5846089594208,40.5845146628378,40.5842250311678,40.5835758970392,40.5834083571591,40.5832698724066,40.5831905458519,40.5828566752126,40.5828521516095,40.5830127880024,40.5830251348804,40.5830422708163,40.583045726525,40.583035332417,40.5829822625409,40.5829339794608,40.5828863086475,40.5828349700306,40.5826588505552,40.5827362543198,40.5826099228921,40.5825643168187,40.5825576242703,40.582520165018,40.5824805112151,40.5824478328215,40.5819689052405,40.5819168291301,40.5818251615806,40.5817534514838,40.581680175764,40.5816092361719,40.5806220917602,40.5795999594223,40.5791953984781,40.5784262863019,40.5774023122719,40.5773223573752,40.5767767492972,40.5758239808958,40.5757313370186,40.5743332674952,40.5743708459072,40.5743711268051,40.5743711369258,40.5743269962632,40.5742654706752,40.5742072219895,40.5741733125593,40.5738349846544,40.5738001743884,40.5737975787945,40.5738236877436,40.5741394877452,40.574170778493,40.5741866713809,40.5741448126623,40.5740888150463,40.5740515237713,40.5739915960313,40.5739472687685,40.5739045524792,40.5734671676474,40.5734306552294,40.5734519951184,40.5738455480003,40.5738638204333,40.5739121097524,40.5739293096357,40.573911179121,40.5738851815441,40.5738774219822,40.5738618099388,40.5738650289464,40.5737135200186,40.5736669390391,40.573635553518,40.5735575717327,40.573513199425,40.573469198638,40.5733885948326,40.5733263173975,40.5732589999045,40.5732089696713,40.5730445689522,40.5729950026884,40.5729851089693,40.573008064913,40.5731907323847,40.57319858544,40.5731881963182,40.5731778685462,40.5731544429401,40.5731259465519,40.5730580279477,40.5730215323048,40.5729876375129,40.5729574185167,40.5728572803632,40.5728233657055,40.5723353764235,40.5723040756546,40.5723014764519,40.5728085804608,40.5728469246904,40.5728600245875,40.5728522619818,40.5727705152799,40.5727272442156,40.5726438103841,40.5725994595428,40.5725107530989,40.572050631012,40.5719996370465,40.5719601521359,40.5719418990842,40.5719627822017,40.5724794622434,40.5725816819019,40.5726282239199,40.5726282803543,40.5725762567474,40.5724746021453,40.5724146399953,40.5723212140061,40.5722633570436,40.571905865967,40.5716684247027,40.571626686109,40.5716423502966,40.5716762786298,40.5717405704245,40.5718510996223,40.5719372080932,40.5720885467885,40.5722346707679,40.5722721069694,40.572286925094,40.5722743625466,40.5722375030022,40.5721645417659,40.5720498326686,40.571969003817,40.5715045348691,40.5714210406406,40.5714210516176,40.5714549778465,40.5715244924406,40.5716943152804,40.5718592831036,40.5719559844974,40.5720186574376,40.5720161101274,40.5719483984328,40.5719463381897,40.5719246776465,40.5718970867176,40.5718636504246,40.5718244718011,40.5717796715755,40.5717293877991,40.5712466666591,40.5711910305184,40.5711710200791,40.5711997939595,40.5712295701287,40.5712519143448,40.5713249683295,40.5713771539496,40.5715337121186,40.5716802897826,40.5717076940988,40.5717331937705,40.5717562007247,40.5717761843747,40.5717955449778,40.5718122040365,40.5718304767982,40.5718433122486,40.5718661922221,40.5718825142241,40.5718922042965,40.5718952185315,40.5718915432711,40.5718811951686,40.5718642211133,40.571840698018,40.5717427679584,40.5717140787342,40.5715862710861,40.5715393196102,40.5714819200105,40.5714036340461,40.5713462174124,40.5713331610994,40.5712992060837,40.5712933454036,40.5712850678956,40.5712745613122,40.5712620639667,40.5712209259481,40.5712261688436,40.571249682582,40.5714401905005,40.5715836058236,40.5716985096886,40.5717272264845,40.5717377022186,40.5717377329567,40.5716804203659,40.5716100203481,40.5715265735895,40.5714692035547,40.5714803705225,40.5714379242801,40.5713883460493,40.5713518133092,40.5713204925867,40.5713113718207,40.5713073954842,40.5712943428685,40.571273466987,40.5712499884249,40.5712370021575,40.5712761520892,40.5713466114785,40.5715214360821,40.5715605784545,40.5715684182897,40.571565845913,40.5715424135746,40.5715085314334,40.5714070576874,40.5701655445108,40.5702096562685,40.570145860988,40.5700946845169,40.5695418938537,40.5695299939842,40.5700890150628,40.5700457894818,40.570112467158,40.5701560300465,40.571396227251,40.5711958899815,40.5711781889224,40.5711489089104,40.5710784627252,40.571081076828,40.5711332648658,40.5711072092381,40.5710759444771,40.5710472709236,40.5710185968119,40.5709851087687,40.5708960513142,40.570697909505,40.5706951444804,40.5707290672401,40.570815174287,40.5708836920827,40.5708778085579,40.5708752082259,40.5708439191831,40.5708308929978,40.5707921554097,40.570757887126,40.5707260797864,40.5707083401173,40.5706587871255,40.5705994223404,40.570403103607,40.5702595956511,40.5702486487556,40.5704213743788,40.5706020162424,40.5706118749683,40.5705779834892,40.5705336499989,40.5704997520704,40.5704910696716,40.5704684640029,40.5704337880374,40.5703667320423,40.5702362710854,40.5701967733092,40.5702127929783,40.5702780229682,40.5703390255589,40.5703797894389,40.5703824074857,40.5703928631078,40.5703951356701,40.5704111486789,40.5703902944716,40.5703613379185,40.5703642212029,40.5703546745124,40.5703146612067,40.5701789827434,40.5700667871094,40.5700218776332,40.5700981017787,40.570228562337,40.5703212832165,40.5703538141139,40.5703929618599,40.5703929703219,40.5703747186936,40.5703721167597,40.5703669654689,40.5703626913814,40.5703564734245,40.5703486490438,40.570322560423,40.570278204148,40.5701973196832,40.5701373075429,40.5701408544459,40.5702860343931,40.5703251735622,40.5703747511662,40.5704138934095,40.5704478158532,40.5704608650693,40.5704739122748,40.570497396973,40.5705080066903,40.5704895757801,40.5704895776106,40.5704660966015,40.5704452230047,40.5703826025028,40.5703864975227,40.5704115116077,40.5704504411229,40.5704737977401,40.5704957974596,40.5705071566972,40.5705123596484,40.5705113983253,40.5705042742039,40.5704909982213,40.5704687773246,40.5704402846802,40.5704056104129,40.5703648642002,40.5702394055157,40.5702087585242,40.5701524623992,40.5695965418238,40.569585983985,40.5703037543917,40.5706098627688,40.5711059679409,40.5717383888725,40.5728902278022,40.5733936483754,40.5737598185877,40.5737972684101,40.5738308095177,40.5740290973115,40.5741667618589,40.5747901665075,40.5748850524742,40.5756526823651,40.5758568144103,40.5760620317368,40.5762680923407,40.5764747532211,40.5766817706674,40.5774892371332,40.5777585143814,40.5778043697599,40.5778508945641,40.5779925939835,40.5781363171532,40.5782817902456,40.5784287360973,40.5792218211565,40.5793555733754,40.5794859004681,40.5796125743252,40.5797353732302,40.5798540822477,40.5799684935996,40.5800784070293,40.5801836301518,40.580283978791,40.5803792773018,40.5804622452647,40.5805406861074,40.5806144839101,40.5806391772523,40.5806704980348,40.580708358218,40.5807526513803,40.5808032530175,40.5808600208924,40.5809227954348,40.5809914001895,40.5810499592236,40.5811119758964,40.5811773400696,40.58124593566,40.5812601592934,40.5813437626692,40.5814219632666,40.5814945660943,40.5815613901184,40.5816222687139,40.58167705008,40.5817255976193,40.581767790278,40.5818035228479,40.5819282569613,40.5819836530359,40.5818548435803,40.5817212956639,40.581432835521,40.5813658860204,40.5813875190182,40.5814190552519,40.581324529098,40.5813089616486,40.581297429683,40.5813165584961,40.5813671828552,40.5814125477272,40.5814525742747,40.5814871929374,40.581516343553,40.5815399754619,40.5815580475952,40.5815705285458,40.5815692661112,40.5815618147948,40.5815483275131,40.5815290810529,40.5815044703909,40.5814750005878,40.5814412764228,40.5814039899824,40.5813639064568,40.5813218484361,40.5812786790295,40.5812352841522,40.5808451859949,40.5808132473184,40.5807799575669,40.5807462085775,40.5807129044889,40.5806809375193,40.5806511640644,40.5806243817546,40.5806013080865,40.5805825612016,40.5793206254329,40.5792470809288,40.5792356141701,40.5792290401832,40.5792273987336,40.5792310868023,40.5792403585422,40.5792551503064,40.579275360555,40.5793008505525,40.5793314453197,40.5793730515998,40.5794245801205,40.579213269076,40.5791929421963,40.5790558156915,40.5788350999689,40.5788158426195,40.5788659637138,40.5789453357409,40.5790331361456,40.5790641686527,40.5790036437428,40.5790263511079,40.5791156911949,40.5791315131984,40.5791072913735,40.5791028783487,40.5790664376476,40.5790407017643,40.5790640175274,40.5790869830637,40.5791375607142,40.5798149081326,40.5798642934921,40.5799100602359,40.5799519068814,40.5799895577683,40.5800227648753,40.5802939376777,40.580950229295,40.5811444245648,40.5812270020004,40.5812674376122,40.5817206851516,40.5812321020052,40.5811364218021,40.5810370788004,40.5809343159497,40.5808283845616,40.5807195436957,40.5806080595251,40.5804942046862,40.5803782576115,40.5800314507249,40.5799588944519,40.5799175978767,40.5798182960034,40.5798190146621,40.5798177619269,40.5798145704705,40.5798095235297,40.5798027527342,40.5797944346735,40.5797847862918,40.5797740592291,40.5796718107798,40.5796604949571,40.5796507725314,40.5796429338017,40.5796372128221,40.5796337804135,40.5796327390631,40.5796341198643,40.5796378815881,40.5796439119145,40.5796520307858,40.5796619957833,40.5796906505621,40.5797154721403,40.5797360620179,40.5797520896327,40.5797632976677,40.5797689894199,40.5797803725969,40.5797972583573,40.5798193665738,40.5800086781821,40.5802148779273,40.5804153657237,40.5804211073034,40.5806616695314,40.5810283076994,40.5810798843819,40.5812001625875,40.5813834270772,40.5814865050479,40.581503706867,40.5816239785461,40.5817385203028,40.5818585032789,40.5842182553885,40.5842765286133,40.5843355184511,40.5843945912009,40.5844531122691,40.5845104529871,40.5845659973648,40.5846191487079,40.5843500308101,40.5835884433695,40.5835617743314,40.583529494152,40.5834923017129,40.5834510022473,40.5834241571917,40.5834015881593,40.5833837053864,40.5833708339265,40.5833631749459,40.5833527508315,40.5833398729631,40.5833249260171,40.5833083564751,40.5832906592872,40.5832719484415,40.5832569011834,40.5832458726691,40.5832391232011,40.5831481294867,40.583061978031,40.5829808282863,40.5829048304471,40.5828341251721,40.582768843324,40.5827091057274,40.5826550229449,40.5826498641502,40.5826383169442,40.582620681584,40.5825974166344,40.5825691270433,40.5825394809813,40.5825133055725,40.5824912447611,40.5824738412671,40.582461523235,40.5824545937014,40.5824509881391,40.5824406541185,40.5824238676736,40.5824010771904,40.5823728914293,40.5823400632642,40.5823119980898,40.5822860855699,40.5822630180003,40.5822434116683,40.5822277903883,40.5822165715072,40.582210054755,40.5822084142367,40.5822116937814,40.5822198057708,40.582157018784,40.5821289038542,40.5822019305815,40.5822534905794,40.5824296169995,40.5826100310831,40.5830739502451,40.5831770375147,40.5835459215033,40.5840489694866,40.5841864458804,40.5842637628337,40.5843754425006,40.5844312815952,40.5845429609528,40.5845773228653,40.5846331622942,40.5847018873363,40.5847534316165,40.5848608148172,40.5849424258703,40.5850154455309,40.5851528939333,40.58523020847,40.5852860463874,40.5853118156251,40.5853647215815,40.5854707412659,40.5854830629867,40.5855070132154,40.5855523660529,40.5856898190094,40.5856898198586,40.5857542496277,40.5857585446599,40.586069747936,40.5862439200957,40.5863813694157,40.5864286156059,40.5864844533866,40.5864916294609,40.5865102195849,40.5865102186407,40.5865316939072,40.5874212558796,40.5883828578208,40.5884387006483,40.5878417075542,40.5879362073439,40.5886934419906,40.5888685304828,40.5895838985805,40.589730033453,40.5897573787788,40.5897826984193,40.589921674724,40.5903564459446,40.5903909030813,40.5904493057884,40.5911671666083,40.5914319316764,40.591734112288,40.5930018990679,40.5941939819159,40.5948940656273,40.5951788221258,40.5963981261166,40.5956709188194,40.5957827199541,40.5958210782172]}]],[[{"lng":[-73.9180925648084,-73.9181253336966,-73.9180556858531,-73.9180834965313,-73.9181148925626,-73.9181397341487,-73.9181712548569,-73.9181759045984,-73.918203291296,-73.9182384602682,-73.9182625040369,-73.9183157211924,-73.9183902548444,-73.9184389381607,-73.9184860783792,-73.9185533871677,-73.9185803852933,-73.9186275379333,-73.918710305518,-73.9187705207392,-73.9188100554866,-73.9188480729359,-73.9188898880758,-73.9189408508247,-73.918969747931,-73.9190001740967,-73.9190463746481,-73.9191903317242,-73.9192343596819,-73.9192775014718,-73.9193270820224,-73.919403008127,-73.919434893581,-73.9195054592814,-73.9195139403541,-73.9196111641994,-73.9197312963758,-73.9198347083388,-73.919893001293,-73.9199761329383,-73.9200521513157,-73.9201392292381,-73.9201397073572,-73.9201823615417,-73.9201823661142,-73.9201886396458,-73.9201849119552,-73.9200494041943,-73.9200469158086,-73.9201748975064,-73.9201711734749,-73.920206300527,-73.9202112911836,-73.920252689006,-73.9202551767876,-73.9202024830337,-73.9202074588369,-73.9202174915833,-73.9202187408311,-73.9202777047249,-73.9202773349179,-73.9202953564158,-73.9203607206784,-73.920404982311,-73.9204702111616,-73.9205508081657,-73.9206253112848,-73.9207150176145,-73.9208215694194,-73.9208214566242,-73.920868429262,-73.9207586767621,-73.9207650320703,-73.920728374935,-73.9206973025786,-73.9206698086596,-73.9207390166014,-73.9207636872599,-73.9207389667976,-73.9207777402874,-73.9207819788003,-73.9208914580685,-73.9209294864426,-73.9209021757944,-73.9209752037078,-73.9209890563315,-73.9209110429072,-73.9208784302738,-73.9209060383639,-73.9209441056756,-73.921012182661,-73.9210122437971,-73.9210375789691,-73.9210816733067,-73.9211026635899,-73.9211770776568,-73.9212823073901,-73.9214708084986,-73.9215142802179,-73.9215328862022,-73.9217626135607,-73.921782402713,-73.9217580921534,-73.9217814875845,-73.921811319539,-73.9218097857828,-73.9218356083965,-73.9218995512202,-73.9219481743886,-73.9218481910777,-73.9218669875513,-73.9218992855613,-73.9218890270277,-73.9221185128986,-73.9221603528536,-73.9223046001212,-73.9223020014655,-73.922353373773,-73.9224612801045,-73.9225524871074,-73.9225626774255,-73.9226282774028,-73.9227169164716,-73.9228235815672,-73.9228492662234,-73.9229640982636,-73.9230201374972,-73.9231331298331,-73.923341180798,-73.9235351589087,-73.923698330456,-73.9238577022056,-73.9238950188409,-73.9239258458292,-73.9239720403671,-73.924016939197,-73.9240426214711,-73.9240631783945,-73.9240670527497,-73.924049095605,-73.9240093332751,-73.924010645095,-73.924021820095,-73.9242957685611,-73.9243231453673,-73.9245675494807,-73.9246794528377,-73.9247570979969,-73.9248073126316,-73.9248366945059,-73.924860511513,-73.9249384074397,-73.9249933142654,-73.9250766496435,-73.9252036151425,-73.925226947574,-73.9252225445942,-73.925283785726,-73.9254664450528,-73.9254183568755,-73.9255427763224,-73.9255944614802,-73.9256468923778,-73.9257084728563,-73.9257060094836,-73.9257906191933,-73.925934353384,-73.9260027980419,-73.9259839842762,-73.9260758183989,-73.9261305753204,-73.9262127166333,-73.9262880091751,-73.926282319535,-73.9263037348965,-73.9263701857111,-73.9264728476127,-73.9265732289015,-73.9264978183316,-73.9265326042008,-73.9265853750353,-73.9267033312267,-73.9267397767153,-73.9268423273603,-73.9267787456346,-73.9268315054989,-73.9268794657249,-73.9269578246044,-73.9270007323218,-73.9270688492858,-73.927087991468,-73.9270946291994,-73.9271278583307,-73.9269420831152,-73.926967338343,-73.9271876107817,-73.9271703287218,-73.9271411293814,-73.9271052430351,-73.9271198446927,-73.9270993562572,-73.9271108301942,-73.9271592873352,-73.927207741889,-73.9272582025461,-73.9272937317055,-73.9273400342665,-73.9273858944954,-73.9274097211316,-73.9274389275162,-73.9274700309266,-73.9275019861963,-73.9275304567609,-73.9275602919822,-73.9275730443843,-73.9276206497676,-73.9276500693362,-73.9276684596778,-73.9276828774732,-73.9276659912845,-73.9276119876814,-73.9273874493916,-73.9273705958316,-73.927353334354,-73.9273434918512,-73.9273260157413,-73.9272994485147,-73.9272772014965,-73.9272475052137,-73.9272431257597,-73.9273191529367,-73.9272648386985,-73.9272793218892,-73.9273568092889,-73.927391881747,-73.9274640249405,-73.9274945689374,-73.9275058017439,-73.9275684694141,-73.9275800288607,-73.9276464035797,-73.9276558430935,-73.9277250698898,-73.9277346389091,-73.9277983244368,-73.9279459835108,-73.9278742602053,-73.9278739383161,-73.9279162574111,-73.9280790681786,-73.9280304142927,-73.9279555522649,-73.9278503067985,-73.9278211315273,-73.9276758176573,-73.9276753802749,-73.927606679653,-73.927593262643,-73.9274692507199,-73.9274750265058,-73.9273693575354,-73.9274382362561,-73.9273901510753,-73.9274045224574,-73.927425522607,-73.9274455175553,-73.9275039620398,-73.9276360393084,-73.9277724493279,-73.9279048250055,-73.9278905685549,-73.9279017574099,-73.9280218527642,-73.9280067651898,-73.9279231804832,-73.9278587609274,-73.9278484736783,-73.9277909208589,-73.9277844315925,-73.9277689297834,-73.9276948316566,-73.9276807008589,-73.927641214998,-73.9275554387913,-73.9275672425982,-73.927557515861,-73.9275472153142,-73.927540167239,-73.9275256916758,-73.9275174175098,-73.927522581628,-73.9275167480363,-73.9275287825852,-73.9275032776782,-73.9274724164497,-73.9274546779099,-73.9274861258152,-73.9274348968193,-73.9275394277351,-73.9275503597229,-73.9276337206545,-73.9277614363911,-73.9271118631756,-73.9269510277461,-73.9266529927844,-73.9266286163416,-73.9266528016336,-73.9263611882989,-73.9260602421988,-73.9257534786633,-73.9254430813116,-73.9251395988566,-73.9248307019395,-73.9245461001638,-73.9242473574877,-73.9239546716577,-73.9239529485009,-73.9240725717561,-73.9241996339266,-73.9242599701322,-73.9242824753092,-73.924350258205,-73.9243635723445,-73.9244313541906,-73.9244479902057,-73.9245179874338,-73.9245268632088,-73.9246012993856,-73.9246568634646,-73.9246368947458,-73.9247713419953,-73.9247569207748,-73.9249102519409,-73.9249202363399,-73.9249724556452,-73.9249591474298,-73.9250869313341,-73.9250935865047,-73.9253635785871,-73.9258880101941,-73.9258750424733,-73.9260296252236,-73.9261594741434,-73.9263560850867,-73.9266523267231,-73.9269617394228,-73.9272596240534,-73.9277763602228,-73.9277646589663,-73.928159051231,-73.9283627126681,-73.9283678337329,-73.9284188580903,-73.9284129716178,-73.9283969402,-73.9283694769213,-73.9283959475282,-73.9283797729373,-73.9283643820113,-73.9283566125997,-73.9282161699486,-73.928225395315,-73.9283361999498,-73.9283586623041,-73.9284290067027,-73.9284732947543,-73.9284970962664,-73.9285216588329,-73.9285434814869,-73.9285597504688,-73.928612527365,-73.9286734493379,-73.9286765617395,-73.9286213901824,-73.9286306141564,-73.9287340774399,-73.9287492680463,-73.9287576155368,-73.9287498483861,-73.9286956708216,-73.9286465667911,-73.9286278470955,-73.9285983672652,-73.9285630571572,-73.9285356073524,-73.9285142302459,-73.9284965573578,-73.9284508988249,-73.9283903685655,-73.9283958280449,-73.9284691076032,-73.9284431266411,-73.9284318487016,-73.9283826899824,-73.9283774597152,-73.9284409049371,-73.928620264992,-73.928653800581,-73.9286510429367,-73.9287630876168,-73.9287803739474,-73.9287830164522,-73.9288035361038,-73.928829695254,-73.928850993693,-73.9289135184539,-73.9289134317756,-73.9288646454086,-73.9288813968443,-73.9289510299323,-73.928814431503,-73.9287908044539,-73.9286315870271,-73.928665938429,-73.9286912629114,-73.928734264673,-73.9288516769863,-73.9292196400519,-73.9292360368272,-73.929173481375,-73.9292524110041,-73.9292431481804,-73.929157063334,-73.9290900430843,-73.9291655424816,-73.9291569382168,-73.9290771056907,-73.9290158020728,-73.9290889138771,-73.9290787500577,-73.9290023949198,-73.92894319888,-73.9290177588667,-73.9290060298237,-73.9289318996011,-73.9288639898049,-73.9289466060801,-73.9289281068375,-73.9288482069839,-73.9288380381499,-73.9288653641496,-73.9288512899082,-73.9288247413036,-73.928814577473,-73.9288426847021,-73.9288293922925,-73.9288005049094,-73.9287570349942,-73.9289612383377,-73.9290763723165,-73.9290841723943,-73.9292157040319,-73.9293486654327,-73.929645245279,-73.9297649181975,-73.9299025816389,-73.9299818786619,-73.9300139913191,-73.9299836435058,-73.9298605507012,-73.9297576678688,-73.9297509435311,-73.9296109216188,-73.9293612835442,-73.9293731224165,-73.9295738415893,-73.9297661577336,-73.9300342745055,-73.9301590210166,-73.9303275985951,-73.9303950072048,-73.9304236378424,-73.9304388286287,-73.9305770571826,-73.9305483581632,-73.9303899033013,-73.9303407424666,-73.9302284661763,-73.9302712478116,-73.9301623550189,-73.9301032598877,-73.9301834273729,-73.9303106518828,-73.9303754324734,-73.9302978809168,-73.9303220861915,-73.9304404174526,-73.9304550184729,-73.9305668222896,-73.9305528123575,-73.9305894044737,-73.9306284936443,-73.9305890922578,-73.930569609519,-73.930467689171,-73.9305356068156,-73.9305288833326,-73.9306296071237,-73.9306313511666,-73.9306521384644,-73.9306743442139,-73.9306275782627,-73.9306313141331,-73.9305250722865,-73.9304807893012,-73.9304731415046,-73.9304713508022,-73.930474819568,-73.9304771229361,-73.9304990640672,-73.9304990544468,-73.9305233026294,-73.9305250476422,-73.9306234424658,-73.9306263915998,-73.9306474994858,-73.9306410670058,-73.9305215475604,-73.9305250201679,-73.9304938408326,-73.9304955610582,-73.9304695850755,-73.9304601366188,-73.9306929718915,-73.9306964165805,-73.9304563207587,-73.9304497032347,-73.9304496017293,-73.9307258078441,-73.9307257872983,-73.9305059228274,-73.930505966161,-73.9304449786184,-73.9303719771903,-73.9304266710375,-73.9305316928037,-73.9305247413,-73.9305697764574,-73.9305715282781,-73.9306044430696,-73.9306006690623,-73.9305642842933,-73.9305749530102,-73.930526458791,-73.9305229784207,-73.9304653676582,-73.9304994518316,-73.9304748059085,-73.9304742339743,-73.9304054166221,-73.9304618564754,-73.9305711782094,-73.9306058065659,-73.9305051636496,-73.9304652942052,-73.9304596427201,-73.9304546522736,-73.9304509192271,-73.9304249356843,-73.9304269667262,-73.9304341175533,-73.9304375809352,-73.9303990560214,-73.9303838085581,-73.9303554557071,-73.9303458431085,-73.9303310650977,-73.9303130216355,-73.9303113673272,-73.9303016192708,-73.9303443327713,-73.9303446293991,-73.9303642604191,-73.9303692274755,-73.930388506965,-73.9303874480107,-73.93038686981,-73.9303833882179,-73.9303811697719,-73.9303765033675,-73.9303749747513,-73.9303740241238,-73.930370117014,-73.9303690238812,-73.9303657000746,-73.930364436033,-73.9303418937051,-73.9303622156806,-73.9303010995104,-73.9303075161744,-73.9302865634836,-73.9302044181931,-73.930176166342,-73.9302178513572,-73.9302014945224,-73.9302060581915,-73.9302653116938,-73.9302694335103,-73.9303536445858,-73.9303430534794,-73.9303140051209,-73.9303038875219,-73.9302766892188,-73.9302651092732,-73.930253201743,-73.9303263406039,-73.9302781375918,-73.9302657919308,-73.9302328589121,-73.9302378122828,-73.9302171860075,-73.930213227886,-73.9301897065828,-73.9301252640054,-73.9301058386685,-73.930023010262,-73.9300272439805,-73.9300281142721,-73.9300295840145,-73.930029709221,-73.9301159318135,-73.9300940414468,-73.9300910824078,-73.9300890526211,-73.9301019165657,-73.9301866063072,-73.9302125148937,-73.9301788650343,-73.9301641033117,-73.9301469470835,-73.9301284525507,-73.9301175483633,-73.9301065821162,-73.93007616099,-73.9300868254382,-73.9300755821913,-73.9299995001639,-73.929999155533,-73.9299982716609,-73.929997504422,-73.9299900881551,-73.9299626370369,-73.9299125015645,-73.9299188578693,-73.9299217628181,-73.9299253407258,-73.9299906530938,-73.9299874145049,-73.9300533859283,-73.9300701842637,-73.9300751403051,-73.9300871084892,-73.9300989932411,-73.9300970112835,-73.9300937747006,-73.9300794524302,-73.9300665964161,-73.9300625849089,-73.9300524453941,-73.9300326034589,-73.9300464535553,-73.930063535292,-73.9300085775099,-73.9300116637646,-73.9299880021189,-73.929985494108,-73.9299583587549,-73.9299605293828,-73.9299066895594,-73.9299003914061,-73.9298951155917,-73.9298906696431,-73.9298320135117,-73.929712820366,-73.9297385061218,-73.9297463968903,-73.9297553773365,-73.9298033640273,-73.9298026058641,-73.9298884197121,-73.9298896134683,-73.9299812081446,-73.9300152467953,-73.9300423841959,-73.9300268937802,-73.9300203323253,-73.9299791125168,-73.9299751043989,-73.9299559190957,-73.9299357593849,-73.9299759362929,-73.9298943623797,-73.9297981654193,-73.9297414732265,-73.9297673540058,-73.9297785203566,-73.9298146554055,-73.929823173368,-73.9298932020807,-73.9299006973723,-73.9300392239667,-73.9300354613714,-73.9299044233794,-73.9298006840449,-73.9297808174206,-73.9298530583416,-73.9298567841477,-73.9298436823814,-73.9298541677514,-73.9298603203068,-73.9299188726263,-73.9299437717558,-73.9299611658137,-73.9300165095213,-73.9302151947032,-73.9301983789752,-73.9301889671515,-73.9301854141426,-73.9301670388882,-73.9301637451835,-73.9301458561133,-73.9301213553433,-73.9301102606755,-73.9301062630113,-73.9300902951192,-73.930078320307,-73.9300743711095,-73.9300501763419,-73.9300815945314,-73.9301363255648,-73.9301389906787,-73.9301649312927,-73.9301826176163,-73.9301874812405,-73.9302275628004,-73.9302876039037,-73.9302915587059,-73.9303076477373,-73.9304593456464,-73.9305248866187,-73.9303813688457,-73.9303596894153,-73.9304433031258,-73.9305433316513,-73.9305703263842,-73.9305467907066,-73.9305253712583,-73.9305202929023,-73.9304873099408,-73.9304810549937,-73.9304418098452,-73.9304339641138,-73.9304203986894,-73.9303662466,-73.9303498574764,-73.9303438620512,-73.9303368493189,-73.9303443425615,-73.9303269474639,-73.9302993440439,-73.9300401194769,-73.9300982732688,-73.9302017682316,-73.9302753348795,-73.9304324612961,-73.9305297477051,-73.9305808960941,-73.9306134962185,-73.9307518137895,-73.9307612283956,-73.9307480761072,-73.9307093672597,-73.9307026825601,-73.930664395731,-73.9306115125472,-73.9305980364645,-73.9306230568456,-73.9306417753042,-73.930649569387,-73.9306873332077,-73.9306954107376,-73.9307406167828,-73.9307491347324,-73.9307883252788,-73.9307950624999,-73.9308344643654,-73.9308069383265,-73.9307683984169,-73.9306630351011,-73.9307056780477,-73.9307690102691,-73.9308252667971,-73.9308195353674,-73.9308320658745,-73.9309351611461,-73.9309592489762,-73.9309936220311,-73.9310281289382,-73.9310361651457,-73.9311043716465,-73.9311901632604,-73.9312630157238,-73.9312128421383,-73.9312205593891,-73.9312267741993,-73.9312737148507,-73.931309875343,-73.9313251214607,-73.931317025228,-73.931276505557,-73.931240368758,-73.9311999048333,-73.9311295042133,-73.9311208709941,-73.9310457338204,-73.9310352031046,-73.930998097504,-73.9309734165763,-73.930954634264,-73.9310084298063,-73.9311109551091,-73.93117079151,-73.9311679769822,-73.9311726623496,-73.931183159927,-73.9312471362245,-73.9312561562515,-73.931325623736,-73.9313357117182,-73.9313668482681,-73.9314197928918,-73.931430230235,-73.9315113499914,-73.9315875822993,-73.9316156203621,-73.9317399477372,-73.9317422336814,-73.931742803086,-73.9317638739996,-73.9317590824142,-73.9317580816717,-73.9316317758916,-73.9316240705845,-73.9316131373722,-73.9315306422289,-73.9314604717236,-73.9313680634337,-73.9311719559049,-73.931027135004,-73.9309877167972,-73.9308462672728,-73.9307813137962,-73.9308054707999,-73.930819183776,-73.9308503666007,-73.9308847319491,-73.9310190347344,-73.9311382037501,-73.9313017105704,-73.9314301859669,-73.9315625251532,-73.9316965222578,-73.9318772173972,-73.9319050358965,-73.9319336498398,-73.9319991529869,-73.9320897293209,-73.932129648585,-73.9321666620416,-73.9322182095261,-73.9322523391236,-73.932308263954,-73.932347490834,-73.9323967790224,-73.9324521768845,-73.9324127763982,-73.9323981545495,-73.9323718826515,-73.9323908943351,-73.9324054865637,-73.9325634383933,-73.9325780349936,-73.9324376290322,-73.9324770288868,-73.9325559783654,-73.9326042055686,-73.9326714732701,-73.9327972710448,-73.9328265485289,-73.9328193283157,-73.9328073608012,-73.9328012160413,-73.9327800123477,-73.9327124166567,-73.9326765397575,-73.9325983410895,-73.9325266118923,-73.932448630395,-73.9323508999956,-73.9321655450526,-73.932000627318,-73.9319058079595,-73.9318254999622,-73.9317589074309,-73.9317446553904,-73.9316741082932,-73.9317501541549,-73.931760735344,-73.9317333820398,-73.9317109079429,-73.9316897772805,-73.9316885567517,-73.9315349529333,-73.9315505710421,-73.9316252600042,-73.9316648612787,-73.9317292508295,-73.9317408751198,-73.9316898528766,-73.9316767223383,-73.9316665789072,-73.9316159846949,-73.9315646256029,-73.9315322950395,-73.9314886172407,-73.931465974308,-73.9314657154104,-73.9314536736866,-73.931431598401,-73.9314367561381,-73.9313093229317,-73.9312719711603,-73.9312210463183,-73.9311599329319,-73.9311395605757,-73.9312007535447,-73.9312583856432,-73.9313172748192,-73.9313640679284,-73.9313999798639,-73.9310098934316,-73.9310045146082,-73.931000129223,-73.9309946597323,-73.9310571658259,-73.9310604356207,-73.9311514354325,-73.9311536017242,-73.9311634704199,-73.9313530095474,-73.9313013085501,-73.9313574055558,-73.9313931040365,-73.9314077575167,-73.9314256543975,-73.9312371374293,-73.9312426095142,-73.9311998346926,-73.9311932618725,-73.9310726222124,-73.9310704045976,-73.9310484787568,-73.9310760222574,-73.9310979480582,-73.931077024843,-73.9312305704302,-73.9312272894226,-73.9312845838047,-73.9313054163604,-73.9312459249482,-73.9314225265011,-73.9314464775722,-73.9314223218776,-73.9314929190243,-73.9314806483417,-73.9315134373057,-73.9315433466718,-73.9314808487993,-73.9314862870527,-73.9314665489463,-73.9314327242082,-73.9314568476148,-73.9314753854822,-73.9314764750353,-73.9315466498031,-73.9315593944157,-73.9315527221199,-73.9314941829165,-73.9314288310434,-73.9313961055898,-73.9314069751201,-73.9314160036077,-73.9313412598258,-73.93131907299,-73.9311330195981,-73.9312129485895,-73.9310917816458,-73.931053130244,-73.9310123654473,-73.9309273982704,-73.9308888007358,-73.9307960172694,-73.9307048853,-73.9306856805981,-73.9306243872196,-73.9305688956272,-73.9301013765885,-73.9300913827922,-73.930070047636,-73.9305361426854,-73.930544681844,-73.9305860209088,-73.9305344412818,-73.9306502192753,-73.9306353232422,-73.9305473343507,-73.9305070797936,-73.9304372696048,-73.9303996759751,-73.9303798319572,-73.9303832851466,-73.9297441078082,-73.9297284638019,-73.9303650037517,-73.9303680674256,-73.9303854525627,-73.9303596123004,-73.9303706280742,-73.9303676020135,-73.930361509338,-73.9303369865333,-73.9302909816294,-73.9302633815747,-73.9297025502045,-73.9297223264673,-73.9299037110113,-73.930218811799,-73.9307328430339,-73.9313491782407,-73.9313655619293,-73.9313513596613,-73.9313172217924,-73.9313029996669,-73.9312775124759,-73.9312519126713,-73.9311807304431,-73.9310452875479,-73.9310580930064,-73.9308144495188,-73.9308059303523,-73.9305577193578,-73.9296432215919,-73.929641815495,-73.9305509692403,-73.9308201977409,-73.9308287126032,-73.9309113518628,-73.930912792656,-73.9309569642139,-73.9309541053253,-73.9310167985159,-73.9310121806847,-73.9305282117319,-73.9296689462475,-73.9296157548258,-73.9295634331281,-73.9292889540057,-73.929194376665,-73.9290889400391,-73.9288898308486,-73.9287923654893,-73.9286935949086,-73.9285739393647,-73.9284979856844,-73.9284315342131,-73.9283688900251,-73.928296748881,-73.9282493047991,-73.9281857599151,-73.9281430268028,-73.9281146217116,-73.9280823297159,-73.9280634718816,-73.9280758896281,-73.9280864018312,-73.9280997427585,-73.928105485982,-73.9281195788438,-73.928089629255,-73.9280389440336,-73.9280435838342,-73.9280965704473,-73.9281103989253,-73.9281496937952,-73.928138197065,-73.9279193378585,-73.9279251444091,-73.9281647386094,-73.9281623937405,-73.928172739299,-73.9281950124812,-73.9282767249762,-73.9281570069562,-73.9280156889545,-73.9278599907478,-73.9277431115315,-73.9276407168966,-73.9275138693355,-73.9274440014012,-73.9274052816233,-73.9273882258095,-73.9273695578589,-73.9273368347179,-73.9275327137679,-73.927586418299,-73.9275955985747,-73.9275162199561,-73.9275116888037,-73.9273414403862,-73.9272807972705,-73.9273065040187,-73.9273205062659,-73.9273508851603,-73.9273392187588,-73.9273724766151,-73.927358535385,-73.9273197695305,-73.9273043382388,-73.9272133428372,-73.9271409664434,-73.927112034736,-73.9269729675165,-73.9268609704584,-73.9267629750653,-73.9266906575185,-73.9266626898056,-73.9266627288983,-73.9265713955133,-73.9263804188107,-73.9263056357625,-73.9263369745878,-73.9266019591251,-73.9265669067122,-73.9265482096333,-73.9261016191073,-73.9255922719012,-73.9254935435831,-73.9255286087458,-73.9256544590901,-73.9262752954224,-73.9263454207472,-73.9262824204289,-73.9262310924367,-73.9261844307319,-73.9262054728269,-73.9260407550698,-73.9258333591695,-73.9257191874578,-73.9256265628069,-73.925523553599,-73.9254698562991,-73.9254243168133,-73.9253788969,-73.9253663689133,-73.9253411186334,-73.9253265831422,-73.9253052755718,-73.9252908398168,-73.925285643146,-73.9252865643765,-73.9252805781324,-73.9252594343054,-73.9251978785368,-73.9251743963877,-73.9251449346813,-73.9251123778675,-73.9250699257747,-73.9250266856211,-73.9249689419649,-73.9249141605491,-73.9248874764359,-73.9248266946884,-73.9247627016458,-73.9246584316704,-73.9246143360199,-73.9245716873116,-73.924553438605,-73.9245420953566,-73.9245369647526,-73.9245333114586,-73.9244985545885,-73.9244742535251,-73.9244309137947,-73.9243921770531,-73.9243581081149,-73.924320194973,-73.9242837910093,-73.9242397272535,-73.9242085869865,-73.9241904044492,-73.9241494324731,-73.9241197701619,-73.9240984947511,-73.924077318692,-73.9240456501833,-73.9240298004276,-73.9240049063022,-73.9239769223904,-73.9239389404355,-73.9239041499692,-73.92387090519,-73.9238397657451,-73.9238003027011,-73.9237562703406,-73.9237425927215,-73.9237312819083,-73.9237260524461,-73.923728418624,-73.9237277600135,-73.9236974751364,-73.9236815246751,-73.9236625187516,-73.9236321998052,-73.923603362599,-73.923574523162,-73.9235411794483,-73.9235079624314,-73.9234800133194,-73.9234496631501,-73.923367618419,-73.9233075741067,-73.9232779133204,-73.9232725562978,-73.9232580544631,-73.923234474806,-73.9232025478627,-73.9231606220977,-73.923112744045,-73.9230877556041,-73.9230650299951,-73.9230338578695,-73.9229448473941,-73.9228778654286,-73.9228283466104,-73.9227803378639,-73.9227619895849,-73.9227421635345,-73.9227170390141,-73.9226957976335,-73.9226639646458,-73.9226100389661,-73.9225872486443,-73.9225340788963,-73.9224520032916,-73.9223965953316,-73.9223487501292,-73.9223230682063,-73.9222911707015,-73.922276734989,-73.9222517418297,-73.9222138285799,-73.9221637469366,-73.9221128113616,-73.922055101474,-73.9219678631651,-73.9219231081819,-73.9218767441658,-73.9218295564305,-73.9217726364444,-73.9217065440245,-73.9216571178839,-73.9216032249414,-73.9215319339081,-73.921486293591,-73.9214308843428,-73.921392938455,-73.9213565032295,-73.9213147402061,-73.9212615354203,-73.9212341138271,-73.9212084310777,-73.9211879761897,-73.9211499954696,-73.9211096837251,-73.9210837415353,-73.9210728249297,-73.921049875168,-73.921012555475,-73.9209716160869,-73.9209255753889,-73.9208666444833,-73.9208174824948,-73.9207736142829,-73.9207311924192,-73.9207107076341,-73.92066736802,-73.9206216606691,-73.9205905872205,-73.9205511907948,-73.9205185392371,-73.9204774685219,-73.9204470867256,-73.9204266295797,-73.9203842437016,-73.9203515912683,-73.9203227201578,-73.9202862523476,-73.9202489661986,-73.9202192065896,-73.9201956305344,-73.9201851392989,-73.920173166234,-73.9201489955265,-73.9201201567881,-73.920091383195,-73.920051070017,-73.9200061874141,-73.9199804371541,-73.9199457112793,-73.9199155847953,-73.9198877920805,-73.9198833852585,-73.9198682571807,-73.9198485305763,-73.9198333050467,-73.9198219932292,-73.9198168607665,-73.9198040983813,-73.919770094537,-73.9197216875786,-73.9196777215396,-73.9196610169435,-73.9196466138076,-73.9196421402877,-73.9196452975978,-73.9196445726202,-73.9196249060907,-73.9195894240246,-73.9195806861638,-73.9195615687869,-73.9195414545875,-73.9195417196382,-73.9195418083028,-73.9195079264372,-73.9194951873569,-73.9194904965566,-73.9194831082309,-73.9194639876785,-73.9194227425657,-73.9194073243292,-73.9193640507751,-73.919312412841,-73.9193097392484,-73.9192639040805,-73.9192511811915,-73.9192339216769,-73.9191993890198,-73.919192108955,-73.9191775805288,-73.9191130612258,-73.9190957806858,-73.9190873024733,-73.91908122205,-73.9190621238703,-73.9190566537012,-73.9190339319749,-73.9190185051635,-73.9190121547255,-73.9190015466285,-73.9188417753934,-73.9188375806319,-73.9189001373303,-73.9188864034861,-73.9188566097794,-73.9188684714564,-73.918855951328,-73.9188357062159,-73.9188475846642,-73.9187992774343,-73.9187964430275,-73.9187959073799,-73.9187372184421,-73.9187126847583,-73.9186739259834,-73.9186441999799,-73.9186037888212,-73.9185687020441,-73.9185304459208,-73.9184943849487,-73.9184550843232,-73.9184222249942,-73.9183987992051,-73.9183680293852,-73.9182739594856,-73.9182468610065,-73.9182393789969,-73.9182307825521,-73.9182344579085,-73.9182402205374,-73.9182485778176,-73.9182654618204,-73.9182718001922,-73.9182674493105,-73.9182562600004,-73.9182402851347,-73.9182248830273,-73.9181941445312,-73.9181628326834,-73.9181597325125,-73.9181460494465,-73.9181503975033,-73.9181616560129,-73.9181516134787,-73.9181293341389,-73.9180995394617,-73.9180452753019,-73.9180207390673,-73.9179834949758,-73.9179367467011,-73.9179266694087,-73.9178917529739,-73.9178753380753,-73.9178541388809,-73.9178323343353,-73.917814164631,-73.917793438379,-73.917783864785,-73.9177701124814,-73.9177632720561,-73.9177473991847,-73.917734083472,-73.9177175708308,-73.9177064129452,-73.9176979857736,-73.9176852802131,-73.9176709577114,-73.9176155419319,-73.9175842937967,-73.9175264586179,-73.9174561674886,-73.9174170795062,-73.9173889660026,-73.9173483332509,-73.9173436147243,-73.9173107597454,-73.9172763851523,-73.9172529673241,-73.9172201529833,-73.9171935553305,-73.9171388658952,-73.9171263303082,-73.917075658406,-73.9170698269373,-73.915944601434,-73.9158289001943,-73.9157540475484,-73.9171359020326,-73.9172301984166,-73.9175750002432,-73.9183322456026,-73.9190857231541,-73.9198693072058,-73.9207565880955,-73.9209287181441,-73.9211616247793,-73.922367608929,-73.9227960812382,-73.9228485463533,-73.9235048569352,-73.923791477666,-73.9240846472311,-73.9246539325931,-73.9246647476181,-73.9252412425509,-73.925945807442,-73.9270927808393,-73.9279589375641,-73.92863344177,-73.9287156972737,-73.9299834173285,-73.929936904353,-73.929632480749,-73.9303485009623,-73.9304342527859,-73.9305172184788,-73.930596672216,-73.9306719189001,-73.9307423002421,-73.9308072005208,-73.9308404859508,-73.9308674386196,-73.9308877057671,-73.9308905316685,-73.9308910123524,-73.9308891344592,-73.930884950186,-73.9308785758354,-73.9308701885829,-73.9308600215523,-73.9308483573357,-73.9308355201393,-73.9307637108393,-73.9307576493907,-73.9307517596794,-73.9307462157335,-73.9307411813643,-73.9307368053264,-73.9307332169219,-73.9307305221801,-73.9307288007245,-73.9307281034201,-73.9307284508704,-73.930729832809,-73.9307385503497,-73.9307501649444,-73.9307406943348,-73.9307542931208,-73.9307812297386,-73.9308085647316,-73.9308290486385,-73.9309137000996,-73.9309207715429,-73.9309600314458,-73.9310926332452,-73.931179511672,-73.9317021421091,-73.9317142204142,-73.9317249134724,-73.931745303496,-73.9317724033525,-73.9317973460914,-73.9318194619442,-73.9318282368275,-73.9318347418738,-73.9318388129291,-73.9318403472601,-73.9318393061472,-73.9318357158611,-73.9318296670004,-73.9318213122053,-73.9318108623062,-73.9318046777447,-73.931798928348,-73.9317937783065,-73.9317893746943,-73.9317858432692,-73.9317832848812,-73.9317817725926,-73.9317813495914,-73.93178392763,-73.931787560569,-73.9317921545551,-73.9317975909072,-73.9318037291821,-73.9318104108035,-73.9318634542836,-73.9319135364923,-73.9319284768204,-73.9319443127039,-73.9319606826121,-73.9319772128219,-73.9319281118676,-73.9323769574283,-73.9323719695463,-73.932013799611,-73.9319887370741,-73.9320183941154,-73.9323308350322,-73.932355992818,-73.9323800499615,-73.9324023388802,-73.9324222410602,-73.9324392042202,-73.9324746587954,-73.9325129419335,-73.9325534988149,-73.9325987705764,-73.9326447979136,-73.9326907033422,-73.9327356117021,-73.9327786668411,-73.9327911504497,-73.9328045136186,-73.9328184190432,-73.9328325157312,-73.9328464478628,-73.9328598637717,-73.9329196614074,-73.9329801590471,-73.9330404736212,-73.9330997247322,-73.9331570475047,-73.9333034022795,-73.9333930595821,-73.9334914563773,-73.9334895283372,-73.9337137801662,-73.9342097148697,-73.9342077286539,-73.9343702787297,-73.9343797014331,-73.9344692819631,-73.934559929029,-73.9345627912191,-73.9345605710198,-73.9352819437215,-73.9352760526263,-73.9352761118093,-73.9354404068803,-73.9356907163977,-73.9356895363613,-73.9357242354232,-73.9357193387555,-73.9356767646808,-73.9356735314599,-73.9358243927578,-73.9358269067191,-73.9357598191954,-73.9357665721109,-73.9357674980518,-73.9361124375298,-73.9361323359013,-73.936152282715,-73.9361717551263,-73.936190242726,-73.9362072609187,-73.9362223636256,-73.9362351549768,-73.936245299688,-73.936252531849,-73.9362543204547,-73.9362741827063,-73.9362704507023,-73.9362893368137,-73.9362875226431,-73.936287231894,-73.9362450715287,-73.9362418512818,-73.9361280221118,-73.9361286594257,-73.9361288123766,-73.9360982496962,-73.9360980770168,-73.9360966869136,-73.9362402391076,-73.9362403724473,-73.9363514911458,-73.9365660702915,-73.936564367648,-73.9363505071377,-73.9363490619603,-73.9363003120676,-73.9363016916904,-73.9363035986279,-73.9363086017894,-73.9363171612953,-73.9365391284709,-73.9365485548835,-73.9365759244078,-73.9366287604513,-73.9369742746376,-73.9369772471098,-73.9369865173925,-73.9369874367197,-73.9369876783104,-73.9369310072212,-73.9369314851825,-73.9369039740811,-73.9368916774403,-73.9368258492613,-73.936744914072,-73.9367319026441,-73.9366630028366,-73.9366492210293,-73.9366326382984,-73.9366330742246,-73.9370592167747,-73.9370562380686,-73.9370529045103,-73.937632697433,-73.9376320432883,-73.9370535633146,-73.9370527874277,-73.9370267558872,-73.9370301269195,-73.9370305103347,-73.9370055840827,-73.9370052051678,-73.9370038732406,-73.9370142304753,-73.9370148102119,-73.9370510689012,-73.937077377783,-73.9371245979845,-73.9372974407271,-73.9373204953578,-73.9373247075988,-73.9378318029718,-73.9378873268306,-73.9381191769509,-73.9380942062777,-73.9382399147974,-73.9382574576991,-73.9383308913978,-73.9385527623651,-73.9384771288587,-73.9386684665774,-73.9386664610738,-73.9386599914724,-73.938663341576,-73.9386466303217,-73.9386221889761,-73.9386275576512,-73.9387866044152,-73.9387826663901,-73.9387311533361,-73.9386685173058,-73.9386632281359,-73.9386783271204,-73.9386871999985,-73.9386974579878,-73.9392964038475,-73.9393015308489,-73.9398253885057,-73.9398288398462,-73.9398570019674,-73.939858515768,-73.9402735576653,-73.9405774582891,-73.9405753254517,-73.9405749537624,-73.9405725816192,-73.9405721499989,-73.9405696280159,-73.9405691688033,-73.9405675432505,-73.9405660894773,-73.9405419930905,-73.9405422955577,-73.9404736062161,-73.9404735774077,-73.940109523965,-73.9401090368293,-73.9401257676994,-73.9402142213517,-73.9402251803578,-73.9402670888333,-73.9402794150494,-73.9403635249099,-73.9403768838958,-73.940472814569,-73.9404865952313,-73.9405616665925,-73.9405755070221,-73.9406581674775,-73.9406765780227,-73.9406771219134,-73.9405856840527,-73.9405866718767,-73.9405872791283,-73.9405875464774,-73.9405884696087,-73.9405887280989,-73.9406285557423,-73.9406364933032,-73.9407001951475,-73.9406969032371,-73.9409164549074,-73.9409000104769,-73.9408971047742,-73.9407386846444,-73.9407384060463,-73.9407935538431,-73.9408308173342,-73.9408467712349,-73.9409163725539,-73.9409753279758,-73.9410040897775,-73.9410251791869,-73.9410258439236,-73.9409145036293,-73.940917369179,-73.9409281603307,-73.9409342208536,-73.9411569967549,-73.9411625845631,-73.9411370122831,-73.94113089391,-73.9411090597259,-73.9411062487938,-73.9410984456549,-73.941145349942,-73.9411507471981,-73.9412015572889,-73.9412056166295,-73.9411540861051,-73.9411583380938,-73.9411938439722,-73.9412092982399,-73.941246974023,-73.9412635116459,-73.9413111511611,-73.941440508572,-73.9414883378426,-73.9415443865731,-73.9415740808357,-73.942551335653,-73.9420203335275,-73.942149388102,-73.9427016776298,-73.94304709646,-73.9425631619098,-73.9426877400567,-73.9431950615803,-73.9435446753092,-73.9430933478146,-73.9432281554656,-73.9435120588953,-73.9436915300457,-73.9440676416711,-73.9436358979574,-73.9437651164146,-73.9442340358714,-73.9446182866624,-73.9441745852377,-73.9443205981808,-73.9447754408129,-73.9451747778161,-73.9447127096423,-73.9448451294087,-73.9453499250347,-73.9457301493043,-73.9452667012463,-73.9453760523788,-73.9458991188809,-73.9462863469191,-73.9457994125889,-73.9459241293531,-73.9464342905935,-73.9467894506878,-73.9463160364871,-73.946454964773,-73.946917962761,-73.9472683270527,-73.946822029472,-73.9470139088358,-73.9474686786132,-73.9483674792493,-73.9495826675518,-73.950250769568,-73.9511822698626,-73.9524744797083,-73.9534932204868,-73.953432163444,-73.9534192982367,-73.9533013599568,-73.9528629215182,-73.9523309909847,-73.9519384943325,-73.9510236946263,-73.9500883946427,-73.949696724994,-73.949374735223,-73.9480044811693,-73.9469768187522,-73.9460061663116,-73.9450294035948,-73.9441367291388,-73.9430620826782,-73.9427406259252,-73.9421653834802,-73.9412412027241,-73.9403576569333,-73.9389906579337,-73.9380568041423,-73.9371056135673,-73.9361696075799,-73.9347519384381,-73.9338128066391,-73.9338136463092,-73.9338361533937,-73.9338359807471,-73.9342995473485,-73.9351340770489,-73.9351378928337,-73.9351087911519,-73.9351061582394,-73.9350953259684,-73.9339140448124,-73.9338364511142,-73.9338362727794,-73.9338130480486,-73.9338132808982,-73.9337639173508,-73.9337631473705,-73.9336629593379,-73.9336632572223,-73.9334004288524,-73.9333993186901,-73.9336624342682,-73.9336627964387,-73.9337631343139,-73.9337580135612,-73.9330034891641,-73.9330029472605,-73.9329716189068,-73.9329635037576,-73.9329095874482,-73.9329134081496,-73.932872950224,-73.9328691636471,-73.9328063642747,-73.9327788560717,-73.9327494487057,-73.9326975326653,-73.9326407480483,-73.9325800656804,-73.9325526813435,-73.9325243366416,-73.9325034115588,-73.9324506061651,-73.9320212466452,-73.9319957687601,-73.9318149783328,-73.931826884272,-73.9316902633028,-73.9316406939416,-73.9310602810801,-73.931062883357,-73.9314422561966,-73.9315025674406,-73.9330973637817,-73.9333442095384,-73.9348088246586,-73.9348609283043,-73.9348914824417,-73.9349022910097,-73.9348935645524,-73.9349954030409,-73.93500161782,-73.9350786183044,-73.9353241049106,-73.9357572231627,-73.9362344446556,-73.9364710758659,-73.9365616343876,-73.9366035818983,-73.9366210958546,-73.936650974268,-73.9366715385713,-73.9366827328403,-73.9366948432211,-73.9367075253733,-73.936720418699,-73.9367331565961,-73.9367453768817,-73.9367567320904,-73.9367567450178,-73.9367933549786,-73.9367954948281,-73.9367985919742,-73.9368025633865,-73.9368073025964,-73.9368126825518,-73.9368185590228,-73.9368247744685,-73.9368311622605,-73.9368375511499,-73.9368437698586,-73.9368496516707,-73.9376156246729,-73.9389672078359,-73.9425090782843,-73.9425191882929,-73.9425273835129,-73.9425334559925,-73.9425372516434,-73.942538674151,-73.9425376874183,-73.9425344786556,-73.9425291296261,-73.9425217664792,-73.9425125628648,-73.9425017358384,-73.9424895407417,-73.9424762651813,-73.9424828136937,-73.9424925505653,-73.9425052182362,-73.9425204816194,-73.9425379369651,-73.9425571225406,-73.942577530844,-73.9425986220291,-73.9427406081808,-73.9428874874475,-73.9431159056162,-73.9432922062786,-73.9434725694638,-73.9436414953313,-73.9438205742343,-73.943934607276,-73.9440493743169,-73.9441643765834,-73.9442791142795,-73.944393088759,-73.9445058046935,-73.9445429369838,-73.9445769861215,-73.9446072724169,-73.9446331912961,-73.9445527223794,-73.9445662343865,-73.9445672091415,-73.9445676294428,-73.9445674848567,-73.9445667789727,-73.9445667778231,-73.9445672927579,-73.9445683130967,-73.9445698176764,-73.9445717752899,-73.9445805752262,-73.9445902566813,-73.944600540171,-73.9446063776838,-73.9446121818313,-73.9446177859037,-73.9446230289376,-73.94462776034,-73.9446423384772,-73.9446776838472,-73.9446950661317,-73.9447444166077,-73.9449196021101,-73.9450962423247,-73.9452738748199,-73.9454520345656,-73.9455429085131,-73.9456336092279,-73.9457235201333,-73.9458120300221,-73.9458985372125,-73.945982453638,-73.946036037426,-73.9460836627551,-73.946124421466,-73.9461575363431,-73.9461823759353,-73.9461984665959,-73.9462055015131,-73.9461589885057,-73.9459533007826,-73.9459214827695,-73.9459089795528,-73.9459239023584,-73.9466510173404,-73.9467119736007,-73.9467795328985,-73.9468013406923,-73.9469198029281,-73.9470850031949,-73.9477671676402,-73.9486854928755,-73.9489637597347,-73.9493881362593,-73.9495406590232,-73.94991862626,-73.9500657581516,-73.9501855243287,-73.9503087290243,-73.9505308157179,-73.9505311591346,-73.9508117706898,-73.9510478999174,-73.9513250956544,-73.9514765323082,-73.9515151797231,-73.9517776781359,-73.9521077266367,-73.9522779037294,-73.952397830766,-73.9525777536374,-73.9527849148459,-73.9529666099609,-73.953124969102,-73.9532829180936,-73.9534040835321,-73.9535266008142,-73.9537425795835,-73.9537796807437,-73.9538505137371,-73.9539349053973,-73.9539942340508,-73.9540113629754,-73.9540319979788,-73.9540833338591,-73.9541072675142,-73.9541002959486,-73.9541336080345,-73.9542854678707,-73.9536517177126,-73.9538405298239,-73.95397148475,-73.9540328089505,-73.9542056252297,-73.9543453980122,-73.9544382860244,-73.95471326915,-73.9550550541248,-73.9550711159212,-73.9550694371045,-73.9550496174754,-73.9549891767211,-73.9549402417257,-73.9559199765486,-73.955962617691,-73.9559960775631,-73.956014466753,-73.9560177456007,-73.9560265976333,-73.9560414673453,-73.9564572912573,-73.9567561828483,-73.9568258363904,-73.95689047345,-73.9569559603608,-73.957031341804,-73.9571329137328,-73.9572361001647,-73.9573360838997,-73.9574554664552,-73.9590076424999,-73.9591095880835,-73.9598350287983,-73.9600479866748,-73.9601050945464,-73.9601492412961,-73.9601967315189,-73.9602179211174,-73.9602275387826,-73.9602312436683,-73.9602346157069,-73.9602394336217,-73.9602431539677,-73.9602582590248,-73.9602685185012,-73.9603253926731,-73.9603419076201,-73.9603461500906,-73.9603380372185,-73.9603176630362,-73.9603171210085,-73.9603495358521,-73.9604071009965,-73.9604596836014,-73.9605166723842,-73.9624443468343,-73.9633698203609,-73.9642641511992,-73.9653598608265,-73.9656409195882,-73.9658201454498,-73.9659316287091,-73.9665263588817,-73.9670455920232,-73.9675424033235,-73.9679700384309,-73.9688973502415,-73.9698231824748,-73.9707527585702,-73.9716772248391,-73.9726033099826,-73.9742079975138,-73.974335918312,-73.9742850539179,-73.9742428825228,-73.9742016805361,-73.9741929026631,-73.9751350915463,-73.9758382003545,-73.9765127912138,-73.9772213207711,-73.9773128445781,-73.9776956586936,-73.9781819154221,-73.9783104901111,-73.9783933903959,-73.9785011318742,-73.9787617541352,-73.9790261723355,-73.9790851061331,-73.9794156499557,-73.9795736900813,-73.9796275845859,-73.9798853448458,-73.9799449997963,-73.9800780913951,-73.9801528345959,-73.9806015960486,-73.9807101319402,-73.9809372332252,-73.981977400581,-73.983046594855,-73.9837215268118,-73.9831403468563,-73.9822111583866,-73.981283846727,-73.9803578547385,-73.9794258684296,-73.9789057139549,-73.9785016917869,-73.9775067424922,-73.9765093450658,-73.9755881930256,-73.9750394042932,-73.9749269555482,-73.9740839048974,-73.9732398353256,-73.9731228463365,-73.9730210800516,-73.9729671326161,-73.9729111684125,-73.9725653370985,-73.9724526158844,-73.9723515208722,-73.9721774273492,-73.972397355419,-73.9725898234115,-73.9729594808647,-73.972994339389,-73.9719151872532,-73.9708953837774,-73.9699656611014,-73.9690408663949,-73.9679216879961,-73.9678067633597,-73.9676863568787,-73.9673997951279,-73.9662983547991,-73.9652237806769,-73.9642964996393,-73.9633709296116,-73.9623794782476,-73.9613726831358,-73.9604436188151,-73.9595206963374,-73.9585927849577,-73.9580473192722,-73.9576680137943,-73.9567047140635,-73.9557406698915,-73.9547955270999,-73.9535988878696,-73.9525878694897,-73.9516677680696,-73.9515845239035,-73.9514654146038,-73.951348165338,-73.9512330307057,-73.9511202608527,-73.9510101005227,-73.9509027889262,-73.9507693807591,-73.9499629669533,-73.9491197021277,-73.9482483442374,-73.9476405732208,-73.9474260878081,-73.9465736676219,-73.9457369191203,-73.9448277099629,-73.9447954727965,-73.9445736645838,-73.9444361462781,-73.9443088819456,-73.9441745062859,-73.9440556093215,-73.9438316165953,-73.9426513822668,-73.9408289785009,-73.9390124693896,-73.9390496277481,-73.9384898668512,-73.938347083712,-73.9378905081103,-73.938098082759,-73.9384349357584,-73.9379155784185,-73.9360940729623,-73.9342626672588,-73.9335511715361,-73.9317339012848,-73.9299222492492,-73.9281313960502,-73.9287901015488,-73.9291243705818,-73.9295685824336,-73.9286685095516,-73.9275993669829,-73.9265330499539,-73.9254714779807,-73.9244041329122,-73.9240555304218,-73.9236367728711,-73.9233217785486,-73.922307925163,-73.9209599200278,-73.919725107872,-73.9181908779807,-73.9180925648084],"lat":[40.5865703350048,40.5865073744992,40.5864365456763,40.5864322084016,40.5864540536665,40.5864456788133,40.586419415396,40.5863950937695,40.5863870423715,40.5864079060532,40.5864042862636,40.5863906813499,40.5863536481558,40.5863223914095,40.5863096763751,40.5862999345244,40.5862633863401,40.5862402403716,40.5861916737085,40.5861673286998,40.5861592446999,40.5861476818714,40.5861347965534,40.5861071841306,40.5860956159999,40.586077094123,40.5860587408308,40.5859624936451,40.5860088815037,40.5860147269352,40.5860147414862,40.5860820127716,40.5861133269506,40.5861336928696,40.5861145406478,40.5861690793973,40.5861355543003,40.5861008581095,40.5860916224936,40.5860592351651,40.5860500166706,40.5860569452636,40.586025009293,40.5860250389317,40.5860212132328,40.5860202618353,40.5859906098873,40.5860067742403,40.5859886002563,40.5859724306778,40.585939908785,40.585938976927,40.5859619346053,40.5859629196034,40.5859810935825,40.5859839264429,40.5860193174753,40.5860221938862,40.5860269773838,40.5860260613826,40.5860637775292,40.5860652518937,40.5860676143172,40.5860897796457,40.5860340817413,40.5860097993268,40.5859959440337,40.5859820980113,40.5859957737037,40.5859578344087,40.5859210803211,40.5858129616004,40.5858097375235,40.5857779707721,40.5857973172405,40.5857736265197,40.5857300966936,40.585753785451,40.5857720597669,40.5858038284768,40.5858006036095,40.5859030618031,40.5858733062725,40.5858304064738,40.585778304979,40.5857690486203,40.5856500522322,40.5855994633644,40.5855905815336,40.5856489935832,40.5857535958582,40.5857535558607,40.5857366263323,40.5857285446843,40.5857414503219,40.5857464678056,40.5857495427446,40.5857461951621,40.5857813375264,40.5857669009884,40.5857997054453,40.5857765402165,40.5857660927795,40.5857334862048,40.5857475856828,40.5857591743252,40.585776576424,40.5856931756735,40.5857117520443,40.5858384214364,40.5858320377786,40.5858446133875,40.5858211256566,40.5858105141531,40.5858561172118,40.5859925662073,40.5860180257399,40.5860239365624,40.586016175254,40.5860093812963,40.5860087299415,40.5860045356399,40.5859967616181,40.5859508074512,40.585955721418,40.5858944570638,40.5859264572269,40.5859627664731,40.5859952205555,40.5859777238722,40.5859415992494,40.5858584661354,40.5858007138123,40.5858007342269,40.5858418946175,40.5858928458923,40.5858997183448,40.5858948357177,40.585877211167,40.5858546759722,40.5858047063113,40.5857802257686,40.5857735353322,40.585682758902,40.5857054083196,40.5856463773686,40.5856377464535,40.5856325750993,40.5856534992268,40.5856830125098,40.5857133981574,40.5857002410519,40.5857128459713,40.5857598715735,40.5858062711555,40.5858398245601,40.5858790443537,40.5858981528953,40.5860923691072,40.5861965140625,40.5861932900707,40.5862528906471,40.5863347488031,40.5864026846226,40.5864674916164,40.5864584472685,40.5865751832022,40.5866309368622,40.586680240042,40.5866797298976,40.5867232877467,40.5867842729823,40.5868435134697,40.5868862584659,40.5869021174698,40.5868714209383,40.5869620152146,40.5870491258421,40.5870960823567,40.5871209110176,40.5871330856028,40.5872040910146,40.5871885067161,40.5872896899538,40.5873303850649,40.5873736229982,40.5874095823861,40.5874519685789,40.5875015346245,40.5875666615426,40.5875564026313,40.5875604570338,40.5875402253168,40.5873689695335,40.5873537958658,40.5875595037804,40.5875716445723,40.5875513732647,40.5875716032998,40.5875797136137,40.5875910371631,40.5876176915001,40.5876611471881,40.5877227591868,40.5877057733401,40.5876866612901,40.5876568907862,40.5876302929907,40.587615721094,40.5875978577892,40.5875788350309,40.5875592907799,40.587541877139,40.5875236292174,40.5875158305541,40.5874867139551,40.5874666932873,40.5873594171974,40.5873616001341,40.5874750134398,40.5875075927127,40.5876481286499,40.5876586772082,40.5876698832264,40.5876756416895,40.5876865790183,40.5877032072622,40.5877384649897,40.5877532747198,40.5877690507026,40.5878499299063,40.5878829990097,40.5879091693988,40.5880221762762,40.5879988001172,40.5879545358348,40.5879357950042,40.5879289015562,40.5878904518704,40.5878832584084,40.5878426338044,40.5878368427285,40.5877943659945,40.5877884954171,40.5877494198534,40.5876588205077,40.5875881588538,40.5875755029788,40.5875487358895,40.5877024605232,40.5877314843462,40.5876666035572,40.587732985372,40.587751386905,40.5878430388128,40.5878433141233,40.5878866447211,40.5878950645031,40.58797306001,40.5879796768783,40.588044598803,40.5881478913515,40.5881785950788,40.5882064451977,40.588219391397,40.5882063042317,40.5882213601303,40.588140492015,40.5880569718004,40.5879759202857,40.58796033563,40.58795340928,40.5880687563509,40.5880769993962,40.5879961872768,40.5880345564793,40.5880406841085,40.588074964004,40.5880788290168,40.5880880615342,40.5881321969524,40.5881406129447,40.5881641313252,40.5882152211497,40.5882289525983,40.5882355027287,40.588227906818,40.5882331438654,40.5882216549525,40.5882259656253,40.5882320897364,40.5882363915617,40.5882478894905,40.5882693843417,40.5882891175855,40.5882995640741,40.5883205745187,40.5883690147937,40.5884938293358,40.5885135318207,40.5884589205203,40.5886606097589,40.5890814722595,40.5891820752107,40.5893684966517,40.5893841286669,40.5894108796166,40.5895927189504,40.5897803772031,40.5899716599274,40.5901652073177,40.5903544408057,40.5905470476748,40.5907392590527,40.5909410189562,40.5911386873366,40.5911398505251,40.5912486819728,40.5913642801887,40.5913214467032,40.5913379303391,40.5912922681216,40.5913007413061,40.5912559242254,40.5912720169762,40.5912314344324,40.591238212301,40.5911993250032,40.5911578858748,40.5911417904657,40.5910563890116,40.5910445297163,40.5909515213959,40.5909591458144,40.5909287088473,40.5909151567498,40.5908297505734,40.590835680425,40.5906733402474,40.59035203456,40.5903371515992,40.590243795635,40.590165377911,40.5900379147356,40.5898458610949,40.5896452667077,40.5894521425308,40.5891022000975,40.5890771821149,40.58882524959,40.5889690160919,40.5889658248345,40.5889340350982,40.5889290341974,40.5889406237746,40.5889182156869,40.5888980331691,40.5888863735987,40.588882893466,40.5888892461941,40.5887839129039,40.5887762547007,40.5888625348115,40.588865431329,40.5888127267005,40.588779543255,40.5887617108295,40.5887432064096,40.5887267654152,40.5887152996017,40.5886781018476,40.5886351648781,40.5886256675595,40.5885802953276,40.5885726364207,40.588655223095,40.5886655853283,40.5886742970058,40.5886806480867,40.5886384346034,40.5886745591381,40.5886883308237,40.5887100184521,40.5887359957235,40.5887556462678,40.5887709506836,40.5887841492109,40.5888182502081,40.5888634578286,40.5888785043633,40.5889325551083,40.5889529207223,40.5889440326315,40.5889777372243,40.5889813236161,40.5890304276395,40.5891204362962,40.5890987407946,40.5890964224861,40.5890210034386,40.5890105015188,40.589008688311,40.5889946086241,40.5889766601528,40.5889621703253,40.5889196327745,40.5889056842255,40.5888673563162,40.5888537195754,40.5889096424096,40.5890043265495,40.5890192930559,40.589126361639,40.5891432640665,40.5891268813408,40.5891471651677,40.5890703851716,40.588813345444,40.5888240772554,40.5888693093378,40.5889395314925,40.5889506916214,40.5888788296275,40.588926286047,40.5889872446179,40.5889967703942,40.5889352003415,40.5889774395281,40.5890402121898,40.589046161586,40.5889866773582,40.5890274653285,40.5890896070101,40.5890979390407,40.5890352508016,40.589081151866,40.5891549881097,40.5891624607083,40.5890912863323,40.5890990269281,40.5891187004039,40.5891282222682,40.5891115272726,40.589118073385,40.5891377473502,40.5891460783946,40.5891258088785,40.589152966925,40.5892342330186,40.5892739697339,40.5892610664106,40.589285630589,40.589303815475,40.5893618468462,40.5894006195079,40.5894646672865,40.5895159978787,40.5894619976001,40.5894413996378,40.5893744431599,40.5893435111852,40.5893203551866,40.5893086935527,40.5892506624799,40.5892236591654,40.5892726573798,40.5892920689451,40.5894259965007,40.5895251092149,40.5896576899177,40.5897323289124,40.5897812224387,40.5897760868094,40.5898906412032,40.5899073446301,40.5897734847676,40.589807684238,40.5896881360247,40.5896531631011,40.5895636971058,40.5896061050715,40.5896766556911,40.589818527758,40.5899404597104,40.59003516763,40.5900490348098,40.5900204112388,40.5900376327123,40.5900169436062,40.5899568602871,40.5899525911326,40.5902529903378,40.5902529665436,40.590042691536,40.5900613730906,40.5902636614617,40.5903079886776,40.5903054903514,40.5902936080452,40.5902909794923,40.5905907213156,40.5905906930913,40.5903292586026,40.5903331134298,40.5906250773925,40.590740679402,40.5908596011971,40.5909078767068,40.5909207001257,40.5909207133987,40.590929956824,40.5909299714877,40.5909167683831,40.5909186942762,40.5906190006453,40.5906196836718,40.5909445664194,40.5909524168446,40.5909431760157,40.59094579826,40.5909576826589,40.5909564295722,40.5910012190209,40.591000054806,40.5910185414002,40.5910254169941,40.5910788712644,40.5910796919292,40.5910700549598,40.5910898602652,40.591093850738,40.5911111277293,40.591117027231,40.5912114008759,40.5912477158316,40.591190092991,40.5912112155772,40.5912099224987,40.5911914378681,40.591186176221,40.5914845820417,40.5914951237906,40.591229731614,40.5912257404035,40.5912415835584,40.5912734075961,40.5912960376398,40.59146198432,40.5914642023973,40.591730942143,40.5917208484941,40.5915281374321,40.5915413625085,40.5917169139653,40.5917472588918,40.5919851325328,40.5921351997628,40.5922450372618,40.592246341831,40.5921250838339,40.5919327918127,40.5917472421184,40.591755596429,40.5918296292896,40.5920281380392,40.5920954413046,40.5921322373641,40.5921887781218,40.5921939631561,40.5922991792237,40.5923013855175,40.5922980677793,40.5922990870311,40.5922435254257,40.592252239752,40.5922622680854,40.5922677474514,40.5923006993636,40.5923216963113,40.592365867781,40.5923803407174,40.5923893282566,40.5924263213872,40.5924366653248,40.5924681313465,40.5924800935136,40.5924649730626,40.5923117706091,40.5923080368534,40.5923567235912,40.5924455754654,40.5923781764713,40.5924062209704,40.5924408571781,40.592448312015,40.5924516662108,40.5924952291479,40.592491972534,40.5925549502941,40.5925626606095,40.5925838076451,40.5925911734687,40.5926109750163,40.592619404933,40.5926104951986,40.592553689837,40.5925176247102,40.5925124393904,40.592487799125,40.592483951136,40.5924685193816,40.5924715939887,40.5924541182888,40.592546697533,40.5925746041438,40.5926830463848,40.5926850164272,40.5926854210378,40.5926861047822,40.5926861624885,40.5927262780842,40.5927536199599,40.5927522435817,40.5927547812535,40.5927607661897,40.592665620317,40.5926783702925,40.5927185803395,40.5927362199116,40.5927567219398,40.5927788212136,40.5927918495356,40.5928049553849,40.5927895099413,40.5927773032086,40.5927716064022,40.5927330549768,40.5927328802013,40.5927324321921,40.5927320442294,40.5927282858821,40.5928171704239,40.5928533948731,40.5928550918009,40.5928558670553,40.5928568216414,40.5928742568568,40.5928812673253,40.5928989763144,40.5929027765538,40.5928951573214,40.5928692503329,40.5928724404524,40.5928767310125,40.5928845648917,40.5929192273728,40.5929503396256,40.5929644843638,40.5930002435208,40.5930002314411,40.5929585842145,40.5929171684681,40.5929048921328,40.5928968660083,40.5928915799497,40.5928981021803,40.5928920410189,40.592886397442,40.5928743703529,40.5928729639556,40.5928717848489,40.5928707918707,40.592903648605,40.5931200482481,40.5931234674815,40.5931245175213,40.5931257126369,40.593132097855,40.5931354076033,40.5931468283642,40.5931416189313,40.5931588869068,40.5930543971679,40.5930608793181,40.5930907311471,40.5931054688924,40.5932365634381,40.5932459751372,40.5933085723267,40.5933053216953,40.5931738154135,40.593158421667,40.5931450512278,40.5931439224456,40.5931865496794,40.5932474378241,40.5932988282366,40.5933726961014,40.5933664169611,40.5933588113477,40.5933484308838,40.5933674538902,40.5933759356175,40.5933914419607,40.5934367414716,40.5935250792281,40.5935842352589,40.5936461323504,40.5936993368409,40.5937821012394,40.5938763122136,40.5939324518857,40.5940057108167,40.5940945355596,40.5939729441846,40.5939388436041,40.5939410787585,40.5939320154433,40.5938851527021,40.5938767494417,40.5938311265415,40.5937686406428,40.5937390405164,40.5937283756832,40.5936975709029,40.5936744688665,40.5936668485714,40.5936023069232,40.5935954628713,40.5937109600285,40.5937221291514,40.5937842811981,40.5938266545742,40.5938379057807,40.5939306208969,40.5939060419233,40.5939116986035,40.5939023788237,40.5938144977448,40.5938802407008,40.5939633822249,40.593975941324,40.5940598115586,40.5941585932165,40.5941856705349,40.5941993045882,40.5941778195796,40.5941728407219,40.5941391426979,40.5941328401479,40.5940932945655,40.594085389135,40.5940717200815,40.5940171524764,40.5940006380612,40.5939945975093,40.5939877032812,40.5939827122678,40.5939654478809,40.5939380545103,40.5941048873305,40.5941608501941,40.5942389175861,40.5942969895319,40.5944026749499,40.5944512492791,40.5944674514553,40.5944768105665,40.5943876243493,40.5943819005208,40.5943687790735,40.5943301633592,40.5943234943433,40.594285298194,40.5942325414578,40.5942193330174,40.5942044976599,40.5942228425264,40.5942305777017,40.5942680533324,40.5942760669416,40.5943209272101,40.5943293803427,40.5943682702441,40.5943749557045,40.5944135713042,40.5944298923562,40.5943921221165,40.5944639509329,40.5944770397504,40.5944930153183,40.5944467575064,40.5944416504442,40.5944306556692,40.594459949861,40.5944415702909,40.5944169173925,40.5943937187183,40.5943879600316,40.5943436993341,40.5942875652701,40.5942441861187,40.5941884092193,40.5941833172628,40.5941911069058,40.5942331057652,40.5942654583594,40.59427625619,40.5942814378903,40.5942567654167,40.5942780439751,40.594303600137,40.5943497963823,40.5943554614039,40.5944047639345,40.594411674564,40.594436668934,40.5944532936219,40.5944659452062,40.5944822652154,40.5944890129844,40.594497530847,40.5945034030727,40.5945040096546,40.5945053702483,40.5945136605326,40.5945148285821,40.5945238302538,40.5945251373144,40.5945291720945,40.5945209907485,40.5945193786442,40.594506843226,40.5944950629109,40.5943659631095,40.5943708679028,40.59430090317,40.5942835124612,40.5942840992655,40.5943670080009,40.5943843287613,40.5943766225587,40.5944290809405,40.5945035184144,40.5945195537768,40.5945331942292,40.5945464507847,40.5945200932149,40.5945046898511,40.5944934212848,40.5944515252972,40.5944989552768,40.5945161012017,40.5945294278681,40.5945437151052,40.5945488916605,40.594616909501,40.5946401909827,40.5946544810895,40.5946866170627,40.5946989761846,40.5947099297313,40.5946886823703,40.5946854117663,40.5946924043024,40.5947282863058,40.5947943869441,40.5948287424691,40.5948630967674,40.5948919217799,40.5949046783187,40.5949163404872,40.5949169169366,40.5949120140488,40.5949149676658,40.5948425070207,40.5948458421366,40.5948023638896,40.5947956893184,40.594823558188,40.594763472297,40.5947857697939,40.5948436360398,40.594916096676,40.5949116860902,40.594929544525,40.5949117538167,40.5948427325185,40.5948037449692,40.5947157024411,40.5946691589953,40.5946452570163,40.5945596606102,40.5943338711616,40.5942364179676,40.594112228742,40.5940400187181,40.59395996142,40.5938684691243,40.5935630085774,40.5932876499216,40.5930858839751,40.5929911099309,40.5928301048992,40.5928341126146,40.5928539502189,40.5930111033848,40.5930370941335,40.5930445212135,40.5930503005205,40.5930077457381,40.5930048931612,40.592692830519,40.5926900933479,40.5928279487605,40.5928164551802,40.5927977673627,40.5927943936945,40.5926867929757,40.592661153688,40.5926354843446,40.5926022273217,40.5925517407717,40.5924798149176,40.5923007109402,40.5922635141393,40.5922630995174,40.592238386452,40.5922254194123,40.5921671345181,40.5921605812261,40.5921307668188,40.5920828098975,40.5920270758351,40.5920089287475,40.5919882405171,40.591965195667,40.5919467874105,40.5919283730722,40.5918048905622,40.591931042481,40.5918307414579,40.5918307388247,40.5918181989861,40.5918082058547,40.5918274324761,40.5918299941114,40.5918550696903,40.5918542401338,40.5917911939619,40.5916929706104,40.5916696887435,40.5916541661897,40.5916440092584,40.5916041841474,40.5916536881486,40.5916628859349,40.5916779051354,40.5916712137643,40.5917054109262,40.5917288122696,40.591726290866,40.5915975927682,40.5916001129938,40.5916886971561,40.5916419831331,40.5916344587678,40.5913611811785,40.5913603586684,40.5916369769959,40.5915885703906,40.5915697580716,40.5915066346912,40.5914810392866,40.5914317907456,40.5914129810017,40.5913504711831,40.5913529410094,40.5913964065531,40.591398901859,40.591239241308,40.5912367486238,40.5913345492299,40.5913420722816,40.5913379354235,40.5912929645734,40.5911997970364,40.5911665330439,40.5911363815044,40.5908094073668,40.5906999104822,40.5906091064255,40.5906154637556,40.5905275284181,40.5895461189241,40.5895313081193,40.5893265655722,40.5893303039233,40.5893117069833,40.589256258167,40.5892073401738,40.5890781513564,40.5889420667767,40.5888219542268,40.588849071569,40.5887784368194,40.5889693177816,40.588988862379,40.5889540930838,40.58876212496,40.5887708197028,40.5887512928331,40.5886795905867,40.5886698697708,40.5886235801202,40.588628541794,40.5885934130156,40.5885143863699,40.5884655204153,40.5884709063575,40.5884774471213,40.5886410797297,40.5886139158298,40.5884428251448,40.5884486290463,40.5884416160789,40.5884042986648,40.5883608666486,40.588321101382,40.5882789957141,40.5882579299451,40.5882415287279,40.5882298169219,40.5876073554742,40.5875600829038,40.5875291237003,40.5874768332291,40.5874069837847,40.5873281672295,40.5871692256316,40.587124684316,40.5870714416688,40.5870475374436,40.5868932874353,40.5868498252143,40.5867987337134,40.5868141600372,40.5869072763735,40.5869234224953,40.5868962630276,40.5869251176502,40.5870313269682,40.5870139476124,40.5869072783906,40.5868756340069,40.5869082249417,40.5869028431908,40.5868876384188,40.5868822341691,40.586890921866,40.5868855287218,40.5868304876831,40.5868572158949,40.5869553116769,40.5869798417641,40.5870356231265,40.5870552620413,40.5870875321145,40.5870950702471,40.5870838192219,40.5870906015995,40.5870818519363,40.5870615023714,40.587032490303,40.5870005883576,40.5869599998348,40.5869179560546,40.5868759288265,40.5868252892167,40.5867817283089,40.5866991622693,40.5866976939377,40.5865687912049,40.5864803613761,40.5864442590019,40.5864037173595,40.58636172267,40.5863291501996,40.5863264963894,40.5863238302567,40.5862939718823,40.5862992745232,40.5862948920627,40.586178107763,40.5861561431628,40.5861358060462,40.5860936539266,40.5861140034952,40.5861517671801,40.5861728527015,40.5861344085704,40.5861069435701,40.5858645230661,40.585870680114,40.5859174236894,40.5860500652094,40.5860453164807,40.5860251418758,40.5860157149571,40.5859923541546,40.5860154974507,40.5860065853164,40.5860403844605,40.5862594418086,40.5862541353324,40.5864000970985,40.5863982667155,40.5862701080439,40.5860991250298,40.5860439090086,40.5860207854419,40.5860261346352,40.5860012343489,40.5859941069715,40.5859592048157,40.5859210014728,40.5858926066881,40.5858659284199,40.5858124723165,40.5858124264444,40.5858035528246,40.5857197622978,40.5856573934011,40.5856003719806,40.5855469273653,40.5855024113561,40.5854668123828,40.5854185317093,40.5852957563478,40.5853615667394,40.5853792819641,40.5855290712393,40.5855575278396,40.5855753153876,40.5853398746667,40.5850713430468,40.5850192920032,40.5849783765727,40.5850414583568,40.585352647442,40.5852761547532,40.5852422945134,40.5852102225715,40.5851817136049,40.5851550284581,40.5850656342176,40.5849530767187,40.584903376891,40.5848643539804,40.5848250744776,40.5847828431806,40.5847346204372,40.5847096324114,40.5846761383218,40.5846566057423,40.5846468797561,40.5846417885912,40.5846407361673,40.5846517662773,40.5846650517936,40.5846743533238,40.5846837542238,40.5846766045508,40.5846836988751,40.584694301554,40.5847037767452,40.5847080864052,40.5847106932686,40.5847064279694,40.5846946180457,40.5846894837526,40.584677789648,40.5846596869149,40.5846337076476,40.5846287935656,40.5846157552385,40.5846118187122,40.584614774524,40.5846315973093,40.584646087547,40.5846590200997,40.5846586193133,40.5846525254128,40.5846510171256,40.5846599153094,40.584663046933,40.5846667553374,40.5846647231417,40.5846631660243,40.5846650199718,40.5846670245605,40.5846631628545,40.5846609797981,40.5846674704729,40.58468734936,40.5846943935461,40.5847096102007,40.5847178810451,40.5847181040187,40.5847281813326,40.5847416911658,40.5847401597485,40.5847427153797,40.5847435633532,40.5847413309929,40.5847471979053,40.5847553454115,40.5847634167081,40.5847732711904,40.5847792337264,40.5847805142821,40.5847777293789,40.5847808108712,40.5847815596555,40.5847823370787,40.5847871725786,40.5848064744882,40.5848176540485,40.5848178539654,40.584813160551,40.5848065873422,40.5848027254199,40.5847963813558,40.5847895364693,40.5847879556575,40.584781786494,40.584767568384,40.584762678671,40.5847662839331,40.5847722255628,40.5847677849239,40.5847475240609,40.5847311470097,40.5847140954493,40.5846976223565,40.5846878934832,40.5846776146192,40.5846725472123,40.5846732740731,40.5846786610042,40.5846743691117,40.5846745184402,40.584669075424,40.5846614718508,40.584662423032,40.5846603870543,40.5846709640895,40.5846705861854,40.5846695323776,40.5846760491165,40.5846791800451,40.5846806552338,40.5846746095924,40.5846732260333,40.5846766795762,40.5846815909558,40.5846743668986,40.5846653873912,40.5846657592661,40.5846597865538,40.5846543187103,40.5846529095493,40.584657993651,40.5846496176628,40.5846505393948,40.5846507615514,40.5846515875005,40.5846518323154,40.5846463896914,40.5846361328364,40.584646709622,40.5846520484941,40.5846493873647,40.5846415370729,40.5846289749874,40.5846047303331,40.5845875325776,40.5845750186123,40.5845799030943,40.5846044923832,40.5846314880486,40.5846462761792,40.5846615904636,40.5846716895321,40.584671262605,40.5846651666147,40.5846509724415,40.5846552048775,40.5846635767315,40.5846614675697,40.5846547703063,40.5846520594216,40.5846573964813,40.584667497122,40.5846653879121,40.5846632538404,40.5846611699435,40.5846515652375,40.5846390282843,40.5846345373673,40.5846479252323,40.5846636166019,40.5846747716754,40.5846755202546,40.5846820596949,40.5846742090305,40.5846646527365,40.5846723488669,40.5846881895486,40.5847115263479,40.5847400539912,40.5847528136471,40.5847587044899,40.5847570981955,40.5847542878211,40.5847601538456,40.5847769759168,40.5847909386307,40.584805626993,40.584822116276,40.5848287560689,40.5848283051276,40.5848301335238,40.5848371028034,40.5848469039766,40.5848509652211,40.5848580336052,40.5848750533924,40.5849074189924,40.5849109853794,40.5849071357092,40.5848957916382,40.5848920532806,40.5849035329591,40.5849017349869,40.584897896616,40.584907350654,40.5849137281667,40.584914210884,40.5849088312539,40.5849238847414,40.5849223140876,40.5849141315795,40.5849246949488,40.5849302260393,40.5849309061399,40.5849433477266,40.5849537306053,40.5849495653211,40.5849716808812,40.5849889812077,40.5850010760572,40.5850097469525,40.5850284316299,40.585045048708,40.5850561129289,40.585042943959,40.5850367065498,40.585034593897,40.5850431162911,40.5850612921161,40.5850913326035,40.585109956874,40.585099482502,40.5851490290008,40.5851512928639,40.585131281077,40.585168102723,40.5851981324227,40.5852197809199,40.5852238685948,40.585245527023,40.5852555584199,40.5852703364073,40.5852834421327,40.5852925405159,40.5853016108278,40.5853155377384,40.5853343754762,40.5853499479326,40.5853719967789,40.5853753364291,40.5853880317322,40.5854164291174,40.5854234452383,40.5854185882617,40.5854113172299,40.5853995215844,40.5853865202069,40.5853633419212,40.5853413723948,40.585331579614,40.5853218676852,40.5853186553895,40.5853167040322,40.5853220218478,40.5853428637486,40.5853624700381,40.5853734426838,40.5853986494687,40.5854124489509,40.5854237551563,40.585433134175,40.5854450076991,40.5854499924124,40.5854558775608,40.5854486851059,40.5854528728971,40.5854676745852,40.585477054062,40.5855084566338,40.5855235401427,40.5855357975252,40.5855387277719,40.5855339222619,40.5855352337654,40.5855397311119,40.5855548160084,40.5855653753518,40.5855776338463,40.5855797152481,40.5855765287412,40.5855834668558,40.5855964952804,40.5856079039803,40.5856136610872,40.5856197187679,40.5856161226201,40.5856303765757,40.5856088819961,40.5856279149058,40.5856159823474,40.5856195268637,40.5856445406409,40.5856766828211,40.585674276144,40.5856575802178,40.5856563652792,40.5856837463914,40.5856813245281,40.5857099068992,40.5857075033162,40.5857369821111,40.5846661618891,40.5845251540852,40.5844232681167,40.584077310797,40.5840621972455,40.5840069337284,40.5839019751362,40.5838300257755,40.5837551948854,40.5837173473468,40.5837138022341,40.5837090024076,40.5837136828037,40.5837307998489,40.5837328958707,40.5837591122947,40.5837843485854,40.5838105496045,40.5838732362516,40.5838744269389,40.5839536177232,40.5840259719442,40.5841398649231,40.5842080591651,40.5842315336653,40.5842325662829,40.5842334352726,40.584122815037,40.5833988086255,40.5832736926518,40.5832540183865,40.5832283218277,40.5831968277828,40.583159811778,40.5831175976484,40.583070554704,40.5830297370686,40.5829862880058,40.5829407762032,40.5829301940827,40.58291940108,40.5829086971864,40.582898379916,40.5828887360367,40.5828800335994,40.5828725144876,40.5828663876945,40.5828618235134,40.5828587543456,40.5828583884655,40.5828572365431,40.5828553326153,40.5828527329389,40.5828495143287,40.5828457718874,40.5828416161961,40.5828371700461,40.5828325648113,40.5828279365662,40.5828234220652,40.5828075438405,40.5827927831311,40.5827589476952,40.5827529102561,40.5827530383972,40.5827531691172,40.5827588159697,40.5827821509849,40.5827841007564,40.5827286107861,40.5827432334557,40.5827157123562,40.5828104470077,40.5828117788424,40.5828774200572,40.5828770001135,40.58288537179,40.5828970053988,40.5829115885519,40.5829219840521,40.5829333077863,40.5829452740036,40.5829575807401,40.5829699174389,40.5829819727869,40.5829934425703,40.5830040373523,40.5830134897758,40.5830150602646,40.5830174023055,40.5830204490151,40.5830241133857,40.583028290771,40.5830328618739,40.5830376961534,40.583042655553,40.5830478341461,40.5830526309486,40.5830569220396,40.5830605965627,40.58306355959,40.5830657345746,40.583082861252,40.5830999174631,40.5831053123198,40.5831089294249,40.5831106862004,40.5831105425392,40.5828697689353,40.5829185099782,40.5829613846996,40.5829259822475,40.5829435116021,40.5831111246186,40.5830205526583,40.5830171008412,40.5830105128434,40.5830009714811,40.5829887415259,40.5829741623575,40.582954585985,40.5829383997134,40.5829258381222,40.582919267412,40.5829175137313,40.5829206105132,40.5829284987191,40.5829410279652,40.5829460206743,40.5829494430204,40.5829512086188,40.5829512729034,40.5829496342514,40.5829463340247,40.5829391494307,40.5829375153692,40.5829414556924,40.5829509128842,40.5829657489002,40.5830147683023,40.5830313016941,40.5830587172603,40.5829645880439,40.5829671841773,40.5829797988935,40.5830942587381,40.5831102051843,40.5831390336737,40.5831525112819,40.5831654136289,40.5831249063024,40.5830201738323,40.5830969768703,40.5832178227645,40.5832429136836,40.5832539643878,40.5832750931892,40.5832548419039,40.5832539819588,40.5831526997929,40.5831535307011,40.5830194244126,40.5830211155521,40.5831519469038,40.5831559766932,40.5832775098497,40.5832775361669,40.5833130135419,40.5833144745385,40.583313468286,40.5833100211601,40.5833042235167,40.5832962273231,40.583286242175,40.583274529802,40.5832613972077,40.583247188622,40.5831839241283,40.5831812347393,40.5830592097459,40.5830602473431,40.5830093840605,40.5830009035584,40.5830000555913,40.5829761532149,40.5829793645221,40.5830054701534,40.5830111980704,40.5830116389341,40.5830047158509,40.5829487458329,40.5829466719949,40.5829520068768,40.5829504019046,40.5829576487865,40.5829869442244,40.5829797213591,40.5830046027029,40.5830029556755,40.5830097333418,40.58301909695,40.5830195383157,40.5831790512011,40.583163620918,40.5832214552797,40.58324050559,40.58324262903,40.5832303264113,40.5830660483288,40.5830661730295,40.5830266280393,40.5830162726738,40.5830155047848,40.5829949882178,40.5829946157726,40.582994449866,40.5829935577815,40.5829924620038,40.582992286305,40.5829913523961,40.5829911658764,40.5829909421266,40.5829722124067,40.5829779823202,40.583028323121,40.5830846994781,40.5830962682841,40.5831153202156,40.5831037757474,40.5831263919655,40.5831258725994,40.5830276797402,40.5830165167928,40.5830160194714,40.5830270659881,40.5830658570373,40.5830660635834,40.583233272364,40.5832354716259,40.5833297556946,40.5833467301642,40.5833488415083,40.5833404813011,40.583292818456,40.5832930939586,40.5833439671649,40.5833404789952,40.583116810717,40.5831168891333,40.5832795671417,40.5833411982782,40.5833379849913,40.5831778972712,40.5831644281751,40.583159141718,40.5831420842691,40.5831413449073,40.5831063672281,40.5831030049252,40.5830670217975,40.5830709378755,40.5830948380413,40.5830894538288,40.5830840648289,40.5831050398753,40.583137951556,40.5831394215039,40.5831649393669,40.583167268735,40.5833332150545,40.5833314462505,40.5831705356922,40.5831749723772,40.5833313340955,40.5833299305892,40.5833282255735,40.5832821364508,40.5832741176293,40.5832228621096,40.583213545574,40.5831590626892,40.5831491470539,40.5831147703437,40.5830873688107,40.5830881303294,40.5830936815741,40.5830938507278,40.5830872204,40.5830929753205,40.5830750691843,40.5830747962874,40.5830733530119,40.5830731730913,40.5830724900906,40.5830722889293,40.5830709163238,40.5830706975949,40.5830691323532,40.5830689072963,40.5830676813102,40.5830674562737,40.5830661068271,40.5830658055674,40.5830857907708,40.5830859768912,40.5831152407754,40.5831422724679,40.583154205896,40.5831954300086,40.5832069479591,40.5832052957653,40.5833283411957,40.5833276247321,40.5833024373269,40.5833024065313,40.5831229505862,40.5830876070798,40.5830912429559,40.5830756128176,40.5830746032367,40.5830739208197,40.5830736288219,40.5830723542197,40.5830712744719,40.5830707479564,40.5830703619062,40.5830854976952,40.5830883384156,40.5831233778349,40.583255342473,40.5833023064367,40.5832992274681,40.5832751161419,40.5831652834732,40.5831631108322,40.5831411412236,40.5831280240701,40.5830947766998,40.5831001799391,40.5831035324549,40.583090465205,40.5830990030751,40.5831132222253,40.5831293045491,40.5832636034395,40.5832985048831,40.5833013793596,40.5833367567982,40.583336626848,40.5833401474762,40.5835287364466,40.5835180832994,40.5836075559394,40.5835144761709,40.5831104237825,40.5831066795509,40.583508797614,40.5834921294643,40.5831273475165,40.5831228165721,40.5834896626333,40.5834710143611,40.5831345452144,40.5831308202111,40.5833370459805,40.583467754266,40.5834720091104,40.5831455739096,40.5831447188316,40.5834799516466,40.5834966260877,40.5831582912183,40.5831594248777,40.5835078044099,40.5835213782442,40.5831650445303,40.5831642348436,40.5835290521104,40.5835448750614,40.5831825185673,40.5831819316505,40.5835526626103,40.5835686852054,40.5831946402303,40.5831941044348,40.5835631525925,40.5835504676142,40.5832069407133,40.5832051680801,40.5835460332497,40.5835331820719,40.5831911918711,40.5831881009795,40.5835281953624,40.5834885962583,40.5833614377891,40.5832872646997,40.5831992651802,40.5830771769272,40.582988198261,40.582674343321,40.5826082108863,40.5820027496335,40.5820411460895,40.5820877271463,40.5821220959711,40.5822021954906,40.5822848078473,40.5823194010667,40.5822574839936,40.581996337616,40.5818004714696,40.5816154610821,40.5814292769107,40.5812591126834,40.5810562678324,40.5809955895593,40.5810046991626,40.5810193276454,40.5810333073843,40.5810541456304,40.5810683712786,40.581082852585,40.5810970957244,40.5811186541569,40.5811329257421,40.5812139890525,40.5812137358118,40.5812041376132,40.5811992769017,40.5811837895578,40.5813032767537,40.581303817021,40.5812213962226,40.5812106189632,40.5812293479839,40.5812301614114,40.5812203162711,40.5812205789826,40.5812326156076,40.58123317234,40.581193564408,40.5811946945556,40.5812129031722,40.5812153888693,40.5811648015251,40.5811623138186,40.5811845991348,40.5811834662258,40.5811320416059,40.5811446754172,40.5812814096513,40.5812836300748,40.5811451702622,40.5811457673611,40.5812837393372,40.5812860004732,40.5811484825206,40.5811474186865,40.5811984307363,40.5812372255851,40.5812692884731,40.5812767194712,40.5812647412035,40.5812400949458,40.5811960428421,40.5811469881365,40.5809712045966,40.5795418689227,40.5795210103254,40.5789586977327,40.5786804710955,40.5781788611469,40.5781708096787,40.5762659200969,40.5761631002208,40.5757009704299,40.5756605051268,40.5755899192009,40.5755657030523,40.5755318766133,40.5755277966682,40.5755154854877,40.5754853535459,40.5752216459977,40.5752264125888,40.5754356213388,40.5755094660102,40.5755969919202,40.5757272162725,40.5758424779582,40.5758604963564,40.5758192014433,40.5757724059501,40.5757227159583,40.5756227100842,40.5754284594975,40.5754235798471,40.57542020375,40.5754184272004,40.5754183007119,40.5754198278808,40.5754229652845,40.5754276237157,40.5754276610819,40.5755377945616,40.5755424016992,40.5755466808231,40.5755505172156,40.5755538080276,40.5755564650366,40.5755584170115,40.5755596116223,40.5755600168429,40.5755596218098,40.5755584371135,40.575556494514,40.5755317509135,40.5754880775628,40.5753735545318,40.5753821334367,40.5753918275846,40.5754023909897,40.575413555609,40.5754250381437,40.575436547228,40.5754473939339,40.5754577381075,40.5754673357943,40.5754759606444,40.5754834092513,40.5754895059486,40.575494106953,40.5755095118322,40.5755239035442,40.5755369013961,40.5755481615656,40.5755573861955,40.5755643312737,40.5755688130866,40.5755707130803,40.5755987880105,40.5756324663809,40.575676774845,40.5757202853315,40.5757489306385,40.5757728599584,40.5757896585766,40.5758010203754,40.5758066285627,40.5758064587654,40.5758005117216,40.5757888132769,40.5757714142722,40.5757567386283,40.5757382191423,40.5757162255022,40.5756911967471,40.5752934962107,40.5752690239823,40.5752663910593,40.5752636740749,40.5752609404769,40.5752582581253,40.5752555186664,40.5752528074915,40.5752501808339,40.5752476931739,40.5752453961087,40.5752408535587,40.5752375125227,40.5752354694497,40.5752352415627,40.5752357686018,40.5752370354291,40.5752390056582,40.5752416226989,40.5752617836983,40.5754463218017,40.5754838165848,40.57551372794,40.575538831992,40.5755570708675,40.5755683968184,40.575572780194,40.5755740357083,40.5755695787903,40.5755594397377,40.5755436874751,40.575522429085,40.5754958090802,40.575465657091,40.5754301639771,40.5753900065585,40.5753459505975,40.5752988361962,40.5752495617761,40.5751990669463,40.5751897112471,40.5752120177214,40.5751989335994,40.5751392595472,40.5751154323094,40.5750194263575,40.5750201172281,40.5750173285209,40.5750154403443,40.5750051840311,40.5749808721268,40.5749072886988,40.5748082236792,40.5747782042115,40.574689679863,40.5746499873339,40.5745516247391,40.5745621250408,40.5745595684338,40.5745335290625,40.5745205991529,40.5745205790298,40.57449199819,40.574460789116,40.5744243779154,40.57442444198,40.5744236266809,40.5744153402515,40.5743836659636,40.5743114469378,40.5742470492427,40.574204123507,40.5742008178708,40.5742417789995,40.574282902709,40.5742918898418,40.574294194837,40.5742965237054,40.574297232242,40.5742876437104,40.5742714772719,40.5742429086527,40.5742663170418,40.5742376225675,40.5740862971805,40.5740732721833,40.5741019825775,40.5742872331488,40.5743332674952,40.5757313370186,40.5758239808958,40.5767767492972,40.5773223573752,40.5774023122719,40.5784262863019,40.5791953984781,40.5795999594223,40.5806220917602,40.5816092361719,40.581680175764,40.5817534514838,40.5818251615806,40.5819168291301,40.5819689052405,40.5824478328215,40.5824805112151,40.582520165018,40.5825576242703,40.5825643168187,40.5826099228921,40.5827362543198,40.5826588505552,40.5828349700306,40.5828863086475,40.5829339794608,40.5829822625409,40.583035332417,40.583045726525,40.5830422708163,40.5830251348804,40.5830127880024,40.5828521516095,40.5828566752126,40.5831905458519,40.5832698724066,40.5834083571591,40.5835758970392,40.5842250311678,40.5845146628378,40.5846089594208,40.5846760046288,40.584746283206,40.5847918749835,40.5848270810659,40.5850293078417,40.5851490325848,40.5858127232536,40.5859683662622,40.5861247709756,40.5862810895005,40.5864364684721,40.5865147235995,40.587306286074,40.5880343523024,40.5887238198211,40.5894529116476,40.5892388640036,40.5891365659574,40.5890411764382,40.5889186179983,40.5888871750408,40.5888680664891,40.5888563457395,40.5887932710085,40.588738199577,40.5886808231431,40.5886314236517,40.5885285776684,40.5884266603017,40.5883219257882,40.5882220731785,40.588118774307,40.5879546107953,40.587941518708,40.5887089520017,40.5895773364773,40.5900172593661,40.5901061899912,40.5906406890456,40.5910645882994,40.591452646914,40.5919219335133,40.5919776507471,40.5921865378584,40.5924585327202,40.5925383440452,40.5925882793623,40.5926539529476,40.5928133880796,40.5929764216716,40.5930127592894,40.5932165610171,40.5933140021166,40.5933472320641,40.5935061546723,40.5935416487985,40.5936208352135,40.5936653067229,40.5939323051821,40.593997228133,40.5941369339831,40.594763406169,40.5954145396838,40.5958210782172,40.595884931775,40.595987010813,40.5960879017296,40.5961915417464,40.5962975233277,40.5963527300793,40.5963948531317,40.5965064534207,40.5966161089621,40.5967192064316,40.5967800269532,40.5967935381629,40.596882943568,40.5969788180569,40.5977905214336,40.5985187857771,40.5989099600676,40.5993158037006,40.6017943730231,40.6026170545397,40.6033481188611,40.6041947115372,40.6056518901444,40.6066715333735,40.6086295077702,40.6088141418023,40.6089359216909,40.6090497192104,40.6091504768934,40.6092531931632,40.6093891895262,40.6094031552795,40.6094177874826,40.6094596075738,40.6095552138141,40.6096744010222,40.6097764261755,40.6098786579925,40.6099863745259,40.6100988747117,40.6102015073052,40.6103020533396,40.6104030309351,40.6104627624443,40.610503715219,40.6106118778289,40.6107148274562,40.6108207661552,40.6109498656061,40.6111122395891,40.6113131859999,40.6113473439651,40.6113756569322,40.6114081679081,40.6114448062977,40.6114854926219,40.6115301384506,40.6115786468387,40.6115902447675,40.6123157278494,40.6130532176678,40.6136353579565,40.6140777104131,40.6142246005537,40.6147891311372,40.6153634067567,40.6160462091094,40.6158885305079,40.614803772404,40.6140808069615,40.6134117379848,40.6127225384378,40.6119928417343,40.6119194575028,40.6108564298636,40.609229317663,40.6075994773071,40.6074332974761,40.6069219435036,40.6070004560576,40.6065878610635,40.6061952096804,40.6059738630588,40.605497900603,40.6038731622438,40.602230711367,40.6026872808249,40.6010620694992,40.5994373827175,40.5977779281458,40.5973232949648,40.5971073036215,40.5968202649194,40.5960204511543,40.5950607791786,40.5941043148464,40.5931487882873,40.5921842516915,40.5918723492592,40.5914953697973,40.5912119158327,40.5903082078847,40.5890956514713,40.5879872778977,40.5866068549255,40.5865703350048]}]],[[{"lng":[-73.8260033749814,-73.8260600322682,-73.8263823750347,-73.8272072076456,-73.8289485211392,-73.8299041641565,-73.8305930643839,-73.8307132655342,-73.8308991069618,-73.8311564582916,-73.8315008443802,-73.8332165272826,-73.8333952937598,-73.8334783794503,-73.8335689574767,-73.8336425620393,-73.8341630764937,-73.8349471756521,-73.835900721417,-73.8359770711086,-73.836005107525,-73.8360278645999,-73.8361147658281,-73.8364085761741,-73.8364088015291,-73.8364090261818,-73.8367163908027,-73.8367166161094,-73.8367168530655,-73.8370366930364,-73.8370368821731,-73.8370370836197,-73.83736817904,-73.8377089419937,-73.8380575612948,-73.8395231273259,-73.8397243990885,-73.8397802516746,-73.840191993236,-73.8402420632721,-73.8406915419902,-73.8413393660909,-73.8426306799134,-73.8427189027115,-73.8429909127847,-73.843146253013,-73.8432588089117,-73.8434863043221,-73.8435697335957,-73.8438182573482,-73.8441728125617,-73.844537388464,-73.8449101116967,-73.8452889856384,-73.8456719821516,-73.8461595844368,-73.8466572411161,-73.8476241018882,-73.8485783880685,-73.848767252333,-73.848957126142,-73.8491459157301,-73.8493315621403,-73.8495120740421,-73.8504290537064,-73.850590510987,-73.8511012167543,-73.8526822571381,-73.852753706286,-73.8547165251997,-73.854699434123,-73.8547082395536,-73.854112647798,-73.8539610547933,-73.8539215421986,-73.8538948015939,-73.8537121987122,-73.8530566390123,-73.8525201905444,-73.8526653541771,-73.8551810971139,-73.8552927590464,-73.8553183028424,-73.855350187959,-73.8554283910726,-73.8553942350219,-73.8554395493513,-73.8555667831852,-73.8555977094858,-73.8556258725154,-73.8557145429801,-73.8558129540011,-73.8559200537607,-73.8567325773891,-73.8574306238659,-73.8581251154846,-73.8581773669283,-73.8582327984575,-73.858276818239,-73.8583290923231,-73.8584221083407,-73.858511660872,-73.8585976714024,-73.8586800647054,-73.8587587683495,-73.8588337133272,-73.8589277465738,-73.8590106373112,-73.8590819836905,-73.8591414922119,-73.8591948564638,-73.859202767927,-73.8592385824414,-73.8592636325765,-73.8592851159699,-73.8593868164633,-73.8594845604181,-73.8595394885174,-73.8595585851161,-73.8596250536085,-73.8596351660726,-73.8596636207086,-73.8597158631146,-73.8597534605845,-73.8597761798592,-73.8597838926762,-73.8597766601653,-73.8597593286286,-73.8597131364884,-73.8596606676163,-73.8596541683763,-73.8596425479584,-73.8596351129799,-73.8596361698067,-73.8596403110687,-73.8596890729929,-73.8597535876575,-73.8598335677945,-73.8599285549996,-73.8600378987578,-73.8606266329048,-73.8612240638327,-73.8615288665559,-73.8618336832683,-73.8621363821695,-73.8624254052537,-73.8627219509845,-73.8630185014243,-73.8635711113709,-73.864122975782,-73.8646872952352,-73.8652387061175,-73.8654761087032,-73.8660417615264,-73.8665724107751,-73.8671140456211,-73.8673090828058,-73.8676592737985,-73.8682106853056,-73.868453052108,-73.8687681732168,-73.8692721567242,-73.8692927042302,-73.8693102591821,-73.8697076535123,-73.8702113590573,-73.8706318513309,-73.8707456101135,-73.8708453942418,-73.8709308131908,-73.8710015610708,-73.8710112740359,-73.8711328338978,-73.8714098075705,-73.8714607424957,-73.8715474999877,-73.8723522953997,-73.8731694263047,-73.8740891317392,-73.8747547553187,-73.8749534951893,-73.8750915415561,-73.8747941417987,-73.8739739307465,-73.8731552720696,-73.8719205840257,-73.8714980070648,-73.8713430983512,-73.8712894048577,-73.8711223138123,-73.8710036316108,-73.8708649277179,-73.8693205085695,-73.869048387312,-73.8686094929539,-73.8684520354003,-73.868358533074,-73.8683180682867,-73.8682776151747,-73.8681058228117,-73.8679258648825,-73.8668280126407,-73.8658127061575,-73.8652477262981,-73.8649174897845,-73.8644708631116,-73.8627137642276,-73.8618182828136,-73.8616234186756,-73.8608717262406,-73.8604098922744,-73.8598592561211,-73.8593087683014,-73.8587246582933,-73.8586201644993,-73.8580176767162,-73.8566154109635,-73.8562856771093,-73.8556742771729,-73.8550508341339,-73.8541541809969,-73.8534013654509,-73.8524444347591,-73.851870674825,-73.851303526722,-73.8508760633661,-73.8507921646086,-73.8499544028441,-73.849564537853,-73.8485944796045,-73.8480129526487,-73.8475082034414,-73.8474631403263,-73.8473249412528,-73.8472136158788,-73.8468936619367,-73.8468393008462,-73.8467488196996,-73.8466465279918,-73.8464697015221,-73.8462333963283,-73.8459109394777,-73.8457582230802,-73.8456572550948,-73.8455644785115,-73.8454708956663,-73.8453836038644,-73.8453373978708,-73.8451446608186,-73.8450402111655,-73.844889056903,-73.8448547787918,-73.8448007955778,-73.8447467583562,-73.8447001317296,-73.8446759558276,-73.8445870704429,-73.8445141563524,-73.8444276585073,-73.844414828606,-73.8443543461236,-73.8442858422926,-73.8440792158507,-73.8437157627912,-73.8428458257842,-73.8427332863079,-73.8421224808986,-73.8414823138433,-73.8410026100729,-73.8405500384892,-73.839816503714,-73.8392009389378,-73.8392513141897,-73.8389995352069,-73.8389439796301,-73.8385970230017,-73.8382130123722,-73.8381325114004,-73.8378878855251,-73.837768570241,-73.8374927999677,-73.8373131229336,-73.8369773580296,-73.8360848440056,-73.8359713964449,-73.8358295092665,-73.8355481993605,-73.8341282331352,-73.8337588817707,-73.8327834605997,-73.8323212642399,-73.8318530552326,-73.8315524583811,-73.8313846950791,-73.8310200977168,-73.8306794998131,-73.8304290241852,-73.8297627450989,-73.828987611965,-73.8280832069699,-73.8277641290058,-73.8276286915821,-73.8275075320579,-73.8271407670679,-73.8263960468184,-73.8262502018818,-73.8261209530947,-73.8260033749814],"lat":[40.715413630791,40.7153993486023,40.7153106753392,40.715073713355,40.7146487412239,40.7144186894738,40.7142370635617,40.7142082424194,40.7141656017704,40.7140976747921,40.7139877114039,40.713070986944,40.7130079305458,40.7129629515836,40.7129169758843,40.7128670594696,40.7125916402772,40.7121627281736,40.7116413707688,40.7117059569769,40.7117296715407,40.7117490639129,40.7118251468743,40.7116417697625,40.7116416261768,40.7116414996779,40.7114703162521,40.7114701919314,40.7114700753335,40.7113118036555,40.7113117050822,40.7113116142325,40.7111669287835,40.7110364842713,40.7109208727847,40.7104964514565,40.7103987655874,40.7103855240801,40.7102768294158,40.7102619316906,40.7101532140614,40.7099462343632,40.7094329772343,40.7093980733765,40.7092869276406,40.7092234564188,40.7091681796368,40.7090557752932,40.7090196089831,40.7089118196223,40.7087784213437,40.708661054971,40.7085603313705,40.7084766794978,40.7084103661249,40.708350820549,40.7083186423409,40.7083326229842,40.7084387208288,40.708444578931,40.708438137523,40.7084193204789,40.7083883336808,40.708345661375,40.708087067055,40.7080398834242,40.7079009830216,40.7074181453227,40.707397147062,40.7067694963278,40.7067425546217,40.7052109741452,40.7044259340715,40.7042642171313,40.7042246126051,40.7041834191978,40.7039178878835,40.7031370466141,40.7022917236176,40.7023076309691,40.7025832673792,40.7025955017877,40.7026730950705,40.7030131506169,40.7033181986624,40.7033486380369,40.7034874101538,40.7036805227357,40.7037262256514,40.7037534210224,40.7038428266498,40.703926400887,40.7040032402576,40.7045614742863,40.7050346140336,40.7055135695479,40.7055496042367,40.705591689885,40.7056361659763,40.7056817265627,40.7057697131799,40.705859756802,40.7059517784979,40.7060456977616,40.7061414321087,40.7062388976188,40.7063924788172,40.7065500158478,40.7067107912256,40.706874064142,40.707053550507,40.707092043384,40.7072727451099,40.7075034553001,40.7076759187473,40.7084923136751,40.7092625701052,40.7096858418024,40.709850568005,40.7103461644909,40.7104216041147,40.7106212108104,40.7108208540233,40.7110228860619,40.7112263569445,40.7114303226755,40.7116338113396,40.7118450597847,40.7126055390835,40.713294646745,40.7133799614124,40.7134931446792,40.7139199103773,40.7139781313718,40.7140092192411,40.7142002939749,40.7143892338106,40.7145749229762,40.7147562704477,40.714932235724,40.7154871695649,40.7160373287648,40.7163149367086,40.7165925433462,40.7168767739987,40.7171481470524,40.7174280189449,40.7177078818569,40.7182766798916,40.7188448079169,40.7194270756022,40.7199767100267,40.7202809377529,40.7209009226014,40.7214866374512,40.722076403898,40.7222890245247,40.7226612566289,40.7232547486383,40.7234854940857,40.7238209071637,40.7244118357159,40.7244359294742,40.7244659908253,40.7251464341414,40.726187326382,40.7270588540253,40.7272695393737,40.7274845934406,40.7277032066697,40.7279245240285,40.7279576114015,40.7283717202997,40.7291781024809,40.7293263741385,40.729362383331,40.7296554848453,40.7299506191985,40.7302827923819,40.7305418917538,40.7306186957731,40.7306713632197,40.73075902678,40.7310032586413,40.7312439698152,40.7316139287872,40.7317505866538,40.7317993571146,40.7318162618719,40.7318715290089,40.7319056836445,40.731945599399,40.7324275432278,40.732513917941,40.7326531766484,40.7327133755154,40.7327401590446,40.7327536202895,40.7327670716494,40.7328262545154,40.7328725692482,40.7332457802965,40.7335838624784,40.7337622492319,40.7338665100468,40.7340072749305,40.734515053656,40.7347700602051,40.7348299731497,40.7350610856848,40.7352012602527,40.7353683856855,40.7355361283473,40.7357086441965,40.7357399071036,40.7359070835274,40.7363308371852,40.7364260425055,40.7365866581536,40.7367202216232,40.7368778133413,40.7370027582791,40.7372023129819,40.7373429291861,40.7375117275426,40.7376538599343,40.7376817560216,40.7379603043543,40.7381060928986,40.7385011710633,40.7387633444713,40.7390078070401,40.7389520315271,40.738771458077,40.7386439866839,40.7386712173942,40.7386692172142,40.7386517895016,40.7386170463539,40.7385394936967,40.7384358454849,40.7383070554127,40.7382068853172,40.7381174010484,40.7380022823602,40.7378732219504,40.7376091837968,40.7372777246965,40.7365109346524,40.7360953800625,40.7359115813815,40.7357514698091,40.7355428032014,40.7353625649347,40.7352081275373,40.7351123447011,40.7348797047254,40.7347031782081,40.7344980961156,40.7344712706516,40.7343447928451,40.73420144745,40.7338478000143,40.7332257299461,40.7320676427423,40.7319508736962,40.7313444363489,40.7307390894366,40.7302788999448,40.7298447299081,40.7290373869242,40.7282668630292,40.7281505773919,40.7277181914947,40.7276227839533,40.727026933597,40.7263674373549,40.7262015444086,40.7256974322974,40.7254339130347,40.7251278510906,40.724730158029,40.7240710603013,40.7226969573175,40.7225390861344,40.7223417181508,40.7219700249877,40.7202305328989,40.7198382960155,40.7188024294399,40.7183298975857,40.7179121433042,40.7176805628081,40.7175513171202,40.7173317240276,40.7171790647029,40.7169627709355,40.7167236830895,40.7165209811477,40.7162735966687,40.7161776325886,40.7161368980159,40.7161004581287,40.7160068511739,40.7156552145362,40.7155650238481,40.7154925266357,40.715413630791]}]],[[{"lng":[-73.9801716110372,-73.9802062856975,-73.9802064507635,-73.9802065458748,-73.9802271035243,-73.9802271618675,-73.9802271619049,-73.9802290135527,-73.980229025947,-73.9802289430904,-73.9802101227924,-73.9802100522445,-73.9802099218457,-73.9801720977647,-73.9801720148655,-73.9801718613518,-73.9801201271727,-73.9801199153776,-73.9801196428517,-73.9800602537324,-73.9800013861361,-73.9800011389069,-73.9800008903387,-73.9799268238399,-73.9799267048356,-73.9799265629445,-73.9798426188445,-73.9798422756669,-73.9798419793285,-73.9797570839648,-73.9797568353644,-73.9797565750851,-73.979680495715,-73.9796803298229,-73.9796801993435,-73.9796202571621,-73.9796200437267,-73.9796198663508,-73.9795787009564,-73.9775117140598,-73.9751573810001,-73.9744823403471,-73.9743670129249,-73.9742673549582,-73.9741845752545,-73.9741845515246,-73.9741195339228,-73.9740728354952,-73.9740728117791,-73.9740727874031,-73.9740445824795,-73.9737918996636,-73.9735549395919,-73.9732662806725,-73.9730510359984,-73.9726828851762,-73.9724290563281,-73.9723690104418,-73.972328462881,-73.9722222860573,-73.972088461074,-73.9720358499465,-73.9719089031181,-73.9715593035278,-73.9713963168815,-73.9722987063983,-73.9729390213175,-73.9730363553095,-73.9730365095256,-73.9730366868249,-73.973147506463,-73.973147600175,-73.9731476945395,-73.9732667358651,-73.9732668900588,-73.9732670673364,-73.9733876020281,-73.9733878261546,-73.97338805027,-73.9735039685979,-73.9746571434982,-73.9747284787882,-73.9748640363946,-73.9749587331438,-73.9750352598249,-73.9751731459734,-73.9752721343549,-73.9763353546432,-73.9772631110038,-73.9781907435932,-73.9791182187705,-73.980291154772,-73.9813288763919,-73.9818053385719,-73.9823093975949,-73.9830734007398,-73.9852841274358,-73.9883498667103,-73.9890587239361,-73.9918082348231,-73.99392923789,-73.9960456530866,-73.9962531437978,-73.9968137289788,-73.9970221625663,-73.9973004251067,-73.9978828574525,-73.9984657784391,-73.9990477303076,-73.9996388598532,-74.0002142135508,-74.0007978693591,-74.0013799010446,-74.0019597833134,-74.0025448697904,-74.0031251337937,-74.0037124585813,-74.0042940983291,-74.0048763207071,-74.0054578234326,-74.0060415268045,-74.0066225945808,-74.0072059128772,-74.0077879438202,-74.0083757478107,-74.0089527434016,-74.0095570830591,-74.0101605728009,-74.0105038368618,-74.011069092807,-74.0132448956053,-74.016067907324,-74.0187832339203,-74.0193110334044,-74.0195531816618,-74.0197129379459,-74.0200572173502,-74.0202929162027,-74.0205426995401,-74.0207733057556,-74.0209074004978,-74.021052986947,-74.0210873117535,-74.0211293325644,-74.0212079281793,-74.021281085446,-74.0213486517288,-74.0214104860531,-74.0214664593663,-74.0215164548883,-74.0215603682944,-74.0215981079466,-74.0216494666172,-74.0217543256647,-74.0219243974276,-74.0226109861283,-74.0229700932488,-74.0231059320848,-74.0232178021328,-74.0233168302438,-74.0234008536295,-74.0234682183412,-74.0234820367263,-74.0235178724573,-74.0235493908876,-74.0245735491043,-74.0246145327845,-74.0246637088286,-74.0257237706746,-74.0260978906359,-74.0320095332724,-74.032310843001,-74.0322687086582,-74.0322068984165,-74.0319785715731,-74.0318970849434,-74.0315976260735,-74.030518308634,-74.0290809088578,-74.0289976246877,-74.0291541899453,-74.0288624112706,-74.0288215975196,-74.0290914223967,-74.0290865428924,-74.0289695821108,-74.0285011625061,-74.0284254329046,-74.0282313430966,-74.0281905304934,-74.0284572109578,-74.0282056954501,-74.0277529818688,-74.0270343422336,-74.0260494840032,-74.0295471450287,-74.0297407821107,-74.0293899048662,-74.0291918306938,-74.0257175880481,-74.025381492653,-74.0250711143009,-74.0248395740679,-74.0246739634487,-74.0246148710311,-74.0243549693672,-74.0241456605057,-74.0251291195524,-74.0249679211714,-74.0255386457804,-74.0248443636344,-74.0252058118758,-74.0254155392946,-74.026051331968,-74.0258711376465,-74.0259280762528,-74.0257763316196,-74.0256909392053,-74.0255297154366,-74.0249112284902,-74.0250899910507,-74.0250773928451,-74.0251025719024,-74.0247716049567,-74.0245232805539,-74.0244880117486,-74.0244607759947,-74.0242891936496,-74.0242717304795,-74.0242402134753,-74.0255013904574,-74.0254160402859,-74.024177529734,-74.0238234739506,-74.0236544314197,-74.0235940029519,-74.0230599104703,-74.0230246483789,-74.0230201211284,-74.0228514179598,-74.0253689015052,-74.0252266297266,-74.0227237279578,-74.0226216193613,-74.0215413831922,-74.021344612879,-74.0212816342104,-74.0212465237341,-74.0212756487398,-74.0212756055027,-74.0213918821067,-74.0213595992164,-74.0212433243841,-74.0211852136861,-74.0211270778384,-74.0210523039221,-74.0213447436049,-74.0223373466683,-74.0222517319971,-74.0212641650561,-74.0209826122586,-74.0208986287083,-74.0209196747743,-74.0238070390313,-74.0235943449756,-74.0235343016559,-74.0233317465083,-74.0230992368154,-74.0229417228345,-74.0228892024582,-74.0228516750451,-74.021959000906,-74.0218690007394,-74.0217115188828,-74.0216215336762,-74.0212316545623,-74.0211867002789,-74.0232046472714,-74.0230621908923,-74.0221019516247,-74.0219369456161,-74.0218769355821,-74.021629462955,-74.0212845599841,-74.0212396106939,-74.0211496348449,-74.021824797455,-74.0216448641538,-74.020894697976,-74.0206396915899,-74.0206021818395,-74.0206021447956,-74.0204746182018,-74.0202421137104,-74.0200245922269,-74.0196195817725,-74.0194170284424,-74.0192520337412,-74.0191920302542,-74.019244507545,-74.0191769896448,-74.0190494830419,-74.0189669806886,-74.018921950883,-74.0188544172947,-74.0187718830647,-74.0187268658868,-74.0186223830856,-74.0181189787649,-74.0202558905293,-74.020051824543,-74.0178740722382,-74.0171531958103,-74.0174663345374,-74.0174189133139,-74.01980081652,-74.0197059641023,-74.0172671593659,-74.0169161785107,-74.0166504795976,-74.0163943753378,-74.0191084380312,-74.0189092362524,-74.01860569461,-74.0158537005682,-74.0154363226965,-74.0177423272749,-74.0176664440952,-74.0178657310968,-74.0176854917547,-74.0174862043472,-74.0175051641058,-74.0150473822186,-74.0149364589416,-74.0144213048455,-74.017458030879,-74.0166763665645,-74.0155416538901,-74.0140042839242,-74.013662739926,-74.0124685144183,-74.0118386205655,-74.0114221956705,-74.0111075041031,-74.0140224767802,-74.0131555493881,-74.0126535881149,-74.010234844318,-74.0085995696829,-74.0085726237899,-74.0077809596034,-74.007458581639,-74.0103720129722,-74.0104633172449,-74.0095507414204,-74.008683715913,-74.0061614113632,-74.0056859475689,-74.0055350125186,-74.0042835825012,-74.0041854573763,-74.0041462489221,-74.0042478861122,-74.0042541535357,-74.004261873855,-74.0042619105958,-74.0042788006124,-74.0043958054614,-74.004511732323,-74.0047016400148,-74.0047227489117,-74.0047522102546,-74.0047618286216,-74.0047687002363,-74.0049517259464,-74.0051236485758,-74.0051265893938,-74.0051267464898,-74.0051274776724,-74.0051410196299,-74.0052658954461,-74.0056203967066,-74.0057848663662,-74.0058271433906,-74.0058574019943,-74.0058579541624,-74.0058585741451,-74.0060381511255,-74.0062004623303,-74.0062269824792,-74.0062268410338,-74.0062250139011,-74.0060895834049,-74.0059290457147,-74.0059280206233,-74.0059236050303,-74.0054577555665,-74.0046014637946,-74.0042254917273,-74.0039133457195,-74.0038981294246,-74.0038314696353,-74.0038081547088,-74.0034880110065,-74.0038933418998,-74.0042393050174,-74.0043655675606,-74.00438799951,-74.0044659363108,-74.0045549848871,-74.0045552306069,-74.004558925644,-74.0045594850581,-74.0045599463601,-74.0045617924487,-74.0046015847354,-74.0045899436488,-74.004605743056,-74.0045436785081,-74.0047329812178,-74.0052384036559,-74.0053581286425,-74.0051559971932,-74.0050616081684,-74.0049801050689,-74.0049799343609,-74.0049785042413,-74.0049779670389,-74.0049751067993,-74.0049715775861,-74.0051923377509,-74.0051928192948,-74.0051974759056,-74.0051990760654,-74.0052001097679,-74.005201051297,-74.0052438497158,-74.0052315101843,-74.0052486303488,-74.0051862979809,-74.0053801441393,-74.005659649757,-74.0059974868269,-74.005795018362,-74.0056996374779,-74.005624151555,-74.0056221800746,-74.005620531528,-74.0056134868175,-74.0059083596535,-74.0059163835452,-74.0059177827927,-74.0059184740561,-74.0059201106916,-74.0063056732252,-74.0067283501606,-74.0074325142904,-74.0076637909847,-74.007721335067,-74.0077254519298,-74.0076743459451,-74.0076387753481,-74.0073051612683,-74.0072574263174,-74.0072661028004,-74.0072528355905,-74.0073187836599,-74.0071253264674,-74.0065246960012,-74.0067068594064,-74.0067991243028,-74.0068821530731,-74.0066293785957,-74.0065357955938,-74.0066415576674,-74.0064497998079,-74.0058415763249,-74.0060287077349,-74.0061193471018,-74.0062030658538,-74.0060460851898,-74.005992626418,-74.005921387034,-74.005898264369,-74.0058099935988,-74.0057578104549,-74.005779742958,-74.0057480923224,-74.0058232752111,-74.0057575379141,-74.0058927245943,-74.0057490883215,-74.0057414552513,-74.0057704613388,-74.005744630336,-74.0058349944877,-74.0058083297684,-74.0058492477061,-74.0058221184709,-74.0056414075448,-74.0056502595959,-74.005649251729,-74.0056431108041,-74.0056421339589,-74.0055631293286,-74.0043005326748,-74.0042950800297,-74.0042662247347,-74.0042637448154,-74.0036286250857,-74.0034034859563,-74.0045923863675,-74.0043229489738,-74.0052813217734,-74.0048619379266,-74.0011351950966,-74.0009442426561,-74.0009172343025,-74.0008340110844,-74.0007478568901,-74.0004941336115,-74.0005378069281,-74.000231413734,-74.0000302417739,-74.00007728967,-74.000099136671,-73.9998430156559,-73.9997100826993,-73.9995315260992,-74.0029246351639,-74.0022403099138,-74.0020328905917,-74.0020466706489,-74.0016195002109,-74.0012061134831,-74.0014647093271,-74.0006877486877,-73.9999814933912,-73.9995454149889,-73.9990260099839,-73.999053721827,-73.9989452019537,-73.9990263326417,-73.9990504410301,-73.99903627811,-73.9990432479231,-73.999063681498,-73.9990903918155,-73.9991754302429,-73.9991798832055,-73.9991897148097,-73.9992404910504,-73.9991533274088,-73.9990793532798,-73.9989695002465,-73.9986558069161,-73.998809725563,-73.9989116016789,-73.9989012653739,-73.9989168483876,-73.998892073152,-73.9987499149165,-73.9987125513134,-73.9985582446839,-73.9987136040983,-73.9987694105892,-73.9986810823641,-73.9986188803608,-73.9985412805443,-73.998456780805,-73.9982251003896,-73.9979893158487,-73.9978713002276,-73.9977147427698,-73.9976483710815,-73.9976184668881,-73.9975773213401,-73.9971162468849,-73.9969646512533,-73.9969298850858,-73.9968449048378,-73.9967524379256,-73.9965929918862,-73.9964028117054,-73.9940355463928,-73.991794990279,-73.99173365211,-73.991662828362,-73.989312730868,-73.9869510181568,-73.9845915735521,-73.9822303421316,-73.9801716110372],"lat":[40.6611546584779,40.6611059550012,40.661105712449,40.6611054605032,40.6610481277332,40.6610479746226,40.6610478483065,40.6609855784504,40.6609853264904,40.6609850557508,40.6609235563192,40.6609233224379,40.6609231336114,40.6608678802009,40.6608677538704,40.6608676188163,40.6608231246566,40.6608229358159,40.6608227913596,40.660790758261,40.6607576992805,40.66075756421,40.6607574922972,40.6607347322698,40.6607346965656,40.6607346866567,40.6607274411314,40.6607274147694,40.6607274504009,40.6607384667118,40.6607385023516,40.6607386016499,40.6607665944027,40.6607666568613,40.6607667380894,40.6608068638552,40.6608070082266,40.6608072145897,40.660853242154,40.6598627564165,40.658722794115,40.6583394497787,40.6581879035122,40.6580287871908,40.6578635778864,40.6578635053414,40.6576937524214,40.6575211934753,40.6575210859169,40.6575209783584,40.6573472525429,40.6563923239465,40.6556439390754,40.6546492613319,40.6539125067717,40.6526392779873,40.6517502587451,40.6515399489964,40.6513979285803,40.6510469517658,40.6506569087538,40.6504856276553,40.6500514098843,40.6488228287575,40.6482577861141,40.6479424820365,40.6476896796483,40.6476394713254,40.6476393901104,40.6476393368779,40.6476029543823,40.6476029187206,40.6476029011522,40.6475830983919,40.6475830721258,40.647583072167,40.6475809294576,40.6475809295095,40.647580957036,40.6475956805563,40.6477643729061,40.6477737093756,40.6477857238903,40.6477954978785,40.6478033942094,40.647817625097,40.6478306045699,40.6477261421713,40.647627336523,40.6475259915112,40.6474280612562,40.6472971614313,40.6471816727075,40.6471277997649,40.6469274038084,40.6466251347049,40.6457679387295,40.6445622438873,40.6441192410392,40.6457839691121,40.6470693112323,40.648340654929,40.6481749762339,40.6477104242787,40.6475377922889,40.6472720195273,40.6467185290791,40.6461592271116,40.6455973458957,40.6450418872787,40.6444782999913,40.6439175471607,40.6433567536584,40.6427987386857,40.6422357596208,40.6416745415814,40.6411158515382,40.640556240282,40.6399954645496,40.6394351358499,40.6388773342414,40.6383148016311,40.6377545819896,40.6371955287901,40.6366365576289,40.6360750812267,40.6354929641312,40.6349123382514,40.6345790963294,40.6347410636714,40.6353974741061,40.6361384510949,40.6369602855955,40.6370978064117,40.6372013433337,40.6372314829131,40.637437238496,40.6375973527029,40.6377745918535,40.6379594688674,40.6380803058091,40.6382266915978,40.6382635879785,40.6383087446018,40.6383981061366,40.6384901083802,40.6385845594067,40.6386812621815,40.6387800151832,40.6388806121901,40.6389828433429,40.6390864953723,40.6391176950941,40.6391813932466,40.6392848596933,40.6397085283277,40.6399346044787,40.6399953259269,40.6399015146036,40.6397977817249,40.6396857318486,40.6395673354794,40.6395332128084,40.6394447739147,40.6393203336925,40.6399239349924,40.6399533646609,40.6399833864462,40.640630519108,40.6402700203256,40.6438578080477,40.6440392144804,40.6440743792926,40.6440299288928,40.6438933802559,40.6438893493698,40.6442022398498,40.6452744247065,40.6444035969304,40.644471961493,40.6445814454196,40.6448660242256,40.6448421256519,40.6446005880281,40.6445830017997,40.6444974610169,40.6441775647027,40.6442507248249,40.6444382288378,40.6444143307089,40.6441560592482,40.6440159828903,40.6445062770219,40.6451978209834,40.6462613503262,40.648369331686,40.6484860262104,40.6488040551139,40.6486860167146,40.646615492291,40.6469123462266,40.6467256163785,40.6469444247654,40.6470945188787,40.6471511251188,40.6473992781535,40.6476151012599,40.6483231814573,40.6486059622675,40.6497821593481,40.650599638057,40.6508184678994,40.6506186970825,40.6509943007431,40.6511605357974,40.6511966531203,40.6513339779586,40.6513195464144,40.6514785506929,40.6511062852908,40.6509240026792,40.6509144129272,40.6508933055769,40.6506877074354,40.6509375534728,40.650918377161,40.6509446093354,40.6511120735898,40.6511025112466,40.6511335163134,40.6518398510342,40.6519338068551,40.6511917732122,40.6513537849132,40.6512561818363,40.6513156632538,40.6509743041348,40.6510027378937,40.6510063882352,40.6511691951618,40.6527214369273,40.6528298569597,40.6512973227688,40.6513115586734,40.6506716229113,40.6508518611848,40.6508173424369,40.6508349725643,40.6508615783713,40.6508915349418,40.6509677579884,40.6509972786109,40.6509259748308,40.6509776346733,40.6509432126181,40.6510982829278,40.6512604709084,40.6519106053817,40.6519816015068,40.651325710104,40.6511568226577,40.6512472752183,40.6512602828075,40.6530447285115,40.6532163689618,40.6530964260473,40.6529422401833,40.6529194384457,40.6528794845083,40.6528223738857,40.6527424115915,40.6522227819708,40.6522227991188,40.6522742381707,40.6523199512906,40.6526970247158,40.6528398368954,40.6540961168179,40.654233236292,40.6535879543102,40.65357656098,40.6535480123717,40.6536451652161,40.6539651085465,40.6541307688882,40.6542107552116,40.6546561757854,40.6548789828799,40.6544335754136,40.6544393333295,40.6544107795165,40.6542908243244,40.6542165892272,40.6542223434268,40.654165259253,40.6541653290523,40.6539997125671,40.6540340122128,40.6540225984942,40.6539426199811,40.6538855095091,40.653868394575,40.6538684082097,40.6537655977166,40.6536513654736,40.6535371368114,40.6534743105244,40.653491349023,40.6538852716079,40.6551182628812,40.6553359488745,40.6540615023309,40.6547751043621,40.6549268008961,40.654991840677,40.6564872105847,40.6565811637511,40.6551941879865,40.6554832749578,40.6553387965722,40.6556206428508,40.6573688843035,40.6575495644642,40.6578458740229,40.6562132400528,40.6566323967597,40.658098916725,40.6581856387715,40.6583084472986,40.6584529927612,40.6583374092433,40.6582723742977,40.6569503866935,40.6570669023843,40.6576080219514,40.6594501973867,40.6599837865673,40.6607583554761,40.6598119634401,40.6600287806369,40.6593163681453,40.6589128372748,40.6593286949617,40.6597062745807,40.6615297474401,40.661981597726,40.6619816540376,40.6604611870537,40.6595209230983,40.6595454277652,40.6602653283396,40.6605584762099,40.66239887973,40.6626421197901,40.6632676941304,40.6633720128403,40.6618450689905,40.6622747403605,40.6621838587469,40.6614448941013,40.6615283060674,40.6615616356813,40.6616232385631,40.6616270376996,40.6616317178119,40.6616317462903,40.6616419766,40.6617128945089,40.661783157976,40.6618934411057,40.6619054963952,40.6619223201888,40.6619281787486,40.6619323648217,40.6620417815344,40.662144558309,40.662149228189,40.6621494784689,40.6621512696458,40.6621844402592,40.6622701655656,40.6624939268494,40.6625825289519,40.6625901089683,40.6625751702991,40.6625748968652,40.6625752553436,40.6626788713456,40.6627725261127,40.662787827861,40.6627879667494,40.6627897570525,40.6629224019194,40.6631021581356,40.6631033065928,40.6631082507391,40.6628613666586,40.6623826685194,40.6621769612209,40.6619775273074,40.6619678058379,40.6619252162555,40.6619079457282,40.6622405561285,40.6624691744692,40.6626579634597,40.6627356766555,40.662714321342,40.6627619524186,40.6628163729128,40.6628161149099,40.6628122589389,40.6628116747466,40.662811191075,40.6628092664401,40.6627677231029,40.6627337328055,40.6627188851718,40.6626801461181,40.6624965039967,40.6627995354012,40.6628691297318,40.6630474140613,40.6629920412022,40.6630609974423,40.6630611423614,40.6630623534832,40.6630628080099,40.6630652279081,40.6630682132421,40.6632015530966,40.6632011205176,40.6631969295944,40.6631954879437,40.6631945591217,40.6631937108849,40.6631551909044,40.6631184696637,40.6631056204915,40.6630696014479,40.6628839269554,40.6630558535637,40.6632586108286,40.6634361512935,40.663376788661,40.663448288466,40.6634501554943,40.6634517162657,40.6634583902548,40.6636382836302,40.6636411938491,40.663641702057,40.6636419523083,40.6636425462783,40.6638634117764,40.6641187544208,40.6645424471289,40.6646835283664,40.6647186330198,40.6647427153915,40.6647911092658,40.6647959803311,40.6645975907526,40.6646429595109,40.6646730488294,40.6646903236431,40.6647298607577,40.6649152184743,40.6645472271604,40.6643629898568,40.6644183065336,40.664340372943,40.6641879301245,40.6642574036363,40.6643202113561,40.6645062067991,40.6641380206746,40.6639591365352,40.6640105666932,40.6639301682105,40.6638400056356,40.663890763214,40.6638495985759,40.6638756910749,40.6638740020266,40.6639227568017,40.663987763093,40.6640119423174,40.6640545638532,40.664114392912,40.6641903181232,40.6643265103922,40.6643818295162,40.6643974952811,40.6644176394675,40.6644695803183,40.6644782842434,40.6645032986197,40.6645287600596,40.6645314913933,40.6639003378438,40.6638998515595,40.6638968908038,40.6638964204332,40.6638490421734,40.6630918619022,40.6630955802223,40.6631152629881,40.6631137836403,40.6627348475346,40.6629857260957,40.6637351998329,40.6640523199753,40.664657003524,40.6650648219382,40.6629017235526,40.6630763919839,40.6630592527478,40.6630064421892,40.6630844614093,40.6633142270934,40.663333477707,40.6636279956228,40.6638213693872,40.6638452538302,40.6638563455063,40.6641055999407,40.6642301669541,40.664397485937,40.6664623121634,40.6667938351452,40.6667872586681,40.666769770351,40.6667662791745,40.6670181072029,40.6671695687076,40.6675459518988,40.6674502749087,40.6679003499712,40.668442972127,40.6688517992133,40.6689737744851,40.6690078884007,40.668921687297,40.6689171521993,40.6688802202326,40.6688734681893,40.6687314777972,40.6683196251858,40.6682966398876,40.6682982045003,40.66830628656,40.6686698811207,40.6690382718616,40.6691622442428,40.669514795548,40.6695961809436,40.6696485786396,40.6697272729153,40.6698045632178,40.6699384361749,40.67053337322,40.6706897367707,40.67133550167,40.6715353781237,40.6716020471051,40.6717391576037,40.6718301725648,40.6717046875678,40.6715680432278,40.6712028684063,40.6708420817575,40.6706614996912,40.670415448363,40.6703114375234,40.6702641422862,40.670199484385,40.6694733106429,40.669234549029,40.6691748470337,40.6690313247711,40.669060501367,40.6690931941774,40.669008413751,40.667848253555,40.6667662175984,40.6667365954421,40.6667042622991,40.6655663378135,40.6644252123044,40.6632837414232,40.6621414927937,40.6611546584779]}]],[[{"lng":[-73.7567032923353,-73.7566122198049,-73.7561856596601,-73.7559084720019,-73.7556625068432,-73.7555548669492,-73.7551681397903,-73.7550016504757,-73.7548784341632,-73.7546881382103,-73.7543963402083,-73.7540914239923,-73.754969194628,-73.7557712100535,-73.7565465244302,-73.7572855504248,-73.7579743023855,-73.7586756908226,-73.7593851050133,-73.7594414294099,-73.7595009415023,-73.760306231218,-73.7611382718999,-73.7619699488974,-73.7624033376402,-73.7627661541313,-73.7636077413815,-73.7644695172355,-73.765397945285,-73.7666409517761,-73.7673322808688,-73.7681799066302,-73.7687043494028,-73.7690621074323,-73.7691391403289,-73.7692253578,-73.7700798474792,-73.7711041071751,-73.7719212200709,-73.772758592226,-73.7735713516841,-73.7744423816123,-73.7752992789752,-73.7757145837482,-73.77618628294,-73.7771234697215,-73.7773063386292,-73.7780011969971,-73.7788695743188,-73.7795716474231,-73.779725536396,-73.7799800524784,-73.7804203408726,-73.7805889280165,-73.781782739708,-73.7822712657046,-73.7823665003101,-73.7824704324181,-73.7826254745131,-73.7835607566972,-73.7844614449882,-73.7853527219895,-73.7857519848189,-73.7861600592494,-73.7865752862753,-73.7869959870821,-73.7874204069056,-73.7878467841394,-73.7884348118371,-73.7884241033582,-73.7884240885826,-73.7884241075716,-73.7884340315063,-73.7884340590823,-73.7884341342646,-73.7884653920933,-73.7884654550029,-73.7884655771321,-73.7885160889831,-73.7885161549744,-73.7885162535477,-73.7885816801997,-73.7886396620547,-73.7886963591255,-73.7887509288496,-73.7888025602805,-73.7888504861383,-73.7888939941983,-73.7889324378942,-73.7889652459334,-73.7889919307762,-73.7890120958796,-73.7891487964827,-73.7892833506776,-73.7894141212479,-73.7902154424164,-73.791014107118,-73.7920285465067,-73.7930380005234,-73.7938960996077,-73.7947305235292,-73.7956166896185,-73.7963941803779,-73.7973140076359,-73.7977681013414,-73.7981839240752,-73.7989815214527,-73.7993042528533,-73.8002218519339,-73.8010769978964,-73.8018572811556,-73.8027872140161,-73.8044998746596,-73.8065887271707,-73.8084933305621,-73.8090007105034,-73.8096898533001,-73.8105887763747,-73.8119043619029,-73.8127805953003,-73.8144393186543,-73.8152427268333,-73.8164004666223,-73.8170276805223,-73.8170973875645,-73.817355290755,-73.8174001053499,-73.8180990519697,-73.8182167099207,-73.818285663457,-73.8186127527825,-73.8189210252736,-73.8189930568014,-73.8190501695226,-73.8191072958393,-73.8191613628179,-73.8192154306293,-73.8195442616115,-73.8197062687685,-73.8202625598922,-73.8203231300877,-73.8203905504065,-73.8204870313979,-73.8206415970137,-73.820778189738,-73.8210335440497,-73.8217471552359,-73.8226403115576,-73.8228579448664,-73.8230686423718,-73.8232722406516,-73.8234685822679,-73.823657514442,-73.8238388906146,-73.8239440598338,-73.8242644916464,-73.8242894051795,-73.8245608126472,-73.8246934397495,-73.8248322241323,-73.8254606073228,-73.8255230749373,-73.8255508516249,-73.8255786292369,-73.8255900058741,-73.8256293522369,-73.8256858368402,-73.825739346338,-73.8257850146509,-73.825896787801,-73.8259194682017,-73.825980532864,-73.8259971641182,-73.8260489242825,-73.8260563284496,-73.8260748601592,-73.8261100515755,-73.8261332357072,-73.8263017384772,-73.8262626196858,-73.8262299906233,-73.8262038903055,-73.8261843499503,-73.8261713929407,-73.8261650347962,-73.8261652832232,-73.8261721378836,-73.8261855906331,-73.8262056254452,-73.8262322184311,-73.8262653378673,-73.8263056252432,-73.8263536691524,-73.8264093876511,-73.826472685646,-73.8265434548205,-73.8266215744528,-73.8276905906447,-73.8278075050829,-73.8284558362932,-73.8285900506941,-73.828888460266,-73.8290510321779,-73.8292024845127,-73.8294162483505,-73.829650668058,-73.8299559031706,-73.8303432587079,-73.8306376733336,-73.8308841116663,-73.8310466747282,-73.8314215868743,-73.8317176497454,-73.8318518524854,-73.8320244861033,-73.8321318898429,-73.8322452210354,-73.8323286336183,-73.83244264495,-73.832537116957,-73.832605308566,-73.8328338102035,-73.8328618322206,-73.8328869747541,-73.8329172127246,-73.833721615217,-73.8339614971016,-73.8346605681255,-73.8347600499883,-73.8350136332837,-73.8351842744934,-73.8355686478378,-73.835832034463,-73.8359282197685,-73.8360070898521,-73.8361277861021,-73.8363562498459,-73.8363669167192,-73.836544046172,-73.8367283341533,-73.8367445758512,-73.8371588675407,-73.8372208649882,-73.83738179052,-73.8374424652162,-73.8375364069957,-73.8375585859024,-73.8375814379533,-73.8376795835559,-73.8377217196385,-73.8376919059955,-73.8376834280763,-73.8376057893524,-73.8373174895486,-73.8372319002147,-73.8371455035866,-73.8367585182244,-73.8361285658933,-73.8359156487578,-73.8359019695286,-73.8358613187213,-73.8351795043705,-73.833868509533,-73.8329689305268,-73.8320706479482,-73.831639755564,-73.8315594226786,-73.8310970924222,-73.8311554935487,-73.831198727747,-73.8312400552556,-73.8312881943025,-73.8313011725404,-73.8303438659767,-73.8303961756113,-73.83090596523,-73.8309942308935,-73.8311345171537,-73.8305355123144,-73.8294675199701,-73.8280915257717,-73.8279496908658,-73.8279645508448,-73.8279003027045,-73.8276056949615,-73.8275238028317,-73.8274982660807,-73.8274550878747,-73.8274094222052,-73.8273135404409,-73.8272277268523,-73.8271388594393,-73.8270529611979,-73.8270122248051,-73.8269582483883,-73.8268719177106,-73.8266951412572,-73.8265726273055,-73.8264679595493,-73.8263916478629,-73.8263378820486,-73.8263091815382,-73.8262380227564,-73.8261403824347,-73.8260258503621,-73.825975804621,-73.8259167329176,-73.8258218972737,-73.8258136411484,-73.8256897373689,-73.8256415128456,-73.8256064165045,-73.8255647887844,-73.825560793229,-73.8254041332308,-73.8249743999207,-73.8249480087467,-73.8248117842176,-73.8248549614948,-73.8249838447333,-73.8251258065185,-73.8252057209488,-73.8252701510202,-73.8253632475165,-73.8253738766737,-73.8252857978249,-73.8244595325713,-73.8235721143048,-73.8230151947775,-73.8217006188712,-73.8212199748999,-73.8210086280554,-73.8194832991281,-73.8189066552469,-73.8186304914798,-73.8177436933596,-73.8171592827276,-73.8166446777877,-73.8159359422738,-73.8152246716851,-73.8151033194465,-73.8150499868699,-73.8149975569087,-73.814894970308,-73.814073820425,-73.8132240172633,-73.8122773782403,-73.8113972909521,-73.8104043557634,-73.8094114217823,-73.8089301670512,-73.808448913235,-73.8080525845573,-73.8075208191378,-73.8065788386773,-73.8056455091005,-73.8047129152036,-73.8046654326126,-73.8046155349878,-73.8036360051951,-73.8026863206076,-73.8018083430405,-73.8013215540357,-73.8008915119533,-73.8000029241536,-73.799111957239,-73.7982205892731,-73.797292605541,-73.7968479577502,-73.7964021870636,-73.7961158477359,-73.7958868169562,-73.7953377292227,-73.7944080175009,-73.7936934138514,-73.7929788166895,-73.7929160314509,-73.7928579703721,-73.7920281759568,-73.791115264333,-73.790207501379,-73.7893472725742,-73.7886511024845,-73.7884824349903,-73.7875944436014,-73.7867351682107,-73.7866908531653,-73.7866484461612,-73.7857705120003,-73.7848424455737,-73.7840094412037,-73.7834969715438,-73.7831101185108,-73.7821600971817,-73.7817652682689,-73.781376988781,-73.7812185758443,-73.7810056636334,-73.7806858491643,-73.7803660354378,-73.7796564130617,-73.7785992477799,-73.7780583566693,-73.7757971337699,-73.7757383692709,-73.7756918242702,-73.7755123829721,-73.7748638213836,-73.7744433045204,-73.77403143122,-73.7736218517438,-73.7732153479139,-73.7728126768902,-73.7724146100267,-73.7716209796025,-73.771566719034,-73.7715340231324,-73.7714521884745,-73.7713767848846,-73.7703898232083,-73.7693716412278,-73.7685770122043,-73.7677299142539,-73.7677061458967,-73.7676150802808,-73.7669786290539,-73.7668785359679,-73.7667631486094,-73.7666335257641,-73.7664910963283,-73.7663375608592,-73.7661748475612,-73.7655684981058,-73.7651512888328,-73.7643149555986,-73.7636122541941,-73.7631681653846,-73.7626829717927,-73.7625969477083,-73.7625308618953,-73.7624860927727,-73.7624634837631,-73.7624633455236,-73.7624853862954,-73.762528757224,-73.762733034679,-73.7624953394349,-73.7634077835835,-73.7647122863809,-73.7637401047644,-73.7636997917016,-73.7643401501721,-73.7649166761363,-73.7655508605399,-73.7656437446563,-73.7655885617446,-73.7652883037964,-73.7648685309736,-73.764350715262,-73.7638186673539,-73.7632753774446,-73.7623420983915,-73.7616081443854,-73.7611408368041,-73.7602421099525,-73.7599381830033,-73.75831675517,-73.7578714145791,-73.7568485473756,-73.7567827271552,-73.7567473961243,-73.7567032923353],"lat":[40.7262294326618,40.7262079265278,40.7258957432521,40.7257066612665,40.7255774665291,40.7255209269319,40.725359040128,40.7252865726765,40.7252210409409,40.7251111605688,40.7249214405119,40.7246919062893,40.724159647309,40.7236402158935,40.7230876094671,40.7225703223631,40.7220907361016,40.7215998160167,40.7210987066723,40.7210634437532,40.7210273722768,40.7206466438225,40.7203291771857,40.7200036100347,40.7198085814109,40.7196387608677,40.7192821420549,40.7188903928791,40.7183560323431,40.7176466136632,40.7172897968106,40.7169952203389,40.7168090292282,40.7166837679547,40.7166567985854,40.716626587994,40.7163272024246,40.7159750627523,40.7156850444531,40.7153972209501,40.7151200953687,40.714905043129,40.7146963140527,40.7145984549217,40.714485574205,40.7142619940852,40.7142093168187,40.7140511241328,40.7138492976283,40.7136741597363,40.7136357700218,40.7135745712783,40.7134687101548,40.7134281756626,40.7131399931981,40.7130251300728,40.7130027431969,40.712976581028,40.7129375484909,40.7127107883543,40.7124939049805,40.7122836170325,40.7121639526009,40.7120600713426,40.7119724932768,40.7119016092442,40.7118476784602,40.7118108331664,40.7119846876091,40.7120586532517,40.712058799811,40.7120589211358,40.7121353010743,40.7121354916038,40.712135665803,40.7122095427143,40.7122096993006,40.7122098570009,40.7122763272035,40.7122764146066,40.7122765025721,40.712331847506,40.7123265072019,40.7123158381413,40.7122999988747,40.712279224786,40.712253824594,40.7122241755897,40.712190718555,40.7121539506849,40.7121144183749,40.7120727091008,40.7120568856387,40.7120317286485,40.7119975320017,40.7117170446768,40.7114325850964,40.7110693716987,40.7107110754255,40.7103523293739,40.710012461966,40.7097530791751,40.7095315794122,40.7092701987566,40.7091431883419,40.7090243932807,40.7088009926084,40.7086982316472,40.7084458015137,40.708201730875,40.7079798752269,40.7077158030576,40.7072277910612,40.7066339100103,40.7060867460048,40.7059488744024,40.7057462554824,40.7054960718278,40.7051239401774,40.7048739630061,40.7044021505635,40.7042024395625,40.7040833531051,40.7040334993715,40.7040298015878,40.7045501397848,40.7046360531532,40.7059737147275,40.7061812339367,40.7063028504822,40.7068533995611,40.7073499060442,40.7074719035871,40.7075702209151,40.7076685389046,40.707760332058,40.7078521164746,40.7084383738074,40.7086918535547,40.7095380732723,40.7096109608246,40.7096802769619,40.7097944308468,40.7099712268711,40.7101568997869,40.7104270358934,40.7110403038144,40.7117522686562,40.711939528439,40.7121313266101,40.7123275144605,40.7125279397826,40.7127324472787,40.7129408783817,40.7132332993445,40.713816425045,40.7138700661059,40.7142550301751,40.7144431443631,40.7146399929159,40.7155496455943,40.7156538817455,40.7157082448787,40.7157626086762,40.7157742713998,40.7158630879316,40.7159906102577,40.716115058784,40.7162240435448,40.7165790339299,40.716651065055,40.7168408866243,40.7168925820097,40.7170534793043,40.7170764916406,40.7171340982333,40.7172848126189,40.7184397614148,40.718668746462,40.7188111258284,40.7189544486669,40.7190985437859,40.719243239071,40.7193883616893,40.7195337382965,40.7196791949997,40.7198245582957,40.7199696545494,40.720114310444,40.7202583531872,40.7204016107181,40.7205451263331,40.7206872534833,40.72082774961,40.7209663744525,40.7211028920193,40.7212370693434,40.7228929493171,40.7230457330009,40.7237864891577,40.7239150660168,40.7241864546952,40.7243257085998,40.7244489250008,40.7246076866053,40.7247754658591,40.7249823506942,40.7252323721525,40.7254182477499,40.7255825299395,40.7256909111136,40.7259642696052,40.7262216815235,40.7263545138775,40.726540622443,40.7266713380303,40.726825720977,40.7269464473026,40.7271259312655,40.7272876978599,40.7274174436019,40.7278415325976,40.7278934438011,40.7279426412377,40.7280018088886,40.7295757349778,40.7300335936821,40.7313813846617,40.7315735251094,40.7320492584897,40.732389588995,40.7331157161877,40.7336194406291,40.7338168611038,40.7339787413259,40.7342413120032,40.7350085921502,40.735124124875,40.7370436587464,40.7384763502197,40.7386025705801,40.7400861519177,40.7402965982237,40.7408428673477,40.7410671166721,40.7413894961949,40.7414656197345,40.7415622591896,40.7419772525247,40.7423663677531,40.7432368830526,40.743300339209,40.7433120536205,40.7433453341666,40.7433554517918,40.7433644883358,40.7434027793409,40.7434358072001,40.7434308938952,40.7433798061134,40.7432279845386,40.7430720507685,40.7427722064174,40.742593616599,40.7424509378266,40.7423991372422,40.7427847418805,40.7427397573551,40.7423409179436,40.7416390413239,40.7409566917453,40.7402648871458,40.7395610621863,40.7394770969316,40.7391612062805,40.7391327638927,40.7385654949987,40.7385619069765,40.7375201947633,40.7370244827535,40.7370831757755,40.7378195987375,40.7385032039502,40.7385024519221,40.7385043519711,40.7385149723389,40.7385156038626,40.7385166711569,40.7385220674502,40.7385333996315,40.7385435406457,40.7385540432256,40.7385641933642,40.7385690085487,40.7385897733083,40.7386229847228,40.7386909913284,40.7387381221347,40.7387783881571,40.738807744776,40.7388284283118,40.7388420593962,40.7388758547659,40.7389222299026,40.7389766249098,40.7390003952147,40.7390456971277,40.7391184248319,40.7391290603414,40.7392886430774,40.7393507546433,40.7393959559896,40.739449572182,40.7394543595712,40.7394882257504,40.7394404262537,40.7395671055064,40.7396309598996,40.7398293639291,40.7403431380092,40.7410438045624,40.7414415368014,40.7417531841915,40.7421906660535,40.7422322404994,40.7422094961843,40.7419495404638,40.7416638128473,40.7414846222237,40.7410357525542,40.7408798052049,40.7408096601895,40.7402831022068,40.7400902263996,40.7399989035571,40.7397042613101,40.7395112749715,40.7393523000362,40.7391278608713,40.7389780482677,40.7389524852625,40.7389431338887,40.7389325861239,40.7389157436598,40.7387809020789,40.7387022549407,40.7386644514245,40.7386293072684,40.7385896483002,40.7385499718919,40.7385323803882,40.7385147868745,40.738500294466,40.7384808479782,40.7384472109873,40.7384186525956,40.7383939487086,40.7383929854824,40.738391577879,40.7383608519982,40.7383310516215,40.7383026552872,40.7382842022456,40.7382690155478,40.7382376243901,40.7382061404715,40.7381746306951,40.7381854288368,40.7382355413158,40.7382823581914,40.738336140698,40.738376374998,40.7384936727728,40.7387482308308,40.7389500622675,40.7391518812423,40.7391677614787,40.7391797328983,40.73940358109,40.7396498394492,40.7398947039537,40.7401263377529,40.7403257146845,40.7403682781607,40.7406179583689,40.7408417760527,40.7408529864632,40.7408667486418,40.7411106793814,40.741368529938,40.74159935688,40.7417413598523,40.7418483056439,40.7421155489653,40.7422164053246,40.7423199933991,40.7423622505907,40.7424195413359,40.7425056067888,40.7425916631466,40.7427293105529,40.7429081226516,40.7429864891389,40.743317666176,40.7433256471641,40.7433335887638,40.7433568425023,40.7434533366435,40.7435158996431,40.7435676012212,40.7436304626194,40.7437043961097,40.7437892494286,40.743884845222,40.7441597313636,40.7441795155559,40.7441916253791,40.7442215225215,40.7442510355007,40.7447379136895,40.7452203090864,40.7455222048845,40.745776226174,40.7457227427204,40.7455263553193,40.744222968236,40.7440935792063,40.7439703628017,40.7438548526522,40.7437484301854,40.7436522585927,40.7435672716866,40.7432581550272,40.7424373457594,40.7406726268385,40.7391684115849,40.7382617079325,40.7372558362195,40.7370873264227,40.7369116801443,40.7367309819523,40.7365475010895,40.7363636253029,40.7361816951815,40.7360039606939,40.7352621626723,40.7347345589719,40.7344677423728,40.7340856997238,40.7329128725579,40.7328641168479,40.7327529552508,40.7326546728048,40.7325442834415,40.7325331267391,40.7324675205314,40.732114664552,40.7316686396683,40.731151192136,40.7306835738073,40.7302405411147,40.7295382907013,40.7290475344412,40.7287944142644,40.728307611567,40.7281584118185,40.7273624071146,40.7271068514865,40.7263558121672,40.7263057848626,40.7262728959838,40.7262294326618]}]],[[{"lng":[-73.8359156487578,-73.8361285658934,-73.8367585182244,-73.8371455035866,-73.8372319002148,-73.8373174895486,-73.8376057893523,-73.8376834280764,-73.8376919059957,-73.8377217196386,-73.837679583556,-73.8375814379535,-73.8375585859024,-73.8375364069957,-73.8374424652163,-73.8373817905202,-73.8372208649882,-73.8371588675407,-73.8367445758513,-73.8367283341535,-73.8365440461719,-73.8363669167193,-73.8363562498459,-73.8361277861022,-73.836007089852,-73.8359282197686,-73.835832034463,-73.8355686478379,-73.8351842744935,-73.8350136332837,-73.8347600499883,-73.8346605681256,-73.8339614971016,-73.833721615217,-73.8329172127247,-73.8328869747542,-73.8328618322207,-73.8328338102036,-73.8326053085661,-73.8325371169571,-73.8324426449501,-73.8323286336183,-73.8322452210355,-73.8321318898429,-73.8320244861032,-73.8318518524854,-73.8317176497454,-73.8314215868743,-73.8310466747283,-73.8308841116662,-73.8306376733337,-73.8303432587079,-73.8299559031706,-73.8296506680581,-73.8294162483505,-73.8292024845129,-73.8290510321779,-73.828888460266,-73.8285900506941,-73.8284558362931,-73.8278075050829,-73.8276905906448,-73.8266215744528,-73.8265434548207,-73.8264726856461,-73.8264093876511,-73.8263536691526,-73.8263056252433,-73.8262653378674,-73.8262322184311,-73.8262056254452,-73.8261855906332,-73.8261721378838,-73.8261652832232,-73.8261650347963,-73.8261713929406,-73.8261843499503,-73.8262038903055,-73.8262299906234,-73.8262626196858,-73.8263017384773,-73.8261332357073,-73.8261100515756,-73.8260748601593,-73.8260563284496,-73.8260489242826,-73.8259971641183,-73.8259805328641,-73.8259194682018,-73.8258967878009,-73.8257850146509,-73.825739346338,-73.8256858368402,-73.8256293522369,-73.8255900058743,-73.8255786292369,-73.8255508516249,-73.8255230749372,-73.8254606073229,-73.8255971632927,-73.8258552754084,-73.8260033749814,-73.8261209530947,-73.8262502018818,-73.8263960468184,-73.8271407670679,-73.8275075320579,-73.8276286915821,-73.8277641290058,-73.8280832069699,-73.828987611965,-73.8297627450989,-73.8304290241852,-73.8306794998131,-73.8310200977168,-73.8313846950791,-73.8315524583811,-73.8318530552326,-73.8323212642399,-73.8327834605997,-73.8337588817707,-73.8341282331352,-73.8355481993605,-73.8358295092665,-73.8359713964449,-73.8360848440056,-73.8369773580296,-73.8373131229336,-73.8374927999677,-73.837768570241,-73.8378878855251,-73.8381325114004,-73.8382130123722,-73.8385970230017,-73.8389439796301,-73.8389995352069,-73.8392513141897,-73.8392009389378,-73.839816503714,-73.8405500384892,-73.8410026100729,-73.8414823138433,-73.8421224808986,-73.8427332863079,-73.8428458257842,-73.8437157627912,-73.8440792158507,-73.8442858422926,-73.8443543461236,-73.844414828606,-73.8444276585073,-73.8445141563524,-73.8445870704429,-73.8446759558276,-73.8447001317296,-73.8447467583562,-73.8448007955778,-73.8448547787918,-73.844889056903,-73.8450402111655,-73.8451446608186,-73.8453373978708,-73.8453836038644,-73.8454708956663,-73.8455644785115,-73.8456572550948,-73.8457582230802,-73.8459109394777,-73.8462333963283,-73.8464697015221,-73.8466465279918,-73.8467488196996,-73.8468393008462,-73.8468936619367,-73.8472136158788,-73.8473249412528,-73.8474631403263,-73.8475082034414,-73.8475557978618,-73.8476703373911,-73.8477574010969,-73.8477784421743,-73.8475798071804,-73.8478016462052,-73.8479588598362,-73.8489234490988,-73.8493530507701,-73.8496520730917,-73.8498443127133,-73.8499642602272,-73.8501155663642,-73.8502044455664,-73.8505116087321,-73.8508691753435,-73.8509932732465,-73.8512092908837,-73.8513510276501,-73.8515510733492,-73.8518953747769,-73.8522409742843,-73.8525773383639,-73.852923535223,-73.853254931964,-73.8536056829382,-73.8537828697177,-73.8538245071134,-73.8540545329872,-73.8543692806646,-73.8544257525366,-73.8513110504637,-73.8508643971003,-73.8507490642678,-73.8506337304074,-73.850498913962,-73.8518974626072,-73.8521614469217,-73.8521556683952,-73.8521542855528,-73.8521357137624,-73.8521275848111,-73.8520877795051,-73.851959190852,-73.8518618516849,-73.8518659886392,-73.8519004907292,-73.8519826307076,-73.8521279815657,-73.8521650798942,-73.8521911681973,-73.852336246321,-73.8523427288433,-73.8524722061685,-73.8525825246995,-73.8526633943345,-73.8529247665995,-73.8531051389512,-73.8532999892406,-73.8534402522138,-73.8536746070519,-73.8538344005143,-73.8543740621409,-73.8547827375971,-73.8549509176938,-73.8550633024279,-73.8553026602968,-73.8549980891601,-73.854663663928,-73.8545203082372,-73.854252199018,-73.8539648920126,-73.8537240393495,-73.8532844938064,-73.8530661864311,-73.8529492766167,-73.8528305667532,-73.8527937652886,-73.8527748332086,-73.8526891729138,-73.8526653448466,-73.8521036199702,-73.8520075954262,-73.8518871125705,-73.8517125242184,-73.8515855290119,-73.8514434756632,-73.8513343885052,-73.8512149537398,-73.8509512188559,-73.8506905306546,-73.8504243782249,-73.8503206130775,-73.8502197885581,-73.8501224605209,-73.8500291655468,-73.8499404179849,-73.8497090835063,-73.8495020229918,-73.8493390917869,-73.8493490666442,-73.8493011081434,-73.8498748449615,-73.8518167923385,-73.8518404651051,-73.8519741296287,-73.8520720017785,-73.8498116240904,-73.8491666240615,-73.8491414027254,-73.8489139364889,-73.8486865565904,-73.8485883455156,-73.8482124206382,-73.8479623358371,-73.8467093366402,-73.8456278799256,-73.8452320691587,-73.8447450720662,-73.8446764811764,-73.8442857642735,-73.8441156672296,-73.8437742660797,-73.843593612502,-73.8436683263363,-73.8436152375605,-73.8436878766413,-73.8436502801304,-73.8435710063455,-73.8435201394644,-73.8434362878047,-73.8431432418534,-73.8430696120356,-73.8430045063485,-73.8429834919072,-73.8430067112625,-73.8430514517534,-73.8430424081083,-73.8429847963955,-73.8427281939649,-73.8426131219735,-73.8424402247995,-73.8420174078952,-73.8419868148217,-73.8414440958441,-73.8406256288308,-73.8405407985584,-73.8398949462952,-73.8397005336243,-73.8397283042787,-73.8400222020751,-73.8400240333709,-73.8400268132414,-73.8400249430433,-73.8400200337904,-73.8399811920611,-73.8399176745095,-73.8398320564932,-73.8397250358941,-73.8396272925196,-73.839603459492,-73.8395986548871,-73.8395678280506,-73.8392536576609,-73.8394040091775,-73.840177896123,-73.8410721424405,-73.8412005729918,-73.8413303681583,-73.8414610895386,-73.8415922956026,-73.8417235428068,-73.8418543882371,-73.841984389944,-73.8421131088286,-73.84216600648,-73.8423956988243,-73.8426182239694,-73.8428314247659,-73.8437165779981,-73.8445463383915,-73.8452215006882,-73.8454947910388,-73.8458523574436,-73.8454898618525,-73.8451340402416,-73.8447902700432,-73.8444497030347,-73.8440443109266,-73.8436344271319,-73.843243813566,-73.8425336059876,-73.8418314671025,-73.8411383911255,-73.8404553715746,-73.8397833585332,-73.8391232990766,-73.8391220967654,-73.8391199522323,-73.8391053150767,-73.8390960881024,-73.8390943905909,-73.8390766786794,-73.8390597507521,-73.839058336473,-73.8390562496218,-73.839055185935,-73.8390539355274,-73.8390539569385,-73.8390546765641,-73.8390553561761,-73.8390564035898,-73.8390600758807,-73.8390624275515,-73.8390653242181,-73.8390728451971,-73.839082345529,-73.8390973191604,-73.8391410437484,-73.8391872975275,-73.8392407117513,-73.839294785399,-73.8393357252278,-73.8394060201175,-73.8394474397681,-73.8394690964412,-73.8394927394836,-73.8395104933792,-73.8395169771945,-73.8395219457003,-73.8395285309119,-73.8395325246988,-73.839535534549,-73.8395349525504,-73.8395316635444,-73.8395314389151,-73.8395344059686,-73.8395415306644,-73.8395487761811,-73.8395566654184,-73.8396024383919,-73.8396226003212,-73.8396512084002,-73.8396628598362,-73.8396844312566,-73.8397245207944,-73.8397462785115,-73.8397714166361,-73.8398041950025,-73.839844342922,-73.8399027777269,-73.8400190454037,-73.8400510679704,-73.8400689687025,-73.8400912763911,-73.8401241631382,-73.8401769423668,-73.8402083900236,-73.8402335863823,-73.8402889935783,-73.8403372143646,-73.8403722771602,-73.8403821351715,-73.8403916635383,-73.8404106976495,-73.8404128128241,-73.8404147978871,-73.8404215600195,-73.8404247934767,-73.8404406373626,-73.8404567225499,-73.840481239546,-73.8405059753627,-73.8405532025165,-73.8405953295077,-73.8406343935758,-73.8406514989966,-73.8406577222069,-73.8406626902552,-73.8406775686862,-73.8406922050723,-73.840704125061,-73.8407124298575,-73.8407225165151,-73.840735612048,-73.840737610894,-73.8407431271487,-73.8407451513152,-73.8407508231659,-73.8407518584396,-73.8407518743927,-73.8407482775543,-73.840742773088,-73.8407330658331,-73.8407297376543,-73.8407293073012,-73.8407323201708,-73.8407413407187,-73.8407554092046,-73.840760388067,-73.8407641504864,-73.840767266265,-73.8407663356798,-73.8407637206892,-73.8407512692185,-73.8407338456162,-73.8407214759005,-73.8407143317528,-73.8407052355804,-73.8406943418648,-73.8406910649729,-73.8406890093982,-73.8406872980397,-73.8406877895866,-73.8406901877132,-73.8406923733551,-73.8406966245418,-73.8407042337751,-73.8407313758005,-73.8407515307587,-73.8407642340115,-73.8407691927133,-73.8407770472971,-73.8407791704357,-73.8407754979146,-73.8407661408274,-73.8407513822146,-73.840731668502,-73.8407187671671,-73.8406799997366,-73.8400426281376,-73.8398495469039,-73.8380577884866,-73.8379892119829,-73.8377803814654,-73.8362511917508,-73.835836515183,-73.8355485237687,-73.8350804930399,-73.8347873606396,-73.8347116851387,-73.8347070809016,-73.8347334508157,-73.8347853545842,-73.8348488943388,-73.8350233466827,-73.83514009988,-73.8350693149265,-73.8350048058533,-73.834934321596,-73.8348585180663,-73.8347781005969,-73.8346981123398,-73.8350657468726,-73.8354377716985,-73.8355695866481,-73.8356755394758,-73.835849677861,-73.8359507145918,-73.8359253040333,-73.8359156487578],"lat":[40.7434308938951,40.7434358072001,40.7434027793409,40.7433644883358,40.7433554517918,40.7433453341666,40.7433120536204,40.7433003392089,40.7432368830526,40.7423663677532,40.7419772525247,40.7415622591896,40.7414656197345,40.7413894961949,40.7410671166721,40.7408428673476,40.7402965982237,40.7400861519177,40.7386025705801,40.7384763502197,40.7370436587464,40.7351241248749,40.7350085921502,40.7342413120032,40.7339787413259,40.7338168611037,40.7336194406291,40.7331157161877,40.732389588995,40.7320492584897,40.7315735251093,40.7313813846617,40.7300335936821,40.7295757349778,40.7280018088886,40.7279426412377,40.727893443801,40.7278415325976,40.7274174436019,40.7272876978599,40.7271259312655,40.7269464473026,40.726825720977,40.7266713380303,40.726540622443,40.7263545138774,40.7262216815234,40.7259642696052,40.7256909111136,40.7255825299395,40.7254182477498,40.7252323721524,40.7249823506942,40.7247754658591,40.7246076866053,40.7244489250008,40.7243257085998,40.7241864546952,40.7239150660168,40.7237864891577,40.7230457330008,40.7228929493171,40.7212370693433,40.7211028920193,40.7209663744525,40.7208277496099,40.7206872534833,40.7205451263331,40.7204016107181,40.7202583531871,40.720114310444,40.7199696545494,40.7198245582957,40.7196791949997,40.7195337382965,40.7193883616893,40.719243239071,40.7190985437859,40.7189544486668,40.7188111258284,40.718668746462,40.7184397614148,40.7172848126189,40.7171340982333,40.7170764916405,40.7170534793042,40.7168925820096,40.7168408866243,40.716651065055,40.7165790339299,40.7162240435448,40.716115058784,40.7159906102577,40.7158630879316,40.7157742713998,40.7157626086762,40.7157082448787,40.7156538817455,40.7155496455943,40.7155143369393,40.7154533969516,40.715413630791,40.7154925266357,40.7155650238481,40.7156552145362,40.7160068511739,40.7161004581287,40.7161368980159,40.7161776325886,40.7162735966687,40.7165209811477,40.7167236830895,40.7169627709355,40.7171790647029,40.7173317240276,40.7175513171202,40.7176805628081,40.7179121433042,40.7183298975857,40.7188024294399,40.7198382960155,40.7202305328989,40.7219700249877,40.7223417181508,40.7225390861344,40.7226969573175,40.7240710603013,40.724730158029,40.7251278510906,40.7254339130347,40.7256974322974,40.7262015444086,40.7263674373549,40.727026933597,40.7276227839533,40.7277181914947,40.7281505773919,40.7282668630292,40.7290373869242,40.7298447299081,40.7302788999448,40.7307390894366,40.7313444363489,40.7319508736962,40.7320676427423,40.7332257299461,40.7338478000143,40.73420144745,40.7343447928451,40.7344712706516,40.7344980961156,40.7347031782081,40.7348797047254,40.7351123447011,40.7352081275373,40.7353625649347,40.7355428032014,40.7357514698091,40.7359115813815,40.7360953800625,40.7365109346524,40.7372777246965,40.7376091837968,40.7378732219504,40.7380022823602,40.7381174010484,40.7382068853172,40.7383070554127,40.7384358454849,40.7385394936967,40.7386170463539,40.7386517895016,40.7386692172142,40.7386712173942,40.7386439866839,40.738771458077,40.7389520315271,40.7390078070401,40.739063915243,40.7391952354507,40.7392990885836,40.7393448352464,40.7397213544384,40.7400496769622,40.7400970163836,40.7403919148126,40.7405232498138,40.740614663785,40.7406655498284,40.7407017722784,40.7407235627984,40.7409020337518,40.7415188570427,40.7421804113246,40.7424225429113,40.7428440212208,40.7431190579557,40.7435072271111,40.7441797382359,40.7448409656761,40.7455056473151,40.7461819475256,40.7468235494634,40.7474968285921,40.7478029913653,40.7478540400851,40.7481583169479,40.748738930191,40.7488517268845,40.7498433761507,40.7499956418746,40.7500384918114,40.7500813409611,40.7501206987575,40.7527528596665,40.7533819947196,40.7534652339494,40.7540478926649,40.7544551502439,40.7547509201017,40.7550785717333,40.7556896704974,40.7563274102381,40.7566559922049,40.756866404551,40.7571107363121,40.757388722746,40.7574596732962,40.7575667953577,40.7578732453588,40.7578867326546,40.7581202009823,40.7582834516903,40.758397738787,40.7587110075729,40.7588890062182,40.7590596940802,40.7591684372405,40.7593246483547,40.7594269778065,40.759676255254,40.7598482997658,40.7601074960894,40.7602806988509,40.7606495847523,40.7603911707666,40.7601711695613,40.7601593448847,40.7602506777814,40.7602714222245,40.7602463886348,40.7601265127512,40.7600387044803,40.7600214018093,40.7599875935566,40.7599721661337,40.7599642281751,40.7599283156637,40.7599183267704,40.7596828266989,40.7595725001842,40.7595223672789,40.7594012585167,40.759355420657,40.7594190842762,40.7594206809652,40.7594158536328,40.759419583092,40.7594487910904,40.7595064110376,40.7595336154798,40.7595665993608,40.759605180839,40.7596491472128,40.7596982560929,40.7598388379575,40.7600067290107,40.7601885894473,40.7601982826528,40.76024287535,40.7611038129485,40.7603537328463,40.7603059788215,40.7602494073818,40.7603928846722,40.7612709740073,40.7602965842879,40.760306890639,40.7602757866728,40.7601384946081,40.7601795630874,40.7604375945079,40.7605510888334,40.7613452691361,40.7621427418613,40.7624346076183,40.7627556312059,40.7627521808586,40.7629985521512,40.7631361995793,40.7632993229664,40.7633705427875,40.7634699073962,40.7634967140607,40.7636127260837,40.7636277942923,40.7635151328046,40.7635369030913,40.7634325661937,40.7635480947651,40.7635925691529,40.763704224005,40.7638318513791,40.7639946228365,40.7640973581533,40.7643213199203,40.7644235936184,40.7646285489317,40.764682989692,40.7645042729927,40.763688570101,40.7636346482519,40.7637724706044,40.7640234198922,40.7641096110879,40.7650940540317,40.7652895884368,40.7651457024598,40.7642324655417,40.7641273882156,40.7640675144162,40.7639584520316,40.7636722713598,40.763438689953,40.7632065080956,40.7629781495759,40.7627553996359,40.7625901790638,40.7625482648677,40.7625398165393,40.7624757649154,40.7619080623721,40.7619316501592,40.7620524302832,40.7622643098209,40.7622850092768,40.7623000009174,40.7623092341065,40.7623126776575,40.7623103201699,40.7623021693931,40.7622882528572,40.7622686175674,40.7622613143797,40.7622141990182,40.7621529544777,40.7620785302424,40.7617390014391,40.7612947608349,40.7608608475473,40.7606852052742,40.7604553976932,40.7597286721183,40.7590684748989,40.7584031589058,40.7577434838967,40.7569447726627,40.7561569937639,40.7553368037671,40.7555446991363,40.7557692688936,40.7560102445044,40.7562672966429,40.7565400363045,40.75682806227,40.756825818085,40.7568218252855,40.7567921242221,40.7567734350086,40.7567699841103,40.7567340558191,40.7567018208982,40.7566991356547,40.7566951622001,40.7566893430308,40.7566824794097,40.7566787240042,40.7566748533111,40.7566729543457,40.7566709196953,40.7566655495795,40.7566626801252,40.7566598296927,40.7566540411119,40.7566483903216,40.7566409273383,40.7566201865045,40.7565969465104,40.7565694923169,40.7565395363441,40.7565195030352,40.7564849403806,40.7564623231061,40.7564486926966,40.7564316428249,40.7564160077115,40.7564083452159,40.7564006975291,40.7563856951799,40.7563693918972,40.7563342676821,40.7563250093719,40.7563040859573,40.7562945405022,40.7562768146641,40.7562539602731,40.7562354553661,40.7562196989528,40.7561447228374,40.7561075063087,40.7560545153687,40.756034973066,40.7560027737209,40.7559468090668,40.7559211210438,40.7558976071835,40.7558726903564,40.7558467050646,40.7558148351846,40.7557403182062,40.7557196150517,40.7557067351916,40.7556881710824,40.7556583922,40.7556090095135,40.7555817038106,40.755563548759,40.7555293706622,40.7555002613041,40.7554807419935,40.7554739113687,40.7554657298573,40.7554443696601,40.7554413199271,40.7554377736336,40.7554229163869,40.7554177426298,40.7553982142634,40.7553819645502,40.7553607833142,40.7553414109893,40.7553066175065,40.7552748076254,40.7552414349947,40.7552241327578,40.755216361112,40.7552088127174,40.7551772966466,40.7551377321101,40.7550902644495,40.7550439983126,40.7550106031681,40.7549765650288,40.75497267733,40.7549637881394,40.7549592610277,40.7549396553969,40.7549323448094,40.7549256717579,40.7549043703445,40.7548839126362,40.7548528044981,40.7548333033575,40.754805613184,40.7547688404763,40.7547251329483,40.7546854034404,40.7546633573329,40.7546352941779,40.7545998807513,40.7545878217617,40.7545771383472,40.7545450004848,40.7544970870012,40.7544600685378,40.7544273697601,40.754383134266,40.7543336083181,40.7543122984646,40.7542852895483,40.7542332736228,40.7541913377843,40.7541394087918,40.7541219781921,40.7541065667952,40.7540893951526,40.7540558714667,40.7540196093608,40.7539814448167,40.7539422576735,40.7539176235634,40.7538923271294,40.7538671335439,40.7538428048671,40.7538200769969,40.7537996374089,40.7537736536655,40.7535838066691,40.7537963150002,40.7538639206673,40.7544910603547,40.7545150424789,40.7541306833467,40.7519052837267,40.7513017845451,40.7508826481068,40.7501532252542,40.7494582894496,40.7489095914899,40.748631931769,40.748286687902,40.7480126684928,40.7477913486168,40.7473647340024,40.7471576525076,40.7470710629488,40.7470215294036,40.7469769533883,40.7469377497663,40.7469042832447,40.7468885585259,40.7462041091385,40.7455239740791,40.7451506314946,40.7448505175602,40.7441757626274,40.743730569606,40.7435005707196,40.7434308938951]}]],[[{"lng":[-73.9692929641454,-73.9683893374683,-73.9679513912622,-73.9676154779079,-73.9672096204262,-73.9666697024391,-73.9665374718372,-73.9660741357412,-73.9658741864341,-73.9652043896813,-73.9645184480918,-73.9638688939085,-73.9631825209575,-73.9625499252884,-73.9625193039367,-73.9621797815518,-73.9623657998502,-73.9628396371634,-73.962482959087,-73.9623976909045,-73.9623590331906,-73.9623307288082,-73.9618983782424,-73.9619407043687,-73.9617499483519,-73.9615855611724,-73.9610926416812,-73.960738582953,-73.9602928166811,-73.9602374033646,-73.960223045397,-73.9601869192427,-73.9601725613865,-73.9601467801997,-73.9600971456535,-73.9600051980264,-73.959859394257,-73.9597137475643,-73.9595677012137,-73.9594225933236,-73.9592995959325,-73.9592759867973,-73.9591320677473,-73.9589832794176,-73.9588406201994,-73.9585856668255,-73.9583957158244,-73.9582457036948,-73.9582693030691,-73.9582921680775,-73.9613465588579,-73.963292055495,-73.9641038822544,-73.9643588344663,-73.9644217717163,-73.9655104335493,-73.9665724714336,-73.9675319676566,-73.9675069776285,-73.9674779632189,-73.967678283782,-73.9708260260517,-73.9739560163829,-73.9762090823007,-73.976568723559,-73.9766665945057,-73.9787036814745,-73.9787602246293,-73.9791839057777,-73.9796168008526,-73.9800351014829,-73.9804615544368,-73.980555795898,-73.9818789449431,-73.981966344575,-73.9824246558843,-73.9825728576109,-73.9826421227732,-73.9827316934269,-73.9828543607518,-73.9824163819714,-73.982891431904,-73.983911252868,-73.9839612023882,-73.9840150709398,-73.9840879215055,-73.9841540103577,-73.9842214620033,-73.9843741079783,-73.9847980530937,-73.9869952007545,-73.9869399138158,-73.98688953828,-73.9868300516626,-73.9867226390491,-73.986614618811,-73.9865630342566,-73.9882043707081,-73.9887115609878,-73.9887879656509,-73.9888192633713,-73.9890687390283,-73.9890981342512,-73.9891284072899,-73.9910586660132,-73.9913324976056,-73.9939292961589,-73.9937873699678,-73.9936042321314,-73.9933382296489,-73.9932683000288,-73.9930045171087,-73.992928890219,-73.9926855276291,-73.9926228608666,-73.9923636704325,-73.994360928302,-73.9962327810058,-73.9977692444504,-73.9980304864499,-73.9984527178269,-73.9989382900044,-73.9991005733859,-73.9992016187204,-73.9992881956256,-73.9993654019507,-73.9995127413904,-73.9999151736663,-74.000190403862,-74.0006230353021,-74.0006843903367,-74.0007730578865,-74.0017943198103,-74.0016998937267,-74.0017436211104,-74.004007959711,-74.0037456197246,-74.0034534855666,-74.0012701496867,-74.0009586848302,-74.0030139382908,-74.0026355689017,-74.0023980258379,-74.0002687237779,-73.9998821496038,-73.9995954679651,-73.9994614351467,-73.9994197196809,-73.9994130243321,-73.9995237390351,-74.0004893340596,-74.0004314734043,-73.9995933358124,-73.9995313520267,-73.9995877000669,-73.9995538908367,-73.9994073844296,-73.9995031786187,-73.9994740682061,-73.9992946883619,-73.9991819901686,-73.9989960413919,-73.9989396903469,-73.9988720727645,-73.9987645802771,-73.9988711709766,-74.0010490312356,-74.0004876862855,-73.9983776068577,-73.9980210272511,-74.0000184043362,-73.9994746390496,-73.9974989831,-73.9973674581169,-73.9971605424392,-73.9971814844639,-73.9971758435588,-73.997244628717,-73.9966976899746,-73.9968218908586,-73.9975276327397,-73.9977601109966,-73.9978016278631,-73.9981387996549,-73.9961922729477,-73.9958861195018,-73.9951382684069,-73.9950643849151,-73.9950459274832,-73.9954456431207,-73.9952934676697,-73.9949820331283,-73.9948003827486,-73.9946629034361,-73.9948576593374,-73.9949954253394,-73.9948823996847,-73.9949104306952,-73.9949296467529,-73.9950292598249,-73.9948820472641,-73.9948363743526,-73.9947693419157,-73.9947142423515,-73.9947715812517,-73.9947923146005,-73.9947923129999,-73.9947728622857,-73.994698074708,-73.9947761435346,-73.9947022906841,-73.9946360347443,-73.9945697901693,-73.9938634103188,-73.9938068724841,-73.993781554265,-73.9937745720781,-73.9936933612929,-73.9936879222448,-73.9935860697536,-73.9936264391673,-73.9935088140361,-73.9928010422898,-73.99269135575,-73.9925121068205,-73.992308337873,-73.9921270353507,-73.9921210063909,-73.991957154312,-73.9918615918932,-73.9914179478271,-73.9909475535079,-73.990714731148,-73.9905461799855,-73.9903076849382,-73.9902849603567,-73.9902272119601,-73.9900911139344,-73.9894935897135,-73.9893473471751,-73.9892004643616,-73.9890698965258,-73.988988977578,-73.9886972330477,-73.9884074480717,-73.9883033220854,-73.9882899911129,-73.9879567655754,-73.9872696936719,-73.9869234845564,-73.9868725221264,-73.9868232284123,-73.9867767914742,-73.9867343305167,-73.9866968689139,-73.9866653095445,-73.9866404130303,-73.9866227794053,-73.9865297294605,-73.9864291160867,-73.9864342989271,-73.9847433000917,-73.9840214984895,-73.9834380628795,-73.9834262754324,-73.9834065026424,-73.9833681994415,-73.983263986722,-73.9830863915882,-73.9830898656595,-73.9828355213527,-73.9827416188599,-73.9827450812466,-73.982748593677,-73.9824595687224,-73.9824589864156,-73.9824228717988,-73.9810239061828,-73.9810173390095,-73.9823020518388,-73.982329442166,-73.9809251031199,-73.980908645638,-73.9807407049495,-73.980220042526,-73.9802371538146,-73.9795591848724,-73.9795557993369,-73.9793286532598,-73.9792798318527,-73.9792733627686,-73.9792139170391,-73.9791827086697,-73.9790504990411,-73.9790576701228,-73.9789292013753,-73.9789311028554,-73.9790608491183,-73.9792433349359,-73.9791209224227,-73.9789635508107,-73.978865177554,-73.9788190904005,-73.9789276582375,-73.9787910619265,-73.9787382948663,-73.9786390665857,-73.9786016215401,-73.9786969819046,-73.9786844058447,-73.9786452922885,-73.9784655784896,-73.9784320225012,-73.9784569266504,-73.9784489915569,-73.9784218237489,-73.9783889555222,-73.9784217833127,-73.9784127146256,-73.9783810189819,-73.9783923054377,-73.9784013614419,-73.9783990943914,-73.9788564309652,-73.9788530336073,-73.9783922995734,-73.9783877652643,-73.9783447485287,-73.978351552585,-73.9783741922705,-73.9783629065039,-73.9783413980516,-73.9783470696972,-73.9783742369881,-73.9784059750025,-73.9783855990521,-73.9783912701033,-73.9784161750832,-73.9784540532827,-73.9784268336227,-73.9785931362013,-73.9785319882069,-73.9784419071594,-73.9782830199627,-73.9781619969166,-73.9781725698714,-73.9781768884553,-73.9780206732666,-73.9773557089441,-73.9773387840461,-73.9772620458,-73.9772119633924,-73.9775121549496,-73.9773608383371,-73.9772953835568,-73.977135626254,-73.9770551895912,-73.9768324636342,-73.9762386476849,-73.9759609634482,-73.9769274918835,-73.9766405923902,-73.9763483559312,-73.9761593729202,-73.9755345648974,-73.9753298739398,-73.9759476210284,-73.9759474688819,-73.975980927235,-73.9760058784546,-73.9758959808124,-73.9758141788266,-73.9758123447576,-73.9755930179054,-73.975600718404,-73.975610869319,-73.9755008317642,-73.9754034822457,-73.9745502338837,-73.9756119226431,-73.9757995183147,-73.9758036260455,-73.975800287795,-73.9757895998045,-73.975771870182,-73.9757476100193,-73.9757175186582,-73.9756824635305,-73.9756434551527,-73.9756016179965,-73.9755581580751,-73.9755143281789,-73.9754713917629,-73.9754305865272,-73.9753930887391,-73.9753599793267,-73.9751825417921,-73.9743185017185,-73.9741151399254,-73.9738887884854,-73.9738548810652,-73.9737621093659,-73.9735441755762,-73.9735559707605,-73.9732885360235,-73.9729264284862,-73.972573119672,-73.9723920139746,-73.972621031062,-73.9729829041212,-73.9732685501583,-73.9733300014653,-73.9735197065474,-73.9735359322334,-73.973757007132,-73.973186766709,-73.9728840477198,-73.9728457419607,-73.9715691389454,-73.9711382458321,-73.9709789685752,-73.9707820058799,-73.9708052443284,-73.9725422126723,-73.9725081027299,-73.9733245610394,-73.9728351278874,-73.972515944972,-73.9698255655953,-73.9694865521811,-73.9721313835225,-73.9728388997497,-73.9726693843376,-73.9718316965493,-73.9692453920736,-73.9689347481843,-73.9689851742897,-73.9714748384582,-73.9723124627611,-73.9721579882499,-73.9714565735483,-73.9711034229883,-73.9709330788632,-73.9710196311851,-73.9734044082712,-73.9746556960804,-73.9743908350232,-73.9734762959847,-73.972548800578,-73.9732987635985,-73.9746296660442,-73.9742361696854,-73.9731062709119,-73.9722179484903,-73.9717052494159,-73.9712249291225,-73.9710965548911,-73.9710043868583,-73.9710569230618,-73.9727575699836,-73.9723203207376,-73.97066975743,-73.9705406218224,-73.9702621853229,-73.9704888184858,-73.9701689450992,-73.970180755728,-73.9676211477992,-73.9675151669107,-73.9674767449303,-73.9683326374704,-73.9692969383771,-73.9692363268524,-73.9692929641454],"lat":[40.7070933310958,40.7068291867471,40.7057312170614,40.704961635387,40.7042557091534,40.7038066038877,40.7036966129153,40.7033201529412,40.7031576959966,40.7026227448141,40.7020749782679,40.7015418892111,40.7010000953747,40.7004970336439,40.7004726819675,40.7002207106044,40.6996055858518,40.6980386683399,40.6980953847548,40.6981089457377,40.6981150917399,40.6981195943247,40.6981883325315,40.6979116822372,40.6968461689056,40.6962074884059,40.6940105041868,40.6924239053023,40.6903462499155,40.6900622223053,40.6899886278864,40.6898034564914,40.6897298620638,40.6896087768417,40.6893452100975,40.6888810337183,40.6881474512173,40.6874156345935,40.6866825554247,40.6859503064327,40.6853348451315,40.6852167050472,40.6844851487008,40.6837499156536,40.6830180530165,40.6817424827147,40.6807977922576,40.6799851049055,40.6799068951275,40.6798311339974,40.680463524301,40.680881585896,40.681052391877,40.6811058760987,40.6811190793324,40.6813440199768,40.681564814365,40.6817687836176,40.6816870214012,40.6815862903941,40.6809554553115,40.6816159417546,40.6822697328902,40.6827295496811,40.6828270590431,40.6829722147987,40.6837443233783,40.6837654444832,40.6831288379729,40.6824912697107,40.6818526267385,40.6812225467569,40.6812583040727,40.6817710147314,40.6818048802675,40.6819824661363,40.6820398895047,40.6820667273451,40.6821014331121,40.6821489634618,40.6827805660987,40.6829653834689,40.6833623114889,40.683381751998,40.6834027180336,40.6834310717892,40.6834567933793,40.6834830448405,40.6835424548719,40.6829092290303,40.6837650103203,40.6838448061587,40.6839175137674,40.6840033717286,40.6841583994584,40.6843143041887,40.6843887556392,40.6850273069238,40.6852246184797,40.6851081993238,40.6850605086136,40.6846803718351,40.6846355816056,40.6845894530735,40.6853416955314,40.6854484062361,40.6864528711465,40.6867559669351,40.6871272300482,40.6876787969339,40.6878244518285,40.68836463604,40.6885194216226,40.6890332465313,40.689160548836,40.689690123777,40.6902394800844,40.6907577745864,40.6911946978608,40.6912537228763,40.6913699834776,40.6914951450345,40.6915369744965,40.6915718343477,40.6915939599271,40.6916130782729,40.6916514503089,40.6917672300104,40.6918964471302,40.6920414906675,40.6918978147893,40.6918957573263,40.6921847767889,40.6923827671366,40.6924067497055,40.6932081996324,40.6936162029811,40.6940516306714,40.6932960621764,40.6940690835822,40.6947778444792,40.6953620370376,40.6957116548645,40.694965802578,40.6956051992456,40.6960650388367,40.6962800266043,40.6963469378186,40.6963576764533,40.6965748265435,40.6969261950881,40.6970524661786,40.6967822614744,40.6968766126194,40.6968980571682,40.6969452323968,40.6968851894461,40.6967265076964,40.696704134462,40.6967951257941,40.6968851880648,40.696812278373,40.6969409405159,40.6969237845742,40.6971207325914,40.6971575772959,40.6979082361948,40.6987577781371,40.6980632961461,40.6987617365738,40.6994660480737,40.7003227780184,40.6996388693213,40.6996342349298,40.6997928126442,40.6999944849681,40.7001059914638,40.7001414093945,40.7008769769171,40.7009907823253,40.7012288169587,40.7013594148768,40.7013193947663,40.7015187877458,40.7033771408642,40.703260077085,40.7029741147229,40.7031003136535,40.7031318397996,40.7032753054718,40.703554065898,40.7033817155352,40.7032919586446,40.7034306085592,40.7035661385261,40.7036505637143,40.7037880258375,40.7037973159588,40.7037713155864,40.7038082008681,40.7040086538952,40.703986339081,40.7039528949536,40.703996689061,40.7040493603745,40.7040684056338,40.7040888947072,40.7041045416993,40.7041647007973,40.7042458610524,40.7042925319136,40.7043344034286,40.704376263514,40.704556007433,40.7045396132142,40.7044689445438,40.7044494574088,40.7044761288379,40.7044779142116,40.7045091182182,40.7045952446574,40.704623505274,40.7046340239279,40.7046298499454,40.7046941125576,40.7046900012402,40.7046896420336,40.7043962015779,40.7042006778533,40.7040866421044,40.7040040890207,40.7040324421392,40.7043513790406,40.7044161675018,40.704839880602,40.7048664293923,40.7049340444871,40.7049434632891,40.7048090381237,40.7047296917027,40.7047238969888,40.7047059146982,40.7046903567816,40.7045645787769,40.7045545008409,40.704540468955,40.7050706589976,40.7051342174126,40.7051757206943,40.7051624624859,40.7051572773862,40.7051461519976,40.7051293544607,40.7051072896238,40.7050804892857,40.7050495993776,40.7050153643952,40.7049786094542,40.7049790991737,40.7050691799306,40.7053486074197,40.7055429072671,40.7055986345647,40.7056440948479,40.7055772208469,40.7054663706604,40.7054610650766,40.7054850666606,40.7054770907023,40.7055115418259,40.705555807398,40.7055724415327,40.7055527098694,40.7055326912395,40.7055087972254,40.7055424144699,40.705822055452,40.7058989138936,40.7057975064678,40.7057369793997,40.7055520336641,40.7053692552005,40.7059079438118,40.7058551598704,40.705851075721,40.7057632835598,40.7057436152499,40.7057702152751,40.7057654328524,40.7057894819743,40.7059171353022,40.7059066402332,40.7059652149733,40.7059669635916,40.7059528891006,40.7059315898793,40.7059249057278,40.7059460289409,40.7055511963775,40.7055300696736,40.7055021965043,40.7058679556977,40.7058624675819,40.7054961991691,40.7054738087075,40.7054630646721,40.7058306482218,40.7058229685248,40.7054562604581,40.7054541771079,40.7055910215957,40.7055622218645,40.7056786353744,40.705684670847,40.7057165454175,40.7057130939598,40.7058302545873,40.7058380142362,40.7058707503505,40.7058664367771,40.7059706823108,40.7059724071944,40.7059827452024,40.7060595051001,40.706065534782,40.7059887742332,40.706006003881,40.7059999649876,40.7059655057719,40.7059680944684,40.705863848933,40.7058595372631,40.705825077834,40.705830251823,40.7057105065468,40.7057053336731,40.7056725969224,40.7056760484656,40.7055603752341,40.7055568085091,40.7049785841429,40.7048765234297,40.7048713958432,40.7046665516455,40.7045284275768,40.7044858413329,40.7044684436196,40.7042909664562,40.7041780897739,40.7042295507855,40.7042200963345,40.7042139266243,40.7031967526635,40.7031395205108,40.7031893080875,40.7030055814026,40.7031787689004,40.7036157418713,40.7047756441907,40.7047155069431,40.7027978204004,40.7024967660949,40.7022991057427,40.7021712803569,40.7030428088057,40.7029519243383,40.7020119965027,40.7020114937218,40.7019750358996,40.7019461332792,40.7019004708804,40.7018951826446,40.7018945042766,40.7018137887684,40.7018064667816,40.7017968145074,40.7017583089657,40.7019111475676,40.7015903438023,40.7000373159549,40.6997524180009,40.6997191860433,40.6996859041901,40.6996535318427,40.6996230021835,40.6995951952749,40.6995709126913,40.6995508544124,40.6995355986459,40.6995255851599,40.6995211026068,40.6995222802019,40.6995290839997,40.6995413178714,40.6995586291593,40.6995805188418,40.6998727901459,40.7011942950089,40.7013052709169,40.7010851943931,40.7010839860283,40.7010806805463,40.7008922925296,40.7008676318813,40.7006241845523,40.7002945534277,40.7000820561209,40.7001663227523,40.7004659955762,40.7008062657463,40.7010509109721,40.7010509252276,40.70122566022,40.7013274529891,40.7015341388818,40.7016698036737,40.701416795976,40.7014347234146,40.7003006796445,40.6999178932581,40.6998564576523,40.6999786630113,40.7000975003423,40.7016364427969,40.701662386463,40.7024126560107,40.702728740744,40.702465344221,40.700245070368,40.7005190607556,40.7027497385596,40.7033464280993,40.7035013804312,40.7029786695797,40.7013647418835,40.7016158682073,40.7017470887866,40.7033165413165,40.7038445395386,40.7039702076261,40.7035087159246,40.7034597358398,40.7036247725514,40.7038156136864,40.7053043356041,40.7060742629942,40.7063257741448,40.7056862833914,40.7062044905064,40.7066977137746,40.7076810607683,40.7080243861224,40.7071355692205,40.706505493033,40.7061360326809,40.7057898999111,40.7058500565582,40.7068282409466,40.7069464338167,40.7088312790503,40.7090828838067,40.7072597088215,40.7073160763539,40.7068875042841,40.7054006656219,40.7053618534073,40.7049292705669,40.7033485056969,40.7034373573807,40.7039498709563,40.7044833845842,40.7050883312297,40.705994313001,40.7070933310958]}]],[[{"lng":[-74.0017436211104,-74.0016998937267,-74.0017943198103,-74.0007730578865,-74.0006843903367,-74.0006230353021,-74.000190403862,-73.9999151736663,-73.9995127413904,-73.9993654019507,-73.9992881956256,-73.9992016187204,-73.9991005733859,-73.9989382900044,-73.9984527178269,-73.9980304864499,-73.9977692444504,-73.9962327810058,-73.994360928302,-73.9923636704325,-73.9926228608666,-73.9926855276291,-73.992928890219,-73.9930045171087,-73.9932683000288,-73.9933382296489,-73.9936042321314,-73.9937873699678,-73.9939292961589,-73.9913324976056,-73.9910586660132,-73.9891284072899,-73.9890981342512,-73.9890687390283,-73.9888192633713,-73.9887879656509,-73.9887115609878,-73.9882043707081,-73.9865630342566,-73.986614618811,-73.9867226390491,-73.9868300516626,-73.98688953828,-73.9869399138158,-73.9869952007545,-73.9847980530937,-73.9843741079783,-73.9842214620033,-73.9841540103577,-73.9840879215055,-73.9840150709398,-73.9839612023882,-73.983911252868,-73.982891431904,-73.9824163819714,-73.9828543607518,-73.9827316934269,-73.9826421227732,-73.9825728576109,-73.9824246558843,-73.981966344575,-73.9818789449431,-73.980555795898,-73.9804615544368,-73.9800351014829,-73.9796168008526,-73.9791839057777,-73.9787602246293,-73.9787036814745,-73.9766665945057,-73.976568723559,-73.9762090823007,-73.9739560163829,-73.9742267139578,-73.974391442015,-73.9739775765495,-73.9741044872183,-73.9745039588365,-73.9751431678887,-73.9746911837325,-73.9743104817796,-73.9735088335376,-73.9730525161378,-73.9727161502031,-73.9724449244621,-73.9718859677281,-73.9714229284868,-73.9710491910434,-73.9711253178971,-73.9711938443834,-73.9712544419753,-73.9713068201652,-73.9713507283514,-73.9713859555711,-73.9714123329649,-73.9714297341057,-73.9714648996102,-73.9714782916489,-73.9714696602279,-73.9714391947519,-73.9713815054419,-73.9713814371047,-73.971381345661,-73.9713585770846,-73.9713197494639,-73.9712758520266,-73.9712269643708,-73.9711731751398,-73.9711145821566,-73.9710512914015,-73.9709834176223,-73.9709110838728,-73.9708789450566,-73.970407345277,-73.9705026252364,-73.9708544070116,-73.9713252639015,-73.9718159465479,-73.9723172091348,-73.972819906653,-73.9733228431905,-73.9738252853462,-73.9743309359185,-73.9748332761671,-73.9753371462465,-73.9758313228491,-73.9763338616919,-73.9768451680885,-73.9773425303496,-73.9778427509164,-73.9783494522871,-73.9788547591815,-73.9793505994626,-73.9796535347633,-73.9797061990158,-73.9797618363971,-73.9798192734448,-73.9798772987375,-73.9799346884464,-73.9799902323078,-73.9800427586837,-73.9800911597291,-73.9801344146106,-73.9801716110372,-73.9822303421316,-73.9845915735521,-73.9869510181568,-73.989312730868,-73.991662828362,-73.99173365211,-73.991794990279,-73.9940355463928,-73.9964028117054,-73.9965929918862,-73.9967524379256,-73.9968449048378,-73.9969298850858,-73.9969646512533,-73.9971162468849,-73.9975773213401,-73.9976184668881,-73.9976483710815,-73.9977147427698,-73.9978713002276,-73.9979893158487,-73.9982251003896,-73.998456780805,-73.9985412805443,-73.9986188803608,-73.9986810823641,-73.9987694105892,-73.9989259123907,-73.9993110109892,-73.999621399733,-73.9996281366582,-73.9999108200748,-74.0003033780888,-74.0010566411319,-74.0014152710316,-74.0022150681655,-74.0028948387695,-74.0031907527484,-74.0036946200053,-74.0036302635154,-74.0039884200628,-74.0044025343906,-74.0051011119802,-74.0051022734627,-74.0054701720859,-74.00552727454,-74.0058636618068,-74.0059724114968,-74.0060018331981,-74.006255356596,-74.0062252348656,-74.006770625536,-74.0068308552184,-74.0068671303845,-74.0068608493116,-74.0068503788535,-74.0068413093371,-74.0068339027153,-74.0068283729114,-74.0068248796409,-74.0068235237983,-74.0068243445431,-74.0068273181691,-74.0068323587888,-74.0068393208146,-74.0068480031636,-74.0068581550652,-74.0068694833049,-74.0068816606923,-74.0068943355114,-74.0069071416794,-74.0069197093195,-74.0069316754446,-74.0069426944404,-74.0069524480484,-74.0069606545575,-74.0069670769408,-74.0069715297018,-74.0069738842316,-74.006974072524,-74.0069720891396,-74.0069679913633,-74.0069618975493,-74.0069539837034,-74.0069444783991,-74.0069336561759,-74.0069218296101,-74.0069093402862,-74.0068965489313,-74.0068962959209,-74.0068814194415,-74.0068697590867,-74.0068445242866,-74.006896266221,-74.0067502379238,-74.0063063503554,-74.0062566207362,-74.0060459645889,-74.0053190755274,-74.0047538869233,-74.0054392652935,-74.0060285141717,-74.006615721184,-74.006803459389,-74.0075482161839,-74.0077965334962,-74.0070872428781,-74.0098541185563,-74.0115401754333,-74.0157487288266,-74.0169026736108,-74.01744446051,-74.0178871914939,-74.0185760501088,-74.0187633687868,-74.0193394687178,-74.0188828336333,-74.0175103708669,-74.0166876836887,-74.0165753609784,-74.016486655545,-74.0160255177601,-74.0159369853455,-74.0122796787279,-74.0108766402898,-74.0103568366732,-74.0103384594794,-74.0105598064477,-74.0109102434041,-74.0108734397819,-74.0115428803157,-74.01162173117,-74.0115144346328,-74.0116252752136,-74.0140621982817,-74.0142492693188,-74.014241804775,-74.0117535050969,-74.0117719119658,-74.0117973545628,-74.011829461988,-74.0118677661764,-74.0119117087206,-74.0119629072948,-74.0120187392263,-74.0120783174313,-74.0121406953,-74.0122048817377,-74.0122698569129,-74.0123345884613,-74.0123980478898,-74.0124592269185,-74.0125171535016,-74.0125709072726,-74.0126196341678,-74.013098246981,-74.0135519867144,-74.0135983928718,-74.0136502464596,-74.0137063452598,-74.0137628109131,-74.0138207747741,-74.0138790057052,-74.0139362668966,-74.0139913421344,-74.0142740725772,-74.0150800647109,-74.0151998057007,-74.0143692064823,-74.0141230285602,-74.0138727376325,-74.0142328945278,-74.0155964448955,-74.0156862549752,-74.0142872217899,-74.0142292319044,-74.0129758779219,-74.0133637821814,-74.0139510936525,-74.0151191866396,-74.0163209992231,-74.0145794672096,-74.0149639218457,-74.0154395663873,-74.0167076523659,-74.018168392808,-74.0188009477692,-74.0172713847013,-74.0172928251957,-74.0177524709637,-74.0177980519032,-74.0178151522344,-74.0178930147166,-74.0178797161499,-74.0179442808025,-74.0179811122353,-74.0180107732054,-74.0179576057241,-74.0179234101333,-74.0178360492119,-74.0178569494518,-74.0178018720321,-74.0181153639023,-74.0181364052083,-74.0181536139001,-74.0181664970957,-74.0181746857997,-74.0181779454721,-74.0181761827467,-74.0180451953719,-74.0180239944048,-74.0180300407372,-74.0180357497576,-74.0180091642728,-74.0180167666967,-74.0179237059139,-74.017986404728,-74.0178344757269,-74.0181498618912,-74.0181954434749,-74.0182296424114,-74.0182980265533,-74.0184123582173,-74.0183195782651,-74.0182630240997,-74.0181707090551,-74.0183869279632,-74.018475221787,-74.0184227782698,-74.0185216335545,-74.0187566135211,-74.0187674803916,-74.018779553442,-74.0187924778013,-74.0188058735751,-74.0188193470131,-74.0188325020817,-74.0188449521056,-74.018856331133,-74.0188663046924,-74.0188745796239,-74.0188809126962,-74.0188851177563,-74.0188870712008,-74.0188867156099,-74.0188840614345,-74.0184103133309,-74.0184181404245,-74.0184295373354,-74.0184442612652,-74.0184619985357,-74.0184823712713,-74.0185371072702,-74.0185348637046,-74.0185284352133,-74.0185180160516,-74.0185039210674,-74.0184865761866,-74.0184665055432,-74.0184443156401,-74.0184206770221,-74.0183963040124,-74.0180175344586,-74.0179741087094,-74.017938386837,-74.017910652233,-74.0178911249316,-74.0178799598628,-74.0178772456227,-74.0178830037701,-74.0178971886547,-74.0179196877776,-74.0179727864566,-74.0179768500939,-74.0191089030861,-74.0191214219692,-74.0197692561323,-74.0199519786468,-74.0190825738633,-74.0191418357437,-74.0191892731334,-74.0191909876797,-74.0192189273765,-74.019177439469,-74.0190876381209,-74.0190825764446,-74.0190654150209,-74.0190410871127,-74.0190338738475,-74.0184304066161,-74.018429658497,-74.0184110318318,-74.018595042201,-74.0186253260616,-74.0186278707078,-74.0186298146203,-74.0186499133297,-74.0186623577716,-74.0189540584041,-74.0189832211536,-74.0189899524726,-74.0190213741365,-74.0194723889746,-74.0195385653754,-74.0196620030694,-74.019663126515,-74.0195520810164,-74.0195184175009,-74.0194286437791,-74.019425749498,-74.0193650147008,-74.0192794279839,-74.0192767176376,-74.0192748527343,-74.019246899636,-74.0192424119533,-74.0192065036038,-74.0191207936089,-74.0190640191753,-74.019032611224,-74.0190301377812,-74.0190258798951,-74.018994459346,-74.0189902916436,-74.0189871412217,-74.0188508522899,-74.0188475707886,-74.0188243386943,-74.0188160794958,-74.0188115915917,-74.0187801720101,-74.0187750393966,-74.0187175176008,-74.0186331977281,-74.0186319129539,-74.0186017917925,-74.0185999818873,-74.0185950598254,-74.0185647616791,-74.0185105917507,-74.01840544611,-74.0184178621022,-74.0182702613937,-74.018283149009,-74.018340688269,-74.0183831379754,-74.0185788278879,-74.0194395573721,-74.0194562003954,-74.0194727993366,-74.0194889048376,-74.0195040808984,-74.0195179166799,-74.0195300376265,-74.0195401156048,-74.0195478777877,-74.0195531140397,-74.0195556826061,-74.0195555139501,-74.019552612636,-74.0192812810203,-74.0190683342972,-74.0189281398833,-74.0189910547142,-74.0177253257244,-74.0176473508548,-74.0175704949416,-74.0174692890313,-74.0168483700235,-74.0167883401621,-74.0152008227913,-74.0153205986476,-74.0150829518708,-74.0148678280074,-74.0128200039887,-74.0126242829078,-74.0121228589365,-74.0121348168879,-74.0141054964797,-74.0136086327028,-74.0138739877799,-74.0137420664441,-74.013018354221,-74.0118628137717,-74.0106085808234,-74.0096710855888,-74.0100860394786,-74.0107731233938,-74.0117827220121,-74.0119325997708,-74.0121759661464,-74.0101162546778,-74.0087859013092,-74.0086955995557,-74.0085980332971,-74.0083544653217,-74.0081641459391,-74.007981841317,-74.00793441543,-74.0078871216416,-74.007826954742,-74.0077683363514,-74.0077170756182,-74.0075447440394,-74.0070198868266,-74.0064414683234,-74.0058822418323,-74.005666802467,-74.005629863304,-74.0078329376668,-74.007420121541,-74.0050037331507,-74.0045927052177,-74.0067843850584,-74.0063646122527,-74.0038203891973,-74.0034092162452,-74.0057590073637,-74.0053420962492,-74.0029756543657,-74.0019632199286,-74.0018530452462,-74.0009615685494,-74.0006990584188,-74.0047941529455,-74.00440941326,-74.0019693859211,-74.0018176504073,-74.0017436211104],"lat":[40.6924067497055,40.6923827671366,40.6921847767889,40.6918957573263,40.6918978147893,40.6920414906675,40.6918964471302,40.6917672300104,40.6916514503089,40.6916130782729,40.6915939599271,40.6915718343477,40.6915369744965,40.6914951450345,40.6913699834776,40.6912537228763,40.6911946978608,40.6907577745864,40.6902394800844,40.689690123777,40.689160548836,40.6890332465313,40.6885194216226,40.68836463604,40.6878244518285,40.6876787969339,40.6871272300482,40.6867559669351,40.6864528711465,40.6854484062361,40.6853416955314,40.6845894530735,40.6846355816056,40.6846803718351,40.6850605086136,40.6851081993238,40.6852246184797,40.6850273069238,40.6843887556392,40.6843143041887,40.6841583994584,40.6840033717286,40.6839175137674,40.6838448061587,40.6837650103203,40.6829092290303,40.6835424548719,40.6834830448405,40.6834567933793,40.6834310717892,40.6834027180336,40.683381751998,40.6833623114889,40.6829653834689,40.6827805660987,40.6821489634618,40.6821014331121,40.6820667273451,40.6820398895047,40.6819824661363,40.6818048802675,40.6817710147314,40.6812583040727,40.6812225467569,40.6818526267385,40.6824912697107,40.6831288379729,40.6837654444832,40.6837443233783,40.6829722147987,40.6828270590431,40.6827295496811,40.6822697328902,40.681504639034,40.6810461702467,40.6809832759687,40.6806496724439,40.6807332033245,40.6808719053068,40.6802666168047,40.6797348230713,40.6786391209694,40.6779986773799,40.6775228106869,40.6771620086036,40.6763946529768,40.6757546336564,40.6752371128027,40.675155501764,40.6750700754908,40.6749812435676,40.6748894319058,40.6747950808498,40.6746986425955,40.6746005795177,40.6745013617793,40.6743034195093,40.6741032381801,40.6739028980975,40.6737045069705,40.6735097068892,40.6735094900912,40.6735092803237,40.6734554990708,40.6733641885281,40.6732742191573,40.6731857540558,40.6730989535934,40.6730139750677,40.6729309725521,40.6728500965096,40.6727714935476,40.6727131748473,40.6726472194284,40.672445493491,40.6718643647745,40.6712482248942,40.6706294753052,40.6700290975678,40.6694271775256,40.668824923261,40.6682230881444,40.6676212350908,40.6670220980278,40.6664190955295,40.6658150797262,40.6652136035386,40.6646063820106,40.6640118972666,40.6634017694639,40.6627990154146,40.6622018328287,40.6615948211,40.6612432337311,40.6612617846824,40.6612743310468,40.6612806082055,40.6612804837651,40.6612739603501,40.6612611755975,40.6612423990874,40.6612180268403,40.6611885728972,40.6611546584779,40.6621414927937,40.6632837414232,40.6644252123044,40.6655663378135,40.6667042622991,40.6667365954421,40.6667662175984,40.667848253555,40.669008413751,40.6690931941774,40.669060501367,40.6690313247711,40.6691748470337,40.669234549029,40.6694733106429,40.670199484385,40.6702641422862,40.6703114375234,40.670415448363,40.6706614996912,40.6708420817575,40.6712028684063,40.6715680432278,40.6717046875678,40.6718301725648,40.6717391576037,40.6716020471051,40.6714149055079,40.6707726390467,40.670127167893,40.6701130768115,40.6694986684217,40.6687168924971,40.6689456817173,40.6683594143471,40.6685786374413,40.6673484659494,40.6672631998149,40.6674276112084,40.6675675233565,40.667665641641,40.6677790863226,40.6679753211003,40.6679756477282,40.6679512714282,40.6678992047115,40.6679937625857,40.667882362494,40.6678903619281,40.6673383029097,40.6673356376667,40.666188861941,40.6662089567073,40.6661287894127,40.6661261855657,40.6661205657922,40.6661136770965,40.6661057184436,40.6660969197017,40.6660875350031,40.666077835404,40.6660681010557,40.6660586131131,40.6660496456141,40.6660414575647,40.6660342854579,40.6660283364438,40.6660237823459,40.6660207546989,40.6660193409495,40.6660195819305,40.6660214706818,40.666024952651,40.6660299272696,40.6660362508572,40.6660437407713,40.6660521806828,40.6660613268242,40.6660709150297,40.6660806683656,40.6660903051286,40.6660995469821,40.6661081269958,40.6661157973547,40.6661223365173,40.6661275556141,40.666131303903,40.6661334731226,40.6661340006198,40.6661339956091,40.6661324666348,40.6661590801502,40.6662124483498,40.6662233826561,40.6665382991071,40.667495533618,40.6675957547139,40.6680532429779,40.6695542853664,40.6707213594476,40.6709214682385,40.6697847457766,40.668623156272,40.6685913751657,40.6670517457336,40.6671597707772,40.6685913580332,40.6685236283354,40.6650859197567,40.6645683362917,40.6648466028415,40.6652679963518,40.6658504662854,40.67039241387,40.6710758744944,40.6716249484227,40.6716016662055,40.6710345309842,40.6654370667669,40.6650385378399,40.6649305089539,40.6648630487881,40.6654707917215,40.6657324141589,40.6686016157636,40.6686428353885,40.6690781954481,40.6691905250697,40.6691904923695,40.6697101155584,40.6697843427504,40.6701143464474,40.6704070228788,40.6705810282759,40.6697058384365,40.6697286047372,40.6698083705388,40.6706577570758,40.6707030539127,40.6707463314555,40.6707869587855,40.6708243436186,40.6708579409408,40.6708884462933,40.6709138052963,40.670933615032,40.6709475607518,40.6709554208782,40.6709570705248,40.6709524834811,40.6709417326286,40.6709249887833,40.670902517981,40.6708746772505,40.6708419089405,40.6710549599123,40.6712569343772,40.671226917313,40.6712026127228,40.6711845841027,40.6711735946862,40.6711689710886,40.6711708115139,40.671179076872,40.6711935916088,40.6713792986793,40.6706856737981,40.6707540276644,40.6714547961561,40.6716693341374,40.6718807617605,40.6721300005131,40.6709704775174,40.6710388349289,40.6722411829999,40.6722072049903,40.673327918721,40.6735915369344,40.6731115881934,40.6721569959691,40.6729082695637,40.6744140170716,40.6746776302942,40.6742728821587,40.6731937744218,40.6719392411037,40.6722507648487,40.6736086458055,40.6736282150247,40.6740477228925,40.6740158989732,40.6740303579952,40.6739652645502,40.6739565898509,40.6738828204969,40.6738996380546,40.6739131810524,40.6739869486651,40.6739753841934,40.6740404791318,40.6740578305957,40.6740954414124,40.6743427016823,40.6743586454752,40.6743770624254,40.6743974250481,40.6744191501316,40.6744416154409,40.6744641775393,40.6747679107681,40.6748527583632,40.6749241078276,40.6749588168435,40.6749935314211,40.6750094395052,40.6750759813264,40.6751251436211,40.6752582230143,40.6754678794149,40.6754403931399,40.6754620819009,40.6754591791814,40.6753654494316,40.6753028125453,40.6753502231809,40.6752909056633,40.6750968465209,40.675153191397,40.6752081013348,40.6752687125877,40.675056454035,40.67505036597,40.67504578063,40.6750428327948,40.6750416091121,40.6750421455504,40.6750444263417,40.6750483844453,40.6750539035182,40.6750608213346,40.6750689345545,40.6750780047006,40.675087765168,40.6750979290603,40.6751081976233,40.6751182690256,40.6755190609858,40.6755381677054,40.6755562034215,40.6755727838991,40.6755875559056,40.675600204736,40.6757687904999,40.6757873380552,40.6758053095626,40.6758221619521,40.675837385971,40.6758505215733,40.6758611718213,40.6758690148808,40.6758738137464,40.6758754234037,40.6758843775577,40.6759488236561,40.6760159559103,40.6760852417856,40.6761561316614,40.6762280631915,40.676300465765,40.6763727650321,40.676444387461,40.6765147648871,40.6765128286957,40.6765679162061,40.6765442818882,40.6766155846381,40.6766132249173,40.67710301045,40.6771395640476,40.6777231343278,40.6777411827303,40.6777432711799,40.6777772885465,40.677826949007,40.6778312363988,40.6778314788134,40.6778501521189,40.6778766240178,40.677876998463,40.6779083213623,40.6779275848231,40.6784071217811,40.6783977736292,40.6783695815257,40.6783695811138,40.678369580799,40.6783848758373,40.6783943460031,40.6783814863046,40.6783524407378,40.6783532931807,40.6783772049148,40.6783583370506,40.6783019525936,40.678385638959,40.6783882012706,40.6784821776007,40.6784591206158,40.6784001983931,40.6784002823106,40.6784020299783,40.6784044944436,40.6784067724368,40.6784083394682,40.6784318333736,40.6784318341242,40.6784079243723,40.6784125619095,40.6784156345743,40.6784429727554,40.6784426585475,40.6784421191424,40.6784199168621,40.6784200163914,40.6784200921312,40.678423357207,40.6784260174143,40.6784448536761,40.6784515501039,40.6784515508377,40.67843020222,40.6784303209971,40.6784316687477,40.6784336421727,40.6784347623034,40.6784609809059,40.6784609811985,40.6784609819941,40.6784396324662,40.6784405118351,40.6784422200623,40.6785495513949,40.6785542184596,40.6787282894121,40.6787286722695,40.6787448216982,40.6789830794724,40.6789332936243,40.6789324523741,40.6789337001853,40.6789370032777,40.6789422722318,40.678949364409,40.6789580878135,40.6789682062894,40.6789794459143,40.678991502414,40.6790040494006,40.6790167472074,40.6790292520846,40.6796481405954,40.6797607479765,40.6798443056137,40.6799049937038,40.6806619026736,40.6806018908417,40.6806506481243,40.6806147317008,40.6809857589876,40.6810219652923,40.6819794194281,40.6821107287806,40.6822540993206,40.6823832140473,40.6836224164973,40.6834686963917,40.6829621778509,40.6829059280251,40.6817125193755,40.6812219467282,40.681009813319,40.6809177013429,40.6804123740144,40.6813984795506,40.682468760268,40.6832687277151,40.6836554310435,40.6843586155409,40.6837599954993,40.6838877491549,40.6840951856285,40.6853415977367,40.6861466022989,40.6861933180126,40.686252564085,40.6864002002507,40.6861747171615,40.6862758220959,40.6862819429786,40.6862457947934,40.6862406283318,40.6862491366716,40.6862644290184,40.686318244091,40.6865264176967,40.6862884902322,40.686195768391,40.6866980788338,40.6867842055411,40.6873850551628,40.6882062904359,40.6876059854009,40.6882152229866,40.6888268799583,40.689669668637,40.6889296446993,40.6896132611602,40.6902364000162,40.6910916029779,40.6904265759207,40.6901363794608,40.6903879872445,40.6901287683501,40.6906118584191,40.6917616203744,40.6925288003893,40.6918432088201,40.6922219624814,40.6924067497055]}]],[[{"lng":[-74.1594560243807,-74.1597481587429,-74.1599787569962,-74.1601497797169,-74.1603248563423,-74.1604697294025,-74.160583416439,-74.1606963816236,-74.1607783314368,-74.1608538858551,-74.1609453840248,-74.1610249026959,-74.1611124252205,-74.1611433241295,-74.1611818404392,-74.1611844355879,-74.1612044150741,-74.1612209244664,-74.1612281459845,-74.1612603798077,-74.1612888334855,-74.1613940264824,-74.1614465769923,-74.1614977600833,-74.1615407729505,-74.1615340324289,-74.1580975000887,-74.1580806249854,-74.1580241608312,-74.1579643392344,-74.1579341788003,-74.1578909606118,-74.1578459610329,-74.1577455636748,-74.1576281088869,-74.1575577885595,-74.1576741520986,-74.1578116894398,-74.1579258823506,-74.1580063345771,-74.1580745482245,-74.1581268769068,-74.1581420957172,-74.1581735817058,-74.1581990404634,-74.158258867774,-74.1583299258829,-74.1584500861119,-74.1585268760503,-74.1585874256811,-74.1586095910001,-74.1586861917961,-74.1587124678574,-74.1587549677637,-74.1588109374541,-74.1592002453446,-74.1593192556198,-74.1594560243807],"lat":[40.6414483328215,40.6414165257902,40.6414464808364,40.6414946816977,40.6415761781737,40.641643622513,40.6416666435855,40.6416895211446,40.6417390346269,40.6417540665251,40.6417872393533,40.6417992408604,40.6418354532347,40.6419069435176,40.6419960397619,40.6421148459602,40.6422319920385,40.642328707326,40.6426172832742,40.6427570675602,40.6428804399975,40.6433365435004,40.6435644085618,40.6437863671136,40.6439728299198,40.6441562824211,40.6437575671228,40.6437118357355,40.6436522098154,40.6436040945142,40.6435725390313,40.6435433773604,40.6434899673416,40.6434076396278,40.6433113234465,40.643239865981,40.643173429144,40.6431476211652,40.6430853080883,40.6430236758603,40.6429337018178,40.6428183157112,40.6427151050021,40.6426487267145,40.6425950776634,40.6425641258429,40.642527364215,40.6425045717895,40.6425001840928,40.6424603840835,40.6423956274726,40.6422769002717,40.6421677470564,40.6419911835296,40.6417586352429,40.6416504034748,40.6415563865718,40.6414483328215]}],[{"lng":[-74.0822127291494,-74.0821239438788,-74.0820462949325,-74.0818660354559,-74.0816524638857,-74.0814222820374,-74.0813560383372,-74.0809559824747,-74.0807283876237,-74.0805182378836,-74.079809964287,-74.0792325272494,-74.0789954633326,-74.0770865800269,-74.0769934108888,-74.0768289568095,-74.0765065715286,-74.076209225026,-74.0759922276154,-74.0753076702205,-74.0744528256364,-74.0740781209122,-74.0739583997646,-74.0738725805337,-74.0735910791928,-74.0734985136762,-74.0737586129538,-74.0738008832219,-74.0738291123217,-74.0737788034295,-74.0738341938234,-74.0738565368473,-74.0738214319199,-74.0733381385698,-74.0732453946485,-74.0734869412914,-74.0734183875406,-74.073690118065,-74.0734642981641,-74.0733332876388,-74.073349388193,-74.0732385381076,-74.0730574496531,-74.073025205072,-74.073202259547,-74.073012400295,-74.0730555988172,-74.0734138382779,-74.0734259074759,-74.0732727290153,-74.0733451713362,-74.0731218418351,-74.072925850374,-74.0728796413302,-74.072798503415,-74.0725877555387,-74.072703082676,-74.0726922655298,-74.0725961712549,-74.0725646823295,-74.0726123279568,-74.072599349268,-74.072572639401,-74.0725258752098,-74.0725755171922,-74.0726274240843,-74.0726166243939,-74.0726231121813,-74.072666307712,-74.0725538388441,-74.0725430349205,-74.0725322202573,-74.0725862304329,-74.0725992077413,-74.0725840870201,-74.0727246714508,-74.0727904221504,-74.0727458600086,-74.0727826061293,-74.0726982879903,-74.0723310089429,-74.0717067164824,-74.0717164118445,-74.0716873737673,-74.0716582975978,-74.0716824805113,-74.071687334134,-74.0723091904679,-74.0722558843628,-74.0721614838066,-74.0720184321324,-74.0721128181298,-74.072098261866,-74.0722321839642,-74.0722919028182,-74.0721848860161,-74.07197701849,-74.0719624775731,-74.0718608087087,-74.0717564808778,-74.0718702509904,-74.071862967984,-74.0719380005509,-74.0719476957863,-74.0720581750604,-74.0720008015548,-74.0719062401355,-74.071792592434,-74.0717707521253,-74.0716496940852,-74.071588916579,-74.0716278763372,-74.0715967920116,-74.0713561217663,-74.0713410941792,-74.0714909006389,-74.0714728470501,-74.0715020640516,-74.0714820243262,-74.0714433170632,-74.0714165971652,-74.071304872901,-74.0713078799052,-74.0711430928896,-74.0711310572094,-74.0715026314746,-74.0714777732261,-74.0716454090146,-74.0716489219899,-74.0717028612152,-74.0717035196727,-74.0721843496904,-74.0721095244463,-74.070374309906,-74.0703292371539,-74.073238291836,-74.0731440058598,-74.0702465869866,-74.0701939955927,-74.0730868981938,-74.0728900560963,-74.0719628096162,-74.0719817686511,-74.0718050036704,-74.0718114182292,-74.0700184914874,-74.069983546539,-74.0717764806754,-74.0717765805276,-74.0717776041814,-74.0717795287127,-74.0717823110228,-74.0717858888039,-74.0717901819341,-74.0717950942719,-74.0718001791059,-74.0718057609803,-74.07181171212,-74.0718178962971,-74.0718241719493,-74.0718303954205,-74.0718364242488,-74.0718364346041,-74.0728504119494,-74.0727769001111,-74.0730772583775,-74.0730903557878,-74.0730326595885,-74.0729293338475,-74.0729260113635,-74.0730161802915,-74.0730144456221,-74.0729319987184,-74.0729227839391,-74.072872655067,-74.0727933688742,-74.0727207645827,-74.0726702464206,-74.0726133813185,-74.0725880905415,-74.0725817300911,-74.0726093386762,-74.072388529503,-74.0723794112938,-74.0726063279755,-74.0725813387353,-74.0725727521261,-74.0734835380173,-74.0734563615981,-74.0735344759337,-74.0734873730356,-74.0734156263282,-74.0733734288804,-74.0732402072255,-74.0732385788387,-74.0725102522106,-74.0725042146961,-74.0723958663089,-74.0723958812341,-74.072103951649,-74.0720948380751,-74.0724108424751,-74.0724108549152,-74.072507170032,-74.0725041424481,-74.0728231570719,-74.0728291971569,-74.0729014239926,-74.0729014064582,-74.0732234340433,-74.0732311600813,-74.0733160490405,-74.073358220456,-74.0730394864668,-74.0728318441043,-74.0733282131641,-74.073057512998,-74.0729847461233,-74.0727820681781,-74.0680217354395,-74.0681301924799,-74.0729117793656,-74.0729282255191,-74.0725125940682,-74.0725035430728,-74.0724583585414,-74.0724492976148,-74.0724552786585,-74.0723990061677,-74.0723698422187,-74.0722952028267,-74.0729745953726,-74.0730287128247,-74.0730725030345,-74.0731378357197,-74.0731656340586,-74.0731920605383,-74.0732136008077,-74.073232362937,-74.0732664191674,-74.0733039479736,-74.0733275803113,-74.0733609503618,-74.073387352804,-74.0734214144515,-74.0734617290564,-74.0734964689557,-74.0735372972767,-74.0735485682667,-74.0735381360336,-74.0735158230786,-74.0735269464726,-74.0735192900301,-74.0735053780985,-74.073487300458,-74.0734713142002,-74.0734407302279,-74.0733781663633,-74.0733114284679,-74.0732613715131,-74.0732099312968,-74.0731995080981,-74.0728805883925,-74.0727054337728,-74.0725678017724,-74.0722550095577,-74.0712345554911,-74.0712159830704,-74.0711470448825,-74.0710617939655,-74.070989415226,-74.0709170697731,-74.0708237583934,-74.070788793745,-74.0707596091144,-74.0707199403692,-74.0705868140295,-74.0705669376257,-74.0705657781343,-74.0705680524043,-74.0705540306489,-74.0705061765062,-74.0704956626468,-74.0704477572997,-74.0703929141398,-74.0703695680075,-74.0703368750972,-74.0702819782229,-74.0702831270951,-74.070243404139,-74.0702200628292,-74.0701675444021,-74.0700869743589,-74.0700799570712,-74.0700799300196,-74.0700647196044,-74.0700273506158,-74.0699830075234,-74.069957356764,-74.0699445353284,-74.0699205973767,-74.0699037459483,-74.0698803921236,-74.0698815482554,-74.0698909248972,-74.0699060243201,-74.0698978246624,-74.0698780033211,-74.0698581498264,-74.0698397057815,-74.0697706520898,-74.0697837365309,-74.0697554308833,-74.0694626579128,-74.0692133249811,-74.0692246048855,-74.0687575029625,-74.068392688831,-74.0683704285743,-74.0672051910483,-74.0666915792443,-74.066656533117,-74.0664933529638,-74.0664225152255,-74.0664202750844,-74.0664146674395,-74.0659606527178,-74.0659100323003,-74.0663776127702,-74.066409889533,-74.0661990795487,-74.0655728084121,-74.0654458606948,-74.0660793790845,-74.0666820798292,-74.0664155871518,-74.0660499153591,-74.0656986474414,-74.0654654995275,-74.0651374231156,-74.0651304128228,-74.0649618928048,-74.0643570515867,-74.0642572175159,-74.0650990840721,-74.0644366200503,-74.0640121170204,-74.0639089224036,-74.0643274585805,-74.0641981286968,-74.0639106023492,-74.0638681679178,-74.0638284392291,-74.0637924920711,-74.0637612998317,-74.0637357071402,-74.0637302790527,-74.0637337263122,-74.0637459633993,-74.0637666867812,-74.0636860989525,-74.0635595449629,-74.0628872404992,-74.0628800578669,-74.0618326374661,-74.0614396145728,-74.0611815141251,-74.0610394201486,-74.0608085316575,-74.0607377937743,-74.0606494058952,-74.0606742614511,-74.0606123893038,-74.0605035922461,-74.0603368079202,-74.0602364881448,-74.0600902768904,-74.0600796731915,-74.0600045732293,-74.060008504501,-74.0598544432862,-74.0598670814194,-74.0598871675371,-74.059912238422,-74.059921205866,-74.0599521919466,-74.0599613278625,-74.0599919211909,-74.0600016118392,-74.0600181691866,-74.0600417658948,-74.0600473682174,-74.0600044761045,-74.0600162511624,-74.060197727956,-74.060195940971,-74.0599991971164,-74.0597693073818,-74.0600343232964,-74.0600204843536,-74.0602722480995,-74.0600775489673,-74.0599011042858,-74.0595330674896,-74.0595031263315,-74.0594756513105,-74.0594513277861,-74.059430762503,-74.0594144684558,-74.0591137796491,-74.0590226904748,-74.0589216345498,-74.0589013342152,-74.0589274475419,-74.0590456347314,-74.0591233393982,-74.0591221407178,-74.0590858430866,-74.0585788123101,-74.0584804297112,-74.0584773643764,-74.0583271141443,-74.0577621971334,-74.0573757032285,-74.0571638387898,-74.0571340354374,-74.057032635894,-74.0569988766926,-74.0569659895738,-74.0567927048816,-74.0567718170307,-74.0578935087154,-74.0604642972133,-74.0651709125078,-74.0646841079542,-74.0643006056805,-74.0641494698955,-74.0640480244343,-74.0635056566019,-74.0640008137063,-74.0650851416127,-74.0655066319099,-74.0666288063531,-74.0689811828008,-74.0691403098743,-74.0700036821387,-74.0715149332337,-74.0733520736676,-74.0735832666406,-74.073999653081,-74.0747894220168,-74.0754323971439,-74.0755171401,-74.0758492212917,-74.0765673473533,-74.0771469658721,-74.0777808956554,-74.0801476556437,-74.081554701236,-74.0828094986345,-74.0834193337422,-74.0835513160172,-74.0840678169856,-74.0849000251211,-74.0854275631428,-74.0867299710324,-74.087164216049,-74.08796268696,-74.0887463865131,-74.0894937013172,-74.090454959314,-74.0908154106232,-74.0930568561993,-74.0941095910939,-74.0944640494356,-74.0948248911882,-74.0951902707625,-74.0955582976852,-74.0959270457183,-74.0972175072902,-74.0973045568559,-74.0977696876388,-74.0993845303205,-74.0994698982082,-74.1000361659006,-74.1008280694218,-74.1013859682836,-74.1016547806967,-74.1018122545728,-74.1023959698123,-74.1029018244486,-74.1033759701738,-74.1042949546501,-74.1054938902475,-74.1066750969231,-74.1072296390472,-74.1077864524133,-74.1083441793557,-74.1088526825127,-74.1089014622398,-74.1094569652844,-74.1100093411824,-74.1104795650208,-74.1108265435469,-74.1111363814495,-74.1126374738107,-74.1129522981178,-74.1132727787911,-74.1135976182838,-74.1139254467172,-74.1142548823079,-74.1145845146131,-74.1148066736336,-74.1150291908367,-74.1152517866413,-74.1154741813677,-74.1156960955886,-74.1159172505448,-74.1161373683003,-74.1163561722905,-74.1165733876026,-74.1167887413211,-74.1169152638732,-74.1174278136688,-74.1183752738762,-74.1199551026624,-74.1209847227257,-74.1213517962625,-74.1224721469679,-74.1225232481015,-74.1232652198775,-74.1235063919732,-74.1239812611203,-74.1245261878744,-74.1251456324918,-74.1252004038081,-74.1263049784264,-74.1265091152447,-74.1267436156091,-74.1274296081366,-74.1278426714669,-74.1287489750645,-74.1298332375903,-74.1309400232729,-74.1315687340858,-74.1321045972236,-74.1330793880416,-74.1340090913369,-74.1349425823379,-74.1361628751426,-74.1364079738768,-74.1371367889934,-74.1380692982536,-74.1390029483852,-74.1398426516882,-74.1408864119256,-74.1418444922298,-74.142879167357,-74.14355036507,-74.1439455821311,-74.1445610109588,-74.1454990358979,-74.146281774311,-74.14724381883,-74.1475909532907,-74.1478892677469,-74.1482388665267,-74.1483961498217,-74.1488696133884,-74.149099517847,-74.1496842382463,-74.150186665171,-74.1503190076634,-74.1512034824914,-74.1531727534184,-74.1537183428746,-74.1537911672324,-74.153868323359,-74.1547408023168,-74.1547926527579,-74.1565118788053,-74.1573738365634,-74.1579267386242,-74.158617417266,-74.1591052153822,-74.1598317893642,-74.1605006921234,-74.1616180742892,-74.1623477632941,-74.1633739183966,-74.1639409497624,-74.1648419038537,-74.1657068252146,-74.1660319330625,-74.1674266668983,-74.167697103615,-74.1680808633964,-74.1684731134242,-74.1687847205829,-74.1688889431174,-74.1692362454647,-74.1695365651142,-74.1698574068933,-74.1709554651375,-74.1718117809592,-74.1720711300466,-74.1723626102388,-74.1727075220247,-74.1732673084324,-74.1736124409434,-74.1739501677995,-74.1742788798559,-74.174597062586,-74.1749032855397,-74.1751962573228,-74.1761005285905,-74.1777529863655,-74.177815021471,-74.1780882019124,-74.1782817743403,-74.1788839057371,-74.1791837742976,-74.1792462347089,-74.1795447069973,-74.1799370611388,-74.180334248424,-74.1819023571359,-74.1836879109284,-74.184426877268,-74.1851706590226,-74.1859191691804,-74.1866723204915,-74.1872941765054,-74.1879115568774,-74.1885243616571,-74.1891324916308,-74.1897358483375,-74.1903343342685,-74.1909278523288,-74.19151630641,-74.1920996012195,-74.1926776422956,-74.1929756774533,-74.1961412310206,-74.1961198339255,-74.1960983457685,-74.1960330392925,-74.1960226115935,-74.1960326018283,-74.196029046913,-74.195963867063,-74.1959455848558,-74.1958835533079,-74.1958060567968,-74.1956860928936,-74.1955768805797,-74.1955597525936,-74.1955275375725,-74.1955085218472,-74.1954869269248,-74.19547347097,-74.195460045448,-74.1954289412743,-74.1953921818181,-74.1953614204139,-74.1953293491205,-74.1953070435641,-74.1953040658198,-74.1953074731055,-74.1952893503173,-74.1952551116111,-74.1952126270202,-74.1951857730962,-74.1951782949684,-74.1951860124745,-74.1952066137094,-74.1952183296772,-74.19521533742,-74.1951995801065,-74.1951912648134,-74.195182084814,-74.1951789081691,-74.1951828091959,-74.1951989606933,-74.1952180479734,-74.1952242024813,-74.1952183436443,-74.1952094167651,-74.195205241607,-74.1952045014828,-74.195200969001,-74.1951766108465,-74.1951547961312,-74.1944948077446,-74.1945135216041,-74.194538002885,-74.1945471654312,-74.1945446229226,-74.1945260684378,-74.1944932346972,-74.1944585226273,-74.1944360654234,-74.1944225685479,-74.1944138694963,-74.1944496283607,-74.1944725220626,-74.1944964540511,-74.1945029597643,-74.1945185109163,-74.1945421257978,-74.1945612901362,-74.1945941227947,-74.1946213505899,-74.1946441833098,-74.1946561206246,-74.1946648484245,-74.1946795009384,-74.1946910617938,-74.1947021131716,-74.1947340388392,-74.1947712346407,-74.1947868968247,-74.1947765738464,-74.1947715070146,-74.194770775859,-74.1947553988095,-74.1947371364667,-74.1946231014519,-74.1945406538106,-74.1945003136082,-74.1944240592381,-74.1943903812557,-74.1943800480482,-74.1943668924539,-74.1943595427586,-74.1943594357064,-74.1943580610105,-74.1943565189597,-74.1943371695146,-74.1943111983336,-74.1942810992094,-74.194257510017,-74.1942351673307,-74.1942041110516,-74.1941741280135,-74.1941327571665,-74.1940828169559,-74.1939730862765,-74.1938983633938,-74.1938269242309,-74.1937742820784,-74.1937222485417,-74.1936265512071,-74.1935831769486,-74.1937196462209,-74.1932342882869,-74.1888189669685,-74.1870234700329,-74.186524968976,-74.1862320980966,-74.1861007857335,-74.1860631840011,-74.185981704392,-74.1859089666786,-74.185638574961,-74.1855741946739,-74.1855011655489,-74.185359267435,-74.1853454296375,-74.185303320134,-74.1852045294068,-74.1851358068276,-74.1851143161488,-74.1850886090233,-74.1851058832706,-74.1851743550745,-74.1852479359728,-74.1851963785235,-74.1851663459308,-74.1851362701024,-74.1849818130333,-74.1849268329308,-74.1848915539784,-74.1848658019589,-74.184846586784,-74.1848359458085,-74.1848254951987,-74.1847888182156,-74.1847731083301,-74.184770042638,-74.1847708510448,-74.1847718395766,-74.1847666430869,-74.1847577356207,-74.1847539079795,-74.1847486006983,-74.1847211948365,-74.1847001218683,-74.1846842556461,-74.1846596165069,-74.1846403745224,-74.1846281570112,-74.1846258908309,-74.1846177183209,-74.1846048914572,-74.184594930282,-74.1845860764883,-74.1845779388453,-74.1845532530629,-74.1845353559461,-74.1845124758307,-74.1844922640951,-74.1844721980557,-74.1844553333814,-74.1844471430653,-74.1844447942823,-74.1844433893306,-74.1844447687056,-74.1844445866403,-74.1844423383707,-74.1844357613095,-74.1844244496634,-74.1844020066903,-74.1842996776201,-74.1842441201757,-74.1842004767683,-74.1841781328016,-74.1841552188563,-74.1841327565863,-74.1841131906444,-74.1840953581982,-74.1840692351307,-74.1840637750652,-74.1840603107912,-74.1840555962864,-74.1840648323192,-74.1840761373723,-74.1840885478107,-74.1841065566164,-74.1841138601742,-74.1841173716868,-74.1841209654099,-74.1841299924189,-74.1841408429177,-74.1841535980247,-74.1841647573296,-74.184175525609,-74.1841869119477,-74.1841923922089,-74.1841974353449,-74.1842069892934,-74.1842166408692,-74.1842219649985,-74.1842223268822,-74.1842266904518,-74.1842328133643,-74.1842396156352,-74.184249704116,-74.1842601014089,-74.1842731009375,-74.1842832707536,-74.1842920252666,-74.1842979494031,-74.1843143684635,-74.1843217087798,-74.1843285569187,-74.1843320875596,-74.1843272518482,-74.1843152413485,-74.1843051996152,-74.1843051813303,-74.1843107605287,-74.184322962589,-74.1843328238055,-74.1843475661551,-74.1843615740828,-74.1843626446559,-74.1843592244624,-74.1843523401954,-74.1843417439023,-74.184333589167,-74.1843327734141,-74.1843393766651,-74.1843485856654,-74.1843597625506,-74.1843680268448,-74.184370467738,-74.1843590104983,-74.1843387350607,-74.1843121008167,-74.1842961058573,-74.1842756216647,-74.1842576581548,-74.1842418913178,-74.1842228856895,-74.1842144400002,-74.1842070655628,-74.1841989571676,-74.1841913356625,-74.1841895595892,-74.1841964375187,-74.184200792563,-74.1841960862891,-74.1841796129049,-74.1841588751478,-74.1841453961376,-74.1841350549975,-74.1840911459567,-74.1840764542184,-74.1840600544655,-74.1840374409907,-74.1840245429553,-74.1840117630117,-74.1840048060138,-74.1839913917367,-74.1839805322347,-74.1839696118677,-74.1839595333209,-74.1839549067064,-74.1839432513229,-74.1839326375868,-74.1839035841427,-74.1838238028877,-74.1837275016424,-74.1837208434843,-74.1837193919353,-74.1837261239643,-74.1837268731632,-74.1836506706406,-74.1836330057828,-74.1836216377141,-74.183615004558,-74.1836127166088,-74.1836167250486,-74.1836269837024,-74.1836363169948,-74.1836564248556,-74.1836726891303,-74.1836860863565,-74.1837050188129,-74.1837220267211,-74.1837372296288,-74.1837954852913,-74.1838066513827,-74.1838087720257,-74.1838037819007,-74.1837970667756,-74.183792258642,-74.1837881288082,-74.1837906864124,-74.1838013177471,-74.1838301914733,-74.1838669763111,-74.1838893723236,-74.1839143096973,-74.1839286508954,-74.1839445054408,-74.1839494593717,-74.1839480792666,-74.1839448939396,-74.1839527758581,-74.1839652294333,-74.1839804701284,-74.1840193827904,-74.1840297054294,-74.1840261119215,-74.1840160593143,-74.1839996926629,-74.1839751438876,-74.1839603738791,-74.1839476717792,-74.1839344986337,-74.1839201359059,-74.1839158616655,-74.183911079655,-74.1839034681329,-74.1838956829287,-74.183875570326,-74.1838457593691,-74.1838232526699,-74.1838008103757,-74.1837834927905,-74.1837601691038,-74.183743224099,-74.1837383084419,-74.183730479523,-74.183723122301,-74.1837107863426,-74.183691726861,-74.1836746827703,-74.1836645411182,-74.1836556701409,-74.1836367564231,-74.1836205458328,-74.183605441721,-74.1835617273757,-74.1835450268845,-74.1835393116318,-74.1835297885603,-74.1835156916417,-74.1834967142369,-74.1834742716646,-74.1834512120989,-74.1834338477906,-74.1834044102331,-74.1833845074681,-74.1833736033659,-74.183345417832,-74.1833278275572,-74.1833095391773,-74.1832835379204,-74.183265902295,-74.1832500261245,-74.1832421227928,-74.1832439997559,-74.1832544668051,-74.1832672925711,-74.1832835392778,-74.1833019165316,-74.1833180172884,-74.1833285841235,-74.183343515093,-74.1833594976973,-74.1833810340057,-74.1833992662457,-74.1834167004061,-74.1834282289109,-74.1834377710867,-74.1834458335298,-74.1834551306499,-74.1834631571095,-74.1834698866766,-74.1834738273398,-74.1834745364066,-74.1834698738528,-74.1834669505891,-74.1834630019432,-74.1834520875405,-74.1834324825653,-74.1834136585598,-74.1833996328772,-74.1833830393912,-74.1833776405034,-74.1833767046446,-74.1833847670973,-74.1833983279884,-74.1834159088867,-74.1834331620843,-74.1834573645993,-74.1834836063872,-74.1834903184377,-74.1834988177534,-74.1835069084765,-74.1835188912456,-74.1835301110549,-74.1835334205678,-74.183542327855,-74.1835430606545,-74.183535840479,-74.1835291889149,-74.1835428958738,-74.1835630869929,-74.1836173942194,-74.1836410875689,-74.1836648501578,-74.1836849420943,-74.1836998198491,-74.1837084599113,-74.1837151090172,-74.1837162972871,-74.1837243527366,-74.183729705456,-74.1837344591972,-74.1837568631378,-74.1837936734454,-74.1838004494242,-74.1837933628714,-74.1837755512802,-74.1837621687837,-74.1837442593566,-74.1837275021522,-74.1837042685541,-74.1836839640877,-74.1836698100389,-74.1836706257302,-74.1836716056155,-74.1836674587201,-74.183659746559,-74.1836339088722,-74.1835946460288,-74.1835638912663,-74.1835395966405,-74.1835041236949,-74.1834844199444,-74.1834473052271,-74.183417511422,-74.1833919018625,-74.1833595039949,-74.1833256914269,-74.1832882327298,-74.1832678292809,-74.1832449219577,-74.1832261131577,-74.1832093571293,-74.1831831291711,-74.1831516115433,-74.1831060694867,-74.1829800010379,-74.1828893162184,-74.1827975700767,-74.1827282966811,-74.1826531803974,-74.1825850137457,-74.182510923557,-74.1824283217282,-74.1823356331157,-74.1822796854327,-74.1822209079047,-74.1820090620486,-74.1819861648959,-74.1819524617875,-74.1819282319002,-74.1818999819254,-74.1818678928017,-74.1818421995707,-74.1817939719293,-74.1817493551966,-74.1817159158691,-74.1816676335006,-74.1816270643461,-74.1815907420064,-74.1815442312971,-74.1814943987325,-74.1814499395321,-74.1814165284401,-74.1813810665639,-74.1813332727931,-74.1812950936092,-74.1812707809655,-74.1812443536097,-74.1812165934919,-74.1811843424393,-74.1811600654508,-74.1811346991412,-74.1811125703127,-74.1810865231358,-74.1810650824921,-74.1810423912372,-74.1810329091121,-74.1810070487262,-74.1809952879368,-74.1809765149715,-74.1809630964181,-74.1809444506256,-74.1809157994875,-74.1808942075147,-74.1808721251322,-74.1808501901789,-74.1808286272016,-74.1808068653847,-74.1808018321768,-74.180805128549,-74.18080739951,-74.1808078013712,-74.1808069954587,-74.1808051037246,-74.18080491631,-74.1808032855983,-74.1807999936322,-74.1807928938142,-74.1807883664043,-74.1807699430072,-74.180751927183,-74.1807129832458,-74.1806757979002,-74.1806291420583,-74.1806050729297,-74.1805815414821,-74.1805271909094,-74.1805032392335,-74.1804991783595,-74.1804899776992,-74.1804817395366,-74.1800407794923,-74.1800477217928,-74.1799067145553,-74.1799240477008,-74.1799365601228,-74.1799650727402,-74.1798956834003,-74.1798840636142,-74.1798437695035,-74.1798483940912,-74.179774527333,-74.1797298775204,-74.1793311724943,-74.1793315380847,-74.1793143250338,-74.1793047609758,-74.1792994217032,-74.1792984192646,-74.1793017747006,-74.1793110941751,-74.1793156765471,-74.1793300972013,-74.1793306293518,-74.1793332044071,-74.1793345668085,-74.1793346797657,-74.1793335402282,-74.1793311789674,-74.1793102522533,-74.1792924908406,-74.1792916601138,-74.1792883006844,-74.1792824625499,-74.1792810016676,-74.1792846610363,-74.1792933539825,-74.179306874602,-74.1793249026371,-74.179336687716,-74.179338520702,-74.1793397382094,-74.179340307993,-74.1793402149624,-74.1793394615812,-74.1793380678023,-74.1793360705394,-74.1793031962161,-74.1792512334066,-74.179211869959,-74.1792027129182,-74.1791928812337,-74.179171519671,-74.179153993854,-74.1791443307641,-74.1791278828046,-74.1791061325883,-74.1790746658389,-74.1790814414026,-74.1790676774293,-74.1790564783293,-74.1790551334485,-74.179053524621,-74.1790456580247,-74.1790494161958,-74.1790596462759,-74.1790441057025,-74.1790396659129,-74.1790261907259,-74.1790167660356,-74.1790089501765,-74.1790060458651,-74.1790019685346,-74.1790014871545,-74.1790081492062,-74.1790187639508,-74.1790356370138,-74.1790355592856,-74.1790453882432,-74.1790659065114,-74.1790795948969,-74.1791012423097,-74.1791139458235,-74.1791334360188,-74.1791620364555,-74.1791790812681,-74.1792077048166,-74.1792363054283,-74.1792540442163,-74.1792696725185,-74.1792858791854,-74.179308078267,-74.1793295090664,-74.1793389072359,-74.1793524748159,-74.1793749830344,-74.1793859617267,-74.1793953340768,-74.1794048280203,-74.1794083264653,-74.1794057831752,-74.1793958343502,-74.1793808028684,-74.1793708038433,-74.1793725304565,-74.1793807514004,-74.1793928348582,-74.1794101430954,-74.1794235198441,-74.1794354805101,-74.1794336816766,-74.179421167376,-74.1794077368491,-74.179416866805,-74.1794109227675,-74.1794072847307,-74.1794053083524,-74.1793945100098,-74.1793883898395,-74.1793852836143,-74.1793951255382,-74.1794015785892,-74.1794040163088,-74.1794084470563,-74.1794157854734,-74.1794284438358,-74.1794392413294,-74.1794544507687,-74.179469771639,-74.1794726081395,-74.1794840262465,-74.1794946243289,-74.1795238200983,-74.1795291402254,-74.1795324894015,-74.1795425331849,-74.1795418885992,-74.1795469629251,-74.1795529269747,-74.1795561160981,-74.1795703501622,-74.1795820775084,-74.1795915012831,-74.179600746756,-74.1796043799412,-74.1796022935593,-74.1796121356732,-74.179609673373,-74.1796059664849,-74.1796018181681,-74.1795975821488,-74.1795871372141,-74.1795688885904,-74.1795575356898,-74.1795538345618,-74.1795490462879,-74.1795430426735,-74.1795339820554,-74.1795227427538,-74.1795071789818,-74.179485606782,-74.179483390033,-74.1794721304225,-74.1794620870392,-74.1794049107093,-74.1793935826967,-74.179377862092,-74.1793672887672,-74.1793401762239,-74.179328358587,-74.1793220169517,-74.1793161871242,-74.1793136167691,-74.1793141070972,-74.1793039781062,-74.1792935357681,-74.1792748897108,-74.1792440480751,-74.1792211297449,-74.1791872806743,-74.1791585616137,-74.1791398613662,-74.1791228646587,-74.1790817492684,-74.179063313411,-74.1790505832986,-74.1790392681086,-74.1790188165325,-74.1789844594886,-74.1789462643083,-74.178938208876,-74.1789318779192,-74.1789220482197,-74.1789090055482,-74.1788900868083,-74.1788888924679,-74.1788375586262,-74.1788209437353,-74.1788118087669,-74.1788019079681,-74.1787907843687,-74.1787811448278,-74.1787707175887,-74.1787354316599,-74.1786761242806,-74.1786406200643,-74.1785990982218,-74.1785135615448,-74.1784831382722,-74.1784702390633,-74.1784248296991,-74.1783951236717,-74.178369901485,-74.1783492357988,-74.1783339635217,-74.178320321909,-74.1783066798634,-74.178291263983,-74.178272612486,-74.1782566214603,-74.1782449476874,-74.1782360066261,-74.1782390999614,-74.1782867414142,-74.178347617072,-74.1783600122331,-74.1783683086274,-74.1783613096398,-74.1783412701196,-74.1783171291722,-74.1782887449354,-74.1782460258198,-74.1782021765537,-74.178173240869,-74.1781522165308,-74.1781329886773,-74.1781099265079,-74.1780613329667,-74.1780076345715,-74.1779834935718,-74.177959521865,-74.1779559982533,-74.1779400335895,-74.1779307085353,-74.1778907931584,-74.1778667719044,-74.1778408806159,-74.1778235955294,-74.1778123760877,-74.1777980401847,-74.1777897840412,-74.1777854322409,-74.1777733061394,-74.1777693527224,-74.1777595736341,-74.1777431051537,-74.177728065662,-74.1777206674806,-74.1776863629984,-74.1776402154951,-74.1775312840748,-74.1774883729559,-74.1774586452386,-74.177441384621,-74.1774225480879,-74.1773959137474,-74.1773857436062,-74.177353725443,-74.1773282685309,-74.1772693509244,-74.1772589893104,-74.1772411227327,-74.1772111857095,-74.1771735255775,-74.1771404213281,-74.1771348059392,-74.1771378426717,-74.1771434442994,-74.1771483824075,-74.1771545454805,-74.1771551049564,-74.1771552839548,-74.1771511870448,-74.1771453791091,-74.1771318774029,-74.1771187583656,-74.1770989930608,-74.1770933016005,-74.1770874193489,-74.1770759221522,-74.1770577629456,-74.1770359775905,-74.1769808824638,-74.1769285450689,-74.1768873353247,-74.1768676428622,-74.1768473767409,-74.1768238689604,-74.1768129047834,-74.1768119330083,-74.1768151479469,-74.1768138074244,-74.1768051405487,-74.1767931445653,-74.1767817964472,-74.1767728228848,-74.1767673853184,-74.176771838318,-74.1767741985175,-74.1767718111686,-74.1767696150389,-74.1767611281468,-74.1767481454634,-74.1767361217451,-74.1767261157428,-74.1767159306661,-74.1767048915117,-74.1766955768324,-74.1767010143561,-74.1766993183296,-74.176694288811,-74.1766862119556,-74.1766834551962,-74.1764825728458,-74.1763907772988,-74.1763688010919,-74.1763578661753,-74.176349506657,-74.176358835594,-74.1763835687842,-74.1765921871739,-74.176652115517,-74.1766757134282,-74.1766872379122,-74.1767167439317,-74.1767244249508,-74.1767168530947,-74.1767058828444,-74.176708488327,-74.176711093376,-74.1767077904899,-74.1766839050925,-74.1766762510197,-74.1766679553825,-74.1766502809557,-74.176616451692,-74.1765848919263,-74.1765387716303,-74.1765146138673,-74.1764965409312,-74.1764732522115,-74.1764338073171,-74.1763712644375,-74.176336667138,-74.1762882750847,-74.1761039225724,-74.1759818319192,-74.1758975780591,-74.1758500274789,-74.1757796470287,-74.175731228269,-74.1757073504662,-74.1756896487599,-74.1756845067306,-74.1756756481692,-74.1756697398141,-74.175664787668,-74.1756412036402,-74.1756268457992,-74.1756025095443,-74.1755826545851,-74.1755322102409,-74.1755279766243,-74.1755166411693,-74.1754841791405,-74.1754857932712,-74.1754908667434,-74.175504080227,-74.1755034564365,-74.1755040579344,-74.1755064451168,-74.1755198580638,-74.1755395485611,-74.17557190132,-74.1755845622616,-74.1755864902898,-74.175565114645,-74.1755553273533,-74.1755323312601,-74.1755192260767,-74.1755021389857,-74.1754840199677,-74.1754769120152,-74.1754777055782,-74.1754765953167,-74.175480324392,-74.1754915945825,-74.1754925512184,-74.1754775450056,-74.1754716625528,-74.1754729135591,-74.1754771130472,-74.175494239784,-74.1755197250761,-74.1755469212418,-74.1755691163698,-74.175623523596,-74.1757076850473,-74.1757087996122,-74.1756997778929,-74.1756900921499,-74.1756900156247,-74.1756847074258,-74.1756694080407,-74.1756517059875,-74.1756247760321,-74.1756017406819,-74.1755903182852,-74.1755752846883,-74.1755589230505,-74.1755270697419,-74.1754993129942,-74.175466911572,-74.1754424095345,-74.1754052896231,-74.1753750953005,-74.1753505323223,-74.1753462838135,-74.1753466040377,-74.1753274914682,-74.1752969154506,-74.1752587960805,-74.1752088841638,-74.1751663874444,-74.17511371862,-74.1750418570967,-74.174953354567,-74.1748962052513,-74.1748554056801,-74.1747883544586,-74.1747520964775,-74.1747200385446,-74.1746801817274,-74.1746445119179,-74.1746087518242,-74.1745862147746,-74.1745513226936,-74.1745492383907,-74.1745226229698,-74.1745018207919,-74.1744825385649,-74.1744651584218,-74.1744595556281,-74.1744475844544,-74.1744320929955,-74.1743946348973,-74.1743657294361,-74.1741537399046,-74.1741110252966,-74.1740590828623,-74.1740548408656,-74.1740333926389,-74.1740124513486,-74.1739963697913,-74.1739501335386,-74.1738861956904,-74.1737873409299,-74.1736411255205,-74.173598692665,-74.1735448378662,-74.1734814746966,-74.1734312431563,-74.1733831948871,-74.1733256259606,-74.1732393164173,-74.1731548195888,-74.1730911777886,-74.1730446594831,-74.1730004279918,-74.1729742183035,-74.1729686514103,-74.1729412389165,-74.1729233337384,-74.1729229255567,-74.172916799197,-74.1729102135975,-74.1728864131037,-74.1728769823726,-74.1728888372496,-74.1729170546054,-74.1729543046914,-74.1729827885465,-74.173001854924,-74.1730162494816,-74.1730281811762,-74.1730197591178,-74.1730015458565,-74.1729731776963,-74.1729480484988,-74.1729211221144,-74.1728961418757,-74.1728933409512,-74.1728717473642,-74.1728467352471,-74.1728229721441,-74.1727838206599,-74.1727539706459,-74.1727152770952,-74.1726771463489,-74.1726366266963,-74.1725109072377,-74.1725070075418,-74.1724478448507,-74.1724339476584,-74.172424988389,-74.1724147927306,-74.1724089734547,-74.1724043087927,-74.172403448119,-74.1723884015702,-74.1723726036919,-74.1723616538658,-74.1723701911474,-74.1723981267516,-74.1724234076358,-74.1724595339966,-74.1724791236716,-74.1725080282729,-74.1725268527777,-74.1725452934826,-74.1725422440035,-74.172521417057,-74.1725008695513,-74.1724903037232,-74.1725203313273,-74.1725492365645,-74.1725558853614,-74.1725534854742,-74.1725708551334,-74.1726103004065,-74.1726368189117,-74.1726877627214,-74.1727196918095,-74.1727340354813,-74.1727317383761,-74.172728969401,-74.1727214530519,-74.1726911322785,-74.1726444633723,-74.1725900869711,-74.1725719268556,-74.1725625972165,-74.1725599060188,-74.1725524645668,-74.1725390393324,-74.1725059252311,-74.1724901252264,-74.1724798302517,-74.1724665296965,-74.1724402786201,-74.1723939799338,-74.1723698481319,-74.1723487539136,-74.1723268925558,-74.1723121538647,-74.1723025435188,-74.1722810538992,-74.1722268680073,-74.1721484102897,-74.1720978368981,-74.1720525842927,-74.1720323441418,-74.1720071529846,-74.1719853686176,-74.1719633056599,-74.1719551374492,-74.1719296911769,-74.1718808529777,-74.1718725950499,-74.1718554050919,-74.1718404989471,-74.1717938551895,-74.1717503385207,-74.171658327406,-74.1715720073874,-74.1715107741458,-74.1715081109973,-74.1714748162796,-74.1714459876187,-74.1714296151884,-74.1714236935794,-74.1714332783833,-74.1714488615698,-74.1714673009927,-74.1714829855417,-74.1714911523035,-74.171472610194,-74.1714537863652,-74.1714321947034,-74.1714064038123,-74.1713478695363,-74.1713358728181,-74.1713479329689,-74.1713682752735,-74.1713954571441,-74.1714405829383,-74.17150330553,-74.1716459422364,-74.1717694870766,-74.1718195751345,-74.1718423805154,-74.1718583448554,-74.1718604258258,-74.1718325674351,-74.1717898807473,-74.1717607840136,-74.1717501278703,-74.1717544924505,-74.1717959169155,-74.1718233683028,-74.1718462485307,-74.1718492724512,-74.1718401246179,-74.171822513898,-74.1718027201441,-74.1717829403092,-74.1717555552444,-74.171734345319,-74.1717231158891,-74.1717281302479,-74.1717583377351,-74.171770296471,-74.1717645795822,-74.1717462155455,-74.1717187278213,-74.1716960887246,-74.1716821666447,-74.1716712815487,-74.1716799981048,-74.1716942410577,-74.1717122849497,-74.1717218695049,-74.1717113031629,-74.1716975975874,-74.1716648782834,-74.1716279723204,-74.171604479422,-74.171591361068,-74.1715798619225,-74.1715618947411,-74.1715506645337,-74.1715394222351,-74.1715266618959,-74.1715085795052,-74.1714949639567,-74.1714885709421,-74.1714833247627,-74.1714787898945,-74.1714835301859,-74.1714875067279,-74.1714850688069,-74.1714787214452,-74.1714680089049,-74.171465068423,-74.1714538709737,-74.1714522887381,-74.1714630212239,-74.1714762292275,-74.1714831641924,-74.1714911412025,-74.1714937829857,-74.1714963733101,-74.1714952193453,-74.1714905486945,-74.1714866379448,-74.1714846220515,-74.1714849353251,-74.1714932806684,-74.1715070444534,-74.1715157343783,-74.1715222942605,-74.1715405942017,-74.1715605531319,-74.1715768987371,-74.1715896745471,-74.1715927998756,-74.1716021028776,-74.1716061755619,-74.171599551894,-74.1715900830608,-74.1715811380519,-74.1715732841174,-74.1715742720483,-74.1715802447481,-74.1715872192374,-74.1715971917377,-74.1716007079577,-74.1716248618878,-74.1716511916402,-74.1717056688525,-74.1717507343241,-74.1717824911718,-74.1718370645924,-74.1719130762053,-74.1719707814098,-74.1720042927544,-74.1720231585235,-74.1720543295956,-74.1720897732115,-74.172257793126,-74.1722957577536,-74.172332153088,-74.1723652739651,-74.1723921694625,-74.1724160191034,-74.1724312171361,-74.1724407109894,-74.172447589678,-74.1724607914743,-74.1724794616066,-74.172510062131,-74.1725452306331,-74.1726175741688,-74.1726525587914,-74.1727040367257,-74.1727523314146,-74.1727962478836,-74.1728432973644,-74.1729038433586,-74.172938961754,-74.1729666153532,-74.1729879887585,-74.1729992381907,-74.1730038838114,-74.17299926424,-74.1729905111473,-74.1729879880031,-74.1729799058207,-74.1729675456654,-74.1729591880983,-74.1729412319821,-74.1729191436166,-74.1728894995599,-74.1728534883566,-74.172825119327,-74.1727994132234,-74.1727561143921,-74.1727136650175,-74.1726278212175,-74.1725570483046,-74.1725012509345,-74.1724611418626,-74.1724373884874,-74.17237264272,-74.1723079886836,-74.1722154325725,-74.1721097577176,-74.172062005147,-74.1720244616686,-74.1719924762055,-74.1719657158356,-74.1719367665939,-74.1718997846608,-74.1718640859913,-74.171817169814,-74.1717762885643,-74.1717354590031,-74.1716934884309,-74.1716577376186,-74.1716231713125,-74.1716010726542,-74.1715849607511,-74.1715699468542,-74.1715590748124,-74.1715539568968,-74.1715474160606,-74.1715491453159,-74.1715663401011,-74.171565452232,-74.1715588562976,-74.171546694245,-74.1715293446476,-74.171511708403,-74.1714973088786,-74.1714932694843,-74.1714799203521,-74.1714558850582,-74.1714420386606,-74.1714385975189,-74.1714396572437,-74.1714310172024,-74.1714086451093,-74.1713974413457,-74.1713865185935,-74.171386146815,-74.171401761581,-74.1713905404507,-74.1713738235051,-74.1713274013555,-74.1711541244912,-74.1711773463552,-74.1710501723989,-74.1709920875226,-74.1712752444561,-74.1712113010523,-74.1711926095121,-74.1702863544111,-74.1700787865105,-74.1691529556914,-74.1690643162887,-74.1684023253057,-74.1682434357728,-74.1682342144125,-74.1682040289716,-74.1681254749266,-74.16801680461,-74.1677409405136,-74.1675760709251,-74.1667738499355,-74.1667169375705,-74.1665337579284,-74.1664797188299,-74.1662159991718,-74.1660998989603,-74.1663188729246,-74.1661160866904,-74.1660453490875,-74.165910141479,-74.165801107559,-74.165634097638,-74.165443100824,-74.1649413904131,-74.1651904175824,-74.1648110926634,-74.1647342653681,-74.1645713236685,-74.1644145964924,-74.1645965659758,-74.1642355930395,-74.1641688681363,-74.1640017900142,-74.1638624942036,-74.1640473151664,-74.1639965645573,-74.163944913667,-74.1638497658629,-74.1637525635069,-74.1636538853251,-74.1635543188294,-74.16345445682,-74.1632457793263,-74.1628714808786,-74.1628579940694,-74.1628050278943,-74.1627521292517,-74.1626464137992,-74.1625097636999,-74.1624347706588,-74.162069018689,-74.1620691886898,-74.1616753469423,-74.1622846525209,-74.1620256407051,-74.1618185661226,-74.1614491782689,-74.1613022180155,-74.1616601070699,-74.1612401581499,-74.1611578955031,-74.1609049077051,-74.1607365487248,-74.161064280653,-74.1610816175891,-74.1608919896109,-74.1608112684074,-74.160762219471,-74.1607506030919,-74.1604218697274,-74.1603481999317,-74.1599489963448,-74.1598641046504,-74.160206919224,-74.1602347053031,-74.160224664531,-74.1601651513392,-74.1601272556782,-74.1601109242345,-74.1600983707883,-74.160057540661,-74.1600261541872,-74.1599928110187,-74.1599583519461,-74.1599236459,-74.1598895680384,-74.159856977679,-74.1597817530621,-74.1597301046699,-74.1597373290745,-74.1597200004094,-74.1596709437014,-74.1596414652894,-74.1596314936957,-74.1596311809968,-74.1595771239791,-74.1595025801432,-74.1594570478402,-74.1594477035375,-74.1594197309645,-74.1593195403716,-74.1592271162295,-74.1591641581224,-74.1591610760113,-74.1591446080743,-74.1591271123761,-74.1591106290415,-74.1590962110192,-74.1590869513726,-74.1590766446494,-74.1590562237889,-74.159015212849,-74.1589894137285,-74.1590253286346,-74.1590095788743,-74.1588953235085,-74.1589329916066,-74.1586458000796,-74.1586347244211,-74.1581527719599,-74.1581488391503,-74.1578926295388,-74.1578412227291,-74.1577335257235,-74.1577736593691,-74.1571878278252,-74.1570707730558,-74.1563684859868,-74.1563655286372,-74.1561027649089,-74.1561148826474,-74.1556986205315,-74.1556851576991,-74.1555891193463,-74.1555864375891,-74.1548293246186,-74.1547593366532,-74.1546926386453,-74.1547782901199,-74.1546466983395,-74.1545967016333,-74.1545491989675,-74.1544542571697,-74.1543830825975,-74.1542527007352,-74.1541579187625,-74.1540299723588,-74.1538807215743,-74.1537646408605,-74.1536296525882,-74.15351122315,-74.1534140659779,-74.1532759228053,-74.1531366609852,-74.1530299679265,-74.1529659292193,-74.152920867497,-74.1528805832335,-74.1528227954896,-74.152797035114,-74.1527006075224,-74.1526960388594,-74.1527127779974,-74.1527247393579,-74.1527247451836,-74.1527250698798,-74.152725169035,-74.1526970044967,-74.1524287612682,-74.1522180688448,-74.152297861755,-74.1521367589991,-74.1520518095404,-74.1520463923327,-74.1511954500718,-74.1512628062136,-74.1513951761365,-74.1512482796657,-74.1511296509037,-74.1505563884208,-74.1504403557141,-74.1504388642439,-74.150411797284,-74.1503927537014,-74.1503085589372,-74.1501138044371,-74.1499678209055,-74.1497938612606,-74.1496788983089,-74.1494581610482,-74.1494473290005,-74.1494357640079,-74.149423723082,-74.1494114738108,-74.1493992884128,-74.1493883959118,-74.1493780966631,-74.1493685783587,-74.1493600144591,-74.1493123559733,-74.1494519410733,-74.1494188170834,-74.149317017231,-74.1493005253992,-74.1492912038271,-74.1492912077351,-74.1492913007569,-74.1492818748203,-74.1492440647119,-74.1491941815569,-74.1488817554377,-74.1485581509232,-74.1485281668494,-74.1485160249077,-74.1487779200588,-74.14761237249,-74.1474993974054,-74.1460217310172,-74.1460573361839,-74.1451927948154,-74.1448420460314,-74.1446713323417,-74.1445908527502,-74.1443392310963,-74.1442614355039,-74.1442282273141,-74.1441618166379,-74.1440930244748,-74.1440502707355,-74.1440241613658,-74.1439530270104,-74.1438867855887,-74.1438616359574,-74.1438374578704,-74.1438148224993,-74.1437942645721,-74.1437762697409,-74.1437612631091,-74.1437495991891,-74.1438419251962,-74.1438173453027,-74.1437428711006,-74.1436836356146,-74.1436457188344,-74.1436149086078,-74.1435730859379,-74.1434883376543,-74.1434247683011,-74.1434547958056,-74.1433610301084,-74.1432628436278,-74.1431767669616,-74.1431280244307,-74.1430773072675,-74.1429599995592,-74.1429372878831,-74.1429224478051,-74.1428597469843,-74.1427873013905,-74.1426832099649,-74.1425776933605,-74.1425397070128,-74.1424754916061,-74.1423879514933,-74.1423588139311,-74.1423224404163,-74.1423196970729,-74.142385583141,-74.142404638359,-74.1423806145696,-74.1422976698097,-74.1421542002926,-74.1420986415576,-74.1420543148346,-74.1415562297235,-74.1414804740345,-74.1412862402268,-74.141192218399,-74.1410243055212,-74.1407625364528,-74.1402889234368,-74.139937853155,-74.1392974576389,-74.139257448527,-74.1392038237721,-74.1391832803589,-74.1387924907908,-74.1375757483848,-74.1375268203474,-74.1374808382665,-74.1374388271393,-74.1374017234485,-74.1373703542867,-74.1373454189202,-74.1373700174998,-74.1364960506209,-74.1357074211084,-74.1357095897999,-74.1349989231714,-74.1349965524362,-74.1343526957363,-74.1343028118537,-74.1334971976667,-74.1334674003459,-74.1334153923328,-74.1333157728423,-74.1332279961608,-74.1331450268027,-74.1329917239349,-74.132889031136,-74.1328250505301,-74.1327421638914,-74.1326616657202,-74.132562222538,-74.1325150401328,-74.1324204314397,-74.1324028357712,-74.1317279495978,-74.1313446802939,-74.1312558118026,-74.1314619976482,-74.1310808393752,-74.1307364496511,-74.1303250354803,-74.1301756735989,-74.1301232490168,-74.1302788704305,-74.1301837001321,-74.1301278287223,-74.1296778516623,-74.1294905763737,-74.1299774026272,-74.1298775073671,-74.129920885797,-74.1293071318685,-74.1292297726106,-74.128933012099,-74.1289177930478,-74.128994963095,-74.1289072903345,-74.1288276699353,-74.1288120184713,-74.1281321491913,-74.1281090048587,-74.1278348594618,-74.1275267724088,-74.1273956855128,-74.1273911938027,-74.127347703174,-74.127244818385,-74.127147745639,-74.12702736021,-74.1270612003737,-74.1270762595555,-74.1270985553174,-74.1271025962817,-74.1271016294187,-74.127104566553,-74.1271244300904,-74.127097762782,-74.1270875403209,-74.127081560709,-74.1270536220526,-74.1265152929335,-74.1264482391902,-74.126396102817,-74.1263463338019,-74.1262752003535,-74.1262230339262,-74.1261922059236,-74.1261494990704,-74.1260698286229,-74.1261999629165,-74.1263418044479,-74.1263680868898,-74.125640268706,-74.1256326580634,-74.1261327655123,-74.1259954242245,-74.1259302660642,-74.125808125427,-74.1256981163312,-74.1255783356939,-74.1254624989208,-74.1253309402587,-74.1252049134943,-74.1248776989751,-74.1246972888106,-74.1246151273606,-74.124529232981,-74.1244806588375,-74.124383570936,-74.1242587290791,-74.1241557844501,-74.1241072851931,-74.1240289521124,-74.1239506354574,-74.1238424516055,-74.1237491804069,-74.123637260257,-74.1235775927147,-74.1235440461204,-74.1235403980375,-74.1235479370604,-74.1235143969793,-74.1234072699929,-74.1231834384499,-74.1228563055525,-74.122779769773,-74.122651740603,-74.1226036360162,-74.1225728047916,-74.1227447642698,-74.1227968835939,-74.1228795964405,-74.1229072489857,-74.1229058179184,-74.1228569841383,-74.1228662545766,-74.1228586834476,-74.1228267295256,-74.122825654104,-74.1228239765498,-74.1227944519432,-74.1227815318064,-74.1227618539832,-74.1227211444975,-74.1226955588767,-74.1219585006234,-74.1219412972036,-74.1219020586069,-74.1218414699557,-74.121843907453,-74.1218656179933,-74.1219483099526,-74.1219428261312,-74.1219814638067,-74.1219908380754,-74.1218718277202,-74.1218741619115,-74.1218532959782,-74.1218455081297,-74.1218339180556,-74.1218066108207,-74.1217576469687,-74.1217875485973,-74.1217713220107,-74.1217791119751,-74.1217644292981,-74.1217597787933,-74.1215588656059,-74.1215534360538,-74.1217605260274,-74.1217237531887,-74.1214475336692,-74.1213869068935,-74.1213261711165,-74.1213052908301,-74.1213733293903,-74.1213119482967,-74.121240335297,-74.1212349214333,-74.1211948895787,-74.1211724627506,-74.1212807479436,-74.121214702542,-74.1211012473794,-74.1210772740512,-74.121180395077,-74.1207131758869,-74.1206463449958,-74.1205742902843,-74.1205281181158,-74.1201678368803,-74.1199348008891,-74.1199711121359,-74.1196071674787,-74.1196256560989,-74.1199569987577,-74.1198544394209,-74.1195298610576,-74.1194656129683,-74.1194498817768,-74.1194263129249,-74.119323025471,-74.1190972049372,-74.1194808715509,-74.1194002953246,-74.119003482004,-74.1186163523627,-74.1186048615348,-74.1186883410023,-74.1186517159865,-74.1188750592626,-74.1188994831259,-74.1189607740235,-74.1188362461694,-74.1186447971802,-74.1185836461846,-74.1184211759267,-74.1184018508355,-74.1181553652091,-74.1182083154939,-74.1180076709366,-74.1179172868314,-74.1177964325272,-74.1177569064589,-74.117748756418,-74.1176985031942,-74.1174978002836,-74.117121006304,-74.1172240828296,-74.1171394411701,-74.1167218766389,-74.1167370340764,-74.1168839607624,-74.1170334812623,-74.1172247008254,-74.1171490052742,-74.1170558070613,-74.1169577534559,-74.1168425818898,-74.116739672586,-74.1166660764623,-74.1166099194958,-74.116599759241,-74.1163000008275,-74.1163316697743,-74.1163048136593,-74.1167534287466,-74.1166704138269,-74.1162462970986,-74.1162194379205,-74.1161572274713,-74.1161420863572,-74.115996933113,-74.115719170423,-74.1156482343379,-74.1153508218293,-74.1151171475206,-74.1148073506757,-74.1147807642832,-74.1142953872243,-74.1137966608601,-74.1140405314602,-74.1139509406848,-74.1128880651097,-74.1128510306609,-74.1138570932216,-74.1138707838445,-74.113653709669,-74.113434037371,-74.1133302319254,-74.1123037090663,-74.1118079913692,-74.1119033368524,-74.1111612946926,-74.111116336666,-74.1117664665002,-74.111725299958,-74.1116763506341,-74.1114957114635,-74.1109228187844,-74.1097393256448,-74.1095380858385,-74.1088648989597,-74.108695537437,-74.1082362049678,-74.1077967414639,-74.1068034270611,-74.1047222159976,-74.1046457778213,-74.104396135552,-74.1043405874489,-74.1041235630175,-74.1040550911334,-74.1040223721704,-74.1039864479106,-74.1039146325034,-74.1038360955884,-74.1037642881849,-74.1037283985405,-74.1036992614275,-74.1036504880204,-74.1030729667749,-74.102316793374,-74.1016826444167,-74.1016426644115,-74.1006054200535,-74.1001321918731,-74.0997111287711,-74.0988006688581,-74.0984998162551,-74.0960455528158,-74.0946850092126,-74.0936265693011,-74.0930396026804,-74.0929882818765,-74.0930050729631,-74.0913569794201,-74.0909602408032,-74.0899233404758,-74.0893975253534,-74.0884552174832,-74.0883604348923,-74.0882744437083,-74.0882411247403,-74.087938041576,-74.087674426815,-74.086344676303,-74.0857075437821,-74.0852269841173,-74.0848440321572,-74.0848297392565,-74.084760748522,-74.0846939476186,-74.0846301835403,-74.0845702647732,-74.083903216641,-74.0825658580706,-74.0822127291494],"lat":[40.6482801622901,40.648278112186,40.6483077531151,40.6483733913572,40.6484242602179,40.6485047254469,40.648490943531,40.6483486764594,40.6482748738463,40.6482455147327,40.648383312988,40.6481863254887,40.6481425544225,40.6471998612679,40.6472058518391,40.6470805224388,40.6469688181834,40.6467238827273,40.646552023759,40.6459130220668,40.6450674882207,40.6450843289107,40.6451932054456,40.6451478163471,40.644998928043,40.6450833734751,40.6453133517729,40.645285707095,40.6453117721427,40.6453562984643,40.6454073806886,40.6454248160997,40.6454434833773,40.6457831161623,40.6457049252696,40.6455498077453,40.6454884791783,40.6453057245574,40.6451079436095,40.6450343807341,40.64502209633,40.6449638639099,40.6451450268718,40.6451312383202,40.6449439412436,40.6448386797018,40.644807917841,40.6450159184719,40.6450005680126,40.6449162794755,40.644850257929,40.644714799469,40.6448640734575,40.6448441794349,40.6449101237688,40.6447908631737,40.6446455956276,40.6446373697844,40.6447354724669,40.6447197488582,40.6446752900825,40.6446670649253,40.6446938034031,40.6446700395146,40.6446176853886,40.644643997132,40.6446505891586,40.6446538783353,40.6446209206595,40.6445600718067,40.6445633712258,40.6445567921703,40.6445304142499,40.6445369924377,40.6445468804627,40.6446208837661,40.6445520183129,40.6445240310686,40.6444918400175,40.6444412734674,40.644599873185,40.6450226498311,40.6450318657213,40.6450503282006,40.6450337464351,40.6450042193931,40.6450134394763,40.6445777535548,40.6445464311019,40.6445815353091,40.6444119329409,40.6443639174445,40.6443381042439,40.6442882697937,40.6442660478205,40.6441104648926,40.644181399058,40.6441703417333,40.6442017617702,40.6440118454986,40.6439748850298,40.6439582896924,40.6439268858153,40.6439361021897,40.6439004276987,40.6437811329696,40.6437971091786,40.643816308579,40.6437720548354,40.6437868857247,40.6435913148711,40.6435783406638,40.6434601574887,40.6434973045561,40.6434562255216,40.6434287405859,40.6433602727182,40.6433548660038,40.6432926250636,40.6432705613306,40.6431931095958,40.64321200376,40.6432211326978,40.6432509092395,40.6432052636783,40.6431293046955,40.642808293775,40.6428003596807,40.6426799316797,40.6426798980604,40.64279633528,40.6427140932891,40.6424632167928,40.6426914030532,40.6425261281323,40.6421847360824,40.6418529739776,40.6422069742969,40.6420075033079,40.6416368149697,40.6409226728761,40.6409955792581,40.6410124006536,40.6410293437563,40.6411231242019,40.6412781322375,40.6410689426143,40.6409259594685,40.6409212381017,40.6409165809514,40.6409120923109,40.6409078727,40.6409040166137,40.6409006104062,40.640897730357,40.6408949268187,40.6408927397232,40.6408912191354,40.6408903998632,40.6408903006605,40.6408909237981,40.6408922550119,40.6409018738206,40.6408036884451,40.6405289631474,40.6405133117964,40.6386189996859,40.638590610272,40.6385926498383,40.63844115456,40.6384266339324,40.6384093841189,40.6384144884302,40.6383762297535,40.638379987367,40.6383859305692,40.6383859765077,40.6383763896268,40.6383355452385,40.6383018941706,40.6382586140071,40.6382268953211,40.6382452659968,40.6381627260741,40.638136308347,40.6379418745921,40.637871909876,40.6377873579357,40.6376539456857,40.6376417226323,40.6372335292362,40.6368939509656,40.6366107256394,40.6366189197912,40.6366327973865,40.6366928746795,40.6366768285806,40.6366837747327,40.6366975321684,40.6367252309892,40.6366472776246,40.6366172712076,40.6366287356816,40.6366263813552,40.6366103328556,40.636580323407,40.6365986624511,40.6365894458338,40.6365733954361,40.6365456754272,40.636566425453,40.6365587633843,40.6365360941652,40.6347982312994,40.6336660328257,40.6320584429904,40.6306906545501,40.6303089789815,40.6302461046155,40.6287875851855,40.6285390460915,40.6299963794065,40.6299566963418,40.627768778427,40.62774814778,40.6277091963531,40.6276793941806,40.627644995425,40.627631100526,40.6275001677161,40.6271384270081,40.6271093614328,40.6271050666473,40.6270960331491,40.6270753326336,40.6270647200944,40.6270705304258,40.6270588629097,40.6270498452858,40.6270397589644,40.6270264920637,40.6270211800701,40.6270179802593,40.6270031310853,40.6269978119121,40.6269877215359,40.626967569583,40.6269360239494,40.6269262184866,40.6269235758603,40.6268642615036,40.6268631942686,40.6268557833378,40.6268494358578,40.626848388465,40.6268526354839,40.6268595417957,40.626868057022,40.6268739274194,40.6268750182767,40.6268835263227,40.6268883006597,40.6269290279663,40.6268741485629,40.6262248976367,40.624608750194,40.6230932975647,40.6230578056978,40.6229201449007,40.622793155008,40.6227088000527,40.6226564291279,40.6226236149861,40.6226124987033,40.6226032211668,40.6225774818233,40.6223812237283,40.6223288203538,40.6223095487185,40.6222808456162,40.6222524247504,40.6222044800556,40.6221849414191,40.6220890221743,40.6220481891243,40.6220215509226,40.6219780385666,40.6218847892468,40.6218687962434,40.621792417663,40.6217702216216,40.6217213908923,40.6216077226484,40.6215864060355,40.621560641124,40.6215100117923,40.6214540638507,40.6214176664008,40.621417682013,40.6214212437711,40.6214330982653,40.6214390366883,40.6214052909801,40.6213955178182,40.621392789272,40.6213883955268,40.6213510866492,40.6213510986992,40.6213191290094,40.6213232079833,40.6212685418666,40.621247173999,40.6212081398724,40.6210874930096,40.6209025647431,40.6208921854035,40.6205562599766,40.6202938937252,40.6202939942489,40.619455405543,40.6190857642475,40.6190164884376,40.6188976015952,40.6189605565051,40.6189622667614,40.6189579985178,40.6193590155938,40.6193158004039,40.6188948122841,40.6188644675671,40.6187224812888,40.6192745436,40.6192026282893,40.6186209197745,40.6180674959386,40.6178724981656,40.6181954103528,40.6179564155866,40.6181070702808,40.6178906996048,40.6178963869941,40.6177723990679,40.6182459448656,40.6181716875856,40.6175109561255,40.6170624146026,40.6174022261335,40.6173288251491,40.6169885030222,40.6169009345904,40.6168676138215,40.6168577109679,40.6168426391477,40.6168228064819,40.6167987500073,40.6167711211342,40.6167283699455,40.6166854995251,40.6166435731903,40.6166036308403,40.6165416712265,40.6164443669384,40.6157518795213,40.6157444806829,40.6147873106475,40.6143780206996,40.6138608881325,40.6135905493377,40.6130317338062,40.6130466770951,40.6128078504194,40.6125779986198,40.6123056767378,40.6121005541204,40.6119018802197,40.6119477357609,40.6120145678959,40.611998241374,40.6120331949817,40.6120383811342,40.6121029586082,40.6121434859966,40.6122078942763,40.6122882877462,40.6123170419324,40.6124164016142,40.6124456969951,40.6125437980571,40.6125748734753,40.6126279661522,40.6127036321904,40.6127215945673,40.6127265850374,40.6127636878954,40.612786375932,40.6128017746222,40.6127838996187,40.6120566471394,40.6119427345742,40.6119285742108,40.6118196399392,40.6118301792575,40.6117491730782,40.6117142545669,40.6117041253008,40.6116905298033,40.6116738072124,40.6116543746712,40.6116327169214,40.6112538175253,40.6111523585216,40.6110560548981,40.6110022864863,40.6109383775445,40.6108896384961,40.6108222890891,40.6107384290466,40.610633676752,40.6100486443875,40.6100107404537,40.6099272948093,40.6097682289801,40.60932605221,40.6089619482392,40.6087427831037,40.6086356718206,40.6084742891963,40.6083747730917,40.6082695473219,40.6079375067591,40.6078995395851,40.6074527233981,40.6064058245662,40.6042135088463,40.6035880441716,40.6030952955355,40.6027192027059,40.6024493024955,40.6021500548305,40.6022913985708,40.6025999499056,40.6027198804299,40.6031053657056,40.6039819199692,40.6040397187302,40.6043792994778,40.6049778569116,40.6055630442717,40.6056210674513,40.6057255679582,40.6058702120091,40.6059879668429,40.6059979500401,40.6060370708854,40.6061216641582,40.6061452342304,40.6061710088577,40.6062458352117,40.6062902965674,40.6064109790698,40.6065225086613,40.606551986371,40.6066814853406,40.606890132547,40.6070223905291,40.607551270117,40.607727602221,40.6080518279621,40.6083700462689,40.6086869332584,40.6090945263766,40.6092365855667,40.6101199357373,40.610406552122,40.6104852193128,40.6105480573601,40.6105946639872,40.610624778037,40.6106383474822,40.610628017665,40.6106273209652,40.6106235929402,40.6105613899334,40.610558101373,40.6105362823107,40.6105066718399,40.6104858075458,40.6104757535881,40.6104698627692,40.6104480281832,40.6104291028298,40.6104134717621,40.6103821298373,40.6103436175778,40.6102868030276,40.6102524448125,40.6102350571793,40.6102347678599,40.6102501095356,40.6102515849962,40.6102854386673,40.6103362055471,40.6104186561448,40.6105069153516,40.6105860604965,40.6109673667623,40.6110424534508,40.6111049351803,40.6111544486427,40.6111907639687,40.611213766576,40.6112234261938,40.6112341290023,40.6112388249689,40.6112375081933,40.6112301803301,40.6112168505862,40.6111975356324,40.6111722598104,40.6111410548779,40.6111039600421,40.6110610219103,40.6110380934131,40.6109327350644,40.6106668134136,40.6101733990011,40.609867130868,40.609765268159,40.6094812350474,40.6094689997097,40.6092913475462,40.6092336021972,40.6091352185802,40.609022318954,40.608908471012,40.6088984050148,40.6086996429454,40.6086629083061,40.6086319147238,40.6085497603366,40.6085002894728,40.6083917410318,40.6083039432947,40.6082143124153,40.608181172361,40.6081529236038,40.608102797299,40.6080549819727,40.6080069646996,40.6079441825366,40.6079296716997,40.6078905117743,40.6078408239624,40.6077910673952,40.607746310443,40.607693493897,40.6076415471229,40.6075854387744,40.6075747239116,40.6075904854894,40.6076150255798,40.607730378479,40.6078862737308,40.6081421177466,40.6082574343827,40.6083578921406,40.6084941448039,40.6085554435014,40.6087715775485,40.6088825569838,40.6092005379402,40.6094978111544,40.6095928146879,40.6102649953817,40.6117615217529,40.6122062818525,40.6122556122519,40.6123206275904,40.6129923178982,40.6130322309345,40.6143544820095,40.615031910829,40.6154574246042,40.615939315916,40.6163215651533,40.6168161457484,40.6172479002834,40.6179460636856,40.6183421565519,40.6188545902809,40.6191432619348,40.6195724049034,40.619954036436,40.6200945345408,40.6206772840716,40.6207902747522,40.6209362561871,40.6210458153045,40.6211240285444,40.6211511433497,40.6212164336711,40.6212705001099,40.6213123869048,40.6214421806275,40.6215433837547,40.6215786205853,40.621635798865,40.6217115382825,40.6218389838629,40.6219487408698,40.6220731685179,40.622211792356,40.6223640119917,40.6225291071353,40.6227062438796,40.6234062428804,40.6249384498507,40.6249909629019,40.6252604265177,40.625451361419,40.6259328717369,40.626137885673,40.6261805812568,40.6263623541178,40.6266012965199,40.6268346301751,40.6277558072062,40.6287379250507,40.6290802156771,40.6294164023978,40.6297464457578,40.6300703073563,40.6303354399282,40.6306065791205,40.6308836810612,40.6311667009126,40.6314555928789,40.6317503103321,40.6320508054671,40.6323570296587,40.6326689333536,40.6329864660791,40.6331428325197,40.6347927589935,40.6348069630797,40.6348277486921,40.6348771872751,40.6349105114836,40.6349733585184,40.6349958483044,40.6350305191216,40.6350388148161,40.6350669618384,40.6350583972377,40.635016864639,40.6350042185706,40.6350239861306,40.6350545992012,40.6350769829124,40.635097299845,40.6351099614397,40.6351470549,40.6351759346424,40.6351902020601,40.6351993203249,40.6352121562636,40.6352338955172,40.6352571956421,40.635287114712,40.6353009430093,40.6353337910922,40.6353771733116,40.6354157810455,40.6354429441493,40.6354665713928,40.6354912395676,40.6355114345565,40.6355209179214,40.6355240721024,40.635526886967,40.6355390911178,40.635553052173,40.6355756329752,40.6355911559285,40.6356032950041,40.6356274003454,40.6356479863639,40.6356634289239,40.6356782485853,40.6356892548175,40.6357079446463,40.6357331491755,40.6357451908225,40.6364495219479,40.6364563358594,40.6364746993382,40.6364895386255,40.6365162031439,40.6365343457506,40.6365497156124,40.6365554845436,40.6365640720228,40.6365821057106,40.6366335841286,40.6368040263822,40.6368744850037,40.6369186966176,40.6369706165594,40.6370342919478,40.6370700276279,40.6370815650844,40.6370931903118,40.6370902830047,40.6370782172894,40.6370590609251,40.6370488431369,40.6370346420343,40.6370324623429,40.6370347508389,40.6370407753954,40.6370800706339,40.6371315116642,40.6371768621376,40.6371962940214,40.6371991015366,40.6372305159649,40.6372673534972,40.6373911835637,40.6374136695932,40.6374222796309,40.6374189918364,40.6374053824372,40.6373973494715,40.6373896911795,40.6373700816126,40.6373691913774,40.6373577106001,40.637330222384,40.6373163017727,40.6373157038595,40.637327213695,40.6373358672142,40.6373371297609,40.6373230761153,40.6373105501878,40.637306411715,40.6373043983881,40.637309114699,40.6373246961031,40.6373464086746,40.6373673232498,40.6373909393516,40.6374446558369,40.6374691168847,40.6375668147327,40.6379612989748,40.6415304148924,40.6429816415239,40.6433886621715,40.6431873968553,40.6432712185117,40.6434478523187,40.6435134622308,40.6436314395018,40.6437693798774,40.6438022225883,40.6438154357988,40.6437927478422,40.6437862913064,40.6437666472322,40.6437897231349,40.6438062036945,40.64380623829,40.6438357444556,40.6438651814395,40.6439029449306,40.6439435261934,40.6439501572618,40.6439698483674,40.6439731708042,40.6440716367671,40.6440717251916,40.6440717819169,40.6440849187032,40.6441264426055,40.6441282663388,40.6441171123191,40.6440721874486,40.6440452445851,40.6440257856871,40.6440088401966,40.643998565411,40.643978449538,40.6439573805248,40.6439454314883,40.6439390742577,40.6439285557628,40.6439243330397,40.6439205805806,40.6439118582267,40.6438906302283,40.6438477591358,40.6438310008535,40.6438169584799,40.6438028066423,40.6437963389348,40.6437905884825,40.643786760445,40.643787471519,40.6437889488603,40.643787193853,40.6437813468591,40.6437719545522,40.6437537243216,40.6437345766936,40.6437170385262,40.6436986571806,40.6436871790818,40.6436805105572,40.6436688603612,40.6436602220707,40.6436506915761,40.6436383019588,40.6436067873186,40.6435983690654,40.6435904061441,40.6435839032847,40.643571933698,40.6435544364428,40.6435300836258,40.6434828375728,40.6434105557215,40.6433945376559,40.643384378729,40.643344194788,40.6433239899432,40.6433087672739,40.6432942632075,40.6432790271232,40.6432699400629,40.6432591187848,40.6432490787291,40.6432367445467,40.643227049037,40.643220775434,40.6432090970599,40.6431986211621,40.6431841795379,40.6431724532969,40.6431713609731,40.6431739257801,40.6431823768876,40.6431938410627,40.6432071779494,40.6432143793861,40.6432285446873,40.643234419242,40.6432322352567,40.6432280695808,40.6432241367873,40.6432227355306,40.6432225973624,40.6432249885555,40.6432291002011,40.6432302269615,40.6432266687312,40.6432209538596,40.6432141748535,40.6432078305245,40.6432005812317,40.6431954743146,40.6431896353723,40.6431830031202,40.6431835828786,40.6431815105378,40.6431724105362,40.6431629156356,40.6431548723674,40.6431482167645,40.643140608177,40.6431316738731,40.6431238644877,40.6431179647648,40.643112297415,40.6431057271127,40.6431009027727,40.64309957689,40.6430935913627,40.6430920703713,40.6430987932712,40.6431036931549,40.6431100428202,40.643115846655,40.6431179804335,40.6431187404691,40.6431168957695,40.643105555164,40.6430871879023,40.6430735046343,40.6430614326766,40.6430433345859,40.6430257828263,40.6430103520874,40.6429909200073,40.6429701741248,40.6429497749594,40.6429248634068,40.6427959027224,40.6427441441063,40.6427007400332,40.642662035702,40.6426274549527,40.6426038707682,40.6425767891488,40.6425520635983,40.6425370053944,40.6425262732145,40.6425088110617,40.6424941607012,40.6424764013603,40.6424636858159,40.6424324437723,40.6423748094236,40.6423071746499,40.6422977559308,40.6422888068528,40.6422742542655,40.6422733378589,40.6422396410507,40.6422606383333,40.6422801868219,40.6423006273786,40.6423231614728,40.642341777905,40.6423659091205,40.6423959902566,40.6424403469011,40.6424676502271,40.6424872695654,40.6425104815931,40.6425251676356,40.6425423180597,40.6426012577463,40.6426143331097,40.6426346350435,40.6426510471005,40.6426707061088,40.6426937865241,40.642708574857,40.6427182423721,40.6427360643452,40.6427606378837,40.6427918042576,40.6428136286044,40.6428400116956,40.6428587883335,40.6428821865101,40.6428999599205,40.6429114375127,40.6429253828431,40.642946514542,40.6429669756807,40.6429943415799,40.6430705630338,40.6430903688521,40.6431004090723,40.6431128051983,40.643124013093,40.6431408258501,40.643157436835,40.643179031171,40.6432010462535,40.6432215623469,40.6432398956551,40.6432484357096,40.6432595061197,40.6432650949313,40.6432651358033,40.6432661568074,40.6432580917661,40.643245700355,40.643232999868,40.6432171255947,40.643198114871,40.6431905547814,40.6431847428177,40.6431785091002,40.6431690416546,40.6431544813518,40.6431295831458,40.6431164463263,40.6431055893858,40.643087483095,40.6430755016919,40.643064235878,40.643035848225,40.6430191799711,40.6430089175701,40.6429918135082,40.6429753814987,40.6429616005437,40.6429492095718,40.6429407853204,40.6429375165563,40.642932228723,40.6429243988414,40.6429187728559,40.6429106598164,40.6429101531081,40.6429128342419,40.642920697268,40.642929623999,40.6429455174547,40.6429636776005,40.6429816375449,40.6429978974565,40.6430120506198,40.6430342465781,40.6430570995364,40.6430828407982,40.6431049886769,40.6431343375211,40.6431490838861,40.6431725312124,40.6431989306347,40.6432226260727,40.6432490378575,40.6432712471679,40.6432990472619,40.6433189140722,40.6433365020049,40.643366347404,40.643404058371,40.6434108567288,40.643430391653,40.6434517853815,40.6434732422288,40.6434872630331,40.6434970954078,40.6435045231663,40.6435085161339,40.6435224878559,40.643534995617,40.6435605906426,40.6435883907399,40.6436095715514,40.6436297226842,40.6436467507636,40.6436661067906,40.6437049855359,40.6437297240146,40.6437468890172,40.6437601510842,40.6437810340203,40.6438094291563,40.6438312300849,40.6438523008682,40.6438593273616,40.6438691954381,40.6438845297396,40.6439021650573,40.6439473032676,40.6440276998859,40.6440816630969,40.6441560523004,40.644195303687,40.6442093322323,40.6442673503823,40.6442964158791,40.6442979153732,40.6443009629189,40.6442978879215,40.6443038858964,40.6443504621203,40.6444114886256,40.6444319012231,40.6444578706225,40.6444848814316,40.6445147678272,40.6445358918282,40.6445483019893,40.6445579617878,40.6445709787019,40.6445836245978,40.6445914333165,40.6446008036433,40.6446104850501,40.6446156674708,40.6446250920152,40.6446294365702,40.6446313016762,40.6446308095541,40.6446368888205,40.6446408344006,40.6446509416489,40.644657069459,40.6446637301988,40.6446696244232,40.6446767807096,40.6446786586065,40.644685789148,40.6446985724089,40.6447111077265,40.644723516637,40.6447341445578,40.6447435199083,40.6447568893518,40.6447943916193,40.6448002829461,40.6447960218054,40.6447896130191,40.6447815934688,40.6447759020392,40.6447678197865,40.6447622186864,40.6447588001691,40.6447515827664,40.644746895651,40.644703943552,40.6446970804535,40.6446904782021,40.6446856615535,40.6446818723461,40.6446857822892,40.6446916616296,40.6447040142147,40.6447114330483,40.6447122819879,40.6447093142732,40.644701164253,40.6446892213639,40.6446735749073,40.644655771214,40.6446399995208,40.6446263068366,40.6446127410134,40.6445999103075,40.6445896616227,40.6445840632772,40.6445829136338,40.6445838111075,40.6445861592449,40.6445907730351,40.6445997747726,40.6446101536854,40.6446274489882,40.6446542861689,40.6446839513562,40.6447018134517,40.6447505286193,40.644771279645,40.644794027255,40.6448136988183,40.6448277947053,40.6448448553375,40.644850484762,40.6448514296784,40.6448488302889,40.6448399221844,40.644819237623,40.6448006841931,40.6447729813218,40.6447453393677,40.6447244926361,40.6446970377906,40.6446739707213,40.6446425498336,40.6446269328581,40.6446102375991,40.6445866995851,40.6445779382498,40.6445645171684,40.6445550007053,40.6445377148132,40.6445273951718,40.644515293146,40.6445120366638,40.6445066416658,40.644484695632,40.6444574516804,40.644427145744,40.6443598995839,40.6442789247765,40.6442881406737,40.6443716802273,40.6443787211669,40.6446550115468,40.6446548986564,40.6452669823029,40.6452687964781,40.6451102403665,40.645110303387,40.6451648599164,40.645166679848,40.6443807021119,40.6444005117726,40.6444866191157,40.6445155650968,40.6445373092303,40.6445598777653,40.6445827971023,40.6446055862794,40.6446383604695,40.6446717124751,40.6447037759237,40.6447046387043,40.6447101170577,40.6447158426728,40.6447216609366,40.6447274147339,40.6447329486903,40.6447594147232,40.6447871906438,40.6448030470969,40.6448187084999,40.6448339417598,40.6448592722605,40.6448844735128,40.6449089485764,40.6449321177115,40.6449534321111,40.6449642617195,40.6449670380529,40.6449700040853,40.6449730812627,40.6449761880878,40.6449792422775,40.6449821629433,40.6449848727325,40.6450091017345,40.6450418769703,40.6450498225543,40.6450469273529,40.6450434254078,40.6450307536496,40.6450147211499,40.6449884065554,40.644950223571,40.6448768145412,40.6446465070566,40.6445056965032,40.6444515895784,40.6444028698995,40.644359937401,40.6443197826043,40.6442622058529,40.6441732368951,40.644070116258,40.6439853313878,40.643908633937,40.643857669393,40.643822662186,40.643793883202,40.6437565579684,40.6437177167502,40.6436842073996,40.6436495298087,40.6435562518881,40.6434803947487,40.6433947870207,40.6433776953475,40.6433529316366,40.6433383959675,40.6433202800421,40.6433006669343,40.6432929230508,40.6432941636091,40.6432936523923,40.6432838445511,40.6432681211316,40.6432525804898,40.6432422807534,40.6432382629432,40.6432374767981,40.6432339701751,40.6432291306917,40.6432189400359,40.6431763172833,40.6431548238123,40.6431440677522,40.6431289664765,40.6431106318674,40.6430941967431,40.6430817064112,40.6430702764222,40.6430629167338,40.643047833104,40.6430414781455,40.643037679178,40.6430343913972,40.6430277626913,40.6430113449764,40.6429917154257,40.6429738378565,40.642957271455,40.6429032479566,40.6428802103018,40.6428614284672,40.6428294206618,40.6428161275168,40.6428120753297,40.6427991039017,40.6427496806378,40.6427416744242,40.642731692777,40.6426807331708,40.6426562601802,40.6426114316851,40.6425933415016,40.642565894653,40.6425501178483,40.6425444931672,40.642522720064,40.6424867605652,40.6423976283971,40.6423772750655,40.6423719883255,40.6423561269382,40.6423386469898,40.6423051684986,40.6422866060478,40.6422430115954,40.6422101425099,40.6421865294475,40.6421743503005,40.6421497754762,40.6421214830747,40.642077803546,40.64204407385,40.642032892136,40.641966310439,40.6419314992491,40.6419218716212,40.6419176834641,40.6419171942973,40.6419240021325,40.6419358758161,40.6419620400595,40.6420481139801,40.642147852464,40.6421820217516,40.6422223330262,40.6422639853626,40.6422816197156,40.6423416993605,40.6423732516511,40.6425072965153,40.6425352665259,40.6425623760907,40.6426038098765,40.6426895467992,40.6427069610777,40.6427266385058,40.6427466543811,40.642770875171,40.642812814221,40.6428852409609,40.6429124344239,40.6429389710628,40.6429683445415,40.6429782428456,40.6429875394939,40.642990643482,40.6429900606316,40.6429854412004,40.64296632353,40.6429629629641,40.6429596957041,40.6429492506491,40.6429239047328,40.6428598464723,40.6427652188389,40.6427451324483,40.6427269267319,40.6427100889701,40.642697764907,40.6426880074771,40.6426873918241,40.6425737374106,40.6425450312312,40.6425301308544,40.6425125093256,40.6424985034596,40.6424950710397,40.6424999646818,40.6425274855329,40.642564174015,40.6425723740862,40.6425714257014,40.6425479632638,40.6425211752305,40.6424934558413,40.6423992119796,40.6423293816601,40.642280223791,40.6422525224648,40.6422328193049,40.6422082954876,40.6421837704965,40.6421624969715,40.6421398177008,40.6421292278682,40.6421318200424,40.64214728759,40.6421810519,40.6423335670821,40.642477881625,40.6425170706598,40.6425454289515,40.642565132643,40.6425894759958,40.6426029897786,40.6426041042969,40.6425925534067,40.6425806963341,40.642564481668,40.6425498186196,40.6425378206797,40.6425291851136,40.642530190318,40.6425433035021,40.6425568167123,40.6425778173524,40.6425902353443,40.6426194897922,40.6426251140881,40.642630393188,40.6426225967005,40.64261134849,40.6426035871438,40.6425998441421,40.6426073134628,40.6426356568444,40.6426505918904,40.6427273808469,40.6428029444275,40.6428488354446,40.6428895573143,40.6429072823145,40.6429160002162,40.6429485965196,40.6429762996676,40.6430140479293,40.6430261923176,40.6430352691667,40.6430334255103,40.6430217024333,40.6430091158771,40.6430120909601,40.6430386879512,40.6430640495109,40.643097833222,40.6430993587953,40.6431095080841,40.6431227786031,40.6431139633044,40.6430960193717,40.6430898671525,40.6430837805121,40.6430753053168,40.6430690741854,40.6430503116933,40.6430400272481,40.6430268459798,40.6430176506082,40.6430100482224,40.6430096222208,40.6430120906921,40.6430223872931,40.6430374545449,40.6430510727993,40.6430585381604,40.6430592007196,40.643046972162,40.6430007227088,40.6429535308253,40.6429106053441,40.6428996800918,40.642884409018,40.6428591464859,40.6428270673528,40.642805195626,40.6427859294023,40.6427757899443,40.6427610934096,40.6427429929501,40.6427080181672,40.6426692024875,40.6426498683136,40.6426327004955,40.6426142310129,40.6426034416441,40.6425941006023,40.6425662211188,40.6425116203404,40.6424642603536,40.6424394238484,40.642427769281,40.642416911284,40.6424190902354,40.6424384232404,40.6424546486591,40.6424674701575,40.6424717480165,40.642472690413,40.6423915390344,40.6423437145539,40.6423300380439,40.6423272205629,40.6423366397861,40.6423490917955,40.6423618259179,40.6424796925794,40.6425116717347,40.6425303445889,40.6425521386212,40.6427898207406,40.6429713861206,40.6431102281402,40.6431725194443,40.6432140171633,40.6432555160554,40.643281372655,40.6433622116392,40.643374032498,40.6433868447717,40.6433984422937,40.6434185943495,40.6434268689776,40.6434194333286,40.6434110455599,40.6434051159779,40.6434105600479,40.6434245603014,40.6434454524162,40.6434598102466,40.6434642552639,40.6434718141627,40.6434636222808,40.6434510659088,40.643440082573,40.6434162205002,40.6433914035861,40.6433778725912,40.6433602111171,40.6433503645987,40.6433342184794,40.6433185773075,40.643310179119,40.6433061353153,40.6433065058708,40.6433112986724,40.643328183048,40.6433752146695,40.6433826984406,40.643402743967,40.6434622945127,40.6434710040452,40.6434983591025,40.643598297623,40.6436444329659,40.6436780376367,40.6436888270305,40.6436958459482,40.6437067714334,40.6437335512641,40.6437494056137,40.6437785193266,40.643798447336,40.643804319081,40.6438192513391,40.643836349888,40.6438669233176,40.6439114725585,40.6439376225731,40.6439726762406,40.6440078748774,40.6440288042438,40.644084999291,40.6440922412695,40.6441094861187,40.6441231054612,40.6441398346435,40.6441570699542,40.6441703868102,40.6441742845053,40.6441765875579,40.6442209720665,40.6443492067586,40.6445717246719,40.6446455248859,40.6446571897876,40.6446710997498,40.6446923208933,40.6447102848951,40.6447180425637,40.6447003805838,40.6446783052458,40.644649347237,40.644635592982,40.6446235783287,40.6446160546321,40.6446148405908,40.64462282197,40.6446465211023,40.6446791265644,40.6447397655818,40.6447874370219,40.644855891685,40.6448891365241,40.644927883075,40.6450303022278,40.645075076819,40.6450845852108,40.6450920717278,40.6450975255277,40.6451059553682,40.6451290244077,40.6451497114998,40.6451460479629,40.6451352779349,40.645114817059,40.6450802888808,40.6450629965293,40.6450448388349,40.6450292855353,40.6450203237775,40.6450169320322,40.6450218031221,40.6450229201838,40.645037172538,40.645061445002,40.6450826755157,40.6451037599035,40.6451122366428,40.6451233964648,40.6451297054714,40.6451369673542,40.6451362586455,40.6450800942251,40.6450548409637,40.6450251732003,40.6450218754525,40.6450051970944,40.6449775421563,40.644964876694,40.6449347715418,40.6448870034496,40.6448148480038,40.6447331555527,40.6447027590473,40.6446586068953,40.6446151855821,40.6445839229286,40.6445473744471,40.6444969230172,40.6444179520542,40.6443454253031,40.6443071439739,40.6442821815094,40.6442599702602,40.6442414647626,40.6442375343688,40.6442045228559,40.6441707816933,40.6441386260129,40.6440922773559,40.6440642525044,40.6440295002848,40.6440090081128,40.6439751799854,40.6439488754275,40.6439255364408,40.6438794590592,40.6438275209417,40.6437620409662,40.6437069921827,40.6436432620274,40.6435854050796,40.6435451503989,40.6435148906282,40.6434928141483,40.6434736810634,40.6434715355462,40.6434607557063,40.6434531638783,40.6434623007568,40.643485786969,40.6434924654482,40.6434976266598,40.6434925039341,40.6434765912429,40.643448626539,40.6434477595643,40.6434215707508,40.6434036159276,40.6433794313481,40.6433531471414,40.6433309142528,40.6433201561868,40.6433181702516,40.6432915260917,40.6432737173472,40.6432562675519,40.6432336673632,40.6432125059813,40.6432003250959,40.6431975552837,40.6432004430814,40.6432011517618,40.6431982458812,40.6431924426619,40.6431838977449,40.6431789110042,40.6431687822171,40.6431542292668,40.6431343695981,40.6431350799425,40.6431272544169,40.643101834699,40.6430661203292,40.6430521214005,40.6430420417656,40.6430205783943,40.6430005735857,40.6429855738022,40.6429681927983,40.6429545053385,40.6429484989966,40.6429588710027,40.6429763484811,40.6429863712562,40.6429870314331,40.6429745791193,40.6429396721849,40.6429124440202,40.6428907951626,40.6428582208026,40.6428404127467,40.6428322651841,40.6428217390322,40.6428120476613,40.6428177921124,40.6428386634969,40.6428534483614,40.6428624400561,40.6428599128571,40.6428526018964,40.6428498613248,40.6428613322637,40.6428417443424,40.6428514745503,40.6428578701577,40.6428718587626,40.6428774475086,40.6428652191667,40.6428581326933,40.6428689999302,40.6429089912286,40.6429463872854,40.642963844392,40.6429863785693,40.643011662163,40.6430583988166,40.6430924607523,40.6431229248505,40.6431383224019,40.643134604475,40.6431344420909,40.6431150493656,40.6430931186139,40.6430709650693,40.6430406939211,40.6430187444296,40.6430058459468,40.6430000417295,40.6429951814532,40.6429843135823,40.6429820790916,40.6429849853013,40.642974203513,40.6429461886058,40.6428738644019,40.642855765052,40.6428380151744,40.642832065403,40.6428197403486,40.6427760445867,40.6427419743965,40.6426513004364,40.6425833043637,40.6425626380803,40.64254625873,40.6425362565278,40.6425229285189,40.6425228708046,40.642526875526,40.6425247171589,40.6425167561948,40.6425061794519,40.6424708145835,40.6424387166153,40.6424011177972,40.6423804027081,40.6423547690716,40.6423305149462,40.6423115501132,40.6423072136961,40.6423034607455,40.6422955787004,40.6422832718896,40.6422558198467,40.6422227784438,40.6421969898061,40.6421827972706,40.6421673792206,40.642155588554,40.6421441563568,40.6420969430893,40.6420436434909,40.6420078614203,40.6419848228819,40.6419614931971,40.6419395441815,40.6419249916616,40.6419084852494,40.6418934377485,40.6418757845464,40.6418651500369,40.6418676190497,40.6418750845347,40.6418771923831,40.6418648855562,40.6418379501377,40.641814055451,40.6417934959885,40.6417704001779,40.6417438225675,40.6417259359772,40.6417025099936,40.6416875158048,40.6416667274334,40.6416519168383,40.6416220453766,40.641548249029,40.6415005599938,40.6414703285389,40.6414547212406,40.6414414615895,40.6414324022121,40.6414267496706,40.641414433962,40.6413908215379,40.6413631896735,40.6413471855315,40.6413336436104,40.6413185810702,40.6412960586651,40.6412729909986,40.6412489418652,40.6412222825937,40.6412117406193,40.6412105055298,40.641207273408,40.6411984279358,40.6411913231141,40.641175346939,40.6411626700665,40.6411458631036,40.641125799145,40.6411083845325,40.6410985037443,40.6410889481847,40.641076747728,40.6410660646215,40.641045856267,40.6410295933945,40.6410178555225,40.6410153909536,40.6410138886958,40.6410122518426,40.6410102683908,40.6410097388801,40.6410102305526,40.6410089714566,40.6410064358839,40.6409998164836,40.6409954174849,40.6409892151603,40.6409707311506,40.6409482619308,40.6408607617291,40.6408391949995,40.6408166529112,40.6408020433474,40.6407875439592,40.6407718151148,40.6407560191598,40.6407406604627,40.6407236736215,40.6407072986612,40.6406923329583,40.6406768196295,40.6406668071137,40.6406546758406,40.6406505302573,40.6406440213602,40.6406388556093,40.6406296340125,40.6406150533032,40.640593584776,40.6405795526974,40.6405635320457,40.6405436045151,40.6405233563166,40.6405076381456,40.6404981157248,40.6404911220025,40.6404891050663,40.6404860671957,40.64048701574,40.6404964347154,40.6405131742226,40.6405313268473,40.6405540834609,40.6405795242345,40.6405937689567,40.6406063491253,40.6406166181905,40.6406187767341,40.6406304798606,40.6406435893292,40.6406573777334,40.6406736206685,40.64069007394,40.6407488069106,40.6408009494608,40.6408563287045,40.6409141757735,40.6409416133895,40.6409554653829,40.6409641357637,40.6409687479794,40.6409713335159,40.6409749010445,40.6409772726659,40.6409819677405,40.6409851024652,40.6409922571178,40.6409980343629,40.6409963876537,40.6409946485325,40.640996343229,40.6410016015389,40.6410115320928,40.6410273605135,40.6410467738406,40.6410699534933,40.6410903029752,40.6411295854287,40.6411483079225,40.6411601533335,40.6411698638524,40.6411730220177,40.6411740096029,40.6411776728182,40.6411798121532,40.6411914436446,40.641213037584,40.6412536020253,40.6413438455043,40.6413591269008,40.6413736888144,40.6413969836962,40.6414139368806,40.6414227360215,40.6414797233171,40.6414994608959,40.6417625059358,40.6420850152681,40.6420850844395,40.6423991756879,40.6424035613688,40.64259381913,40.6425718044547,40.6421116827677,40.642067575869,40.641739626514,40.6417753082559,40.6420861605755,40.6418728598744,40.6421300167986,40.6419912410417,40.6419413503617,40.6419242742485,40.6418683735309,40.6418253315,40.6418376668154,40.6417277744985,40.6418447936081,40.6415816382253,40.6414788086972,40.6414226378837,40.6414348716778,40.6424241007305,40.6424065870012,40.641436675005,40.6413708433614,40.6413005131007,40.641257551347,40.6412245114495,40.6412143713757,40.6422805467086,40.6422090003919,40.6406423057794,40.6404337150713,40.6403914670249,40.6414186620985,40.6413967852287,40.640315745545,40.640106202243,40.6399941102304,40.6410658600068,40.6410527973438,40.6399466587996,40.6399297980373,40.6399146063186,40.6398915093209,40.6398740695887,40.6398623909551,40.6398565429523,40.6398565603983,40.6409574196882,40.6409374836165,40.6410281938828,40.6410381879223,40.641024660811,40.6409673624416,40.6409301754576,40.6409300540765,40.6407883220102,40.6407278353615,40.6406107847668,40.6387656527723,40.6386993146056,40.6386462787777,40.6394283371709,40.6393937344571,40.6386649933133,40.6385950111136,40.6386940623783,40.6393861413186,40.6393510144755,40.6386812397149,40.6385677683126,40.638541189153,40.6386329588888,40.6386236902574,40.638518400439,40.6384654123225,40.6384437264535,40.6399401367778,40.6399278236928,40.6386095752982,40.6384103169249,40.6383390613377,40.6385649889145,40.638608229932,40.6386421936614,40.6386698473517,40.6387223527499,40.6387336734765,40.6387410667237,40.6387443460614,40.6387434287966,40.6387383380594,40.6387292022195,40.6386493329043,40.6385784446768,40.6385242809746,40.6384533450618,40.6384403419276,40.6384142398279,40.6383451618001,40.6382144459171,40.6379925832119,40.6379564476538,40.6379329792115,40.6379281629851,40.637906931816,40.6378104052429,40.6377961197571,40.6378482014787,40.6378568716723,40.6378899812267,40.6379254560316,40.6379514764553,40.6379767056289,40.6379964134552,40.6380113955704,40.6380393103198,40.638268617569,40.6385789424447,40.6385838663752,40.6388225779098,40.6388152771313,40.638264017819,40.6382490079555,40.6381284790978,40.6381099656179,40.6379675114477,40.6379650512311,40.6388739149662,40.6388790351653,40.6379571597461,40.6379508052289,40.637947135641,40.6379058477389,40.6379507422603,40.6379395908862,40.6375307471645,40.6375179389042,40.6377874824072,40.6377856224882,40.6377307758654,40.6377238554188,40.639196327304,40.6391939681142,40.6377215455509,40.637444368545,40.6373433440691,40.6372964725675,40.6372298072591,40.637193798384,40.6371723108883,40.6371742441237,40.6371816360722,40.6371980828396,40.6372126801074,40.6372489638204,40.6372725894138,40.6372727190793,40.6372670047836,40.6372062971501,40.6371811663062,40.637155977959,40.6371397914595,40.6371398450259,40.6371349412126,40.6371327548526,40.6371924355622,40.6372664549911,40.6373332249639,40.6373819500577,40.6373844954816,40.6375263662621,40.6375696904026,40.6376418417247,40.6376633412542,40.6376925817169,40.6382742882636,40.6382907479557,40.6377050659607,40.6376672153155,40.6377307885362,40.6384870561229,40.6393965130575,40.639409342886,40.6385006795714,40.6385593306673,40.6384301759942,40.6384273519036,40.6383760570155,40.6383381725205,40.6382810164322,40.6382672855424,40.6381500752493,40.6378927803615,40.6375176742606,40.6374097721629,40.6374053994855,40.6374023021017,40.6374005488454,40.6374001786795,40.6374011998303,40.6374039938886,40.6374078801025,40.6374127876505,40.637418627098,40.6375259581404,40.6378851565791,40.638291640547,40.6383901203452,40.6384334660242,40.6385038808949,40.6385056277117,40.6385472062064,40.6385706863679,40.6386176702902,40.638668331372,40.6387052079733,40.6374378380299,40.6374452135167,40.6375470735979,40.6388762511278,40.6390370378426,40.6389095973122,40.6390945497008,40.6392292576899,40.6393784976548,40.6393538147065,40.6393042677268,40.6392012862071,40.6390960255786,40.639039226441,40.6390248266221,40.6389978325726,40.6389654249315,40.6389203486149,40.6389005233065,40.6388807555389,40.6388846096834,40.6388879625141,40.6388942116626,40.6389032095019,40.6389147434714,40.6389285410979,40.6389442764325,40.6389615777507,40.6390883550559,40.639207478924,40.6392294228088,40.6392331079203,40.6392331552917,40.6392313876485,40.6392267852572,40.6393255525301,40.639466337997,40.6394774581182,40.6397098451811,40.6397142566173,40.6396921463389,40.6396803731276,40.6396675867939,40.639638037398,40.6396323163824,40.639596997838,40.6395693045234,40.6395620093365,40.6395442990832,40.6395341375019,40.6395375256188,40.639569888812,40.63964121083,40.6396702072512,40.6397482552975,40.6397922669654,40.6400550105671,40.6401982512814,40.6402524566139,40.6403058070937,40.6403432477704,40.640328052065,40.6402967597074,40.640366768817,40.6400921942955,40.640145275161,40.6403886750811,40.640506668844,40.6405893969112,40.6406670241126,40.6407337391006,40.6408058377519,40.6407357267243,40.6407459676756,40.6408548920193,40.6408904498686,40.6410011523712,40.641013434811,40.6410311294717,40.6410538419185,40.6410810658639,40.641112194453,40.6411465337908,40.641295463489,40.6414667524616,40.6416213100762,40.6416455231074,40.6417853605864,40.6417606224099,40.6418867974052,40.6417537949093,40.6417169014811,40.6415957899369,40.6415471165511,40.641503906674,40.6414570735868,40.6414445326633,40.6414169366647,40.6414177509614,40.6414196303356,40.6414486089805,40.6414866112512,40.6415318562914,40.6415892267298,40.6416234210823,40.6417043889845,40.6416412802003,40.6416054374318,40.6415968307639,40.6413101040751,40.6410265606049,40.6409352910516,40.640778472307,40.6410337646028,40.6410165498942,40.64076062251,40.6407238260831,40.64079470601,40.6413853125529,40.6413548351959,40.6407298728556,40.6406868184588,40.6406289834787,40.640337411211,40.6404843723524,40.6404139294879,40.64049800621,40.6411893132411,40.6411948275862,40.6404019226678,40.6402269775039,40.6402499994381,40.6401396742933,40.6401534508588,40.6401553047165,40.6399747221563,40.6398297989621,40.6398014863811,40.6397668913595,40.6393110568502,40.6393190784869,40.6395154888531,40.6395770862248,40.6396270409007,40.6396813733377,40.6397200061715,40.639766461292,40.6398631837617,40.6399798113142,40.6400428490554,40.6401610291754,40.640241737639,40.6403717528808,40.6403779941991,40.640378051517,40.6403763017596,40.6403547169371,40.6403385277878,40.6403277302276,40.6403006985991,40.64025447319,40.641264314303,40.6412527841996,40.641332380487,40.6414184920823,40.6413417181929,40.6412643880283,40.6402312426288,40.6402108982962,40.6401798478784,40.6401559331866,40.6401473284436,40.640154839546,40.6401820251397,40.6401932985561,40.6402402499313,40.6402393510754,40.64022237752,40.6402054077809,40.6401827104909,40.6401685958874,40.6401470876681,40.6401347166401,40.6401518322845,40.6401860422086,40.6402287827855,40.6402715561482,40.6403029378346,40.6403428713939,40.6403770609393,40.6404055351323,40.6404510394839,40.6404908433828,40.6405221611902,40.6405889571093,40.6406731897375,40.6408205083463,40.6407705498022,40.6406267656311,40.6405970739028,40.6406223400942,40.6408434740032,40.6409005198084,40.6409563680764,40.6410192666171,40.6410728727707,40.6411381838706,40.6411882834404,40.641230243367,40.6412915944699,40.6412938760177,40.6412947385713,40.6413315052665,40.6413392290625,40.6413418214672,40.6413476240489,40.6413530266726,40.6414469830814,40.6414419081215,40.6414012022506,40.6414058947742,40.6414652959815,40.6415559498269,40.6415464403581,40.6415064080169,40.6415010667695,40.6415546394995,40.6415700744487,40.6415783157209,40.6415806922796,40.6415489054513,40.6415518612082,40.6414121590756,40.6414234244543,40.6415566215642,40.6415595822251,40.641592547117,40.6415949187867,40.6415878575232,40.6416216322501,40.6416116283248,40.6415743145599,40.6414286644439,40.6415027375848,40.6414853320526,40.6416065692289,40.6416007031301,40.6414764747408,40.6414525313251,40.6415866397587,40.6415848795477,40.6416750095629,40.6416691450699,40.6414324959871,40.6413968399876,40.641613282299,40.6416074200861,40.6413834453796,40.6410457821909,40.641044095621,40.6410563284083,40.6410627826018,40.6411389959884,40.6411976043839,40.6413148145623,40.6413803093542,40.6414426286761,40.6422094534291,40.6422356139048,40.6414699143219,40.641478874172,40.6414346483965,40.6414235246873,40.6414391986628,40.6414734665234,40.6423551017098,40.6423793785328,40.6414646150127,40.641530365029,40.6415632511789,40.6417976435533,40.6418088466244,40.6423873659741,40.6423836187422,40.6425045159932,40.6425418640604,40.642039609106,40.6419968711478,40.6415760495202,40.6415298005429,40.6415936842618,40.641750235376,40.6418054975333,40.6418258769522,40.6417834006461,40.6416841588456,40.6416612596708,40.6415431332859,40.6415832520433,40.6416678570459,40.6418440930802,40.6418757224445,40.6420317560966,40.6420594856166,40.6423670759278,40.6426497857494,40.6430273599626,40.6430497686523,40.6428433002025,40.6426535847745,40.642454581783,40.642281619762,40.642106766334,40.6421254323637,40.642109982964,40.6422026651023,40.6422708667767,40.6422801988119,40.6431618267024,40.6431898248929,40.6423472516388,40.6423547232526,40.6422449017898,40.6422164541504,40.6422622932307,40.6423518192141,40.6423746828319,40.6424705401582,40.6427849926779,40.6429769680848,40.642957615929,40.6432791478459,40.6436095158079,40.6440425021198,40.6441365916753,40.6445324446376,40.644473511458,40.6440760116673,40.6440445917104,40.6436875559236,40.643821251324,40.6437234970838,40.6443188004321,40.6446106749794,40.6447060272429,40.6450964231813,40.6450469023231,40.644706160345,40.6446593622287,40.6446881827913,40.6447781642249,40.6450816031901,40.6454637281848,40.6454958325368,40.645579128804,40.6455747233487,40.6455627732037,40.6455619842893,40.6455601959409,40.6455636573995,40.6456304698132,40.6456699410801,40.6457211659054,40.6457404322002,40.6456661648156,40.6456380521481,40.6456227028443,40.6456142221316,40.6456125847819,40.6456092311764,40.6456160997193,40.6456366349969,40.6456548132509,40.64563814892,40.6455426001801,40.6454067329867,40.6453965489262,40.6451323333171,40.6450640504505,40.6450557108514,40.6450470343108,40.6453703619538,40.6453727474427,40.6455557177348,40.645838658794,40.6459619978246,40.6459727807525,40.6460763148169,40.6467007241005,40.6468189430567,40.6471761321044,40.6473103595313,40.6478434705765,40.6479079053277,40.6479206500783,40.6479016564861,40.6480800937592,40.6482352936148,40.6486996093866,40.6488805533705,40.6489255522761,40.6488911473395,40.6488866575686,40.648874784994,40.6488570800996,40.648833767373,40.6488051424053,40.6485816686879,40.6483158188509,40.6482801622901]}]],[[{"lng":[-74.0734662706626,-74.0734523502963,-74.0734369851189,-74.0734222848111,-74.0734082682496,-74.0733949525516,-74.0733823557139,-74.0733775184459,-74.0733722356987,-74.0733665968554,-74.0733606957033,-74.0733546264794,-74.0733484930982,-74.0733423935521,-74.0733364324389,-74.0733307031616,-74.073325305938,-74.0733203249656,-74.0733158453224,-74.0733119419944,-74.0733086761243,-74.0733061040376,-74.0733042682129,-74.0733031990545,-74.0733029115864,-74.0733034140223,-74.0733046950211,-74.0733142034632,-74.073324634467,-74.0733359623629,-74.0733481590608,-74.0733470322516,-74.0733451501212,-74.0733425210566,-74.0733409073627,-74.0733400790659,-74.0733400485342,-74.0733408134176,-74.0733415224828,-74.0733423669688,-74.0733446947515,-74.0733477713394,-74.0733515726235,-74.0733560566965,-74.073361184721,-74.0733669037966,-74.0733731618949,-74.0733798955621,-74.0733870446286,-74.0733945333225,-74.0734104815021,-74.0734262482716,-74.0734417751959,-74.0734596099015,-74.0734780584636,-74.0734971063964,-74.0735026389055,-74.0735085233476,-74.073514668353,-74.0735209774891,-74.0735273490354,-74.073533681265,-74.0735398770525,-74.0735458368445,-74.0735514665748,-74.0735566780931,-74.0735613874205,-74.0735655197939,-74.0735690118701,-74.0735718093084,-74.0735738634746,-74.0735751468233,-74.073575635101,-74.0735753216351,-74.0735661085427,-74.0735561953353,-74.0735455997879,-74.0735343346205,-74.0735224180509,-74.0735199987435,-74.0735098654372,-74.0734966967546,-74.0735313517051,-74.0735665323044,-74.0736022264572,-74.073638417456,-74.0736996934535,-74.0737605387432,-74.0738209460722,-74.0738809055483,-74.0739404127751,-74.0740603378054,-74.074180948205,-74.074302578217,-74.074307908412,-74.0743840161996,-74.0744602881984,-74.0745453991284,-74.0746233475877,-74.0747011004747,-74.0748107071409,-74.0750828819262,-74.0749941307351,-74.0749290910491,-74.0748231878456,-74.074806762263,-74.0747899710037,-74.0747728430821,-74.074755407955,-74.0747376988076,-74.074719744434,-74.07470157736,-74.0746880048984,-74.0746746044748,-74.0746614231191,-74.0746485023713,-74.0746358877264,-74.0746236180943,-74.0746117394125,-74.0746002866382,-74.0745893011009,-74.0745788171029,-74.074568870263,-74.0745594944454,-74.0745466603601,-74.0745331784853,-74.0745190617999,-74.0745043274631,-74.0744889950446,-74.0744730799461,-74.0744566006379,-74.0744395771321,-74.0744249992943,-74.0744099388453,-74.0743944234849,-74.074378483772,-74.0743621513603,-74.0743454541681,-74.074328426925,-74.0743111021615,-74.074293511087,-74.0742756895246,-74.0742606641872,-74.0742458121771,-74.0742311792045,-74.0742168090073,-74.0742027426836,-74.0741890255155,-74.0741756966256,-74.0741627964666,-74.0741503641673,-74.0741380861275,-74.0741262857486,-74.0741149845796,-74.074104201318,-74.0740939627893,-74.0740842861516,-74.0740751923035,-74.0740666986233,-74.0740588238083,-74.0740458259264,-74.0740322084777,-74.0740180004918,-74.0740032270365,-74.0739879151553,-74.0739720916744,-74.0739557886918,-74.0739390341281,-74.0739218589794,-74.0739026886751,-74.0738831452908,-74.0738632635544,-74.0738430757786,-74.0738226158066,-74.0738019152861,-74.0737810104794,-74.0737599334711,-74.0737466204695,-74.0737336999341,-74.0737212142909,-74.0737092004745,-74.0736976967386,-74.0736867373858,-74.0736763584742,-74.0736665918949,-74.0736574646975,-74.0736490098757,-74.0736384204895,-74.0736272287757,-74.0736154514549,-74.0736031070023,-74.0735902138934,-74.0735767963148,-74.0735628720814,-74.0735484634016,-74.0735335942424,-74.073518289883,-74.0735059130219,-74.0734930909315,-74.0734798634039,-74.0734662706626],"lat":[40.5783856858974,40.5783814640073,40.578395684188,40.578410308023,40.5784253179098,40.5784406945719,40.5784564194022,40.5784592962935,40.5784616760739,40.5784635198195,40.5784647971474,40.5784654872237,40.57846557792,40.5784650668282,40.5784639639335,40.5784622889446,40.5784600652518,40.5784573335111,40.5784541358856,40.57845052845,40.5784465664501,40.5784423202124,40.578437856219,40.5784332500064,40.578428577456,40.578423915291,40.5784193405822,40.578404592083,40.5783902103865,40.5783762298524,40.5783626819938,40.5783527986379,40.5783429827761,40.5783332684114,40.5783271980035,40.5783210364608,40.578314841908,40.578308675495,40.578305902261,40.5783025958615,40.5782966623219,40.5782909308475,40.5782854564032,40.5782802927927,40.5782754882892,40.5782710901697,40.5782671396797,40.5782636775693,40.5782607343672,40.5782583382666,40.5782564122092,40.5782537583498,40.5782503866098,40.5782328968505,40.5782157799516,40.5781990503296,40.5781966400607,40.5781947775555,40.5781934928601,40.5781928076477,40.5781927305272,40.5781932639091,40.5781943989766,40.5781961166951,40.5781983930005,40.5782011887475,40.5782044619399,40.5782081593513,40.5782122227221,40.5782165884258,40.5782211874715,40.5782259466665,40.5782307898004,40.5782356433319,40.5782497619203,40.5782636031922,40.5782771473676,40.5782903729943,40.5783032631401,40.5783056789565,40.5783157978588,40.5783279597145,40.578347845577,40.5783671866214,40.5783859733058,40.5784041981017,40.5784349802237,40.5784662566341,40.5784980246578,40.5785302792759,40.5785630183141,40.5786273973871,40.5786910292131,40.5787577113008,40.5787612541185,40.5788024817991,40.5788393604236,40.5788848119472,40.5789282005783,40.5789634262395,40.579021201694,40.5791601587556,40.5792365574164,40.5791712603218,40.5790989329643,40.5790920256963,40.5790856510729,40.5790798191267,40.5790745429057,40.579069828922,40.5790656872083,40.5790621241097,40.5790601391649,40.5790575600471,40.5790543951021,40.5790506551924,40.5790463513456,40.5790415004568,40.579036116234,40.5790302179202,40.5790238247548,40.5790169596671,40.579009644078,40.5790019020898,40.5789872065188,40.5789728544671,40.5789588596634,40.5789452406922,40.5789320102727,40.5789191874933,40.5789067845712,40.5788948172411,40.5788861520065,40.5788779823,40.5788703216732,40.5788631861891,40.5788565883917,40.5788505408275,40.578845056206,40.5788401453957,40.5788358167525,40.5788320782947,40.5788299679215,40.578827234392,40.578823884713,40.5788199305833,40.5788153810232,40.578810253259,40.5788045581549,40.5787983171289,40.5787915465737,40.5787836000277,40.5787752437301,40.5787664924097,40.5787573651528,40.5787478797006,40.5787380539676,40.5787279107247,40.578717468389,40.5787067462144,40.5786955711584,40.5786848295639,40.5786745452014,40.57866473598,40.578655417965,40.5786466095672,40.5786383280212,40.5786305880514,40.5786234038777,40.5786161310216,40.5786094549748,40.5786033869394,40.5785979399617,40.5785931200509,40.5785889348929,40.5785853926732,40.5785824988995,40.5785773884135,40.5785717204708,40.5785655131376,40.5785587856562,40.5785515582732,40.5785438545884,40.5785356965254,40.5785271127113,40.5785181249078,40.5785087655945,40.5784970268867,40.5784856150789,40.5784745500963,40.5784638488474,40.5784535284082,40.5784436046784,40.5784340935615,40.5784250102885,40.5784163709267,40.5784081858464,40.5784017517526,40.5783958443202,40.5783904844646,40.5783856858974]}],[{"lng":[-74.0643600372125,-74.0644088166617,-74.0645875231509,-74.0645418613377,-74.0643600372125],"lat":[40.5882678911748,40.5882389243158,40.5884031574157,40.5884339923943,40.5882678911748]}],[{"lng":[-74.0549886783945,-74.0549991647687,-74.0550337313576,-74.0550519409882,-74.0550195433676,-74.0550559101294,-74.0551040353216,-74.0551725101646,-74.0552871969713,-74.0551600112236,-74.0549886783945],"lat":[40.6066606969118,40.6066457447841,40.6066598261434,40.6066338609728,40.6066206629666,40.6065688056947,40.6065884106716,40.6064907673493,40.6065388900787,40.6067304918535,40.6066606969118]}],[{"lng":[-74.1961412310206,-74.1929756774533,-74.1926776422956,-74.1920996012195,-74.19151630641,-74.1909278523288,-74.1903343342685,-74.1897358483375,-74.1891324916308,-74.1885243616571,-74.1879115568774,-74.1872941765054,-74.1866723204915,-74.1859191691804,-74.1851706590226,-74.184426877268,-74.1836879109284,-74.1819023571359,-74.180334248424,-74.1799370611388,-74.1795447069973,-74.1792462347089,-74.1791837742976,-74.1788839057371,-74.1782817743403,-74.1780882019124,-74.177815021471,-74.1777529863655,-74.1761005285905,-74.1751962573228,-74.1749032855397,-74.174597062586,-74.1742788798559,-74.1739501677995,-74.1736124409434,-74.1732673084324,-74.1727075220247,-74.1723626102388,-74.1720711300466,-74.1718117809592,-74.1709554651375,-74.1698574068933,-74.1695365651142,-74.1692362454647,-74.1688889431174,-74.1687847205829,-74.1684731134242,-74.1680808633964,-74.167697103615,-74.1674266668983,-74.1660319330625,-74.1657068252146,-74.1648419038537,-74.1639409497624,-74.1633739183966,-74.1623477632941,-74.1616180742892,-74.1605006921234,-74.1598317893642,-74.1591052153822,-74.158617417266,-74.1579267386242,-74.1573738365634,-74.1565118788053,-74.1547926527579,-74.1547408023168,-74.153868323359,-74.1537911672324,-74.1537183428746,-74.1531727534184,-74.1512034824914,-74.1503190076634,-74.150186665171,-74.1496842382463,-74.149099517847,-74.1488696133884,-74.1483961498217,-74.1482388665267,-74.1478892677469,-74.1475909532907,-74.14724381883,-74.146281774311,-74.1454990358979,-74.1445610109588,-74.1439455821311,-74.14355036507,-74.142879167357,-74.1418444922298,-74.1408864119256,-74.1398426516882,-74.1390029483852,-74.1380692982536,-74.1371367889934,-74.1364079738768,-74.1361628751426,-74.1349425823379,-74.1340090913369,-74.1330793880416,-74.1321045972236,-74.1315687340858,-74.1309400232729,-74.1298332375903,-74.1287489750645,-74.1278426714669,-74.1274296081366,-74.1267436156091,-74.1265091152447,-74.1263049784264,-74.1252004038081,-74.1251456324918,-74.1245261878744,-74.1239812611203,-74.1235063919732,-74.1232652198775,-74.1225232481015,-74.1224721469679,-74.1213517962625,-74.1209847227257,-74.1199551026624,-74.1183752738762,-74.1174278136688,-74.1169152638732,-74.1167887413211,-74.1165733876026,-74.1163561722905,-74.1161373683003,-74.1159172505448,-74.1156960955886,-74.1154741813677,-74.1152517866413,-74.1150291908367,-74.1148066736336,-74.1145845146131,-74.1142548823079,-74.1139254467172,-74.1135976182838,-74.1132727787911,-74.1129522981178,-74.1126374738107,-74.1111363814495,-74.1108265435469,-74.1104795650208,-74.1100093411824,-74.1094569652844,-74.1089014622398,-74.1088526825127,-74.1083441793557,-74.1077864524133,-74.1072296390472,-74.1066750969231,-74.1054938902475,-74.1042949546501,-74.1033759701738,-74.1029018244486,-74.1023959698123,-74.1018122545728,-74.1016547806967,-74.1013859682836,-74.1008280694218,-74.1000361659006,-74.0994698982082,-74.0993845303205,-74.0977696876388,-74.0973045568559,-74.0972175072902,-74.0959270457183,-74.0955582976852,-74.0951902707625,-74.0948248911882,-74.0944640494356,-74.0941095910939,-74.0930568561993,-74.0908154106232,-74.090454959314,-74.0894937013172,-74.0887463865131,-74.08796268696,-74.087164216049,-74.0867299710324,-74.0854275631428,-74.0849000251211,-74.0840678169856,-74.0835513160172,-74.0834193337422,-74.0828094986345,-74.081554701236,-74.0801476556437,-74.0777808956554,-74.0771469658721,-74.0765673473533,-74.0758492212917,-74.0755171401,-74.0754323971439,-74.0747894220168,-74.073999653081,-74.0735832666406,-74.0733520736676,-74.0715149332337,-74.0700036821387,-74.0691403098743,-74.0689811828008,-74.0666288063531,-74.0655066319099,-74.0650851416127,-74.0640008137063,-74.0635056566019,-74.0626077283667,-74.0621249908936,-74.0620926651399,-74.062067039671,-74.0619561793393,-74.0610841405996,-74.0612897002948,-74.0619200267061,-74.0620634236495,-74.0628407291809,-74.0637593335814,-74.0636262262527,-74.0635794712449,-74.0632995364789,-74.0628960002703,-74.0624820031818,-74.0620555868396,-74.0617388295381,-74.0605601754054,-74.0615077639733,-74.0618181575796,-74.0626009358209,-74.0626881084882,-74.0626882494532,-74.0626884036215,-74.0627935288087,-74.0627936469587,-74.0627937886333,-74.0629138457672,-74.0629139874503,-74.0629141293707,-74.0630447619832,-74.063044997929,-74.0630452578556,-74.0631008501731,-74.0631641537116,-74.0633605055731,-74.0641789596957,-74.0644478548609,-74.0653380118304,-74.0657763656931,-74.0665617301802,-74.0666255950235,-74.0666737077574,-74.0687483925866,-74.0690253902049,-74.0692873830133,-74.0695335598975,-74.0697632175143,-74.0699757532453,-74.0702116931775,-74.0711977234038,-74.0713115058186,-74.0714436987433,-74.0715929326755,-74.0717574744879,-74.0719351994526,-74.0721560935358,-74.0723667002151,-74.0725659217358,-74.0727527782497,-74.0729264086931,-74.0735337984666,-74.0736450889696,-74.0741241000606,-74.0746968511872,-74.0747511641769,-74.0752516172839,-74.0767304009693,-74.077726921944,-74.0778023740842,-74.0778714792686,-74.0791509238097,-74.0795429885944,-74.079947275494,-74.0803630521683,-74.0807895390109,-74.0817159143092,-74.0824393056807,-74.0829075260775,-74.0833421756386,-74.0837683881891,-74.0842588883333,-74.0848880868417,-74.0854585227023,-74.0858020348512,-74.087697375959,-74.0877817102823,-74.0879193916578,-74.0881335529947,-74.0883388800727,-74.0885344761313,-74.0887195034333,-74.088766266508,-74.0888140769824,-74.0891785702706,-74.0894176459207,-74.0894603771765,-74.0894625259192,-74.089706213169,-74.0902776030581,-74.0910709118548,-74.0920445158073,-74.0927507430531,-74.0927705822398,-74.0938729485011,-74.094605968253,-74.0953463096093,-74.0960885193106,-74.0968216684653,-74.0975663500422,-74.0983201493462,-74.0990495449778,-74.0997875664952,-74.100540513185,-74.1012715078008,-74.1020293093996,-74.1027719714833,-74.1035224424516,-74.1042693696863,-74.1047097914178,-74.1052429037728,-74.1048925340597,-74.1030623502508,-74.1039162653103,-74.1039260189981,-74.1040819676967,-74.1042374150949,-74.1043918930113,-74.1045449361854,-74.1046960836793,-74.1048448802657,-74.1049908778003,-74.1051336365711,-74.1052727266234,-74.1054077290547,-74.105531591107,-74.105650641249,-74.1057645053775,-74.1058728256901,-74.1059752618094,-74.1060714918527,-74.1061612134433,-74.1062441446606,-74.1066215258488,-74.1066043939317,-74.1054729455723,-74.1046693161401,-74.1038698555966,-74.1030703666264,-74.1020893826292,-74.1015496156722,-74.1007865099782,-74.1000228097541,-74.0989520165496,-74.0976300813006,-74.0979713491121,-74.0982572108537,-74.0985353612661,-74.0988205963189,-74.0988854901243,-74.0990498808949,-74.0993511497426,-74.099643467734,-74.0999637517971,-74.1002705391573,-74.1007127169145,-74.1008081517748,-74.1012385736843,-74.1015227350791,-74.1017373268587,-74.1019917041854,-74.1022430416423,-74.1024912301959,-74.102736162177,-74.1029777313271,-74.1032158330786,-74.1034503639065,-74.1036812220584,-74.1039083073734,-74.1041315213253,-74.104846271245,-74.1055764550874,-74.1061723704817,-74.106906924319,-74.1071040086103,-74.1078679586248,-74.1086159408723,-74.1093621450181,-74.1101394717195,-74.1121123978743,-74.1135152232929,-74.1142986670062,-74.1147179679246,-74.1150993995063,-74.1161742246439,-74.1163000392628,-74.1163633640869,-74.116410527291,-74.1172129034508,-74.1180405535346,-74.1187603887196,-74.1194800974205,-74.1202400898627,-74.1216663634852,-74.1230928113978,-74.1232920615201,-74.1235966318533,-74.1239506369465,-74.124899043723,-74.1241856038726,-74.1235840138025,-74.1234515303664,-74.1234164888568,-74.1232219633198,-74.123170037416,-74.1231160913419,-74.1227896727344,-74.1225964492859,-74.1221685656974,-74.1216256400038,-74.1214453570591,-74.1213873134497,-74.1213881541003,-74.1213575435243,-74.1213575197575,-74.1213575078366,-74.1213425480553,-74.121343520693,-74.1213435208248,-74.1213604469873,-74.1213929926679,-74.1216043917063,-74.1217007550939,-74.1218307982974,-74.1218533359744,-74.1217262391975,-74.1220960212705,-74.1226437541449,-74.1227605800866,-74.1227606984399,-74.1227608403022,-74.122891205807,-74.1228912772967,-74.1228913599735,-74.1230330420598,-74.123033196429,-74.1230333613109,-74.1231835234829,-74.1231836648387,-74.1231838072792,-74.1233393647001,-74.1233395532961,-74.1233397304328,-74.1234975648371,-74.1240583616202,-74.1251589568915,-74.1253527570123,-74.125672678039,-74.1266568893801,-74.12706747024,-74.127467498419,-74.1274928245819,-74.1275266186025,-74.1275683879978,-74.1276175241908,-74.1276733110061,-74.1277349354834,-74.1278471150735,-74.1281479757139,-74.1291446441952,-74.1292832020009,-74.1309404878287,-74.1319538353831,-74.1325162036901,-74.1326491995887,-74.1327843625368,-74.1329214536417,-74.133060229789,-74.1332400720371,-74.133421074384,-74.1336031137798,-74.133786066999,-74.1342774930893,-74.1346185566227,-74.1357919339248,-74.1363534324276,-74.137042581878,-74.1381387369323,-74.1384659707023,-74.1402400878657,-74.1411063134086,-74.1418476464932,-74.1441858820751,-74.1458047420613,-74.1469905773909,-74.1472356836284,-74.1480214873466,-74.1501459479379,-74.1516371359177,-74.1526287023336,-74.1625647565192,-74.1643866512156,-74.1644273761467,-74.1647661213767,-74.1648521499664,-74.1649961655394,-74.1655501357253,-74.1659198171382,-74.166889720225,-74.1698258238223,-74.1701472932972,-74.1704674823617,-74.1707862269769,-74.1711033637115,-74.1712509821698,-74.1715081866497,-74.171777239006,-74.1718516652276,-74.1719192139948,-74.1722550766378,-74.1734645182208,-74.1742166231723,-74.1747920243117,-74.1748948087025,-74.1750004144386,-74.1751085148576,-74.1752187756933,-74.1753308557817,-74.1754444084295,-74.1756414494582,-74.175836736932,-74.1760299334002,-74.1762207053066,-74.1764087227188,-74.1765936607424,-74.1775803674472,-74.1783981394257,-74.1790769996092,-74.1793691998134,-74.1831259388962,-74.1834662119469,-74.1838252136254,-74.1847420761179,-74.1857085213456,-74.185919772638,-74.1860271449661,-74.186099217619,-74.186277027529,-74.1864617449917,-74.18665327775,-74.186851530137,-74.1870564031241,-74.1872677943703,-74.1874855982733,-74.1877097060639,-74.1879400057353,-74.1881763822238,-74.1884187174249,-74.188666890252,-74.1889207766972,-74.1891802498931,-74.1892227173139,-74.1891250824619,-74.1890353667766,-74.1890096735266,-74.1890398957837,-74.1890943144194,-74.1891966091692,-74.1892512669193,-74.1891953797036,-74.1901329419416,-74.1902518234609,-74.190108808563,-74.1900695778584,-74.1899751756534,-74.1899205888627,-74.1898963711543,-74.1899221412573,-74.189980916187,-74.1900602667698,-74.1903770210933,-74.1904620703501,-74.1906405300715,-74.1917684424512,-74.1936329911255,-74.1974980000875,-74.1988762263611,-74.2005840002506,-74.2029499998021,-74.2044119994804,-74.2053989146549,-74.2060284124252,-74.205961542947,-74.2059864121584,-74.2060030986441,-74.2060127029352,-74.2060116443702,-74.2059982457698,-74.2059890732033,-74.2059860292211,-74.2059876812101,-74.205994144246,-74.2059925508149,-74.2059834198857,-74.2059466029055,-74.2059215985032,-74.2059186149627,-74.205917533295,-74.2058970544075,-74.2058907981489,-74.205820692153,-74.2057755076904,-74.205764942217,-74.2057598276791,-74.2057573425926,-74.2057549623512,-74.2057533294656,-74.2057627005456,-74.2057719724298,-74.2057744110879,-74.2057678712305,-74.2057469274952,-74.2057426294888,-74.2057437992123,-74.2057420614764,-74.205738088377,-74.2057240328971,-74.2056970265166,-74.2056590104846,-74.2056175719187,-74.2055746990717,-74.2054430299924,-74.2054173705709,-74.2054115908095,-74.2054067987036,-74.2053929112427,-74.2053770659722,-74.2053569952066,-74.2053222937089,-74.2052879682221,-74.2052722088488,-74.2052695881313,-74.2052693620202,-74.2052720215424,-74.2052670037838,-74.2052492056191,-74.2052128771437,-74.2051654526205,-74.2051375063797,-74.205125214952,-74.2051223107756,-74.2051115804904,-74.2050813698724,-74.205069473241,-74.2050682243607,-74.2050785313772,-74.2050897605968,-74.205108004006,-74.2051220944173,-74.2051236729696,-74.2051188839012,-74.2050909582431,-74.205074227356,-74.2050701239878,-74.2051018651468,-74.2051251085444,-74.2051307703334,-74.205132259195,-74.20512670483,-74.2051050512329,-74.2050967103753,-74.2050954230204,-74.2050933954492,-74.2050885447482,-74.2050689754382,-74.2050564590789,-74.2050551441379,-74.2050426312567,-74.2050350678488,-74.2050190317369,-74.2050022790396,-74.2049911958832,-74.2049829179168,-74.2049802230257,-74.2049655945386,-74.2048866223186,-74.204876875487,-74.2048643038844,-74.204831410145,-74.2048019833523,-74.2047781530964,-74.2047697629106,-74.204762800828,-74.2047621602706,-74.2047622192459,-74.2047559701127,-74.2047356972107,-74.2047224023388,-74.2047091190273,-74.2047028688956,-74.204702944229,-74.2047163529982,-74.2047262326815,-74.2047459499098,-74.2047509413077,-74.2047495901842,-74.2047398144363,-74.2047251117314,-74.2047118159388,-74.2047048341604,-74.2047034748333,-74.2047035256027,-74.2047112806183,-74.20472604416,-74.2047358887146,-74.2047457332754,-74.2047541750516,-74.2047556122377,-74.2047493434149,-74.2047445073956,-74.2047431669758,-74.2047390119264,-74.2047271220416,-74.2047053942523,-74.2046640441503,-74.2046381497119,-74.2046241736579,-74.2046193214423,-74.2046193803717,-74.20461943767,-74.2046061705148,-74.2045970827756,-74.2045894076441,-74.2045810428921,-74.2045434173059,-74.2045302398873,-74.2045150339666,-74.2045102722502,-74.2044998430847,-74.2044740288426,-74.2044272139775,-74.2044007643369,-74.2043987721181,-74.2043975271852,-74.2044018874198,-74.2044138919413,-74.2044470555812,-74.204456975569,-74.2044683523493,-74.2044859834887,-74.2045380821564,-74.2046147608249,-74.2046303060135,-74.204633902081,-74.2046297780441,-74.2046025344736,-74.2044214540837,-74.2043977140959,-74.2043768080517,-74.2043643389908,-74.2043616759436,-74.204367414599,-74.2043962998548,-74.2044139254873,-74.2044245698881,-74.2044232853829,-74.2044178168425,-74.2044193911699,-74.2044420011903,-74.2044385710287,-74.2044260291989,-74.2044121012049,-74.2044108136356,-74.2044221001769,-74.2044004957286,-74.2044104092736,-74.2044147166378,-74.2044042830932,-74.2043636722888,-74.2043412730566,-74.2043258879498,-74.2043198233287,-74.2043189388621,-74.2043186709932,-74.2043182896575,-74.2043185492583,-74.2043225489158,-74.2043422452022,-74.2043507166695,-74.2043500952635,-74.2043362196457,-74.2043075773417,-74.2042452874235,-74.2041738351582,-74.2041395456036,-74.2041199929543,-74.2041194025833,-74.2041412497183,-74.2041707691207,-74.204205423295,-74.2042235687755,-74.2042594366548,-74.204274942826,-74.2042771354465,-74.2042557048767,-74.2042585709211,-74.2042586542666,-74.2042538170947,-74.2042398435841,-74.2042202647798,-74.2042154111593,-74.2042022853119,-74.2042024062095,-74.2042169336981,-74.2042354561409,-74.2042370672539,-74.2042456083701,-74.2042457129551,-74.2042458567567,-74.2042504045647,-74.2042581287547,-74.2042653300289,-74.2042921520311,-74.2043541224735,-74.20437820037,-74.2043826647357,-74.2043857935899,-74.2043831912767,-74.2043791782155,-74.2043863332232,-74.2043976229699,-74.2044256759408,-74.2044901874018,-74.2045421222818,-74.2045646538937,-74.2045789393469,-74.204580656948,-74.2045514329175,-74.2044983379422,-74.2044339517499,-74.204410234173,-74.2044052367818,-74.2043782968335,-74.2043523480943,-74.204328146734,-74.2043063980027,-74.2042877356799,-74.2042727036055,-74.2042617398313,-74.204255163856,-74.2042531673141,-74.2042558083912,-74.2042612346108,-74.2042606807441,-74.2042439920567,-74.2042249077046,-74.204203858014,-74.2041813176277,-74.2041569224048,-74.2041302137659,-74.2041219535706,-74.2041220096959,-74.2041303813918,-74.2041469538477,-74.2041714997652,-74.204203682475,-74.2043230214239,-74.2045742207294,-74.2047052984863,-74.2044681031451,-74.2044354840094,-74.2046460894321,-74.2044089255159,-74.2042030060916,-74.2041007534238,-74.2038588660928,-74.203699743358,-74.2039416761199,-74.2038855045637,-74.2026586697188,-74.2026340159662,-74.2026046654403,-74.2025713667473,-74.2025349691915,-74.2024964011137,-74.2024566462135,-74.2024167184607,-74.2023776362332,-74.2023403963442,-74.2023059486182,-74.2022751716654,-74.2022168883266,-74.2021537443157,-74.2020860296481,-74.2020140553344,-74.2024677595674,-74.2025862272912,-74.203052549115,-74.2029634019565,-74.2024549506314,-74.202027339207,-74.2020672733737,-74.2020885797091,-74.2021069333324,-74.2021128970273,-74.2021178437595,-74.2021216397466,-74.2021241823272,-74.2021254027382,-74.2021252679735,-74.2021237816774,-74.202120984046,-74.2021169507396,-74.2021058230419,-74.2020902183828,-74.2020706076674,-74.2020239800381,-74.2019794768125,-74.2019376422769,-74.2018989880804,-74.2018717090535,-74.2018511296591,-74.2018376001095,-74.2018282943149,-74.2018257314604,-74.2018299820351,-74.2018409291553,-74.201858271778,-74.2018815329784,-74.2019226692231,-74.2019588649275,-74.2019893996557,-74.2020034981303,-74.2023028459175,-74.2023174356984,-74.2022872787704,-74.2023164576832,-74.2023086400305,-74.202280579096,-74.2021000909813,-74.2020203245778,-74.2020596087162,-74.2020094455734,-74.2019436762176,-74.2017547894857,-74.2018244360961,-74.2017824822654,-74.2017216016059,-74.2013033939439,-74.2012892598436,-74.2009254049636,-74.2007488080641,-74.2006897679247,-74.2006312785556,-74.2005745767087,-74.2005208613405,-74.2004712682611,-74.2004268461184,-74.2004288647193,-74.2004234595496,-74.2004107158449,-74.2003908345855,-74.2003641293271,-74.2003310212563,-74.200292032548,-74.2002254073941,-74.2001565682654,-74.2000440359903,-74.1999370342864,-74.1998358133172,-74.1997406097351,-74.1996516461287,-74.1995691305016,-74.1994932557867,-74.1994241993941,-74.1993621227969,-74.1993889882595,-74.1994232276861,-74.1994642489926,-74.1994735213771,-74.1994816556487,-74.1994884089285,-74.1994935795723,-74.199497013191,-74.1994986072605,-74.1994983141833,-74.199497363626,-74.1994923645753,-74.1994834487973,-74.1994708512993,-74.1994563211772,-74.19943168324,-74.1993999986457,-74.1993621758988,-74.1993279905563,-74.1992911618253,-74.1992108242351,-74.1990246572613,-74.19894864455,-74.1988949898269,-74.198888882422,-74.1988744354111,-74.1988610114675,-74.1987971341399,-74.1987714026434,-74.1987680545815,-74.1987323255373,-74.198696623404,-74.1986732421609,-74.198655486674,-74.1986321125436,-74.1986255626401,-74.1986302228065,-74.1986281079242,-74.1986092208703,-74.1985847317169,-74.1985613714359,-74.1985290229493,-74.1984955632754,-74.1984542398731,-74.1984275075589,-74.1984029664992,-74.198350420328,-74.1983079661438,-74.1982531582802,-74.1982230587191,-74.1981918348391,-74.1981550034999,-74.1981204131753,-74.1980824663724,-74.1980445103724,-74.1980088001168,-74.1980010580027,-74.1979966845435,-74.1979654616298,-74.1979622670407,-74.197950028516,-74.1979143164048,-74.197883954734,-74.1978772970357,-74.1978752065185,-74.1978729711544,-74.1978349717546,-74.1978003799241,-74.1977679544497,-74.1977299271094,-74.1976863621059,-74.1976371771622,-74.1976047161768,-74.1975935096174,-74.197557684993,-74.1975487296359,-74.1975184758748,-74.1975135771886,-74.1975144866894,-74.1975223843042,-74.1975145823943,-74.1974765417413,-74.197457644656,-74.1974544831274,-74.1974524331473,-74.1974548688037,-74.1974830546024,-74.1974887949506,-74.1974967092989,-74.1974810681359,-74.1974329636377,-74.1973837882814,-74.1973760324073,-74.1973616638333,-74.1973439198129,-74.1973126963709,-74.1972993393776,-74.1973061971382,-74.1973343937785,-74.1973760161972,-74.1974176437281,-74.197438932521,-74.1983818129487,-74.198759582053,-74.1991833388908,-74.2001486675991,-74.2013852747252,-74.2022184985106,-74.2028162837459,-74.202739270472,-74.2026729916908,-74.2023017901411,-74.2024437444953,-74.2006422973026,-74.2004532444463,-74.2005898644603,-74.2006900130349,-74.2007629080135,-74.2008089237767,-74.2008280438635,-74.2008304096493,-74.2008372382107,-74.2008474252264,-74.2008453524152,-74.200843286058,-74.2008468081847,-74.2008626758844,-74.200876296246,-74.2008764607542,-74.2008766278349,-74.2008913696865,-74.200899384049,-74.2009073971022,-74.2009142323828,-74.2009098670507,-74.200878584907,-74.2008730128366,-74.2008911002278,-74.2008934656438,-74.2009002735356,-74.2008913855701,-74.2008769051662,-74.2008747874013,-74.2008468081713,-74.2008154337286,-74.2007829044989,-74.2007637976405,-74.2007400934952,-74.2007085566909,-74.2006950752679,-74.2006412520387,-74.2005841006868,-74.2005527564982,-74.2005415633182,-74.2004867496923,-74.2004386710961,-74.2004152908061,-74.2003874236246,-74.2003629250218,-74.2003485065203,-74.2003520385625,-74.2003656610187,-74.2003960797443,-74.2004231348726,-74.2004423126977,-74.2004839361972,-74.2005165714904,-74.2005671260383,-74.2006366965343,-74.2007073781953,-74.2007724770938,-74.2008084179395,-74.2008399145064,-74.2008344149688,-74.2008154237475,-74.2007583564286,-74.2007113690562,-74.2006979927424,-74.2006959274555,-74.2006904952547,-74.2006805395224,-74.2006807141483,-74.2006909292732,-74.2007078921841,-74.2007147232489,-74.200739547533,-74.2007531613425,-74.2007576474083,-74.2007757492182,-74.2007983279402,-74.2008209169792,-74.200858062602,-74.2008963265329,-74.2009356989252,-74.2009649963309,-74.2009729628049,-74.2009708977308,-74.2009755282761,-74.2009936301872,-74.2010161895566,-74.2010286835011,-74.2010354832875,-74.2010265753964,-74.2010053312689,-74.2009952585928,-74.2009830333952,-74.2009821738937,-74.2009809584708,-74.2009844920294,-74.2009868438433,-74.2010037523627,-74.2010407757325,-74.2010688259973,-74.2010699746923,-74.2010520698347,-74.2009971557567,-74.2009231855452,-74.2008492046015,-74.2007740792591,-74.2007000264049,-74.2006405172708,-74.2005798912497,-74.2005361350731,-74.2005058812991,-74.2004667406196,-74.2004578309905,-74.2004624009499,-74.2004905276733,-74.2005051534754,-74.2004951474254,-74.2004705294054,-74.2004324510315,-74.2004280019192,-74.2004370934675,-74.2004595529638,-74.2005268800416,-74.200567251228,-74.2006412284866,-74.2007151890816,-74.2007734748508,-74.2008475082582,-74.200873315822,-74.2008767449405,-74.2008768991777,-74.200899357555,-74.2009296667265,-74.2009296950112,-74.2009219200421,-74.2009309452916,-74.2009826019349,-74.2009904780778,-74.200986158669,-74.2010008972181,-74.2010211961115,-74.2010683691378,-74.2010898345989,-74.2011213819469,-74.2011248343392,-74.2011271819975,-74.2011384820717,-74.2011497744335,-74.2011790613172,-74.2011971691267,-74.201210796147,-74.2012311382102,-74.2012313055957,-74.2012336636187,-74.2012584731012,-74.2012888342665,-74.2013314535806,-74.2013830378687,-74.2014323999804,-74.2014357887568,-74.2014224095955,-74.2014022547962,-74.2013293950202,-74.2013081077916,-74.2013014781412,-74.2012994120438,-74.2012962216331,-74.2012896637072,-74.2012830046591,-74.2012662853391,-74.2012651893585,-74.2012597067796,-74.2012430558625,-74.2012308920349,-74.201226575976,-74.2012312268074,-74.2012448463135,-74.2012618232833,-74.2012776856668,-74.20129466954,-74.2013127655428,-74.20132414579,-74.2013231915088,-74.2013110214574,-74.2012876035383,-74.2012753426313,-74.2012843589773,-74.2013022972531,-74.2013762481191,-74.2014502083927,-74.2015241991573,-74.2015455333477,-74.2015613264202,-74.2015670984459,-74.201574000629,-74.2015853772703,-74.2016023559998,-74.2016193383799,-74.2016284744285,-74.2016320110412,-74.2016321787644,-74.2016334667117,-74.2016313969507,-74.2016248443253,-74.2016126773318,-74.2015993939951,-74.2015849443556,-74.2015625854995,-74.2015166791995,-74.2014449565263,-74.2013720912927,-74.2013440890535,-74.2013340454838,-74.2013374852188,-74.2013801947627,-74.2014083169122,-74.2014117624972,-74.2013973307357,-74.2013649706972,-74.2013292449223,-74.2012789255904,-74.2012263478617,-74.2011782330442,-74.2011357660296,-74.2010989240154,-74.2010766279033,-74.201081283896,-74.2010904271504,-74.2010883594742,-74.2011042163682,-74.2011391215753,-74.2011448901549,-74.2011439415058,-74.2011396286715,-74.201134189277,-74.2011197860988,-74.2011053796627,-74.201088729916,-74.2010709587325,-74.2010565544187,-74.2010443924931,-74.201036711609,-74.2010301557307,-74.2010224773963,-74.2010136740913,-74.2010085351875,-74.2010059946951,-74.2009960772787,-74.200985042391,-74.2009784804138,-74.200981958026,-74.2010100798537,-74.2010370679299,-74.2010517640194,-74.2010609057429,-74.2010610807166,-74.2010623688921,-74.2010636579491,-74.2010615850544,-74.2010595083271,-74.2010608003345,-74.2010766627469,-74.2010958727414,-74.2011318960846,-74.201170147798,-74.2011825235367,-74.2012083135554,-74.2012161553162,-74.2014167066776,-74.2013926063758,-74.2009862556541,-74.2008047968128,-74.2007548389544,-74.2006212335449,-74.2006112133297,-74.200579878649,-74.2005249774727,-74.2004768171586,-74.2004511906391,-74.2004356587747,-74.2004257378512,-74.2004236656096,-74.2004249542167,-74.2004251004293,-74.2004241478587,-74.2004231933758,-74.2004222382351,-74.200413439778,-74.2004081277162,-74.200725721301,-74.2007259406904,-74.2007272487523,-74.2007296067241,-74.2007329447304,-74.2007371638545,-74.2007421390686,-74.2007477229399,-74.2007537499986,-74.200760041642,-74.2007664114268,-74.200772670594,-74.2007786336628,-74.2007841239267,-74.2007889786898,-74.2007930540885,-74.2007962293544,-74.200798410393,-74.2007995325724,-74.2007995626381,-74.200798499699,-74.2007916938454,-74.2007900531536,-74.2007874488768,-74.2007839564835,-74.2007796771786,-74.2007747349708,-74.2007692730789,-74.2007634497816,-74.2007574338305,-74.2007513995605,-74.2007455218368,-74.2007399709885,-74.200734907872,-74.2007304792101,-74.2007268133394,-74.2007240164922,-74.2007221697174,-74.200716953545,-74.2004031164306,-74.2003892830183,-74.2003748747354,-74.2003638279674,-74.2003561484403,-74.2003439823211,-74.2003351882087,-74.2003297547489,-74.200327683645,-74.2003222411599,-74.2003067104727,-74.2002866954248,-74.2002722901604,-74.2002578816457,-74.2002434705453,-74.2002301813125,-74.2002157708256,-74.2002024815483,-74.2001869465593,-74.2001869542459,-74.2001846215905,-74.2003614865723,-74.2003724648818,-74.2003767774272,-74.2003818373219,-74.2003875040384,-74.2003936201966,-74.200400015934,-74.2004065136234,-74.2004129328063,-74.2004190952045,-74.2004248296711,-74.2004299769445,-74.2004343940705,-74.2004379583734,-74.2004405708625,-74.2004421589816,-74.2004426786241,-74.2004042757766,-74.2004005311311,-74.2003960175844,-74.2003908585792,-74.2003851952115,-74.2003791823709,-74.2003729845055,-74.2003667711233,-74.2003607121568,-74.2003549733154,-74.2003497115532,-74.2003450707762,-74.200341177907,-74.2003381394133,-74.2003360383959,-74.2003349323162,-74.2003348514246,-74.2003458123817,-74.2001726540773,-74.2001570067433,-74.2001381058405,-74.2001079859317,-74.20006776011,-74.2000207995478,-74.1999704760824,-74.1999178947118,-74.199860828096,-74.1998048856528,-74.1997534272433,-74.1996986010278,-74.1996751207576,-74.1995813819546,-74.1992239618957,-74.1988891094792,-74.1988306761224,-74.1987348557128,-74.1986649196422,-74.1986224779907,-74.1985674909544,-74.1985100206544,-74.19843746919,-74.198368813536,-74.1983272698561,-74.1982697421849,-74.1982146141594,-74.198167032012,-74.1981095948968,-74.1980296116513,-74.1979746931524,-74.1979948616342,-74.1980050158084,-74.198042754962,-74.19805286271,-74.1980251993393,-74.1979978101797,-74.1979702041423,-74.1979451159957,-74.1978975167805,-74.1978274903918,-74.1977825059901,-74.1977650823139,-74.197758099691,-74.1977290387076,-74.1977027614617,-74.1976642835046,-74.1976370156922,-74.1976238290096,-74.1975993735931,-74.1975655907895,-74.197525254861,-74.1974858830618,-74.1974558445895,-74.1974126603351,-74.19737034865,-74.1973439606133,-74.1973361947318,-74.1973081429976,-74.1972565793611,-74.1971894017817,-74.1971237751068,-74.1970785077629,-74.1970676955196,-74.1970787258873,-74.1970584922606,-74.1970178836044,-74.1969538204287,-74.1968866713236,-74.1968773141207,-74.1968398993352,-74.1967853063197,-74.1967370056033,-74.1967356218844,-74.1967732980772,-74.1968124980791,-74.1968391866412,-74.1968361395884,-74.1968284444275,-74.196845673867,-74.1968738772257,-74.1968786566836,-74.1968521147611,-74.1968068189623,-74.1967662463501,-74.1967366157925,-74.1967100920207,-74.1966663245121,-74.1965991678593,-74.1965585661401,-74.1965319126956,-74.1965037536452,-74.1964319548283,-74.1963664701807,-74.1963103119084,-74.1962667378237,-74.1962092047991,-74.1961937804894,-74.1961767889133,-74.1961754221726,-74.1961739873556,-74.1962035955031,-74.1961987972533,-74.1961607404317,-74.1961412310206],"lat":[40.6347927589935,40.6331428325197,40.6329864660791,40.6326689333536,40.6323570296587,40.6320508054671,40.6317503103321,40.6314555928789,40.6311667009126,40.6308836810612,40.6306065791205,40.6303354399282,40.6300703073563,40.6297464457578,40.6294164023978,40.6290802156771,40.6287379250507,40.6277558072062,40.6268346301751,40.6266012965199,40.6263623541178,40.6261805812568,40.626137885673,40.6259328717369,40.625451361419,40.6252604265177,40.6249909629019,40.6249384498507,40.6234062428804,40.6227062438796,40.6225291071353,40.6223640119917,40.622211792356,40.6220731685179,40.6219487408698,40.6218389838629,40.6217115382825,40.621635798865,40.6215786205853,40.6215433837547,40.6214421806275,40.6213123869048,40.6212705001099,40.6212164336711,40.6211511433497,40.6211240285444,40.6210458153045,40.6209362561871,40.6207902747522,40.6206772840716,40.6200945345408,40.619954036436,40.6195724049034,40.6191432619348,40.6188545902809,40.6183421565519,40.6179460636856,40.6172479002834,40.6168161457484,40.6163215651533,40.615939315916,40.6154574246042,40.615031910829,40.6143544820095,40.6130322309345,40.6129923178982,40.6123206275904,40.6122556122519,40.6122062818525,40.6117615217529,40.6102649953817,40.6095928146879,40.6094978111544,40.6092005379402,40.6088825569838,40.6087715775485,40.6085554435014,40.6084941448039,40.6083578921406,40.6082574343827,40.6081421177466,40.6078862737308,40.607730378479,40.6076150255798,40.6075904854894,40.6075747239116,40.6075854387744,40.6076415471229,40.607693493897,40.607746310443,40.6077910673952,40.6078408239624,40.6078905117743,40.6079296716997,40.6079441825366,40.6080069646996,40.6080549819727,40.608102797299,40.6081529236038,40.608181172361,40.6082143124153,40.6083039432947,40.6083917410318,40.6085002894728,40.6085497603366,40.6086319147238,40.6086629083061,40.6086996429454,40.6088984050148,40.608908471012,40.609022318954,40.6091352185802,40.6092336021972,40.6092913475462,40.6094689997097,40.6094812350474,40.609765268159,40.609867130868,40.6101733990011,40.6106668134136,40.6109327350644,40.6110380934131,40.6110610219103,40.6111039600421,40.6111410548779,40.6111722598104,40.6111975356324,40.6112168505862,40.6112301803301,40.6112375081933,40.6112388249689,40.6112341290023,40.6112234261938,40.611213766576,40.6111907639687,40.6111544486427,40.6111049351803,40.6110424534508,40.6109673667623,40.6105860604965,40.6105069153516,40.6104186561448,40.6103362055471,40.6102854386673,40.6102515849962,40.6102501095356,40.6102347678599,40.6102350571793,40.6102524448125,40.6102868030276,40.6103436175778,40.6103821298373,40.6104134717621,40.6104291028298,40.6104480281832,40.6104698627692,40.6104757535881,40.6104858075458,40.6105066718399,40.6105362823107,40.610558101373,40.6105613899334,40.6106235929402,40.6106273209652,40.610628017665,40.6106383474822,40.610624778037,40.6105946639872,40.6105480573601,40.6104852193128,40.610406552122,40.6101199357373,40.6092365855667,40.6090945263766,40.6086869332584,40.6083700462689,40.6080518279621,40.607727602221,40.607551270117,40.6070223905291,40.606890132547,40.6066814853406,40.606551986371,40.6065225086613,40.6064109790698,40.6062902965674,40.6062458352117,40.6061710088577,40.6061452342304,40.6061216641582,40.6060370708854,40.6059979500401,40.6059879668429,40.6058702120091,40.6057255679582,40.6056210674513,40.6055630442717,40.6049778569116,40.6043792994778,40.6040397187302,40.6039819199692,40.6031053657056,40.6027198804299,40.6025999499056,40.6022913985708,40.6021500548305,40.601945577091,40.601855487904,40.6016907451458,40.6015601477326,40.6012364554469,40.5998163931775,40.5997489746976,40.5995422411895,40.5994947946257,40.5992375997249,40.5989348595219,40.5987524157589,40.5986967716816,40.5983636065895,40.5978622277705,40.5973476524014,40.5968490112399,40.5964112311185,40.5949115147772,40.5943675906145,40.5941894178399,40.5935819063333,40.5934954723356,40.5934953372301,40.5934952202106,40.5934186366082,40.5934185454077,40.5934184640786,40.5933547047808,40.5933546328331,40.5933545794811,40.5933059513644,40.5933058606016,40.5933057973005,40.5932926098742,40.5933138094327,40.5929065569067,40.5923414485486,40.5921394185354,40.5914348591443,40.5910628098845,40.5903962231406,40.590342019704,40.5902947235609,40.588255067406,40.5879911110863,40.5877177928864,40.5874358677838,40.5871461449712,40.5868494771359,40.5865666142673,40.5853631101048,40.5852070513839,40.5850583827193,40.5849189520807,40.5847904069636,40.5846741280705,40.584534930743,40.5843859602722,40.5842279009276,40.5840615278771,40.5838877063468,40.5833109123411,40.5831951509086,40.582723652505,40.5821263867667,40.582066980334,40.5815195671638,40.5802039500301,40.5793173431667,40.5792502129355,40.579189758485,40.5780499732385,40.5777834800652,40.5775274330632,40.5772823169445,40.5770485655325,40.5765203918729,40.5761079397351,40.5758353027021,40.5755796615393,40.5753317975795,40.5750445770901,40.5746781759357,40.5743291781514,40.5741347150593,40.5730618845432,40.5730191736173,40.5729494451845,40.5728277202268,40.5726972199249,40.5725585065765,40.5724122347462,40.5723744850151,40.5723249465657,40.5719472890497,40.5717207835254,40.5716802983745,40.5716093452059,40.5713629872354,40.5707810161172,40.5699291958546,40.5688923387405,40.5680960483853,40.5679434106031,40.5684089429083,40.5687896237727,40.569181388867,40.5695603057981,40.5699477987303,40.5703424444386,40.5707315307686,40.5711107821095,40.5715038446983,40.5718819128259,40.5722784655153,40.5726616791725,40.573046622403,40.5734282841132,40.5738112682864,40.5740059394047,40.573094039891,40.5729151645648,40.571924855219,40.5708942937548,40.570299595655,40.570295891921,40.5702856699422,40.5702689605055,40.570245813937,40.57021629995,40.5701805074356,40.5701385441942,40.5700905366114,40.5700366292767,40.5699769845483,40.5699141511519,40.5698461237492,40.5697731161182,40.5696953576866,40.5696130928106,40.5695265800072,40.5694360911413,40.5693419105715,40.5689150672086,40.5687782687683,40.5682553426664,40.567877127458,40.5675006495187,40.5671228251282,40.5666484041572,40.5663858570257,40.5660148190989,40.5656434882968,40.5651239930237,40.5644821710468,40.5641118321154,40.5637901625775,40.5634779466084,40.5631595190582,40.5630870199658,40.5629033648193,40.5625714143414,40.562249060569,40.5618845559932,40.5615464656662,40.5610493425846,40.5609420476326,40.5604680011701,40.5601514945116,40.5599055783561,40.5600148928915,40.5601282243285,40.5602455235095,40.5603667395555,40.5604918198884,40.5606207099398,40.5607533541202,40.5608896948932,40.5610296731188,40.5611732280791,40.5615952394129,40.5619899734925,40.5622963328294,40.5626670460355,40.5627698833931,40.5631455882576,40.5635283633471,40.5639089377653,40.564310666832,40.5655055577586,40.5636898192186,40.5626757240841,40.5629324875105,40.5631660707364,40.5638027318887,40.5638792104359,40.5639156379859,40.5639435159133,40.5644177637808,40.5649216420596,40.5653552243262,40.5657795527173,40.5662274656848,40.5670884600852,40.5679663664545,40.5680758638436,40.5682399812729,40.5684307186556,40.5689491424445,40.5694245377283,40.5698325286489,40.5699205329322,40.5699491962305,40.5700983608072,40.5701375377127,40.5701783647501,40.5704298447689,40.5705964331634,40.5709394937403,40.5715013938681,40.5717756146804,40.5720922110721,40.5722236682536,40.5723726119111,40.5723727112814,40.5723728007548,40.5725238710791,40.5726756622045,40.5726757347448,40.5728267437394,40.5729755487895,40.5735559198829,40.573832027759,40.5742170889656,40.5746531813966,40.5749069850808,40.5751325873752,40.5754830196804,40.5755666257362,40.5755667068616,40.5755667879619,40.5756405003575,40.5756405458491,40.5756405814445,40.5757026474738,40.5757027191787,40.5757027727791,40.5757517719419,40.5757518161857,40.5757518528895,40.5757869407644,40.57578698613,40.5757870129121,40.5758079333258,40.5758328716827,40.5758813539717,40.5759010430202,40.5759844469469,40.5762849329162,40.5764052186687,40.5754799102494,40.5754251577883,40.575373131217,40.5753245886939,40.5752802376302,40.575240724315,40.5752066245533,40.5751675762499,40.5750565385785,40.5747300541427,40.5746824823603,40.5741060101974,40.5737425306182,40.5735576226782,40.5735162067815,40.5734790937297,40.5734463493115,40.5734180314265,40.5733822778878,40.5733501081286,40.5733215435835,40.5732966040146,40.5732382283604,40.5731977126844,40.5730519498333,40.5729913095805,40.5729084522082,40.5727796429604,40.5727398873731,40.5725273721191,40.5724225526331,40.5723326139677,40.5720374100049,40.5718477694807,40.5720133209792,40.5714610589974,40.5714105750647,40.5712740617826,40.5707469288205,40.5703824434124,40.5667293999793,40.5656248615302,40.5653379837258,40.562951695702,40.5623456418449,40.5614469703726,40.5606424482222,40.5602904102697,40.5604766053655,40.5610904206046,40.5611307867612,40.5611766930729,40.5612281161901,40.561285029582,40.5613202637955,40.5613977305618,40.5614924158657,40.5615209230203,40.561551719835,40.5617048371558,40.5622869362441,40.5625729717263,40.5627981327469,40.5628390155932,40.5628754772072,40.5629074048034,40.5629346998332,40.5629572776488,40.5629750684109,40.5630041240522,40.5630394000365,40.5630808354085,40.5631283585313,40.563181887334,40.5632413293207,40.5637554402341,40.5671106388179,40.5698750000021,40.5705483133979,40.5722605918989,40.5721932001548,40.5720734943531,40.5717146255052,40.5723355342815,40.5724573031455,40.5725004743426,40.5725280169689,40.5727651328751,40.5729991585379,40.5732299769819,40.5734574728336,40.573681532379,40.5739020436207,40.5741188963337,40.5743319821281,40.5745411944807,40.5747464288116,40.5749475825282,40.5751445550771,40.5753372479939,40.5755255649528,40.575321436036,40.5746106996704,40.5738817225564,40.5732498561291,40.5726665061419,40.5721864095687,40.5717305371768,40.5713355039409,40.5709312067735,40.5710373525912,40.5710571385717,40.5715953050637,40.5717614809775,40.5723104626349,40.5727996205986,40.5732826221847,40.5739353174637,40.5744948794977,40.5748930690814,40.5763185234041,40.5766791202205,40.5766850285199,40.5766236356205,40.5772617088882,40.5788590005879,40.5793036186336,40.5795110004113,40.5801020000802,40.5801700009204,40.5798424570515,40.5797642671455,40.5800469937658,40.5800769889694,40.5802037445182,40.5802525597538,40.58027822891,40.5803016974059,40.5803181267576,40.5803385376937,40.5803668484597,40.5803952006911,40.5804103839359,40.5804239328707,40.5804508726813,40.5804690020193,40.5804852225868,40.5805124623759,40.5805323165266,40.5805552074656,40.5806028286459,40.5806380821522,40.5806558106616,40.5806767280564,40.580706052586,40.5807280428035,40.5807458452777,40.5807632162562,40.5807874001827,40.5808089041418,40.5808334802621,40.5808558374443,40.580867852512,40.5808820108823,40.5809071493432,40.5809443217942,40.5809656889322,40.580979610103,40.5809944874679,40.581008287362,40.5810262685058,40.5810534569073,40.5810694869829,40.5810911307874,40.5811204830544,40.5811378715184,40.5811403926892,40.5811463112105,40.5811690793957,40.5812028815901,40.5812291385635,40.5812584490829,40.5812943350605,40.5813511423765,40.5813738750962,40.5814040361395,40.5814428473468,40.5814746998999,40.5815045118213,40.5815262841726,40.5815473183795,40.581572371863,40.5815994688027,40.5816328263075,40.5816598995237,40.5816861933707,40.581691516357,40.5816989639992,40.5817229822306,40.5817812193347,40.581818629267,40.5818534085676,40.5818822907642,40.5819148905247,40.5819821564197,40.5820200503907,40.5820382058824,40.5820665214703,40.5820836288167,40.5821066431926,40.582129099045,40.582165967466,40.5821905497292,40.5822081905728,40.5822253222625,40.5822574034547,40.5822857245496,40.5823188728992,40.5823659049972,40.5823931835209,40.5824145850326,40.5824568151325,40.5824995736415,40.5825348438231,40.582563721078,40.5826343910058,40.5826557805075,40.5826696938313,40.5826841786435,40.5826858346976,40.5826848083329,40.5826912351574,40.5827062073128,40.5827259776492,40.5827452131562,40.5827644589001,40.5827805241178,40.5827869596786,40.5827976694069,40.5828163808968,40.582840958902,40.5828713897633,40.5828938137903,40.5829247669896,40.5829525420853,40.582969107836,40.5829808801573,40.5829851817186,40.5829916172797,40.5830001780981,40.5830140714263,40.5830306351812,40.5830455827862,40.5830610509826,40.5830717189978,40.5830823880174,40.5830930585309,40.5831042767849,40.5831171116975,40.5831400948585,40.5831598671112,40.58317590193,40.5831839385832,40.5831829089594,40.5831819137843,40.5831937148081,40.5832065629382,40.5832242042653,40.5832434380962,40.5832621395201,40.583277656979,40.5832851533705,40.5832958530974,40.583310828911,40.5833819583817,40.5834268627544,40.5834963488739,40.5835428423617,40.5835701108287,40.5836080922327,40.5836535900332,40.583712945842,40.5837487471651,40.583800043335,40.583850794275,40.5838801593292,40.5839538335597,40.583989615361,40.5840430250751,40.5840793255605,40.5841567073391,40.5842516773363,40.5842933245432,40.5843232388013,40.5843494272078,40.58437832805,40.584519172556,40.5845480671154,40.5845865738468,40.5846341493707,40.584680104359,40.5847233726373,40.5847730111076,40.5848071751037,40.5848504346508,40.5848883723921,40.5849337982869,40.5849898977092,40.5850502328868,40.5850742840444,40.5850978151507,40.5851272263384,40.5851640952436,40.5851962986888,40.5854569116788,40.5854900212227,40.5855236753274,40.5855493396897,40.5855617015821,40.585570289797,40.5855810027124,40.5855982695714,40.5856007842592,40.58560760722,40.5856173492547,40.5856184538198,40.5856355079445,40.5856589827123,40.5856792710876,40.5857049184956,40.585751428175,40.5857813997674,40.5858087592367,40.5858195734585,40.5858361970535,40.5858592069977,40.5858955410758,40.5859350401366,40.5859627711656,40.5860135582314,40.5860401511594,40.5860812293739,40.586110054127,40.5861394361311,40.5862361831605,40.5862564820087,40.5862837317572,40.5863061808071,40.5863200977211,40.5863350927663,40.5863516652329,40.5864142021425,40.5864537403029,40.5866206834019,40.5867189623309,40.5867910782001,40.586830079369,40.586864275199,40.5869112935227,40.5870234881881,40.5872574995136,40.587320535043,40.5873824661778,40.5874795996537,40.5875607707489,40.5876451832481,40.5877520378998,40.5878172268619,40.587880281658,40.5879283563462,40.5879529143911,40.5879592763524,40.5879698476155,40.5879932644636,40.5880274196945,40.588115020045,40.5882176036827,40.5882871147319,40.5883427761877,40.588372812417,40.5884091871309,40.5884196021333,40.5884222855607,40.5884284230424,40.5884378357267,40.5884502493196,40.5884653020775,40.588482555349,40.5885015063574,40.5885216028518,40.5885422592,40.588562873455,40.5885948162405,40.5886270230018,40.5886401777959,40.5886512792104,40.588660076923,40.5886663725567,40.5887202042464,40.5887733939243,40.5888272508126,40.5888814745784,40.5889353214605,40.5889880528657,40.5890389454992,40.5890873012867,40.5891366174734,40.5887191393255,40.5887723708306,40.5891826956187,40.5892183977943,40.5892857454659,40.5897067638116,40.5896429717417,40.5898427574125,40.5902495253617,40.5901999064748,40.5898073963993,40.5897861102389,40.5907221457824,40.5906981489716,40.5906774501351,40.5906605772088,40.590647960546,40.5906399219416,40.5906366664244,40.590638277028,40.5906447126732,40.5906558092154,40.5906712836315,40.5906907412379,40.5907469534115,40.5908000270429,40.5908497183599,40.5908957991251,40.59083882536,40.5908767106414,40.5911405418099,40.5912309227767,40.590951125852,40.590999079292,40.5911445337713,40.5911785921522,40.5912136353702,40.5912179904483,40.5912230317468,40.5912286229259,40.5912346127745,40.5912408392997,40.5912471341074,40.5912533269571,40.5912592503657,40.5912647441368,40.591285204547,40.5913038881894,40.5913202312398,40.5913329291473,40.5913494743583,40.5913696645209,40.5913932527047,40.5914311283716,40.5914713887355,40.5915133486854,40.5915438622736,40.5915751286555,40.5916062879902,40.5916364833797,40.5916648844338,40.5916907101065,40.5917152550176,40.5917439687676,40.5917762798461,40.5917807647951,40.5914693217744,40.5914769848639,40.5915086410983,40.5915239651028,40.5915325212073,40.5915163411663,40.5917039023588,40.5917867150196,40.5918088541896,40.5918602999611,40.59182367412,40.5920173248185,40.5920529563697,40.5920951342854,40.5920530216791,40.5925314886406,40.5925243352552,40.5928663793049,40.5927503394198,40.5927499534597,40.5927560988071,40.5927686455191,40.5927873282969,40.5928117520944,40.592841400472,40.5928864545672,40.592931346235,40.5929753674429,40.5930178238859,40.5930580459372,40.59309539921,40.593129294563,40.593166186907,40.5932006363957,40.5932857849758,40.5933749804862,40.593468014412,40.5935646692644,40.5936647190886,40.5937679299926,40.5938740606929,40.5939828630797,40.5940940827956,40.5941382700945,40.5941793880979,40.5942167257585,40.5942211523864,40.594226729726,40.5942332912452,40.5942406410261,40.5942485596137,40.5942568105696,40.5942651475309,40.594284278007,40.5943030391008,40.5943209362904,40.594337497825,40.5943511576151,40.5943845896874,40.5944143736053,40.5944396553549,40.59445624323,40.5944691304008,40.594543609478,40.5946764480182,40.5947800077604,40.5948788164817,40.5949047572918,40.5949449277604,40.5949526392622,40.5949501865812,40.5949638974913,40.594968174786,40.5950117983105,40.5950639641139,40.5951144008081,40.5951725143671,40.5952255130708,40.5952836077576,40.5953433920377,40.5953861031874,40.5954408019264,40.5954955115158,40.5955527810124,40.5956023784321,40.5956553945287,40.5957015906619,40.5957554493537,40.5957930746548,40.5958333119979,40.5958760922571,40.5959095005945,40.5959616554064,40.5960129597583,40.596062564801,40.596112165968,40.5961634818796,40.596212235261,40.5962618371508,40.5962960178226,40.5963327547204,40.5963840573315,40.5964404383956,40.5964703548037,40.596519104275,40.5965483326819,40.5965547422697,40.5965567545496,40.5965584661955,40.5965926989502,40.5966414452839,40.5966654182896,40.5966902544884,40.5967364541957,40.5967766837495,40.5967886993435,40.5967887186129,40.5967998828956,40.5968033160622,40.5968033680657,40.5967989865394,40.5973491860573,40.5973645483503,40.5973773789475,40.5973962478457,40.5974424171323,40.5975013700334,40.597557758994,40.5976149928053,40.5976636316579,40.5977037722723,40.5977242596034,40.5977388136444,40.5977645388815,40.5978056428094,40.5978321402144,40.5978911155413,40.5979466800639,40.5979928738409,40.5980202382734,40.598059522241,40.5981115795508,40.5981567749026,40.5982036802049,40.5984608345548,40.6008617836935,40.6017119751763,40.6023587364845,40.6036833500987,40.6046369662085,40.6059696796165,40.6082708279673,40.6088322117635,40.6098278612319,40.6118756420391,40.613284693932,40.6160332370762,40.616327997309,40.6170289273895,40.6170415714279,40.6170534015445,40.6170729673295,40.6170942885509,40.6171352840281,40.6171694381884,40.6172027324161,40.6172591114856,40.6173171983368,40.6173701503678,40.617428205883,40.6174845575294,40.6175392232193,40.6175947436389,40.6176510928202,40.6177065995251,40.6177621050587,40.6177988223986,40.6178381218422,40.6178723420963,40.6178834568463,40.6179338213952,40.6179748173709,40.6180021377068,40.6180286322463,40.618059407549,40.6181004108559,40.6181149808463,40.6181193059799,40.6181116757203,40.6180946254613,40.6180400003805,40.617989660967,40.6179794337234,40.6179735495642,40.6179787738547,40.6179924942406,40.6179976394936,40.6180353179511,40.6180755466641,40.6181285472837,40.6181806981374,40.618234553754,40.6182858292698,40.6183421985547,40.6183994028086,40.6184505989974,40.6185009479833,40.6185419141494,40.6185913829833,40.618634034632,40.6186715292832,40.6186953255302,40.6187165555922,40.6187446293824,40.618767629521,40.6188043026073,40.6188393332019,40.6188607203284,40.6188941325272,40.6189249645711,40.6189497581308,40.6190086997014,40.619065937681,40.6191103714222,40.619168454347,40.6192102908495,40.6192598026496,40.6192948110373,40.6193494336584,40.6193880138174,40.6194040696927,40.6194595582768,40.6195124770132,40.6195688129886,40.6196199972988,40.6196703260812,40.6197163819225,40.6197675810882,40.6198068589673,40.6198657993648,40.6199144779475,40.6199699669974,40.620016052875,40.6200706969907,40.6200954558053,40.6201151170339,40.6201330913692,40.6201382347054,40.6201732768938,40.6201962513455,40.6202288007152,40.6202851699678,40.6203218939601,40.620353469122,40.6203636534846,40.6203721467422,40.6203815402751,40.620391821699,40.6203961880455,40.6204005888462,40.6204015723567,40.6203948700693,40.6203719364663,40.6203395825611,40.6203080848054,40.6202953478371,40.6202996721013,40.6203304908551,40.6203501520419,40.6203783315361,40.6204124485647,40.620430359238,40.6204577110937,40.6204722751249,40.62048429892,40.6204954110169,40.6205363947611,40.6205500219638,40.6205729674538,40.6205780215774,40.6205761846938,40.6205683690085,40.6205665589329,40.6205826573301,40.6205911552237,40.6206133562362,40.6206646063405,40.6206773792278,40.6206918473547,40.6207012433495,40.620725173411,40.6207439490549,40.620774608745,40.6207839910191,40.6208386645297,40.6208941594537,40.6209342688207,40.6209649368146,40.6210204199609,40.6210733229382,40.6211032121526,40.6211382300288,40.6211681055126,40.6211954184817,40.6212423461123,40.6212995434084,40.621357602273,40.6214122337959,40.6214677541926,40.6215061871303,40.6215548308722,40.6215863819344,40.6215939948834,40.6215998838172,40.6216126089654,40.6216211448395,40.6216450847523,40.6216528083142,40.6216546437283,40.6216580982672,40.6216905676558,40.6217486544885,40.6218058897282,40.6218614202231,40.6218836405594,40.6219152740491,40.6219238177795,40.6219639734068,40.6220186690109,40.6220742109895,40.6221297392301,40.6221852512722,40.6222407481168,40.6222945306189,40.6223500235325,40.6224063687113,40.6224592951818,40.6225156489955,40.6225711718526,40.6226241513208,40.6226651919127,40.6226882762861,40.6227044888855,40.6227053127131,40.6226932241283,40.6226845527398,40.6226861320267,40.6226980520231,40.6227304832835,40.622785993846,40.62284406378,40.6228995656864,40.6229533476296,40.6230088385289,40.623064343187,40.6231215654574,40.6231770858436,40.6232326054374,40.623289836367,40.6233470775038,40.6234017647868,40.6234573087597,40.6234983336815,40.6235188737655,40.6235368904188,40.6235447048682,40.6235448325225,40.6235525686444,40.6235679608891,40.6235935797932,40.6236302342523,40.6236617885296,40.6236891163861,40.6237361210381,40.6237857191151,40.6238344683431,40.6238764107684,40.623913232072,40.6239432115243,40.6239868479375,40.6240373080103,40.6240783465898,40.6241355680853,40.6241936347899,40.6242517221085,40.6243055055772,40.6243558406368,40.6244104964829,40.6244677277797,40.6245241095581,40.6245796397459,40.6246360398458,40.624691585718,40.624746280778,40.6248018325304,40.6248573783917,40.6249137750632,40.6249693091636,40.6250256943545,40.6250820831825,40.6251367656819,40.6251739237531,40.6251922997763,40.625249544402,40.6253076480591,40.6253623254634,40.6254007564333,40.6254323108038,40.625459597502,40.6255005713776,40.6255577843508,40.6256158672357,40.6256713856478,40.625726904058,40.6257832825785,40.6258379521406,40.6258951795095,40.6259506724309,40.6260010337731,40.6260505133108,40.6260957157722,40.6261102152069,40.6261118783689,40.6260537710697,40.6260705133932,40.626248890542,40.6293441481063,40.6293325714443,40.6295946341135,40.629587638107,40.6296107184801,40.6296295645499,40.6296407646441,40.6296570775051,40.6297100803017,40.6297647732859,40.6298211659534,40.6298775444355,40.629933062828,40.6299817491987,40.6300381262307,40.6300936473596,40.6301491696621,40.6302055598669,40.6302501006946,40.6302775583719,40.6302727077439,40.630267957653,40.6302634488611,40.6302593149796,40.6302556785097,40.6302526472127,40.6302503109167,40.6302487388542,40.6302479776109,40.630248049745,40.630248953119,40.6302506609628,40.630253122667,40.6302562652828,40.6302599956833,40.630264203324,40.6302687635175,40.6302735411295,40.6302783945824,40.6302831800514,40.6303501243184,40.6303545593426,40.6303587180897,40.6303624800444,40.63036573619,40.6303683921678,40.6303703710108,40.6303716153747,40.6303720891993,40.6303717787539,40.6303706930348,40.6303688635047,40.6303663431811,40.6303632050998,40.6303595401983,40.6303554546807,40.6303510669402,40.6303206077046,40.6302923622674,40.6303747264056,40.6304302721523,40.6304849573058,40.630541345554,40.6305968873886,40.6306549863731,40.6307122237628,40.6307694569689,40.6308241323516,40.6308788263144,40.6309343813118,40.6309907817699,40.6310463269958,40.6311010184959,40.6311557075377,40.6312103990326,40.6312650880705,40.6313189279586,40.6313214904694,40.6313286694642,40.6313824794704,40.6313632412405,40.6313595380237,40.6313564318706,40.6313540090477,40.6313523368434,40.6313514616994,40.6313514079208,40.6313521770012,40.631353747581,40.6313560760412,40.6313590977138,40.6313627286789,40.6313668680944,40.6313714009976,40.6313762014971,40.6313811362699,40.6314556772389,40.6314594683086,40.6314627373502,40.6314653949574,40.6314673684459,40.6314686038421,40.6314690673586,40.6314687463183,40.6314676495017,40.631465806906,40.6314632689251,40.6314601049715,40.6314564015774,40.6314522600286,40.6314477935939,40.631443124428,40.6314383802295,40.6314131364518,40.631361080531,40.631429166609,40.6314821576157,40.6315326061237,40.631577946658,40.6316207362025,40.6316635322466,40.6317012059735,40.6317388891479,40.631777423398,40.6318159503332,40.631852774801,40.6318741689967,40.6319436877578,40.6322506608928,40.632514358315,40.6325685350598,40.632666794815,40.6327069440482,40.6327375148543,40.6327566712783,40.6327815500632,40.6327835812757,40.6327686983594,40.6327456495149,40.6327514666613,40.6327229702054,40.6327078032302,40.6327441187951,40.6327709414342,40.6328129710282,40.6328644012084,40.6329139419831,40.6329844035117,40.6330180602674,40.6330291924699,40.6330149782293,40.6329864344278,40.6329636040497,40.6329427185578,40.6329523701213,40.6329696024786,40.6330001297617,40.6330503205583,40.633058232673,40.6330561336546,40.6330526255777,40.6330326584321,40.6330155261287,40.6329948394615,40.6329927528077,40.6329956809901,40.633007185657,40.6330022334899,40.6329937301576,40.6329922888361,40.6329981470505,40.6330160300265,40.633048243901,40.633061437161,40.6330829957644,40.63309978681,40.6331272646116,40.6331725529942,40.6332011260934,40.6332333265054,40.6332500739405,40.6332668622094,40.6332979516452,40.6333063069253,40.6333456841721,40.6333922392692,40.6334518878584,40.6335126472915,40.6335626181986,40.6335982905671,40.6336339843413,40.6336613897596,40.6337030990524,40.633712600616,40.6337316127711,40.6337613877216,40.6337757285802,40.6337936764347,40.6338223378756,40.6338497887794,40.6338700857315,40.6338761174279,40.6339048236057,40.6339239546343,40.6339001737214,40.6338966481204,40.633942040648,40.6340076745894,40.6340542321293,40.6341257854301,40.6342366767243,40.6343093730877,40.6343808814942,40.6344475965391,40.6344916782021,40.6346860502338,40.6347302101752,40.6347781047903,40.6347927589935]}]],[[{"lng":[-73.8968088322377,-73.8969387299879,-73.8972360384394,-73.8979683978374,-73.8985733266556,-73.8989526183253,-73.8991943424998,-73.8985205207147,-73.8978825324011,-73.8971314979564,-73.8967852634123,-73.8968088322377],"lat":[40.7958084451598,40.7956358728536,40.7957200375371,40.795644839162,40.7960691402596,40.7962278525797,40.7965024560183,40.7969361941898,40.7971165326497,40.7967980777284,40.7963291664871,40.7958084451598]}],[{"lng":[-73.8983303627048,-73.8964666883457,-73.8979848668692,-73.8986403871492,-73.8990245556723,-73.9002100499307,-73.8997873880092,-73.8997156381744,-73.9000373581574,-73.8994891942367,-73.8993874857105,-73.8983303627048],"lat":[40.8024128214426,40.8007904708914,40.7996042808198,40.799101165124,40.79917219984,40.7992641563986,40.799509553872,40.8007988085028,40.8009087420502,40.8009011159296,40.8019356650703,40.8024128214426]}],[{"lng":[-73.8938545418665,-73.8929322610114,-73.8919127185849,-73.8909056006279,-73.8899794248792,-73.8898359917002,-73.8898056417241,-73.8896900496137,-73.8896389531624,-73.8888504620368,-73.8878951090142,-73.8863995722807,-73.8860962416716,-73.8859499963777,-73.8858721579579,-73.8857942629586,-73.8856920052475,-73.885566158875,-73.8854150101017,-73.885026388461,-73.8847896027465,-73.8839006990514,-73.8837841413457,-73.8843870535373,-73.8846093892466,-73.884613360104,-73.8846216586827,-73.8846445070049,-73.884385041061,-73.8843612859193,-73.8843321238172,-73.8842948821121,-73.8842497175018,-73.8837878612648,-73.8826592292403,-73.8824477955298,-73.8809802965942,-73.8780628326213,-73.8766345996371,-73.8767318550682,-73.8752053909248,-73.8744638192774,-73.8725011088597,-73.8723943790009,-73.87232977098,-73.8724366723508,-73.8721896101205,-73.87209716961,-73.8720368753993,-73.8721293114736,-73.8720803878503,-73.871804636402,-73.871657776834,-73.870957536841,-73.8705680692793,-73.8704709316532,-73.8705534219163,-73.8681121914008,-73.8684634695914,-73.8697896801756,-73.871518550303,-73.8716114259257,-73.8716988193081,-73.8716033619253,-73.8717450937392,-73.872380604537,-73.8724386468485,-73.8726476533188,-73.872705037586,-73.873172233272,-73.8735509657251,-73.8746771631406,-73.874730604527,-73.8752651703732,-73.8758578858133,-73.8759299807161,-73.8781421881992,-73.8780768548654,-73.877986295094,-73.8779688037537,-73.8780330023647,-73.8780629485342,-73.8781143889429,-73.8781658114006,-73.878234649218,-73.8784329551354,-73.8787434416655,-73.8789245383548,-73.8792134840769,-73.8793429218454,-73.8795099596104,-73.8796276483653,-73.8797430082038,-73.8797570457684,-73.8799166060345,-73.8800546298488,-73.8801711511879,-73.8802789879653,-73.8804183651007,-73.8805694363832,-73.880771498085,-73.8809203054526,-73.8810691031168,-73.8811796566723,-73.8813202576124,-73.881430829576,-73.8815332076575,-73.8817093195776,-73.8818212547986,-73.8819386393324,-73.8820349014337,-73.882060131274,-73.8820653925818,-73.8821925670658,-73.8823208879867,-73.8823701011564,-73.8823946520833,-73.8824477508195,-73.8824302177404,-73.8825189491205,-73.882541134022,-73.882595269443,-73.882760284008,-73.8828832397242,-73.882970590687,-73.8830709164281,-73.8832036033139,-73.8835401184932,-73.8836954242248,-73.883809410282,-73.8838384999311,-73.8838518269011,-73.8838774507143,-73.883899993125,-73.8839153677212,-73.883937916675,-73.8839646251961,-73.8837835397013,-73.8837773796317,-73.8837384573709,-73.8836903699654,-73.8836689308896,-73.8836802471624,-73.8837232666592,-73.8837744240954,-73.8837927904066,-73.8837845795789,-73.8839677470786,-73.8839894532263,-73.8850517233671,-73.8851457697334,-73.8852671450526,-73.8852726221398,-73.8853108705868,-73.8853654459887,-73.8853967640884,-73.8853803319732,-73.8853311688596,-73.8852834210594,-73.885257551695,-73.8852616650514,-73.8851551712667,-73.8852555367025,-73.8855997811227,-73.8857807388099,-73.8859142467253,-73.886008874247,-73.8860777124662,-73.8860997266448,-73.8861637705656,-73.8862757645438,-73.8864243555295,-73.8864869182356,-73.8867238924872,-73.8868487982526,-73.8870857353168,-73.8872709734712,-73.8873809562422,-73.8872473845833,-73.8873355263323,-73.8874023468318,-73.8875288602214,-73.8877112460045,-73.8876312953765,-73.8879589722395,-73.888592177064,-73.88876053714,-73.8888936421902,-73.8890644202607,-73.8891567419391,-73.8892741877571,-73.8893664037694,-73.8893378380542,-73.8892232300483,-73.8891979414091,-73.8892241609115,-73.8895563430164,-73.8895566450195,-73.8899743403498,-73.8899959817085,-73.8901475624386,-73.889374392537,-73.8895447802606,-73.8896587496353,-73.8897533298726,-73.8898134682587,-73.8898139834978,-73.8898504127416,-73.8898722925851,-73.8898990576227,-73.8899282336486,-73.8899608907001,-73.8899913911536,-73.8900593269243,-73.890135940812,-73.8902329568919,-73.8903359671524,-73.8903525976987,-73.8904366732254,-73.8905142258841,-73.8905821307971,-73.8907212261887,-73.8908635417718,-73.8910123432362,-73.8912711298405,-73.8914971718673,-73.8914990373008,-73.8914410427721,-73.891786181356,-73.8919792953427,-73.8924549463606,-73.8927064133067,-73.8927068106643,-73.8925317713942,-73.8922731584353,-73.8921636454764,-73.8918131200951,-73.8918097358281,-73.8916760418402,-73.8916869931252,-73.8915641760858,-73.8915600496647,-73.8914999793814,-73.8915075139587,-73.8913037299903,-73.8912985697377,-73.8912671062289,-73.8912840241392,-73.8913137691738,-73.891311187901,-73.8914648886088,-73.8915064566576,-73.8916956183466,-73.8917324099561,-73.8918661080939,-73.8918288899755,-73.8921973967156,-73.8923002032758,-73.8923373050778,-73.8923350700472,-73.8923980350901,-73.8924002723912,-73.8925666773841,-73.892748140374,-73.8928977090187,-73.8930465439451,-73.8931565417054,-73.8933051648915,-73.8933765511916,-73.8934542012682,-73.8935480465592,-73.8936224544214,-73.8937195431347,-73.8938360222724,-73.8939524809126,-73.8940365860741,-73.8941044950304,-73.8942209637423,-73.8945251014217,-73.8946286391834,-73.8946325235101,-73.8945739391342,-73.8947260190962,-73.8947767972104,-73.8948033737134,-73.8948536053588,-73.8947297052668,-73.8948429598363,-73.8949690952872,-73.8950983648732,-73.8952855056423,-73.8953726905782,-73.8954591186794,-73.8955063396857,-73.8954179487796,-73.8953922109978,-73.8953020614291,-73.8953118163586,-73.8952796287401,-73.8953119748753,-73.8953441670708,-73.8954054906103,-73.895466556982,-73.8955116391719,-73.8955910909182,-73.8957227377877,-73.8956991253092,-73.8956702513876,-73.8957479089886,-73.8958317488783,-73.895838380731,-73.8959779468775,-73.8959418417458,-73.8959355336319,-73.8958776634504,-73.8957906695808,-73.8958748159932,-73.8959488883551,-73.8960132058915,-73.8961082451788,-73.8962242411907,-73.8962070824305,-73.896195723522,-73.8961958530148,-73.8962304073702,-73.8962764250297,-73.896351184938,-73.8967868232375,-73.8970874830768,-73.8971143801433,-73.8971507949872,-73.8971738740818,-73.8972601499915,-73.8973129614691,-73.897386394392,-73.8974968195382,-73.8974758873537,-73.8974147269857,-73.8974859174092,-73.8975470659673,-73.8976381874115,-73.8977612664875,-73.8977506569325,-73.8977282725107,-73.8977994519539,-73.8978671583508,-73.8978736083506,-73.8980134089624,-73.8980030659638,-73.8979903705154,-73.8978712799066,-73.8979360029626,-73.898068037988,-73.898161107527,-73.8982208549524,-73.8982949488795,-73.898281719951,-73.8982730583684,-73.8982627548872,-73.8982576122462,-73.8982723922851,-73.8982746241178,-73.898244380815,-73.898193423798,-73.898116666876,-73.8981330076062,-73.8981275802739,-73.8981234882694,-73.8981208343316,-73.8981196850934,-73.8981200694086,-73.8981219776276,-73.8981253618396,-73.8981301370758,-73.8981752231325,-73.898189275444,-73.898190774742,-73.898228278324,-73.8982085961973,-73.8982455584078,-73.898277344047,-73.8982898837178,-73.898526565166,-73.8995895065898,-73.8997048984212,-73.8997376467702,-73.8997367485531,-73.8997359579793,-73.9000719306023,-73.9002655501904,-73.900525594862,-73.9007857843107,-73.9008408811077,-73.9009113159718,-73.9009729888154,-73.9012573411964,-73.9013065215338,-73.9015233141979,-73.9015309603218,-73.9018027093367,-73.9020495227796,-73.9020724544782,-73.9020939422966,-73.90212682831,-73.9021418446852,-73.9021521558646,-73.9021677804542,-73.902169118889,-73.9021691367931,-73.9021678338667,-73.9021802195705,-73.902206214732,-73.9022228476561,-73.9022462046635,-73.9028803445172,-73.9029392917129,-73.9029879543749,-73.9029976700565,-73.9030087791717,-73.903020180606,-73.9030296770311,-73.903075683378,-73.9030894659654,-73.9032427350223,-73.9034172037365,-73.9041803643575,-73.9044655147674,-73.9041833769559,-73.9038041229161,-73.9034699718379,-73.9030644378354,-73.9030098321429,-73.9025785907422,-73.9021074330696,-73.9018319525609,-73.9016631934329,-73.9016012124739,-73.9012927762711,-73.9008456123222,-73.9006114108083,-73.9002097407531,-73.9001666938695,-73.9000382996104,-73.899799199741,-73.8991214503617,-73.8989955585362,-73.8988623061277,-73.8988361737786,-73.8986771004262,-73.8986541737904,-73.8984743243382,-73.8984522996302,-73.8982046932798,-73.8979449776934,-73.8975695875859,-73.89639572974,-73.8954852276459,-73.8952915650016,-73.8951102086074,-73.8938545418665],"lat":[40.8273400367457,40.8267870360298,40.8267944502507,40.8267877841199,40.8268099922383,40.8268047342572,40.826803621043,40.8267993835699,40.8267975100074,40.8267685952441,40.8267431852966,40.8275033797394,40.827655777358,40.8277336349429,40.8277773147601,40.8278235750115,40.8278773035847,40.8279398906285,40.8280141509475,40.8281871577443,40.8282360541028,40.8282701539127,40.8282742924624,40.8268172835329,40.8253035364272,40.8252765033196,40.824956206335,40.8238142737016,40.8229513694985,40.822873801332,40.8228101429798,40.822718205268,40.8226422090826,40.8219334137713,40.8196888326195,40.819268322009,40.818235623128,40.8161826324441,40.8157115080992,40.8153864964866,40.8148787445003,40.8146452318617,40.8138881282341,40.8139743356059,40.8139218233413,40.8138509340016,40.8136736707672,40.813738021521,40.8136855133727,40.8136211686926,40.8135840546195,40.8133148905393,40.813254261976,40.8121461806095,40.8120873176225,40.8114582949917,40.811243380723,40.8067518328319,40.8059365489391,40.8041251058638,40.8018741488882,40.801914396207,40.8018052719205,40.8017518114465,40.8015473661162,40.8012901146328,40.8012706127963,40.8011901159483,40.8011671768106,40.800997839706,40.8008533027719,40.8009794228642,40.8012566376286,40.8013981525485,40.8014559875864,40.8010842230912,40.8013192903065,40.8016666440351,40.8016567155069,40.8017111151282,40.8020599068608,40.802194319345,40.8023680848793,40.8025516842475,40.8026468057683,40.8027027341923,40.802739114243,40.8027720805082,40.8027953268351,40.8027725191786,40.8027694908152,40.8027433187195,40.802743439121,40.8027434537642,40.8027600077112,40.8027601514077,40.8027242195509,40.8027210538031,40.8026679402866,40.8026328474792,40.8025874267094,40.8025585434274,40.8025358823215,40.8025297734462,40.8025112519869,40.8024947727618,40.8024813964506,40.8024473549758,40.802431914257,40.802421663907,40.8024077933889,40.8024041582823,40.8024028862876,40.8023721453342,40.802351534973,40.8023538474582,40.8023549999506,40.8023512120935,40.80226557239,40.8022521812844,40.8023356815629,40.8023257063234,40.8023062088512,40.8022891271833,40.8022842995422,40.8022598195804,40.802227997709,40.8021791746318,40.8021621236029,40.8021221957366,40.8021071844979,40.802095531658,40.8020753348686,40.8020613573485,40.8020489275725,40.8020310612954,40.8019651488623,40.8019290159247,40.80193989917,40.8019561937698,40.8019452558052,40.8019133454654,40.8018806901926,40.8018628439411,40.8018737849875,40.8019072480144,40.801919683824,40.8019574453552,40.8019038796612,40.8021309067981,40.8022595894873,40.802284394817,40.8022740289678,40.8022533267726,40.8022606397447,40.8023021530701,40.8023342852673,40.8023529026702,40.802342485539,40.802308236964,40.8022968339514,40.8022724535439,40.8024097810255,40.8025654973334,40.8026803921367,40.8027985174956,40.8029526567885,40.803054329695,40.8030853728713,40.8031756849769,40.8032642893685,40.8033451627559,40.8033792128325,40.8035302149824,40.8036352191167,40.8038091636803,40.8039470023367,40.8041106812839,40.8041861406168,40.8042931899106,40.8043743425894,40.8044017267404,40.8046147812202,40.8046713253759,40.8049979259207,40.8047892750978,40.804863178598,40.8049562274618,40.805021912402,40.8051280261683,40.805210337606,40.8053807802982,40.8055880368749,40.8056844209319,40.8058070996793,40.805845351192,40.8054316065188,40.8054312318875,40.8049131303831,40.8048862862502,40.8049606097867,40.8059252731153,40.8058070761928,40.8058477452696,40.8058754905862,40.8058773913577,40.8058773918501,40.8058571464444,40.8058313564649,40.8057852909278,40.8057484467444,40.8057147699175,40.8057042598731,40.8057043246813,40.8057146909475,40.8057369075283,40.8057666360139,40.805771435839,40.8057936387665,40.8058477929737,40.8058675228471,40.8058750287227,40.8058923713528,40.8058998860652,40.8059124218943,40.8059271989694,40.8059312382405,40.8056618990674,40.8056228920862,40.8063847089762,40.8063701066053,40.8063439899394,40.8063439485955,40.8056565515684,40.8057024331248,40.8053025925655,40.8051869554661,40.8051937849577,40.8051509531426,40.8051301101093,40.8050939399563,40.8050999805382,40.8050815880891,40.8050703110427,40.8050067883257,40.8050164982251,40.8050104894242,40.8049762818992,40.8049849383132,40.8049898214062,40.8050439869435,40.8050576930825,40.8051158434222,40.8050493634203,40.8050904874267,40.8051664720941,40.8052846879194,40.8056606056702,40.8056563701184,40.8056486794798,40.8056384889318,40.8056453248598,40.8056207100047,40.806340261302,40.8063269187964,40.8063147655121,40.8063124099211,40.806343998338,40.8062978645643,40.8062930200055,40.8062758988885,40.8062759675726,40.8062539341315,40.8062442087558,40.8062467735325,40.8062517672195,40.8062690374305,40.8062666855951,40.8062423825086,40.8062326449937,40.8062323324247,40.8060457730072,40.8060262465835,40.8062136337427,40.8062082228227,40.8062149081587,40.8057411014617,40.8057239970122,40.806231130494,40.8068636396762,40.8068427110714,40.8067035173349,40.8066030838895,40.8065953053037,40.8062677776883,40.8061768017772,40.8059014041617,40.8058694561573,40.805766184068,40.805768671035,40.8058694855306,40.8059604937492,40.8062162000154,40.8063489830049,40.8065813433475,40.8065596573083,40.8064450216897,40.806290130457,40.8062803680102,40.8064549743025,40.8065406075719,40.8065176158396,40.8063911611804,40.8062879114681,40.8060567905951,40.8058305592091,40.8058085115824,40.8060224404519,40.806268316156,40.8064961509513,40.8064770418423,40.8064158453391,40.8063240635267,40.8062410313226,40.8062104719022,40.8062061425932,40.8062105805546,40.806159258515,40.8061238376568,40.806110865929,40.8060933036286,40.8060452536476,40.8060409598473,40.8060815272947,40.8062246171367,40.8062144007051,40.8059992268215,40.8058000594781,40.8057878325167,40.8059943737508,40.8062013208389,40.8061899335016,40.8061371293254,40.8059674941373,40.8059626409115,40.8061126496745,40.8061795394924,40.8061666038593,40.8060906475138,40.8059308536481,40.8055349817596,40.8055202900289,40.8059137157085,40.8061380700999,40.8061199911542,40.8060975706984,40.8060509618393,40.8059173349156,40.8058909384904,40.8058712844663,40.8058696133827,40.805859509754,40.8058263592231,40.8058111555852,40.8057555065654,40.8056993787552,40.8056932828304,40.8056866120298,40.8056795338398,40.8056722259747,40.8056648719157,40.8056576563035,40.8056507603029,40.8056443570539,40.8056342907847,40.8056241982674,40.8056107257393,40.805571275436,40.805552914428,40.805539472704,40.8055427214199,40.8055440038298,40.805434309098,40.8052284028106,40.8052154185672,40.8051945119811,40.8051826759072,40.8051722672382,40.8051011350889,40.8050608889075,40.8050068348814,40.8049174894485,40.8049136459222,40.804899332354,40.8048760978912,40.8048818818477,40.8048744302424,40.8048415829281,40.8048401737072,40.804790086916,40.8047841405216,40.8047906435654,40.8047995498295,40.8048253095659,40.8048489099751,40.8048725057185,40.8049186568202,40.8049263698785,40.8049341496873,40.8049418662554,40.8049538283208,40.8049503432438,40.8049481131901,40.8050715024554,40.8087447930574,40.8090627010545,40.8093643005338,40.80945558286,40.8095500727788,40.8096234285296,40.8097021211851,40.809768986807,40.8098563992003,40.8107128845324,40.8115068828557,40.8121248200648,40.8122819599137,40.8130864554802,40.8141318427975,40.8150757884839,40.816106761023,40.8163177924573,40.8173697944309,40.8185051921006,40.8191533645607,40.8195504268544,40.819694858758,40.8204754421116,40.8215414176145,40.8221088079296,40.823071014629,40.8231741321428,40.823481696233,40.8240579415116,40.8256969191896,40.8259886509688,40.8262974361398,40.8263579934982,40.8267436963077,40.8267992863288,40.827235359173,40.8272887612399,40.8278891099849,40.8285217482647,40.8294230008309,40.8287628795207,40.828248541385,40.8281423498679,40.828036899455,40.8273400367457]}]],[[{"lng":[-73.83979488496,-73.8396739409273,-73.8396148723846,-73.8396149179071,-73.8396988664225,-73.8396865942083,-73.8395995556964,-73.8395964940748,-73.8396679876182,-73.8396649487313,-73.8395779273512,-73.8395779671898,-73.839664999928,-73.8396527163925,-73.8395687744623,-73.8395563892316,-73.8396372233397,-73.8396311164964,-73.8395471917215,-73.839544124431,-73.8396156120838,-73.8396033299458,-73.8395349260577,-73.8395318581117,-73.8396189069858,-73.8396065964076,-73.83951955832,-73.839513371203,-73.8396035347986,-73.8395850130332,-73.8395104064142,-73.8395073334473,-73.8395943764546,-73.8395758674236,-73.8394981515543,-73.8394981857193,-73.8394577753271,-73.8394578379758,-73.8395013454108,-73.8395013852709,-73.8395666684003,-73.8395574707152,-73.8394828813758,-73.8394829098492,-73.8395513077088,-73.8395483074206,-73.8394768138819,-73.8394613266912,-73.8396198628735,-73.8396199311504,-73.8394769391686,-73.8394738662222,-73.8396137738248,-73.8396014164854,-73.8394708559249,-73.8394646743323,-73.8396045647495,-73.8395953097228,-73.8394647426752,-73.8394431652959,-73.8394151905752,-73.8394122031088,-73.8394868100439,-73.8394837412623,-73.8395926675504,-73.8395802778292,-73.8395308516807,-73.8395688615534,-73.8395910845229,-73.8397599111196,-73.8397835872567,-73.8399204847868,-73.8401815169901,-73.8407422912492,-73.8411267526218,-73.8418172591211,-73.8422133466469,-73.842345274926,-73.8425311171007,-73.8426274568154,-73.8427588429378,-73.8427032485432,-73.842937312376,-73.8430525629734,-73.8430940865235,-73.843099509596,-73.8430211629787,-73.8430534532797,-73.8431069159991,-73.8430361270815,-73.8430339454239,-73.8429948413687,-73.8429459840538,-73.8429154807419,-73.8428952750772,-73.8428745081251,-73.8427613143411,-73.8427218778583,-73.8426699883598,-73.842650274871,-73.8426010368027,-73.8425650833819,-73.8425393448818,-73.8425332573094,-73.842481984427,-73.8424632238886,-73.8423171248032,-73.8420762064724,-73.842027270661,-73.8417046629585,-73.8417545761596,-73.8413820617807,-73.8413610674426,-73.8412739263343,-73.8412025073201,-73.8410740038714,-73.8410237668876,-73.8410063788096,-73.8408682194575,-73.840581564588,-73.8404497031631,-73.8404204444651,-73.8404323489576,-73.8404660352615,-73.8404176540198,-73.8401278555698,-73.840112537299,-73.8400175299584,-73.8400265601272,-73.8399595945986,-73.8399872601915,-73.8399234512599,-73.8398292624169,-73.8398370318464,-73.8399088667522,-73.8398581371862,-73.8398814293241,-73.839984600832,-73.8399940339281,-73.8400515092335,-73.8400535103905,-73.8401006913586,-73.8400605997814,-73.8399673052874,-73.839998604073,-73.8401462573308,-73.8402460596579,-73.840289119449,-73.8402315549765,-73.8402806697419,-73.8402850625364,-73.8403652852561,-73.8405234084931,-73.8406188149607,-73.8407033953127,-73.8408134495695,-73.8408435226979,-73.8409185621533,-73.8410445465455,-73.8411757421449,-73.8412496637642,-73.841289746031,-73.8413111172788,-73.841349263555,-73.8414247519927,-73.8415670372551,-73.841703301698,-73.8418844180047,-73.8419241389583,-73.8419490890731,-73.8419868483405,-73.8421258581763,-73.8421373384481,-73.8420936631185,-73.842375344205,-73.8427987581109,-73.8428921645095,-73.8430637903374,-73.8430430176385,-73.8431528346121,-73.8431699276372,-73.8434477697222,-73.8435800143382,-73.8437405300036,-73.8437722678201,-73.8440068651957,-73.844110201558,-73.8441839942784,-73.8441792071287,-73.8443873689674,-73.8445179136856,-73.8446412872602,-73.8447574149078,-73.8448662262433,-73.8449613212074,-73.8450499073548,-73.8451319377281,-73.8452073688511,-73.8452801923656,-73.8453684280164,-73.8454653867592,-73.8457656170223,-73.845854121851,-73.8459116691661,-73.8460260036607,-73.8461730287205,-73.8468887120835,-73.8471968450965,-73.8474677216827,-73.8475828339988,-73.847630992988,-73.8477025662252,-73.8482148651571,-73.8487628685534,-73.8493855614798,-73.8500504981515,-73.8502048669623,-73.8504106682,-73.8505247054515,-73.8506024620396,-73.8515932500799,-73.8517920051125,-73.8519812557734,-73.8521883239583,-73.8524370767289,-73.8523905801646,-73.8522495647087,-73.8522583224928,-73.8524345347244,-73.8525312722851,-73.8526193275169,-73.852800042436,-73.8529450576772,-73.8530132828713,-73.8528946349658,-73.8528420870741,-73.8526549604506,-73.8526727838091,-73.8526465127709,-73.8526730689271,-73.8526181519095,-73.8526579920883,-73.8529796270479,-73.8529510574378,-73.8529687081025,-73.8529513161469,-73.8528809058543,-73.852913985456,-73.8529799523565,-73.8533685786882,-73.8537435802723,-73.8543465558497,-73.8548423540992,-73.8549550400127,-73.8551469531533,-73.8553151178983,-73.8553803024369,-73.8553196589575,-73.8550486013369,-73.8547100821091,-73.854430755966,-73.8541126873481,-73.8538501105715,-73.8534677405863,-73.8533525874502,-73.8532390092186,-73.8531276469797,-73.8530191293157,-73.8529140687554,-73.8528479304539,-73.8527836405627,-73.8527482834068,-73.852710001515,-73.8526613338688,-73.8526101467633,-73.8525573943493,-73.8525165212839,-73.8524757539389,-73.8520635741306,-73.8519141729744,-73.8517135355406,-73.8514812422842,-73.8513635762557,-73.8511999772519,-73.851048397499,-73.8508949358727,-73.8507281130148,-73.8505666835552,-73.8504108775591,-73.8503492346868,-73.850284181508,-73.8502160577005,-73.8501452189738,-73.8500978330527,-73.8499795406617,-73.8498651685291,-73.8497552011789,-73.8496501044711,-73.849550323628,-73.8494562813482,-73.8493683760152,-73.8492869800105,-73.8492124381357,-73.8491450661521,-73.8490851494433,-73.8490329418068,-73.849038228774,-73.8490453605222,-73.8490630185004,-73.8490824094239,-73.8491105161404,-73.8491403753151,-73.8491701942888,-73.8492088394631,-73.8492404353332,-73.8492789600583,-73.8493420151683,-73.8493735898031,-73.8493842025582,-73.8493755953606,-73.8492971166623,-73.8492482752339,-73.8492134682294,-73.8491908876784,-73.8491735842485,-73.8491946982757,-73.8492490511082,-73.8493033806389,-73.849357681327,-73.8494189871434,-73.8494541199775,-73.8494787747934,-73.8494999003759,-73.8495297741913,-73.8495770633073,-73.8496435606484,-73.8497135592384,-73.8497696046884,-73.8497980452202,-73.8498099933728,-73.8498118967199,-73.8498348557813,-73.8498717157423,-73.8499089230631,-73.8497670510375,-73.8497601163408,-73.8497863390853,-73.8497915545344,-73.8498876786974,-73.8498842169862,-73.8499193870184,-73.8500201232454,-73.8498483393259,-73.8498466251808,-73.8500300110965,-73.8500424161291,-73.85004422604,-73.8500425537318,-73.8500234018868,-73.8500053510722,-73.8499955485299,-73.8499799383494,-73.849974779336,-73.8499696276366,-73.8499673290538,-73.8497477887842,-73.8497286535864,-73.849957494652,-73.8499511693801,-73.8495559567937,-73.8495507693494,-73.8499535560638,-73.8499597566972,-73.8499703010127,-73.8499721137099,-73.849966968027,-73.849942606318,-73.8499077311547,-73.8498809326432,-73.8499001913423,-73.8498666326907,-73.8497898980027,-73.8497594494487,-73.8497545288021,-73.8497441013597,-73.849731915087,-73.8497022702831,-73.8496813524957,-73.8496499390142,-73.8496116642039,-73.8491657211891,-73.8491709398646,-73.8487600774598,-73.8487096247923,-73.8491274880784,-73.849132699398,-73.8495221825685,-73.8494543115231,-73.8494450336026,-73.8493883850838,-73.8492762555412,-73.8491025592305,-73.8489555708316,-73.8487773786149,-73.8486479587444,-73.8485242676746,-73.8484164096165,-73.8483677654779,-73.8483289188505,-73.848280240183,-73.848349370762,-73.8483987979702,-73.8483795372141,-73.8482816345226,-73.8481149914892,-73.8479863058122,-73.8478500379095,-73.8476342069126,-73.847536219756,-73.8475170625152,-73.8474882264191,-73.8475277690616,-73.8476680516586,-73.8479029865274,-73.8480762459938,-73.8482536483152,-73.8484027288337,-73.8485554046479,-73.8486051818876,-73.8486478460621,-73.8487009796496,-73.8487028953815,-73.848704238784,-73.8487431721286,-73.848799921247,-73.8488355148197,-73.84883560644,-73.8488356250031,-73.848871151834,-73.8489066358098,-73.84894604006,-73.8489810966713,-73.8490307194203,-73.8490837991527,-73.8491052157553,-73.8491191059702,-73.8491651039055,-73.849214665784,-73.8493338230794,-73.8493178894178,-73.8494103633772,-73.8494285272771,-73.8495267218233,-73.8496118055207,-73.8497075610163,-73.8498210718385,-73.8499772270918,-73.8500627973219,-73.850084200019,-73.8501129120303,-73.8501215075184,-73.8501343653171,-73.8501486756431,-73.8501983903642,-73.8503356010146,-73.850362470885,-73.850649546161,-73.8509207057749,-73.8511855292595,-73.8512633899898,-73.8513241118027,-73.8514753723051,-73.8517780752275,-73.8520492259949,-73.8523456539033,-73.8525737562284,-73.8539934914496,-73.8540712042706,-73.8541247337556,-73.8542184149609,-73.8543508748237,-73.8546011424812,-73.8547998636912,-73.8550354272501,-73.8551605815095,-73.8551760519167,-73.8553887931119,-73.8556095879817,-73.8558544633539,-73.8560516293124,-73.8562460630447,-73.8564376149585,-73.8566261376771,-73.8566181343632,-73.8565778014845,-73.856496920485,-73.856397852059,-73.856268079978,-73.8561662030984,-73.856045593117,-73.8559294272059,-73.855808407844,-73.8556904709838,-73.8556138973806,-73.8555635843382,-73.8555787713098,-73.8555847936042,-73.8556049703973,-73.8557207270875,-73.8558983570519,-73.8560511716755,-73.8561254256331,-73.8563001122441,-73.8563859829374,-73.8565160409679,-73.8565236192694,-73.8566385427424,-73.8567579265952,-73.8568775395574,-73.8569486517885,-73.8570444330499,-73.8571214561418,-73.8572024052575,-73.8572449198857,-73.8572196386465,-73.8571279376042,-73.8570030245838,-73.8569262312978,-73.8568251493471,-73.8567529717633,-73.8566757965839,-73.8566748824054,-73.8567271583775,-73.8568342102445,-73.857924029087,-73.8581270569977,-73.8582813740184,-73.8584231767867,-73.8585566485381,-73.8587360635664,-73.8588903750238,-73.8589112120127,-73.8589117725049,-73.8588720650435,-73.8588264323911,-73.8587828442472,-73.8587472261362,-73.8587056115777,-73.8586660234084,-73.8586224721031,-73.8585729449642,-73.8585432556536,-73.8585056003916,-73.858481714815,-73.8584558076315,-73.8584438535961,-73.8584120914246,-73.8583624971698,-73.8583148770697,-73.8583148161362,-73.8583127496203,-73.8583463635422,-73.8583819693826,-73.8583858315419,-73.8583995957086,-73.8583975292331,-73.8583934779532,-73.8583933657708,-73.8583933144869,-73.8584190832342,-73.8584609189064,-73.858503117029,-73.8585123017872,-73.8585053317683,-73.8585102165134,-73.8585170417449,-73.858561489017,-73.8586119190109,-73.8586717643724,-73.8587475960582,-73.8588094637394,-73.8588890885491,-73.8589347172643,-73.8589919507005,-73.8590192625443,-73.8590503937845,-73.859065314354,-73.8590847585267,-73.8590920931198,-73.8590834407817,-73.859057165769,-73.8590470459352,-73.8590026327842,-73.8589743130598,-73.8589580820172,-73.8589277553267,-73.8588974286872,-73.8588570663359,-73.8588529763358,-73.8588770940308,-73.8589092914103,-73.8589314132523,-73.8589723200796,-73.8590082399906,-73.8591273340373,-73.8591954502448,-73.8592593902281,-73.8593105781951,-73.8593660233232,-73.8593663120556,-73.8593666242334,-73.8593840557894,-73.8594099178215,-73.8593974999662,-73.859401919202,-73.8593765635751,-73.8593129537783,-73.8592577527608,-73.8592575982146,-73.8592530904908,-73.8592273765277,-73.8592229055704,-73.8592226524774,-73.8592054959474,-73.8591586814882,-73.8590822548802,-73.8589804571145,-73.8588277974303,-73.8586650516919,-73.8585724249463,-73.858418327096,-73.8583899622881,-73.8586193056997,-73.8587745265453,-73.8589514122178,-73.8590006650952,-73.8590049367417,-73.8590333612196,-73.8590766256642,-73.8591520952384,-73.8593197656454,-73.8594716149286,-73.8595480961051,-73.8596661655864,-73.8598315249328,-73.8601269523558,-73.8601182635032,-73.8600804911734,-73.8600352991341,-73.8600317284643,-73.8600088165894,-73.8599598469343,-73.8599271534919,-73.8599234115955,-73.8598712321972,-73.8597783920461,-73.8597466904334,-73.8597192807567,-73.8597235542751,-73.8596707296177,-73.8596760694148,-73.8596253738816,-73.8595405986248,-73.8594739316422,-73.8594064325493,-73.8593389430534,-73.8593332977337,-73.8593291926488,-73.8593267299824,-73.8593259710346,-73.8593269346965,-73.85932959698,-73.859333891615,-73.8593569326948,-73.8593836727589,-73.8594138974704,-73.859381679263,-73.859355782334,-73.8593362415701,-73.8593230832854,-73.8593163251867,-73.8593192704232,-73.8593238377998,-73.8593299149968,-73.8593373525653,-73.8593459676029,-73.8593555482515,-73.8593658589071,-73.859371893224,-73.859378031772,-73.8593898201083,-73.8594014790834,-73.8594126798378,-73.8594231064368,-73.8594324647817,-73.8594404909056,-73.8594469584185,-73.8594750716286,-73.8595121799863,-73.8595582049871,-73.8596130492471,-73.8596540386574,-73.8597027334092,-73.8597589085073,-73.8598223043861,-73.8598926281085,-73.8599695547198,-73.8600527287487,-73.8601417658498,-73.8602362545796,-73.8603357582984,-73.8604398171872,-73.8605479503733,-73.860659658153,-73.8607744243003,-73.8608917184534,-73.8622860458276,-73.8626468066483,-73.8644033337952,-73.8676564628447,-73.8686889096087,-73.8697695585004,-73.8707780488594,-73.8712942159998,-73.8717160645012,-73.8765199603363,-73.8766345996371,-73.8780628326213,-73.8809802965942,-73.8824477955298,-73.8826592292403,-73.8837878612648,-73.8842497175018,-73.8842948821121,-73.8843321238172,-73.8843612859193,-73.884385041061,-73.8846445070049,-73.8846216586827,-73.884613360104,-73.8846093892466,-73.8843870535373,-73.8837841413457,-73.8839006990514,-73.8847896027465,-73.885026388461,-73.8854150101017,-73.885566158875,-73.8856920052475,-73.8857942629586,-73.8857804210568,-73.8857319592302,-73.8856280064155,-73.8855923603726,-73.8854678426463,-73.8853473929309,-73.8853368300031,-73.8853367000831,-73.8852801048696,-73.8852752842485,-73.8852419928355,-73.8852326819139,-73.8852282126335,-73.8852251664197,-73.8852230297459,-73.8852208952329,-73.8852190454723,-73.8852165959349,-73.8852147649757,-73.88521355038,-73.8852123256275,-73.8852107117646,-73.8852100300607,-73.8852099719983,-73.8852092884129,-73.8852086796872,-73.8852058424259,-73.8852036424639,-73.8851587849656,-73.8851241284434,-73.8845210008481,-73.8842706020193,-73.8840194346347,-73.883999123243,-73.8838089879107,-73.8835825579804,-73.8832246055431,-73.8830124553659,-73.8820240958018,-73.8820129137923,-73.8819990936337,-73.8819358895712,-73.8818171701888,-73.8818025299803,-73.8816551223218,-73.8815321581044,-73.8813335607295,-73.8812102103995,-73.8810388009345,-73.880742078211,-73.8807208158036,-73.8806788959028,-73.8805595352094,-73.8802673783566,-73.8801734789894,-73.8800914409518,-73.8799463075401,-73.8796518235077,-73.8793523626357,-73.8789939591054,-73.8786303201969,-73.8782622180322,-73.877890467801,-73.8775158530005,-73.8772276255229,-73.8769435147923,-73.8761514288291,-73.8750783721069,-73.8742583325403,-73.8738929586438,-73.8738369655606,-73.8737730880609,-73.8737582282926,-73.8736176059599,-73.8735905326388,-73.8735176630578,-73.8733483430233,-73.8733274669736,-73.8731760392855,-73.8731471467484,-73.8731272815869,-73.8729804293913,-73.8727720465853,-73.8727271842559,-73.8712060585942,-73.8703478696004,-73.8702763856525,-73.8701817822227,-73.8700652511302,-73.8695586208914,-73.8692076681603,-73.868740735508,-73.8683084692482,-73.8678225811518,-73.8674020711092,-73.8672481888945,-73.866361307901,-73.8654645019086,-73.8644801171779,-73.8643692214372,-73.8636393815755,-73.8635801404726,-73.8634723231289,-73.8617616650535,-73.8616283336918,-73.8604562735985,-73.8601849194853,-73.859724523661,-73.8591959368475,-73.8583566909684,-73.8575394249403,-73.8571924801879,-73.856184021551,-73.8555357982924,-73.8551967533145,-73.8542074576561,-73.853497466347,-73.8533352494205,-73.8532680414721,-73.8530946020703,-73.8530351029675,-73.852920440308,-73.8528699785798,-73.8526648047364,-73.8524793893949,-73.852331486691,-73.8522072094839,-73.852070059308,-73.8518586876834,-73.8516845974783,-73.8501653592554,-73.8495589063688,-73.8484861534022,-73.8454272320661,-73.8442277329463,-73.8432267235367,-73.8421823657989,-73.8400027641618,-73.83979488496],"lat":[40.8356192074919,40.8356012091667,40.8356105688684,40.8355916852755,40.8355752799166,40.8355091734125,40.8355184942249,40.8354996074832,40.835492625982,40.8354642979479,40.8354665368521,40.8354500148388,40.8354430539473,40.8353816689229,40.835395714345,40.835376813962,40.8353627642277,40.8353179103598,40.8353248738743,40.8353083475379,40.8353037266438,40.8352423404418,40.8352564074474,40.8352398811096,40.8352258400347,40.8351762555342,40.8351855762867,40.835173765936,40.8351573692941,40.8351054162397,40.8351147537728,40.8351005883448,40.835088907193,40.8350322326534,40.8350415663563,40.8350274042467,40.8350320683311,40.835006105692,40.8350061662456,40.8349896430584,40.8349802932322,40.8349283536441,40.8349306097697,40.8349188080673,40.8349071014992,40.8348622514425,40.8348692321993,40.834847968244,40.8348293056552,40.8348009819374,40.8348173050767,40.8348031398146,40.8347773698905,40.8347466684768,40.8347630100695,40.8347488386373,40.8347301512871,40.8347018146024,40.8347205149193,40.8346473151852,40.8346496361505,40.8346000651075,40.8345907288109,40.8345742007935,40.8345604756456,40.8344917235808,40.8343689182358,40.834230491945,40.8340416880906,40.8337178974949,40.8336672430954,40.8333207947995,40.8330434254738,40.8326007790162,40.8322869827392,40.8317261936547,40.8315505072772,40.8313004485228,40.8311204882084,40.8310001205188,40.8308184841429,40.8307450266699,40.8301214016875,40.8301015670816,40.8300209700228,40.8299600117952,40.8299615871206,40.8297620900394,40.8297941393199,40.8293069823434,40.8289349849401,40.8288274667015,40.8287029156992,40.8286224686762,40.8285691766244,40.8285275718086,40.8283277245031,40.8282756209145,40.8280400532971,40.8279089858429,40.8278057303519,40.827739260717,40.8275998377753,40.8275273041485,40.8274775716966,40.8273749605172,40.8271846846803,40.8265377353675,40.8265474477451,40.8257673819871,40.8257554203967,40.825147433399,40.8250850334991,40.8249089978554,40.824816858085,40.8245261134276,40.8243411658737,40.8242410271096,40.8241535072083,40.8235948361563,40.8233455664967,40.8232685250566,40.8231130437951,40.8230800235838,40.8229980294567,40.8224214270147,40.822299406219,40.822190242623,40.822067732913,40.8219998602399,40.8219219325542,40.8217395384415,40.8215715014961,40.8214313311079,40.8211547985954,40.8210099819193,40.8208968675144,40.8207947763627,40.8206825610678,40.8206144454143,40.8205120799626,40.8203227617277,40.8202300717399,40.820179082004,40.8199349473157,40.819819249055,40.8198260235228,40.8198077045539,40.8197355307711,40.8196784975575,40.8196262661264,40.8195777500243,40.8195387972248,40.8195495007785,40.8194776229621,40.8194446911904,40.8193550433897,40.8193421249209,40.8192301695992,40.8191830818138,40.819161015082,40.81915650957,40.8191361440375,40.8191229741488,40.8190418808288,40.8189404322117,40.8189042122473,40.8188500181042,40.8188323729219,40.8188049478319,40.8187743739082,40.8184582219133,40.8182590337787,40.8180595429516,40.8174898470806,40.8169370086494,40.8167304539289,40.8165586450268,40.8163773195514,40.8162734279655,40.8160510550134,40.8156980652578,40.8154683465973,40.815321699542,40.8151390707769,40.8147061226307,40.8145135766466,40.8143309923702,40.814186670559,40.8136451308272,40.8134251528926,40.8132027988456,40.8129782035971,40.8127515034169,40.812537680056,40.8123222490033,40.8121053246078,40.8118870220096,40.8117781167457,40.8117514383606,40.8117649676643,40.811582278842,40.8114294715344,40.8113301124461,40.8110237144216,40.8106766644305,40.8105213251784,40.8105804876142,40.8109039428543,40.8112817497529,40.8113517412714,40.811455764866,40.8124629089958,40.8129046861196,40.8132368653451,40.81348902434,40.8135342955192,40.8135840243911,40.8138303153466,40.8139301995395,40.8143043867503,40.8143001745273,40.8143405619206,40.8142889736524,40.8143026744951,40.8144213759092,40.8144713771398,40.814493132564,40.8144565592526,40.8145169006093,40.8145220305653,40.8144402994715,40.8145726276565,40.8145844236236,40.8144755472776,40.8143433370836,40.8143380795575,40.814242758337,40.814175817748,40.8141139613618,40.8140586921232,40.8139633995449,40.8138734844954,40.8138500306209,40.8138333256224,40.8137329415704,40.813714452174,40.8136894037016,40.8136738221008,40.8135939031363,40.813645833154,40.8138638579141,40.8140915180124,40.8141934171709,40.814368994799,40.8144121416873,40.8142888820827,40.8141615671502,40.814073189623,40.8138444014154,40.8137179190698,40.8136351468258,40.81357141221,40.8134777111061,40.8134903601797,40.8135095419874,40.8135351482582,40.8135670344586,40.8136050206081,40.8136326572108,40.813662706288,40.8136836463741,40.8137013710889,40.8137179541341,40.8137293461068,40.8137353346552,40.8137361935097,40.8137338019072,40.8137260606634,40.8136720579228,40.8136467440486,40.813590682107,40.8135500616971,40.8135531443762,40.8134918808384,40.8134333844029,40.8133272228133,40.8132163527069,40.8131009321114,40.8130633579445,40.813029263913,40.8129988280378,40.8129722092388,40.8129570027328,40.8129141444474,40.8128655303095,40.812811366271,40.812751881795,40.8126873288839,40.8126179810112,40.8125441319634,40.8124660945946,40.8123841995011,40.8122987936211,40.8122102387641,40.8121189100786,40.8120487162525,40.8119863242913,40.8119053582321,40.8118310339467,40.8117660129934,40.8116983402307,40.8116492552858,40.8115603503489,40.8114979903652,40.8114621929455,40.8113972187877,40.8113441523431,40.8112870747676,40.8112299737573,40.8111608308863,40.811122263471,40.8110598166448,40.8110000415715,40.8109243407841,40.8108606391246,40.8107797205129,40.8107094244241,40.8106524051143,40.8105874274487,40.810506484135,40.8104215445629,40.8103525329918,40.810278221125,40.8102304861637,40.8101880867715,40.8101430366365,40.8100860182303,40.8100328778851,40.8099984438153,40.8099294059674,40.8098218936515,40.8097489182566,40.8096601220894,40.8096691200087,40.8096452132205,40.8096399363505,40.8096518920214,40.8096440509126,40.809629442261,40.8096266659269,40.8092540395301,40.8092669363033,40.809252328753,40.8092351033237,40.8092154084877,40.8091875293482,40.8091543346394,40.809123772964,40.8090936343777,40.809077268519,40.8090254672838,40.8089882854678,40.808948448392,40.8088755124545,40.808913639652,40.8088751116388,40.8088300684251,40.8087147201722,40.8087447720354,40.8087208675109,40.8086934060764,40.8086762590991,40.8086497186248,40.8086205121882,40.8085780193462,40.8085328462248,40.8085009360907,40.8084762524287,40.8084096553816,40.8083370097606,40.8083073408306,40.8082693366699,40.8082498032241,40.8082245627351,40.8082046316634,40.8081780394907,40.8081554417608,40.8081381408778,40.8081241850512,40.8082251359362,40.808235764343,40.8083374577931,40.8082404704191,40.808133474599,40.8081467587698,40.8080552772177,40.8080236801959,40.8079492074627,40.8078775328363,40.8078316761258,40.807769287459,40.8077089838619,40.8076358782767,40.8075435102826,40.8074638187384,40.8073687757954,40.8072180514946,40.8070315049757,40.8068524050477,40.8066734596246,40.8065243277843,40.8063601863346,40.8062406997106,40.8061285826756,40.8061030506237,40.8060760142664,40.8060085904115,40.8059264027952,40.8057175020065,40.8054489091492,40.8053296047885,40.8051664492274,40.8050021793973,40.8049196411492,40.8049010069712,40.8048580768281,40.8047935880726,40.8047424417443,40.8046993714804,40.8047317862773,40.8048329083652,40.8048584729292,40.8048962596861,40.8048990294405,40.804845167928,40.8048048250227,40.8047966511692,40.8047724392976,40.8047670951924,40.8047621689947,40.8047806704795,40.8047969068273,40.8048535798278,40.8048977518614,40.804926401397,40.8049776732991,40.8050208644196,40.8050512182618,40.8046614657032,40.8046679762756,40.8050598281406,40.8050643984452,40.8050860726131,40.8050942829143,40.8050944308435,40.8050595949819,40.8048656385372,40.8047793315494,40.8046635506727,40.8046333281164,40.8045881072299,40.804534218813,40.804510024974,40.8045158435904,40.8045125639903,40.8044775171354,40.8044778681173,40.8044925861016,40.804530376686,40.8045598499491,40.8045983783255,40.804593976712,40.8045991162411,40.8045803292648,40.8045508887043,40.8044619131591,40.8044574624195,40.8044656683629,40.8044800286681,40.8045137652515,40.8045476503301,40.8045478195503,40.8045200549142,40.8044977900193,40.8044955281008,40.8044644272943,40.8044702050732,40.8045146461396,40.8045874295842,40.8046643402967,40.8047453191075,40.8048303037174,40.8048655711638,40.8049328514398,40.8049490132688,40.8049468357134,40.8048829935714,40.804830528366,40.8047740631394,40.804724869734,40.8046791575071,40.8046765655756,40.804703583773,40.8047849963324,40.80488219624,40.8049720217752,40.8050621570349,40.8051221041797,40.8051690602815,40.8052477602477,40.8052816812508,40.8052819314656,40.8052587039266,40.805241220476,40.80523993226,40.805263893425,40.8052733108133,40.805293592521,40.8052746147744,40.805295185031,40.8053304751588,40.8053258693481,40.8053072381161,40.8052387175942,40.8051854945613,40.8051399188192,40.8051154937251,40.8050696288985,40.8050379034914,40.8049953703208,40.8049519107047,40.8049440303138,40.8049092707154,40.8053910342372,40.8054665200493,40.805558732297,40.8056445832924,40.8057209034501,40.8057941068374,40.8058894906752,40.805912755735,40.805954126024,40.8059796891298,40.8059931927225,40.8059780734878,40.8059448850504,40.8059342883612,40.8059026012489,40.8058709099328,40.8058512633453,40.8058271222636,40.8058195427928,40.8058632041353,40.8059249417748,40.805952046195,40.8059700856388,40.8059820772959,40.8059985915148,40.806027216754,40.8060663847177,40.8061101171883,40.8061493314365,40.8061975468293,40.8062518000872,40.8062909692237,40.806331641133,40.806384370961,40.8064084762214,40.8064115216439,40.8064080427635,40.8064242697624,40.8064893617722,40.8065440139063,40.8065924747981,40.8066378837572,40.8066677300838,40.8066975135378,40.8066968749382,40.8066975810178,40.8066984362985,40.8066884903381,40.8066743586659,40.8066403951684,40.8066067502077,40.8065639677424,40.8065077147118,40.8064802181635,40.8064452708843,40.8064089782718,40.8063661745357,40.8063432370526,40.8062928076731,40.8062362360639,40.8061827077526,40.8061291988783,40.8060756889905,40.8060359639903,40.8060084299519,40.8059885086034,40.8059808155667,40.8059685456415,40.8059660672379,40.8060058829243,40.8061571817032,40.8062698778297,40.8064115816123,40.8065404124272,40.8066756832078,40.8068013585423,40.8069367031033,40.807139694813,40.8073201203072,40.8074522576481,40.8075295913373,40.8075682951727,40.8075716017341,40.8075426730078,40.8074750004846,40.807358998426,40.8072430237453,40.8071431320895,40.8070335695139,40.8069498069017,40.8068789746492,40.8068404068221,40.8068340968232,40.8068407443276,40.8068327514956,40.807314677973,40.8081120406316,40.8082588091488,40.8088468360739,40.8092339751356,40.8102714175866,40.8101976370984,40.8101047091221,40.810046091276,40.8099755581021,40.8099507698811,40.8099414625434,40.8099051142652,40.8098182502048,40.8098065647232,40.8097334773083,40.8096054998913,40.8095699615285,40.8095590833717,40.8095139348612,40.8094903215916,40.8094874765082,40.8094813973669,40.8094411885536,40.8094021534093,40.8093848833591,40.8092867574119,40.8092778819164,40.8092392856982,40.8092184023976,40.8091982538972,40.8091725522075,40.8091459780156,40.8090197024464,40.8090111990559,40.8090083964088,40.8090113294538,40.8090042280858,40.8089965404632,40.8089884579468,40.8089801817269,40.8089719178158,40.8089638719189,40.8089562443149,40.8089240355945,40.8088935217636,40.8088649474021,40.8087345851511,40.8086034119761,40.8084716047744,40.8083393412973,40.8082067999102,40.808198739901,40.8081911288513,40.8081841539296,40.8081779866606,40.8081727787076,40.8081686581428,40.8081657262977,40.8081646266597,40.8081639362338,40.8081637687324,40.8081651026023,40.8081679002197,40.8081720826732,40.8081775319904,40.8081840944647,40.8081915849913,40.8083406558843,40.8084885863622,40.8086350632338,40.8087797763837,40.8088670096549,40.8089519254399,40.8090341313331,40.8091132474497,40.8091889081822,40.8092607638896,40.8093284825134,40.8093917511126,40.8094502773096,40.8095037906416,40.8095520438111,40.8095948138282,40.8096319030419,40.8096631400531,40.809688380507,40.8099459112274,40.8100125400154,40.8102759864376,40.8105837619372,40.8118542724566,40.8134236997572,40.8144868954878,40.8147295360379,40.8149223354902,40.8161310634242,40.8157115080992,40.8161826324441,40.818235623128,40.819268322009,40.8196888326195,40.8219334137713,40.8226422090826,40.822718205268,40.8228101429798,40.822873801332,40.8229513694985,40.8238142737016,40.824956206335,40.8252765033196,40.8253035364272,40.8268172835329,40.8282742924624,40.8282701539127,40.8282360541028,40.8281871577443,40.8280141509475,40.8279398906285,40.8278773035847,40.8278235750115,40.8279143713239,40.8282121805301,40.8288509914984,40.8290700377422,40.8301119039421,40.8305648576803,40.8305982647274,40.8305986571073,40.8307705028734,40.8307831605576,40.8308706311554,40.8308950733779,40.8309068262766,40.8309148389398,40.8309204354699,40.8309260578009,40.8309309026006,40.8309373342621,40.8309421472509,40.8309453469256,40.8309485531237,40.8309528129963,40.8309545865659,40.8309547473312,40.8309563331044,40.8309577376909,40.8309642904212,40.8309693675631,40.8310729617076,40.831161082577,40.832254826651,40.8325963606578,40.8328814511171,40.8329057427893,40.8331150395822,40.8333782763501,40.8337997594966,40.8340534602036,40.8353357992776,40.8353637032037,40.8353944221834,40.8354621249856,40.8356437967682,40.8356742925784,40.8359463439712,40.8361867753265,40.8365670213302,40.836784354721,40.8370624578241,40.8374864279544,40.837521265023,40.8375051288087,40.8374591795866,40.8373442991535,40.8373105844355,40.8372811268627,40.8372262776342,40.8371260264319,40.8370349162458,40.8369329018055,40.8368412003844,40.8367600295246,40.8366895689627,40.8366299545205,40.8365831822738,40.8365608443931,40.8364985748949,40.8364230989704,40.8363790022439,40.8363634124156,40.8363611180845,40.8363587514383,40.8363981947851,40.8368187789932,40.8368965251878,40.8371144281902,40.8375920085582,40.8376519493322,40.838165830893,40.8382638989732,40.838335096416,40.8389524851857,40.8397512823361,40.8397489448,40.8396746224424,40.8396255665228,40.8396214788075,40.8396180754978,40.8396138826638,40.8395956534619,40.8396000467111,40.8398245766416,40.8399952139561,40.8401664990161,40.8402902760565,40.8403438043703,40.840592685023,40.8408568919647,40.8410877973869,40.8411090181287,40.8412652747639,40.8412779566327,40.8413059327065,40.8415127206042,40.8415278596844,40.8416616659383,40.8416890901825,40.841744019969,40.8418040334786,40.8418992866161,40.8419893968736,40.8420276484458,40.8421459172477,40.8422194899931,40.8422579925553,40.842370739177,40.8424516676459,40.8424701551548,40.8420726882375,40.8410469607221,40.8407354577473,40.8401215059892,40.8398513043708,40.8387800833759,40.8377842871409,40.837010527112,40.8363474952993,40.8356253025498,40.8347777470676,40.8342010523503,40.8343554874818,40.8344088709594,40.8345244953327,40.8349364829275,40.8350927078166,40.8352304476122,40.8353741424097,40.8356616669108,40.8356192074919]}]],[[{"lng":[-73.9213375241934,-73.9211359470915,-73.9210331764514,-73.9208389871311,-73.9205787811659,-73.9203547989368,-73.9203146552123,-73.9192378576436,-73.9191457374825,-73.9190656028214,-73.9189949684349,-73.9189872445786,-73.9189107610063,-73.9179799205819,-73.9179027981095,-73.916629852478,-73.9163985291404,-73.9154547096642,-73.9144382723331,-73.9138042827681,-73.9137838537059,-73.9145920846777,-73.9151413442617,-73.9153569891036,-73.9155211784629,-73.9163057468168,-73.9161708792398,-73.9168654058495,-73.9170792352836,-73.9171062231295,-73.9178407192205,-73.9181233087113,-73.9184333846567,-73.9185629977499,-73.9185900136679,-73.9185087695909,-73.921892481289,-73.9219953927308,-73.922190980573,-73.9224351211493,-73.9228520328015,-73.9230647313939,-73.9240114578265,-73.9240136473876,-73.9240620882918,-73.9241211399679,-73.9242362187588,-73.9242475490167,-73.924310779587,-73.9244805228042,-73.9246732967182,-73.9248839477171,-73.9250608790882,-73.9251402151916,-73.9251535184034,-73.925241953081,-73.92538939088,-73.9257180867853,-73.9271375406857,-73.9273242257486,-73.9275441076857,-73.9276039547454,-73.9276965061652,-73.9277874649514,-73.9281011898734,-73.9284926956136,-73.9291735279066,-73.9303098812945,-73.9306381969117,-73.9310535280784,-73.9326708061044,-73.9350234513451,-73.9354056628427,-73.9358129979866,-73.9359822600659,-73.93607064617,-73.9360533274152,-73.936002712407,-73.9359182384006,-73.9357934534883,-73.9357638481296,-73.935712659977,-73.93312843469,-73.9326960608632,-73.9324014551364,-73.9322407328491,-73.9321052895736,-73.9314759532981,-73.9308417873928,-73.9307294050381,-73.9297844300836,-73.9297240078186,-73.9296661054263,-73.9287194892678,-73.9285945984799,-73.9280727357571,-73.9273732689822,-73.9269225825708,-73.9268082369468,-73.9266671434606,-73.9264183404304,-73.9262543144867,-73.926104101867,-73.9260623804895,-73.9260655786846,-73.9260858770584,-73.9260891150301,-73.9260446989647,-73.926047936891,-73.9260866061662,-73.9261123376661,-73.9261529337365,-73.9261596044981,-73.9261594224978,-73.9262716852483,-73.9264418232361,-73.9265472974237,-73.9265676633997,-73.926513121857,-73.9262782642522,-73.9261455569655,-73.9259276308138,-73.9257642622022,-73.9256355690744,-73.9255872987962,-73.9255804117409,-73.9256075602625,-73.9261693977945,-73.926428059502,-73.926628984231,-73.926666623693,-73.9267379884692,-73.9267007459007,-73.9266395461271,-73.9265782480936,-73.9265067877858,-73.9263674257349,-73.9263303226732,-73.9263445156768,-73.9264265433789,-73.9264880303096,-73.9265658481599,-73.9267027226223,-73.9267388558823,-73.9268287456523,-73.9269445611787,-73.9270195067962,-73.9271148772652,-73.9271659966795,-73.9272409427353,-73.9273158785868,-73.9273806159024,-73.9274385682008,-73.92751010805,-73.9275612056603,-73.9276531907831,-73.927784099285,-73.9278688924114,-73.92789328731,-73.9279020271949,-73.9279105356631,-73.927893744986,-73.9276598280625,-73.9275783022955,-73.927320657086,-73.9272766442425,-73.9272328605244,-73.9271356372808,-73.927801414724,-73.9280005357249,-73.9282672029621,-73.9283377317929,-73.9283429113744,-73.9283421270905,-73.9283353831694,-73.9283227160924,-73.9282953104294,-73.9282652092128,-73.9273533214668,-73.9272605730301,-73.9272437665862,-73.9270978282146,-73.9270512285462,-73.9270115864135,-73.9269790933577,-73.926953906384,-73.9269361472018,-73.9269259016367,-73.9269232192152,-73.9269049272832,-73.9268906696192,-73.9268896782797,-73.9269519235601,-73.927038456716,-73.9271180694481,-73.9271851477837,-73.9273548544178,-73.9273469225273,-73.9276712262087,-73.9277069412712,-73.9273826362456,-73.9273667566067,-73.9272029970421,-73.927216892572,-73.927277202689,-73.9274392218532,-73.927475886035,-73.9272629329128,-73.9269199561588,-73.9269010544435,-73.9268826175436,-73.9268541017267,-73.9268060764352,-73.926695726295,-73.9272477078928,-73.9271146423064,-73.9270669662849,-73.9271693302249,-73.9266656548039,-73.9265535165366,-73.92674263893,-73.9267368395309,-73.9267252621683,-73.9267209116897,-73.9265384639004,-73.9265025027553,-73.9266847062115,-73.9265524180843,-73.9268452842961,-73.9268316274075,-73.9268690867946,-73.9269953130313,-73.9270464029791,-73.92688606022,-73.926509548673,-73.9258804633777,-73.9258249463873,-73.9257755181175,-73.925698261787,-73.9254929349305,-73.9252752102012,-73.9243604410757,-73.922633785949,-73.9221553889881,-73.9219109222957,-73.9213375241934],"lat":[40.8008521069996,40.800475459594,40.8002652818581,40.8000125980067,40.7996681489629,40.7994228528632,40.79937545929,40.7988810676829,40.798838987346,40.7988027973194,40.7987718427019,40.7987697122199,40.7987401378657,40.7983802019275,40.7983626532315,40.7978581394371,40.797684842039,40.797063466031,40.7956655178639,40.7945118464559,40.7938362854821,40.7927766019591,40.7920124824924,40.7918430495077,40.7917832502494,40.7911174803343,40.7910142933738,40.7903620629616,40.7904566742225,40.7904686167368,40.7901713199375,40.7900402399343,40.7898039643367,40.7896953338259,40.7894741039087,40.7894250897694,40.7857032696432,40.78575607781,40.7855106715738,40.784782837565,40.7835556934177,40.7833428847743,40.7826606898251,40.7826576439826,40.7825902784521,40.7825230740108,40.7824969150867,40.7824943391266,40.7824559565543,40.7823204906459,40.7822448605036,40.7822225827736,40.7822162939729,40.7822437675957,40.7822483748079,40.7822740488486,40.7822741443989,40.7821765579446,40.7811942691262,40.7810906293243,40.7810506348991,40.781039748349,40.781014785533,40.7809898588352,40.7809203200422,40.7810083534809,40.7814105785422,40.7820773357907,40.782261413049,40.7823965940692,40.7826936396248,40.7830063820289,40.7833944992681,40.783710081035,40.7839423681064,40.7842172156203,40.7845123681536,40.7846753713101,40.7848068799635,40.7852547813041,40.7854460392927,40.7856804894926,40.7887101794855,40.7891782236649,40.7897202906728,40.7896948492349,40.7898339521078,40.790479159258,40.7909914300016,40.7909551144309,40.7913414752266,40.7913661788456,40.791355786453,40.7909435325125,40.7909669243039,40.7908233907805,40.7908108253347,40.7907886935067,40.7907644398684,40.7907345137873,40.7906933758846,40.790694533017,40.7907316071174,40.7908278485147,40.7909365177573,40.7910038085359,40.7910917804053,40.7911771108265,40.7912650821921,40.7913536766938,40.7914126270235,40.7915472095544,40.7916196610713,40.7917153889947,40.7917569084184,40.7917959045645,40.7918270651617,40.7918581347818,40.7918968847633,40.7918785186037,40.7918473254036,40.7918755473895,40.7918572572634,40.791822158203,40.791820830907,40.7918544665083,40.7918959074664,40.7918992232049,40.7919564905445,40.7919463977503,40.7919401906083,40.7919284232944,40.7918326216568,40.7917911349967,40.7917936441892,40.7917728496547,40.7916613888376,40.7915034760539,40.7912472891195,40.7911102344215,40.7910223243008,40.7909795017132,40.7909681592702,40.7909741206745,40.7909889521535,40.7909993820255,40.7909994295056,40.7910150244606,40.7909969334045,40.7909969807409,40.7910073844259,40.7909970688294,40.7909608572457,40.7909609022626,40.7909635238249,40.7909584027292,40.7909416036542,40.7909548381319,40.7909788461784,40.7910098188341,40.7910391465825,40.791091111421,40.7913483340281,40.7914604747392,40.7917431604596,40.7917673270093,40.7917913683781,40.7919293066032,40.7919974792624,40.7921336409069,40.7923285234456,40.7928565492747,40.7929180580741,40.7929796898269,40.7930411109853,40.7931019891402,40.7931611687547,40.7932128750663,40.79446189461,40.7947298332911,40.7947791762289,40.795103604961,40.7951784925291,40.795255659259,40.795334732347,40.795415329778,40.7954970621713,40.7955795346616,40.7956623488063,40.7959838515361,40.7962345242222,40.7962520113602,40.7967084322844,40.7969887959176,40.7972038612356,40.7973498967803,40.7973165807863,40.7972939021205,40.7972170142663,40.7972986633796,40.7973770630779,40.7973468203448,40.7973867477994,40.7974154334978,40.7974074531486,40.797710538216,40.798122899665,40.7989186451221,40.7998375904774,40.7998882368496,40.7999407685033,40.7999875590461,40.8000359005377,40.8001469776551,40.800392957369,40.8005637562296,40.8005430121258,40.8004058536962,40.8001827140358,40.8003151729215,40.8004034989728,40.8004114714819,40.8004073388229,40.8004142109436,40.800333898308,40.800374917307,40.8004547572559,40.8006048255949,40.8007396467128,40.8007655290147,40.8007836767993,40.8006361761043,40.8006517430313,40.8008406483689,40.8006570315246,40.8015517419262,40.8016424897783,40.8017306009963,40.8018108713506,40.8019561686507,40.8019985227434,40.801985553419,40.8018687381411,40.8016264699749,40.8015026662536,40.8008521069996]}],[{"lng":[-73.9338058988187,-73.9338290088461,-73.9339460882535,-73.9339460993372,-73.9339417014619,-73.9339490585752,-73.9339505415139,-73.9339417347039,-73.9339417502117,-73.9339520565795,-73.9339535373093,-73.9339344570958,-73.9339462322761,-73.9339389227626,-73.9339492125554,-73.9339462843471,-73.933956590909,-73.9339485311269,-73.9339485543914,-73.9339485843049,-73.933953020921,-73.9339545215819,-73.9339442637826,-73.9339487028314,-73.9339472531391,-73.9339634453099,-73.9339678830253,-73.9339635051224,-73.9339694135805,-73.9339856595785,-73.9339893693093,-73.9339820368583,-73.9339835275384,-73.9339747351948,-73.933982106614,-73.9339733264724,-73.9339909751146,-73.9339777641613,-73.9339895420226,-73.9339954393642,-73.933980756566,-73.9339822483401,-73.9339852396395,-73.93397645066,-73.9339662095034,-73.9339912197835,-73.9340147672698,-73.9338565263882,-73.933862309728,-73.9338639144928,-73.933865102619,-73.933869278467,-73.9338723254896,-73.9339298460019,-73.9339817898682,-73.9340077020494,-73.9340384391788,-73.9340930669192,-73.9341371141607,-73.9341955874917,-73.934282278014,-73.9343041739804,-73.934314405073,-73.9343408097147,-73.9343386458474,-73.9342139101698,-73.9341963919577,-73.9341353262406,-73.934120734843,-73.9335611931148,-73.9333285236184,-73.9332590953999,-73.9331839563982,-73.9331741353949,-73.9330847174971,-73.9329328832929,-73.9326308826758,-73.9323901711915,-73.9315441743434,-73.9314960425862,-73.9314754959243,-73.931467071884,-73.9314489142783,-73.9314319858802,-73.93140904211,-73.9313909010211,-73.9313051152024,-73.9312694724058,-73.9311594998733,-73.9311268875933,-73.931114089247,-73.9310979084438,-73.9310737538932,-73.9310339009393,-73.9310278774159,-73.9309765453237,-73.9309753529652,-73.9309584321078,-73.9309342915886,-73.9309093651686,-73.9308280132428,-73.9308062811451,-73.9307163031651,-73.9307102870262,-73.9306957752588,-73.9306873327641,-73.9306390281701,-73.9306317956095,-73.9306100410067,-73.9305726120896,-73.9305726375719,-73.9305424330677,-73.93044280213,-73.9304053696452,-73.9303534505283,-73.9303329206556,-73.9303087645877,-73.9302786056748,-73.9302617139496,-73.9301917546035,-73.9301832945256,-73.9300602069385,-73.9300126130297,-73.9299737361859,-73.9299786217695,-73.93004460905,-73.9300093109045,-73.9299828842777,-73.9299100860984,-73.9298894808297,-73.9297866800015,-73.9296925121459,-73.9295769383951,-73.9295204392848,-73.929453663335,-73.9294365411877,-73.9293543599857,-73.9293312697181,-73.9293022039684,-73.9292748768804,-73.9292081759596,-73.9291183881423,-73.9290349024031,-73.9290267140667,-73.9290212358464,-73.9290164464204,-73.929007881206,-73.9289999486633,-73.9289861876299,-73.9289534865756,-73.9289376366859,-73.9289015234417,-73.9289194251578,-73.9289439694696,-73.9289712100229,-73.9290364017963,-73.9290546102875,-73.9292793674117,-73.929307732758,-73.9295305805691,-73.9296829425113,-73.9297459469162,-73.9298748577821,-73.9298424475345,-73.9298514439533,-73.9298095534999,-73.9298325404253,-73.9298874065192,-73.929901397884,-73.929916361206,-73.9299373533455,-73.929920395011,-73.9300688103554,-73.9301077102815,-73.930196643929,-73.9304198047997,-73.9311140804534,-73.9314275855796,-73.9316582110575,-73.931792925203,-73.9318750017174,-73.9320100145719,-73.9320788602176,-73.9323512886908,-73.9325092094968,-73.932538526549,-73.932672391309,-73.9328771265509,-73.9331068320781,-73.9332458739464,-73.9332713202113,-73.9334848964465,-73.9337279050359,-73.933887852657,-73.9340699772657,-73.934272217146,-73.9343403278663,-73.9345104254863,-73.9347388158446,-73.9350540605796,-73.9351076449163,-73.9351718245162,-73.935268097784,-73.9352650078894,-73.9351903929617,-73.9354676208841,-73.9355389669594,-73.9358310678891,-73.9360239182378,-73.9363201087061,-73.9366930221003,-73.9370616874706,-73.9370530457888,-73.937081043823,-73.9370724626218,-73.9370147968674,-73.9361407331412,-73.936128362353,-73.9361268927969,-73.9362185986991,-73.9362275129535,-73.9362430332505,-73.937149654611,-73.937228901673,-73.9373978860931,-73.9374167567744,-73.9375498916258,-73.9376348291229,-73.9376866938538,-73.9376956302226,-73.9377412217619,-73.9377736325512,-73.9378172269291,-73.9379476897699,-73.9379459085127,-73.9379593077519,-73.9379718180139,-73.9381157008973,-73.9381335619299,-73.9381942962532,-73.9382451995141,-73.9385393733166,-73.9392664264451,-73.9398261969646,-73.9398345399792,-73.9398428239091,-73.9398526760338,-73.9398804556066,-73.9398885206175,-73.9399100328247,-73.9399297439946,-73.9399548367934,-73.9399897801899,-73.9400130838673,-73.9400247325254,-73.9400498270758,-73.9400641572908,-73.9401143432387,-73.9401494727626,-73.9401851293105,-73.940202301813,-73.9402247528415,-73.9402379576831,-73.9402670099552,-73.9403620935133,-73.9404532074849,-73.9405337719822,-73.9405509380776,-73.940581302009,-73.9405905496837,-73.9406235705766,-73.9406737440216,-73.9407173267632,-73.9407212836151,-73.9407490172053,-73.9407675082594,-73.940788680061,-73.9408308814259,-73.9410249973189,-73.9410857371065,-73.9411108283886,-73.941137236131,-73.9411728885478,-73.9414461201894,-73.9415257681018,-73.9416745419575,-73.9418544859221,-73.9420143175309,-73.9421791859556,-73.9423138887432,-73.9423912852097,-73.9424345113706,-73.9424697044477,-73.9425722552488,-73.9426044272357,-73.9426737981828,-73.9427813753336,-73.9428678379267,-73.9429352053114,-73.9430166313694,-73.943115162113,-73.943161419105,-73.9432056553694,-73.9432398573975,-73.9432700303567,-73.9433102738203,-73.9433474936639,-73.9433967907729,-73.9434410552642,-73.9435514383947,-73.9435442071252,-73.9435697971989,-73.9436320172783,-73.9437600534063,-73.943832566099,-73.9438932460593,-73.9439546016314,-73.9440543944633,-73.9446466599195,-73.9447226452693,-73.9459218599374,-73.946444972832,-73.9470895191672,-73.9478434603698,-73.9487762622345,-73.9493317062711,-73.9503380413039,-73.9509281278826,-73.9512967085309,-73.9522294753702,-73.9524643016674,-73.9525514546904,-73.9526613672815,-73.9534164669039,-73.953713450606,-73.9541647699251,-73.9557773591232,-73.9552823348086,-73.9551041694841,-73.9548172381665,-73.954399191913,-73.9538948958825,-73.9538891708097,-73.9534368386116,-73.9531604499487,-73.9530982760681,-73.9529774055357,-73.9525222263876,-73.9520712707866,-73.9516026543104,-73.9511110237241,-73.9506288547574,-73.9501582122699,-73.9496868299651,-73.9494228781563,-73.949233270825,-73.9490651785891,-73.9487870281116,-73.9483112545438,-73.9482064153801,-73.9481538432484,-73.9481010902656,-73.9480513020299,-73.9478467911888,-73.9478166305282,-73.9477571646885,-73.9477105597932,-73.9474199623519,-73.9473759984473,-73.9473277151459,-73.9472801829742,-73.9469736680703,-73.9464613385203,-73.9459678974937,-73.945508639182,-73.9450512798452,-73.9447597648013,-73.9445991529627,-73.9447092611273,-73.9456183646418,-73.9461313104867,-73.9456926125162,-73.9452396521392,-73.9447820817178,-73.9443019458712,-73.9437747678022,-73.943157703856,-73.9428555022079,-73.9427536722819,-73.94226311155,-73.9417714017003,-73.9413174236948,-73.940860631756,-73.940403449022,-73.9399487597705,-73.9394939753992,-73.939017533146,-73.9387439450372,-73.9386375332666,-73.9383874852984,-73.9383092504302,-73.9382064268832,-73.9381355240751,-73.937617149518,-73.9371439842421,-73.9370816369499,-73.9366885488281,-73.9362095781427,-73.936135543971,-73.9360507657812,-73.9359937141727,-73.9357554821078,-73.9348734383498,-73.9346379027272,-73.9344540007277,-73.9342351954951,-73.9341281676116,-73.9340746397773,-73.9340091796638,-73.9339200430821,-73.9338001947305,-73.9337933462578,-73.9337899739921,-73.9338058988187],"lat":[40.8165124932471,40.8155853601875,40.8155876247392,40.8155764575647,40.8155652989209,40.8155563695585,40.81554298001,40.8155318089564,40.815516185466,40.8154972182193,40.8154860523891,40.815471534509,40.8154425179763,40.8154157242806,40.8154012232267,40.8153900548706,40.8153722041738,40.8153482020114,40.8153247614981,40.8152946216848,40.8152667268783,40.8152354720267,40.8152053258169,40.8151751979104,40.8151550979958,40.8151294430236,40.8151004229545,40.815069164065,40.8150390271146,40.8149475104223,40.814912357031,40.8148956127812,40.8148743974964,40.8148487282133,40.8148252930784,40.8147873318603,40.8147750681166,40.8147583111192,40.8147382276562,40.8147192578789,40.8147047425219,40.8146824205703,40.814629959141,40.8146009308253,40.8145652112515,40.8145283864341,40.8144837526248,40.8144814744192,40.8142492963205,40.8141927372835,40.8141531579557,40.8141011748166,40.8140632642607,40.8133476906338,40.8128146355453,40.8126084986973,40.812340880071,40.8119684025308,40.8117123709245,40.8113931776929,40.8108230505087,40.8104816661152,40.8103222649113,40.8099275827496,40.8095622138314,40.8090591737927,40.8090318515825,40.8087363905142,40.8086564519774,40.8076006773867,40.807318946463,40.8072372452067,40.8071561977971,40.8071453909499,40.8070269147021,40.8068710221339,40.8065529339069,40.8062991409686,40.8053977833267,40.8053511537067,40.8053280929381,40.805305969303,40.8052976457617,40.8052819578906,40.8052469138115,40.8052330696601,40.8051316064599,40.8050905537125,40.8049669402625,40.8049226779973,40.8049043505129,40.8048811775295,40.8048470510283,40.8047944822144,40.8047824945593,40.804715632512,40.8047054993978,40.8046870452911,40.8046529187679,40.8046193935175,40.8045099668058,40.8044740078063,40.8043554973326,40.804340744668,40.8043259880687,40.8043103127254,40.8042457529605,40.8042300795136,40.8042070156815,40.8041526042161,40.8041433918763,40.8041074183405,40.8039741500994,40.8039206656575,40.8038478047433,40.8038192136144,40.8037860153681,40.8037343792257,40.8037057941369,40.8035831651904,40.8035739472084,40.8033616481605,40.8032874984288,40.8031964679741,40.803190245385,40.8031061117708,40.8030401351573,40.8029847524943,40.80286455125,40.8028303574591,40.8026607487175,40.802440285948,40.8021800252157,40.8020534796156,40.801907368836,40.8018617118574,40.8016712504379,40.8015988539909,40.801495801349,40.8013731902327,40.8011475206113,40.8011130032264,40.8010809038519,40.8009698603143,40.8008955725617,40.8008307155421,40.8007723491254,40.8007100976928,40.8006021231194,40.8003093684847,40.8001708437777,40.7998552146627,40.7994581864915,40.7989115889355,40.7982588610823,40.7967625941013,40.7966944338674,40.7958531395207,40.7958102579556,40.7955077983493,40.7952962337631,40.7952087482341,40.7950351567284,40.7950150378559,40.7950014004286,40.7949831662967,40.7949490611408,40.794967292604,40.7949468243625,40.7949491121371,40.7949187862845,40.7949096723301,40.7947008286055,40.7947129910637,40.7945932243523,40.7944708723486,40.7940965013439,40.7939279883829,40.7938017404392,40.7937279617911,40.7936819218437,40.7936054861699,40.7935665088339,40.7934138451513,40.7933319015446,40.7933166821354,40.7932482327729,40.7931302513679,40.7929953282095,40.7929142960292,40.7928994633517,40.7927741713326,40.7926014783711,40.7924894770171,40.7923582937729,40.7922173157979,40.7921679680546,40.7920512946465,40.7919007687052,40.7916862313585,40.7916488886998,40.7916047395675,40.7915280258004,40.7915257634812,40.7914711601291,40.7912636520575,40.7913186936598,40.7910947048703,40.790829128126,40.7904259576486,40.7899130491591,40.7894135902135,40.7894064167575,40.78936639571,40.7893458423888,40.7893212811849,40.7889490734105,40.7889385300597,40.7889268679854,40.7888004980769,40.7887956129499,40.7887957741521,40.7891684490595,40.7889963080371,40.7886217198435,40.7885797615163,40.7882837445289,40.7880942448148,40.787973560579,40.7879572935205,40.7878539043509,40.7877833580626,40.7876884686809,40.7874772994293,40.7874691587553,40.78745627993,40.7874318733825,40.7871847627564,40.7871657903985,40.7870973302998,40.7870410681081,40.7867107770001,40.7858887530671,40.7852565524155,40.7852539723591,40.785251410364,40.7852439316502,40.7852323755102,40.7852235273471,40.785211966758,40.7852017655313,40.7851895227945,40.7851704777928,40.7851568738064,40.7851534764258,40.7851385142315,40.7851310296201,40.7851038246447,40.7850872553795,40.7850662020607,40.7850591871403,40.785045151291,40.7850371346841,40.7850221014535,40.7849719840823,40.7849228730835,40.7848787716059,40.7848667415936,40.7848537087093,40.7848466891421,40.7848296504117,40.7848035979267,40.7847805410671,40.7847805431024,40.7847675182022,40.7847574951213,40.7847474487887,40.7847274245564,40.7846352224864,40.7846091665167,40.7845971486805,40.7845831140043,40.7845660769625,40.7844314738516,40.7843909009699,40.784313830632,40.7842207466774,40.7841375848975,40.7840513633949,40.7839811657665,40.7839407261827,40.7839178303224,40.7838964609471,40.7838247241554,40.7838018309308,40.7837537431472,40.7836781900966,40.7836186558026,40.7835721060897,40.7835148654585,40.7834461706297,40.7834118304948,40.7833698429877,40.7833278516944,40.7832881546768,40.7832331809464,40.7831820329985,40.7831095028464,40.7830491821281,40.7829035084884,40.7828805238227,40.7829230780709,40.7829623236854,40.7828289317175,40.782859089475,40.7828877273326,40.7829155196513,40.7829643580463,40.7832178738028,40.7832475726415,40.7837527983547,40.7839731785782,40.7842449057949,40.7845637555659,40.7849582359268,40.7851931260554,40.7856171500132,40.7858653801727,40.7860200748652,40.7864115502316,40.7865104314209,40.7865485806622,40.786595020127,40.7869125711392,40.7870375855268,40.7872275635765,40.7879139244711,40.7885844554883,40.7888220717528,40.7892047443701,40.7897749086677,40.7904626909915,40.7904704985544,40.7910851413718,40.7914668813839,40.7915527529126,40.7917196931681,40.7923476222252,40.7929811719834,40.7936078056141,40.7942850353219,40.7949595913764,40.7955877315044,40.7962169853809,40.7966063841608,40.7968719999055,40.7971004941062,40.7974828390052,40.7981292175668,40.7982728510984,40.7983448765784,40.7984171483815,40.7984853598543,40.7987655427009,40.798806862972,40.7988883320409,40.7989521806135,40.7993502952957,40.799410524218,40.7994766714787,40.7995417892866,40.7999617029103,40.8006653058823,40.8013423951725,40.8019702312397,40.8025985987175,40.8030030414928,40.8032250478403,40.8032719273995,40.8036589775521,40.8038773575842,40.8045149486583,40.8051360144618,40.805761256464,40.8063908245811,40.8061705933247,40.8059128052393,40.8057865544534,40.8057440127946,40.8064157377451,40.8070890003497,40.8077133463811,40.8083342675993,40.8089580956456,40.8095814180327,40.8102088095336,40.8108565568745,40.8112308205668,40.8113763885697,40.8117184435789,40.8118254640113,40.811967604798,40.8120656192324,40.8127403643289,40.8134210414446,40.8135061410526,40.8140416302207,40.8146738499206,40.8147881271423,40.8149080151166,40.8149886935705,40.8153255842971,40.8165278475177,40.8169080484752,40.8171885285585,40.8175548812153,40.8177339630165,40.8178265139486,40.8179438380677,40.8181159933882,40.818349758874,40.8177766085798,40.8171513737017,40.8165124932471]}]],[[{"lng":[-73.9012927762711,-73.9016012124739,-73.9016631934329,-73.9018319525609,-73.9021074330696,-73.9025785907422,-73.9030098321429,-73.9030644378354,-73.9034699718379,-73.9038041229161,-73.9041833769559,-73.9044655147674,-73.9041803643575,-73.9034172037365,-73.9032427350223,-73.9030894659654,-73.903075683378,-73.9030296770311,-73.903020180606,-73.9030087791717,-73.9029976700565,-73.9029879543749,-73.9029392917129,-73.9028803445172,-73.9022462046635,-73.9022228476561,-73.9022341089328,-73.9022392341545,-73.9022382244946,-73.9022299342292,-73.9022117865037,-73.9022045520365,-73.9021918570056,-73.9021937275346,-73.9022265330585,-73.9022557275125,-73.9023195673461,-73.9023169760326,-73.9023032033442,-73.9022904880229,-73.9022923199277,-73.9024453913696,-73.9025229838462,-73.9027559359522,-73.9029277033109,-73.9028776056683,-73.9027127821122,-73.9027097310255,-73.9029046938851,-73.9030596673371,-73.9029731194502,-73.9030028317108,-73.9030860984648,-73.9032126892875,-73.9032556388145,-73.9033386519545,-73.9033172735504,-73.9033387705515,-73.9033563378776,-73.9033990155695,-73.9035515843465,-73.9035658381192,-73.9036355537641,-73.9036826593201,-73.9037328451555,-73.9037420133561,-73.9036653925337,-73.9036899794644,-73.9037659945388,-73.9037717752447,-73.9037994505479,-73.9038220037218,-73.9038599171088,-73.9038926971336,-73.9039273277045,-73.9038508436899,-73.9038723608316,-73.903948424406,-73.9039674817378,-73.904002323964,-73.9040705530348,-73.904016809718,-73.9040977498001,-73.9041489890094,-73.904378656104,-73.9044588404635,-73.9044808862398,-73.9044998381816,-73.9045295409573,-73.9045500408996,-73.9045756670949,-73.9046248768796,-73.9046720382826,-73.9047693111723,-73.9047986455895,-73.9048521129967,-73.9049535897656,-73.9050009800524,-73.9050301424152,-73.9050449870867,-73.9050575284657,-73.9050666697697,-73.905084916864,-73.9051140880859,-73.9051578087387,-73.9051869582197,-73.9052452798711,-73.9053123397463,-73.9053910705998,-73.9054384459595,-73.9054639558901,-73.9054912854607,-73.9055058837329,-73.9055215317456,-73.905760515838,-73.906014278218,-73.9060633650224,-73.9062038675775,-73.9065204221317,-73.9063897688755,-73.9064517112552,-73.9065858783388,-73.9067289367694,-73.9068140168889,-73.9067500914721,-73.9067013004487,-73.9067685009218,-73.9067687302411,-73.907178727963,-73.9072629877427,-73.907342721018,-73.9073937417649,-73.9074338420675,-73.907452628743,-73.907470305029,-73.90749762914,-73.9075265803846,-73.9075395149187,-73.9075704598699,-73.9076086725146,-73.9076305269052,-73.9076414651683,-73.9076433135435,-73.9077580810817,-73.9079001980398,-73.9079366355669,-73.907958477433,-73.907991215599,-73.9080203235559,-73.908073973218,-73.9080277046477,-73.907951305919,-73.9078712757074,-73.9077930755954,-73.9077348873292,-73.9076585299467,-73.9076822280089,-73.9077895070678,-73.9078495142615,-73.9079331778411,-73.9079950174484,-73.9080514070637,-73.9081020996817,-73.9081679482041,-73.9081315246987,-73.9079607647614,-73.9080263327671,-73.9081681408637,-73.9082517706627,-73.9083208691768,-73.9084219076801,-73.9084755612857,-73.9085502667626,-73.908488461634,-73.9083775607034,-73.9082903119433,-73.9082557956647,-73.9082551373358,-73.9082431077393,-73.908241332662,-73.9083030360829,-73.9091565966024,-73.9096390002743,-73.9096733476855,-73.9096745559145,-73.909740778549,-73.9097938851773,-73.9098460776918,-73.9099108288177,-73.9099464428086,-73.909965891454,-73.9100436925218,-73.9101343870527,-73.9103254478974,-73.9104679045932,-73.9106070955225,-73.9107139207357,-73.9107916849905,-73.9108922226534,-73.9109050128445,-73.9109567966998,-73.9109859346481,-73.9110506933465,-73.9110982748191,-73.9112675550274,-73.9114164396819,-73.9114941337445,-73.9116228586628,-73.9116883117506,-73.9117465332404,-73.9117885727928,-73.9118209199051,-73.9118856123664,-73.9119599884195,-73.9120343822892,-73.9120861291178,-73.912147005357,-73.9121540245585,-73.9122380852687,-73.9123448190134,-73.9126682602597,-73.9130078609773,-73.9131760491004,-73.9134477454447,-73.9137225597358,-73.9151276744479,-73.9161694719892,-73.9188039407059,-73.9188909266373,-73.9189558170617,-73.9190497876381,-73.9191238027018,-73.9202406815888,-73.9204406698039,-73.9207813392432,-73.9209564533052,-73.9213273077851,-73.9216882697391,-73.9220376596916,-73.9225961100029,-73.9229271006578,-73.9235869911203,-73.9242270684122,-73.9266579478849,-73.9270035946511,-73.9276278865885,-73.9275083495037,-73.927312484243,-73.9274368990251,-73.927282719436,-73.9276450035258,-73.9279317402624,-73.9281095963548,-73.9282059174836,-73.9283405618559,-73.9287260748988,-73.9300545889053,-73.9303195005869,-73.9305364505973,-73.9305175883918,-73.931162681293,-73.9317647687617,-73.9318105081344,-73.9318456449309,-73.9318871009773,-73.9319195675757,-73.9322826191665,-73.9325270878598,-73.9326425718146,-73.9326209528879,-73.9325943464726,-73.932822887607,-73.9328325056735,-73.9328639708333,-73.9328741200196,-73.9327868808537,-73.9326908976692,-73.9326792189946,-73.9325650330207,-73.9326168465716,-73.9326322925525,-73.9324770179711,-73.9324311938161,-73.932428399467,-73.9324263200191,-73.9324230759501,-73.9324176727652,-73.9323756888468,-73.9323424553048,-73.9323324171359,-73.9323656418263,-73.9323620926577,-73.9323406284524,-73.9323358226825,-73.9323874504284,-73.93238847622,-73.9323897132503,-73.9323304638715,-73.9321924713324,-73.9307636038365,-73.9307322542105,-73.9306973149717,-73.9306150566943,-73.9305914070116,-73.9305760349493,-73.9303150503051,-73.9300999320037,-73.9293756528765,-73.9292199763873,-73.9282765761432,-73.9280668415937,-73.9278148123178,-73.9274011385047,-73.9273165306651,-73.9272466274104,-73.9263585911154,-73.9258207067006,-73.9253853849738,-73.9251848646356,-73.9245472607947,-73.9240255724197,-73.9226526117355,-73.9219476414545,-73.9211440903874,-73.9206653919851,-73.9205434700688,-73.9204860327717,-73.9204016380274,-73.919934717123,-73.9198042462086,-73.9194430353526,-73.9193804172549,-73.9189459722908,-73.9188883685595,-73.918755706085,-73.918338258972,-73.9178827209934,-73.9178215165969,-73.9175659944301,-73.9162158862712,-73.9145055369864,-73.9128763339277,-73.9118915498783,-73.9118161575674,-73.9118078064213,-73.9117993600899,-73.9117908307274,-73.9117822077248,-73.91177350082,-73.9117646991739,-73.9117558270768,-73.9117468595878,-73.9117378214179,-73.9117287002149,-73.9117194968646,-73.9117102336493,-73.9117008880756,-73.911691470939,-73.9116819826793,-73.9116724358909,-73.9116628175499,-73.9116531402278,-73.9116434043647,-73.911633619664,-73.9116237656292,-73.9116138638591,-73.9116039148068,-73.9115939180187,-73.9115838737285,-73.9115737832594,-73.9115636567549,-73.9115534827494,-73.9115432850569,-73.9115330519899,-73.9115227837712,-73.911512492529,-73.9115021652516,-73.9114918251073,-73.9114814634685,-73.9114710772767,-73.9114606790861,-73.9114502702216,-73.9114398599554,-73.9114294273284,-73.9114189941708,-73.9114085611454,-73.9113981174453,-73.9113876846948,-73.9113772644132,-73.9113668319261,-73.9113564227262,-73.9110729859053,-73.9106999884419,-73.90990894138,-73.9094576088314,-73.9084185418301,-73.9074268174018,-73.9064572221044,-73.9056589031397,-73.9055246630307,-73.9054559226368,-73.9053277028843,-73.9052502263246,-73.9048965315111,-73.9047810379607,-73.9037931018158,-73.9028870209578,-73.9026681924117,-73.9012927762711],"lat":[40.8204754421116,40.819694858758,40.8195504268544,40.8191533645607,40.8185051921006,40.8173697944309,40.8163177924573,40.816106761023,40.8150757884839,40.8141318427975,40.8130864554802,40.8122819599137,40.8121248200648,40.8115068828557,40.8107128845324,40.8098563992003,40.809768986807,40.8097021211851,40.8096234285296,40.8095500727788,40.80945558286,40.8093643005338,40.8090627010545,40.8087447930574,40.8050715024554,40.8049481131901,40.804938797305,40.8049341350803,40.804924022594,40.8049159356741,40.8048827349566,40.8048523089941,40.8048232606454,40.804788693487,40.8047541530724,40.8047002522614,40.8045979845592,40.8045964491763,40.8045882917783,40.8045730707532,40.8045647761417,40.8044169540545,40.804463788098,40.8043285348216,40.8041972917092,40.8041575821462,40.8041768879394,40.8041636634672,40.8041390539352,40.8040174348504,40.803936771871,40.8039173527701,40.8039970878969,40.8038996395141,40.8039276761699,40.8038554124353,40.8037752824546,40.8037737441762,40.8038611236107,40.8038749071398,40.8038353681898,40.8038310231285,40.8038097707597,40.803795033096,40.8037732961173,40.8037678087909,40.803702462032,40.8036877050422,40.8037534546791,40.8037499957611,40.8037227960732,40.8036987035442,40.8036699572498,40.8036520961131,40.8036343907996,40.8035742827785,40.8035587447012,40.8036213099473,40.803607824495,40.8035790755951,40.8035209771482,40.8034709761689,40.8034165986282,40.8034556525874,40.8032745980212,40.8032113858458,40.8031916953188,40.8031834334504,40.8031702356519,40.8031500300326,40.8031236074502,40.803069203267,40.8030147966983,40.8029128418939,40.8028862439104,40.8028352289894,40.8027246134459,40.802667961258,40.8026347999513,40.8026003333846,40.8025712166684,40.8025408043612,40.8025048678798,40.8024647936445,40.8024302608664,40.8024053961776,40.8023404562078,40.802274729988,40.8021857100948,40.8021401195458,40.8021152512978,40.8020903845359,40.8020613589133,40.802019954898,40.8017998817657,40.8015529310959,40.8015833914496,40.8014929929967,40.8011755105198,40.8010907916864,40.8010369152017,40.801107478446,40.8009699675517,40.8008906396062,40.8008505945225,40.8008200298263,40.8007467104632,40.8007454173563,40.8003226335583,40.8002374484449,40.8001568384219,40.8001043353956,40.8000545897492,40.800028244451,40.8000034579154,40.799981356168,40.7999632196943,40.7999551178426,40.7999468458199,40.7999454942058,40.7999316848823,40.7999164828855,40.7998957441096,40.799799044286,40.7996608856868,40.7996277292762,40.7996222155475,40.7996319212747,40.7996360929249,40.7995728191678,40.7995614306028,40.7995447777828,40.799522589666,40.799493489538,40.7994657893,40.7994200982146,40.7993883139253,40.799442326073,40.7994700282402,40.7994963676946,40.7995143923282,40.7995268819128,40.7995396463598,40.7994619861943,40.7994313007765,40.7992834492679,40.7992378721622,40.7993223306842,40.7993721763115,40.7994054166404,40.799442092445,40.7993834153871,40.799307425389,40.7992645113959,40.7991980524277,40.7991329950906,40.7990928681811,40.799091000089,40.7990569070593,40.7990251030438,40.7989591354181,40.7983094279216,40.7979422258008,40.7979612495516,40.7979619190906,40.797912143674,40.7978684952333,40.7979005983375,40.7978588605259,40.7978343059063,40.7978048229648,40.7976795165519,40.7975886346284,40.7974290017745,40.797330785393,40.7972571474122,40.7971957756733,40.7970975092623,40.7970177950363,40.7970115600936,40.7969894759185,40.7969698329986,40.7969207199294,40.7968880708335,40.7968151848257,40.7967464708541,40.796699824564,40.7966410784967,40.7966237698883,40.796626273245,40.7966336793734,40.7966337041236,40.7966337535956,40.7966485594975,40.79665107506,40.7966560308957,40.7966781180732,40.7966806644422,40.7967102261117,40.7967176824488,40.79673513462,40.7967624319657,40.7967723914884,40.7967824285354,40.7967894387587,40.7973629485082,40.7978307189274,40.7988797297223,40.798915894597,40.7989469172748,40.798993935687,40.7990324550523,40.7996136878703,40.7998041564907,40.800275009952,40.8005988142252,40.8012845916315,40.8015857238042,40.8018771975727,40.8021882013318,40.8023732946429,40.8025157253244,40.8025450108556,40.8024098039147,40.8025119504399,40.8026956654816,40.8029332337116,40.8032117709833,40.8032774416938,40.8035082644171,40.8039886328461,40.8039994625138,40.8040129343378,40.8040480802543,40.8042398902814,40.8041036247247,40.8059023473232,40.8061901456991,40.806470276943,40.8065905635668,40.8071282957769,40.8077696934736,40.8078184179509,40.8078558449789,40.8078940243973,40.8079371336018,40.8083639736226,40.8088232817754,40.8093828645268,40.8097707417739,40.8100535573694,40.8101136173336,40.8101161525591,40.810124436886,40.810414043429,40.8104944601992,40.8105829330816,40.8107991351871,40.8108859751897,40.8114674958908,40.8119046217607,40.813423607835,40.8140168333874,40.8140606863159,40.8141175189592,40.8141517151757,40.8142087061908,40.8146515748029,40.8146856842332,40.814964274079,40.8150329648747,40.8153421183282,40.8172118198021,40.8176304043794,40.8194243871483,40.8194600278876,40.8195028473368,40.8194966721425,40.8194849814707,40.8193639086563,40.8193608031914,40.8193573402414,40.8193532472364,40.8193514280953,40.8193505317995,40.8193168805521,40.819274349927,40.819097069017,40.8190588823702,40.8188100423438,40.8187556145247,40.8186902111291,40.8185828574234,40.8185596343246,40.8185429852211,40.8183206920482,40.8181803374006,40.8180654145411,40.818012668875,40.8187126230078,40.8192853301108,40.8204943152806,40.8210315449594,40.8215630020621,40.8218368930876,40.8219338574816,40.8219795361112,40.8220612166807,40.8223522024408,40.8224369745602,40.8226716673988,40.8227123524777,40.822992672881,40.8230297738504,40.8231152185245,40.8233833871732,40.8236787768469,40.82371837133,40.8238836724325,40.8234679302259,40.822941856759,40.8224413483939,40.8221414817778,40.8220350224125,40.8220397698634,40.8220444552569,40.822049059337,40.8220536001881,40.8220580515164,40.8220624384421,40.8220667365254,40.822070961997,40.8220751056619,40.8220791696885,40.8220831512295,40.8220870432659,40.8220908457806,40.8220945664878,40.822098206393,40.8221017469107,40.8221051979148,40.8221085582422,40.8221118285635,40.8221150087183,40.8221180894773,40.8221210802383,40.8221239721229,40.822126774512,40.8221294775219,40.8221320811535,40.8221345859173,40.8221369906318,40.8221392971579,40.8221415054868,40.8221436137757,40.8221456227042,40.8221475327647,40.8221493340911,40.8221510471148,40.8221526502227,40.8221541551513,40.8221555607288,40.8221568592562,40.8221580577535,40.8221591575776,40.8221601578914,40.8221610595243,40.8221618529439,40.8221625564116,40.8221631516483,40.8221636475599,40.822242942732,40.8223241138459,40.8225511076148,40.8224324023704,40.8221812706534,40.821945061995,40.8217153645337,40.821556532635,40.8215238132751,40.8215070586095,40.8214758057734,40.8214569216134,40.8213707103807,40.8213414452237,40.8210911006587,40.8208591742366,40.8208031593847,40.8204754421116]}]],[[{"lng":[-73.8807208158036,-73.880742078211,-73.8810388009345,-73.8812102103995,-73.8813335607295,-73.8815321581044,-73.8816551223218,-73.8818025299803,-73.8818171701888,-73.8819358895712,-73.8819990936337,-73.8820129137923,-73.8820240958018,-73.8830124553659,-73.8832246055431,-73.8835825579804,-73.8838089879107,-73.883999123243,-73.8840194346347,-73.8842706020193,-73.8845210008481,-73.8851241284434,-73.8851587849656,-73.8852036424639,-73.8852058424259,-73.8852086796872,-73.8852092884129,-73.8852099719983,-73.8852100300607,-73.8852107117646,-73.8852123256275,-73.88521355038,-73.8852147649757,-73.8852165959349,-73.8852190454723,-73.8852208952329,-73.8852230297459,-73.8852251664197,-73.8852282126335,-73.8852326819139,-73.8852419928355,-73.8852752842485,-73.8852801048696,-73.8853367000831,-73.8853368300031,-73.8853473929309,-73.8854678426463,-73.8855923603726,-73.8856280064155,-73.8857319592302,-73.8857804210568,-73.8857942629586,-73.8858721579579,-73.8859499963777,-73.8860962416716,-73.8863995722807,-73.8878951090142,-73.8888504620368,-73.8896389531624,-73.8896900496137,-73.8898056417241,-73.8898359917002,-73.8899794248792,-73.8909056006279,-73.8919127185849,-73.8929322610114,-73.8938545418665,-73.8951102086074,-73.8952915650016,-73.8954852276459,-73.89639572974,-73.8975695875859,-73.8979449776934,-73.8982046932798,-73.8984522996302,-73.8984743243382,-73.8986541737904,-73.8986771004262,-73.8988361737786,-73.8988623061277,-73.8989955585362,-73.8991214503617,-73.899799199741,-73.9000382996104,-73.9001666938695,-73.9002097407531,-73.9006114108083,-73.9008456123222,-73.9012927762711,-73.9026681924117,-73.9028870209578,-73.9037931018158,-73.9047810379607,-73.9048965315111,-73.9052502263246,-73.9053277028843,-73.9054559226368,-73.9055246630307,-73.9056589031397,-73.9064572221044,-73.9074268174018,-73.9084185418301,-73.9094576088314,-73.90990894138,-73.9106999884419,-73.9110729859053,-73.9113564227262,-73.9113668319261,-73.9113772644132,-73.9113876846948,-73.9113981174453,-73.9114085611454,-73.9114189941708,-73.9114294273284,-73.9114398599554,-73.9114502702216,-73.9114606790861,-73.9114710772767,-73.9114814634685,-73.9114918251073,-73.9115021652516,-73.911512492529,-73.9115227837712,-73.9115330519899,-73.9115432850569,-73.9115534827494,-73.9115636567549,-73.9115737832594,-73.9115838737285,-73.9115939180187,-73.9116039148068,-73.9116138638591,-73.9116237656292,-73.911633619664,-73.9116434043647,-73.9116531402278,-73.9116628175499,-73.9116724358909,-73.9116819826793,-73.911691470939,-73.9117008880756,-73.9117102336493,-73.9117194968646,-73.9117287002149,-73.9117378214179,-73.9117468595878,-73.9117558270768,-73.9117646991739,-73.91177350082,-73.9117822077248,-73.9117908307274,-73.9117993600899,-73.9118078064213,-73.9118161575674,-73.9118915498783,-73.9128763339277,-73.9145055369864,-73.9162158862712,-73.9175659944301,-73.9174677276598,-73.9174045904965,-73.917317823921,-73.9172501029689,-73.9171900744019,-73.9171269375669,-73.9168919579492,-73.9167740058587,-73.916087828579,-73.9161528164556,-73.9163091751571,-73.9165696902129,-73.9166136844246,-73.9164245189577,-73.9163666165908,-73.9163038794069,-73.9162474812951,-73.9161877845351,-73.9161301185075,-73.9159228498893,-73.9154506149717,-73.9154110823548,-73.9146105170494,-73.91363149059,-73.9121698257826,-73.9116595096252,-73.9115237026997,-73.9113891821466,-73.9104901068159,-73.9096213067709,-73.9095189573599,-73.9094603951056,-73.9094225763066,-73.9093741529989,-73.9092835491321,-73.9092368150935,-73.9091777810132,-73.9091059782658,-73.9088980411655,-73.9088257599825,-73.9086913122939,-73.9085754804493,-73.9085215170721,-73.9083765599517,-73.9082398017556,-73.9081087020974,-73.9079713522339,-73.907832931392,-73.9077182166099,-73.9076266601747,-73.9075726938384,-73.9074020053082,-73.9073330702898,-73.9072711255385,-73.9072129415771,-73.9071395446096,-73.9069755048822,-73.9068849720798,-73.9067985483355,-73.906681464221,-73.9065235399408,-73.9064616962426,-73.9063567469709,-73.9062547533835,-73.905979404418,-73.905383580735,-73.904865655025,-73.9047651767355,-73.9041548191641,-73.9035755553362,-73.9029161550487,-73.9027845818396,-73.9027129170968,-73.9026881011636,-73.9013440457415,-73.9011633011518,-73.9009399949242,-73.9009631996938,-73.9010403297361,-73.9015115199571,-73.9003333035012,-73.8997327331982,-73.8996551031458,-73.8996374955661,-73.8985614225852,-73.8975178693376,-73.896587201409,-73.8955571806114,-73.8952735691077,-73.8948194262753,-73.8948475875661,-73.8953783618073,-73.8952778489266,-73.8950980727422,-73.8950141578443,-73.8949357995068,-73.8948486279507,-73.8941015052218,-73.8931709893529,-73.8921681562123,-73.8901746864267,-73.889417248692,-73.8886904083088,-73.8881375215934,-73.8875425178058,-73.8865980234512,-73.8861843210051,-73.8861197232776,-73.8861097884652,-73.8857468591637,-73.885109971338,-73.8841272455011,-73.8835182040595,-73.8831387395403,-73.882747698579,-73.8823302550307,-73.8821241001081,-73.8817724951235,-73.8816967494198,-73.881642909245,-73.8807657491459,-73.8807208158036],"lat":[40.837521265023,40.8374864279544,40.8370624578241,40.836784354721,40.8365670213302,40.8361867753265,40.8359463439712,40.8356742925784,40.8356437967682,40.8354621249856,40.8353944221834,40.8353637032037,40.8353357992776,40.8340534602036,40.8337997594966,40.8333782763501,40.8331150395822,40.8329057427893,40.8328814511171,40.8325963606578,40.832254826651,40.831161082577,40.8310729617076,40.8309693675631,40.8309642904212,40.8309577376909,40.8309563331044,40.8309547473312,40.8309545865659,40.8309528129963,40.8309485531237,40.8309453469256,40.8309421472509,40.8309373342621,40.8309309026006,40.8309260578009,40.8309204354699,40.8309148389398,40.8309068262766,40.8308950733779,40.8308706311554,40.8307831605576,40.8307705028734,40.8305986571073,40.8305982647274,40.8305648576803,40.8301119039421,40.8290700377422,40.8288509914984,40.8282121805301,40.8279143713239,40.8278235750115,40.8277773147601,40.8277336349429,40.827655777358,40.8275033797394,40.8267431852966,40.8267685952441,40.8267975100074,40.8267993835699,40.826803621043,40.8268047342572,40.8268099922383,40.8267877841199,40.8267944502507,40.8267870360298,40.8273400367457,40.828036899455,40.8281423498679,40.828248541385,40.8287628795207,40.8294230008309,40.8285217482647,40.8278891099849,40.8272887612399,40.827235359173,40.8267992863288,40.8267436963077,40.8263579934982,40.8262974361398,40.8259886509688,40.8256969191896,40.8240579415116,40.823481696233,40.8231741321428,40.823071014629,40.8221088079296,40.8215414176145,40.8204754421116,40.8208031593847,40.8208591742366,40.8210911006587,40.8213414452237,40.8213707103807,40.8214569216134,40.8214758057734,40.8215070586095,40.8215238132751,40.821556532635,40.8217153645337,40.821945061995,40.8221812706534,40.8224324023704,40.8225511076148,40.8223241138459,40.822242942732,40.8221636475599,40.8221631516483,40.8221625564116,40.8221618529439,40.8221610595243,40.8221601578914,40.8221591575776,40.8221580577535,40.8221568592562,40.8221555607288,40.8221541551513,40.8221526502227,40.8221510471148,40.8221493340911,40.8221475327647,40.8221456227042,40.8221436137757,40.8221415054868,40.8221392971579,40.8221369906318,40.8221345859173,40.8221320811535,40.8221294775219,40.822126774512,40.8221239721229,40.8221210802383,40.8221180894773,40.8221150087183,40.8221118285635,40.8221085582422,40.8221051979148,40.8221017469107,40.822098206393,40.8220945664878,40.8220908457806,40.8220870432659,40.8220831512295,40.8220791696885,40.8220751056619,40.822070961997,40.8220667365254,40.8220624384421,40.8220580515164,40.8220536001881,40.822049059337,40.8220444552569,40.8220397698634,40.8220350224125,40.8221414817778,40.8224413483939,40.822941856759,40.8234679302259,40.8238836724325,40.8239461069527,40.8239862220029,40.8240413500195,40.824084377625,40.8241225173314,40.8241626310562,40.8243119255752,40.8243870873737,40.8248378518314,40.8248569409132,40.824902866513,40.824979385864,40.8249923080049,40.8251149132185,40.825152440893,40.8251931022554,40.8252296554679,40.8252683467122,40.8253057213218,40.8254400559875,40.8257477793764,40.8257739091232,40.8262945078545,40.8269243691411,40.8279022214857,40.8287489996408,40.8289597824482,40.8291381845012,40.8307373730328,40.8322814222731,40.8324637770399,40.8325681158095,40.8326354962769,40.8327217713076,40.8328831962541,40.8329664604707,40.8330716391853,40.8331995664458,40.833570034682,40.8336988117321,40.8339383467746,40.8341444417013,40.8342404561624,40.8344983710865,40.8347416936322,40.8349749496441,40.8352193227624,40.8354655995994,40.8356696962831,40.8358325897843,40.8359286037738,40.8362322834186,40.8363424266365,40.8364413994077,40.8365343644113,40.8366516345745,40.8369137289169,40.837058376254,40.8371955162379,40.8373835254483,40.8376358430157,40.8377346502358,40.8379023261805,40.8380652802542,40.8385051953,40.8397689839726,40.8406968315902,40.8408768290624,40.8419702523602,40.8430040671536,40.8441813317002,40.8444157458766,40.8445427895467,40.8445814722859,40.8444287507698,40.8444098469549,40.8443849826749,40.8443458394087,40.8442060775786,40.8433679689654,40.8429893800162,40.8440558179051,40.8441948406573,40.8442338255314,40.8441158739513,40.8439972480106,40.8438870555599,40.8437650891061,40.8437338283405,40.8436837709689,40.8436463632951,40.8429387789566,40.8428798609365,40.8427744807562,40.8427252911291,40.842679358976,40.8426282603431,40.842190302897,40.841637343677,40.8410496397396,40.8398736671137,40.8394227333803,40.839158026468,40.8398620023848,40.8396406584809,40.8392790501085,40.8401050444709,40.8404235214813,40.8404709946356,40.8402602436551,40.8399046391549,40.8393559193069,40.8390223663263,40.8388106720048,40.8385923412635,40.8383547669226,40.8382351240816,40.8380310725181,40.8379871134609,40.8379596836389,40.8375429859006,40.837521265023]}]],[[{"lng":[-73.9026881011636,-73.9027129170968,-73.9027845818396,-73.9029161550487,-73.9035755553362,-73.9041548191641,-73.9047651767355,-73.904865655025,-73.905383580735,-73.905979404418,-73.9062547533835,-73.9063567469709,-73.9064616962426,-73.9065235399408,-73.906681464221,-73.9067985483355,-73.9068849720798,-73.9069755048822,-73.9071395446096,-73.9072129415771,-73.9072711255385,-73.9073330702898,-73.9074020053082,-73.9075726938384,-73.9076266601747,-73.9077182166099,-73.907832931392,-73.9079713522339,-73.9081087020974,-73.9082398017556,-73.9083765599517,-73.9085215170721,-73.9085754804493,-73.9086913122939,-73.9088257599825,-73.9088980411655,-73.9091059782658,-73.9091777810132,-73.9092368150935,-73.9092835491321,-73.9093741529989,-73.9094225763066,-73.9094603951056,-73.9095189573599,-73.9096213067709,-73.9104901068159,-73.9113891821466,-73.9115237026997,-73.9116595096252,-73.9121698257826,-73.91363149059,-73.9146105170494,-73.9154110823548,-73.9154506149717,-73.9159228498893,-73.9161301185075,-73.9161877845351,-73.9162474812951,-73.9163038794069,-73.9163666165908,-73.9164245189577,-73.9166136844246,-73.9165696902129,-73.9163091751571,-73.9161528164556,-73.916087828579,-73.9167740058587,-73.9168919579492,-73.9171269375669,-73.9171900744019,-73.9172501029689,-73.917317823921,-73.9174045904965,-73.9174677276598,-73.9175659944301,-73.9178215165969,-73.9178827209934,-73.918338258972,-73.918755706085,-73.9188883685595,-73.9189459722908,-73.9193804172549,-73.9194430353526,-73.9198042462086,-73.919934717123,-73.9204016380274,-73.9204860327717,-73.9205434700688,-73.9206653919851,-73.9211440903874,-73.9219476414545,-73.9226526117355,-73.9240255724197,-73.9245472607947,-73.9251848646356,-73.9253853849738,-73.9258207067006,-73.9263585911154,-73.9272466274104,-73.9273165306651,-73.9274011385047,-73.9278148123178,-73.9280668415937,-73.9282765761432,-73.9292199763873,-73.9293756528765,-73.9300999320037,-73.9303150503051,-73.9305760349493,-73.9305914070116,-73.9306150566943,-73.9306973149717,-73.9307322542105,-73.9307636038365,-73.9321924713324,-73.9323304638715,-73.9323897132503,-73.9323818170235,-73.9323749850426,-73.9324287473732,-73.9324592388034,-73.9323998255854,-73.9324247024759,-73.9324660358504,-73.9325118088919,-73.9324647565508,-73.9324987323838,-73.9325488357831,-73.9325786278701,-73.9325395002976,-73.9325736045052,-73.9326113906863,-73.9326686762827,-73.9326226467974,-73.9326600360099,-73.9327050562735,-73.9327284196167,-73.9327305415562,-73.932738439751,-73.9327469384184,-73.9327576166252,-73.9327659458116,-73.9327743340497,-73.9329594037364,-73.9329827513579,-73.9330076056631,-73.9330588174996,-73.9330725113432,-73.9330854034834,-73.9333256283996,-73.9334193672127,-73.9334755690621,-73.9335460674699,-73.9336059203671,-73.9335704473617,-73.9335639574196,-73.9335639085739,-73.9335380799096,-73.9335135809268,-73.9334867112086,-73.9334691837515,-73.9334610566967,-73.9334623570314,-73.9331993138177,-73.9331763370732,-73.9331430670921,-73.9329963900161,-73.9326562035398,-73.9323556421868,-73.9318666017283,-73.9315039543422,-73.9309581983301,-73.9308641441779,-73.9308146852843,-73.9307694505562,-73.930750079599,-73.9307157038901,-73.9306598019076,-73.9305909473463,-73.9305544179342,-73.9305157238608,-73.9305070562786,-73.9304318403857,-73.9304832452105,-73.93039907688,-73.9303668615928,-73.9298571474441,-73.9295893950809,-73.9295787088452,-73.9293801258821,-73.9291940800724,-73.929184586731,-73.9286157482235,-73.9282745470679,-73.9281192534924,-73.9280820937369,-73.9280474840184,-73.9278686981082,-73.9276707334657,-73.9276342472698,-73.9275920975169,-73.9275482844688,-73.9274601310171,-73.927421415361,-73.9273912595109,-73.9273675706093,-73.9273418451992,-73.9273019449863,-73.9271498069637,-73.9268051593282,-73.9264974755206,-73.926377829331,-73.9262244385218,-73.9261562785059,-73.9260920720706,-73.9258911698099,-73.9255378459996,-73.9246844846605,-73.924549099801,-73.9244534627579,-73.9242740136647,-73.9236095515337,-73.9235400201159,-73.9227346100817,-73.9226280853113,-73.9224698366015,-73.9215071460599,-73.9204329802783,-73.9193488243451,-73.9187717919945,-73.9183870599972,-73.9172871941725,-73.9169715243762,-73.9155882282611,-73.914774366957,-73.9141607633373,-73.9137952351787,-73.9135182652173,-73.9133829397145,-73.9132497070102,-73.9125840554476,-73.9119467035972,-73.9114163658133,-73.9112809741578,-73.9110409640953,-73.9108057940986,-73.910254353069,-73.9093592484465,-73.9084507328043,-73.9075448891075,-73.9066467555957,-73.9061182471481,-73.9055058276064,-73.9048312203632,-73.9041010735872,-73.9033865124588,-73.9026881011636],"lat":[40.8445814722859,40.8445427895467,40.8444157458766,40.8441813317002,40.8430040671536,40.8419702523602,40.8408768290624,40.8406968315902,40.8397689839726,40.8385051953,40.8380652802542,40.8379023261805,40.8377346502358,40.8376358430157,40.8373835254483,40.8371955162379,40.837058376254,40.8369137289169,40.8366516345745,40.8365343644113,40.8364413994077,40.8363424266365,40.8362322834186,40.8359286037738,40.8358325897843,40.8356696962831,40.8354655995994,40.8352193227624,40.8349749496441,40.8347416936322,40.8344983710865,40.8342404561624,40.8341444417013,40.8339383467746,40.8336988117321,40.833570034682,40.8331995664458,40.8330716391853,40.8329664604707,40.8328831962541,40.8327217713076,40.8326354962769,40.8325681158095,40.8324637770399,40.8322814222731,40.8307373730328,40.8291381845012,40.8289597824482,40.8287489996408,40.8279022214857,40.8269243691411,40.8262945078545,40.8257739091232,40.8257477793764,40.8254400559875,40.8253057213218,40.8252683467122,40.8252296554679,40.8251931022554,40.825152440893,40.8251149132185,40.8249923080049,40.824979385864,40.824902866513,40.8248569409132,40.8248378518314,40.8243870873737,40.8243119255752,40.8241626310562,40.8241225173314,40.824084377625,40.8240413500195,40.8239862220029,40.8239461069527,40.8238836724325,40.82371837133,40.8236787768469,40.8233833871732,40.8231152185245,40.8230297738504,40.822992672881,40.8227123524777,40.8226716673988,40.8224369745602,40.8223522024408,40.8220612166807,40.8219795361112,40.8219338574816,40.8218368930876,40.8215630020621,40.8210315449594,40.8204943152806,40.8192853301108,40.8187126230078,40.818012668875,40.8180654145411,40.8181803374006,40.8183206920482,40.8185429852211,40.8185596343246,40.8185828574234,40.8186902111291,40.8187556145247,40.8188100423438,40.8190588823702,40.819097069017,40.819274349927,40.8193168805521,40.8193505317995,40.8193514280953,40.8193532472364,40.8193573402414,40.8193608031914,40.8193639086563,40.8194849814707,40.8194966721425,40.8195028473368,40.8195531968433,40.8195906966822,40.8204471402953,40.8211206121411,40.8211455669272,40.8215741230965,40.8215774349762,40.8221388159179,40.8221546018248,40.8225834646109,40.8225992167529,40.8230407110459,40.8230725214571,40.8234827081246,40.8234876195757,40.8240783513856,40.8240925689179,40.8245452264743,40.8245597240005,40.8249125429573,40.8249843482537,40.8251255114366,40.8252167830761,40.8253222704127,40.825458227185,40.8256121688826,40.8269234472671,40.8272244067465,40.8275357132044,40.8280862438122,40.8281561520366,40.8282256738179,40.8300286837657,40.8307743509689,40.8312214105751,40.8315094535015,40.8327895305208,40.8328921920781,40.8329427360213,40.8329916533309,40.8330584920767,40.833148754785,40.8332714756895,40.8333951676404,40.8335194207008,40.8336438230717,40.8347703963769,40.8349435738275,40.8351941281191,40.8356787891887,40.836473476526,40.8369933356284,40.8376400557478,40.8383206895101,40.8392541469134,40.8393533688681,40.8394283456492,40.8395701776613,40.8396158221309,40.8396386297872,40.8397152322995,40.8398586815471,40.8398880098946,40.8399336426868,40.8400102740694,40.840231705388,40.8404600605671,40.840610259031,40.840620022305,40.8415674489581,40.8420835490797,40.8422766696025,40.8424671456244,40.842818415237,40.8432037576477,40.84467686503,40.844975761157,40.8453172038185,40.8453915968336,40.8454645959546,40.8455977212001,40.8460334824842,40.8460187841966,40.8460523365154,40.846087214561,40.846194776329,40.8462550834272,40.8463414836816,40.8464050608974,40.8464636414384,40.8465068673762,40.846436407628,40.8462767888972,40.8461361515057,40.8460807940868,40.8460108817896,40.8459786004336,40.845952003804,40.8458578093881,40.8456981313547,40.8453160832941,40.8452554723792,40.8451661821664,40.8450867742174,40.8447927396644,40.8447589436098,40.8447968393723,40.8448009103269,40.8448126875305,40.8448735734316,40.8449407948031,40.8449924261884,40.8450344670993,40.8450541402324,40.84510408616,40.8451152461266,40.8451471538477,40.8451654341516,40.8451777551909,40.8451832278256,40.8451859749536,40.8451872325366,40.8451844585699,40.845170587654,40.8451573020728,40.845148693223,40.8451464812193,40.8451411731634,40.8451335258673,40.845104173849,40.8450565236104,40.845007441044,40.8449584961924,40.8449163140672,40.844882557804,40.8448434358235,40.8448003420935,40.8447308221529,40.8446552958725,40.8445814722859]}]]],null,null,{"interactive":true,"className":"","stroke":false,"color":"#03F","weight":5,"opacity":0.5,"fill":true,"fillColor":["#FFE794","#FC522B","#FFC661","#FEAD4A","#FE9D43","#FED774","#808080","#FD8539","#B50026","#D21021","#FC552C","#FEDB7A","#808080","#EB2E20","#FEB954","#808080","#808080","#FED571","#FEDC7D","#808080","#FFE58E","#FD8038","#F44025","#808080","#808080","#FEB651","#EC3021","#FFFFCC","#C20325","#808080","#FFCA66","#FFC15C","#F33E25","#FFE288","#FD6C32","#FE9740","#FFF8BB","#FFC560","#FD873A","#FEB34D","#FFC25D","#808080","#FD7434","#FFC560","#FD5C2D","#FE9840","#FC512B","#800026","#FFC05B","#ED3321","#808080","#E8281F","#808080","#EA2D20","#FD7333","#FED370","#FD7534","#FFC560","#FEB04B","#FD893B","#808080","#FEDA78","#FED26F","#FA4B29","#FEA847","#FFFFCB","#FC532B","#FEB954","#FFE086","#FFEA9A","#FD923E"],"fillOpacity":0.5,"smoothFactor":1,"noClip":false},null,null,null,{"interactive":false,"permanent":false,"direction":"auto","opacity":1,"offset":[0,0],"textsize":"10px","textOnly":false,"className":"","sticky":true},null]}],"limits":{"lat":[40.4961339876118,40.9155327765027],"lng":[-74.2555913631521,-73.7000090632127]}},"evals":[],"jsHooks":[]}</script> ] --- # Mapping Categorical Data .pull-left[ ```r pal_factor <- colorFactor(palette = "Dark2", domain = nyc_cd$borough) leaflet(width = "100%") %>% setView(lat = 40.7, lng = -74.0, zoom = 10) %>% addProviderTiles("CartoDB.Positron") %>