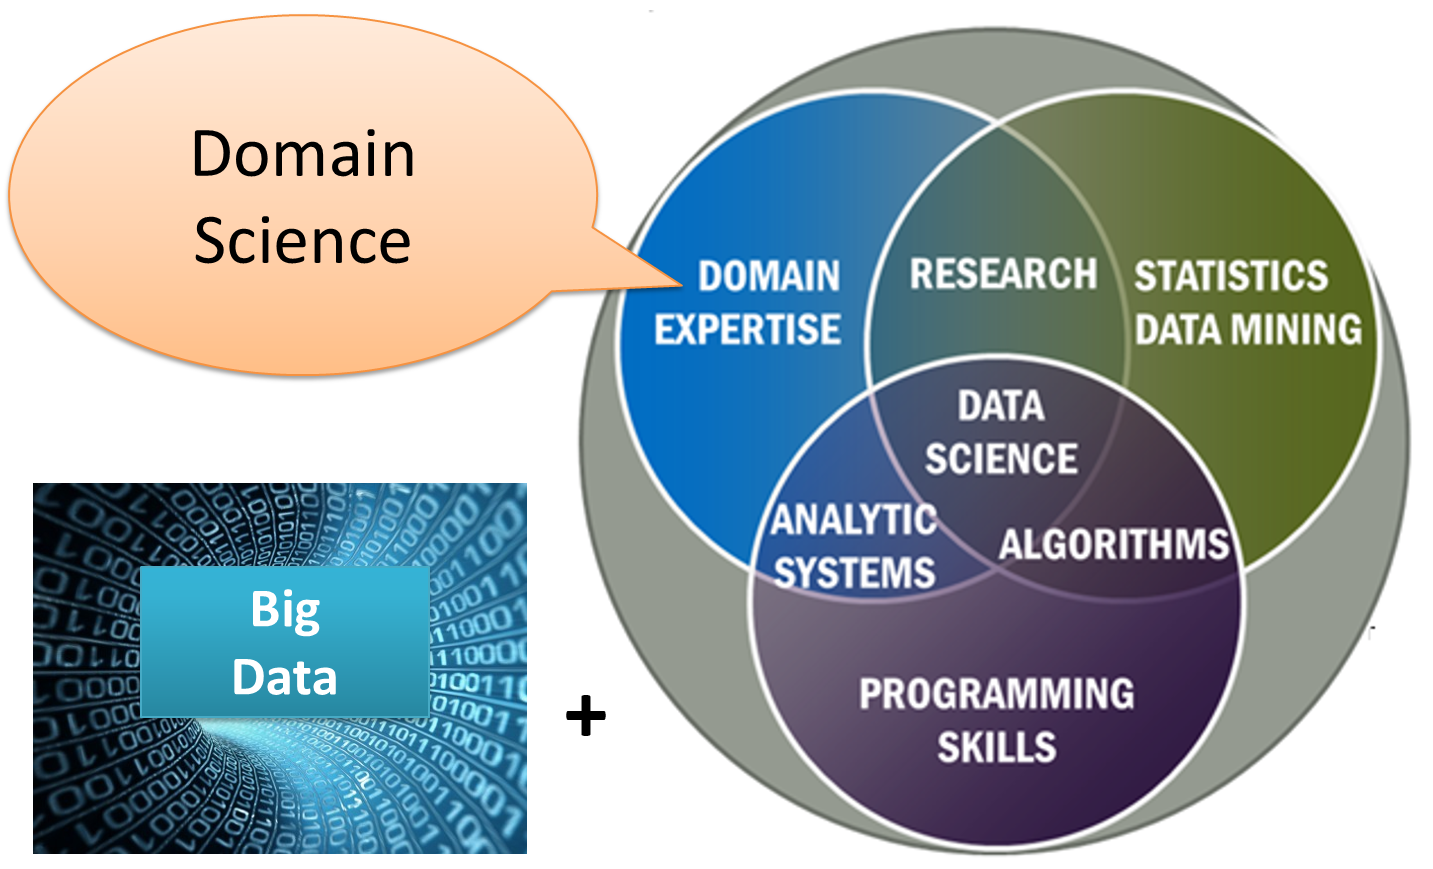
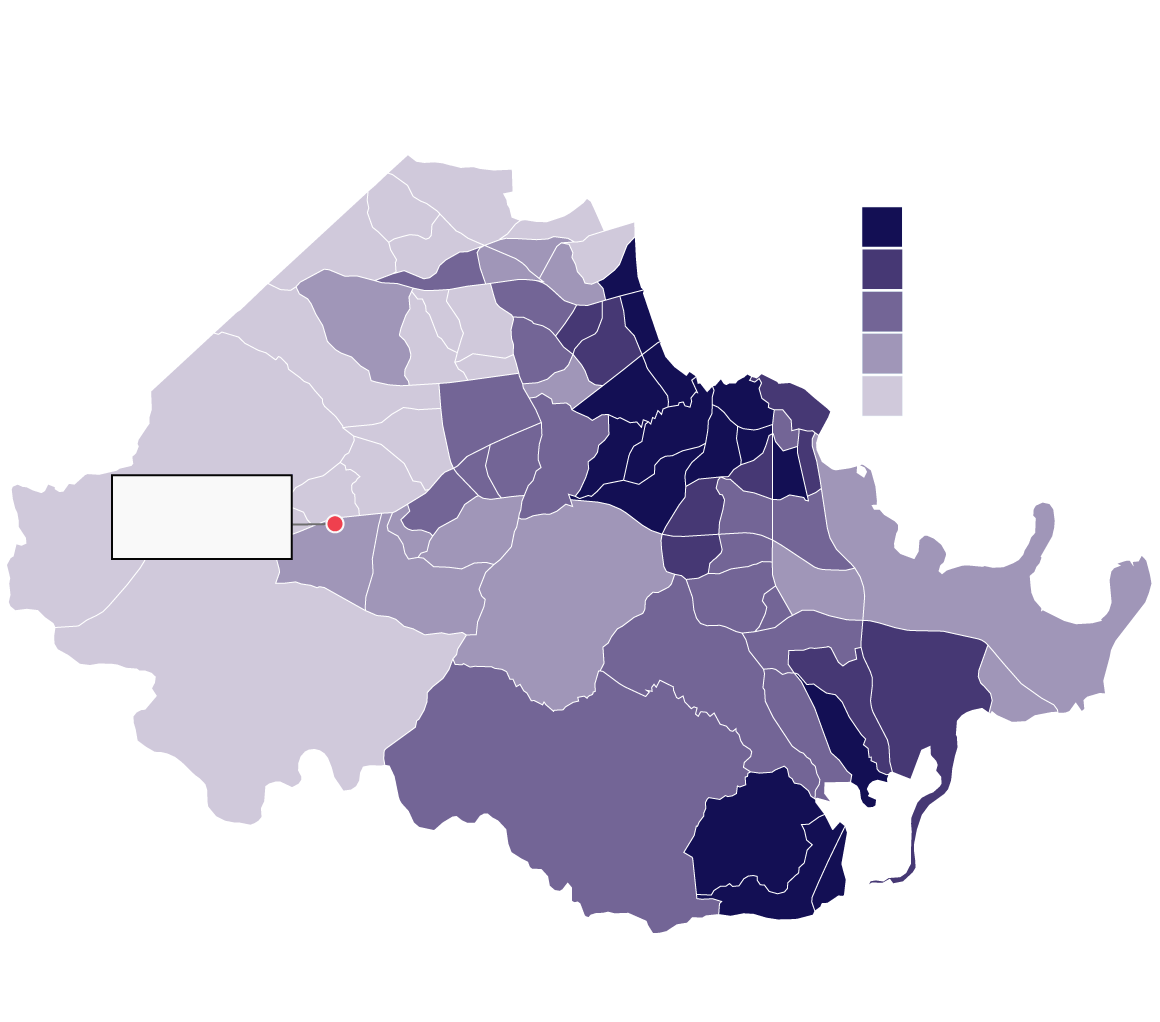
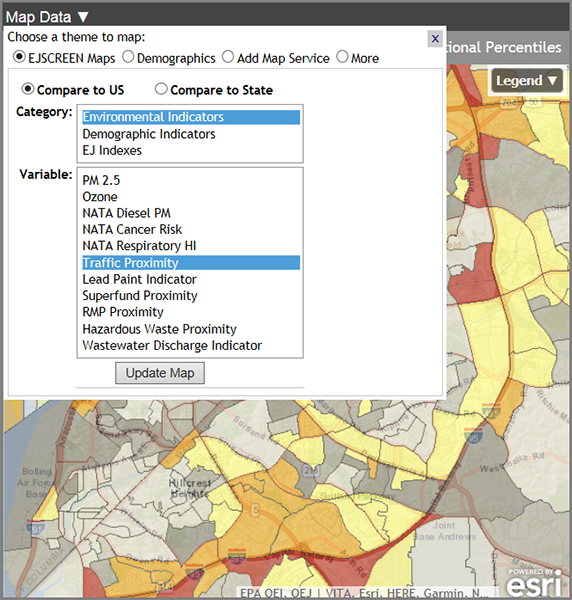
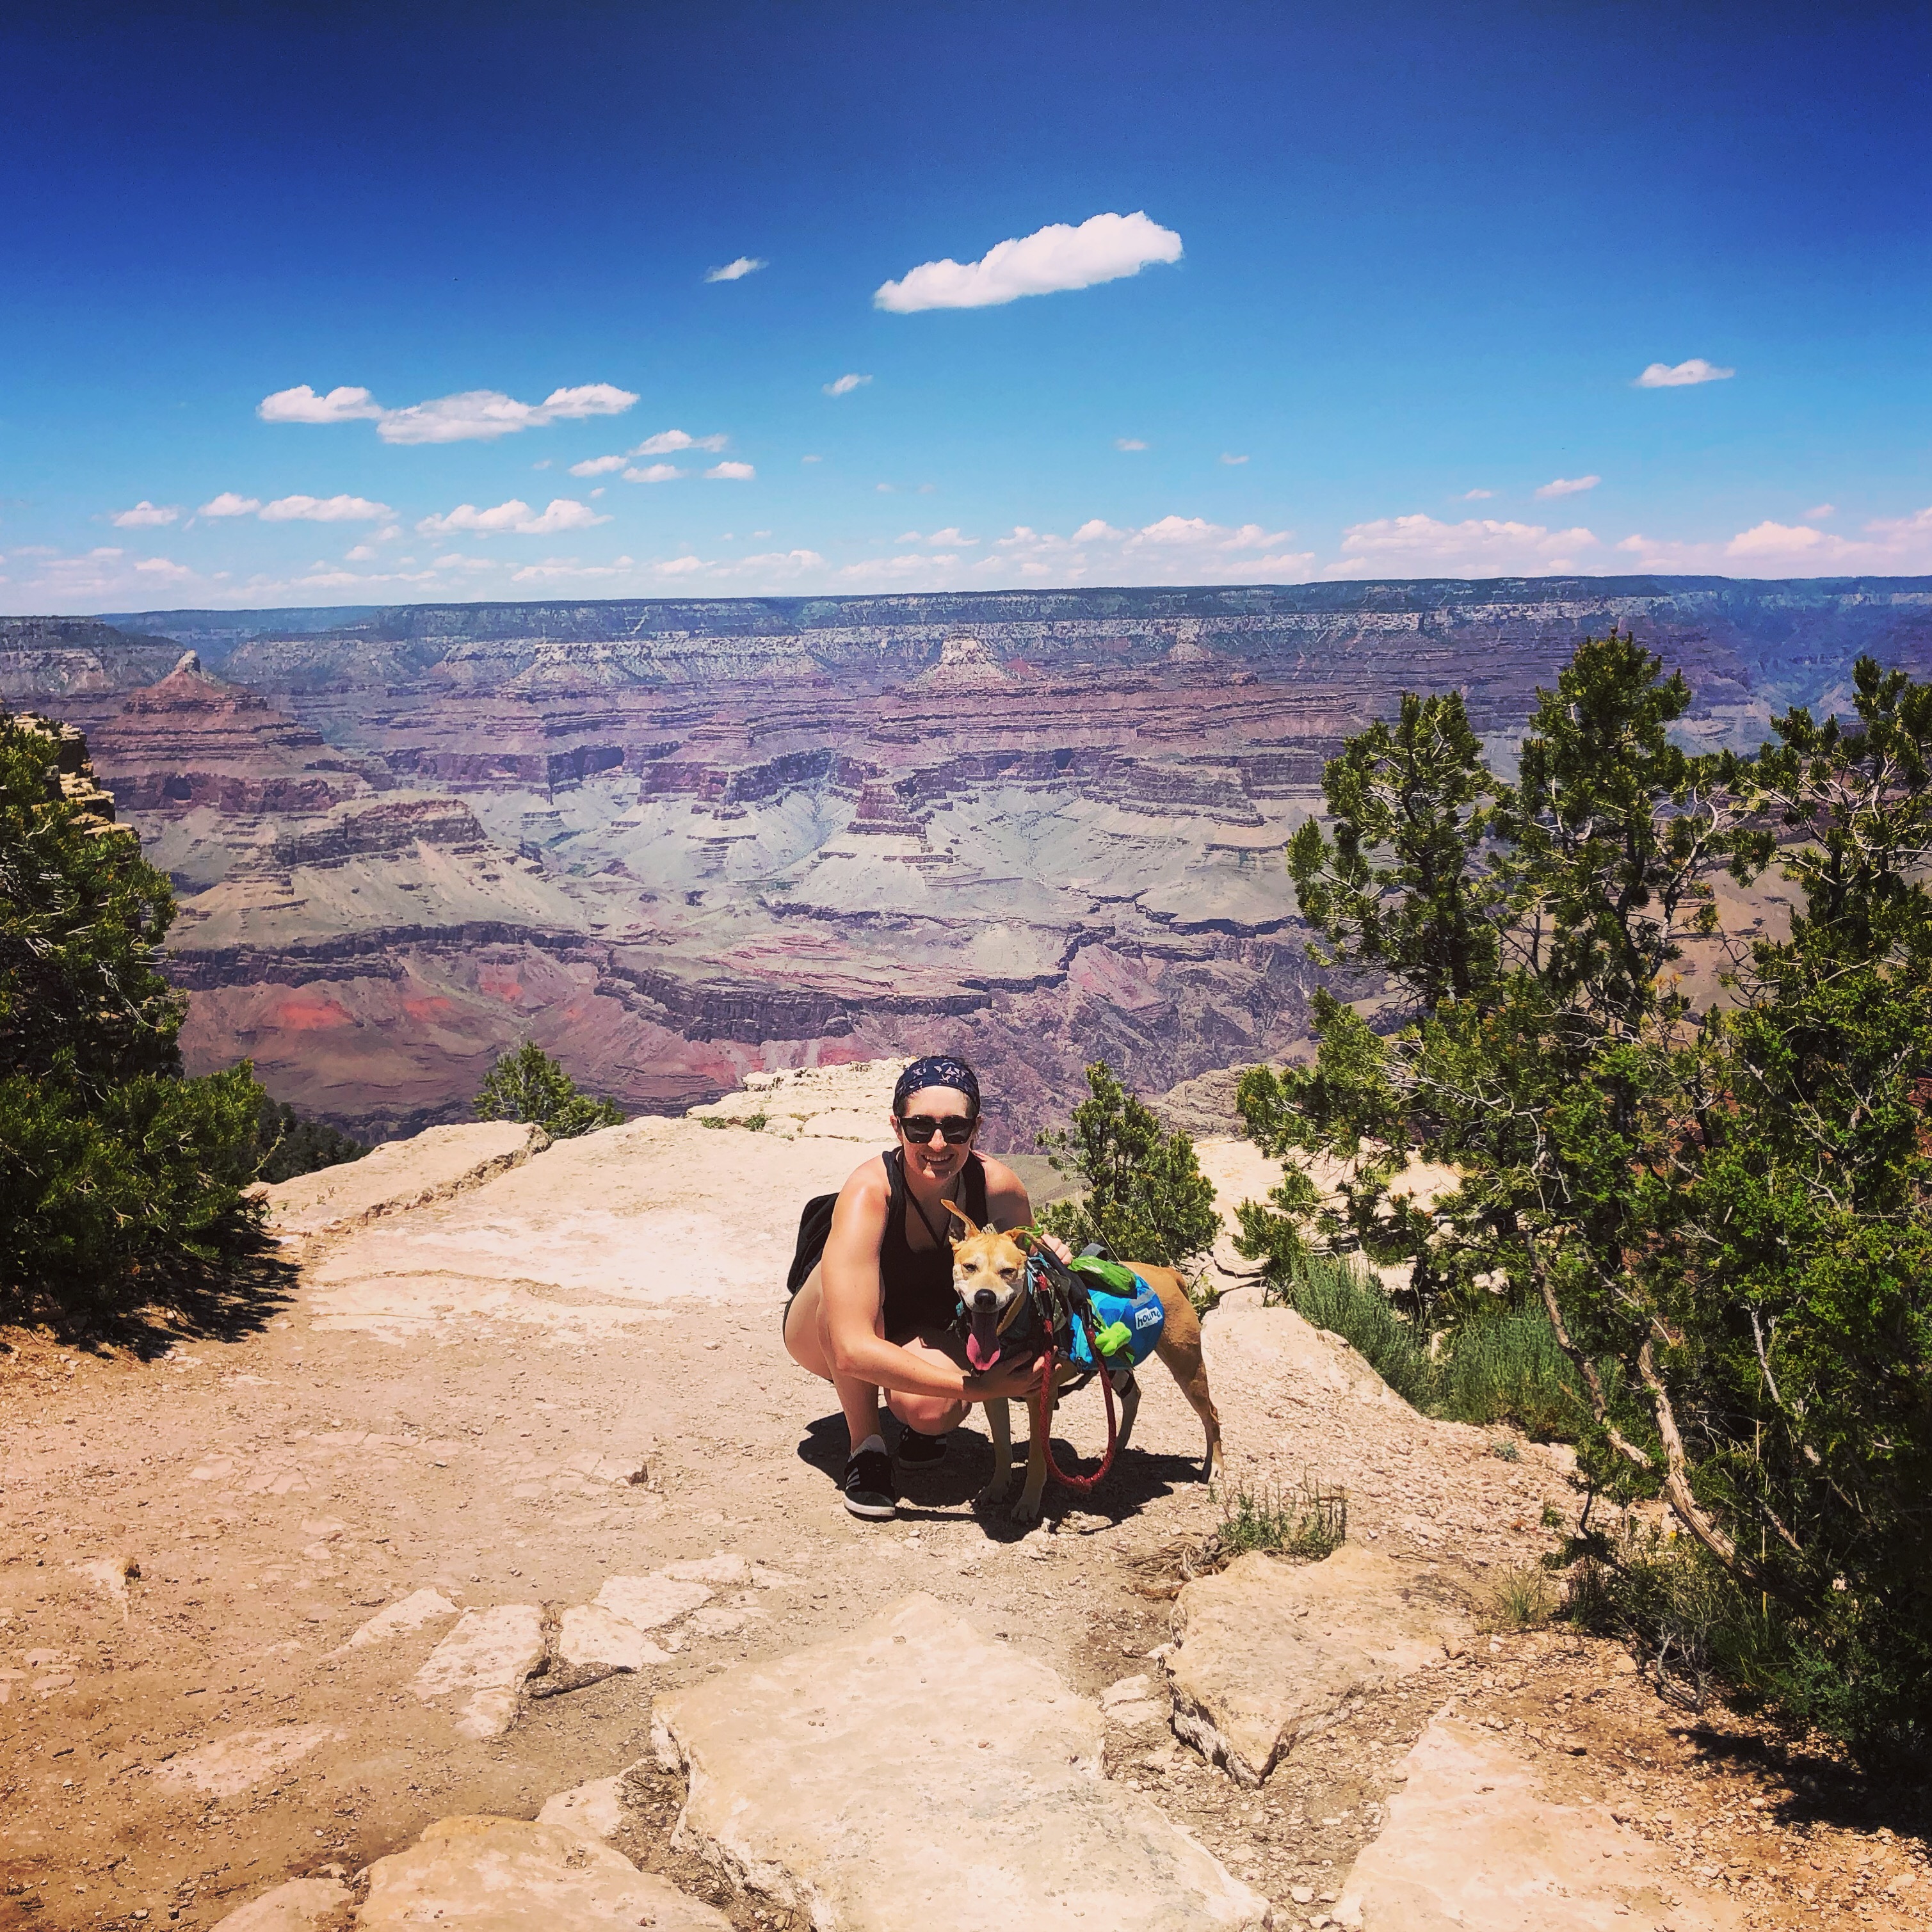
class: center, middle, inverse, title-slide # Day One: Introductions ## SDS 192: Introduction to Data Science ### <p>Lindsay Poirier<br/> <span style="font-size: 70%;"> <a href="http://www.smith.edu/sds">Statistical & Data Sciences</a>, Smith College<br/> </span></p> ### <p>Spring 2022<br/> <img src="data:image/png;base64,iVBORw0KGgoAAAANSUhEUgAAAPAAAADwCAYAAAA+VemSAAAABGdBTUEAALGPC/xhBQAAACBjSFJNAAB6JgAAgIQAAPoAAACA6AAAdTAAAOpgAAA6mAAAF3CculE8AAAABmJLR0QA/wD/AP+gvaeTAAAACXBIWXMAAC4jAAAuIwF4pT92AAAAB3RJTUUH5AkKCykoXgqp0QAAe6NJREFUeNrtnXd8HNW5/r9nZrap927Lli1b7p1mwHSwgVBtCC2BFAgBk9yb3JRfbupNvzcJNqElgdB7B5veDAbce5NlyVbvXVumnN8fs5IlayWvbNmSzD6fD9jenXN25rznmdPe530hgggiiCCCCCKIIIIIIogggggiiCCCCIY5xFDfQASDjElLQAiBZWUBJwU/XYOiVCClZOezQ32HEQwiIgQ+UZBzDWQEoEVLRGEx8B1gYvDb3QgeQIrnSGyppzoZ9j0x1HccwSAgQuATAQVLANwgFwDfA86y/90DfmAViL8B7wNedkVG45GOCIFHMiYuBomCwnTgu8BVQOJhSjUDLwHLsJxbEKbJ7qeH+kkiOEJECDwSMXEJGBpoejaCrwPfBHIJ354SKAUeRvAQlixFCMmu54b6ySIYICIEHmkouBogDsRlwB3AHEA9wtosYBNwD4gX8VvNzEmA5/851E8ZQZiIEHikwF7nOkGeDtwJXABE9VvGsuw/FeVwtXuBd4G/gfgECETWxyMDEQIPdxQsBiEFUikAeTtwLZDSbxlLomkKMyePRVEUNm7bh24Y4RC5DngGIe5HyO1IJDsj0+rhjAiBhysmXAWmF7SYdIS8HrgVyKc/m0mJAMaMSudbV5/LTZcvQFEET7y2igeefZeikkokgOjX7BLYB/wDIR/Fa1biUmH380PdIhGEQITAwxGTlgBEI+VC4C7gZMDR5/USsCwSE2NZfNGp3HH9RUzJH4USJKqUkp1F5dz71Fs8s2I1dQ3NNon7J7IBrENyN/AG0MruyGg83BAh8HDChKtAoqGKeSCWApcAMf2WsSzcbidnnzKN7910MWfOnYTbFZrrft3g0/W7uPvRFbyzejNerz+caXU78CZwN6b6OULq7HlmqFsqgiAiBB4OKFgMUgoUZRxSfgu4Ecjst4wlURTB9IIx3HHDRVx1/skkxEWH9XPNrR28/N4a7nniTTZuL8Y0LVAO2xWqgSeAB4E9QOTYaRggQuChRN71kNQArbHJCJYEN6mmcJh1LlIyKiuVr19xFrdcdQ65WSmIQ6fDVgCzcT1IiZo0BxRXz2qAsqp6Hn7xQx564X32l1WHM62WwG7gfpBP4mqoxZsOe54a6pb80iJC4KHCpMUgpAdLnAcsBc4AXP2WMS3i4qK54vyTuOP6i5g1eSxqrymwxGotRN/3D/T9TwAWjtHX4si7FSWugENNblmSTbtKuPept3jhrS9oamq1p9X99wwd+ATJMoR8G0lHZJNraBAh8PFGwVUgTBXpmIntiHEFEN9vGcvC6XBwxrxJLL1xEeedNp0ot7PXZdJfi176DHrR/VjNO+zRGkAIlNgJOMbdimP0dQh3eq+yPn+A9z/fxt2PreSjNdvx+wPhrI9bgVeA5ShyPVKYkWOn44sIgY8XChYDUoAyCuQtwM3A6H7LSIlAUDA+h9u/egHXLppPSmJs78vMDsyqdwgULsOs+xRMf2/LSkBxoqacgjN/KWrGRQit95q5obmN5978nL8/+Sbb9xzAsmQ46+Ny4BEE/8SiBBFZHx8vRAh8rDF2EUTHg6EngLgCe9SdQX/uj8F1bkZaEjd85QxuXXI+40an917nSgOzcSP63nswyl9BBpoPb1EJwhGLlnUJjvw7URPnguI45OclxeU1/OO593j05Y+oqKoPZ31sAduB5SCex2M10qhBSUQocSwRIfCxxKSrAFxIsSB4LHQO4Om3jGkRE+Nh0YLZLL1xISdPz0fTenPdai9GL34Io+RRrPYDA7ekBBGVjSP3Rhx530CJGcehlRimyfrtxSx/bCWvvr+W1tYOUA87rfYBHwHLEPIDwMvOyPr4WCFC4GOByVeBaijozqnA7cBiIKnfMpaFQ9M4eeYE7rxhIYsWzCImyt3rMhloxCh7Ab3oXszGzSCtI7eiBISCkjAV57jb0HKWIFzJvS5r9/p565PNLHtsBZ9t2E1A18NZHzcBLwD3INQtSMuK+FcPPiIEHkxMXAIBBdxWFtL6GohvAmMJw/1x/Jgsbr3mPG649AzSUxJ6X2f6MGo/RC9cjlH9ge1mOVjWk4DqRks7E0f+UrS0c0DtPVGobWjhqTc+5b6n32Z3UTkSGc6x0wHgIaR4GMUqQ0Zki4OJCIEHCxOvBohFiEuxj4XmAFqf1wfXuanJ8Vx78el859oLKMjLCrHONbGatxEoug+j9Dmkv+HYWU2CcCai5VyBY/x3URNmgOg5fZdSUri/ivuffocnX19FdW1jOOtjE1u2eDeW9QoOVwu7V4FRekxN8mVAhMBHi0lXgSWdKMopSHEXcCHQv0uUZRHlcXP+6TO468ZFzJ89EaejN9eltwy95FH0ff/CaisGIY/PM0mBEj0ax9hb0MZ+HSVqFId2FV03+WJLIXc/toKVH22gvd0XzvrYi+RdBHejiFVIApEge0eHCIGPFAWLQSJQmIjkNuCrQFq/ZSyJqirMnpLH0hsX8pVz5hEX03uqKvUWjIrX0Pcux2xYD5Zx/C0lAUVFTZiFY/x30XIuRzgSel3W2u7j9Q/Xs/zxlazdUohhmAOQLXIfFjsix05HjiON5PDlxbiroHEnJE9KQ4hvAX8GLqY/0YGUCAljRqXxHzdfyu//4zrmz5mE23mI6MAKYNauwr/1J+h77rZHXY5ik+poIAAk0luBUf02VtMWhCsVJSobxMHZgsupMW3CaBYtmEVyYhzFFbU0NbYF6+jzxqOAecCFCFxIuY+vO9toOw1qdg7Bw45cREbggaBgMQiisbgQwVLgNMKU+V114Sl897oLmT4xt0vm1/1Cq2UX+r4H0fc/ifTVDD/LSBDuFByjluAYdxtK/FQOvUkpJdsKS7nv6bd5duVq6utbbCeQw8sWPwexHMkKoI3dkWl1uBhu3WR4YuI1gKKBMQfBncBXgNh+y1gWbpeTs06eyl03LeKsk6aElPlJXzX6gSfRix7Eat1tb24Na6sIlNjxOMZ+E0fuDQhPVq8r/AGdVet2cfdjK3hv9Ra8vrBki23ACmAZgjUg9cj58eExrLvKkKNgMdhtNBb4FnATkNVvmaDMb+qEXO684SKuuvAUEkPI/KTRjlm1kkDhPZh1n4EVGDnWkIDiQE0+Cef4O1CzLkFovVcQza0dvPTuGpY/vpLNO0vClS1WAY+DfBCUvSAj6+N+MFK6zPHFhMXgBAySsJ0wvost8+t7GAkeC2VnpvC1y8/im1efw5js1BAyPx2zcZ1N3IrXkHrryLWCBOGIRs1chDP/TtSkk0HpKbKQEkqr6njohQ94+MUPOFBeE65scRdwL8inwVkHftj1wlA/8bDDSO06xw6TrgHwIOU5IO8CziQMmV9sXBSXnTuPO29YyJzJeahqCJlf2170ff9E3/8EsqP8xGl9CcKTgWP0dTjGfQsldiKHPpxpWWzaWcLfn3yTF99eQ3NzWziyxQDwCbAMKd+BiGzxUJwoXejoUbAEFEXBtGYiuB3kVUBCv2UsC4dD4/S5k1l6w0VcMH8GUZ7eXJf+OozSZwkU3Y/VvG0ErHOPABJbthhXgCPvVhyjv4pw9z5V8/oCvPv5VpY9tpJVa7bjD4TlltkCvAzcQ0DdgGaZ7IlsdMGJ140GjolXg6ELHK4ckDcDt2BnOegbQffHgnE53Hrt+Vx/yemkJMb1vsz0Yla/g154D0btx6FlficaOmWLqafZssX0C0LKFuubWnn2zc+498m32F5YipSHdcsEO5vEv0E8hBbYj6nJL/tG14nenfrGrFugrRFURzzIy7FlfrMIQ+aXnprI9Zeewa3XnEd+bmZI90ezaZMt8yt7GRlo+vK1tAThiEEb/VVcU36O8OT0vkRKikqr+cdz7/HYKx9RWd0QrmxxC5J7gBeQognVgJ0vDvUTDwm+bN3Khp3lwAVyPnbY1vMJQ+YXHe1h4ZkzWXrjIk6ZOQFHL5mfxGo/gFHyMHrxw1jtpcfP/XG4QYJwJeGc/P9wjrsNy18H0kKJ7p3CyTBN1m4tYtljK3n9w/W0hS9b/ADJ34CPAd+XMeztl4vAB4+FpmDnz13CYbMcWGiayrzp+dx14yIuPmt23zK/8pfQ9/49KPMzv2yt260xQERl4Zr2exy514FQCez6M0bpMzjyvo02ajHC2Vtd2d7hY+WqTdz96Aq+2LwHXQ8rm0Qj8DzIv+N0bEU3rS+Tf/WXo4tNWgIODXQjEylvxD7T7a1g747gOjdvdAbfWnweN12+gMzUhN7XmX6M2o/QC5dh1LwPxiDK/EYiJCix43DN+F+07MvAMtD3P4p/68+Q3qqgbPEsHPl3oqWdHVK2WF3fbGeTeOYdCosrws0mUQL8CykfwbTKURX5ZdixPvG7WsESQMaAuATkUmwf3P5lfpYkJTmeaxadxneuvYDJ43NCrHMtrJbtBPbeh1H6LNJf/2Vozf4hQUmYhnvWX1HTzgXTS2DvvQR2/BYZaDzYPhKEKxEt5yoc424PyhZ7jrRSSnYVV/DA0+/w5BufUFvXFK5scQO2N9erQAvyWdh14hrmxH2yCUtASgeqODl4nruQMGR+Ho+L806bwV03LuT0OZNwOUPJ/MrR9z9my/xai76869wejQJq6mm4Zv4FNelkpN5CYPf/ou/5K1JvC93TJCgxY23Z4pivBWWLPRHQDT7btIdlj63gzVWb6OjwhTOt7gDeRnI3ktVAgD0n5vr4xCNwwWIQQmBZ+QhxG3AdkN5vmaDMb8akMdx10yIuO3ce8TG9M3dKoxWz4nUChcsxG9aBpZ+ILXgEEGgZF+Ca+ReUuMlIfx3+7b9E3/cvsHz9F5WAoqEmzsIx/g607MsQjt5Rdlvbvbz2wXqWPbaS9dv2YhhhuWXWAk8huQ9F7j4Ro4GcON1vwjWQ/CE0nJGK4KsgbgN6RzLvjqDMb3ROKrdcdQ43X3E2ORlJobMc1H9uh22tehOpt59ILXd0kKBmnId77j9QoscgO8rwb/kxeukzII0B1YMWhZZxvn1+nDK/VzYJgIqaRh55+SP++dy7FB+oRgrCWR/vBR4A8TjW7mqU8SeMW+aJ0Q0nXQWSKIS4IBgV4zRsb+bQCMr8EhJiuPKCU7jj+ouYMXE0SsgsB3vQix5AP/CUvQlzYrTY4EGCs+AHuGb8Gat1N/7NP8CoeMP+4gjrE+5UHKOuwTH+NpS4yYTKJrGt8AD3PvUWz735OQ0NLeFmk/gcO+ztCqD9RAiyN7K748SrQVoqijYH5B3AZUBcv2UsC5fTyVknT+HOGxdyzilT8bhCZDnw1aAfeAp93wNYLbtOTPfHQYKIGoWWeTFW4wbMhrUcMXk70emWGZuPI+9bOHKvR7h753rzB3Q+WruDux9byfurt+ALL5tEG/A6sByUNSCNkUzkkdklJ10NiimwtDFIvgF8Dcjpt0xQ5jdlwmhuv+5Cllx0KknxvSVw0uiwZX57/45Z++nIkvkNJTo5O5ht1SVbPAVn/h2omYtCyhabWtp5/u0vuPept9i8ozjcbBKVwKNI+U+cShGGlCMxLczI6pqTLwEzDZSWROBqpPguMI0wZH5ZGcl87bIFfHPxuYzNSQud5aBhHfree+0sB3rLSGudExdBt0w16xJbf5x0UohsEnCgspZ/Pf8+/37pQ0orasOVLe4A/g48S6u7nsQO2DZy1scjp4va7o9ukGcB3wMW2P/uB6ZFbGwUl5w9l6U3LmTe1HF9yPz2oRc/hF7yKLKjbCS1yvFDcFp71NPjo7wH4cnCMeZ6HGO/hRI7nl6yRdNi484Slj++kpffW0NLS7t9xty/Tf3YssW/IXkPhHekhPUZ/l11wtVgWgoOZRqIO4CrgMR+ywRlfqfOmshdN13MhafPIDqUzC9Qj1H6HIG99wVlfkMUQG64Q4KSNAfHqMWYNe9jVL09pPeCUGzZ4rjbcIy+FuFK7XVZhy/Au59t4W+PvMGn63cRCE+22Ay8BGI5ptiMIs3hTuTh210nLgGvG6I7cpDi68A3sGV+h3V/nDA2m9uuPZ/rLj2dtKQQmTtNL0b1e7ZaqOYjMH3DuSWGGAI1/VzcM/4PJWE6RumzeNd83c4MMZSQgOpCTZkfzLZ4PkLtfXZf19jKMytXc+9Tb7GzsCzcbBKlwMPAQyBKh3NYn+HXbQskcA3Yu8mXBXeX53A4mZ8lSUtN4LpL7Wx+E8f2JfPbbK9zy174csr8BgKhomVfgWvGn1CixyJ9Vfg3/Qf6gaeG+s4OQoJwxqNlX2Znk0ic3SPsLdhumXsPVPHgs+/x+KsfU1UTtmxxE3AP8CK60kxOO3z0+lA/cQ8Mr+47aQkI4cSy5mOnJ7kAO4Zw3zAtoqLdXHTGLJbesJDTZk8MIfMDq+MARsm/bZlfW8lwe/LhB8WFY8xNuKb+BuFOx2rbi3/zf2FUvGIvNYYbJCjRo9DGfA3H2FtQosfQS7Zo2Nkklj/+Jm98uJ62Nm942STgPWAZko9B+IfTtHp4dOMu90c5CcFtwLVAar9lLImmKsyZPp6lNyzk0rPnEBsdKstBE0b5K+h778Fs2PjllvmFg2D+YMeEpTgn/gDhSMBq2oRv039g1nww1Hd32HtHqCgJ03GOvx0t5wqEs3e2xbYOH298tIFlj61k7eZCdCMs2WID8CzIe9HZjiqs4eBfPbRdOf9qqLcgXWSAcgOSbwO9txa7I7jOHTsqnW8uPpevXX4WWWkh9rQsP2btJwQK78aofg+MjqF+2uGPYPB25+Sf48z7JqgezNqP8G/6ge37PVLaTwKqB9fUn+Oc+MNeCdo6UVXXxOOvruLBZ99hb0lluLLFYuCfCB7B46zAr8P2oRuRh84kkxYDxCC5GHu6PI8wshwkJcWxZOFp3P7VC5iSP6p3lgNpYbXsQC+6H730GaSvbuR0vCGGiBqFa/ofcIxaAigY5S/j3/IjrNa9I64NtYyLcM26GyV2AtJbhtRbUWInhMy2uHNfOfc//Q5Pv/GpLVsML5vEemAZUrwGtA7VtPr4m2XC1SDRbJkfd3K4vEJgy/zcLs49bTpLb1zImXMn4XKGyHLgrUDf/zj6vn9ite2NuD8OBBKck36Ma/rvwfKjF/8b//ZfIL3VI64NtYyLcM1ejhIzHqttH/6NS7Fad+EYewuOMTeFjM8V0A0+3bCbZY+v4O1Vm+jo8IezPu4A3kSyDMVcjSV0dh9fJ5DjZ5pJi0FFYDAe+DZwA5DRb5mg++PMyWO54/qLuPL8k4mPDSXza7NlfnvvwaxfE5H5HQkkaFkX4yz4EUb12+iFy5GB5hHXjr3JeydG5YqDssWkuXa2xayvIBy93eZb2ry88t5a7nnyTdZvLQo3m0QN8CRSPIBi7kYqx+3Y6dibp+BKaD4P4j5IQXANcDswicOtcyWMyk7l5ivP4pYrz2ZUZmrvWY2l2zK/vfdgVq7oWzgeQXgQCkKLQxrtIPWhvpsBo0/ydkenbDHzItstM2V+r2wSAGXV9fz7pQ/51/Pvs7+0JlzZ4h7gfpBPMubyGg68DjuePqbPfGy7ux1ELgo4D9v9cT5hyPzi42O44vyTuPOGhcwoyEUNKfMrPJjNz1sZIe6XHGGRtzskCHcajtFfxTHuVpS43tJxy5Js3XOAe558kxfe+pzGxtZwZYufAXcj5FtA+7GMXX1suv3EJSCFiiJngbwTuJywZH4OTp83me/dtIhzT5mGxx1C5uevRT/wNHrRA1gtO47LOlcI+yekHFJP4MGD5IR64Q2YvD3aQaDETsAx7lYco69DuHsHb/H5dT5cs52/PbqCj77YFq5ssRVbtrgMqa5FWOaxkC0OvhknLgZIR3AH8HUGIvP76oUsvugUkhN6Z+6UZgdm1dt2OJu6T49blgNLCho6nOiWQqIngFszj7guQXA5FXwhmLZQ6vghGKtZiZ+K1bIT6a8dUHFVCd6/7Kquz2cQAlTR00QWYA6yD8gRk/eQdkFxoqacEnTLvChkNomG5jaee/Mz/v7kW2zfcyBc2WI58G8ky4HqwY5dPbgUsI+G4pHcj+0P2e86t1Pmd9NlC/hWfzK/xg3oe/9uy/xCbKwIEdQTii6vShRx9COmENDsdfCdl+exoyaeZZeu46y8WkzZ9/WdjxaqoRu8TrZXx9PoddIW0JiX00B+SusxIXHnkk2IrqZGiRmHa/rvUDMWEihcjn/bf4ftVWVaghW7s9hcmYgSDOLn1kyumlbKmMT2Hs8gBOxvjOL5raPxGmrX7GVaRjMXF9gRXwcDg0Le7gg6sahZl9j648R5IWSLkuKyGv7x3Hs8+spHVFTVhytbfCbopNQ8mLpj7eirOOQ24VzsBNh9P1FQ5nfpOXO584aFzJ06Di2kzK8YveRhjJJHglkOeteqCKhrd7K7Lg7dVBiX3Ep6jI+6dhdRTpM419FtxphSUNPqoaIxCq+uBefSva+zpKCuzYWiSJI9AcQhkSoVBbZWJfCN50+mwevEqVrcfel6ClJbMQaZwIqADl2luCGailYPyR4/kyfko035NU2uU0k2NdBbBjb8C1hVnMY/1+ahKRLdUIl2GMzNqicvod1+qYmuS2n0uvjHmvHUddgqML9PY/HM/Vw4oRJNMY96KTLo5A3euDRaMfY/hVn7MY7cG3HkfQMl5mAIcSEEeaPS+c1d13LZufNY/vhKXnt/Ha39Z5MQwFeQPAcMag4Y9eir6IaUKQCXAItCfm9ZOFSV+fMm8Yf/uJ7vf/0S8nLSUA6ZhshAA8b+x/Fv/iFG6fN9HmeYUrBydxY/WjmTZasn8uyWXN4tzKTB6+K/356OlIL5Y+qxui2Tu6axnf8Wfc+COkevJp+DMUntnJVXQ1qMv1fnEwIaO5zc8vzJrCpJ4/z8Klxq75FNEZIYp4EqJCWNMSwsqGR6RrM9gxukuZAQsL0qnl++N43ffjCFJzeO4rkt2ZSKs/l0r4NfLX+CudErSW/5N9L09SjXn/+CImBMYjvn51dx7fT96JagsCmNr156JvkzLkKqUfbZexAxLoO5OQ1cMaWUs/Jq+Hh/KuOSW7m4oBztMCNwl036uJfu5JXtRfg3Lu0iryDkez7sursq0Vsx61dj1ryPQKJE5yG0g0eYiiLIyUjmojNmMm1CLjWNLVRUNWCaZl+N6MB2/lhN3Y7BMTaDPQIHny10wwnG52Vz65LzuOErZ5KeHErm58Oo+SCY5eDDgzK/EO2hCHi7MIOlr85BSsHlk8vIiuugsC6Oez/Lp7Hdhc+wb8WwRFcZwxI0eZ3EOA1iXAZNXgdeQyXereNxmF2DkpT2tQ5V8t1TC5GAU7WwQvQ9BVCEoLbNA1KgCoFDPTiF71wnjk7o4Mdn7eaBL3Q+KUlDCIlhCeranZhSkBC8B+sIhydFwNaqeL778jy2V8Vxal4zp8w7Fd1TwAdfbGfb2+8Qq7Vgla1GZjV3lbGkoMmr4dVVFGGTL8Zp9FqCTExtpSCtFU1V+Kx8NHKfG8fYr6MWTMY9pgbf2psxKlYgBcQ4Dc7Kq0FR4ECTB7dmIg+zYuuyT4cDv6niVC0S3DqObu1+KHnb1t2FUbESl2aX9RlKV+wBl2p2cSmcunt2WAALq2kbvk3/iVr+Es7876GlnwPdZIvRHhdXnn8SZ8wp4KkVn3LfU2+zu7jCzrYYJjeOBseCwL0hJekpCTz6hzs4ZUZ+iO9NrOatBPbei1H2PNLf2O9rVGBPEZ/elEu738F9V6zh0snluFRJW0Dl9x9M5q8fT8KwFJq8Gr//cApNXieZcV4avQ4+KEpndnYjZ4+r5pnNo9nfFM2CsTX89OwdZMZ5EcCmygQeXp+H31BRhMTjMLl57j6mpjf3MLgQUNwYzSMbxlLT7qJNV/nDhwW4NKuL9FdMLmNCaiuWBMMiuIaWFNbG8rO3p/FuYQZeQ+W03Dq+f/puJqa2DHhdLID2gMpfPylgW1UcPzinlKU3XED6rO+DM4lNGz7guh/eR1WjQAbXvUJAWbOHpzbn8m5hBmXNUWiqZGJqC1dMKePSSeVEB4kM9t4CFqhRmShZl4Es7JqGC3caatJJGOUr7KkowReXZa+fD/c4QsDuulge2zCWj/alUdfuItET4LQxtXxtdjFT05tRu5G3trqEF5/6P1avqcJiDtMymsmM9bJiVxbtukZylJ9fnreV5OgAcJi6M5r7bm+B7Vdf9R6+hvVo2ZcHZYuzerhlpibFsfSGhZw8fTyXf/fPVNU2hpMu9ahxnAgMbpeD0Zm9lSG2zO+RbjK/MI6FBARMhdp2FwmeAHOyG3FrEtOCWKfJ1dNKeWpzLqYlaNc1PtiXxvaqBASQm9RGrNPgpW2jeGV7DmkxPlKi/TyxcSz5Ka3cNX8PQkBNu5v39mbQoau0+R0owPn5VUzLaO4xLClAWXMUT2wcQ12HC8Xr5B9rxndNv6OdBrMyG5mY1tpVTgC6qbB89UQACtKaiXUZPLc5lyavkweuWEO8Rx8QiRUB26vjeacwnQWTJN//9s2kTLkJlGjM+tVMbP4ZF+a18cj6sbQHNFQBe+uj+f7rs/mgKJ3s+A7yU1rxGyqf70/hw6J0dtbE8aMFO4hyHP2a9XD3vqUynrtem8P68mTGJ7cyMbWF6jY3D68Zx+riJO79Vhzz5/wJosdTsn8f3//tg6z4tBqXNgpVlTyzJZcYp0GL14nLYZKf0kLAVFAEbK7oo+6141hdksryy9YxJ7ux/5mPsJVtevG/MWs+wDH2ZrSxN6NEje5x2aiMZNwux3E7qjs+BA4FaWFUvEJg5+8wGzeCFb7Mr5MYM7Ma+bQkld9+MJlrZ+xnbFI7sU6d0Qnt3Hv5OnIT2kmN9vOvq77ga8+eitdQeeCKtcQ4Da58/AwUIbn3irWkRfv4yiML2FCWhFdXcTtMTh9Ty1vf+ABVSO75bAIPfjGOUOOIJWFaRiP3XraW778+hwRPgF+et5UYlz1yKUIyPrkNyzq0nGBUQhv/cfouLphQhZTwo5Uzebswk501cZyWW89ADqyEgK3VCbT4VM4/ZxEp024GKTDKX8K/5cfQuodrpsczLaOJ8Smt+AzBvZ/n8/7eDK6bVcJ/nLGLjFgvlhRsrUzg/701g/s/z2dmZiNXTS07uPMuwPJWYpS/CmLqQZv4ajAb1gy403afOWysSOI7p+zhjlMLSYzy49U1Htswht+9P5lla09l9lW5KC3F/OGe+3ltVRGXT63g2yfvJc6l88qOHP6+egKmJbjtlELuOG0PSZ4Abf7D1P3BVO7+ZCL3XbE2vBeVAKt9P/4dv8GofB3npJ+iZV3WK7fT8cLQEdgKYBx4BrNunT2MDdDwDkXyrZOKKG/xsGJ3Fq/tzCbKYZIe62NqehM3zi5hQkorQkB6jB+HapEa42daRjM+QyHBHSAl2s/c7Eb7354A9V4XAVPB7TDxaCZRcV40BeLdep83KIF4t8HMrCainAZxbp2TRjUQ79a71pCHriUl4FAtvnNKITfO3o8l7Q3MU0fX8caubA40RzNf1A/4DKyxwwkIUmIMMBrQS57Dv+PXXYKEaRnNTM+0ZxD7GqJZsSuLiWkt/NeCnYxPbusi6YK8Wn6wYCe3PHcyr+3KZuHECtzBJYH9ABaY7SAtZKAeWb0C3+57MKreHDiBBRTWxfJBUTpT0pv46oz9aKpFs9eJEBaL5iXxelkmH28oomTPZ/iLHuSVD1uYme3lfy7cQm5CBxLIT2mjstXDI2vziHfrZMX6MS3Y1mfdkgsnVPLqzhw+2Z/K/qZoJqeFuXQR2NFd6tZhHHgGLWMhqO4wCg4+ho7Adtc+4mmGKSEl2scfF25mT90+NpQncqApmuLGaFbuzmJVSRr3X7GGs/NqsQgu1YJnxAKJplr28ib4b4dq2Wu1bk4KnWfKhzOqDNYju91b/04aAkXYswiCZRUJLs0epv3Gkb3N7Q0whdod/ybw0f0Emot6+IdbwTbQFKho9dDQ4eLU3HKy4zowrYP3bwFzshtIj/Wxrz6Gdl3D7Qgc8kIRSKMN//rb8dYdwAy0HpEthYCSpmjadY3dtXFc+fgZwXNjC7AQWixNHc14NIvKz35KQ+1+Gr0nc+W0MnLiOjCCM5soh8n83Fqe2Dimy270UXd3uzV7nXhUi4YO18BvX3T1lCOy12BgCAl85LA3sTR++/4UTEvwy/O3cVZeLQFT4NMVXt2Rw52vzuXlbaM4Pbc2tGHkYf59BDel0LdXEiGdSgZvkSSBcUltuDSLHaUGHbVb7OOaQ47MdFOhI6DgUCyEkPgMFUv2vo+AoWCYCg7V6vuIS1pY/howjoy8nVCF3Thjk9qZl1OPlKAmzUVJmGlPTTv2E9XyDhliK80iHiHAp9v33f28PWAqvdaxveoG6HxeYe+Lx7l0suI6RqSb7IgkMNhv2N21cWysSOTaGfuZN6oRTUji3Sb5Ka24NJNmnwPDUrrONw898w317+7HDgJ7atv9MzW4O941qgehConHYeDVVaQUXfVaEuo7nLhUixingSJACXYVIWTXdcohvx3WuXC3jRJLwoysRialtfBWYRaflx5gwdjarg4tBDR6Hfxr7Ti2VsVzx6l7GJPYzprSZLZWx3PKqIYenf/twkyqWt0sKqgg1qnbMacObRNhH58pCmD1bJNOTzC7zWTwUEHa7phKz9nNuOQ2EjwBEtwBfnbODnImnI1jxn/acZ/b9lD7+X+yeXMx0U6T8SmtZMX6+Kg4jW3V8czKakIANe1OVu7OwjIP7gz3rnt71zq/s/1b/Q62V8fbx2ZD3amPAMfCkeN0bPXRQUhIiI/mG1edczBulTQwyl/Gat5+RBsflhS8VZjB+tJkylqjSPAE8BkKa8qS+OsnBRTWxnHD7BLm5jSwrjyJV3fkIIGpGc24NYsXt48iYKrMzGog1mXw7NZc/KbK/DG1JEf5KayPpaghlooWNx8Xp7G5KoGpGc0IJKVN9jlgnNvouh8JfLgvnY0VSRSkthDlNNhVE8eTm8fw+w+nIIBpmU1sq47nk/1prC1LYkJKK2kxPjwOk501cazen8LnpclMSGklOcpHglsP7XYoQTgTUNxptvQPex4Z6zRQVckbO7NZW5ZMlNPA4zCpbXfx4b40/vDhFB5dn4dDlVw+pYxop8kbu7LZWRNPgsePSzOpbnPz3NbR/HVVAVEOk5+cvZ28pA7bcaNbm3y0L43t1QlMz2zCklDaHIUQdpt0dxstb/Gwtz6W13bmEO/WGZPYTlWrh7oOF0meAKqQxLt1ylqieGNnBg1mFjlzvosSO5Hysn28/fJf+b8XivnLqgJSY/ycPa6aFr+DFTuz2ViZiG4JdtfGsnz1BFbszsayBGeNq2b+mDosycG6d2VT3+EiNdoPQGWrh4/2pXH3pxP5yycFpMXY+yEDJbEaPwUt+/Iul8vWdi8PvfABTS3toY6R3gU+He6OHMcFAolDSJyaya6aOG545lTcqkWHrmJZCldOK2XJ9APUtrv4/uuz2VcXixCSb794Ev+7aAMqsKk8iR+8MZsHrlyDAmwuS+K+z/P5zQVb+PW703h3bzqqIgnoKn5D5dfvTkVTLUxL4Sdnbec/z9yNEZwaRztNrpxayiclqdz60knEunS8uopX18iK8yKEpKbNzc3PnUJRfSy6ofB/H09ia1UCvz5/C994/mQK62LRDZW/fVLA+0XpPHv9J7bn1yE7YErCVFxT/wclblLQC+mtrpfg4mkHqGt3sXz1BL778lzi3TqWhFa/A7fD9l3+3um7mJzWQlacl/KWKB5ZP5abnzuFOLeOaQmafU4yY7387JxtnDK6Hgvw6iq/enca7wXbxK9rBAyFn709HU2xsKTgZ+ds5675e5ACVu9P4a5X5+A1NKSEdp+Dj/elsbYsGUtCXlIbL964isxYHy7N4q7T91BnjuW5zRm88v0XiIp6Az3go7W1GZeWyam5dUxIaUURcOtJe2nxOXh84xh+8MZshJB4NJMJKS3sqYvr8tWW2PsKd83fTU3wxfTKDnuzU7cU2vwaLs3sqvtIHWiGEiOXwAKmZDQT7wlw+ZQy3tqTSUlDDHFundNya7m4oILkqADNPgdfn7OPVr/9hvQ4TMYlt3HLSUWUNVeQEu0nJcrPLfOKKJ9YydT0JqI0k0smlVOQ1tw1le3uAm1JwZycnlNOS8IlBRVEOUze3ZtBdZubBHeAmZlNnJlXw9jENjp0jZtmF9McPFfu7MiJngA3zi6myefs+jw12k+Uw+y1caSmn4Vr+p9Qk+ba+Zu6JfuSwee787Q9nDK6jrf3ZFLcEI1EMCaxjfPGVzEvp4Eop+3tleDR+cV5Wzl7XDUfFKVT1uzBoVpMSGll4cRKpmc0oQiJlODULC6dVM6kPtpESpiddbBNxiW18e2T96JbSg+fnM7NwaSoQJeTiATGTjyTBxf9gjc3tvPRx29Ttfc9PJqP8SntnJZby6zMJuKCL6PEqAA/P3cbl04qZ2NFIoYlmJbRzI7qOH713rTgqcFBu4xO6ODur6zn4j3lrN6fSm27iyiHPR0/tO6RhsE9arYF/D8C/tDjc0syZlQanz75G7LSkuzPTC++NV9HP/DsEd+Fz7BXAB6HiRV0o9NUiVuzutZXXWu2YJlODyG1m1LHtA6u66xu/+7PNd20CGlwNeiy5zftjSKnJg/uimLvAB8qsbOsnvfYeZ9G97NjoaGNWoxr2m/tIOv+OgI7f0+g6L6QWRLUoIukN7ij7dYsVEViWT3fCQJ7TWpY9gagIiRux8Ed+h51Kv37AprdnrNzHd/n/le35+vhHtlRQvvaO+goexNVsW3ZaZfuMxHTEuytjw3ucwiKG2O4//N8qlrdPHPdp8w95AXbuR4PmIKAofRbd9iQ4Bi9BPdJ/wbVXhpW1DQw/7r/pqS0JtRGxo+BPw5muJ0ROwIDeILaXCntDYkoh/3v7prTXkQI4lAF0KHXmBYDcqToKhe8F49mOwUcqn81+lDv9fU5EoQWg2P8rTgLfoJwJWO1FeHf+lOMshdBGn3eB8iDbURoLW7n54KD7deXDHMgbWJJwhrRQqmKZPUKohwH6zn0ZoSA1oDGj1bO5LMDKahBn/JYl8HS03YzLaOp129L2fniPvicoeoeaRjRBB7sk6BjeW9HWolwp+Kc/DMced9EqFGYDWvwb/4hZu2qsH5lIPdxvNuvP0lgv/ciwa1aXDm1lLk59bg1i+QoP9Mzmpie2YRTtfotP5z6yVG34VDfQAR9Q4nLxzXtd2jZVwACo+IV/Ft+gtW8c8SHxDkaPa8E3A6TW+YWH7I30dOh5suACIGHKYQrBdese9AyLkCaXvTihwjs+B+kt+pLTd7uMIZhiqbjjQiBhyMkoLgQrmSkv4bA7r+g770XqR+hx1M3IcJQ45hE0vgSI0Lg4QgB0luJb80tCC0Ks3EDWIGBE1ACQkV40ux/+mo4sq25wUGEvIOPCIGHLSyspi32X49w1BWeDJzjbkMbfR0IYe9cH3huSEbiCHmPDSIEHmr0J/w+GqIJcI67FeeUX3R95J51Dz6jHaNixXElcYS8xw5Do0KOIAgFJToX4Uo9+qq6Q4JwZ9gjbzd0hr05ntu0EfIeW0QIPBSQgOLGMfZmPAvexj33HwhHwlDf1aAjQt5jjwiBjzckCGcirsk/xTXz/1BiJyBcyX0moT4iCJC+Kvzbfob0VR/86SMMe3MkiJD3+CCyBj6ekCBixuCa8ksco78KihOz5kP8W/4LGagf9J8zDjyPz+hATT4ZALP+C4zKlcecwBHyHj9ECHwcoaacgmv671FTzwIrgL7/cQLbfo7VVnxsSCUkRsUbGOVvdPvskD8HGRHyHl9ECHw8IBxoOVfgmvoblNgJSL0ZvfAeAnv+72AM7GP228H/UFBi8lAzLsCsfh/pLT9yx5A+ECHv8UeEwMcYQovBMe42nAU/QrhSkB378W//Ffr+pw5mnjjWkKCNvgrX9D+ieHKQgQbMhrXoe++1I0kOwrZ0hLxDgy81gUXwf12Z/IKfB5V4IUPC9llPCEgJ2pibcE39DahuW0m05ceYNR9yNBE5BwQJWtYi3LPuQbhtjyzhTkfLugQlbhLWxxditRYd1b0MNnmPuV2OQTMPFb6UBO4MIOfTFZp8DqpaPVS2eGj2O5DSzg2U5AmQE99BcpSfaGc3/egh0E2FgNl7M18ATtXAIU2k3oxZ8Sr+bb/AatnVK1LkseSxHeHxpC7y9miHmHFoOVcS2PHnI76JwSTvcbOLZh42wdpIwZeKwIqwIzkUN0XxaUkqn5SksKUykcpWD15dRbfsBaOmWDhUi+SoAJPTmjkrr5pzx1czNqkdVciuDiOBJzbl8saubDt8KQc/9zhMlp62m3nuR+mo+wTZUY4MNPUiSrPPQatfO2YkFhg4D2wlOq0azRWLy6nidjq7MkKKrv8NHINF3uNul/m7mXu4VCojBF8KAtuhcwQ7a2J5dstoXtuZzb6GGAK62q3zHpzS+lFAQlOHi6LaWFbuymJschvXTt/P9bNKyIn3IrFjE39UlM5bO7LtyOwHf5F4d4Bb5u4DoxGraXufuY3/sWY8930+ftBHBDuNqkRRJA7NR2zSH4iJiSM1KZastCTG5mQwJa2OsQ3Pk6aBU6VXuJ3+MBjkHUq7dMbqHuk44QmsCDsu8xMbx/DQujyK6mORUthJ1PojTWfUfQGGFBTWxvG7D6byXlE6Pz17BwvyavDpKuWtHlClXV8npETTTDu9SlddodHsc1DTHNX/vRw1JFSX0X0BqWga0W6T7Jh8zhqXwKKCCk4eVU+M0ziYB6kPDAZ5h9wuJwB54QQncGe+3N9+MIW3d2cSMNVg9sMjsJ6QmBJWl6TxnZei+fX5WzhpVD1VrZ5QF6OpkhinHmbdHNk9Dej+e04BLCStXoVd3gR21Sbw9OZcLpxQwbdPLmJudgOKIkN28sEi74iwywjACUtgIeDj4lR+8uZMNlckHnkH6VWxpLQpmp++NZOrpx2gxecg1FxMFRKnNsxDRnTl9oEmr4NnNo/hk5I0vnf6Lm6aXUK00+ixThysaXPELoOHE5LAioBVJal877U57KmNC7+D9Jrv9nHUIySVLW7u/zzfnm6GuEYRsscGyrBHkMzlzVH88p3p7G+M5r/O2kmSJ4AlB2/kPSHsIg/5cwhxwhFYEbCjJo6fvjnj8J1EAlIgBHicBm7NRFMtVCExpSBgqLQHNHRD6T3NFQR3R0PDTgo2gA4aIsHYYe99QNvHYZ47C0l7QOWBL/IxpeDn524nIfdcnLOOnrwjzi59NWNUDlr2ZcjWPUOWF7gTJxSBhbA3hf700SQ2licdppMIEqP8zMupZ25OA1PTm0mP9RHv1nFrJl5dpa7dxd76GNaUJfPxvjQONHqQdMtC1g80IcO5jDiXn7TYFjQlOK0TCggV0xLUdbgw++iM8R69Kz1pX7CjNAr7v2CweZ+uYppK/+tuAbopeGjtWJJSx/KzRf9z1NPmY2KX0mQ+Lk7jQFO0vV4Po73DtUtoKKhpp+Oa8kvUtLMx6z/H2P8okfSigwQBvLIjm9d3ZvfdSaQg2mlw8aRybpxdzJzsBuJcRsgUoAI72fX1M0sobEzmsb2X8vgn0NTSelgS65Zi76r2A0vCrWd6uWnJSQgtGoTArP8Cq+p1KlujuPbJ+VS3eno9ixCSO0/bzU2zizEspZ97sEergKngMxTqO1yUNkWztSqezw6ksK8+Ft1UQreVAL+h8fcPY5h+biuLzzjyc95jZpdZ+9lTF8sj68fy5KYxNHudh52Wh2OX3vcGwhGLY+zXcU78ASJqNNJoxah6086/PITRAk8YAgsBVa1u/r0+D19AC30UIQUZsV5+uGAH18/aT6zLOJhBoC+7S3C4PMw+81vM+NpS5r5TyE/+8hiVNY39klg3FQzr8IZNmXIzzim/PPiBv5rAunbEzvf6PBsWQKJHZ3S8D8Ps9mE/P9fdPdFvCMqao3hlRw7/XDuOkoaYPknc1NzK7+59goktRYxn5fCyi2IxLb2Z/7lgCzMym/jlu9OoavH0S+Jw7dL9d5TYfJyTf4pj1BJQo7BaCwns/C36gafQsi8bcJsMJk4YQb8i4KPiNLZUJvbRSSAxys8vzt/Kt07aR7TTsLPSH272I0FJmIWa/x+4ojO4/nSFny8sJ9al9ztzMqUI6crXvd5QYW9wpSMST8KyDpddQIGYPLSCH+KY9muUzIuxLNHV8Q/9zwzmfDIsUBXJ2KR27pq/m39e9QUnja4LvQYPNuzm3ZXc+1o5fkMMeKw5ZnbhYJ4rp2px3cwS/vvcbcS6A0dnl+6VCwda1sW4T3kCx5ivg3BgVLyO74vr0UseBSPAwFtkcHFCEFhg+8++vzcdXyB0ZAsh4KbZxVwz/QACGf5BvgCrfT9G5evoRQ8QWHsLi3Pf5NqZB/od8SxJeB3lSCAtlJixuOa/iGv6H3BO/m/c8/6FNvrqsKvozGBw6uh6/nrJBqZnNfbT8RVe3pHLuvKk8BKPH2y6Y2eX7s0RrOea6fu5dsb+QbGLcCXjnPRj3Cc9jJo0L5hM7rf41t6MWb+W4yZGOQxODAILaPQ62VCRFLpRpWBMUhs3zi7BdZi8OaEgvWX41t+Ob+NdmC178Dgsvj6nmJz4jj5GLmlvGhn9hMkJhr0xDjzZs6SvBqthTb+7m1JadrqV2Bld1wl3Oq6pv0G4Mwa0p2JKmJnZxM/P2UparBG6bDC38WMbxuI1lLD77bG2S882AY82CHYBUKNwTf8Drik/R7hSMRvX4Vt7C/4dv0P66oYFcTtxQhAY7IzrtW0uQvZACaeOrmNsYtuRO7CbXrD8dmpRCZPSWrhwQmWflxtS0B5Q+7e1hEDRAwS2/wqrbS9G5Rv41nwdo3Ilgv47mdCiQ38mBr6tYUm48IzZ3HTZ6Yh+1vXv7U1nV23cgHZxj7ldumGw7CIUJyJ6DNL0oZf8G9/n12OUvwZSH1bkhROEwEJAXbsLf19TIwETU1vxOPp5y0sBwkG4FnJpFhdOqCTaFcItT9ibJS0+R//VCZDeKvzbf0PH+2fi++w6O2YVKsKdhhAqITu+EMFsDa09PjZqV4HeNOBOpmZcRMy8ZXzz+uuYPD47tD5PSKpaPbxbmBH2SDkodhkgBsMuUm/Cv+l7+FZfhX/DXVgte4YdcTtxQhAYwG8oWDK0uFYokihHP2emwoGWfSnuufehZZwf1u9JCdMzmvqcrhmmQrPfeXi7CwAT6a1EGi0gQBt1NZ7Tnrc1vCEWhUKomNUfYu76I1brnuBU/Gn8G78fPNYIH50eVkSNY0JqK1fOaOhzF1dagveL0mnyOsIehY/KLkeAwbKL1bQdo/LtLpsMV5wwx0geh2m7yIU40JeWoK7d1XtgkSCc8TjGfwfnhP9EuFLA0jGq3+8zcXZXUQnJUQGmZTSzuzq+12/qlgj644aJ4HmnEjsO1/TfIVoToZ9ptDRaCez4Pebeh0DRINCM1AfW2Q51jzQ23cW5KV/wQOx8alrdvesSsKs2jv1N0SR6msIaNY/ILkeBAdmlv6Rvw5i03XFCjMBSQrwngEPty0kAvihNodHrPDhySOyd3Fl345r8C4QrBbNxA/qBpw5L3mBxPA6T8cmhA8NZph1VYmAPAlrO1RCVx2F3ogSAZY/c7aUDHilC+TYHKlZSkNLMvJyGPl07GzpcbKxIDGs3+ojscpQIyy5eDSUqB0feLahJcwbnh4cIJwSBATJjfCRH+QntwS75ojSZl7fn2KOuEKhpZ+E++VEcY74GQsUofQ7fFzdi1nwcfuMJGJvYhlO1wBIH/5MCoUjbbXEgo4sAq2UnWB0DKjPQ0aIvYYIEYt0mJ42q71OTaxgKu2viws7NG7ZdBv4YfaJPu1iAMAjEnoRj3qO45/0L5+SfhtwQHCk4IabQUkJiVIAp6c3sqYkL2RO8AY0/fDiJaLfk6oXnEDXzF+AehQw0ou9dTmDP3Uh/w4B6kZQwOrGD3KQ2HKpFTlwHWXFesuO8ZMZ5mZPdMLBzTQFG9XtY1e+DesYxaatwVEUTU1uIdhq0B0J3j6KGGNoDGjFOo39nk7DtMplop85lk8txa1bXGfWRIrRd2slO0hg95SuceuYSlNQJSKMVs/4LpOk/Jm19PHBiEBiIdpicO66K13dmh1ajCFsq959vzGUtM7kl1mRyxg4cRb/BKH0RYQbs+cgAOo8pYVZWAy/csIpop4HHYeLRTJyaRHDQC2pA0NvtHeaUMwe9ncIhr5SQn9xKnFun3e/ovaEloLw5Cq+uEuMy+m2sgdjlP96Yzer9qdw4u5hJaS12wLrOACIcpV00naiEXGKm/Rh19PWgRGO17iaw47foZc+FtWQarjghCAy2cc8ZX83k9OaDQvFDIaCxDe5/5mNe+WALp45tYX7aOqZnxDA6oYMop01Al2ahiEPCmHb7e3dEO0zyktoPSkSDLotHhWOwgdKTvHvxb1iKUdXbt1kCyVF+MmO9VDZHhayr3uukQ9cQ+Hu2R6iNqrDsImnqcPKvNeN4fVcWp+bWccaYWqZnNDE6of0o7aKgpp6Jc+qvUVNOB2liVLxOYMevMBvWDX5DH2ecMAS2JIxK6OBbJ+3lh2/MwtsjMFo3BDtARU0jL1TDK+osYt06qdF+soNT4Kw4LxmxPtJifKTHeEmP8RPvDtgdyWHanUgejE083OMr9SRvEYGdf8Cs/bTP3MROzSI12t/n9wFDpa379FqCcMSBFo301YA0u8oN1C5VLVG8tGU0r+3IIdZ1dHZBjbHjchf8BBGVg9Sb0IvuJ7D7r/Z9jpCd5v5wwhC4E1dNLWVjeSIPrxtHvwNhMCCzIaGxw0ljh8tepwWhqBYuzcKt2Z0jM9bLmMR2xia1MSurkRmZjWTE+vA4rAFFcwQODh2hNqAEWA1rkc49gDmQWkOiO3ml3or01+Es+BFazhXohX/vnZlBgkORxLn6ihtlh2/1GZ37nwIt8yIc+d9FiZ2Isf8JAkX3I71VPZ4tfLsEA9ZZ4ijs4sXjduOY8isc426zFUQtOwns+DV62Utg+k8I8sIJRmApIdZl8JOzd9AacPDC1lG2IP5wxuoW6bATlhR4dRVvQKURQUVzFOtLkwHwuAyy4rycMrqOK6aUcfqYWmIOiR/VNxSU2Dy0nKuwWndhVr2HNNoO/rYAo2Il3n1bkb6ZIJxH3B49yOurBsXRlalQic1HTZyHb+3NGBUrejy7IiSufuJGmdL2JxYStMyFuOc93BU43jnlF4DEv/1XQ2eXUTVcOUfn/NMvwKG6MCpeI7D9l5gNG45o134444QiMNixjTNifPxx4SbSYnw8un4sLV7nkYdt7Rb4rdPwXl2lqC6WotpYXtuRzcKJFdxxWiEzMxvpdnVvSNAyL8I15x6UqFyk6cWoeBX/pu/3yOMLJtJXg5QmXR4eA8Sha97Arj/jmvLzno/mTkNNOgmjvCeBhbCDBvSHzmmqFiLrgzb6qwSKHugxClsSMmKPo112GVyy/3GWXiCZKv+N5T0xpsyH4oQ5B7a9qpLRshZCdB6p0X5+ce42ll+2jlPG1OJUgmeCg7VeDcYvbvHZ0Rxvfu5knts6GsPqWyEqHNE4xt+KEj0WhILQonGM/iqO3JvoNa88is7Wa7d5w1KMitfskf7QZjPae31mSggYfXcNVUjc/YzQQg0tqrAkx88uXpUn397LDb/fwLNrnZhyqJW7xwYnBoElKAlTcc99AM9pL+Cc8nMsxY1bM7lqahmPXfMZf754IwvGVxPv0RHyoMPFUSMYW2pvXRw/XDGLRzeMDd1ZJOBIRE2c3buKQXQkCH1UtBLpq8Q48FSPa622IozyF3u9LCxL4OtTcidQBLgd9vrcbFhjbwh1hzP0c4JN4uNmF0Vhb0MSP1wxp2+7jHCM7Cm0BBQHWvYluKb8EiVhOlh+ZEcpSLNrhzgz1sc35u3jiqllbKpIYFVxGhvKk9hdF0t9hwtfQD0YJylESo+wICT17S7+572pJEUFuHxKWe9ATnojZuMGNE9Oz8cIMQoeCfo85xWABYHC+5B6q71jLBQ7/lbbvp7PGVTsNPv6XnurioVHM4Pr9RXoJY/gLPjhwSq0aBx538CseS/ksw0ru4xwjFwCSxCuJJz5d+LIvxPhTEb6qgjs+Qt60QNgHdxF7dxcSvQEOHd8DWfn1dDi16hpc7OjJp699bEcaIqitCmaylY3jV6nvVGiq/gMDcvs1on6WxsKSW27mz98OJmC1BYmpbX02NiSejt60YMocZNs4T0KRsWr6PsfPeq5UJ/klSC0GNSsc1CT5mLWfopR+TZdRAhBBr+pUNPu6pMocS6DqM6ImBKk2dv1U02cDY5E0Nv7rOfI7SLw6SqWgb1gV5TDyDb7t8tIxsgksAQlYRquKb9Ay7oUFCdm4zoC236OUfW2fQ4ZqlgwNhRAnNsg3t3GhNQ2BBAwBR26ii9I3NoOFxXNUZS1eChvjmJvfSzbquOpbPEQMNR+QrJKtlcl8PD6PP7ngs09A9MJMCrfxGxYh5pyKgBm1bs9d6GPAP15WAktBtfc+9Cyr0Bo0UhfNb6Nd2KUPhf69rGjaDR0uPps+6w4Lx7NPDiQhVpHN24AvTGs5xqQXdqdVDvOpip6MWX1FnuKS9m8dSMV9cbBFC0DtcsIxsgjsHCiZV98cMps+tD3P05gx/8gW3cfmgLIRghPna7D/uAXipDEugxiXQYCyE3sQOQ0IrA7V3tApbrVw6qSVJ7dMprP9qeim30fhby6I5sbZxUzLaP5kLe9ifRVY5S9HHwejhl5kaCmn9NFXjgYesesXdXrrBbsAW1fQyytfq1PMmTFee01sAQU0Pc/ipo4GzVtAUiJ2bSRwK7/QwZH3z6VRgOxi9NAqC7Gz1yEc8rPIXoiUm+leed9lK5dxcd7nDy7Nfco7DIyMbIIrDhxTvg+zoL/QjiTkL5KArv/D33fPwh4W2kJOEPG/HU7TGKcYUgEgwbtsms3A0c7TMYltzE+pY2FEyu4//N87v0s33b47+WMIaloieKDonSmZTT3/qHB2EmRoGVciDqzH99maU9lD90kE454hBaPpCpkvTtr4voUMiAgN6G9S3QAIL3V+NbdCs6gw0WgpUubrJsKLcEE3UdsFwuEOwXHhO/jGH87OBKw2ksI7Pwd2oEnyIvrYNw8WFhQeXR2GYEYOQSWIJxJOMZ8DeFMwqz/gsD2n2NUvYciTHbXJfDDlTNp8Tl62M2UgoUTK/jJWTtwHkXgtC6XSQnpMX5+uGAn7brG/Z/nh3yTW6ZgTVky7QGVKIc5uPsm0kJLPxvH7B9CVD8ZE8TBXeLuZ7XCnYFz6i/wr/t2j6MlAbQFVNaVJdm7wSGmmR6nwZT05p75dQW2HllvOViRsGV9u2vjjs4unculqb9Gy7rEzlpRtwr/1p9h1q4CZNeIPeR2GQKMHAILkIEGArv/FxGdi1HyGFbr3q63rBCSPTVx1LYdEknCEqRG+fEaqp2VbhAsZkl7RL55zj5W7MoKHRhdwO7aWFr9DqKd5uD6SwvVXvtH5fef7qSPXWIALfUM/I4E0Nu6tSEcaI5mU0Vin1EkkzwBJqU3h36eUGKjo7KLQMtahGv671Dip4PZgb7/CQI7f4fVVtL7+Guo7TIEGDkEBrAC6MUPYbO553FCnEu3O8KhO8UKlLV4aPNrJHQm3B6MW5GQm9jOzKxGSupjQnbeRq+r76no0UAIUFzgKzl8uhMJ0l8bdtXv702noq/sBhImpzeTGesNux2Pxi7CmYBz0k9Q4qcjvZUEdv0Rvfhfdtyvfna2h8wuQ4Dh6chx2N7R+yzQqVl9JPuyYxoX1g0sHGo4t+jWTLJivX1eY1iip2pn0KBgtRWhb1h6+FxFAozyF7Hainre2yERLIWAmjYXr+7IsZOfhapKkSwYW0Ocywh75Doau0ijA6PyDYzyl/Gt/TqBwnsOu2M/tHY5/hheBJaA6kGJy7edDQZQzKFYxLlDhxJt8TtYW5Y06NMlgZ2m5Ei/P5qG0ksewah8I6ybtN0p78SofN3eAQ8RwVIAr+/KZm1ZUp/5i9JifCzIqwl7D+6o7WL5Cez+P3xf3IBR9Q7hqrOGzi7HH8OHwBJEVA6uab8j6qwPcRb8eEBByjU1KIELZRdL8O7eDOraBy94mgB8hkp5i6fPa9yaSaxTD7/SsNvKRPrr7e3Z8ApgVK7E99n1tL87D9+6W23xRLAt1OC68MEvxttn3KGr4PQxtUxMHZgTxFHbxQoEvbnC+9EhtcsQYOgJLAEEauoZeE5+FGf+UoQnC6HFEDbbJGj9xRhWJJsqEvi4OG3QHlgIKG/x9L3hA2THdxDrMo7NTudAX0TBneJDI1gqAuo7nPzxo8lsq47vc+0b49FZMn2/vfET7m+Ga5f9WShCDbfW/h9zqO1ynDGkBJZSgubGMe5W3Kc8hpp2NtJsJ1C4DP+uP/Rwhzzsgwhpb5b0gY6Ag/s+z6e0OWpACbpCQWCvo57dMpr9jdF9dvqp6c3EuvQjm7ofq97V7dlVxc6c8Jv3p/DitlH9FlowtobTx9QN2PnhsHbxazyw6XSqYq9D1dxH/WjH3C7DDENIYIkSMwb3rL/gmvG/KFG5WK2F+Dcsxb/lJ8iOioE9iJB2GNG+IOwQpveszqcjoB4xiTsnBS9tz+HBL8Zj9pFg2+00mJ9bi1M7kl4iUJLmIByxHDWTe5+ioAr7bxsrEvjea7N5eN24vnPmSkFKtI9bTy60d4uPhMD92UWBzwstln+SR4cVN8ztMvwwdFtxijOYDSEVsDAq3yCwvTPQ2AAVJ4TRUbBlcg+tG4fbYbJ0/h6SowJ2CNMwbCmCjgnNPo2nN+fyvx9Poq7d3cdbXjAptYX5Y+oOW7cI4fXnzF6EJ+MXCMfDIGtDLiUU7Pvpr8MLoSI8GWC0gW67Drb6NYrqY3htVzbPbs6lpCG6X/WeIiTXzyph/hGMvuHaxTR0Hnx1B1pNBkvnNw0Lu4wUDB2BhYZwpyMDDeh77yNQuOyIA41JbCMerqMgoCOgsuzTieysiee2kwuZm9NAnNteo8kQo5UIxmeqb3fwRWkKT27K5Z3CTDoCffsKa6rFtTP3kxnrPWynr2x1U9vmtiNgSIkaPw23+z+pro5C10Nnw5MIyls8bK6Mw5QhRhopkaoHkXYRVvxiag+s5cD2VyirC7C1KpFNlQnUtHqCOYv6iwsrOHNcNbefWohLtQZM4AHZxQ/LPslnZ03ssLDLSMGQHoZZLTvwb/tvjPLXwQoclY9wOG96AISd4PmNndl8tj+Fk0fXMz+3loK0FrLiOmyneWGHZ6nrcHGgMYrtNfF8cSCFHTXxtPqCsZL76vhSMH9MDVdNLUWI/kcRRcAj6/O497P8g+oYLRqhPYVpmjS2tIccfaWEB74Yz6MbxvZZtxQqODUs60UCuonPNwlDN7raoN9nCD7HpPRmfnHeVrLjjrzDD8gu1vCwy0jC0BHYChDYczdG6YuDEmhMEQQ3S8KMISUkDR1OVu7M4q3dmUQFA7Nrit3ZTCkIGAodutbtaOXwnX5UQjs/WrCDjFhfWJ2+PaDR2ObudvZqAI3Be+y7UdoCGm3+/nIvSaCp2/OK8Hc8pGB8Sgt/WLiJeTkNRzVa2XYZQGyvYWKXkYKhI7A0kXrjoFUnBDj6e9N3c7w/WAgQEgto84cihKSXC2Cf9QuSo/387NxtnD6mdgCdJNRvhPk2O+x9DfCtGDzSm5tTz68v2MIZYwfyHKGhKCpOV3TfQ96wtcvIwJBOoQc9QpHs+/PseHsaWNkS1WfWhiPe8ZWC9FgvPz9vG0umHRhAHEkFoXqO/HcHs92kIDHaz5VTSrnjtD3kp7QNTmcXKqh9xPwatnYZOTgxHEKxX/D9HYWclVfNRRMr+dlb09nfEHPk4UwPqVcgmZbVyM/O3saFE6pQhAy7k2iZF6FlnQpyM8c95mlwtBVAfJSf03Lr+ObcIs7Mq8WtmYM2UllmAN1bByKFXvQZpnYZSTjBCBzMThYCWXFerpxSRrTT4FfvTmNzRQJ2uIgjMGvw3CUl2scVU0v5zil7mZDSOqCsel2RNL5YA9YmO67TMW8k+w9VtYj16IxJbGd+bi2LCiqYldXYJVIY7ITbRj8uzMPNLiMNJwyBzWDE/lBQVIvMOC9CwAX5VeQmtPPgmvG8siOH6ha3HcUjRBYAgh91fSjto4iM+A7OHlfNtTP2c/KohgGPWJ3kJSqPOPcq0uI70LTBcSXshBASTZE4FDsVSbw7QEp0gFHx7eQltTE1vZn8lFaSouwE3JY1CMSV9Gq/g3bpXflws8tIxAlBYEEwFKrXCYeOwjKYciOoYbUkTExt5XcXbua6mSW8vSeTzw6kUFhnx4EKmAqmVLCkHcBcUyUezSQtxsfktGZOGV3P/DG15Ce3doWVCbuTyGBmhm6Jxm4Z9yRX3vYRQgz+CGw7OUgUIXEoEpdm4nFYaIq0R1oGKZuiFAhPOigupLe0S2QxYuwygnFCENh2GJAsmlROXkprD+8kKcHjMJme2dRlUEvazgVzsxuZnd1Ii89Bg9dJebOHhg4XHbqKYSm4NJM4l05mMCNevFsnKhjFoXskxfAg0EZfjWv6H1GixyJ9Vfg3fo+YlreJTTj27dP5FwkYR0vYQ55LTT8b19TfILRofGtv6cpBNDLsMrJxQhAY7COkJdNLQx51SmyjStn7M4A4t068WycvMRhFsds10DNS4pGNVgLH6Gtwzbob4QrGplI9PeseaZCA6sKRex2uKb9AROUiveWg9AwIP7ztMvJxwhAYbCMeSULOHiQ6BmzSMhfhmvmXg+TFjgypJs21vdCOZgP6CI6PjxoShDMR58Tv48hfinDEY7Xuwb/tZ5gNa3uvg4epXU4EnFAEHo7QMi7CNetvCHfmMahdRXjSQFHBMoM5io4+p3C/kKDEjMU59dc4Ri2xg+rXfox/y48x6z87tr8dQS9ECHwM0SM/r9GOUN22YwMgfTWYDWuOLqj7qCtxTfstQo1Gmu34t/6/PjMuDBbUlFNwTf8DauoCO8jg/scIbPsFVlvxCZm+c7gjQuBjhJ4ZE4oIbPs5ImY8jtwbQAj8W3/aK7F22JCgxI7DNe33KDHjALsa17TfYzVu7BFud9AgVLTsK3BN+y1K7ASk3oxeuIzA7r8gA00R8g4RIgQ+Buid7mRpkKwq+r5/AByxdNIuDFrO1V3k7YQSPRY14wKbwIMJCWrKabhn3Y3wZCHbS/Bv/yX6gWfA9EXIO4SIEHiQ0W+KT0ykt9K+sHunD2Z8CFuVJcBq2WlPy7ulTZH+Gszq947Ng0kDqbdgtZfYm1U1H3IkgRciGFxECDyI6DfRWCd6dXgFJTYPLecqrNZdmFXvIc22/n9IgFn9Pkb5SwezDhrtGNXv2kc5gz59tlO0eD+5FGm0B5OiRbaFhwMiBB4khEXeUOVGXYVr+h9QosYgTS9G+Uv4133nsCSWZhv+dd/BKH0ONWkeZsNazOr3D0/+I4U0D07NI6PusEGEwIOAIyKvBOHJwDX1NyjReYCd2V7LvgKj9DmM8lcPSxRptmGUv4pR9uqgBEXovK8+64kQd9hh6ONCj3Ac6cgL2HHBDk39qUXb2e3DnaEKbCseLbkkCEcCatqZCHfGcW7FCI4UEQIfBY6KvGBvDB2S3V4a7XZ2++M52gWdM1yzl+M5/XWck34CiuPo643gmCMyhT5CHDV5BbagYdt/H3TGMNrQ9z+GWfPBcXWLVJPn4Zr+J9S0s+xg+nrTANK2RDCUiBD4CHDU5O0Go/RFzNpPjq87ZCeEGsy/+3uUuClIvSXonPFXkMfpHiI4KkQIPEAMJnltdDsbhuMz8gazQDrybsY1+b8R7gyktxz/9l+hlzwWcc4YQYgQeAAYfPIGcZzXu8KVjLPghzjG347QYrGatuDf+mOMyrcAK0LeEYQIgcPEMSPvcYYSMxbntN/iyLkaFA2j6i0CW36M2bgpQtwRiAiBw8BQkrcztvugZBJQnDgn/RjH6K+C5cMofgT/9l9htZdFyDtCESHwYdBDEtheRGDjUsxDyHs0qToOV7bZ5yBgKCRFBVAG4L4YkvjSQvqqsdqL8RU9TOWmB4hRaolyhl1tv+hMtiaEHR7nyxol43giQuB+0BU9Mno8dVVFtG/8LzwNb9KhO0nw6KhCYlqCBq/9b4cysB57uLKqAv9YM451Zck8eOUa4gaQ3rPZ50BKiHd3y7EsDQK7/oRR/A8OVLVw41NzuOv0PVw5teyoyaYI2FyZwGs7szEswYSUVq6YWopbtcL3STkk26JlRQJxHA4RAvcBLeMi3LPvIeAcw8PPvMPTL72I0dzA2KTZNHmdLL9sPWkxfipa3Nz56lz+eNEmCtJae8V4UjpjOQVHpc7vFAEVbf2XFcD45DYsKezcQId8J8TBEVxAV/xjTYF/rR1He0Dj5+duAw6Gp5FGG9JsI0pzcmpuPRmx3pDZ/5Sga2bnd53lO9Ohdv5u97A3phQ0+xxsq0pgU0USiwoqcGvhsVAIqGp18+K2UTT5HMzJbuDU0XV2rOqh7gzDGBECh0DnyCtixvHBqnU8+O8H+fbMLxiT7OOxDWMpaYjBtASWhJo2N2VNURxojiLKaaAqktRoP4qQ6KZCdZubA01RBEyFCSmtZMV5AQ5b1rAUKltdzMxs5ORRdbi0gyOZAPymwu7aOGra3GTHd1Db7mJqejNJUQHaA4KyJg/tAQcHmqIASHAHiA2SodHroM2v8e2T9pIS7e8RflUIO+Ha9uo42vwOxia10exzkpfURqxLp9nroLQ5iqpWN8lRAQrSWvAE4y/PzGxkdlYjT28ezYvbRw2ozS0J/1wzjpW7s5iS0UxpUzSzsxrBbUSG4X4QIfAh6L7mpaOI4jUPEGXVcOqYRnIT20mN9vPPtXk4VIs2v8b9X+RT3BjNT9+cgUuzyEtq4y+XbCAlOsCaskT+7+MCfLqKJQVOzeJ3F25mcnoLzd7+yx5ocvP91+dwoCmKqenNLPvK+q4ptG4p3PtZPi9tH0WCJwBAZYuHhxZ/Tlp0gI8rpvFmcQE+bxu76mIRwHdPLeSaGQewLHhy0xge3zgG3VT4+XnbuGxyOaZlk7e61c3/vD+FtWXJJHkCaKpFQ4eL+65Yw4SUVu75bAKflqTi0kyafQ6+MrmcO07dgxpMidK5Bh4oBPZzxbl1fnHuVuLdOvFu40sVIvZIMIQE7pyjMWx2QA/dbQ5sWsqC2A/5OGkqd706h+z4DkbFd/DVGfu7iPONuUVsKE/kl+dvZUJKKw7FIs5lE21UfAen5dZRVB+DYSmsLknhk5JUpqS3EO0y+ixrWZAZ6+Nvl6zn9V3ZvLs3o6sj2yOkykf70jktt45rpu+nstXN+0XpxLsMROo5nD//91zcsZPGbcv48dl7AOyRNjibvWb6fk7LreUX70ynza8dDNcq4fGNYyisi+Xvl61lTGI7n5em8IcPJwN2zOZ5OfW0+B10BFSkjOa1HdncMKuElGj/UYXItaQg3q2zriyJJzeN4YyxNXxcnMZlk8soSG0dnkHau7JDDF0HHjoCK0600ddgtRdhNm4EyxxSIoc6KrIqV9Dij+fqaaUkR/nZ1xDDe3vT+eNHk7n/8rUkRwfIiPXi1kzGJHQwMbWta52rW4JnNo/mtZ3ZzMpqJMZpoKmStoDd5Kqgz7KWtOMp5yV3kBXnRRWyB8liXAZXTTvA81tH8+M3Z2JJSIv24k+9Ate8X+OKGktS/H6kO0B+SlvXiGgFN6pSogO4NItop9H1/ALwGipbKhM5b3w1p+Y2opt2ypPR8R2MS2pjT10sy1dPIM5tkJfURpNXp6bdhWGJrsx/R2JCVcBnB5J5ZvNoFk6s5IlNY3h1RzapMX4uKSgfuk7RFySgqKgps9BGX9MrFvbxxNARWCho2VegJM7BKHkEvfhhrLaSIYn00Nc5r6bAZwdSeHl7DvdfsZa52Q1EOUx+9/4U2gIaydEBlODUscnnwKcLatrd+A2FeLfOh0UZLJ5Wym2nFLKnLpYvSpO7NogsSciyPl1lTGIbitKNDOLgEY0F+AIqhXWxXDN9P6ePraW6PZ6fvT2HT9uvZVbUWOgoRGn8lDbdGcxmIKho8ZAR6yPepfdMxRus1xT2CJsZ18HmygTKm10keAI0eh1sq45HUSRbKhPQDZU/LlxLarSf+z/Pp6ghpmvnuPPZRLe/Kxzes1sI2FUTh0/XWDp/N3/+aBKritP4/UX2cmNYjb4SlOhcHGNvRht7M0rU6CG9neNDYAE+v86Bynqy0pJ6fKVEjcY56adoWZcS2HsvRtnzSH/jcRuND+ek4VQtdtXEc8crc0mJ9rO7No7z8itJi7Ezvce7dfJTWvntB1PIjPWyvzGaU0bX8V8LdjJ3VD2v7Mhmd10s26vj2V6dgCJgakYT5+dX91n2Z+dsZ0NpIm/symZXbRw7q+P55bvTyEtq4+a5RRiWYENZMh8UpfH5gQRazDTM6InMnjoBGr/Av/k/maYW82rVFO58ZS6tAY1Wn4Nfnr+FqenNPLRuHMUN0WyrTMCrq2yvimdRQQWnj6njxtkl/GjlTL7xwslkx3VQ1hyFU7WYmNrC1IwmLODX705DtxS+OJBMq9/B8tX5/PDMneyoieeNndlsr4mnsDaWX7wzlXFJbXxtTjExzr53ky0J0zObcGgmP39nOi0+Bw7V4s8fT8KwBOeMqxn6tbAE4UxAy74cx/jvoibO6goR3B2lVfX4/Ppx67+DmxIvZQrA6cB5PT4Xgnavn4/W7SCgG4wbnUFMlLvb9wrCnYGWfj5K4mwI1GN1lIFlHNOGCMfDSiKYldXIjMwmVEVy2eQyrp9V0pWLx6VazMpuRFMkMU6DiydVcMXUMhI8OjMzG4l1GQhg4cRKzh1fTbTTZGxSG2MT23H2UTbObVDRGkVxYwwZsT6mZzbhVC3i3brd0RWJW9M5f2YUWt5t5E66iDuuX8ispG34NtyJUb+B3MR2xiW3oZsKk9Ob+fqcYqakN2NJhe3V8eiWwvTMJjJifSiKZEJKK9lxXlKj/cwfU0uUw8SpSs4ZX83tpxYyPqWNtGg/0zKb8eoa45LbuHbmfsYktRHtMJmd3UhDh4t9jTFkxvqY1uOem3GqfR80S+h6TodicemkchZOrEBRoCC1hZx479BtRAdTyKjpZ+Oa/kec+XegROfCIcnoahta+NcL7/Ozvz3N/oq6vmp7F/iUuh2DdnuDS4+CxQA/BP4U8nvLwqFpnDJrIt+7aREXnjGTaI+rd5sFGjDKXkAvug+zcbOtTR1kIofrHtl9V7VznXeog4EQ9jqOzu/lwbPZzqlwV9BJYXsoWbL/skq3z7vahYOJyZyJ03DO+F9E2vkgdcz9j+Hd+t/IjsqutlK7TcO7Z+vTlN7NaXb7vnO6fug9hfqusx7DOvw9Hw5q57l2Z9sfcl/HFRIQCkr8VJzjb0PLWYxwpfS6rN3r561PNrP88RWsXr+bgK73l+v5v4A/s2vwgu8fCwJfCTwGRPV5nWkRGxvFpefM5c4bFjJ36jg0tfdDW+370Isfxih5BKu9dNDudqQLE4QrDc9pz6GmnmlrePf8jcCevyADzcNmR39EQ4KIysaReyOOvG8E42/3bFjDtFi3rYjlj6/ktffX0draYb8x+0YHcCPw4mASeHCn0KlTQFAB5ANT6Ks7KYJAQGfr7v2sXLWJhqY28nLSSIiLRnQ7RBTORLTUM1FTzwAZQLaXgOk/unQkI5y8duyqWByjr7UdOrb/kkDhcjDaI+Q9WgTbVht1Fe6Zf8aRewPClUr3hpVSUlxWw/8+9Br/729PsXr9LgK60d+oG6yZFxEsR+AfvlNogImLAdIRfBf4OtC/S44lURTBlAmj+c5XL2DJRaeSnBDbuwXMDsyqdwgULsOs+/SIiDziydsFYY8KqgerZSdI44hqUQQjN73pYEICihM15RSc+UtRMy7qFWwQoLG5jefe+px7nniT7XsOYFmyp/N2aFQADyNZDlSze3BzVx2bd/bEJSCFiiJngbwTuByI67eMZeFyOjh93mS+d9Mizj1lGh537/M16a9FP/A0etEDWC07Di42D4MjJa8SYk03EOXRoMoBD7kRcciakQGQ0bQEdR0u4lw6HseXNHxO0LlbiZ2AY9ytOEZfh3Cn97rM59f5cM12/vboCj76Yhs+f+BwIy5AK/A6sAyhrEVKk13PDvojHNtJl70mjsLelf4eMB/o+9Q7uEMUHx/DFeefxJ03LGRGQS5qr8aSWK2F6PseRN//pB2Spp8nOVLy+gyVhg5nkLQCRUhiXAbxA1AFtfhDqIIGAYqADl2lyesgymna55PB3exwypY2e7jxmdO4a/7uQVEjjThIEO40HLlfxZF3K0pcAYd2IsuSbN2zn3uefIsX3vqcxsZWeh7Qh4QOfAbcjeAtoJ2dxy5j5LFfNRVcCc3nQdwHKQiuAW4HJvX721IiJIzKTuXmK8/ilivPZlRmam8fW0vHbPicQOE9mJUrkHpbr1qPZuRdU5rEj1bOpLbdTaLH1uOmRvv59sl7OW98ld2A/ahzNAX+/HFBSFXQ4cqCQDgTQEqk3kyPbwTsqI7j7k8nsqcujpz4DvyGwqKJFXxjXjGG1b+iSBFQ3+Hkfz+exFcml3Hq6PqeggbooXTqvmPeY0cd27HkUAVVX7/b2a4iWEmvsuLgtL7LxMdg5oIWhZZ5Ec7xd6CmzA/pSVVWXc+/X/qQfz3/PvtLa5CdjdJ/zXuA+0E+yZjLazjwOux4epAfoCcGdxMrFOp2QtsbkDalA411WLwNBIA8ICZkmWDvaW5pZ9W6nXy0bidOh8bYnDTcrm6NLVSUqFy0zIWosQVIf7U9GgePnY5mzSuB5Cg/EkFpUzR/XrSRr0wup8Xv4N/r8pifW0dKdIBmr4PC+lg2VybQ7OvU9tq9zqsrvLx9FHXtLmZkNdLsc6AI2aUsavH1UVaCmno67jn3o2V/BbP2Q9BbIUigdl3lF+/MAOA/zthFcnSAV7aNYmpGM6eMrkcC7brGxooEdtXYK5eSxhiinCZuzaLJ56DV72B2diNjEttxdDujFcJ2qdxcmciWqgR0UyExKhAkvYsGrxPdVNhVG0dhfSxxLqNrCi5E/78rgLLmKNaUJlHWEkWsy7BnD0FUt7lZU5pEdZubmnY31a1u0mJ8RySOCGlQRUNNPgnX1F/jLPiRPeoe4ozR3NbBsys/4wd/eoynXvuExqa2cBQaNcA/keKHKNYboLTz+f9A7bZBuPH+cfxcKe1phGTC1YVIfoIqXgbuBC6mLyIrAgvYsK2I23/1D55/63Puuulizpw7CbfrYOBxocWgjb4WNfVM9P2Poxf/EyUmH9esu49qwyraaZER6yXaZTAuuZ2U6ABZcT4+KU7jk5JUxia196nOcWqSj4rTWbE7E7+h9lAFXTvjAN6A2kfZvbhyFuGa8WeU2IlY7cUILfbg+CvsqX15s4dLJ5czK6uRk0bV09jhJCPWi6BvRdG9l69lZlZTv2qkunYXf/xwMmtKk3E7DAKGyuLpB7hhVgnLV0/gpe05pET5UYStHpqS1szvL9pEgkenqr/fzWzijd2ZLPt0IoapYErbeeP/nb2d6ZnNbKmK52dvTac9oBHrMihv8XBWXjXTMpoGofMJlNixOMZ+A8eYmxCenF5XBHSDTzbs4u5HV/Dup5vp6PDbx0L9b1J1AG8iWYZirkYKnZ0vDML9ho/j7wu953kAgwmLP0WwGbgYwZ3ASUDodACKgs9vsOKD9Xy2aQ9LLjqV715/EVPyR6F0P3byZOGc+AO07MsRWhTCk4PVWoh/010YlSsHfKuda184GCImyqGTFuOjqtXTrzonNdrP6WNquCC/kvaAxo/Pso8OUqL9mFYoZU8Ur+/K5eYrFpAw9+fgzkZ2HCCw9WdYbYVdSwMpIcGtc8PsYh7dkMen+1NJi/ExJ7uB8/OrMPpRFAkhkbJvNZIAnt6cy2cHkvn+6bvJie9gXVkS/1w7jplZjXxzXhFbqxJQhORX528lYCh8//XZbK1O4MyxtX3+riIkZS0e/vzRJObmNHDZ5DL8hsqy1RO49/N8ln1lPduq4qlrc/OTc7aREevjrT2ZZMd5j26RJ0G4ktByrsY5/naU+Gm9PKiklOwsKufep9/mmRWfUlffHPSu6XeTygDWAcuR4jWglZ0vHj03jgBDJ2bY8xzkX92Gr+MZPDEfosjrgVuxz5B7m00AqkJjcxsPPvMO76zewjcXn8vXLj+LrLTEbtcpKLET7L9LC6PiFYyaj45cKiN6/tWwFFr9DmLdOnvrY/pU5wDEu0wSPToOVfZQBSFhd123somtNLnd1DEWpeC/wZ2N1bID/6b/xKh6i54rYwiYtljitxdupsnrZEdNHA+tzcOpWlw+uaxPRdHYxHak7FuN5DMUtlQmUNnq4d7P85HSDlqgCEl9h4t5OQ0keAKclNPArKxmqtucJHoCNHkdwbJ9KJmS29hYnsj+xhj8hsq6MtsfvjXgIN6t06GrnDyqng8zm1i+eiJmsP0um1KGaQk0ZYAL4WDcay39bBz5S9FSF4Dq7nVZVV0Tj7+6igeefYeikkq7lQ9/nrsP+AeKfBSnuxI9ANsHf3c5XAytoL/wefvPgsXVCPFXLPkmgtuAa4HUkGWEsFvxQDU//9vTvPL+Ou68YSFfOXsOsdGeQ65VcIy9BeFKQd/7d8yGjXbGgTCJfKhqx5KwriyJ0mYPc7IbWFua3K86R2LLAtsCWg9VUE68l/VlSXbZi9aSluDggU2nU7w92s712/AZvo3/iVn3We97DUbMWL56IldPO8Atc/cxN6ee1SWpFNXH4NL6VhRZwMzMpj7VSA7VIi3Gx4zMJn5+7lYSguTaWpVASpQducPen5Jdp3edLyVXP0omhCQ52k9KtI9vnlTEgrxqpBRUtnoobohGAMWNMcS4dP60aCOxLoMXt47ipa2jWDLtAKkx/vB2/SX2vkjidJzjb0fLuQrhTOx1WVuHjzc+2sCyx1aydnMhunFYRwyABuBZkH8HtiORbHr8KDr/4ODYb2KFg7odULcd0qbWoijvIeUXQDwwmr6m1cJeH5dX1PHmJ5vYVlhGRnIC2elJPY6dhOpBTZiJmnERijMe2VGCDDQdlsSKgN11sfz9s3y2VCZS2uzhzcJMntmcy1njavjqjP0oAt4qzGRzZSKv7szhlR051La7CZi2ACLKYdHid/D81tGsLUvm+W2jeXVnDtPSm8iO6+DNwgw2V8Tz6t5pvLo9m5omP4H2aqa0/xJnW+gEZyK4Bn5+ay6flKTyRWkKz27JpcHr5NaT9zIq3ktGrI/XdmXz2s5sPi1J5fGNY9ldG8f83Dri3QHu/yKfl7bn8Pn+VCpaPWypTMDjMBmb2EF6jJd3CjP5uDiN7dXxvLUni1XFaYxJbGNLVSIvbhtFTZubUfHtvLYrm7d2Z9HgdTIlvZkZmU28ujOn1++emlvPlPQW2gIOntkymh018XxxIIVXdmTT5HNyVl412yoTuf+zCZQ0RbO5MoHV+1OZO6qeCydUhjcCS1CiR+HIvxPX9N+jpZ+DUHu+0A3D5LNNe/jZ357m/x56laKSSqzD7y57gbeAH2LxACiV7H6OwfSmOhoMP+e7AglcA7bjx2Ug7wDm0N/LJnjWkZaawHWXnsGtS85n4tjMHm6Z9nUmZtNm9L33YpS90C+RFQF762N4YdsoAqaCZQncDpPJac2clVdDjMtASthUmcjH+9KIdhrkJrazuTIBVUhunruPBI+O31D4pCSVDeVJxLsDnDKqmomZCi5PHJur01mtf4fY5HGMyYhm7Xv3IOs/4ZZ5B0iIMkKOOgL7/Pe1ndnEu3UK62JRFclZedVMSmvpumZ/UxQf7kunps3NuORWTh9TS3qMnza/xuObxlDV6kZTJJa0ZzQXTajk5FH1SAkHmqJ4d28Gde0usuO9zM2pZ1R8B68H5Y0OxWJBXg07quOpbPXgUC0um1zGlLQWiht7/25ajB+k/eL57EAy68uTcGkWk9OamZ3VSFJUgA0VieyptT3wShpjGJfcynnjq0nwBPoffSUIZzxa9mVBmd9sED0nllJK9h6o4sFn3+PxVz+mqqbh4DlZ37CATcA9wIvoSjM57fDR68eNCuFg+BG4ExOXgNcN0R05SPE14JtAbr/3LO3IFRPysrntmvO57tLTSUuK732d6cWofg997z32+riPXECdSqFuS9deaqS+1Dlmt2sOqoIESsaFaOO+i5IwBwLViJgJIARm0b3ou36P9Nf3KNsXOvdYQqmNQt1Xd0XRQNRIdCurKAfPaTu9CDvPhTsjavb3u93VWYd+H1L1dUiUzp62xpb5pcwPuj+ej1B762fqGlt5ZuVq7n3qLXYWliE7Xdj6hgRKgYeBh0CUgpSDKUAYTAxfAnfC9q1WgGkI7gCuAhL7LWNZOBwap86ayF03XcyFp8/oQ7ZYj1H6HIGi+7Gath4T2eLBHwMldhyeM98KqluCH+st+Lf8yE4qFhEkHB5dMr/JOPK+bYs6XL23Szp8Ad79bAt/e+QNPl2/i0BAD2ed2wy8BGI5ptiMIk12D90GVTgYOd2lYAmAG+RZwF3AWfa/+0FQtnjJ2XNZemNfskWJ1bYPvfgh9JJHkR3HKM2IBc7JP8Q1vadUWnaU0f7uqUhvJL3JYSHto0LHmOtx5H3Ljhx6SKOZpsXGnSUsf3wlL7+3hpaWdvvoqP+29QOrgLuRvAfCO9yJ24nhsYkVDuq2Q2aBQUDdiypXIOR+EKOBNA4jW9zWTbY4NieNxB6yRYFwJqGlLUBNOR2swZEt9oIENXU+Wvr5PT83WtCL/wV6S4TAfUGCcMSgjboS94w/48i9KYTMD/ZX1PK3R97gJ395klVrt+MPGIfzXZbADuA3CPErmozNxGsGO0YGeWEkERigZic0bIfUyT4UcyMotrO47ZYZWu0U3KxobfXy6cbdfPDFdhRFIW9Uek+1k1BQonJQMy5EjZ+CDNQiOyoGdOzUJ4KLY6utCCU6FyV+StdXRuUbmGXPgQwMdesOP0hAcaCmzMc17bc4J/6nPeoe4v7Y1NLOE69/wg/+9BjPrVxNc0tHkLj9Gq4CuA8p/wun8g6W7KDkBajePtRPPSCM7Hf+xKtBWiqKNie4W30ZYcoWF5w8laU3LuScU6bicYWQLfpq0A88hb7vAayWXWHLFntWAsKVgiP3eqTRir7/CYQjEcfYGxFqDNJsQy95/LBqqi8dumR++TjyvoUj93qEO7PXZf6AzodrdrDs8ZW8v3pLuDK/NmyZ33JQ1oA0joXM73jhxOg2k64CSRRCXIAUdwGnEYZsMSEhhisvOIU7rr+QGRNzUULKFvegFz2AfuAppLcq/BYLhmVxTfsdjtzrsbzleD88D6u1sOcW82H725cMEoQ7Fcfoa3GMuxUlbjKhZH7bCg9w71Nv8dybn9PQ0BKuzO9zYDmIFUD7SCZuJ0bWFLov1O2EpOk6SR/vwjt6BYJKEGOAFPpyy1QEPn+ATduLefOTTbR2+MjLSScuxtNzfexKQUs7GzX5VKTRiuw4AOZhwoZKUGLzcc++G8eoxSBNjNJnMMpfsqfKnVq8E+P1OTjolPllLbLXuXnfCI66PRupoqaRvz/5Fj/638d579MteDtH3f7XuXuBP4L4b6w9axCJOrueH+onHhSceF2oYDEIIbCsfIS4FbgeSO+3jCVRVYUZk8Zw102LuOzcecTH9D5TlEYrZsXrBAqXYzasAysEkSWoibNwzforauoCMDsI7L2XwM7fIQONQ906ww+dMr/EWTjG34GWfRnC0fvsvrXdy2sfrGfZYytZv20vRmcYzP5RCzyF5D4UuRsphu157pHixCNwJyZeA0I4kObJCO4CFgLR/ZaxLDweF+edNoO7blzI6XMKcDl7e3JKbzn6/sfQ9/0Lq7XoYDYJCWraAlwz/4KaOBupNxHY9Sf0PcuRRtuJ3NpHBglKTJ6d5WDM11CieodPC+gGn23aw7LHVvDmqk10dPjCWed2AG8juRvJaiDAnhOLuJ048btUwRJAxoC4BORSYB79iTiCbkbJSXEsWXga373uQiaPzwnhlmlhtWwnsPc+jNJnkYFGtKxLgzrefKSvGv+2n6OX/BusyA5zD0gQrkS0nKtwjLsdNWFGSJnfrn0V3P/M2zz1xqfU1jWF4/5oAhuAZQheBVqQz8KuE7ebn7hP1h2TloBDA93IRMobgW8BvYP9dkfQLTNvdAbfWnweN12+gMzUhN7XmT6M2g+xmjbhyL0R4cnGai/Gv+VHGGUv2sdQEdiQgOpGSzsLR/6daGlnwyGCA4Dq+maeeG0VDzzzDoXFFcEkgId1fywB/oWUj2Ba5aiKZPeJsc7tD18OAneiYDEIKbCUSQh5O7ZqIqXfMpaFpqnMm57P0hsXcfGC2cRGh3IAsw97rfb9+NffilH51petdftGp8wvYSrO8d+xsxw4k3pd1t7hY+WqTdz96Aq+2LwH/fDxlgEageeAe3Cq29Eti50jf3c5XHw5u5jtlukCOR/bLfN8wNNvGdMiOtrDwjNnsvTGRZwycwIOrfcmvvTXEtj7d4zih4PZJL7kUZcliKgcHGNusrMcRI+ld5YDk7Vbi1j22Epe/3A9bYfPcgDgAz5A8jfgY8A32DGXRwK+nAQGmHULtDWC6ogHeTlwBzCLw8kWpSQ9NZHrLz2DW685j/zcvmSLm9D3/h2j7KWw9McnHCQIZxxa1ldwjL8DNWlOSJlfUWk1/3juPR575SMqq8OW+W0B7kHKF5BKE6rBUIW0GWp82bpVb0y8GnRd4HTlgLwZuAVbttg3guvjgnE53Hrt+Vx3yemkJvZ2AJOmF7P6XfTC5Ri1Hw++f/VwRGeWg9TTbJlf+gUhsxzUN7Xy7MrPuPept9heWIqUh5X5gS3z+zeIh9AC+zE1yc4Tf53bH0707hQ+CpaAoiiY1kwEt4O8Ckjot0xQtnj63MksveEiLpg/g6hQskV/HUbps7ZssXn7sZUtDhU6ZX5xBUGZ31cR7rRel3l9Ad77fCt3P7aSVWu24w9P5tcCvAzcQ0DdgGaZ7PnyrHP7w4nWjY4ek64B8CDlOcFjpwWAq98ypkVsXBSXnTuPO29YyJzJeaghZYtF6Pv+hb7/MWRH+YnT+hKEJwNH7vU48r6NEts7LqFpWWzaWcLfn3iTF99ZQ3NzWzjujwHgE2AZkncQdJxojhhHixOlCw0uJiwGpwBDJgGLge9iZ1vse6gIro+zM1P42uVn8c2rz2FMdmrv9bGlYzaus7NJVLyGDAZsH5GQIBzRqJmLcObfiZp0cq8sB1JCaVUdD73wAQ+/+AEHymvCWedKYBdwL/A0lqsOxQu7jm/M5ZGAkdp1jg/s3E4CGIt9dnwTkNVvmWC2xakTcrnjhou4+sJTSIzrvQaURjtm1UqbyHWf2c4eI8UanTK/5JPs9CRZlyC03rH5m1s7ePGdNdzzxEo27yzBNMNyf6wCHgf5ICh7h3M4m+GAkdJlhhYTFwNSAzEnGIT+K0Bsv2UsC7fLyYKTp3LXTQs5+6QpPdPCBCF91egHnkQvehCrdfeRyRaPKwRK7HgcY79p58/19H6f+QM6q9bt5O7HVvLe6i14ff5wZX4rsL2o1oDUv+wbVOFgWHeVYYeCxSCIRnIhsBRbtujo8/qgbDExMZarLjyF7153IdMn5vbIJtF5odWyy862eOAppLd6+FlGgnCn4Bh1jS3zi5/KoTcppWRbYSn3Pf02z65cTX19Szh5hQzgcxDLkawA2kZKOJvhgBNDTni8ULcDEqfpfPP5nWyYtAIhqoAxQDL9yRZ9ATZu28ebn26m3esnLyeN2JiobgUEwpWKlnYOatLJSKMF2VEaWu10vCEBzYOWuQjXjD/hHPet4Kjb88Yqaxu596m3+a//fZx3Vm2mwxc4XFQMCRQBf0LKn3FJ4ReUxAfYERl1B4Kh7h4jFwWLQSJQmIjkNuCr2PG5+kZQtjh7Sh533riQy86ZR1xMbwcwqbdgVLyGvnc5ZsN6sIzjbykJKCpqwiwc47+LlnM5wpHQ67LWdh+vf7ie5Y+vZO2WQgzDDGe6XAc8g+A+LHYgiKxzjxARAh8tJl0FlnSiKKcEo4FcSBiyxSiPm/NPn8FdNy5i/uyJOB29BVLSW4Ze8qgtW2wrPn5umVKgRI/GMfYWtLFfD8r8enYVXTf4Yste7n5sBSs/2kB7uy8c90cv8A6wDEWsQhL4MvktHwtECDxYmHg1QCxCXIq9Pp7D4WSLUpKSHM81i+bznWsvYPK47JBumVbzNgJF92GUPof0NxzT2NXCmYiWc4Wd5SBhRq8AclJKdhdXcv8zb/P0G59SXdsYrsxvE3A3Ur6CIlooLYO2z46pSb4MiBB4MDFxCQQUcFtZSOtrIL6JfQR1WNni+DGZfGvxedx42ZlkpCT0vi4oW9QLl2NUfwDmUabe7HEPBGV+Z9rZ/NLOCSnzq2lo5snXP+WBp99h976ycGV+B4CHkOJhFKvsRIyKMZSIEPhYYPJVoOoKunsKyO8AS7A3uvpGULZ4ysyJ3HnDQhYtmEVMVG/Zogw0YpS9gF50L2bj5qNzy+x0f0yYinPcbWg5SxCu3rfZ7vXz1qpNLHt8Jas37BqIzO8F4O8o2hak+aWS+R0vRAh8LDHpakC4gDORLAXOJQzZYkyMh0ULZrP0xoWcND0/pGzRai9GL34Io+RRrPYDRxbyNiobx5gbcYz9RjDdS2+Z3/rtxSx/bCWvvr+W1vBlfh8BdwMfAL7IiHvsECHwscbYRRAdD4aeAOIKbNniDMKQLWakJXHDV+xsi+NGp4dYHxuYjRvtJG3lryADzYe3qAThiEXLuhRH/h2oiXNBcRzy85Li8hr+8dx7PPryR1RU1Ycr89sG3APK83isRhpVKHl6qC1wQiNC4OOFgsWAFKCMAnkLcDN2/uO+ISUCQcH4HG7/6gVcu2g+KYm9HcCk2YFZ9Q6BwmWYdZ+Gli12yvxSTsGZfxdqxoUhZX4NzW089+bn/P3JN9m+5wBWZxrC/lEOPILknyiUICPHQscLEQIfbxRcBcJSQZ2JFN8FrsROZt43LAunw8EZ8yax9MZFnHfadKLcIdwy/bXopc+gF92P1byjW15PgRI7Ace4W3GMvg7h7h1l1+cP8P7n27n7sRV8tGY7/vCyHLQCrwDLUeR6pDDZGSHu8USEwEOFSYtBSA+WOA/72OkMwpAtxsVFc/n5J3Hn9Rcxa/JY1JDZJArRi23ZIlLiGP1VW+YXN5FQWQ427Srh3qfe4oW3vqCpqTXcLAefIFmGkG8j6fgyBJAbjogQeCiRdz0kNUBrbDKCJSBvx5Yt9nvshJSMykrl61ecxS1XnUNuVkqfskWkRE2a21vmB5RV1fPwix/y0Avvs7+seiAyvweAJ4lqqqUtBfY8NdQt+aVFhMDDAQfdMsch+RZwI5DZb5mgbHF6wRjuuOEirjr/ZBLiosP6uebWDl5+bw33PPEmG7cXhyvzqwaewCZvIUTWucMBEQIPJ0y4CiQaqpgHYilwCRDTbxnLwu12cvYp0/jeTYs4c+5k3K7QAim/bvDp+l3c/egK3vl0c7gyv3bgTeBuLO1zhNTZHdlZHi6IEHg4YtISgGikXIgd9vZkwpQtLr7oVO64/iKm5I/qki1KKdlZVM69T73FMytWU9fQHM502QDWIlkGvAG0fhnDtg53RAg8XDHhKttdUotJR8jrgVuB3sGmuiPoljlmVDrfuvpcbrp8AYoiePy1VTz47LsUlVSG6/64D/gHlnwUaVSiaEQ2qYYnIgQe7uiZTeI24Fogtd8ylkTTFGZOzkMIwabt+9CNsNwf64FnkeLvaHIHFjJyLDS8ESHwSIE9rXYi5enAncAFQFS/ZSzL/vPwxPUC7wJ/Q/IpAn9kg2pkIELgkYaCqwHiQFyG7ZY5hyOPrGIBm0DegxAv4jebmZ0Ez/9zqJ8ygjARIfBIxMQlYGig6dkIvg58EzubRLj2lNhZDh5G8BCWLEVEZH4jERECj2QULMGWBxnTge8AVwNJhynVBLwI3ANsBmGxKyLzG6mIEPhEQMESkNKNYAG2W+Y5wKFiYj/wEYhlCN5H4o0Qd+QjQuATBdO/Bu3NoDkTEHIxcDswMfjtbuABJM8SazZQ5YCyZ4b6jiMYBEQIfKJh0hIQQmBZWcBJwU/XoCgVtkdHZNSNIIIIIogggggiiCCCCCKIIIIIIoggggiOI/4/XAsfnjqA45IAAAAldEVYdGRhdGU6Y3JlYXRlADIwMjAtMDktMTBUMTE6NDE6NDAtMDQ6MDCXimqTAAAAJXRFWHRkYXRlOm1vZGlmeQAyMDIwLTA5LTEwVDExOjQxOjQwLTA0OjAw5tfSLwAAAABJRU5ErkJggg==" width="64"/></p> --- # What is data science?: Common view .pull-left[ * interdisciplinary field combining computer science, mathematics/statistics, and domain expertise to extract meaningful information from unstructured data points ] .pull-right[  Hckum, CC BY-SA 4.0 <https://creativecommons.org/licenses/by-sa/4.0>, via Wikimedia Commons ] --- # What is data science?: My view .pull-left[ * interdisciplinary field combining computer science, mathematics/statistics, and domain expertise to extract meaningful information from unstructured data points * also involves art, design, hermeneutics, communication, and ability to grapple with ethical dilemmas ] .pull-right[  Hckum, CC BY-SA 4.0 <https://creativecommons.org/licenses/by-sa/4.0>, via Wikimedia Commons ] --- # Case Study 1: ACLU Fights Discriminatory Housing .pull-left[ * American Civil Liberties Union employs [data scientists](https://medium.com/aclu-tech-analytics/meet-the-aclu-analytics-team-4644d4f20dae) to produce insights regarding discriminatory laws and practices * Findings are presented in courts, legislatures, and public reports * In [this study](https://www.aclu.org/blog/racial-justice/race-and-economic-justice/lawsuit-challenges-discriminatory-housing-policy), they use public data to show that excluding people with criminal records from housing can be viewed as a violation of the US Fair Housing Act. ] .pull-right[  ] --- # Case Study 2: EPA Tracks Environmental Injustice .pull-left[ * Environmental Protection Agency hires [data scientists](https://www.epa.gov/careers/science-careers-epa) to produce insights regarding environmental health risks * Findings implicate environmental policies, funding allocations, and legal actions against states and industries * [This tool](https://www.epa.gov/ejscreen), visualizes environmental and demographic indicators to highlight communities experiencing environmental injustices. ] .pull-right[  ] --- # Case Study 3: Geena Davis Institute Studies Gender Biases in Films .pull-left[ * Geena Davis Institute collaborated with University of Southern California’s Signal Analysis and Interpretation Laboratory (SAIL) * Developed a machine learning tool to measure representation of diverse groups in films by studying screen time and speaking ] .pull-right[  ] --- # Topics covered in this course .pull-left[ * data visualization * data wrangling * mapping * data science infrastructures and workflows * data science ethics ] .pull-right[  <https://towardsdatascience.com/the-25-best-data-visualizations-of-2018-93643f0aad04> ] --- # Who is the professor? Why is an anthropologist teaching data science? .pull-left[ * Please call me Lindsay (preferred), Professor Poirier, or Dr. Poirier * Previously Assistant Professor of Science and Technology Studies at UC Davis * Lab Manager at [BetaNYC](https://beta.nyc/) * M.S./Ph.D. in Science and Technology Studies from Rensselaer Polytechnic Institute * B.S. in Information Technology and Web Science from Rensselaer Polytechnic Institute * Dancing, crafting, cooking, re-watching the same TV series over and over again. * I have a *very* spunky dog Madison who you may hear on Zoom calls. ] .pull-right[  ] --- # Exercise * In break-out rooms, navigate to the Jamboard in the chat window. * Navigate to the slide associated with your breakout room number. * Elect one person to serve as a facilitator. This person is responsible for calling on students as they raise their hands. * Everyone should add a sticky note with their name, their major, and the number of cups of coffee they drink per day to slide. * Using the sticky notes, talk through the following prompt: * Find the non-STEM major in your group in which students with that major on average drink the most cups of coffee per day. Repeat for STEM majors. * In the text box, formally write-out the steps you took to come to your answers in as much detail as possible. --- # Coding can be intimidating! * Coding is like learning a new language. When you are first learning it, it all feels completely unfamiliar. I will work to support you in building the vocabulary and syntax to code in R. * Coding can be frustrating. I regularly lose hours of my day in trying to find bugs in my code. I will work to give you resources and skills to navigate coding frustrations. * Coding social environments have historically been exclusionary. I will work to reduce barriers to coding in whatever ways I can. --- # Syllabus Review * Policies * Standards Grading * Course Website * Moodle * Perusall * Slack --- # For Wednesday * Review Syllabus and Grading Contract in Perusall * Install Slack Desktop and set notifications * Fill out first day of class questionnaire * Next time: Datasets, Data Ethics Framework, More on Standards Grading